Cedar Park, TX Map & Demographics
Cedar Park Map
Cedar Park Overview
$52,803
PER CAPITA INCOME
$139,645
AVG FAMILY INCOME
$118,903
AVG HOUSEHOLD INCOME
42.4%
WAGE / INCOME GAP [ % ]
57.6¢/ $1
WAGE / INCOME GAP [ $ ]
0.40
INEQUALITY / GINI INDEX
76,344
TOTAL POPULATION
37,969
MALE POPULATION
38,375
FEMALE POPULATION
98.94
MALES / 100 FEMALES
101.07
FEMALES / 100 MALES
37.6
MEDIAN AGE
3.1
AVG FAMILY SIZE
2.6
AVG HOUSEHOLD SIZE
42,266
LABOR FORCE [ PEOPLE ]
71.3%
PERCENT IN LABOR FORCE
3.3%
UNEMPLOYMENT RATE
Cedar Park Zip Codes
Income in Cedar Park
Income Overview in Cedar Park
Per Capita Income in Cedar Park is $52,803, while median incomes of families and households are $139,645 and $118,903 respectively.
| Characteristic | Number | Measure |
| Per Capita Income | 76,344 | $52,803 |
| Median Family Income | 20,672 | $139,645 |
| Mean Family Income | 20,672 | $156,937 |
| Median Household Income | 28,764 | $118,903 |
| Mean Household Income | 28,764 | $138,577 |
| Income Deficit | 20,672 | $0 |
| Wage / Income Gap (%) | 76,344 | 42.38% |
| Wage / Income Gap ($) | 76,344 | 57.62¢ per $1 |
| Gini / Inequality Index | 76,344 | 0.40 |
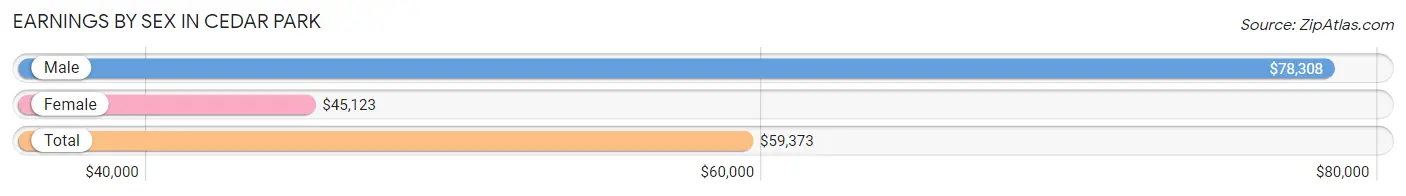
Earnings by Sex in Cedar Park
Average Earnings in Cedar Park are $59,373, $78,308 for men and $45,123 for women, a difference of 42.4%.
| Sex | Number | Average Earnings |
| Male | 24,422 (55.3%) | $78,308 |
| Female | 19,767 (44.7%) | $45,123 |
| Total | 44,189 (100.0%) | $59,373 |
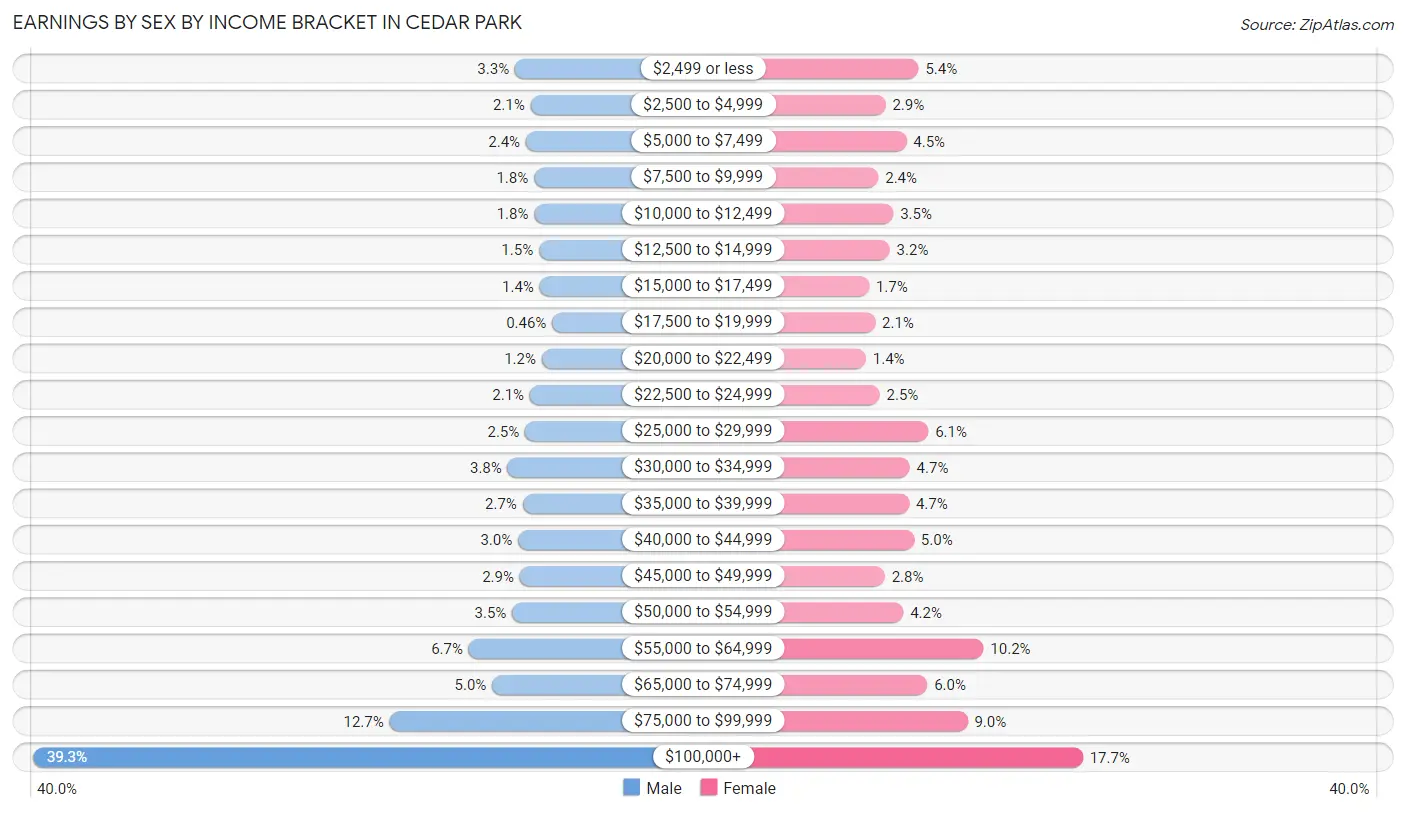
Earnings by Sex by Income Bracket in Cedar Park
The most common earnings brackets in Cedar Park are $100,000+ for men (9,600 | 39.3%) and $100,000+ for women (3,495 | 17.7%).
| Income | Male | Female |
| $2,499 or less | 793 (3.3%) | 1,061 (5.4%) |
| $2,500 to $4,999 | 507 (2.1%) | 573 (2.9%) |
| $5,000 to $7,499 | 594 (2.4%) | 881 (4.5%) |
| $7,500 to $9,999 | 444 (1.8%) | 467 (2.4%) |
| $10,000 to $12,499 | 439 (1.8%) | 688 (3.5%) |
| $12,500 to $14,999 | 354 (1.5%) | 634 (3.2%) |
| $15,000 to $17,499 | 342 (1.4%) | 328 (1.7%) |
| $17,500 to $19,999 | 112 (0.5%) | 419 (2.1%) |
| $20,000 to $22,499 | 302 (1.2%) | 282 (1.4%) |
| $22,500 to $24,999 | 521 (2.1%) | 486 (2.5%) |
| $25,000 to $29,999 | 607 (2.5%) | 1,206 (6.1%) |
| $30,000 to $34,999 | 928 (3.8%) | 932 (4.7%) |
| $35,000 to $39,999 | 651 (2.7%) | 921 (4.7%) |
| $40,000 to $44,999 | 738 (3.0%) | 994 (5.0%) |
| $45,000 to $49,999 | 706 (2.9%) | 561 (2.8%) |
| $50,000 to $54,999 | 844 (3.5%) | 836 (4.2%) |
| $55,000 to $64,999 | 1,639 (6.7%) | 2,024 (10.2%) |
| $65,000 to $74,999 | 1,211 (5.0%) | 1,192 (6.0%) |
| $75,000 to $99,999 | 3,090 (12.7%) | 1,787 (9.0%) |
| $100,000+ | 9,600 (39.3%) | 3,495 (17.7%) |
| Total | 24,422 (100.0%) | 19,767 (100.0%) |
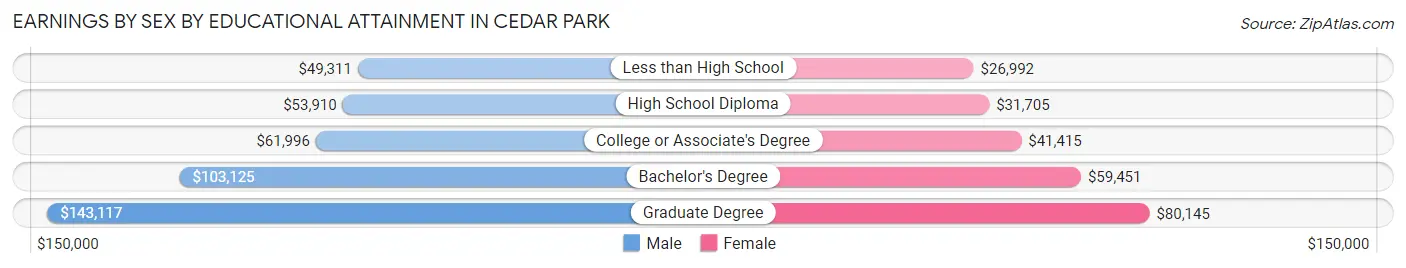
Earnings by Sex by Educational Attainment in Cedar Park
Average earnings in Cedar Park are $86,273 for men and $52,955 for women, a difference of 38.6%. Men with an educational attainment of graduate degree enjoy the highest average annual earnings of $143,117, while those with less than high school education earn the least with $49,311. Women with an educational attainment of graduate degree earn the most with the average annual earnings of $80,145, while those with less than high school education have the smallest earnings of $26,992.
| Educational Attainment | Male Income | Female Income |
| Less than High School | $49,311 | $26,992 |
| High School Diploma | $53,910 | $31,705 |
| College or Associate's Degree | $61,996 | $41,415 |
| Bachelor's Degree | $103,125 | $59,451 |
| Graduate Degree | $143,117 | $80,145 |
| Total | $86,273 | $52,955 |
Family Income in Cedar Park
Family Income Brackets in Cedar Park
According to the Cedar Park family income data, there are 5,561 families falling into the $200,000+ income range, which is the most common income bracket and makes up 26.9% of all families. Conversely, the less than $10,000 income bracket is the least frequent group with only 269 families (1.3%) belonging to this category.
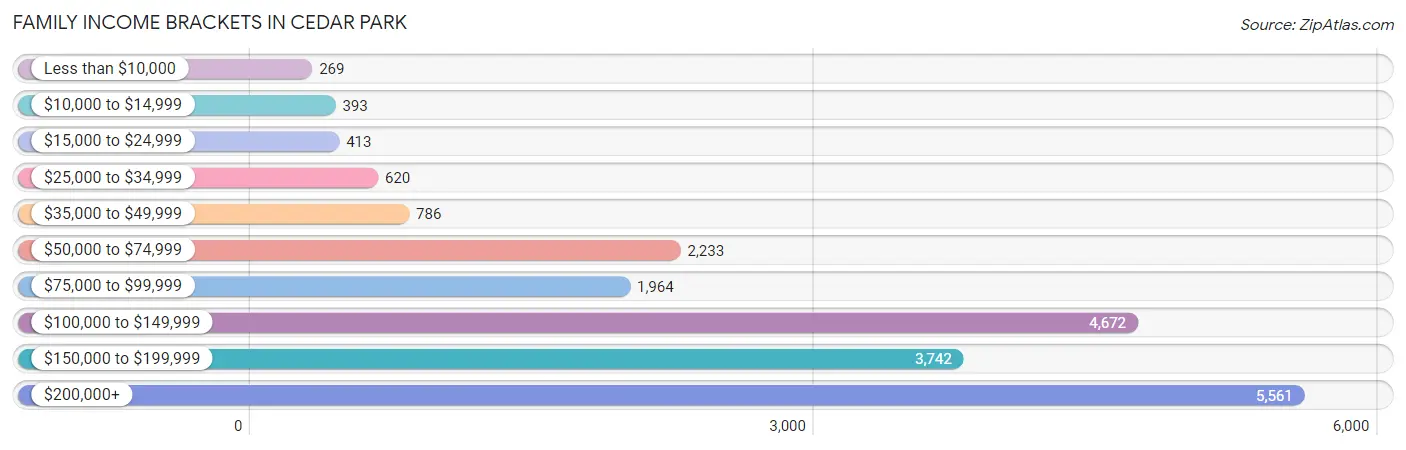
| Income Bracket | # Families | % Families |
| Less than $10,000 | 269 | 1.3% |
| $10,000 to $14,999 | 393 | 1.9% |
| $15,000 to $24,999 | 413 | 2.0% |
| $25,000 to $34,999 | 620 | 3.0% |
| $35,000 to $49,999 | 786 | 3.8% |
| $50,000 to $74,999 | 2,233 | 10.8% |
| $75,000 to $99,999 | 1,964 | 9.5% |
| $100,000 to $149,999 | 4,672 | 22.6% |
| $150,000 to $199,999 | 3,742 | 18.1% |
| $200,000+ | 5,561 | 26.9% |
Family Income by Famaliy Size in Cedar Park
7+ person families (152 | 0.7%) account for the highest median family income in Cedar Park with $170,000 per family, while 2-person families (8,235 | 39.8%) have the highest median income of $55,146 per family member.
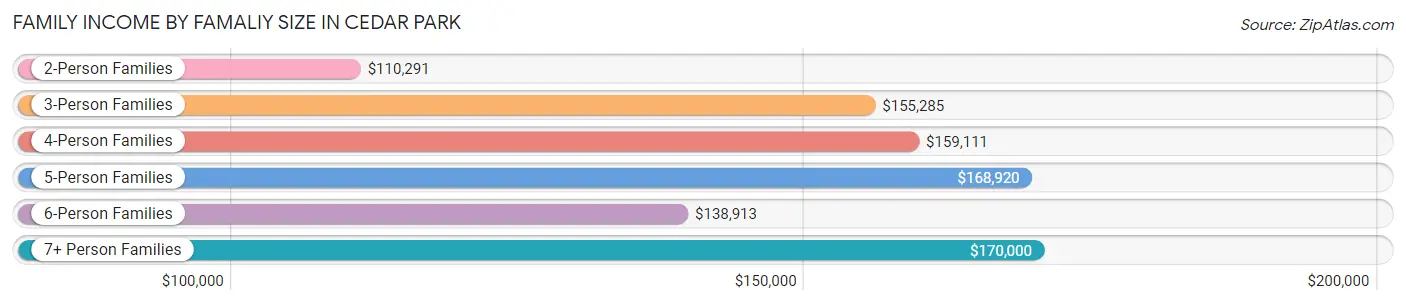
| Income Bracket | # Families | Median Income |
| 2-Person Families | 8,235 (39.8%) | $110,291 |
| 3-Person Families | 4,837 (23.4%) | $155,285 |
| 4-Person Families | 5,659 (27.4%) | $159,111 |
| 5-Person Families | 1,233 (6.0%) | $168,920 |
| 6-Person Families | 556 (2.7%) | $138,913 |
| 7+ Person Families | 152 (0.7%) | $170,000 |
| Total | 20,672 (100.0%) | $139,645 |
Family Income by Number of Earners in Cedar Park
The median family income in Cedar Park is $139,645, with families comprising 3+ earners (2,046) having the highest median family income of $174,188, while families with no earners (1,772) have the lowest median family income of $75,792, accounting for 9.9% and 8.6% of families, respectively.
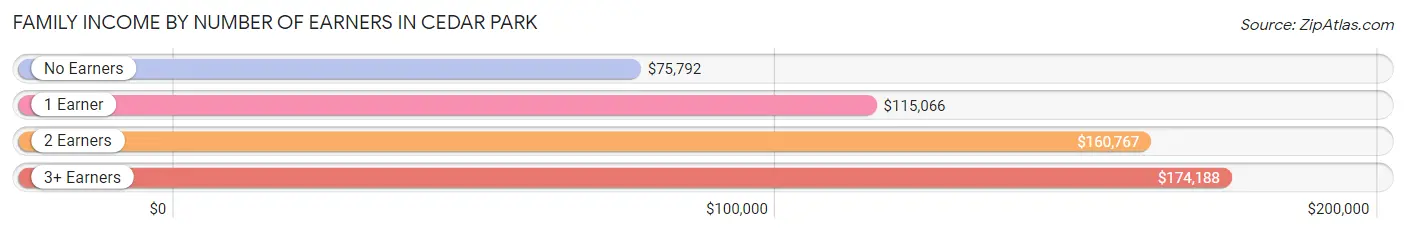
| Number of Earners | # Families | Median Income |
| No Earners | 1,772 (8.6%) | $75,792 |
| 1 Earner | 6,393 (30.9%) | $115,066 |
| 2 Earners | 10,461 (50.6%) | $160,767 |
| 3+ Earners | 2,046 (9.9%) | $174,188 |
| Total | 20,672 (100.0%) | $139,645 |
Household Income in Cedar Park
Household Income Brackets in Cedar Park
With 6,155 households falling in the category, the $100,000 to $149,999 income range is the most frequent in Cedar Park, accounting for 21.4% of all households. In contrast, only 547 households (1.9%) fall into the less than $10,000 income bracket, making it the least populous group.
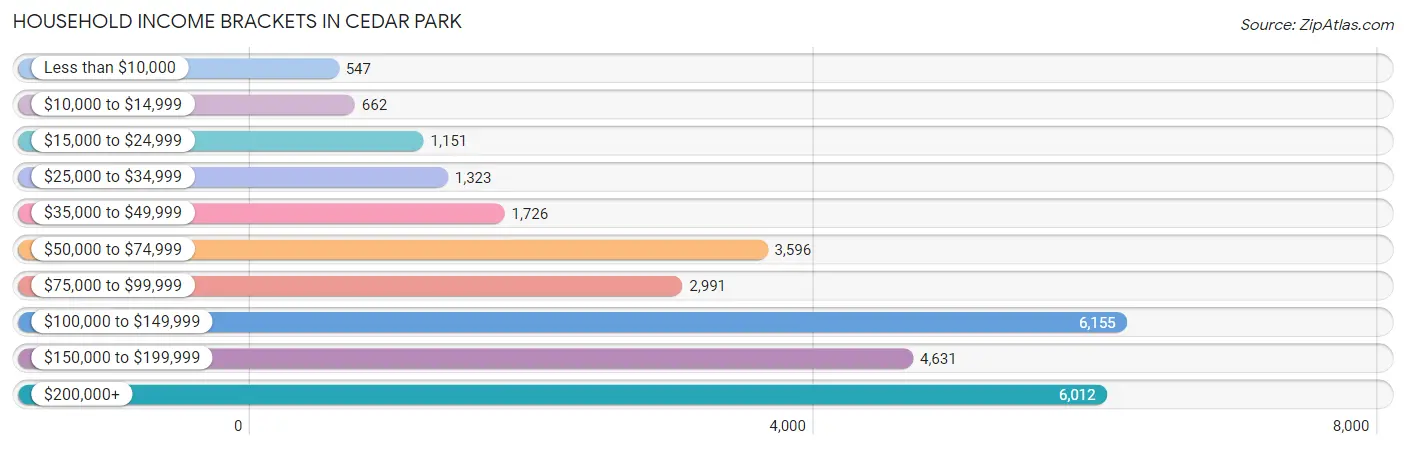
| Income Bracket | # Households | % Households |
| Less than $10,000 | 547 | 1.9% |
| $10,000 to $14,999 | 662 | 2.3% |
| $15,000 to $24,999 | 1,151 | 4.0% |
| $25,000 to $34,999 | 1,323 | 4.6% |
| $35,000 to $49,999 | 1,726 | 6.0% |
| $50,000 to $74,999 | 3,596 | 12.5% |
| $75,000 to $99,999 | 2,991 | 10.4% |
| $100,000 to $149,999 | 6,155 | 21.4% |
| $150,000 to $199,999 | 4,631 | 16.1% |
| $200,000+ | 6,012 | 20.9% |
Household Income by Householder Age in Cedar Park
The median household income in Cedar Park is $118,903, with the highest median household income of $139,089 found in the 25 to 44 years age bracket for the primary householder. A total of 11,901 households (41.4%) fall into this category. Meanwhile, the 15 to 24 years age bracket for the primary householder has the lowest median household income of $60,237, with 859 households (3.0%) in this group.
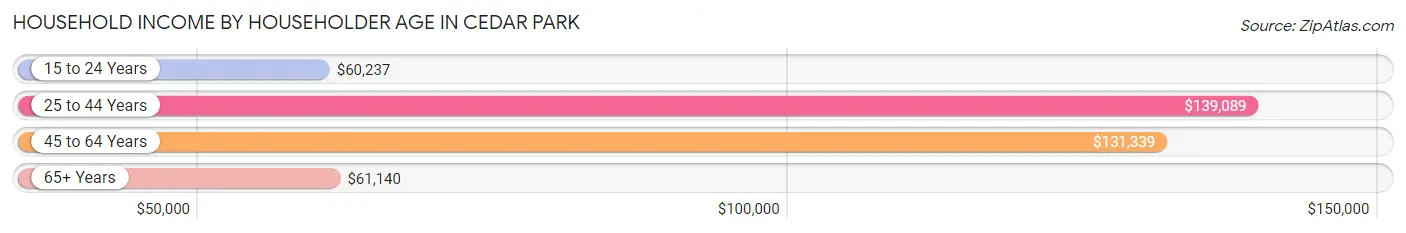
| Income Bracket | # Households | Median Income |
| 15 to 24 Years | 859 (3.0%) | $60,237 |
| 25 to 44 Years | 11,901 (41.4%) | $139,089 |
| 45 to 64 Years | 11,207 (39.0%) | $131,339 |
| 65+ Years | 4,797 (16.7%) | $61,140 |
| Total | 28,764 (100.0%) | $118,903 |
Poverty in Cedar Park
Income Below Poverty by Sex and Age in Cedar Park
With 4.9% poverty level for males and 6.1% for females among the residents of Cedar Park, 18 to 24 year old males and 5 year old females are the most vulnerable to poverty, with 279 males (10.6%) and 68 females (25.5%) in their respective age groups living below the poverty level.

| Age Bracket | Male | Female |
| Under 5 Years | 123 (6.0%) | 74 (3.4%) |
| 5 Years | 0 (0.0%) | 68 (25.5%) |
| 6 to 11 Years | 348 (9.6%) | 165 (4.6%) |
| 12 to 14 Years | 53 (2.8%) | 24 (1.4%) |
| 15 Years | 26 (5.1%) | 24 (5.1%) |
| 16 and 17 Years | 60 (6.1%) | 37 (3.2%) |
| 18 to 24 Years | 279 (10.6%) | 253 (10.5%) |
| 25 to 34 Years | 187 (3.4%) | 448 (8.1%) |
| 35 to 44 Years | 102 (1.5%) | 423 (6.4%) |
| 45 to 54 Years | 255 (4.3%) | 263 (4.7%) |
| 55 to 64 Years | 107 (2.9%) | 242 (6.0%) |
| 65 to 74 Years | 209 (9.4%) | 181 (6.6%) |
| 75 Years and over | 116 (8.8%) | 132 (7.6%) |
| Total | 1,865 (4.9%) | 2,334 (6.1%) |
Income Above Poverty by Sex and Age in Cedar Park
According to the poverty statistics in Cedar Park, males aged 5 years and females aged 12 to 14 years are the age groups that are most secure financially, with 100.0% of males and 98.6% of females in these age groups living above the poverty line.
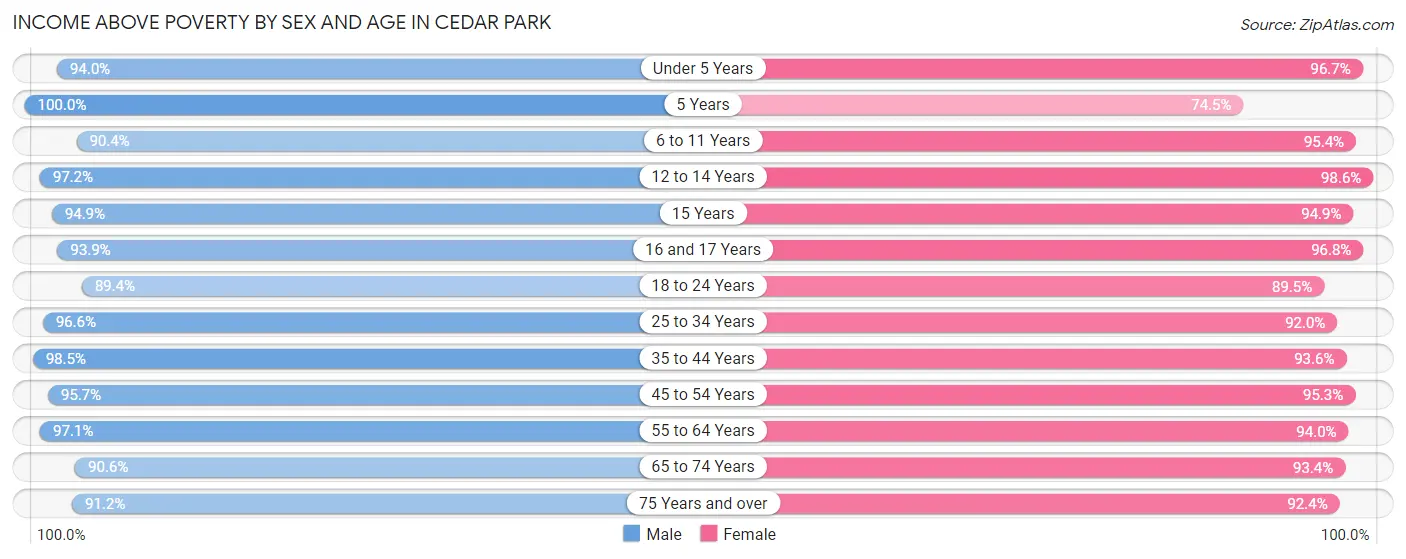
| Age Bracket | Male | Female |
| Under 5 Years | 1,928 (94.0%) | 2,136 (96.7%) |
| 5 Years | 589 (100.0%) | 199 (74.5%) |
| 6 to 11 Years | 3,266 (90.4%) | 3,442 (95.4%) |
| 12 to 14 Years | 1,823 (97.2%) | 1,719 (98.6%) |
| 15 Years | 487 (94.9%) | 450 (94.9%) |
| 16 and 17 Years | 924 (93.9%) | 1,108 (96.8%) |
| 18 to 24 Years | 2,351 (89.4%) | 2,157 (89.5%) |
| 25 to 34 Years | 5,370 (96.6%) | 5,118 (91.9%) |
| 35 to 44 Years | 6,668 (98.5%) | 6,214 (93.6%) |
| 45 to 54 Years | 5,650 (95.7%) | 5,281 (95.3%) |
| 55 to 64 Years | 3,618 (97.1%) | 3,811 (94.0%) |
| 65 to 74 Years | 2,019 (90.6%) | 2,565 (93.4%) |
| 75 Years and over | 1,200 (91.2%) | 1,598 (92.4%) |
| Total | 35,893 (95.1%) | 35,798 (93.9%) |
Income Below Poverty Among Married-Couple Families in Cedar Park
The poverty statistics for married-couple families in Cedar Park show that 2.3% or 388 of the total 16,828 families live below the poverty line. Families with 3 or 4 children have the highest poverty rate of 6.3%, comprising of 76 families. On the other hand, families with 5 or more children have the lowest poverty rate of 0.0%, which includes 0 families.
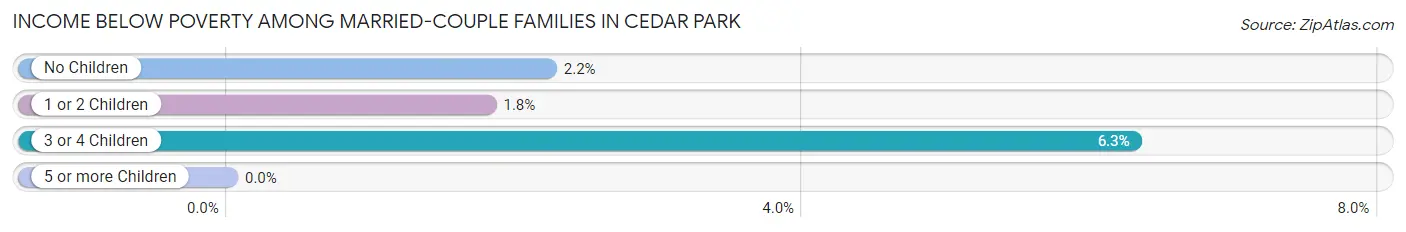
| Children | Above Poverty | Below Poverty |
| No Children | 7,454 (97.8%) | 169 (2.2%) |
| 1 or 2 Children | 7,788 (98.2%) | 143 (1.8%) |
| 3 or 4 Children | 1,132 (93.7%) | 76 (6.3%) |
| 5 or more Children | 66 (100.0%) | 0 (0.0%) |
| Total | 16,440 (97.7%) | 388 (2.3%) |
Income Below Poverty Among Single-Parent Households in Cedar Park
According to the poverty data in Cedar Park, 1.6% or 20 single-father households and 24.2% or 630 single-mother households are living below the poverty line. Among single-father households, those with no children have the highest poverty rate, with 20 households (3.2%) experiencing poverty. Likewise, among single-mother households, those with 3 or 4 children have the highest poverty rate, with 46 households (40.0%) falling below the poverty line.
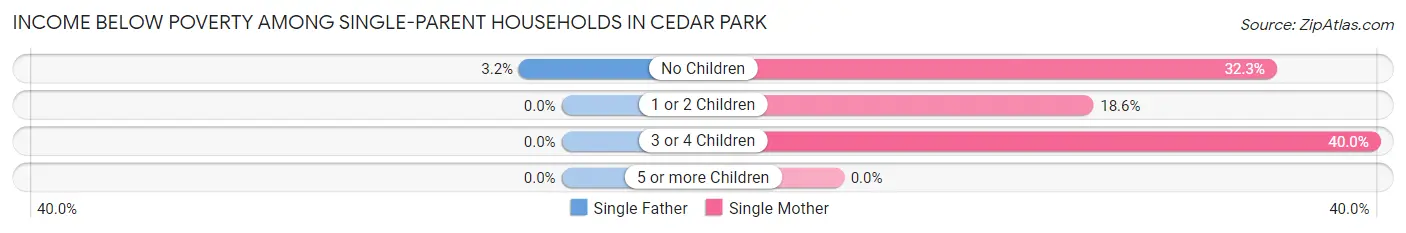
| Children | Single Father | Single Mother |
| No Children | 20 (3.2%) | 291 (32.3%) |
| 1 or 2 Children | 0 (0.0%) | 293 (18.6%) |
| 3 or 4 Children | 0 (0.0%) | 46 (40.0%) |
| 5 or more Children | 0 (0.0%) | 0 (0.0%) |
| Total | 20 (1.6%) | 630 (24.2%) |
Income Below Poverty Among Married-Couple vs Single-Parent Households in Cedar Park
The poverty data for Cedar Park shows that 388 of the married-couple family households (2.3%) and 650 of the single-parent households (16.9%) are living below the poverty level. Within the married-couple family households, those with 3 or 4 children have the highest poverty rate, with 76 households (6.3%) falling below the poverty line. Among the single-parent households, those with 3 or 4 children have the highest poverty rate, with 46 household (31.7%) living below poverty.
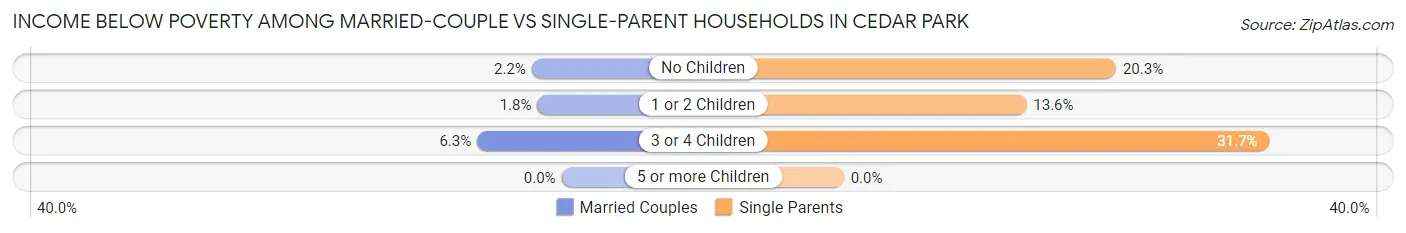
| Children | Married-Couple Families | Single-Parent Households |
| No Children | 169 (2.2%) | 311 (20.3%) |
| 1 or 2 Children | 143 (1.8%) | 293 (13.6%) |
| 3 or 4 Children | 76 (6.3%) | 46 (31.7%) |
| 5 or more Children | 0 (0.0%) | 0 (0.0%) |
| Total | 388 (2.3%) | 650 (16.9%) |
Race in Cedar Park
The most populous races in Cedar Park are White / Caucasian (53,904 | 70.6%), Hispanic or Latino (15,389 | 20.2%), and Asian (9,656 | 12.7%).
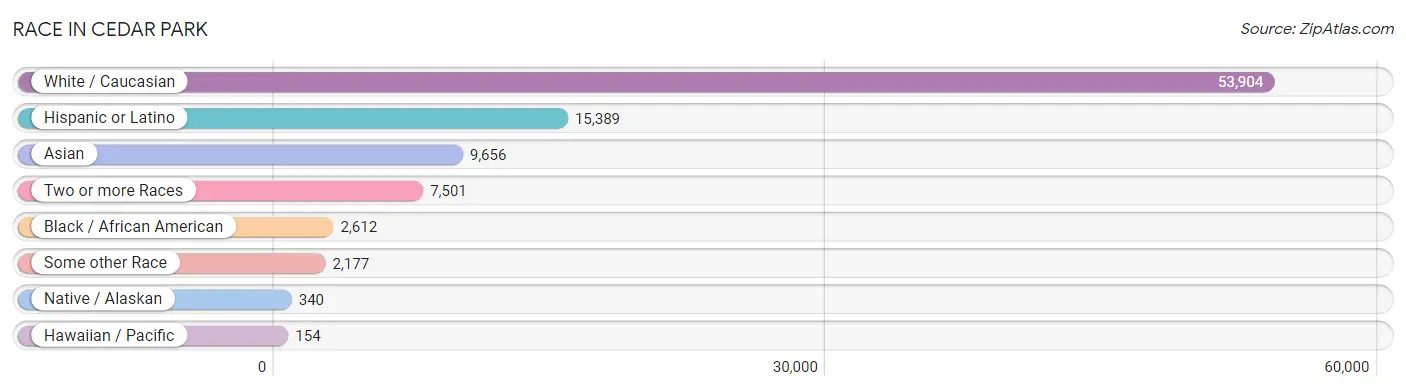
| Race | # Population | % Population |
| Asian | 9,656 | 12.7% |
| Black / African American | 2,612 | 3.4% |
| Hawaiian / Pacific | 154 | 0.2% |
| Hispanic or Latino | 15,389 | 20.2% |
| Native / Alaskan | 340 | 0.4% |
| White / Caucasian | 53,904 | 70.6% |
| Two or more Races | 7,501 | 9.8% |
| Some other Race | 2,177 | 2.9% |
| Total | 76,344 | 100.0% |
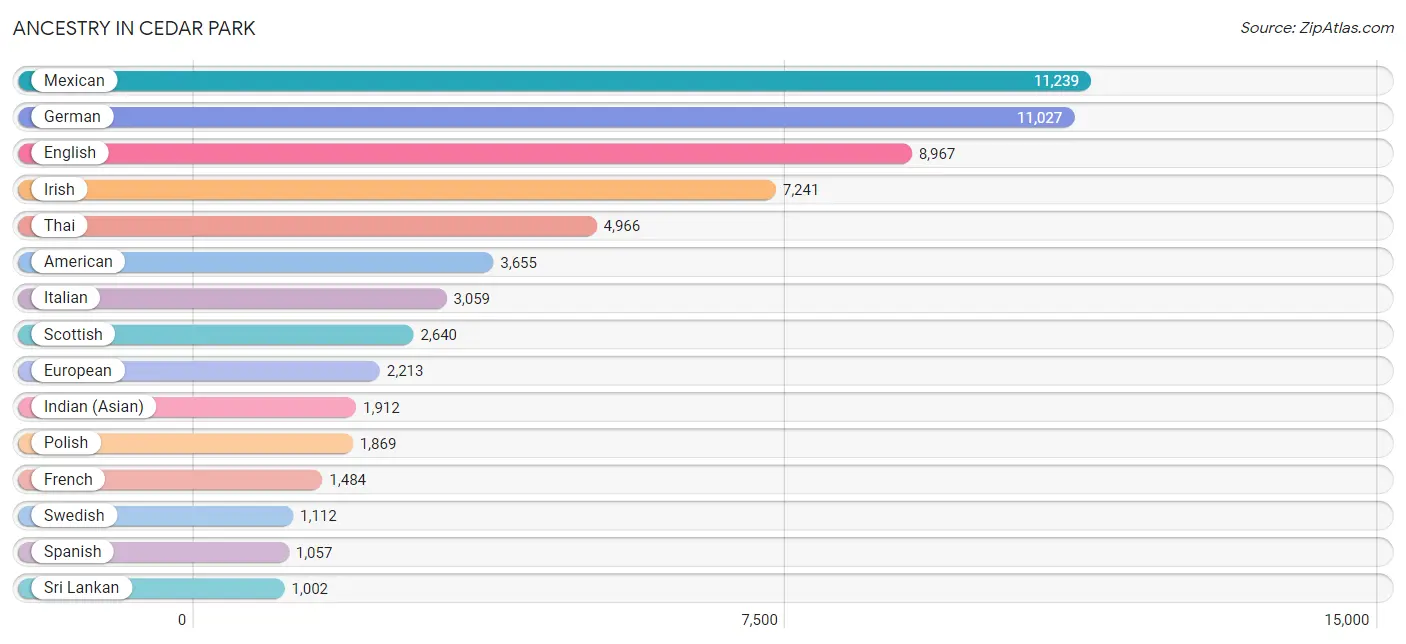
Ancestry in Cedar Park
The most populous ancestries reported in Cedar Park are Mexican (11,239 | 14.7%), German (11,027 | 14.4%), English (8,967 | 11.7%), Irish (7,241 | 9.5%), and Thai (4,966 | 6.5%), together accounting for 56.9% of all Cedar Park residents.
| Ancestry | # Population | % Population |
| African | 61 | 0.1% |
| Albanian | 56 | 0.1% |
| American | 3,655 | 4.8% |
| Apache | 186 | 0.2% |
| Arab | 532 | 0.7% |
| Argentinean | 5 | 0.0% |
| Armenian | 41 | 0.1% |
| Australian | 59 | 0.1% |
| Austrian | 112 | 0.2% |
| Belgian | 37 | 0.1% |
| Bhutanese | 275 | 0.4% |
| Bolivian | 23 | 0.0% |
| Brazilian | 258 | 0.3% |
| British | 568 | 0.7% |
| British West Indian | 27 | 0.0% |
| Burmese | 963 | 1.3% |
| Canadian | 209 | 0.3% |
| Central American | 621 | 0.8% |
| Central American Indian | 62 | 0.1% |
| Cherokee | 218 | 0.3% |
| Chickasaw | 12 | 0.0% |
| Chilean | 39 | 0.1% |
| Choctaw | 68 | 0.1% |
| Colombian | 113 | 0.2% |
| Comanche | 70 | 0.1% |
| Croatian | 35 | 0.1% |
| Cuban | 550 | 0.7% |
| Czech | 698 | 0.9% |
| Czechoslovakian | 105 | 0.1% |
| Danish | 235 | 0.3% |
| Dominican | 105 | 0.1% |
| Dutch | 519 | 0.7% |
| Eastern European | 139 | 0.2% |
| Egyptian | 19 | 0.0% |
| English | 8,967 | 11.7% |
| Estonian | 11 | 0.0% |
| Ethiopian | 9 | 0.0% |
| European | 2,213 | 2.9% |
| Filipino | 229 | 0.3% |
| French | 1,484 | 1.9% |
| French Canadian | 201 | 0.3% |
| German | 11,027 | 14.4% |
| Greek | 325 | 0.4% |
| Guamanian / Chamorro | 56 | 0.1% |
| Guatemalan | 110 | 0.1% |
| Guyanese | 23 | 0.0% |
| Honduran | 29 | 0.0% |
| Hopi | 3 | 0.0% |
| Hungarian | 293 | 0.4% |
| Icelander | 19 | 0.0% |
| Indian (Asian) | 1,912 | 2.5% |
| Indonesian | 63 | 0.1% |
| Iranian | 36 | 0.1% |
| Irish | 7,241 | 9.5% |
| Israeli | 29 | 0.0% |
| Italian | 3,059 | 4.0% |
| Japanese | 138 | 0.2% |
| Kiowa | 35 | 0.1% |
| Korean | 794 | 1.0% |
| Laotian | 80 | 0.1% |
| Lebanese | 75 | 0.1% |
| Lithuanian | 28 | 0.0% |
| Malaysian | 98 | 0.1% |
| Maltese | 21 | 0.0% |
| Mexican | 11,239 | 14.7% |
| Mexican American Indian | 156 | 0.2% |
| Mongolian | 10 | 0.0% |
| Moroccan | 122 | 0.2% |
| Native Hawaiian | 124 | 0.2% |
| Nicaraguan | 72 | 0.1% |
| Nigerian | 158 | 0.2% |
| Northern European | 296 | 0.4% |
| Norwegian | 930 | 1.2% |
| Ottawa | 8 | 0.0% |
| Pakistani | 52 | 0.1% |
| Palestinian | 11 | 0.0% |
| Panamanian | 144 | 0.2% |
| Pennsylvania German | 30 | 0.0% |
| Peruvian | 374 | 0.5% |
| Polish | 1,869 | 2.5% |
| Portuguese | 259 | 0.3% |
| Potawatomi | 10 | 0.0% |
| Pueblo | 17 | 0.0% |
| Puerto Rican | 457 | 0.6% |
| Romanian | 269 | 0.4% |
| Russian | 414 | 0.5% |
| Salvadoran | 266 | 0.4% |
| Samoan | 16 | 0.0% |
| Scandinavian | 292 | 0.4% |
| Scotch-Irish | 739 | 1.0% |
| Scottish | 2,640 | 3.5% |
| Senegalese | 58 | 0.1% |
| Serbian | 34 | 0.0% |
| Slavic | 10 | 0.0% |
| Slovak | 52 | 0.1% |
| Slovene | 31 | 0.0% |
| South African | 31 | 0.0% |
| South American | 748 | 1.0% |
| South American Indian | 41 | 0.1% |
| Spaniard | 454 | 0.6% |
| Spanish | 1,057 | 1.4% |
| Sri Lankan | 1,002 | 1.3% |
| Subsaharan African | 335 | 0.4% |
| Swedish | 1,112 | 1.5% |
| Swiss | 154 | 0.2% |
| Thai | 4,966 | 6.5% |
| Tohono O'Odham | 4 | 0.0% |
| Trinidadian and Tobagonian | 10 | 0.0% |
| Turkish | 409 | 0.5% |
| Ukrainian | 160 | 0.2% |
| Venezuelan | 194 | 0.3% |
| Vietnamese | 49 | 0.1% |
| Welsh | 705 | 0.9% |
| Yugoslavian | 7 | 0.0% | View All 114 Rows |
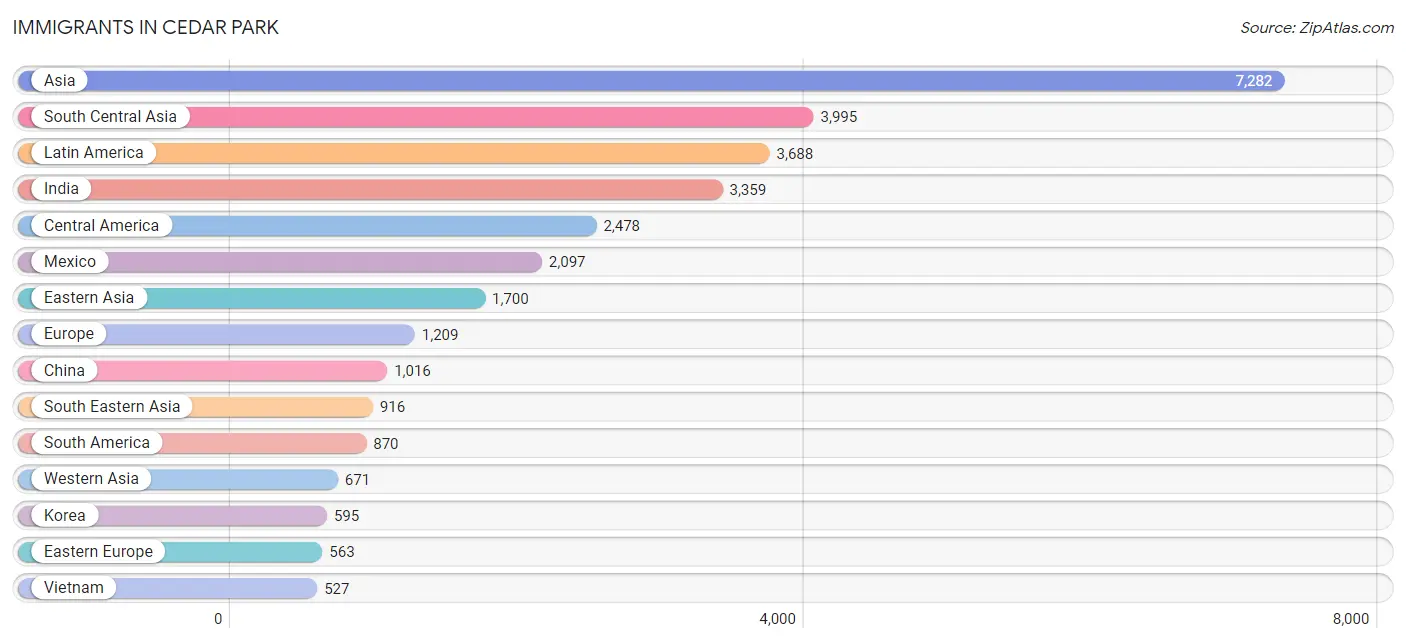
Immigrants in Cedar Park
The most numerous immigrant groups reported in Cedar Park came from Asia (7,282 | 9.5%), South Central Asia (3,995 | 5.2%), Latin America (3,688 | 4.8%), India (3,359 | 4.4%), and Central America (2,478 | 3.3%), together accounting for 27.2% of all Cedar Park residents.
| Immigration Origin | # Population | % Population |
| Africa | 284 | 0.4% |
| Argentina | 5 | 0.0% |
| Asia | 7,282 | 9.5% |
| Australia | 45 | 0.1% |
| Bangladesh | 13 | 0.0% |
| Belarus | 21 | 0.0% |
| Bolivia | 18 | 0.0% |
| Brazil | 269 | 0.4% |
| Cambodia | 138 | 0.2% |
| Canada | 362 | 0.5% |
| Caribbean | 340 | 0.4% |
| Central America | 2,478 | 3.3% |
| Chile | 26 | 0.0% |
| China | 1,016 | 1.3% |
| Colombia | 77 | 0.1% |
| Costa Rica | 33 | 0.0% |
| Cuba | 294 | 0.4% |
| Dominica | 23 | 0.0% |
| Eastern Africa | 75 | 0.1% |
| Eastern Asia | 1,700 | 2.2% |
| Eastern Europe | 563 | 0.7% |
| Egypt | 30 | 0.0% |
| El Salvador | 169 | 0.2% |
| England | 73 | 0.1% |
| Ethiopia | 16 | 0.0% |
| Europe | 1,209 | 1.6% |
| France | 28 | 0.0% |
| Germany | 154 | 0.2% |
| Greece | 33 | 0.0% |
| Guatemala | 110 | 0.1% |
| Guyana | 23 | 0.0% |
| Honduras | 12 | 0.0% |
| Hong Kong | 6 | 0.0% |
| India | 3,359 | 4.4% |
| Indonesia | 48 | 0.1% |
| Iran | 27 | 0.0% |
| Iraq | 181 | 0.2% |
| Ireland | 20 | 0.0% |
| Israel | 59 | 0.1% |
| Italy | 74 | 0.1% |
| Japan | 89 | 0.1% |
| Kazakhstan | 11 | 0.0% |
| Kenya | 31 | 0.0% |
| Korea | 595 | 0.8% |
| Laos | 27 | 0.0% |
| Latin America | 3,688 | 4.8% |
| Lebanon | 14 | 0.0% |
| Mexico | 2,097 | 2.8% |
| Moldova | 119 | 0.2% |
| Morocco | 49 | 0.1% |
| Nepal | 243 | 0.3% |
| Netherlands | 14 | 0.0% |
| Nicaragua | 12 | 0.0% |
| Nigeria | 32 | 0.0% |
| Northern Africa | 133 | 0.2% |
| Northern Europe | 173 | 0.2% |
| Oceania | 61 | 0.1% |
| Pakistan | 262 | 0.3% |
| Panama | 45 | 0.1% |
| Peru | 285 | 0.4% |
| Philippines | 176 | 0.2% |
| Poland | 101 | 0.1% |
| Portugal | 61 | 0.1% |
| Romania | 70 | 0.1% |
| Russia | 75 | 0.1% |
| Saudi Arabia | 13 | 0.0% |
| Senegal | 30 | 0.0% |
| Serbia | 15 | 0.0% |
| South Africa | 14 | 0.0% |
| South America | 870 | 1.1% |
| South Central Asia | 3,995 | 5.2% |
| South Eastern Asia | 916 | 1.2% |
| Southern Europe | 277 | 0.4% |
| Spain | 42 | 0.1% |
| Sri Lanka | 29 | 0.0% |
| Taiwan | 182 | 0.2% |
| Trinidad and Tobago | 10 | 0.0% |
| Turkey | 337 | 0.4% |
| Ukraine | 131 | 0.2% |
| Venezuela | 167 | 0.2% |
| Vietnam | 527 | 0.7% |
| Western Africa | 62 | 0.1% |
| Western Asia | 671 | 0.9% |
| Western Europe | 196 | 0.3% | View All 84 Rows |
Sex and Age in Cedar Park
Sex and Age in Cedar Park
The most populous age groups in Cedar Park are 40 to 44 Years (3,545 | 9.3%) for men and 40 to 44 Years (3,438 | 9.0%) for women.
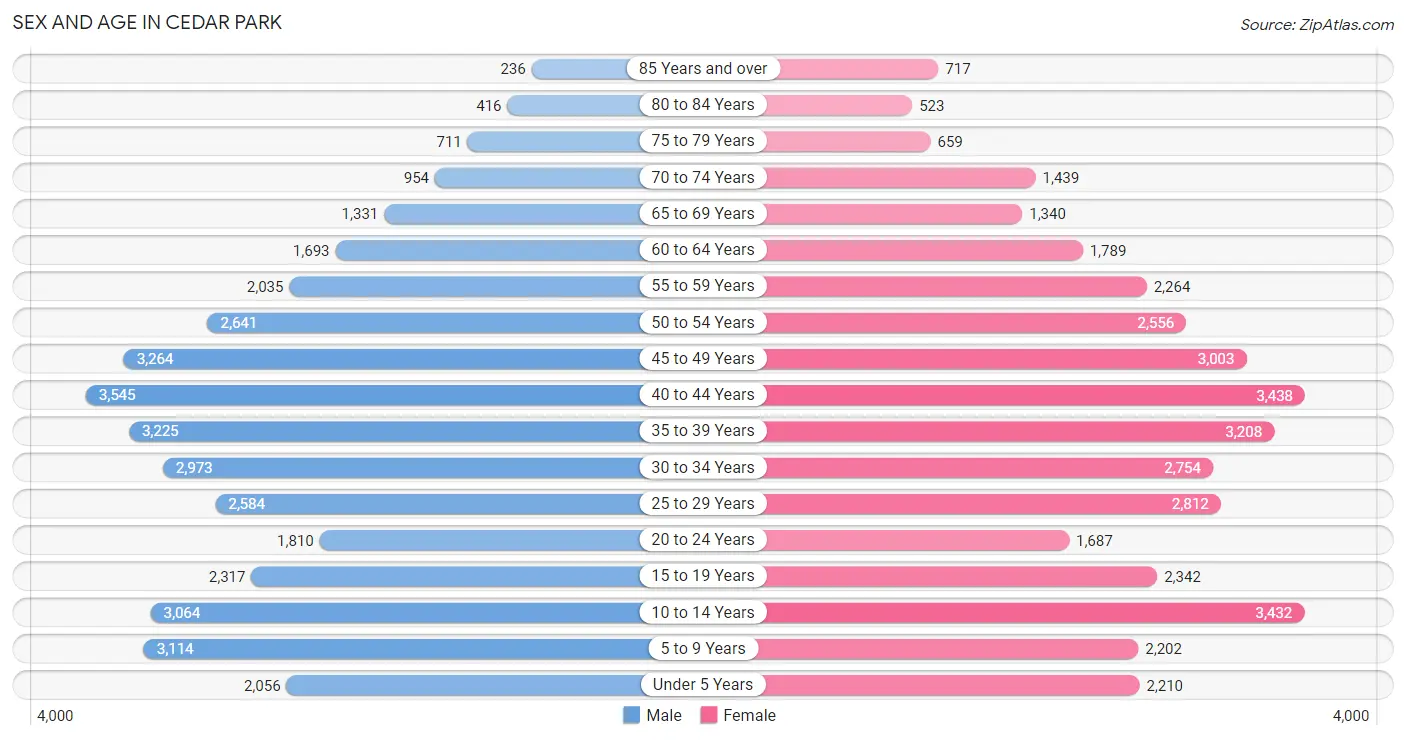
| Age Bracket | Male | Female |
| Under 5 Years | 2,056 (5.4%) | 2,210 (5.8%) |
| 5 to 9 Years | 3,114 (8.2%) | 2,202 (5.7%) |
| 10 to 14 Years | 3,064 (8.1%) | 3,432 (8.9%) |
| 15 to 19 Years | 2,317 (6.1%) | 2,342 (6.1%) |
| 20 to 24 Years | 1,810 (4.8%) | 1,687 (4.4%) |
| 25 to 29 Years | 2,584 (6.8%) | 2,812 (7.3%) |
| 30 to 34 Years | 2,973 (7.8%) | 2,754 (7.2%) |
| 35 to 39 Years | 3,225 (8.5%) | 3,208 (8.4%) |
| 40 to 44 Years | 3,545 (9.3%) | 3,438 (9.0%) |
| 45 to 49 Years | 3,264 (8.6%) | 3,003 (7.8%) |
| 50 to 54 Years | 2,641 (7.0%) | 2,556 (6.7%) |
| 55 to 59 Years | 2,035 (5.4%) | 2,264 (5.9%) |
| 60 to 64 Years | 1,693 (4.5%) | 1,789 (4.7%) |
| 65 to 69 Years | 1,331 (3.5%) | 1,340 (3.5%) |
| 70 to 74 Years | 954 (2.5%) | 1,439 (3.7%) |
| 75 to 79 Years | 711 (1.9%) | 659 (1.7%) |
| 80 to 84 Years | 416 (1.1%) | 523 (1.4%) |
| 85 Years and over | 236 (0.6%) | 717 (1.9%) |
| Total | 37,969 (100.0%) | 38,375 (100.0%) |
Families and Households in Cedar Park
Median Family Size in Cedar Park
The median family size in Cedar Park is 3.12 persons per family, with married-couple families (16,828 | 81.4%) accounting for the largest median family size of 3.21 persons per family. On the other hand, single male/father families (1,239 | 6.0%) represent the smallest median family size with 2.48 persons per family.
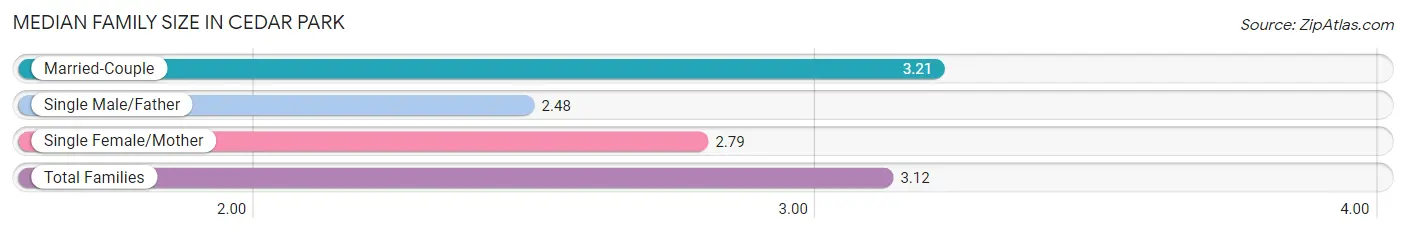
| Family Type | # Families | Family Size |
| Married-Couple | 16,828 (81.4%) | 3.21 |
| Single Male/Father | 1,239 (6.0%) | 2.48 |
| Single Female/Mother | 2,605 (12.6%) | 2.79 |
| Total Families | 20,672 (100.0%) | 3.12 |
Median Household Size in Cedar Park
The median household size in Cedar Park is 2.64 persons per household, with married-couple households (16,828 | 58.5%) accounting for the largest median household size of 3.24 persons per household. non-family households (8,092 | 28.1%) represent the smallest median household size with 1.29 persons per household.
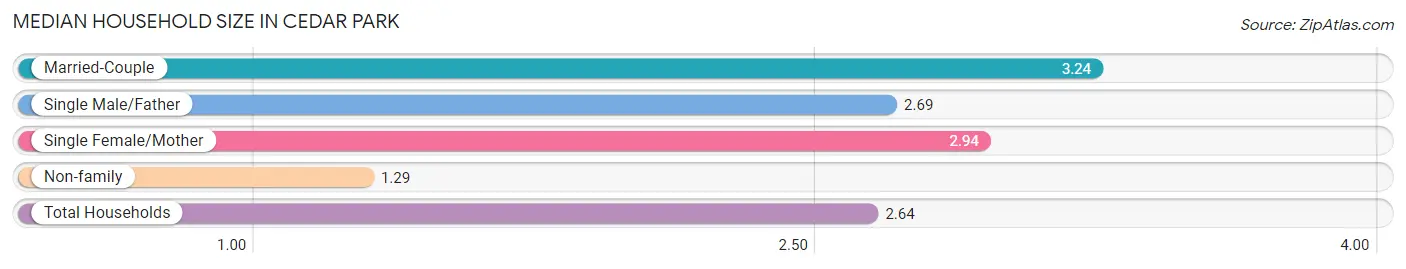
| Household Type | # Households | Household Size |
| Married-Couple | 16,828 (58.5%) | 3.24 |
| Single Male/Father | 1,239 (4.3%) | 2.69 |
| Single Female/Mother | 2,605 (9.1%) | 2.94 |
| Non-family | 8,092 (28.1%) | 1.29 |
| Total Households | 28,764 (100.0%) | 2.64 |
Household Size by Marriage Status in Cedar Park
Out of a total of 28,764 households in Cedar Park, 20,672 (71.9%) are family households, while 8,092 (28.1%) are nonfamily households. The most numerous type of family households are 2-person households, comprising 7,671, and the most common type of nonfamily households are 1-person households, comprising 6,174.
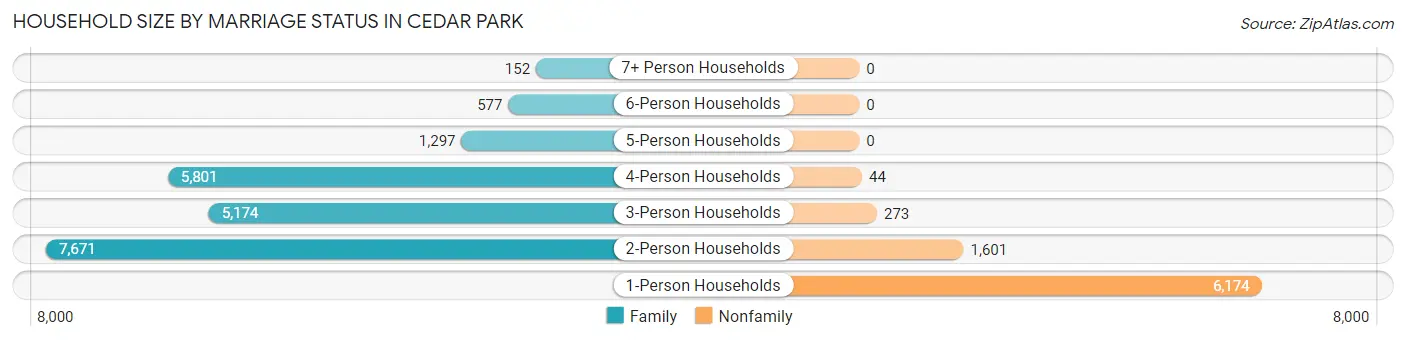
| Household Size | Family Households | Nonfamily Households |
| 1-Person Households | - | 6,174 (21.5%) |
| 2-Person Households | 7,671 (26.7%) | 1,601 (5.6%) |
| 3-Person Households | 5,174 (18.0%) | 273 (0.9%) |
| 4-Person Households | 5,801 (20.2%) | 44 (0.2%) |
| 5-Person Households | 1,297 (4.5%) | 0 (0.0%) |
| 6-Person Households | 577 (2.0%) | 0 (0.0%) |
| 7+ Person Households | 152 (0.5%) | 0 (0.0%) |
| Total | 20,672 (71.9%) | 8,092 (28.1%) |
Female Fertility in Cedar Park
Fertility by Age in Cedar Park
Average fertility rate in Cedar Park is 40.0 births per 1,000 women. Women in the age bracket of 20 to 34 years have the highest fertility rate with 65.0 births per 1,000 women. Women in the age bracket of 20 to 34 years acount for 60.1% of all women with births.
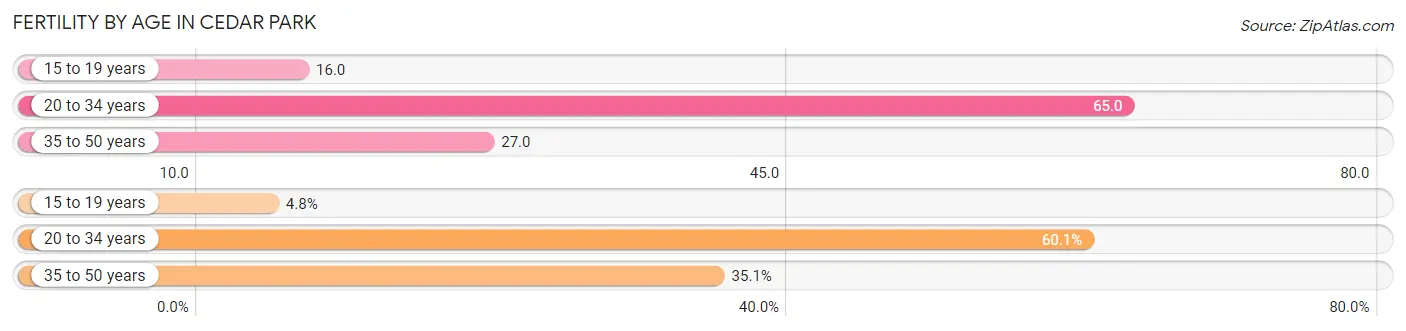
| Age Bracket | Women with Births | Births / 1,000 Women |
| 15 to 19 years | 38 (4.8%) | 16.0 |
| 20 to 34 years | 475 (60.1%) | 65.0 |
| 35 to 50 years | 277 (35.1%) | 27.0 |
| Total | 790 (100.0%) | 40.0 |
Fertility by Age by Marriage Status in Cedar Park
96.5% of women with births (790) in Cedar Park are married. The highest percentage of unmarried women with births falls into 35 to 50 years age bracket with 5.1% of them unmarried at the time of birth, while the lowest percentage of unmarried women with births belong to 15 to 19 years age bracket with 0.0% of them unmarried.
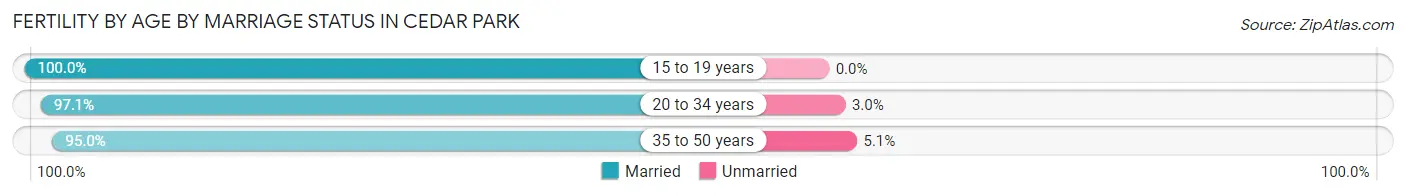
| Age Bracket | Married | Unmarried |
| 15 to 19 years | 38 (100.0%) | 0 (0.0%) |
| 20 to 34 years | 461 (97.1%) | 14 (2.9%) |
| 35 to 50 years | 263 (95.0%) | 14 (5.1%) |
| Total | 762 (96.5%) | 28 (3.5%) |
Fertility by Education in Cedar Park
Average fertility rate in Cedar Park is 40.0 births per 1,000 women. Women with the education attainment of graduate degree have the highest fertility rate of 100.0 births per 1,000 women, while women with the education attainment of college or associate's degree have the lowest fertility at 3.0 births per 1,000 women. Women with the education attainment of bachelor's degree represent 44.8% of all women with births.
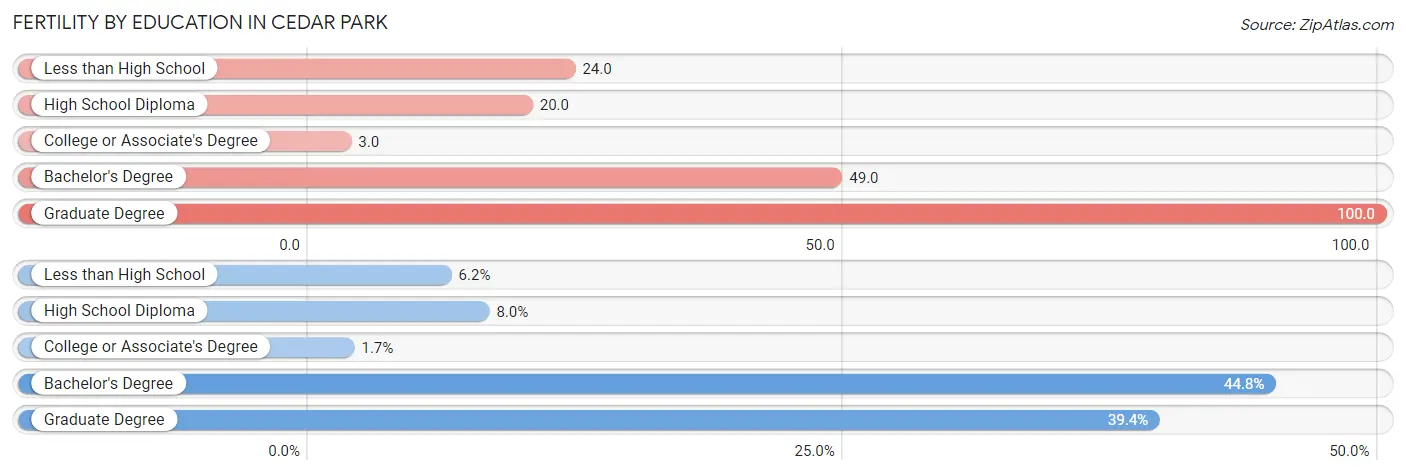
| Educational Attainment | Women with Births | Births / 1,000 Women |
| Less than High School | 49 (6.2%) | 24.0 |
| High School Diploma | 63 (8.0%) | 20.0 |
| College or Associate's Degree | 13 (1.7%) | 3.0 |
| Bachelor's Degree | 354 (44.8%) | 49.0 |
| Graduate Degree | 311 (39.4%) | 100.0 |
| Total | 790 (100.0%) | 40.0 |
Fertility by Education by Marriage Status in Cedar Park
3.5% of women with births in Cedar Park are unmarried. Women with the educational attainment of less than high school are most likely to be married with 100.0% of them married at childbirth, while women with the educational attainment of graduate degree are least likely to be married with 9.0% of them unmarried at childbirth.
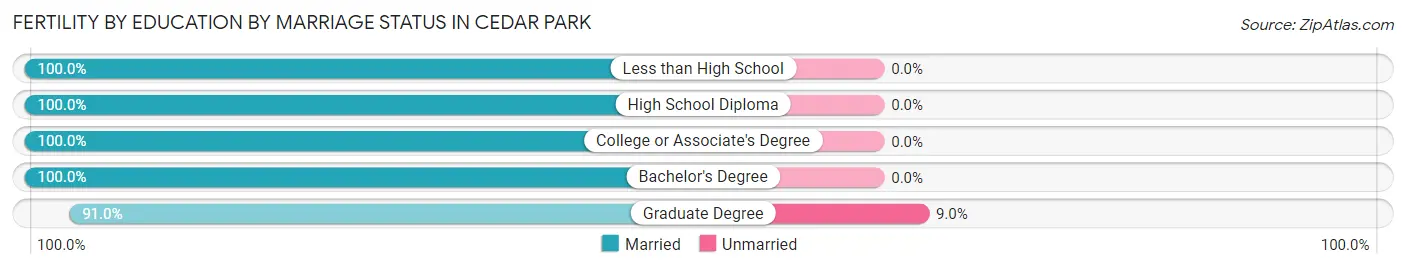
| Educational Attainment | Married | Unmarried |
| Less than High School | 49 (100.0%) | 0 (0.0%) |
| High School Diploma | 63 (100.0%) | 0 (0.0%) |
| College or Associate's Degree | 13 (100.0%) | 0 (0.0%) |
| Bachelor's Degree | 354 (100.0%) | 0 (0.0%) |
| Graduate Degree | 283 (91.0%) | 28 (9.0%) |
| Total | 762 (96.5%) | 28 (3.5%) |
Employment Characteristics in Cedar Park
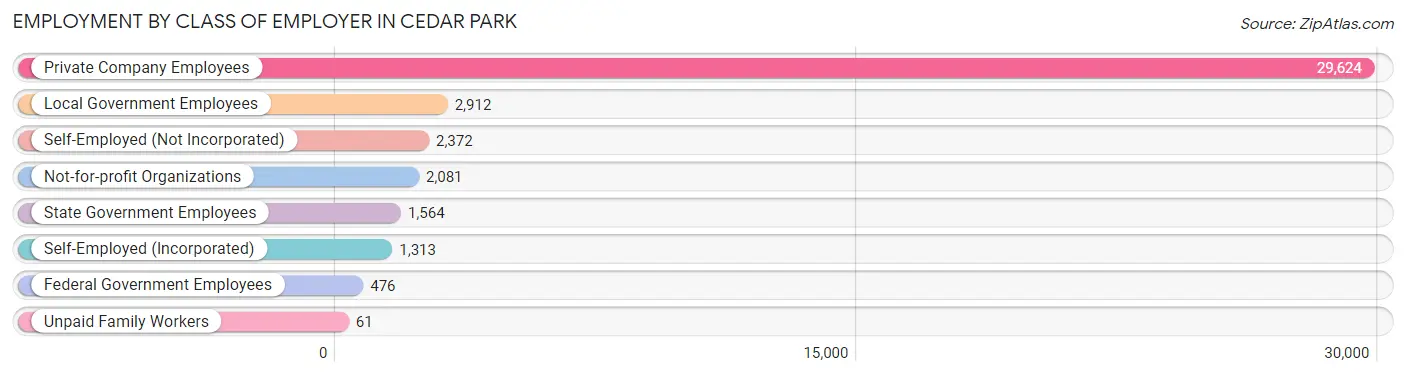
Employment by Class of Employer in Cedar Park
Among the 40,403 employed individuals in Cedar Park, private company employees (29,624 | 73.3%), local government employees (2,912 | 7.2%), and self-employed (not incorporated) (2,372 | 5.9%) make up the most common classes of employment.
| Employer Class | # Employees | % Employees |
| Private Company Employees | 29,624 | 73.3% |
| Self-Employed (Incorporated) | 1,313 | 3.3% |
| Self-Employed (Not Incorporated) | 2,372 | 5.9% |
| Not-for-profit Organizations | 2,081 | 5.1% |
| Local Government Employees | 2,912 | 7.2% |
| State Government Employees | 1,564 | 3.9% |
| Federal Government Employees | 476 | 1.2% |
| Unpaid Family Workers | 61 | 0.2% |
| Total | 40,403 | 100.0% |
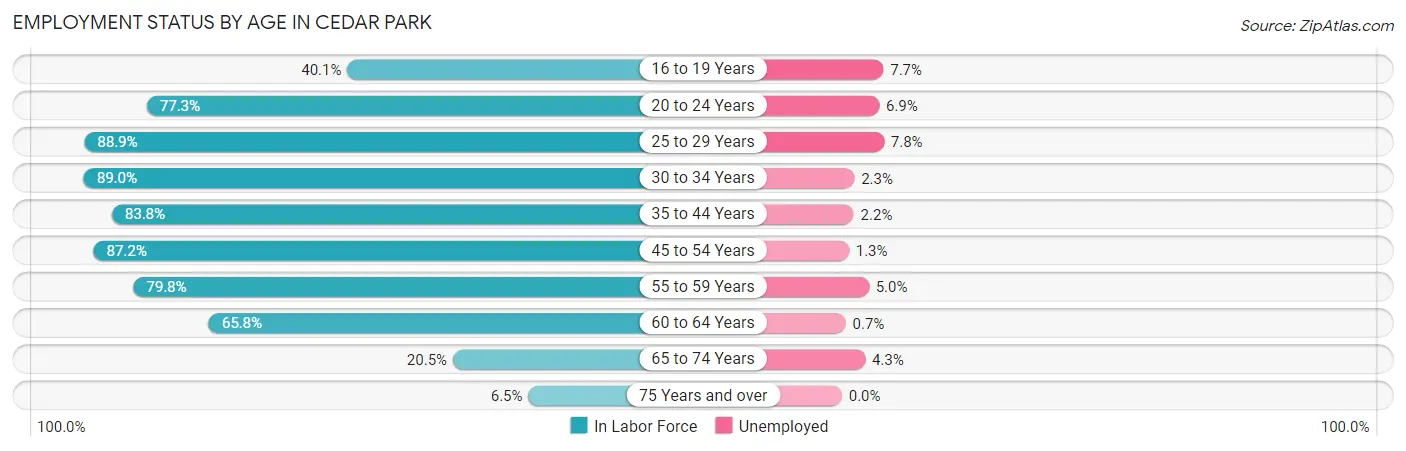
Employment Status by Age in Cedar Park
According to the labor force statistics for Cedar Park, out of the total population over 16 years of age (59,279), 71.3% or 42,266 individuals are in the labor force, with 3.3% or 1,395 of them unemployed. The age group with the highest labor force participation rate is 30 to 34 years, with 89.0% or 5,097 individuals in the labor force. Within the labor force, the 25 to 29 years age range has the highest percentage of unemployed individuals, with 7.8% or 374 of them being unemployed.
| Age Bracket | In Labor Force | Unemployed |
| 16 to 19 Years | 1,472 (40.1%) | 113 (7.7%) |
| 20 to 24 Years | 2,703 (77.3%) | 187 (6.9%) |
| 25 to 29 Years | 4,797 (88.9%) | 374 (7.8%) |
| 30 to 34 Years | 5,097 (89.0%) | 117 (2.3%) |
| 35 to 44 Years | 11,243 (83.8%) | 247 (2.2%) |
| 45 to 54 Years | 9,997 (87.2%) | 130 (1.3%) |
| 55 to 59 Years | 3,431 (79.8%) | 172 (5.0%) |
| 60 to 64 Years | 2,291 (65.8%) | 16 (0.7%) |
| 65 to 74 Years | 1,038 (20.5%) | 45 (4.3%) |
| 75 Years and over | 212 (6.5%) | 0 (0.0%) |
| Total | 42,266 (71.3%) | 1,395 (3.3%) |
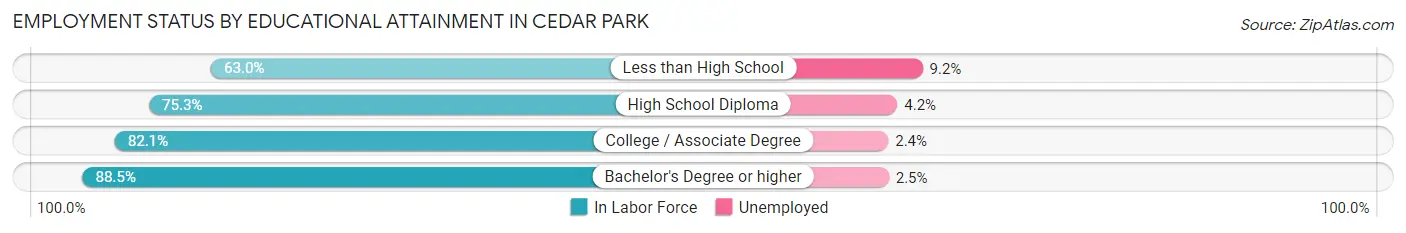
Employment Status by Educational Attainment in Cedar Park
According to labor force statistics for Cedar Park, 84.2% of individuals (36,866) out of the total population between 25 and 64 years of age (43,784) are in the labor force, with 2.9% or 1,069 of them being unemployed. The group with the highest labor force participation rate are those with the educational attainment of bachelor's degree or higher, with 88.5% or 21,618 individuals in the labor force. Within the labor force, individuals with less than high school education have the highest percentage of unemployment, with 9.2% or 72 of them being unemployed.
| Educational Attainment | In Labor Force | Unemployed |
| Less than High School | 782 (63.0%) | 114 (9.2%) |
| High School Diploma | 4,654 (75.3%) | 260 (4.2%) |
| College / Associate Degree | 9,799 (82.1%) | 286 (2.4%) |
| Bachelor's Degree or higher | 21,618 (88.5%) | 611 (2.5%) |
| Total | 36,866 (84.2%) | 1,270 (2.9%) |
Employment Occupations by Sex in Cedar Park
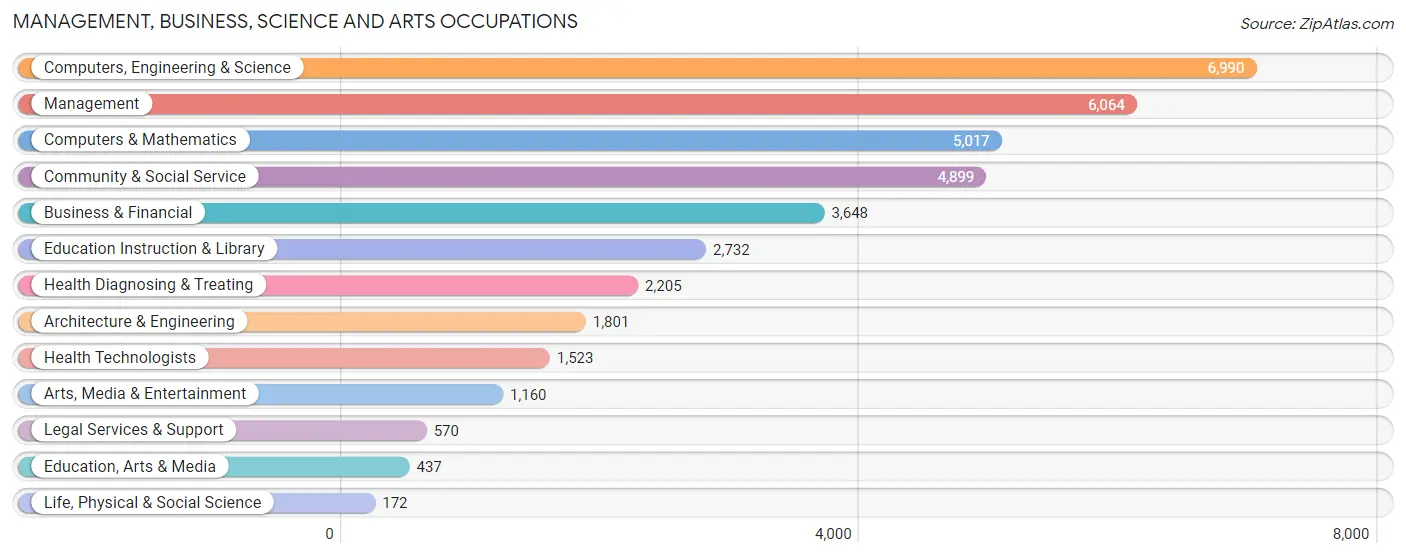
Management, Business, Science and Arts Occupations
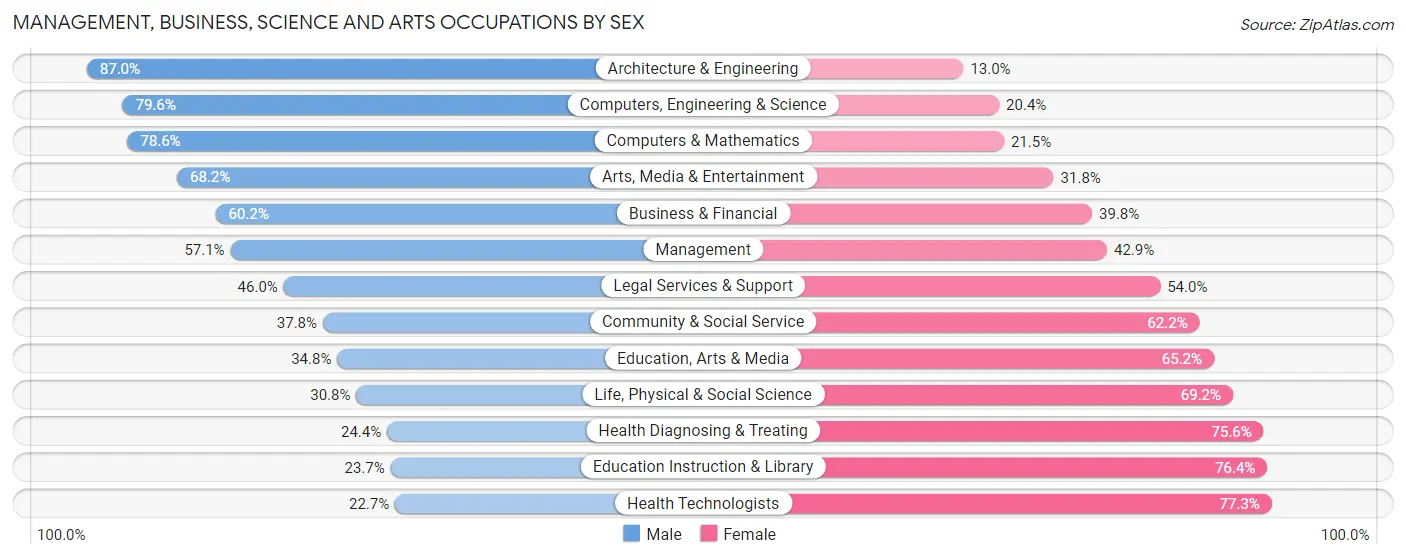
The most common Management, Business, Science and Arts occupations in Cedar Park are Computers, Engineering & Science (6,990 | 17.1%), Management (6,064 | 14.8%), Computers & Mathematics (5,017 | 12.3%), Community & Social Service (4,899 | 12.0%), and Business & Financial (3,648 | 8.9%).
Management, Business, Science and Arts Occupations by Sex
Within the Management, Business, Science and Arts occupations in Cedar Park, the most male-oriented occupations are Architecture & Engineering (87.0%), Computers, Engineering & Science (79.6%), and Computers & Mathematics (78.5%), while the most female-oriented occupations are Health Technologists (77.3%), Education Instruction & Library (76.3%), and Health Diagnosing & Treating (75.6%).
| Occupation | Male | Female |
| Management | 3,460 (57.1%) | 2,604 (42.9%) |
| Business & Financial | 2,195 (60.2%) | 1,453 (39.8%) |
| Computers, Engineering & Science | 5,561 (79.6%) | 1,429 (20.4%) |
| Computers & Mathematics | 3,941 (78.5%) | 1,076 (21.4%) |
| Architecture & Engineering | 1,567 (87.0%) | 234 (13.0%) |
| Life, Physical & Social Science | 53 (30.8%) | 119 (69.2%) |
| Community & Social Service | 1,851 (37.8%) | 3,048 (62.2%) |
| Education, Arts & Media | 152 (34.8%) | 285 (65.2%) |
| Legal Services & Support | 262 (46.0%) | 308 (54.0%) |
| Education Instruction & Library | 646 (23.6%) | 2,086 (76.3%) |
| Arts, Media & Entertainment | 791 (68.2%) | 369 (31.8%) |
| Health Diagnosing & Treating | 538 (24.4%) | 1,667 (75.6%) |
| Health Technologists | 346 (22.7%) | 1,177 (77.3%) |
| Total (Category) | 13,605 (57.2%) | 10,201 (42.8%) |
| Total (Overall) | 22,717 (55.6%) | 18,150 (44.4%) |
Services Occupations
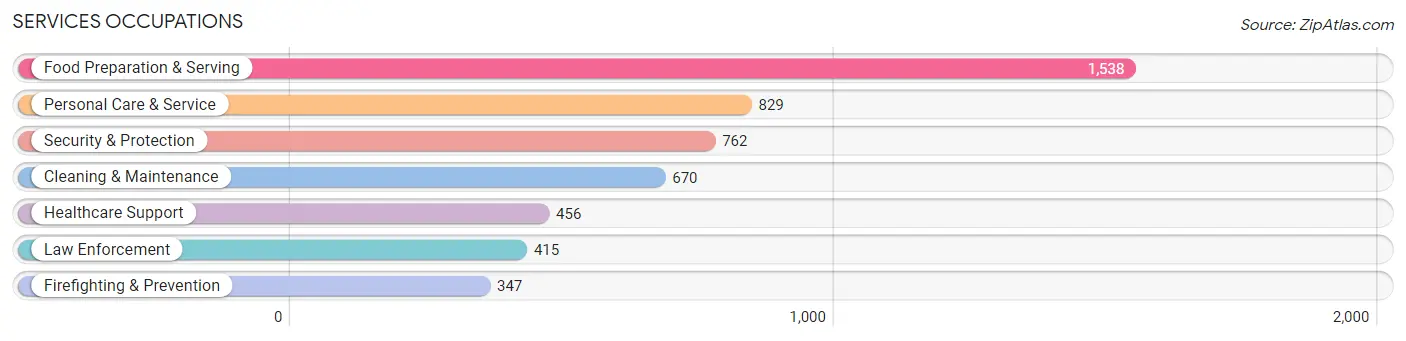
The most common Services occupations in Cedar Park are Food Preparation & Serving (1,538 | 3.8%), Personal Care & Service (829 | 2.0%), Security & Protection (762 | 1.9%), Cleaning & Maintenance (670 | 1.6%), and Healthcare Support (456 | 1.1%).
Services Occupations by Sex
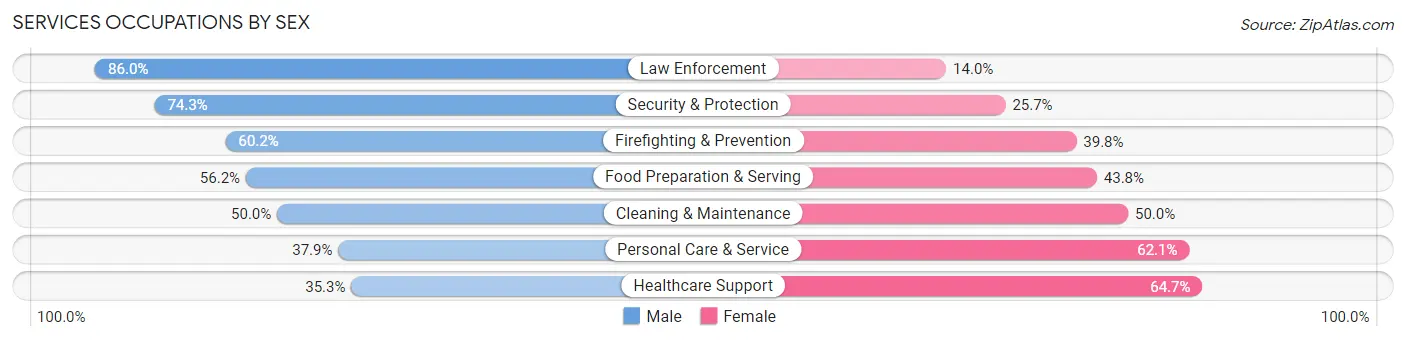
Within the Services occupations in Cedar Park, the most male-oriented occupations are Law Enforcement (86.0%), Security & Protection (74.3%), and Firefighting & Prevention (60.2%), while the most female-oriented occupations are Healthcare Support (64.7%), Personal Care & Service (62.1%), and Cleaning & Maintenance (50.0%).
| Occupation | Male | Female |
| Healthcare Support | 161 (35.3%) | 295 (64.7%) |
| Security & Protection | 566 (74.3%) | 196 (25.7%) |
| Firefighting & Prevention | 209 (60.2%) | 138 (39.8%) |
| Law Enforcement | 357 (86.0%) | 58 (14.0%) |
| Food Preparation & Serving | 864 (56.2%) | 674 (43.8%) |
| Cleaning & Maintenance | 335 (50.0%) | 335 (50.0%) |
| Personal Care & Service | 314 (37.9%) | 515 (62.1%) |
| Total (Category) | 2,240 (52.6%) | 2,015 (47.4%) |
| Total (Overall) | 22,717 (55.6%) | 18,150 (44.4%) |
Sales and Office Occupations
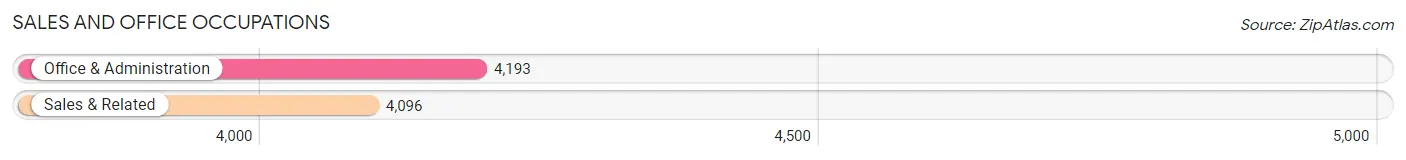
The most common Sales and Office occupations in Cedar Park are Office & Administration (4,193 | 10.3%), and Sales & Related (4,096 | 10.0%).
Sales and Office Occupations by Sex
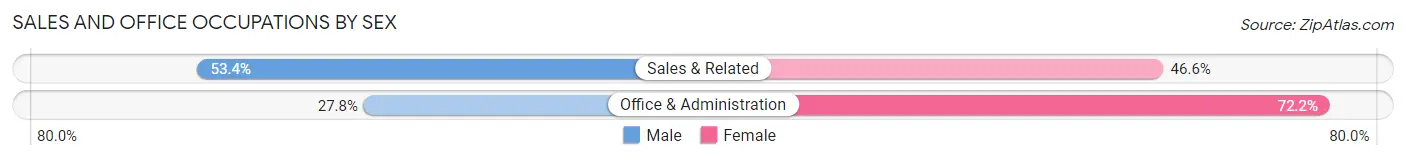
| Occupation | Male | Female |
| Sales & Related | 2,186 (53.4%) | 1,910 (46.6%) |
| Office & Administration | 1,166 (27.8%) | 3,027 (72.2%) |
| Total (Category) | 3,352 (40.4%) | 4,937 (59.6%) |
| Total (Overall) | 22,717 (55.6%) | 18,150 (44.4%) |
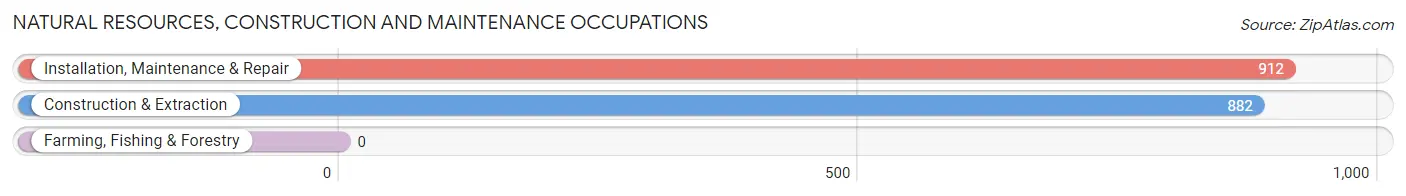
Natural Resources, Construction and Maintenance Occupations
The most common Natural Resources, Construction and Maintenance occupations in Cedar Park are Installation, Maintenance & Repair (912 | 2.2%), and Construction & Extraction (882 | 2.2%).
Natural Resources, Construction and Maintenance Occupations by Sex
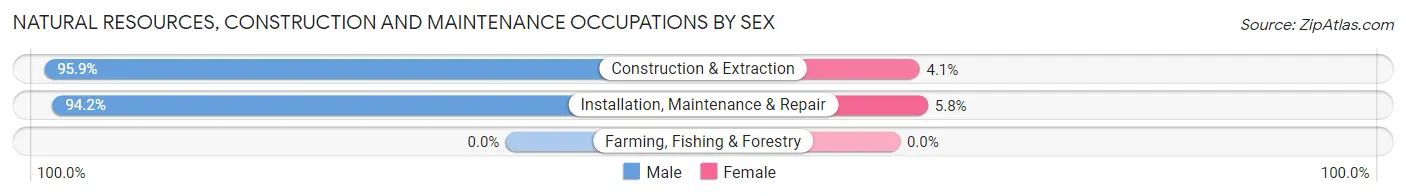
| Occupation | Male | Female |
| Farming, Fishing & Forestry | 0 (0.0%) | 0 (0.0%) |
| Construction & Extraction | 846 (95.9%) | 36 (4.1%) |
| Installation, Maintenance & Repair | 859 (94.2%) | 53 (5.8%) |
| Total (Category) | 1,705 (95.0%) | 89 (5.0%) |
| Total (Overall) | 22,717 (55.6%) | 18,150 (44.4%) |
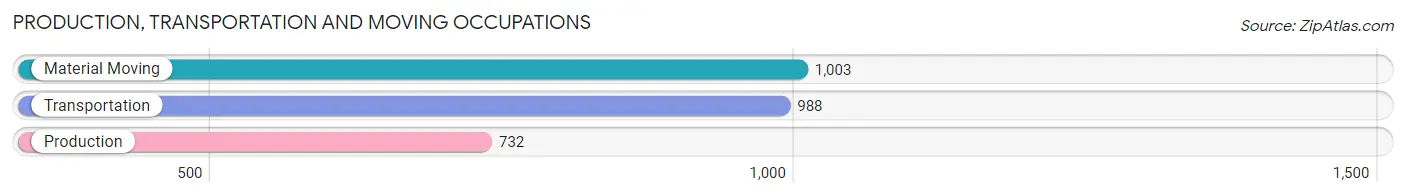
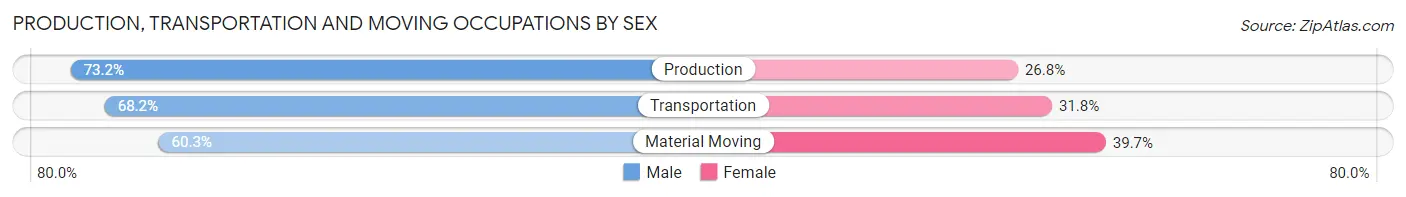
Production, Transportation and Moving Occupations
The most common Production, Transportation and Moving occupations in Cedar Park are Material Moving (1,003 | 2.5%), Transportation (988 | 2.4%), and Production (732 | 1.8%).
Production, Transportation and Moving Occupations by Sex
| Occupation | Male | Female |
| Production | 536 (73.2%) | 196 (26.8%) |
| Transportation | 674 (68.2%) | 314 (31.8%) |
| Material Moving | 605 (60.3%) | 398 (39.7%) |
| Total (Category) | 1,815 (66.6%) | 908 (33.4%) |
| Total (Overall) | 22,717 (55.6%) | 18,150 (44.4%) |
Employment Industries by Sex in Cedar Park
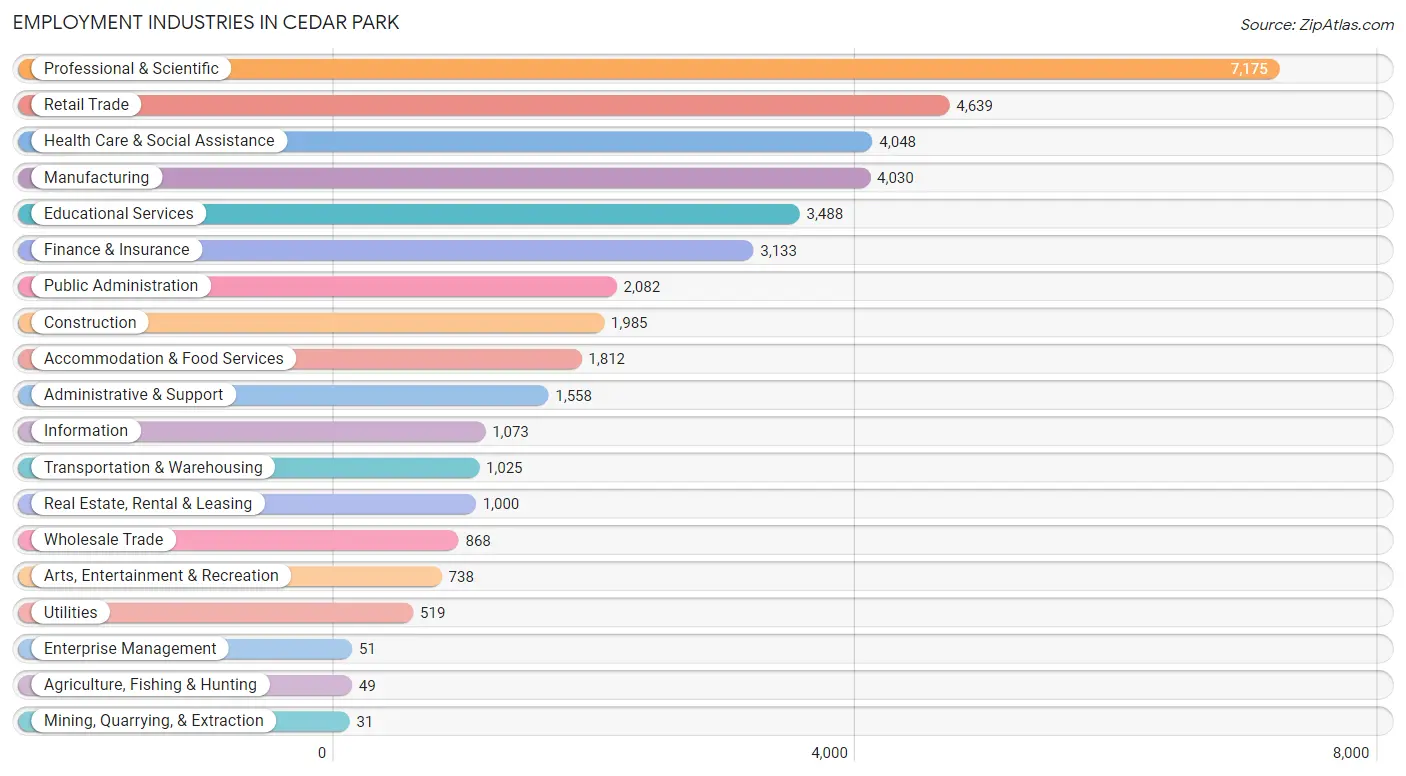
Employment Industries in Cedar Park
The major employment industries in Cedar Park include Professional & Scientific (7,175 | 17.6%), Retail Trade (4,639 | 11.4%), Health Care & Social Assistance (4,048 | 9.9%), Manufacturing (4,030 | 9.9%), and Educational Services (3,488 | 8.5%).
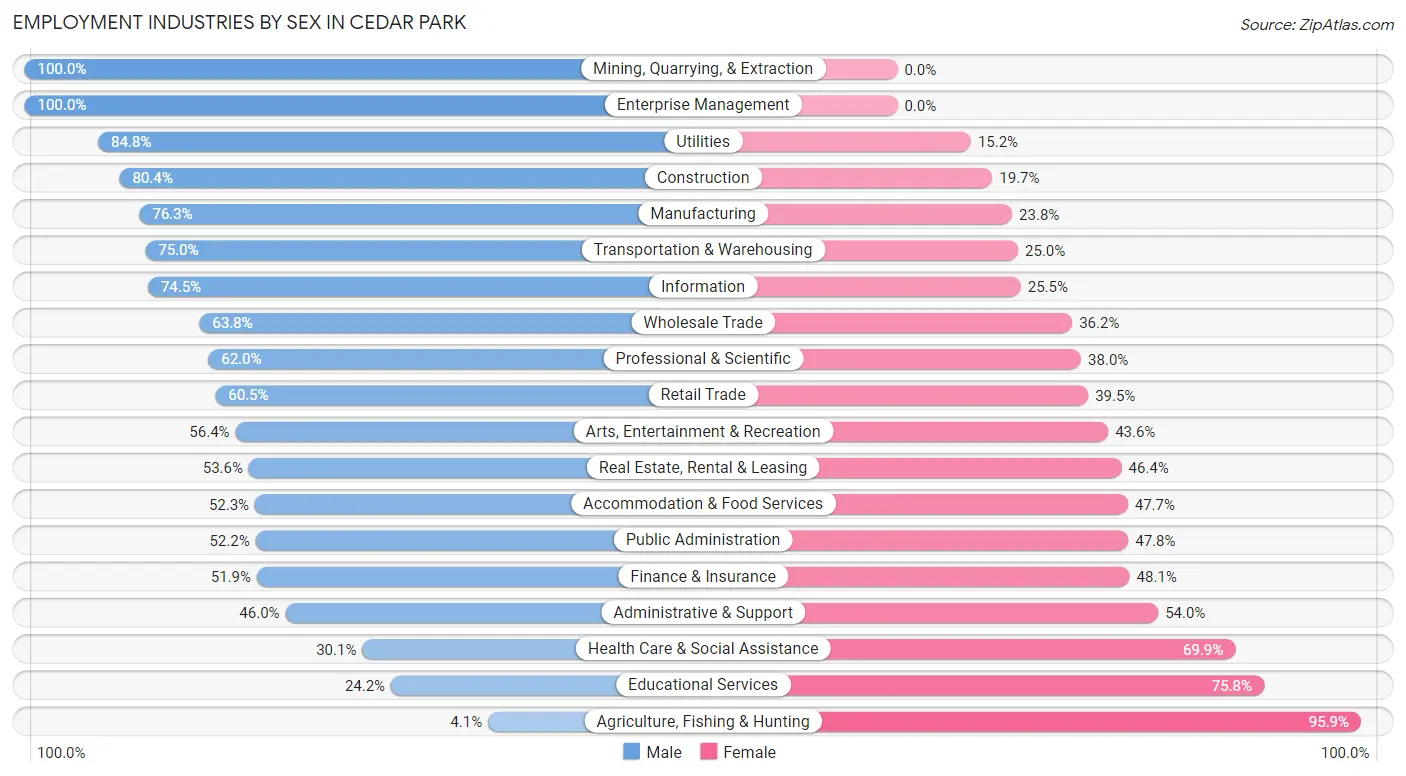
Employment Industries by Sex in Cedar Park
The Cedar Park industries that see more men than women are Mining, Quarrying, & Extraction (100.0%), Enterprise Management (100.0%), and Utilities (84.8%), whereas the industries that tend to have a higher number of women are Agriculture, Fishing & Hunting (95.9%), Educational Services (75.8%), and Health Care & Social Assistance (69.9%).
| Industry | Male | Female |
| Agriculture, Fishing & Hunting | 2 (4.1%) | 47 (95.9%) |
| Mining, Quarrying, & Extraction | 31 (100.0%) | 0 (0.0%) |
| Construction | 1,595 (80.3%) | 390 (19.7%) |
| Manufacturing | 3,073 (76.2%) | 957 (23.7%) |
| Wholesale Trade | 554 (63.8%) | 314 (36.2%) |
| Retail Trade | 2,807 (60.5%) | 1,832 (39.5%) |
| Transportation & Warehousing | 769 (75.0%) | 256 (25.0%) |
| Utilities | 440 (84.8%) | 79 (15.2%) |
| Information | 799 (74.5%) | 274 (25.5%) |
| Finance & Insurance | 1,627 (51.9%) | 1,506 (48.1%) |
| Real Estate, Rental & Leasing | 536 (53.6%) | 464 (46.4%) |
| Professional & Scientific | 4,446 (62.0%) | 2,729 (38.0%) |
| Enterprise Management | 51 (100.0%) | 0 (0.0%) |
| Administrative & Support | 717 (46.0%) | 841 (54.0%) |
| Educational Services | 843 (24.2%) | 2,645 (75.8%) |
| Health Care & Social Assistance | 1,219 (30.1%) | 2,829 (69.9%) |
| Arts, Entertainment & Recreation | 416 (56.4%) | 322 (43.6%) |
| Accommodation & Food Services | 948 (52.3%) | 864 (47.7%) |
| Public Administration | 1,087 (52.2%) | 995 (47.8%) |
| Total | 22,717 (55.6%) | 18,150 (44.4%) |
Education in Cedar Park
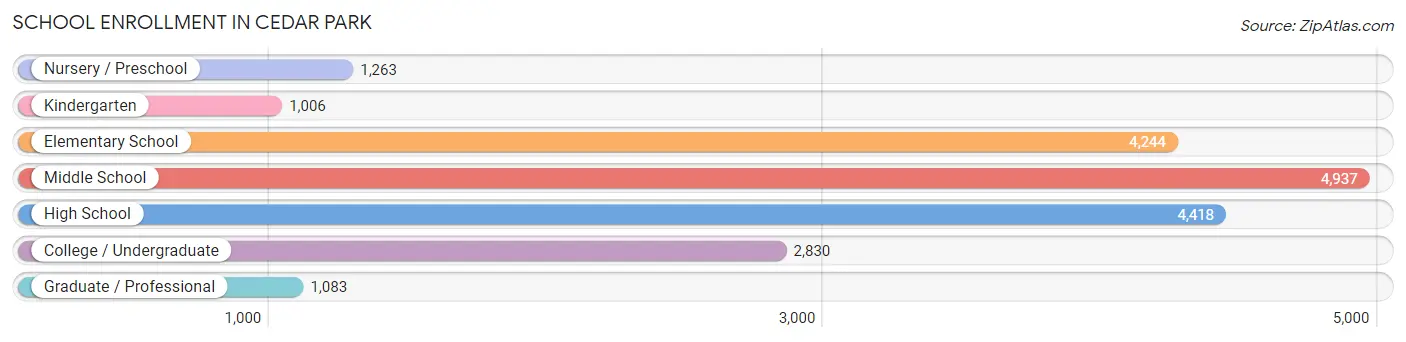
School Enrollment in Cedar Park
The most common levels of schooling among the 19,781 students in Cedar Park are middle school (4,937 | 25.0%), high school (4,418 | 22.3%), and elementary school (4,244 | 21.4%).
| School Level | # Students | % Students |
| Nursery / Preschool | 1,263 | 6.4% |
| Kindergarten | 1,006 | 5.1% |
| Elementary School | 4,244 | 21.4% |
| Middle School | 4,937 | 25.0% |
| High School | 4,418 | 22.3% |
| College / Undergraduate | 2,830 | 14.3% |
| Graduate / Professional | 1,083 | 5.5% |
| Total | 19,781 | 100.0% |
School Enrollment by Age by Funding Source in Cedar Park
Out of a total of 19,781 students who are enrolled in schools in Cedar Park, 3,244 (16.4%) attend a private institution, while the remaining 16,537 (83.6%) are enrolled in public schools. The age group of 3 to 4 year olds has the highest likelihood of being enrolled in private schools, with 729 (73.8% in the age bracket) enrolled. Conversely, the age group of 18 to 19 year olds has the lowest likelihood of being enrolled in a private school, with 1,143 (94.6% in the age bracket) attending a public institution.
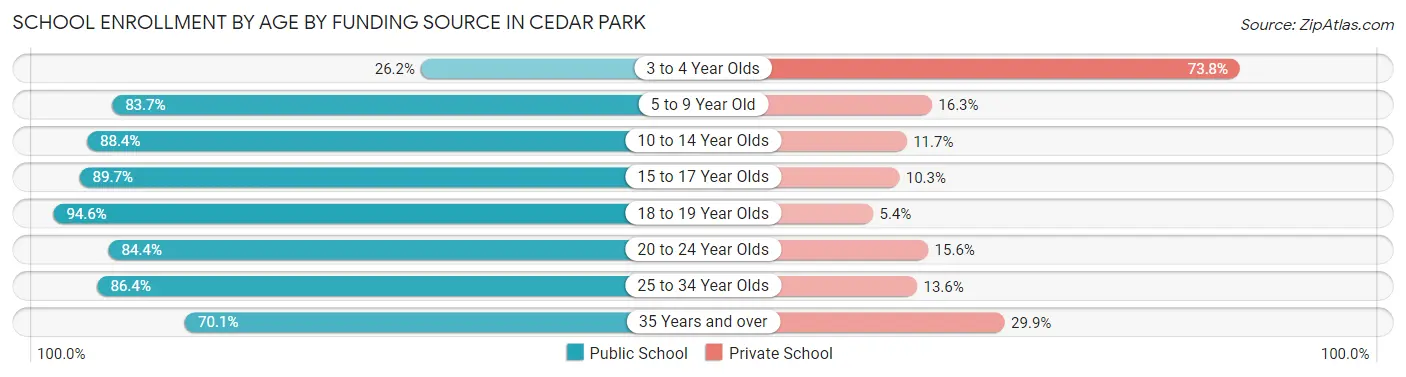
| Age Bracket | Public School | Private School |
| 3 to 4 Year Olds | 259 (26.2%) | 729 (73.8%) |
| 5 to 9 Year Old | 4,218 (83.7%) | 823 (16.3%) |
| 10 to 14 Year Olds | 5,492 (88.3%) | 724 (11.7%) |
| 15 to 17 Year Olds | 2,789 (89.7%) | 319 (10.3%) |
| 18 to 19 Year Olds | 1,143 (94.6%) | 65 (5.4%) |
| 20 to 24 Year Olds | 1,106 (84.4%) | 205 (15.6%) |
| 25 to 34 Year Olds | 1,031 (86.4%) | 162 (13.6%) |
| 35 Years and over | 502 (70.1%) | 214 (29.9%) |
| Total | 16,537 (83.6%) | 3,244 (16.4%) |
Educational Attainment by Field of Study in Cedar Park
Business (6,150 | 20.7%), engineering (4,161 | 14.0%), computers & mathematics (2,781 | 9.4%), science & technology (2,436 | 8.2%), and education (2,418 | 8.2%) are the most common fields of study among 29,673 individuals in Cedar Park who have obtained a bachelor's degree or higher.
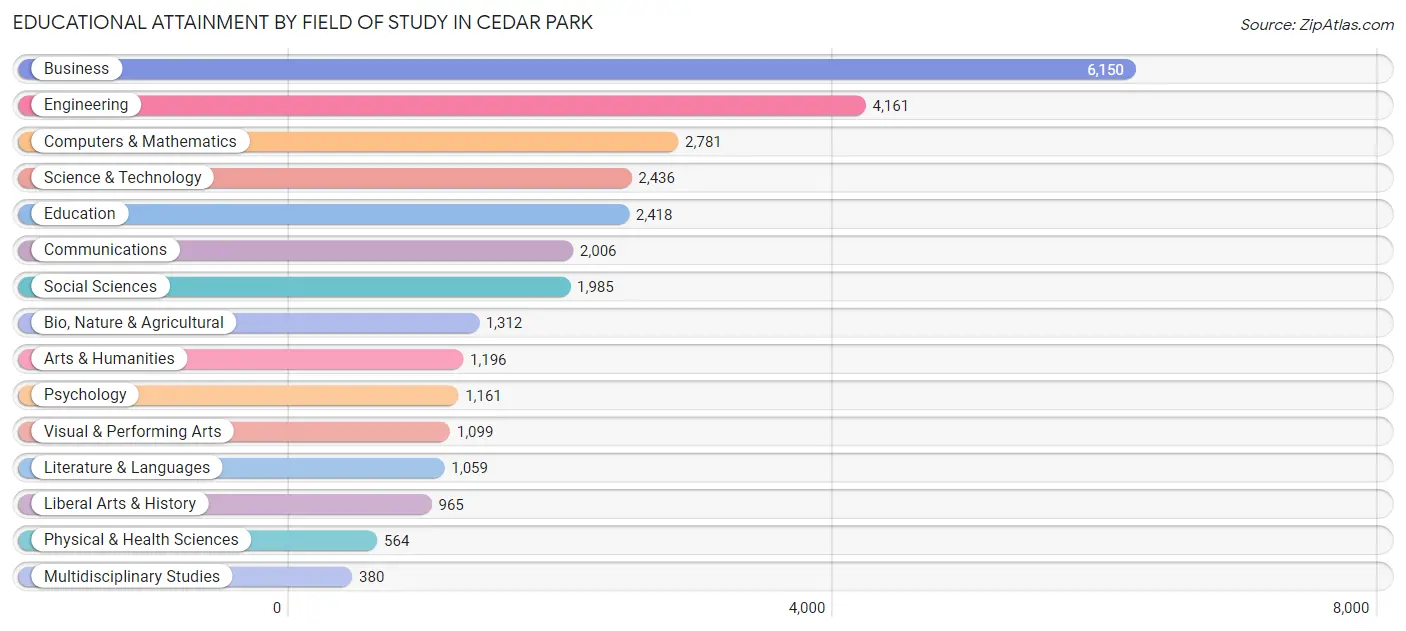
| Field of Study | # Graduates | % Graduates |
| Computers & Mathematics | 2,781 | 9.4% |
| Bio, Nature & Agricultural | 1,312 | 4.4% |
| Physical & Health Sciences | 564 | 1.9% |
| Psychology | 1,161 | 3.9% |
| Social Sciences | 1,985 | 6.7% |
| Engineering | 4,161 | 14.0% |
| Multidisciplinary Studies | 380 | 1.3% |
| Science & Technology | 2,436 | 8.2% |
| Business | 6,150 | 20.7% |
| Education | 2,418 | 8.2% |
| Literature & Languages | 1,059 | 3.6% |
| Liberal Arts & History | 965 | 3.3% |
| Visual & Performing Arts | 1,099 | 3.7% |
| Communications | 2,006 | 6.8% |
| Arts & Humanities | 1,196 | 4.0% |
| Total | 29,673 | 100.0% |
Transportation & Commute in Cedar Park
Vehicle Availability by Sex in Cedar Park
The most prevalent vehicle ownership categories in Cedar Park are males with 2 vehicles (11,446, accounting for 50.8%) and females with 2 vehicles (8,989, making up 64.1%).
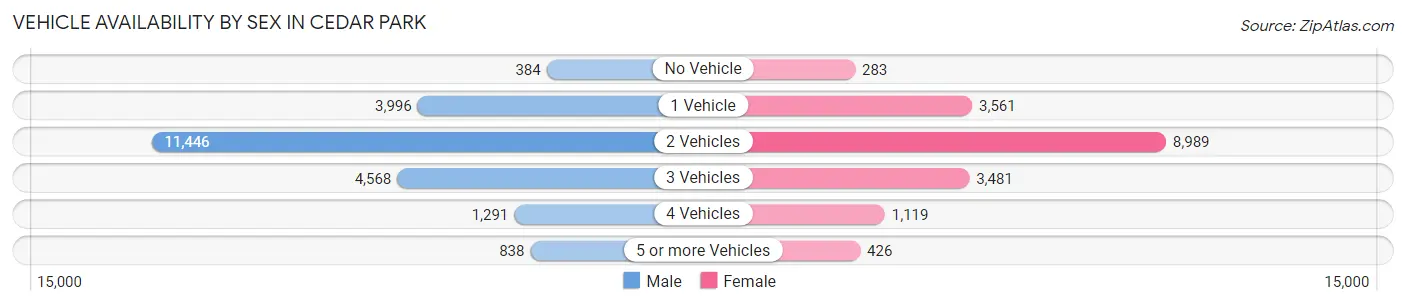
| Vehicles Available | Male | Female |
| No Vehicle | 384 (1.7%) | 283 (1.6%) |
| 1 Vehicle | 3,996 (17.7%) | 3,561 (19.9%) |
| 2 Vehicles | 11,446 (50.8%) | 8,989 (50.3%) |
| 3 Vehicles | 4,568 (20.3%) | 3,481 (19.5%) |
| 4 Vehicles | 1,291 (5.7%) | 1,119 (6.3%) |
| 5 or more Vehicles | 838 (3.7%) | 426 (2.4%) |
| Total | 22,523 (100.0%) | 17,859 (100.0%) |
Commute Time in Cedar Park
The most frequently occuring commute durations in Cedar Park are 15 to 19 minutes (4,586 commuters, 15.4%), 20 to 24 minutes (4,229 commuters, 14.2%), and 30 to 34 minutes (3,892 commuters, 13.1%).
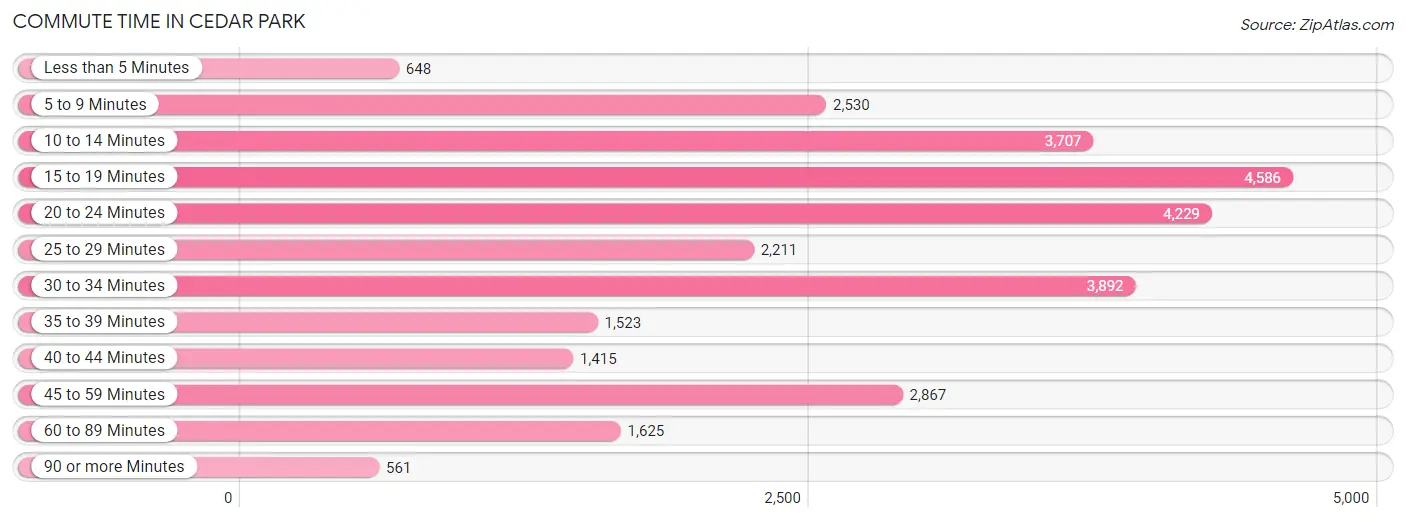
| Commute Time | # Commuters | % Commuters |
| Less than 5 Minutes | 648 | 2.2% |
| 5 to 9 Minutes | 2,530 | 8.5% |
| 10 to 14 Minutes | 3,707 | 12.4% |
| 15 to 19 Minutes | 4,586 | 15.4% |
| 20 to 24 Minutes | 4,229 | 14.2% |
| 25 to 29 Minutes | 2,211 | 7.4% |
| 30 to 34 Minutes | 3,892 | 13.1% |
| 35 to 39 Minutes | 1,523 | 5.1% |
| 40 to 44 Minutes | 1,415 | 4.8% |
| 45 to 59 Minutes | 2,867 | 9.6% |
| 60 to 89 Minutes | 1,625 | 5.4% |
| 90 or more Minutes | 561 | 1.9% |
Commute Time by Sex in Cedar Park
The most common commute times in Cedar Park are 20 to 24 minutes (2,530 commuters, 15.6%) for males and 15 to 19 minutes (2,234 commuters, 16.5%) for females.
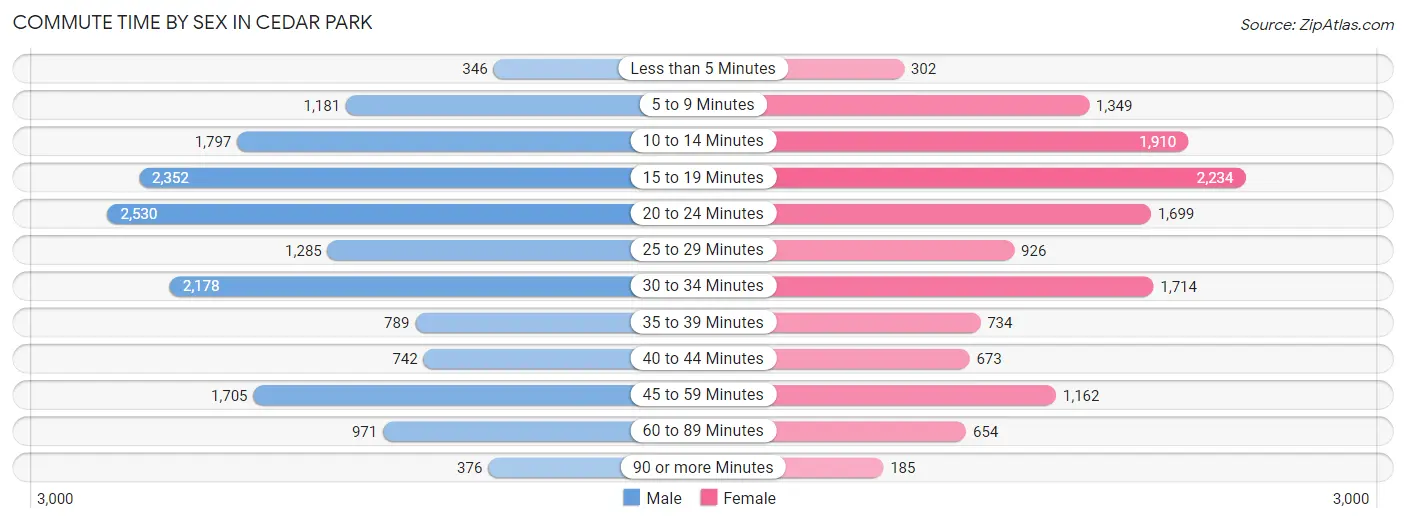
| Commute Time | Male | Female |
| Less than 5 Minutes | 346 (2.1%) | 302 (2.2%) |
| 5 to 9 Minutes | 1,181 (7.3%) | 1,349 (10.0%) |
| 10 to 14 Minutes | 1,797 (11.1%) | 1,910 (14.1%) |
| 15 to 19 Minutes | 2,352 (14.5%) | 2,234 (16.5%) |
| 20 to 24 Minutes | 2,530 (15.6%) | 1,699 (12.6%) |
| 25 to 29 Minutes | 1,285 (7.9%) | 926 (6.8%) |
| 30 to 34 Minutes | 2,178 (13.4%) | 1,714 (12.7%) |
| 35 to 39 Minutes | 789 (4.9%) | 734 (5.4%) |
| 40 to 44 Minutes | 742 (4.6%) | 673 (5.0%) |
| 45 to 59 Minutes | 1,705 (10.5%) | 1,162 (8.6%) |
| 60 to 89 Minutes | 971 (6.0%) | 654 (4.8%) |
| 90 or more Minutes | 376 (2.3%) | 185 (1.4%) |
Time of Departure to Work by Sex in Cedar Park
The most frequent times of departure to work in Cedar Park are 8:00 AM to 8:29 AM (2,783, 17.1%) for males and 7:00 AM to 7:29 AM (2,361, 17.4%) for females.
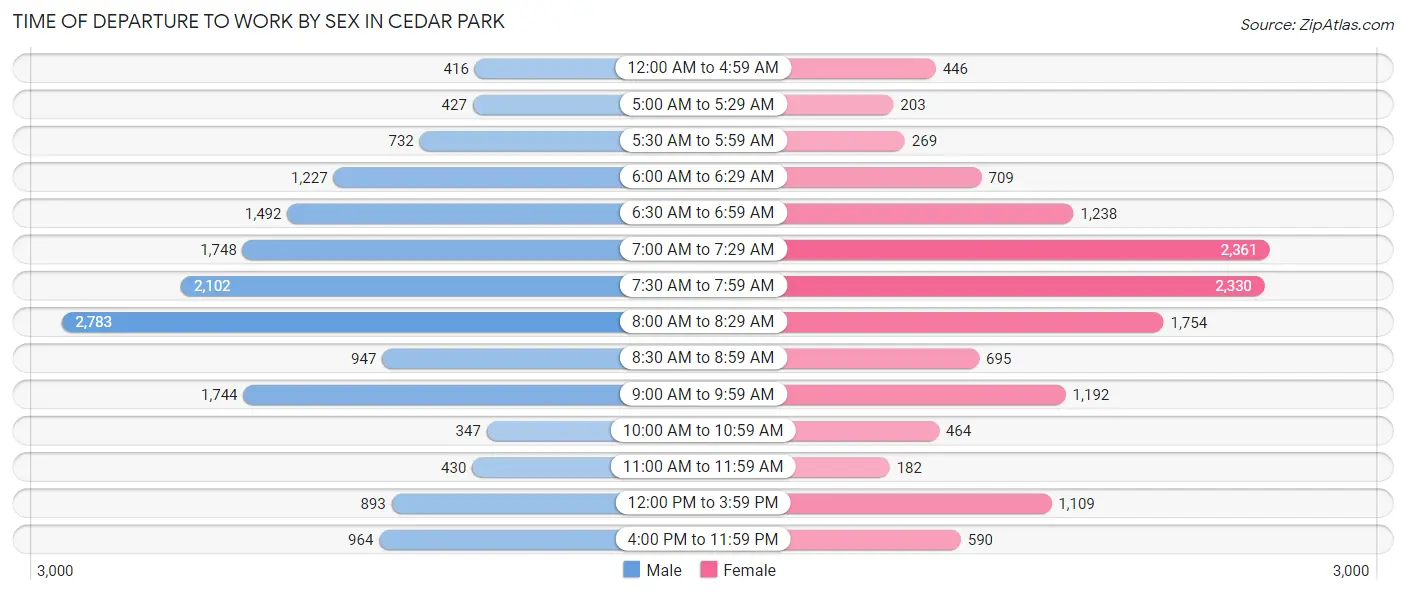
| Time of Departure | Male | Female |
| 12:00 AM to 4:59 AM | 416 (2.6%) | 446 (3.3%) |
| 5:00 AM to 5:29 AM | 427 (2.6%) | 203 (1.5%) |
| 5:30 AM to 5:59 AM | 732 (4.5%) | 269 (2.0%) |
| 6:00 AM to 6:29 AM | 1,227 (7.5%) | 709 (5.2%) |
| 6:30 AM to 6:59 AM | 1,492 (9.2%) | 1,238 (9.1%) |
| 7:00 AM to 7:29 AM | 1,748 (10.8%) | 2,361 (17.4%) |
| 7:30 AM to 7:59 AM | 2,102 (12.9%) | 2,330 (17.2%) |
| 8:00 AM to 8:29 AM | 2,783 (17.1%) | 1,754 (13.0%) |
| 8:30 AM to 8:59 AM | 947 (5.8%) | 695 (5.1%) |
| 9:00 AM to 9:59 AM | 1,744 (10.7%) | 1,192 (8.8%) |
| 10:00 AM to 10:59 AM | 347 (2.1%) | 464 (3.4%) |
| 11:00 AM to 11:59 AM | 430 (2.6%) | 182 (1.3%) |
| 12:00 PM to 3:59 PM | 893 (5.5%) | 1,109 (8.2%) |
| 4:00 PM to 11:59 PM | 964 (5.9%) | 590 (4.4%) |
| Total | 16,252 (100.0%) | 13,542 (100.0%) |
Housing Occupancy in Cedar Park
Occupancy by Ownership in Cedar Park
Of the total 28,764 dwellings in Cedar Park, owner-occupied units account for 19,197 (66.7%), while renter-occupied units make up 9,567 (33.3%).
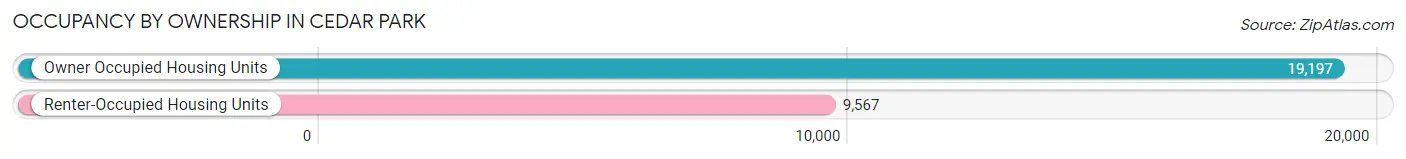
| Occupancy | # Housing Units | % Housing Units |
| Owner Occupied Housing Units | 19,197 | 66.7% |
| Renter-Occupied Housing Units | 9,567 | 33.3% |
| Total Occupied Housing Units | 28,764 | 100.0% |
Occupancy by Household Size in Cedar Park
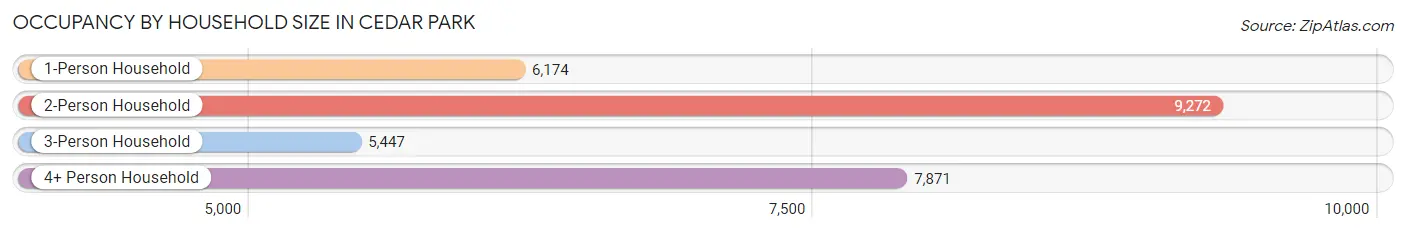
| Household Size | # Housing Units | % Housing Units |
| 1-Person Household | 6,174 | 21.5% |
| 2-Person Household | 9,272 | 32.2% |
| 3-Person Household | 5,447 | 18.9% |
| 4+ Person Household | 7,871 | 27.4% |
| Total Housing Units | 28,764 | 100.0% |
Occupancy by Ownership by Household Size in Cedar Park
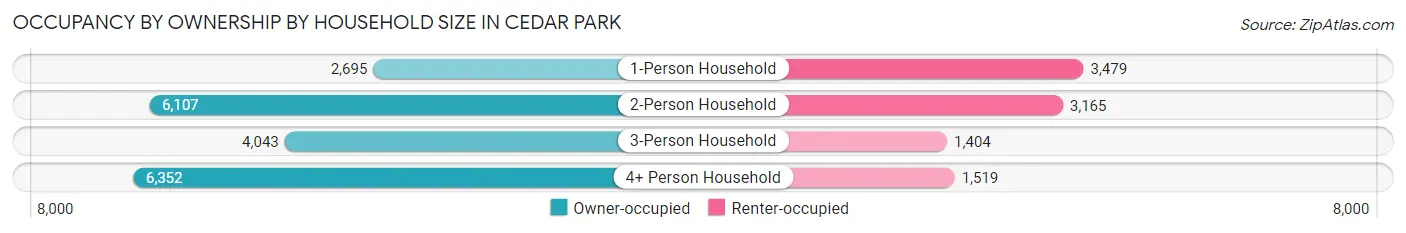
| Household Size | Owner-occupied | Renter-occupied |
| 1-Person Household | 2,695 (43.6%) | 3,479 (56.4%) |
| 2-Person Household | 6,107 (65.9%) | 3,165 (34.1%) |
| 3-Person Household | 4,043 (74.2%) | 1,404 (25.8%) |
| 4+ Person Household | 6,352 (80.7%) | 1,519 (19.3%) |
| Total Housing Units | 19,197 (66.7%) | 9,567 (33.3%) |
Occupancy by Educational Attainment in Cedar Park
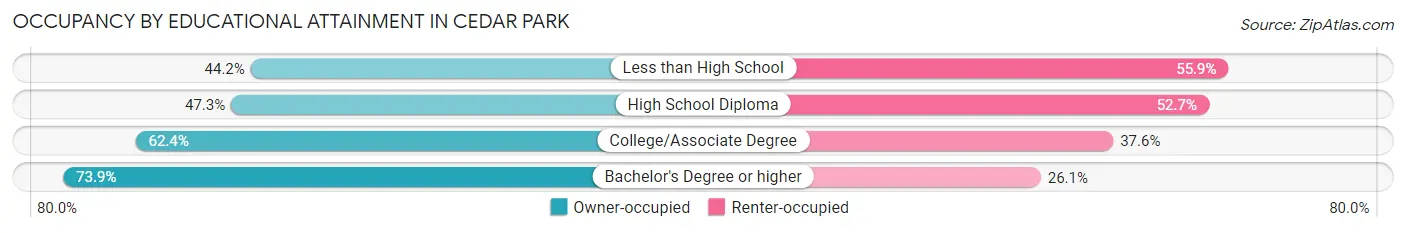
| Household Size | Owner-occupied | Renter-occupied |
| Less than High School | 249 (44.2%) | 315 (55.8%) |
| High School Diploma | 1,696 (47.3%) | 1,893 (52.7%) |
| College/Associate Degree | 5,069 (62.4%) | 3,055 (37.6%) |
| Bachelor's Degree or higher | 12,183 (73.9%) | 4,304 (26.1%) |
Occupancy by Age of Householder in Cedar Park
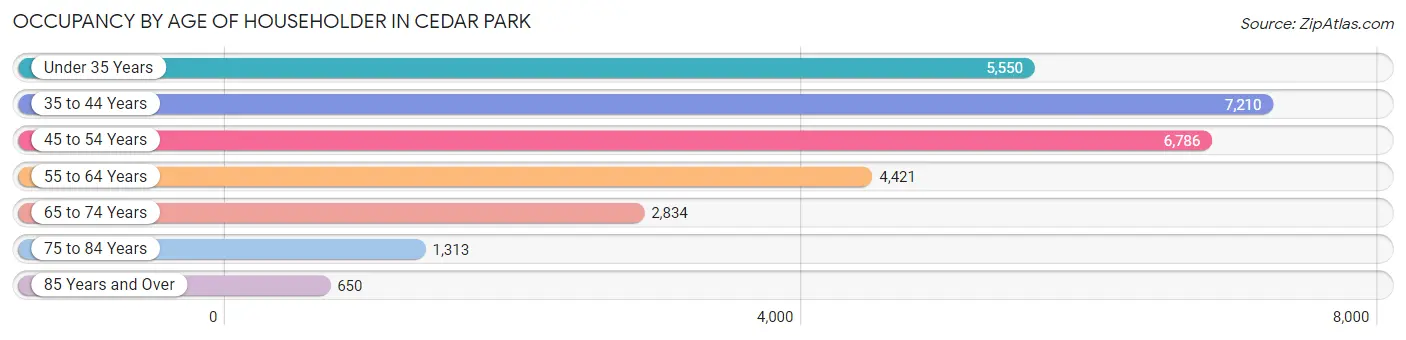
| Age Bracket | # Households | % Households |
| Under 35 Years | 5,550 | 19.3% |
| 35 to 44 Years | 7,210 | 25.1% |
| 45 to 54 Years | 6,786 | 23.6% |
| 55 to 64 Years | 4,421 | 15.4% |
| 65 to 74 Years | 2,834 | 9.9% |
| 75 to 84 Years | 1,313 | 4.6% |
| 85 Years and Over | 650 | 2.3% |
| Total | 28,764 | 100.0% |
Housing Finances in Cedar Park
Median Income by Occupancy in Cedar Park
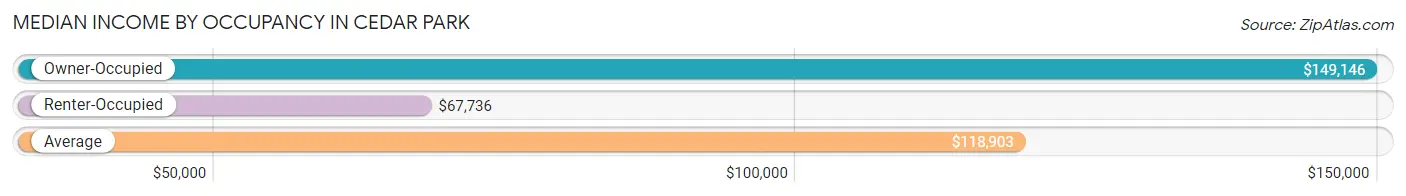
| Occupancy Type | # Households | Median Income |
| Owner-Occupied | 19,197 (66.7%) | $149,146 |
| Renter-Occupied | 9,567 (33.3%) | $67,736 |
| Average | 28,764 (100.0%) | $118,903 |
Occupancy by Householder Income Bracket in Cedar Park
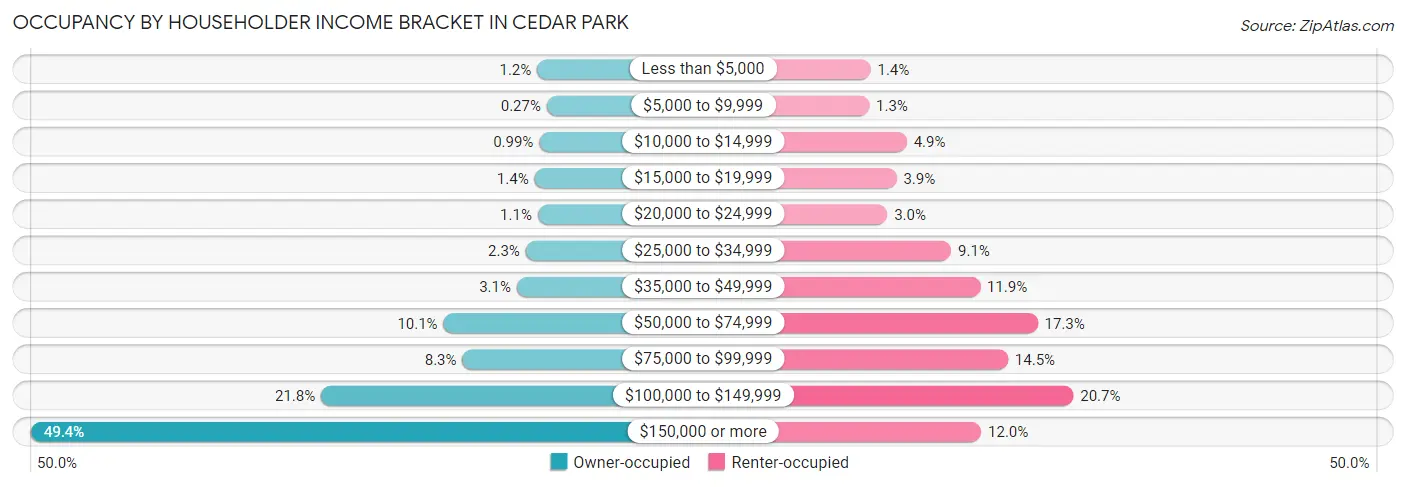
| Income Bracket | Owner-occupied | Renter-occupied |
| Less than $5,000 | 228 (1.2%) | 137 (1.4%) |
| $5,000 to $9,999 | 51 (0.3%) | 123 (1.3%) |
| $10,000 to $14,999 | 191 (1.0%) | 466 (4.9%) |
| $15,000 to $19,999 | 276 (1.4%) | 373 (3.9%) |
| $20,000 to $24,999 | 216 (1.1%) | 289 (3.0%) |
| $25,000 to $34,999 | 438 (2.3%) | 871 (9.1%) |
| $35,000 to $49,999 | 598 (3.1%) | 1,134 (11.8%) |
| $50,000 to $74,999 | 1,940 (10.1%) | 1,658 (17.3%) |
| $75,000 to $99,999 | 1,596 (8.3%) | 1,388 (14.5%) |
| $100,000 to $149,999 | 4,179 (21.8%) | 1,984 (20.7%) |
| $150,000 or more | 9,484 (49.4%) | 1,144 (12.0%) |
| Total | 19,197 (100.0%) | 9,567 (100.0%) |
Monthly Housing Cost Tiers in Cedar Park
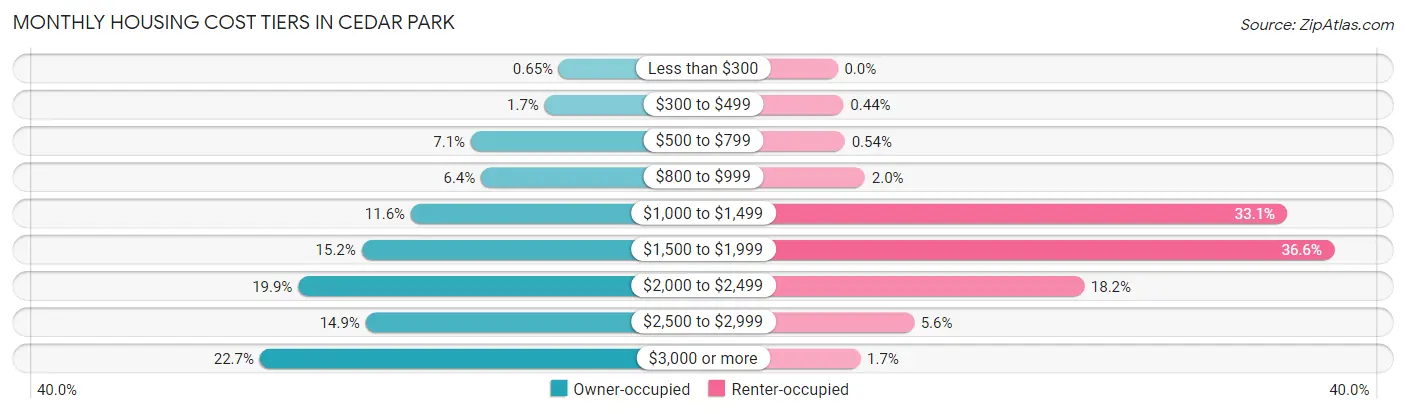
| Monthly Cost | Owner-occupied | Renter-occupied |
| Less than $300 | 124 (0.6%) | 0 (0.0%) |
| $300 to $499 | 326 (1.7%) | 42 (0.4%) |
| $500 to $799 | 1,368 (7.1%) | 52 (0.5%) |
| $800 to $999 | 1,225 (6.4%) | 193 (2.0%) |
| $1,000 to $1,499 | 2,217 (11.6%) | 3,167 (33.1%) |
| $1,500 to $1,999 | 2,915 (15.2%) | 3,497 (36.5%) |
| $2,000 to $2,499 | 3,811 (19.9%) | 1,736 (18.1%) |
| $2,500 to $2,999 | 2,857 (14.9%) | 538 (5.6%) |
| $3,000 or more | 4,354 (22.7%) | 160 (1.7%) |
| Total | 19,197 (100.0%) | 9,567 (100.0%) |
Physical Housing Characteristics in Cedar Park
Housing Structures in Cedar Park
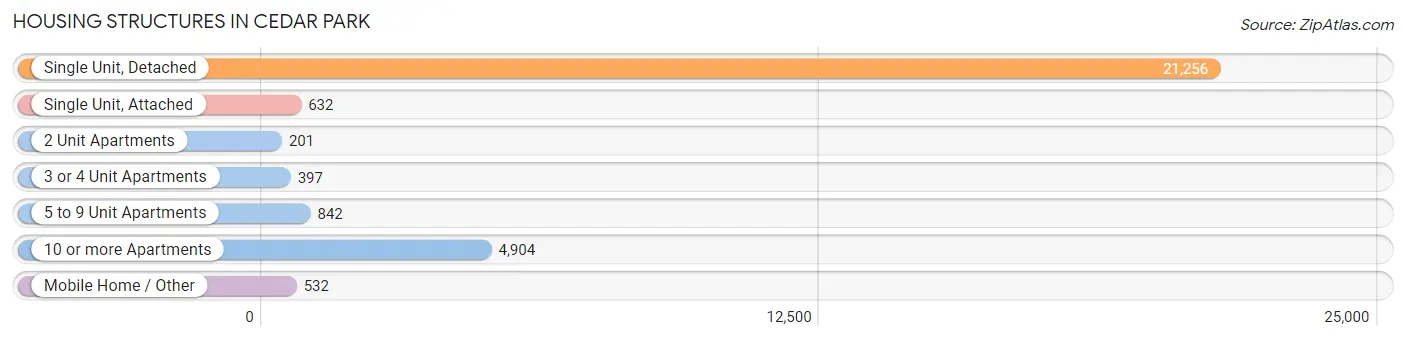
| Structure Type | # Housing Units | % Housing Units |
| Single Unit, Detached | 21,256 | 73.9% |
| Single Unit, Attached | 632 | 2.2% |
| 2 Unit Apartments | 201 | 0.7% |
| 3 or 4 Unit Apartments | 397 | 1.4% |
| 5 to 9 Unit Apartments | 842 | 2.9% |
| 10 or more Apartments | 4,904 | 17.1% |
| Mobile Home / Other | 532 | 1.8% |
| Total | 28,764 | 100.0% |
Housing Structures by Occupancy in Cedar Park
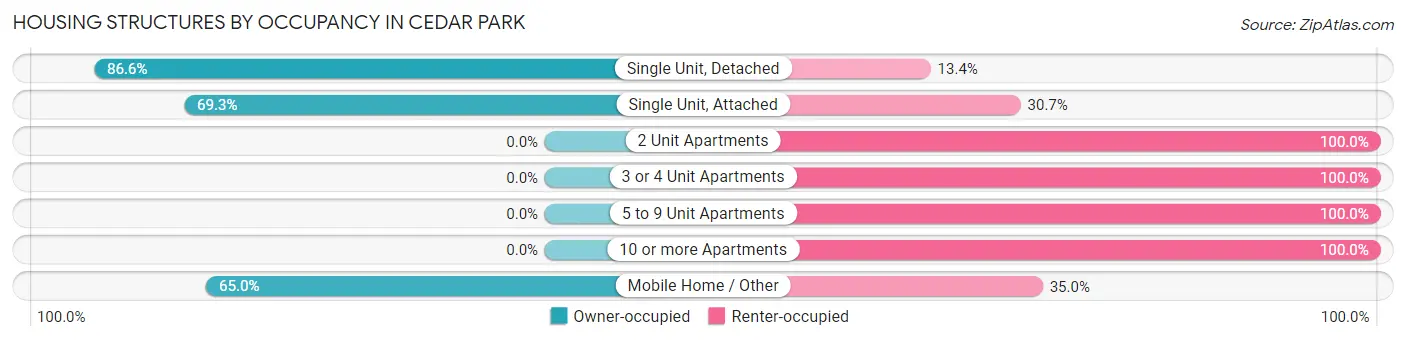
| Structure Type | Owner-occupied | Renter-occupied |
| Single Unit, Detached | 18,413 (86.6%) | 2,843 (13.4%) |
| Single Unit, Attached | 438 (69.3%) | 194 (30.7%) |
| 2 Unit Apartments | 0 (0.0%) | 201 (100.0%) |
| 3 or 4 Unit Apartments | 0 (0.0%) | 397 (100.0%) |
| 5 to 9 Unit Apartments | 0 (0.0%) | 842 (100.0%) |
| 10 or more Apartments | 0 (0.0%) | 4,904 (100.0%) |
| Mobile Home / Other | 346 (65.0%) | 186 (35.0%) |
| Total | 19,197 (66.7%) | 9,567 (33.3%) |
Housing Structures by Number of Rooms in Cedar Park
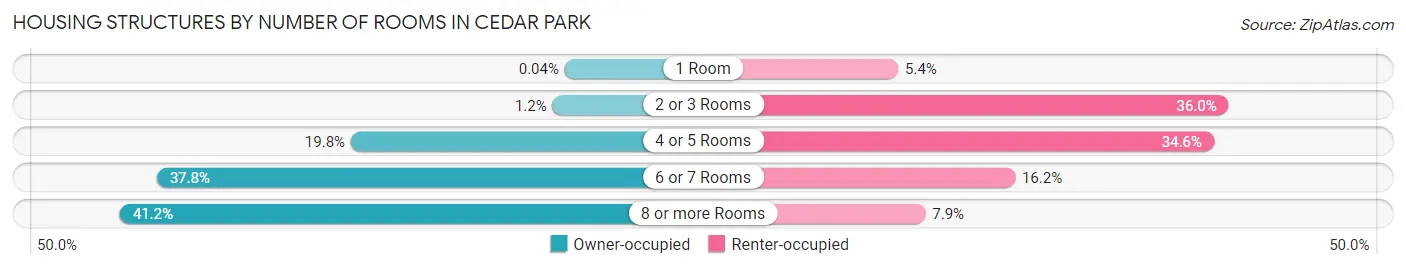
| Number of Rooms | Owner-occupied | Renter-occupied |
| 1 Room | 8 (0.0%) | 515 (5.4%) |
| 2 or 3 Rooms | 224 (1.2%) | 3,439 (35.9%) |
| 4 or 5 Rooms | 3,805 (19.8%) | 3,308 (34.6%) |
| 6 or 7 Rooms | 7,253 (37.8%) | 1,549 (16.2%) |
| 8 or more Rooms | 7,907 (41.2%) | 756 (7.9%) |
| Total | 19,197 (100.0%) | 9,567 (100.0%) |
Housing Structure by Heating Type in Cedar Park
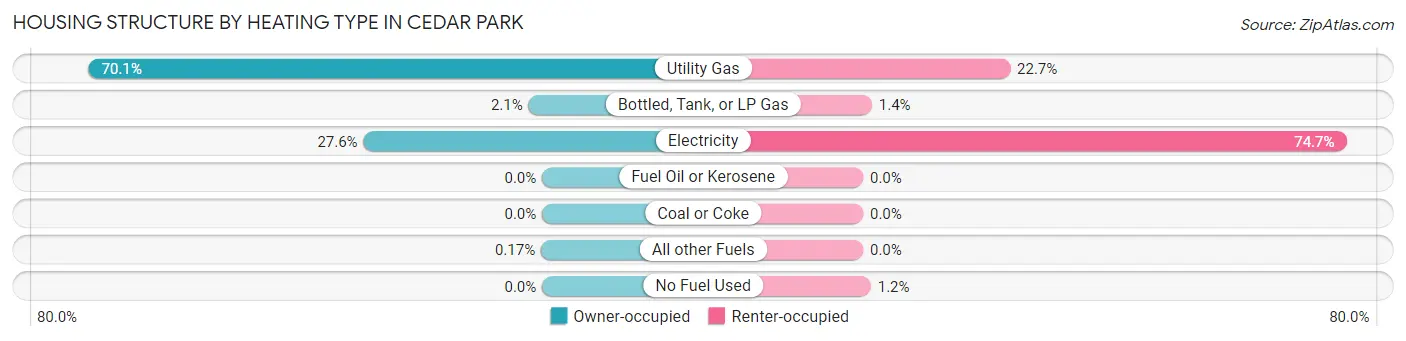
| Heating Type | Owner-occupied | Renter-occupied |
| Utility Gas | 13,460 (70.1%) | 2,175 (22.7%) |
| Bottled, Tank, or LP Gas | 401 (2.1%) | 130 (1.4%) |
| Electricity | 5,303 (27.6%) | 7,147 (74.7%) |
| Fuel Oil or Kerosene | 0 (0.0%) | 0 (0.0%) |
| Coal or Coke | 0 (0.0%) | 0 (0.0%) |
| All other Fuels | 33 (0.2%) | 0 (0.0%) |
| No Fuel Used | 0 (0.0%) | 115 (1.2%) |
| Total | 19,197 (100.0%) | 9,567 (100.0%) |
Household Vehicle Usage in Cedar Park
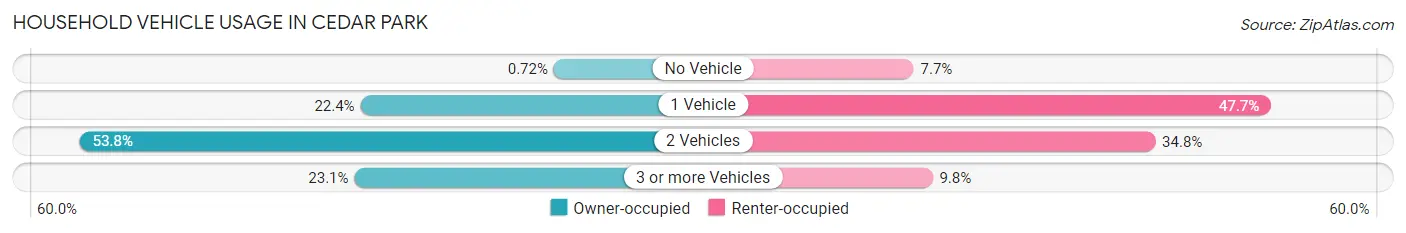
| Vehicles per Household | Owner-occupied | Renter-occupied |
| No Vehicle | 139 (0.7%) | 736 (7.7%) |
| 1 Vehicle | 4,296 (22.4%) | 4,567 (47.7%) |
| 2 Vehicles | 10,336 (53.8%) | 3,325 (34.7%) |
| 3 or more Vehicles | 4,426 (23.1%) | 939 (9.8%) |
| Total | 19,197 (100.0%) | 9,567 (100.0%) |
Real Estate & Mortgages in Cedar Park
Real Estate and Mortgage Overview in Cedar Park
| Characteristic | Without Mortgage | With Mortgage |
| Housing Units | 5,056 | 14,141 |
| Median Property Value | $378,800 | $442,400 |
| Median Household Income | $119,513 | $7,711 |
| Monthly Housing Costs | $935 | $4,354 |
| Real Estate Taxes | $6,637 | $99 |
Property Value by Mortgage Status in Cedar Park
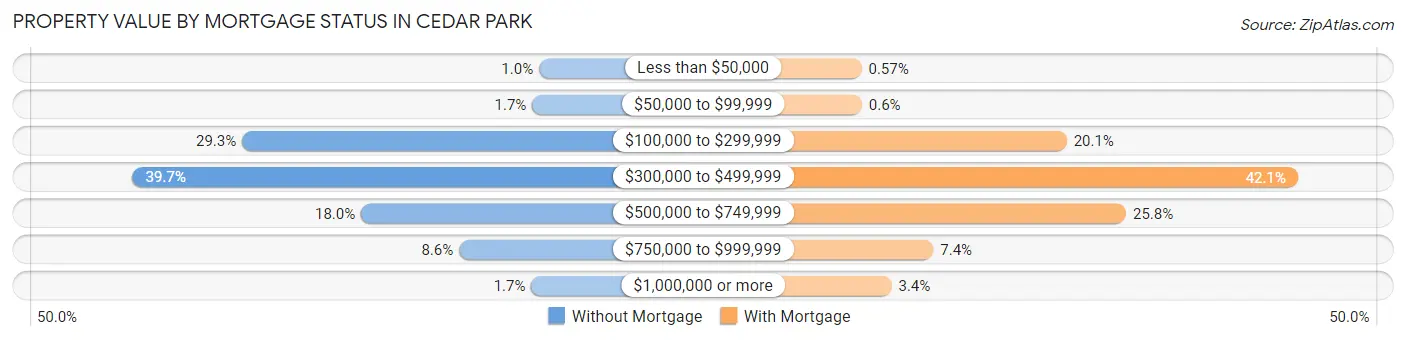
| Property Value | Without Mortgage | With Mortgage |
| Less than $50,000 | 51 (1.0%) | 81 (0.6%) |
| $50,000 to $99,999 | 84 (1.7%) | 85 (0.6%) |
| $100,000 to $299,999 | 1,481 (29.3%) | 2,844 (20.1%) |
| $300,000 to $499,999 | 2,008 (39.7%) | 5,955 (42.1%) |
| $500,000 to $749,999 | 908 (18.0%) | 3,643 (25.8%) |
| $750,000 to $999,999 | 436 (8.6%) | 1,048 (7.4%) |
| $1,000,000 or more | 88 (1.7%) | 485 (3.4%) |
| Total | 5,056 (100.0%) | 14,141 (100.0%) |
Household Income by Mortgage Status in Cedar Park
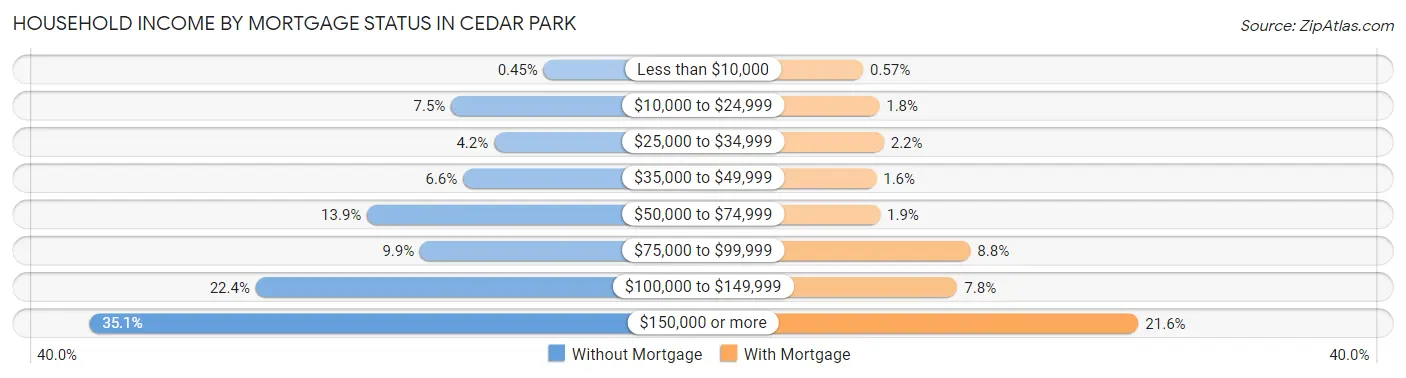
| Household Income | Without Mortgage | With Mortgage |
| Less than $10,000 | 23 (0.4%) | 80 (0.6%) |
| $10,000 to $24,999 | 379 (7.5%) | 256 (1.8%) |
| $25,000 to $34,999 | 214 (4.2%) | 304 (2.1%) |
| $35,000 to $49,999 | 333 (6.6%) | 224 (1.6%) |
| $50,000 to $74,999 | 703 (13.9%) | 265 (1.9%) |
| $75,000 to $99,999 | 499 (9.9%) | 1,237 (8.7%) |
| $100,000 to $149,999 | 1,132 (22.4%) | 1,097 (7.8%) |
| $150,000 or more | 1,773 (35.1%) | 3,047 (21.5%) |
| Total | 5,056 (100.0%) | 14,141 (100.0%) |
Property Value to Household Income Ratio in Cedar Park
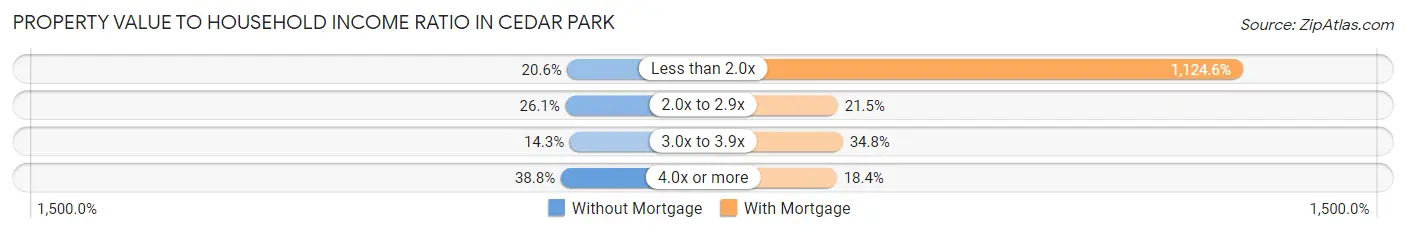
| Value-to-Income Ratio | Without Mortgage | With Mortgage |
| Less than 2.0x | 1,039 (20.5%) | 159,031 (1,124.6%) |
| 2.0x to 2.9x | 1,320 (26.1%) | 3,038 (21.5%) |
| 3.0x to 3.9x | 721 (14.3%) | 4,917 (34.8%) |
| 4.0x or more | 1,961 (38.8%) | 2,605 (18.4%) |
| Total | 5,056 (100.0%) | 14,141 (100.0%) |
Real Estate Taxes by Mortgage Status in Cedar Park
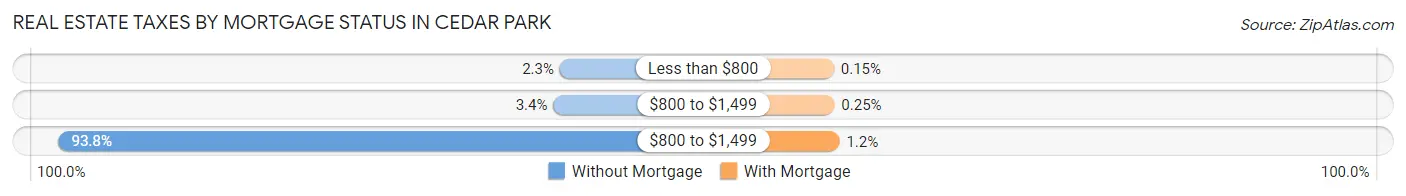
| Property Taxes | Without Mortgage | With Mortgage |
| Less than $800 | 114 (2.2%) | 21 (0.2%) |
| $800 to $1,499 | 174 (3.4%) | 35 (0.3%) |
| $800 to $1,499 | 4,742 (93.8%) | 165 (1.2%) |
| Total | 5,056 (100.0%) | 14,141 (100.0%) |
Health & Disability in Cedar Park
Health Insurance Coverage by Age in Cedar Park
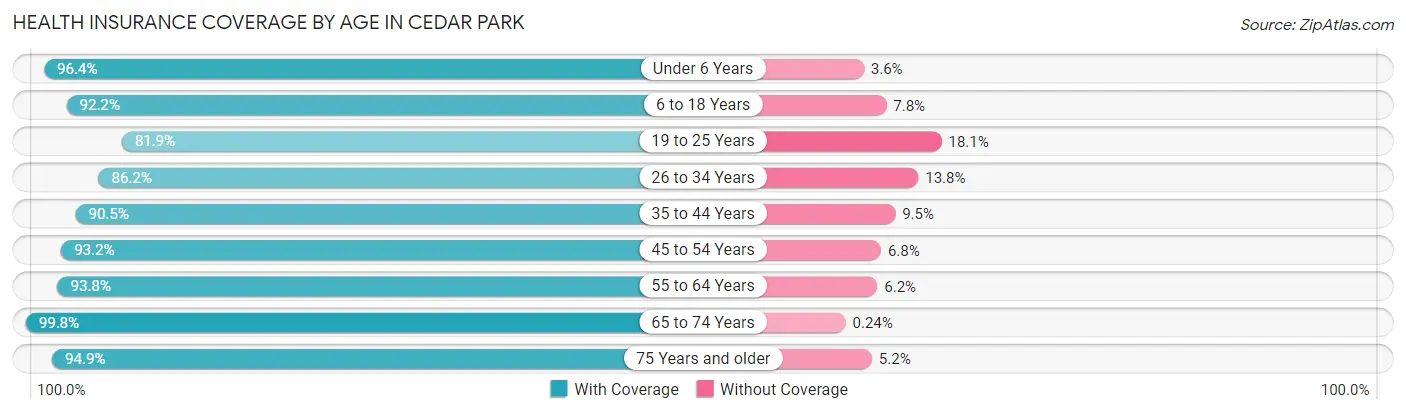
| Age Bracket | With Coverage | Without Coverage |
| Under 6 Years | 4,947 (96.4%) | 187 (3.6%) |
| 6 to 18 Years | 13,699 (92.2%) | 1,166 (7.8%) |
| 19 to 25 Years | 4,439 (81.9%) | 983 (18.1%) |
| 26 to 34 Years | 8,548 (86.2%) | 1,368 (13.8%) |
| 35 to 44 Years | 12,133 (90.5%) | 1,274 (9.5%) |
| 45 to 54 Years | 10,666 (93.2%) | 783 (6.8%) |
| 55 to 64 Years | 7,299 (93.8%) | 479 (6.2%) |
| 65 to 74 Years | 4,962 (99.8%) | 12 (0.2%) |
| 75 Years and older | 2,889 (94.9%) | 157 (5.1%) |
| Total | 69,582 (91.6%) | 6,409 (8.4%) |
Health Insurance Coverage by Citizenship Status in Cedar Park
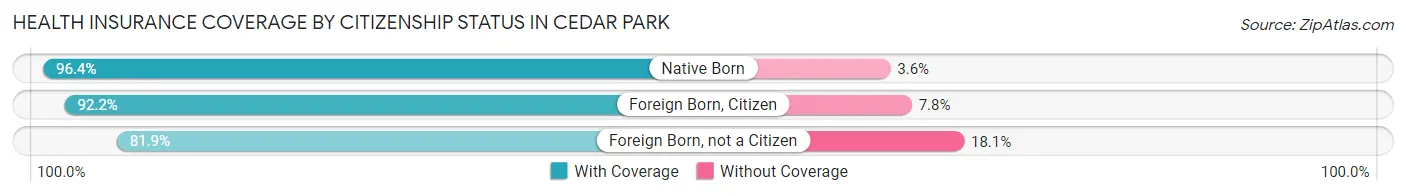
| Citizenship Status | With Coverage | Without Coverage |
| Native Born | 4,947 (96.4%) | 187 (3.6%) |
| Foreign Born, Citizen | 13,699 (92.2%) | 1,166 (7.8%) |
| Foreign Born, not a Citizen | 4,439 (81.9%) | 983 (18.1%) |
Health Insurance Coverage by Household Income in Cedar Park
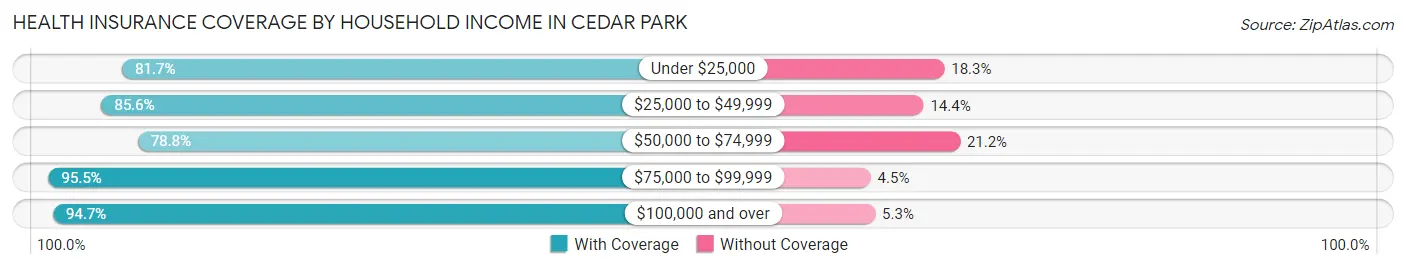
| Household Income | With Coverage | Without Coverage |
| Under $25,000 | 3,244 (81.7%) | 725 (18.3%) |
| $25,000 to $49,999 | 5,250 (85.6%) | 881 (14.4%) |
| $50,000 to $74,999 | 6,624 (78.8%) | 1,782 (21.2%) |
| $75,000 to $99,999 | 6,319 (95.5%) | 296 (4.5%) |
| $100,000 and over | 48,112 (94.7%) | 2,700 (5.3%) |
Public vs Private Health Insurance Coverage by Age in Cedar Park
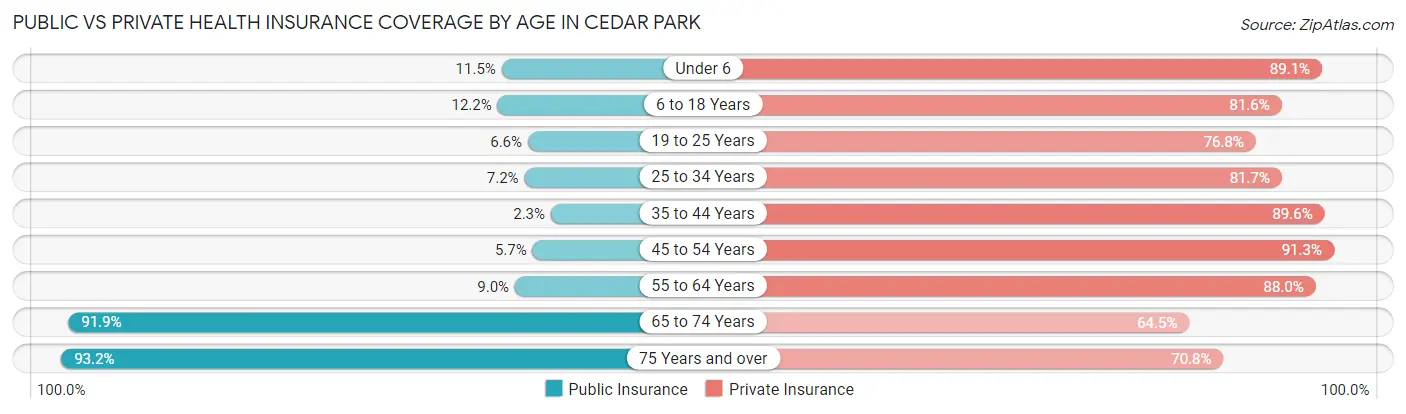
| Age Bracket | Public Insurance | Private Insurance |
| Under 6 | 588 (11.5%) | 4,575 (89.1%) |
| 6 to 18 Years | 1,815 (12.2%) | 12,131 (81.6%) |
| 19 to 25 Years | 357 (6.6%) | 4,165 (76.8%) |
| 25 to 34 Years | 716 (7.2%) | 8,096 (81.7%) |
| 35 to 44 Years | 311 (2.3%) | 12,011 (89.6%) |
| 45 to 54 Years | 654 (5.7%) | 10,453 (91.3%) |
| 55 to 64 Years | 699 (9.0%) | 6,841 (87.9%) |
| 65 to 74 Years | 4,570 (91.9%) | 3,207 (64.5%) |
| 75 Years and over | 2,839 (93.2%) | 2,157 (70.8%) |
| Total | 12,549 (16.5%) | 63,636 (83.7%) |
Disability Status by Sex by Age in Cedar Park
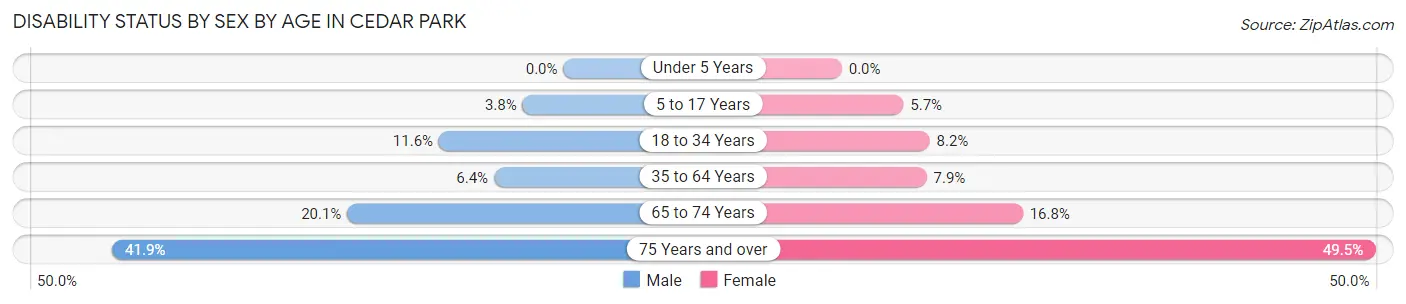
| Age Bracket | Male | Female |
| Under 5 Years | 0 (0.0%) | 0 (0.0%) |
| 5 to 17 Years | 291 (3.8%) | 414 (5.7%) |
| 18 to 34 Years | 943 (11.6%) | 650 (8.2%) |
| 35 to 64 Years | 1,056 (6.4%) | 1,277 (7.9%) |
| 65 to 74 Years | 447 (20.1%) | 461 (16.8%) |
| 75 Years and over | 551 (41.9%) | 856 (49.5%) |
Disability Class by Sex by Age in Cedar Park
Disability Class: Hearing Difficulty
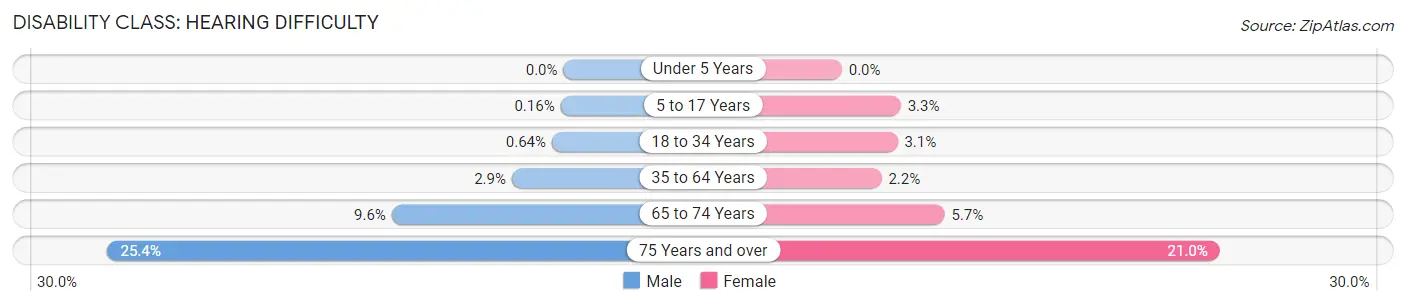
| Age Bracket | Male | Female |
| Under 5 Years | 0 (0.0%) | 0 (0.0%) |
| 5 to 17 Years | 12 (0.2%) | 238 (3.3%) |
| 18 to 34 Years | 52 (0.6%) | 247 (3.1%) |
| 35 to 64 Years | 470 (2.9%) | 358 (2.2%) |
| 65 to 74 Years | 213 (9.6%) | 157 (5.7%) |
| 75 Years and over | 334 (25.4%) | 364 (21.0%) |
Disability Class: Vision Difficulty
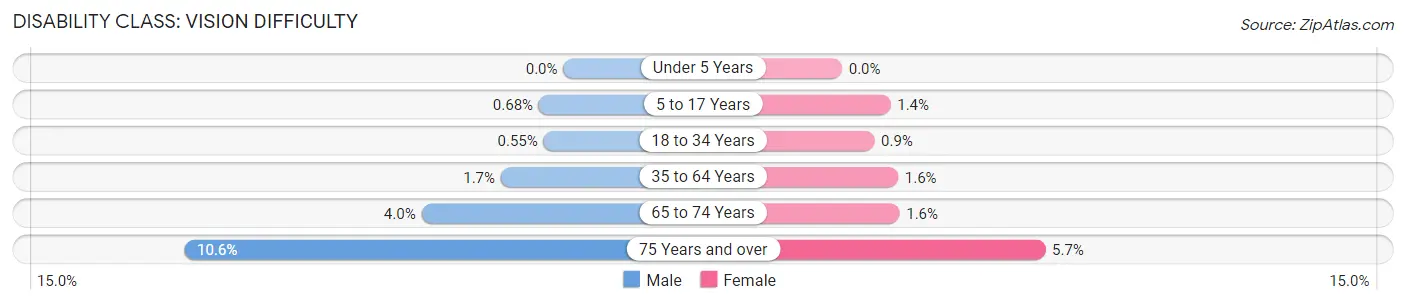
| Age Bracket | Male | Female |
| Under 5 Years | 0 (0.0%) | 0 (0.0%) |
| 5 to 17 Years | 52 (0.7%) | 98 (1.3%) |
| 18 to 34 Years | 45 (0.5%) | 72 (0.9%) |
| 35 to 64 Years | 286 (1.7%) | 253 (1.6%) |
| 65 to 74 Years | 88 (4.0%) | 44 (1.6%) |
| 75 Years and over | 139 (10.6%) | 98 (5.7%) |
Disability Class: Cognitive Difficulty
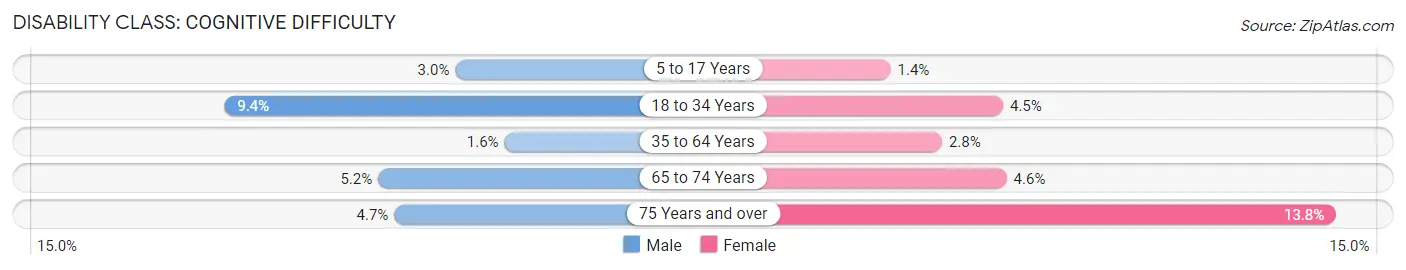
| Age Bracket | Male | Female |
| 5 to 17 Years | 231 (3.0%) | 99 (1.4%) |
| 18 to 34 Years | 771 (9.4%) | 358 (4.5%) |
| 35 to 64 Years | 269 (1.6%) | 453 (2.8%) |
| 65 to 74 Years | 115 (5.2%) | 126 (4.6%) |
| 75 Years and over | 62 (4.7%) | 238 (13.8%) |
Disability Class: Ambulatory Difficulty
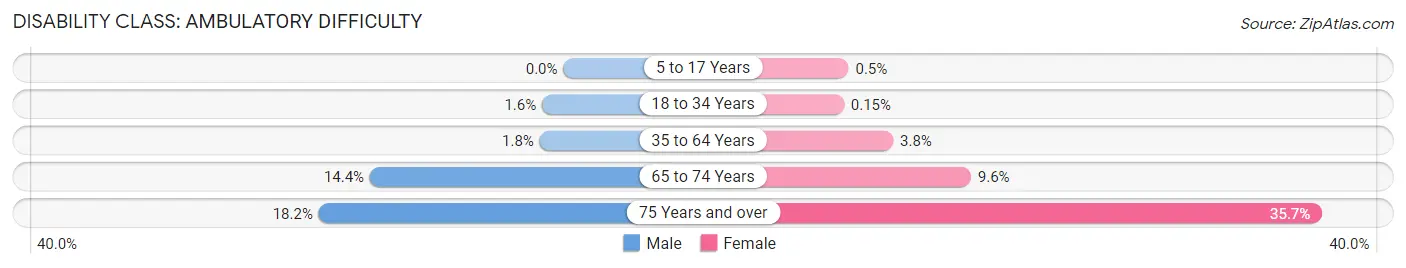
| Age Bracket | Male | Female |
| 5 to 17 Years | 0 (0.0%) | 36 (0.5%) |
| 18 to 34 Years | 129 (1.6%) | 12 (0.2%) |
| 35 to 64 Years | 289 (1.8%) | 619 (3.8%) |
| 65 to 74 Years | 320 (14.4%) | 263 (9.6%) |
| 75 Years and over | 239 (18.2%) | 617 (35.7%) |
Disability Class: Self-Care Difficulty
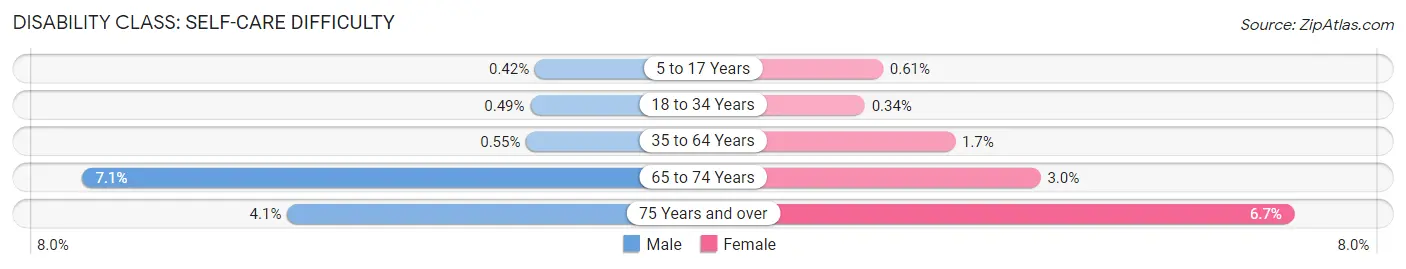
| Age Bracket | Male | Female |
| 5 to 17 Years | 32 (0.4%) | 44 (0.6%) |
| 18 to 34 Years | 40 (0.5%) | 27 (0.3%) |
| 35 to 64 Years | 90 (0.5%) | 273 (1.7%) |
| 65 to 74 Years | 159 (7.1%) | 81 (2.9%) |
| 75 Years and over | 54 (4.1%) | 116 (6.7%) |
Technology Access in Cedar Park
Computing Device Access in Cedar Park
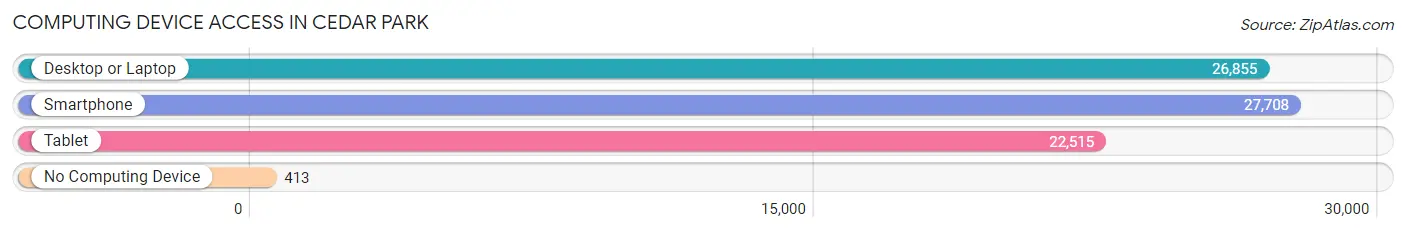
| Device Type | # Households | % Households |
| Desktop or Laptop | 26,855 | 93.4% |
| Smartphone | 27,708 | 96.3% |
| Tablet | 22,515 | 78.3% |
| No Computing Device | 413 | 1.4% |
| Total | 28,764 | 100.0% |
Internet Access in Cedar Park
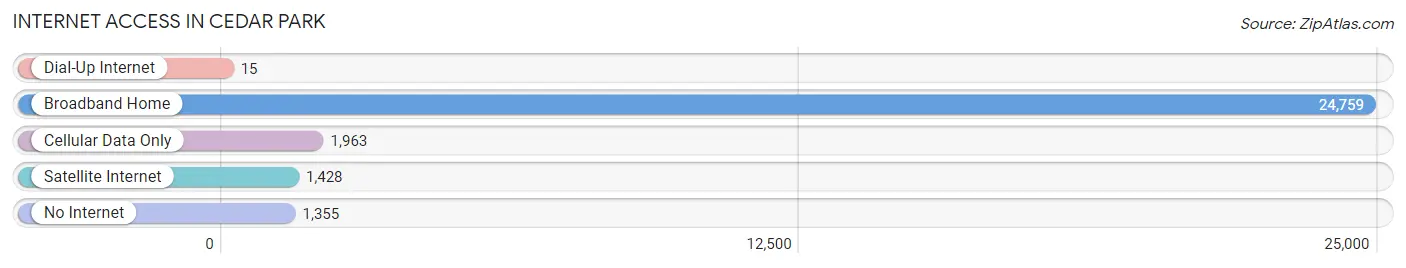
| Internet Type | # Households | % Households |
| Dial-Up Internet | 15 | 0.1% |
| Broadband Home | 24,759 | 86.1% |
| Cellular Data Only | 1,963 | 6.8% |
| Satellite Internet | 1,428 | 5.0% |
| No Internet | 1,355 | 4.7% |
| Total | 28,764 | 100.0% |
Cedar Park Summary
Cedar Park, Texas is a city located in Williamson County, Texas, United States. It is a suburb of Austin, the state capital. The population was estimated to be 57,957 in 2019, making it the third-largest city in the Austin metropolitan area.
History
The area now known as Cedar Park was originally inhabited by the Tonkawa people. The first settlers arrived in the area in the 1840s, and the city was officially incorporated in 1973. The city was named after a nearby cedar tree, which was used as a landmark by early settlers.
The city experienced rapid growth in the late 20th century, due in part to its proximity to Austin. The population of Cedar Park increased from 4,000 in 1990 to over 50,000 in 2019.
Geography
Cedar Park is located in Williamson County, Texas, about 20 miles northwest of Austin. It is situated on the Balcones Escarpment, a geological formation that runs through Central Texas. The city covers an area of approximately 25 square miles.
The terrain of Cedar Park is mostly flat, with some rolling hills. The city is located in the Edwards Plateau, which is characterized by limestone outcroppings and cedar trees. The climate is humid subtropical, with hot summers and mild winters.
Economy
Cedar Park is home to a diverse economy. The city is home to several major employers, including Dell, National Instruments, and Samsung. The city also has a thriving retail sector, with several shopping centers and outlets.
The city is also home to several technology companies, including AMD, Apple, and Google. The city is also home to several medical facilities, including Cedar Park Regional Medical Center and Seton Medical Center.
Demographics
As of 2019, the population of Cedar Park was estimated to be 57,957. The racial makeup of the city was 79.2% White, 8.2% Hispanic or Latino, 6.3% Asian, and 4.3% African American. The median household income was $87,845, and the median age was 35.
Cedar Park is a rapidly growing city, with a population that is expected to continue to increase in the coming years. The city is home to a diverse population, with a variety of cultures and backgrounds. The city is also home to a thriving economy, with a variety of businesses and industries.
Common Questions
What is Per Capita Income in Cedar Park?
Per Capita income in Cedar Park is $52,803.
What is the Median Family Income in Cedar Park?
Median Family Income in Cedar Park is $139,645.
What is the Median Household income in Cedar Park?
Median Household Income in Cedar Park is $118,903.
What is Income or Wage Gap in Cedar Park?
Income or Wage Gap in Cedar Park is 42.4%.
Women in Cedar Park earn 57.6 cents for every dollar earned by a man.
What is Inequality or Gini Index in Cedar Park?
Inequality or Gini Index in Cedar Park is 0.40.
What is the Total Population of Cedar Park?
Total Population of Cedar Park is 76,344.
What is the Total Male Population of Cedar Park?
Total Male Population of Cedar Park is 37,969.
What is the Total Female Population of Cedar Park?
Total Female Population of Cedar Park is 38,375.
What is the Ratio of Males per 100 Females in Cedar Park?
There are 98.94 Males per 100 Females in Cedar Park.
What is the Ratio of Females per 100 Males in Cedar Park?
There are 101.07 Females per 100 Males in Cedar Park.
What is the Median Population Age in Cedar Park?
Median Population Age in Cedar Park is 37.6 Years.
What is the Average Family Size in Cedar Park
Average Family Size in Cedar Park is 3.1 People.
What is the Average Household Size in Cedar Park
Average Household Size in Cedar Park is 2.6 People.
How Large is the Labor Force in Cedar Park?
There are 42,266 People in the Labor Forcein in Cedar Park.
What is the Percentage of People in the Labor Force in Cedar Park?
71.3% of People are in the Labor Force in Cedar Park.
What is the Unemployment Rate in Cedar Park?
Unemployment Rate in Cedar Park is 3.3%.