Palatine, IL Map & Demographics
Palatine Map
Palatine Overview
$49,351
PER CAPITA INCOME
$120,549
AVG FAMILY INCOME
$93,383
AVG HOUSEHOLD INCOME
30.5%
WAGE / INCOME GAP [ % ]
69.5¢/ $1
WAGE / INCOME GAP [ $ ]
$10,898
FAMILY INCOME DEFICIT
0.43
INEQUALITY / GINI INDEX
67,223
TOTAL POPULATION
32,763
MALE POPULATION
34,460
FEMALE POPULATION
95.08
MALES / 100 FEMALES
105.18
FEMALES / 100 MALES
39.4
MEDIAN AGE
3.1
AVG FAMILY SIZE
2.5
AVG HOUSEHOLD SIZE
38,905
LABOR FORCE [ PEOPLE ]
72.5%
PERCENT IN LABOR FORCE
4.7%
UNEMPLOYMENT RATE
Income in Palatine
Income Overview in Palatine
Per Capita Income in Palatine is $49,351, while median incomes of families and households are $120,549 and $93,383 respectively.
| Characteristic | Number | Measure |
| Per Capita Income | 67,223 | $49,351 |
| Median Family Income | 17,348 | $120,549 |
| Mean Family Income | 17,348 | $145,229 |
| Median Household Income | 26,582 | $93,383 |
| Mean Household Income | 26,582 | $123,770 |
| Income Deficit | 17,348 | $10,898 |
| Wage / Income Gap (%) | 67,223 | 30.50% |
| Wage / Income Gap ($) | 67,223 | 69.50¢ per $1 |
| Gini / Inequality Index | 67,223 | 0.43 |
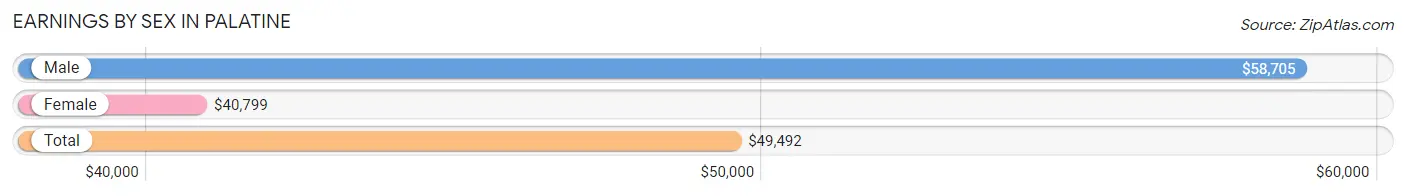
Earnings by Sex in Palatine
Average Earnings in Palatine are $49,492, $58,705 for men and $40,799 for women, a difference of 30.5%.
| Sex | Number | Average Earnings |
| Male | 21,428 (53.7%) | $58,705 |
| Female | 18,474 (46.3%) | $40,799 |
| Total | 39,902 (100.0%) | $49,492 |
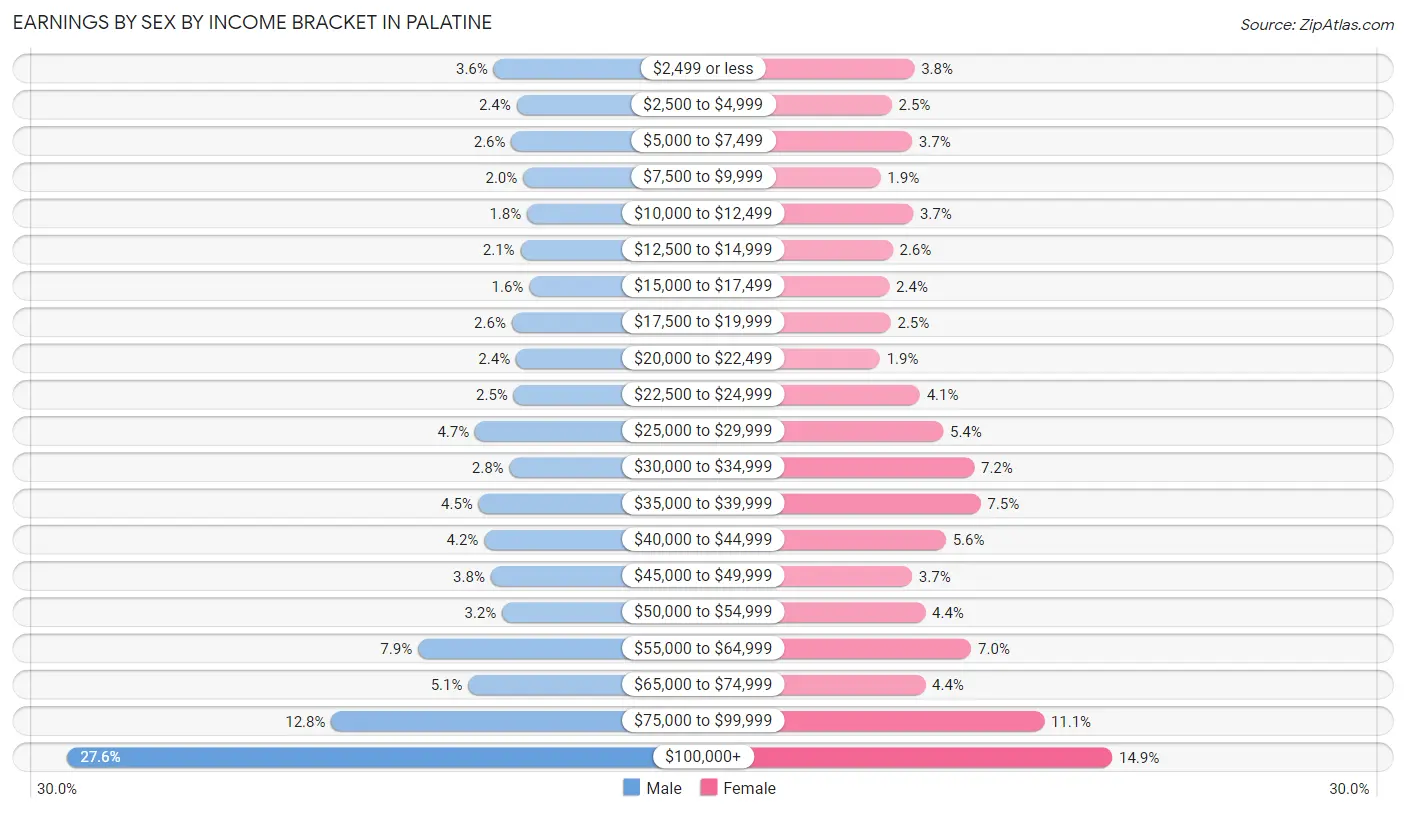
Earnings by Sex by Income Bracket in Palatine
The most common earnings brackets in Palatine are $100,000+ for men (5,915 | 27.6%) and $100,000+ for women (2,754 | 14.9%).
| Income | Male | Female |
| $2,499 or less | 780 (3.6%) | 700 (3.8%) |
| $2,500 to $4,999 | 503 (2.4%) | 465 (2.5%) |
| $5,000 to $7,499 | 566 (2.6%) | 677 (3.7%) |
| $7,500 to $9,999 | 424 (2.0%) | 349 (1.9%) |
| $10,000 to $12,499 | 377 (1.8%) | 687 (3.7%) |
| $12,500 to $14,999 | 457 (2.1%) | 474 (2.6%) |
| $15,000 to $17,499 | 351 (1.6%) | 440 (2.4%) |
| $17,500 to $19,999 | 561 (2.6%) | 454 (2.5%) |
| $20,000 to $22,499 | 511 (2.4%) | 342 (1.8%) |
| $22,500 to $24,999 | 537 (2.5%) | 758 (4.1%) |
| $25,000 to $29,999 | 1,003 (4.7%) | 999 (5.4%) |
| $30,000 to $34,999 | 589 (2.8%) | 1,320 (7.1%) |
| $35,000 to $39,999 | 959 (4.5%) | 1,388 (7.5%) |
| $40,000 to $44,999 | 893 (4.2%) | 1,027 (5.6%) |
| $45,000 to $49,999 | 814 (3.8%) | 676 (3.7%) |
| $50,000 to $54,999 | 678 (3.2%) | 813 (4.4%) |
| $55,000 to $64,999 | 1,690 (7.9%) | 1,292 (7.0%) |
| $65,000 to $74,999 | 1,085 (5.1%) | 813 (4.4%) |
| $75,000 to $99,999 | 2,735 (12.8%) | 2,046 (11.1%) |
| $100,000+ | 5,915 (27.6%) | 2,754 (14.9%) |
| Total | 21,428 (100.0%) | 18,474 (100.0%) |
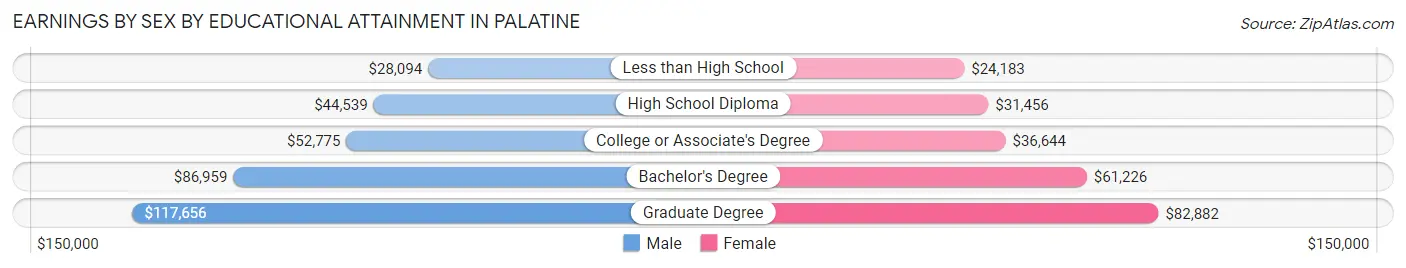
Earnings by Sex by Educational Attainment in Palatine
Average earnings in Palatine are $65,865 for men and $44,932 for women, a difference of 31.8%. Men with an educational attainment of graduate degree enjoy the highest average annual earnings of $117,656, while those with less than high school education earn the least with $28,094. Women with an educational attainment of graduate degree earn the most with the average annual earnings of $82,882, while those with less than high school education have the smallest earnings of $24,183.
| Educational Attainment | Male Income | Female Income |
| Less than High School | $28,094 | $24,183 |
| High School Diploma | $44,539 | $31,456 |
| College or Associate's Degree | $52,775 | $36,644 |
| Bachelor's Degree | $86,959 | $61,226 |
| Graduate Degree | $117,656 | $82,882 |
| Total | $65,865 | $44,932 |
Family Income in Palatine
Family Income Brackets in Palatine
According to the Palatine family income data, there are 3,886 families falling into the $200,000+ income range, which is the most common income bracket and makes up 22.4% of all families. Conversely, the $10,000 to $14,999 income bracket is the least frequent group with only 226 families (1.3%) belonging to this category.
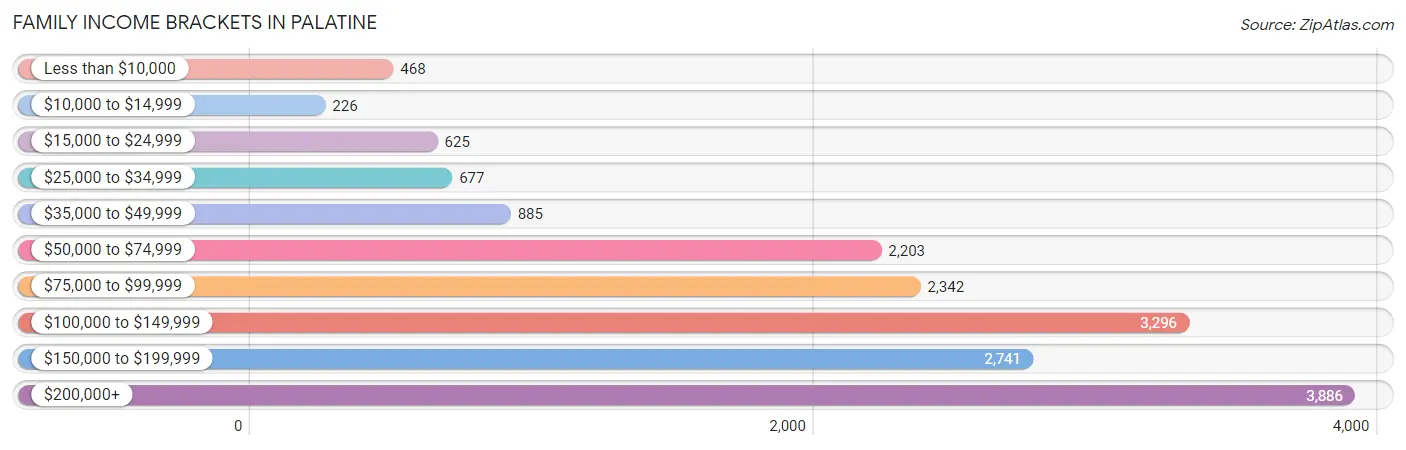
| Income Bracket | # Families | % Families |
| Less than $10,000 | 468 | 2.7% |
| $10,000 to $14,999 | 226 | 1.3% |
| $15,000 to $24,999 | 625 | 3.6% |
| $25,000 to $34,999 | 677 | 3.9% |
| $35,000 to $49,999 | 885 | 5.1% |
| $50,000 to $74,999 | 2,203 | 12.7% |
| $75,000 to $99,999 | 2,342 | 13.5% |
| $100,000 to $149,999 | 3,296 | 19.0% |
| $150,000 to $199,999 | 2,741 | 15.8% |
| $200,000+ | 3,886 | 22.4% |
Family Income by Famaliy Size in Palatine
7+ person families (148 | 0.9%) account for the highest median family income in Palatine with $170,515 per family, while 2-person families (7,783 | 44.9%) have the highest median income of $56,197 per family member.
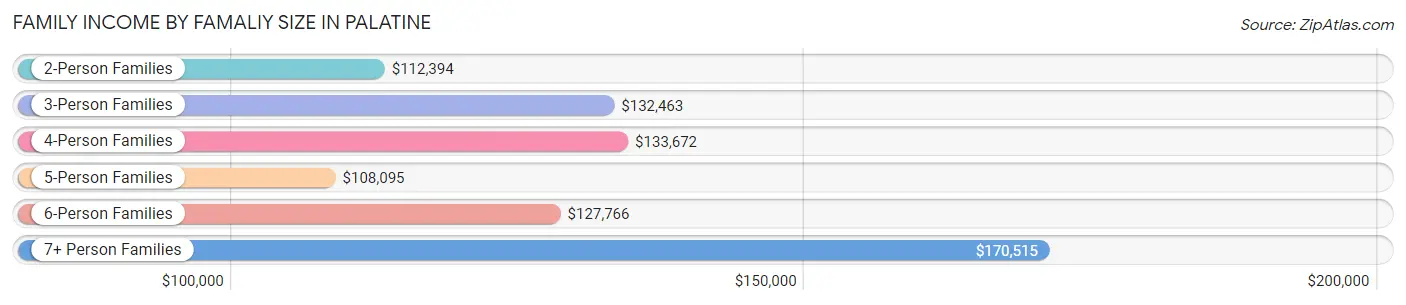
| Income Bracket | # Families | Median Income |
| 2-Person Families | 7,783 (44.9%) | $112,394 |
| 3-Person Families | 4,154 (23.9%) | $132,463 |
| 4-Person Families | 3,247 (18.7%) | $133,672 |
| 5-Person Families | 1,628 (9.4%) | $108,095 |
| 6-Person Families | 388 (2.2%) | $127,766 |
| 7+ Person Families | 148 (0.9%) | $170,515 |
| Total | 17,348 (100.0%) | $120,549 |
Family Income by Number of Earners in Palatine
The median family income in Palatine is $120,549, with families comprising 3+ earners (2,194) having the highest median family income of $170,330, while families with no earners (1,667) have the lowest median family income of $57,526, accounting for 12.7% and 9.6% of families, respectively.
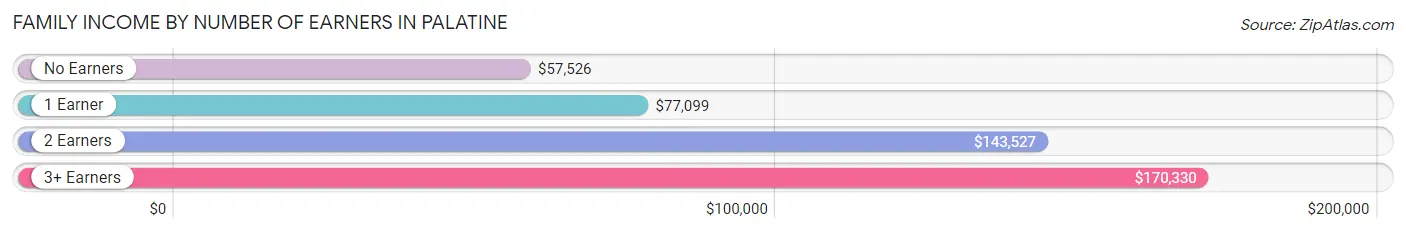
| Number of Earners | # Families | Median Income |
| No Earners | 1,667 (9.6%) | $57,526 |
| 1 Earner | 4,801 (27.7%) | $77,099 |
| 2 Earners | 8,686 (50.1%) | $143,527 |
| 3+ Earners | 2,194 (12.7%) | $170,330 |
| Total | 17,348 (100.0%) | $120,549 |
Household Income in Palatine
Household Income Brackets in Palatine
With 4,652 households falling in the category, the $100,000 to $149,999 income range is the most frequent in Palatine, accounting for 17.5% of all households. In contrast, only 399 households (1.5%) fall into the $10,000 to $14,999 income bracket, making it the least populous group.
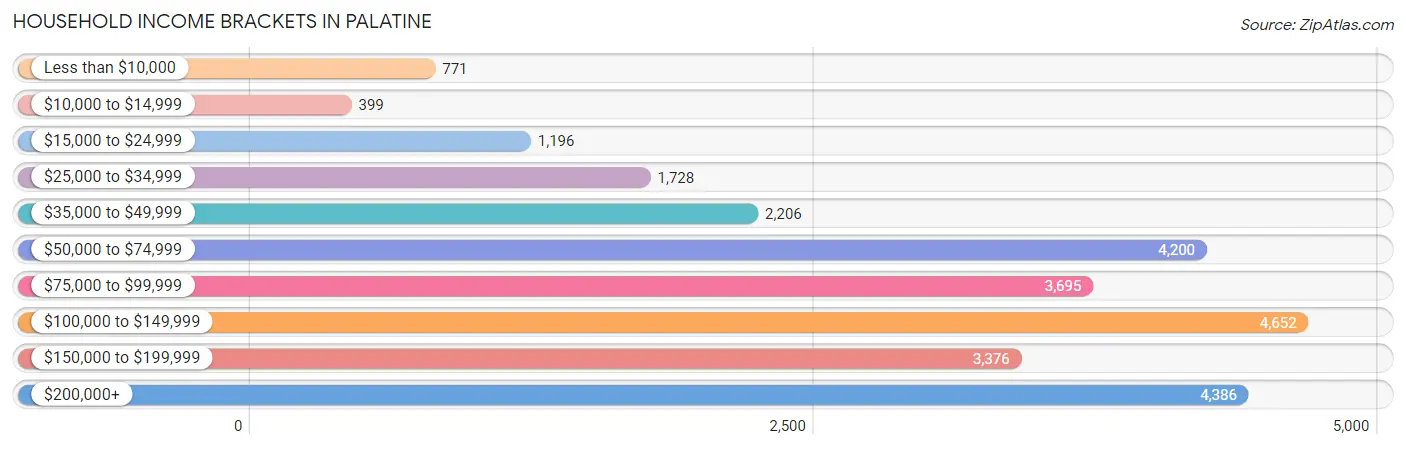
| Income Bracket | # Households | % Households |
| Less than $10,000 | 771 | 2.9% |
| $10,000 to $14,999 | 399 | 1.5% |
| $15,000 to $24,999 | 1,196 | 4.5% |
| $25,000 to $34,999 | 1,728 | 6.5% |
| $35,000 to $49,999 | 2,206 | 8.3% |
| $50,000 to $74,999 | 4,200 | 15.8% |
| $75,000 to $99,999 | 3,695 | 13.9% |
| $100,000 to $149,999 | 4,652 | 17.5% |
| $150,000 to $199,999 | 3,376 | 12.7% |
| $200,000+ | 4,386 | 16.5% |
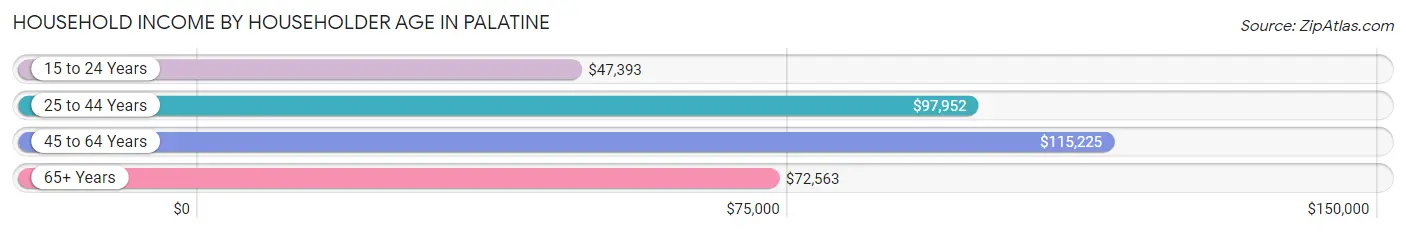
Household Income by Householder Age in Palatine
The median household income in Palatine is $93,383, with the highest median household income of $115,225 found in the 45 to 64 years age bracket for the primary householder. A total of 10,073 households (37.9%) fall into this category. Meanwhile, the 15 to 24 years age bracket for the primary householder has the lowest median household income of $47,393, with 677 households (2.5%) in this group.
| Income Bracket | # Households | Median Income |
| 15 to 24 Years | 677 (2.5%) | $47,393 |
| 25 to 44 Years | 9,359 (35.2%) | $97,952 |
| 45 to 64 Years | 10,073 (37.9%) | $115,225 |
| 65+ Years | 6,473 (24.3%) | $72,563 |
| Total | 26,582 (100.0%) | $93,383 |
Poverty in Palatine
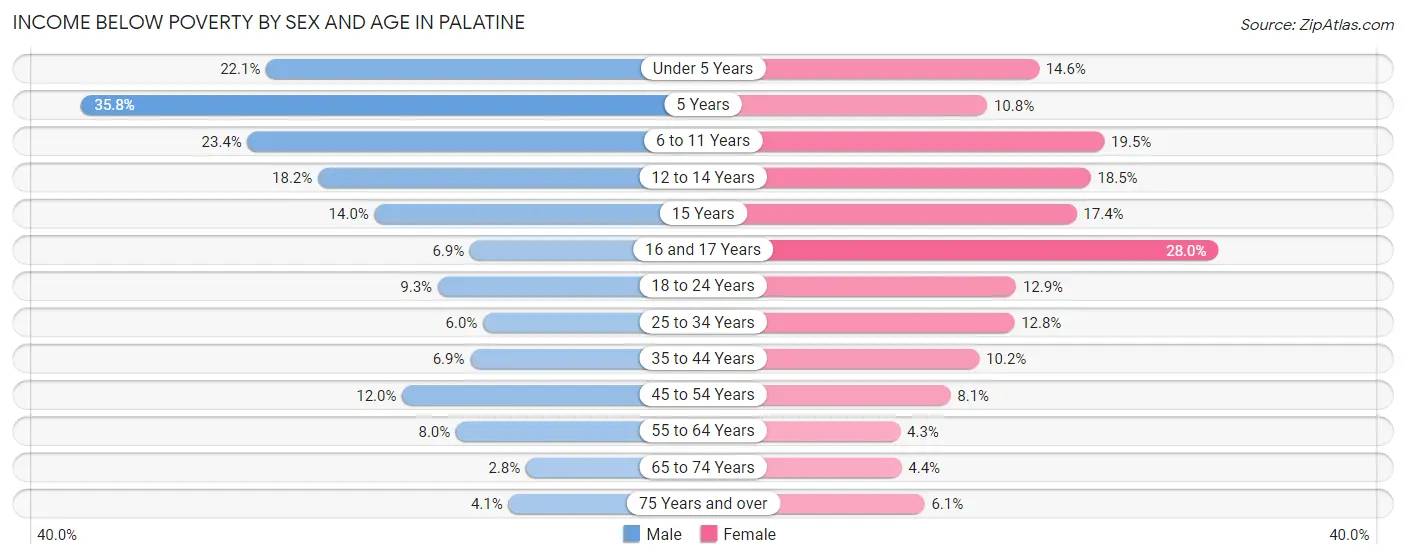
Income Below Poverty by Sex and Age in Palatine
With 10.3% poverty level for males and 10.7% for females among the residents of Palatine, 5 year old males and 16 and 17 year old females are the most vulnerable to poverty, with 200 males (35.8%) and 213 females (28.0%) in their respective age groups living below the poverty level.
| Age Bracket | Male | Female |
| Under 5 Years | 505 (22.1%) | 302 (14.6%) |
| 5 Years | 200 (35.8%) | 43 (10.8%) |
| 6 to 11 Years | 498 (23.4%) | 565 (19.5%) |
| 12 to 14 Years | 165 (18.2%) | 259 (18.5%) |
| 15 Years | 43 (14.0%) | 93 (17.4%) |
| 16 and 17 Years | 52 (6.9%) | 213 (28.0%) |
| 18 to 24 Years | 227 (9.3%) | 271 (12.9%) |
| 25 to 34 Years | 300 (5.9%) | 614 (12.8%) |
| 35 to 44 Years | 287 (6.9%) | 467 (10.2%) |
| 45 to 54 Years | 583 (12.0%) | 348 (8.1%) |
| 55 to 64 Years | 374 (8.0%) | 203 (4.3%) |
| 65 to 74 Years | 77 (2.8%) | 155 (4.4%) |
| 75 Years and over | 73 (4.1%) | 139 (6.1%) |
| Total | 3,384 (10.3%) | 3,672 (10.7%) |
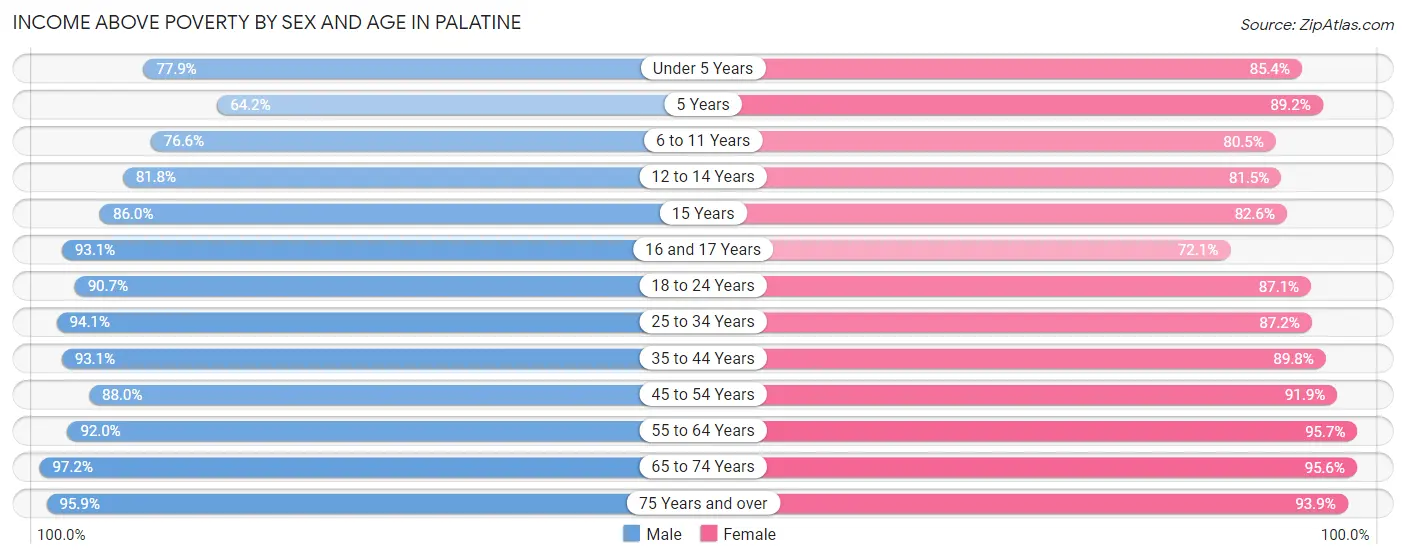
Income Above Poverty by Sex and Age in Palatine
According to the poverty statistics in Palatine, males aged 65 to 74 years and females aged 55 to 64 years are the age groups that are most secure financially, with 97.2% of males and 95.7% of females in these age groups living above the poverty line.
| Age Bracket | Male | Female |
| Under 5 Years | 1,784 (77.9%) | 1,763 (85.4%) |
| 5 Years | 359 (64.2%) | 356 (89.2%) |
| 6 to 11 Years | 1,627 (76.6%) | 2,336 (80.5%) |
| 12 to 14 Years | 741 (81.8%) | 1,144 (81.5%) |
| 15 Years | 264 (86.0%) | 441 (82.6%) |
| 16 and 17 Years | 698 (93.1%) | 549 (72.1%) |
| 18 to 24 Years | 2,210 (90.7%) | 1,825 (87.1%) |
| 25 to 34 Years | 4,738 (94.1%) | 4,184 (87.2%) |
| 35 to 44 Years | 3,865 (93.1%) | 4,110 (89.8%) |
| 45 to 54 Years | 4,291 (88.0%) | 3,970 (91.9%) |
| 55 to 64 Years | 4,327 (92.0%) | 4,485 (95.7%) |
| 65 to 74 Years | 2,698 (97.2%) | 3,350 (95.6%) |
| 75 Years and over | 1,722 (95.9%) | 2,126 (93.9%) |
| Total | 29,324 (89.6%) | 30,639 (89.3%) |
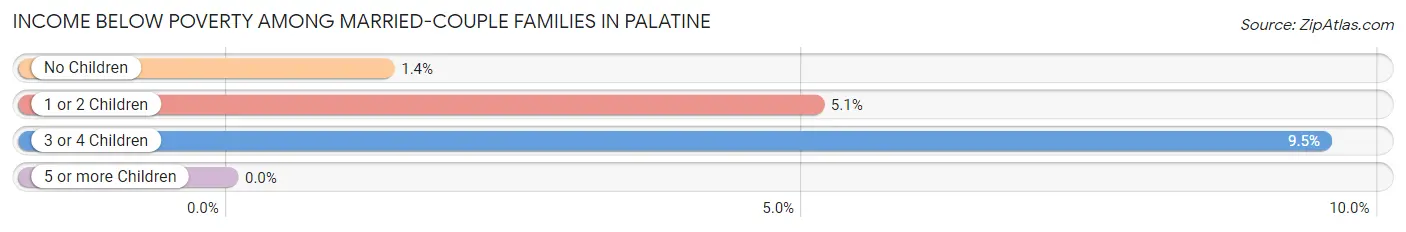
Income Below Poverty Among Married-Couple Families in Palatine
The poverty statistics for married-couple families in Palatine show that 3.2% or 422 of the total 13,339 families live below the poverty line. Families with 3 or 4 children have the highest poverty rate of 9.5%, comprising of 98 families. On the other hand, families with 5 or more children have the lowest poverty rate of 0.0%, which includes 0 families.
| Children | Above Poverty | Below Poverty |
| No Children | 7,978 (98.6%) | 110 (1.4%) |
| 1 or 2 Children | 3,979 (94.9%) | 214 (5.1%) |
| 3 or 4 Children | 931 (90.5%) | 98 (9.5%) |
| 5 or more Children | 29 (100.0%) | 0 (0.0%) |
| Total | 12,917 (96.8%) | 422 (3.2%) |
Income Below Poverty Among Single-Parent Households in Palatine
According to the poverty data in Palatine, 25.3% or 300 single-father households and 25.1% or 709 single-mother households are living below the poverty line. Among single-father households, those with 3 or 4 children have the highest poverty rate, with 67 households (100.0%) experiencing poverty. Likewise, among single-mother households, those with 5 or more children have the highest poverty rate, with 11 households (100.0%) falling below the poverty line.
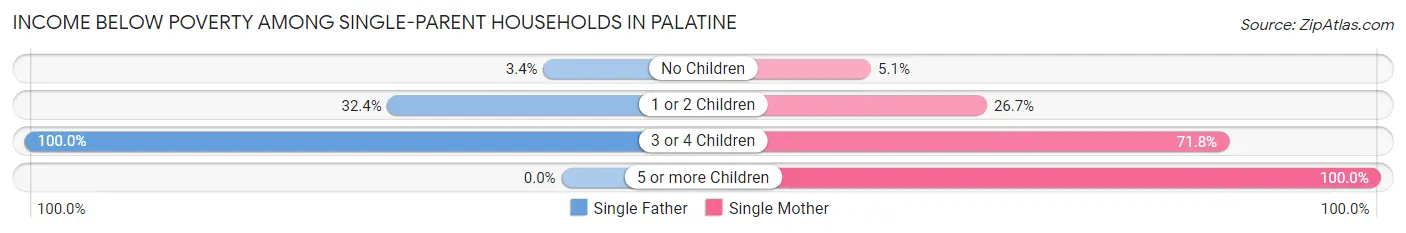
| Children | Single Father | Single Mother |
| No Children | 15 (3.4%) | 51 (5.1%) |
| 1 or 2 Children | 218 (32.4%) | 388 (26.7%) |
| 3 or 4 Children | 67 (100.0%) | 259 (71.8%) |
| 5 or more Children | 0 (0.0%) | 11 (100.0%) |
| Total | 300 (25.3%) | 709 (25.1%) |
Income Below Poverty Among Married-Couple vs Single-Parent Households in Palatine
The poverty data for Palatine shows that 422 of the married-couple family households (3.2%) and 1,009 of the single-parent households (25.2%) are living below the poverty level. Within the married-couple family households, those with 3 or 4 children have the highest poverty rate, with 98 households (9.5%) falling below the poverty line. Among the single-parent households, those with 5 or more children have the highest poverty rate, with 11 household (100.0%) living below poverty.
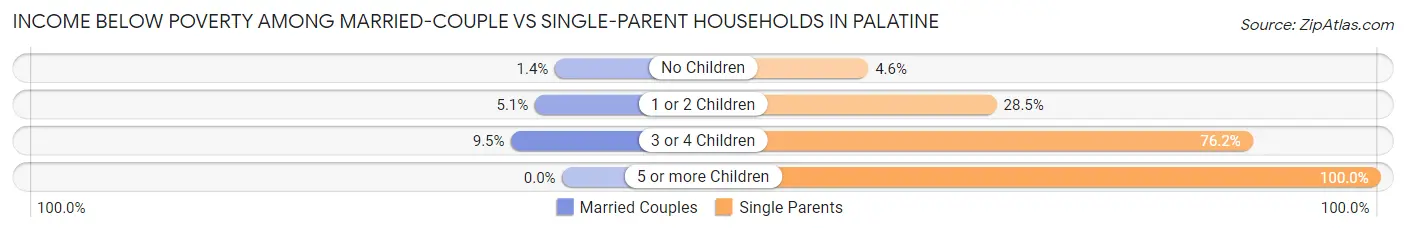
| Children | Married-Couple Families | Single-Parent Households |
| No Children | 110 (1.4%) | 66 (4.6%) |
| 1 or 2 Children | 214 (5.1%) | 606 (28.5%) |
| 3 or 4 Children | 98 (9.5%) | 326 (76.2%) |
| 5 or more Children | 0 (0.0%) | 11 (100.0%) |
| Total | 422 (3.2%) | 1,009 (25.2%) |
Race in Palatine
The most populous races in Palatine are White / Caucasian (43,614 | 64.9%), Hispanic or Latino (13,250 | 19.7%), and Asian (8,785 | 13.1%).
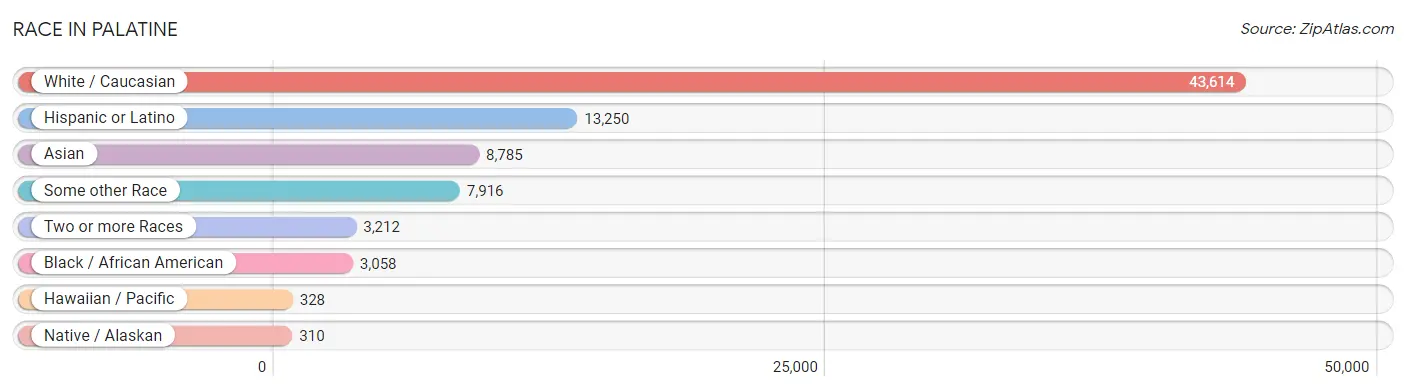
| Race | # Population | % Population |
| Asian | 8,785 | 13.1% |
| Black / African American | 3,058 | 4.5% |
| Hawaiian / Pacific | 328 | 0.5% |
| Hispanic or Latino | 13,250 | 19.7% |
| Native / Alaskan | 310 | 0.5% |
| White / Caucasian | 43,614 | 64.9% |
| Two or more Races | 3,212 | 4.8% |
| Some other Race | 7,916 | 11.8% |
| Total | 67,223 | 100.0% |
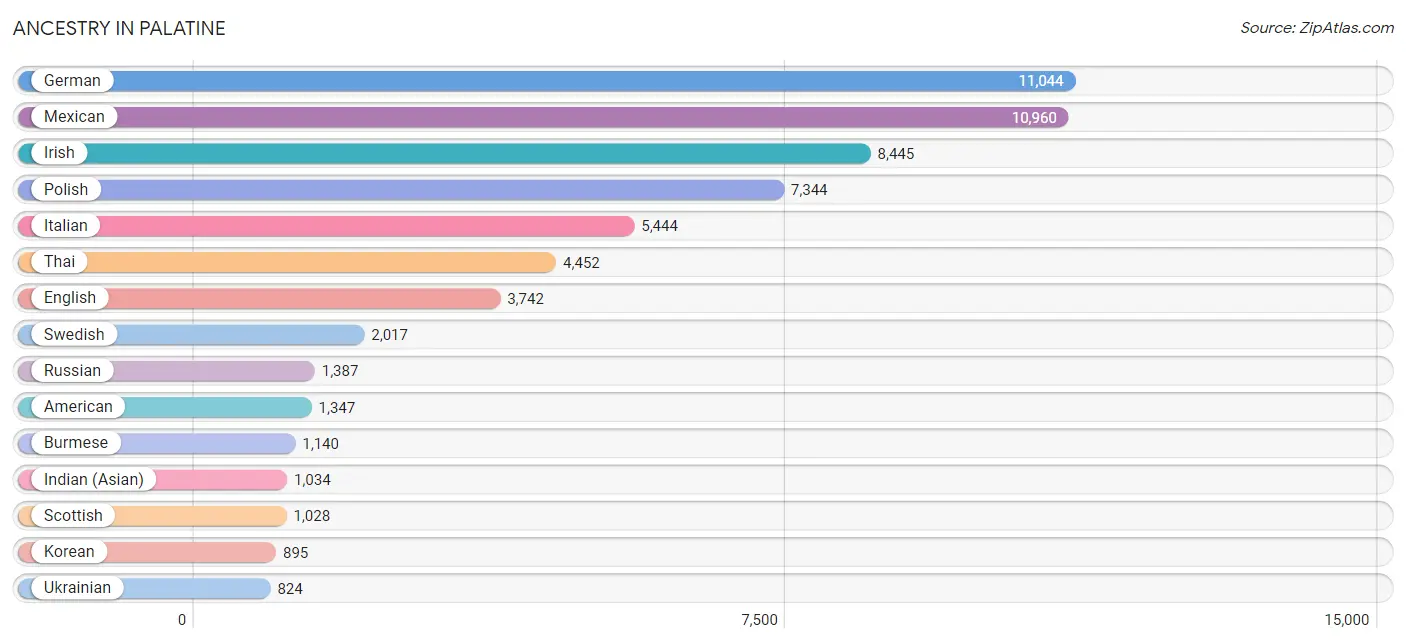
Ancestry in Palatine
The most populous ancestries reported in Palatine are German (11,044 | 16.4%), Mexican (10,960 | 16.3%), Irish (8,445 | 12.6%), Polish (7,344 | 10.9%), and Italian (5,444 | 8.1%), together accounting for 64.3% of all Palatine residents.
| Ancestry | # Population | % Population |
| African | 74 | 0.1% |
| Albanian | 424 | 0.6% |
| American | 1,347 | 2.0% |
| Arab | 470 | 0.7% |
| Argentinean | 36 | 0.1% |
| Armenian | 70 | 0.1% |
| Assyrian / Chaldean / Syriac | 13 | 0.0% |
| Australian | 22 | 0.0% |
| Austrian | 212 | 0.3% |
| Belgian | 79 | 0.1% |
| Belizean | 59 | 0.1% |
| Bhutanese | 591 | 0.9% |
| Blackfeet | 10 | 0.0% |
| Brazilian | 43 | 0.1% |
| British | 231 | 0.3% |
| Bulgarian | 689 | 1.0% |
| Burmese | 1,140 | 1.7% |
| Cambodian | 26 | 0.0% |
| Canadian | 106 | 0.2% |
| Cape Verdean | 27 | 0.0% |
| Central American | 779 | 1.2% |
| Central American Indian | 91 | 0.1% |
| Cherokee | 65 | 0.1% |
| Chilean | 26 | 0.0% |
| Chippewa | 9 | 0.0% |
| Choctaw | 9 | 0.0% |
| Colombian | 219 | 0.3% |
| Costa Rican | 24 | 0.0% |
| Croatian | 285 | 0.4% |
| Cuban | 81 | 0.1% |
| Czech | 531 | 0.8% |
| Czechoslovakian | 28 | 0.0% |
| Danish | 268 | 0.4% |
| Dominican | 25 | 0.0% |
| Dutch | 669 | 1.0% |
| Eastern European | 154 | 0.2% |
| Ecuadorian | 93 | 0.1% |
| Egyptian | 43 | 0.1% |
| English | 3,742 | 5.6% |
| European | 506 | 0.7% |
| Filipino | 211 | 0.3% |
| Finnish | 61 | 0.1% |
| French | 795 | 1.2% |
| French Canadian | 260 | 0.4% |
| German | 11,044 | 16.4% |
| Ghanaian | 20 | 0.0% |
| Greek | 540 | 0.8% |
| Guatemalan | 45 | 0.1% |
| Guyanese | 65 | 0.1% |
| Haitian | 204 | 0.3% |
| Honduran | 207 | 0.3% |
| Hungarian | 320 | 0.5% |
| Indian (Asian) | 1,034 | 1.5% |
| Iranian | 48 | 0.1% |
| Iraqi | 58 | 0.1% |
| Irish | 8,445 | 12.6% |
| Iroquois | 14 | 0.0% |
| Israeli | 36 | 0.1% |
| Italian | 5,444 | 8.1% |
| Jamaican | 104 | 0.2% |
| Japanese | 6 | 0.0% |
| Jordanian | 188 | 0.3% |
| Kenyan | 1 | 0.0% |
| Korean | 895 | 1.3% |
| Laotian | 59 | 0.1% |
| Latvian | 83 | 0.1% |
| Lebanese | 23 | 0.0% |
| Liberian | 11 | 0.0% |
| Lithuanian | 460 | 0.7% |
| Luxembourger | 75 | 0.1% |
| Macedonian | 5 | 0.0% |
| Malaysian | 5 | 0.0% |
| Menominee | 14 | 0.0% |
| Mexican | 10,960 | 16.3% |
| Mexican American Indian | 20 | 0.0% |
| Native Hawaiian | 41 | 0.1% |
| New Zealander | 22 | 0.0% |
| Nicaraguan | 23 | 0.0% |
| Nigerian | 20 | 0.0% |
| Northern European | 51 | 0.1% |
| Norwegian | 710 | 1.1% |
| Palestinian | 92 | 0.1% |
| Panamanian | 4 | 0.0% |
| Pennsylvania German | 11 | 0.0% |
| Peruvian | 181 | 0.3% |
| Polish | 7,344 | 10.9% |
| Portuguese | 32 | 0.1% |
| Puerto Rican | 386 | 0.6% |
| Romanian | 355 | 0.5% |
| Russian | 1,387 | 2.1% |
| Salvadoran | 476 | 0.7% |
| Samoan | 287 | 0.4% |
| Scandinavian | 176 | 0.3% |
| Scotch-Irish | 439 | 0.6% |
| Scottish | 1,028 | 1.5% |
| Serbian | 73 | 0.1% |
| Slovak | 231 | 0.3% |
| Slovene | 30 | 0.0% |
| South American | 716 | 1.1% |
| Spaniard | 98 | 0.2% |
| Spanish | 36 | 0.1% |
| Sri Lankan | 192 | 0.3% |
| Subsaharan African | 161 | 0.2% |
| Swedish | 2,017 | 3.0% |
| Swiss | 202 | 0.3% |
| Syrian | 13 | 0.0% |
| Thai | 4,452 | 6.6% |
| Ukrainian | 824 | 1.2% |
| Venezuelan | 161 | 0.2% |
| Welsh | 222 | 0.3% |
| West Indian | 20 | 0.0% |
| Yugoslavian | 40 | 0.1% |
| Zimbabwean | 8 | 0.0% | View All 113 Rows |
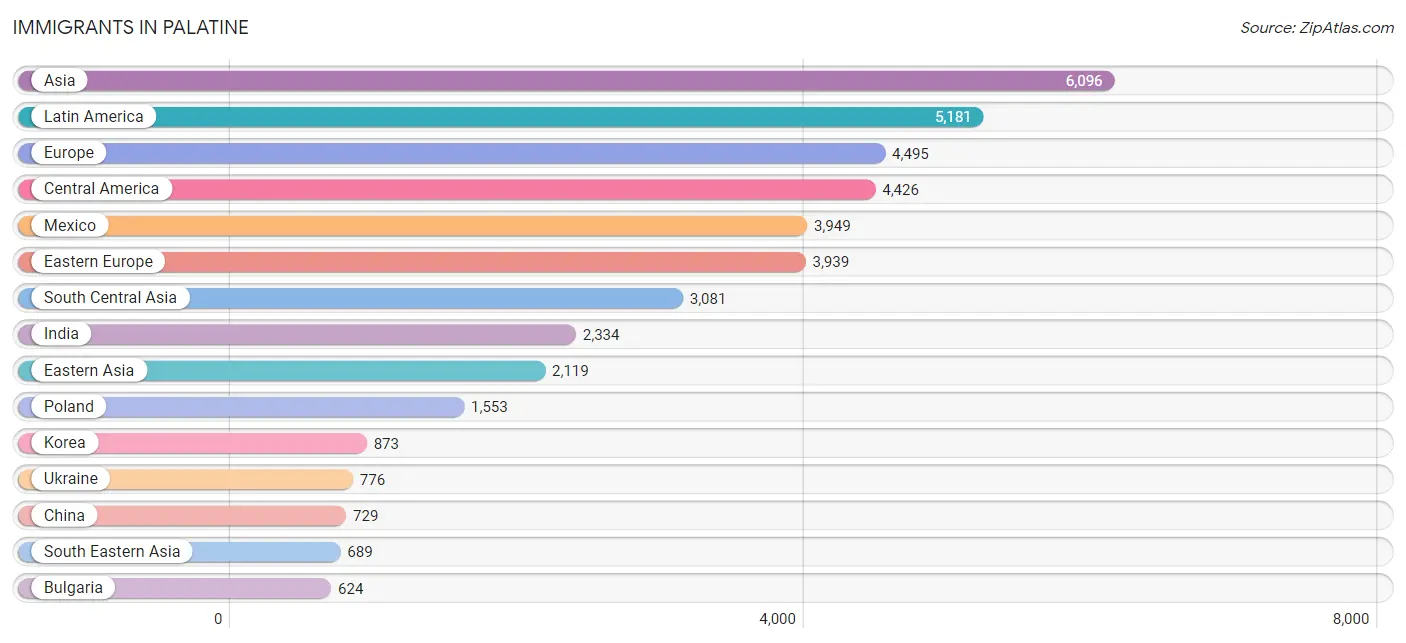
Immigrants in Palatine
The most numerous immigrant groups reported in Palatine came from Asia (6,096 | 9.1%), Latin America (5,181 | 7.7%), Europe (4,495 | 6.7%), Central America (4,426 | 6.6%), and Mexico (3,949 | 5.9%), together accounting for 35.9% of all Palatine residents.
| Immigration Origin | # Population | % Population |
| Africa | 383 | 0.6% |
| Albania | 66 | 0.1% |
| Asia | 6,096 | 9.1% |
| Australia | 41 | 0.1% |
| Austria | 52 | 0.1% |
| Belarus | 29 | 0.0% |
| Belize | 59 | 0.1% |
| Bosnia and Herzegovina | 17 | 0.0% |
| Brazil | 95 | 0.1% |
| Bulgaria | 624 | 0.9% |
| Cameroon | 34 | 0.1% |
| Canada | 220 | 0.3% |
| Caribbean | 136 | 0.2% |
| Central America | 4,426 | 6.6% |
| Chile | 26 | 0.0% |
| China | 729 | 1.1% |
| Colombia | 136 | 0.2% |
| Croatia | 16 | 0.0% |
| Cuba | 45 | 0.1% |
| Eastern Africa | 27 | 0.0% |
| Eastern Asia | 2,119 | 3.2% |
| Eastern Europe | 3,939 | 5.9% |
| Ecuador | 92 | 0.1% |
| Egypt | 40 | 0.1% |
| El Salvador | 247 | 0.4% |
| England | 50 | 0.1% |
| Europe | 4,495 | 6.7% |
| Germany | 144 | 0.2% |
| Greece | 52 | 0.1% |
| Guatemala | 34 | 0.1% |
| Guyana | 65 | 0.1% |
| Haiti | 35 | 0.1% |
| Honduras | 46 | 0.1% |
| Hong Kong | 65 | 0.1% |
| Hungary | 37 | 0.1% |
| India | 2,334 | 3.5% |
| Indonesia | 59 | 0.1% |
| Iran | 74 | 0.1% |
| Iraq | 74 | 0.1% |
| Ireland | 16 | 0.0% |
| Israel | 3 | 0.0% |
| Italy | 94 | 0.1% |
| Jamaica | 56 | 0.1% |
| Japan | 517 | 0.8% |
| Jordan | 44 | 0.1% |
| Kenya | 19 | 0.0% |
| Korea | 873 | 1.3% |
| Laos | 5 | 0.0% |
| Latin America | 5,181 | 7.7% |
| Latvia | 39 | 0.1% |
| Lithuania | 83 | 0.1% |
| Mexico | 3,949 | 5.9% |
| Middle Africa | 34 | 0.1% |
| Moldova | 98 | 0.2% |
| Nepal | 115 | 0.2% |
| Netherlands | 8 | 0.0% |
| Nicaragua | 91 | 0.1% |
| Nigeria | 124 | 0.2% |
| North Macedonia | 40 | 0.1% |
| Northern Africa | 91 | 0.1% |
| Northern Europe | 143 | 0.2% |
| Oceania | 41 | 0.1% |
| Pakistan | 509 | 0.8% |
| Peru | 139 | 0.2% |
| Philippines | 545 | 0.8% |
| Poland | 1,553 | 2.3% |
| Romania | 170 | 0.3% |
| Russia | 330 | 0.5% |
| Saudi Arabia | 65 | 0.1% |
| Senegal | 27 | 0.0% |
| Serbia | 13 | 0.0% |
| South America | 619 | 0.9% |
| South Central Asia | 3,081 | 4.6% |
| South Eastern Asia | 689 | 1.0% |
| Southern Europe | 174 | 0.3% |
| Spain | 28 | 0.0% |
| Sri Lanka | 49 | 0.1% |
| Switzerland | 22 | 0.0% |
| Taiwan | 230 | 0.3% |
| Ukraine | 776 | 1.1% |
| Venezuela | 66 | 0.1% |
| Vietnam | 58 | 0.1% |
| Western Africa | 151 | 0.2% |
| Western Asia | 207 | 0.3% |
| Western Europe | 226 | 0.3% |
| Zimbabwe | 8 | 0.0% | View All 86 Rows |
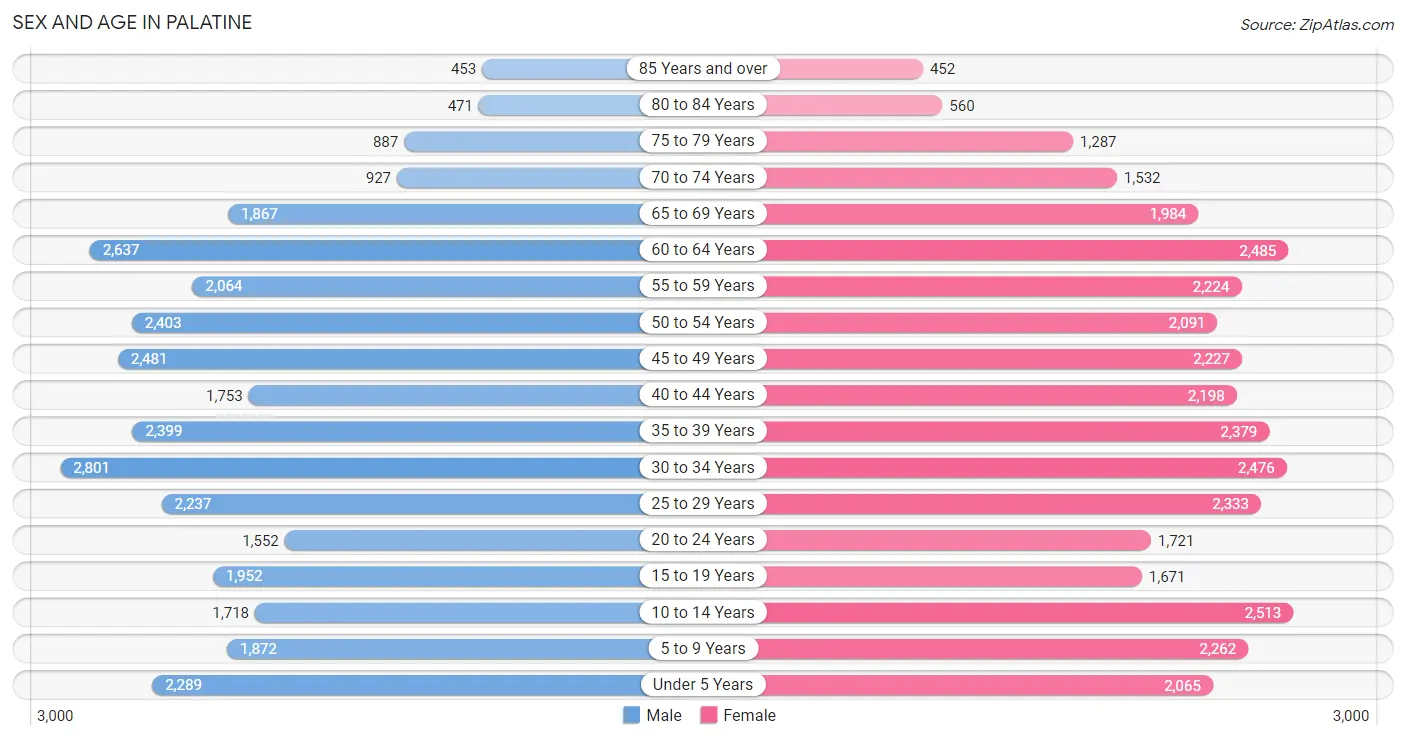
Sex and Age in Palatine
Sex and Age in Palatine
The most populous age groups in Palatine are 30 to 34 Years (2,801 | 8.6%) for men and 10 to 14 Years (2,513 | 7.3%) for women.
| Age Bracket | Male | Female |
| Under 5 Years | 2,289 (7.0%) | 2,065 (6.0%) |
| 5 to 9 Years | 1,872 (5.7%) | 2,262 (6.6%) |
| 10 to 14 Years | 1,718 (5.2%) | 2,513 (7.3%) |
| 15 to 19 Years | 1,952 (6.0%) | 1,671 (4.9%) |
| 20 to 24 Years | 1,552 (4.7%) | 1,721 (5.0%) |
| 25 to 29 Years | 2,237 (6.8%) | 2,333 (6.8%) |
| 30 to 34 Years | 2,801 (8.6%) | 2,476 (7.2%) |
| 35 to 39 Years | 2,399 (7.3%) | 2,379 (6.9%) |
| 40 to 44 Years | 1,753 (5.3%) | 2,198 (6.4%) |
| 45 to 49 Years | 2,481 (7.6%) | 2,227 (6.5%) |
| 50 to 54 Years | 2,403 (7.3%) | 2,091 (6.1%) |
| 55 to 59 Years | 2,064 (6.3%) | 2,224 (6.5%) |
| 60 to 64 Years | 2,637 (8.1%) | 2,485 (7.2%) |
| 65 to 69 Years | 1,867 (5.7%) | 1,984 (5.8%) |
| 70 to 74 Years | 927 (2.8%) | 1,532 (4.4%) |
| 75 to 79 Years | 887 (2.7%) | 1,287 (3.7%) |
| 80 to 84 Years | 471 (1.4%) | 560 (1.6%) |
| 85 Years and over | 453 (1.4%) | 452 (1.3%) |
| Total | 32,763 (100.0%) | 34,460 (100.0%) |
Families and Households in Palatine
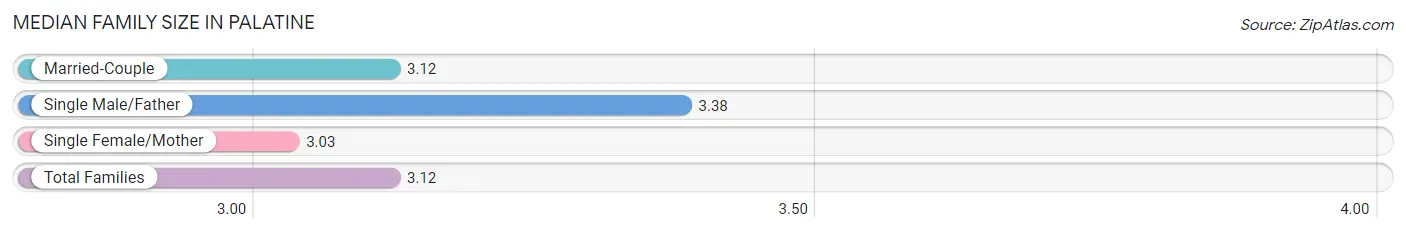
Median Family Size in Palatine
The median family size in Palatine is 3.12 persons per family, with single male/father families (1,187 | 6.8%) accounting for the largest median family size of 3.38 persons per family. On the other hand, single female/mother families (2,822 | 16.3%) represent the smallest median family size with 3.03 persons per family.
| Family Type | # Families | Family Size |
| Married-Couple | 13,339 (76.9%) | 3.12 |
| Single Male/Father | 1,187 (6.8%) | 3.38 |
| Single Female/Mother | 2,822 (16.3%) | 3.03 |
| Total Families | 17,348 (100.0%) | 3.12 |
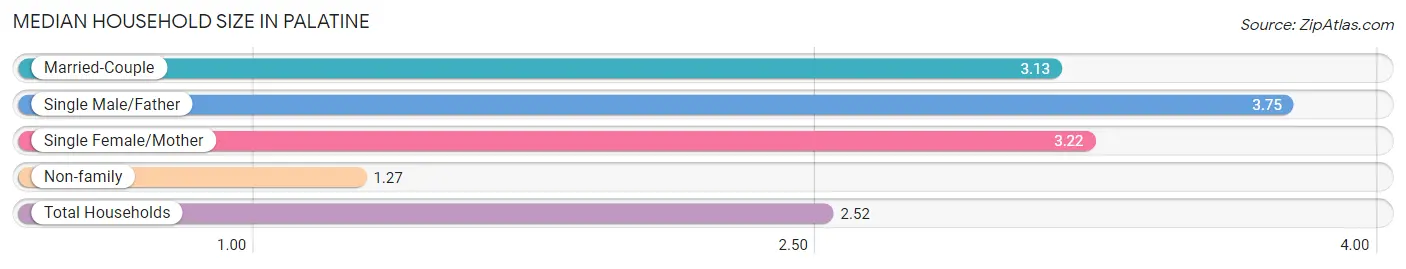
Median Household Size in Palatine
The median household size in Palatine is 2.52 persons per household, with single male/father households (1,187 | 4.5%) accounting for the largest median household size of 3.75 persons per household. non-family households (9,234 | 34.7%) represent the smallest median household size with 1.27 persons per household.
| Household Type | # Households | Household Size |
| Married-Couple | 13,339 (50.2%) | 3.13 |
| Single Male/Father | 1,187 (4.5%) | 3.75 |
| Single Female/Mother | 2,822 (10.6%) | 3.22 |
| Non-family | 9,234 (34.7%) | 1.27 |
| Total Households | 26,582 (100.0%) | 2.52 |
Household Size by Marriage Status in Palatine
Out of a total of 26,582 households in Palatine, 17,348 (65.3%) are family households, while 9,234 (34.7%) are nonfamily households. The most numerous type of family households are 2-person households, comprising 7,397, and the most common type of nonfamily households are 1-person households, comprising 7,196.
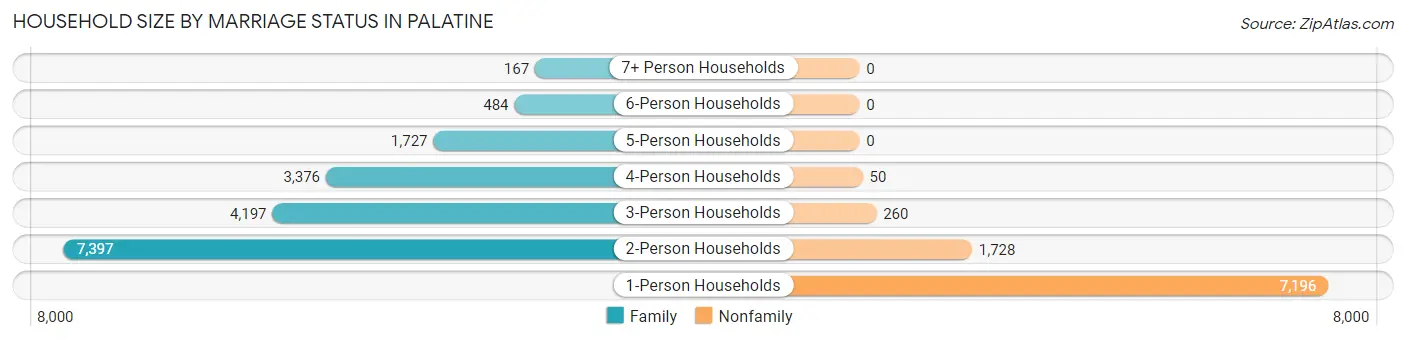
| Household Size | Family Households | Nonfamily Households |
| 1-Person Households | - | 7,196 (27.1%) |
| 2-Person Households | 7,397 (27.8%) | 1,728 (6.5%) |
| 3-Person Households | 4,197 (15.8%) | 260 (1.0%) |
| 4-Person Households | 3,376 (12.7%) | 50 (0.2%) |
| 5-Person Households | 1,727 (6.5%) | 0 (0.0%) |
| 6-Person Households | 484 (1.8%) | 0 (0.0%) |
| 7+ Person Households | 167 (0.6%) | 0 (0.0%) |
| Total | 17,348 (65.3%) | 9,234 (34.7%) |
Female Fertility in Palatine
Fertility by Age in Palatine
Average fertility rate in Palatine is 62.0 births per 1,000 women. Women in the age bracket of 20 to 34 years have the highest fertility rate with 107.0 births per 1,000 women. Women in the age bracket of 20 to 34 years acount for 73.3% of all women with births.
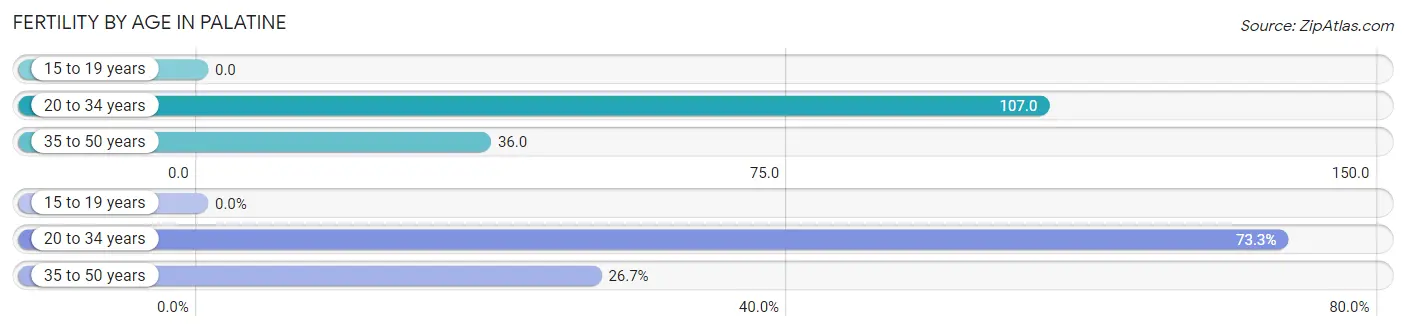
| Age Bracket | Women with Births | Births / 1,000 Women |
| 15 to 19 years | 0 (0.0%) | 0.0 |
| 20 to 34 years | 700 (73.3%) | 107.0 |
| 35 to 50 years | 255 (26.7%) | 36.0 |
| Total | 955 (100.0%) | 62.0 |
Fertility by Age by Marriage Status in Palatine
82.7% of women with births (955) in Palatine are married. The highest percentage of unmarried women with births falls into 20 to 34 years age bracket with 20.3% of them unmarried at the time of birth, while the lowest percentage of unmarried women with births belong to 35 to 50 years age bracket with 9.0% of them unmarried.
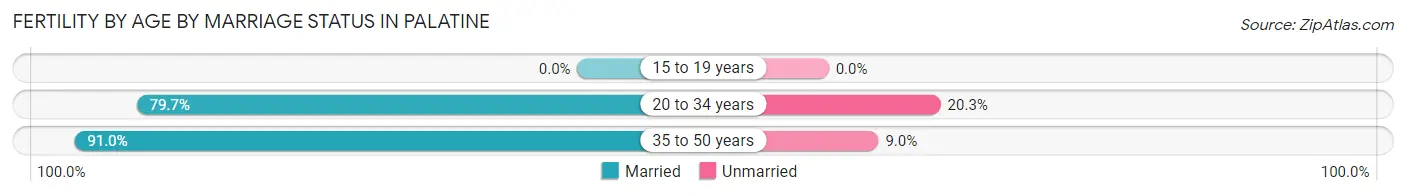
| Age Bracket | Married | Unmarried |
| 15 to 19 years | 0 (0.0%) | 0 (0.0%) |
| 20 to 34 years | 558 (79.7%) | 142 (20.3%) |
| 35 to 50 years | 232 (91.0%) | 23 (9.0%) |
| Total | 790 (82.7%) | 165 (17.3%) |
Fertility by Education in Palatine
Average fertility rate in Palatine is 62.0 births per 1,000 women. Women with the education attainment of bachelor's degree have the highest fertility rate of 98.0 births per 1,000 women, while women with the education attainment of college or associate's degree have the lowest fertility at 26.0 births per 1,000 women. Women with the education attainment of bachelor's degree represent 42.6% of all women with births.
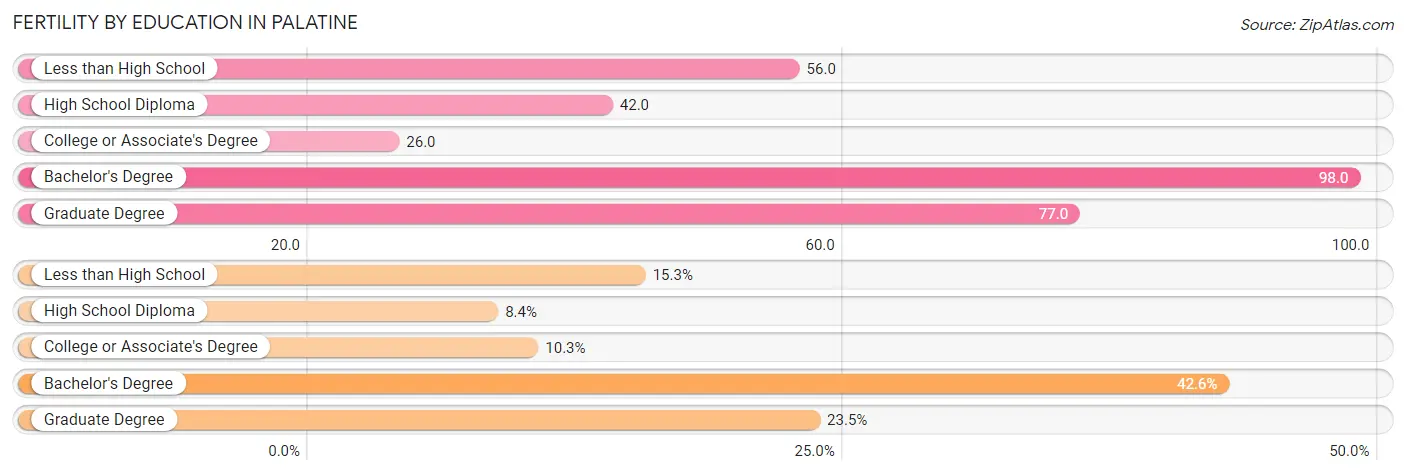
| Educational Attainment | Women with Births | Births / 1,000 Women |
| Less than High School | 146 (15.3%) | 56.0 |
| High School Diploma | 80 (8.4%) | 42.0 |
| College or Associate's Degree | 98 (10.3%) | 26.0 |
| Bachelor's Degree | 407 (42.6%) | 98.0 |
| Graduate Degree | 224 (23.5%) | 77.0 |
| Total | 955 (100.0%) | 62.0 |
Fertility by Education by Marriage Status in Palatine
17.3% of women with births in Palatine are unmarried. Women with the educational attainment of bachelor's degree are most likely to be married with 100.0% of them married at childbirth, while women with the educational attainment of less than high school are least likely to be married with 78.8% of them unmarried at childbirth.
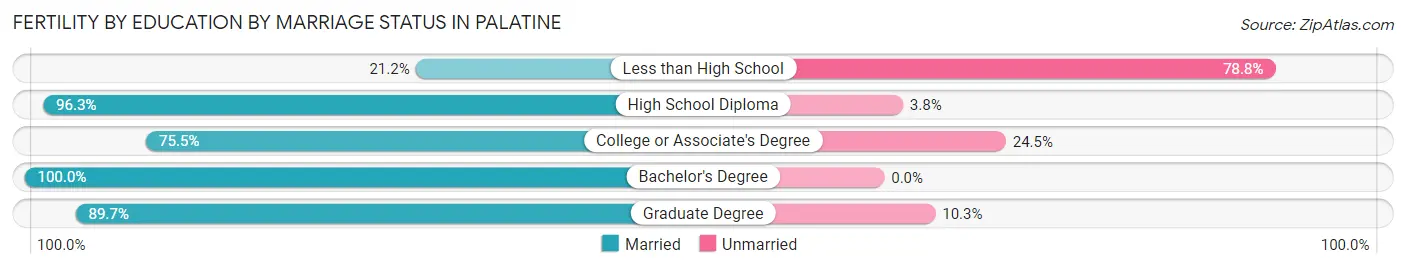
| Educational Attainment | Married | Unmarried |
| Less than High School | 31 (21.2%) | 115 (78.8%) |
| High School Diploma | 77 (96.3%) | 3 (3.7%) |
| College or Associate's Degree | 74 (75.5%) | 24 (24.5%) |
| Bachelor's Degree | 407 (100.0%) | 0 (0.0%) |
| Graduate Degree | 201 (89.7%) | 23 (10.3%) |
| Total | 790 (82.7%) | 165 (17.3%) |
Employment Characteristics in Palatine
Employment by Class of Employer in Palatine
Among the 36,589 employed individuals in Palatine, private company employees (26,815 | 73.3%), not-for-profit organizations (2,558 | 7.0%), and local government employees (2,444 | 6.7%) make up the most common classes of employment.
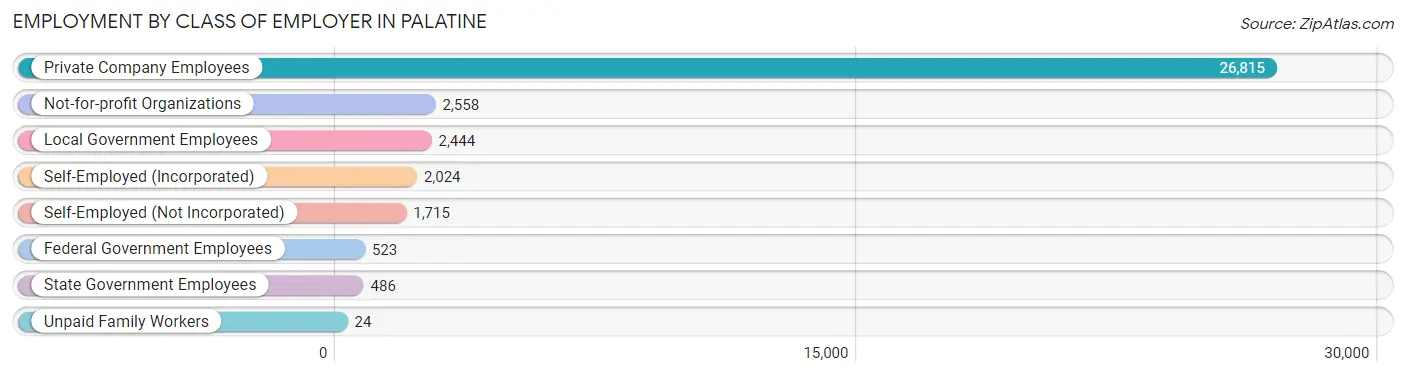
| Employer Class | # Employees | % Employees |
| Private Company Employees | 26,815 | 73.3% |
| Self-Employed (Incorporated) | 2,024 | 5.5% |
| Self-Employed (Not Incorporated) | 1,715 | 4.7% |
| Not-for-profit Organizations | 2,558 | 7.0% |
| Local Government Employees | 2,444 | 6.7% |
| State Government Employees | 486 | 1.3% |
| Federal Government Employees | 523 | 1.4% |
| Unpaid Family Workers | 24 | 0.1% |
| Total | 36,589 | 100.0% |
Employment Status by Age in Palatine
According to the labor force statistics for Palatine, out of the total population over 16 years of age (53,662), 72.5% or 38,905 individuals are in the labor force, with 4.7% or 1,829 of them unemployed. The age group with the highest labor force participation rate is 30 to 34 years, with 93.0% or 4,908 individuals in the labor force. Within the labor force, the 65 to 74 years age range has the highest percentage of unemployed individuals, with 9.2% or 245 of them being unemployed.
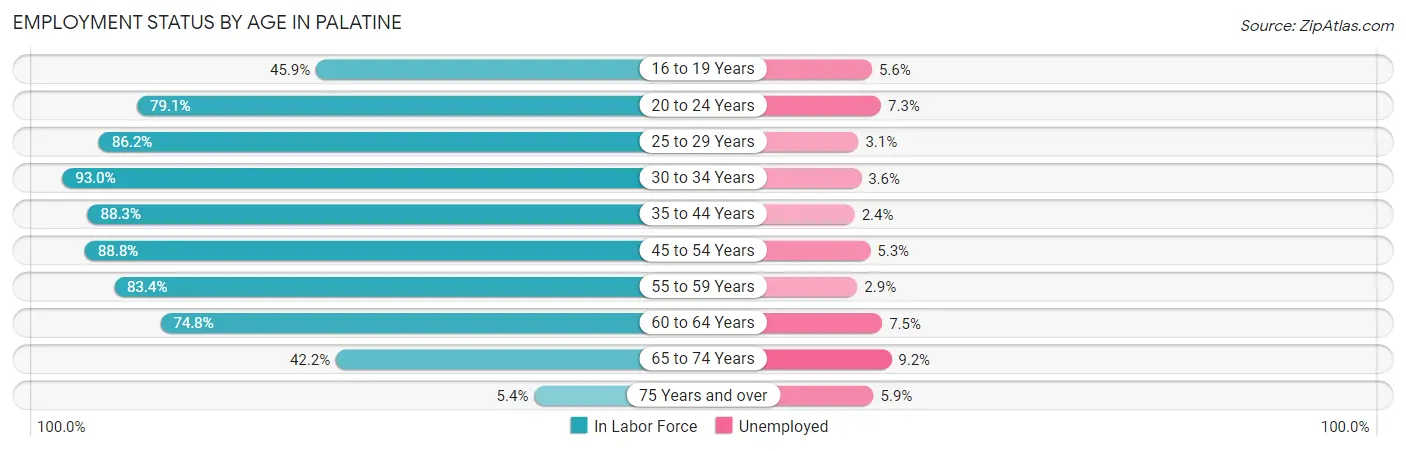
| Age Bracket | In Labor Force | Unemployed |
| 16 to 19 Years | 1,276 (45.9%) | 71 (5.6%) |
| 20 to 24 Years | 2,589 (79.1%) | 189 (7.3%) |
| 25 to 29 Years | 3,939 (86.2%) | 122 (3.1%) |
| 30 to 34 Years | 4,908 (93.0%) | 177 (3.6%) |
| 35 to 44 Years | 7,708 (88.3%) | 185 (2.4%) |
| 45 to 54 Years | 8,171 (88.8%) | 433 (5.3%) |
| 55 to 59 Years | 3,576 (83.4%) | 104 (2.9%) |
| 60 to 64 Years | 3,831 (74.8%) | 287 (7.5%) |
| 65 to 74 Years | 2,663 (42.2%) | 245 (9.2%) |
| 75 Years and over | 222 (5.4%) | 13 (5.9%) |
| Total | 38,905 (72.5%) | 1,829 (4.7%) |
Employment Status by Educational Attainment in Palatine
According to labor force statistics for Palatine, 86.4% of individuals (32,130) out of the total population between 25 and 64 years of age (37,188) are in the labor force, with 4.1% or 1,317 of them being unemployed. The group with the highest labor force participation rate are those with the educational attainment of bachelor's degree or higher, with 89.9% or 17,565 individuals in the labor force. Within the labor force, individuals with less than high school education have the highest percentage of unemployment, with 6.4% or 153 of them being unemployed.
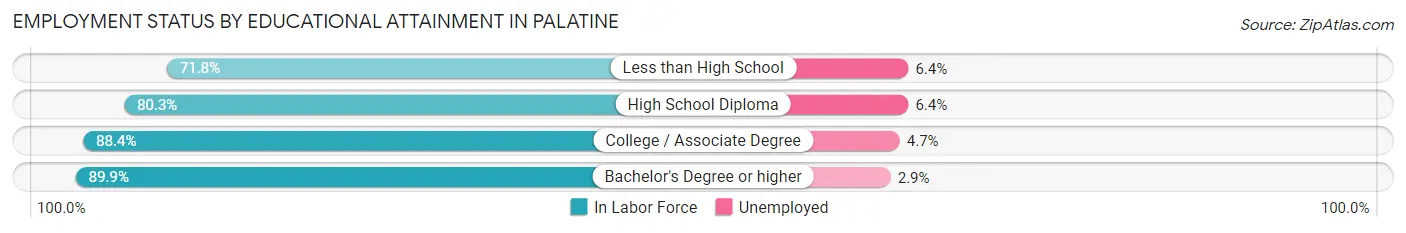
| Educational Attainment | In Labor Force | Unemployed |
| Less than High School | 2,391 (71.8%) | 213 (6.4%) |
| High School Diploma | 4,584 (80.3%) | 365 (6.4%) |
| College / Associate Degree | 7,613 (88.4%) | 405 (4.7%) |
| Bachelor's Degree or higher | 17,565 (89.9%) | 567 (2.9%) |
| Total | 32,130 (86.4%) | 1,525 (4.1%) |
Employment Occupations by Sex in Palatine
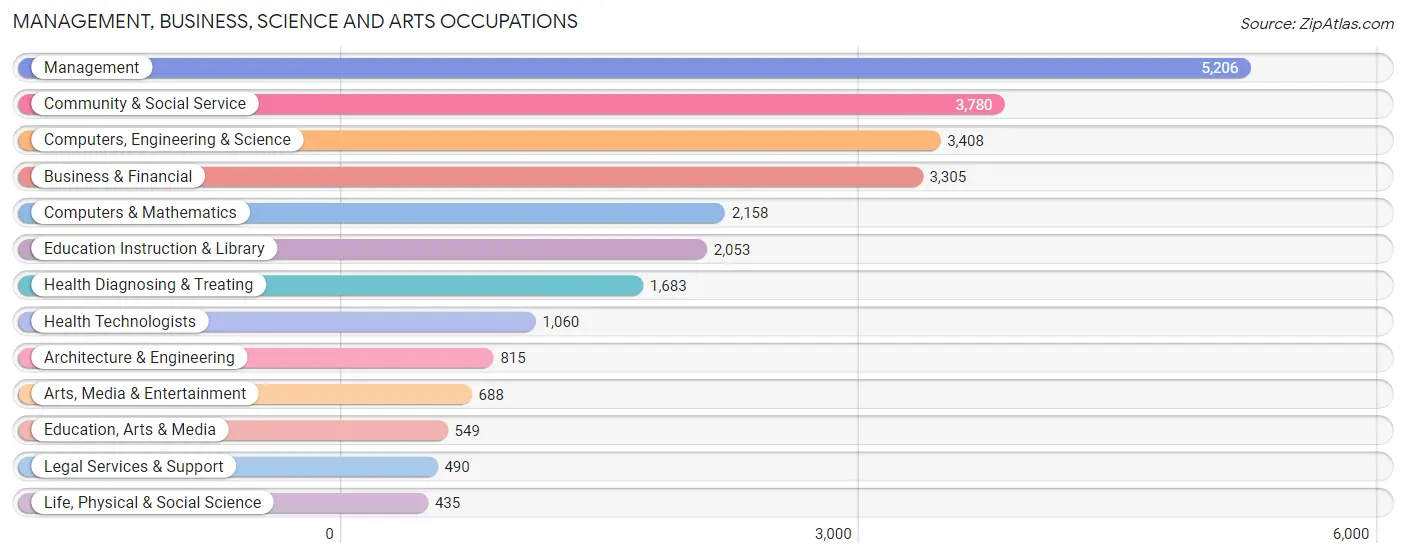
Management, Business, Science and Arts Occupations
The most common Management, Business, Science and Arts occupations in Palatine are Management (5,206 | 14.1%), Community & Social Service (3,780 | 10.2%), Computers, Engineering & Science (3,408 | 9.2%), Business & Financial (3,305 | 8.9%), and Computers & Mathematics (2,158 | 5.8%).
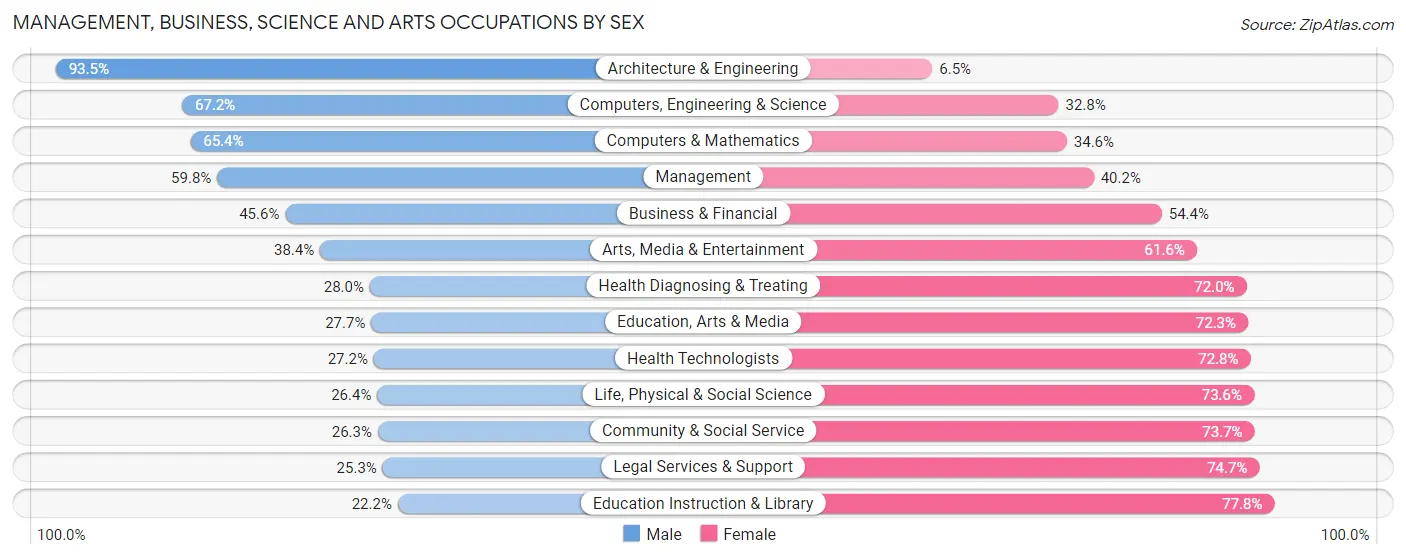
Management, Business, Science and Arts Occupations by Sex
Within the Management, Business, Science and Arts occupations in Palatine, the most male-oriented occupations are Architecture & Engineering (93.5%), Computers, Engineering & Science (67.2%), and Computers & Mathematics (65.4%), while the most female-oriented occupations are Education Instruction & Library (77.8%), Legal Services & Support (74.7%), and Community & Social Service (73.7%).
| Occupation | Male | Female |
| Management | 3,115 (59.8%) | 2,091 (40.2%) |
| Business & Financial | 1,508 (45.6%) | 1,797 (54.4%) |
| Computers, Engineering & Science | 2,289 (67.2%) | 1,119 (32.8%) |
| Computers & Mathematics | 1,412 (65.4%) | 746 (34.6%) |
| Architecture & Engineering | 762 (93.5%) | 53 (6.5%) |
| Life, Physical & Social Science | 115 (26.4%) | 320 (73.6%) |
| Community & Social Service | 995 (26.3%) | 2,785 (73.7%) |
| Education, Arts & Media | 152 (27.7%) | 397 (72.3%) |
| Legal Services & Support | 124 (25.3%) | 366 (74.7%) |
| Education Instruction & Library | 455 (22.2%) | 1,598 (77.8%) |
| Arts, Media & Entertainment | 264 (38.4%) | 424 (61.6%) |
| Health Diagnosing & Treating | 471 (28.0%) | 1,212 (72.0%) |
| Health Technologists | 288 (27.2%) | 772 (72.8%) |
| Total (Category) | 8,378 (48.2%) | 9,004 (51.8%) |
| Total (Overall) | 19,903 (53.7%) | 17,144 (46.3%) |
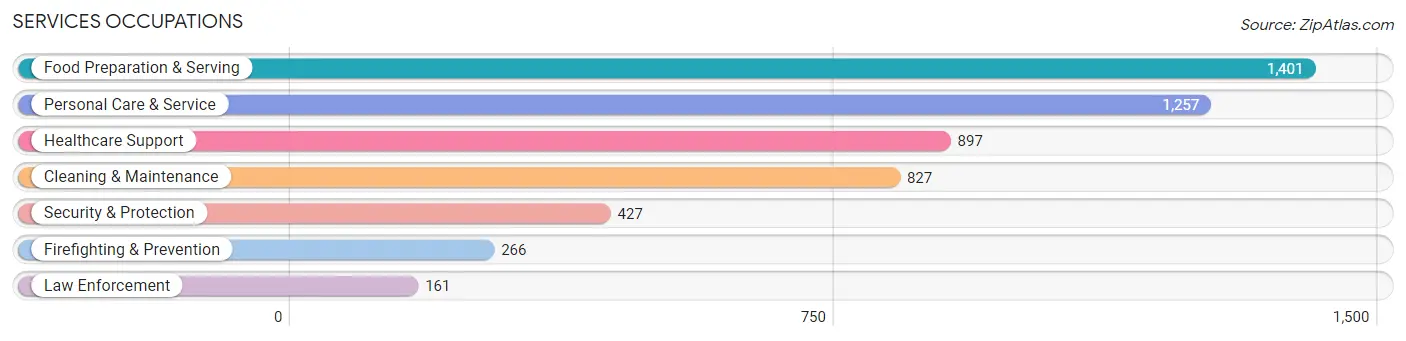
Services Occupations
The most common Services occupations in Palatine are Food Preparation & Serving (1,401 | 3.8%), Personal Care & Service (1,257 | 3.4%), Healthcare Support (897 | 2.4%), Cleaning & Maintenance (827 | 2.2%), and Security & Protection (427 | 1.1%).
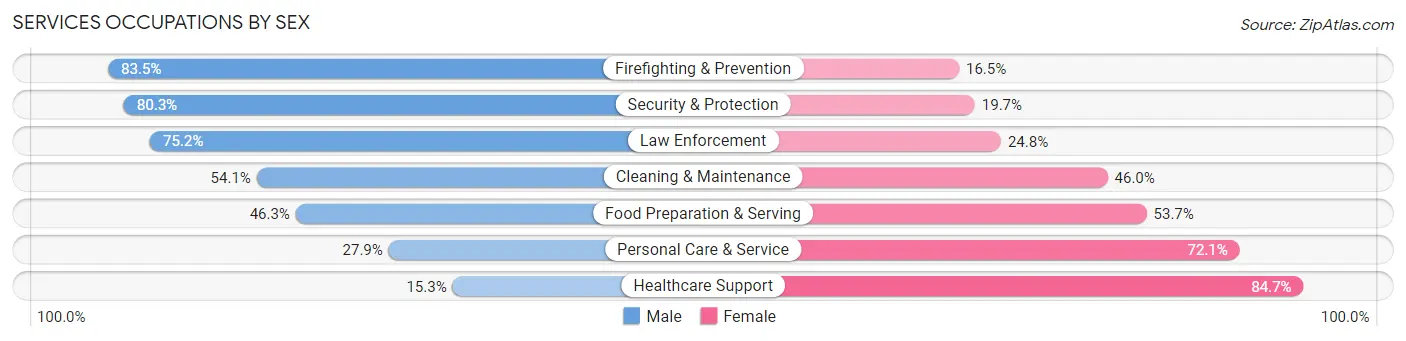
Services Occupations by Sex
Within the Services occupations in Palatine, the most male-oriented occupations are Firefighting & Prevention (83.5%), Security & Protection (80.3%), and Law Enforcement (75.2%), while the most female-oriented occupations are Healthcare Support (84.7%), Personal Care & Service (72.1%), and Food Preparation & Serving (53.7%).
| Occupation | Male | Female |
| Healthcare Support | 137 (15.3%) | 760 (84.7%) |
| Security & Protection | 343 (80.3%) | 84 (19.7%) |
| Firefighting & Prevention | 222 (83.5%) | 44 (16.5%) |
| Law Enforcement | 121 (75.2%) | 40 (24.8%) |
| Food Preparation & Serving | 649 (46.3%) | 752 (53.7%) |
| Cleaning & Maintenance | 447 (54.0%) | 380 (46.0%) |
| Personal Care & Service | 351 (27.9%) | 906 (72.1%) |
| Total (Category) | 1,927 (40.1%) | 2,882 (59.9%) |
| Total (Overall) | 19,903 (53.7%) | 17,144 (46.3%) |
Sales and Office Occupations
The most common Sales and Office occupations in Palatine are Sales & Related (3,732 | 10.1%), and Office & Administration (3,375 | 9.1%).

Sales and Office Occupations by Sex
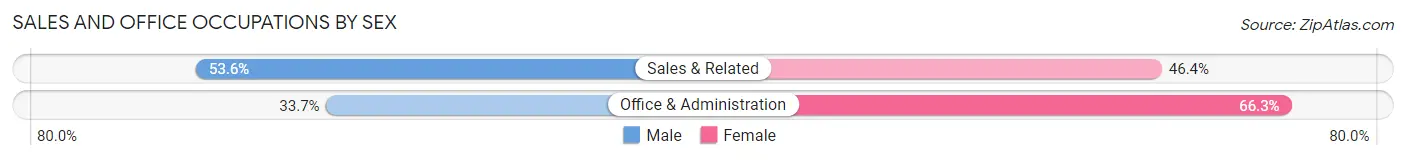
| Occupation | Male | Female |
| Sales & Related | 2,002 (53.6%) | 1,730 (46.4%) |
| Office & Administration | 1,138 (33.7%) | 2,237 (66.3%) |
| Total (Category) | 3,140 (44.2%) | 3,967 (55.8%) |
| Total (Overall) | 19,903 (53.7%) | 17,144 (46.3%) |
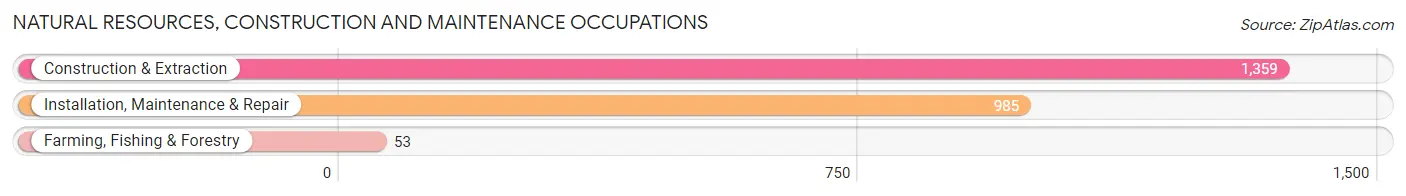
Natural Resources, Construction and Maintenance Occupations
The most common Natural Resources, Construction and Maintenance occupations in Palatine are Construction & Extraction (1,359 | 3.7%), Installation, Maintenance & Repair (985 | 2.7%), and Farming, Fishing & Forestry (53 | 0.1%).
Natural Resources, Construction and Maintenance Occupations by Sex
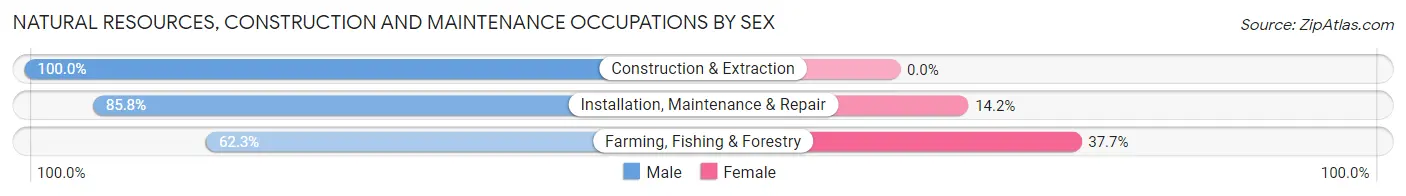
| Occupation | Male | Female |
| Farming, Fishing & Forestry | 33 (62.3%) | 20 (37.7%) |
| Construction & Extraction | 1,359 (100.0%) | 0 (0.0%) |
| Installation, Maintenance & Repair | 845 (85.8%) | 140 (14.2%) |
| Total (Category) | 2,237 (93.3%) | 160 (6.7%) |
| Total (Overall) | 19,903 (53.7%) | 17,144 (46.3%) |
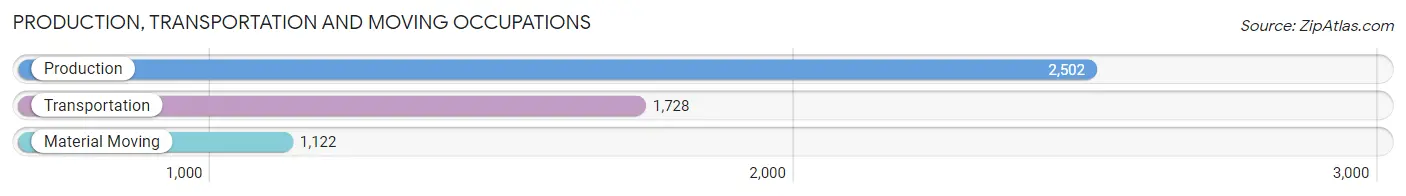
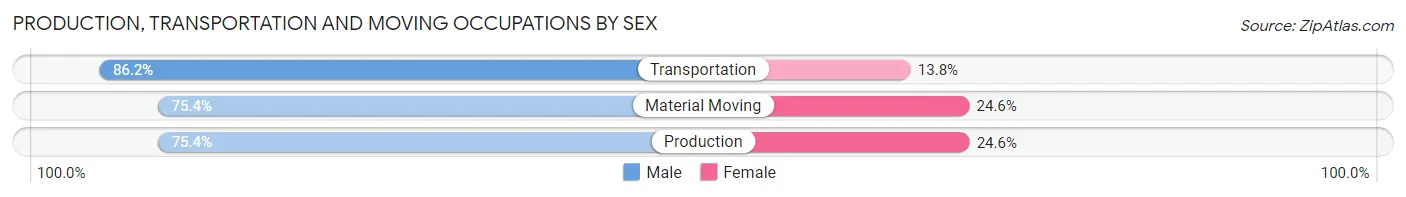
Production, Transportation and Moving Occupations
The most common Production, Transportation and Moving occupations in Palatine are Production (2,502 | 6.8%), Transportation (1,728 | 4.7%), and Material Moving (1,122 | 3.0%).
Production, Transportation and Moving Occupations by Sex
| Occupation | Male | Female |
| Production | 1,886 (75.4%) | 616 (24.6%) |
| Transportation | 1,489 (86.2%) | 239 (13.8%) |
| Material Moving | 846 (75.4%) | 276 (24.6%) |
| Total (Category) | 4,221 (78.9%) | 1,131 (21.1%) |
| Total (Overall) | 19,903 (53.7%) | 17,144 (46.3%) |
Employment Industries by Sex in Palatine
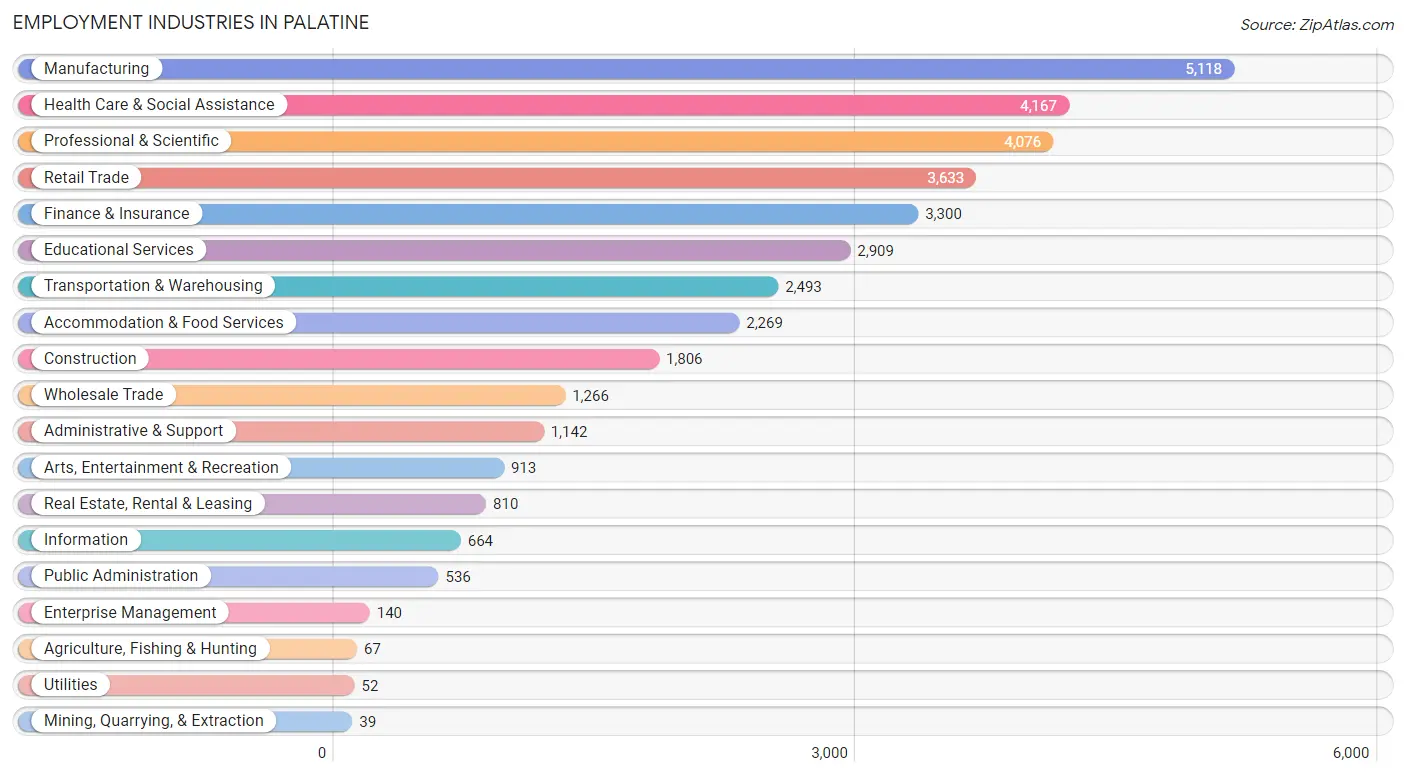
Employment Industries in Palatine
The major employment industries in Palatine include Manufacturing (5,118 | 13.8%), Health Care & Social Assistance (4,167 | 11.3%), Professional & Scientific (4,076 | 11.0%), Retail Trade (3,633 | 9.8%), and Finance & Insurance (3,300 | 8.9%).
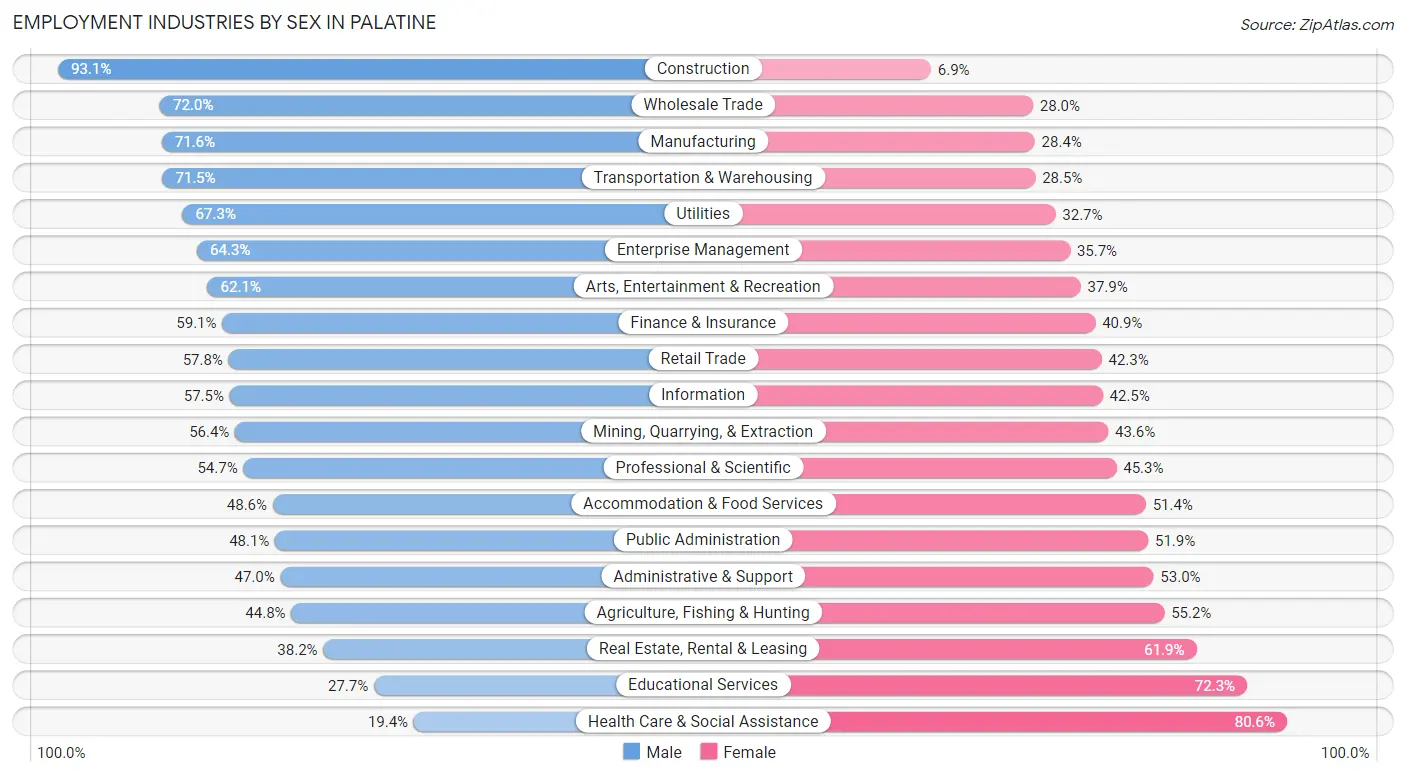
Employment Industries by Sex in Palatine
The Palatine industries that see more men than women are Construction (93.1%), Wholesale Trade (72.0%), and Manufacturing (71.6%), whereas the industries that tend to have a higher number of women are Health Care & Social Assistance (80.6%), Educational Services (72.3%), and Real Estate, Rental & Leasing (61.9%).
| Industry | Male | Female |
| Agriculture, Fishing & Hunting | 30 (44.8%) | 37 (55.2%) |
| Mining, Quarrying, & Extraction | 22 (56.4%) | 17 (43.6%) |
| Construction | 1,681 (93.1%) | 125 (6.9%) |
| Manufacturing | 3,664 (71.6%) | 1,454 (28.4%) |
| Wholesale Trade | 911 (72.0%) | 355 (28.0%) |
| Retail Trade | 2,098 (57.8%) | 1,535 (42.2%) |
| Transportation & Warehousing | 1,782 (71.5%) | 711 (28.5%) |
| Utilities | 35 (67.3%) | 17 (32.7%) |
| Information | 382 (57.5%) | 282 (42.5%) |
| Finance & Insurance | 1,949 (59.1%) | 1,351 (40.9%) |
| Real Estate, Rental & Leasing | 309 (38.2%) | 501 (61.9%) |
| Professional & Scientific | 2,229 (54.7%) | 1,847 (45.3%) |
| Enterprise Management | 90 (64.3%) | 50 (35.7%) |
| Administrative & Support | 537 (47.0%) | 605 (53.0%) |
| Educational Services | 805 (27.7%) | 2,104 (72.3%) |
| Health Care & Social Assistance | 809 (19.4%) | 3,358 (80.6%) |
| Arts, Entertainment & Recreation | 567 (62.1%) | 346 (37.9%) |
| Accommodation & Food Services | 1,103 (48.6%) | 1,166 (51.4%) |
| Public Administration | 258 (48.1%) | 278 (51.9%) |
| Total | 19,903 (53.7%) | 17,144 (46.3%) |
Education in Palatine
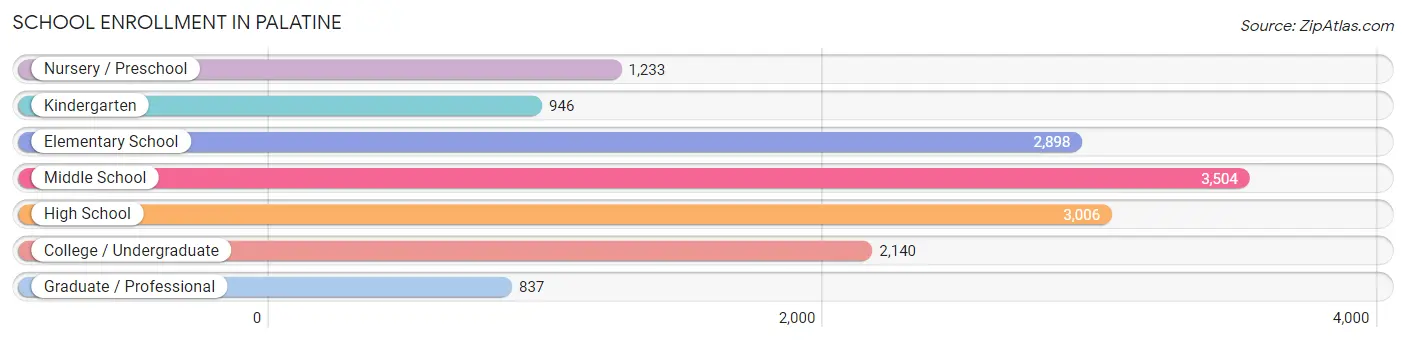
School Enrollment in Palatine
The most common levels of schooling among the 14,564 students in Palatine are middle school (3,504 | 24.1%), high school (3,006 | 20.6%), and elementary school (2,898 | 19.9%).
| School Level | # Students | % Students |
| Nursery / Preschool | 1,233 | 8.5% |
| Kindergarten | 946 | 6.5% |
| Elementary School | 2,898 | 19.9% |
| Middle School | 3,504 | 24.1% |
| High School | 3,006 | 20.6% |
| College / Undergraduate | 2,140 | 14.7% |
| Graduate / Professional | 837 | 5.8% |
| Total | 14,564 | 100.0% |
School Enrollment by Age by Funding Source in Palatine
Out of a total of 14,564 students who are enrolled in schools in Palatine, 2,010 (13.8%) attend a private institution, while the remaining 12,554 (86.2%) are enrolled in public schools. The age group of 3 to 4 year olds has the highest likelihood of being enrolled in private schools, with 419 (42.9% in the age bracket) enrolled. Conversely, the age group of 15 to 17 year olds has the lowest likelihood of being enrolled in a private school, with 2,120 (98.6% in the age bracket) attending a public institution.
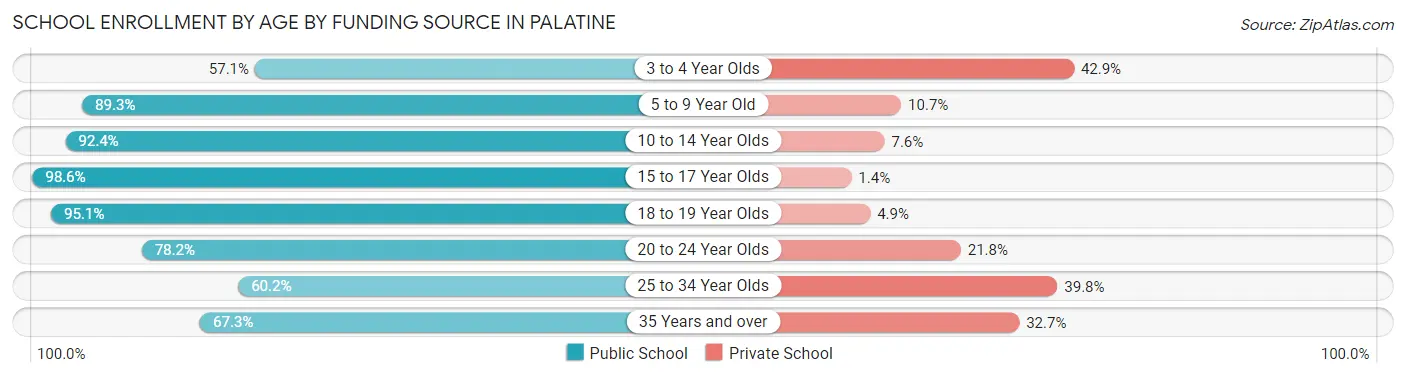
| Age Bracket | Public School | Private School |
| 3 to 4 Year Olds | 558 (57.1%) | 419 (42.9%) |
| 5 to 9 Year Old | 3,461 (89.3%) | 415 (10.7%) |
| 10 to 14 Year Olds | 3,859 (92.4%) | 318 (7.6%) |
| 15 to 17 Year Olds | 2,120 (98.6%) | 31 (1.4%) |
| 18 to 19 Year Olds | 673 (95.1%) | 35 (4.9%) |
| 20 to 24 Year Olds | 921 (78.2%) | 257 (21.8%) |
| 25 to 34 Year Olds | 428 (60.2%) | 283 (39.8%) |
| 35 Years and over | 529 (67.3%) | 257 (32.7%) |
| Total | 12,554 (86.2%) | 2,010 (13.8%) |
Educational Attainment by Field of Study in Palatine
Business (6,166 | 24.4%), engineering (3,314 | 13.1%), social sciences (1,952 | 7.7%), education (1,848 | 7.3%), and science & technology (1,575 | 6.2%) are the most common fields of study among 25,231 individuals in Palatine who have obtained a bachelor's degree or higher.
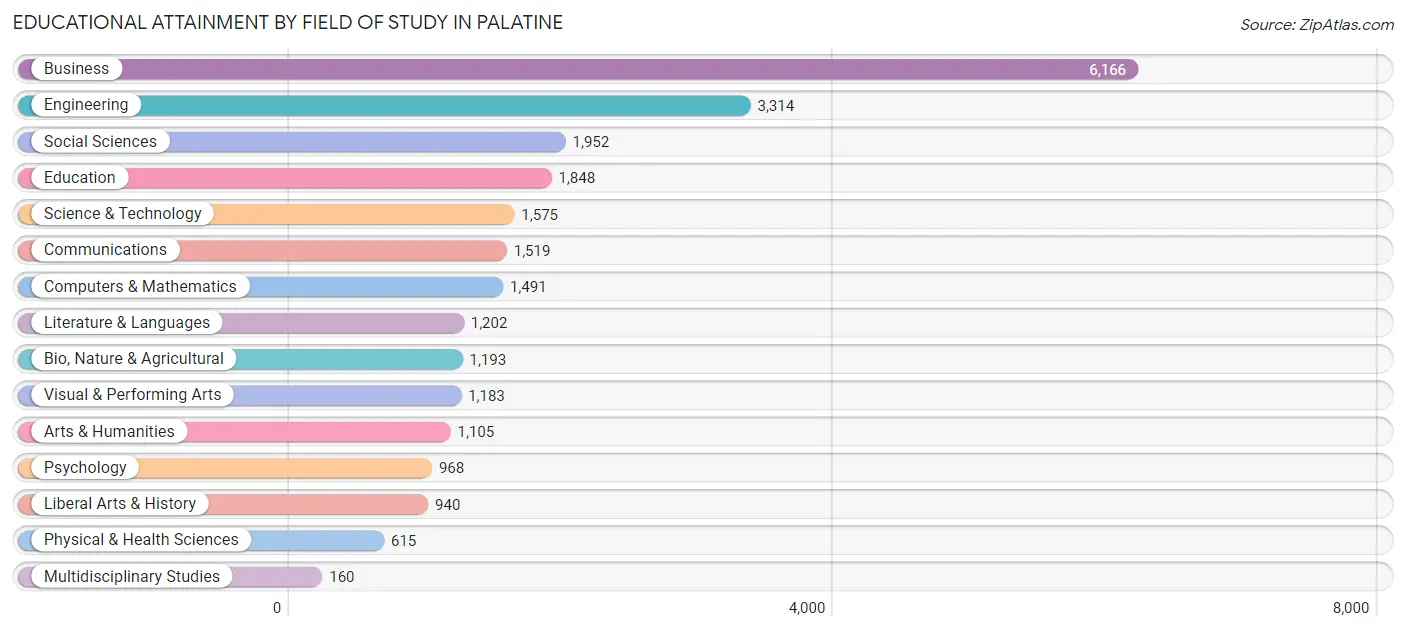
| Field of Study | # Graduates | % Graduates |
| Computers & Mathematics | 1,491 | 5.9% |
| Bio, Nature & Agricultural | 1,193 | 4.7% |
| Physical & Health Sciences | 615 | 2.4% |
| Psychology | 968 | 3.8% |
| Social Sciences | 1,952 | 7.7% |
| Engineering | 3,314 | 13.1% |
| Multidisciplinary Studies | 160 | 0.6% |
| Science & Technology | 1,575 | 6.2% |
| Business | 6,166 | 24.4% |
| Education | 1,848 | 7.3% |
| Literature & Languages | 1,202 | 4.8% |
| Liberal Arts & History | 940 | 3.7% |
| Visual & Performing Arts | 1,183 | 4.7% |
| Communications | 1,519 | 6.0% |
| Arts & Humanities | 1,105 | 4.4% |
| Total | 25,231 | 100.0% |
Transportation & Commute in Palatine
Vehicle Availability by Sex in Palatine
The most prevalent vehicle ownership categories in Palatine are males with 2 vehicles (10,432, accounting for 52.8%) and females with 2 vehicles (8,820, making up 62.0%).
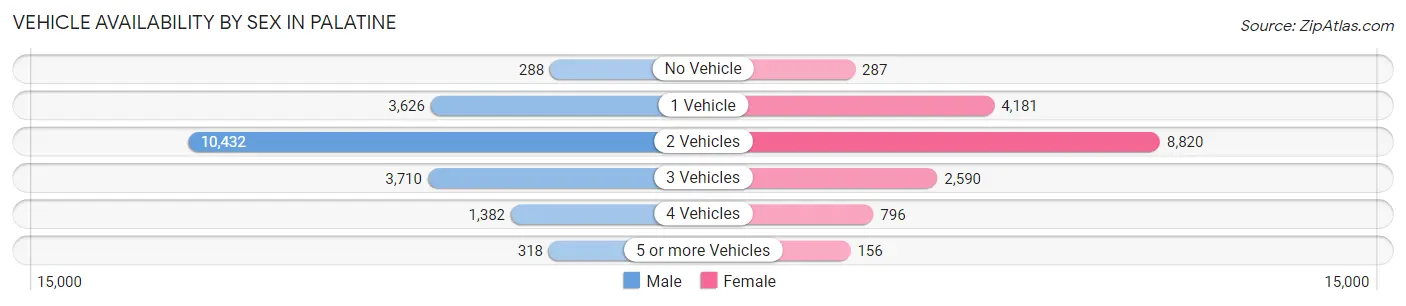
| Vehicles Available | Male | Female |
| No Vehicle | 288 (1.5%) | 287 (1.7%) |
| 1 Vehicle | 3,626 (18.3%) | 4,181 (24.8%) |
| 2 Vehicles | 10,432 (52.8%) | 8,820 (52.4%) |
| 3 Vehicles | 3,710 (18.8%) | 2,590 (15.4%) |
| 4 Vehicles | 1,382 (7.0%) | 796 (4.7%) |
| 5 or more Vehicles | 318 (1.6%) | 156 (0.9%) |
| Total | 19,756 (100.0%) | 16,830 (100.0%) |
Commute Time in Palatine
The most frequently occuring commute durations in Palatine are 30 to 34 minutes (4,572 commuters, 14.8%), 20 to 24 minutes (4,563 commuters, 14.8%), and 15 to 19 minutes (4,308 commuters, 14.0%).
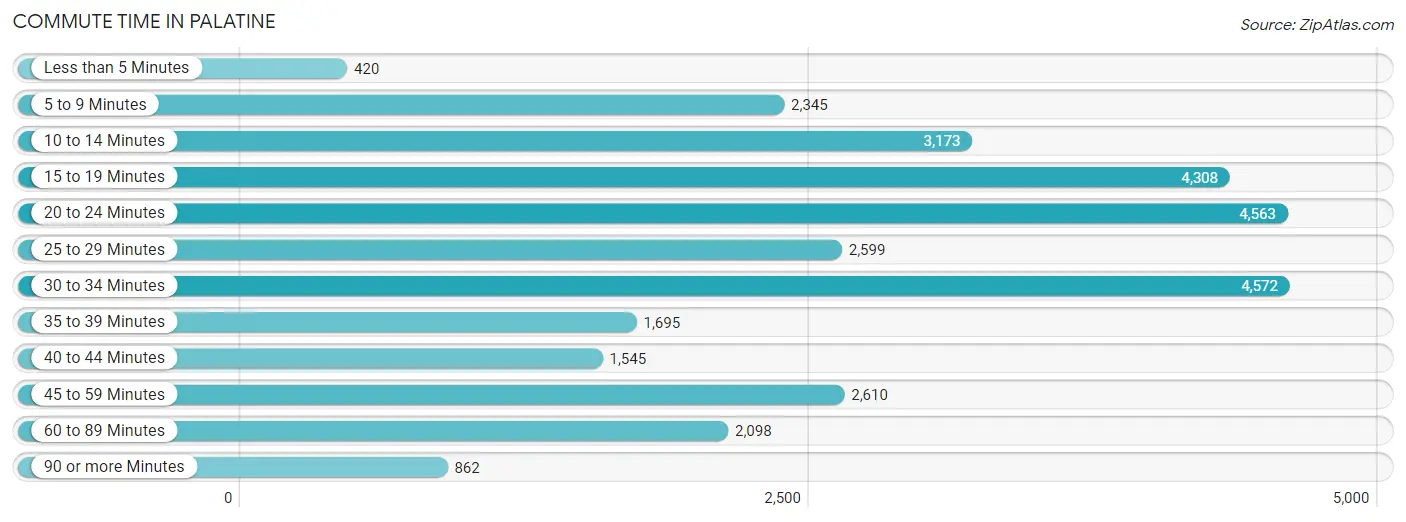
| Commute Time | # Commuters | % Commuters |
| Less than 5 Minutes | 420 | 1.4% |
| 5 to 9 Minutes | 2,345 | 7.6% |
| 10 to 14 Minutes | 3,173 | 10.3% |
| 15 to 19 Minutes | 4,308 | 14.0% |
| 20 to 24 Minutes | 4,563 | 14.8% |
| 25 to 29 Minutes | 2,599 | 8.4% |
| 30 to 34 Minutes | 4,572 | 14.8% |
| 35 to 39 Minutes | 1,695 | 5.5% |
| 40 to 44 Minutes | 1,545 | 5.0% |
| 45 to 59 Minutes | 2,610 | 8.5% |
| 60 to 89 Minutes | 2,098 | 6.8% |
| 90 or more Minutes | 862 | 2.8% |
Commute Time by Sex in Palatine
The most common commute times in Palatine are 30 to 34 minutes (2,643 commuters, 15.8%) for males and 20 to 24 minutes (2,030 commuters, 14.4%) for females.
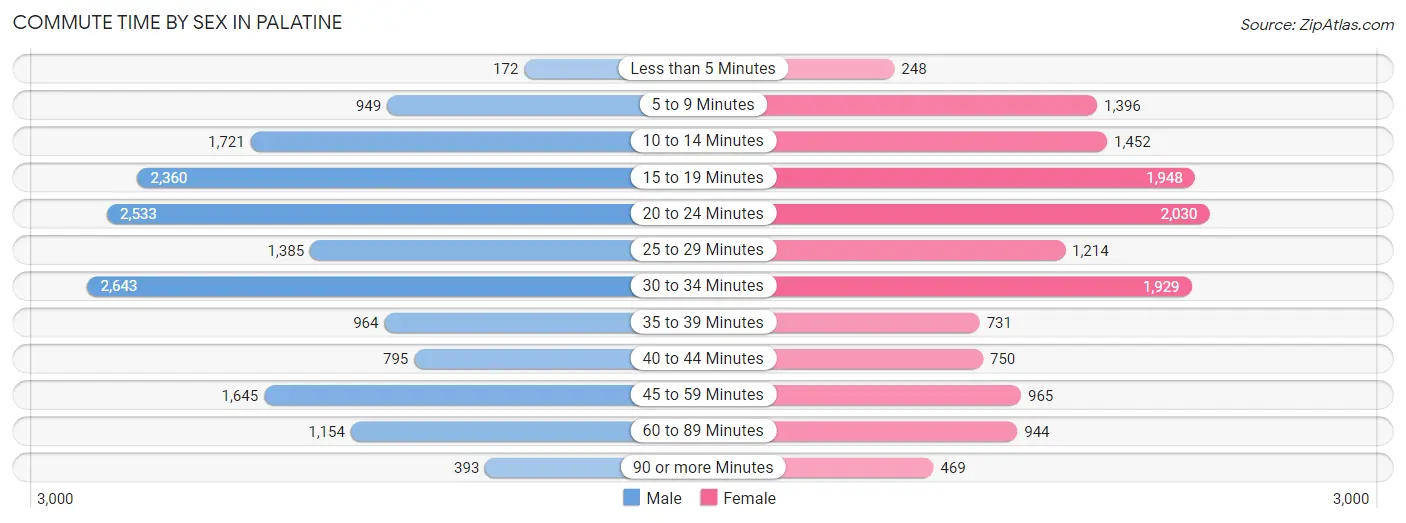
| Commute Time | Male | Female |
| Less than 5 Minutes | 172 (1.0%) | 248 (1.8%) |
| 5 to 9 Minutes | 949 (5.7%) | 1,396 (9.9%) |
| 10 to 14 Minutes | 1,721 (10.3%) | 1,452 (10.3%) |
| 15 to 19 Minutes | 2,360 (14.1%) | 1,948 (13.8%) |
| 20 to 24 Minutes | 2,533 (15.1%) | 2,030 (14.4%) |
| 25 to 29 Minutes | 1,385 (8.3%) | 1,214 (8.6%) |
| 30 to 34 Minutes | 2,643 (15.8%) | 1,929 (13.7%) |
| 35 to 39 Minutes | 964 (5.8%) | 731 (5.2%) |
| 40 to 44 Minutes | 795 (4.8%) | 750 (5.3%) |
| 45 to 59 Minutes | 1,645 (9.8%) | 965 (6.9%) |
| 60 to 89 Minutes | 1,154 (6.9%) | 944 (6.7%) |
| 90 or more Minutes | 393 (2.4%) | 469 (3.3%) |
Time of Departure to Work by Sex in Palatine
The most frequent times of departure to work in Palatine are 7:00 AM to 7:29 AM (2,584, 15.5%) for males and 7:00 AM to 7:29 AM (2,541, 18.0%) for females.
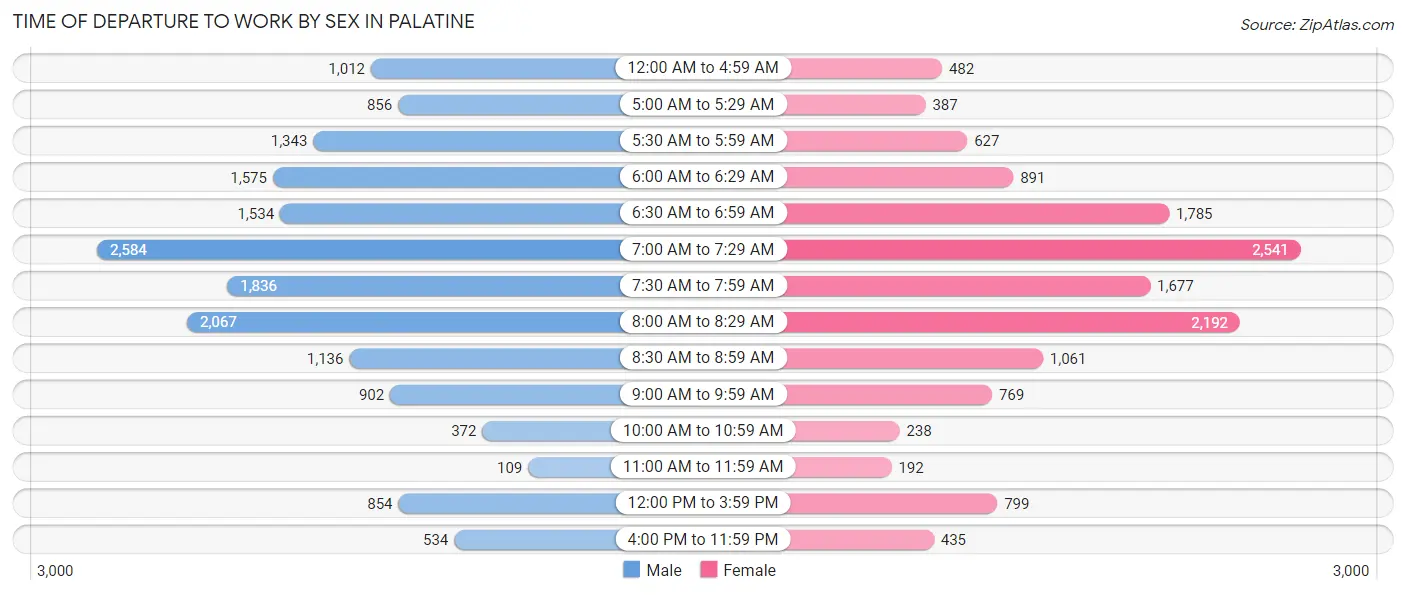
| Time of Departure | Male | Female |
| 12:00 AM to 4:59 AM | 1,012 (6.0%) | 482 (3.4%) |
| 5:00 AM to 5:29 AM | 856 (5.1%) | 387 (2.8%) |
| 5:30 AM to 5:59 AM | 1,343 (8.0%) | 627 (4.4%) |
| 6:00 AM to 6:29 AM | 1,575 (9.4%) | 891 (6.3%) |
| 6:30 AM to 6:59 AM | 1,534 (9.2%) | 1,785 (12.7%) |
| 7:00 AM to 7:29 AM | 2,584 (15.5%) | 2,541 (18.0%) |
| 7:30 AM to 7:59 AM | 1,836 (11.0%) | 1,677 (11.9%) |
| 8:00 AM to 8:29 AM | 2,067 (12.4%) | 2,192 (15.6%) |
| 8:30 AM to 8:59 AM | 1,136 (6.8%) | 1,061 (7.5%) |
| 9:00 AM to 9:59 AM | 902 (5.4%) | 769 (5.5%) |
| 10:00 AM to 10:59 AM | 372 (2.2%) | 238 (1.7%) |
| 11:00 AM to 11:59 AM | 109 (0.6%) | 192 (1.4%) |
| 12:00 PM to 3:59 PM | 854 (5.1%) | 799 (5.7%) |
| 4:00 PM to 11:59 PM | 534 (3.2%) | 435 (3.1%) |
| Total | 16,714 (100.0%) | 14,076 (100.0%) |
Housing Occupancy in Palatine
Occupancy by Ownership in Palatine
Of the total 26,582 dwellings in Palatine, owner-occupied units account for 17,942 (67.5%), while renter-occupied units make up 8,640 (32.5%).
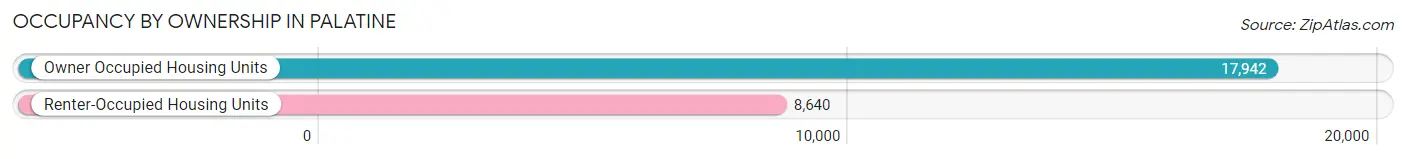
| Occupancy | # Housing Units | % Housing Units |
| Owner Occupied Housing Units | 17,942 | 67.5% |
| Renter-Occupied Housing Units | 8,640 | 32.5% |
| Total Occupied Housing Units | 26,582 | 100.0% |
Occupancy by Household Size in Palatine
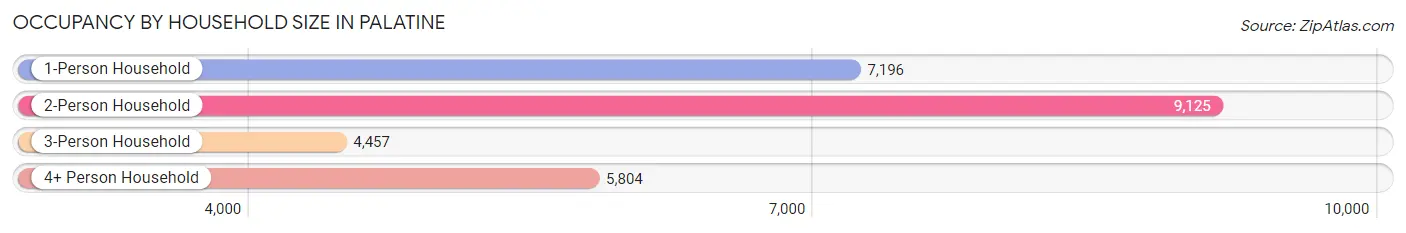
| Household Size | # Housing Units | % Housing Units |
| 1-Person Household | 7,196 | 27.1% |
| 2-Person Household | 9,125 | 34.3% |
| 3-Person Household | 4,457 | 16.8% |
| 4+ Person Household | 5,804 | 21.8% |
| Total Housing Units | 26,582 | 100.0% |
Occupancy by Ownership by Household Size in Palatine
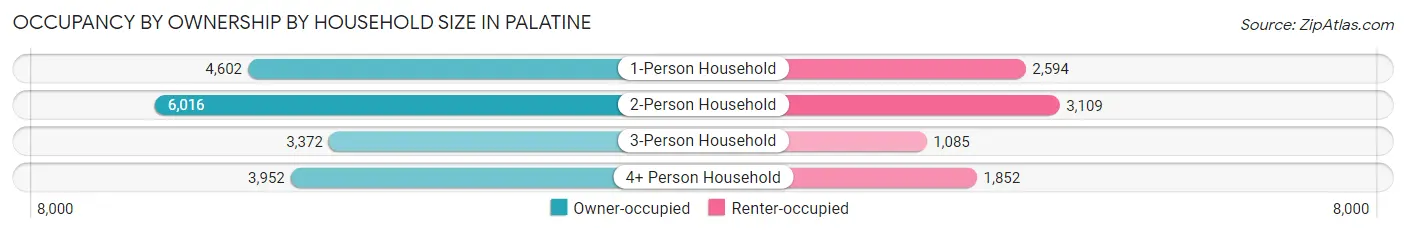
| Household Size | Owner-occupied | Renter-occupied |
| 1-Person Household | 4,602 (63.9%) | 2,594 (36.0%) |
| 2-Person Household | 6,016 (65.9%) | 3,109 (34.1%) |
| 3-Person Household | 3,372 (75.7%) | 1,085 (24.3%) |
| 4+ Person Household | 3,952 (68.1%) | 1,852 (31.9%) |
| Total Housing Units | 17,942 (67.5%) | 8,640 (32.5%) |
Occupancy by Educational Attainment in Palatine
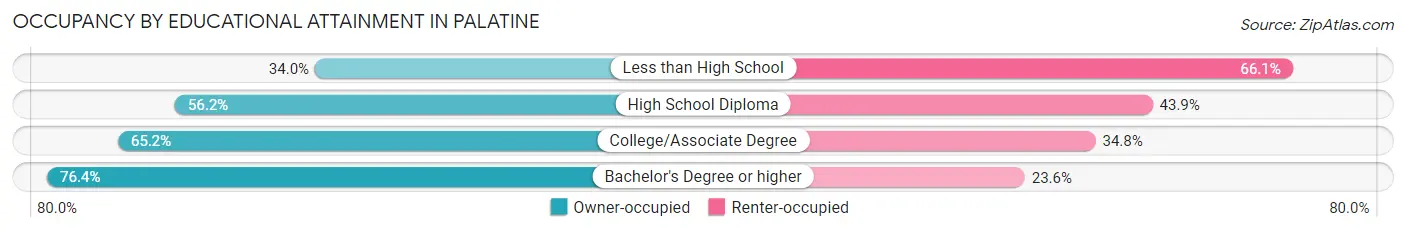
| Household Size | Owner-occupied | Renter-occupied |
| Less than High School | 681 (34.0%) | 1,325 (66.0%) |
| High School Diploma | 2,103 (56.1%) | 1,642 (43.9%) |
| College/Associate Degree | 4,417 (65.2%) | 2,358 (34.8%) |
| Bachelor's Degree or higher | 10,741 (76.4%) | 3,315 (23.6%) |
Occupancy by Age of Householder in Palatine
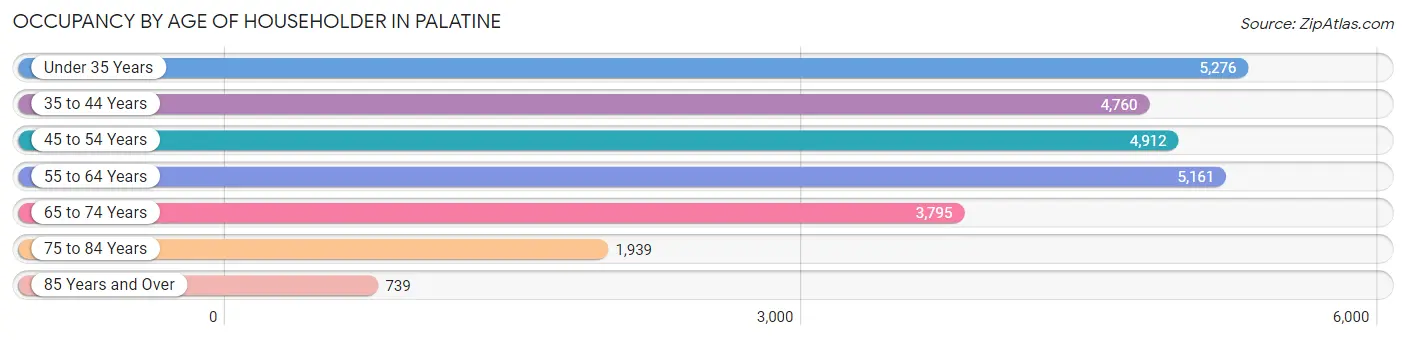
| Age Bracket | # Households | % Households |
| Under 35 Years | 5,276 | 19.9% |
| 35 to 44 Years | 4,760 | 17.9% |
| 45 to 54 Years | 4,912 | 18.5% |
| 55 to 64 Years | 5,161 | 19.4% |
| 65 to 74 Years | 3,795 | 14.3% |
| 75 to 84 Years | 1,939 | 7.3% |
| 85 Years and Over | 739 | 2.8% |
| Total | 26,582 | 100.0% |
Housing Finances in Palatine
Median Income by Occupancy in Palatine
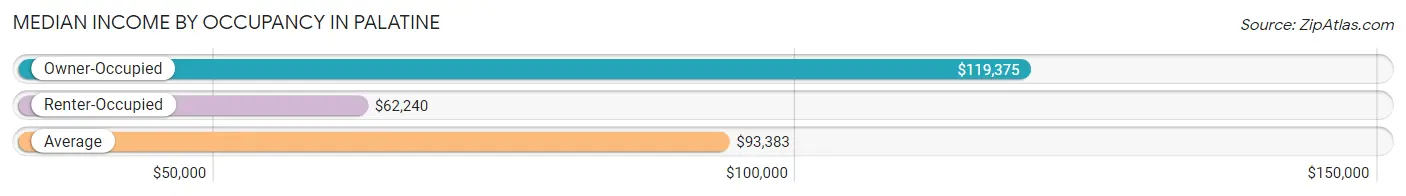
| Occupancy Type | # Households | Median Income |
| Owner-Occupied | 17,942 (67.5%) | $119,375 |
| Renter-Occupied | 8,640 (32.5%) | $62,240 |
| Average | 26,582 (100.0%) | $93,383 |
Occupancy by Householder Income Bracket in Palatine
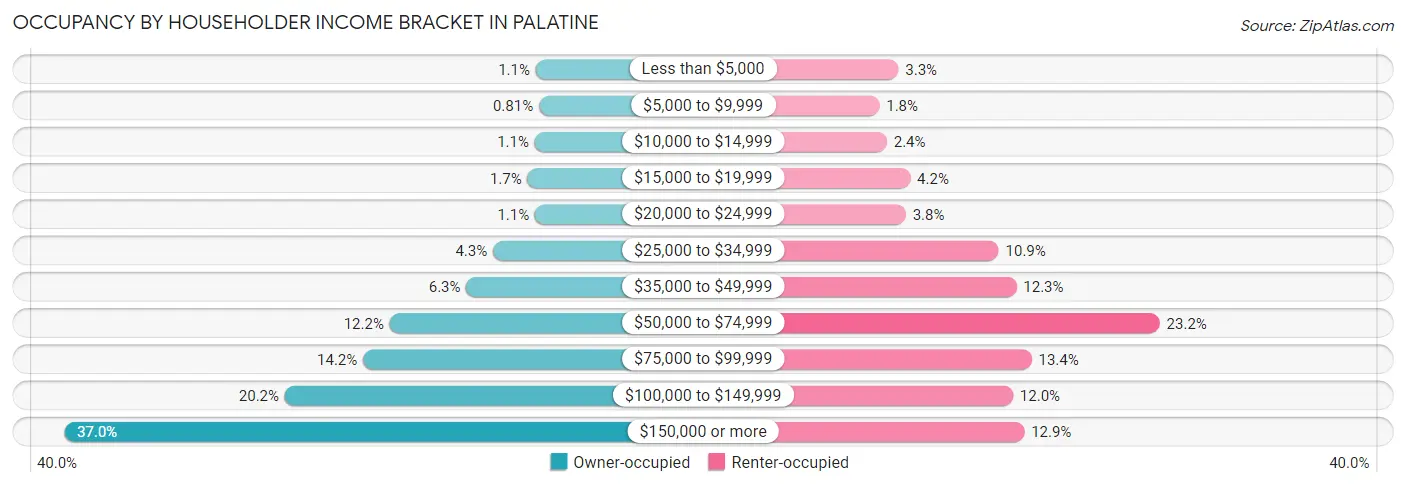
| Income Bracket | Owner-occupied | Renter-occupied |
| Less than $5,000 | 189 (1.1%) | 282 (3.3%) |
| $5,000 to $9,999 | 146 (0.8%) | 156 (1.8%) |
| $10,000 to $14,999 | 203 (1.1%) | 206 (2.4%) |
| $15,000 to $19,999 | 302 (1.7%) | 359 (4.2%) |
| $20,000 to $24,999 | 199 (1.1%) | 330 (3.8%) |
| $25,000 to $34,999 | 774 (4.3%) | 942 (10.9%) |
| $35,000 to $49,999 | 1,137 (6.3%) | 1,058 (12.2%) |
| $50,000 to $74,999 | 2,186 (12.2%) | 2,002 (23.2%) |
| $75,000 to $99,999 | 2,549 (14.2%) | 1,159 (13.4%) |
| $100,000 to $149,999 | 3,619 (20.2%) | 1,036 (12.0%) |
| $150,000 or more | 6,638 (37.0%) | 1,110 (12.9%) |
| Total | 17,942 (100.0%) | 8,640 (100.0%) |
Monthly Housing Cost Tiers in Palatine
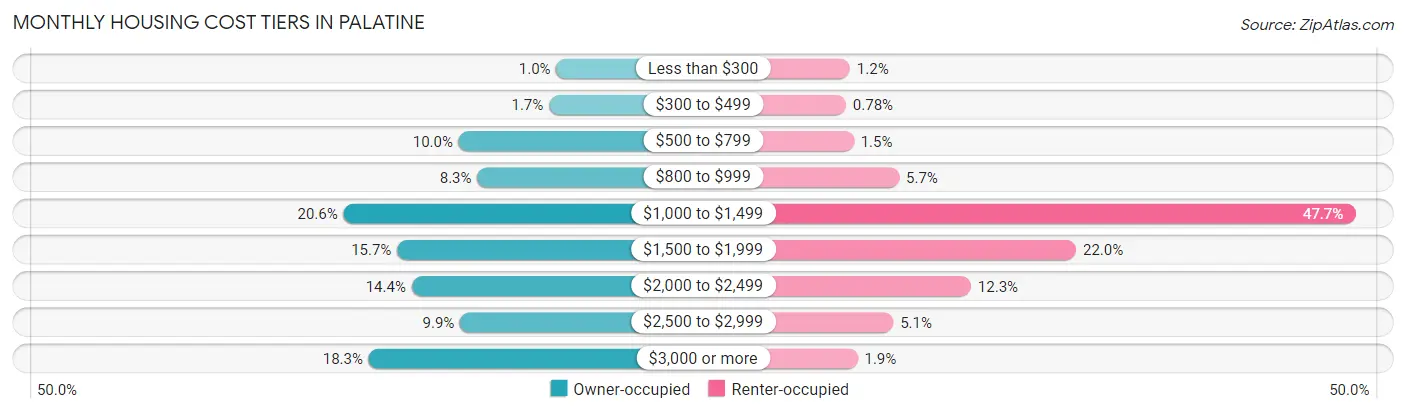
| Monthly Cost | Owner-occupied | Renter-occupied |
| Less than $300 | 187 (1.0%) | 99 (1.1%) |
| $300 to $499 | 306 (1.7%) | 67 (0.8%) |
| $500 to $799 | 1,799 (10.0%) | 130 (1.5%) |
| $800 to $999 | 1,492 (8.3%) | 491 (5.7%) |
| $1,000 to $1,499 | 3,704 (20.6%) | 4,117 (47.6%) |
| $1,500 to $1,999 | 2,817 (15.7%) | 1,898 (22.0%) |
| $2,000 to $2,499 | 2,576 (14.4%) | 1,062 (12.3%) |
| $2,500 to $2,999 | 1,776 (9.9%) | 444 (5.1%) |
| $3,000 or more | 3,285 (18.3%) | 160 (1.8%) |
| Total | 17,942 (100.0%) | 8,640 (100.0%) |
Physical Housing Characteristics in Palatine
Housing Structures in Palatine
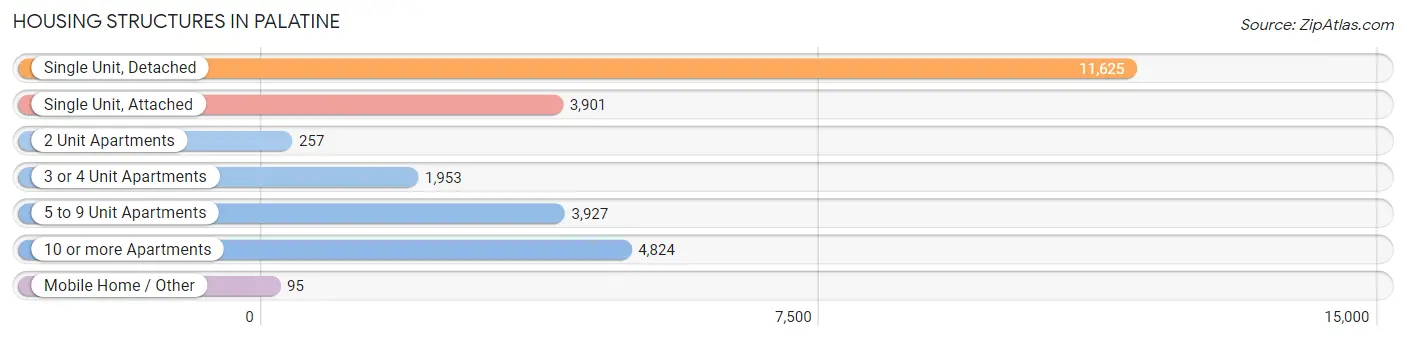
| Structure Type | # Housing Units | % Housing Units |
| Single Unit, Detached | 11,625 | 43.7% |
| Single Unit, Attached | 3,901 | 14.7% |
| 2 Unit Apartments | 257 | 1.0% |
| 3 or 4 Unit Apartments | 1,953 | 7.3% |
| 5 to 9 Unit Apartments | 3,927 | 14.8% |
| 10 or more Apartments | 4,824 | 18.1% |
| Mobile Home / Other | 95 | 0.4% |
| Total | 26,582 | 100.0% |
Housing Structures by Occupancy in Palatine
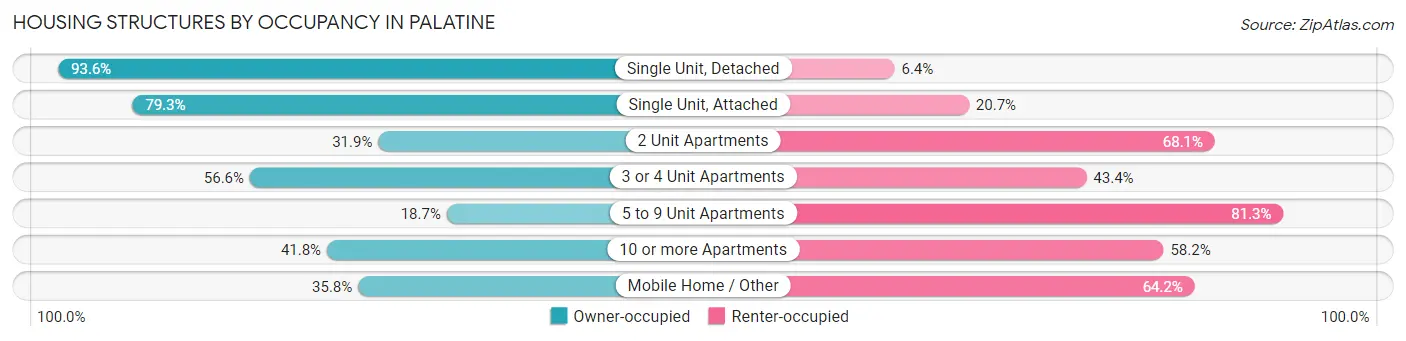
| Structure Type | Owner-occupied | Renter-occupied |
| Single Unit, Detached | 10,877 (93.6%) | 748 (6.4%) |
| Single Unit, Attached | 3,092 (79.3%) | 809 (20.7%) |
| 2 Unit Apartments | 82 (31.9%) | 175 (68.1%) |
| 3 or 4 Unit Apartments | 1,106 (56.6%) | 847 (43.4%) |
| 5 to 9 Unit Apartments | 735 (18.7%) | 3,192 (81.3%) |
| 10 or more Apartments | 2,016 (41.8%) | 2,808 (58.2%) |
| Mobile Home / Other | 34 (35.8%) | 61 (64.2%) |
| Total | 17,942 (67.5%) | 8,640 (32.5%) |
Housing Structures by Number of Rooms in Palatine
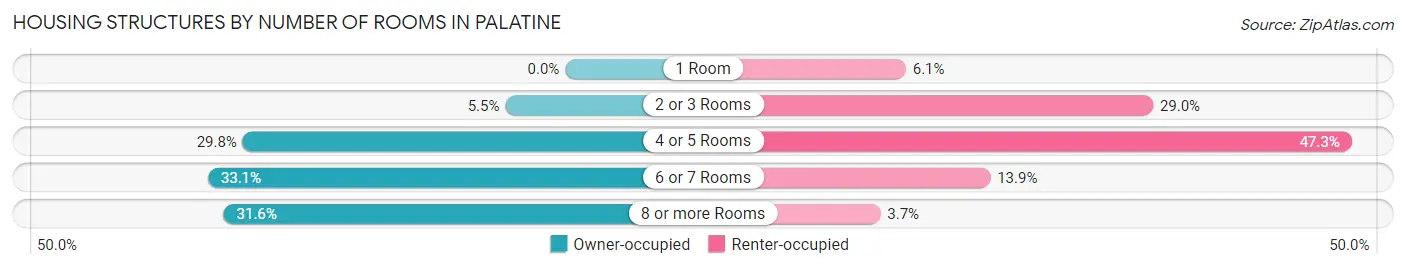
| Number of Rooms | Owner-occupied | Renter-occupied |
| 1 Room | 0 (0.0%) | 526 (6.1%) |
| 2 or 3 Rooms | 994 (5.5%) | 2,501 (28.9%) |
| 4 or 5 Rooms | 5,352 (29.8%) | 4,089 (47.3%) |
| 6 or 7 Rooms | 5,929 (33.1%) | 1,201 (13.9%) |
| 8 or more Rooms | 5,667 (31.6%) | 323 (3.7%) |
| Total | 17,942 (100.0%) | 8,640 (100.0%) |
Housing Structure by Heating Type in Palatine
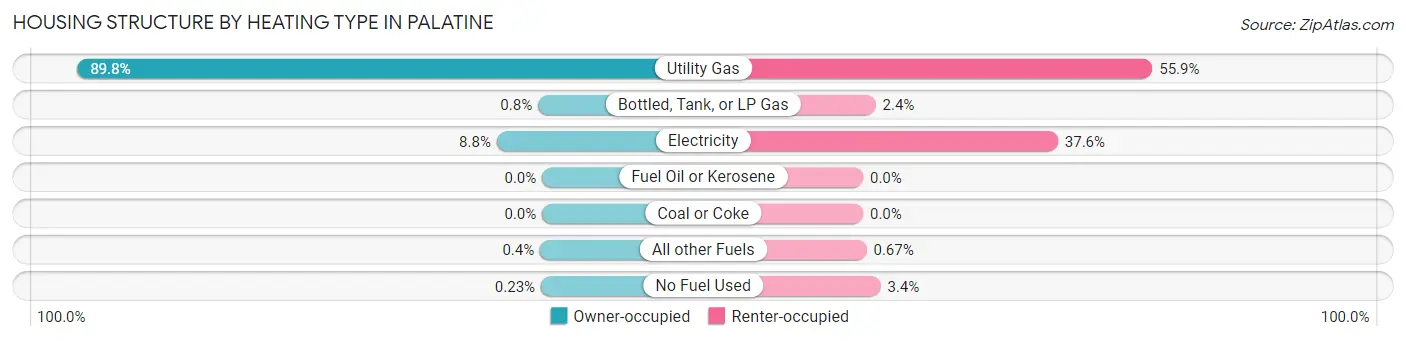
| Heating Type | Owner-occupied | Renter-occupied |
| Utility Gas | 16,115 (89.8%) | 4,829 (55.9%) |
| Bottled, Tank, or LP Gas | 144 (0.8%) | 209 (2.4%) |
| Electricity | 1,571 (8.8%) | 3,252 (37.6%) |
| Fuel Oil or Kerosene | 0 (0.0%) | 0 (0.0%) |
| Coal or Coke | 0 (0.0%) | 0 (0.0%) |
| All other Fuels | 71 (0.4%) | 58 (0.7%) |
| No Fuel Used | 41 (0.2%) | 292 (3.4%) |
| Total | 17,942 (100.0%) | 8,640 (100.0%) |
Household Vehicle Usage in Palatine
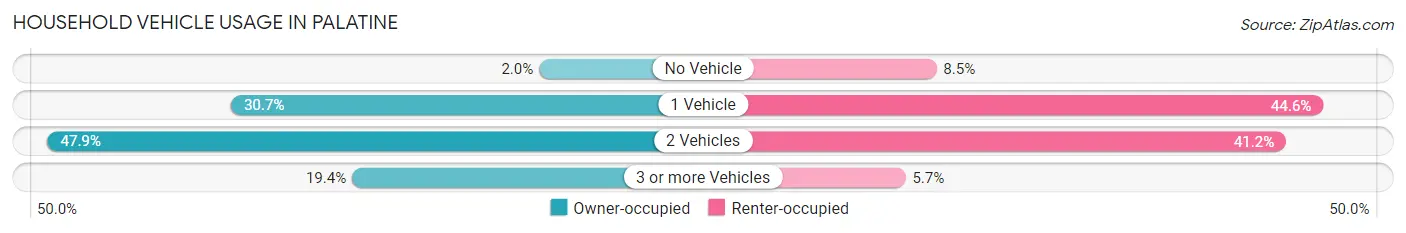
| Vehicles per Household | Owner-occupied | Renter-occupied |
| No Vehicle | 355 (2.0%) | 738 (8.5%) |
| 1 Vehicle | 5,514 (30.7%) | 3,857 (44.6%) |
| 2 Vehicles | 8,585 (47.8%) | 3,557 (41.2%) |
| 3 or more Vehicles | 3,488 (19.4%) | 488 (5.7%) |
| Total | 17,942 (100.0%) | 8,640 (100.0%) |
Real Estate & Mortgages in Palatine
Real Estate and Mortgage Overview in Palatine
| Characteristic | Without Mortgage | With Mortgage |
| Housing Units | 6,662 | 11,280 |
| Median Property Value | $321,900 | $345,500 |
| Median Household Income | $93,442 | $5,028 |
| Monthly Housing Costs | $975 | $3,268 |
| Real Estate Taxes | $7,510 | $161 |
Property Value by Mortgage Status in Palatine
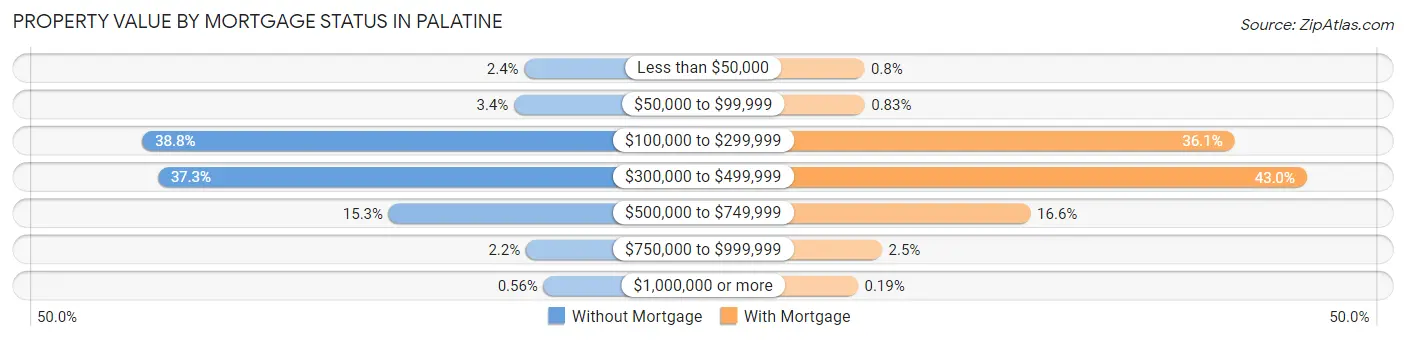
| Property Value | Without Mortgage | With Mortgage |
| Less than $50,000 | 160 (2.4%) | 90 (0.8%) |
| $50,000 to $99,999 | 225 (3.4%) | 94 (0.8%) |
| $100,000 to $299,999 | 2,585 (38.8%) | 4,071 (36.1%) |
| $300,000 to $499,999 | 2,486 (37.3%) | 4,848 (43.0%) |
| $500,000 to $749,999 | 1,020 (15.3%) | 1,876 (16.6%) |
| $750,000 to $999,999 | 149 (2.2%) | 280 (2.5%) |
| $1,000,000 or more | 37 (0.6%) | 21 (0.2%) |
| Total | 6,662 (100.0%) | 11,280 (100.0%) |
Household Income by Mortgage Status in Palatine
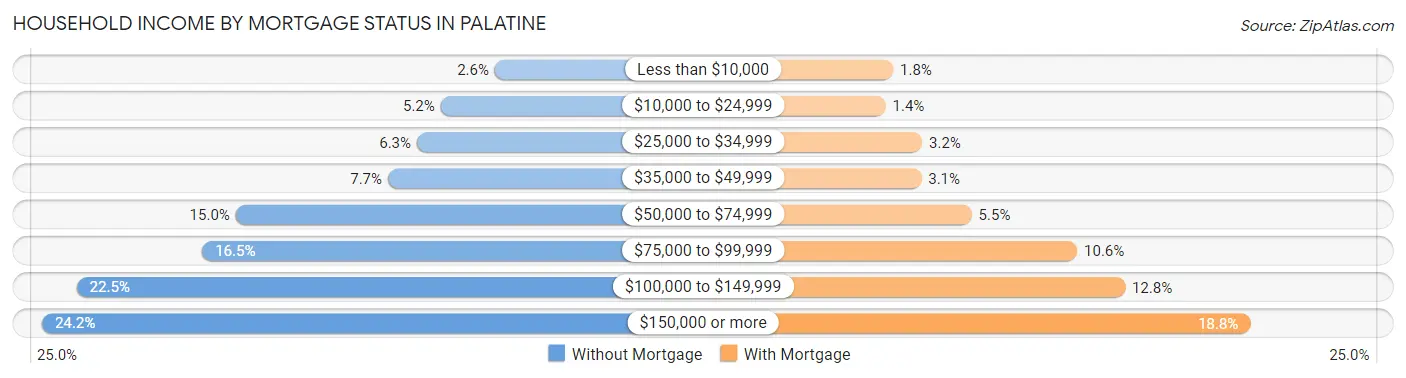
| Household Income | Without Mortgage | With Mortgage |
| Less than $10,000 | 174 (2.6%) | 202 (1.8%) |
| $10,000 to $24,999 | 346 (5.2%) | 161 (1.4%) |
| $25,000 to $34,999 | 421 (6.3%) | 358 (3.2%) |
| $35,000 to $49,999 | 513 (7.7%) | 353 (3.1%) |
| $50,000 to $74,999 | 996 (14.9%) | 624 (5.5%) |
| $75,000 to $99,999 | 1,102 (16.5%) | 1,190 (10.5%) |
| $100,000 to $149,999 | 1,500 (22.5%) | 1,447 (12.8%) |
| $150,000 or more | 1,610 (24.2%) | 2,119 (18.8%) |
| Total | 6,662 (100.0%) | 11,280 (100.0%) |
Property Value to Household Income Ratio in Palatine
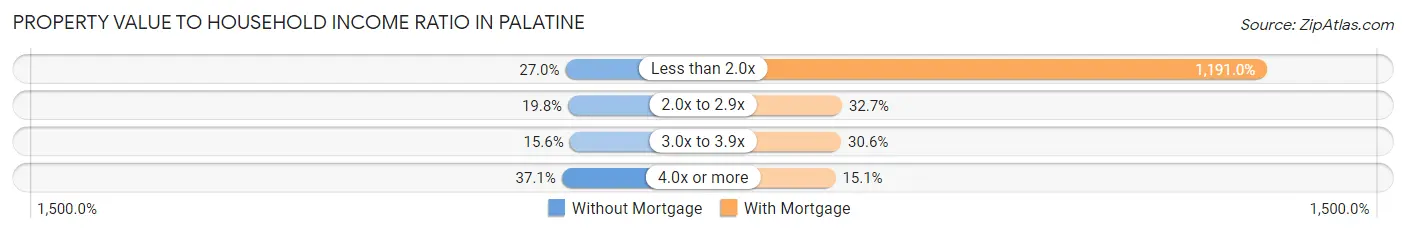
| Value-to-Income Ratio | Without Mortgage | With Mortgage |
| Less than 2.0x | 1,796 (27.0%) | 134,342 (1,191.0%) |
| 2.0x to 2.9x | 1,321 (19.8%) | 3,693 (32.7%) |
| 3.0x to 3.9x | 1,036 (15.5%) | 3,450 (30.6%) |
| 4.0x or more | 2,470 (37.1%) | 1,704 (15.1%) |
| Total | 6,662 (100.0%) | 11,280 (100.0%) |
Real Estate Taxes by Mortgage Status in Palatine
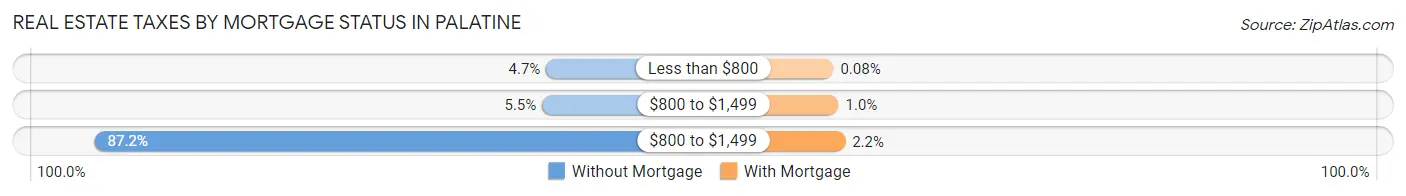
| Property Taxes | Without Mortgage | With Mortgage |
| Less than $800 | 315 (4.7%) | 9 (0.1%) |
| $800 to $1,499 | 365 (5.5%) | 115 (1.0%) |
| $800 to $1,499 | 5,810 (87.2%) | 250 (2.2%) |
| Total | 6,662 (100.0%) | 11,280 (100.0%) |
Health & Disability in Palatine
Health Insurance Coverage by Age in Palatine
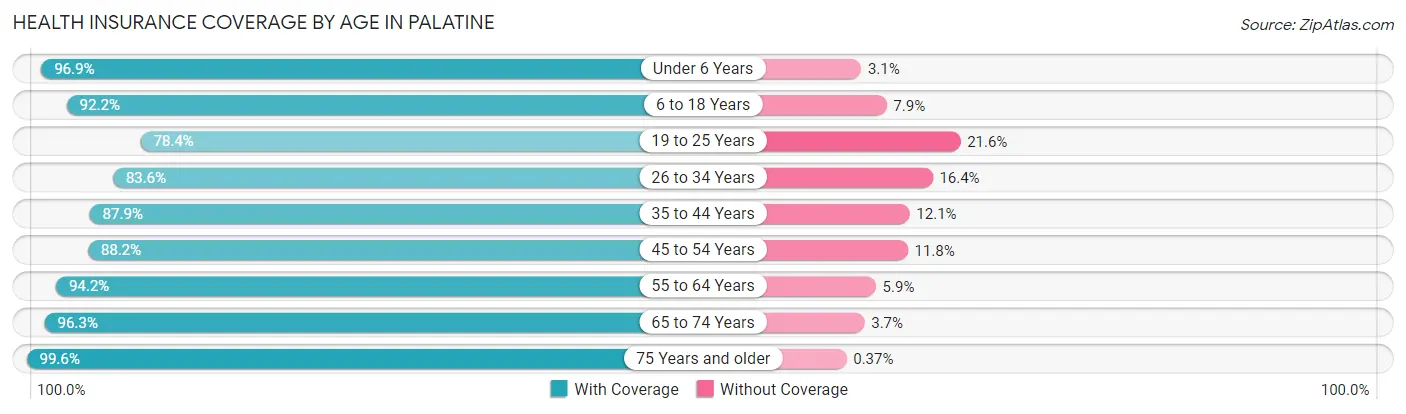
| Age Bracket | With Coverage | Without Coverage |
| Under 6 Years | 5,147 (96.9%) | 165 (3.1%) |
| 6 to 18 Years | 9,649 (92.1%) | 822 (7.9%) |
| 19 to 25 Years | 3,413 (78.4%) | 941 (21.6%) |
| 26 to 34 Years | 7,759 (83.6%) | 1,526 (16.4%) |
| 35 to 44 Years | 7,669 (87.9%) | 1,060 (12.1%) |
| 45 to 54 Years | 8,107 (88.2%) | 1,085 (11.8%) |
| 55 to 64 Years | 8,840 (94.2%) | 549 (5.9%) |
| 65 to 74 Years | 6,046 (96.3%) | 234 (3.7%) |
| 75 Years and older | 4,045 (99.6%) | 15 (0.4%) |
| Total | 60,675 (90.5%) | 6,397 (9.5%) |
Health Insurance Coverage by Citizenship Status in Palatine
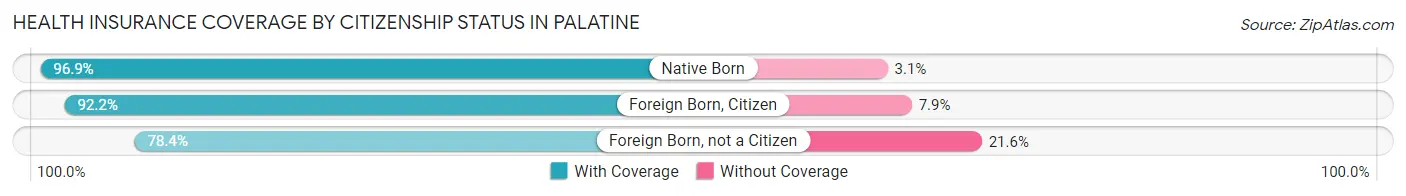
| Citizenship Status | With Coverage | Without Coverage |
| Native Born | 5,147 (96.9%) | 165 (3.1%) |
| Foreign Born, Citizen | 9,649 (92.1%) | 822 (7.9%) |
| Foreign Born, not a Citizen | 3,413 (78.4%) | 941 (21.6%) |
Health Insurance Coverage by Household Income in Palatine
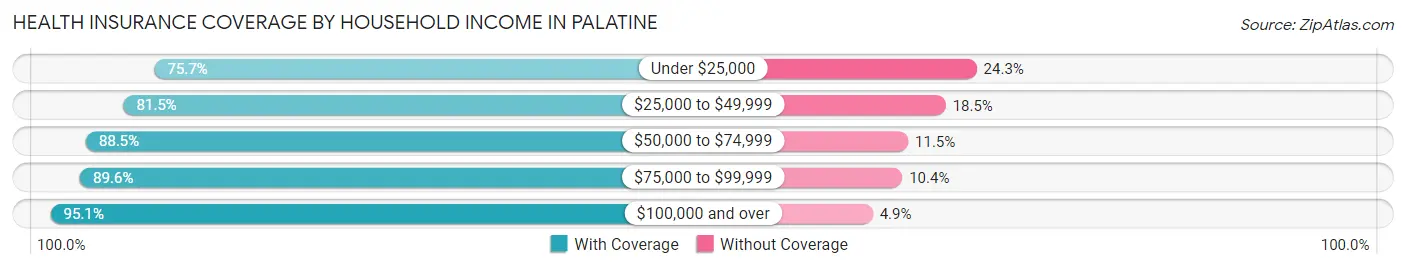
| Household Income | With Coverage | Without Coverage |
| Under $25,000 | 3,820 (75.7%) | 1,228 (24.3%) |
| $25,000 to $49,999 | 6,265 (81.5%) | 1,425 (18.5%) |
| $50,000 to $74,999 | 8,016 (88.5%) | 1,041 (11.5%) |
| $75,000 to $99,999 | 8,070 (89.6%) | 936 (10.4%) |
| $100,000 and over | 34,427 (95.1%) | 1,759 (4.9%) |
Public vs Private Health Insurance Coverage by Age in Palatine
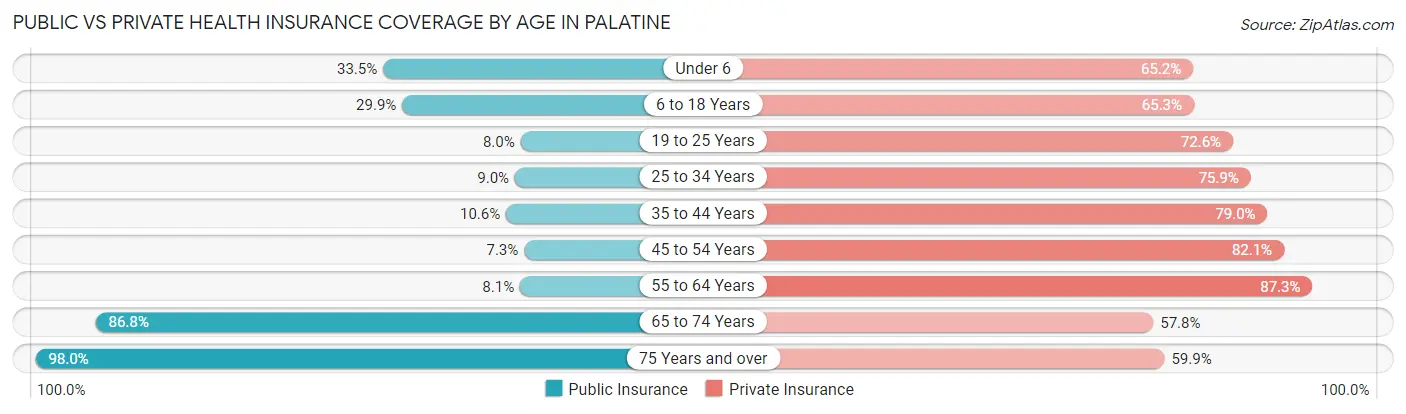
| Age Bracket | Public Insurance | Private Insurance |
| Under 6 | 1,778 (33.5%) | 3,463 (65.2%) |
| 6 to 18 Years | 3,133 (29.9%) | 6,842 (65.3%) |
| 19 to 25 Years | 346 (8.0%) | 3,161 (72.6%) |
| 25 to 34 Years | 834 (9.0%) | 7,046 (75.9%) |
| 35 to 44 Years | 928 (10.6%) | 6,896 (79.0%) |
| 45 to 54 Years | 669 (7.3%) | 7,543 (82.1%) |
| 55 to 64 Years | 756 (8.1%) | 8,200 (87.3%) |
| 65 to 74 Years | 5,452 (86.8%) | 3,631 (57.8%) |
| 75 Years and over | 3,978 (98.0%) | 2,432 (59.9%) |
| Total | 17,874 (26.7%) | 49,214 (73.4%) |
Disability Status by Sex by Age in Palatine
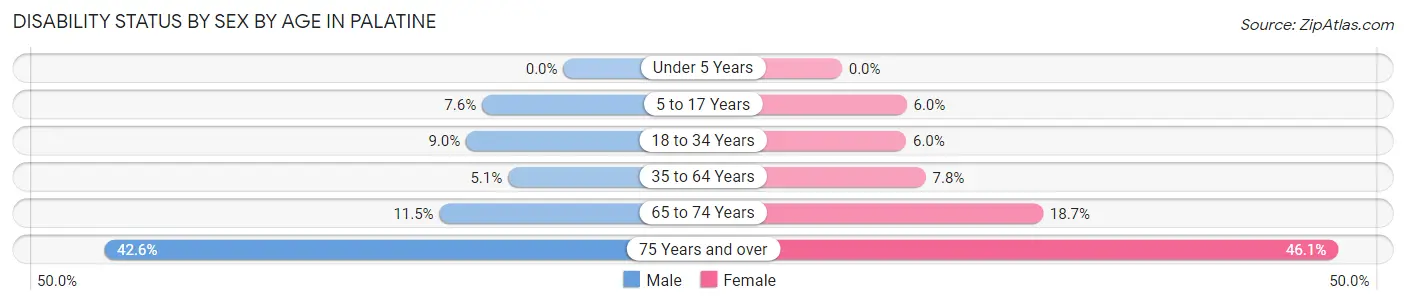
| Age Bracket | Male | Female |
| Under 5 Years | 0 (0.0%) | 0 (0.0%) |
| 5 to 17 Years | 351 (7.5%) | 365 (6.0%) |
| 18 to 34 Years | 673 (9.0%) | 411 (6.0%) |
| 35 to 64 Years | 704 (5.1%) | 1,057 (7.8%) |
| 65 to 74 Years | 319 (11.5%) | 654 (18.7%) |
| 75 Years and over | 765 (42.6%) | 1,043 (46.1%) |
Disability Class by Sex by Age in Palatine
Disability Class: Hearing Difficulty
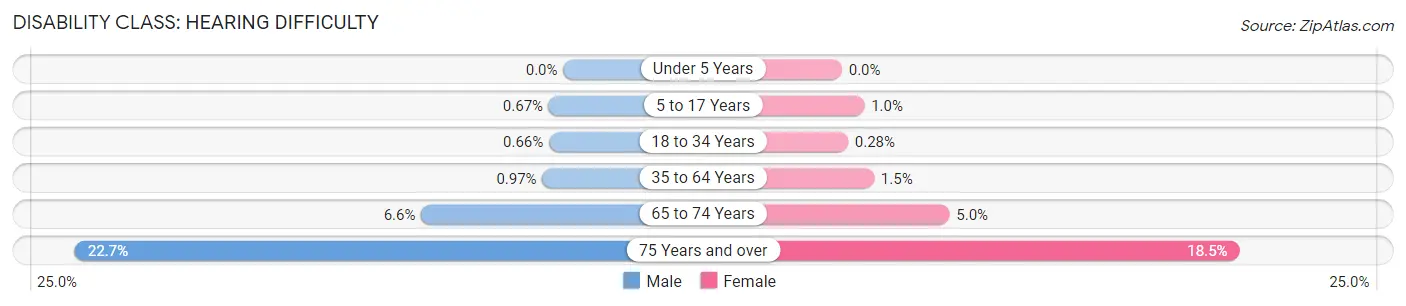
| Age Bracket | Male | Female |
| Under 5 Years | 0 (0.0%) | 0 (0.0%) |
| 5 to 17 Years | 31 (0.7%) | 63 (1.0%) |
| 18 to 34 Years | 49 (0.7%) | 19 (0.3%) |
| 35 to 64 Years | 133 (1.0%) | 202 (1.5%) |
| 65 to 74 Years | 183 (6.6%) | 175 (5.0%) |
| 75 Years and over | 407 (22.7%) | 418 (18.4%) |
Disability Class: Vision Difficulty
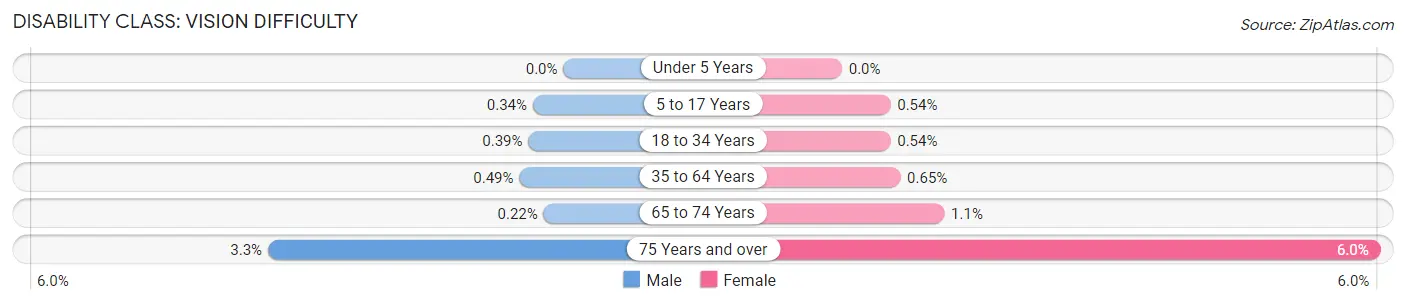
| Age Bracket | Male | Female |
| Under 5 Years | 0 (0.0%) | 0 (0.0%) |
| 5 to 17 Years | 16 (0.3%) | 33 (0.5%) |
| 18 to 34 Years | 29 (0.4%) | 37 (0.5%) |
| 35 to 64 Years | 67 (0.5%) | 88 (0.6%) |
| 65 to 74 Years | 6 (0.2%) | 40 (1.1%) |
| 75 Years and over | 59 (3.3%) | 136 (6.0%) |
Disability Class: Cognitive Difficulty
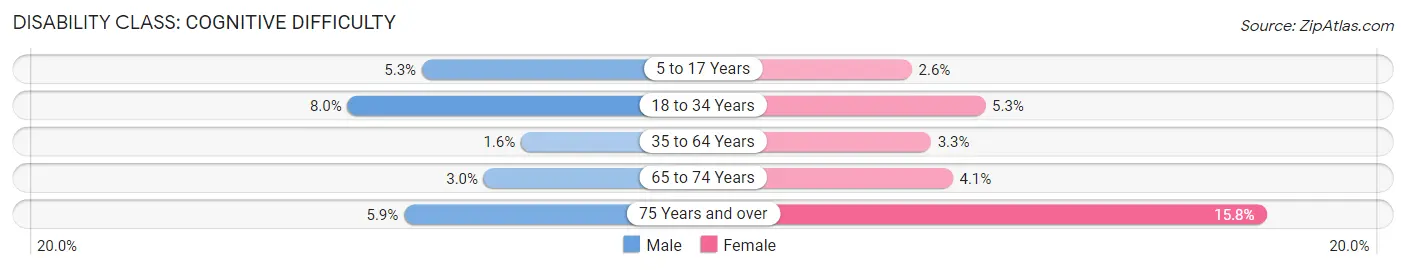
| Age Bracket | Male | Female |
| 5 to 17 Years | 244 (5.2%) | 157 (2.6%) |
| 18 to 34 Years | 597 (8.0%) | 367 (5.3%) |
| 35 to 64 Years | 215 (1.6%) | 448 (3.3%) |
| 65 to 74 Years | 82 (2.9%) | 144 (4.1%) |
| 75 Years and over | 106 (5.9%) | 357 (15.8%) |
Disability Class: Ambulatory Difficulty
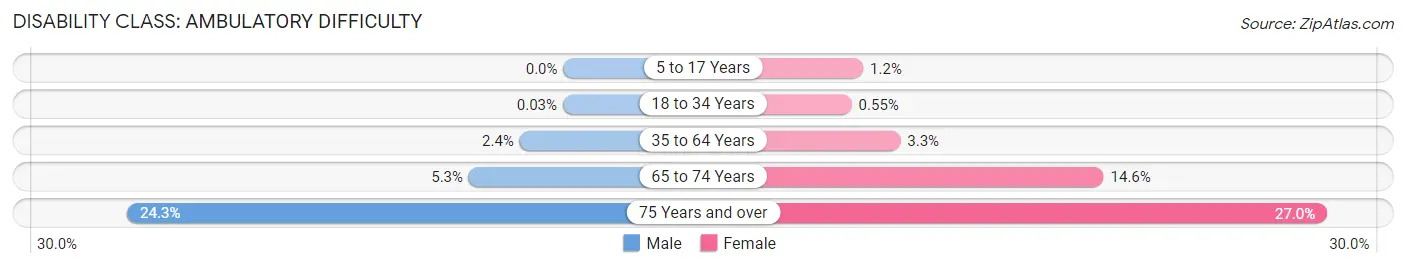
| Age Bracket | Male | Female |
| 5 to 17 Years | 0 (0.0%) | 72 (1.2%) |
| 18 to 34 Years | 2 (0.0%) | 38 (0.5%) |
| 35 to 64 Years | 334 (2.4%) | 443 (3.3%) |
| 65 to 74 Years | 146 (5.3%) | 511 (14.6%) |
| 75 Years and over | 436 (24.3%) | 612 (27.0%) |
Disability Class: Self-Care Difficulty
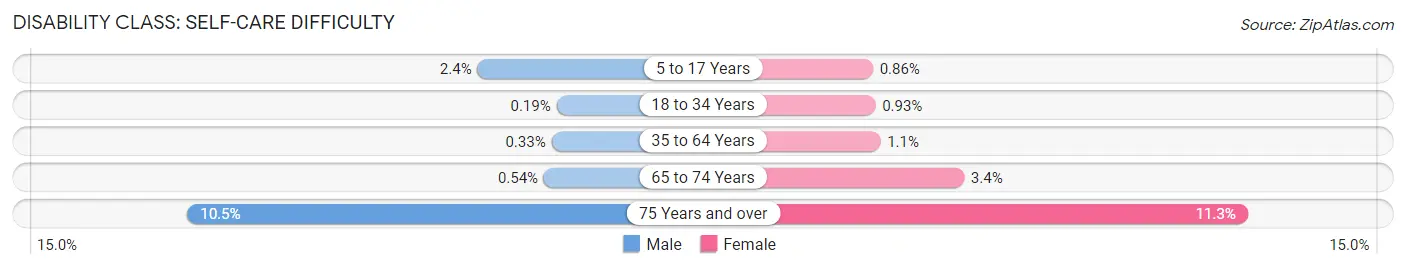
| Age Bracket | Male | Female |
| 5 to 17 Years | 111 (2.4%) | 52 (0.9%) |
| 18 to 34 Years | 14 (0.2%) | 64 (0.9%) |
| 35 to 64 Years | 45 (0.3%) | 146 (1.1%) |
| 65 to 74 Years | 15 (0.5%) | 119 (3.4%) |
| 75 Years and over | 188 (10.5%) | 256 (11.3%) |
Technology Access in Palatine
Computing Device Access in Palatine
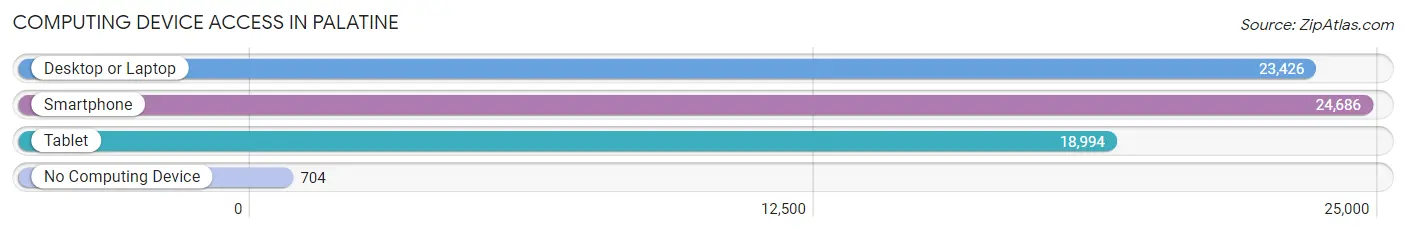
| Device Type | # Households | % Households |
| Desktop or Laptop | 23,426 | 88.1% |
| Smartphone | 24,686 | 92.9% |
| Tablet | 18,994 | 71.5% |
| No Computing Device | 704 | 2.6% |
| Total | 26,582 | 100.0% |
Internet Access in Palatine
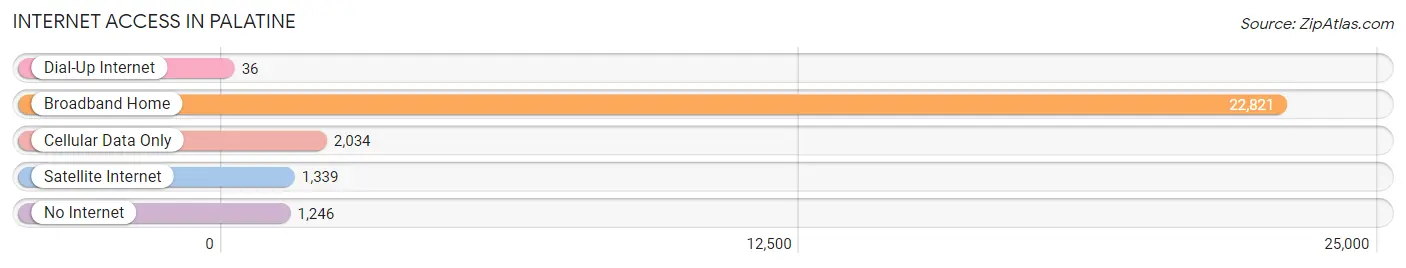
| Internet Type | # Households | % Households |
| Dial-Up Internet | 36 | 0.1% |
| Broadband Home | 22,821 | 85.9% |
| Cellular Data Only | 2,034 | 7.6% |
| Satellite Internet | 1,339 | 5.0% |
| No Internet | 1,246 | 4.7% |
| Total | 26,582 | 100.0% |
Palatine Summary
Palatine, Illinois is a village located in Cook County, approximately 30 miles northwest of Chicago. It is part of the Chicago metropolitan area and is a popular suburb for those who work in the city. The village has a population of 68,557 as of the 2019 census, making it the seventh-largest community in Cook County.
History
The area that is now Palatine was first settled in the early 19th century by German immigrants. The village was officially incorporated in 1866 and was named after the Palatinate region of Germany. The village grew slowly until the 1950s, when the population began to rapidly increase due to the post-World War II housing boom. The village experienced a period of rapid growth in the 1970s and 1980s, and the population has continued to grow since then.
Geography
Palatine is located in northeastern Illinois, approximately 30 miles northwest of Chicago. It is part of the Chicago metropolitan area and is bordered by Schaumburg to the north, Rolling Meadows to the east, Hoffman Estates to the south, and Inverness to the west. The village covers an area of 8.9 square miles and is located at an elevation of 690 feet.
The village is located in the Fox River Valley and is home to several parks and recreational areas, including Deer Grove Forest Preserve, Palatine Park District, and Palatine Hills Golf Course. The village is also home to several lakes, including Lake Cook, Lake Zurich, and Lake Arlington.
Economy
Palatine is home to a variety of businesses and industries, including manufacturing, retail, and healthcare. The village is home to several large employers, including Motorola Solutions, Zurich North America, and Medline Industries. The village is also home to several shopping centers, including the Palatine Town Square and the Deer Grove Shopping Center.
Demographics
As of the 2019 census, Palatine had a population of 68,557. The racial makeup of the village was 75.3% White, 8.2% Asian, 8.1% Hispanic or Latino, 5.2% African American, and 1.2% from other races. The median household income was $77,845 and the median family income was $90,945.
Palatine is served by several school districts, including Palatine-Schaumburg High School District 211, Palatine Elementary School District 15, and Community Consolidated School District 15. The village is also home to several higher education institutions, including Harper College and William Rainey Harper College.
Palatine is a vibrant and diverse community that offers a variety of amenities and attractions. The village is home to a variety of parks and recreational areas, as well as a variety of businesses and industries. The village is also home to several higher education institutions and is served by several school districts. Palatine is a great place to live, work, and play.
Common Questions
What is Per Capita Income in Palatine?
Per Capita income in Palatine is $49,351.
What is the Median Family Income in Palatine?
Median Family Income in Palatine is $120,549.
What is the Median Household income in Palatine?
Median Household Income in Palatine is $93,383.
What is Income or Wage Gap in Palatine?
Income or Wage Gap in Palatine is 30.5%.
Women in Palatine earn 69.5 cents for every dollar earned by a man.
What is Family Income Deficit in Palatine?
Family Income Deficit in Palatine is $10,898.
Families that are below poverty line in Palatine earn $10,898 less on average than the poverty threshold level.
What is Inequality or Gini Index in Palatine?
Inequality or Gini Index in Palatine is 0.43.
What is the Total Population of Palatine?
Total Population of Palatine is 67,223.
What is the Total Male Population of Palatine?
Total Male Population of Palatine is 32,763.
What is the Total Female Population of Palatine?
Total Female Population of Palatine is 34,460.
What is the Ratio of Males per 100 Females in Palatine?
There are 95.08 Males per 100 Females in Palatine.
What is the Ratio of Females per 100 Males in Palatine?
There are 105.18 Females per 100 Males in Palatine.
What is the Median Population Age in Palatine?
Median Population Age in Palatine is 39.4 Years.
What is the Average Family Size in Palatine
Average Family Size in Palatine is 3.1 People.
What is the Average Household Size in Palatine
Average Household Size in Palatine is 2.5 People.
How Large is the Labor Force in Palatine?
There are 38,905 People in the Labor Forcein in Palatine.
What is the Percentage of People in the Labor Force in Palatine?
72.5% of People are in the Labor Force in Palatine.
What is the Unemployment Rate in Palatine?
Unemployment Rate in Palatine is 4.7%.