Galveston, TX Map & Demographics
Galveston Map
Galveston Overview
$37,464
PER CAPITA INCOME
$83,331
AVG FAMILY INCOME
$57,453
AVG HOUSEHOLD INCOME
13.3%
WAGE / INCOME GAP [ % ]
86.7¢/ $1
WAGE / INCOME GAP [ $ ]
$11,207
FAMILY INCOME DEFICIT
0.51
INEQUALITY / GINI INDEX
53,265
TOTAL POPULATION
27,240
MALE POPULATION
26,025
FEMALE POPULATION
104.67
MALES / 100 FEMALES
95.54
FEMALES / 100 MALES
39.4
MEDIAN AGE
2.8
AVG FAMILY SIZE
2.1
AVG HOUSEHOLD SIZE
26,724
LABOR FORCE [ PEOPLE ]
58.0%
PERCENT IN LABOR FORCE
6.8%
UNEMPLOYMENT RATE
Galveston Area Codes
Income in Galveston
Income Overview in Galveston
Per Capita Income in Galveston is $37,464, while median incomes of families and households are $83,331 and $57,453 respectively.
| Characteristic | Number | Measure |
| Per Capita Income | 53,265 | $37,464 |
| Median Family Income | 12,611 | $83,331 |
| Mean Family Income | 12,611 | $110,266 |
| Median Household Income | 23,748 | $57,453 |
| Mean Household Income | 23,748 | $83,238 |
| Income Deficit | 12,611 | $11,207 |
| Wage / Income Gap (%) | 53,265 | 13.30% |
| Wage / Income Gap ($) | 53,265 | 86.70¢ per $1 |
| Gini / Inequality Index | 53,265 | 0.51 |
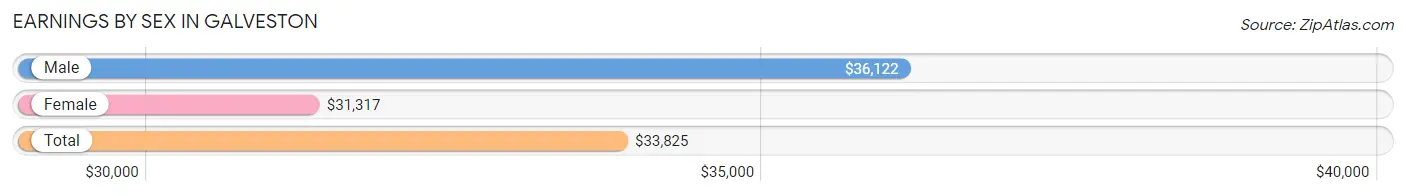
Earnings by Sex in Galveston
Average Earnings in Galveston are $33,825, $36,122 for men and $31,317 for women, a difference of 13.3%.
| Sex | Number | Average Earnings |
| Male | 15,225 (52.2%) | $36,122 |
| Female | 13,944 (47.8%) | $31,317 |
| Total | 29,169 (100.0%) | $33,825 |
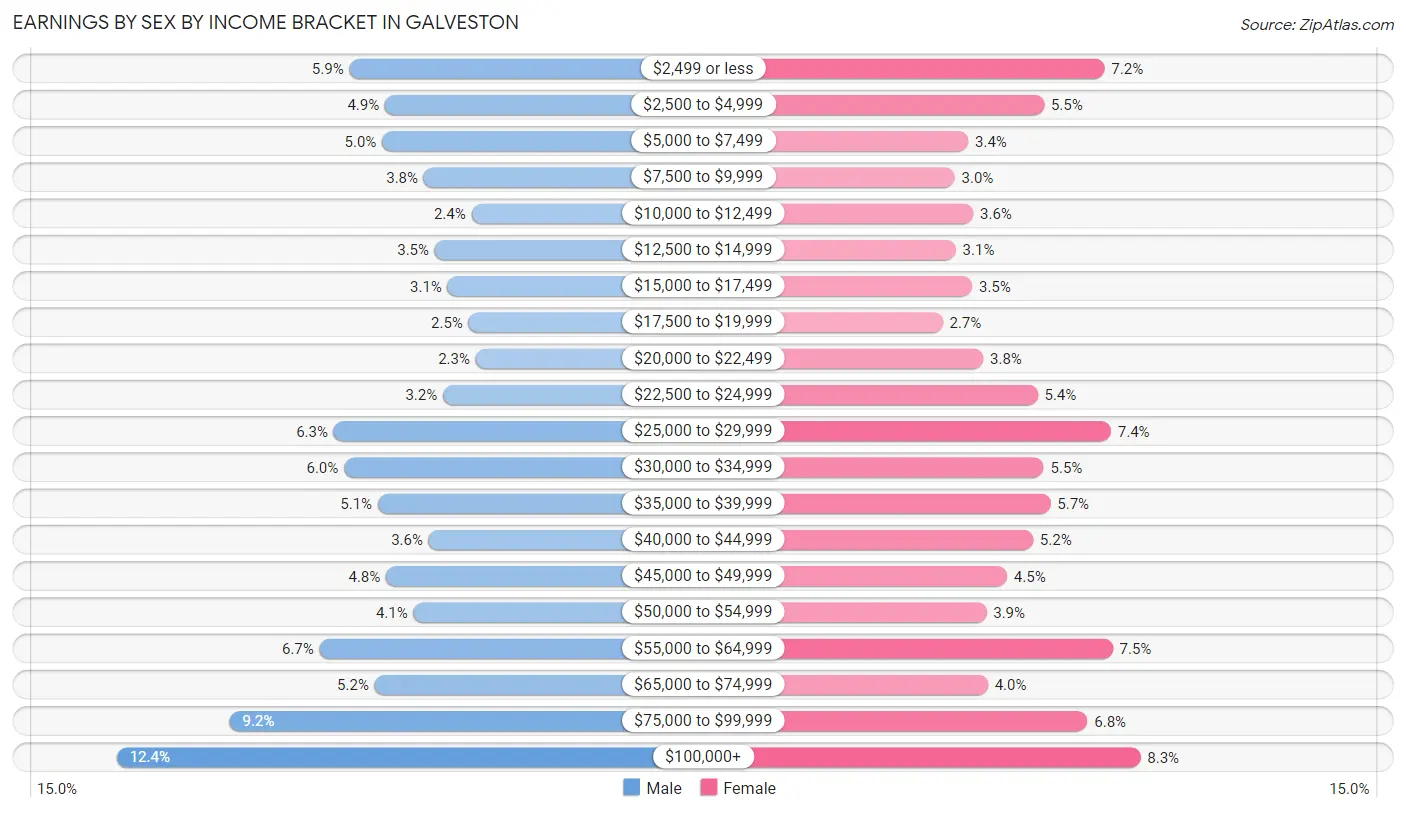
Earnings by Sex by Income Bracket in Galveston
The most common earnings brackets in Galveston are $100,000+ for men (1,889 | 12.4%) and $100,000+ for women (1,151 | 8.3%).
| Income | Male | Female |
| $2,499 or less | 894 (5.9%) | 1,010 (7.2%) |
| $2,500 to $4,999 | 741 (4.9%) | 773 (5.5%) |
| $5,000 to $7,499 | 753 (5.0%) | 476 (3.4%) |
| $7,500 to $9,999 | 575 (3.8%) | 422 (3.0%) |
| $10,000 to $12,499 | 371 (2.4%) | 495 (3.5%) |
| $12,500 to $14,999 | 528 (3.5%) | 427 (3.1%) |
| $15,000 to $17,499 | 473 (3.1%) | 491 (3.5%) |
| $17,500 to $19,999 | 383 (2.5%) | 375 (2.7%) |
| $20,000 to $22,499 | 353 (2.3%) | 534 (3.8%) |
| $22,500 to $24,999 | 493 (3.2%) | 748 (5.4%) |
| $25,000 to $29,999 | 960 (6.3%) | 1,035 (7.4%) |
| $30,000 to $34,999 | 917 (6.0%) | 771 (5.5%) |
| $35,000 to $39,999 | 772 (5.1%) | 798 (5.7%) |
| $40,000 to $44,999 | 554 (3.6%) | 729 (5.2%) |
| $45,000 to $49,999 | 737 (4.8%) | 627 (4.5%) |
| $50,000 to $54,999 | 619 (4.1%) | 546 (3.9%) |
| $55,000 to $64,999 | 1,021 (6.7%) | 1,041 (7.5%) |
| $65,000 to $74,999 | 785 (5.2%) | 552 (4.0%) |
| $75,000 to $99,999 | 1,407 (9.2%) | 943 (6.8%) |
| $100,000+ | 1,889 (12.4%) | 1,151 (8.3%) |
| Total | 15,225 (100.0%) | 13,944 (100.0%) |
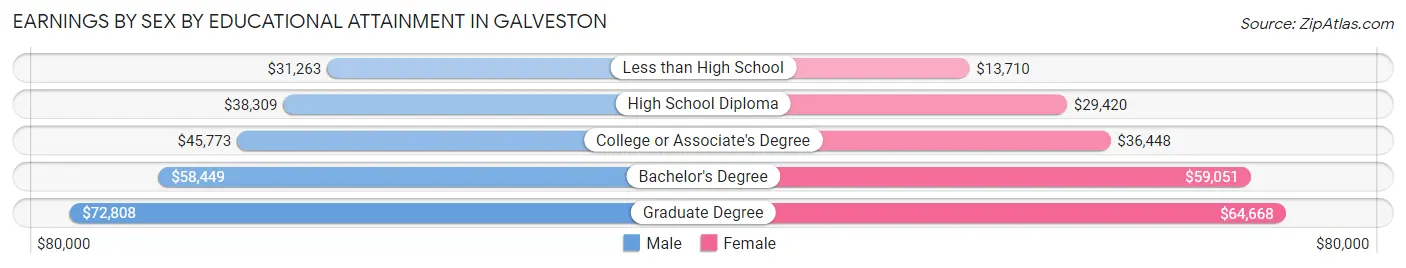
Earnings by Sex by Educational Attainment in Galveston
Average earnings in Galveston are $45,594 for men and $38,140 for women, a difference of 16.4%. Men with an educational attainment of graduate degree enjoy the highest average annual earnings of $72,808, while those with less than high school education earn the least with $31,263. Women with an educational attainment of graduate degree earn the most with the average annual earnings of $64,668, while those with less than high school education have the smallest earnings of $13,710.
| Educational Attainment | Male Income | Female Income |
| Less than High School | $31,263 | $13,710 |
| High School Diploma | $38,309 | $29,420 |
| College or Associate's Degree | $45,773 | $36,448 |
| Bachelor's Degree | $58,449 | $59,051 |
| Graduate Degree | $72,808 | $64,668 |
| Total | $45,594 | $38,140 |
Family Income in Galveston
Family Income Brackets in Galveston
According to the Galveston family income data, there are 2,257 families falling into the $100,000 to $149,999 income range, which is the most common income bracket and makes up 17.9% of all families. Conversely, the $10,000 to $14,999 income bracket is the least frequent group with only 328 families (2.6%) belonging to this category.
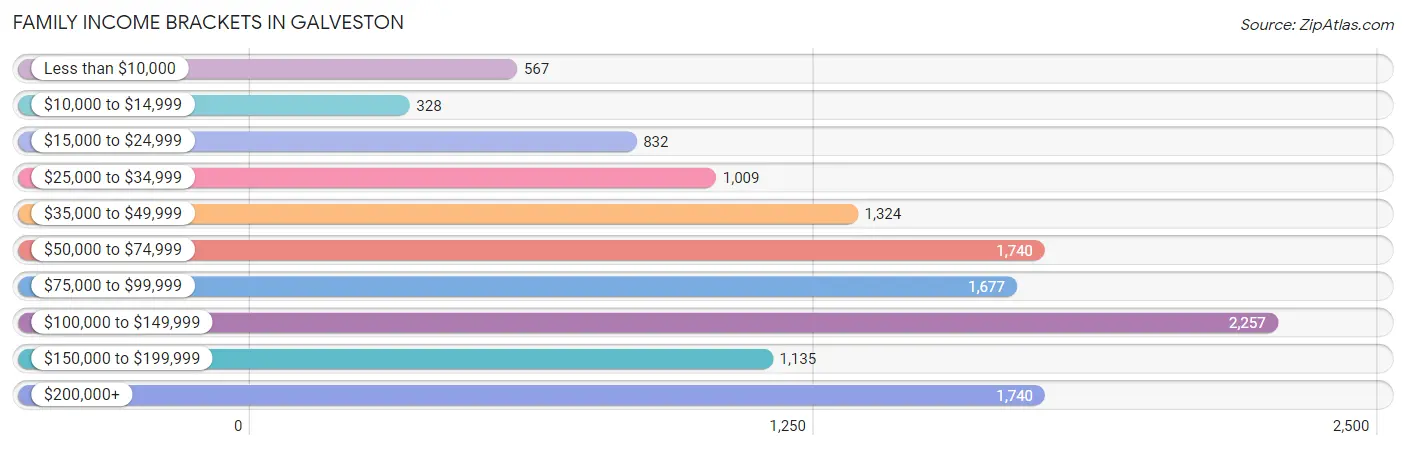
| Income Bracket | # Families | % Families |
| Less than $10,000 | 567 | 4.5% |
| $10,000 to $14,999 | 328 | 2.6% |
| $15,000 to $24,999 | 832 | 6.6% |
| $25,000 to $34,999 | 1,009 | 8.0% |
| $35,000 to $49,999 | 1,324 | 10.5% |
| $50,000 to $74,999 | 1,740 | 13.8% |
| $75,000 to $99,999 | 1,677 | 13.3% |
| $100,000 to $149,999 | 2,257 | 17.9% |
| $150,000 to $199,999 | 1,135 | 9.0% |
| $200,000+ | 1,740 | 13.8% |
Family Income by Famaliy Size in Galveston
3-person families (2,903 | 23.0%) account for the highest median family income in Galveston with $87,528 per family, while 2-person families (7,285 | 57.8%) have the highest median income of $42,040 per family member.
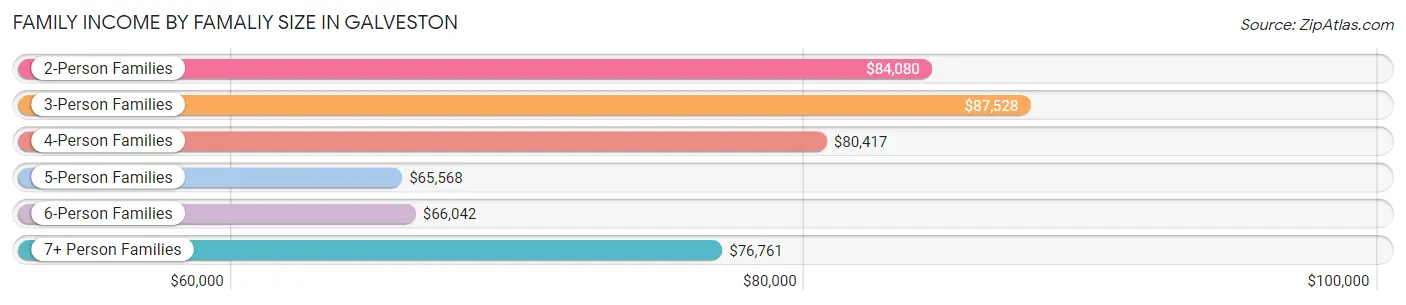
| Income Bracket | # Families | Median Income |
| 2-Person Families | 7,285 (57.8%) | $84,080 |
| 3-Person Families | 2,903 (23.0%) | $87,528 |
| 4-Person Families | 1,437 (11.4%) | $80,417 |
| 5-Person Families | 536 (4.3%) | $65,568 |
| 6-Person Families | 293 (2.3%) | $66,042 |
| 7+ Person Families | 157 (1.2%) | $76,761 |
| Total | 12,611 (100.0%) | $83,331 |
Family Income by Number of Earners in Galveston
The median family income in Galveston is $83,331, with families comprising 3+ earners (1,104) having the highest median family income of $112,259, while families with no earners (2,336) have the lowest median family income of $57,500, accounting for 8.7% and 18.5% of families, respectively.
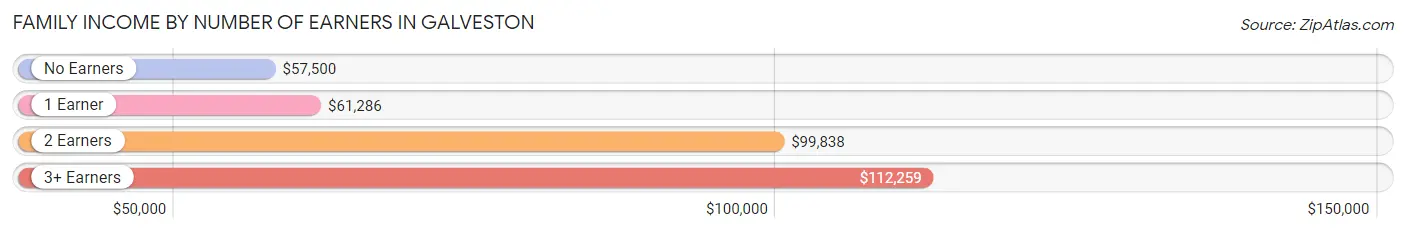
| Number of Earners | # Families | Median Income |
| No Earners | 2,336 (18.5%) | $57,500 |
| 1 Earner | 4,088 (32.4%) | $61,286 |
| 2 Earners | 5,083 (40.3%) | $99,838 |
| 3+ Earners | 1,104 (8.7%) | $112,259 |
| Total | 12,611 (100.0%) | $83,331 |
Household Income in Galveston
Household Income Brackets in Galveston
With 3,562 households falling in the category, the $50,000 to $74,999 income range is the most frequent in Galveston, accounting for 15.0% of all households. In contrast, only 1,306 households (5.5%) fall into the $10,000 to $14,999 income bracket, making it the least populous group.
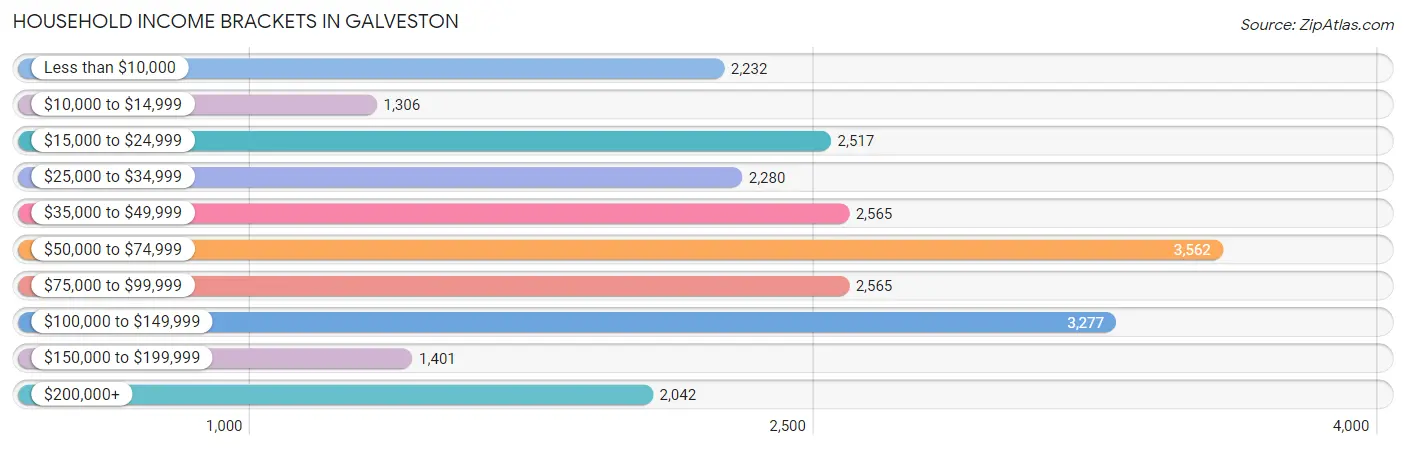
| Income Bracket | # Households | % Households |
| Less than $10,000 | 2,232 | 9.4% |
| $10,000 to $14,999 | 1,306 | 5.5% |
| $15,000 to $24,999 | 2,517 | 10.6% |
| $25,000 to $34,999 | 2,280 | 9.6% |
| $35,000 to $49,999 | 2,565 | 10.8% |
| $50,000 to $74,999 | 3,562 | 15.0% |
| $75,000 to $99,999 | 2,565 | 10.8% |
| $100,000 to $149,999 | 3,277 | 13.8% |
| $150,000 to $199,999 | 1,401 | 5.9% |
| $200,000+ | 2,042 | 8.6% |
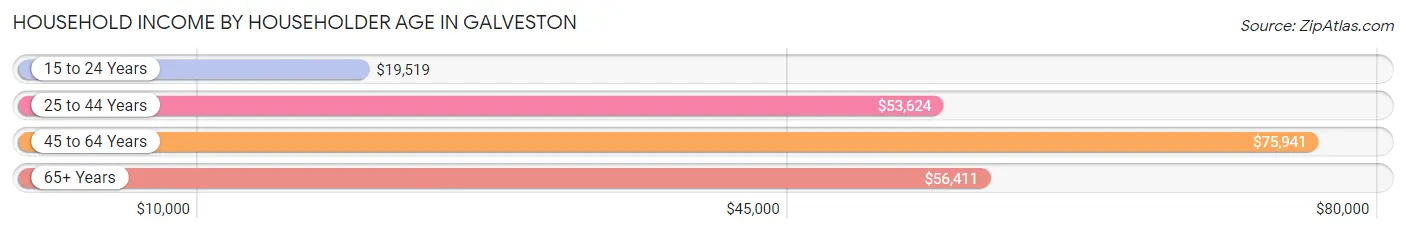
Household Income by Householder Age in Galveston
The median household income in Galveston is $57,453, with the highest median household income of $75,941 found in the 45 to 64 years age bracket for the primary householder. A total of 8,293 households (34.9%) fall into this category. Meanwhile, the 15 to 24 years age bracket for the primary householder has the lowest median household income of $19,519, with 1,643 households (6.9%) in this group.
| Income Bracket | # Households | Median Income |
| 15 to 24 Years | 1,643 (6.9%) | $19,519 |
| 25 to 44 Years | 6,830 (28.8%) | $53,624 |
| 45 to 64 Years | 8,293 (34.9%) | $75,941 |
| 65+ Years | 6,982 (29.4%) | $56,411 |
| Total | 23,748 (100.0%) | $57,453 |
Poverty in Galveston
Income Below Poverty by Sex and Age in Galveston
With 18.9% poverty level for males and 19.6% for females among the residents of Galveston, 12 to 14 year old males and 18 to 24 year old females are the most vulnerable to poverty, with 218 males (35.5%) and 1,273 females (43.6%) in their respective age groups living below the poverty level.
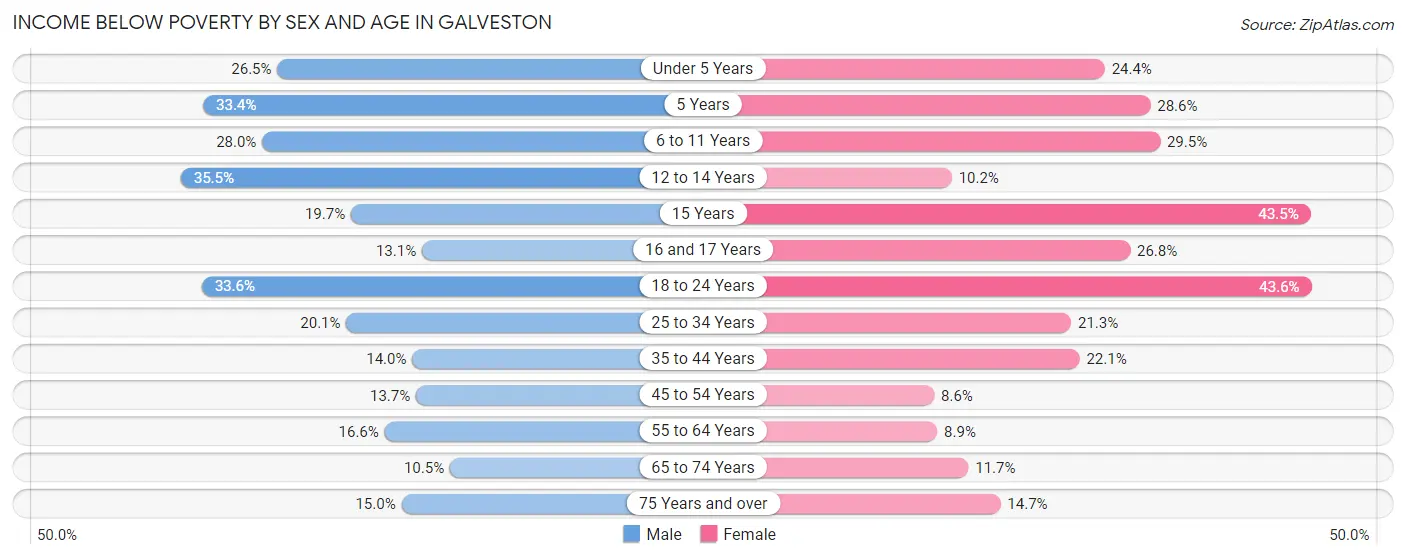
| Age Bracket | Male | Female |
| Under 5 Years | 310 (26.5%) | 275 (24.4%) |
| 5 Years | 118 (33.4%) | 65 (28.6%) |
| 6 to 11 Years | 343 (28.0%) | 411 (29.5%) |
| 12 to 14 Years | 218 (35.5%) | 72 (10.2%) |
| 15 Years | 27 (19.7%) | 77 (43.5%) |
| 16 and 17 Years | 87 (13.1%) | 103 (26.8%) |
| 18 to 24 Years | 778 (33.6%) | 1,273 (43.6%) |
| 25 to 34 Years | 798 (20.1%) | 879 (21.3%) |
| 35 to 44 Years | 349 (14.0%) | 555 (22.1%) |
| 45 to 54 Years | 371 (13.7%) | 243 (8.6%) |
| 55 to 64 Years | 623 (16.6%) | 334 (8.8%) |
| 65 to 74 Years | 357 (10.5%) | 369 (11.7%) |
| 75 Years and over | 243 (15.0%) | 282 (14.7%) |
| Total | 4,622 (18.9%) | 4,938 (19.6%) |
Income Above Poverty by Sex and Age in Galveston
According to the poverty statistics in Galveston, males aged 65 to 74 years and females aged 45 to 54 years are the age groups that are most secure financially, with 89.5% of males and 91.4% of females in these age groups living above the poverty line.
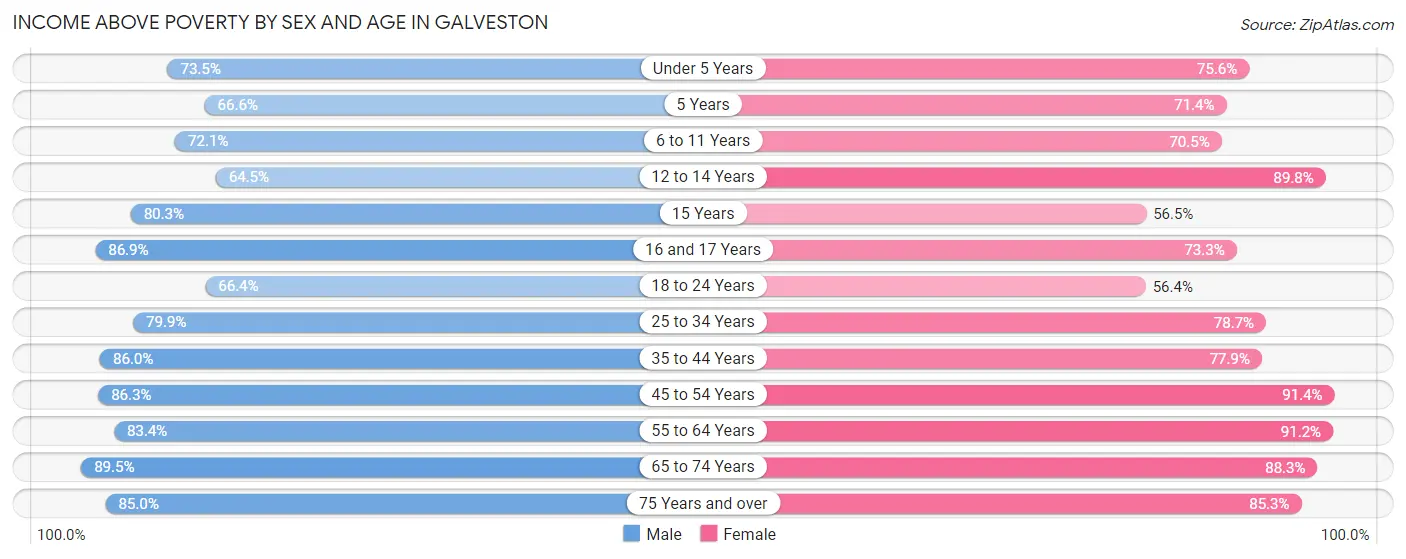
| Age Bracket | Male | Female |
| Under 5 Years | 858 (73.5%) | 852 (75.6%) |
| 5 Years | 235 (66.6%) | 162 (71.4%) |
| 6 to 11 Years | 884 (72.1%) | 981 (70.5%) |
| 12 to 14 Years | 396 (64.5%) | 634 (89.8%) |
| 15 Years | 110 (80.3%) | 100 (56.5%) |
| 16 and 17 Years | 576 (86.9%) | 282 (73.3%) |
| 18 to 24 Years | 1,540 (66.4%) | 1,648 (56.4%) |
| 25 to 34 Years | 3,165 (79.9%) | 3,252 (78.7%) |
| 35 to 44 Years | 2,141 (86.0%) | 1,961 (77.9%) |
| 45 to 54 Years | 2,343 (86.3%) | 2,592 (91.4%) |
| 55 to 64 Years | 3,132 (83.4%) | 3,441 (91.1%) |
| 65 to 74 Years | 3,036 (89.5%) | 2,775 (88.3%) |
| 75 Years and over | 1,375 (85.0%) | 1,634 (85.3%) |
| Total | 19,791 (81.1%) | 20,314 (80.4%) |
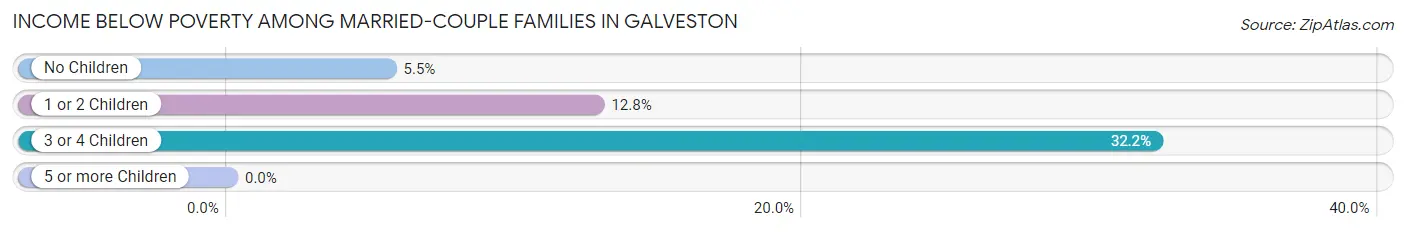
Income Below Poverty Among Married-Couple Families in Galveston
The poverty statistics for married-couple families in Galveston show that 8.5% or 706 of the total 8,286 families live below the poverty line. Families with 3 or 4 children have the highest poverty rate of 32.2%, comprising of 142 families. On the other hand, families with 5 or more children have the lowest poverty rate of 0.0%, which includes 0 families.
| Children | Above Poverty | Below Poverty |
| No Children | 5,646 (94.5%) | 330 (5.5%) |
| 1 or 2 Children | 1,600 (87.2%) | 234 (12.8%) |
| 3 or 4 Children | 299 (67.8%) | 142 (32.2%) |
| 5 or more Children | 35 (100.0%) | 0 (0.0%) |
| Total | 7,580 (91.5%) | 706 (8.5%) |
Income Below Poverty Among Single-Parent Households in Galveston
According to the poverty data in Galveston, 14.4% or 159 single-father households and 22.2% or 714 single-mother households are living below the poverty line. Among single-father households, those with 1 or 2 children have the highest poverty rate, with 133 households (29.6%) experiencing poverty. Likewise, among single-mother households, those with 3 or 4 children have the highest poverty rate, with 115 households (53.0%) falling below the poverty line.
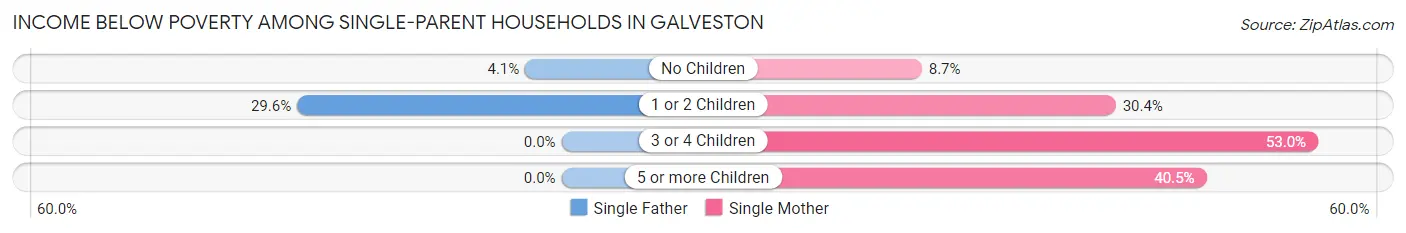
| Children | Single Father | Single Mother |
| No Children | 26 (4.1%) | 128 (8.7%) |
| 1 or 2 Children | 133 (29.6%) | 456 (30.4%) |
| 3 or 4 Children | 0 (0.0%) | 115 (53.0%) |
| 5 or more Children | 0 (0.0%) | 15 (40.5%) |
| Total | 159 (14.4%) | 714 (22.2%) |
Income Below Poverty Among Married-Couple vs Single-Parent Households in Galveston
The poverty data for Galveston shows that 706 of the married-couple family households (8.5%) and 873 of the single-parent households (20.2%) are living below the poverty level. Within the married-couple family households, those with 3 or 4 children have the highest poverty rate, with 142 households (32.2%) falling below the poverty line. Among the single-parent households, those with 3 or 4 children have the highest poverty rate, with 115 household (49.8%) living below poverty.
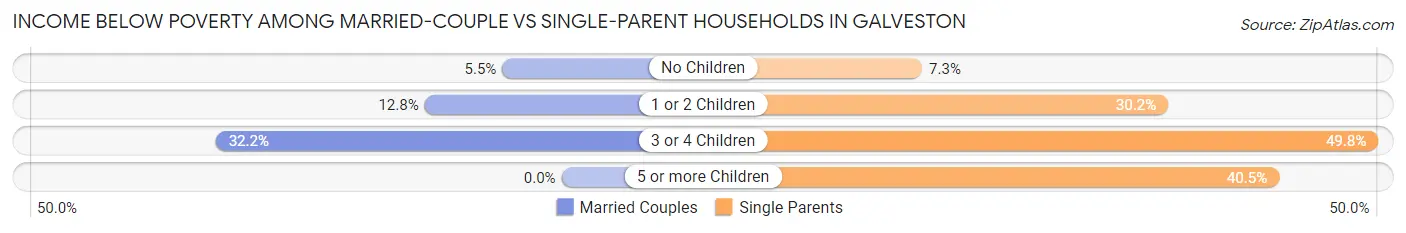
| Children | Married-Couple Families | Single-Parent Households |
| No Children | 330 (5.5%) | 154 (7.3%) |
| 1 or 2 Children | 234 (12.8%) | 589 (30.2%) |
| 3 or 4 Children | 142 (32.2%) | 115 (49.8%) |
| 5 or more Children | 0 (0.0%) | 15 (40.5%) |
| Total | 706 (8.5%) | 873 (20.2%) |
Race in Galveston
The most populous races in Galveston are White / Caucasian (34,513 | 64.8%), Hispanic or Latino (15,810 | 29.7%), and Black / African American (8,427 | 15.8%).
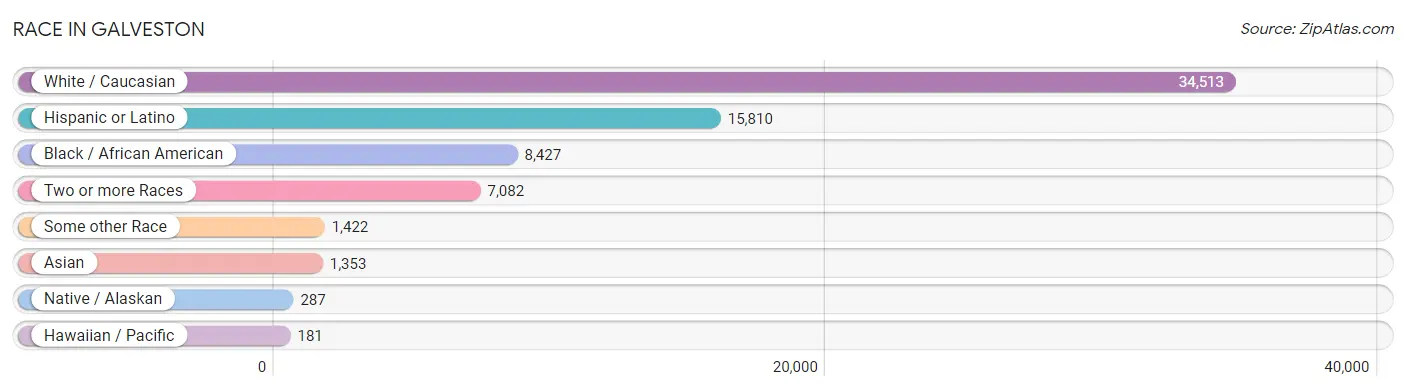
| Race | # Population | % Population |
| Asian | 1,353 | 2.5% |
| Black / African American | 8,427 | 15.8% |
| Hawaiian / Pacific | 181 | 0.3% |
| Hispanic or Latino | 15,810 | 29.7% |
| Native / Alaskan | 287 | 0.5% |
| White / Caucasian | 34,513 | 64.8% |
| Two or more Races | 7,082 | 13.3% |
| Some other Race | 1,422 | 2.7% |
| Total | 53,265 | 100.0% |
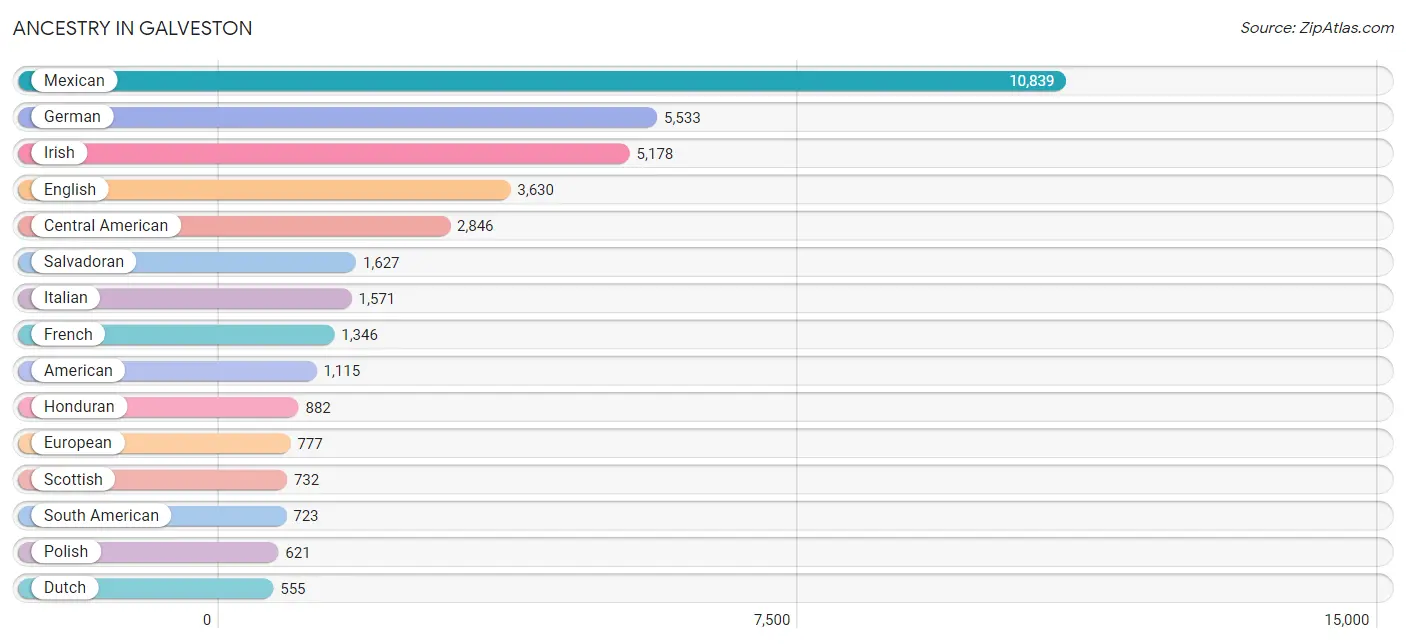
Ancestry in Galveston
The most populous ancestries reported in Galveston are Mexican (10,839 | 20.3%), German (5,533 | 10.4%), Irish (5,178 | 9.7%), English (3,630 | 6.8%), and Central American (2,846 | 5.3%), together accounting for 52.6% of all Galveston residents.
| Ancestry | # Population | % Population |
| African | 303 | 0.6% |
| Alsatian | 10 | 0.0% |
| American | 1,115 | 2.1% |
| Apache | 66 | 0.1% |
| Arab | 346 | 0.6% |
| Armenian | 4 | 0.0% |
| Australian | 6 | 0.0% |
| Austrian | 70 | 0.1% |
| Bangladeshi | 20 | 0.0% |
| Belgian | 13 | 0.0% |
| Belizean | 7 | 0.0% |
| Bhutanese | 33 | 0.1% |
| Blackfeet | 11 | 0.0% |
| Brazilian | 8 | 0.0% |
| British | 441 | 0.8% |
| British West Indian | 20 | 0.0% |
| Bulgarian | 11 | 0.0% |
| Burmese | 72 | 0.1% |
| Cajun | 85 | 0.2% |
| Canadian | 103 | 0.2% |
| Central American | 2,846 | 5.3% |
| Central American Indian | 129 | 0.2% |
| Cherokee | 100 | 0.2% |
| Chickasaw | 13 | 0.0% |
| Chilean | 3 | 0.0% |
| Choctaw | 35 | 0.1% |
| Colombian | 485 | 0.9% |
| Comanche | 4 | 0.0% |
| Creek | 6 | 0.0% |
| Croatian | 52 | 0.1% |
| Cuban | 165 | 0.3% |
| Cypriot | 4 | 0.0% |
| Czech | 430 | 0.8% |
| Czechoslovakian | 83 | 0.2% |
| Danish | 239 | 0.4% |
| Delaware | 50 | 0.1% |
| Dominican | 14 | 0.0% |
| Dutch | 555 | 1.0% |
| Eastern European | 118 | 0.2% |
| Ecuadorian | 45 | 0.1% |
| Egyptian | 51 | 0.1% |
| English | 3,630 | 6.8% |
| European | 777 | 1.5% |
| Filipino | 29 | 0.1% |
| Finnish | 72 | 0.1% |
| French | 1,346 | 2.5% |
| French Canadian | 153 | 0.3% |
| German | 5,533 | 10.4% |
| Ghanaian | 94 | 0.2% |
| Greek | 195 | 0.4% |
| Guamanian / Chamorro | 67 | 0.1% |
| Guatemalan | 306 | 0.6% |
| Honduran | 882 | 1.7% |
| Hungarian | 113 | 0.2% |
| Icelander | 24 | 0.1% |
| Indian (Asian) | 316 | 0.6% |
| Iranian | 161 | 0.3% |
| Irish | 5,178 | 9.7% |
| Israeli | 10 | 0.0% |
| Italian | 1,571 | 2.9% |
| Jamaican | 79 | 0.2% |
| Jordanian | 25 | 0.1% |
| Korean | 256 | 0.5% |
| Latvian | 7 | 0.0% |
| Lebanese | 64 | 0.1% |
| Lithuanian | 74 | 0.1% |
| Maltese | 8 | 0.0% |
| Mexican | 10,839 | 20.3% |
| Mexican American Indian | 26 | 0.1% |
| Moroccan | 22 | 0.0% |
| Native Hawaiian | 18 | 0.0% |
| New Zealander | 10 | 0.0% |
| Nigerian | 23 | 0.0% |
| Northern European | 49 | 0.1% |
| Norwegian | 408 | 0.8% |
| Ottawa | 7 | 0.0% |
| Paiute | 4 | 0.0% |
| Pakistani | 70 | 0.1% |
| Palestinian | 97 | 0.2% |
| Panamanian | 31 | 0.1% |
| Pennsylvania German | 73 | 0.1% |
| Peruvian | 146 | 0.3% |
| Pima | 19 | 0.0% |
| Polish | 621 | 1.2% |
| Portuguese | 65 | 0.1% |
| Pueblo | 24 | 0.1% |
| Puerto Rican | 472 | 0.9% |
| Romanian | 96 | 0.2% |
| Russian | 166 | 0.3% |
| Salvadoran | 1,627 | 3.0% |
| Samoan | 11 | 0.0% |
| Scandinavian | 167 | 0.3% |
| Scotch-Irish | 423 | 0.8% |
| Scottish | 732 | 1.4% |
| Seminole | 21 | 0.0% |
| Serbian | 30 | 0.1% |
| Sioux | 2 | 0.0% |
| Slovak | 13 | 0.0% |
| Slovene | 7 | 0.0% |
| South American | 723 | 1.4% |
| Spaniard | 127 | 0.2% |
| Spanish | 198 | 0.4% |
| Spanish American | 26 | 0.1% |
| Sri Lankan | 186 | 0.4% |
| Subsaharan African | 470 | 0.9% |
| Swedish | 377 | 0.7% |
| Swiss | 124 | 0.2% |
| Thai | 451 | 0.9% |
| Trinidadian and Tobagonian | 67 | 0.1% |
| Turkish | 56 | 0.1% |
| U.S. Virgin Islander | 7 | 0.0% |
| Ukrainian | 83 | 0.2% |
| Uruguayan | 9 | 0.0% |
| Venezuelan | 35 | 0.1% |
| Welsh | 331 | 0.6% |
| West Indian | 24 | 0.1% |
| Yaqui | 53 | 0.1% |
| Yugoslavian | 16 | 0.0% | View All 118 Rows |
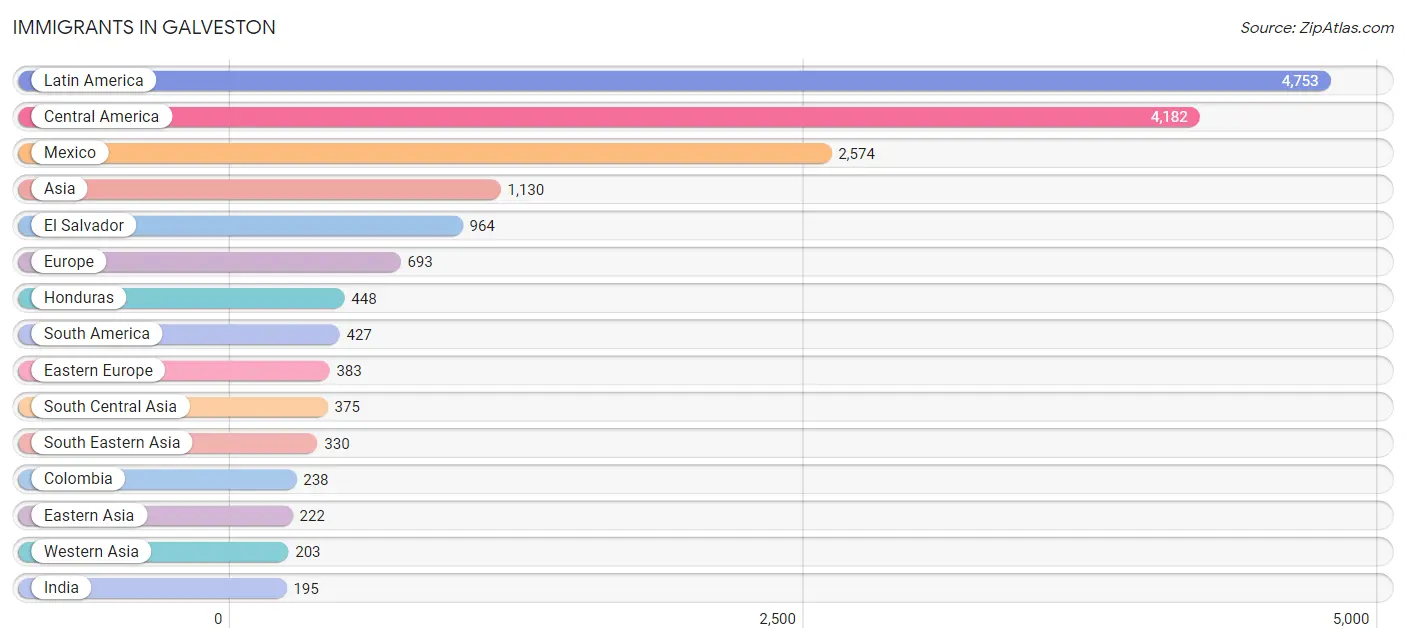
Immigrants in Galveston
The most numerous immigrant groups reported in Galveston came from Latin America (4,753 | 8.9%), Central America (4,182 | 7.9%), Mexico (2,574 | 4.8%), Asia (1,130 | 2.1%), and El Salvador (964 | 1.8%), together accounting for 25.5% of all Galveston residents.
| Immigration Origin | # Population | % Population |
| Africa | 141 | 0.3% |
| Asia | 1,130 | 2.1% |
| Australia | 19 | 0.0% |
| Austria | 7 | 0.0% |
| Bangladesh | 10 | 0.0% |
| Brazil | 23 | 0.0% |
| Bulgaria | 29 | 0.1% |
| Canada | 192 | 0.4% |
| Caribbean | 144 | 0.3% |
| Central America | 4,182 | 7.9% |
| China | 138 | 0.3% |
| Colombia | 238 | 0.4% |
| Croatia | 8 | 0.0% |
| Cuba | 38 | 0.1% |
| Eastern Asia | 222 | 0.4% |
| Eastern Europe | 383 | 0.7% |
| Ecuador | 14 | 0.0% |
| Egypt | 45 | 0.1% |
| El Salvador | 964 | 1.8% |
| England | 39 | 0.1% |
| Europe | 693 | 1.3% |
| France | 13 | 0.0% |
| Germany | 54 | 0.1% |
| Ghana | 10 | 0.0% |
| Greece | 95 | 0.2% |
| Guatemala | 189 | 0.4% |
| Honduras | 448 | 0.8% |
| Hungary | 28 | 0.1% |
| India | 195 | 0.4% |
| Indonesia | 37 | 0.1% |
| Iran | 138 | 0.3% |
| Iraq | 6 | 0.0% |
| Israel | 30 | 0.1% |
| Italy | 19 | 0.0% |
| Jamaica | 24 | 0.1% |
| Japan | 10 | 0.0% |
| Jordan | 38 | 0.1% |
| Korea | 74 | 0.1% |
| Kuwait | 19 | 0.0% |
| Latin America | 4,753 | 8.9% |
| Lebanon | 9 | 0.0% |
| Malaysia | 52 | 0.1% |
| Mexico | 2,574 | 4.8% |
| Micronesia | 14 | 0.0% |
| Moldova | 108 | 0.2% |
| Morocco | 22 | 0.0% |
| Nepal | 31 | 0.1% |
| Netherlands | 18 | 0.0% |
| Nigeria | 23 | 0.0% |
| Northern Africa | 95 | 0.2% |
| Northern Europe | 92 | 0.2% |
| Oceania | 43 | 0.1% |
| Panama | 7 | 0.0% |
| Peru | 117 | 0.2% |
| Philippines | 144 | 0.3% |
| Poland | 37 | 0.1% |
| Romania | 21 | 0.0% |
| Russia | 72 | 0.1% |
| Saudi Arabia | 35 | 0.1% |
| Scotland | 13 | 0.0% |
| Senegal | 7 | 0.0% |
| South America | 427 | 0.8% |
| South Central Asia | 375 | 0.7% |
| South Eastern Asia | 330 | 0.6% |
| Southern Europe | 126 | 0.2% |
| Spain | 12 | 0.0% |
| Sri Lanka | 1 | 0.0% |
| Sweden | 11 | 0.0% |
| Syria | 4 | 0.0% |
| Taiwan | 6 | 0.0% |
| Thailand | 62 | 0.1% |
| Trinidad and Tobago | 82 | 0.2% |
| Turkey | 30 | 0.1% |
| Ukraine | 80 | 0.2% |
| Uruguay | 9 | 0.0% |
| Venezuela | 26 | 0.1% |
| Vietnam | 35 | 0.1% |
| Western Africa | 40 | 0.1% |
| Western Asia | 203 | 0.4% |
| Western Europe | 92 | 0.2% | View All 80 Rows |
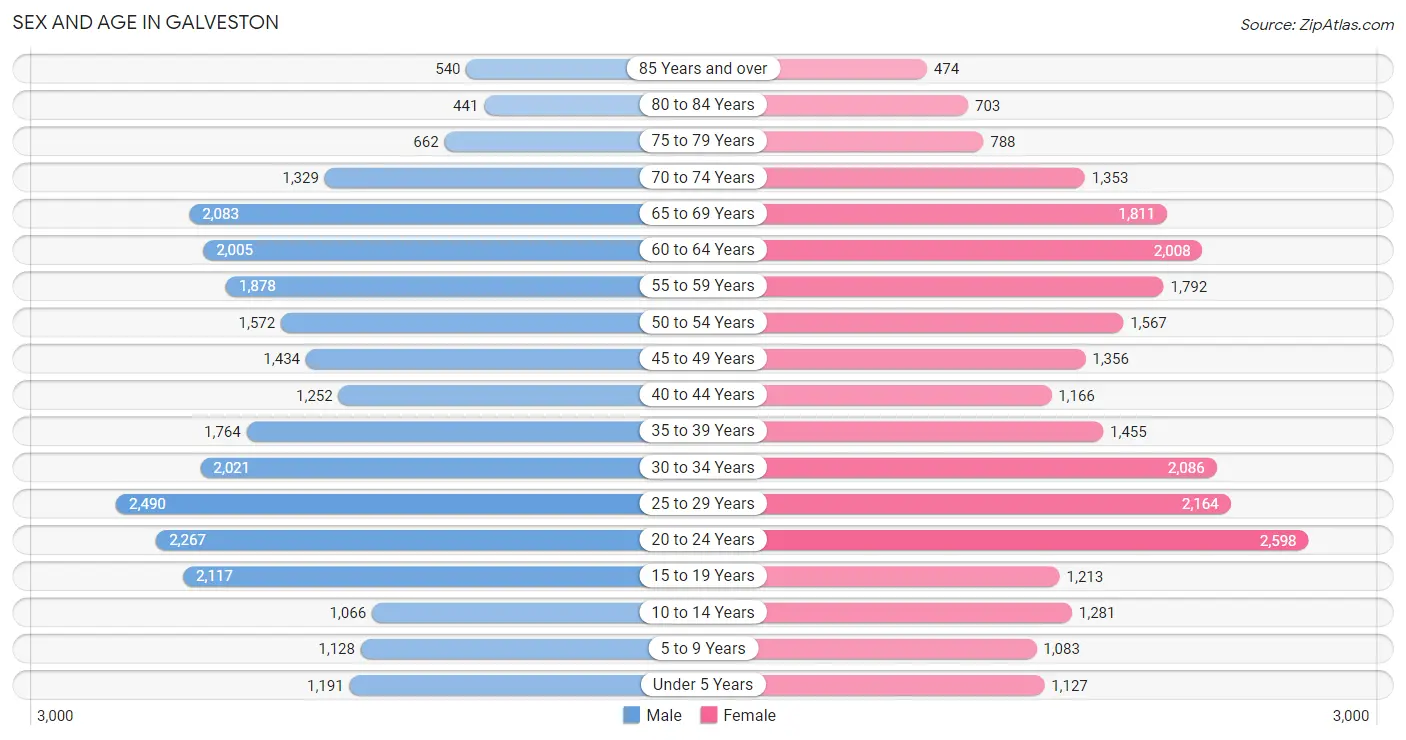
Sex and Age in Galveston
Sex and Age in Galveston
The most populous age groups in Galveston are 25 to 29 Years (2,490 | 9.1%) for men and 20 to 24 Years (2,598 | 10.0%) for women.
| Age Bracket | Male | Female |
| Under 5 Years | 1,191 (4.4%) | 1,127 (4.3%) |
| 5 to 9 Years | 1,128 (4.1%) | 1,083 (4.2%) |
| 10 to 14 Years | 1,066 (3.9%) | 1,281 (4.9%) |
| 15 to 19 Years | 2,117 (7.8%) | 1,213 (4.7%) |
| 20 to 24 Years | 2,267 (8.3%) | 2,598 (10.0%) |
| 25 to 29 Years | 2,490 (9.1%) | 2,164 (8.3%) |
| 30 to 34 Years | 2,021 (7.4%) | 2,086 (8.0%) |
| 35 to 39 Years | 1,764 (6.5%) | 1,455 (5.6%) |
| 40 to 44 Years | 1,252 (4.6%) | 1,166 (4.5%) |
| 45 to 49 Years | 1,434 (5.3%) | 1,356 (5.2%) |
| 50 to 54 Years | 1,572 (5.8%) | 1,567 (6.0%) |
| 55 to 59 Years | 1,878 (6.9%) | 1,792 (6.9%) |
| 60 to 64 Years | 2,005 (7.4%) | 2,008 (7.7%) |
| 65 to 69 Years | 2,083 (7.6%) | 1,811 (7.0%) |
| 70 to 74 Years | 1,329 (4.9%) | 1,353 (5.2%) |
| 75 to 79 Years | 662 (2.4%) | 788 (3.0%) |
| 80 to 84 Years | 441 (1.6%) | 703 (2.7%) |
| 85 Years and over | 540 (2.0%) | 474 (1.8%) |
| Total | 27,240 (100.0%) | 26,025 (100.0%) |
Families and Households in Galveston
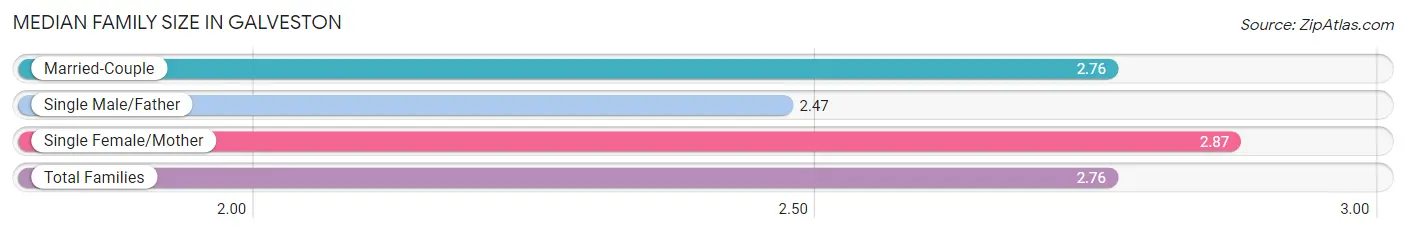
Median Family Size in Galveston
The median family size in Galveston is 2.76 persons per family, with single female/mother families (3,220 | 25.5%) accounting for the largest median family size of 2.87 persons per family. On the other hand, single male/father families (1,105 | 8.8%) represent the smallest median family size with 2.47 persons per family.
| Family Type | # Families | Family Size |
| Married-Couple | 8,286 (65.7%) | 2.76 |
| Single Male/Father | 1,105 (8.8%) | 2.47 |
| Single Female/Mother | 3,220 (25.5%) | 2.87 |
| Total Families | 12,611 (100.0%) | 2.76 |
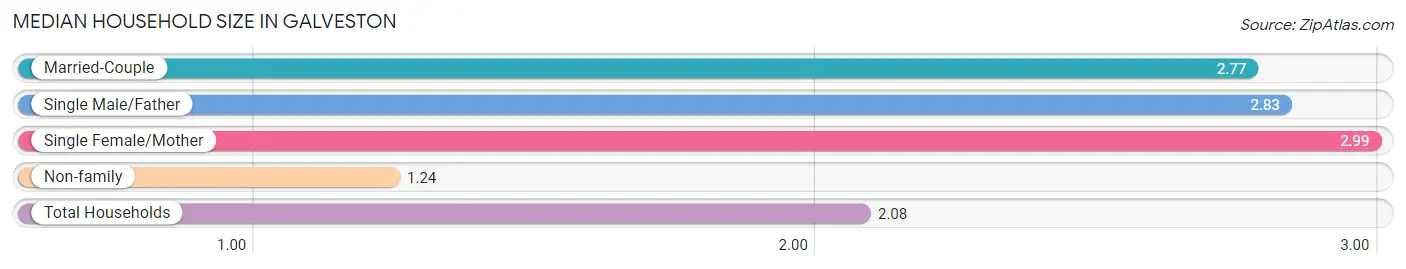
Median Household Size in Galveston
The median household size in Galveston is 2.08 persons per household, with single female/mother households (3,220 | 13.6%) accounting for the largest median household size of 2.99 persons per household. non-family households (11,137 | 46.9%) represent the smallest median household size with 1.24 persons per household.
| Household Type | # Households | Household Size |
| Married-Couple | 8,286 (34.9%) | 2.77 |
| Single Male/Father | 1,105 (4.6%) | 2.83 |
| Single Female/Mother | 3,220 (13.6%) | 2.99 |
| Non-family | 11,137 (46.9%) | 1.24 |
| Total Households | 23,748 (100.0%) | 2.08 |
Household Size by Marriage Status in Galveston
Out of a total of 23,748 households in Galveston, 12,611 (53.1%) are family households, while 11,137 (46.9%) are nonfamily households. The most numerous type of family households are 2-person households, comprising 6,965, and the most common type of nonfamily households are 1-person households, comprising 8,996.
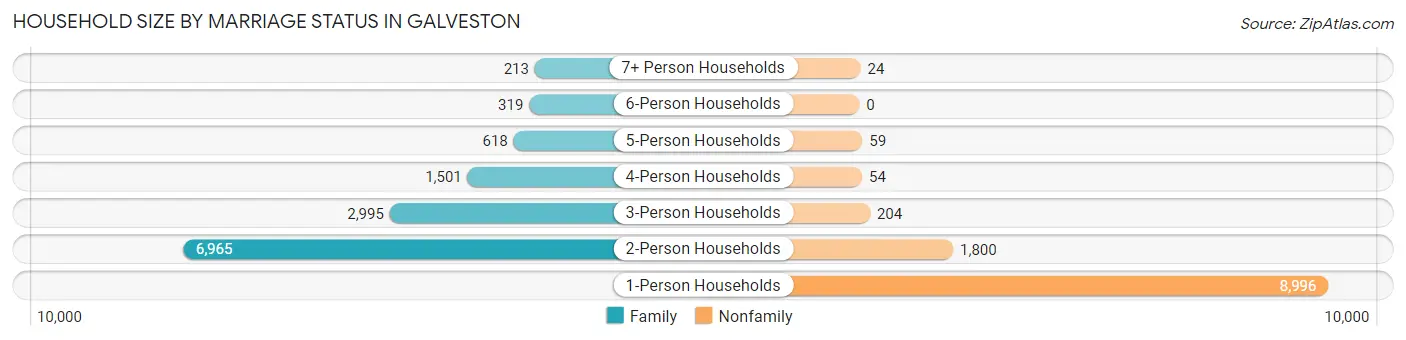
| Household Size | Family Households | Nonfamily Households |
| 1-Person Households | - | 8,996 (37.9%) |
| 2-Person Households | 6,965 (29.3%) | 1,800 (7.6%) |
| 3-Person Households | 2,995 (12.6%) | 204 (0.9%) |
| 4-Person Households | 1,501 (6.3%) | 54 (0.2%) |
| 5-Person Households | 618 (2.6%) | 59 (0.3%) |
| 6-Person Households | 319 (1.3%) | 0 (0.0%) |
| 7+ Person Households | 213 (0.9%) | 24 (0.1%) |
| Total | 12,611 (53.1%) | 11,137 (46.9%) |
Female Fertility in Galveston
Fertility by Age in Galveston
Average fertility rate in Galveston is 59.0 births per 1,000 women. Women in the age bracket of 20 to 34 years have the highest fertility rate with 95.0 births per 1,000 women. Women in the age bracket of 20 to 34 years acount for 89.4% of all women with births.
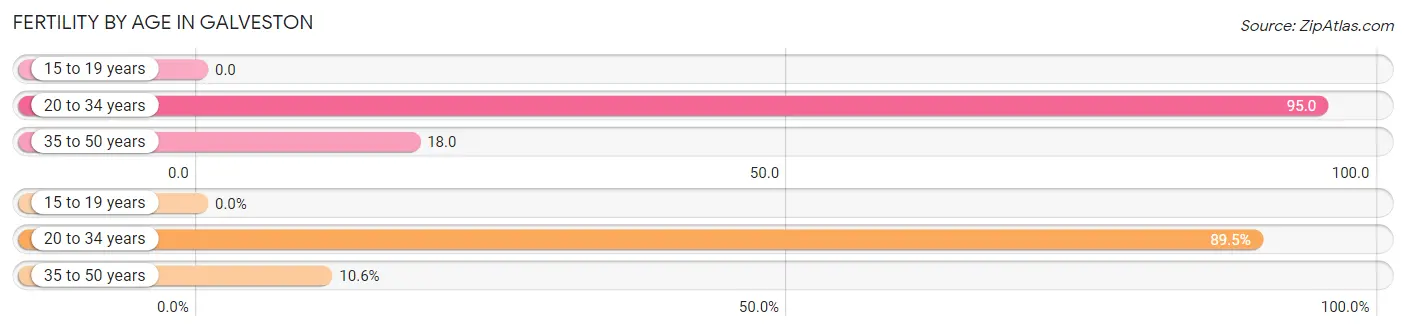
| Age Bracket | Women with Births | Births / 1,000 Women |
| 15 to 19 years | 0 (0.0%) | 0.0 |
| 20 to 34 years | 653 (89.4%) | 95.0 |
| 35 to 50 years | 77 (10.5%) | 18.0 |
| Total | 730 (100.0%) | 59.0 |
Fertility by Age by Marriage Status in Galveston
68.2% of women with births (730) in Galveston are married. The highest percentage of unmarried women with births falls into 20 to 34 years age bracket with 34.6% of them unmarried at the time of birth, while the lowest percentage of unmarried women with births belong to 35 to 50 years age bracket with 7.8% of them unmarried.
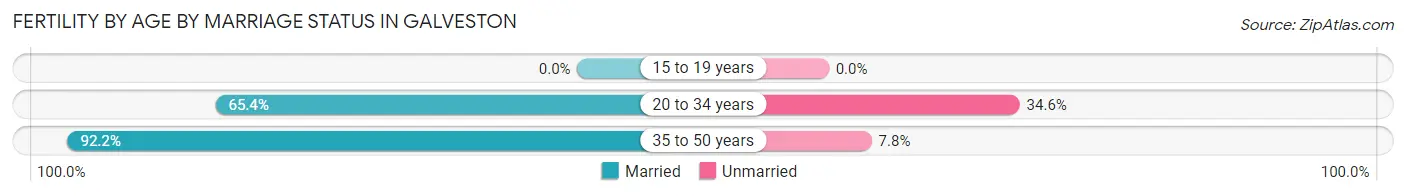
| Age Bracket | Married | Unmarried |
| 15 to 19 years | 0 (0.0%) | 0 (0.0%) |
| 20 to 34 years | 427 (65.4%) | 226 (34.6%) |
| 35 to 50 years | 71 (92.2%) | 6 (7.8%) |
| Total | 498 (68.2%) | 232 (31.8%) |
Fertility by Education in Galveston
Average fertility rate in Galveston is 59.0 births per 1,000 women. Women with the education attainment of graduate degree have the highest fertility rate of 75.0 births per 1,000 women, while women with the education attainment of less than high school have the lowest fertility at 33.0 births per 1,000 women. Women with the education attainment of college or associate's degree represent 33.4% of all women with births.
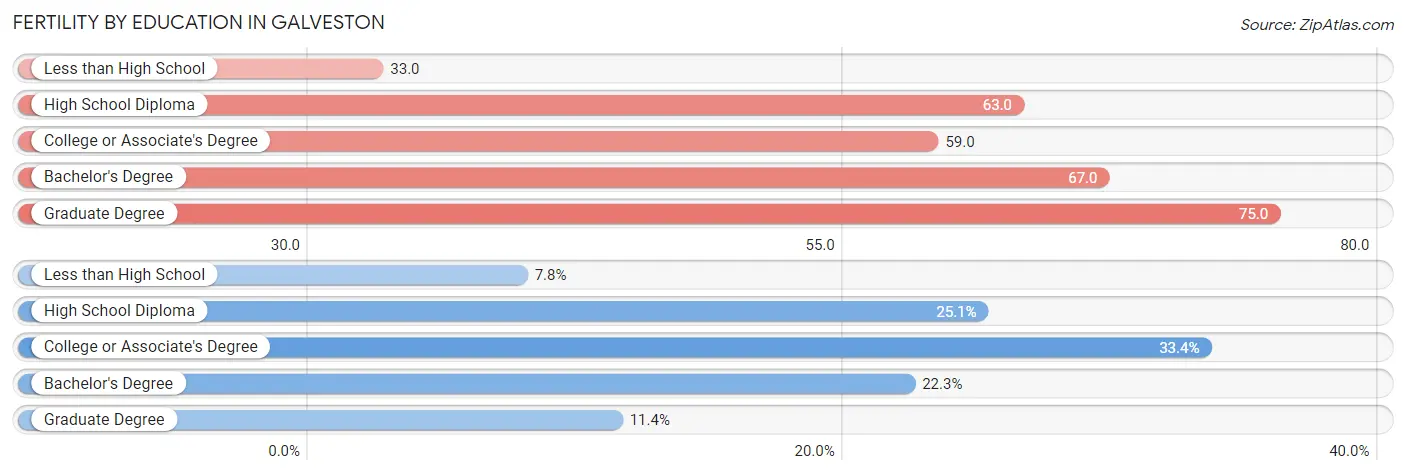
| Educational Attainment | Women with Births | Births / 1,000 Women |
| Less than High School | 57 (7.8%) | 33.0 |
| High School Diploma | 183 (25.1%) | 63.0 |
| College or Associate's Degree | 244 (33.4%) | 59.0 |
| Bachelor's Degree | 163 (22.3%) | 67.0 |
| Graduate Degree | 83 (11.4%) | 75.0 |
| Total | 730 (100.0%) | 59.0 |
Fertility by Education by Marriage Status in Galveston
31.8% of women with births in Galveston are unmarried. Women with the educational attainment of bachelor's degree are most likely to be married with 100.0% of them married at childbirth, while women with the educational attainment of college or associate's degree are least likely to be married with 55.7% of them unmarried at childbirth.
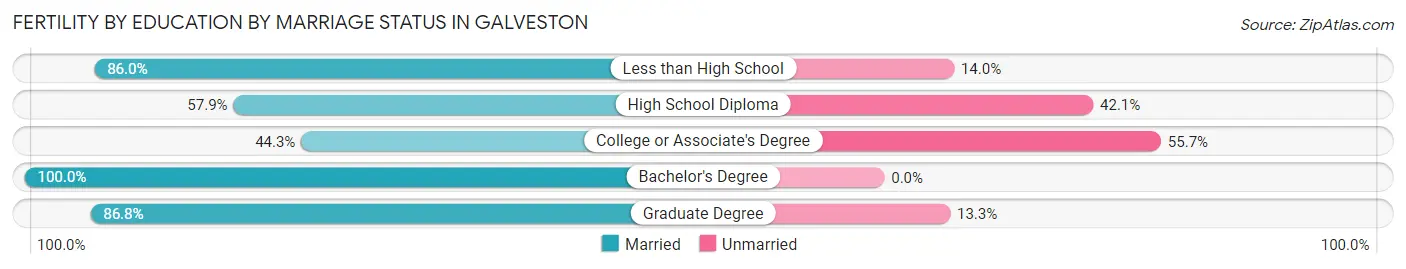
| Educational Attainment | Married | Unmarried |
| Less than High School | 49 (86.0%) | 8 (14.0%) |
| High School Diploma | 106 (57.9%) | 77 (42.1%) |
| College or Associate's Degree | 108 (44.3%) | 136 (55.7%) |
| Bachelor's Degree | 163 (100.0%) | 0 (0.0%) |
| Graduate Degree | 72 (86.8%) | 11 (13.3%) |
| Total | 498 (68.2%) | 232 (31.8%) |
Employment Characteristics in Galveston
Employment by Class of Employer in Galveston
Among the 24,446 employed individuals in Galveston, private company employees (14,989 | 61.3%), state government employees (2,725 | 11.2%), and local government employees (1,989 | 8.1%) make up the most common classes of employment.
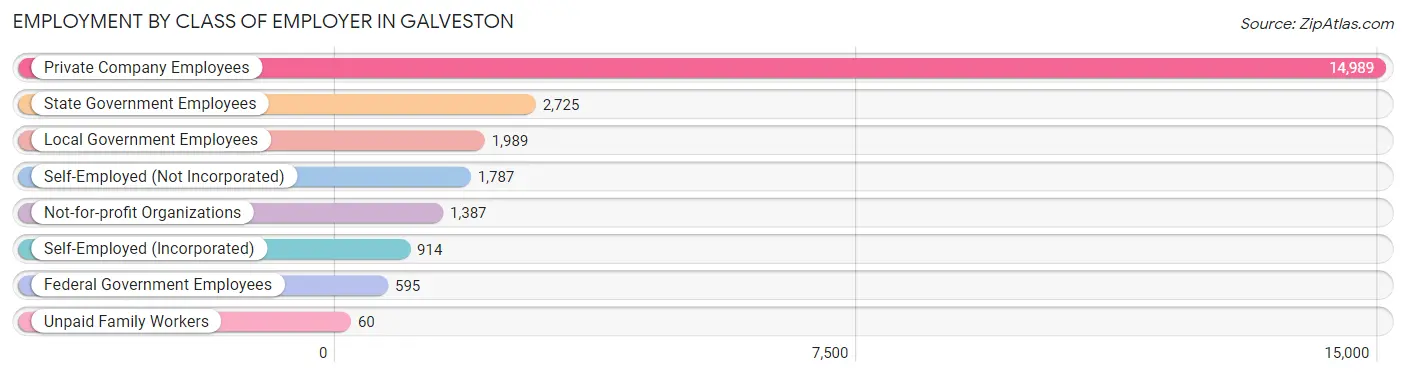
| Employer Class | # Employees | % Employees |
| Private Company Employees | 14,989 | 61.3% |
| Self-Employed (Incorporated) | 914 | 3.7% |
| Self-Employed (Not Incorporated) | 1,787 | 7.3% |
| Not-for-profit Organizations | 1,387 | 5.7% |
| Local Government Employees | 1,989 | 8.1% |
| State Government Employees | 2,725 | 11.2% |
| Federal Government Employees | 595 | 2.4% |
| Unpaid Family Workers | 60 | 0.3% |
| Total | 24,446 | 100.0% |
Employment Status by Age in Galveston
According to the labor force statistics for Galveston, out of the total population over 16 years of age (46,075), 58.0% or 26,723 individuals are in the labor force, with 6.8% or 1,817 of them unemployed. The age group with the highest labor force participation rate is 30 to 34 years, with 81.1% or 3,331 individuals in the labor force. Within the labor force, the 16 to 19 years age range has the highest percentage of unemployed individuals, with 16.4% or 189 of them being unemployed.
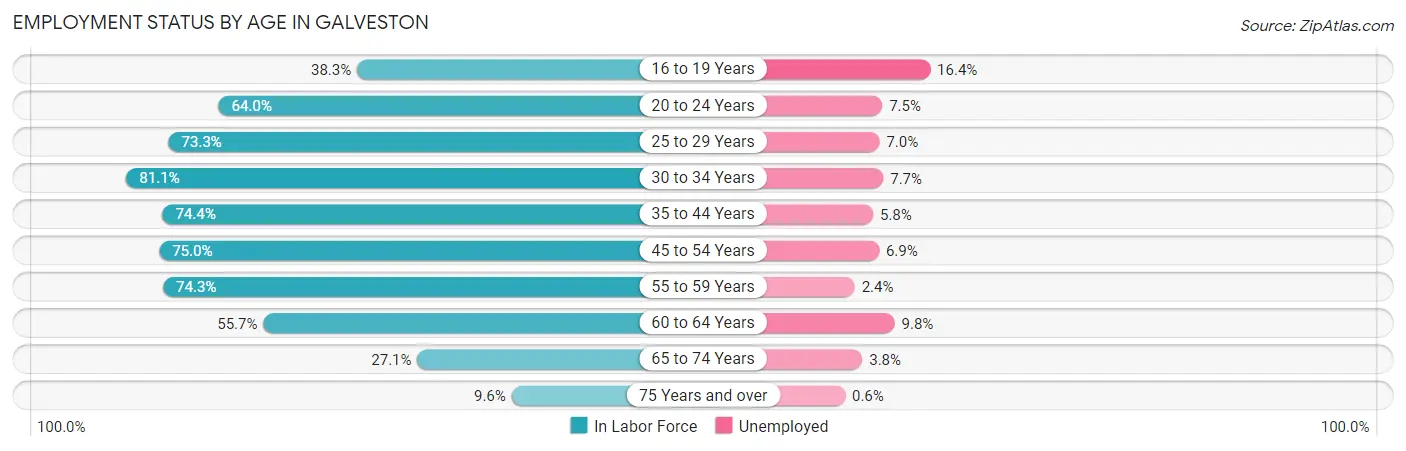
| Age Bracket | In Labor Force | Unemployed |
| 16 to 19 Years | 1,155 (38.3%) | 189 (16.4%) |
| 20 to 24 Years | 3,114 (64.0%) | 234 (7.5%) |
| 25 to 29 Years | 3,411 (73.3%) | 239 (7.0%) |
| 30 to 34 Years | 3,331 (81.1%) | 256 (7.7%) |
| 35 to 44 Years | 4,194 (74.4%) | 243 (5.8%) |
| 45 to 54 Years | 4,447 (75.0%) | 307 (6.9%) |
| 55 to 59 Years | 2,727 (74.3%) | 65 (2.4%) |
| 60 to 64 Years | 2,235 (55.7%) | 219 (9.8%) |
| 65 to 74 Years | 1,782 (27.1%) | 68 (3.8%) |
| 75 Years and over | 346 (9.6%) | 2 (0.6%) |
| Total | 26,724 (58.0%) | 1,817 (6.8%) |
Employment Status by Educational Attainment in Galveston
According to labor force statistics for Galveston, 72.6% of individuals (20,335) out of the total population between 25 and 64 years of age (28,010) are in the labor force, with 6.5% or 1,322 of them being unemployed. The group with the highest labor force participation rate are those with the educational attainment of bachelor's degree or higher, with 80.4% or 7,092 individuals in the labor force. Within the labor force, individuals with less than high school education have the highest percentage of unemployment, with 12.2% or 271 of them being unemployed.
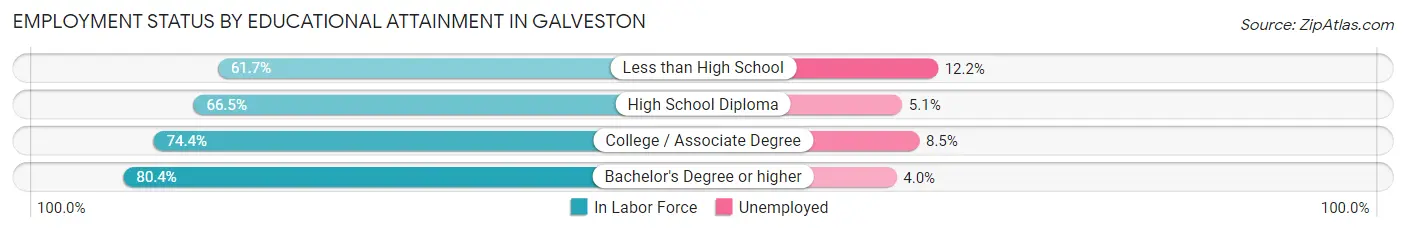
| Educational Attainment | In Labor Force | Unemployed |
| Less than High School | 2,219 (61.7%) | 439 (12.2%) |
| High School Diploma | 4,763 (66.5%) | 365 (5.1%) |
| College / Associate Degree | 6,273 (74.4%) | 717 (8.5%) |
| Bachelor's Degree or higher | 7,092 (80.4%) | 353 (4.0%) |
| Total | 20,335 (72.6%) | 1,821 (6.5%) |
Employment Occupations by Sex in Galveston
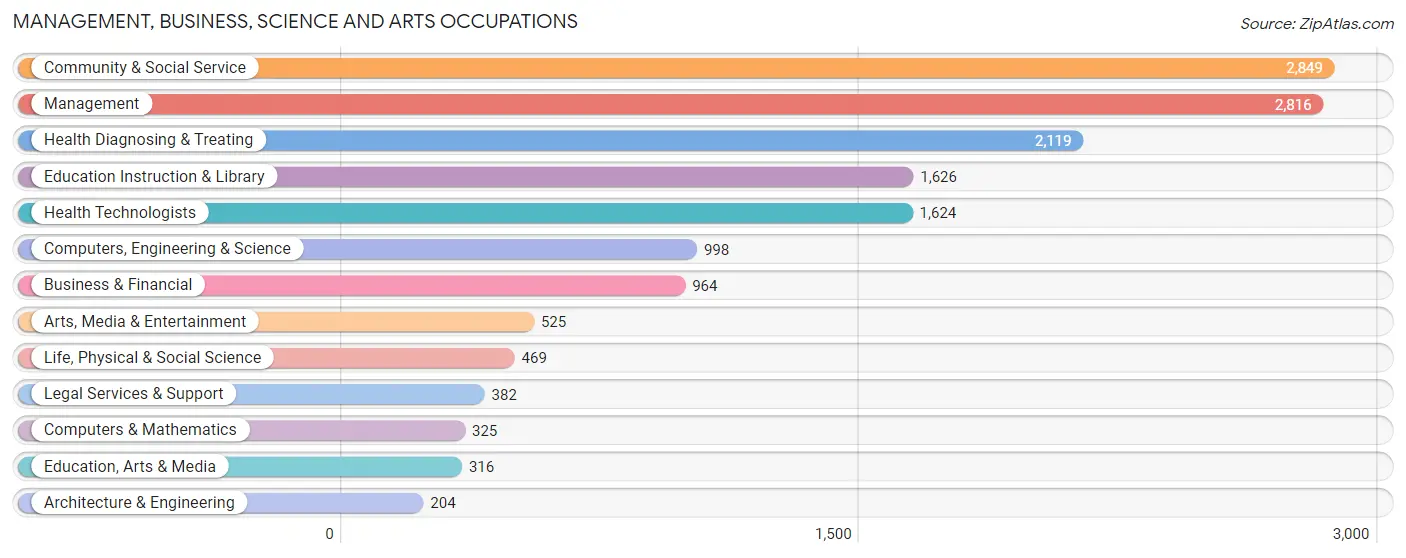
Management, Business, Science and Arts Occupations
The most common Management, Business, Science and Arts occupations in Galveston are Community & Social Service (2,849 | 11.5%), Management (2,816 | 11.3%), Health Diagnosing & Treating (2,119 | 8.5%), Education Instruction & Library (1,626 | 6.6%), and Health Technologists (1,624 | 6.5%).
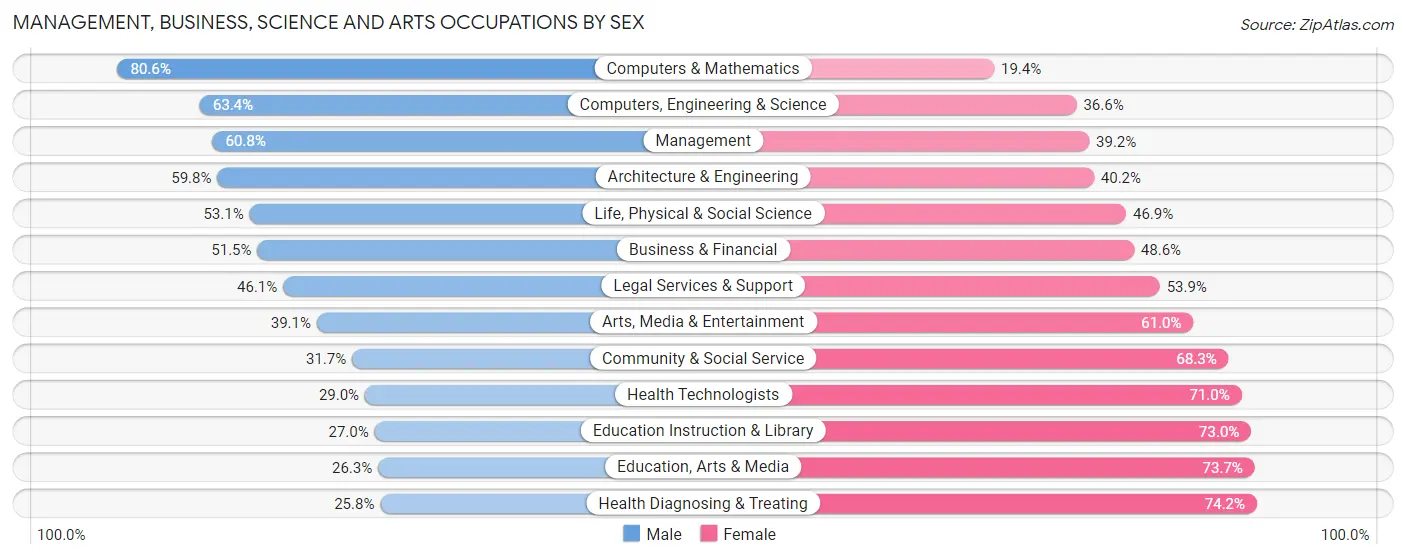
Management, Business, Science and Arts Occupations by Sex
Within the Management, Business, Science and Arts occupations in Galveston, the most male-oriented occupations are Computers & Mathematics (80.6%), Computers, Engineering & Science (63.4%), and Management (60.8%), while the most female-oriented occupations are Health Diagnosing & Treating (74.2%), Education, Arts & Media (73.7%), and Education Instruction & Library (73.0%).
| Occupation | Male | Female |
| Management | 1,712 (60.8%) | 1,104 (39.2%) |
| Business & Financial | 496 (51.4%) | 468 (48.5%) |
| Computers, Engineering & Science | 633 (63.4%) | 365 (36.6%) |
| Computers & Mathematics | 262 (80.6%) | 63 (19.4%) |
| Architecture & Engineering | 122 (59.8%) | 82 (40.2%) |
| Life, Physical & Social Science | 249 (53.1%) | 220 (46.9%) |
| Community & Social Service | 903 (31.7%) | 1,946 (68.3%) |
| Education, Arts & Media | 83 (26.3%) | 233 (73.7%) |
| Legal Services & Support | 176 (46.1%) | 206 (53.9%) |
| Education Instruction & Library | 439 (27.0%) | 1,187 (73.0%) |
| Arts, Media & Entertainment | 205 (39.1%) | 320 (61.0%) |
| Health Diagnosing & Treating | 547 (25.8%) | 1,572 (74.2%) |
| Health Technologists | 471 (29.0%) | 1,153 (71.0%) |
| Total (Category) | 4,291 (44.0%) | 5,455 (56.0%) |
| Total (Overall) | 12,731 (51.3%) | 12,096 (48.7%) |
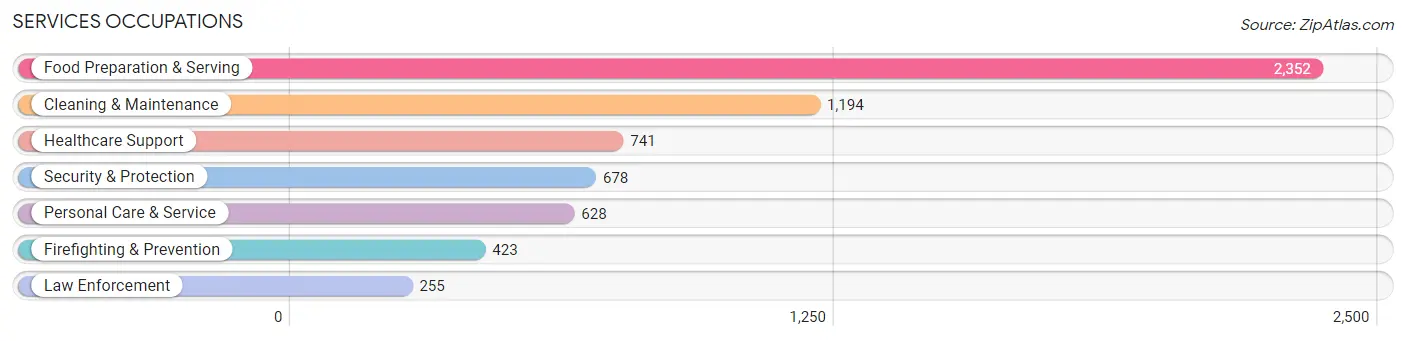
Services Occupations
The most common Services occupations in Galveston are Food Preparation & Serving (2,352 | 9.5%), Cleaning & Maintenance (1,194 | 4.8%), Healthcare Support (741 | 3.0%), Security & Protection (678 | 2.7%), and Personal Care & Service (628 | 2.5%).
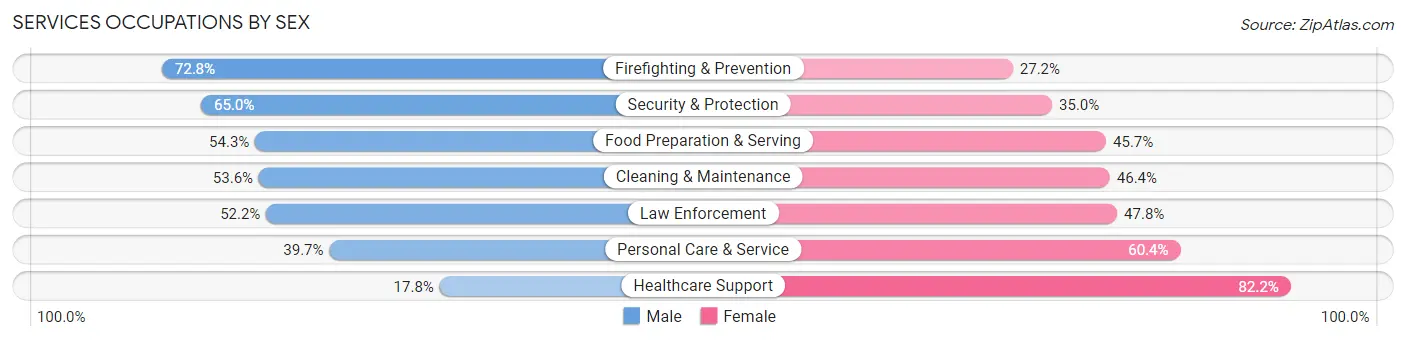
Services Occupations by Sex
Within the Services occupations in Galveston, the most male-oriented occupations are Firefighting & Prevention (72.8%), Security & Protection (65.0%), and Food Preparation & Serving (54.3%), while the most female-oriented occupations are Healthcare Support (82.2%), Personal Care & Service (60.4%), and Law Enforcement (47.8%).
| Occupation | Male | Female |
| Healthcare Support | 132 (17.8%) | 609 (82.2%) |
| Security & Protection | 441 (65.0%) | 237 (35.0%) |
| Firefighting & Prevention | 308 (72.8%) | 115 (27.2%) |
| Law Enforcement | 133 (52.2%) | 122 (47.8%) |
| Food Preparation & Serving | 1,278 (54.3%) | 1,074 (45.7%) |
| Cleaning & Maintenance | 640 (53.6%) | 554 (46.4%) |
| Personal Care & Service | 249 (39.7%) | 379 (60.4%) |
| Total (Category) | 2,740 (49.0%) | 2,853 (51.0%) |
| Total (Overall) | 12,731 (51.3%) | 12,096 (48.7%) |
Sales and Office Occupations
The most common Sales and Office occupations in Galveston are Sales & Related (2,468 | 9.9%), and Office & Administration (2,262 | 9.1%).
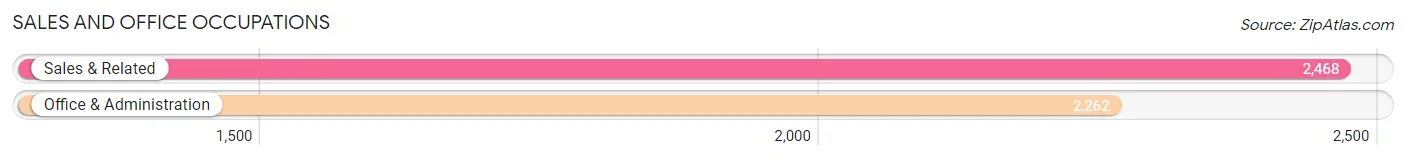
Sales and Office Occupations by Sex
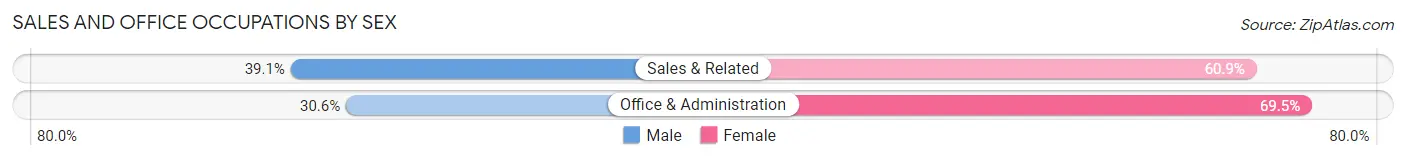
| Occupation | Male | Female |
| Sales & Related | 964 (39.1%) | 1,504 (60.9%) |
| Office & Administration | 691 (30.5%) | 1,571 (69.5%) |
| Total (Category) | 1,655 (35.0%) | 3,075 (65.0%) |
| Total (Overall) | 12,731 (51.3%) | 12,096 (48.7%) |
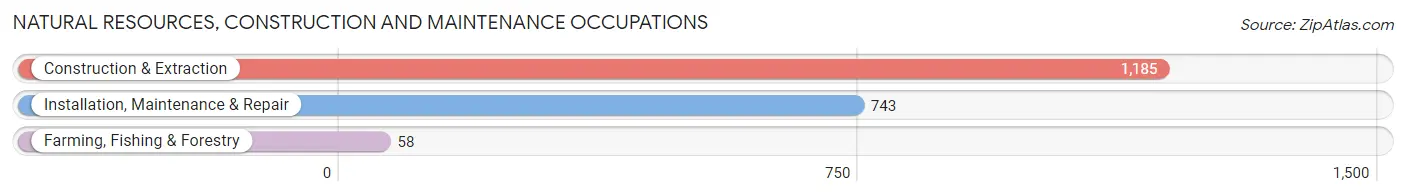
Natural Resources, Construction and Maintenance Occupations
The most common Natural Resources, Construction and Maintenance occupations in Galveston are Construction & Extraction (1,185 | 4.8%), Installation, Maintenance & Repair (743 | 3.0%), and Farming, Fishing & Forestry (58 | 0.2%).
Natural Resources, Construction and Maintenance Occupations by Sex
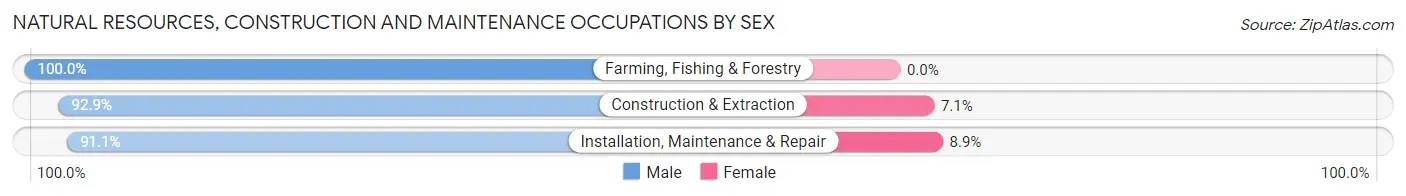
| Occupation | Male | Female |
| Farming, Fishing & Forestry | 58 (100.0%) | 0 (0.0%) |
| Construction & Extraction | 1,101 (92.9%) | 84 (7.1%) |
| Installation, Maintenance & Repair | 677 (91.1%) | 66 (8.9%) |
| Total (Category) | 1,836 (92.4%) | 150 (7.5%) |
| Total (Overall) | 12,731 (51.3%) | 12,096 (48.7%) |
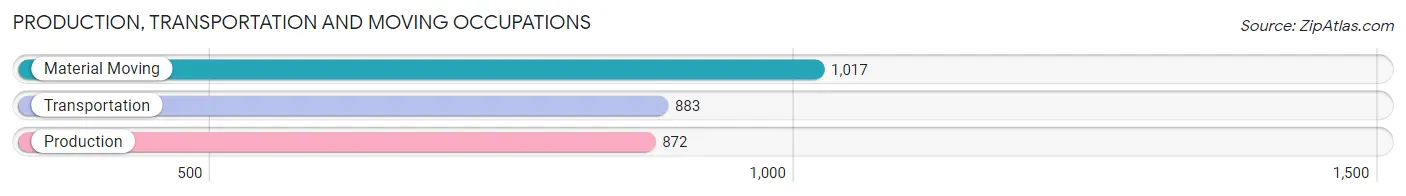
Production, Transportation and Moving Occupations
The most common Production, Transportation and Moving occupations in Galveston are Material Moving (1,017 | 4.1%), Transportation (883 | 3.6%), and Production (872 | 3.5%).
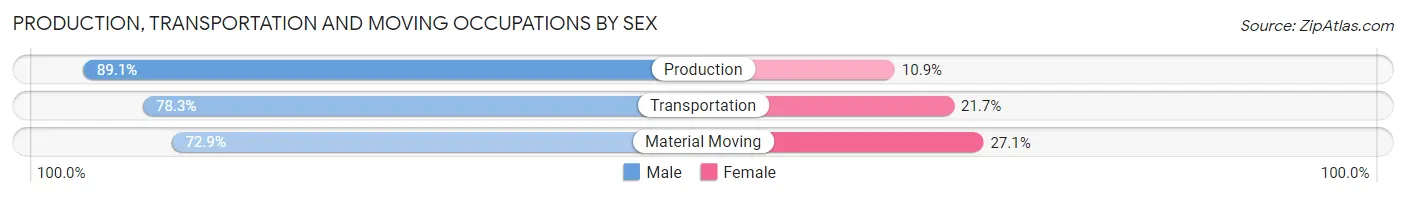
Production, Transportation and Moving Occupations by Sex
| Occupation | Male | Female |
| Production | 777 (89.1%) | 95 (10.9%) |
| Transportation | 691 (78.3%) | 192 (21.7%) |
| Material Moving | 741 (72.9%) | 276 (27.1%) |
| Total (Category) | 2,209 (79.7%) | 563 (20.3%) |
| Total (Overall) | 12,731 (51.3%) | 12,096 (48.7%) |
Employment Industries by Sex in Galveston
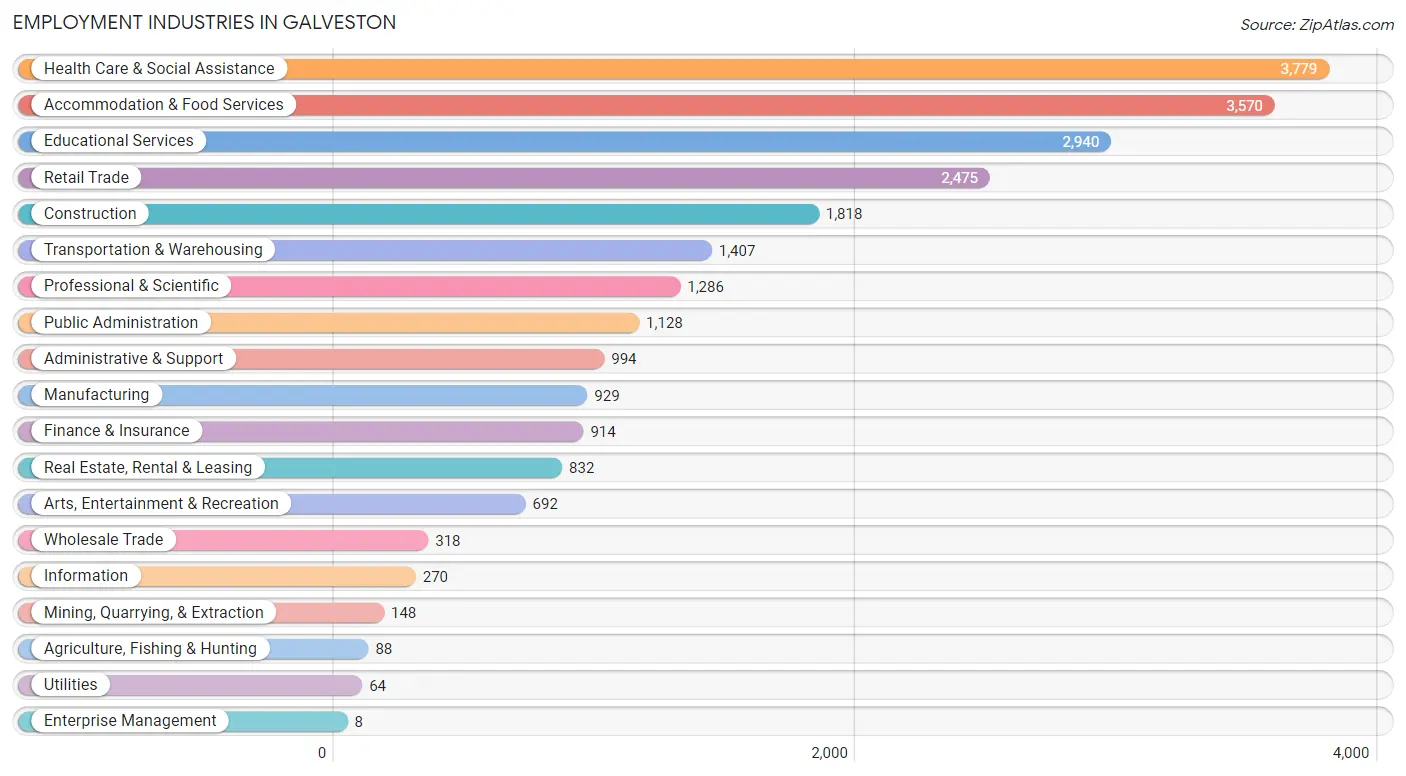
Employment Industries in Galveston
The major employment industries in Galveston include Health Care & Social Assistance (3,779 | 15.2%), Accommodation & Food Services (3,570 | 14.4%), Educational Services (2,940 | 11.8%), Retail Trade (2,475 | 10.0%), and Construction (1,818 | 7.3%).
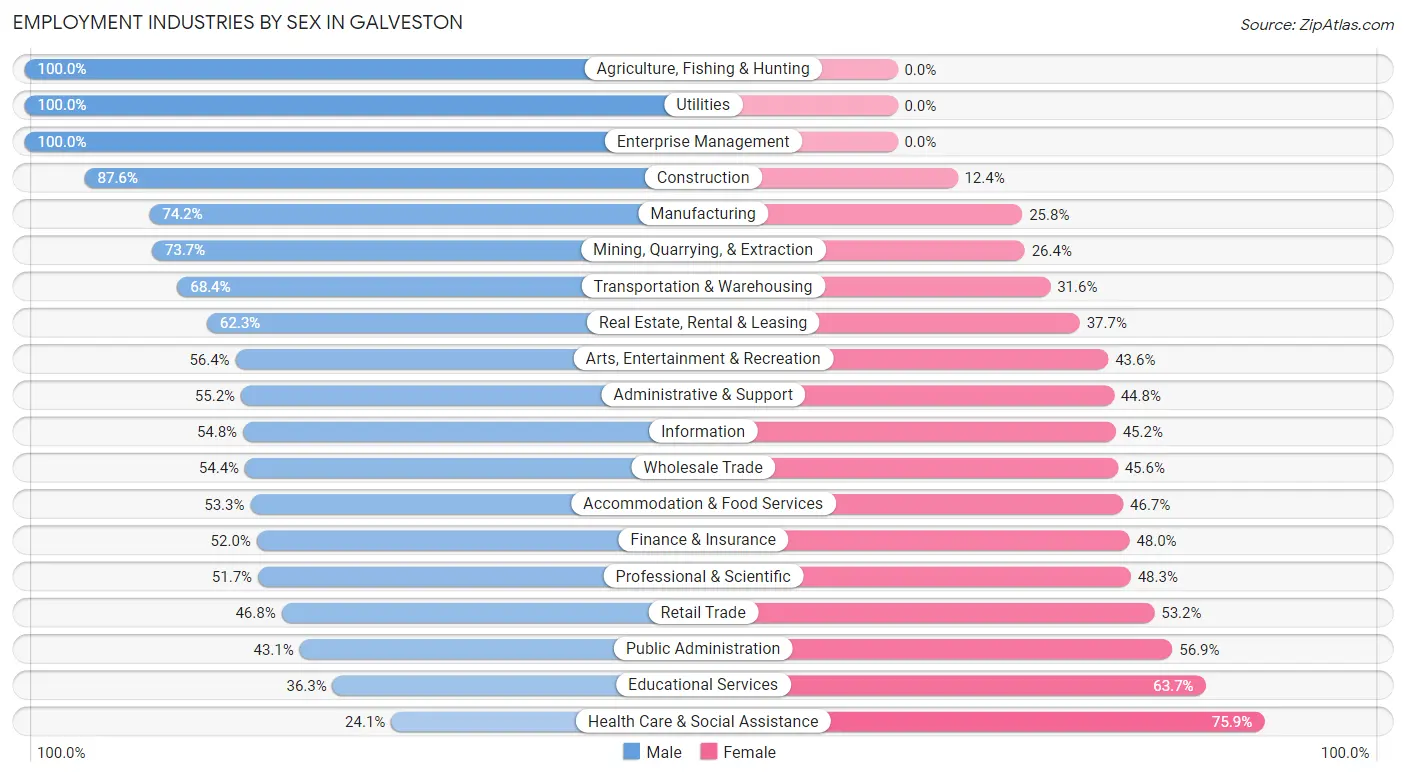
Employment Industries by Sex in Galveston
The Galveston industries that see more men than women are Agriculture, Fishing & Hunting (100.0%), Utilities (100.0%), and Enterprise Management (100.0%), whereas the industries that tend to have a higher number of women are Health Care & Social Assistance (75.9%), Educational Services (63.7%), and Public Administration (56.9%).
| Industry | Male | Female |
| Agriculture, Fishing & Hunting | 88 (100.0%) | 0 (0.0%) |
| Mining, Quarrying, & Extraction | 109 (73.7%) | 39 (26.4%) |
| Construction | 1,592 (87.6%) | 226 (12.4%) |
| Manufacturing | 689 (74.2%) | 240 (25.8%) |
| Wholesale Trade | 173 (54.4%) | 145 (45.6%) |
| Retail Trade | 1,159 (46.8%) | 1,316 (53.2%) |
| Transportation & Warehousing | 962 (68.4%) | 445 (31.6%) |
| Utilities | 64 (100.0%) | 0 (0.0%) |
| Information | 148 (54.8%) | 122 (45.2%) |
| Finance & Insurance | 475 (52.0%) | 439 (48.0%) |
| Real Estate, Rental & Leasing | 518 (62.3%) | 314 (37.7%) |
| Professional & Scientific | 665 (51.7%) | 621 (48.3%) |
| Enterprise Management | 8 (100.0%) | 0 (0.0%) |
| Administrative & Support | 549 (55.2%) | 445 (44.8%) |
| Educational Services | 1,066 (36.3%) | 1,874 (63.7%) |
| Health Care & Social Assistance | 912 (24.1%) | 2,867 (75.9%) |
| Arts, Entertainment & Recreation | 390 (56.4%) | 302 (43.6%) |
| Accommodation & Food Services | 1,902 (53.3%) | 1,668 (46.7%) |
| Public Administration | 486 (43.1%) | 642 (56.9%) |
| Total | 12,731 (51.3%) | 12,096 (48.7%) |
Education in Galveston
School Enrollment in Galveston
The most common levels of schooling among the 12,761 students in Galveston are college / undergraduate (4,898 | 38.4%), middle school (1,965 | 15.4%), and high school (1,938 | 15.2%).
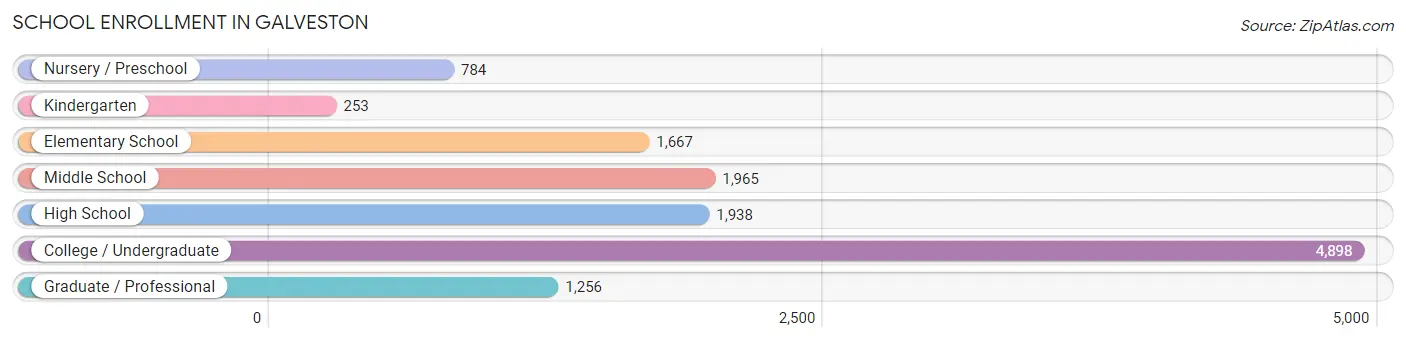
| School Level | # Students | % Students |
| Nursery / Preschool | 784 | 6.1% |
| Kindergarten | 253 | 2.0% |
| Elementary School | 1,667 | 13.1% |
| Middle School | 1,965 | 15.4% |
| High School | 1,938 | 15.2% |
| College / Undergraduate | 4,898 | 38.4% |
| Graduate / Professional | 1,256 | 9.8% |
| Total | 12,761 | 100.0% |
School Enrollment by Age by Funding Source in Galveston
Out of a total of 12,761 students who are enrolled in schools in Galveston, 1,799 (14.1%) attend a private institution, while the remaining 10,962 (85.9%) are enrolled in public schools. The age group of 3 to 4 year olds has the highest likelihood of being enrolled in private schools, with 146 (33.0% in the age bracket) enrolled. Conversely, the age group of 20 to 24 year olds has the lowest likelihood of being enrolled in a private school, with 2,592 (89.8% in the age bracket) attending a public institution.
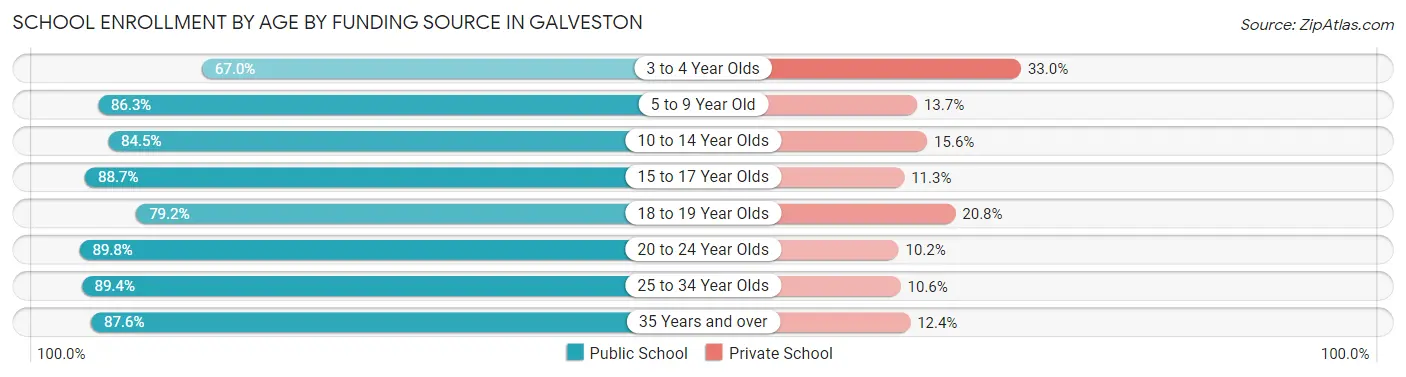
| Age Bracket | Public School | Private School |
| 3 to 4 Year Olds | 296 (67.0%) | 146 (33.0%) |
| 5 to 9 Year Old | 1,821 (86.3%) | 288 (13.7%) |
| 10 to 14 Year Olds | 1,950 (84.5%) | 359 (15.5%) |
| 15 to 17 Year Olds | 1,227 (88.7%) | 156 (11.3%) |
| 18 to 19 Year Olds | 1,161 (79.2%) | 305 (20.8%) |
| 20 to 24 Year Olds | 2,592 (89.8%) | 295 (10.2%) |
| 25 to 34 Year Olds | 1,120 (89.4%) | 133 (10.6%) |
| 35 Years and over | 799 (87.6%) | 113 (12.4%) |
| Total | 10,962 (85.9%) | 1,799 (14.1%) |
Educational Attainment by Field of Study in Galveston
Business (2,163 | 16.3%), bio, nature & agricultural (2,111 | 15.9%), science & technology (1,727 | 13.0%), arts & humanities (1,242 | 9.4%), and education (1,017 | 7.7%) are the most common fields of study among 13,274 individuals in Galveston who have obtained a bachelor's degree or higher.
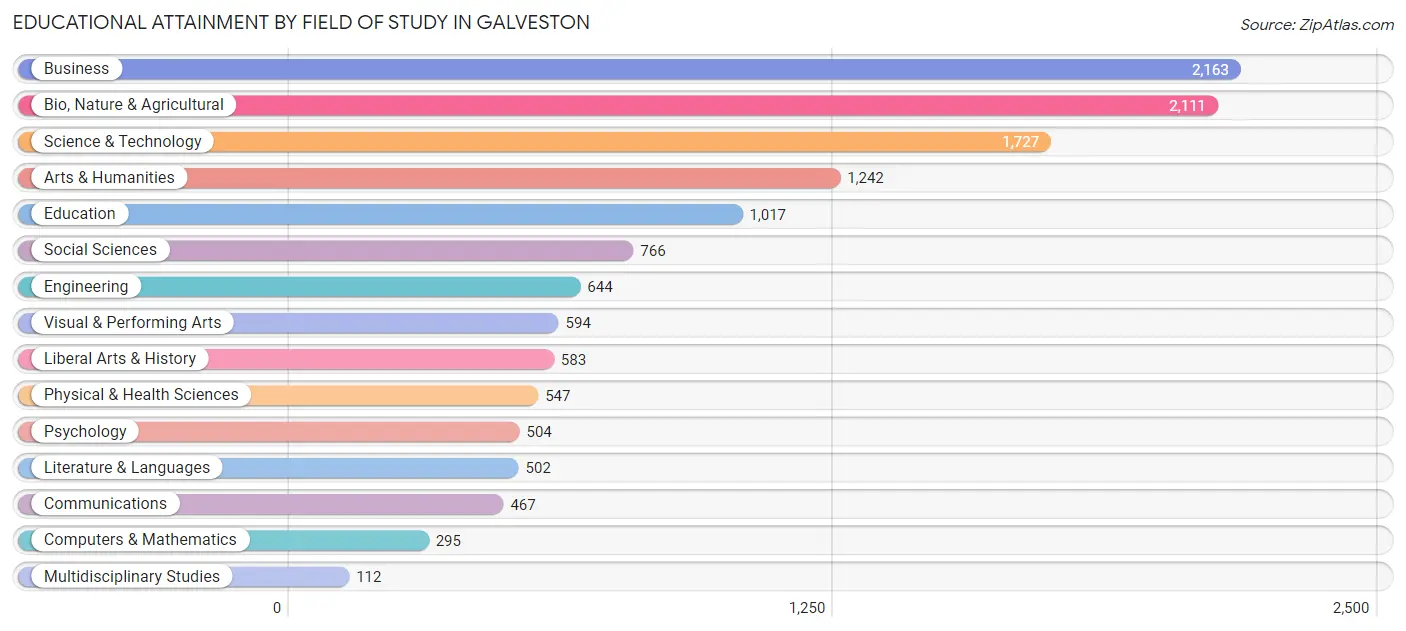
| Field of Study | # Graduates | % Graduates |
| Computers & Mathematics | 295 | 2.2% |
| Bio, Nature & Agricultural | 2,111 | 15.9% |
| Physical & Health Sciences | 547 | 4.1% |
| Psychology | 504 | 3.8% |
| Social Sciences | 766 | 5.8% |
| Engineering | 644 | 4.9% |
| Multidisciplinary Studies | 112 | 0.8% |
| Science & Technology | 1,727 | 13.0% |
| Business | 2,163 | 16.3% |
| Education | 1,017 | 7.7% |
| Literature & Languages | 502 | 3.8% |
| Liberal Arts & History | 583 | 4.4% |
| Visual & Performing Arts | 594 | 4.5% |
| Communications | 467 | 3.5% |
| Arts & Humanities | 1,242 | 9.4% |
| Total | 13,274 | 100.0% |
Transportation & Commute in Galveston
Vehicle Availability by Sex in Galveston
The most prevalent vehicle ownership categories in Galveston are males with 2 vehicles (5,362, accounting for 44.1%) and females with 2 vehicles (5,008, making up 45.4%).
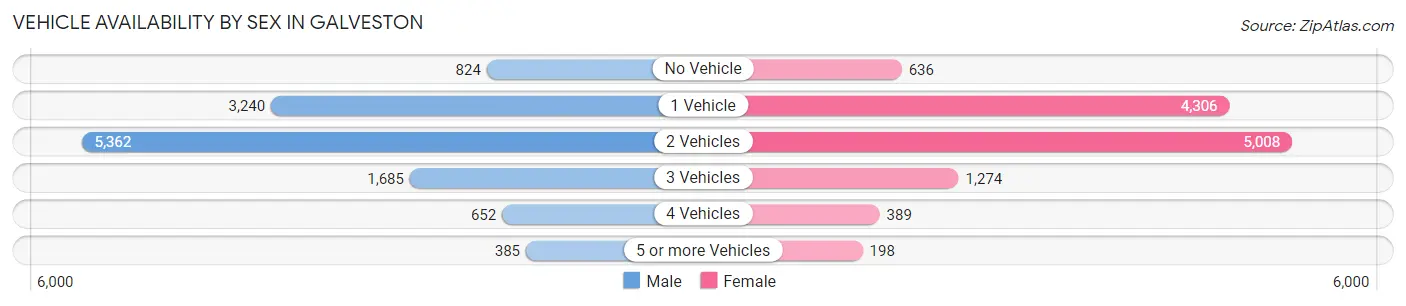
| Vehicles Available | Male | Female |
| No Vehicle | 824 (6.8%) | 636 (5.4%) |
| 1 Vehicle | 3,240 (26.7%) | 4,306 (36.5%) |
| 2 Vehicles | 5,362 (44.1%) | 5,008 (42.4%) |
| 3 Vehicles | 1,685 (13.9%) | 1,274 (10.8%) |
| 4 Vehicles | 652 (5.4%) | 389 (3.3%) |
| 5 or more Vehicles | 385 (3.2%) | 198 (1.7%) |
| Total | 12,148 (100.0%) | 11,811 (100.0%) |
Commute Time in Galveston
The most frequently occuring commute durations in Galveston are 15 to 19 minutes (4,459 commuters, 20.3%), 10 to 14 minutes (4,349 commuters, 19.8%), and 5 to 9 minutes (4,170 commuters, 19.0%).
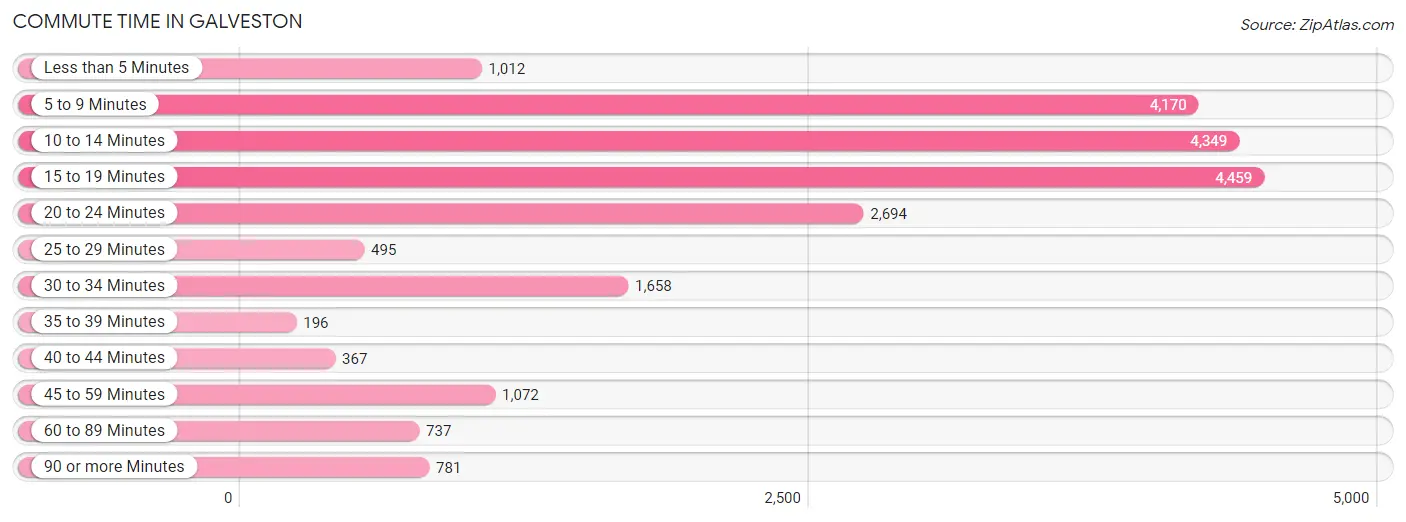
| Commute Time | # Commuters | % Commuters |
| Less than 5 Minutes | 1,012 | 4.6% |
| 5 to 9 Minutes | 4,170 | 19.0% |
| 10 to 14 Minutes | 4,349 | 19.8% |
| 15 to 19 Minutes | 4,459 | 20.3% |
| 20 to 24 Minutes | 2,694 | 12.2% |
| 25 to 29 Minutes | 495 | 2.2% |
| 30 to 34 Minutes | 1,658 | 7.5% |
| 35 to 39 Minutes | 196 | 0.9% |
| 40 to 44 Minutes | 367 | 1.7% |
| 45 to 59 Minutes | 1,072 | 4.9% |
| 60 to 89 Minutes | 737 | 3.4% |
| 90 or more Minutes | 781 | 3.5% |
Commute Time by Sex in Galveston
The most common commute times in Galveston are 10 to 14 minutes (2,333 commuters, 20.5%) for males and 15 to 19 minutes (2,409 commuters, 22.7%) for females.
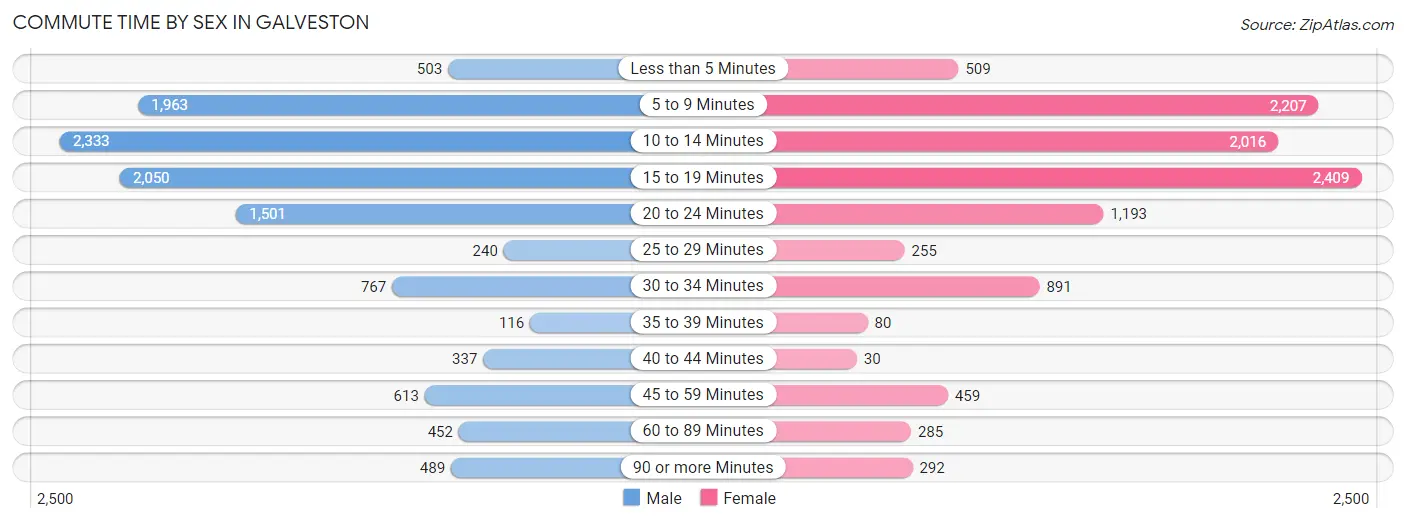
| Commute Time | Male | Female |
| Less than 5 Minutes | 503 (4.4%) | 509 (4.8%) |
| 5 to 9 Minutes | 1,963 (17.3%) | 2,207 (20.8%) |
| 10 to 14 Minutes | 2,333 (20.5%) | 2,016 (19.0%) |
| 15 to 19 Minutes | 2,050 (18.0%) | 2,409 (22.7%) |
| 20 to 24 Minutes | 1,501 (13.2%) | 1,193 (11.2%) |
| 25 to 29 Minutes | 240 (2.1%) | 255 (2.4%) |
| 30 to 34 Minutes | 767 (6.8%) | 891 (8.4%) |
| 35 to 39 Minutes | 116 (1.0%) | 80 (0.7%) |
| 40 to 44 Minutes | 337 (3.0%) | 30 (0.3%) |
| 45 to 59 Minutes | 613 (5.4%) | 459 (4.3%) |
| 60 to 89 Minutes | 452 (4.0%) | 285 (2.7%) |
| 90 or more Minutes | 489 (4.3%) | 292 (2.8%) |
Time of Departure to Work by Sex in Galveston
The most frequent times of departure to work in Galveston are 7:00 AM to 7:29 AM (1,508, 13.3%) for males and 7:30 AM to 7:59 AM (1,725, 16.2%) for females.
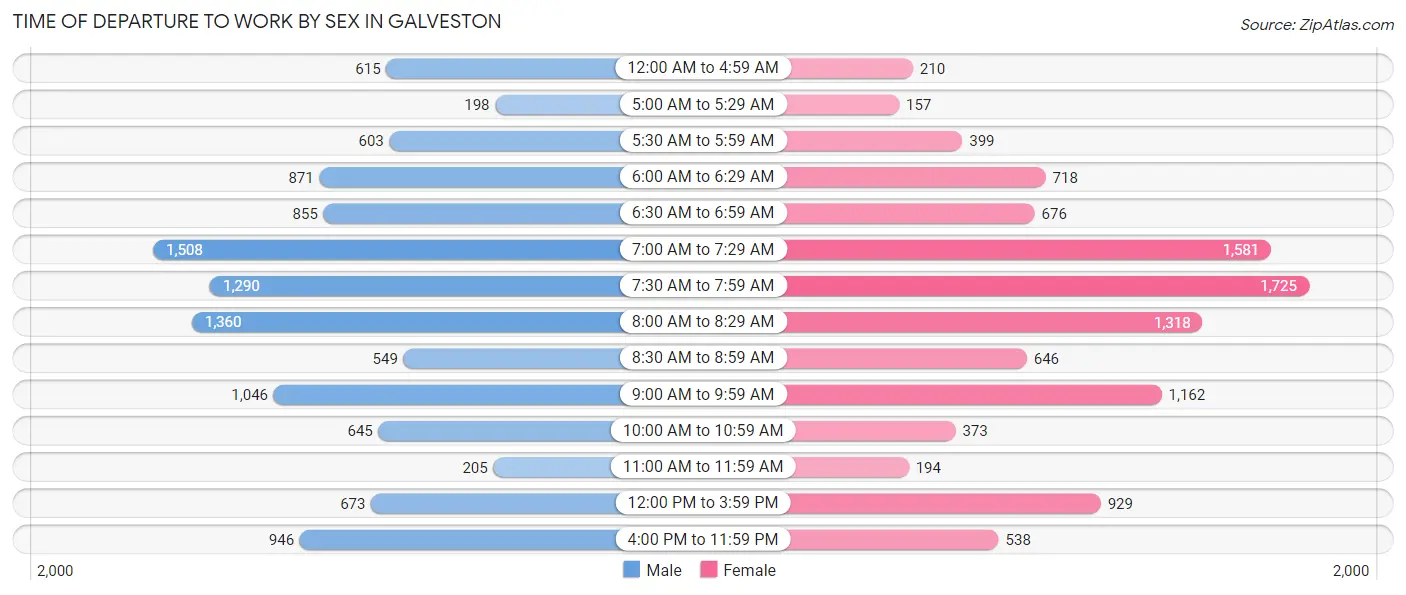
| Time of Departure | Male | Female |
| 12:00 AM to 4:59 AM | 615 (5.4%) | 210 (2.0%) |
| 5:00 AM to 5:29 AM | 198 (1.7%) | 157 (1.5%) |
| 5:30 AM to 5:59 AM | 603 (5.3%) | 399 (3.7%) |
| 6:00 AM to 6:29 AM | 871 (7.7%) | 718 (6.8%) |
| 6:30 AM to 6:59 AM | 855 (7.5%) | 676 (6.4%) |
| 7:00 AM to 7:29 AM | 1,508 (13.3%) | 1,581 (14.9%) |
| 7:30 AM to 7:59 AM | 1,290 (11.4%) | 1,725 (16.2%) |
| 8:00 AM to 8:29 AM | 1,360 (12.0%) | 1,318 (12.4%) |
| 8:30 AM to 8:59 AM | 549 (4.8%) | 646 (6.1%) |
| 9:00 AM to 9:59 AM | 1,046 (9.2%) | 1,162 (10.9%) |
| 10:00 AM to 10:59 AM | 645 (5.7%) | 373 (3.5%) |
| 11:00 AM to 11:59 AM | 205 (1.8%) | 194 (1.8%) |
| 12:00 PM to 3:59 PM | 673 (5.9%) | 929 (8.7%) |
| 4:00 PM to 11:59 PM | 946 (8.3%) | 538 (5.1%) |
| Total | 11,364 (100.0%) | 10,626 (100.0%) |
Housing Occupancy in Galveston
Occupancy by Ownership in Galveston
Of the total 23,748 dwellings in Galveston, owner-occupied units account for 11,004 (46.3%), while renter-occupied units make up 12,744 (53.7%).
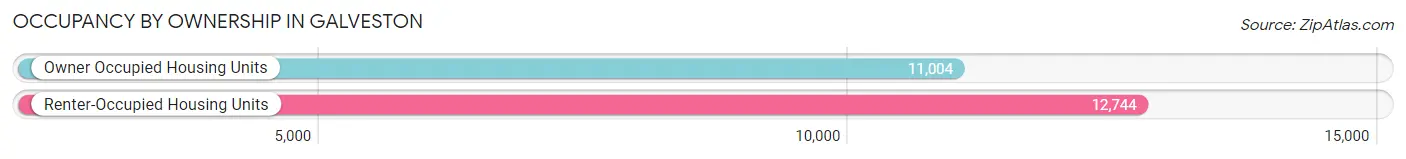
| Occupancy | # Housing Units | % Housing Units |
| Owner Occupied Housing Units | 11,004 | 46.3% |
| Renter-Occupied Housing Units | 12,744 | 53.7% |
| Total Occupied Housing Units | 23,748 | 100.0% |
Occupancy by Household Size in Galveston
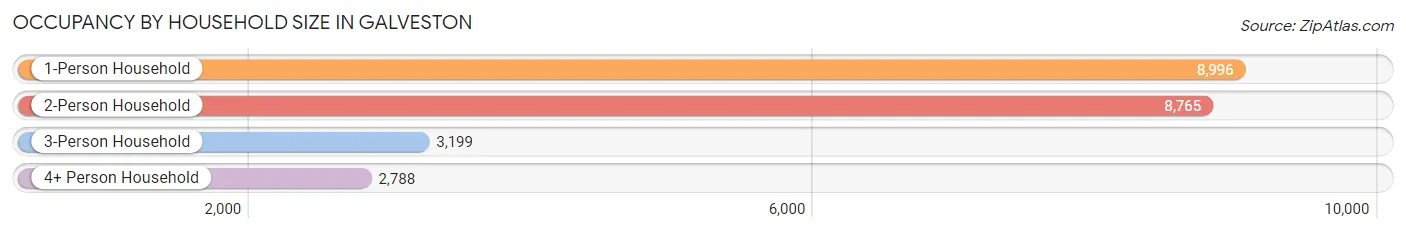
| Household Size | # Housing Units | % Housing Units |
| 1-Person Household | 8,996 | 37.9% |
| 2-Person Household | 8,765 | 36.9% |
| 3-Person Household | 3,199 | 13.5% |
| 4+ Person Household | 2,788 | 11.7% |
| Total Housing Units | 23,748 | 100.0% |
Occupancy by Ownership by Household Size in Galveston
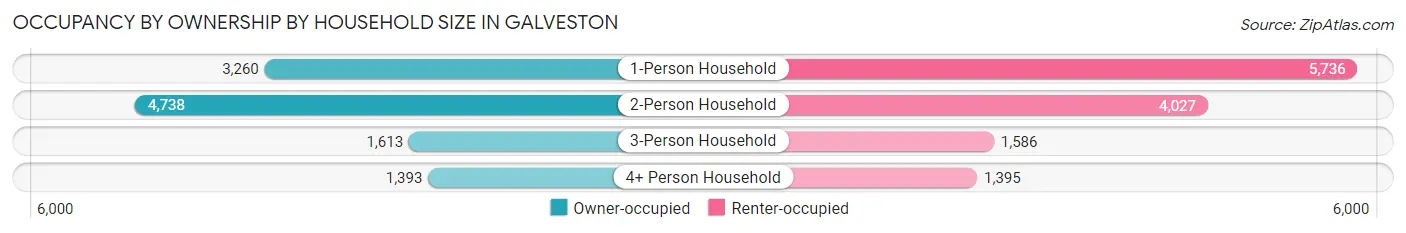
| Household Size | Owner-occupied | Renter-occupied |
| 1-Person Household | 3,260 (36.2%) | 5,736 (63.8%) |
| 2-Person Household | 4,738 (54.1%) | 4,027 (45.9%) |
| 3-Person Household | 1,613 (50.4%) | 1,586 (49.6%) |
| 4+ Person Household | 1,393 (50.0%) | 1,395 (50.0%) |
| Total Housing Units | 11,004 (46.3%) | 12,744 (53.7%) |
Occupancy by Educational Attainment in Galveston
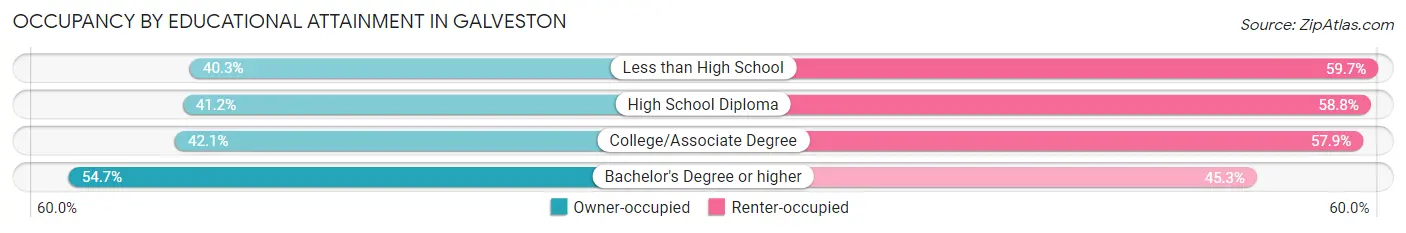
| Household Size | Owner-occupied | Renter-occupied |
| Less than High School | 895 (40.3%) | 1,326 (59.7%) |
| High School Diploma | 2,011 (41.2%) | 2,873 (58.8%) |
| College/Associate Degree | 3,365 (42.1%) | 4,630 (57.9%) |
| Bachelor's Degree or higher | 4,733 (54.7%) | 3,915 (45.3%) |
Occupancy by Age of Householder in Galveston
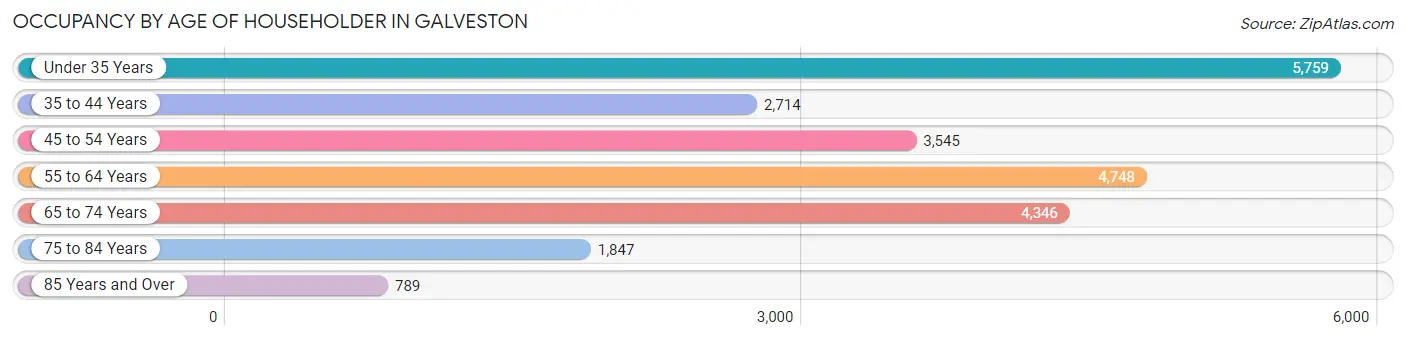
| Age Bracket | # Households | % Households |
| Under 35 Years | 5,759 | 24.2% |
| 35 to 44 Years | 2,714 | 11.4% |
| 45 to 54 Years | 3,545 | 14.9% |
| 55 to 64 Years | 4,748 | 20.0% |
| 65 to 74 Years | 4,346 | 18.3% |
| 75 to 84 Years | 1,847 | 7.8% |
| 85 Years and Over | 789 | 3.3% |
| Total | 23,748 | 100.0% |
Housing Finances in Galveston
Median Income by Occupancy in Galveston
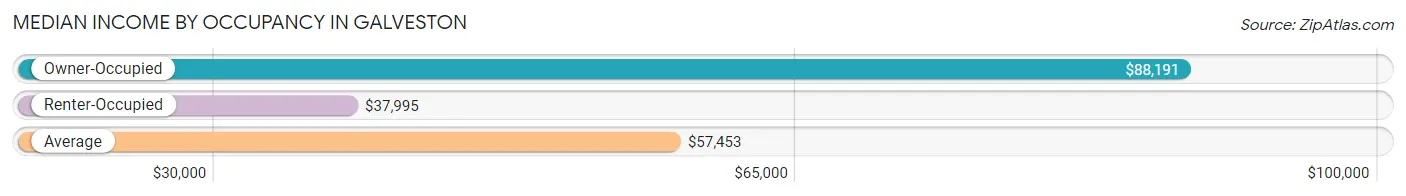
| Occupancy Type | # Households | Median Income |
| Owner-Occupied | 11,004 (46.3%) | $88,191 |
| Renter-Occupied | 12,744 (53.7%) | $37,995 |
| Average | 23,748 (100.0%) | $57,453 |
Occupancy by Householder Income Bracket in Galveston
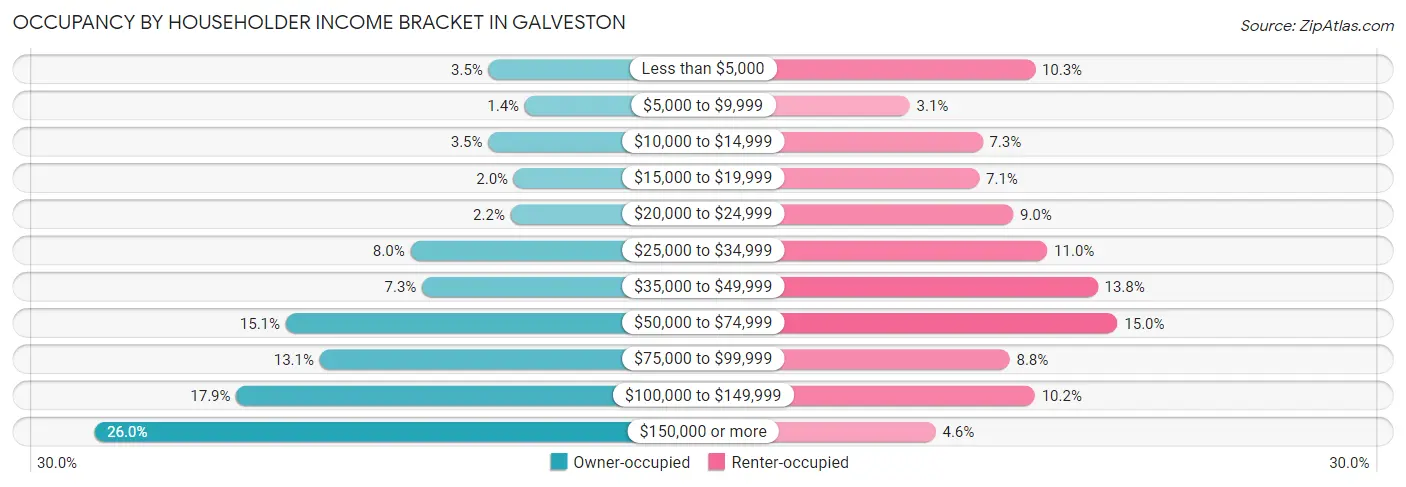
| Income Bracket | Owner-occupied | Renter-occupied |
| Less than $5,000 | 383 (3.5%) | 1,306 (10.2%) |
| $5,000 to $9,999 | 155 (1.4%) | 394 (3.1%) |
| $10,000 to $14,999 | 385 (3.5%) | 924 (7.2%) |
| $15,000 to $19,999 | 224 (2.0%) | 900 (7.1%) |
| $20,000 to $24,999 | 244 (2.2%) | 1,147 (9.0%) |
| $25,000 to $34,999 | 875 (8.0%) | 1,396 (11.0%) |
| $35,000 to $49,999 | 801 (7.3%) | 1,763 (13.8%) |
| $50,000 to $74,999 | 1,658 (15.1%) | 1,906 (15.0%) |
| $75,000 to $99,999 | 1,445 (13.1%) | 1,121 (8.8%) |
| $100,000 to $149,999 | 1,970 (17.9%) | 1,305 (10.2%) |
| $150,000 or more | 2,864 (26.0%) | 582 (4.6%) |
| Total | 11,004 (100.0%) | 12,744 (100.0%) |
Monthly Housing Cost Tiers in Galveston
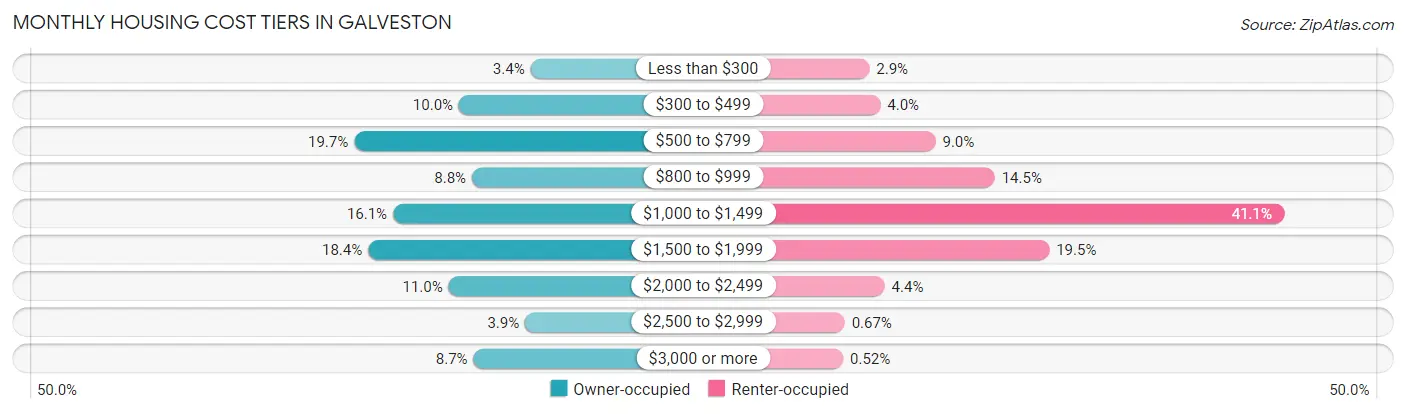
| Monthly Cost | Owner-occupied | Renter-occupied |
| Less than $300 | 377 (3.4%) | 375 (2.9%) |
| $300 to $499 | 1,103 (10.0%) | 503 (4.0%) |
| $500 to $799 | 2,164 (19.7%) | 1,151 (9.0%) |
| $800 to $999 | 971 (8.8%) | 1,845 (14.5%) |
| $1,000 to $1,499 | 1,771 (16.1%) | 5,236 (41.1%) |
| $1,500 to $1,999 | 2,023 (18.4%) | 2,485 (19.5%) |
| $2,000 to $2,499 | 1,207 (11.0%) | 554 (4.3%) |
| $2,500 to $2,999 | 433 (3.9%) | 85 (0.7%) |
| $3,000 or more | 955 (8.7%) | 66 (0.5%) |
| Total | 11,004 (100.0%) | 12,744 (100.0%) |
Physical Housing Characteristics in Galveston
Housing Structures in Galveston
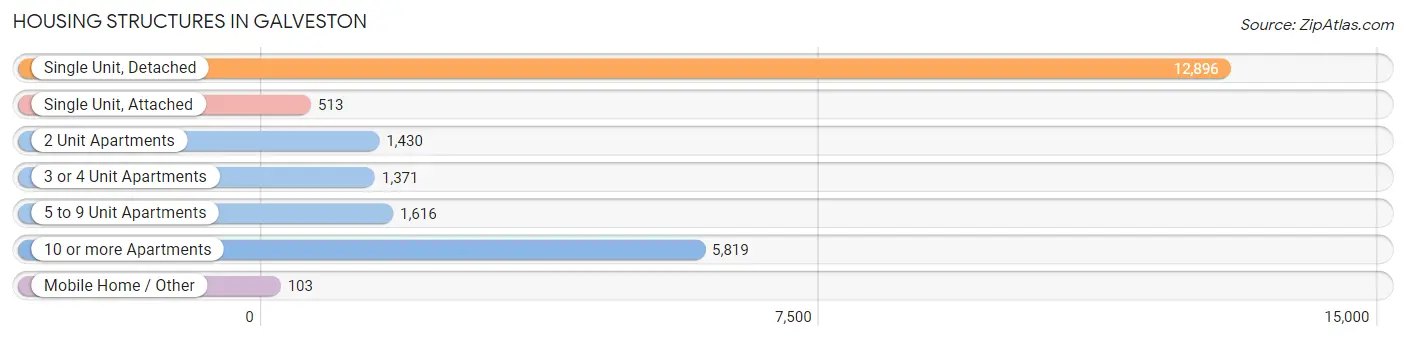
| Structure Type | # Housing Units | % Housing Units |
| Single Unit, Detached | 12,896 | 54.3% |
| Single Unit, Attached | 513 | 2.2% |
| 2 Unit Apartments | 1,430 | 6.0% |
| 3 or 4 Unit Apartments | 1,371 | 5.8% |
| 5 to 9 Unit Apartments | 1,616 | 6.8% |
| 10 or more Apartments | 5,819 | 24.5% |
| Mobile Home / Other | 103 | 0.4% |
| Total | 23,748 | 100.0% |
Housing Structures by Occupancy in Galveston
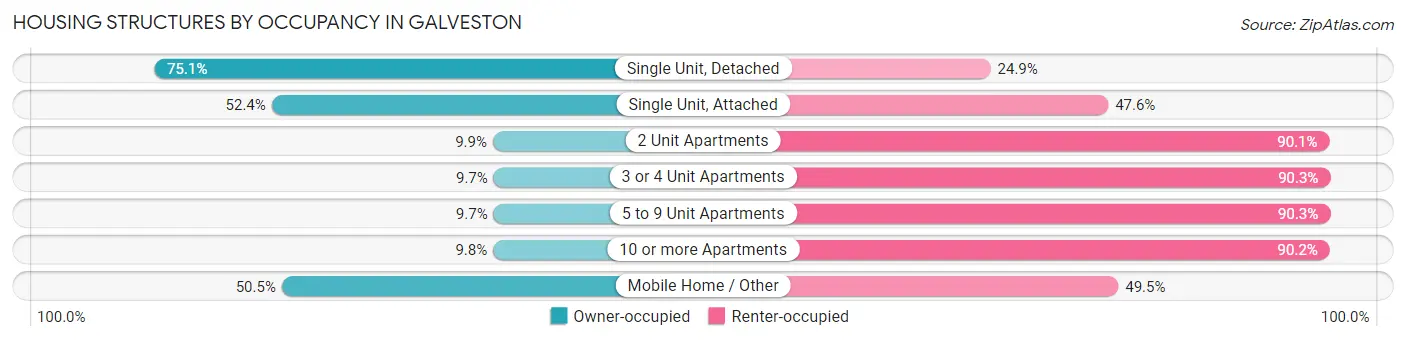
| Structure Type | Owner-occupied | Renter-occupied |
| Single Unit, Detached | 9,682 (75.1%) | 3,214 (24.9%) |
| Single Unit, Attached | 269 (52.4%) | 244 (47.6%) |
| 2 Unit Apartments | 141 (9.9%) | 1,289 (90.1%) |
| 3 or 4 Unit Apartments | 133 (9.7%) | 1,238 (90.3%) |
| 5 to 9 Unit Apartments | 157 (9.7%) | 1,459 (90.3%) |
| 10 or more Apartments | 570 (9.8%) | 5,249 (90.2%) |
| Mobile Home / Other | 52 (50.5%) | 51 (49.5%) |
| Total | 11,004 (46.3%) | 12,744 (53.7%) |
Housing Structures by Number of Rooms in Galveston
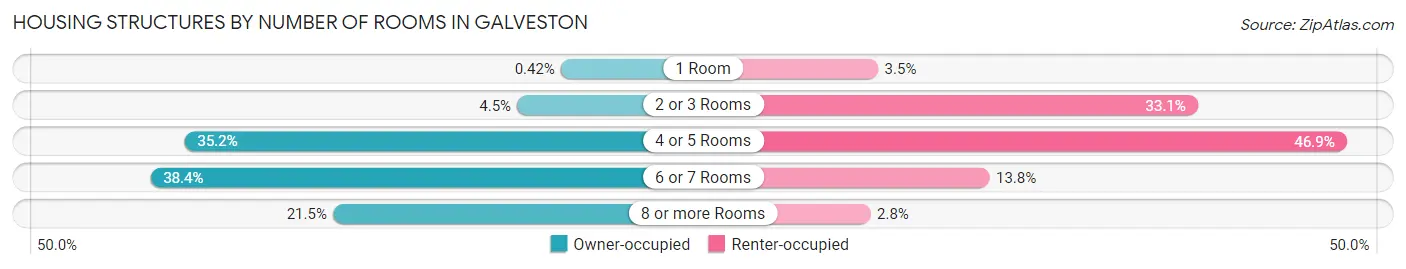
| Number of Rooms | Owner-occupied | Renter-occupied |
| 1 Room | 46 (0.4%) | 445 (3.5%) |
| 2 or 3 Rooms | 492 (4.5%) | 4,216 (33.1%) |
| 4 or 5 Rooms | 3,877 (35.2%) | 5,970 (46.9%) |
| 6 or 7 Rooms | 4,223 (38.4%) | 1,758 (13.8%) |
| 8 or more Rooms | 2,366 (21.5%) | 355 (2.8%) |
| Total | 11,004 (100.0%) | 12,744 (100.0%) |
Housing Structure by Heating Type in Galveston
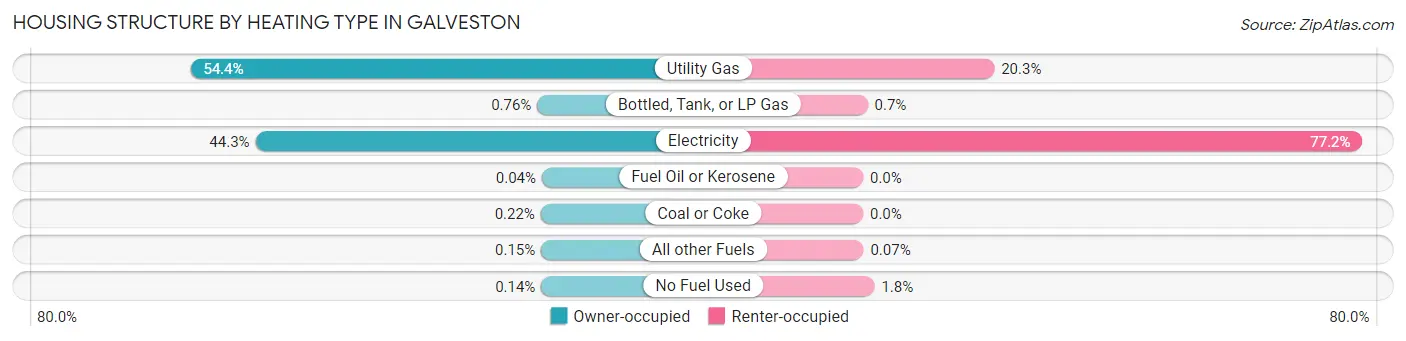
| Heating Type | Owner-occupied | Renter-occupied |
| Utility Gas | 5,984 (54.4%) | 2,584 (20.3%) |
| Bottled, Tank, or LP Gas | 84 (0.8%) | 89 (0.7%) |
| Electricity | 4,877 (44.3%) | 9,836 (77.2%) |
| Fuel Oil or Kerosene | 4 (0.0%) | 0 (0.0%) |
| Coal or Coke | 24 (0.2%) | 0 (0.0%) |
| All other Fuels | 16 (0.2%) | 9 (0.1%) |
| No Fuel Used | 15 (0.1%) | 226 (1.8%) |
| Total | 11,004 (100.0%) | 12,744 (100.0%) |
Household Vehicle Usage in Galveston
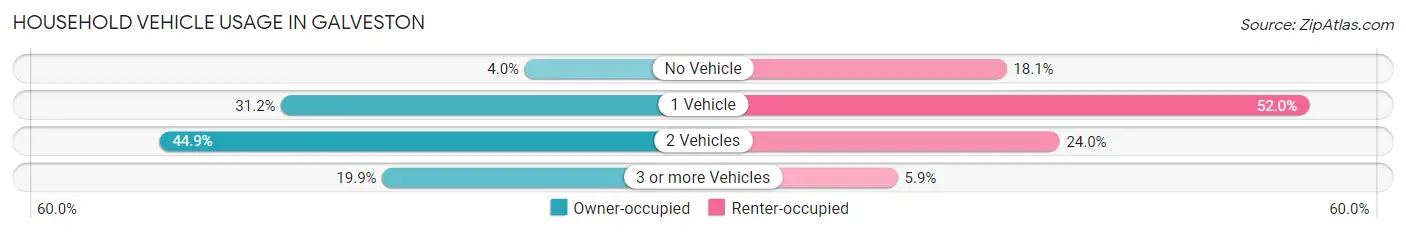
| Vehicles per Household | Owner-occupied | Renter-occupied |
| No Vehicle | 435 (4.0%) | 2,305 (18.1%) |
| 1 Vehicle | 3,437 (31.2%) | 6,625 (52.0%) |
| 2 Vehicles | 4,940 (44.9%) | 3,062 (24.0%) |
| 3 or more Vehicles | 2,192 (19.9%) | 752 (5.9%) |
| Total | 11,004 (100.0%) | 12,744 (100.0%) |
Real Estate & Mortgages in Galveston
Real Estate and Mortgage Overview in Galveston
| Characteristic | Without Mortgage | With Mortgage |
| Housing Units | 6,263 | 4,741 |
| Median Property Value | $234,700 | $285,900 |
| Median Household Income | $69,541 | $1,461 |
| Monthly Housing Costs | $734 | $916 |
| Real Estate Taxes | $2,756 | $68 |
Property Value by Mortgage Status in Galveston
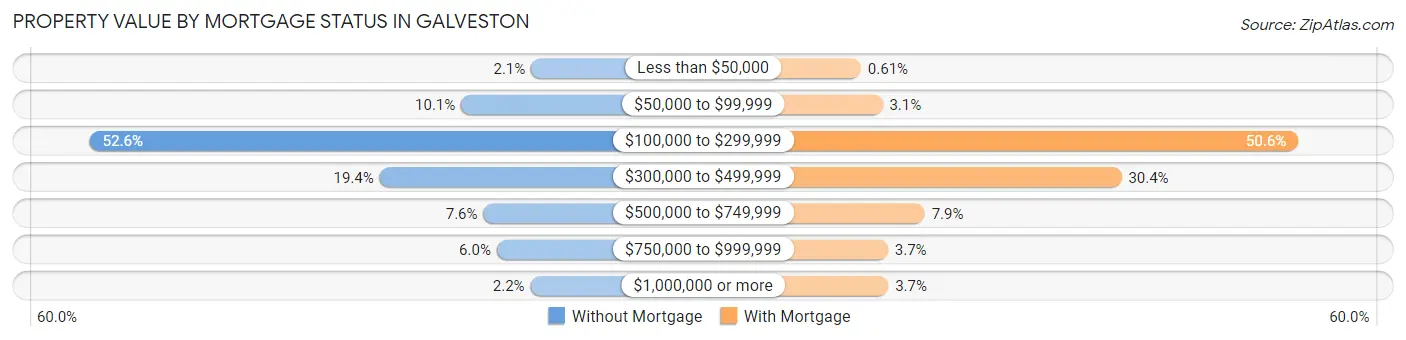
| Property Value | Without Mortgage | With Mortgage |
| Less than $50,000 | 132 (2.1%) | 29 (0.6%) |
| $50,000 to $99,999 | 633 (10.1%) | 146 (3.1%) |
| $100,000 to $299,999 | 3,292 (52.6%) | 2,398 (50.6%) |
| $300,000 to $499,999 | 1,217 (19.4%) | 1,441 (30.4%) |
| $500,000 to $749,999 | 474 (7.6%) | 375 (7.9%) |
| $750,000 to $999,999 | 378 (6.0%) | 175 (3.7%) |
| $1,000,000 or more | 137 (2.2%) | 177 (3.7%) |
| Total | 6,263 (100.0%) | 4,741 (100.0%) |
Household Income by Mortgage Status in Galveston
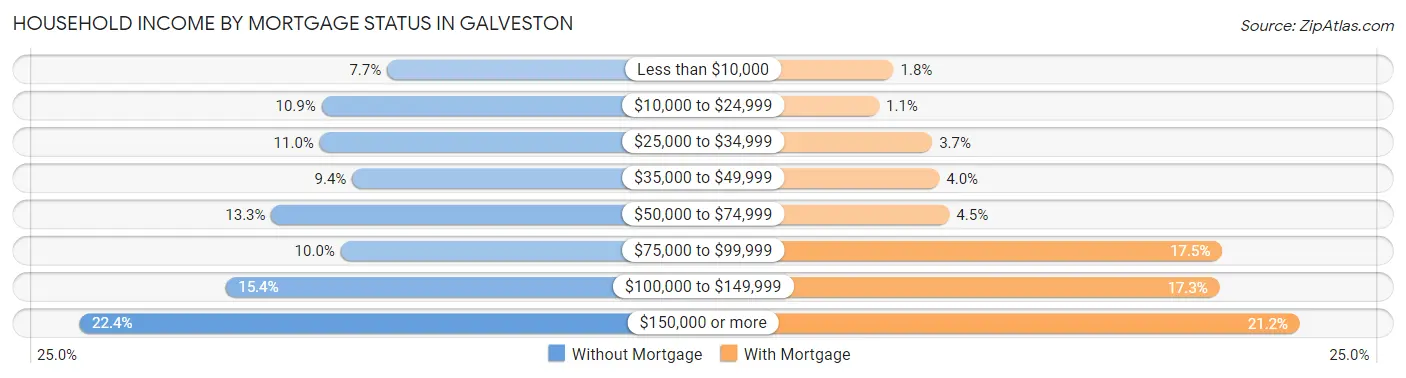
| Household Income | Without Mortgage | With Mortgage |
| Less than $10,000 | 485 (7.7%) | 86 (1.8%) |
| $10,000 to $24,999 | 680 (10.9%) | 53 (1.1%) |
| $25,000 to $34,999 | 686 (11.0%) | 173 (3.6%) |
| $35,000 to $49,999 | 589 (9.4%) | 189 (4.0%) |
| $50,000 to $74,999 | 830 (13.3%) | 212 (4.5%) |
| $75,000 to $99,999 | 623 (10.0%) | 828 (17.5%) |
| $100,000 to $149,999 | 967 (15.4%) | 822 (17.3%) |
| $150,000 or more | 1,403 (22.4%) | 1,003 (21.2%) |
| Total | 6,263 (100.0%) | 4,741 (100.0%) |
Property Value to Household Income Ratio in Galveston
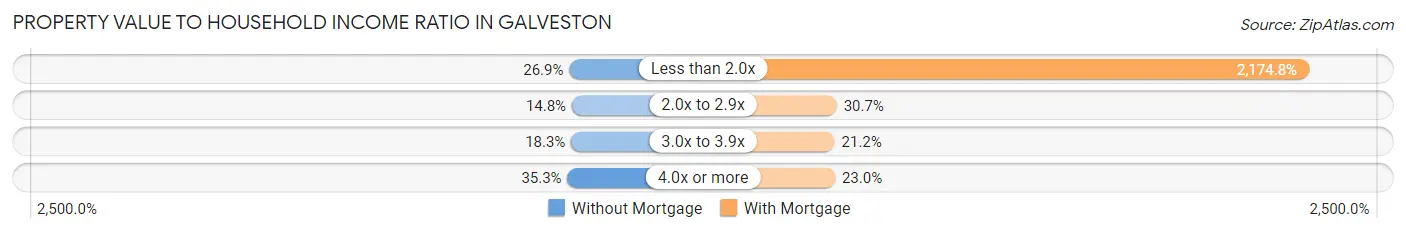
| Value-to-Income Ratio | Without Mortgage | With Mortgage |
| Less than 2.0x | 1,686 (26.9%) | 103,105 (2,174.7%) |
| 2.0x to 2.9x | 928 (14.8%) | 1,457 (30.7%) |
| 3.0x to 3.9x | 1,144 (18.3%) | 1,005 (21.2%) |
| 4.0x or more | 2,210 (35.3%) | 1,091 (23.0%) |
| Total | 6,263 (100.0%) | 4,741 (100.0%) |
Real Estate Taxes by Mortgage Status in Galveston
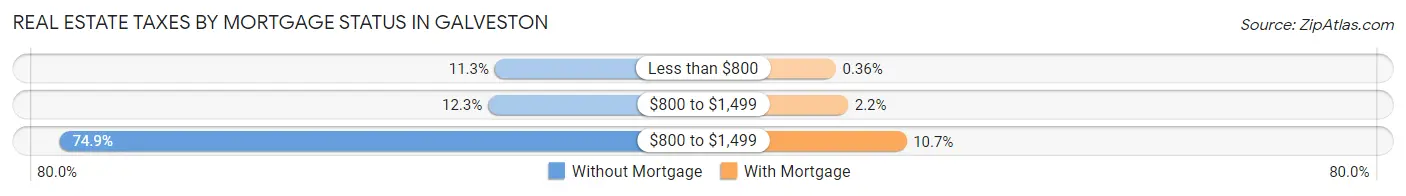
| Property Taxes | Without Mortgage | With Mortgage |
| Less than $800 | 707 (11.3%) | 17 (0.4%) |
| $800 to $1,499 | 769 (12.3%) | 102 (2.1%) |
| $800 to $1,499 | 4,691 (74.9%) | 507 (10.7%) |
| Total | 6,263 (100.0%) | 4,741 (100.0%) |
Health & Disability in Galveston
Health Insurance Coverage by Age in Galveston
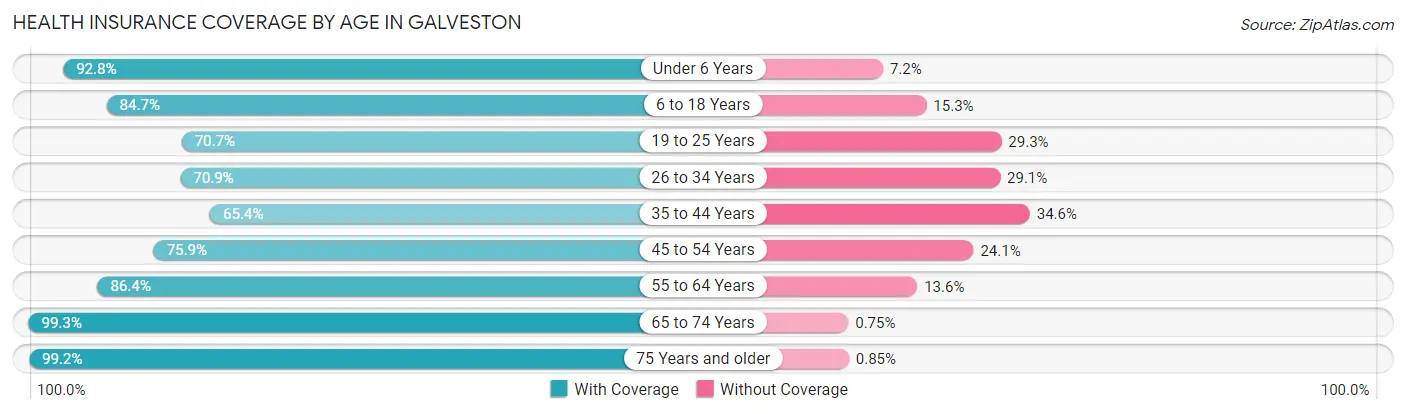
| Age Bracket | With Coverage | Without Coverage |
| Under 6 Years | 2,689 (92.8%) | 209 (7.2%) |
| 6 to 18 Years | 5,262 (84.7%) | 951 (15.3%) |
| 19 to 25 Years | 4,578 (70.7%) | 1,897 (29.3%) |
| 26 to 34 Years | 5,096 (70.9%) | 2,088 (29.1%) |
| 35 to 44 Years | 3,274 (65.4%) | 1,732 (34.6%) |
| 45 to 54 Years | 4,207 (75.9%) | 1,335 (24.1%) |
| 55 to 64 Years | 6,506 (86.4%) | 1,024 (13.6%) |
| 65 to 74 Years | 6,488 (99.3%) | 49 (0.7%) |
| 75 Years and older | 3,504 (99.2%) | 30 (0.9%) |
| Total | 41,604 (81.7%) | 9,315 (18.3%) |
Health Insurance Coverage by Citizenship Status in Galveston
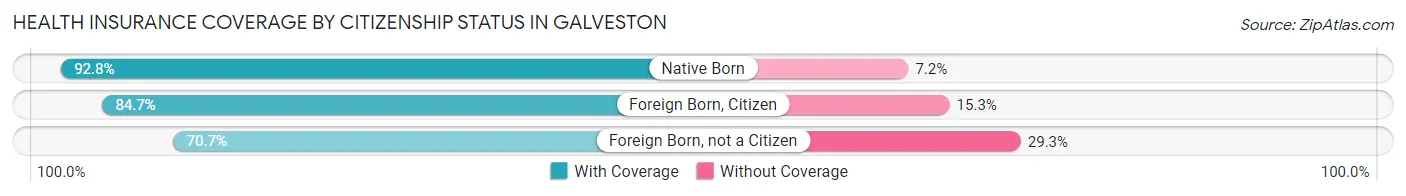
| Citizenship Status | With Coverage | Without Coverage |
| Native Born | 2,689 (92.8%) | 209 (7.2%) |
| Foreign Born, Citizen | 5,262 (84.7%) | 951 (15.3%) |
| Foreign Born, not a Citizen | 4,578 (70.7%) | 1,897 (29.3%) |
Health Insurance Coverage by Household Income in Galveston
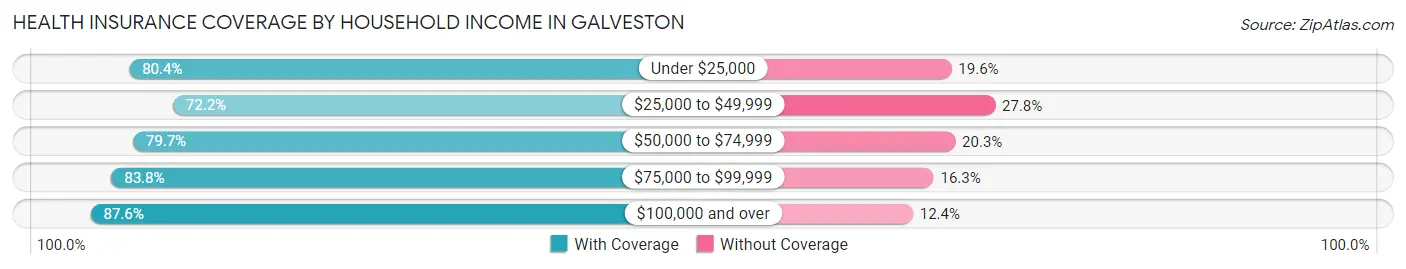
| Household Income | With Coverage | Without Coverage |
| Under $25,000 | 7,684 (80.4%) | 1,873 (19.6%) |
| $25,000 to $49,999 | 6,956 (72.2%) | 2,677 (27.8%) |
| $50,000 to $74,999 | 5,668 (79.7%) | 1,444 (20.3%) |
| $75,000 to $99,999 | 5,196 (83.8%) | 1,008 (16.3%) |
| $100,000 and over | 14,816 (87.6%) | 2,090 (12.4%) |
Public vs Private Health Insurance Coverage by Age in Galveston
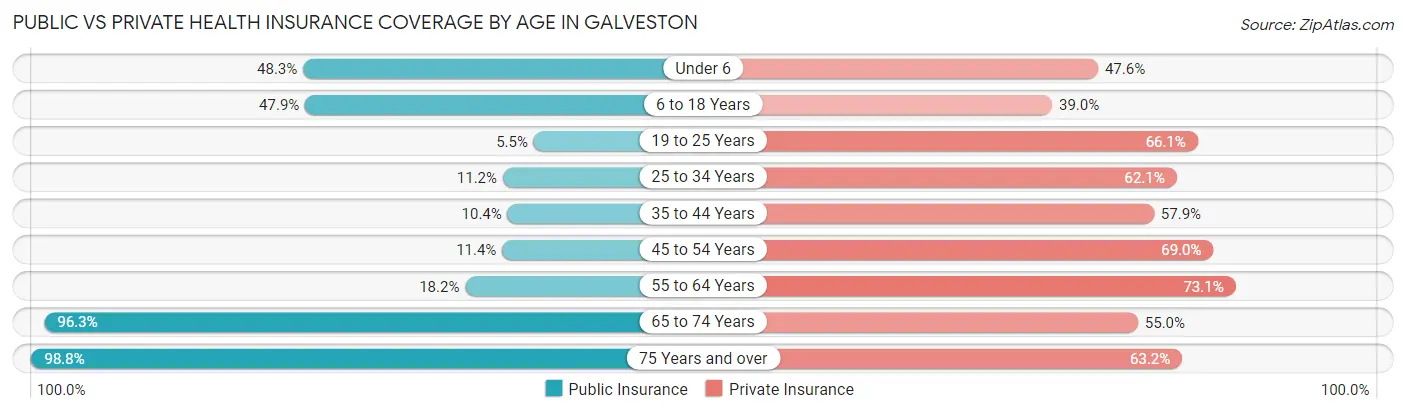
| Age Bracket | Public Insurance | Private Insurance |
| Under 6 | 1,400 (48.3%) | 1,378 (47.5%) |
| 6 to 18 Years | 2,977 (47.9%) | 2,425 (39.0%) |
| 19 to 25 Years | 355 (5.5%) | 4,277 (66.0%) |
| 25 to 34 Years | 807 (11.2%) | 4,464 (62.1%) |
| 35 to 44 Years | 518 (10.3%) | 2,900 (57.9%) |
| 45 to 54 Years | 629 (11.4%) | 3,822 (69.0%) |
| 55 to 64 Years | 1,371 (18.2%) | 5,502 (73.1%) |
| 65 to 74 Years | 6,298 (96.3%) | 3,592 (54.9%) |
| 75 Years and over | 3,490 (98.8%) | 2,232 (63.2%) |
| Total | 17,845 (35.0%) | 30,592 (60.1%) |
Disability Status by Sex by Age in Galveston
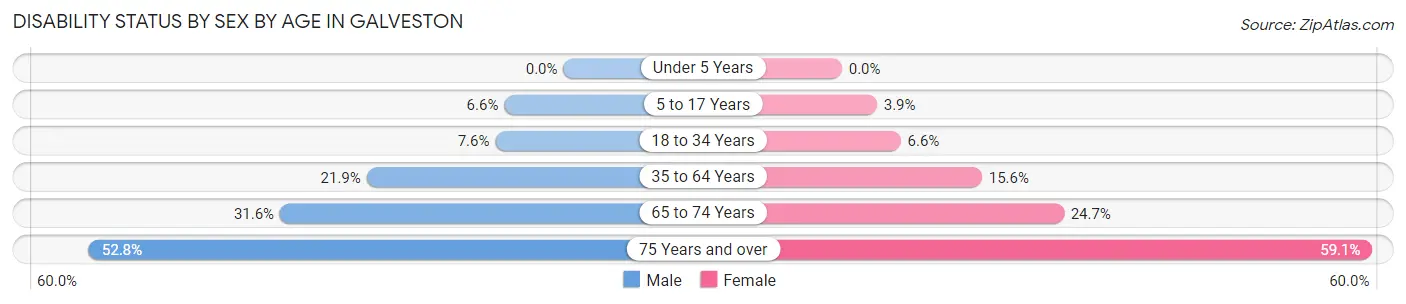
| Age Bracket | Male | Female |
| Under 5 Years | 0 (0.0%) | 0 (0.0%) |
| 5 to 17 Years | 202 (6.6%) | 114 (3.9%) |
| 18 to 34 Years | 540 (7.6%) | 480 (6.6%) |
| 35 to 64 Years | 1,961 (21.9%) | 1,423 (15.6%) |
| 65 to 74 Years | 1,071 (31.6%) | 777 (24.7%) |
| 75 Years and over | 855 (52.8%) | 1,132 (59.1%) |
Disability Class by Sex by Age in Galveston
Disability Class: Hearing Difficulty
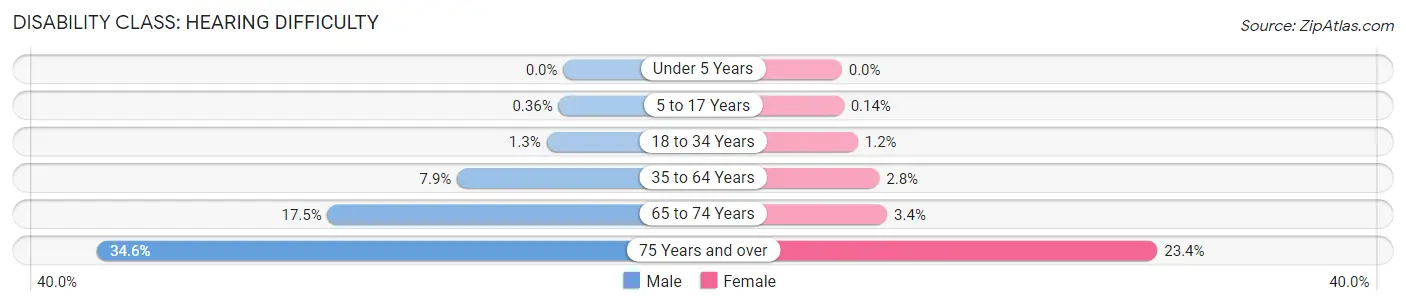
| Age Bracket | Male | Female |
| Under 5 Years | 0 (0.0%) | 0 (0.0%) |
| 5 to 17 Years | 11 (0.4%) | 4 (0.1%) |
| 18 to 34 Years | 89 (1.3%) | 87 (1.2%) |
| 35 to 64 Years | 705 (7.9%) | 255 (2.8%) |
| 65 to 74 Years | 594 (17.5%) | 106 (3.4%) |
| 75 Years and over | 560 (34.6%) | 449 (23.4%) |
Disability Class: Vision Difficulty
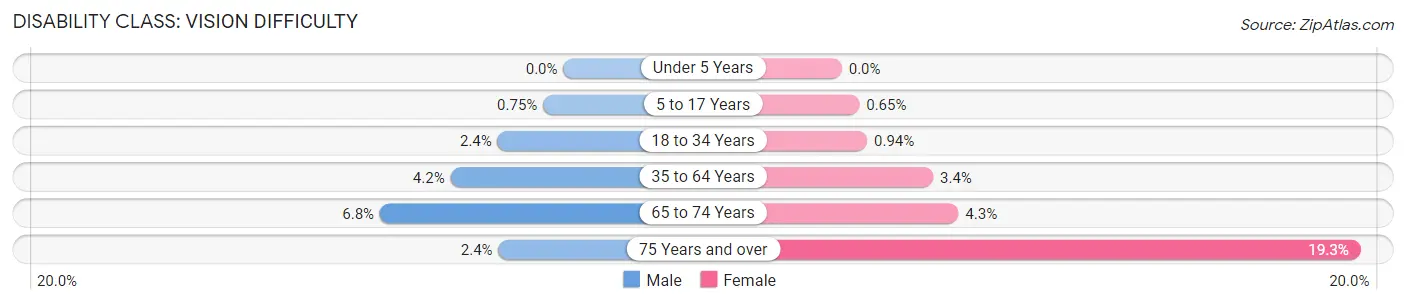
| Age Bracket | Male | Female |
| Under 5 Years | 0 (0.0%) | 0 (0.0%) |
| 5 to 17 Years | 23 (0.7%) | 19 (0.6%) |
| 18 to 34 Years | 174 (2.4%) | 69 (0.9%) |
| 35 to 64 Years | 375 (4.2%) | 309 (3.4%) |
| 65 to 74 Years | 231 (6.8%) | 136 (4.3%) |
| 75 Years and over | 39 (2.4%) | 369 (19.3%) |
Disability Class: Cognitive Difficulty
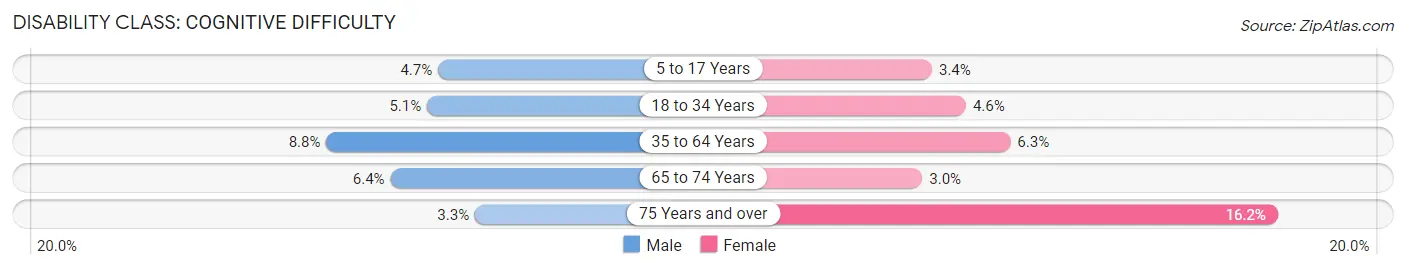
| Age Bracket | Male | Female |
| 5 to 17 Years | 143 (4.6%) | 98 (3.4%) |
| 18 to 34 Years | 360 (5.1%) | 338 (4.6%) |
| 35 to 64 Years | 788 (8.8%) | 571 (6.3%) |
| 65 to 74 Years | 218 (6.4%) | 94 (3.0%) |
| 75 Years and over | 53 (3.3%) | 310 (16.2%) |
Disability Class: Ambulatory Difficulty
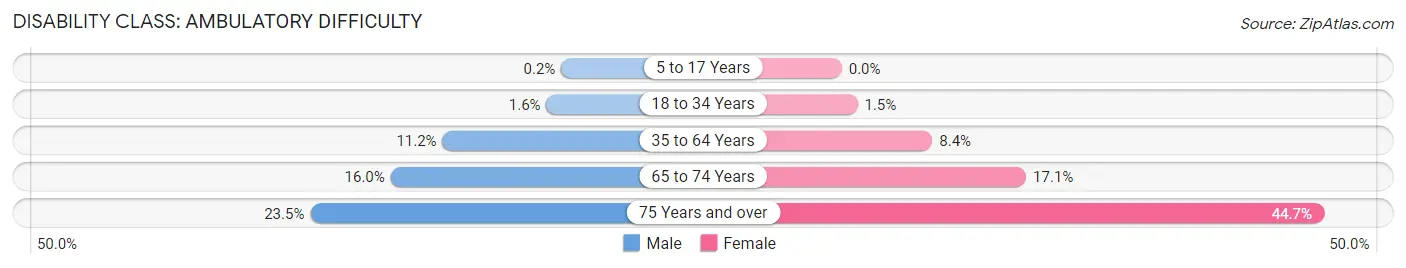
| Age Bracket | Male | Female |
| 5 to 17 Years | 6 (0.2%) | 0 (0.0%) |
| 18 to 34 Years | 112 (1.6%) | 107 (1.5%) |
| 35 to 64 Years | 1,004 (11.2%) | 767 (8.4%) |
| 65 to 74 Years | 544 (16.0%) | 538 (17.1%) |
| 75 Years and over | 380 (23.5%) | 857 (44.7%) |
Disability Class: Self-Care Difficulty
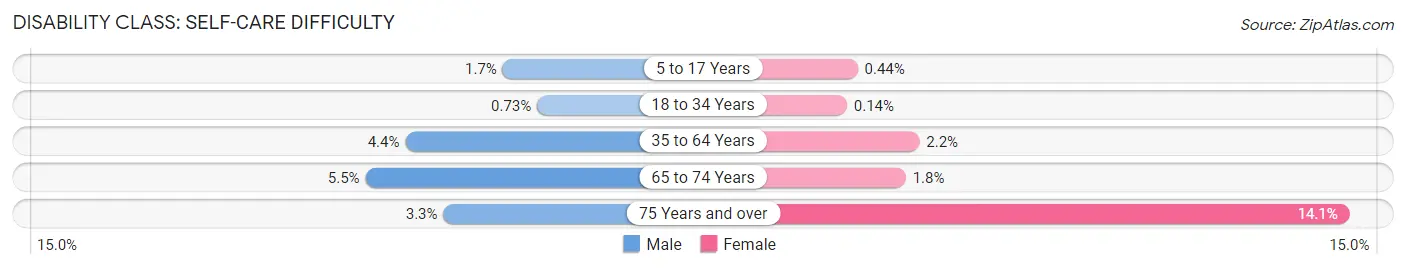
| Age Bracket | Male | Female |
| 5 to 17 Years | 52 (1.7%) | 13 (0.4%) |
| 18 to 34 Years | 52 (0.7%) | 10 (0.1%) |
| 35 to 64 Years | 394 (4.4%) | 197 (2.2%) |
| 65 to 74 Years | 187 (5.5%) | 56 (1.8%) |
| 75 Years and over | 54 (3.3%) | 271 (14.1%) |
Technology Access in Galveston
Computing Device Access in Galveston

| Device Type | # Households | % Households |
| Desktop or Laptop | 17,528 | 73.8% |
| Smartphone | 21,229 | 89.4% |
| Tablet | 13,285 | 55.9% |
| No Computing Device | 1,434 | 6.0% |
| Total | 23,748 | 100.0% |
Internet Access in Galveston
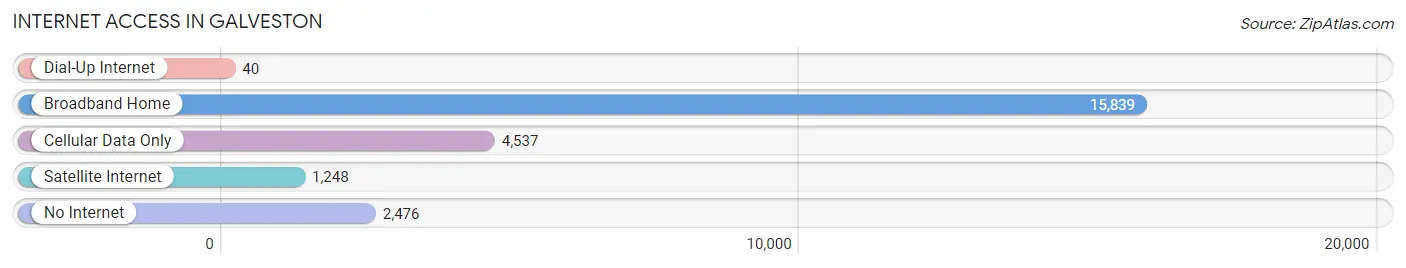
| Internet Type | # Households | % Households |
| Dial-Up Internet | 40 | 0.2% |
| Broadband Home | 15,839 | 66.7% |
| Cellular Data Only | 4,537 | 19.1% |
| Satellite Internet | 1,248 | 5.3% |
| No Internet | 2,476 | 10.4% |
| Total | 23,748 | 100.0% |
Galveston Summary
Galveston, Texas is a city located on the Gulf Coast of the United States. It is the county seat of Galveston County and is the second-largest city in the state of Texas. The city is located on Galveston Island, which is connected to the mainland by two bridges. Galveston is known for its rich history, beautiful beaches, and vibrant culture.
History
Galveston was founded in 1839 by Michel B. Menard and a group of investors. The city was named after Bernardo de Galvez, a Spanish colonial governor of Louisiana. Galveston quickly became a major port city and was the largest city in Texas by 1860. During the Civil War, the city was occupied by Union forces and was the site of the Battle of Galveston in 1863.
After the war, Galveston experienced a period of rapid growth and development. The city was home to a number of prominent businesses, including the Galveston Wharf Company, the Galveston Cotton Exchange, and the Galveston News. In 1900, the city was devastated by a hurricane that killed an estimated 8,000 people. The city was rebuilt and continued to grow, becoming a major tourist destination in the early 20th century.
Geography
Galveston is located on Galveston Island, which is connected to the mainland by two bridges. The island is approximately 27 miles long and 3 miles wide. The city is located on the Gulf of Mexico and is bordered by the cities of Texas City and La Marque. The city has a humid subtropical climate, with hot, humid summers and mild winters.
Economy
Galveston’s economy is largely based on tourism, with the city being home to a number of popular attractions, including Moody Gardens, Schlitterbahn Waterpark, and the Galveston Island Historic Pleasure Pier. The city is also home to a number of businesses, including the Port of Galveston, the Galveston Wharf Company, and the Galveston Cotton Exchange.
Demographics
As of the 2010 census, the population of Galveston was 47,743. The city is majority white (63.2%), with African Americans making up the largest minority group (25.2%). The median household income in the city is $41,945, and the median age is 37.7.
Galveston is a vibrant city with a rich history and a bright future. The city is home to a number of attractions, businesses, and residents, making it a great place to live and visit.
Common Questions
What is Per Capita Income in Galveston?
Per Capita income in Galveston is $37,464.
What is the Median Family Income in Galveston?
Median Family Income in Galveston is $83,331.
What is the Median Household income in Galveston?
Median Household Income in Galveston is $57,453.
What is Income or Wage Gap in Galveston?
Income or Wage Gap in Galveston is 13.3%.
Women in Galveston earn 86.7 cents for every dollar earned by a man.
What is Family Income Deficit in Galveston?
Family Income Deficit in Galveston is $11,207.
Families that are below poverty line in Galveston earn $11,207 less on average than the poverty threshold level.
What is Inequality or Gini Index in Galveston?
Inequality or Gini Index in Galveston is 0.51.
What is the Total Population of Galveston?
Total Population of Galveston is 53,265.
What is the Total Male Population of Galveston?
Total Male Population of Galveston is 27,240.
What is the Total Female Population of Galveston?
Total Female Population of Galveston is 26,025.
What is the Ratio of Males per 100 Females in Galveston?
There are 104.67 Males per 100 Females in Galveston.
What is the Ratio of Females per 100 Males in Galveston?
There are 95.54 Females per 100 Males in Galveston.
What is the Median Population Age in Galveston?
Median Population Age in Galveston is 39.4 Years.
What is the Average Family Size in Galveston
Average Family Size in Galveston is 2.8 People.
What is the Average Household Size in Galveston
Average Household Size in Galveston is 2.1 People.
How Large is the Labor Force in Galveston?
There are 26,724 People in the Labor Forcein in Galveston.
What is the Percentage of People in the Labor Force in Galveston?
58.0% of People are in the Labor Force in Galveston.
What is the Unemployment Rate in Galveston?
Unemployment Rate in Galveston is 6.8%.