Arden Arcade, CA Map & Demographics
Arden Arcade Map
Arden Arcade Overview
$42,480
PER CAPITA INCOME
$81,840
AVG FAMILY INCOME
$64,479
AVG HOUSEHOLD INCOME
17.3%
WAGE / INCOME GAP [ % ]
82.7¢/ $1
WAGE / INCOME GAP [ $ ]
$12,554
FAMILY INCOME DEFICIT
0.52
INEQUALITY / GINI INDEX
96,076
TOTAL POPULATION
46,022
MALE POPULATION
50,054
FEMALE POPULATION
91.94
MALES / 100 FEMALES
108.76
FEMALES / 100 MALES
37.0
MEDIAN AGE
3.1
AVG FAMILY SIZE
2.4
AVG HOUSEHOLD SIZE
47,709
LABOR FORCE [ PEOPLE ]
62.6%
PERCENT IN LABOR FORCE
8.1%
UNEMPLOYMENT RATE
Income in Arden Arcade
Income Overview in Arden Arcade
Per Capita Income in Arden Arcade is $42,480, while median incomes of families and households are $81,840 and $64,479 respectively.
| Characteristic | Number | Measure |
| Per Capita Income | 96,076 | $42,480 |
| Median Family Income | 22,768 | $81,840 |
| Mean Family Income | 22,768 | $126,451 |
| Median Household Income | 39,044 | $64,479 |
| Mean Household Income | 39,044 | $102,397 |
| Income Deficit | 22,768 | $12,554 |
| Wage / Income Gap (%) | 96,076 | 17.28% |
| Wage / Income Gap ($) | 96,076 | 82.72¢ per $1 |
| Gini / Inequality Index | 96,076 | 0.52 |
Earnings by Sex in Arden Arcade
Average Earnings in Arden Arcade are $39,372, $42,515 for men and $35,169 for women, a difference of 17.3%.
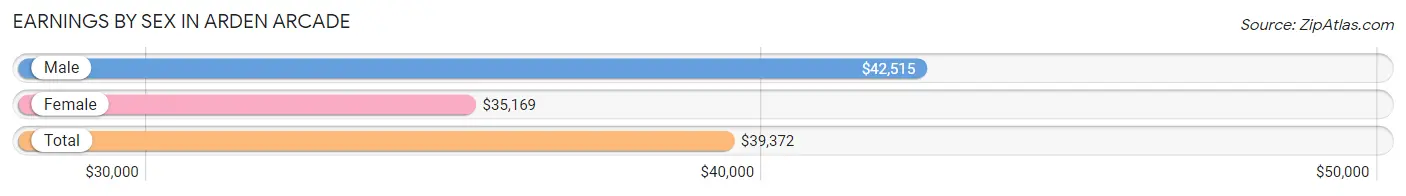
| Sex | Number | Average Earnings |
| Male | 24,532 (50.7%) | $42,515 |
| Female | 23,825 (49.3%) | $35,169 |
| Total | 48,357 (100.0%) | $39,372 |
Earnings by Sex by Income Bracket in Arden Arcade
The most common earnings brackets in Arden Arcade are $100,000+ for men (4,528 | 18.5%) and $100,000+ for women (3,525 | 14.8%).
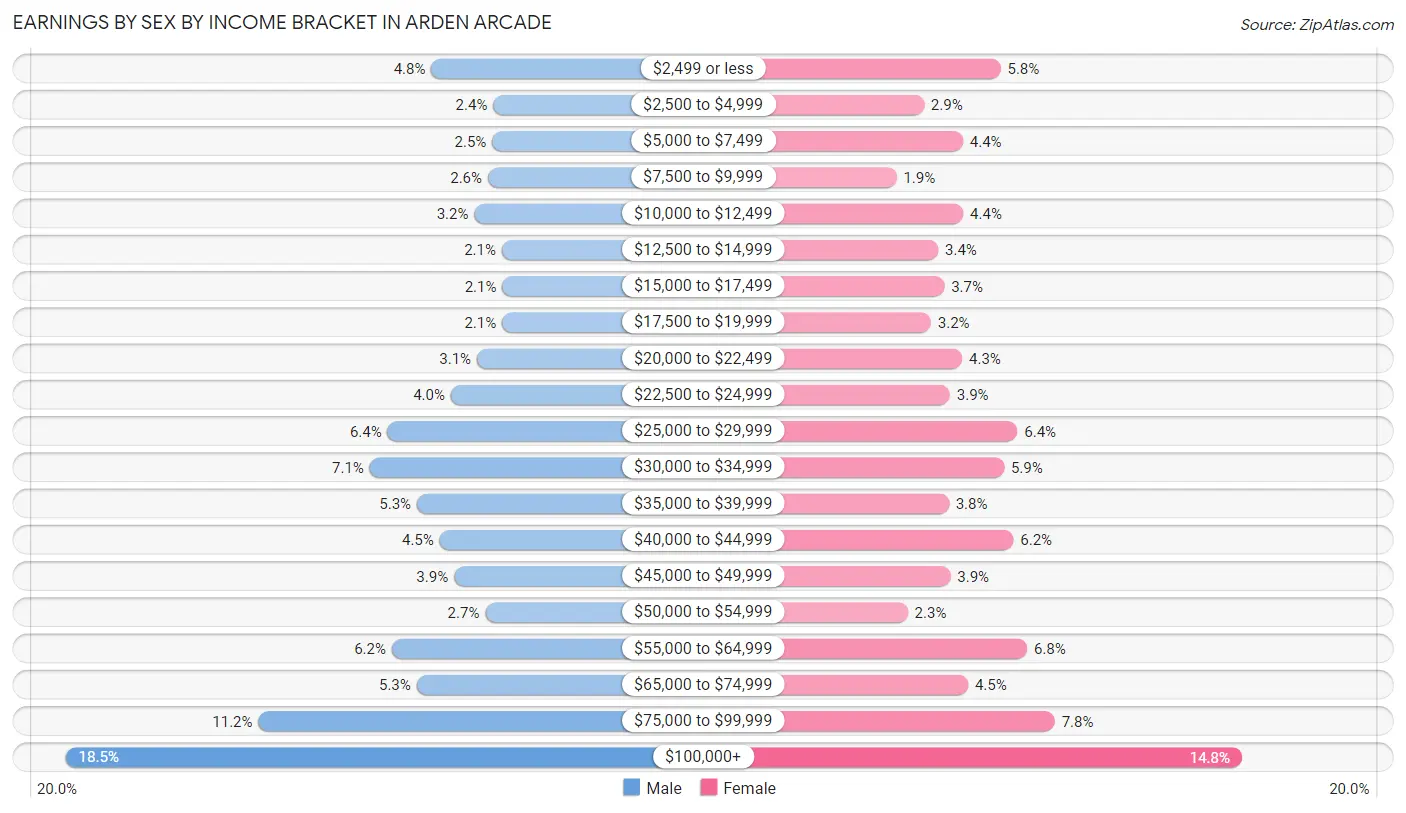
| Income | Male | Female |
| $2,499 or less | 1,168 (4.8%) | 1,373 (5.8%) |
| $2,500 to $4,999 | 599 (2.4%) | 689 (2.9%) |
| $5,000 to $7,499 | 608 (2.5%) | 1,037 (4.3%) |
| $7,500 to $9,999 | 647 (2.6%) | 444 (1.9%) |
| $10,000 to $12,499 | 772 (3.2%) | 1,038 (4.4%) |
| $12,500 to $14,999 | 521 (2.1%) | 816 (3.4%) |
| $15,000 to $17,499 | 514 (2.1%) | 869 (3.6%) |
| $17,500 to $19,999 | 517 (2.1%) | 751 (3.2%) |
| $20,000 to $22,499 | 749 (3.0%) | 1,029 (4.3%) |
| $22,500 to $24,999 | 988 (4.0%) | 919 (3.9%) |
| $25,000 to $29,999 | 1,571 (6.4%) | 1,522 (6.4%) |
| $30,000 to $34,999 | 1,735 (7.1%) | 1,404 (5.9%) |
| $35,000 to $39,999 | 1,299 (5.3%) | 910 (3.8%) |
| $40,000 to $44,999 | 1,092 (4.4%) | 1,486 (6.2%) |
| $45,000 to $49,999 | 960 (3.9%) | 925 (3.9%) |
| $50,000 to $54,999 | 672 (2.7%) | 544 (2.3%) |
| $55,000 to $64,999 | 1,532 (6.2%) | 1,607 (6.8%) |
| $65,000 to $74,999 | 1,302 (5.3%) | 1,082 (4.5%) |
| $75,000 to $99,999 | 2,758 (11.2%) | 1,855 (7.8%) |
| $100,000+ | 4,528 (18.5%) | 3,525 (14.8%) |
| Total | 24,532 (100.0%) | 23,825 (100.0%) |
Earnings by Sex by Educational Attainment in Arden Arcade
Average earnings in Arden Arcade are $47,627 for men and $42,003 for women, a difference of 11.8%. Men with an educational attainment of graduate degree enjoy the highest average annual earnings of $102,364, while those with less than high school education earn the least with $30,584. Women with an educational attainment of graduate degree earn the most with the average annual earnings of $86,549, while those with less than high school education have the smallest earnings of $25,512.
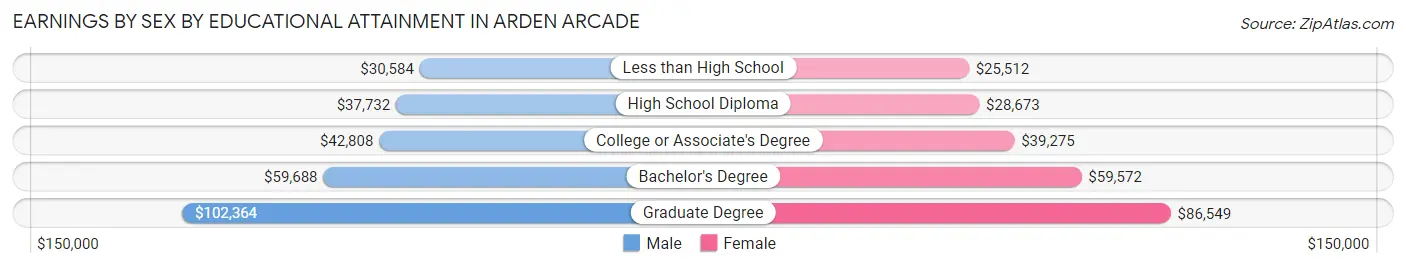
| Educational Attainment | Male Income | Female Income |
| Less than High School | $30,584 | $25,512 |
| High School Diploma | $37,732 | $28,673 |
| College or Associate's Degree | $42,808 | $39,275 |
| Bachelor's Degree | $59,688 | $59,572 |
| Graduate Degree | $102,364 | $86,549 |
| Total | $47,627 | $42,003 |
Family Income in Arden Arcade
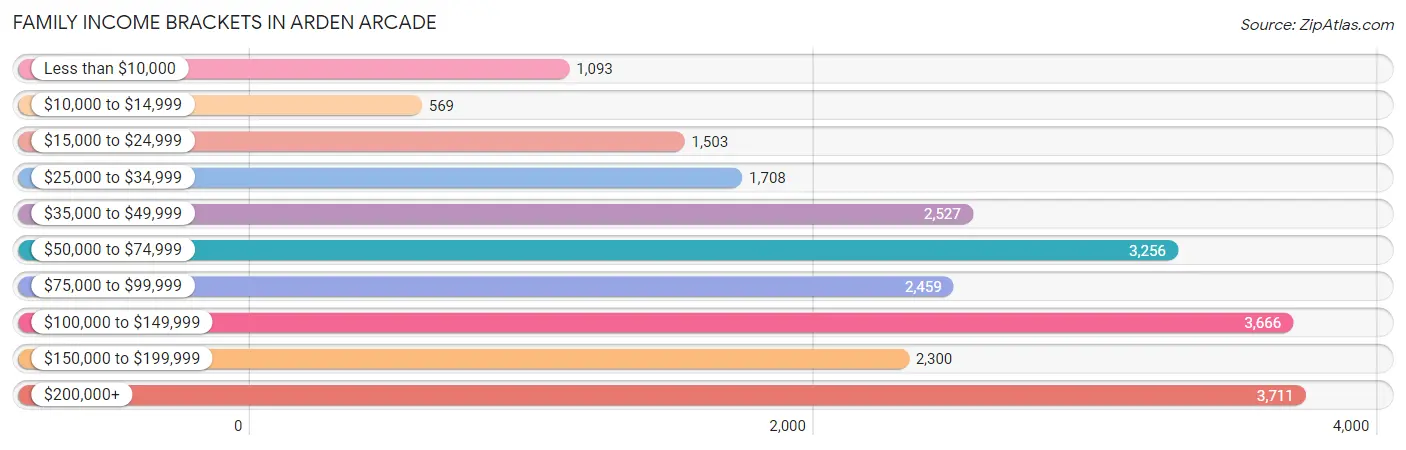
Family Income Brackets in Arden Arcade
According to the Arden Arcade family income data, there are 3,711 families falling into the $200,000+ income range, which is the most common income bracket and makes up 16.3% of all families. Conversely, the $10,000 to $14,999 income bracket is the least frequent group with only 569 families (2.5%) belonging to this category.
| Income Bracket | # Families | % Families |
| Less than $10,000 | 1,093 | 4.8% |
| $10,000 to $14,999 | 569 | 2.5% |
| $15,000 to $24,999 | 1,503 | 6.6% |
| $25,000 to $34,999 | 1,708 | 7.5% |
| $35,000 to $49,999 | 2,527 | 11.1% |
| $50,000 to $74,999 | 3,256 | 14.3% |
| $75,000 to $99,999 | 2,459 | 10.8% |
| $100,000 to $149,999 | 3,666 | 16.1% |
| $150,000 to $199,999 | 2,300 | 10.1% |
| $200,000+ | 3,711 | 16.3% |
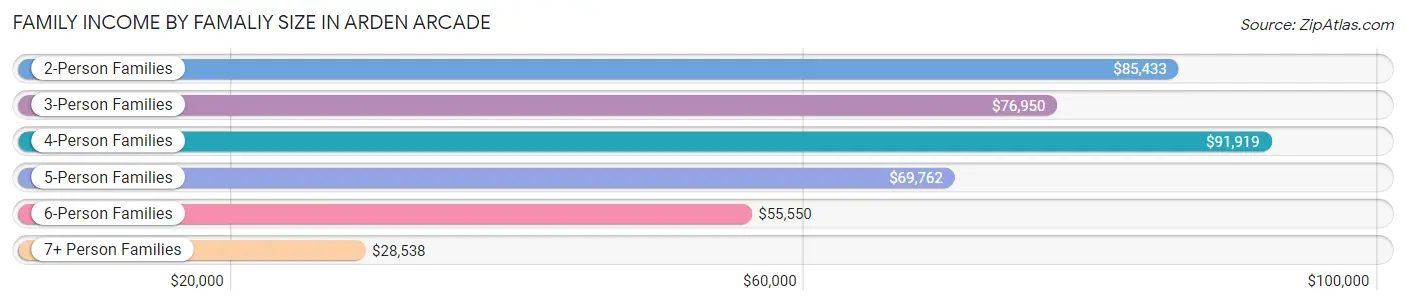
Family Income by Famaliy Size in Arden Arcade
4-person families (4,456 | 19.6%) account for the highest median family income in Arden Arcade with $91,919 per family, while 2-person families (10,840 | 47.6%) have the highest median income of $42,716 per family member.
| Income Bracket | # Families | Median Income |
| 2-Person Families | 10,840 (47.6%) | $85,433 |
| 3-Person Families | 4,765 (20.9%) | $76,950 |
| 4-Person Families | 4,456 (19.6%) | $91,919 |
| 5-Person Families | 1,858 (8.2%) | $69,762 |
| 6-Person Families | 453 (2.0%) | $55,550 |
| 7+ Person Families | 396 (1.7%) | $28,538 |
| Total | 22,768 (100.0%) | $81,840 |
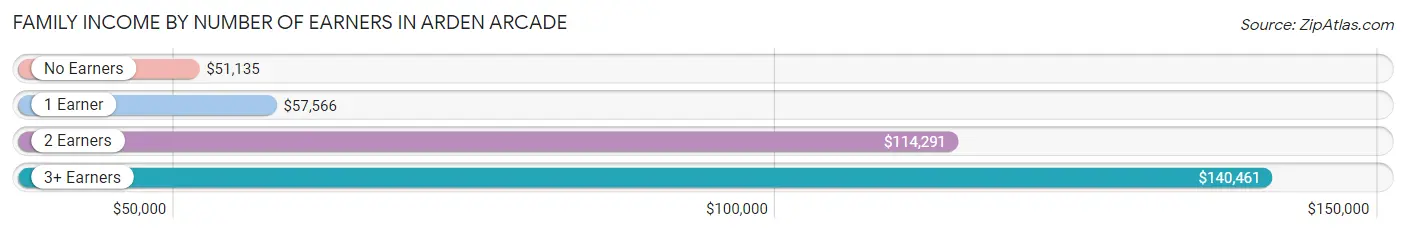
Family Income by Number of Earners in Arden Arcade
The median family income in Arden Arcade is $81,840, with families comprising 3+ earners (1,989) having the highest median family income of $140,461, while families with no earners (3,475) have the lowest median family income of $51,135, accounting for 8.7% and 15.3% of families, respectively.
| Number of Earners | # Families | Median Income |
| No Earners | 3,475 (15.3%) | $51,135 |
| 1 Earner | 9,078 (39.9%) | $57,566 |
| 2 Earners | 8,226 (36.1%) | $114,291 |
| 3+ Earners | 1,989 (8.7%) | $140,461 |
| Total | 22,768 (100.0%) | $81,840 |
Household Income in Arden Arcade
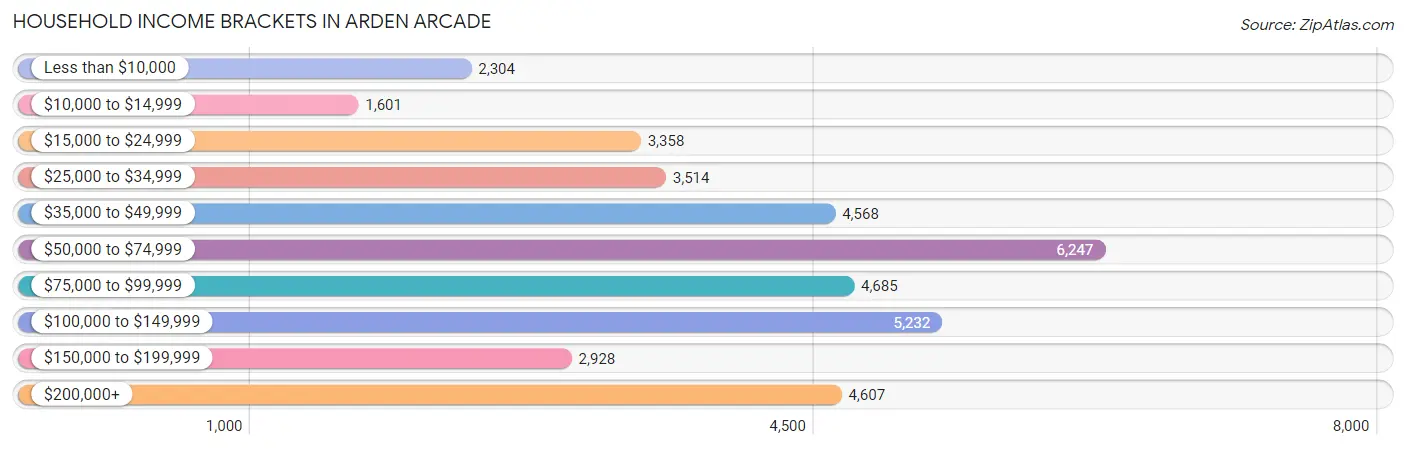
Household Income Brackets in Arden Arcade
With 6,247 households falling in the category, the $50,000 to $74,999 income range is the most frequent in Arden Arcade, accounting for 16.0% of all households. In contrast, only 1,601 households (4.1%) fall into the $10,000 to $14,999 income bracket, making it the least populous group.
| Income Bracket | # Households | % Households |
| Less than $10,000 | 2,304 | 5.9% |
| $10,000 to $14,999 | 1,601 | 4.1% |
| $15,000 to $24,999 | 3,358 | 8.6% |
| $25,000 to $34,999 | 3,514 | 9.0% |
| $35,000 to $49,999 | 4,568 | 11.7% |
| $50,000 to $74,999 | 6,247 | 16.0% |
| $75,000 to $99,999 | 4,685 | 12.0% |
| $100,000 to $149,999 | 5,232 | 13.4% |
| $150,000 to $199,999 | 2,928 | 7.5% |
| $200,000+ | 4,607 | 11.8% |
Household Income by Householder Age in Arden Arcade
The median household income in Arden Arcade is $64,479, with the highest median household income of $82,901 found in the 45 to 64 years age bracket for the primary householder. A total of 13,164 households (33.7%) fall into this category. Meanwhile, the 15 to 24 years age bracket for the primary householder has the lowest median household income of $45,426, with 1,644 households (4.2%) in this group.
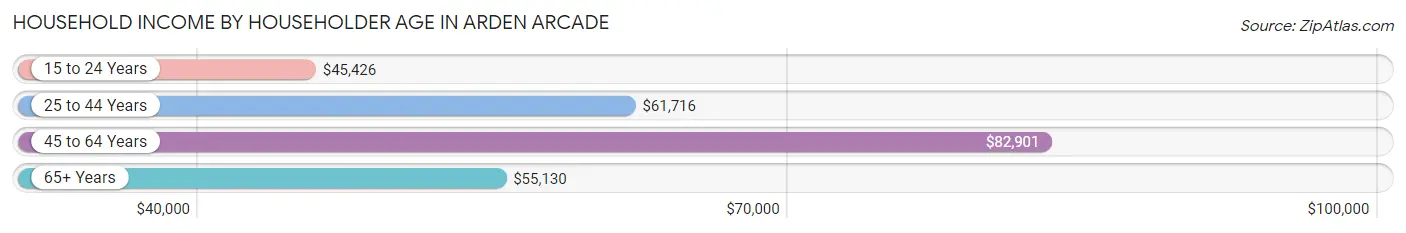
| Income Bracket | # Households | Median Income |
| 15 to 24 Years | 1,644 (4.2%) | $45,426 |
| 25 to 44 Years | 14,235 (36.5%) | $61,716 |
| 45 to 64 Years | 13,164 (33.7%) | $82,901 |
| 65+ Years | 10,001 (25.6%) | $55,130 |
| Total | 39,044 (100.0%) | $64,479 |
Poverty in Arden Arcade
Income Below Poverty by Sex and Age in Arden Arcade
With 18.9% poverty level for males and 19.6% for females among the residents of Arden Arcade, under 5 year old males and 6 to 11 year old females are the most vulnerable to poverty, with 1,244 males (36.5%) and 1,198 females (35.3%) in their respective age groups living below the poverty level.
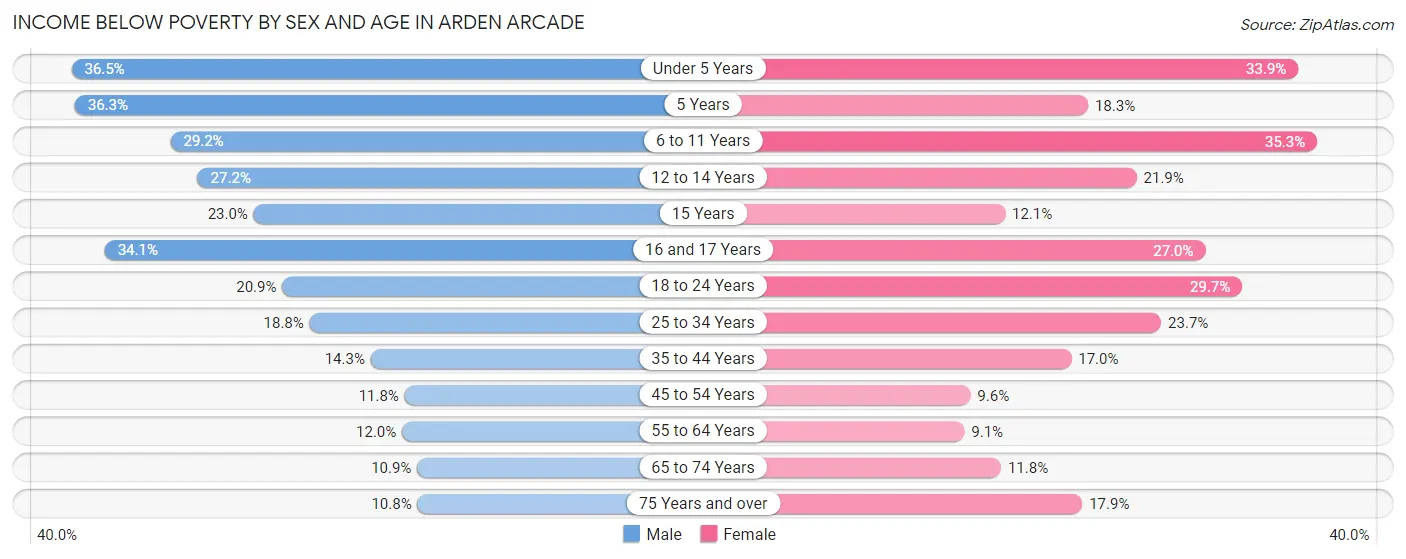
| Age Bracket | Male | Female |
| Under 5 Years | 1,244 (36.5%) | 988 (33.9%) |
| 5 Years | 321 (36.3%) | 104 (18.3%) |
| 6 to 11 Years | 1,185 (29.2%) | 1,198 (35.3%) |
| 12 to 14 Years | 419 (27.2%) | 386 (21.9%) |
| 15 Years | 100 (23.0%) | 71 (12.1%) |
| 16 and 17 Years | 410 (34.1%) | 214 (27.0%) |
| 18 to 24 Years | 673 (20.9%) | 1,399 (29.7%) |
| 25 to 34 Years | 1,386 (18.8%) | 1,915 (23.7%) |
| 35 to 44 Years | 931 (14.3%) | 1,100 (17.0%) |
| 45 to 54 Years | 650 (11.8%) | 521 (9.6%) |
| 55 to 64 Years | 621 (12.0%) | 514 (9.1%) |
| 65 to 74 Years | 413 (10.8%) | 622 (11.8%) |
| 75 Years and over | 272 (10.8%) | 711 (17.8%) |
| Total | 8,625 (18.9%) | 9,743 (19.6%) |
Income Above Poverty by Sex and Age in Arden Arcade
According to the poverty statistics in Arden Arcade, males aged 75 years and over and females aged 55 to 64 years are the age groups that are most secure financially, with 89.2% of males and 90.9% of females in these age groups living above the poverty line.
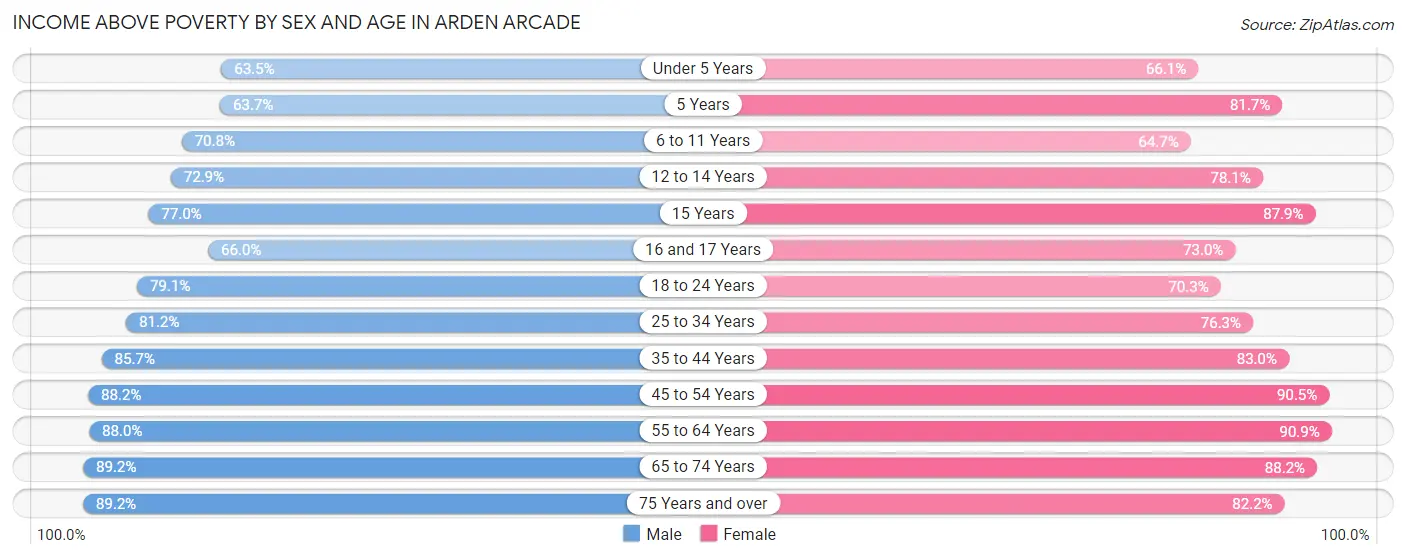
| Age Bracket | Male | Female |
| Under 5 Years | 2,162 (63.5%) | 1,928 (66.1%) |
| 5 Years | 564 (63.7%) | 465 (81.7%) |
| 6 to 11 Years | 2,877 (70.8%) | 2,198 (64.7%) |
| 12 to 14 Years | 1,124 (72.9%) | 1,377 (78.1%) |
| 15 Years | 335 (77.0%) | 515 (87.9%) |
| 16 and 17 Years | 794 (65.9%) | 579 (73.0%) |
| 18 to 24 Years | 2,552 (79.1%) | 3,309 (70.3%) |
| 25 to 34 Years | 5,970 (81.2%) | 6,161 (76.3%) |
| 35 to 44 Years | 5,578 (85.7%) | 5,357 (83.0%) |
| 45 to 54 Years | 4,866 (88.2%) | 4,937 (90.4%) |
| 55 to 64 Years | 4,566 (88.0%) | 5,136 (90.9%) |
| 65 to 74 Years | 3,393 (89.1%) | 4,641 (88.2%) |
| 75 Years and over | 2,239 (89.2%) | 3,272 (82.2%) |
| Total | 37,020 (81.1%) | 39,875 (80.4%) |
Income Below Poverty Among Married-Couple Families in Arden Arcade
The poverty statistics for married-couple families in Arden Arcade show that 9.8% or 1,475 of the total 15,112 families live below the poverty line. Families with 5 or more children have the highest poverty rate of 60.6%, comprising of 97 families. On the other hand, families with no children have the lowest poverty rate of 5.1%, which includes 426 families.
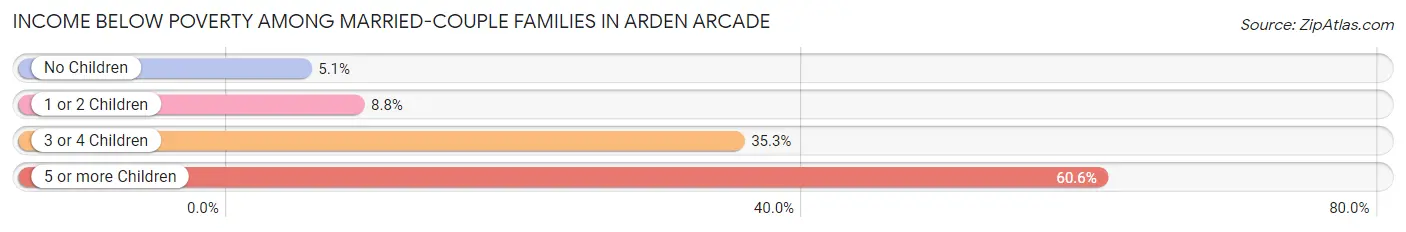
| Children | Above Poverty | Below Poverty |
| No Children | 7,932 (94.9%) | 426 (5.1%) |
| 1 or 2 Children | 4,729 (91.2%) | 455 (8.8%) |
| 3 or 4 Children | 913 (64.7%) | 497 (35.2%) |
| 5 or more Children | 63 (39.4%) | 97 (60.6%) |
| Total | 13,637 (90.2%) | 1,475 (9.8%) |
Income Below Poverty Among Single-Parent Households in Arden Arcade
According to the poverty data in Arden Arcade, 15.0% or 307 single-father households and 25.8% or 1,447 single-mother households are living below the poverty line. Among single-father households, those with 5 or more children have the highest poverty rate, with 103 households (100.0%) experiencing poverty. Likewise, among single-mother households, those with 5 or more children have the highest poverty rate, with 60 households (100.0%) falling below the poverty line.
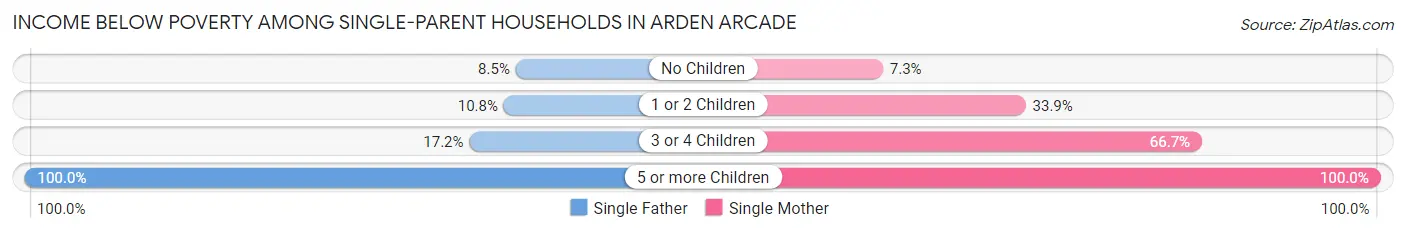
| Children | Single Father | Single Mother |
| No Children | 69 (8.5%) | 195 (7.3%) |
| 1 or 2 Children | 100 (10.7%) | 751 (33.9%) |
| 3 or 4 Children | 35 (17.2%) | 441 (66.7%) |
| 5 or more Children | 103 (100.0%) | 60 (100.0%) |
| Total | 307 (15.0%) | 1,447 (25.8%) |
Income Below Poverty Among Married-Couple vs Single-Parent Households in Arden Arcade
The poverty data for Arden Arcade shows that 1,475 of the married-couple family households (9.8%) and 1,754 of the single-parent households (22.9%) are living below the poverty level. Within the married-couple family households, those with 5 or more children have the highest poverty rate, with 97 households (60.6%) falling below the poverty line. Among the single-parent households, those with 5 or more children have the highest poverty rate, with 163 household (100.0%) living below poverty.
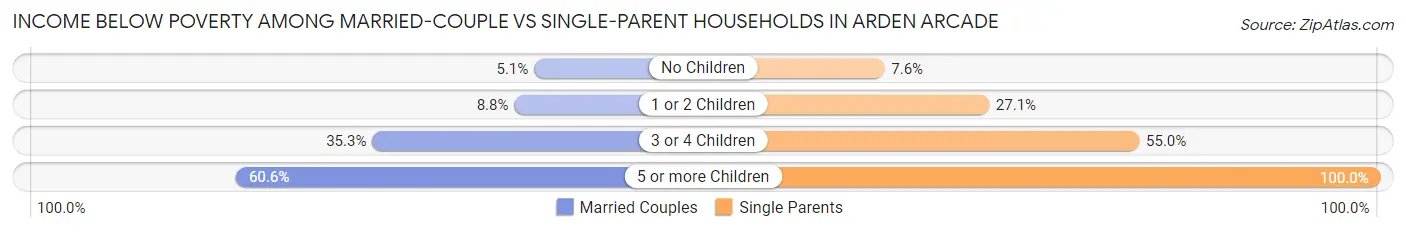
| Children | Married-Couple Families | Single-Parent Households |
| No Children | 426 (5.1%) | 264 (7.6%) |
| 1 or 2 Children | 455 (8.8%) | 851 (27.1%) |
| 3 or 4 Children | 497 (35.2%) | 476 (55.0%) |
| 5 or more Children | 97 (60.6%) | 163 (100.0%) |
| Total | 1,475 (9.8%) | 1,754 (22.9%) |
Race in Arden Arcade
The most populous races in Arden Arcade are White / Caucasian (53,297 | 55.5%), Hispanic or Latino (20,263 | 21.1%), and Some other Race (11,448 | 11.9%).
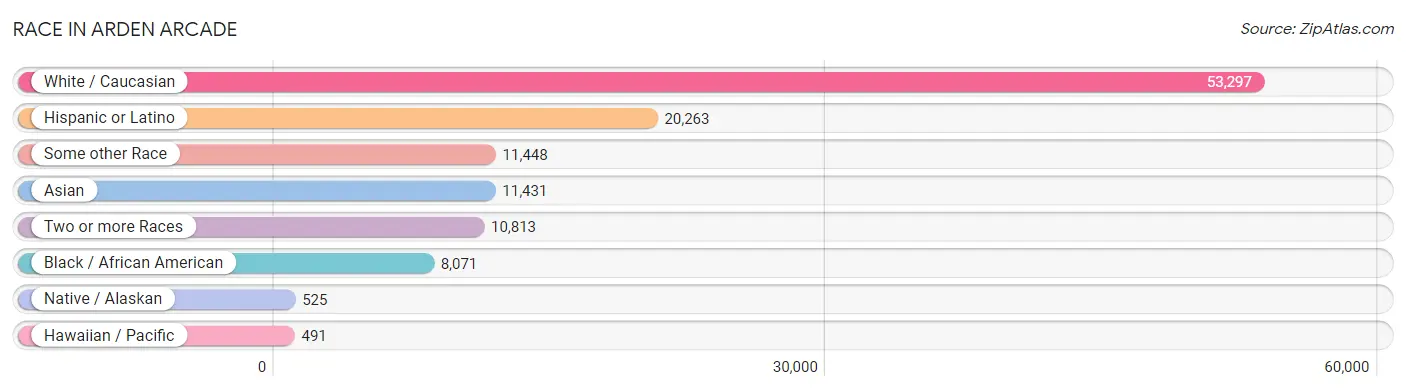
| Race | # Population | % Population |
| Asian | 11,431 | 11.9% |
| Black / African American | 8,071 | 8.4% |
| Hawaiian / Pacific | 491 | 0.5% |
| Hispanic or Latino | 20,263 | 21.1% |
| Native / Alaskan | 525 | 0.5% |
| White / Caucasian | 53,297 | 55.5% |
| Two or more Races | 10,813 | 11.3% |
| Some other Race | 11,448 | 11.9% |
| Total | 96,076 | 100.0% |
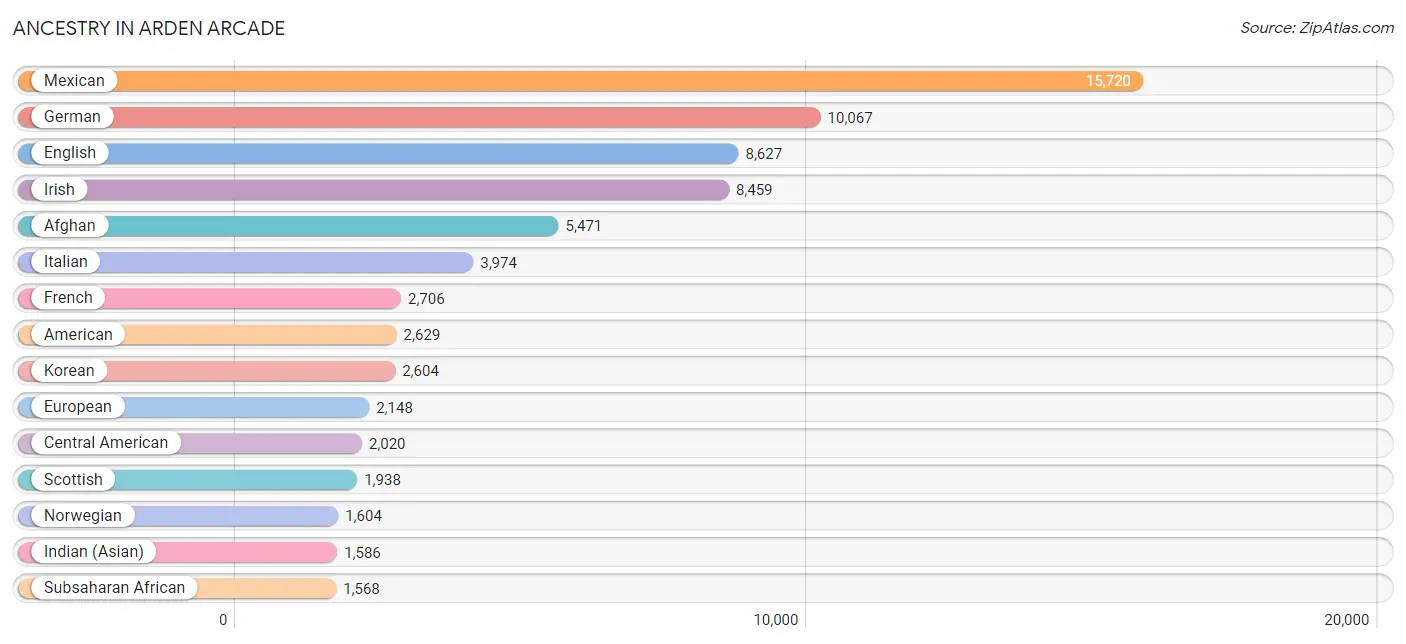
Ancestry in Arden Arcade
The most populous ancestries reported in Arden Arcade are Mexican (15,720 | 16.4%), German (10,067 | 10.5%), English (8,627 | 9.0%), Irish (8,459 | 8.8%), and Afghan (5,471 | 5.7%), together accounting for 50.3% of all Arden Arcade residents.
| Ancestry | # Population | % Population |
| Afghan | 5,471 | 5.7% |
| African | 595 | 0.6% |
| Albanian | 101 | 0.1% |
| American | 2,629 | 2.7% |
| Apache | 85 | 0.1% |
| Arab | 1,084 | 1.1% |
| Argentinean | 29 | 0.0% |
| Armenian | 557 | 0.6% |
| Assyrian / Chaldean / Syriac | 10 | 0.0% |
| Australian | 50 | 0.1% |
| Austrian | 365 | 0.4% |
| Bangladeshi | 859 | 0.9% |
| Barbadian | 14 | 0.0% |
| Basque | 35 | 0.0% |
| Belgian | 73 | 0.1% |
| Belizean | 84 | 0.1% |
| Bhutanese | 1,159 | 1.2% |
| Blackfeet | 44 | 0.1% |
| Bolivian | 62 | 0.1% |
| Brazilian | 79 | 0.1% |
| British | 876 | 0.9% |
| British West Indian | 46 | 0.1% |
| Bulgarian | 9 | 0.0% |
| Burmese | 368 | 0.4% |
| Cajun | 9 | 0.0% |
| Cambodian | 34 | 0.0% |
| Canadian | 352 | 0.4% |
| Cape Verdean | 296 | 0.3% |
| Celtic | 35 | 0.0% |
| Central American | 2,020 | 2.1% |
| Central American Indian | 149 | 0.2% |
| Cherokee | 925 | 1.0% |
| Chilean | 193 | 0.2% |
| Choctaw | 55 | 0.1% |
| Colombian | 136 | 0.1% |
| Costa Rican | 63 | 0.1% |
| Creek | 143 | 0.2% |
| Croatian | 164 | 0.2% |
| Cuban | 162 | 0.2% |
| Czech | 175 | 0.2% |
| Czechoslovakian | 139 | 0.1% |
| Danish | 326 | 0.3% |
| Dominican | 34 | 0.0% |
| Dutch | 1,093 | 1.1% |
| Eastern European | 442 | 0.5% |
| Ecuadorian | 74 | 0.1% |
| Egyptian | 371 | 0.4% |
| English | 8,627 | 9.0% |
| Ethiopian | 338 | 0.4% |
| European | 2,148 | 2.2% |
| Filipino | 69 | 0.1% |
| Finnish | 156 | 0.2% |
| French | 2,706 | 2.8% |
| French Canadian | 204 | 0.2% |
| German | 10,067 | 10.5% |
| German Russian | 27 | 0.0% |
| Ghanaian | 12 | 0.0% |
| Greek | 523 | 0.5% |
| Guamanian / Chamorro | 10 | 0.0% |
| Guatemalan | 506 | 0.5% |
| Guyanese | 12 | 0.0% |
| Haitian | 173 | 0.2% |
| Honduran | 150 | 0.2% |
| Hungarian | 232 | 0.2% |
| Icelander | 8 | 0.0% |
| Indian (Asian) | 1,586 | 1.7% |
| Indonesian | 13 | 0.0% |
| Iranian | 718 | 0.7% |
| Iraqi | 5 | 0.0% |
| Irish | 8,459 | 8.8% |
| Iroquois | 44 | 0.1% |
| Italian | 3,974 | 4.1% |
| Jamaican | 103 | 0.1% |
| Japanese | 132 | 0.1% |
| Kenyan | 18 | 0.0% |
| Korean | 2,604 | 2.7% |
| Laotian | 81 | 0.1% |
| Latvian | 20 | 0.0% |
| Lebanese | 324 | 0.3% |
| Liberian | 41 | 0.0% |
| Lithuanian | 89 | 0.1% |
| Malaysian | 66 | 0.1% |
| Mexican | 15,720 | 16.4% |
| Mexican American Indian | 196 | 0.2% |
| Mongolian | 15 | 0.0% |
| Moroccan | 27 | 0.0% |
| Native Hawaiian | 289 | 0.3% |
| Navajo | 297 | 0.3% |
| Nepalese | 142 | 0.2% |
| Nicaraguan | 53 | 0.1% |
| Nigerian | 83 | 0.1% |
| Northern European | 148 | 0.2% |
| Norwegian | 1,604 | 1.7% |
| Pakistani | 176 | 0.2% |
| Palestinian | 54 | 0.1% |
| Panamanian | 205 | 0.2% |
| Paraguayan | 30 | 0.0% |
| Pennsylvania German | 27 | 0.0% |
| Peruvian | 58 | 0.1% |
| Polish | 1,040 | 1.1% |
| Portuguese | 1,184 | 1.2% |
| Puerto Rican | 452 | 0.5% |
| Romanian | 345 | 0.4% |
| Russian | 1,441 | 1.5% |
| Salvadoran | 1,043 | 1.1% |
| Samoan | 3 | 0.0% |
| Scandinavian | 272 | 0.3% |
| Scotch-Irish | 1,017 | 1.1% |
| Scottish | 1,938 | 2.0% |
| Seminole | 35 | 0.0% |
| Serbian | 33 | 0.0% |
| Sierra Leonean | 33 | 0.0% |
| Sioux | 29 | 0.0% |
| Slavic | 56 | 0.1% |
| Slovak | 36 | 0.0% |
| Slovene | 51 | 0.1% |
| South American | 588 | 0.6% |
| South American Indian | 122 | 0.1% |
| Spaniard | 533 | 0.5% |
| Spanish | 452 | 0.5% |
| Sri Lankan | 576 | 0.6% |
| Subsaharan African | 1,568 | 1.6% |
| Swedish | 1,314 | 1.4% |
| Swiss | 240 | 0.3% |
| Syrian | 13 | 0.0% |
| Thai | 993 | 1.0% |
| Tlingit-Haida | 15 | 0.0% |
| Turkish | 30 | 0.0% |
| Ugandan | 47 | 0.1% |
| Ukrainian | 1,083 | 1.1% |
| Vietnamese | 6 | 0.0% |
| Welsh | 735 | 0.8% |
| Yugoslavian | 72 | 0.1% | View All 133 Rows |
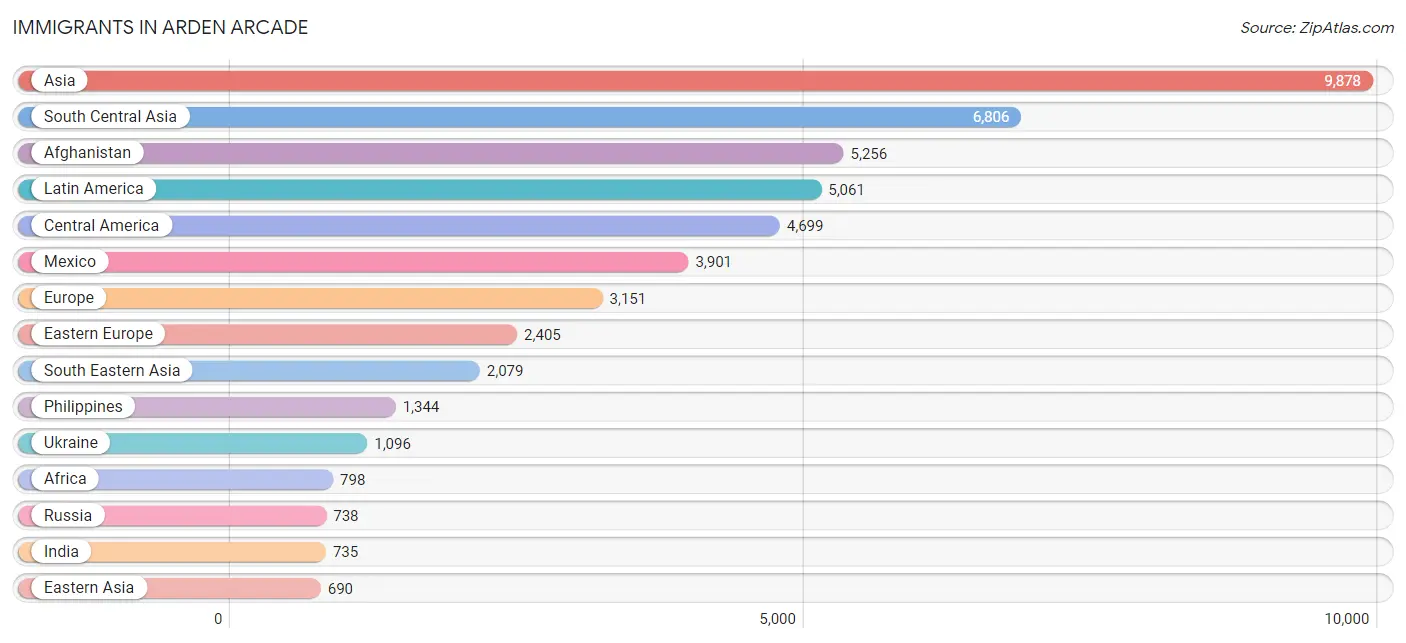
Immigrants in Arden Arcade
The most numerous immigrant groups reported in Arden Arcade came from Asia (9,878 | 10.3%), South Central Asia (6,806 | 7.1%), Afghanistan (5,256 | 5.5%), Latin America (5,061 | 5.3%), and Central America (4,699 | 4.9%), together accounting for 33.0% of all Arden Arcade residents.
| Immigration Origin | # Population | % Population |
| Afghanistan | 5,256 | 5.5% |
| Africa | 798 | 0.8% |
| Argentina | 13 | 0.0% |
| Asia | 9,878 | 10.3% |
| Australia | 18 | 0.0% |
| Austria | 10 | 0.0% |
| Bangladesh | 6 | 0.0% |
| Belarus | 120 | 0.1% |
| Belize | 61 | 0.1% |
| Bosnia and Herzegovina | 41 | 0.0% |
| Brazil | 59 | 0.1% |
| Bulgaria | 9 | 0.0% |
| Canada | 146 | 0.2% |
| Caribbean | 80 | 0.1% |
| Central America | 4,699 | 4.9% |
| Chile | 43 | 0.0% |
| China | 357 | 0.4% |
| Colombia | 96 | 0.1% |
| Costa Rica | 63 | 0.1% |
| Croatia | 17 | 0.0% |
| Czechoslovakia | 30 | 0.0% |
| Dominican Republic | 34 | 0.0% |
| Eastern Africa | 490 | 0.5% |
| Eastern Asia | 690 | 0.7% |
| Eastern Europe | 2,405 | 2.5% |
| Ecuador | 37 | 0.0% |
| Egypt | 15 | 0.0% |
| El Salvador | 341 | 0.4% |
| England | 168 | 0.2% |
| Ethiopia | 277 | 0.3% |
| Europe | 3,151 | 3.3% |
| Fiji | 592 | 0.6% |
| France | 119 | 0.1% |
| Germany | 168 | 0.2% |
| Greece | 7 | 0.0% |
| Guatemala | 222 | 0.2% |
| Haiti | 22 | 0.0% |
| Honduras | 28 | 0.0% |
| Hong Kong | 14 | 0.0% |
| Hungary | 17 | 0.0% |
| India | 735 | 0.8% |
| Indonesia | 23 | 0.0% |
| Iran | 537 | 0.6% |
| Iraq | 14 | 0.0% |
| Ireland | 37 | 0.0% |
| Israel | 48 | 0.1% |
| Italy | 36 | 0.0% |
| Jamaica | 24 | 0.0% |
| Japan | 124 | 0.1% |
| Kazakhstan | 46 | 0.1% |
| Kenya | 68 | 0.1% |
| Korea | 195 | 0.2% |
| Kuwait | 9 | 0.0% |
| Laos | 11 | 0.0% |
| Latin America | 5,061 | 5.3% |
| Latvia | 1 | 0.0% |
| Lebanon | 134 | 0.1% |
| Liberia | 70 | 0.1% |
| Malaysia | 53 | 0.1% |
| Mexico | 3,901 | 4.1% |
| Moldova | 119 | 0.1% |
| Morocco | 82 | 0.1% |
| Netherlands | 63 | 0.1% |
| Nicaragua | 14 | 0.0% |
| Nigeria | 41 | 0.0% |
| Northern Africa | 117 | 0.1% |
| Northern Europe | 281 | 0.3% |
| Oceania | 618 | 0.6% |
| Pakistan | 122 | 0.1% |
| Panama | 69 | 0.1% |
| Peru | 28 | 0.0% |
| Philippines | 1,344 | 1.4% |
| Poland | 12 | 0.0% |
| Portugal | 53 | 0.1% |
| Romania | 132 | 0.1% |
| Russia | 738 | 0.8% |
| Serbia | 8 | 0.0% |
| Sierra Leone | 28 | 0.0% |
| Singapore | 37 | 0.0% |
| Somalia | 11 | 0.0% |
| South Africa | 11 | 0.0% |
| South America | 282 | 0.3% |
| South Central Asia | 6,806 | 7.1% |
| South Eastern Asia | 2,079 | 2.2% |
| Southern Europe | 96 | 0.1% |
| Sudan | 20 | 0.0% |
| Taiwan | 145 | 0.2% |
| Thailand | 370 | 0.4% |
| Uganda | 40 | 0.0% |
| Ukraine | 1,096 | 1.1% |
| Uzbekistan | 72 | 0.1% |
| Vietnam | 228 | 0.2% |
| Western Africa | 180 | 0.2% |
| Western Asia | 294 | 0.3% |
| Western Europe | 360 | 0.4% | View All 95 Rows |
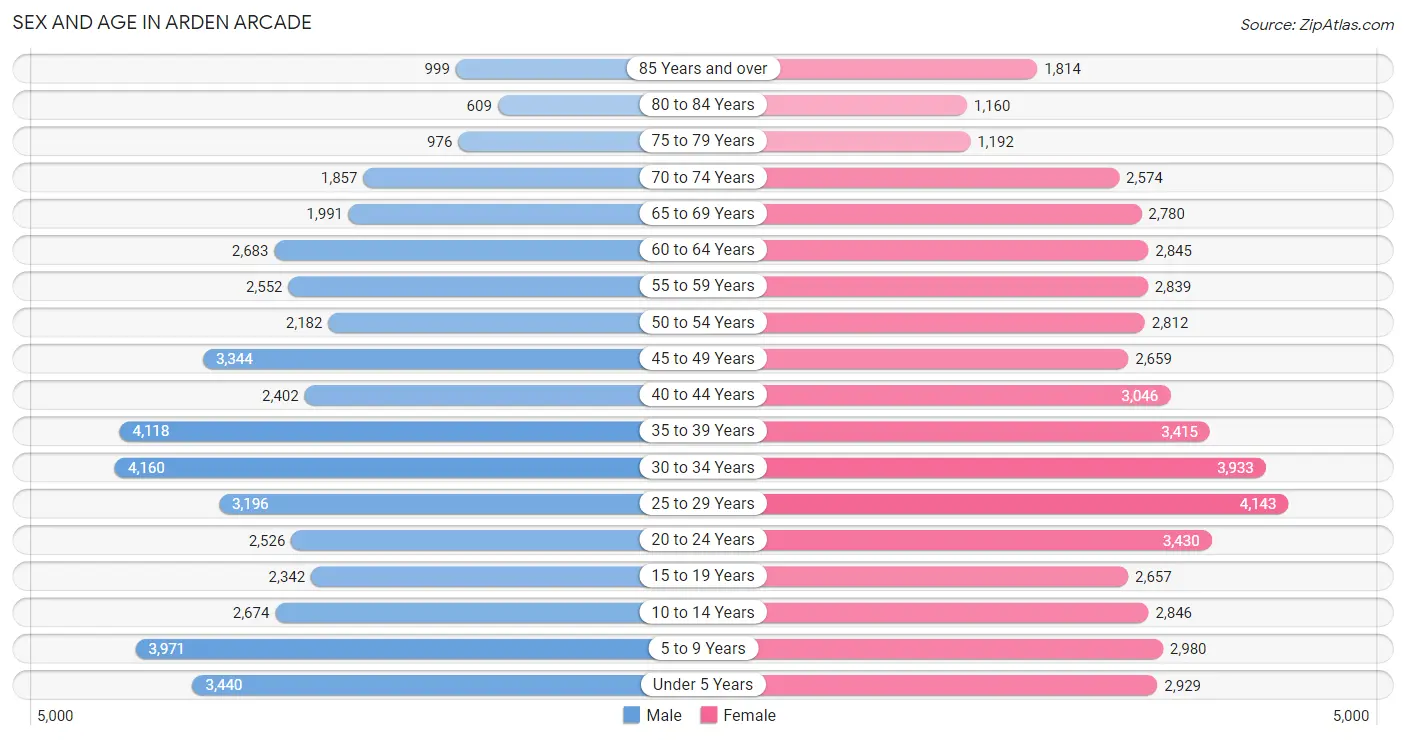
Sex and Age in Arden Arcade
Sex and Age in Arden Arcade
The most populous age groups in Arden Arcade are 30 to 34 Years (4,160 | 9.0%) for men and 25 to 29 Years (4,143 | 8.3%) for women.
| Age Bracket | Male | Female |
| Under 5 Years | 3,440 (7.5%) | 2,929 (5.9%) |
| 5 to 9 Years | 3,971 (8.6%) | 2,980 (5.9%) |
| 10 to 14 Years | 2,674 (5.8%) | 2,846 (5.7%) |
| 15 to 19 Years | 2,342 (5.1%) | 2,657 (5.3%) |
| 20 to 24 Years | 2,526 (5.5%) | 3,430 (6.9%) |
| 25 to 29 Years | 3,196 (6.9%) | 4,143 (8.3%) |
| 30 to 34 Years | 4,160 (9.0%) | 3,933 (7.9%) |
| 35 to 39 Years | 4,118 (8.9%) | 3,415 (6.8%) |
| 40 to 44 Years | 2,402 (5.2%) | 3,046 (6.1%) |
| 45 to 49 Years | 3,344 (7.3%) | 2,659 (5.3%) |
| 50 to 54 Years | 2,182 (4.7%) | 2,812 (5.6%) |
| 55 to 59 Years | 2,552 (5.6%) | 2,839 (5.7%) |
| 60 to 64 Years | 2,683 (5.8%) | 2,845 (5.7%) |
| 65 to 69 Years | 1,991 (4.3%) | 2,780 (5.6%) |
| 70 to 74 Years | 1,857 (4.0%) | 2,574 (5.1%) |
| 75 to 79 Years | 976 (2.1%) | 1,192 (2.4%) |
| 80 to 84 Years | 609 (1.3%) | 1,160 (2.3%) |
| 85 Years and over | 999 (2.2%) | 1,814 (3.6%) |
| Total | 46,022 (100.0%) | 50,054 (100.0%) |
Families and Households in Arden Arcade
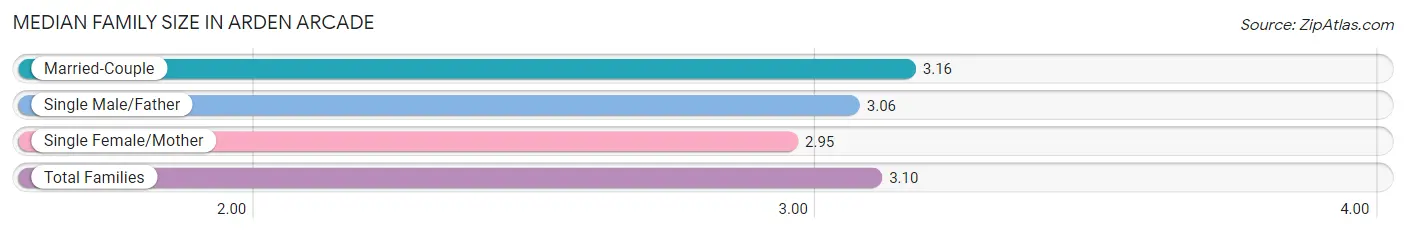
Median Family Size in Arden Arcade
The median family size in Arden Arcade is 3.10 persons per family, with married-couple families (15,112 | 66.4%) accounting for the largest median family size of 3.16 persons per family. On the other hand, single female/mother families (5,609 | 24.6%) represent the smallest median family size with 2.95 persons per family.
| Family Type | # Families | Family Size |
| Married-Couple | 15,112 (66.4%) | 3.16 |
| Single Male/Father | 2,047 (9.0%) | 3.06 |
| Single Female/Mother | 5,609 (24.6%) | 2.95 |
| Total Families | 22,768 (100.0%) | 3.10 |
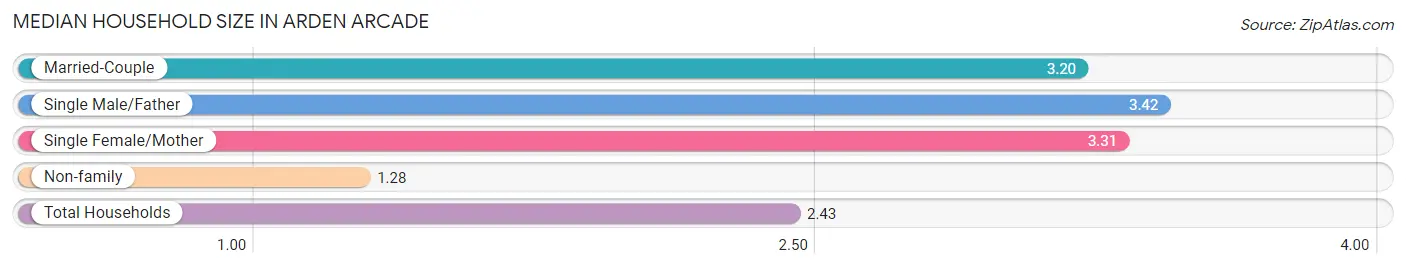
Median Household Size in Arden Arcade
The median household size in Arden Arcade is 2.43 persons per household, with single male/father households (2,047 | 5.2%) accounting for the largest median household size of 3.42 persons per household. non-family households (16,276 | 41.7%) represent the smallest median household size with 1.28 persons per household.
| Household Type | # Households | Household Size |
| Married-Couple | 15,112 (38.7%) | 3.20 |
| Single Male/Father | 2,047 (5.2%) | 3.42 |
| Single Female/Mother | 5,609 (14.4%) | 3.31 |
| Non-family | 16,276 (41.7%) | 1.28 |
| Total Households | 39,044 (100.0%) | 2.43 |
Household Size by Marriage Status in Arden Arcade
Out of a total of 39,044 households in Arden Arcade, 22,768 (58.3%) are family households, while 16,276 (41.7%) are nonfamily households. The most numerous type of family households are 2-person households, comprising 9,642, and the most common type of nonfamily households are 1-person households, comprising 12,730.
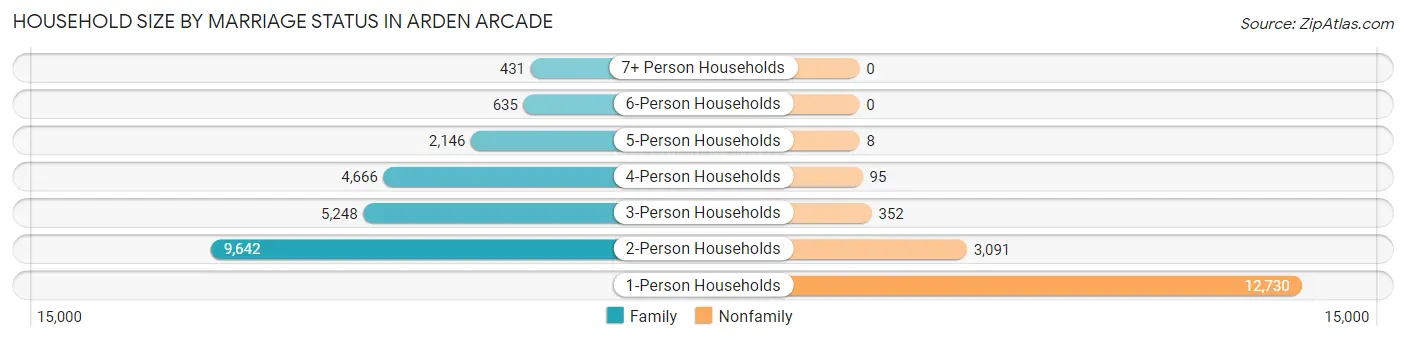
| Household Size | Family Households | Nonfamily Households |
| 1-Person Households | - | 12,730 (32.6%) |
| 2-Person Households | 9,642 (24.7%) | 3,091 (7.9%) |
| 3-Person Households | 5,248 (13.4%) | 352 (0.9%) |
| 4-Person Households | 4,666 (11.9%) | 95 (0.2%) |
| 5-Person Households | 2,146 (5.5%) | 8 (0.0%) |
| 6-Person Households | 635 (1.6%) | 0 (0.0%) |
| 7+ Person Households | 431 (1.1%) | 0 (0.0%) |
| Total | 22,768 (58.3%) | 16,276 (41.7%) |
Female Fertility in Arden Arcade
Fertility by Age in Arden Arcade
Average fertility rate in Arden Arcade is 44.0 births per 1,000 women. Women in the age bracket of 20 to 34 years have the highest fertility rate with 68.0 births per 1,000 women. Women in the age bracket of 20 to 34 years acount for 75.0% of all women with births.
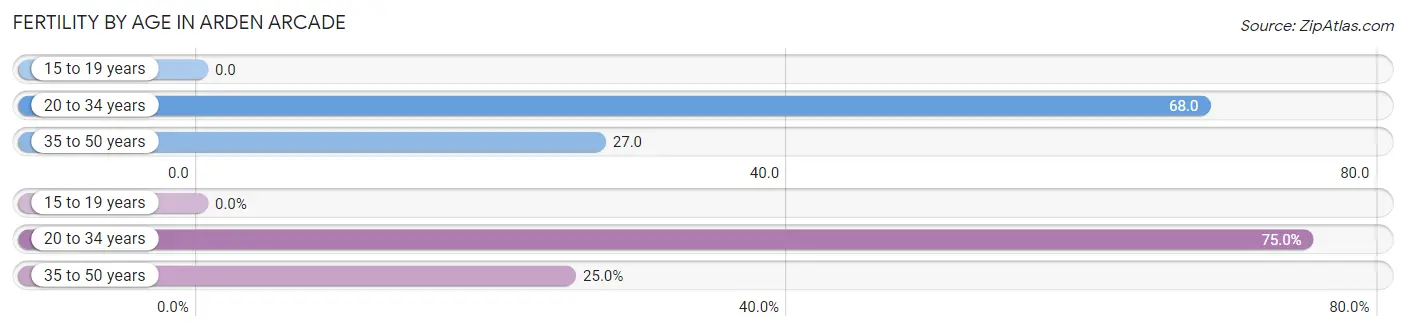
| Age Bracket | Women with Births | Births / 1,000 Women |
| 15 to 19 years | 0 (0.0%) | 0.0 |
| 20 to 34 years | 781 (75.0%) | 68.0 |
| 35 to 50 years | 260 (25.0%) | 27.0 |
| Total | 1,041 (100.0%) | 44.0 |
Fertility by Age by Marriage Status in Arden Arcade
74.8% of women with births (1,041) in Arden Arcade are married. The highest percentage of unmarried women with births falls into 35 to 50 years age bracket with 35.4% of them unmarried at the time of birth, while the lowest percentage of unmarried women with births belong to 20 to 34 years age bracket with 21.8% of them unmarried.
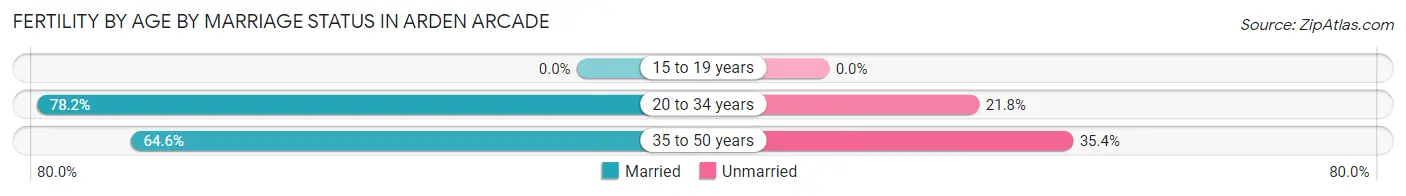
| Age Bracket | Married | Unmarried |
| 15 to 19 years | 0 (0.0%) | 0 (0.0%) |
| 20 to 34 years | 611 (78.2%) | 170 (21.8%) |
| 35 to 50 years | 168 (64.6%) | 92 (35.4%) |
| Total | 779 (74.8%) | 262 (25.2%) |
Fertility by Education in Arden Arcade
Average fertility rate in Arden Arcade is 44.0 births per 1,000 women. Women with the education attainment of graduate degree have the highest fertility rate of 94.0 births per 1,000 women, while women with the education attainment of less than high school have the lowest fertility at 27.0 births per 1,000 women. Women with the education attainment of college or associate's degree represent 27.2% of all women with births.
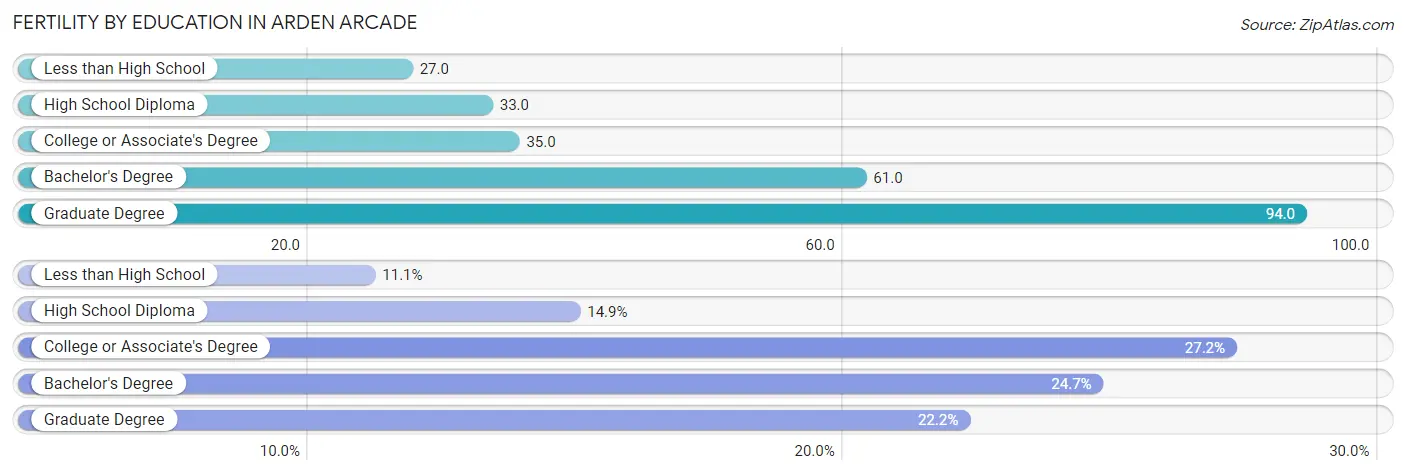
| Educational Attainment | Women with Births | Births / 1,000 Women |
| Less than High School | 115 (11.1%) | 27.0 |
| High School Diploma | 155 (14.9%) | 33.0 |
| College or Associate's Degree | 283 (27.2%) | 35.0 |
| Bachelor's Degree | 257 (24.7%) | 61.0 |
| Graduate Degree | 231 (22.2%) | 94.0 |
| Total | 1,041 (100.0%) | 44.0 |
Fertility by Education by Marriage Status in Arden Arcade
25.2% of women with births in Arden Arcade are unmarried. Women with the educational attainment of less than high school are most likely to be married with 100.0% of them married at childbirth, while women with the educational attainment of college or associate's degree are least likely to be married with 59.0% of them unmarried at childbirth.
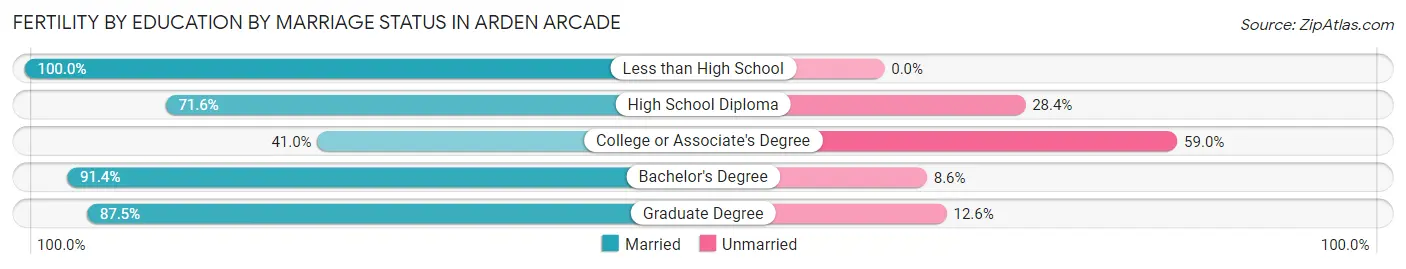
| Educational Attainment | Married | Unmarried |
| Less than High School | 115 (100.0%) | 0 (0.0%) |
| High School Diploma | 111 (71.6%) | 44 (28.4%) |
| College or Associate's Degree | 116 (41.0%) | 167 (59.0%) |
| Bachelor's Degree | 235 (91.4%) | 22 (8.6%) |
| Graduate Degree | 202 (87.5%) | 29 (12.6%) |
| Total | 779 (74.8%) | 262 (25.2%) |
Employment Characteristics in Arden Arcade
Employment by Class of Employer in Arden Arcade
Among the 42,508 employed individuals in Arden Arcade, private company employees (25,394 | 59.7%), state government employees (4,206 | 9.9%), and not-for-profit organizations (3,951 | 9.3%) make up the most common classes of employment.
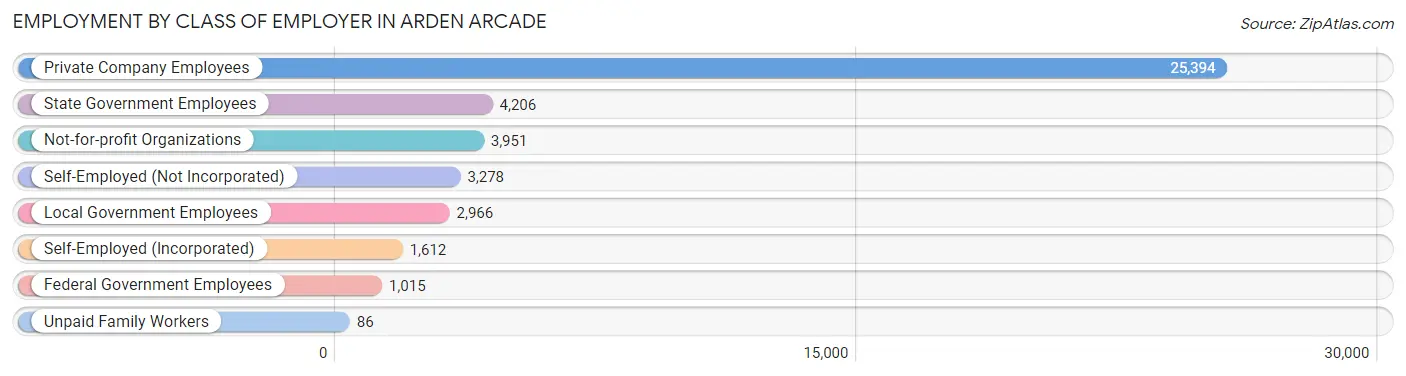
| Employer Class | # Employees | % Employees |
| Private Company Employees | 25,394 | 59.7% |
| Self-Employed (Incorporated) | 1,612 | 3.8% |
| Self-Employed (Not Incorporated) | 3,278 | 7.7% |
| Not-for-profit Organizations | 3,951 | 9.3% |
| Local Government Employees | 2,966 | 7.0% |
| State Government Employees | 4,206 | 9.9% |
| Federal Government Employees | 1,015 | 2.4% |
| Unpaid Family Workers | 86 | 0.2% |
| Total | 42,508 | 100.0% |
Employment Status by Age in Arden Arcade
According to the labor force statistics for Arden Arcade, out of the total population over 16 years of age (76,213), 62.6% or 47,709 individuals are in the labor force, with 8.1% or 3,864 of them unemployed. The age group with the highest labor force participation rate is 45 to 54 years, with 84.7% or 9,314 individuals in the labor force. Within the labor force, the 16 to 19 years age range has the highest percentage of unemployed individuals, with 17.1% or 231 of them being unemployed.
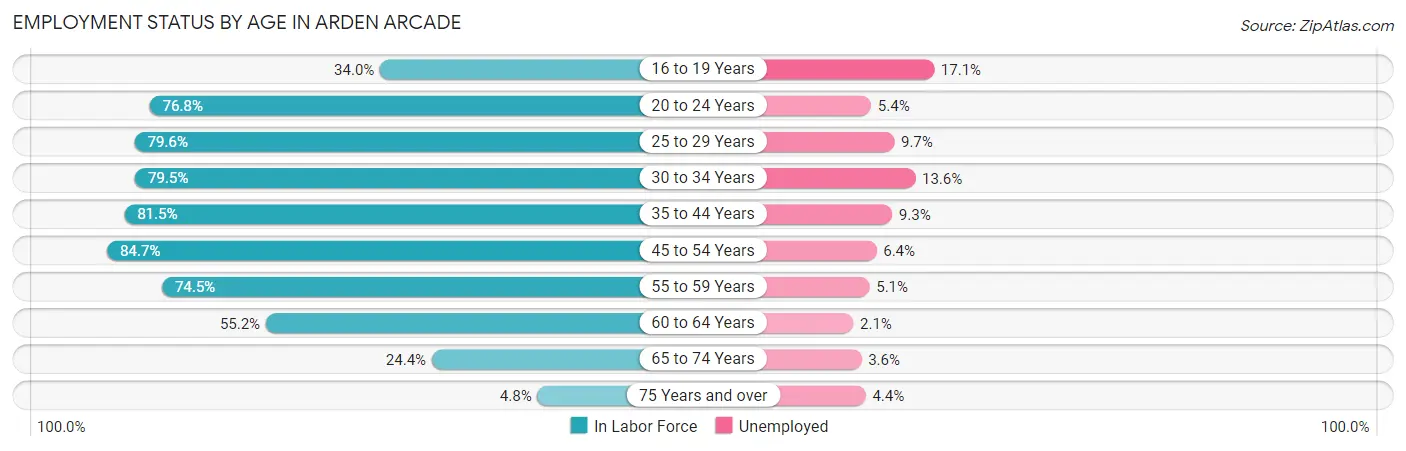
| Age Bracket | In Labor Force | Unemployed |
| 16 to 19 Years | 1,352 (34.0%) | 231 (17.1%) |
| 20 to 24 Years | 4,574 (76.8%) | 247 (5.4%) |
| 25 to 29 Years | 5,842 (79.6%) | 567 (9.7%) |
| 30 to 34 Years | 6,434 (79.5%) | 875 (13.6%) |
| 35 to 44 Years | 10,580 (81.5%) | 984 (9.3%) |
| 45 to 54 Years | 9,314 (84.7%) | 596 (6.4%) |
| 55 to 59 Years | 4,016 (74.5%) | 205 (5.1%) |
| 60 to 64 Years | 3,051 (55.2%) | 64 (2.1%) |
| 65 to 74 Years | 2,245 (24.4%) | 81 (3.6%) |
| 75 Years and over | 324 (4.8%) | 14 (4.4%) |
| Total | 47,709 (62.6%) | 3,864 (8.1%) |
Employment Status by Educational Attainment in Arden Arcade
According to labor force statistics for Arden Arcade, 77.9% of individuals (39,206) out of the total population between 25 and 64 years of age (50,329) are in the labor force, with 8.4% or 3,293 of them being unemployed. The group with the highest labor force participation rate are those with the educational attainment of bachelor's degree or higher, with 86.9% or 15,245 individuals in the labor force. Within the labor force, individuals with less than high school education have the highest percentage of unemployment, with 15.1% or 607 of them being unemployed.
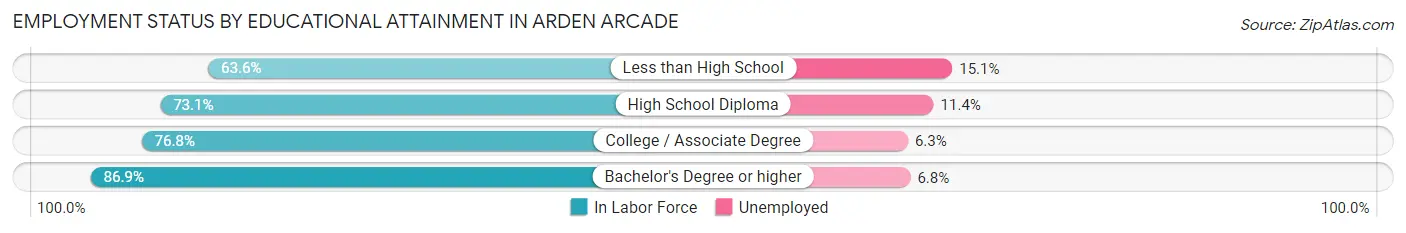
| Educational Attainment | In Labor Force | Unemployed |
| Less than High School | 4,021 (63.6%) | 955 (15.1%) |
| High School Diploma | 7,364 (73.1%) | 1,148 (11.4%) |
| College / Associate Degree | 12,587 (76.8%) | 1,033 (6.3%) |
| Bachelor's Degree or higher | 15,245 (86.9%) | 1,193 (6.8%) |
| Total | 39,206 (77.9%) | 4,228 (8.4%) |
Employment Occupations by Sex in Arden Arcade
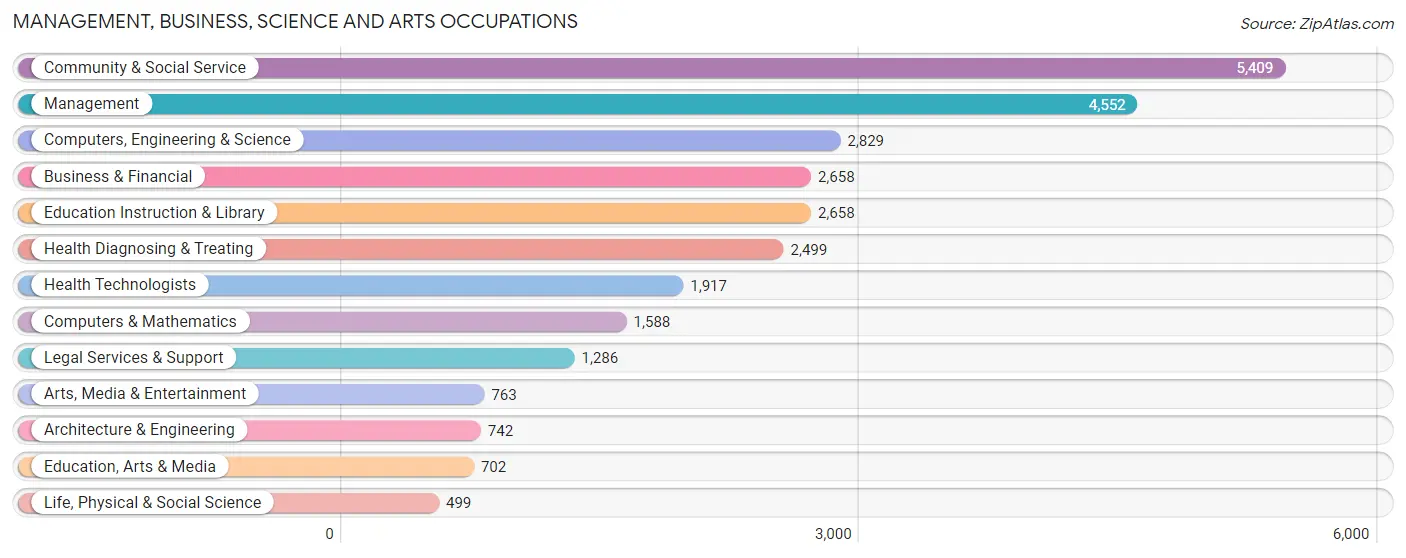
Management, Business, Science and Arts Occupations
The most common Management, Business, Science and Arts occupations in Arden Arcade are Community & Social Service (5,409 | 12.4%), Management (4,552 | 10.4%), Computers, Engineering & Science (2,829 | 6.5%), Business & Financial (2,658 | 6.1%), and Education Instruction & Library (2,658 | 6.1%).
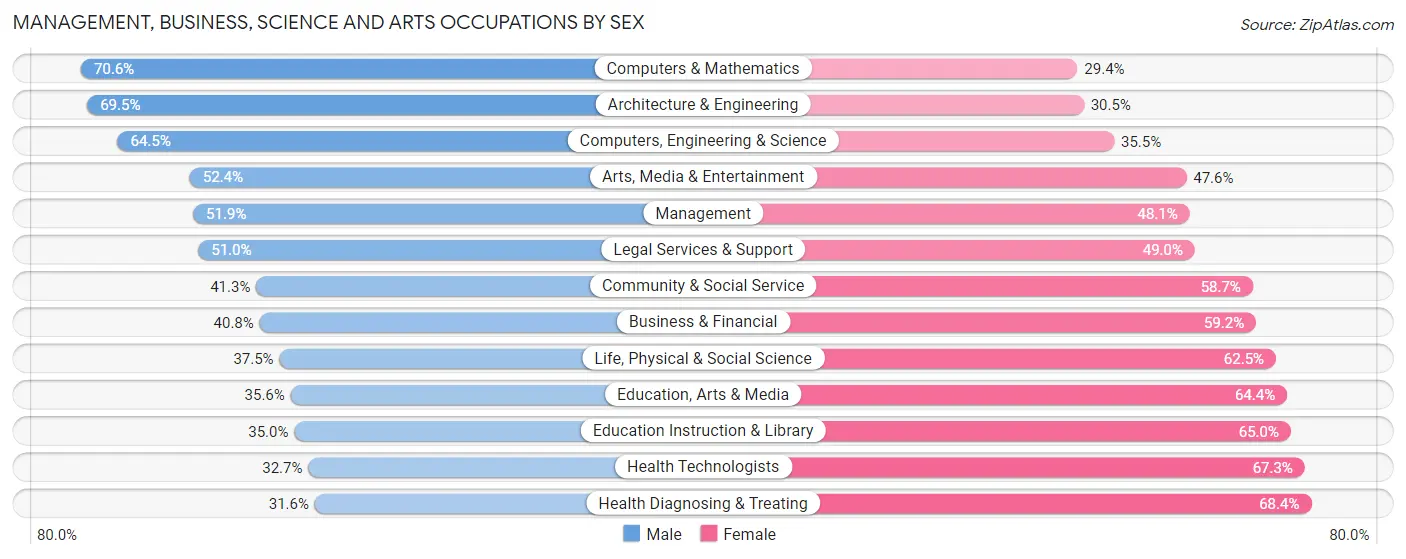
Management, Business, Science and Arts Occupations by Sex
Within the Management, Business, Science and Arts occupations in Arden Arcade, the most male-oriented occupations are Computers & Mathematics (70.6%), Architecture & Engineering (69.5%), and Computers, Engineering & Science (64.5%), while the most female-oriented occupations are Health Diagnosing & Treating (68.4%), Health Technologists (67.3%), and Education Instruction & Library (65.0%).
| Occupation | Male | Female |
| Management | 2,361 (51.9%) | 2,191 (48.1%) |
| Business & Financial | 1,084 (40.8%) | 1,574 (59.2%) |
| Computers, Engineering & Science | 1,824 (64.5%) | 1,005 (35.5%) |
| Computers & Mathematics | 1,121 (70.6%) | 467 (29.4%) |
| Architecture & Engineering | 516 (69.5%) | 226 (30.5%) |
| Life, Physical & Social Science | 187 (37.5%) | 312 (62.5%) |
| Community & Social Service | 2,236 (41.3%) | 3,173 (58.7%) |
| Education, Arts & Media | 250 (35.6%) | 452 (64.4%) |
| Legal Services & Support | 656 (51.0%) | 630 (49.0%) |
| Education Instruction & Library | 930 (35.0%) | 1,728 (65.0%) |
| Arts, Media & Entertainment | 400 (52.4%) | 363 (47.6%) |
| Health Diagnosing & Treating | 789 (31.6%) | 1,710 (68.4%) |
| Health Technologists | 626 (32.7%) | 1,291 (67.3%) |
| Total (Category) | 8,294 (46.2%) | 9,653 (53.8%) |
| Total (Overall) | 21,709 (49.6%) | 22,061 (50.4%) |
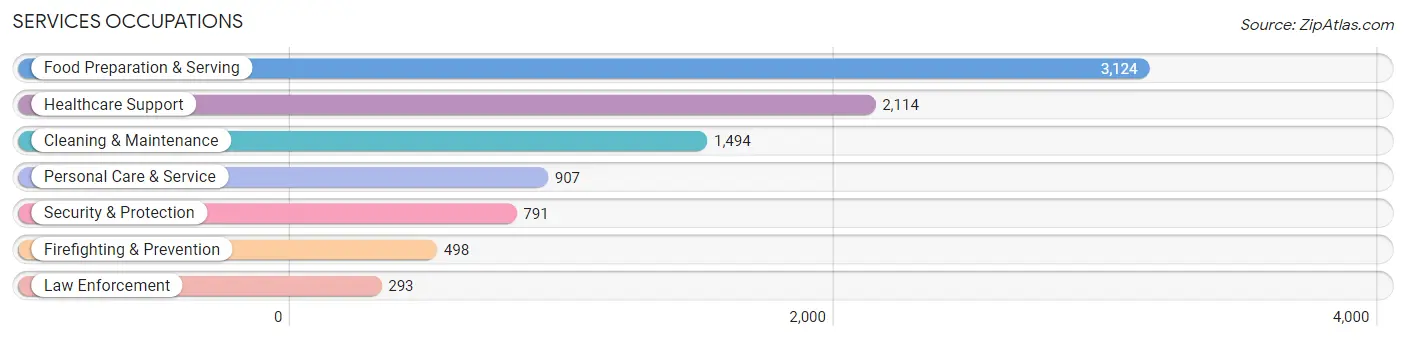
Services Occupations
The most common Services occupations in Arden Arcade are Food Preparation & Serving (3,124 | 7.1%), Healthcare Support (2,114 | 4.8%), Cleaning & Maintenance (1,494 | 3.4%), Personal Care & Service (907 | 2.1%), and Security & Protection (791 | 1.8%).
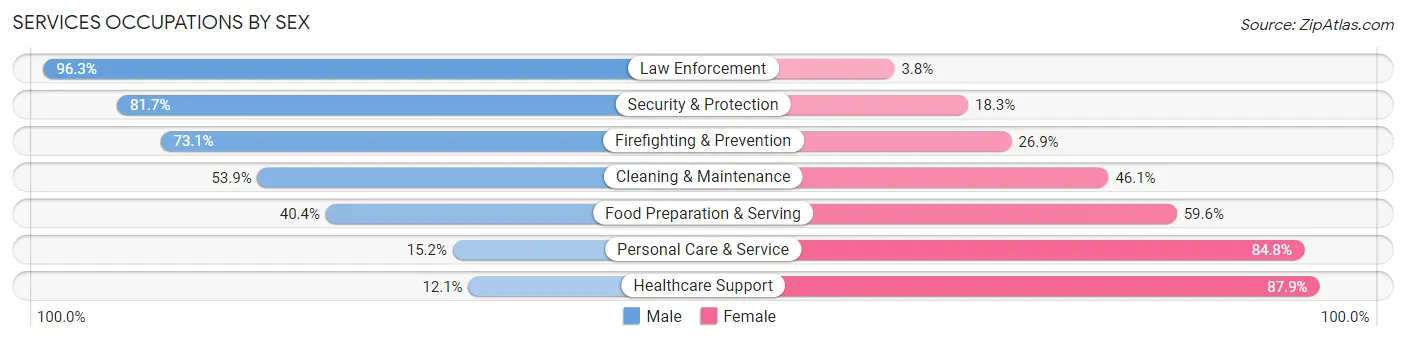
Services Occupations by Sex
Within the Services occupations in Arden Arcade, the most male-oriented occupations are Law Enforcement (96.3%), Security & Protection (81.7%), and Firefighting & Prevention (73.1%), while the most female-oriented occupations are Healthcare Support (87.9%), Personal Care & Service (84.8%), and Food Preparation & Serving (59.6%).
| Occupation | Male | Female |
| Healthcare Support | 256 (12.1%) | 1,858 (87.9%) |
| Security & Protection | 646 (81.7%) | 145 (18.3%) |
| Firefighting & Prevention | 364 (73.1%) | 134 (26.9%) |
| Law Enforcement | 282 (96.3%) | 11 (3.7%) |
| Food Preparation & Serving | 1,261 (40.4%) | 1,863 (59.6%) |
| Cleaning & Maintenance | 805 (53.9%) | 689 (46.1%) |
| Personal Care & Service | 138 (15.2%) | 769 (84.8%) |
| Total (Category) | 3,106 (36.8%) | 5,324 (63.2%) |
| Total (Overall) | 21,709 (49.6%) | 22,061 (50.4%) |
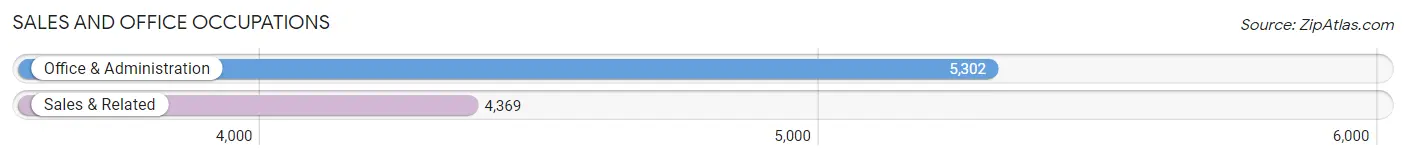
Sales and Office Occupations
The most common Sales and Office occupations in Arden Arcade are Office & Administration (5,302 | 12.1%), and Sales & Related (4,369 | 10.0%).
Sales and Office Occupations by Sex
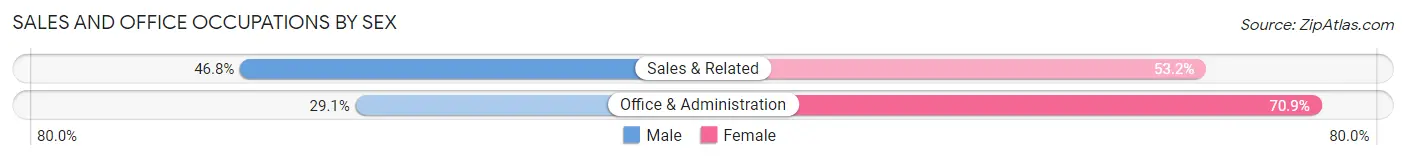
| Occupation | Male | Female |
| Sales & Related | 2,046 (46.8%) | 2,323 (53.2%) |
| Office & Administration | 1,542 (29.1%) | 3,760 (70.9%) |
| Total (Category) | 3,588 (37.1%) | 6,083 (62.9%) |
| Total (Overall) | 21,709 (49.6%) | 22,061 (50.4%) |
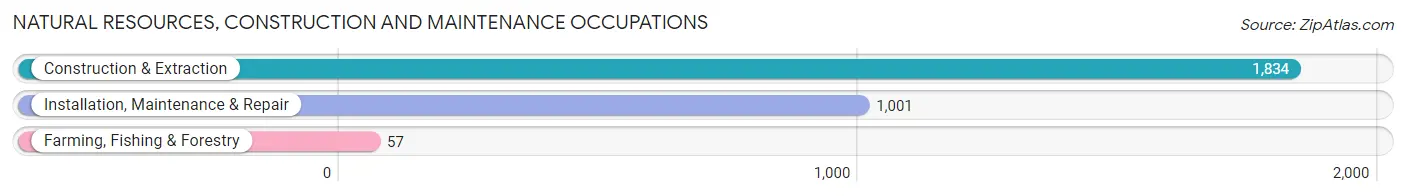
Natural Resources, Construction and Maintenance Occupations
The most common Natural Resources, Construction and Maintenance occupations in Arden Arcade are Construction & Extraction (1,834 | 4.2%), Installation, Maintenance & Repair (1,001 | 2.3%), and Farming, Fishing & Forestry (57 | 0.1%).
Natural Resources, Construction and Maintenance Occupations by Sex
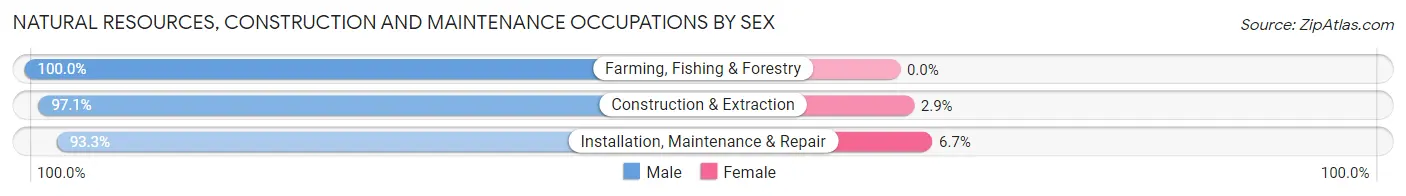
| Occupation | Male | Female |
| Farming, Fishing & Forestry | 57 (100.0%) | 0 (0.0%) |
| Construction & Extraction | 1,781 (97.1%) | 53 (2.9%) |
| Installation, Maintenance & Repair | 934 (93.3%) | 67 (6.7%) |
| Total (Category) | 2,772 (95.9%) | 120 (4.2%) |
| Total (Overall) | 21,709 (49.6%) | 22,061 (50.4%) |
Production, Transportation and Moving Occupations
The most common Production, Transportation and Moving occupations in Arden Arcade are Transportation (1,918 | 4.4%), Material Moving (1,672 | 3.8%), and Production (1,240 | 2.8%).
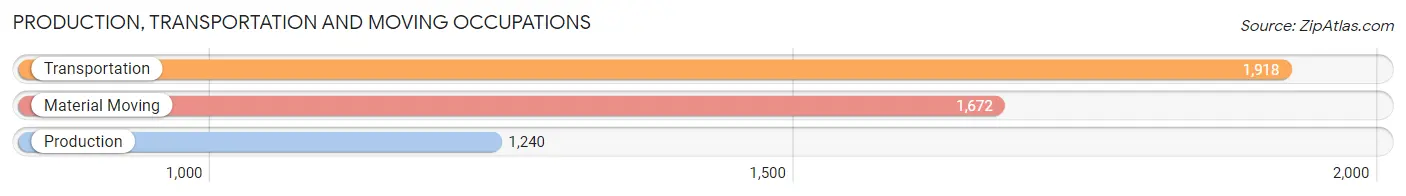
Production, Transportation and Moving Occupations by Sex
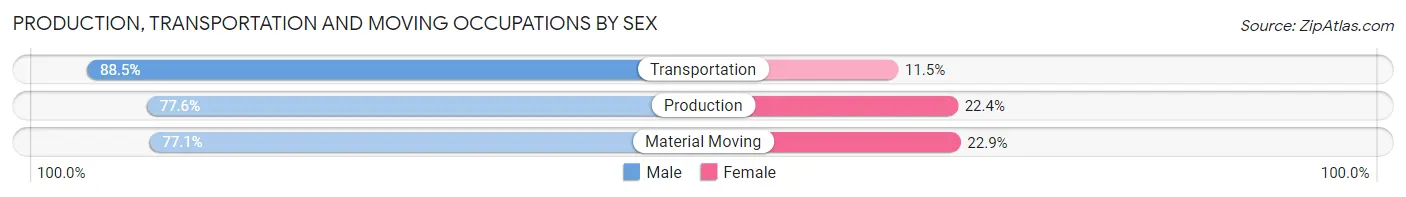
| Occupation | Male | Female |
| Production | 962 (77.6%) | 278 (22.4%) |
| Transportation | 1,698 (88.5%) | 220 (11.5%) |
| Material Moving | 1,289 (77.1%) | 383 (22.9%) |
| Total (Category) | 3,949 (81.8%) | 881 (18.2%) |
| Total (Overall) | 21,709 (49.6%) | 22,061 (50.4%) |
Employment Industries by Sex in Arden Arcade
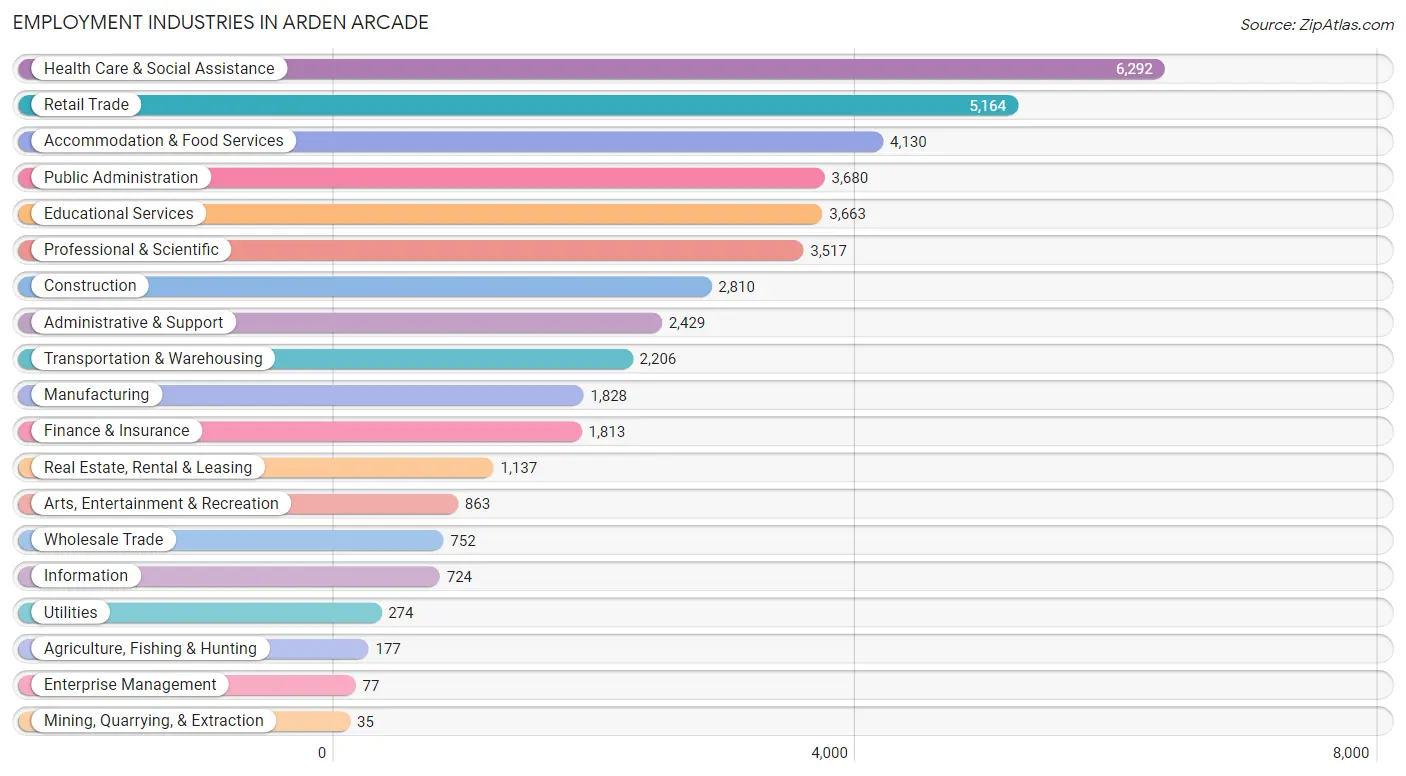
Employment Industries in Arden Arcade
The major employment industries in Arden Arcade include Health Care & Social Assistance (6,292 | 14.4%), Retail Trade (5,164 | 11.8%), Accommodation & Food Services (4,130 | 9.4%), Public Administration (3,680 | 8.4%), and Educational Services (3,663 | 8.4%).
Employment Industries by Sex in Arden Arcade
The Arden Arcade industries that see more men than women are Construction (83.7%), Transportation & Warehousing (79.8%), and Wholesale Trade (75.5%), whereas the industries that tend to have a higher number of women are Enterprise Management (84.4%), Health Care & Social Assistance (72.6%), and Educational Services (69.1%).
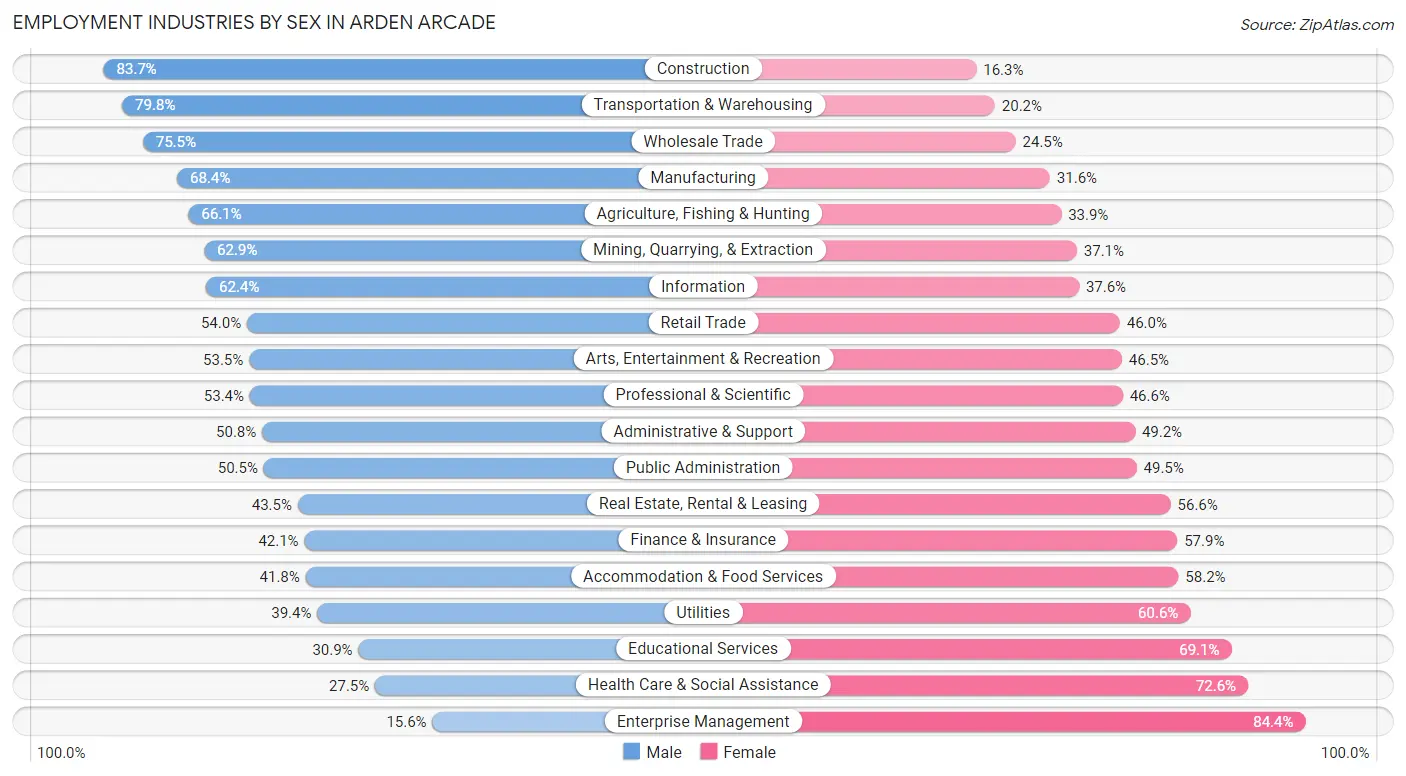
| Industry | Male | Female |
| Agriculture, Fishing & Hunting | 117 (66.1%) | 60 (33.9%) |
| Mining, Quarrying, & Extraction | 22 (62.9%) | 13 (37.1%) |
| Construction | 2,351 (83.7%) | 459 (16.3%) |
| Manufacturing | 1,251 (68.4%) | 577 (31.6%) |
| Wholesale Trade | 568 (75.5%) | 184 (24.5%) |
| Retail Trade | 2,787 (54.0%) | 2,377 (46.0%) |
| Transportation & Warehousing | 1,761 (79.8%) | 445 (20.2%) |
| Utilities | 108 (39.4%) | 166 (60.6%) |
| Information | 452 (62.4%) | 272 (37.6%) |
| Finance & Insurance | 763 (42.1%) | 1,050 (57.9%) |
| Real Estate, Rental & Leasing | 494 (43.4%) | 643 (56.6%) |
| Professional & Scientific | 1,877 (53.4%) | 1,640 (46.6%) |
| Enterprise Management | 12 (15.6%) | 65 (84.4%) |
| Administrative & Support | 1,235 (50.8%) | 1,194 (49.2%) |
| Educational Services | 1,132 (30.9%) | 2,531 (69.1%) |
| Health Care & Social Assistance | 1,727 (27.5%) | 4,565 (72.6%) |
| Arts, Entertainment & Recreation | 462 (53.5%) | 401 (46.5%) |
| Accommodation & Food Services | 1,728 (41.8%) | 2,402 (58.2%) |
| Public Administration | 1,858 (50.5%) | 1,822 (49.5%) |
| Total | 21,709 (49.6%) | 22,061 (50.4%) |
Education in Arden Arcade
School Enrollment in Arden Arcade
The most common levels of schooling among the 24,218 students in Arden Arcade are college / undergraduate (6,546 | 27.0%), elementary school (5,028 | 20.8%), and middle school (4,269 | 17.6%).
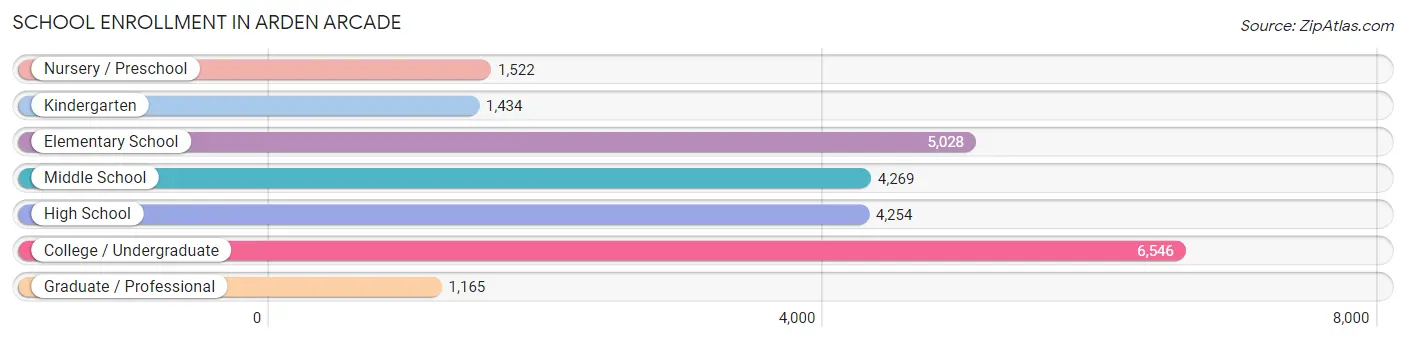
| School Level | # Students | % Students |
| Nursery / Preschool | 1,522 | 6.3% |
| Kindergarten | 1,434 | 5.9% |
| Elementary School | 5,028 | 20.8% |
| Middle School | 4,269 | 17.6% |
| High School | 4,254 | 17.6% |
| College / Undergraduate | 6,546 | 27.0% |
| Graduate / Professional | 1,165 | 4.8% |
| Total | 24,218 | 100.0% |
School Enrollment by Age by Funding Source in Arden Arcade
Out of a total of 24,218 students who are enrolled in schools in Arden Arcade, 3,923 (16.2%) attend a private institution, while the remaining 20,295 (83.8%) are enrolled in public schools. The age group of 3 to 4 year olds has the highest likelihood of being enrolled in private schools, with 471 (42.4% in the age bracket) enrolled. Conversely, the age group of 20 to 24 year olds has the lowest likelihood of being enrolled in a private school, with 2,551 (94.2% in the age bracket) attending a public institution.
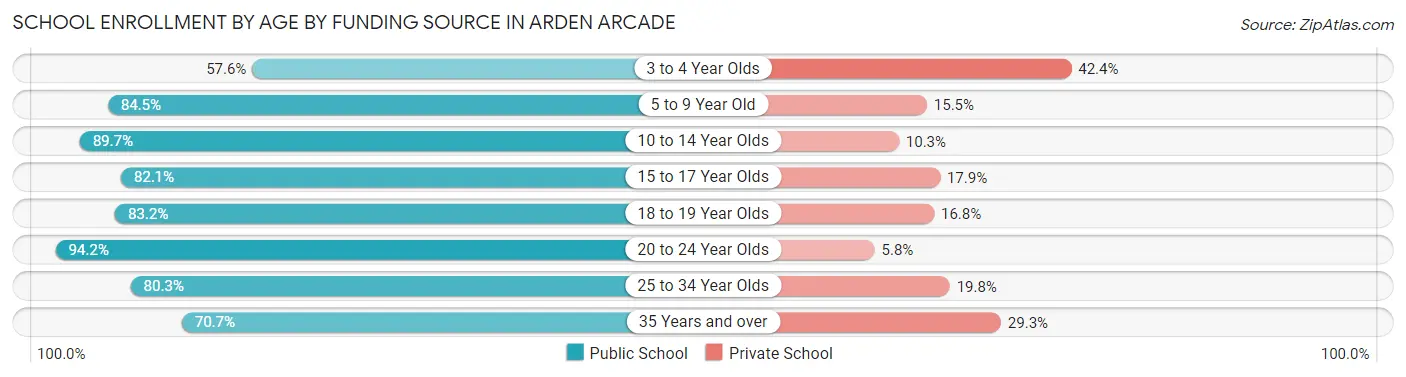
| Age Bracket | Public School | Private School |
| 3 to 4 Year Olds | 640 (57.6%) | 471 (42.4%) |
| 5 to 9 Year Old | 5,406 (84.5%) | 992 (15.5%) |
| 10 to 14 Year Olds | 4,775 (89.7%) | 547 (10.3%) |
| 15 to 17 Year Olds | 2,461 (82.1%) | 538 (17.9%) |
| 18 to 19 Year Olds | 1,249 (83.2%) | 253 (16.8%) |
| 20 to 24 Year Olds | 2,551 (94.2%) | 156 (5.8%) |
| 25 to 34 Year Olds | 2,085 (80.2%) | 513 (19.8%) |
| 35 Years and over | 1,118 (70.7%) | 463 (29.3%) |
| Total | 20,295 (83.8%) | 3,923 (16.2%) |
Educational Attainment by Field of Study in Arden Arcade
Business (3,823 | 14.7%), social sciences (3,390 | 13.0%), education (2,213 | 8.5%), bio, nature & agricultural (2,203 | 8.5%), and science & technology (2,174 | 8.4%) are the most common fields of study among 26,031 individuals in Arden Arcade who have obtained a bachelor's degree or higher.
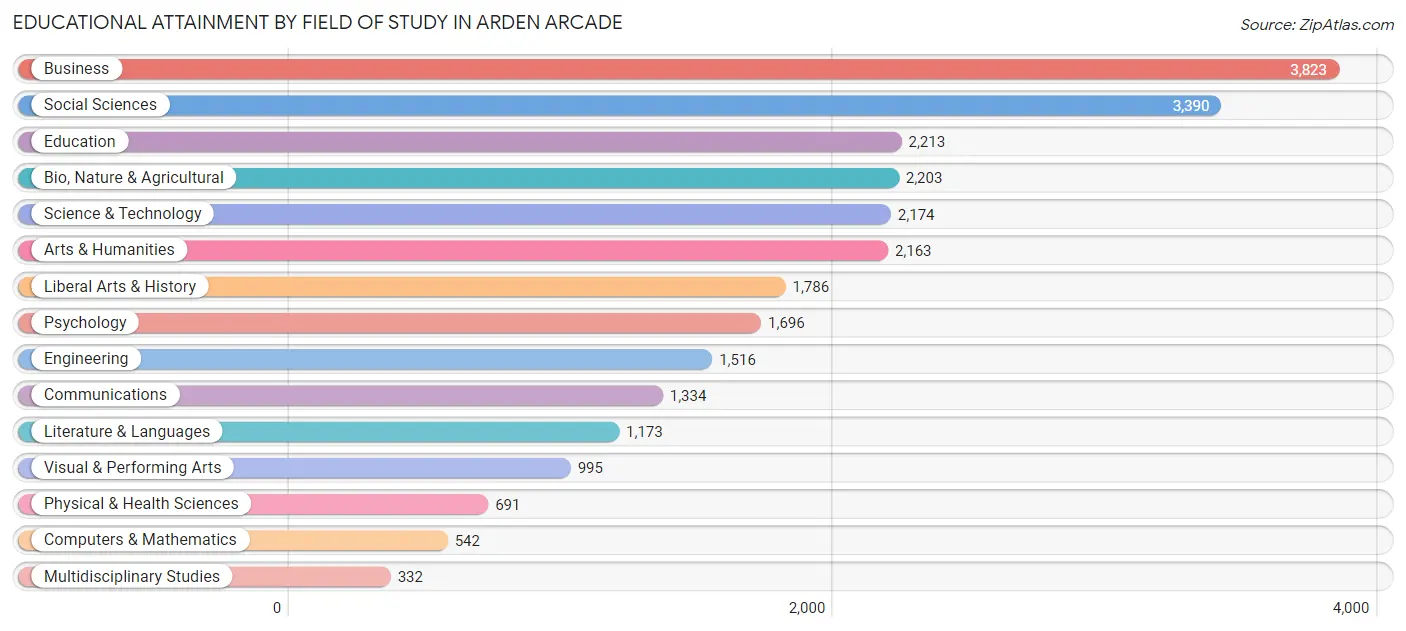
| Field of Study | # Graduates | % Graduates |
| Computers & Mathematics | 542 | 2.1% |
| Bio, Nature & Agricultural | 2,203 | 8.5% |
| Physical & Health Sciences | 691 | 2.6% |
| Psychology | 1,696 | 6.5% |
| Social Sciences | 3,390 | 13.0% |
| Engineering | 1,516 | 5.8% |
| Multidisciplinary Studies | 332 | 1.3% |
| Science & Technology | 2,174 | 8.4% |
| Business | 3,823 | 14.7% |
| Education | 2,213 | 8.5% |
| Literature & Languages | 1,173 | 4.5% |
| Liberal Arts & History | 1,786 | 6.9% |
| Visual & Performing Arts | 995 | 3.8% |
| Communications | 1,334 | 5.1% |
| Arts & Humanities | 2,163 | 8.3% |
| Total | 26,031 | 100.0% |
Transportation & Commute in Arden Arcade
Vehicle Availability by Sex in Arden Arcade
The most prevalent vehicle ownership categories in Arden Arcade are males with 2 vehicles (9,512, accounting for 44.8%) and females with 2 vehicles (8,712, making up 44.8%).
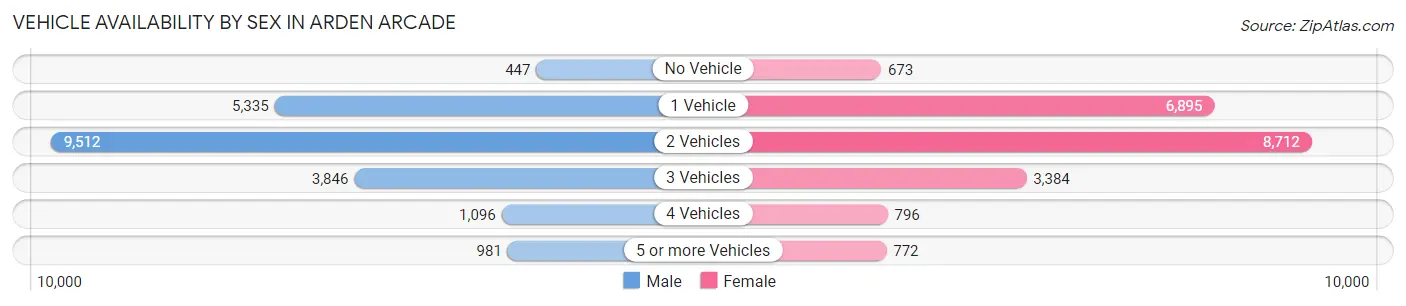
| Vehicles Available | Male | Female |
| No Vehicle | 447 (2.1%) | 673 (3.2%) |
| 1 Vehicle | 5,335 (25.1%) | 6,895 (32.5%) |
| 2 Vehicles | 9,512 (44.8%) | 8,712 (41.0%) |
| 3 Vehicles | 3,846 (18.1%) | 3,384 (15.9%) |
| 4 Vehicles | 1,096 (5.2%) | 796 (3.7%) |
| 5 or more Vehicles | 981 (4.6%) | 772 (3.6%) |
| Total | 21,217 (100.0%) | 21,232 (100.0%) |
Commute Time in Arden Arcade
The most frequently occuring commute durations in Arden Arcade are 20 to 24 minutes (6,640 commuters, 18.1%), 15 to 19 minutes (6,023 commuters, 16.5%), and 30 to 34 minutes (5,858 commuters, 16.0%).
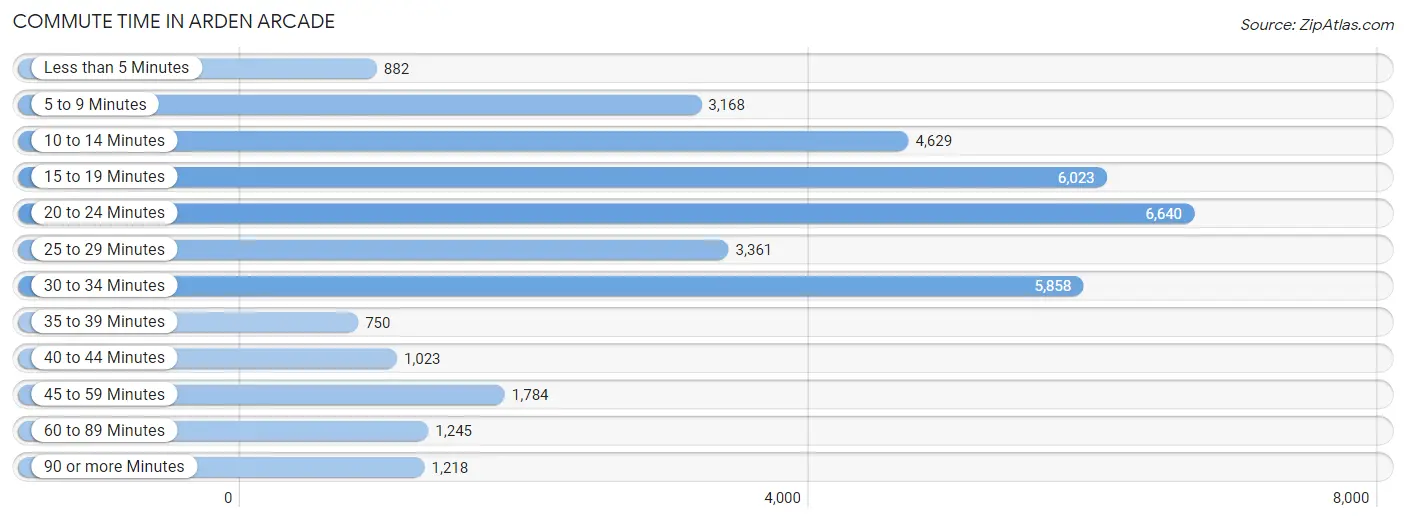
| Commute Time | # Commuters | % Commuters |
| Less than 5 Minutes | 882 | 2.4% |
| 5 to 9 Minutes | 3,168 | 8.7% |
| 10 to 14 Minutes | 4,629 | 12.7% |
| 15 to 19 Minutes | 6,023 | 16.5% |
| 20 to 24 Minutes | 6,640 | 18.1% |
| 25 to 29 Minutes | 3,361 | 9.2% |
| 30 to 34 Minutes | 5,858 | 16.0% |
| 35 to 39 Minutes | 750 | 2.1% |
| 40 to 44 Minutes | 1,023 | 2.8% |
| 45 to 59 Minutes | 1,784 | 4.9% |
| 60 to 89 Minutes | 1,245 | 3.4% |
| 90 or more Minutes | 1,218 | 3.3% |
Commute Time by Sex in Arden Arcade
The most common commute times in Arden Arcade are 20 to 24 minutes (3,656 commuters, 19.6%) for males and 15 to 19 minutes (3,419 commuters, 19.1%) for females.
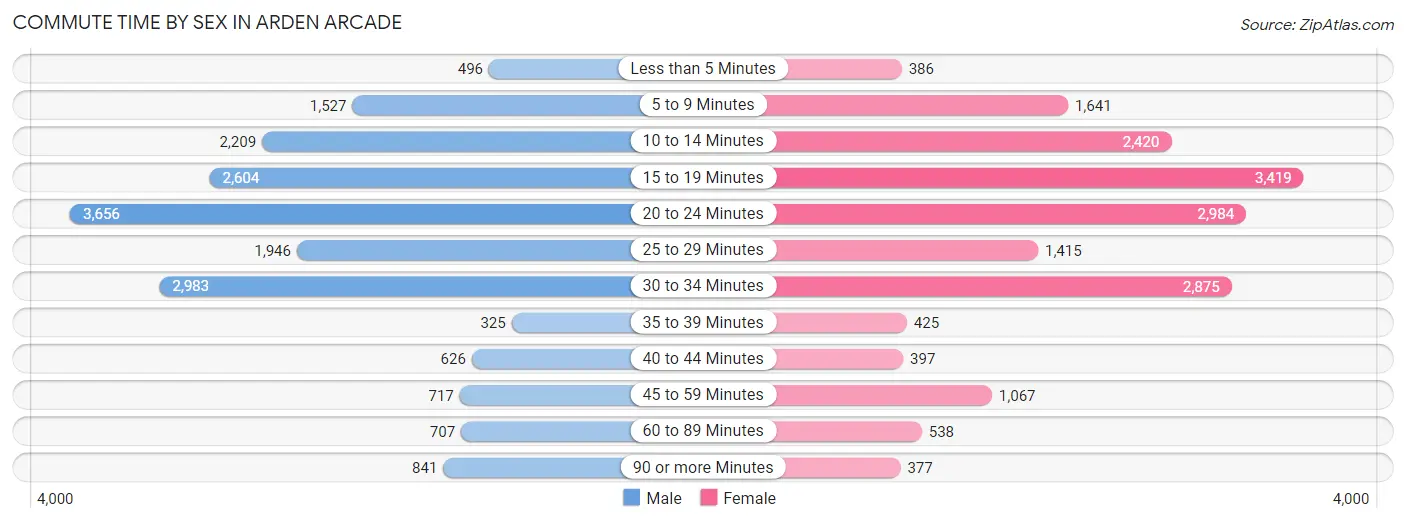
| Commute Time | Male | Female |
| Less than 5 Minutes | 496 (2.7%) | 386 (2.1%) |
| 5 to 9 Minutes | 1,527 (8.2%) | 1,641 (9.1%) |
| 10 to 14 Minutes | 2,209 (11.8%) | 2,420 (13.5%) |
| 15 to 19 Minutes | 2,604 (14.0%) | 3,419 (19.1%) |
| 20 to 24 Minutes | 3,656 (19.6%) | 2,984 (16.6%) |
| 25 to 29 Minutes | 1,946 (10.4%) | 1,415 (7.9%) |
| 30 to 34 Minutes | 2,983 (16.0%) | 2,875 (16.0%) |
| 35 to 39 Minutes | 325 (1.7%) | 425 (2.4%) |
| 40 to 44 Minutes | 626 (3.4%) | 397 (2.2%) |
| 45 to 59 Minutes | 717 (3.8%) | 1,067 (5.9%) |
| 60 to 89 Minutes | 707 (3.8%) | 538 (3.0%) |
| 90 or more Minutes | 841 (4.5%) | 377 (2.1%) |
Time of Departure to Work by Sex in Arden Arcade
The most frequent times of departure to work in Arden Arcade are 7:30 AM to 7:59 AM (2,133, 11.4%) for males and 7:30 AM to 7:59 AM (3,004, 16.7%) for females.
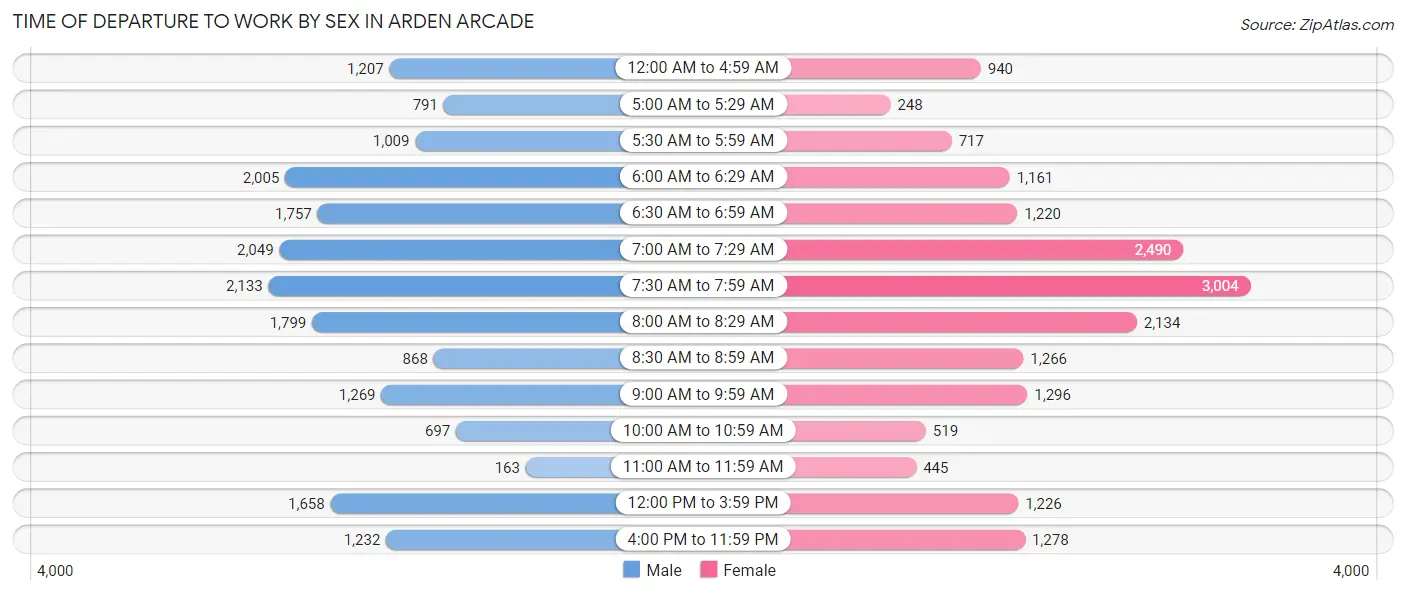
| Time of Departure | Male | Female |
| 12:00 AM to 4:59 AM | 1,207 (6.5%) | 940 (5.2%) |
| 5:00 AM to 5:29 AM | 791 (4.2%) | 248 (1.4%) |
| 5:30 AM to 5:59 AM | 1,009 (5.4%) | 717 (4.0%) |
| 6:00 AM to 6:29 AM | 2,005 (10.8%) | 1,161 (6.5%) |
| 6:30 AM to 6:59 AM | 1,757 (9.4%) | 1,220 (6.8%) |
| 7:00 AM to 7:29 AM | 2,049 (11.0%) | 2,490 (13.9%) |
| 7:30 AM to 7:59 AM | 2,133 (11.4%) | 3,004 (16.7%) |
| 8:00 AM to 8:29 AM | 1,799 (9.7%) | 2,134 (11.9%) |
| 8:30 AM to 8:59 AM | 868 (4.7%) | 1,266 (7.1%) |
| 9:00 AM to 9:59 AM | 1,269 (6.8%) | 1,296 (7.2%) |
| 10:00 AM to 10:59 AM | 697 (3.7%) | 519 (2.9%) |
| 11:00 AM to 11:59 AM | 163 (0.9%) | 445 (2.5%) |
| 12:00 PM to 3:59 PM | 1,658 (8.9%) | 1,226 (6.8%) |
| 4:00 PM to 11:59 PM | 1,232 (6.6%) | 1,278 (7.1%) |
| Total | 18,637 (100.0%) | 17,944 (100.0%) |
Housing Occupancy in Arden Arcade
Occupancy by Ownership in Arden Arcade
Of the total 39,044 dwellings in Arden Arcade, owner-occupied units account for 17,515 (44.9%), while renter-occupied units make up 21,529 (55.1%).
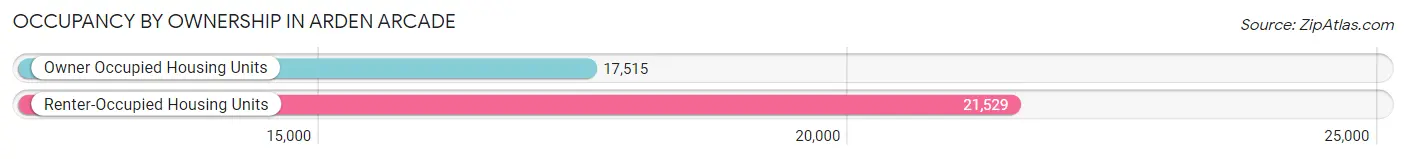
| Occupancy | # Housing Units | % Housing Units |
| Owner Occupied Housing Units | 17,515 | 44.9% |
| Renter-Occupied Housing Units | 21,529 | 55.1% |
| Total Occupied Housing Units | 39,044 | 100.0% |
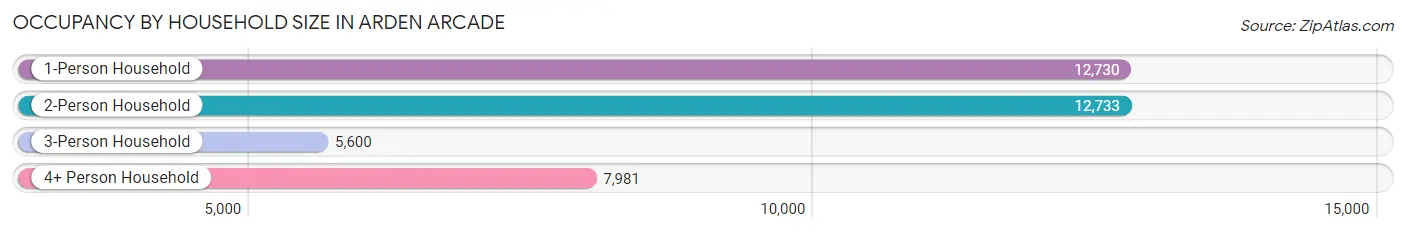
Occupancy by Household Size in Arden Arcade
| Household Size | # Housing Units | % Housing Units |
| 1-Person Household | 12,730 | 32.6% |
| 2-Person Household | 12,733 | 32.6% |
| 3-Person Household | 5,600 | 14.3% |
| 4+ Person Household | 7,981 | 20.4% |
| Total Housing Units | 39,044 | 100.0% |
Occupancy by Ownership by Household Size in Arden Arcade
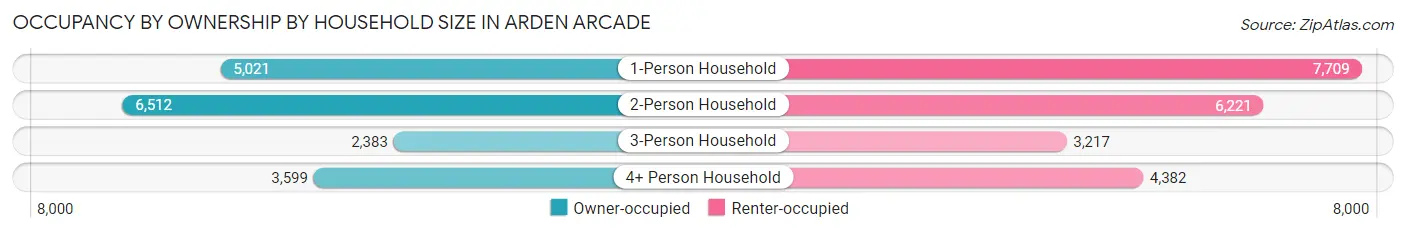
| Household Size | Owner-occupied | Renter-occupied |
| 1-Person Household | 5,021 (39.4%) | 7,709 (60.6%) |
| 2-Person Household | 6,512 (51.1%) | 6,221 (48.9%) |
| 3-Person Household | 2,383 (42.5%) | 3,217 (57.5%) |
| 4+ Person Household | 3,599 (45.1%) | 4,382 (54.9%) |
| Total Housing Units | 17,515 (44.9%) | 21,529 (55.1%) |
Occupancy by Educational Attainment in Arden Arcade
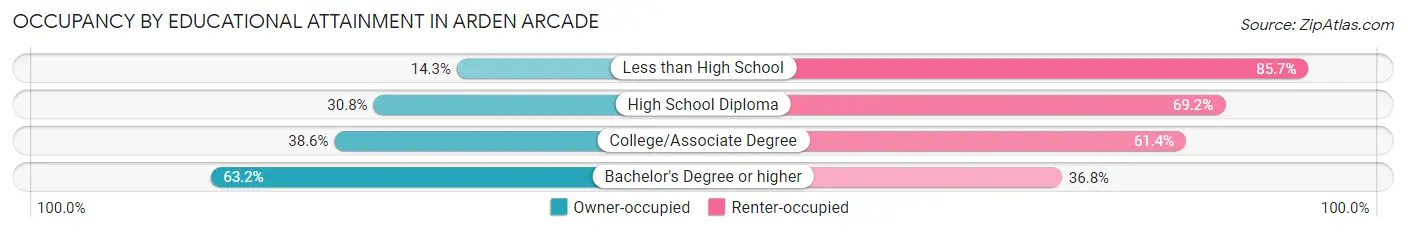
| Household Size | Owner-occupied | Renter-occupied |
| Less than High School | 449 (14.3%) | 2,686 (85.7%) |
| High School Diploma | 2,310 (30.8%) | 5,181 (69.2%) |
| College/Associate Degree | 5,019 (38.6%) | 7,986 (61.4%) |
| Bachelor's Degree or higher | 9,737 (63.2%) | 5,676 (36.8%) |
Occupancy by Age of Householder in Arden Arcade
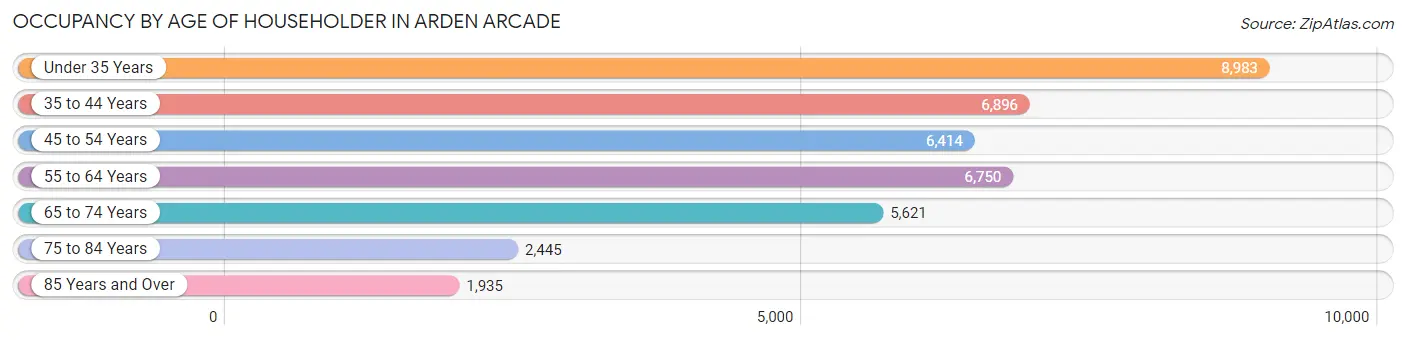
| Age Bracket | # Households | % Households |
| Under 35 Years | 8,983 | 23.0% |
| 35 to 44 Years | 6,896 | 17.7% |
| 45 to 54 Years | 6,414 | 16.4% |
| 55 to 64 Years | 6,750 | 17.3% |
| 65 to 74 Years | 5,621 | 14.4% |
| 75 to 84 Years | 2,445 | 6.3% |
| 85 Years and Over | 1,935 | 5.0% |
| Total | 39,044 | 100.0% |
Housing Finances in Arden Arcade
Median Income by Occupancy in Arden Arcade
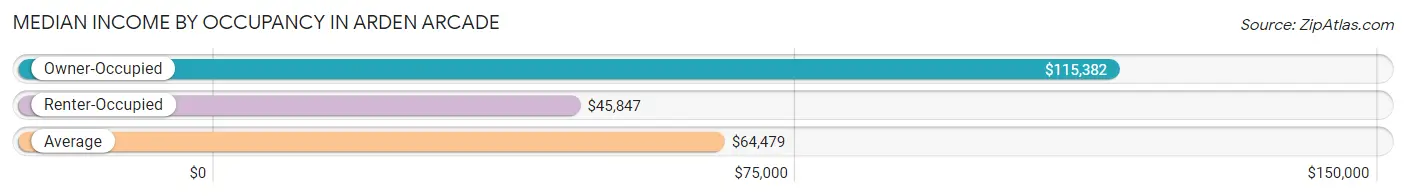
| Occupancy Type | # Households | Median Income |
| Owner-Occupied | 17,515 (44.9%) | $115,382 |
| Renter-Occupied | 21,529 (55.1%) | $45,847 |
| Average | 39,044 (100.0%) | $64,479 |
Occupancy by Householder Income Bracket in Arden Arcade
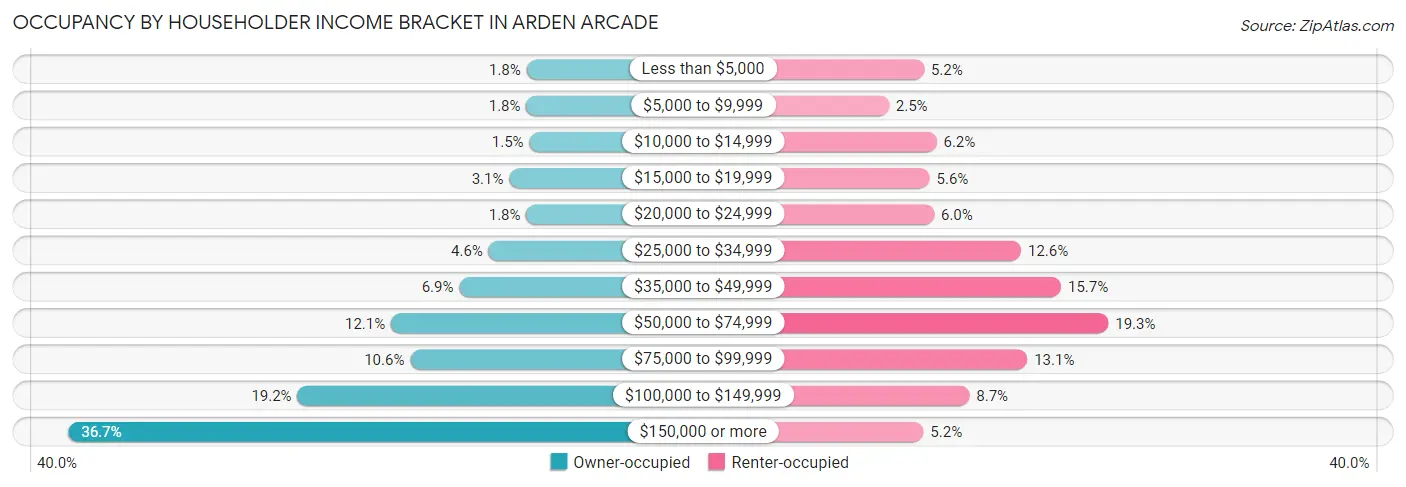
| Income Bracket | Owner-occupied | Renter-occupied |
| Less than $5,000 | 307 (1.8%) | 1,122 (5.2%) |
| $5,000 to $9,999 | 310 (1.8%) | 547 (2.5%) |
| $10,000 to $14,999 | 270 (1.5%) | 1,329 (6.2%) |
| $15,000 to $19,999 | 537 (3.1%) | 1,214 (5.6%) |
| $20,000 to $24,999 | 310 (1.8%) | 1,288 (6.0%) |
| $25,000 to $34,999 | 813 (4.6%) | 2,714 (12.6%) |
| $35,000 to $49,999 | 1,205 (6.9%) | 3,372 (15.7%) |
| $50,000 to $74,999 | 2,116 (12.1%) | 4,146 (19.3%) |
| $75,000 to $99,999 | 1,860 (10.6%) | 2,817 (13.1%) |
| $100,000 to $149,999 | 3,365 (19.2%) | 1,866 (8.7%) |
| $150,000 or more | 6,422 (36.7%) | 1,114 (5.2%) |
| Total | 17,515 (100.0%) | 21,529 (100.0%) |
Monthly Housing Cost Tiers in Arden Arcade
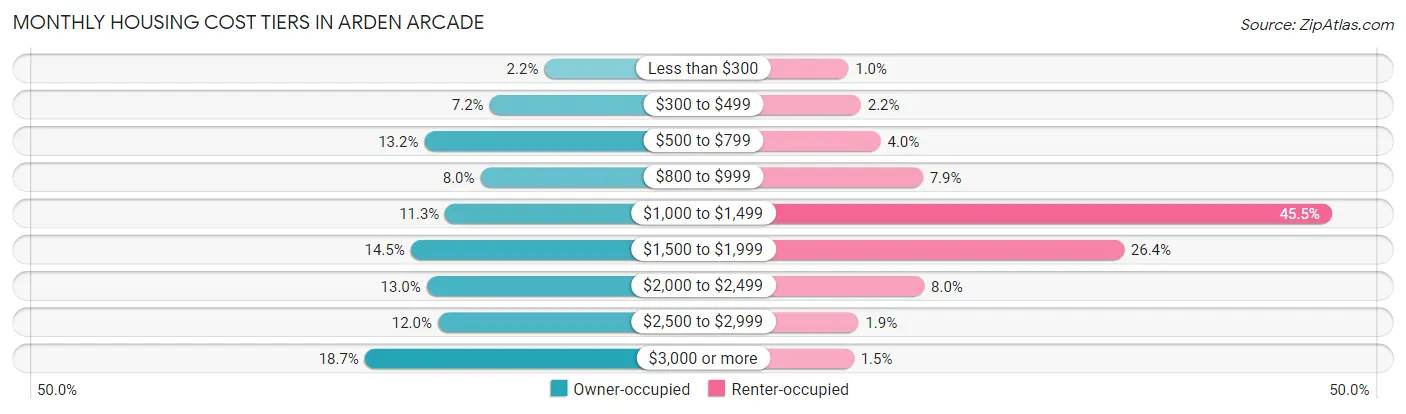
| Monthly Cost | Owner-occupied | Renter-occupied |
| Less than $300 | 378 (2.2%) | 215 (1.0%) |
| $300 to $499 | 1,262 (7.2%) | 463 (2.1%) |
| $500 to $799 | 2,313 (13.2%) | 855 (4.0%) |
| $800 to $999 | 1,409 (8.0%) | 1,691 (7.9%) |
| $1,000 to $1,499 | 1,975 (11.3%) | 9,795 (45.5%) |
| $1,500 to $1,999 | 2,534 (14.5%) | 5,677 (26.4%) |
| $2,000 to $2,499 | 2,276 (13.0%) | 1,718 (8.0%) |
| $2,500 to $2,999 | 2,095 (12.0%) | 417 (1.9%) |
| $3,000 or more | 3,273 (18.7%) | 322 (1.5%) |
| Total | 17,515 (100.0%) | 21,529 (100.0%) |
Physical Housing Characteristics in Arden Arcade
Housing Structures in Arden Arcade
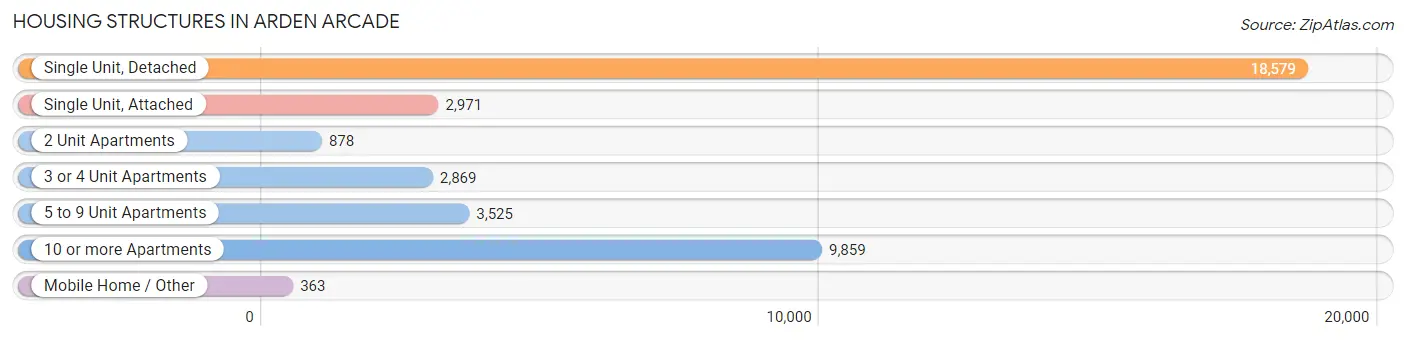
| Structure Type | # Housing Units | % Housing Units |
| Single Unit, Detached | 18,579 | 47.6% |
| Single Unit, Attached | 2,971 | 7.6% |
| 2 Unit Apartments | 878 | 2.2% |
| 3 or 4 Unit Apartments | 2,869 | 7.3% |
| 5 to 9 Unit Apartments | 3,525 | 9.0% |
| 10 or more Apartments | 9,859 | 25.3% |
| Mobile Home / Other | 363 | 0.9% |
| Total | 39,044 | 100.0% |
Housing Structures by Occupancy in Arden Arcade
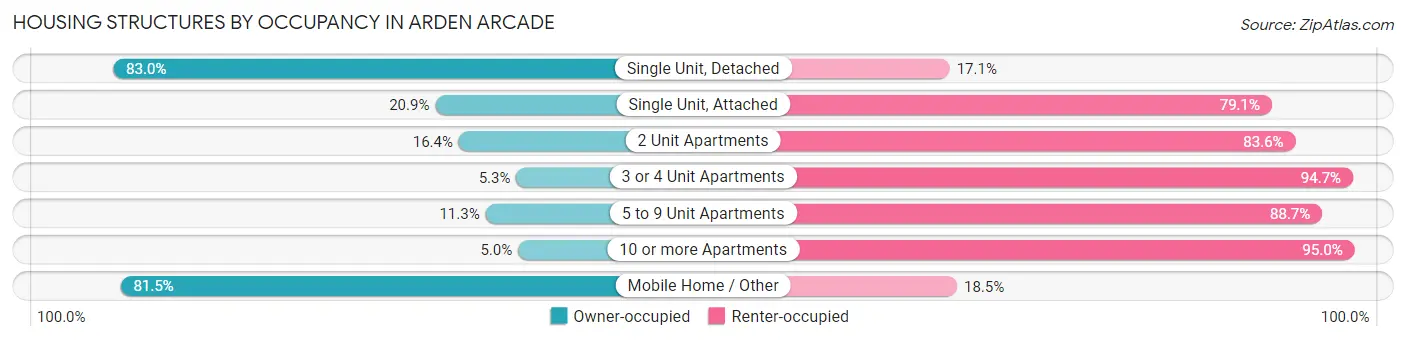
| Structure Type | Owner-occupied | Renter-occupied |
| Single Unit, Detached | 15,411 (83.0%) | 3,168 (17.1%) |
| Single Unit, Attached | 622 (20.9%) | 2,349 (79.1%) |
| 2 Unit Apartments | 144 (16.4%) | 734 (83.6%) |
| 3 or 4 Unit Apartments | 153 (5.3%) | 2,716 (94.7%) |
| 5 to 9 Unit Apartments | 397 (11.3%) | 3,128 (88.7%) |
| 10 or more Apartments | 492 (5.0%) | 9,367 (95.0%) |
| Mobile Home / Other | 296 (81.5%) | 67 (18.5%) |
| Total | 17,515 (44.9%) | 21,529 (55.1%) |
Housing Structures by Number of Rooms in Arden Arcade
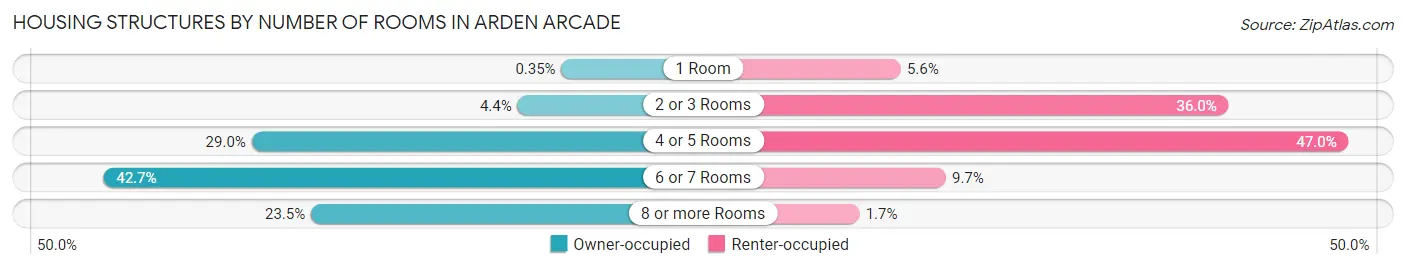
| Number of Rooms | Owner-occupied | Renter-occupied |
| 1 Room | 62 (0.4%) | 1,195 (5.6%) |
| 2 or 3 Rooms | 773 (4.4%) | 7,740 (35.9%) |
| 4 or 5 Rooms | 5,079 (29.0%) | 10,127 (47.0%) |
| 6 or 7 Rooms | 7,483 (42.7%) | 2,092 (9.7%) |
| 8 or more Rooms | 4,118 (23.5%) | 375 (1.7%) |
| Total | 17,515 (100.0%) | 21,529 (100.0%) |
Housing Structure by Heating Type in Arden Arcade
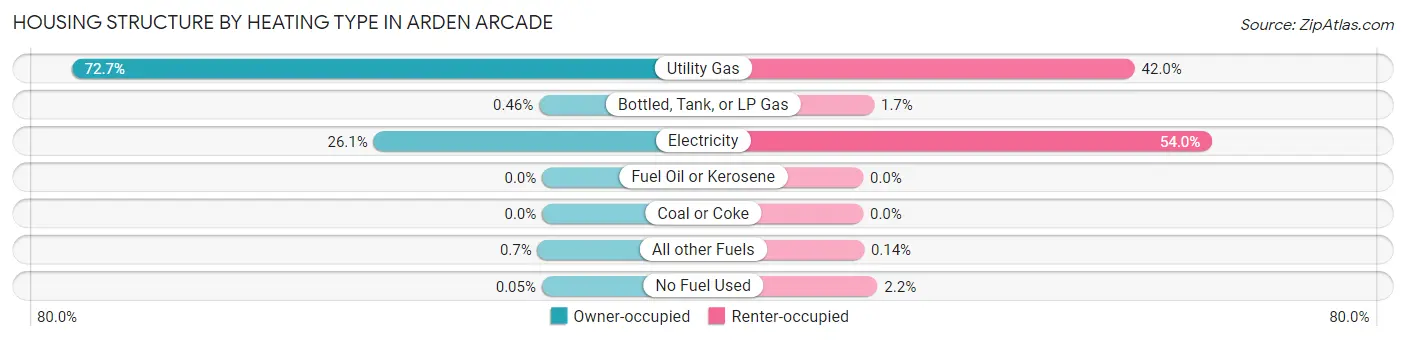
| Heating Type | Owner-occupied | Renter-occupied |
| Utility Gas | 12,738 (72.7%) | 9,038 (42.0%) |
| Bottled, Tank, or LP Gas | 80 (0.5%) | 367 (1.7%) |
| Electricity | 4,565 (26.1%) | 11,616 (54.0%) |
| Fuel Oil or Kerosene | 0 (0.0%) | 0 (0.0%) |
| Coal or Coke | 0 (0.0%) | 0 (0.0%) |
| All other Fuels | 123 (0.7%) | 30 (0.1%) |
| No Fuel Used | 9 (0.1%) | 478 (2.2%) |
| Total | 17,515 (100.0%) | 21,529 (100.0%) |
Household Vehicle Usage in Arden Arcade
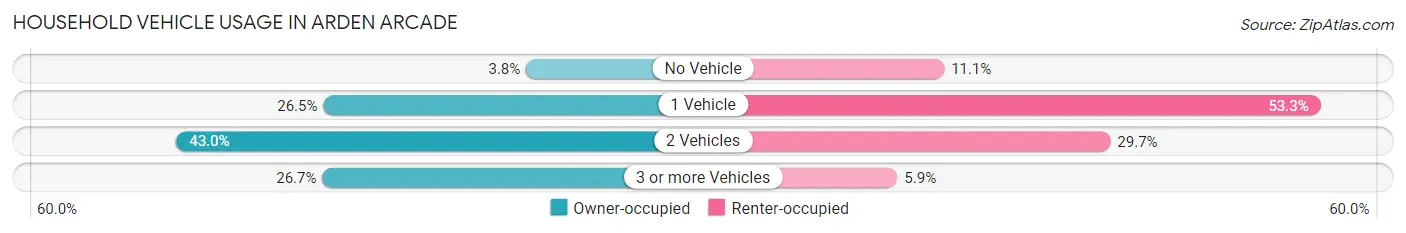
| Vehicles per Household | Owner-occupied | Renter-occupied |
| No Vehicle | 669 (3.8%) | 2,393 (11.1%) |
| 1 Vehicle | 4,648 (26.5%) | 11,468 (53.3%) |
| 2 Vehicles | 7,531 (43.0%) | 6,403 (29.7%) |
| 3 or more Vehicles | 4,667 (26.7%) | 1,265 (5.9%) |
| Total | 17,515 (100.0%) | 21,529 (100.0%) |
Real Estate & Mortgages in Arden Arcade
Real Estate and Mortgage Overview in Arden Arcade
| Characteristic | Without Mortgage | With Mortgage |
| Housing Units | 6,244 | 11,271 |
| Median Property Value | $448,900 | $472,800 |
| Median Household Income | $75,718 | $4,858 |
| Monthly Housing Costs | $680 | $3,201 |
| Real Estate Taxes | $2,591 | $166 |
Property Value by Mortgage Status in Arden Arcade
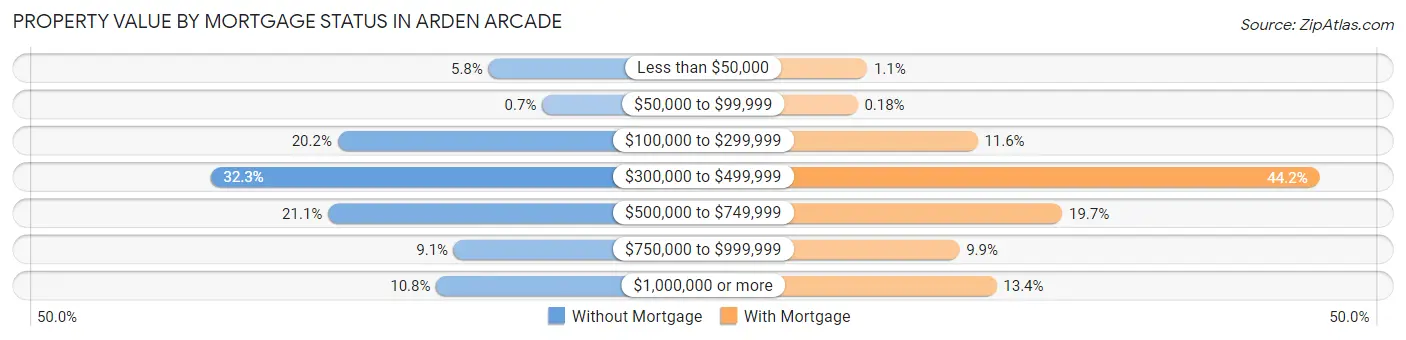
| Property Value | Without Mortgage | With Mortgage |
| Less than $50,000 | 363 (5.8%) | 123 (1.1%) |
| $50,000 to $99,999 | 44 (0.7%) | 20 (0.2%) |
| $100,000 to $299,999 | 1,260 (20.2%) | 1,308 (11.6%) |
| $300,000 to $499,999 | 2,017 (32.3%) | 4,980 (44.2%) |
| $500,000 to $749,999 | 1,317 (21.1%) | 2,217 (19.7%) |
| $750,000 to $999,999 | 569 (9.1%) | 1,112 (9.9%) |
| $1,000,000 or more | 674 (10.8%) | 1,511 (13.4%) |
| Total | 6,244 (100.0%) | 11,271 (100.0%) |
Household Income by Mortgage Status in Arden Arcade
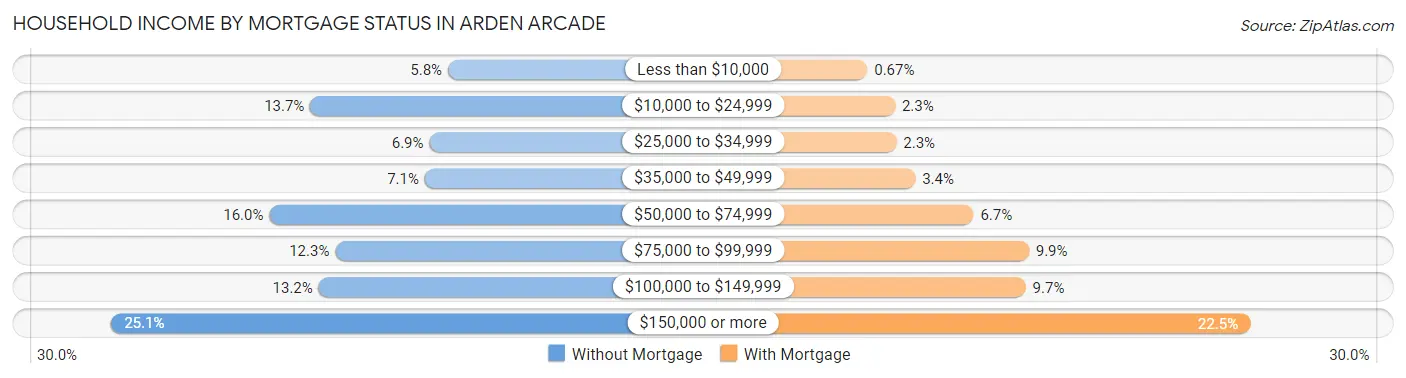
| Household Income | Without Mortgage | With Mortgage |
| Less than $10,000 | 363 (5.8%) | 76 (0.7%) |
| $10,000 to $24,999 | 854 (13.7%) | 254 (2.2%) |
| $25,000 to $34,999 | 429 (6.9%) | 263 (2.3%) |
| $35,000 to $49,999 | 445 (7.1%) | 384 (3.4%) |
| $50,000 to $74,999 | 1,000 (16.0%) | 760 (6.7%) |
| $75,000 to $99,999 | 765 (12.2%) | 1,116 (9.9%) |
| $100,000 to $149,999 | 824 (13.2%) | 1,095 (9.7%) |
| $150,000 or more | 1,564 (25.1%) | 2,541 (22.5%) |
| Total | 6,244 (100.0%) | 11,271 (100.0%) |
Property Value to Household Income Ratio in Arden Arcade
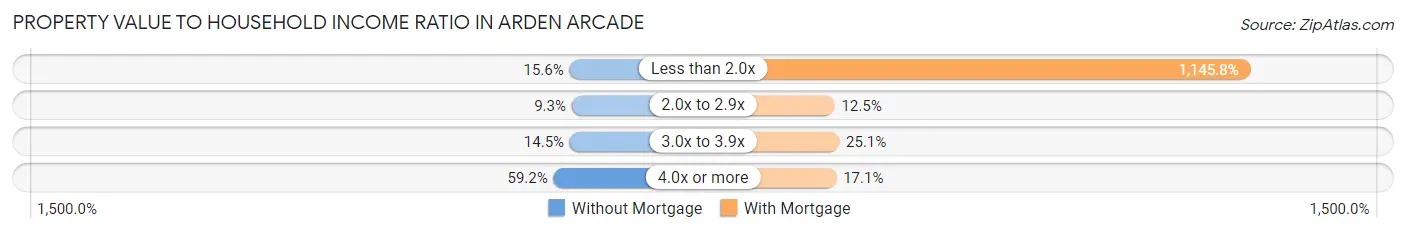
| Value-to-Income Ratio | Without Mortgage | With Mortgage |
| Less than 2.0x | 973 (15.6%) | 129,137 (1,145.7%) |
| 2.0x to 2.9x | 580 (9.3%) | 1,403 (12.4%) |
| 3.0x to 3.9x | 903 (14.5%) | 2,828 (25.1%) |
| 4.0x or more | 3,694 (59.2%) | 1,932 (17.1%) |
| Total | 6,244 (100.0%) | 11,271 (100.0%) |
Real Estate Taxes by Mortgage Status in Arden Arcade
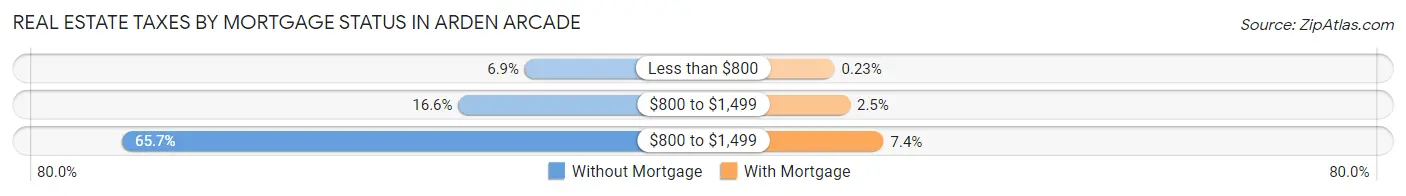
| Property Taxes | Without Mortgage | With Mortgage |
| Less than $800 | 431 (6.9%) | 26 (0.2%) |
| $800 to $1,499 | 1,038 (16.6%) | 279 (2.5%) |
| $800 to $1,499 | 4,105 (65.7%) | 833 (7.4%) |
| Total | 6,244 (100.0%) | 11,271 (100.0%) |
Health & Disability in Arden Arcade
Health Insurance Coverage by Age in Arden Arcade
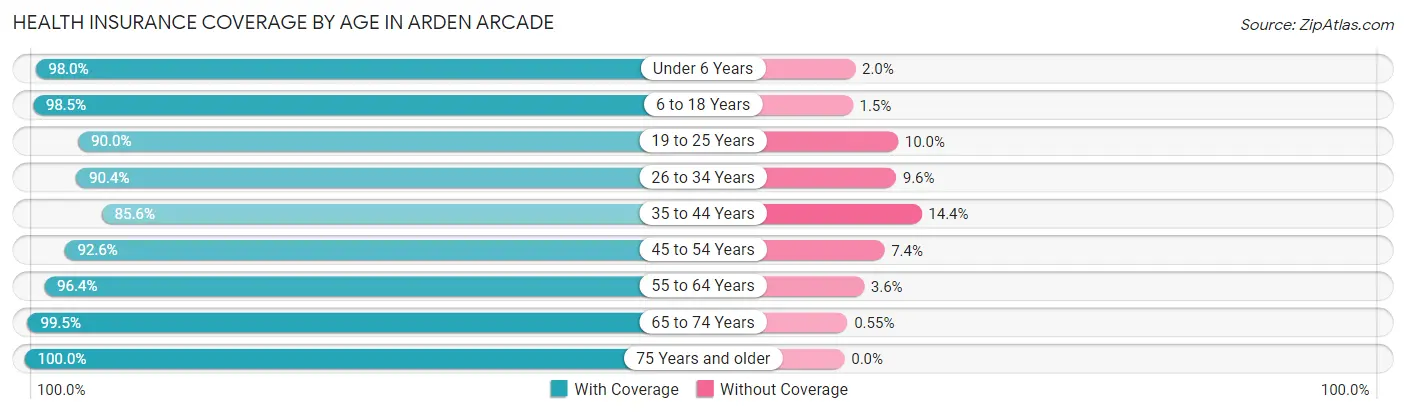
| Age Bracket | With Coverage | Without Coverage |
| Under 6 Years | 7,727 (98.0%) | 158 (2.0%) |
| 6 to 18 Years | 14,746 (98.5%) | 230 (1.5%) |
| 19 to 25 Years | 7,775 (90.0%) | 862 (10.0%) |
| 26 to 34 Years | 12,383 (90.4%) | 1,315 (9.6%) |
| 35 to 44 Years | 11,038 (85.6%) | 1,853 (14.4%) |
| 45 to 54 Years | 10,158 (92.6%) | 816 (7.4%) |
| 55 to 64 Years | 10,442 (96.4%) | 395 (3.6%) |
| 65 to 74 Years | 9,019 (99.5%) | 50 (0.5%) |
| 75 Years and older | 6,494 (100.0%) | 0 (0.0%) |
| Total | 89,782 (94.1%) | 5,679 (5.9%) |
Health Insurance Coverage by Citizenship Status in Arden Arcade
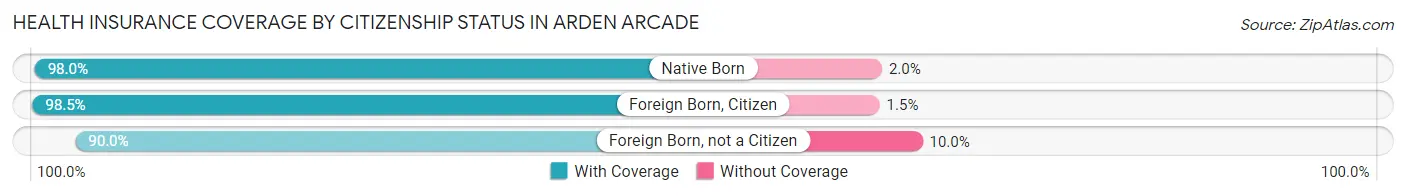
| Citizenship Status | With Coverage | Without Coverage |
| Native Born | 7,727 (98.0%) | 158 (2.0%) |
| Foreign Born, Citizen | 14,746 (98.5%) | 230 (1.5%) |
| Foreign Born, not a Citizen | 7,775 (90.0%) | 862 (10.0%) |
Health Insurance Coverage by Household Income in Arden Arcade
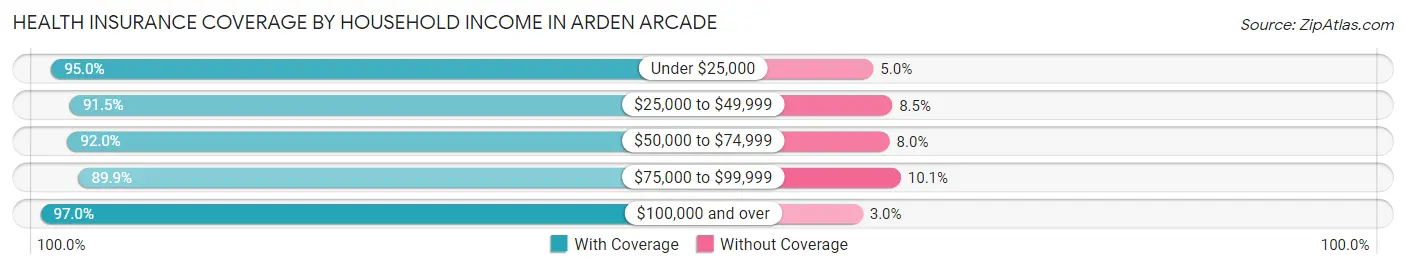
| Household Income | With Coverage | Without Coverage |
| Under $25,000 | 13,520 (95.0%) | 710 (5.0%) |
| $25,000 to $49,999 | 16,727 (91.5%) | 1,556 (8.5%) |
| $50,000 to $74,999 | 13,612 (92.0%) | 1,189 (8.0%) |
| $75,000 to $99,999 | 9,899 (89.9%) | 1,116 (10.1%) |
| $100,000 and over | 35,291 (97.0%) | 1,086 (3.0%) |
Public vs Private Health Insurance Coverage by Age in Arden Arcade
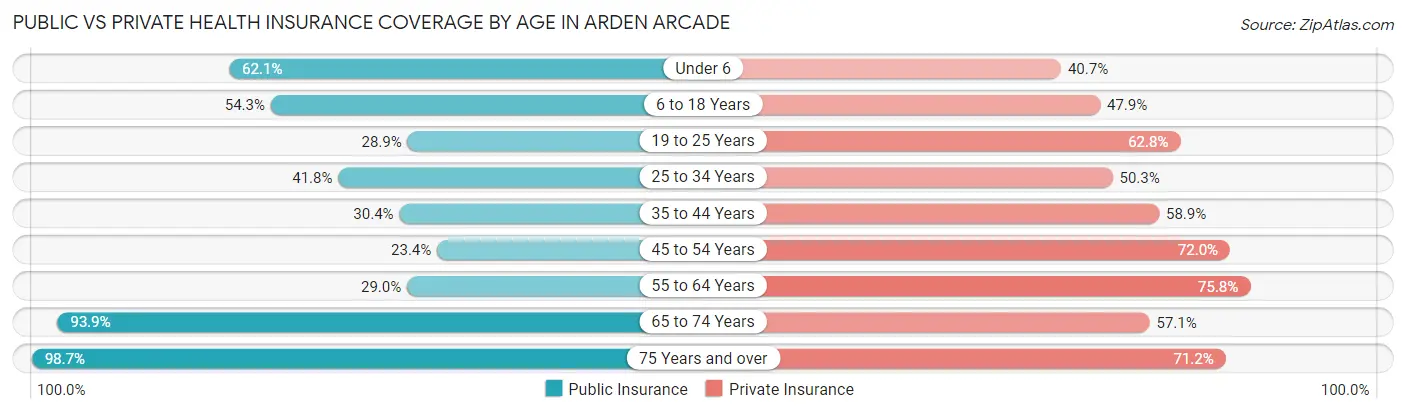
| Age Bracket | Public Insurance | Private Insurance |
| Under 6 | 4,893 (62.1%) | 3,208 (40.7%) |
| 6 to 18 Years | 8,132 (54.3%) | 7,179 (47.9%) |
| 19 to 25 Years | 2,498 (28.9%) | 5,425 (62.8%) |
| 25 to 34 Years | 5,722 (41.8%) | 6,884 (50.3%) |
| 35 to 44 Years | 3,923 (30.4%) | 7,590 (58.9%) |
| 45 to 54 Years | 2,571 (23.4%) | 7,906 (72.0%) |
| 55 to 64 Years | 3,145 (29.0%) | 8,212 (75.8%) |
| 65 to 74 Years | 8,518 (93.9%) | 5,181 (57.1%) |
| 75 Years and over | 6,408 (98.7%) | 4,625 (71.2%) |
| Total | 45,810 (48.0%) | 56,210 (58.9%) |
Disability Status by Sex by Age in Arden Arcade
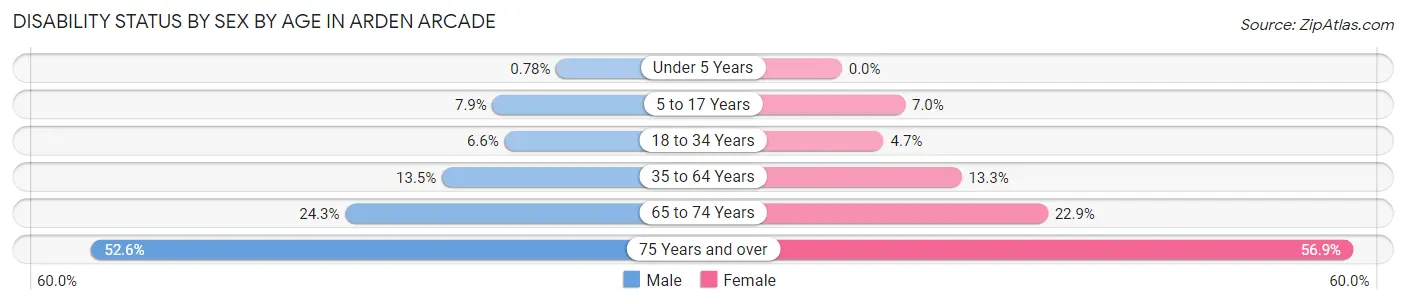
| Age Bracket | Male | Female |
| Under 5 Years | 27 (0.8%) | 0 (0.0%) |
| 5 to 17 Years | 653 (7.9%) | 507 (7.0%) |
| 18 to 34 Years | 691 (6.6%) | 596 (4.7%) |
| 35 to 64 Years | 2,320 (13.5%) | 2,335 (13.3%) |
| 65 to 74 Years | 924 (24.3%) | 1,207 (22.9%) |
| 75 Years and over | 1,320 (52.6%) | 2,267 (56.9%) |
Disability Class by Sex by Age in Arden Arcade
Disability Class: Hearing Difficulty
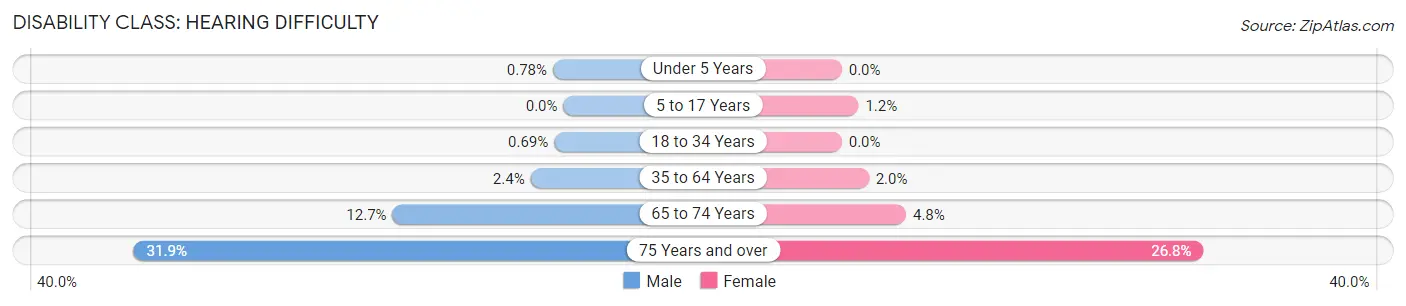
| Age Bracket | Male | Female |
| Under 5 Years | 27 (0.8%) | 0 (0.0%) |
| 5 to 17 Years | 0 (0.0%) | 89 (1.2%) |
| 18 to 34 Years | 73 (0.7%) | 0 (0.0%) |
| 35 to 64 Years | 420 (2.4%) | 351 (2.0%) |
| 65 to 74 Years | 483 (12.7%) | 251 (4.8%) |
| 75 Years and over | 801 (31.9%) | 1,069 (26.8%) |
Disability Class: Vision Difficulty
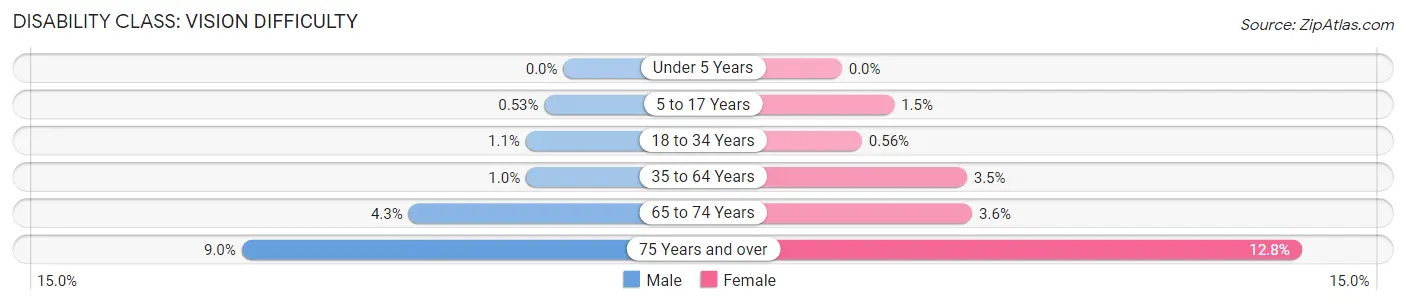
| Age Bracket | Male | Female |
| Under 5 Years | 0 (0.0%) | 0 (0.0%) |
| 5 to 17 Years | 44 (0.5%) | 105 (1.5%) |
| 18 to 34 Years | 111 (1.1%) | 72 (0.6%) |
| 35 to 64 Years | 179 (1.0%) | 610 (3.5%) |
| 65 to 74 Years | 164 (4.3%) | 191 (3.6%) |
| 75 Years and over | 225 (9.0%) | 510 (12.8%) |
Disability Class: Cognitive Difficulty
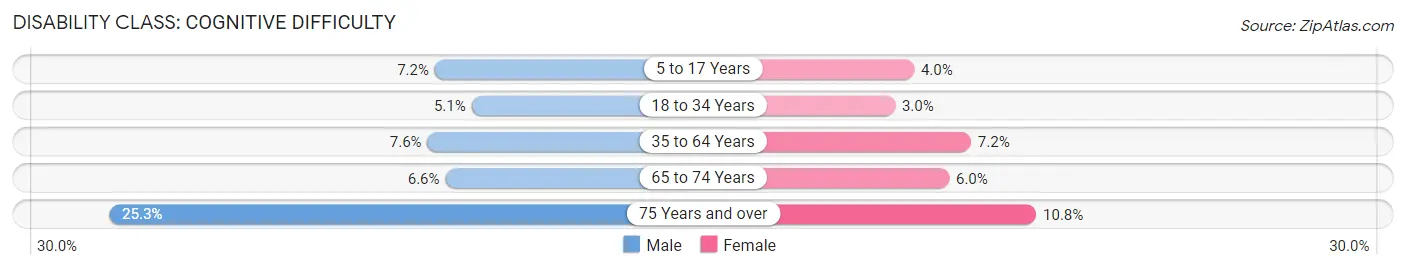
| Age Bracket | Male | Female |
| 5 to 17 Years | 593 (7.2%) | 290 (4.0%) |
| 18 to 34 Years | 539 (5.1%) | 378 (3.0%) |
| 35 to 64 Years | 1,300 (7.6%) | 1,260 (7.2%) |
| 65 to 74 Years | 250 (6.6%) | 314 (6.0%) |
| 75 Years and over | 635 (25.3%) | 431 (10.8%) |
Disability Class: Ambulatory Difficulty
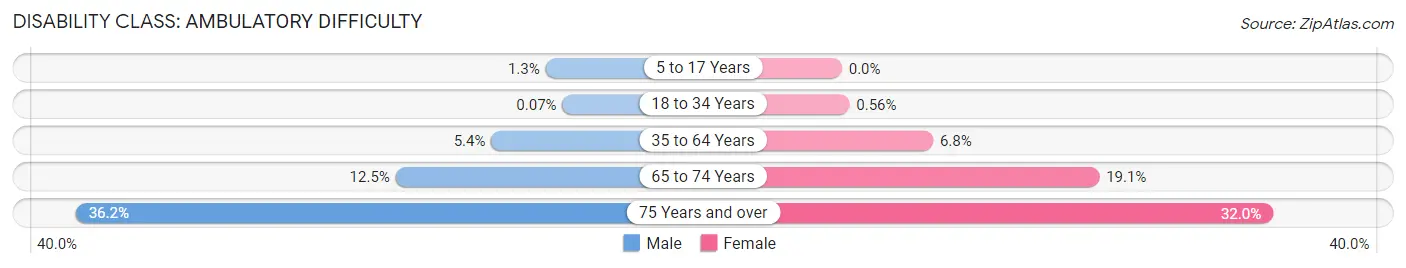
| Age Bracket | Male | Female |
| 5 to 17 Years | 109 (1.3%) | 0 (0.0%) |
| 18 to 34 Years | 7 (0.1%) | 71 (0.6%) |
| 35 to 64 Years | 919 (5.3%) | 1,186 (6.8%) |
| 65 to 74 Years | 474 (12.4%) | 1,006 (19.1%) |
| 75 Years and over | 909 (36.2%) | 1,275 (32.0%) |
Disability Class: Self-Care Difficulty
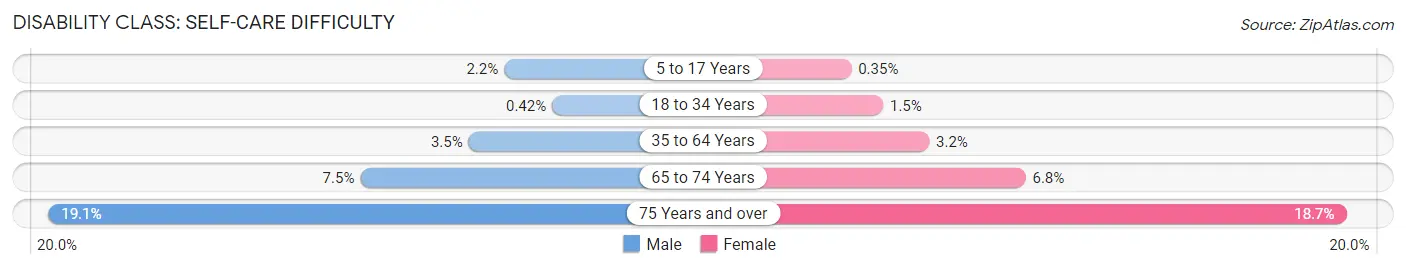
| Age Bracket | Male | Female |
| 5 to 17 Years | 182 (2.2%) | 25 (0.4%) |
| 18 to 34 Years | 44 (0.4%) | 196 (1.5%) |
| 35 to 64 Years | 604 (3.5%) | 568 (3.2%) |
| 65 to 74 Years | 287 (7.5%) | 359 (6.8%) |
| 75 Years and over | 480 (19.1%) | 746 (18.7%) |
Technology Access in Arden Arcade
Computing Device Access in Arden Arcade
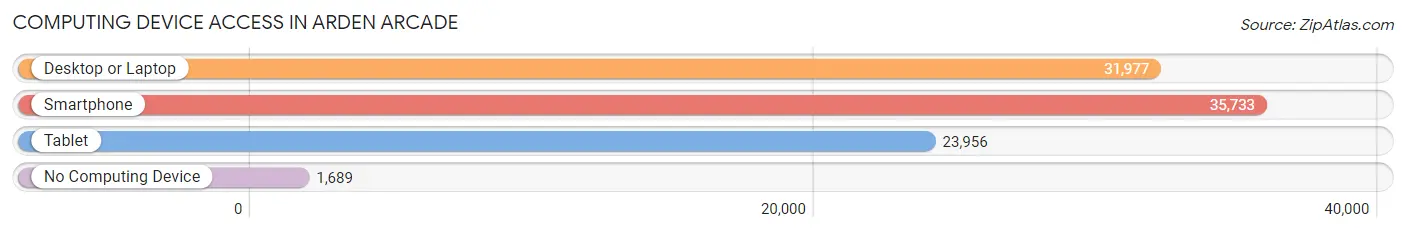
| Device Type | # Households | % Households |
| Desktop or Laptop | 31,977 | 81.9% |
| Smartphone | 35,733 | 91.5% |
| Tablet | 23,956 | 61.4% |
| No Computing Device | 1,689 | 4.3% |
| Total | 39,044 | 100.0% |
Internet Access in Arden Arcade
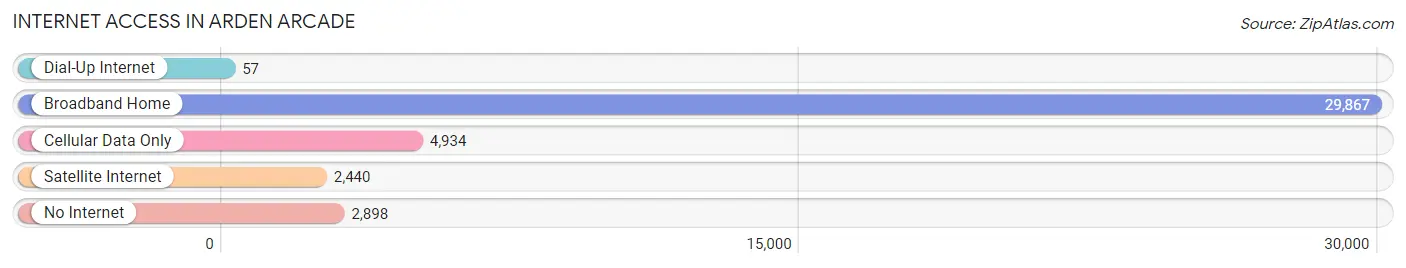
| Internet Type | # Households | % Households |
| Dial-Up Internet | 57 | 0.2% |
| Broadband Home | 29,867 | 76.5% |
| Cellular Data Only | 4,934 | 12.6% |
| Satellite Internet | 2,440 | 6.2% |
| No Internet | 2,898 | 7.4% |
| Total | 39,044 | 100.0% |
Arden Arcade Summary
Arden Arcade is a census-designated place (CDP) located in Sacramento County, California. It is a suburban area located just northeast of the city of Sacramento. As of the 2010 census, the population of Arden Arcade was 92,186.
History
Arden Arcade was originally part of the Rancho Del Paso Mexican land grant, which was granted to John Sutter in 1844. The area was developed in the early 20th century as a residential suburb of Sacramento. The area was named after the Arden Fair Shopping Center, which opened in 1947. The shopping center was named after the Arden area of Sacramento, which was named after the Shakespearean forest in As You Like It.
Geography
Arden Arcade is located at 38°35'17" North, 121°22'17" West (38.588, -121.371). It is bordered by the city of Sacramento to the south, the American River to the west, and the cities of Citrus Heights and Carmichael to the north and east, respectively.
The total area of Arden Arcade is 11.2 square miles, of which 11.1 square miles is land and 0.1 square miles is water. The terrain is generally flat, with some rolling hills in the northern part of the CDP.
Economy
Arden Arcade is a primarily residential area, with a few commercial and industrial businesses. The largest employers in the area are the State of California, Kaiser Permanente, and Sutter Health. Other major employers include the County of Sacramento, the City of Sacramento, and the Sacramento County Office of Education.
Demographics
As of the 2010 census, there were 92,186 people, 35,945 households, and 24,845 families residing in Arden Arcade. The population density was 8,269.3 people per square mile. The racial makeup of the CDP was 68.2% White, 8.3% African American, 0.7% Native American, 11.2% Asian, 0.3% Pacific Islander, 6.7% from other races, and 4.7% from two or more races. Hispanic or Latino of any race were 16.3% of the population.
The median income for a household in Arden Arcade was $60,945, and the median income for a family was $71,845. About 8.3% of families and 11.2% of the population were below the poverty line, including 15.2% of those under age 18 and 6.7% of those age 65 or over.
Common Questions
What is Per Capita Income in Arden Arcade?
Per Capita income in Arden Arcade is $42,480.
What is the Median Family Income in Arden Arcade?
Median Family Income in Arden Arcade is $81,840.
What is the Median Household income in Arden Arcade?
Median Household Income in Arden Arcade is $64,479.
What is Income or Wage Gap in Arden Arcade?
Income or Wage Gap in Arden Arcade is 17.3%.
Women in Arden Arcade earn 82.7 cents for every dollar earned by a man.
What is Family Income Deficit in Arden Arcade?
Family Income Deficit in Arden Arcade is $12,554.
Families that are below poverty line in Arden Arcade earn $12,554 less on average than the poverty threshold level.
What is Inequality or Gini Index in Arden Arcade?
Inequality or Gini Index in Arden Arcade is 0.52.
What is the Total Population of Arden Arcade?
Total Population of Arden Arcade is 96,076.
What is the Total Male Population of Arden Arcade?
Total Male Population of Arden Arcade is 46,022.
What is the Total Female Population of Arden Arcade?
Total Female Population of Arden Arcade is 50,054.
What is the Ratio of Males per 100 Females in Arden Arcade?
There are 91.94 Males per 100 Females in Arden Arcade.
What is the Ratio of Females per 100 Males in Arden Arcade?
There are 108.76 Females per 100 Males in Arden Arcade.
What is the Median Population Age in Arden Arcade?
Median Population Age in Arden Arcade is 37.0 Years.
What is the Average Family Size in Arden Arcade
Average Family Size in Arden Arcade is 3.1 People.
What is the Average Household Size in Arden Arcade
Average Household Size in Arden Arcade is 2.4 People.
How Large is the Labor Force in Arden Arcade?
There are 47,709 People in the Labor Forcein in Arden Arcade.
What is the Percentage of People in the Labor Force in Arden Arcade?
62.6% of People are in the Labor Force in Arden Arcade.
What is the Unemployment Rate in Arden Arcade?
Unemployment Rate in Arden Arcade is 8.1%.