Fraser, MI Map & Demographics
Fraser Map
Fraser Overview
$37,422
PER CAPITA INCOME
$79,250
AVG FAMILY INCOME
$61,039
AVG HOUSEHOLD INCOME
29.1%
WAGE / INCOME GAP [ % ]
70.9¢/ $1
WAGE / INCOME GAP [ $ ]
0.44
INEQUALITY / GINI INDEX
14,668
TOTAL POPULATION
6,904
MALE POPULATION
7,764
FEMALE POPULATION
88.92
MALES / 100 FEMALES
112.46
FEMALES / 100 MALES
41.9
MEDIAN AGE
2.8
AVG FAMILY SIZE
2.2
AVG HOUSEHOLD SIZE
7,936
LABOR FORCE [ PEOPLE ]
64.9%
PERCENT IN LABOR FORCE
4.8%
UNEMPLOYMENT RATE
Fraser Zip Codes
Income in Fraser
Income Overview in Fraser
Per Capita Income in Fraser is $37,422, while median incomes of families and households are $79,250 and $61,039 respectively.
| Characteristic | Number | Measure |
| Per Capita Income | 14,668 | $37,422 |
| Median Family Income | 3,934 | $79,250 |
| Mean Family Income | 3,934 | $90,976 |
| Median Household Income | 6,531 | $61,039 |
| Mean Household Income | 6,531 | $83,023 |
| Income Deficit | 3,934 | $0 |
| Wage / Income Gap (%) | 14,668 | 29.05% |
| Wage / Income Gap ($) | 14,668 | 70.95¢ per $1 |
| Gini / Inequality Index | 14,668 | 0.44 |
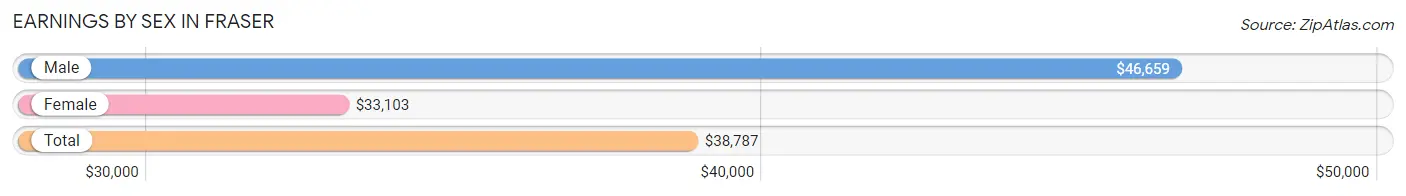
Earnings by Sex in Fraser
Average Earnings in Fraser are $38,787, $46,659 for men and $33,103 for women, a difference of 29.0%.
| Sex | Number | Average Earnings |
| Male | 4,056 (49.6%) | $46,659 |
| Female | 4,120 (50.4%) | $33,103 |
| Total | 8,176 (100.0%) | $38,787 |
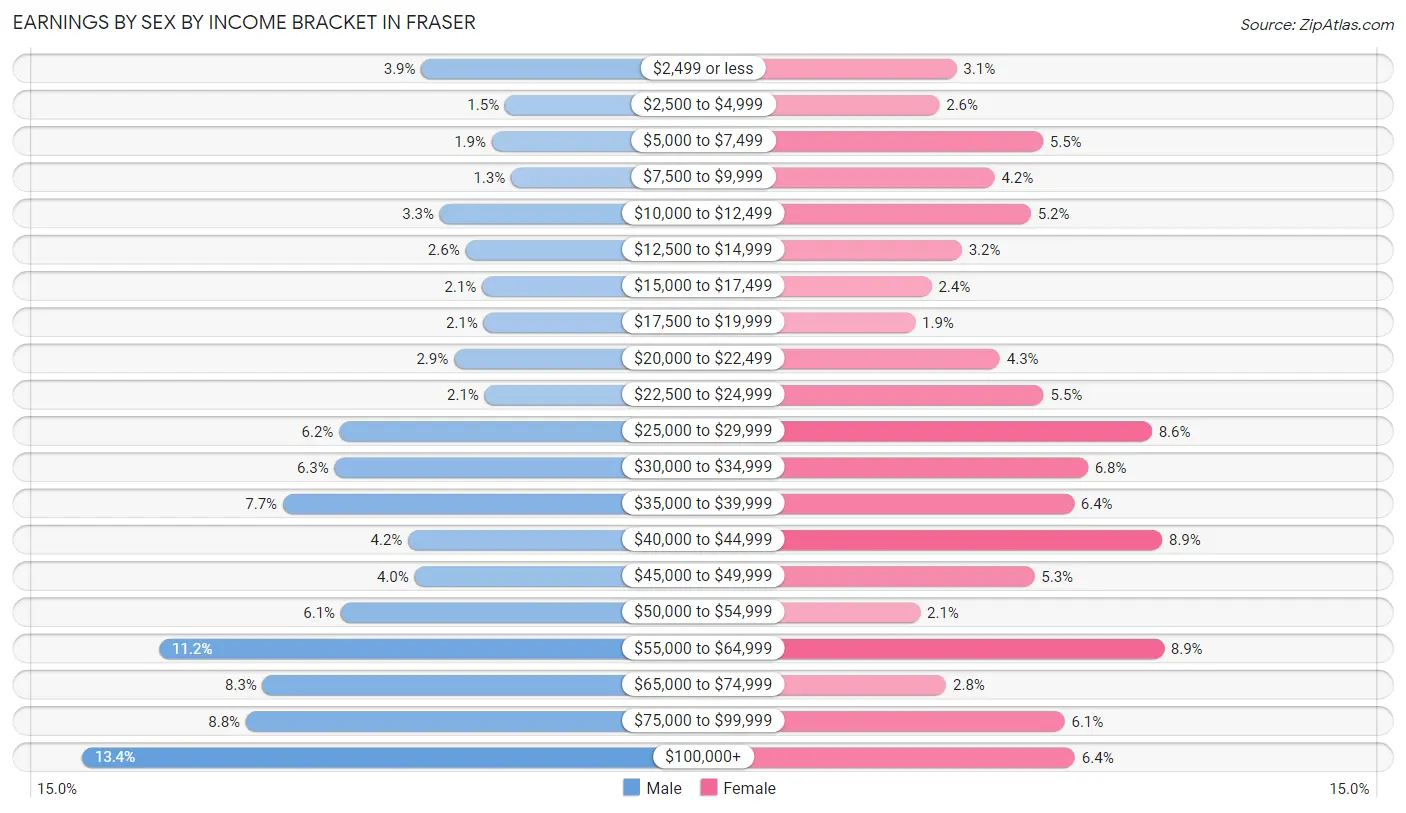
Earnings by Sex by Income Bracket in Fraser
The most common earnings brackets in Fraser are $100,000+ for men (543 | 13.4%) and $55,000 to $64,999 for women (367 | 8.9%).
| Income | Male | Female |
| $2,499 or less | 156 (3.8%) | 127 (3.1%) |
| $2,500 to $4,999 | 61 (1.5%) | 107 (2.6%) |
| $5,000 to $7,499 | 76 (1.9%) | 227 (5.5%) |
| $7,500 to $9,999 | 54 (1.3%) | 171 (4.2%) |
| $10,000 to $12,499 | 135 (3.3%) | 213 (5.2%) |
| $12,500 to $14,999 | 106 (2.6%) | 133 (3.2%) |
| $15,000 to $17,499 | 87 (2.1%) | 98 (2.4%) |
| $17,500 to $19,999 | 85 (2.1%) | 79 (1.9%) |
| $20,000 to $22,499 | 119 (2.9%) | 177 (4.3%) |
| $22,500 to $24,999 | 84 (2.1%) | 228 (5.5%) |
| $25,000 to $29,999 | 250 (6.2%) | 353 (8.6%) |
| $30,000 to $34,999 | 255 (6.3%) | 279 (6.8%) |
| $35,000 to $39,999 | 314 (7.7%) | 263 (6.4%) |
| $40,000 to $44,999 | 171 (4.2%) | 365 (8.9%) |
| $45,000 to $49,999 | 164 (4.0%) | 217 (5.3%) |
| $50,000 to $54,999 | 248 (6.1%) | 85 (2.1%) |
| $55,000 to $64,999 | 455 (11.2%) | 367 (8.9%) |
| $65,000 to $74,999 | 337 (8.3%) | 115 (2.8%) |
| $75,000 to $99,999 | 356 (8.8%) | 252 (6.1%) |
| $100,000+ | 543 (13.4%) | 264 (6.4%) |
| Total | 4,056 (100.0%) | 4,120 (100.0%) |
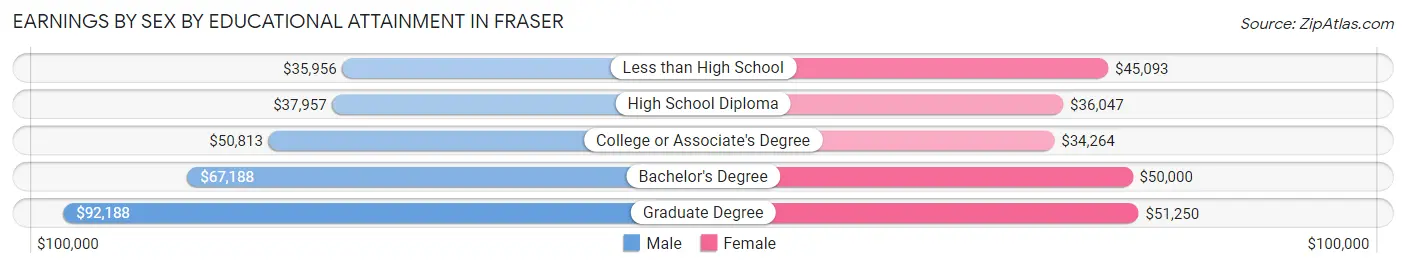
Earnings by Sex by Educational Attainment in Fraser
Average earnings in Fraser are $51,277 for men and $38,101 for women, a difference of 25.7%. Men with an educational attainment of graduate degree enjoy the highest average annual earnings of $92,188, while those with less than high school education earn the least with $35,956. Women with an educational attainment of graduate degree earn the most with the average annual earnings of $51,250, while those with college or associate's degree education have the smallest earnings of $34,264.
| Educational Attainment | Male Income | Female Income |
| Less than High School | $35,956 | $45,093 |
| High School Diploma | $37,957 | $36,047 |
| College or Associate's Degree | $50,813 | $34,264 |
| Bachelor's Degree | $67,188 | $50,000 |
| Graduate Degree | $92,188 | $51,250 |
| Total | $51,277 | $38,101 |
Family Income in Fraser
Family Income Brackets in Fraser
According to the Fraser family income data, there are 771 families falling into the $100,000 to $149,999 income range, which is the most common income bracket and makes up 19.6% of all families. Conversely, the less than $10,000 income bracket is the least frequent group with only 43 families (1.1%) belonging to this category.
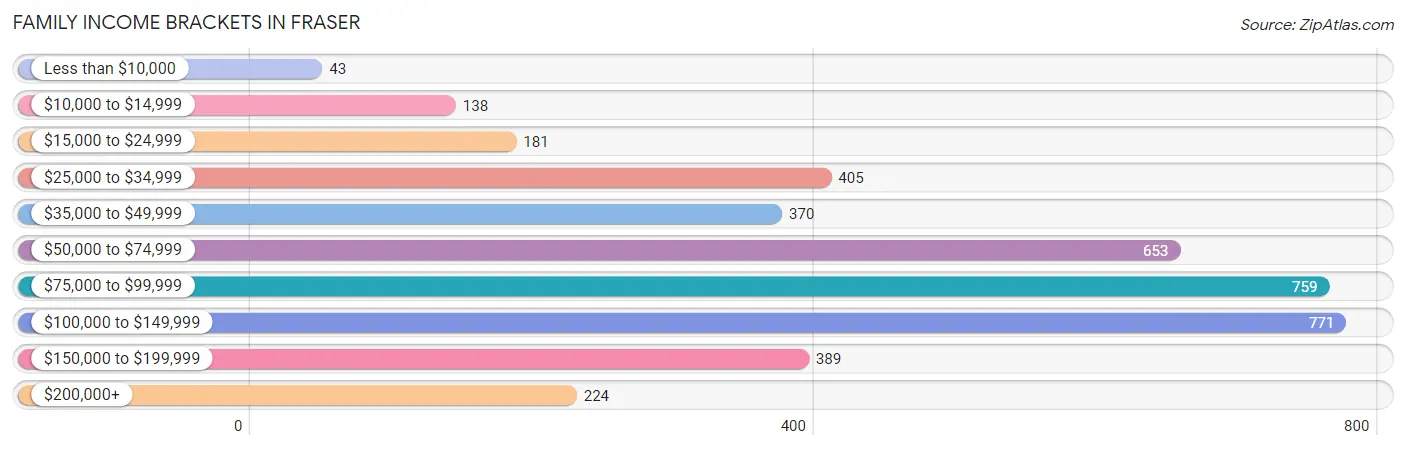
| Income Bracket | # Families | % Families |
| Less than $10,000 | 43 | 1.1% |
| $10,000 to $14,999 | 138 | 3.5% |
| $15,000 to $24,999 | 181 | 4.6% |
| $25,000 to $34,999 | 405 | 10.3% |
| $35,000 to $49,999 | 370 | 9.4% |
| $50,000 to $74,999 | 653 | 16.6% |
| $75,000 to $99,999 | 759 | 19.3% |
| $100,000 to $149,999 | 771 | 19.6% |
| $150,000 to $199,999 | 389 | 9.9% |
| $200,000+ | 224 | 5.7% |
Family Income by Famaliy Size in Fraser
6-person families (38 | 1.0%) account for the highest median family income in Fraser with $138,088 per family, while 2-person families (1,931 | 49.1%) have the highest median income of $29,966 per family member.
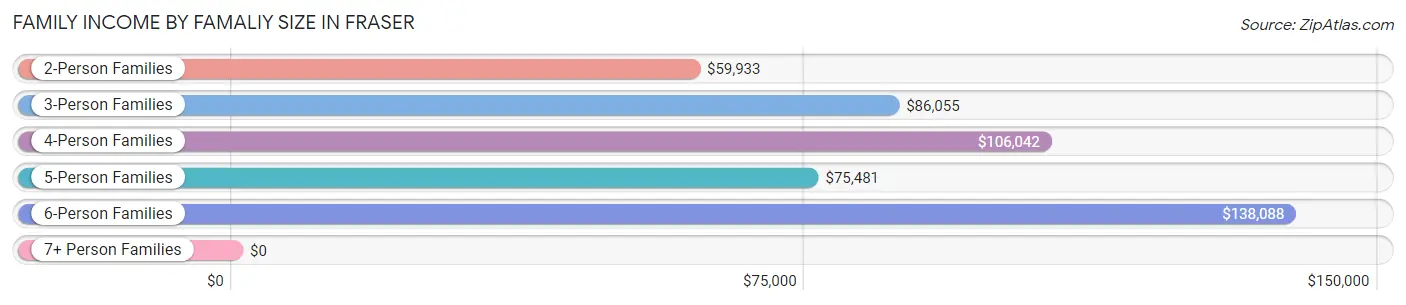
| Income Bracket | # Families | Median Income |
| 2-Person Families | 1,931 (49.1%) | $59,933 |
| 3-Person Families | 1,081 (27.5%) | $86,055 |
| 4-Person Families | 719 (18.3%) | $106,042 |
| 5-Person Families | 165 (4.2%) | $75,481 |
| 6-Person Families | 38 (1.0%) | $138,088 |
| 7+ Person Families | 0 (0.0%) | $0 |
| Total | 3,934 (100.0%) | $79,250 |
Family Income by Number of Earners in Fraser
The median family income in Fraser is $79,250, with families comprising 3+ earners (416) having the highest median family income of $151,809, while families with no earners (464) have the lowest median family income of $47,833, accounting for 10.6% and 11.8% of families, respectively.
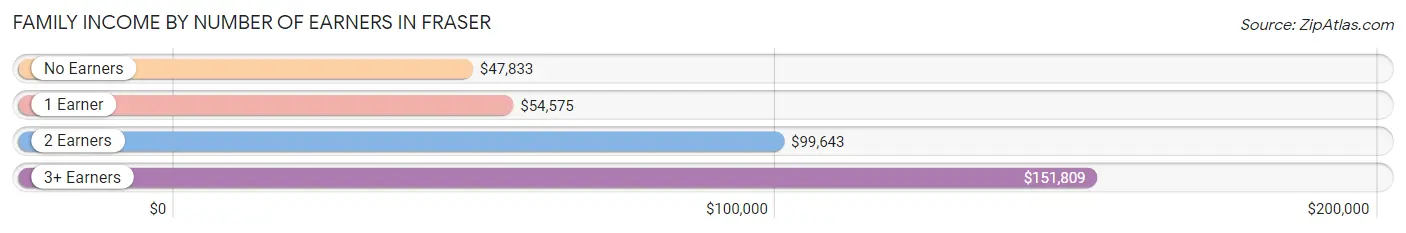
| Number of Earners | # Families | Median Income |
| No Earners | 464 (11.8%) | $47,833 |
| 1 Earner | 1,604 (40.8%) | $54,575 |
| 2 Earners | 1,450 (36.9%) | $99,643 |
| 3+ Earners | 416 (10.6%) | $151,809 |
| Total | 3,934 (100.0%) | $79,250 |
Household Income in Fraser
Household Income Brackets in Fraser
With 1,123 households falling in the category, the $50,000 to $74,999 income range is the most frequent in Fraser, accounting for 17.2% of all households. In contrast, only 196 households (3.0%) fall into the less than $10,000 income bracket, making it the least populous group.
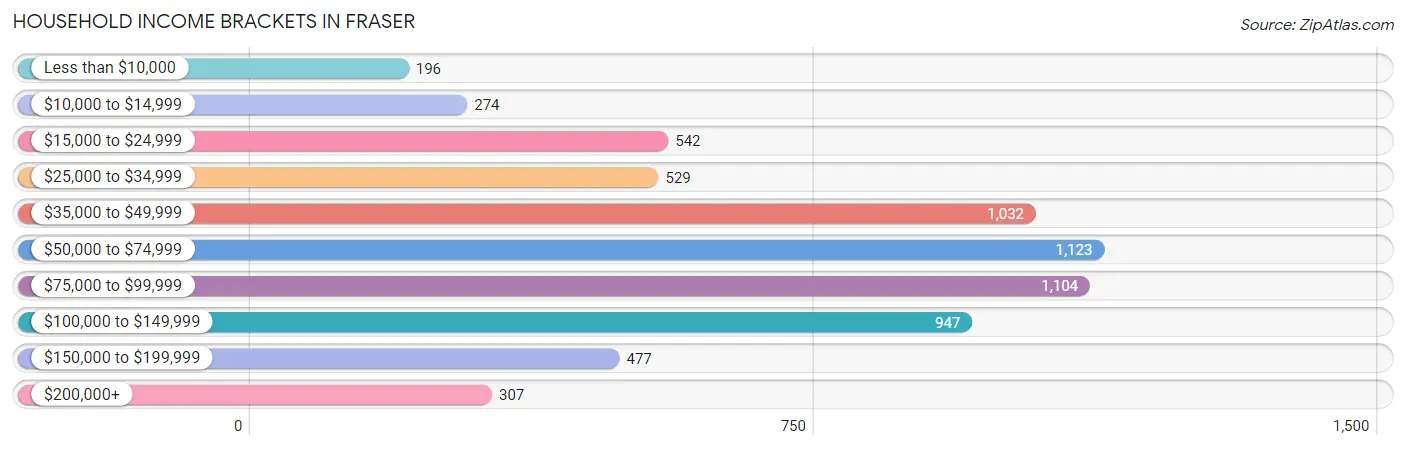
| Income Bracket | # Households | % Households |
| Less than $10,000 | 196 | 3.0% |
| $10,000 to $14,999 | 274 | 4.2% |
| $15,000 to $24,999 | 542 | 8.3% |
| $25,000 to $34,999 | 529 | 8.1% |
| $35,000 to $49,999 | 1,032 | 15.8% |
| $50,000 to $74,999 | 1,123 | 17.2% |
| $75,000 to $99,999 | 1,104 | 16.9% |
| $100,000 to $149,999 | 947 | 14.5% |
| $150,000 to $199,999 | 477 | 7.3% |
| $200,000+ | 307 | 4.7% |
Household Income by Householder Age in Fraser
The median household income in Fraser is $61,039, with the highest median household income of $95,490 found in the 15 to 24 years age bracket for the primary householder. A total of 263 households (4.0%) fall into this category. Meanwhile, the 65+ years age bracket for the primary householder has the lowest median household income of $48,906, with 2,065 households (31.6%) in this group.
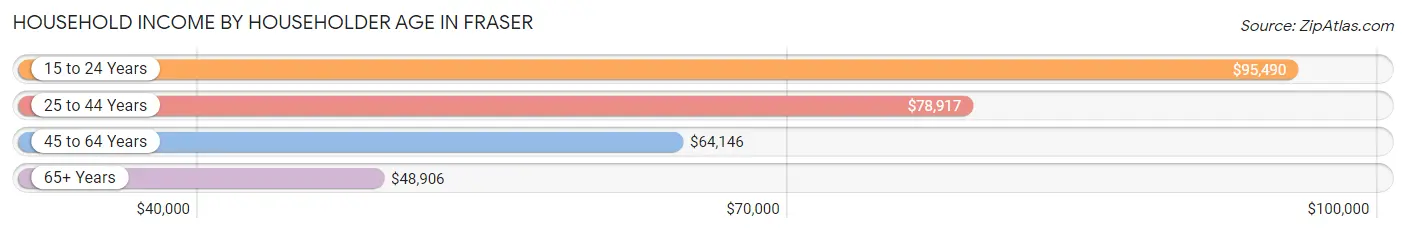
| Income Bracket | # Households | Median Income |
| 15 to 24 Years | 263 (4.0%) | $95,490 |
| 25 to 44 Years | 1,727 (26.4%) | $78,917 |
| 45 to 64 Years | 2,476 (37.9%) | $64,146 |
| 65+ Years | 2,065 (31.6%) | $48,906 |
| Total | 6,531 (100.0%) | $61,039 |
Poverty in Fraser
Income Below Poverty by Sex and Age in Fraser
With 9.6% poverty level for males and 11.7% for females among the residents of Fraser, 15 year old males and 5 year old females are the most vulnerable to poverty, with 22 males (57.9%) and 10 females (31.2%) in their respective age groups living below the poverty level.
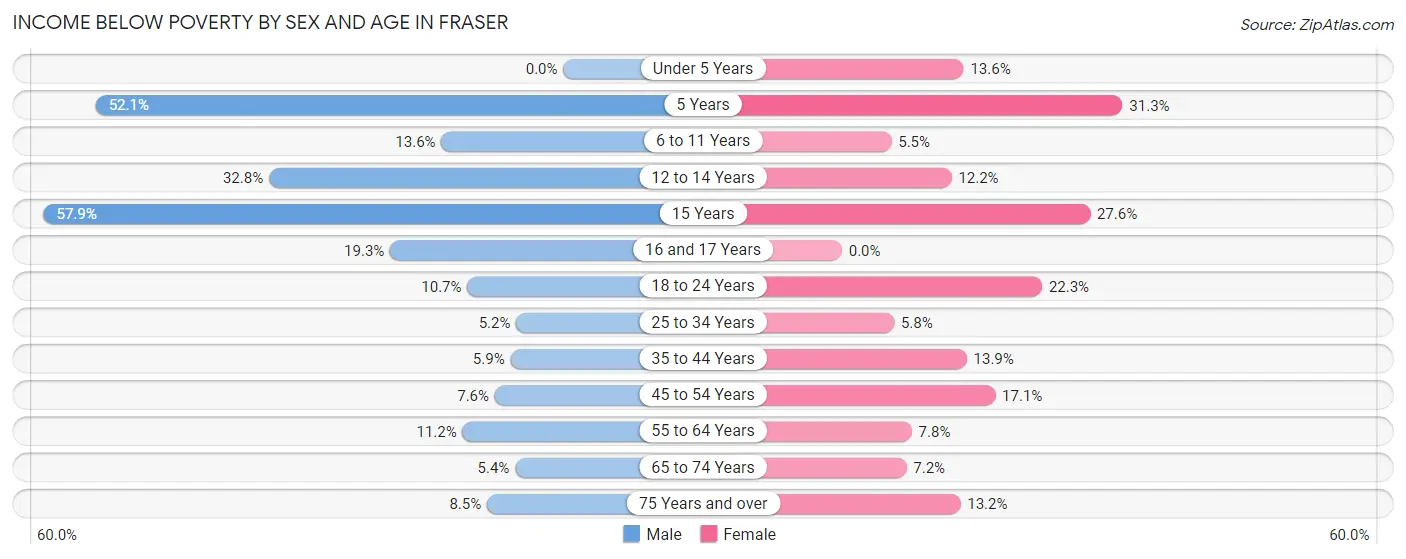
| Age Bracket | Male | Female |
| Under 5 Years | 0 (0.0%) | 55 (13.6%) |
| 5 Years | 25 (52.1%) | 10 (31.2%) |
| 6 to 11 Years | 33 (13.6%) | 25 (5.5%) |
| 12 to 14 Years | 137 (32.8%) | 21 (12.2%) |
| 15 Years | 22 (57.9%) | 34 (27.6%) |
| 16 and 17 Years | 27 (19.3%) | 0 (0.0%) |
| 18 to 24 Years | 65 (10.7%) | 150 (22.3%) |
| 25 to 34 Years | 59 (5.2%) | 59 (5.8%) |
| 35 to 44 Years | 45 (5.9%) | 108 (13.9%) |
| 45 to 54 Years | 59 (7.6%) | 194 (17.1%) |
| 55 to 64 Years | 103 (11.2%) | 92 (7.8%) |
| 65 to 74 Years | 47 (5.4%) | 65 (7.2%) |
| 75 Years and over | 38 (8.5%) | 83 (13.2%) |
| Total | 660 (9.6%) | 896 (11.7%) |
Income Above Poverty by Sex and Age in Fraser
According to the poverty statistics in Fraser, males aged under 5 years and females aged 16 and 17 years are the age groups that are most secure financially, with 100.0% of males and 100.0% of females in these age groups living above the poverty line.
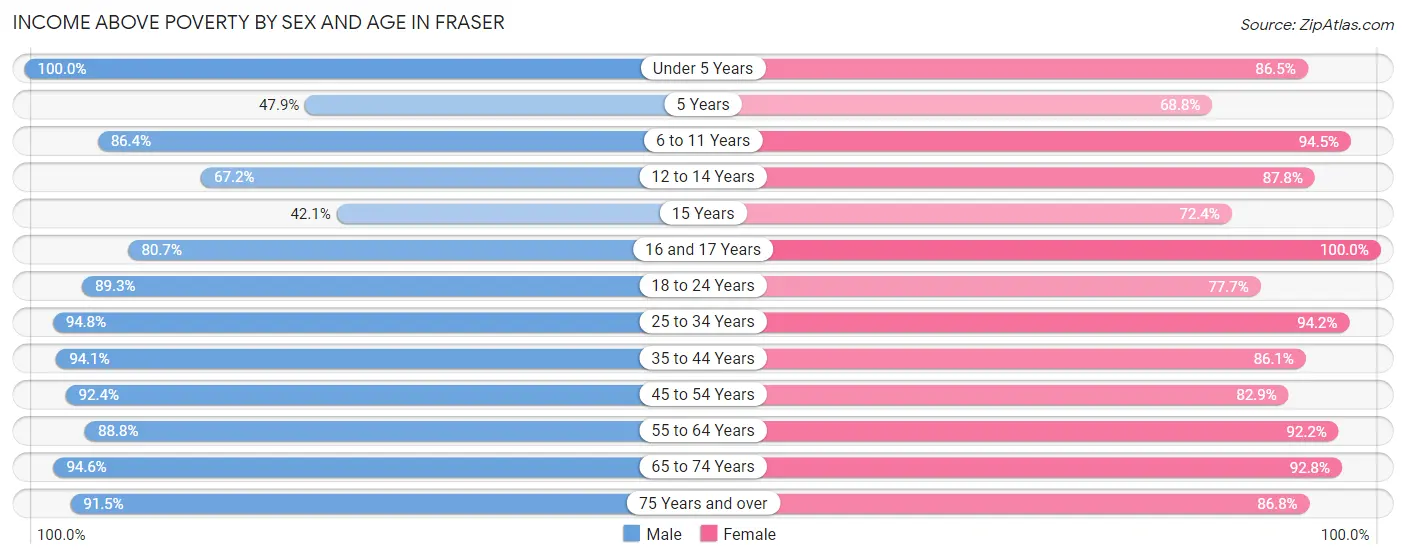
| Age Bracket | Male | Female |
| Under 5 Years | 482 (100.0%) | 351 (86.5%) |
| 5 Years | 23 (47.9%) | 22 (68.8%) |
| 6 to 11 Years | 210 (86.4%) | 429 (94.5%) |
| 12 to 14 Years | 281 (67.2%) | 151 (87.8%) |
| 15 Years | 16 (42.1%) | 89 (72.4%) |
| 16 and 17 Years | 113 (80.7%) | 140 (100.0%) |
| 18 to 24 Years | 543 (89.3%) | 523 (77.7%) |
| 25 to 34 Years | 1,066 (94.8%) | 957 (94.2%) |
| 35 to 44 Years | 719 (94.1%) | 669 (86.1%) |
| 45 to 54 Years | 714 (92.4%) | 942 (82.9%) |
| 55 to 64 Years | 814 (88.8%) | 1,090 (92.2%) |
| 65 to 74 Years | 830 (94.6%) | 839 (92.8%) |
| 75 Years and over | 409 (91.5%) | 546 (86.8%) |
| Total | 6,220 (90.4%) | 6,748 (88.3%) |
Income Below Poverty Among Married-Couple Families in Fraser
The poverty statistics for married-couple families in Fraser show that 6.5% or 166 of the total 2,557 families live below the poverty line. Families with 3 or 4 children have the highest poverty rate of 33.6%, comprising of 47 families. On the other hand, families with no children have the lowest poverty rate of 3.3%, which includes 50 families.
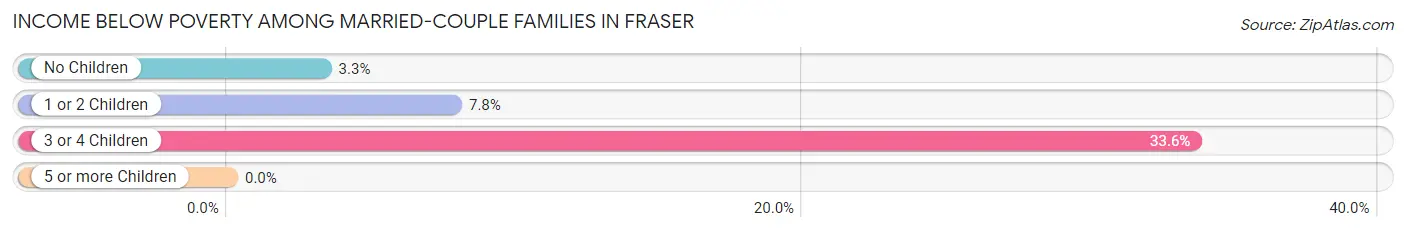
| Children | Above Poverty | Below Poverty |
| No Children | 1,482 (96.7%) | 50 (3.3%) |
| 1 or 2 Children | 816 (92.2%) | 69 (7.8%) |
| 3 or 4 Children | 93 (66.4%) | 47 (33.6%) |
| 5 or more Children | 0 (0.0%) | 0 (0.0%) |
| Total | 2,391 (93.5%) | 166 (6.5%) |
Income Below Poverty Among Single-Parent Households in Fraser
According to the poverty data in Fraser, 6.9% or 27 single-father households and 17.1% or 168 single-mother households are living below the poverty line. Among single-father households, those with 3 or 4 children have the highest poverty rate, with 13 households (23.2%) experiencing poverty. Likewise, among single-mother households, those with no children have the highest poverty rate, with 92 households (21.0%) falling below the poverty line.
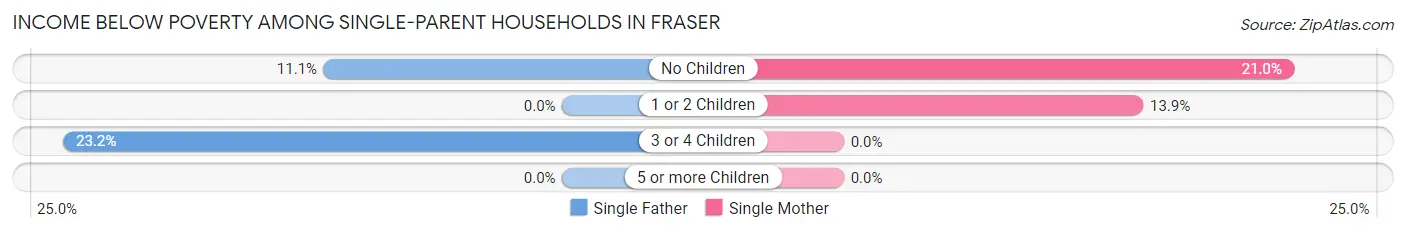
| Children | Single Father | Single Mother |
| No Children | 14 (11.1%) | 92 (21.0%) |
| 1 or 2 Children | 0 (0.0%) | 76 (13.9%) |
| 3 or 4 Children | 13 (23.2%) | 0 (0.0%) |
| 5 or more Children | 0 (0.0%) | 0 (0.0%) |
| Total | 27 (6.9%) | 168 (17.1%) |
Income Below Poverty Among Married-Couple vs Single-Parent Households in Fraser
The poverty data for Fraser shows that 166 of the married-couple family households (6.5%) and 195 of the single-parent households (14.2%) are living below the poverty level. Within the married-couple family households, those with 3 or 4 children have the highest poverty rate, with 47 households (33.6%) falling below the poverty line. Among the single-parent households, those with 3 or 4 children have the highest poverty rate, with 13 household (23.2%) living below poverty.
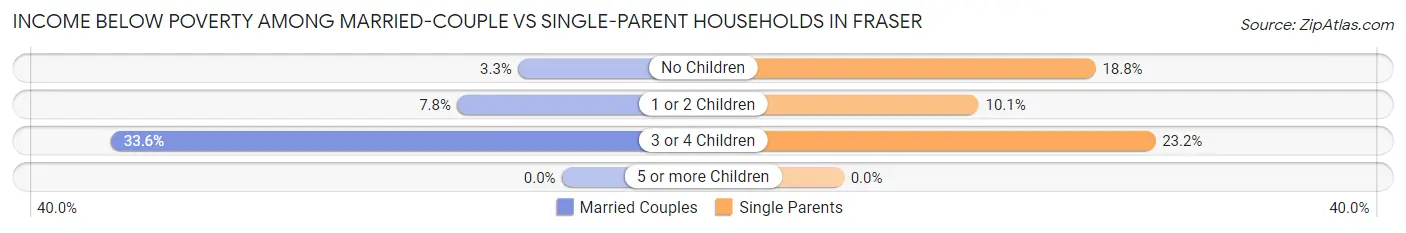
| Children | Married-Couple Families | Single-Parent Households |
| No Children | 50 (3.3%) | 106 (18.8%) |
| 1 or 2 Children | 69 (7.8%) | 76 (10.1%) |
| 3 or 4 Children | 47 (33.6%) | 13 (23.2%) |
| 5 or more Children | 0 (0.0%) | 0 (0.0%) |
| Total | 166 (6.5%) | 195 (14.2%) |
Race in Fraser
The most populous races in Fraser are White / Caucasian (12,306 | 83.9%), Black / African American (1,018 | 6.9%), and Two or more Races (876 | 6.0%).
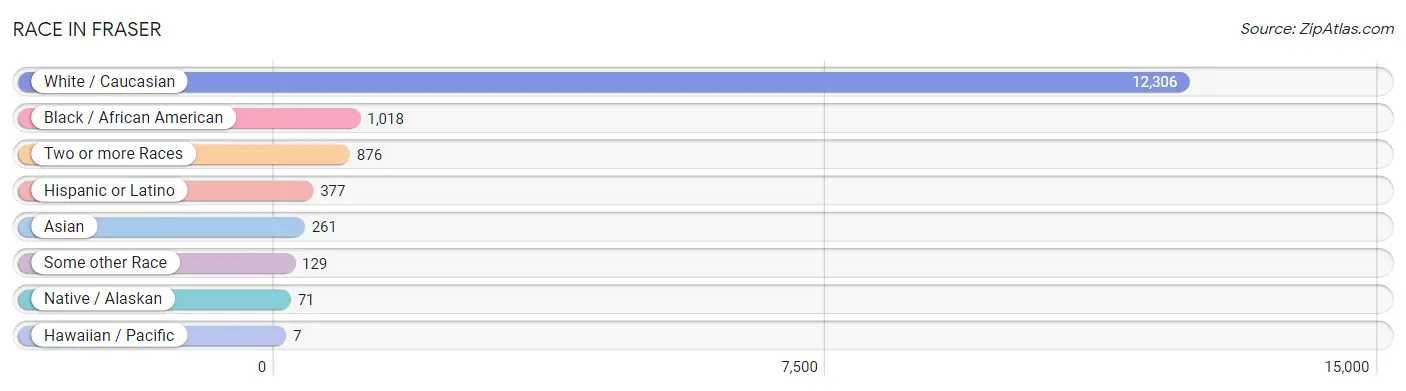
| Race | # Population | % Population |
| Asian | 261 | 1.8% |
| Black / African American | 1,018 | 6.9% |
| Hawaiian / Pacific | 7 | 0.1% |
| Hispanic or Latino | 377 | 2.6% |
| Native / Alaskan | 71 | 0.5% |
| White / Caucasian | 12,306 | 83.9% |
| Two or more Races | 876 | 6.0% |
| Some other Race | 129 | 0.9% |
| Total | 14,668 | 100.0% |
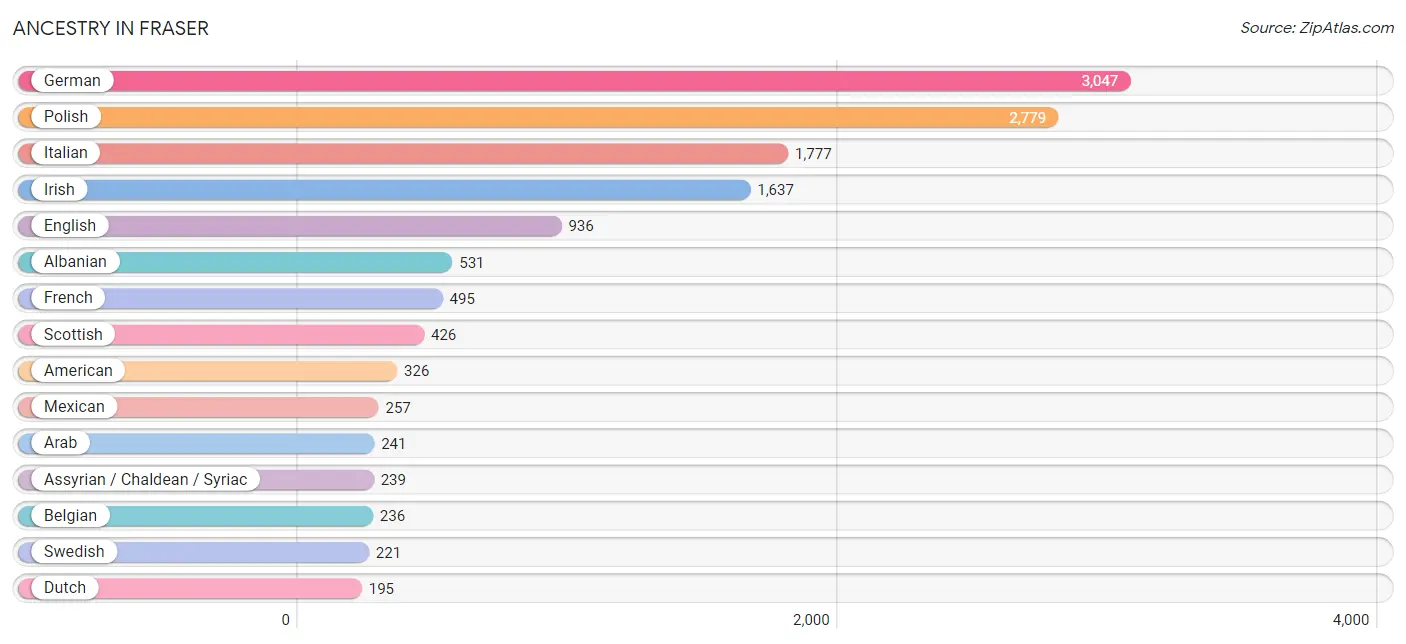
Ancestry in Fraser
The most populous ancestries reported in Fraser are German (3,047 | 20.8%), Polish (2,779 | 19.0%), Italian (1,777 | 12.1%), Irish (1,637 | 11.2%), and English (936 | 6.4%), together accounting for 69.4% of all Fraser residents.
| Ancestry | # Population | % Population |
| African | 19 | 0.1% |
| Albanian | 531 | 3.6% |
| Aleut | 5 | 0.0% |
| American | 326 | 2.2% |
| Arab | 241 | 1.6% |
| Assyrian / Chaldean / Syriac | 239 | 1.6% |
| Austrian | 35 | 0.2% |
| Belgian | 236 | 1.6% |
| Bhutanese | 16 | 0.1% |
| Blackfeet | 39 | 0.3% |
| British | 21 | 0.1% |
| Burmese | 27 | 0.2% |
| Canadian | 57 | 0.4% |
| Central American | 20 | 0.1% |
| Cherokee | 112 | 0.8% |
| Chippewa | 65 | 0.4% |
| Croatian | 19 | 0.1% |
| Czech | 36 | 0.3% |
| Danish | 29 | 0.2% |
| Dutch | 195 | 1.3% |
| Egyptian | 108 | 0.7% |
| English | 936 | 6.4% |
| European | 138 | 0.9% |
| Finnish | 37 | 0.3% |
| French | 495 | 3.4% |
| French Canadian | 187 | 1.3% |
| German | 3,047 | 20.8% |
| Greek | 71 | 0.5% |
| Hungarian | 93 | 0.6% |
| Indian (Asian) | 155 | 1.1% |
| Irish | 1,637 | 11.2% |
| Italian | 1,777 | 12.1% |
| Korean | 54 | 0.4% |
| Lebanese | 41 | 0.3% |
| Lithuanian | 58 | 0.4% |
| Lumbee | 20 | 0.1% |
| Macedonian | 127 | 0.9% |
| Mexican | 257 | 1.8% |
| Native Hawaiian | 25 | 0.2% |
| Northern European | 18 | 0.1% |
| Norwegian | 39 | 0.3% |
| Osage | 22 | 0.2% |
| Ottawa | 22 | 0.2% |
| Pakistani | 22 | 0.2% |
| Panamanian | 9 | 0.1% |
| Polish | 2,779 | 19.0% |
| Puerto Rican | 92 | 0.6% |
| Romanian | 138 | 0.9% |
| Russian | 136 | 0.9% |
| Salvadoran | 11 | 0.1% |
| Samoan | 7 | 0.1% |
| Scotch-Irish | 177 | 1.2% |
| Scottish | 426 | 2.9% |
| Senegalese | 60 | 0.4% |
| Serbian | 84 | 0.6% |
| Sioux | 69 | 0.5% |
| Slavic | 29 | 0.2% |
| Slovak | 112 | 0.8% |
| Spanish | 8 | 0.1% |
| Sri Lankan | 27 | 0.2% |
| Subsaharan African | 79 | 0.5% |
| Swedish | 221 | 1.5% |
| Swiss | 23 | 0.2% |
| Syrian | 27 | 0.2% |
| Thai | 66 | 0.4% |
| Ukrainian | 92 | 0.6% |
| Welsh | 147 | 1.0% |
| Yugoslavian | 85 | 0.6% | View All 68 Rows |
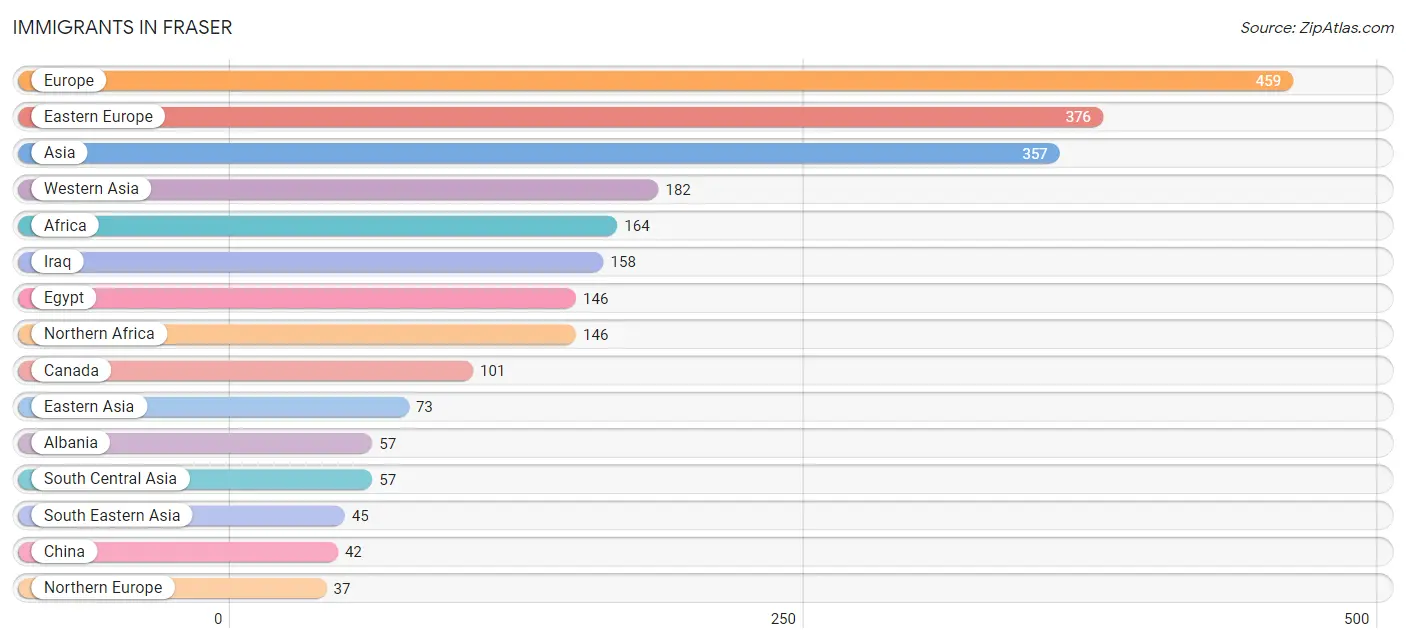
Immigrants in Fraser
The most numerous immigrant groups reported in Fraser came from Europe (459 | 3.1%), Eastern Europe (376 | 2.6%), Asia (357 | 2.4%), Western Asia (182 | 1.2%), and Africa (164 | 1.1%), together accounting for 10.5% of all Fraser residents.
| Immigration Origin | # Population | % Population |
| Africa | 164 | 1.1% |
| Albania | 57 | 0.4% |
| Asia | 357 | 2.4% |
| Belarus | 9 | 0.1% |
| Bosnia and Herzegovina | 36 | 0.3% |
| Canada | 101 | 0.7% |
| Central America | 9 | 0.1% |
| China | 42 | 0.3% |
| Eastern Asia | 73 | 0.5% |
| Eastern Europe | 376 | 2.6% |
| Egypt | 146 | 1.0% |
| England | 19 | 0.1% |
| Europe | 459 | 3.1% |
| Germany | 17 | 0.1% |
| India | 31 | 0.2% |
| Iraq | 158 | 1.1% |
| Italy | 29 | 0.2% |
| Japan | 4 | 0.0% |
| Jordan | 17 | 0.1% |
| Korea | 27 | 0.2% |
| Latin America | 9 | 0.1% |
| Moldova | 10 | 0.1% |
| North Macedonia | 12 | 0.1% |
| Northern Africa | 146 | 1.0% |
| Northern Europe | 37 | 0.3% |
| Pakistan | 26 | 0.2% |
| Panama | 9 | 0.1% |
| Philippines | 31 | 0.2% |
| Poland | 27 | 0.2% |
| Senegal | 18 | 0.1% |
| Serbia | 36 | 0.3% |
| South Central Asia | 57 | 0.4% |
| South Eastern Asia | 45 | 0.3% |
| Southern Europe | 29 | 0.2% |
| Syria | 7 | 0.1% |
| Vietnam | 14 | 0.1% |
| Western Africa | 18 | 0.1% |
| Western Asia | 182 | 1.2% |
| Western Europe | 17 | 0.1% | View All 39 Rows |
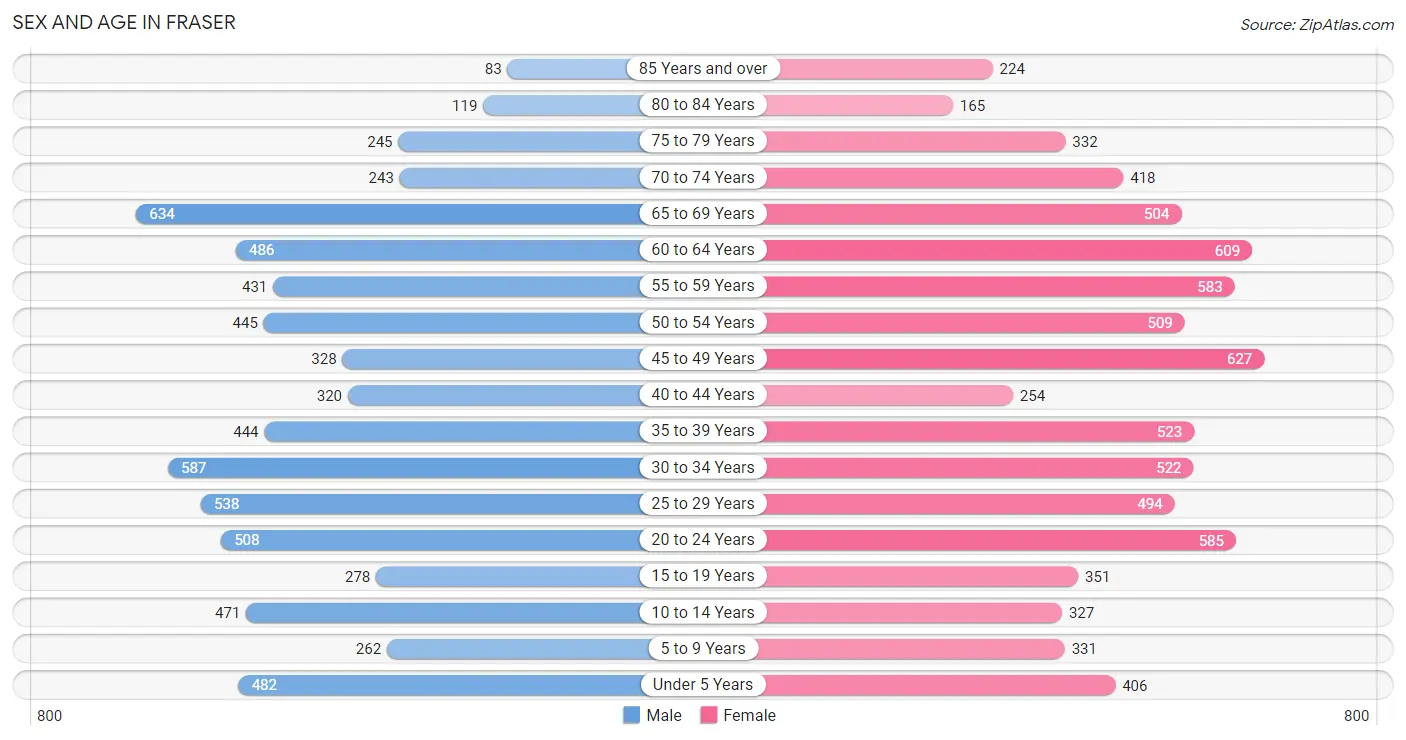
Sex and Age in Fraser
Sex and Age in Fraser
The most populous age groups in Fraser are 65 to 69 Years (634 | 9.2%) for men and 45 to 49 Years (627 | 8.1%) for women.
| Age Bracket | Male | Female |
| Under 5 Years | 482 (7.0%) | 406 (5.2%) |
| 5 to 9 Years | 262 (3.8%) | 331 (4.3%) |
| 10 to 14 Years | 471 (6.8%) | 327 (4.2%) |
| 15 to 19 Years | 278 (4.0%) | 351 (4.5%) |
| 20 to 24 Years | 508 (7.4%) | 585 (7.5%) |
| 25 to 29 Years | 538 (7.8%) | 494 (6.4%) |
| 30 to 34 Years | 587 (8.5%) | 522 (6.7%) |
| 35 to 39 Years | 444 (6.4%) | 523 (6.7%) |
| 40 to 44 Years | 320 (4.6%) | 254 (3.3%) |
| 45 to 49 Years | 328 (4.8%) | 627 (8.1%) |
| 50 to 54 Years | 445 (6.5%) | 509 (6.6%) |
| 55 to 59 Years | 431 (6.2%) | 583 (7.5%) |
| 60 to 64 Years | 486 (7.0%) | 609 (7.8%) |
| 65 to 69 Years | 634 (9.2%) | 504 (6.5%) |
| 70 to 74 Years | 243 (3.5%) | 418 (5.4%) |
| 75 to 79 Years | 245 (3.5%) | 332 (4.3%) |
| 80 to 84 Years | 119 (1.7%) | 165 (2.1%) |
| 85 Years and over | 83 (1.2%) | 224 (2.9%) |
| Total | 6,904 (100.0%) | 7,764 (100.0%) |
Families and Households in Fraser
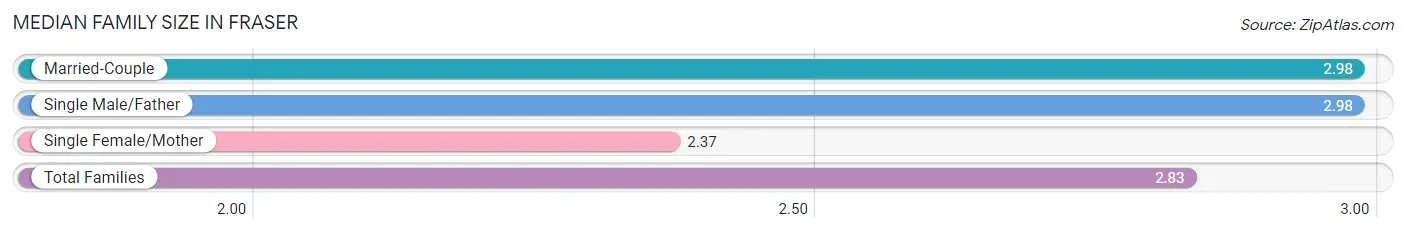
Median Family Size in Fraser
The median family size in Fraser is 2.83 persons per family, with married-couple families (2,557 | 65.0%) accounting for the largest median family size of 2.98 persons per family. On the other hand, single female/mother families (984 | 25.0%) represent the smallest median family size with 2.37 persons per family.
| Family Type | # Families | Family Size |
| Married-Couple | 2,557 (65.0%) | 2.98 |
| Single Male/Father | 393 (10.0%) | 2.98 |
| Single Female/Mother | 984 (25.0%) | 2.37 |
| Total Families | 3,934 (100.0%) | 2.83 |
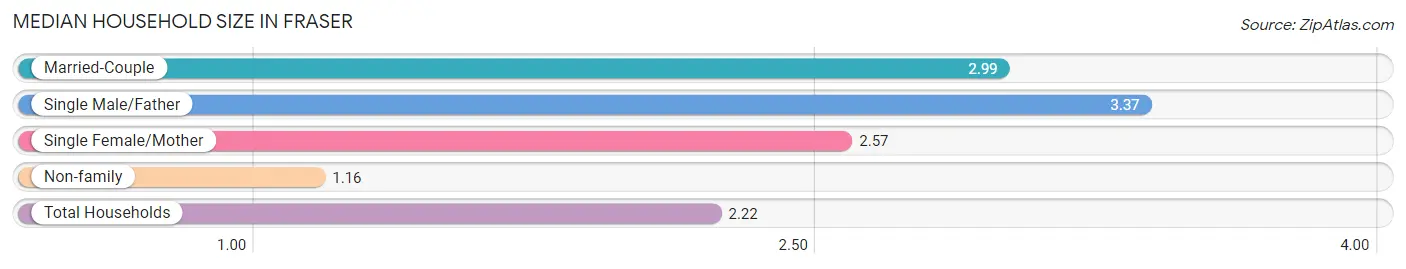
Median Household Size in Fraser
The median household size in Fraser is 2.22 persons per household, with single male/father households (393 | 6.0%) accounting for the largest median household size of 3.37 persons per household. non-family households (2,597 | 39.8%) represent the smallest median household size with 1.16 persons per household.
| Household Type | # Households | Household Size |
| Married-Couple | 2,557 (39.2%) | 2.99 |
| Single Male/Father | 393 (6.0%) | 3.37 |
| Single Female/Mother | 984 (15.1%) | 2.57 |
| Non-family | 2,597 (39.8%) | 1.16 |
| Total Households | 6,531 (100.0%) | 2.22 |
Household Size by Marriage Status in Fraser
Out of a total of 6,531 households in Fraser, 3,934 (60.2%) are family households, while 2,597 (39.8%) are nonfamily households. The most numerous type of family households are 2-person households, comprising 1,699, and the most common type of nonfamily households are 1-person households, comprising 2,279.
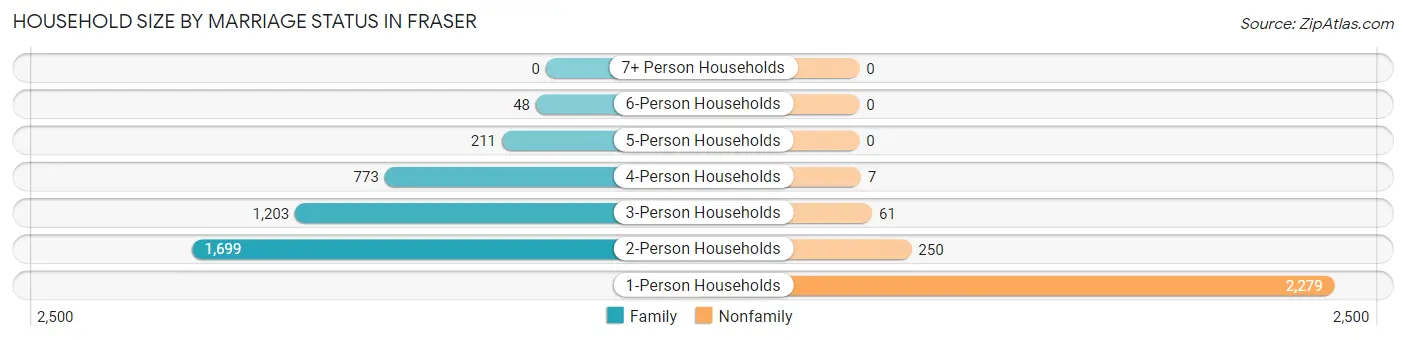
| Household Size | Family Households | Nonfamily Households |
| 1-Person Households | - | 2,279 (34.9%) |
| 2-Person Households | 1,699 (26.0%) | 250 (3.8%) |
| 3-Person Households | 1,203 (18.4%) | 61 (0.9%) |
| 4-Person Households | 773 (11.8%) | 7 (0.1%) |
| 5-Person Households | 211 (3.2%) | 0 (0.0%) |
| 6-Person Households | 48 (0.7%) | 0 (0.0%) |
| 7+ Person Households | 0 (0.0%) | 0 (0.0%) |
| Total | 3,934 (60.2%) | 2,597 (39.8%) |
Female Fertility in Fraser
Fertility by Age in Fraser
Average fertility rate in Fraser is 43.0 births per 1,000 women. Women in the age bracket of 20 to 34 years have the highest fertility rate with 79.0 births per 1,000 women. Women in the age bracket of 20 to 34 years acount for 85.8% of all women with births.
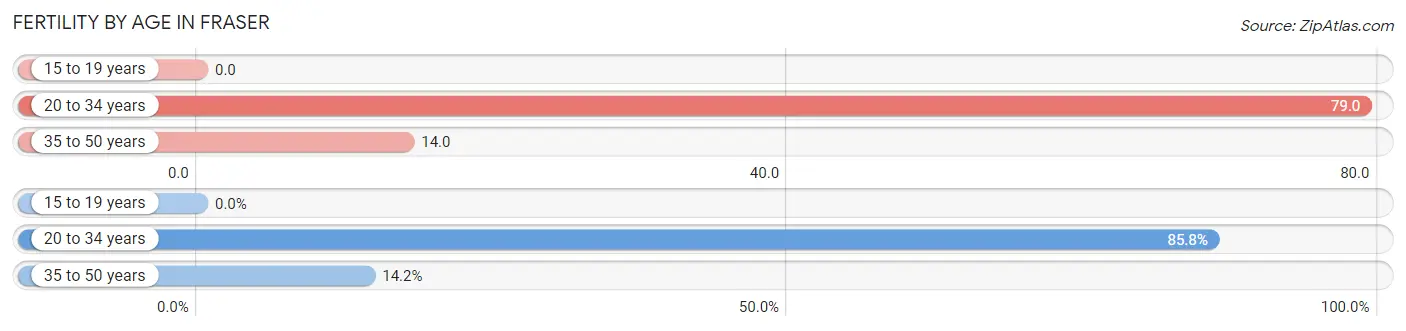
| Age Bracket | Women with Births | Births / 1,000 Women |
| 15 to 19 years | 0 (0.0%) | 0.0 |
| 20 to 34 years | 127 (85.8%) | 79.0 |
| 35 to 50 years | 21 (14.2%) | 14.0 |
| Total | 148 (100.0%) | 43.0 |
Fertility by Age by Marriage Status in Fraser
72.3% of women with births (148) in Fraser are married. The highest percentage of unmarried women with births falls into 35 to 50 years age bracket with 47.6% of them unmarried at the time of birth, while the lowest percentage of unmarried women with births belong to 20 to 34 years age bracket with 24.4% of them unmarried.
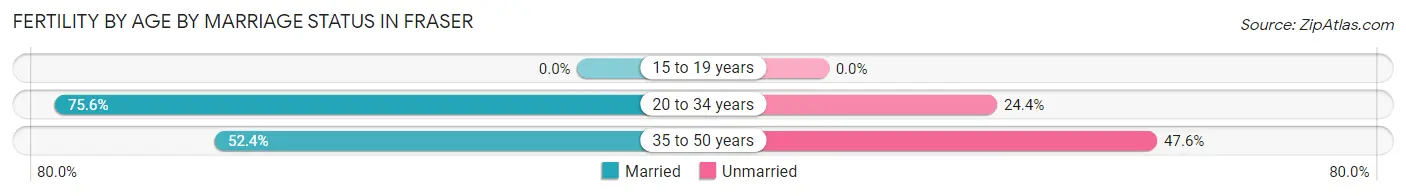
| Age Bracket | Married | Unmarried |
| 15 to 19 years | 0 (0.0%) | 0 (0.0%) |
| 20 to 34 years | 96 (75.6%) | 31 (24.4%) |
| 35 to 50 years | 11 (52.4%) | 10 (47.6%) |
| Total | 107 (72.3%) | 41 (27.7%) |
Fertility by Education in Fraser
Average fertility rate in Fraser is 43.0 births per 1,000 women. Women with the education attainment of bachelor's degree have the highest fertility rate of 86.0 births per 1,000 women, while women with the education attainment of college or associate's degree have the lowest fertility at 13.0 births per 1,000 women. Women with the education attainment of high school diploma represent 34.5% of all women with births.
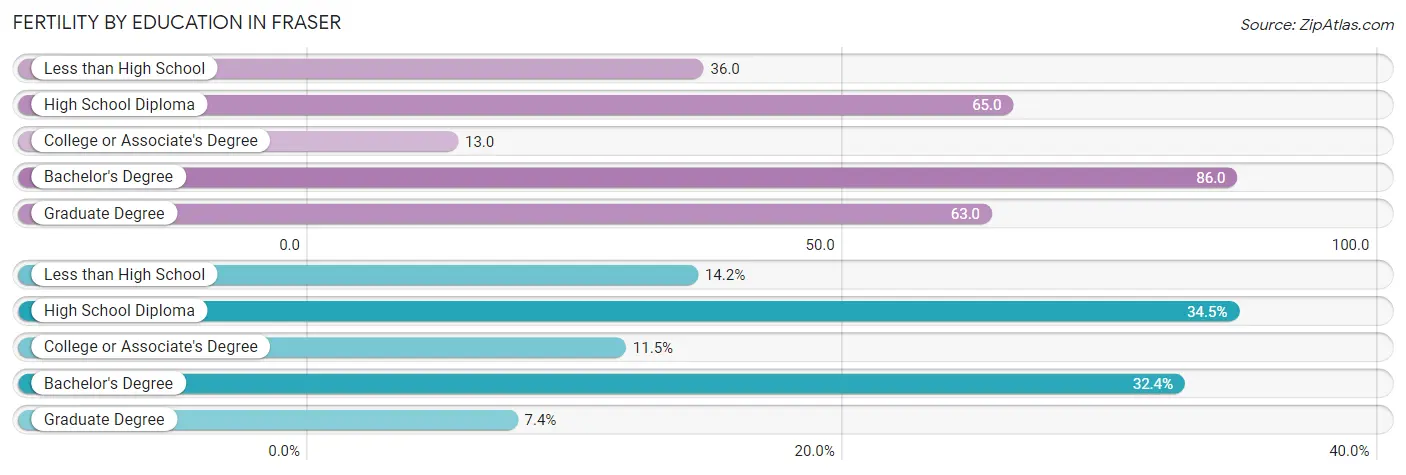
| Educational Attainment | Women with Births | Births / 1,000 Women |
| Less than High School | 21 (14.2%) | 36.0 |
| High School Diploma | 51 (34.5%) | 65.0 |
| College or Associate's Degree | 17 (11.5%) | 13.0 |
| Bachelor's Degree | 48 (32.4%) | 86.0 |
| Graduate Degree | 11 (7.4%) | 63.0 |
| Total | 148 (100.0%) | 43.0 |
Fertility by Education by Marriage Status in Fraser
27.7% of women with births in Fraser are unmarried. Women with the educational attainment of college or associate's degree are most likely to be married with 100.0% of them married at childbirth, while women with the educational attainment of less than high school are least likely to be married with 100.0% of them unmarried at childbirth.
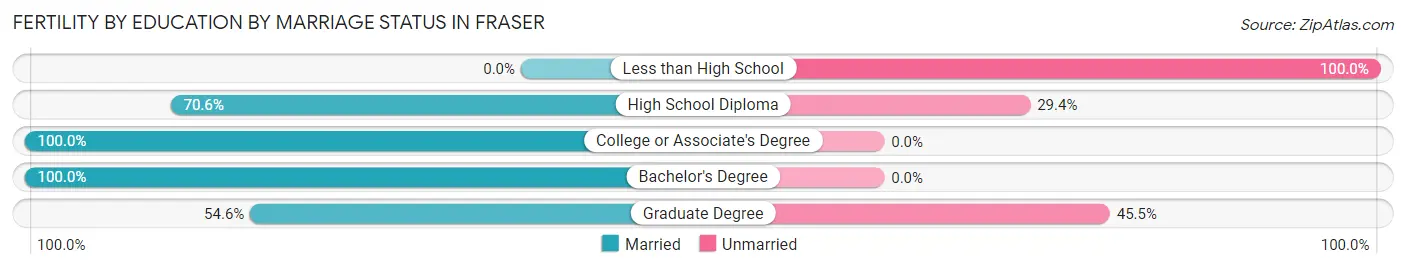
| Educational Attainment | Married | Unmarried |
| Less than High School | 0 (0.0%) | 21 (100.0%) |
| High School Diploma | 36 (70.6%) | 15 (29.4%) |
| College or Associate's Degree | 17 (100.0%) | 0 (0.0%) |
| Bachelor's Degree | 48 (100.0%) | 0 (0.0%) |
| Graduate Degree | 6 (54.5%) | 5 (45.5%) |
| Total | 107 (72.3%) | 41 (27.7%) |
Employment Characteristics in Fraser
Employment by Class of Employer in Fraser
Among the 7,388 employed individuals in Fraser, private company employees (5,241 | 70.9%), not-for-profit organizations (963 | 13.0%), and local government employees (370 | 5.0%) make up the most common classes of employment.
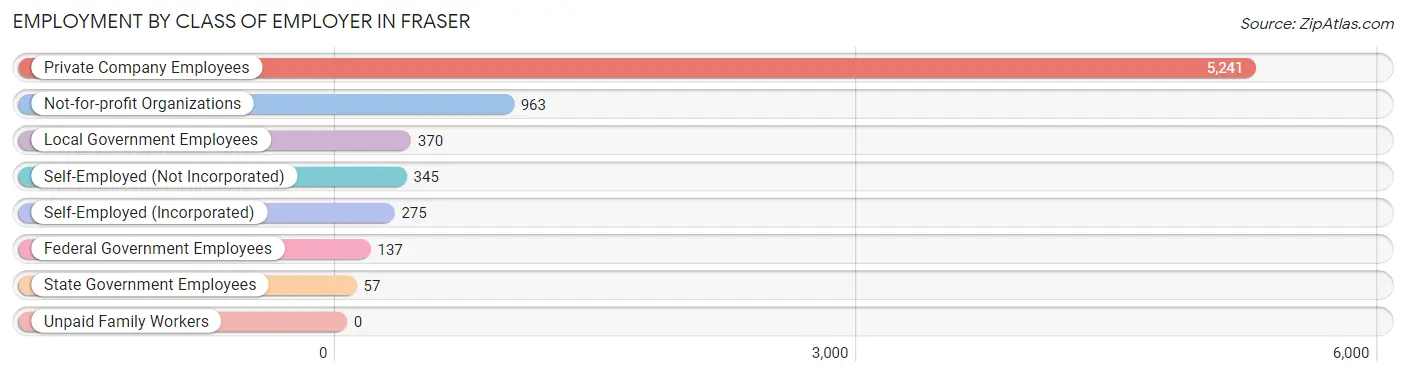
| Employer Class | # Employees | % Employees |
| Private Company Employees | 5,241 | 70.9% |
| Self-Employed (Incorporated) | 275 | 3.7% |
| Self-Employed (Not Incorporated) | 345 | 4.7% |
| Not-for-profit Organizations | 963 | 13.0% |
| Local Government Employees | 370 | 5.0% |
| State Government Employees | 57 | 0.8% |
| Federal Government Employees | 137 | 1.8% |
| Unpaid Family Workers | 0 | 0.0% |
| Total | 7,388 | 100.0% |
Employment Status by Age in Fraser
According to the labor force statistics for Fraser, out of the total population over 16 years of age (12,228), 64.9% or 7,936 individuals are in the labor force, with 4.8% or 381 of them unemployed. The age group with the highest labor force participation rate is 25 to 29 years, with 85.4% or 881 individuals in the labor force. Within the labor force, the 16 to 19 years age range has the highest percentage of unemployed individuals, with 33.3% or 91 of them being unemployed.
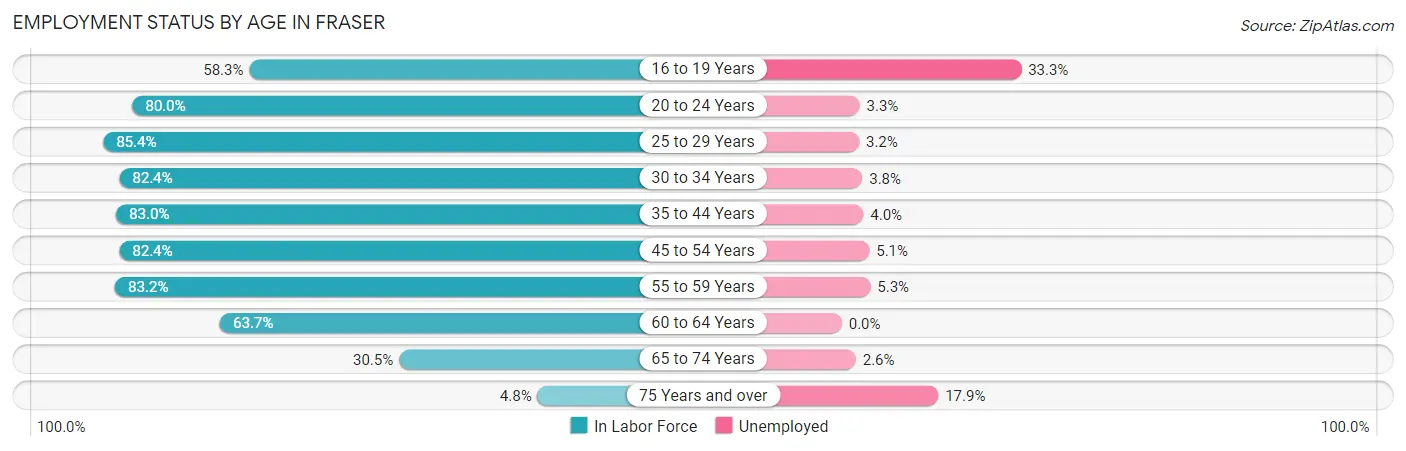
| Age Bracket | In Labor Force | Unemployed |
| 16 to 19 Years | 273 (58.3%) | 91 (33.3%) |
| 20 to 24 Years | 874 (80.0%) | 29 (3.3%) |
| 25 to 29 Years | 881 (85.4%) | 28 (3.2%) |
| 30 to 34 Years | 914 (82.4%) | 35 (3.8%) |
| 35 to 44 Years | 1,279 (83.0%) | 51 (4.0%) |
| 45 to 54 Years | 1,573 (82.4%) | 80 (5.1%) |
| 55 to 59 Years | 844 (83.2%) | 45 (5.3%) |
| 60 to 64 Years | 698 (63.7%) | 0 (0.0%) |
| 65 to 74 Years | 549 (30.5%) | 14 (2.6%) |
| 75 Years and over | 56 (4.8%) | 10 (17.9%) |
| Total | 7,936 (64.9%) | 381 (4.8%) |
Employment Status by Educational Attainment in Fraser
According to labor force statistics for Fraser, 80.4% of individuals (6,191) out of the total population between 25 and 64 years of age (7,700) are in the labor force, with 3.9% or 241 of them being unemployed. The group with the highest labor force participation rate are those with the educational attainment of bachelor's degree or higher, with 94.0% or 1,635 individuals in the labor force. Within the labor force, individuals with less than high school education have the highest percentage of unemployment, with 6.0% or 15 of them being unemployed.
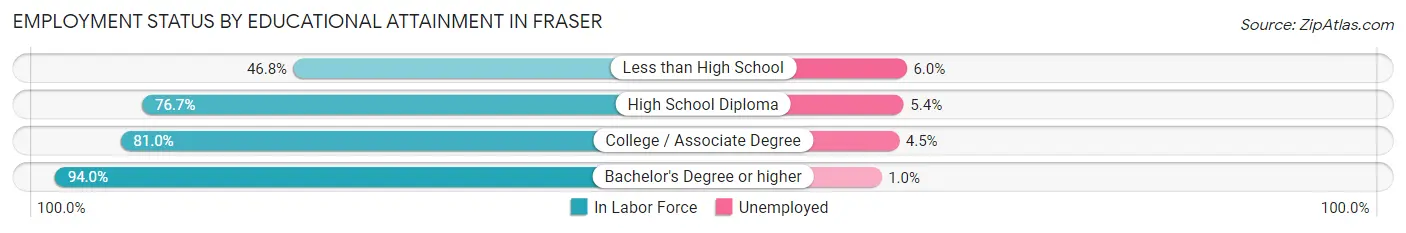
| Educational Attainment | In Labor Force | Unemployed |
| Less than High School | 252 (46.8%) | 32 (6.0%) |
| High School Diploma | 1,601 (76.7%) | 113 (5.4%) |
| College / Associate Degree | 2,701 (81.0%) | 150 (4.5%) |
| Bachelor's Degree or higher | 1,635 (94.0%) | 17 (1.0%) |
| Total | 6,191 (80.4%) | 300 (3.9%) |
Employment Occupations by Sex in Fraser
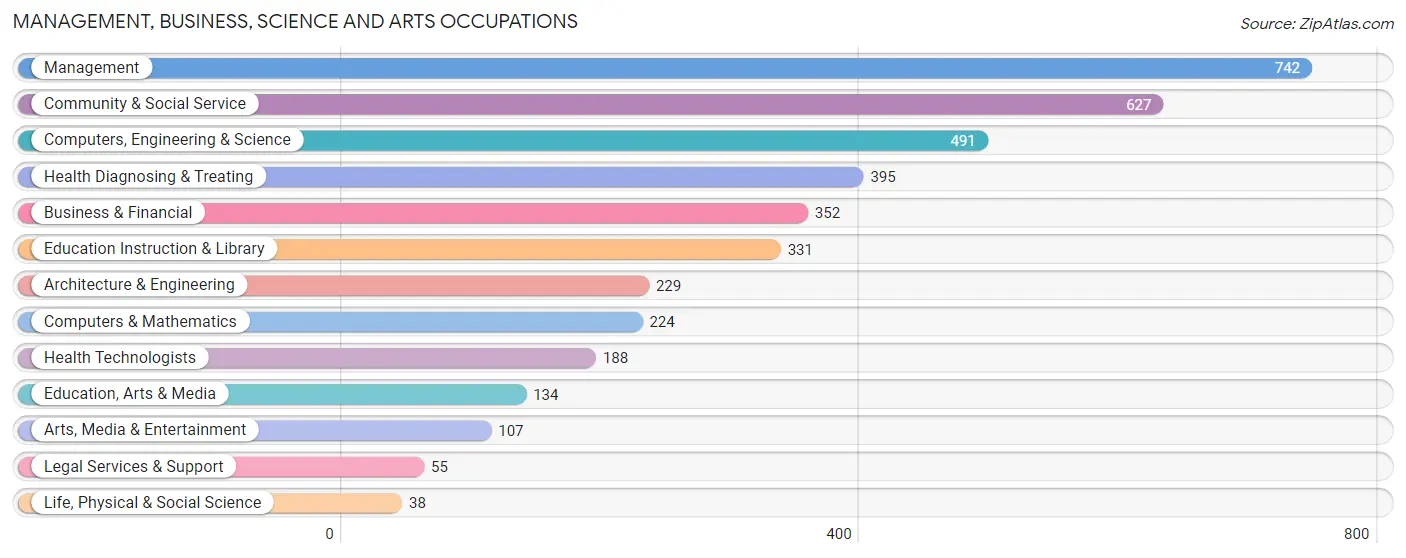
Management, Business, Science and Arts Occupations
The most common Management, Business, Science and Arts occupations in Fraser are Management (742 | 9.8%), Community & Social Service (627 | 8.3%), Computers, Engineering & Science (491 | 6.5%), Health Diagnosing & Treating (395 | 5.2%), and Business & Financial (352 | 4.7%).
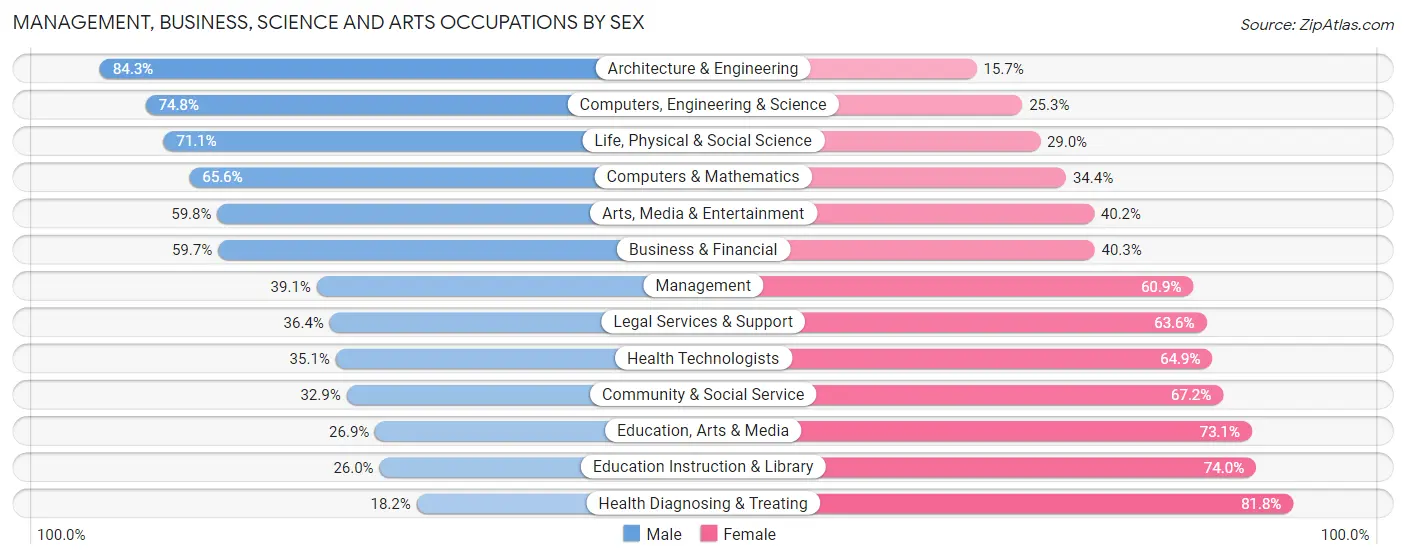
Management, Business, Science and Arts Occupations by Sex
Within the Management, Business, Science and Arts occupations in Fraser, the most male-oriented occupations are Architecture & Engineering (84.3%), Computers, Engineering & Science (74.8%), and Life, Physical & Social Science (71.1%), while the most female-oriented occupations are Health Diagnosing & Treating (81.8%), Education Instruction & Library (74.0%), and Education, Arts & Media (73.1%).
| Occupation | Male | Female |
| Management | 290 (39.1%) | 452 (60.9%) |
| Business & Financial | 210 (59.7%) | 142 (40.3%) |
| Computers, Engineering & Science | 367 (74.8%) | 124 (25.3%) |
| Computers & Mathematics | 147 (65.6%) | 77 (34.4%) |
| Architecture & Engineering | 193 (84.3%) | 36 (15.7%) |
| Life, Physical & Social Science | 27 (71.1%) | 11 (28.9%) |
| Community & Social Service | 206 (32.9%) | 421 (67.1%) |
| Education, Arts & Media | 36 (26.9%) | 98 (73.1%) |
| Legal Services & Support | 20 (36.4%) | 35 (63.6%) |
| Education Instruction & Library | 86 (26.0%) | 245 (74.0%) |
| Arts, Media & Entertainment | 64 (59.8%) | 43 (40.2%) |
| Health Diagnosing & Treating | 72 (18.2%) | 323 (81.8%) |
| Health Technologists | 66 (35.1%) | 122 (64.9%) |
| Total (Category) | 1,145 (43.9%) | 1,462 (56.1%) |
| Total (Overall) | 3,810 (50.4%) | 3,745 (49.6%) |
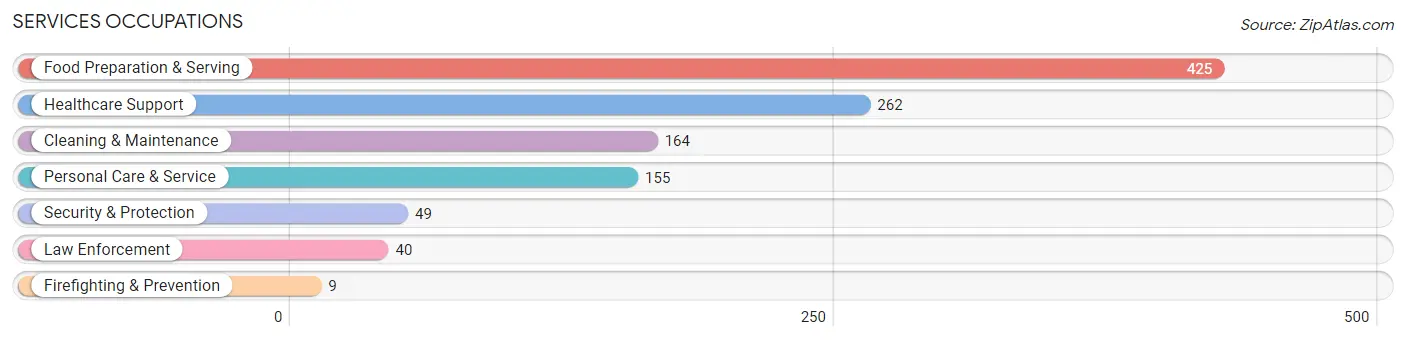
Services Occupations
The most common Services occupations in Fraser are Food Preparation & Serving (425 | 5.6%), Healthcare Support (262 | 3.5%), Cleaning & Maintenance (164 | 2.2%), Personal Care & Service (155 | 2.1%), and Security & Protection (49 | 0.6%).
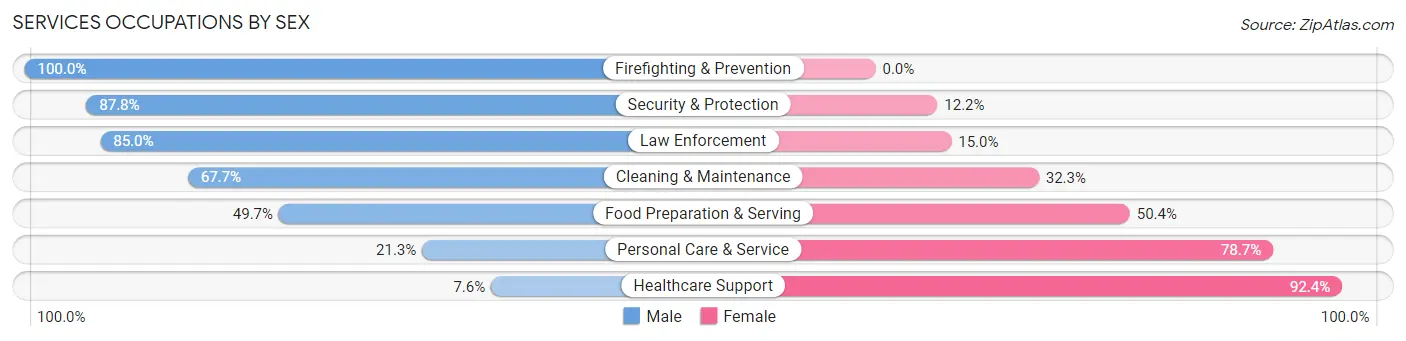
Services Occupations by Sex
Within the Services occupations in Fraser, the most male-oriented occupations are Firefighting & Prevention (100.0%), Security & Protection (87.8%), and Law Enforcement (85.0%), while the most female-oriented occupations are Healthcare Support (92.4%), Personal Care & Service (78.7%), and Food Preparation & Serving (50.3%).
| Occupation | Male | Female |
| Healthcare Support | 20 (7.6%) | 242 (92.4%) |
| Security & Protection | 43 (87.8%) | 6 (12.2%) |
| Firefighting & Prevention | 9 (100.0%) | 0 (0.0%) |
| Law Enforcement | 34 (85.0%) | 6 (15.0%) |
| Food Preparation & Serving | 211 (49.6%) | 214 (50.3%) |
| Cleaning & Maintenance | 111 (67.7%) | 53 (32.3%) |
| Personal Care & Service | 33 (21.3%) | 122 (78.7%) |
| Total (Category) | 418 (39.6%) | 637 (60.4%) |
| Total (Overall) | 3,810 (50.4%) | 3,745 (49.6%) |
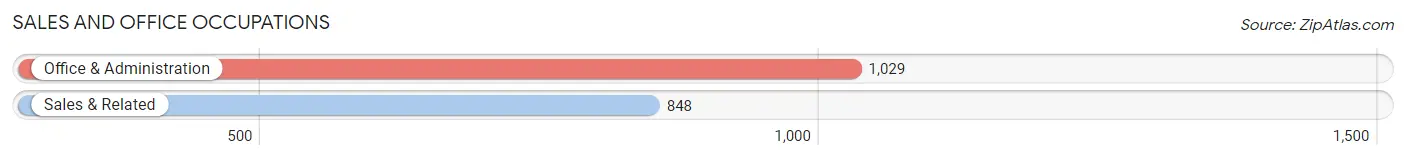
Sales and Office Occupations
The most common Sales and Office occupations in Fraser are Office & Administration (1,029 | 13.6%), and Sales & Related (848 | 11.2%).
Sales and Office Occupations by Sex
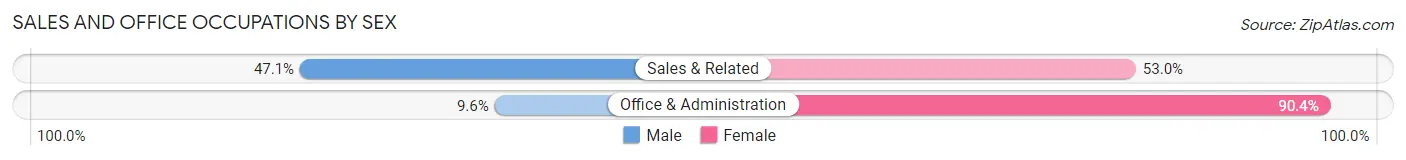
| Occupation | Male | Female |
| Sales & Related | 399 (47.0%) | 449 (52.9%) |
| Office & Administration | 99 (9.6%) | 930 (90.4%) |
| Total (Category) | 498 (26.5%) | 1,379 (73.5%) |
| Total (Overall) | 3,810 (50.4%) | 3,745 (49.6%) |
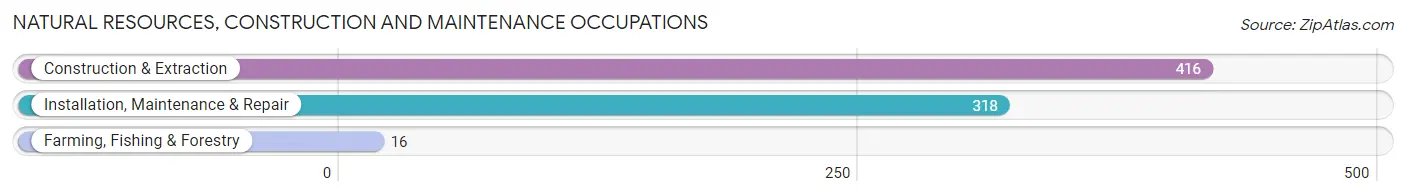
Natural Resources, Construction and Maintenance Occupations
The most common Natural Resources, Construction and Maintenance occupations in Fraser are Construction & Extraction (416 | 5.5%), Installation, Maintenance & Repair (318 | 4.2%), and Farming, Fishing & Forestry (16 | 0.2%).
Natural Resources, Construction and Maintenance Occupations by Sex
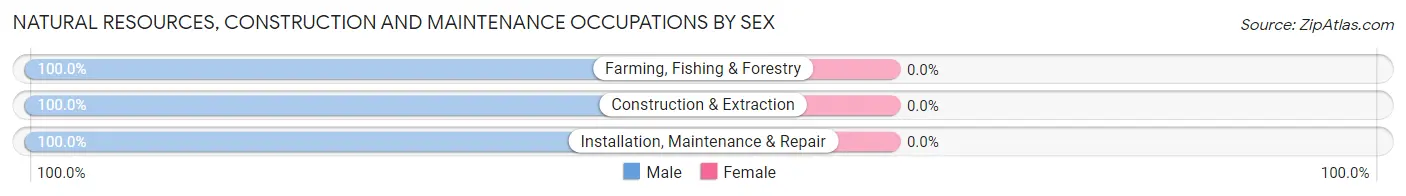
| Occupation | Male | Female |
| Farming, Fishing & Forestry | 16 (100.0%) | 0 (0.0%) |
| Construction & Extraction | 416 (100.0%) | 0 (0.0%) |
| Installation, Maintenance & Repair | 318 (100.0%) | 0 (0.0%) |
| Total (Category) | 750 (100.0%) | 0 (0.0%) |
| Total (Overall) | 3,810 (50.4%) | 3,745 (49.6%) |
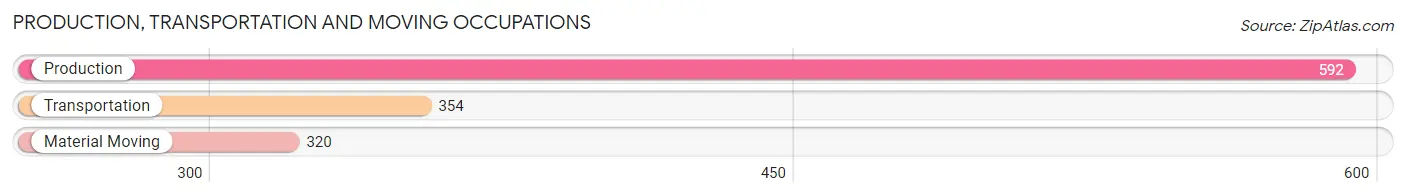
Production, Transportation and Moving Occupations
The most common Production, Transportation and Moving occupations in Fraser are Production (592 | 7.8%), Transportation (354 | 4.7%), and Material Moving (320 | 4.2%).
Production, Transportation and Moving Occupations by Sex
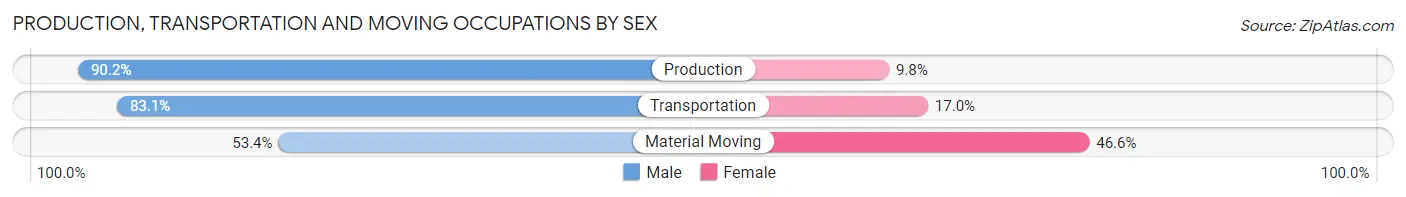
| Occupation | Male | Female |
| Production | 534 (90.2%) | 58 (9.8%) |
| Transportation | 294 (83.1%) | 60 (17.0%) |
| Material Moving | 171 (53.4%) | 149 (46.6%) |
| Total (Category) | 999 (78.9%) | 267 (21.1%) |
| Total (Overall) | 3,810 (50.4%) | 3,745 (49.6%) |
Employment Industries by Sex in Fraser
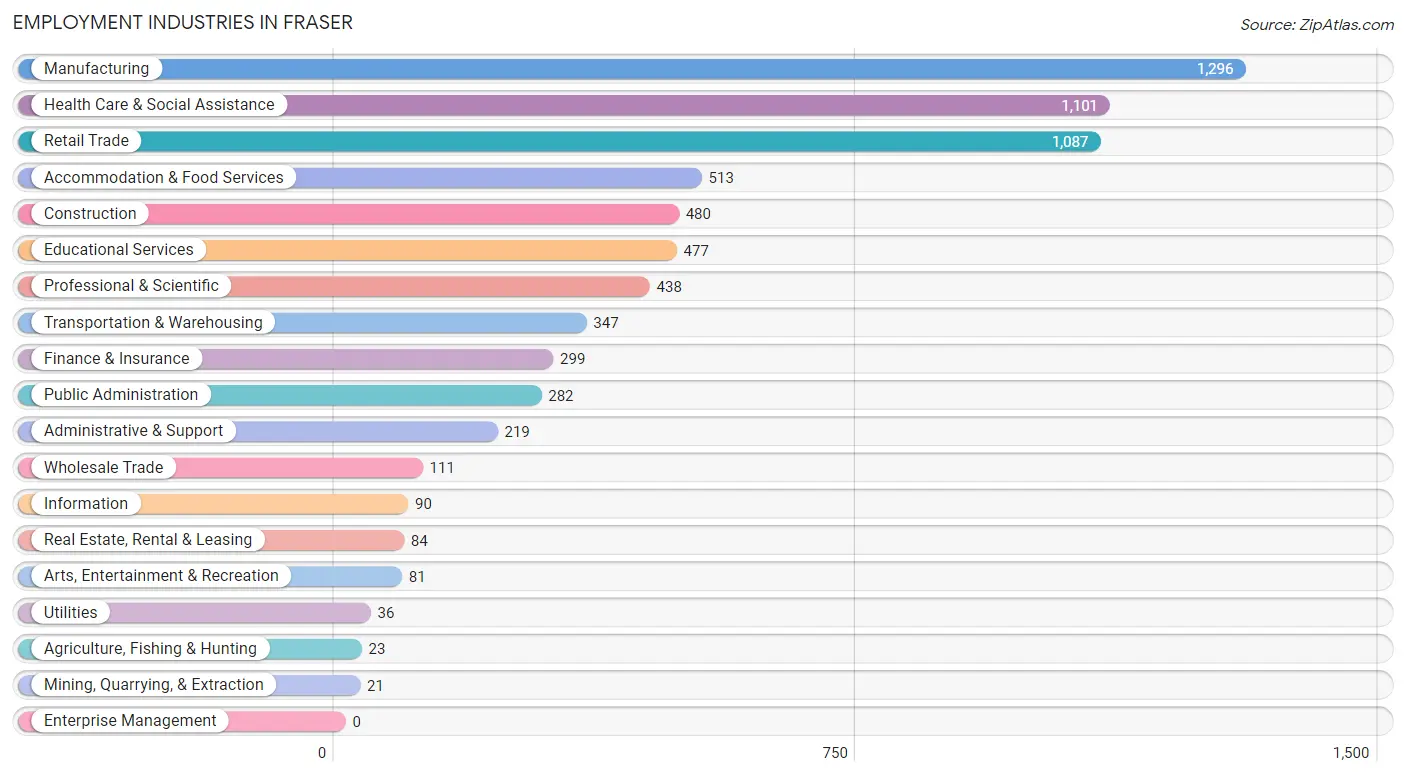
Employment Industries in Fraser
The major employment industries in Fraser include Manufacturing (1,296 | 17.2%), Health Care & Social Assistance (1,101 | 14.6%), Retail Trade (1,087 | 14.4%), Accommodation & Food Services (513 | 6.8%), and Construction (480 | 6.4%).
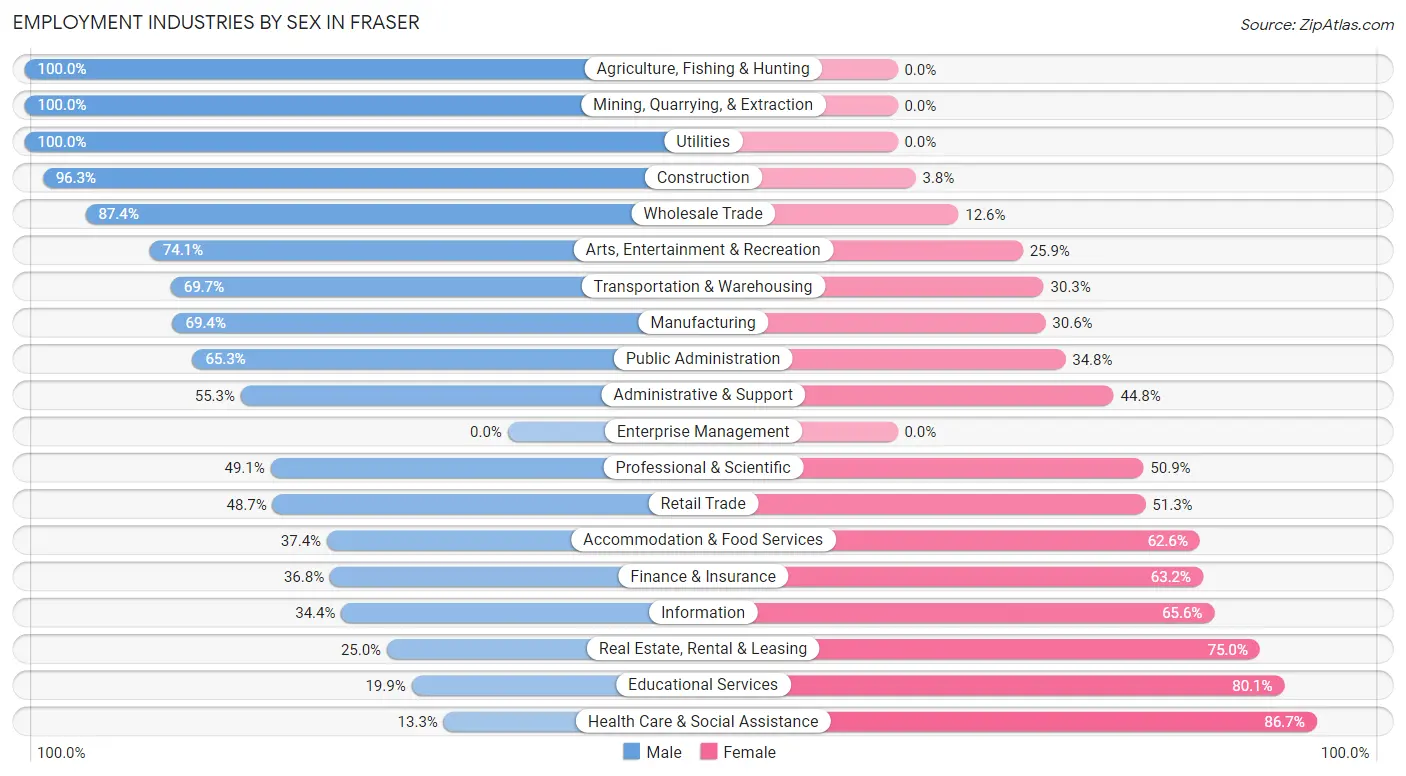
Employment Industries by Sex in Fraser
The Fraser industries that see more men than women are Agriculture, Fishing & Hunting (100.0%), Mining, Quarrying, & Extraction (100.0%), and Utilities (100.0%), whereas the industries that tend to have a higher number of women are Health Care & Social Assistance (86.7%), Educational Services (80.1%), and Real Estate, Rental & Leasing (75.0%).
| Industry | Male | Female |
| Agriculture, Fishing & Hunting | 23 (100.0%) | 0 (0.0%) |
| Mining, Quarrying, & Extraction | 21 (100.0%) | 0 (0.0%) |
| Construction | 462 (96.3%) | 18 (3.7%) |
| Manufacturing | 899 (69.4%) | 397 (30.6%) |
| Wholesale Trade | 97 (87.4%) | 14 (12.6%) |
| Retail Trade | 529 (48.7%) | 558 (51.3%) |
| Transportation & Warehousing | 242 (69.7%) | 105 (30.3%) |
| Utilities | 36 (100.0%) | 0 (0.0%) |
| Information | 31 (34.4%) | 59 (65.6%) |
| Finance & Insurance | 110 (36.8%) | 189 (63.2%) |
| Real Estate, Rental & Leasing | 21 (25.0%) | 63 (75.0%) |
| Professional & Scientific | 215 (49.1%) | 223 (50.9%) |
| Enterprise Management | 0 (0.0%) | 0 (0.0%) |
| Administrative & Support | 121 (55.2%) | 98 (44.8%) |
| Educational Services | 95 (19.9%) | 382 (80.1%) |
| Health Care & Social Assistance | 146 (13.3%) | 955 (86.7%) |
| Arts, Entertainment & Recreation | 60 (74.1%) | 21 (25.9%) |
| Accommodation & Food Services | 192 (37.4%) | 321 (62.6%) |
| Public Administration | 184 (65.2%) | 98 (34.7%) |
| Total | 3,810 (50.4%) | 3,745 (49.6%) |
Education in Fraser
School Enrollment in Fraser
The most common levels of schooling among the 2,464 students in Fraser are high school (651 | 26.4%), middle school (602 | 24.4%), and elementary school (500 | 20.3%).
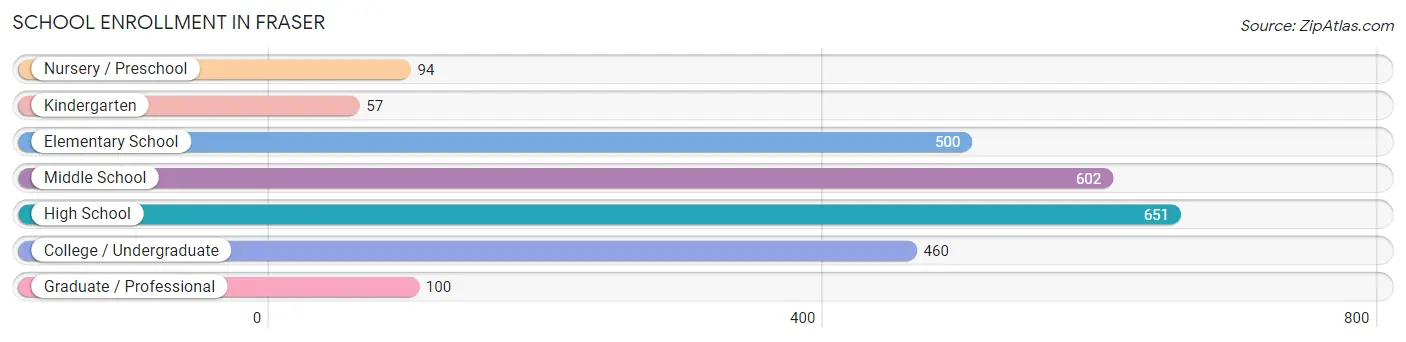
| School Level | # Students | % Students |
| Nursery / Preschool | 94 | 3.8% |
| Kindergarten | 57 | 2.3% |
| Elementary School | 500 | 20.3% |
| Middle School | 602 | 24.4% |
| High School | 651 | 26.4% |
| College / Undergraduate | 460 | 18.7% |
| Graduate / Professional | 100 | 4.1% |
| Total | 2,464 | 100.0% |
School Enrollment by Age by Funding Source in Fraser
Out of a total of 2,464 students who are enrolled in schools in Fraser, 241 (9.8%) attend a private institution, while the remaining 2,223 (90.2%) are enrolled in public schools. The age group of 25 to 34 year olds has the highest likelihood of being enrolled in private schools, with 70 (31.5% in the age bracket) enrolled. Conversely, the age group of 35 years and over has the lowest likelihood of being enrolled in a private school, with 51 (100.0% in the age bracket) attending a public institution.
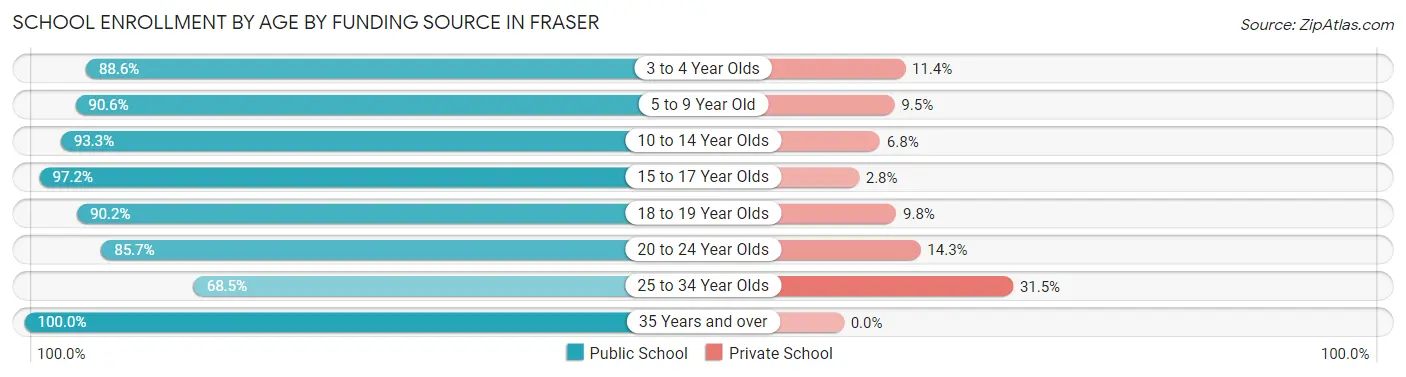
| Age Bracket | Public School | Private School |
| 3 to 4 Year Olds | 62 (88.6%) | 8 (11.4%) |
| 5 to 9 Year Old | 508 (90.5%) | 53 (9.5%) |
| 10 to 14 Year Olds | 704 (93.2%) | 51 (6.8%) |
| 15 to 17 Year Olds | 415 (97.2%) | 12 (2.8%) |
| 18 to 19 Year Olds | 120 (90.2%) | 13 (9.8%) |
| 20 to 24 Year Olds | 210 (85.7%) | 35 (14.3%) |
| 25 to 34 Year Olds | 152 (68.5%) | 70 (31.5%) |
| 35 Years and over | 51 (100.0%) | 0 (0.0%) |
| Total | 2,223 (90.2%) | 241 (9.8%) |
Educational Attainment by Field of Study in Fraser
Business (534 | 22.1%), science & technology (393 | 16.3%), education (295 | 12.2%), arts & humanities (194 | 8.0%), and computers & mathematics (145 | 6.0%) are the most common fields of study among 2,418 individuals in Fraser who have obtained a bachelor's degree or higher.
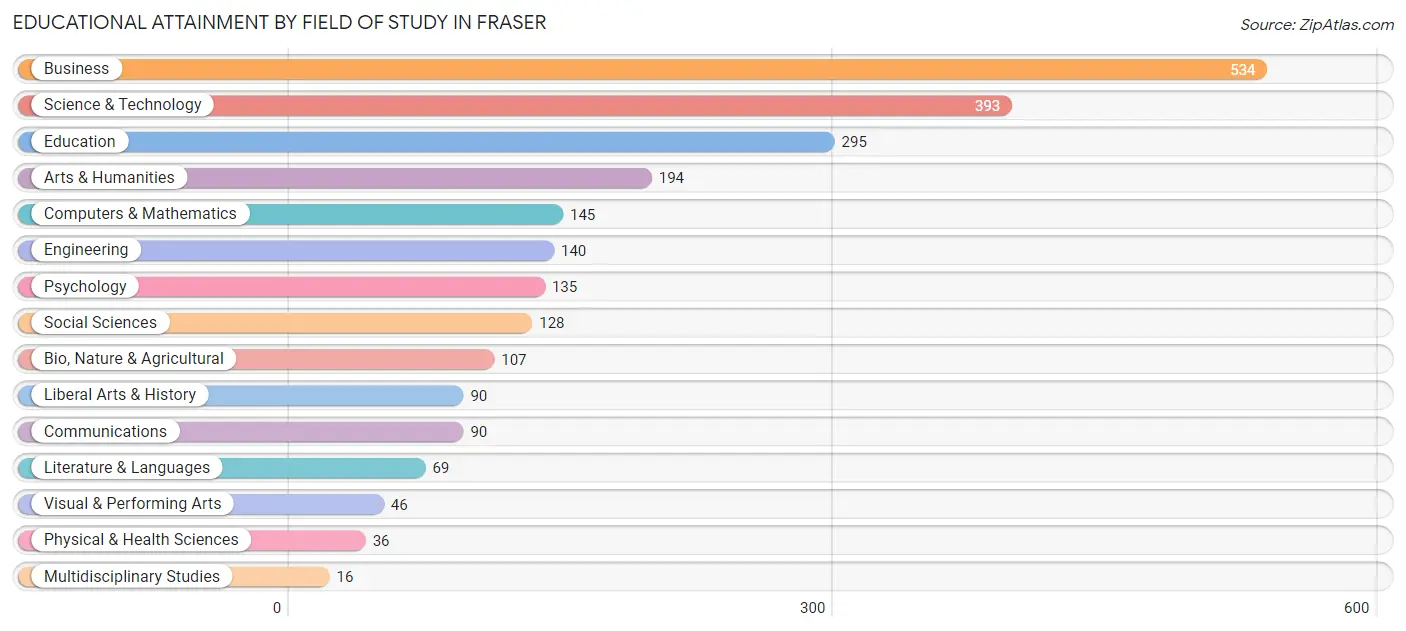
| Field of Study | # Graduates | % Graduates |
| Computers & Mathematics | 145 | 6.0% |
| Bio, Nature & Agricultural | 107 | 4.4% |
| Physical & Health Sciences | 36 | 1.5% |
| Psychology | 135 | 5.6% |
| Social Sciences | 128 | 5.3% |
| Engineering | 140 | 5.8% |
| Multidisciplinary Studies | 16 | 0.7% |
| Science & Technology | 393 | 16.3% |
| Business | 534 | 22.1% |
| Education | 295 | 12.2% |
| Literature & Languages | 69 | 2.9% |
| Liberal Arts & History | 90 | 3.7% |
| Visual & Performing Arts | 46 | 1.9% |
| Communications | 90 | 3.7% |
| Arts & Humanities | 194 | 8.0% |
| Total | 2,418 | 100.0% |
Transportation & Commute in Fraser
Vehicle Availability by Sex in Fraser
The most prevalent vehicle ownership categories in Fraser are males with 2 vehicles (1,898, accounting for 51.0%) and females with 2 vehicles (1,576, making up 51.8%).
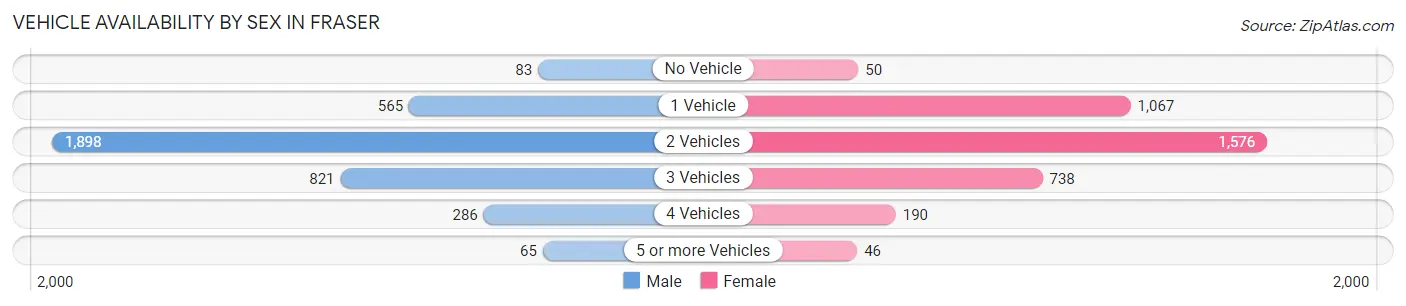
| Vehicles Available | Male | Female |
| No Vehicle | 83 (2.2%) | 50 (1.4%) |
| 1 Vehicle | 565 (15.2%) | 1,067 (29.1%) |
| 2 Vehicles | 1,898 (51.0%) | 1,576 (43.0%) |
| 3 Vehicles | 821 (22.1%) | 738 (20.1%) |
| 4 Vehicles | 286 (7.7%) | 190 (5.2%) |
| 5 or more Vehicles | 65 (1.8%) | 46 (1.3%) |
| Total | 3,718 (100.0%) | 3,667 (100.0%) |
Commute Time in Fraser
The most frequently occuring commute durations in Fraser are 20 to 24 minutes (1,310 commuters, 20.4%), 15 to 19 minutes (1,039 commuters, 16.2%), and 30 to 34 minutes (799 commuters, 12.4%).
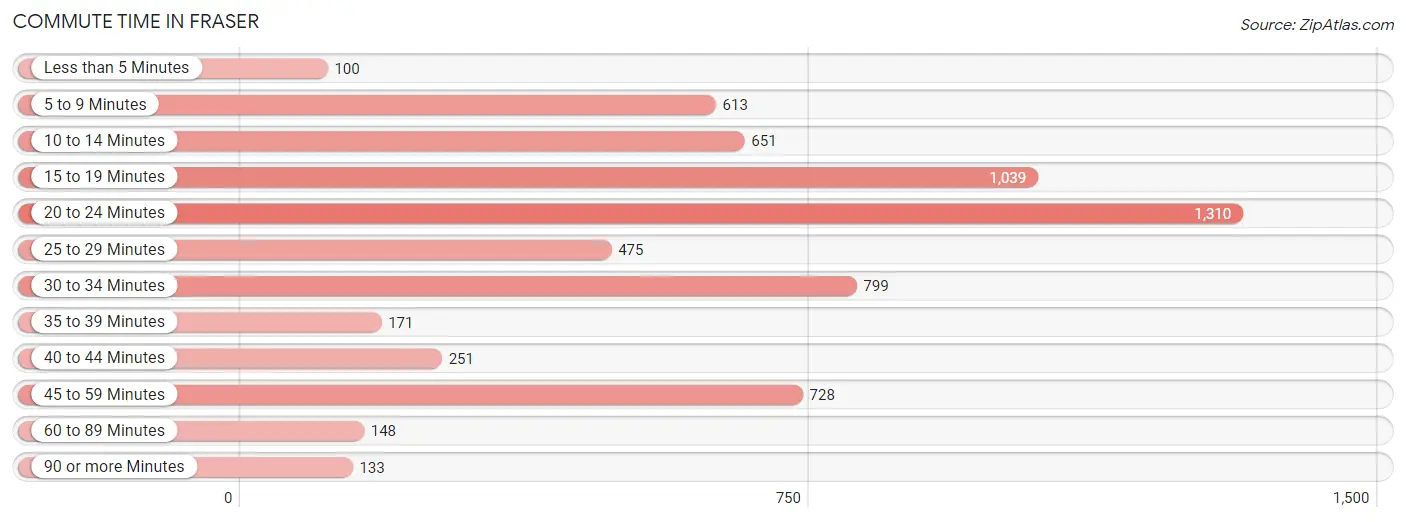
| Commute Time | # Commuters | % Commuters |
| Less than 5 Minutes | 100 | 1.6% |
| 5 to 9 Minutes | 613 | 9.6% |
| 10 to 14 Minutes | 651 | 10.1% |
| 15 to 19 Minutes | 1,039 | 16.2% |
| 20 to 24 Minutes | 1,310 | 20.4% |
| 25 to 29 Minutes | 475 | 7.4% |
| 30 to 34 Minutes | 799 | 12.4% |
| 35 to 39 Minutes | 171 | 2.7% |
| 40 to 44 Minutes | 251 | 3.9% |
| 45 to 59 Minutes | 728 | 11.3% |
| 60 to 89 Minutes | 148 | 2.3% |
| 90 or more Minutes | 133 | 2.1% |
Commute Time by Sex in Fraser
The most common commute times in Fraser are 20 to 24 minutes (646 commuters, 19.8%) for males and 20 to 24 minutes (664 commuters, 21.1%) for females.
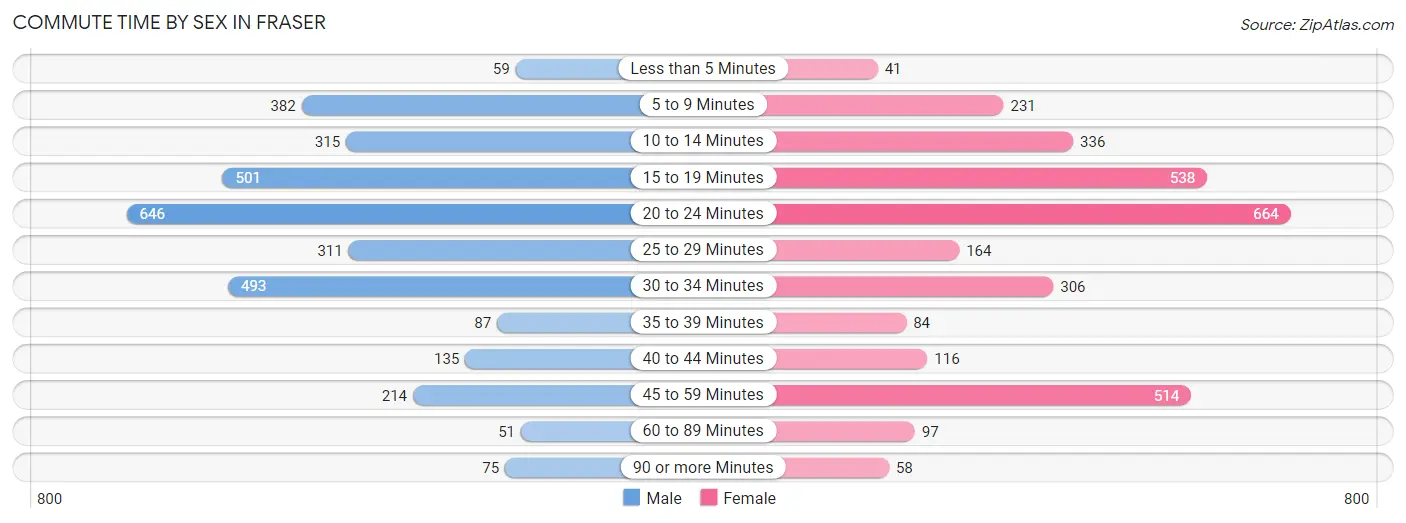
| Commute Time | Male | Female |
| Less than 5 Minutes | 59 (1.8%) | 41 (1.3%) |
| 5 to 9 Minutes | 382 (11.7%) | 231 (7.3%) |
| 10 to 14 Minutes | 315 (9.6%) | 336 (10.7%) |
| 15 to 19 Minutes | 501 (15.3%) | 538 (17.1%) |
| 20 to 24 Minutes | 646 (19.8%) | 664 (21.1%) |
| 25 to 29 Minutes | 311 (9.5%) | 164 (5.2%) |
| 30 to 34 Minutes | 493 (15.1%) | 306 (9.7%) |
| 35 to 39 Minutes | 87 (2.7%) | 84 (2.7%) |
| 40 to 44 Minutes | 135 (4.1%) | 116 (3.7%) |
| 45 to 59 Minutes | 214 (6.6%) | 514 (16.3%) |
| 60 to 89 Minutes | 51 (1.6%) | 97 (3.1%) |
| 90 or more Minutes | 75 (2.3%) | 58 (1.8%) |
Time of Departure to Work by Sex in Fraser
The most frequent times of departure to work in Fraser are 7:00 AM to 7:29 AM (435, 13.3%) for males and 7:30 AM to 7:59 AM (448, 14.2%) for females.
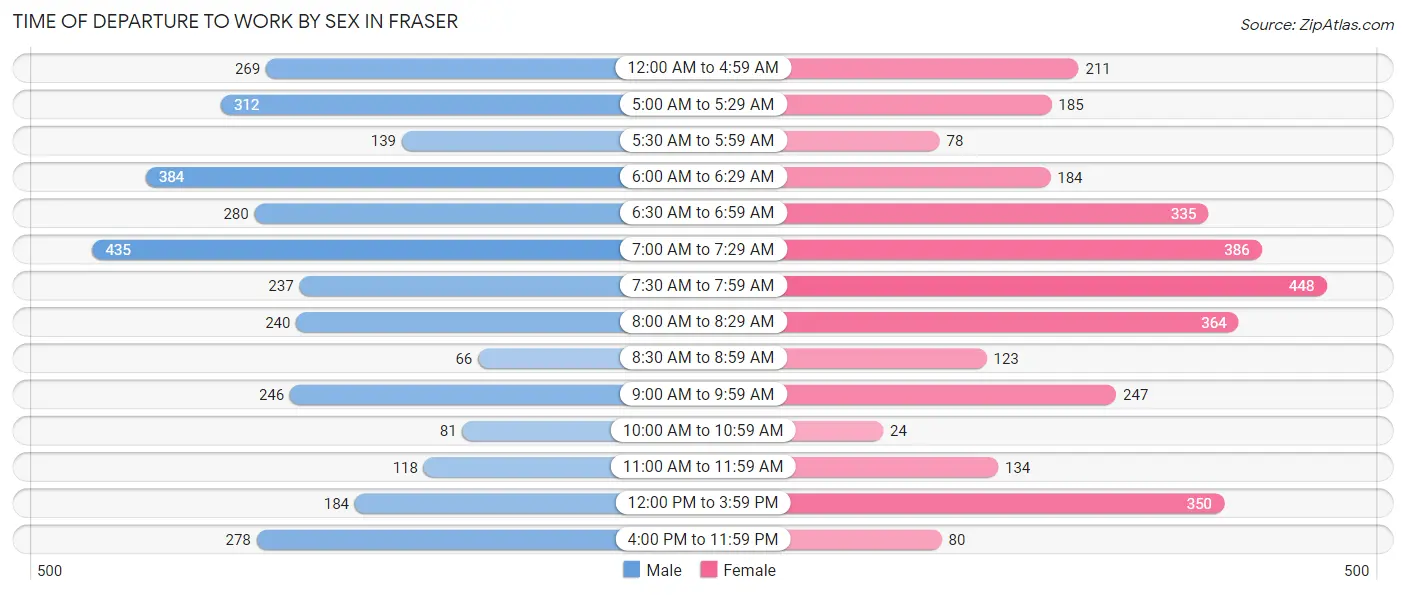
| Time of Departure | Male | Female |
| 12:00 AM to 4:59 AM | 269 (8.2%) | 211 (6.7%) |
| 5:00 AM to 5:29 AM | 312 (9.5%) | 185 (5.9%) |
| 5:30 AM to 5:59 AM | 139 (4.3%) | 78 (2.5%) |
| 6:00 AM to 6:29 AM | 384 (11.7%) | 184 (5.8%) |
| 6:30 AM to 6:59 AM | 280 (8.6%) | 335 (10.6%) |
| 7:00 AM to 7:29 AM | 435 (13.3%) | 386 (12.3%) |
| 7:30 AM to 7:59 AM | 237 (7.2%) | 448 (14.2%) |
| 8:00 AM to 8:29 AM | 240 (7.3%) | 364 (11.6%) |
| 8:30 AM to 8:59 AM | 66 (2.0%) | 123 (3.9%) |
| 9:00 AM to 9:59 AM | 246 (7.5%) | 247 (7.8%) |
| 10:00 AM to 10:59 AM | 81 (2.5%) | 24 (0.8%) |
| 11:00 AM to 11:59 AM | 118 (3.6%) | 134 (4.3%) |
| 12:00 PM to 3:59 PM | 184 (5.6%) | 350 (11.1%) |
| 4:00 PM to 11:59 PM | 278 (8.5%) | 80 (2.5%) |
| Total | 3,269 (100.0%) | 3,149 (100.0%) |
Housing Occupancy in Fraser
Occupancy by Ownership in Fraser
Of the total 6,531 dwellings in Fraser, owner-occupied units account for 4,873 (74.6%), while renter-occupied units make up 1,658 (25.4%).
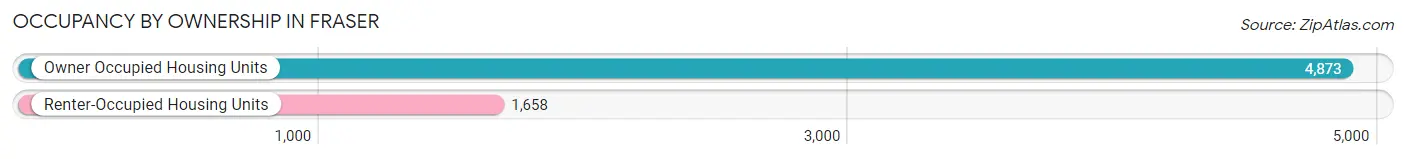
| Occupancy | # Housing Units | % Housing Units |
| Owner Occupied Housing Units | 4,873 | 74.6% |
| Renter-Occupied Housing Units | 1,658 | 25.4% |
| Total Occupied Housing Units | 6,531 | 100.0% |
Occupancy by Household Size in Fraser
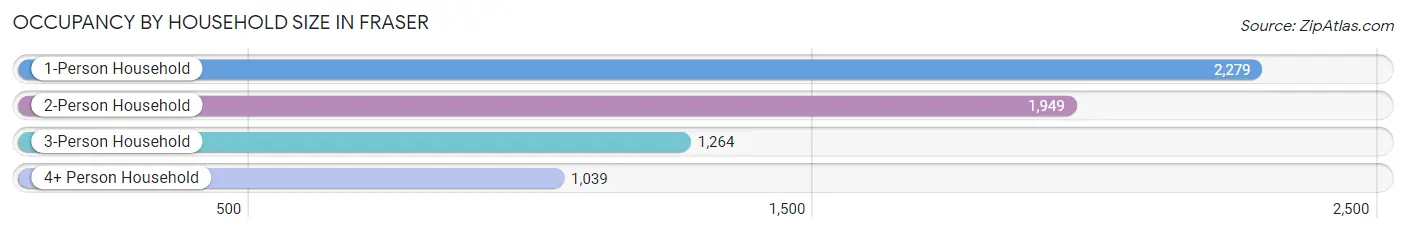
| Household Size | # Housing Units | % Housing Units |
| 1-Person Household | 2,279 | 34.9% |
| 2-Person Household | 1,949 | 29.8% |
| 3-Person Household | 1,264 | 19.4% |
| 4+ Person Household | 1,039 | 15.9% |
| Total Housing Units | 6,531 | 100.0% |
Occupancy by Ownership by Household Size in Fraser
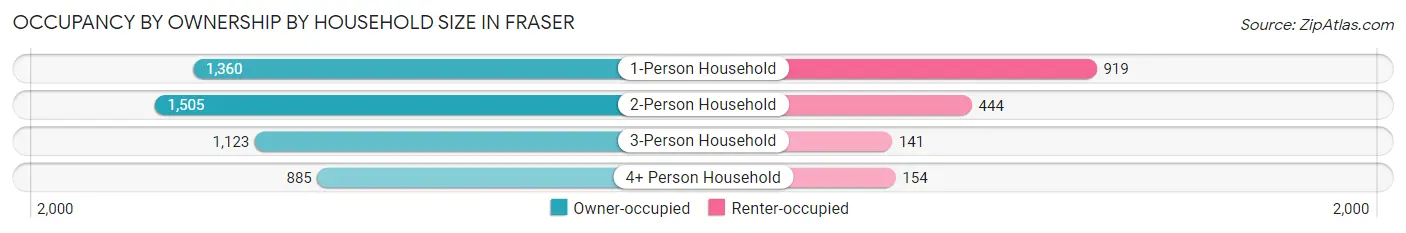
| Household Size | Owner-occupied | Renter-occupied |
| 1-Person Household | 1,360 (59.7%) | 919 (40.3%) |
| 2-Person Household | 1,505 (77.2%) | 444 (22.8%) |
| 3-Person Household | 1,123 (88.8%) | 141 (11.2%) |
| 4+ Person Household | 885 (85.2%) | 154 (14.8%) |
| Total Housing Units | 4,873 (74.6%) | 1,658 (25.4%) |
Occupancy by Educational Attainment in Fraser
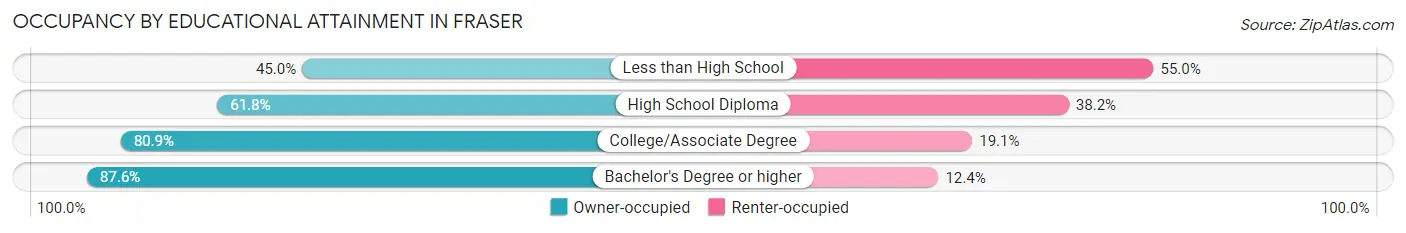
| Household Size | Owner-occupied | Renter-occupied |
| Less than High School | 189 (45.0%) | 231 (55.0%) |
| High School Diploma | 1,158 (61.8%) | 716 (38.2%) |
| College/Associate Degree | 2,264 (80.9%) | 533 (19.1%) |
| Bachelor's Degree or higher | 1,262 (87.6%) | 178 (12.4%) |
Occupancy by Age of Householder in Fraser
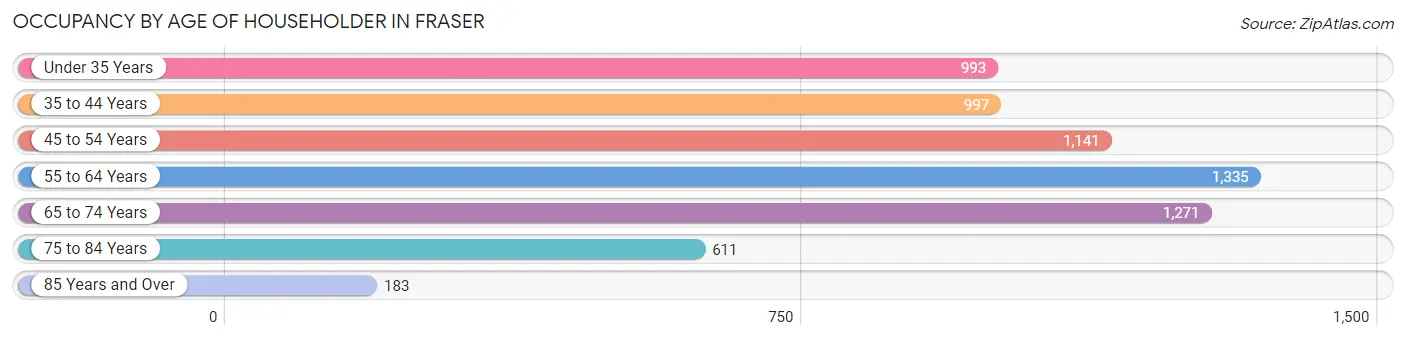
| Age Bracket | # Households | % Households |
| Under 35 Years | 993 | 15.2% |
| 35 to 44 Years | 997 | 15.3% |
| 45 to 54 Years | 1,141 | 17.5% |
| 55 to 64 Years | 1,335 | 20.4% |
| 65 to 74 Years | 1,271 | 19.5% |
| 75 to 84 Years | 611 | 9.4% |
| 85 Years and Over | 183 | 2.8% |
| Total | 6,531 | 100.0% |
Housing Finances in Fraser
Median Income by Occupancy in Fraser
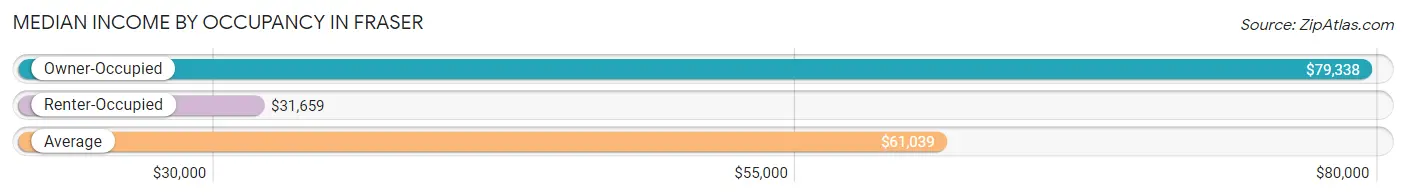
| Occupancy Type | # Households | Median Income |
| Owner-Occupied | 4,873 (74.6%) | $79,338 |
| Renter-Occupied | 1,658 (25.4%) | $31,659 |
| Average | 6,531 (100.0%) | $61,039 |
Occupancy by Householder Income Bracket in Fraser
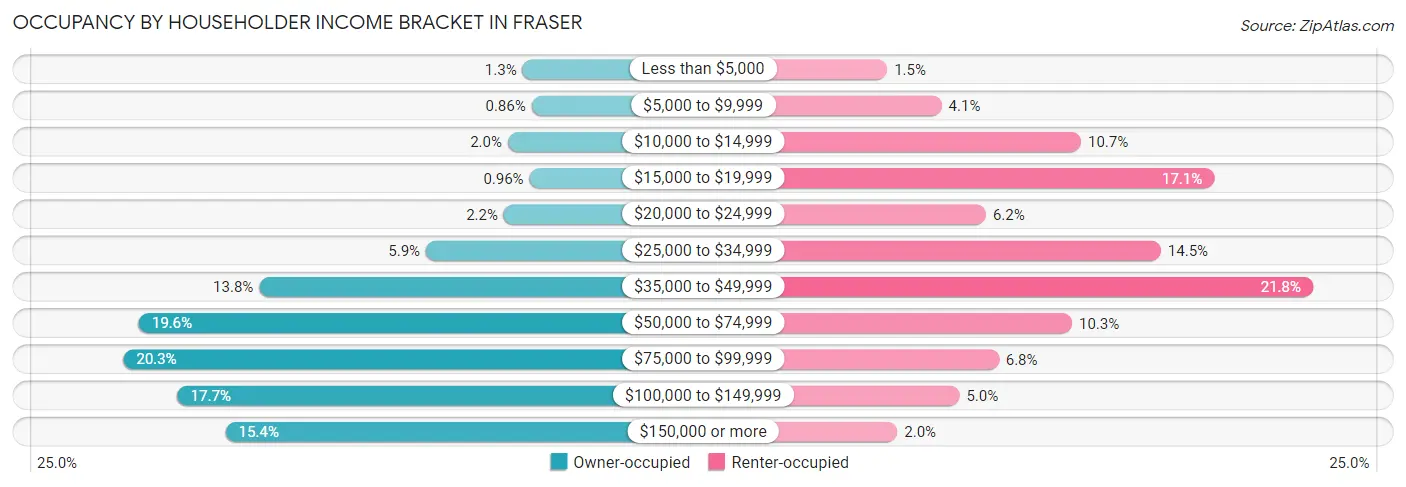
| Income Bracket | Owner-occupied | Renter-occupied |
| Less than $5,000 | 63 (1.3%) | 25 (1.5%) |
| $5,000 to $9,999 | 42 (0.9%) | 68 (4.1%) |
| $10,000 to $14,999 | 97 (2.0%) | 178 (10.7%) |
| $15,000 to $19,999 | 47 (1.0%) | 283 (17.1%) |
| $20,000 to $24,999 | 106 (2.2%) | 103 (6.2%) |
| $25,000 to $34,999 | 287 (5.9%) | 241 (14.5%) |
| $35,000 to $49,999 | 674 (13.8%) | 361 (21.8%) |
| $50,000 to $74,999 | 953 (19.6%) | 171 (10.3%) |
| $75,000 to $99,999 | 989 (20.3%) | 113 (6.8%) |
| $100,000 to $149,999 | 863 (17.7%) | 82 (5.0%) |
| $150,000 or more | 752 (15.4%) | 33 (2.0%) |
| Total | 4,873 (100.0%) | 1,658 (100.0%) |
Monthly Housing Cost Tiers in Fraser
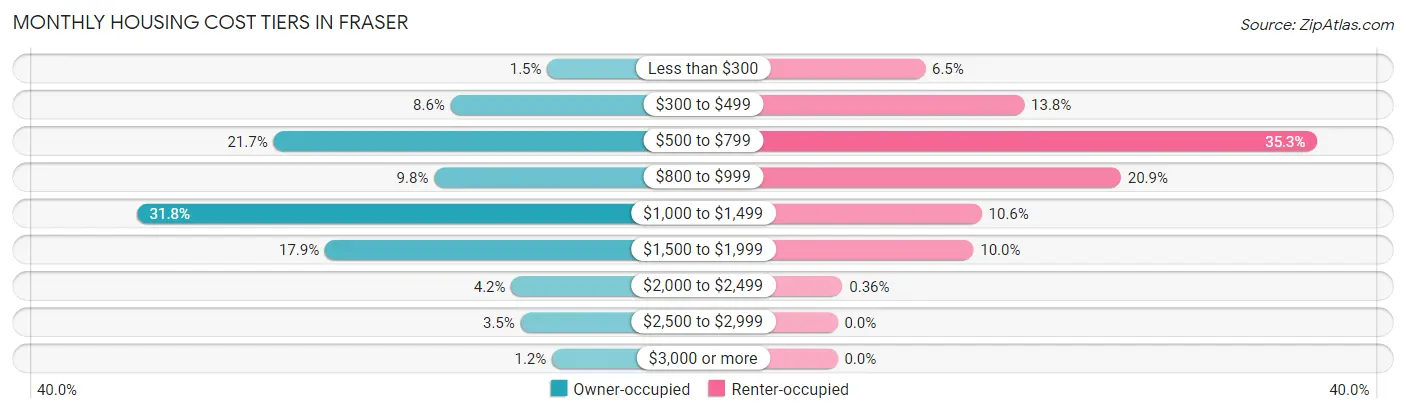
| Monthly Cost | Owner-occupied | Renter-occupied |
| Less than $300 | 73 (1.5%) | 107 (6.5%) |
| $300 to $499 | 420 (8.6%) | 228 (13.8%) |
| $500 to $799 | 1,056 (21.7%) | 586 (35.3%) |
| $800 to $999 | 479 (9.8%) | 346 (20.9%) |
| $1,000 to $1,499 | 1,547 (31.8%) | 176 (10.6%) |
| $1,500 to $1,999 | 871 (17.9%) | 166 (10.0%) |
| $2,000 to $2,499 | 202 (4.2%) | 6 (0.4%) |
| $2,500 to $2,999 | 169 (3.5%) | 0 (0.0%) |
| $3,000 or more | 56 (1.1%) | 0 (0.0%) |
| Total | 4,873 (100.0%) | 1,658 (100.0%) |
Physical Housing Characteristics in Fraser
Housing Structures in Fraser
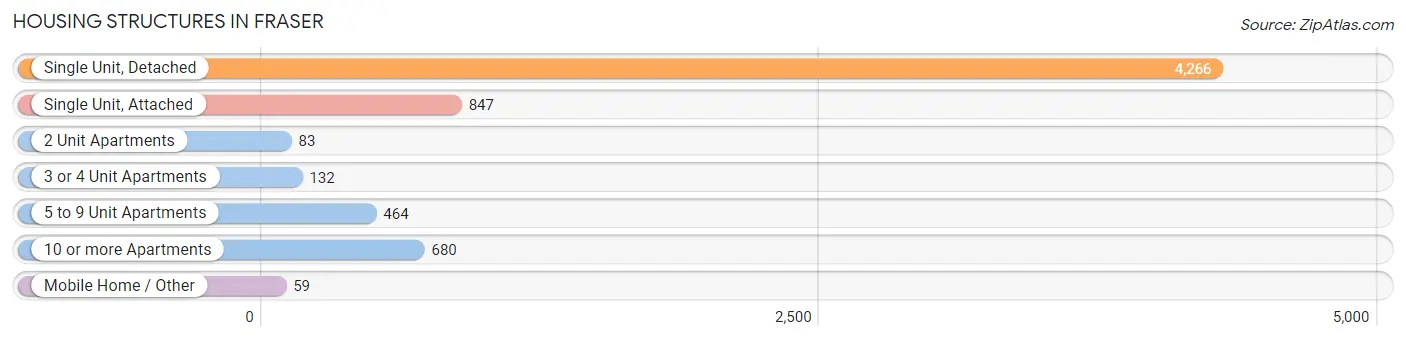
| Structure Type | # Housing Units | % Housing Units |
| Single Unit, Detached | 4,266 | 65.3% |
| Single Unit, Attached | 847 | 13.0% |
| 2 Unit Apartments | 83 | 1.3% |
| 3 or 4 Unit Apartments | 132 | 2.0% |
| 5 to 9 Unit Apartments | 464 | 7.1% |
| 10 or more Apartments | 680 | 10.4% |
| Mobile Home / Other | 59 | 0.9% |
| Total | 6,531 | 100.0% |
Housing Structures by Occupancy in Fraser
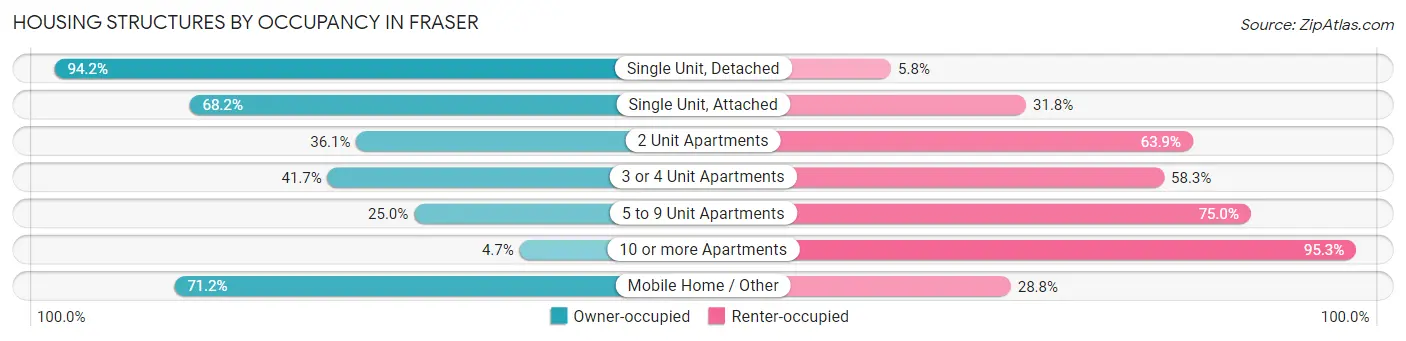
| Structure Type | Owner-occupied | Renter-occupied |
| Single Unit, Detached | 4,020 (94.2%) | 246 (5.8%) |
| Single Unit, Attached | 578 (68.2%) | 269 (31.8%) |
| 2 Unit Apartments | 30 (36.1%) | 53 (63.9%) |
| 3 or 4 Unit Apartments | 55 (41.7%) | 77 (58.3%) |
| 5 to 9 Unit Apartments | 116 (25.0%) | 348 (75.0%) |
| 10 or more Apartments | 32 (4.7%) | 648 (95.3%) |
| Mobile Home / Other | 42 (71.2%) | 17 (28.8%) |
| Total | 4,873 (74.6%) | 1,658 (25.4%) |
Housing Structures by Number of Rooms in Fraser
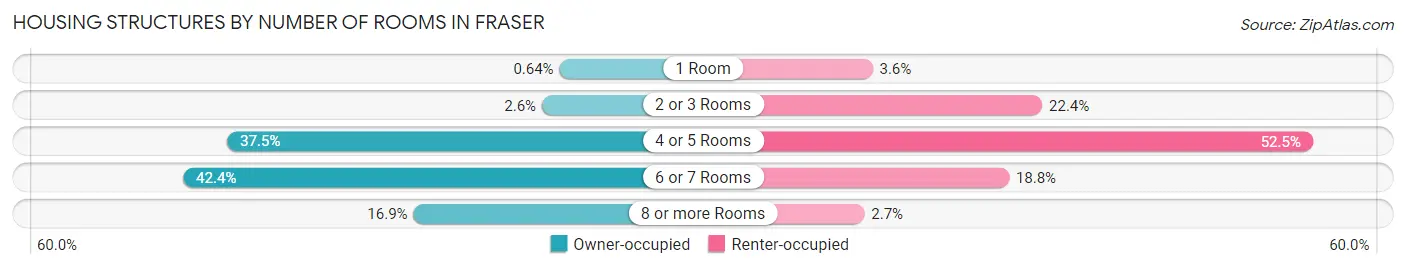
| Number of Rooms | Owner-occupied | Renter-occupied |
| 1 Room | 31 (0.6%) | 60 (3.6%) |
| 2 or 3 Rooms | 126 (2.6%) | 372 (22.4%) |
| 4 or 5 Rooms | 1,829 (37.5%) | 870 (52.5%) |
| 6 or 7 Rooms | 2,066 (42.4%) | 311 (18.8%) |
| 8 or more Rooms | 821 (16.9%) | 45 (2.7%) |
| Total | 4,873 (100.0%) | 1,658 (100.0%) |
Housing Structure by Heating Type in Fraser
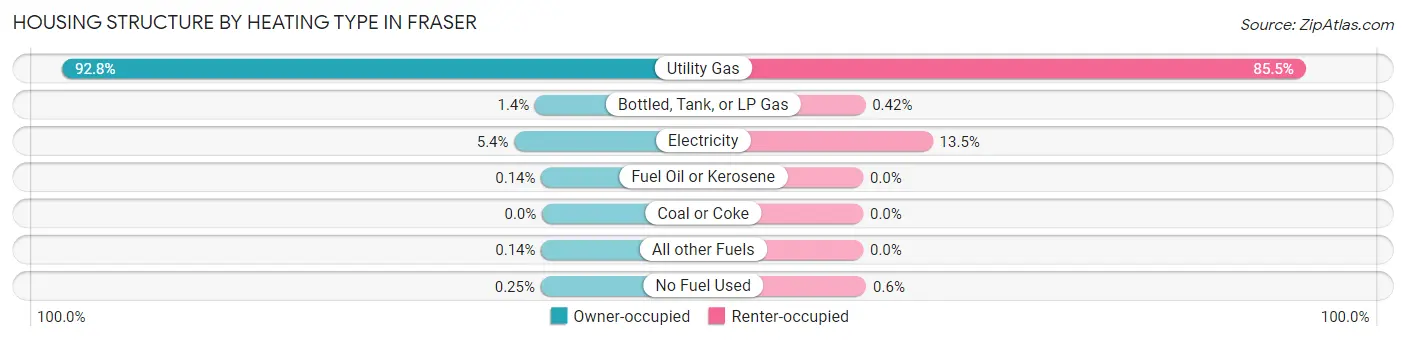
| Heating Type | Owner-occupied | Renter-occupied |
| Utility Gas | 4,520 (92.8%) | 1,418 (85.5%) |
| Bottled, Tank, or LP Gas | 66 (1.3%) | 7 (0.4%) |
| Electricity | 261 (5.4%) | 223 (13.5%) |
| Fuel Oil or Kerosene | 7 (0.1%) | 0 (0.0%) |
| Coal or Coke | 0 (0.0%) | 0 (0.0%) |
| All other Fuels | 7 (0.1%) | 0 (0.0%) |
| No Fuel Used | 12 (0.3%) | 10 (0.6%) |
| Total | 4,873 (100.0%) | 1,658 (100.0%) |
Household Vehicle Usage in Fraser
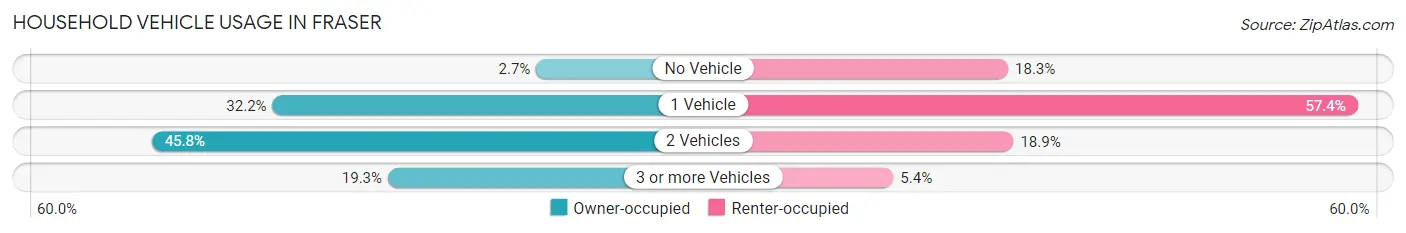
| Vehicles per Household | Owner-occupied | Renter-occupied |
| No Vehicle | 131 (2.7%) | 303 (18.3%) |
| 1 Vehicle | 1,571 (32.2%) | 952 (57.4%) |
| 2 Vehicles | 2,230 (45.8%) | 313 (18.9%) |
| 3 or more Vehicles | 941 (19.3%) | 90 (5.4%) |
| Total | 4,873 (100.0%) | 1,658 (100.0%) |
Real Estate & Mortgages in Fraser
Real Estate and Mortgage Overview in Fraser
| Characteristic | Without Mortgage | With Mortgage |
| Housing Units | 1,701 | 3,172 |
| Median Property Value | $178,900 | $178,900 |
| Median Household Income | $59,782 | $546 |
| Monthly Housing Costs | $653 | $56 |
| Real Estate Taxes | $3,361 | $110 |
Property Value by Mortgage Status in Fraser
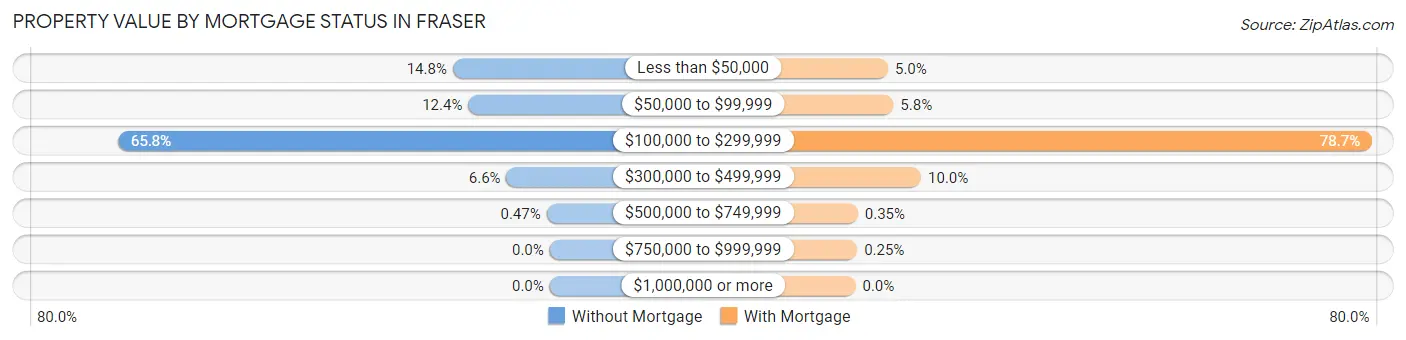
| Property Value | Without Mortgage | With Mortgage |
| Less than $50,000 | 251 (14.8%) | 157 (5.0%) |
| $50,000 to $99,999 | 211 (12.4%) | 183 (5.8%) |
| $100,000 to $299,999 | 1,119 (65.8%) | 2,496 (78.7%) |
| $300,000 to $499,999 | 112 (6.6%) | 317 (10.0%) |
| $500,000 to $749,999 | 8 (0.5%) | 11 (0.4%) |
| $750,000 to $999,999 | 0 (0.0%) | 8 (0.3%) |
| $1,000,000 or more | 0 (0.0%) | 0 (0.0%) |
| Total | 1,701 (100.0%) | 3,172 (100.0%) |
Household Income by Mortgage Status in Fraser
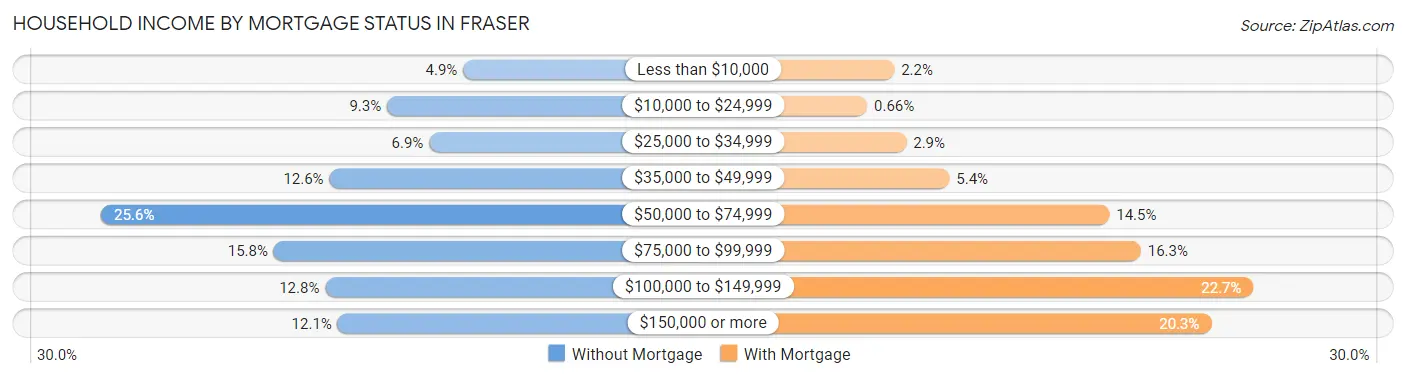
| Household Income | Without Mortgage | With Mortgage |
| Less than $10,000 | 84 (4.9%) | 70 (2.2%) |
| $10,000 to $24,999 | 158 (9.3%) | 21 (0.7%) |
| $25,000 to $34,999 | 117 (6.9%) | 92 (2.9%) |
| $35,000 to $49,999 | 214 (12.6%) | 170 (5.4%) |
| $50,000 to $74,999 | 436 (25.6%) | 460 (14.5%) |
| $75,000 to $99,999 | 268 (15.8%) | 517 (16.3%) |
| $100,000 to $149,999 | 218 (12.8%) | 721 (22.7%) |
| $150,000 or more | 206 (12.1%) | 645 (20.3%) |
| Total | 1,701 (100.0%) | 3,172 (100.0%) |
Property Value to Household Income Ratio in Fraser
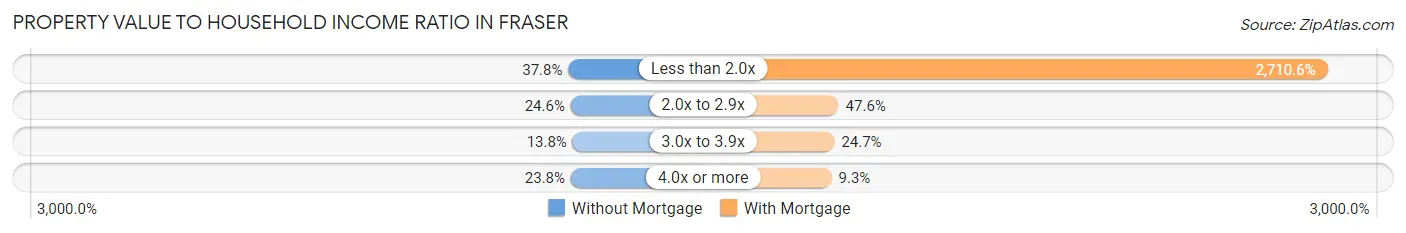
| Value-to-Income Ratio | Without Mortgage | With Mortgage |
| Less than 2.0x | 643 (37.8%) | 85,980 (2,710.6%) |
| 2.0x to 2.9x | 418 (24.6%) | 1,509 (47.6%) |
| 3.0x to 3.9x | 235 (13.8%) | 784 (24.7%) |
| 4.0x or more | 405 (23.8%) | 294 (9.3%) |
| Total | 1,701 (100.0%) | 3,172 (100.0%) |
Real Estate Taxes by Mortgage Status in Fraser
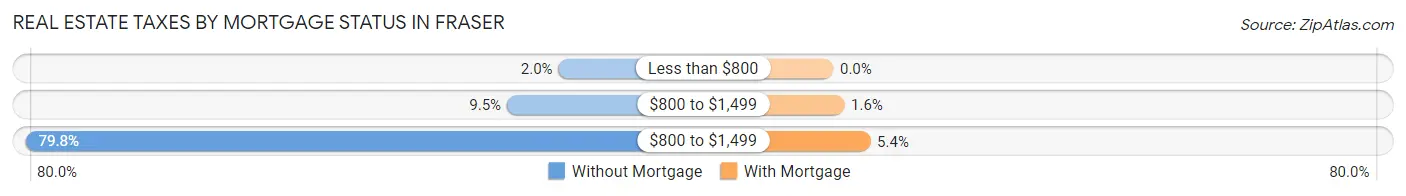
| Property Taxes | Without Mortgage | With Mortgage |
| Less than $800 | 34 (2.0%) | 0 (0.0%) |
| $800 to $1,499 | 162 (9.5%) | 51 (1.6%) |
| $800 to $1,499 | 1,358 (79.8%) | 172 (5.4%) |
| Total | 1,701 (100.0%) | 3,172 (100.0%) |
Health & Disability in Fraser
Health Insurance Coverage by Age in Fraser
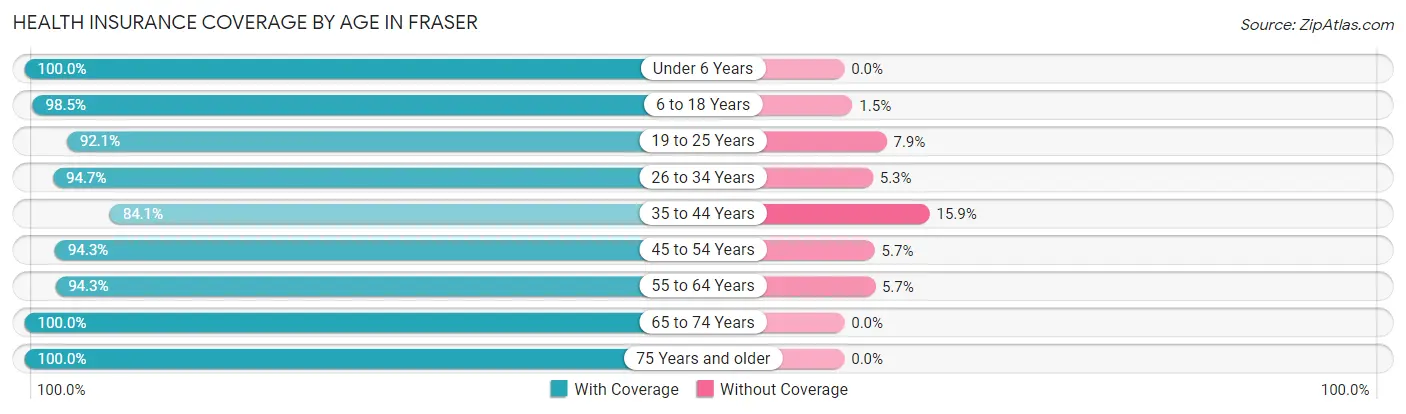
| Age Bracket | With Coverage | Without Coverage |
| Under 6 Years | 968 (100.0%) | 0 (0.0%) |
| 6 to 18 Years | 1,830 (98.5%) | 28 (1.5%) |
| 19 to 25 Years | 1,181 (92.1%) | 101 (7.9%) |
| 26 to 34 Years | 1,926 (94.7%) | 108 (5.3%) |
| 35 to 44 Years | 1,296 (84.1%) | 245 (15.9%) |
| 45 to 54 Years | 1,801 (94.3%) | 108 (5.7%) |
| 55 to 64 Years | 1,979 (94.3%) | 120 (5.7%) |
| 65 to 74 Years | 1,781 (100.0%) | 0 (0.0%) |
| 75 Years and older | 1,076 (100.0%) | 0 (0.0%) |
| Total | 13,838 (95.1%) | 710 (4.9%) |
Health Insurance Coverage by Citizenship Status in Fraser
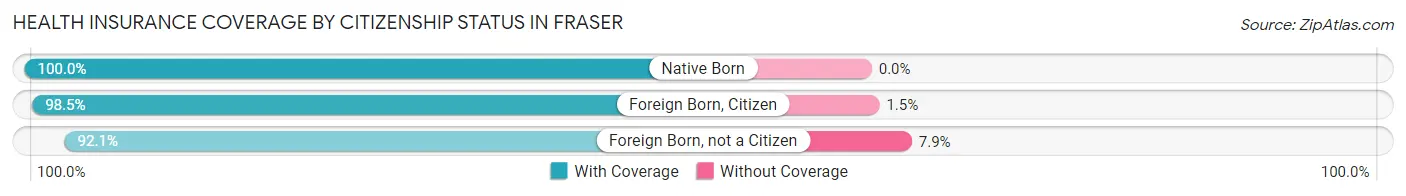
| Citizenship Status | With Coverage | Without Coverage |
| Native Born | 968 (100.0%) | 0 (0.0%) |
| Foreign Born, Citizen | 1,830 (98.5%) | 28 (1.5%) |
| Foreign Born, not a Citizen | 1,181 (92.1%) | 101 (7.9%) |
Health Insurance Coverage by Household Income in Fraser
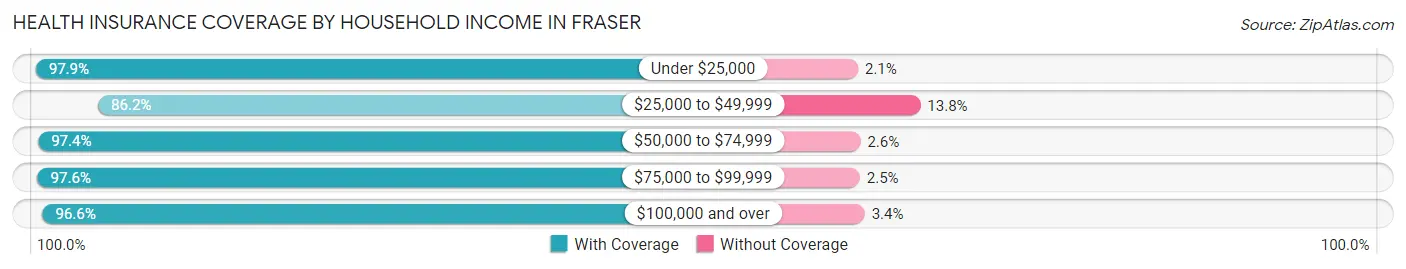
| Household Income | With Coverage | Without Coverage |
| Under $25,000 | 1,485 (97.9%) | 32 (2.1%) |
| $25,000 to $49,999 | 2,307 (86.2%) | 369 (13.8%) |
| $50,000 to $74,999 | 2,363 (97.4%) | 62 (2.6%) |
| $75,000 to $99,999 | 2,712 (97.6%) | 68 (2.5%) |
| $100,000 and over | 4,945 (96.6%) | 172 (3.4%) |
Public vs Private Health Insurance Coverage by Age in Fraser
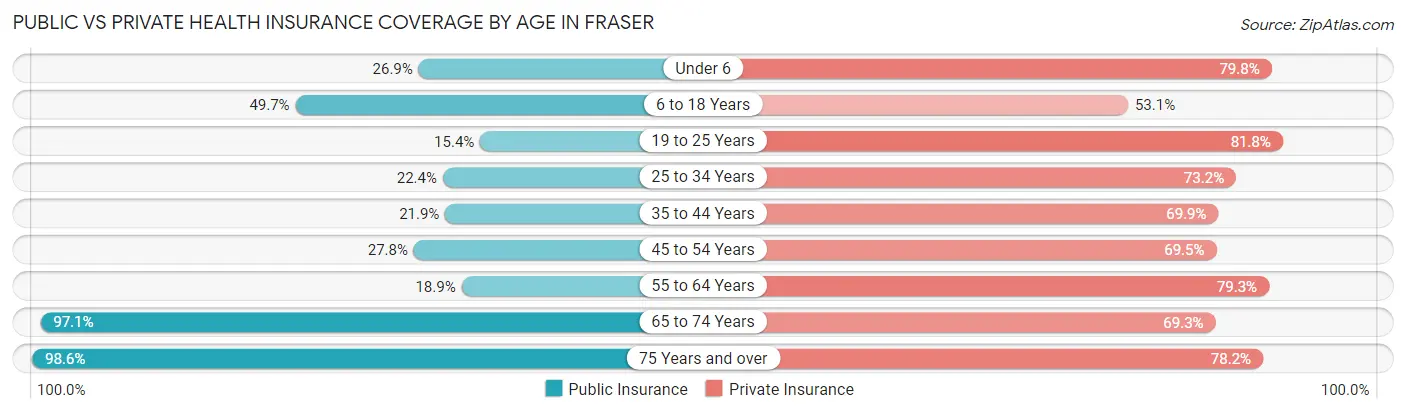
| Age Bracket | Public Insurance | Private Insurance |
| Under 6 | 260 (26.9%) | 772 (79.7%) |
| 6 to 18 Years | 924 (49.7%) | 987 (53.1%) |
| 19 to 25 Years | 198 (15.4%) | 1,049 (81.8%) |
| 25 to 34 Years | 455 (22.4%) | 1,488 (73.2%) |
| 35 to 44 Years | 338 (21.9%) | 1,077 (69.9%) |
| 45 to 54 Years | 530 (27.8%) | 1,327 (69.5%) |
| 55 to 64 Years | 397 (18.9%) | 1,664 (79.3%) |
| 65 to 74 Years | 1,729 (97.1%) | 1,235 (69.3%) |
| 75 Years and over | 1,061 (98.6%) | 841 (78.2%) |
| Total | 5,892 (40.5%) | 10,440 (71.8%) |
Disability Status by Sex by Age in Fraser
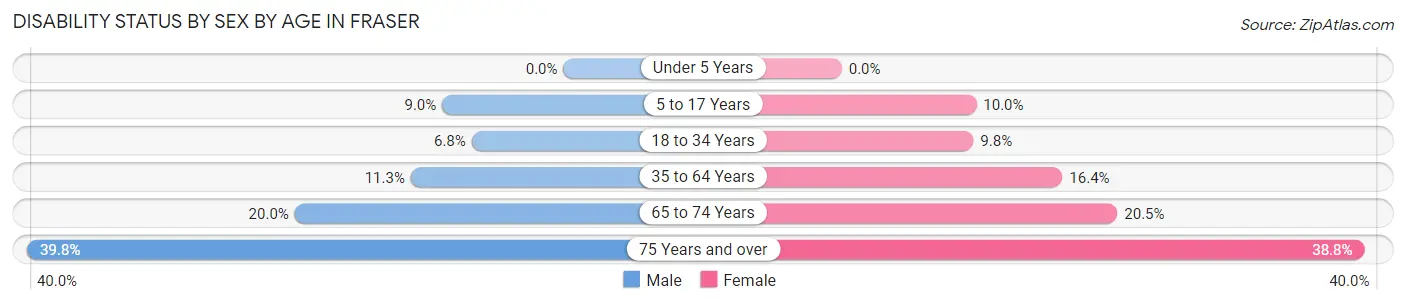
| Age Bracket | Male | Female |
| Under 5 Years | 0 (0.0%) | 0 (0.0%) |
| 5 to 17 Years | 82 (9.0%) | 92 (10.0%) |
| 18 to 34 Years | 118 (6.8%) | 165 (9.8%) |
| 35 to 64 Years | 278 (11.3%) | 507 (16.4%) |
| 65 to 74 Years | 175 (20.0%) | 185 (20.5%) |
| 75 Years and over | 178 (39.8%) | 244 (38.8%) |
Disability Class by Sex by Age in Fraser
Disability Class: Hearing Difficulty
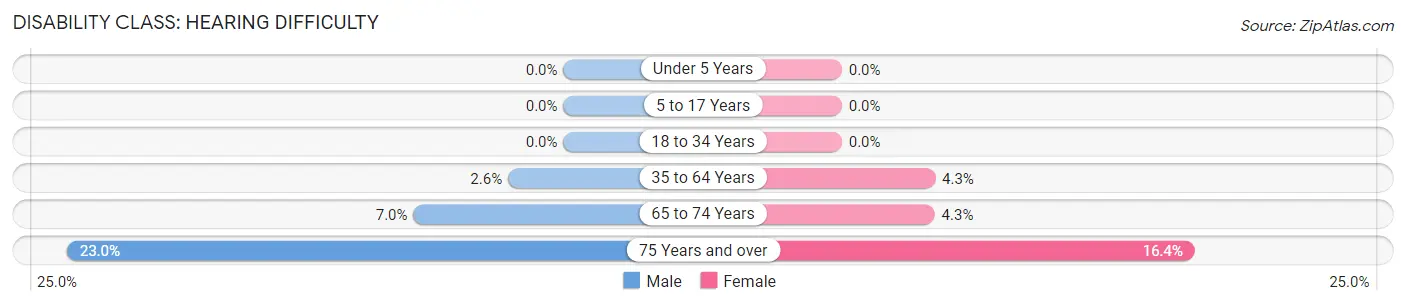
| Age Bracket | Male | Female |
| Under 5 Years | 0 (0.0%) | 0 (0.0%) |
| 5 to 17 Years | 0 (0.0%) | 0 (0.0%) |
| 18 to 34 Years | 0 (0.0%) | 0 (0.0%) |
| 35 to 64 Years | 63 (2.6%) | 134 (4.3%) |
| 65 to 74 Years | 61 (7.0%) | 39 (4.3%) |
| 75 Years and over | 103 (23.0%) | 103 (16.4%) |
Disability Class: Vision Difficulty
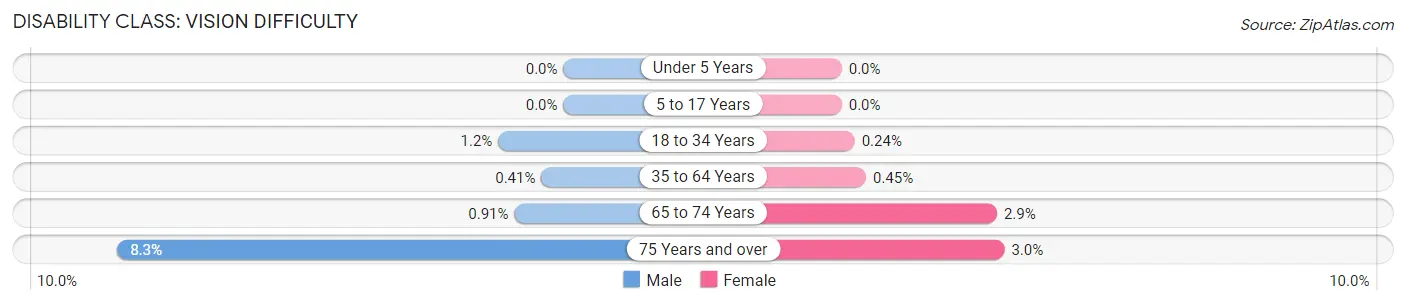
| Age Bracket | Male | Female |
| Under 5 Years | 0 (0.0%) | 0 (0.0%) |
| 5 to 17 Years | 0 (0.0%) | 0 (0.0%) |
| 18 to 34 Years | 21 (1.2%) | 4 (0.2%) |
| 35 to 64 Years | 10 (0.4%) | 14 (0.4%) |
| 65 to 74 Years | 8 (0.9%) | 26 (2.9%) |
| 75 Years and over | 37 (8.3%) | 19 (3.0%) |
Disability Class: Cognitive Difficulty
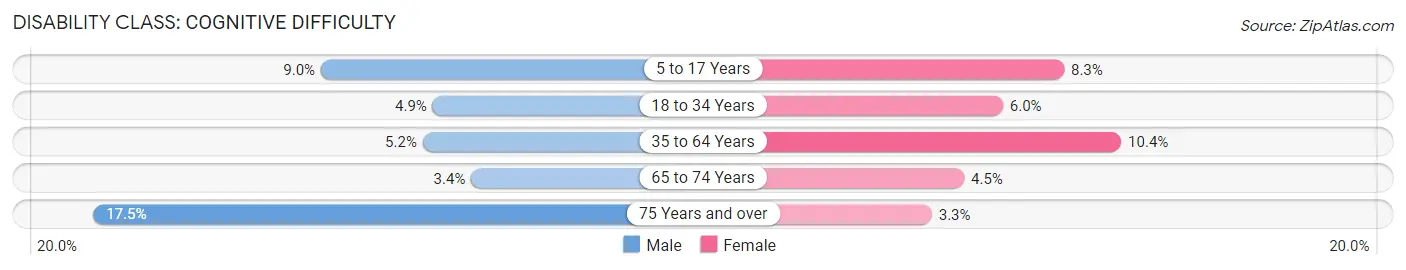
| Age Bracket | Male | Female |
| 5 to 17 Years | 82 (9.0%) | 76 (8.3%) |
| 18 to 34 Years | 84 (4.9%) | 101 (6.0%) |
| 35 to 64 Years | 128 (5.2%) | 321 (10.4%) |
| 65 to 74 Years | 30 (3.4%) | 41 (4.5%) |
| 75 Years and over | 78 (17.4%) | 21 (3.3%) |
Disability Class: Ambulatory Difficulty
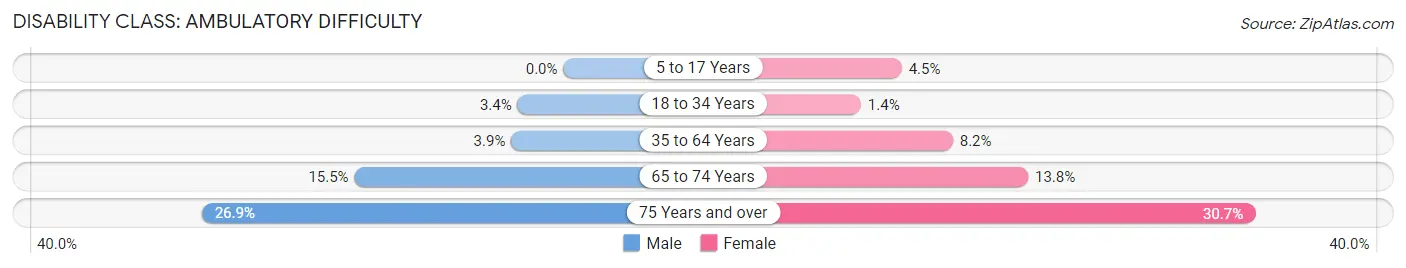
| Age Bracket | Male | Female |
| 5 to 17 Years | 0 (0.0%) | 41 (4.4%) |
| 18 to 34 Years | 59 (3.4%) | 24 (1.4%) |
| 35 to 64 Years | 95 (3.9%) | 255 (8.2%) |
| 65 to 74 Years | 136 (15.5%) | 125 (13.8%) |
| 75 Years and over | 120 (26.9%) | 193 (30.7%) |
Disability Class: Self-Care Difficulty
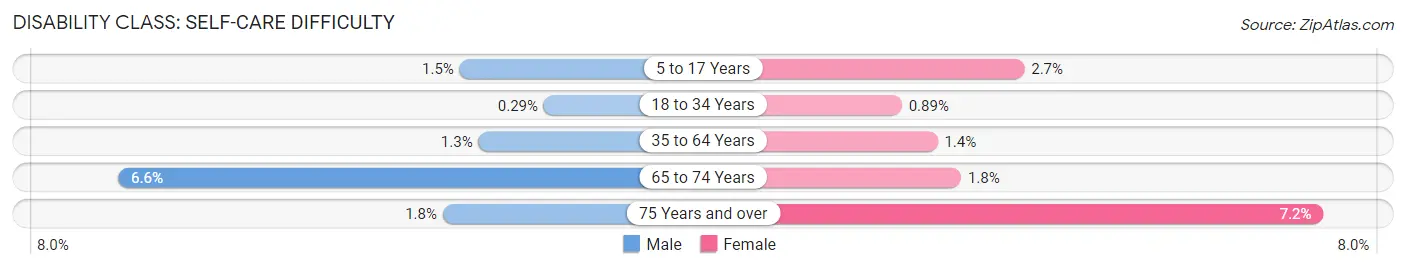
| Age Bracket | Male | Female |
| 5 to 17 Years | 14 (1.5%) | 25 (2.7%) |
| 18 to 34 Years | 5 (0.3%) | 15 (0.9%) |
| 35 to 64 Years | 31 (1.3%) | 44 (1.4%) |
| 65 to 74 Years | 58 (6.6%) | 16 (1.8%) |
| 75 Years and over | 8 (1.8%) | 45 (7.1%) |
Technology Access in Fraser
Computing Device Access in Fraser
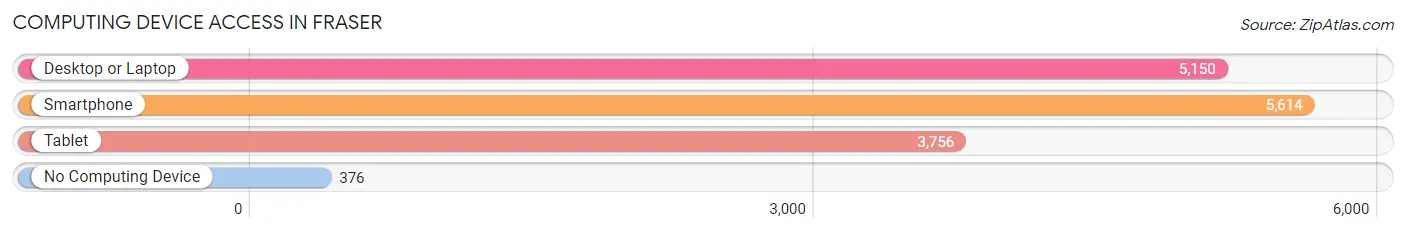
| Device Type | # Households | % Households |
| Desktop or Laptop | 5,150 | 78.8% |
| Smartphone | 5,614 | 86.0% |
| Tablet | 3,756 | 57.5% |
| No Computing Device | 376 | 5.8% |
| Total | 6,531 | 100.0% |
Internet Access in Fraser
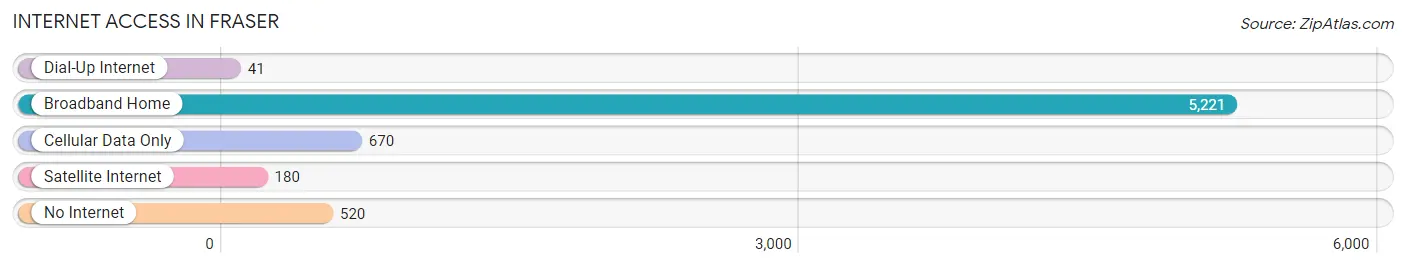
| Internet Type | # Households | % Households |
| Dial-Up Internet | 41 | 0.6% |
| Broadband Home | 5,221 | 79.9% |
| Cellular Data Only | 670 | 10.3% |
| Satellite Internet | 180 | 2.8% |
| No Internet | 520 | 8.0% |
| Total | 6,531 | 100.0% |
Fraser Summary
Fraser, Michigan is a small city located in Macomb County, Michigan. It is situated just north of Detroit and is part of the Metro Detroit area. The city has a population of 14,480 as of the 2010 census.
History
The area that is now Fraser was first settled in 1818 by a man named John Fraser. He was a Scottish immigrant who had come to the area to work in the lumber industry. He eventually purchased a large tract of land and built a sawmill. The area was known as Fraser’s Mill until 1836 when it was officially incorporated as the Village of Fraser.
In the late 19th century, Fraser became a popular summer resort destination for wealthy Detroiters. The city was home to several large resorts, including the Fraser Hotel, which was built in 1891. The city also had a large amusement park, which was popular with visitors.
In the early 20th century, Fraser began to experience a population boom as Detroiters moved to the area to escape the city’s industrial pollution. The city was officially incorporated as a city in 1953.
Geography
Fraser is located in Macomb County, Michigan. It is situated just north of Detroit and is part of the Metro Detroit area. The city has a total area of 4.2 square miles, all of which is land.
The city is bordered by the cities of Warren and Sterling Heights to the north, Clinton Township to the east, and Roseville to the south. The city is also bordered by the Clinton River to the west.
Economy
The economy of Fraser is largely based on the automotive industry. The city is home to several automotive suppliers, including Magna International, which is one of the largest automotive suppliers in the world. The city is also home to several other manufacturing companies, including a steel mill and a plastics factory.
The city is also home to several retail stores, including a Walmart Supercenter and a Meijer. The city also has several restaurants, including several fast food chains.
Demographics
As of the 2010 census, the population of Fraser was 14,480. The racial makeup of the city was 87.3% White, 6.2% African American, 0.5% Native American, 1.7% Asian, 0.1% Pacific Islander, and 3.2% from other races. Hispanic or Latino of any race were 4.3% of the population.
The median household income in Fraser was $50,945, and the median family income was $60,945. The per capita income for the city was $25,945. About 8.3% of families and 10.2% of the population were below the poverty line, including 14.2% of those under age 18 and 6.2% of those age 65 or over.
Common Questions
What is Per Capita Income in Fraser?
Per Capita income in Fraser is $37,422.
What is the Median Family Income in Fraser?
Median Family Income in Fraser is $79,250.
What is the Median Household income in Fraser?
Median Household Income in Fraser is $61,039.
What is Income or Wage Gap in Fraser?
Income or Wage Gap in Fraser is 29.1%.
Women in Fraser earn 70.9 cents for every dollar earned by a man.
What is Inequality or Gini Index in Fraser?
Inequality or Gini Index in Fraser is 0.44.
What is the Total Population of Fraser?
Total Population of Fraser is 14,668.
What is the Total Male Population of Fraser?
Total Male Population of Fraser is 6,904.
What is the Total Female Population of Fraser?
Total Female Population of Fraser is 7,764.
What is the Ratio of Males per 100 Females in Fraser?
There are 88.92 Males per 100 Females in Fraser.
What is the Ratio of Females per 100 Males in Fraser?
There are 112.46 Females per 100 Males in Fraser.
What is the Median Population Age in Fraser?
Median Population Age in Fraser is 41.9 Years.
What is the Average Family Size in Fraser
Average Family Size in Fraser is 2.8 People.
What is the Average Household Size in Fraser
Average Household Size in Fraser is 2.2 People.
How Large is the Labor Force in Fraser?
There are 7,936 People in the Labor Forcein in Fraser.
What is the Percentage of People in the Labor Force in Fraser?
64.9% of People are in the Labor Force in Fraser.
What is the Unemployment Rate in Fraser?
Unemployment Rate in Fraser is 4.8%.