Buda, TX Map & Demographics
Buda Map
Buda Overview
$43,280
PER CAPITA INCOME
$116,922
AVG FAMILY INCOME
$105,378
AVG HOUSEHOLD INCOME
23.6%
WAGE / INCOME GAP [ % ]
76.4¢/ $1
WAGE / INCOME GAP [ $ ]
0.38
INEQUALITY / GINI INDEX
14,997
TOTAL POPULATION
7,784
MALE POPULATION
7,213
FEMALE POPULATION
107.92
MALES / 100 FEMALES
92.66
FEMALES / 100 MALES
36.8
MEDIAN AGE
3.1
AVG FAMILY SIZE
2.6
AVG HOUSEHOLD SIZE
7,899
LABOR FORCE [ PEOPLE ]
71.5%
PERCENT IN LABOR FORCE
3.6%
UNEMPLOYMENT RATE
Buda Zip Codes
Income in Buda
Income Overview in Buda
Per Capita Income in Buda is $43,280, while median incomes of families and households are $116,922 and $105,378 respectively.
| Characteristic | Number | Measure |
| Per Capita Income | 14,997 | $43,280 |
| Median Family Income | 4,164 | $116,922 |
| Mean Family Income | 4,164 | $128,157 |
| Median Household Income | 5,695 | $105,378 |
| Mean Household Income | 5,695 | $112,987 |
| Income Deficit | 4,164 | $0 |
| Wage / Income Gap (%) | 14,997 | 23.60% |
| Wage / Income Gap ($) | 14,997 | 76.40¢ per $1 |
| Gini / Inequality Index | 14,997 | 0.38 |
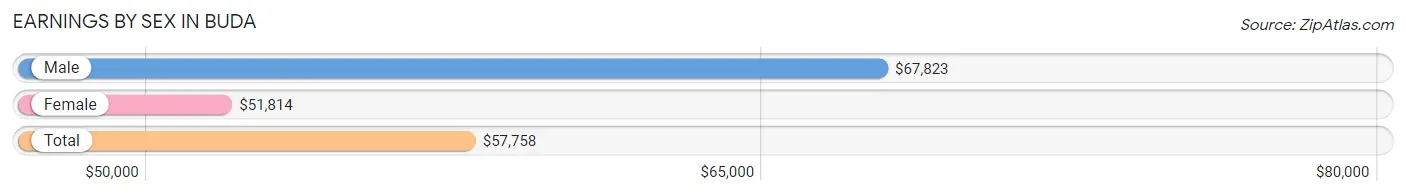
Earnings by Sex in Buda
Average Earnings in Buda are $57,758, $67,823 for men and $51,814 for women, a difference of 23.6%.
| Sex | Number | Average Earnings |
| Male | 4,420 (54.6%) | $67,823 |
| Female | 3,676 (45.4%) | $51,814 |
| Total | 8,096 (100.0%) | $57,758 |
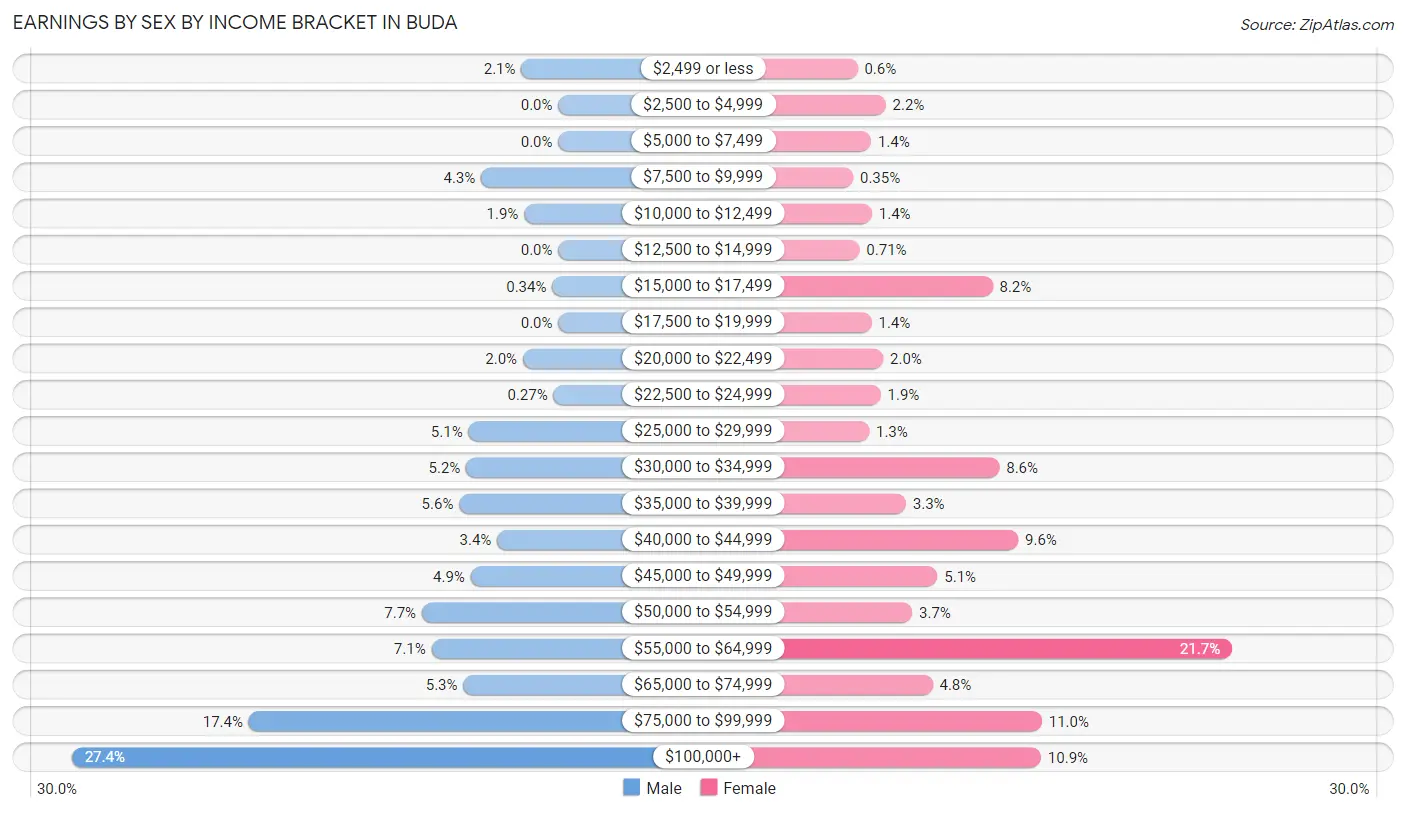
Earnings by Sex by Income Bracket in Buda
The most common earnings brackets in Buda are $100,000+ for men (1,209 | 27.4%) and $55,000 to $64,999 for women (796 | 21.6%).
| Income | Male | Female |
| $2,499 or less | 92 (2.1%) | 22 (0.6%) |
| $2,500 to $4,999 | 0 (0.0%) | 80 (2.2%) |
| $5,000 to $7,499 | 0 (0.0%) | 50 (1.4%) |
| $7,500 to $9,999 | 192 (4.3%) | 13 (0.4%) |
| $10,000 to $12,499 | 85 (1.9%) | 52 (1.4%) |
| $12,500 to $14,999 | 0 (0.0%) | 26 (0.7%) |
| $15,000 to $17,499 | 15 (0.3%) | 301 (8.2%) |
| $17,500 to $19,999 | 0 (0.0%) | 51 (1.4%) |
| $20,000 to $22,499 | 88 (2.0%) | 75 (2.0%) |
| $22,500 to $24,999 | 12 (0.3%) | 70 (1.9%) |
| $25,000 to $29,999 | 223 (5.1%) | 46 (1.3%) |
| $30,000 to $34,999 | 229 (5.2%) | 315 (8.6%) |
| $35,000 to $39,999 | 246 (5.6%) | 122 (3.3%) |
| $40,000 to $44,999 | 152 (3.4%) | 354 (9.6%) |
| $45,000 to $49,999 | 218 (4.9%) | 187 (5.1%) |
| $50,000 to $54,999 | 339 (7.7%) | 135 (3.7%) |
| $55,000 to $64,999 | 315 (7.1%) | 796 (21.6%) |
| $65,000 to $74,999 | 236 (5.3%) | 177 (4.8%) |
| $75,000 to $99,999 | 769 (17.4%) | 403 (11.0%) |
| $100,000+ | 1,209 (27.4%) | 401 (10.9%) |
| Total | 4,420 (100.0%) | 3,676 (100.0%) |
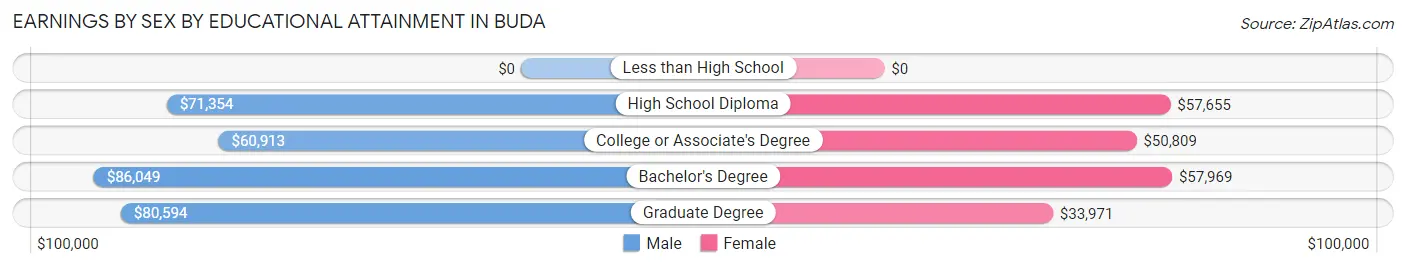
Earnings by Sex by Educational Attainment in Buda
Average earnings in Buda are $75,543 for men and $54,659 for women, a difference of 27.7%. Men with an educational attainment of bachelor's degree enjoy the highest average annual earnings of $86,049, while those with college or associate's degree education earn the least with $60,913. Women with an educational attainment of bachelor's degree earn the most with the average annual earnings of $57,969, while those with graduate degree education have the smallest earnings of $33,971.
| Educational Attainment | Male Income | Female Income |
| Less than High School | - | - |
| High School Diploma | $71,354 | $57,655 |
| College or Associate's Degree | $60,913 | $50,809 |
| Bachelor's Degree | $86,049 | $57,969 |
| Graduate Degree | $80,594 | $33,971 |
| Total | $75,543 | $54,659 |
Family Income in Buda
Family Income Brackets in Buda
According to the Buda family income data, there are 1,366 families falling into the $100,000 to $149,999 income range, which is the most common income bracket and makes up 32.8% of all families.
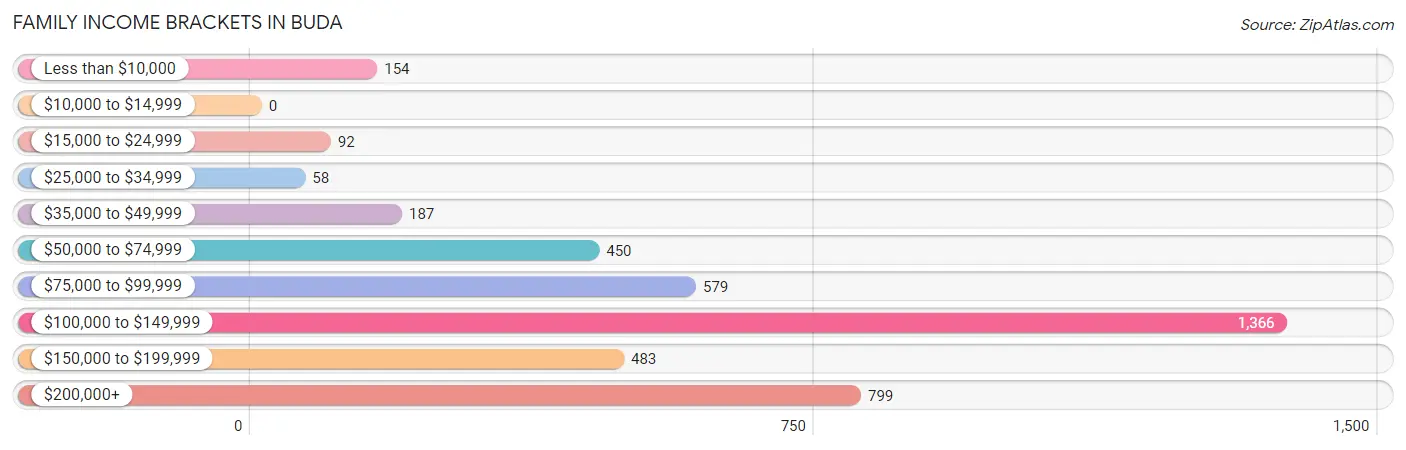
| Income Bracket | # Families | % Families |
| Less than $10,000 | 154 | 3.7% |
| $10,000 to $14,999 | 0 | 0.0% |
| $15,000 to $24,999 | 92 | 2.2% |
| $25,000 to $34,999 | 58 | 1.4% |
| $35,000 to $49,999 | 187 | 4.5% |
| $50,000 to $74,999 | 450 | 10.8% |
| $75,000 to $99,999 | 579 | 13.9% |
| $100,000 to $149,999 | 1,366 | 32.8% |
| $150,000 to $199,999 | 483 | 11.6% |
| $200,000+ | 799 | 19.2% |
Family Income by Famaliy Size in Buda
5-person families (240 | 5.8%) account for the highest median family income in Buda with $215,300 per family, while 2-person families (1,442 | 34.6%) have the highest median income of $57,728 per family member.
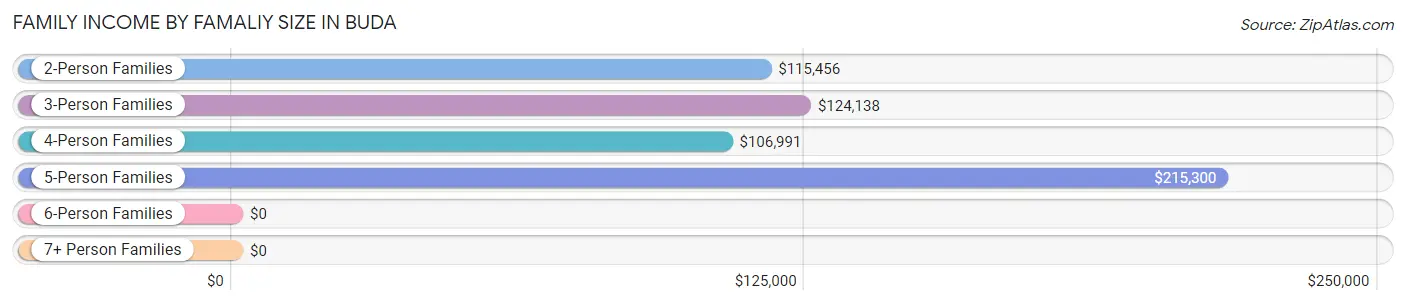
| Income Bracket | # Families | Median Income |
| 2-Person Families | 1,442 (34.6%) | $115,456 |
| 3-Person Families | 1,098 (26.4%) | $124,138 |
| 4-Person Families | 1,335 (32.1%) | $106,991 |
| 5-Person Families | 240 (5.8%) | $215,300 |
| 6-Person Families | 49 (1.2%) | $0 |
| 7+ Person Families | 0 (0.0%) | $0 |
| Total | 4,164 (100.0%) | $116,922 |
Family Income by Number of Earners in Buda
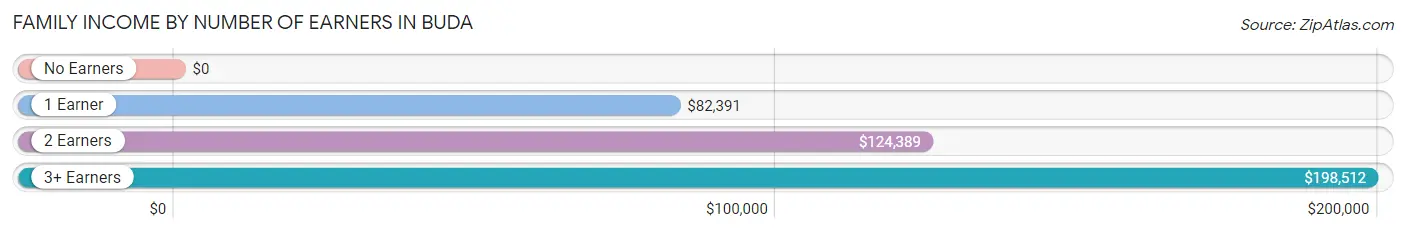
| Number of Earners | # Families | Median Income |
| No Earners | 388 (9.3%) | $0 |
| 1 Earner | 1,182 (28.4%) | $82,391 |
| 2 Earners | 2,351 (56.5%) | $124,389 |
| 3+ Earners | 243 (5.8%) | $198,512 |
| Total | 4,164 (100.0%) | $116,922 |
Household Income in Buda
Household Income Brackets in Buda
With 1,646 households falling in the category, the $100,000 to $149,999 income range is the most frequent in Buda, accounting for 28.9% of all households. In contrast, only 57 households (1.0%) fall into the $25,000 to $34,999 income bracket, making it the least populous group.
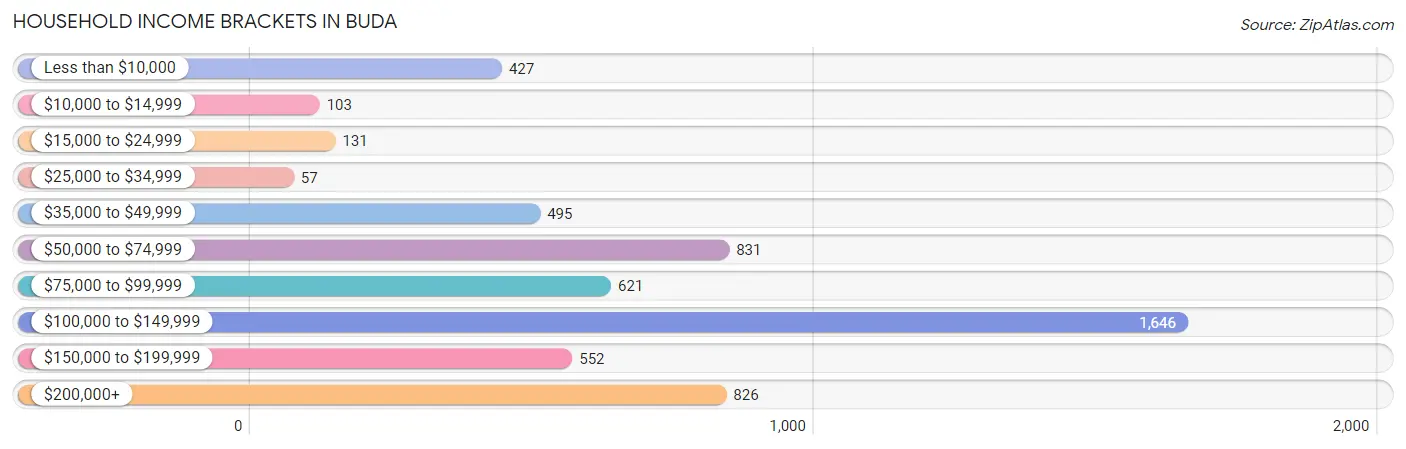
| Income Bracket | # Households | % Households |
| Less than $10,000 | 427 | 7.5% |
| $10,000 to $14,999 | 103 | 1.8% |
| $15,000 to $24,999 | 131 | 2.3% |
| $25,000 to $34,999 | 57 | 1.0% |
| $35,000 to $49,999 | 495 | 8.7% |
| $50,000 to $74,999 | 831 | 14.6% |
| $75,000 to $99,999 | 621 | 10.9% |
| $100,000 to $149,999 | 1,646 | 28.9% |
| $150,000 to $199,999 | 552 | 9.7% |
| $200,000+ | 826 | 14.5% |
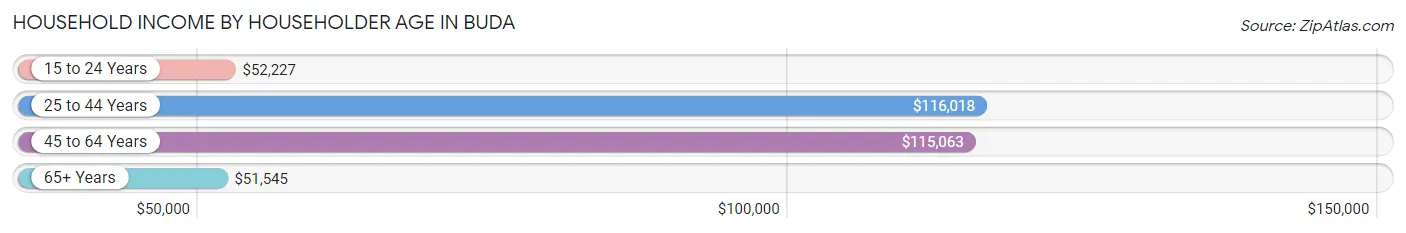
Household Income by Householder Age in Buda
The median household income in Buda is $105,378, with the highest median household income of $116,018 found in the 25 to 44 years age bracket for the primary householder. A total of 2,430 households (42.7%) fall into this category. Meanwhile, the 65+ years age bracket for the primary householder has the lowest median household income of $51,545, with 942 households (16.5%) in this group.
| Income Bracket | # Households | Median Income |
| 15 to 24 Years | 119 (2.1%) | $52,227 |
| 25 to 44 Years | 2,430 (42.7%) | $116,018 |
| 45 to 64 Years | 2,204 (38.7%) | $115,063 |
| 65+ Years | 942 (16.5%) | $51,545 |
| Total | 5,695 (100.0%) | $105,378 |
Poverty in Buda
Income Below Poverty by Sex and Age in Buda
With 7.3% poverty level for males and 8.4% for females among the residents of Buda, 25 to 34 year old males and 65 to 74 year old females are the most vulnerable to poverty, with 160 males (22.1%) and 138 females (18.8%) in their respective age groups living below the poverty level.
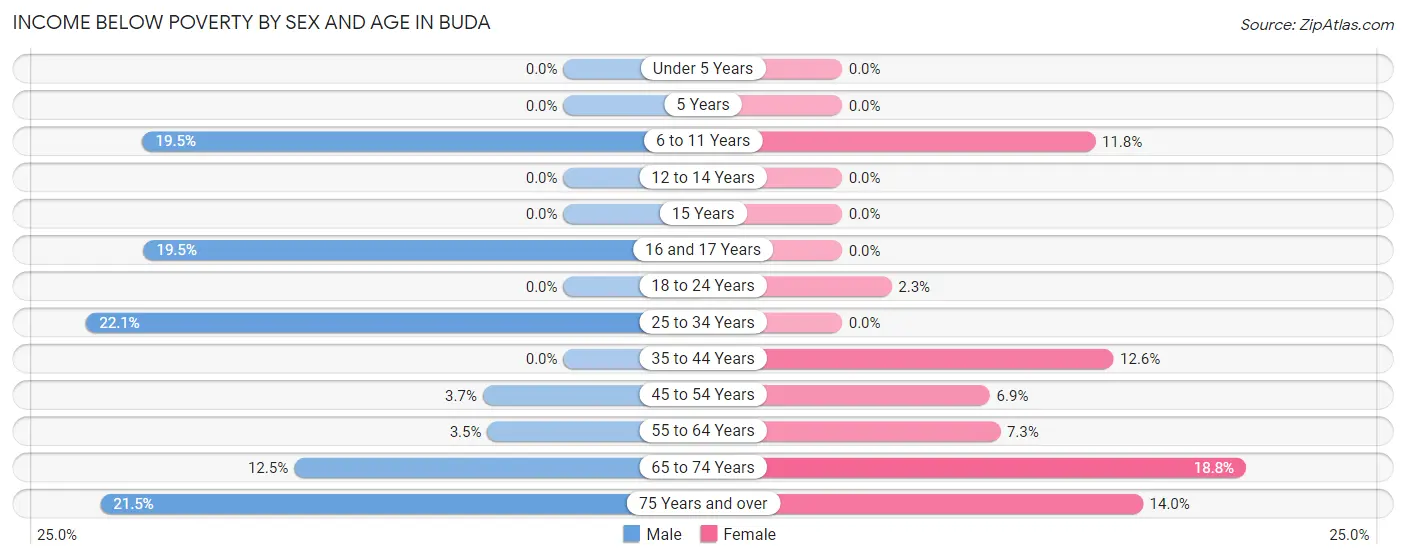
| Age Bracket | Male | Female |
| Under 5 Years | 0 (0.0%) | 0 (0.0%) |
| 5 Years | 0 (0.0%) | 0 (0.0%) |
| 6 to 11 Years | 226 (19.5%) | 100 (11.7%) |
| 12 to 14 Years | 0 (0.0%) | 0 (0.0%) |
| 15 Years | 0 (0.0%) | 0 (0.0%) |
| 16 and 17 Years | 45 (19.5%) | 0 (0.0%) |
| 18 to 24 Years | 0 (0.0%) | 5 (2.3%) |
| 25 to 34 Years | 160 (22.1%) | 0 (0.0%) |
| 35 to 44 Years | 0 (0.0%) | 213 (12.6%) |
| 45 to 54 Years | 51 (3.7%) | 74 (6.9%) |
| 55 to 64 Years | 20 (3.5%) | 40 (7.3%) |
| 65 to 74 Years | 41 (12.5%) | 138 (18.8%) |
| 75 Years and over | 29 (21.5%) | 37 (14.0%) |
| Total | 572 (7.3%) | 607 (8.4%) |
Income Above Poverty by Sex and Age in Buda
According to the poverty statistics in Buda, males aged under 5 years and females aged under 5 years are the age groups that are most secure financially, with 100.0% of males and 100.0% of females in these age groups living above the poverty line.
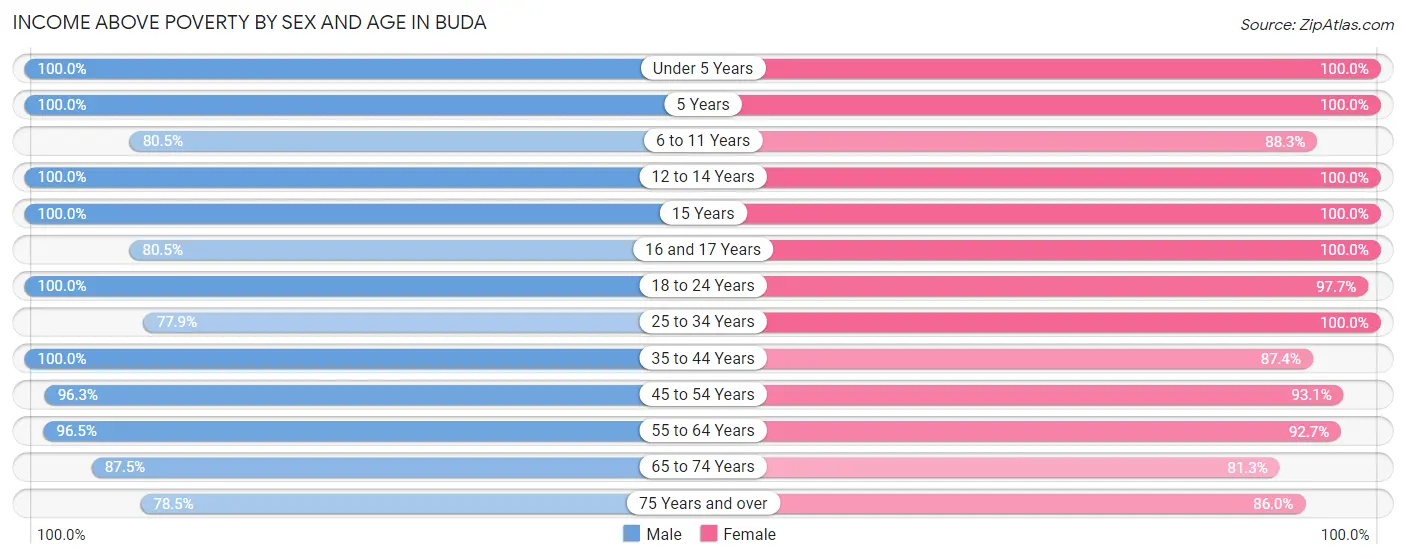
| Age Bracket | Male | Female |
| Under 5 Years | 638 (100.0%) | 355 (100.0%) |
| 5 Years | 158 (100.0%) | 64 (100.0%) |
| 6 to 11 Years | 932 (80.5%) | 751 (88.2%) |
| 12 to 14 Years | 227 (100.0%) | 227 (100.0%) |
| 15 Years | 108 (100.0%) | 164 (100.0%) |
| 16 and 17 Years | 186 (80.5%) | 269 (100.0%) |
| 18 to 24 Years | 661 (100.0%) | 212 (97.7%) |
| 25 to 34 Years | 563 (77.9%) | 749 (100.0%) |
| 35 to 44 Years | 1,488 (100.0%) | 1,479 (87.4%) |
| 45 to 54 Years | 1,312 (96.3%) | 1,005 (93.1%) |
| 55 to 64 Years | 546 (96.5%) | 505 (92.7%) |
| 65 to 74 Years | 287 (87.5%) | 598 (81.2%) |
| 75 Years and over | 106 (78.5%) | 228 (86.0%) |
| Total | 7,212 (92.6%) | 6,606 (91.6%) |
Income Below Poverty Among Married-Couple Families in Buda
The poverty statistics for married-couple families in Buda show that 3.2% or 109 of the total 3,411 families live below the poverty line. Families with 3 or 4 children have the highest poverty rate of 23.7%, comprising of 51 families. On the other hand, families with 1 or 2 children have the lowest poverty rate of 0.0%, which includes 0 families.
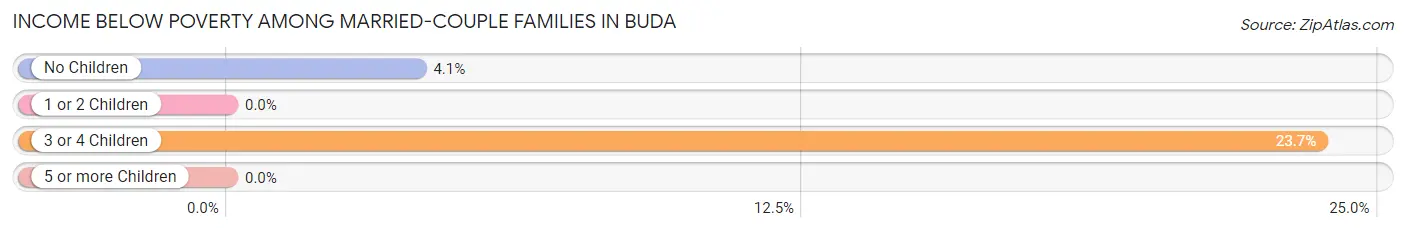
| Children | Above Poverty | Below Poverty |
| No Children | 1,358 (95.9%) | 58 (4.1%) |
| 1 or 2 Children | 1,780 (100.0%) | 0 (0.0%) |
| 3 or 4 Children | 164 (76.3%) | 51 (23.7%) |
| 5 or more Children | 0 (0.0%) | 0 (0.0%) |
| Total | 3,302 (96.8%) | 109 (3.2%) |
Income Below Poverty Among Single-Parent Households in Buda
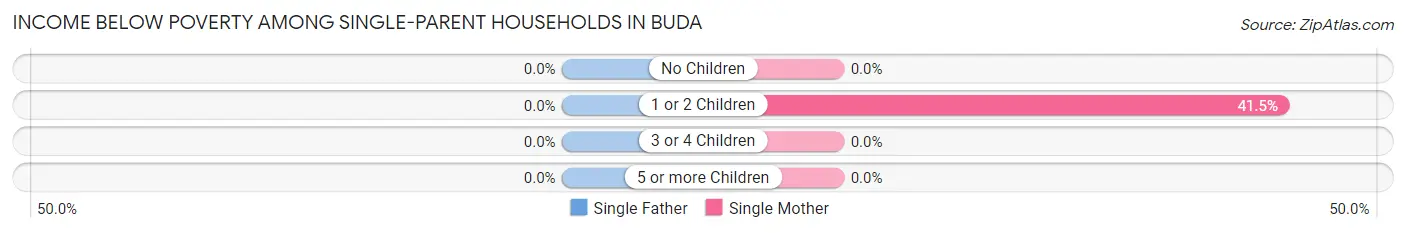
| Children | Single Father | Single Mother |
| No Children | 0 (0.0%) | 0 (0.0%) |
| 1 or 2 Children | 0 (0.0%) | 135 (41.5%) |
| 3 or 4 Children | 0 (0.0%) | 0 (0.0%) |
| 5 or more Children | 0 (0.0%) | 0 (0.0%) |
| Total | 0 (0.0%) | 135 (21.1%) |
Income Below Poverty Among Married-Couple vs Single-Parent Households in Buda
The poverty data for Buda shows that 109 of the married-couple family households (3.2%) and 135 of the single-parent households (17.9%) are living below the poverty level. Within the married-couple family households, those with 3 or 4 children have the highest poverty rate, with 51 households (23.7%) falling below the poverty line. Among the single-parent households, those with 1 or 2 children have the highest poverty rate, with 135 household (32.8%) living below poverty.
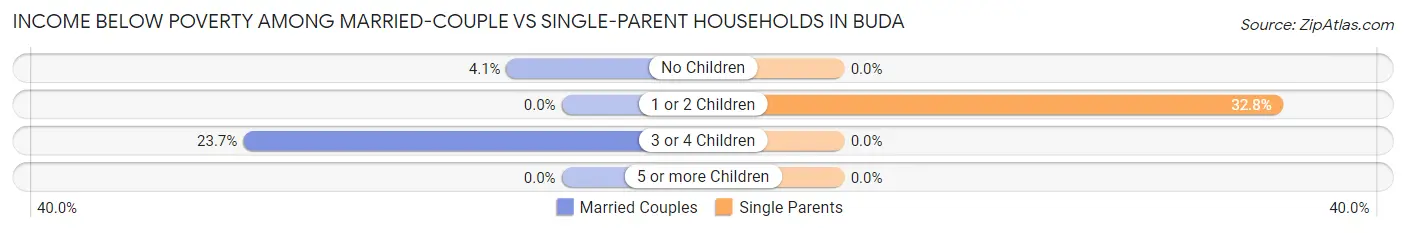
| Children | Married-Couple Families | Single-Parent Households |
| No Children | 58 (4.1%) | 0 (0.0%) |
| 1 or 2 Children | 0 (0.0%) | 135 (32.8%) |
| 3 or 4 Children | 51 (23.7%) | 0 (0.0%) |
| 5 or more Children | 0 (0.0%) | 0 (0.0%) |
| Total | 109 (3.2%) | 135 (17.9%) |
Race in Buda
The most populous races in Buda are White / Caucasian (12,796 | 85.3%), Hispanic or Latino (4,787 | 31.9%), and Two or more Races (1,642 | 11.0%).
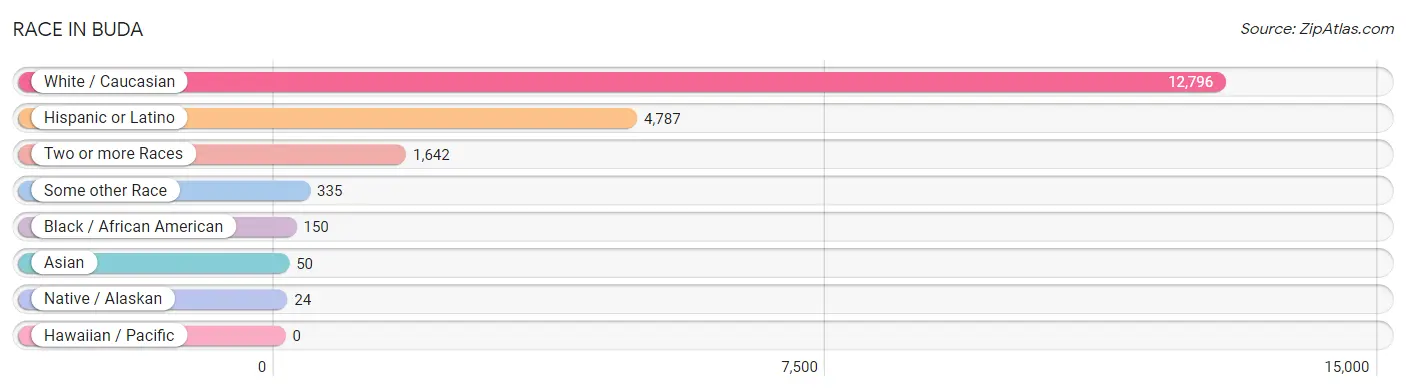
| Race | # Population | % Population |
| Asian | 50 | 0.3% |
| Black / African American | 150 | 1.0% |
| Hawaiian / Pacific | 0 | 0.0% |
| Hispanic or Latino | 4,787 | 31.9% |
| Native / Alaskan | 24 | 0.2% |
| White / Caucasian | 12,796 | 85.3% |
| Two or more Races | 1,642 | 11.0% |
| Some other Race | 335 | 2.2% |
| Total | 14,997 | 100.0% |
Ancestry in Buda
The most populous ancestries reported in Buda are Mexican (4,141 | 27.6%), German (2,502 | 16.7%), English (2,394 | 16.0%), Irish (1,810 | 12.1%), and Arab (980 | 6.5%), together accounting for 78.9% of all Buda residents.
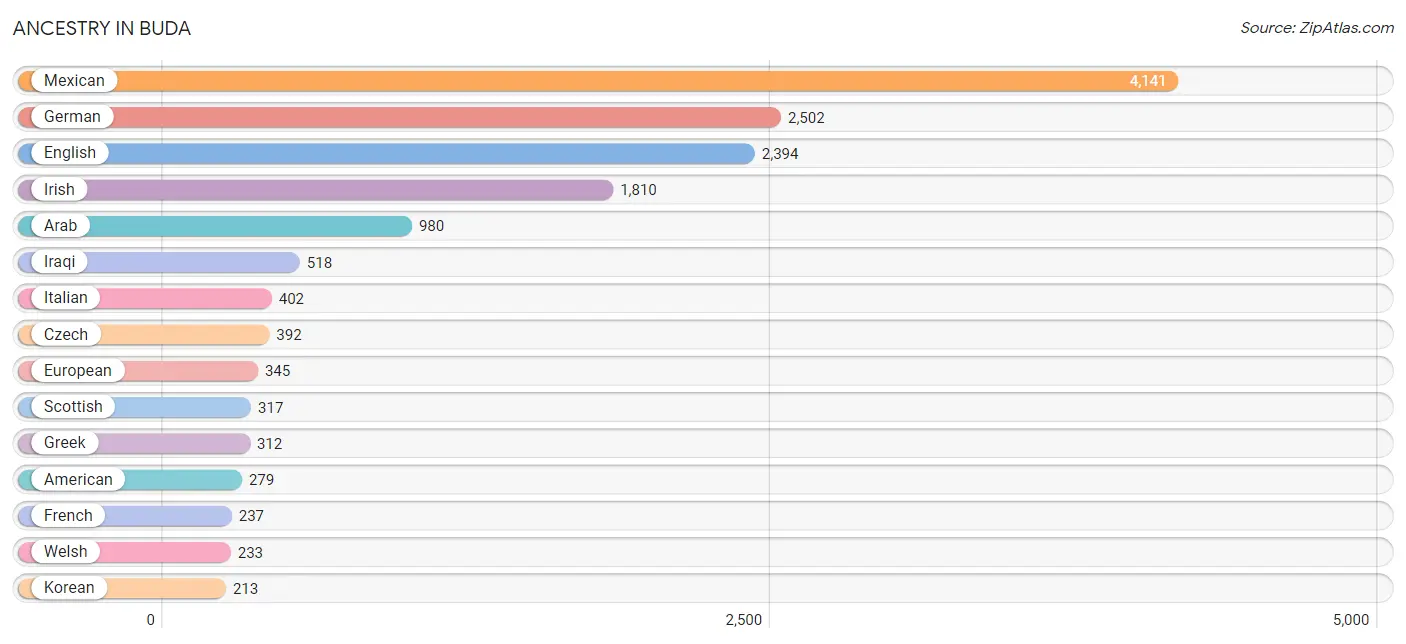
| Ancestry | # Population | % Population |
| American | 279 | 1.9% |
| Apache | 29 | 0.2% |
| Arab | 980 | 6.5% |
| Argentinean | 33 | 0.2% |
| Austrian | 57 | 0.4% |
| Central American | 117 | 0.8% |
| Colombian | 105 | 0.7% |
| Cuban | 41 | 0.3% |
| Czech | 392 | 2.6% |
| Danish | 201 | 1.3% |
| Dutch | 71 | 0.5% |
| Eastern European | 101 | 0.7% |
| English | 2,394 | 16.0% |
| European | 345 | 2.3% |
| French | 237 | 1.6% |
| German | 2,502 | 16.7% |
| Greek | 312 | 2.1% |
| Honduran | 36 | 0.2% |
| Hungarian | 35 | 0.2% |
| Iraqi | 518 | 3.5% |
| Irish | 1,810 | 12.1% |
| Italian | 402 | 2.7% |
| Korean | 213 | 1.4% |
| Lebanese | 26 | 0.2% |
| Mexican | 4,141 | 27.6% |
| Mexican American Indian | 24 | 0.2% |
| Nigerian | 69 | 0.5% |
| Norwegian | 62 | 0.4% |
| Polish | 102 | 0.7% |
| Portuguese | 55 | 0.4% |
| Romanian | 1 | 0.0% |
| Salvadoran | 81 | 0.5% |
| Scandinavian | 43 | 0.3% |
| Scotch-Irish | 150 | 1.0% |
| Scottish | 317 | 2.1% |
| Sioux | 15 | 0.1% |
| South American | 138 | 0.9% |
| Spaniard | 46 | 0.3% |
| Spanish | 37 | 0.3% |
| Subsaharan African | 69 | 0.5% |
| Swedish | 134 | 0.9% |
| Syrian | 26 | 0.2% |
| Welsh | 233 | 1.5% | View All 43 Rows |
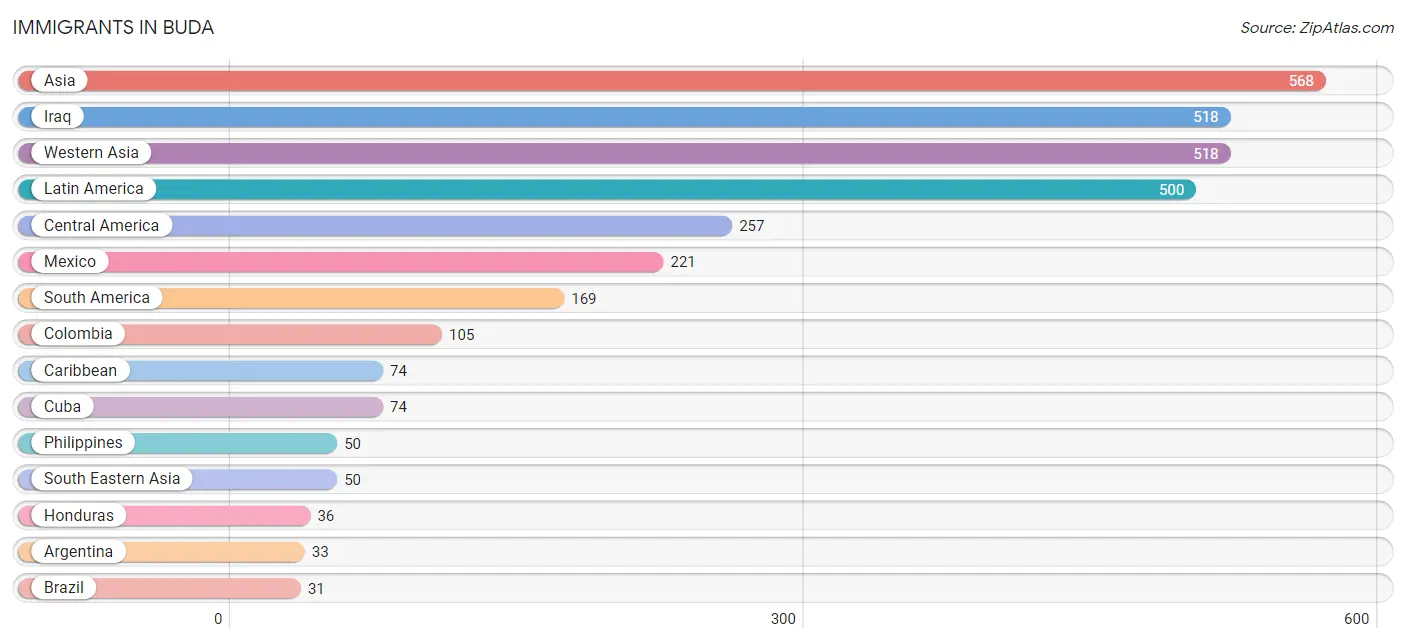
Immigrants in Buda
The most numerous immigrant groups reported in Buda came from Asia (568 | 3.8%), Iraq (518 | 3.5%), Western Asia (518 | 3.5%), Latin America (500 | 3.3%), and Central America (257 | 1.7%), together accounting for 15.7% of all Buda residents.
| Immigration Origin | # Population | % Population |
| Argentina | 33 | 0.2% |
| Asia | 568 | 3.8% |
| Brazil | 31 | 0.2% |
| Caribbean | 74 | 0.5% |
| Central America | 257 | 1.7% |
| Colombia | 105 | 0.7% |
| Cuba | 74 | 0.5% |
| Eastern Europe | 2 | 0.0% |
| Europe | 22 | 0.2% |
| Honduras | 36 | 0.2% |
| Iraq | 518 | 3.5% |
| Latin America | 500 | 3.3% |
| Mexico | 221 | 1.5% |
| Northern Europe | 20 | 0.1% |
| Philippines | 50 | 0.3% |
| Romania | 2 | 0.0% |
| Scotland | 20 | 0.1% |
| South America | 169 | 1.1% |
| South Eastern Asia | 50 | 0.3% |
| Western Asia | 518 | 3.5% | View All 20 Rows |
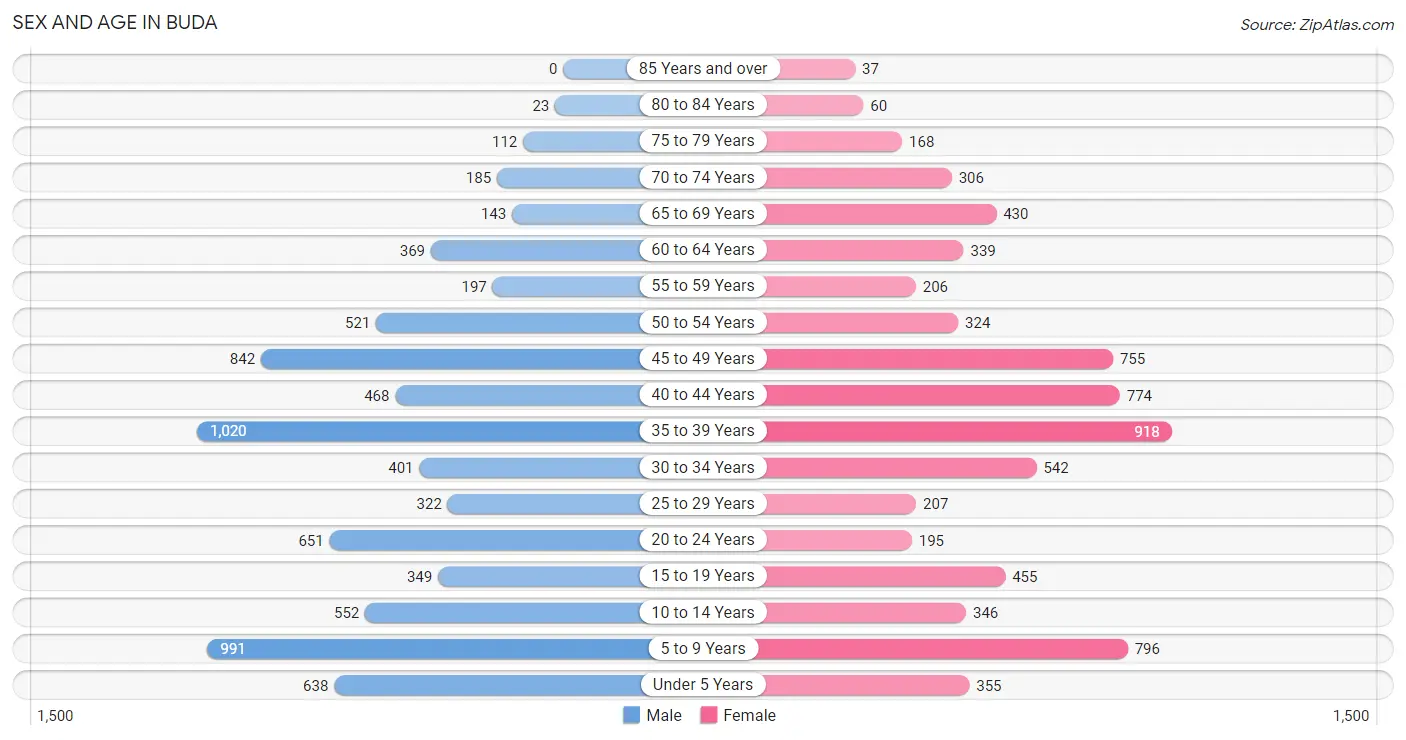
Sex and Age in Buda
Sex and Age in Buda
The most populous age groups in Buda are 35 to 39 Years (1,020 | 13.1%) for men and 35 to 39 Years (918 | 12.7%) for women.
| Age Bracket | Male | Female |
| Under 5 Years | 638 (8.2%) | 355 (4.9%) |
| 5 to 9 Years | 991 (12.7%) | 796 (11.0%) |
| 10 to 14 Years | 552 (7.1%) | 346 (4.8%) |
| 15 to 19 Years | 349 (4.5%) | 455 (6.3%) |
| 20 to 24 Years | 651 (8.4%) | 195 (2.7%) |
| 25 to 29 Years | 322 (4.1%) | 207 (2.9%) |
| 30 to 34 Years | 401 (5.1%) | 542 (7.5%) |
| 35 to 39 Years | 1,020 (13.1%) | 918 (12.7%) |
| 40 to 44 Years | 468 (6.0%) | 774 (10.7%) |
| 45 to 49 Years | 842 (10.8%) | 755 (10.5%) |
| 50 to 54 Years | 521 (6.7%) | 324 (4.5%) |
| 55 to 59 Years | 197 (2.5%) | 206 (2.9%) |
| 60 to 64 Years | 369 (4.7%) | 339 (4.7%) |
| 65 to 69 Years | 143 (1.8%) | 430 (6.0%) |
| 70 to 74 Years | 185 (2.4%) | 306 (4.2%) |
| 75 to 79 Years | 112 (1.4%) | 168 (2.3%) |
| 80 to 84 Years | 23 (0.3%) | 60 (0.8%) |
| 85 Years and over | 0 (0.0%) | 37 (0.5%) |
| Total | 7,784 (100.0%) | 7,213 (100.0%) |
Families and Households in Buda
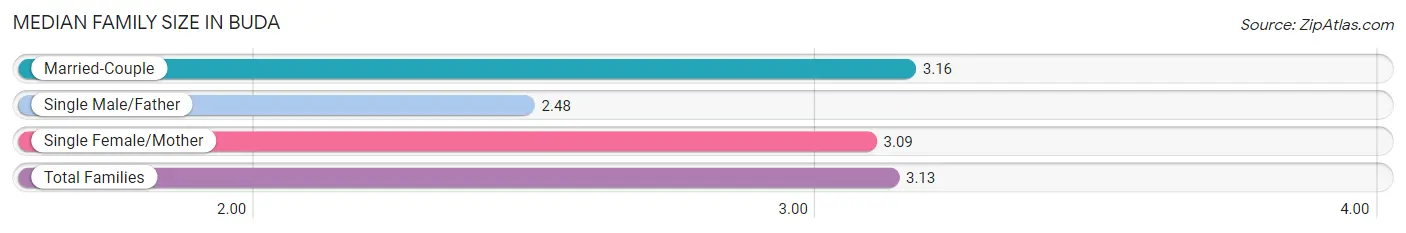
Median Family Size in Buda
The median family size in Buda is 3.13 persons per family, with married-couple families (3,411 | 81.9%) accounting for the largest median family size of 3.16 persons per family. On the other hand, single male/father families (114 | 2.7%) represent the smallest median family size with 2.48 persons per family.
| Family Type | # Families | Family Size |
| Married-Couple | 3,411 (81.9%) | 3.16 |
| Single Male/Father | 114 (2.7%) | 2.48 |
| Single Female/Mother | 639 (15.3%) | 3.09 |
| Total Families | 4,164 (100.0%) | 3.13 |
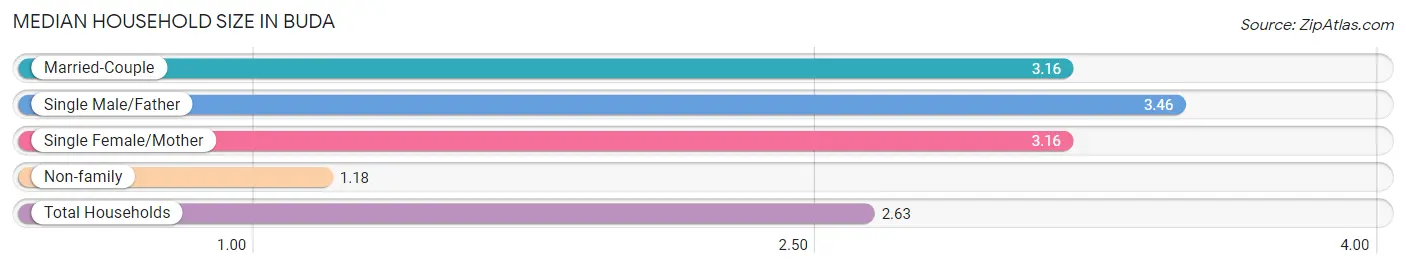
Median Household Size in Buda
The median household size in Buda is 2.63 persons per household, with single male/father households (114 | 2.0%) accounting for the largest median household size of 3.46 persons per household. non-family households (1,531 | 26.9%) represent the smallest median household size with 1.18 persons per household.
| Household Type | # Households | Household Size |
| Married-Couple | 3,411 (59.9%) | 3.16 |
| Single Male/Father | 114 (2.0%) | 3.46 |
| Single Female/Mother | 639 (11.2%) | 3.16 |
| Non-family | 1,531 (26.9%) | 1.18 |
| Total Households | 5,695 (100.0%) | 2.63 |
Household Size by Marriage Status in Buda
Out of a total of 5,695 households in Buda, 4,164 (73.1%) are family households, while 1,531 (26.9%) are nonfamily households. The most numerous type of family households are 2-person households, comprising 1,322, and the most common type of nonfamily households are 1-person households, comprising 1,322.
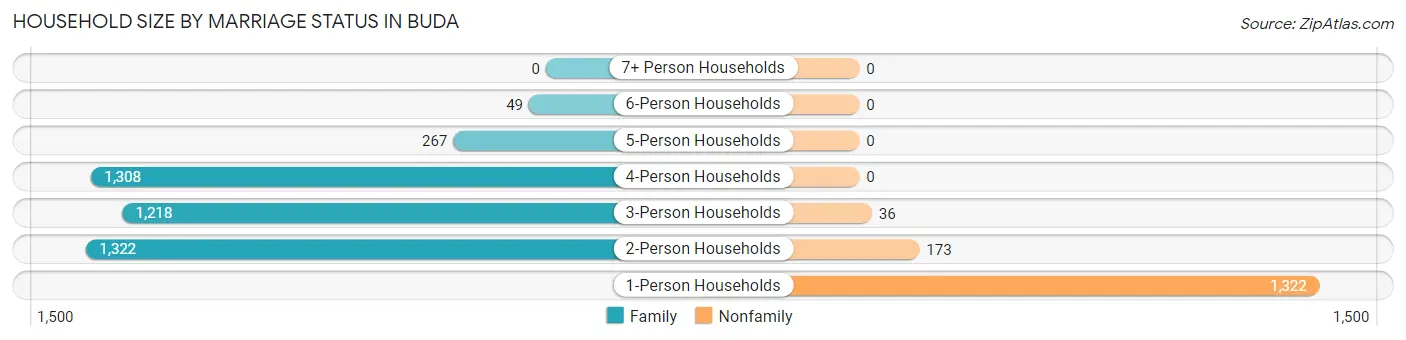
| Household Size | Family Households | Nonfamily Households |
| 1-Person Households | - | 1,322 (23.2%) |
| 2-Person Households | 1,322 (23.2%) | 173 (3.0%) |
| 3-Person Households | 1,218 (21.4%) | 36 (0.6%) |
| 4-Person Households | 1,308 (23.0%) | 0 (0.0%) |
| 5-Person Households | 267 (4.7%) | 0 (0.0%) |
| 6-Person Households | 49 (0.9%) | 0 (0.0%) |
| 7+ Person Households | 0 (0.0%) | 0 (0.0%) |
| Total | 4,164 (73.1%) | 1,531 (26.9%) |
Female Fertility in Buda
Fertility by Age in Buda
Average fertility rate in Buda is 34.0 births per 1,000 women. Women in the age bracket of 35 to 50 years have the highest fertility rate with 47.0 births per 1,000 women. Women in the age bracket of 35 to 50 years acount for 88.7% of all women with births.
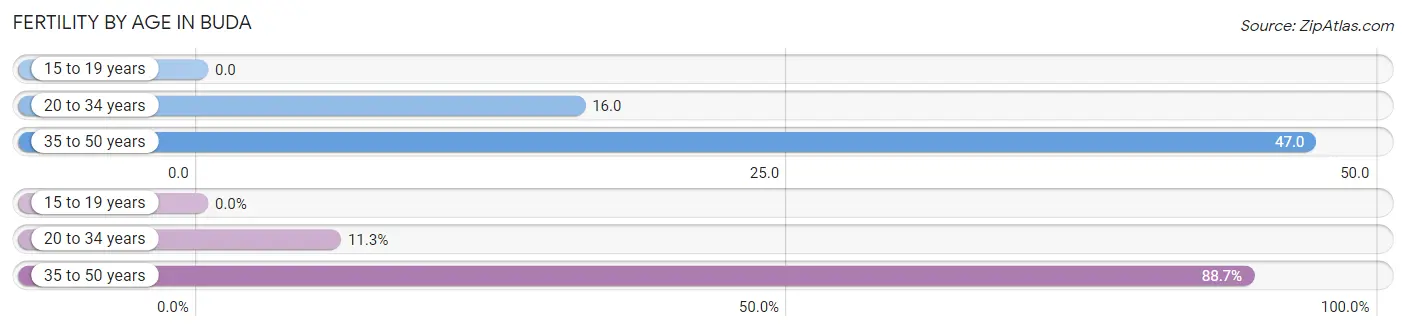
| Age Bracket | Women with Births | Births / 1,000 Women |
| 15 to 19 years | 0 (0.0%) | 0.0 |
| 20 to 34 years | 15 (11.3%) | 16.0 |
| 35 to 50 years | 118 (88.7%) | 47.0 |
| Total | 133 (100.0%) | 34.0 |
Fertility by Age by Marriage Status in Buda
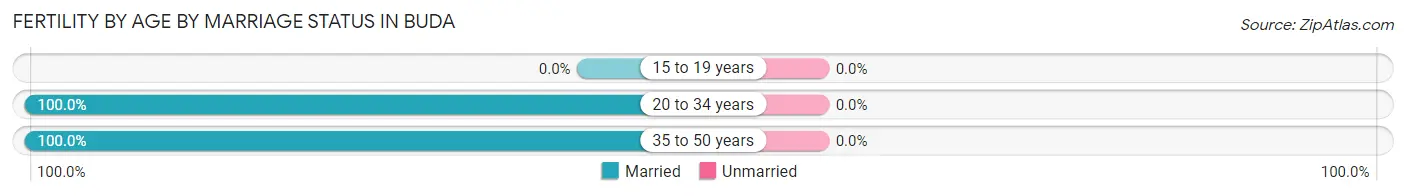
| Age Bracket | Married | Unmarried |
| 15 to 19 years | 0 (0.0%) | 0 (0.0%) |
| 20 to 34 years | 15 (100.0%) | 0 (0.0%) |
| 35 to 50 years | 118 (100.0%) | 0 (0.0%) |
| Total | 133 (100.0%) | 0 (0.0%) |
Fertility by Education in Buda
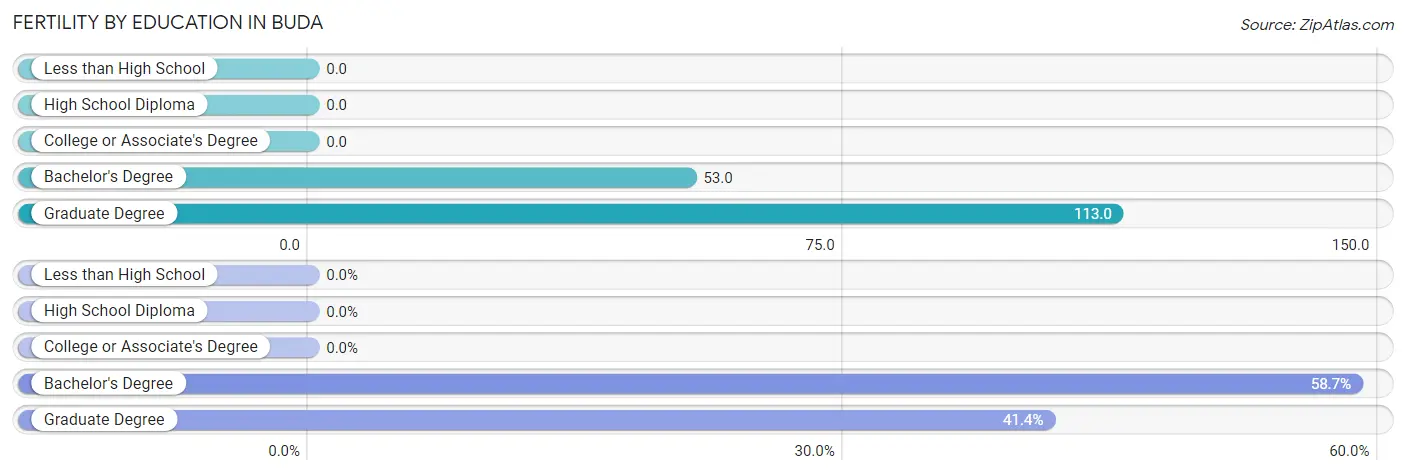
| Educational Attainment | Women with Births | Births / 1,000 Women |
| Less than High School | 0 (0.0%) | 0.0 |
| High School Diploma | 0 (0.0%) | 0.0 |
| College or Associate's Degree | 0 (0.0%) | 0.0 |
| Bachelor's Degree | 78 (58.7%) | 53.0 |
| Graduate Degree | 55 (41.3%) | 113.0 |
| Total | 133 (100.0%) | 34.0 |
Fertility by Education by Marriage Status in Buda
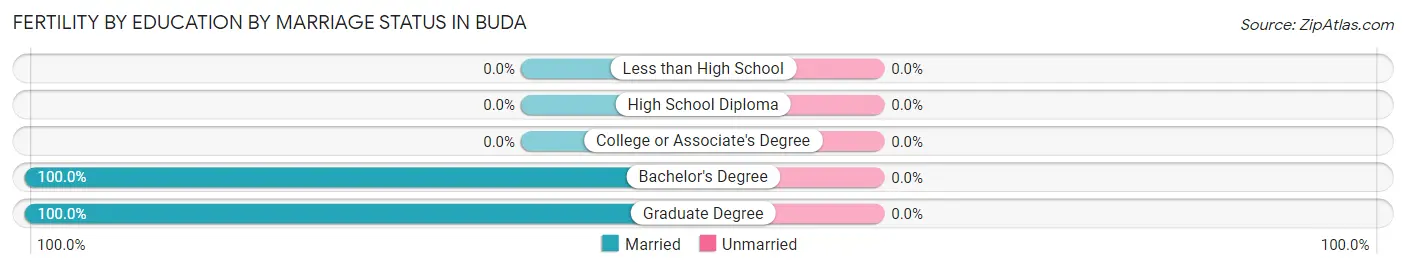
| Educational Attainment | Married | Unmarried |
| Less than High School | 0 (0.0%) | 0 (0.0%) |
| High School Diploma | 0 (0.0%) | 0 (0.0%) |
| College or Associate's Degree | 0 (0.0%) | 0 (0.0%) |
| Bachelor's Degree | 78 (100.0%) | 0 (0.0%) |
| Graduate Degree | 55 (100.0%) | 0 (0.0%) |
| Total | 133 (100.0%) | 0 (0.0%) |
Employment Characteristics in Buda
Employment by Class of Employer in Buda
Among the 7,560 employed individuals in Buda, private company employees (4,838 | 64.0%), local government employees (951 | 12.6%), and self-employed (not incorporated) (614 | 8.1%) make up the most common classes of employment.
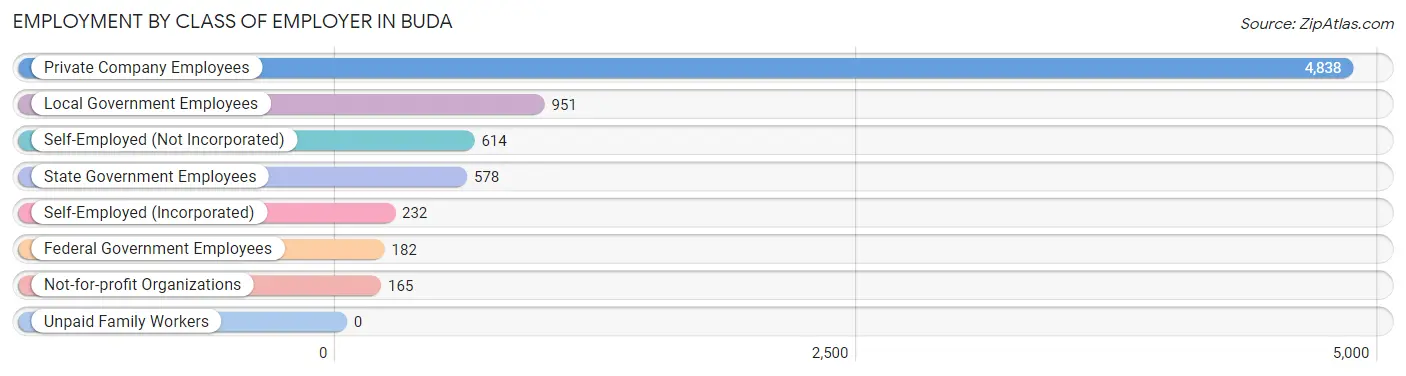
| Employer Class | # Employees | % Employees |
| Private Company Employees | 4,838 | 64.0% |
| Self-Employed (Incorporated) | 232 | 3.1% |
| Self-Employed (Not Incorporated) | 614 | 8.1% |
| Not-for-profit Organizations | 165 | 2.2% |
| Local Government Employees | 951 | 12.6% |
| State Government Employees | 578 | 7.6% |
| Federal Government Employees | 182 | 2.4% |
| Unpaid Family Workers | 0 | 0.0% |
| Total | 7,560 | 100.0% |
Employment Status by Age in Buda
According to the labor force statistics for Buda, out of the total population over 16 years of age (11,047), 71.5% or 7,899 individuals are in the labor force, with 3.6% or 284 of them unemployed. The age group with the highest labor force participation rate is 55 to 59 years, with 100.0% or 403 individuals in the labor force. Within the labor force, the 16 to 19 years age range has the highest percentage of unemployed individuals, with 52.9% or 45 of them being unemployed.
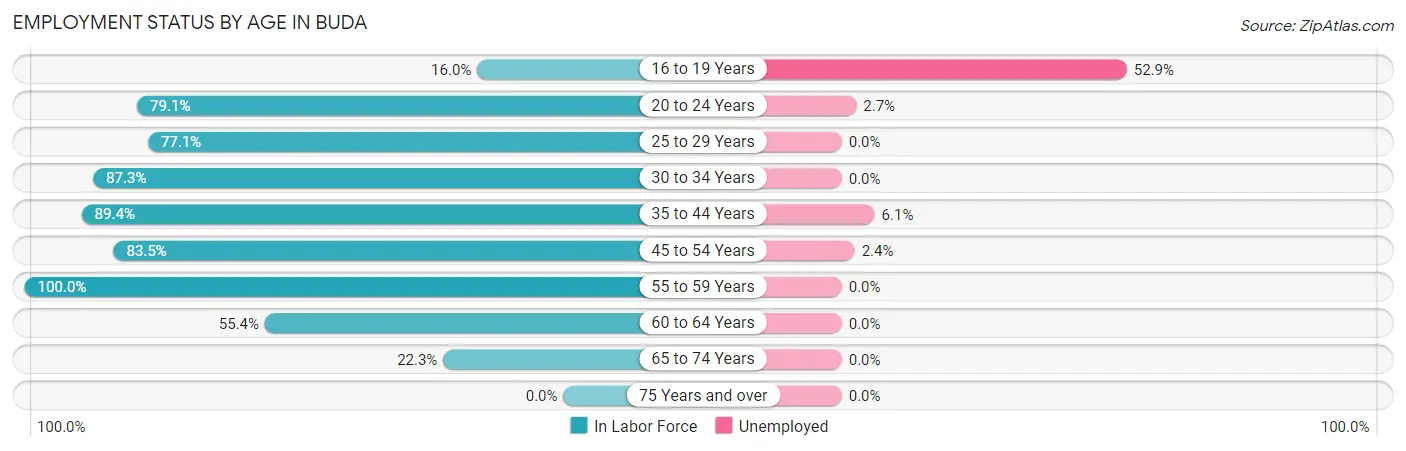
| Age Bracket | In Labor Force | Unemployed |
| 16 to 19 Years | 85 (16.0%) | 45 (52.9%) |
| 20 to 24 Years | 669 (79.1%) | 18 (2.7%) |
| 25 to 29 Years | 408 (77.1%) | 0 (0.0%) |
| 30 to 34 Years | 823 (87.3%) | 0 (0.0%) |
| 35 to 44 Years | 2,843 (89.4%) | 173 (6.1%) |
| 45 to 54 Years | 2,039 (83.5%) | 49 (2.4%) |
| 55 to 59 Years | 403 (100.0%) | 0 (0.0%) |
| 60 to 64 Years | 392 (55.4%) | 0 (0.0%) |
| 65 to 74 Years | 237 (22.3%) | 0 (0.0%) |
| 75 Years and over | 0 (0.0%) | 0 (0.0%) |
| Total | 7,899 (71.5%) | 284 (3.6%) |
Employment Status by Educational Attainment in Buda
According to labor force statistics for Buda, 84.2% of individuals (6,909) out of the total population between 25 and 64 years of age (8,205) are in the labor force, with 3.2% or 221 of them being unemployed. The group with the highest labor force participation rate are those with the educational attainment of less than high school, with 90.3% or 262 individuals in the labor force. Within the labor force, individuals with less than high school education have the highest percentage of unemployment, with 48.5% or 127 of them being unemployed.
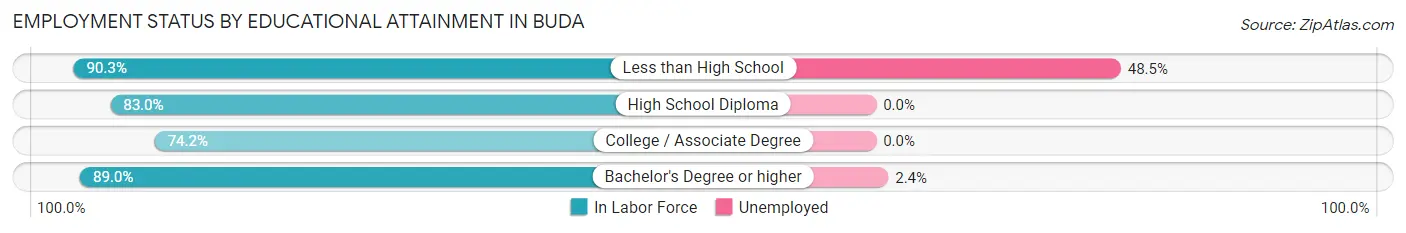
| Educational Attainment | In Labor Force | Unemployed |
| Less than High School | 262 (90.3%) | 141 (48.5%) |
| High School Diploma | 1,228 (83.0%) | 0 (0.0%) |
| College / Associate Degree | 1,562 (74.2%) | 0 (0.0%) |
| Bachelor's Degree or higher | 3,855 (89.0%) | 104 (2.4%) |
| Total | 6,909 (84.2%) | 263 (3.2%) |
Employment Occupations by Sex in Buda
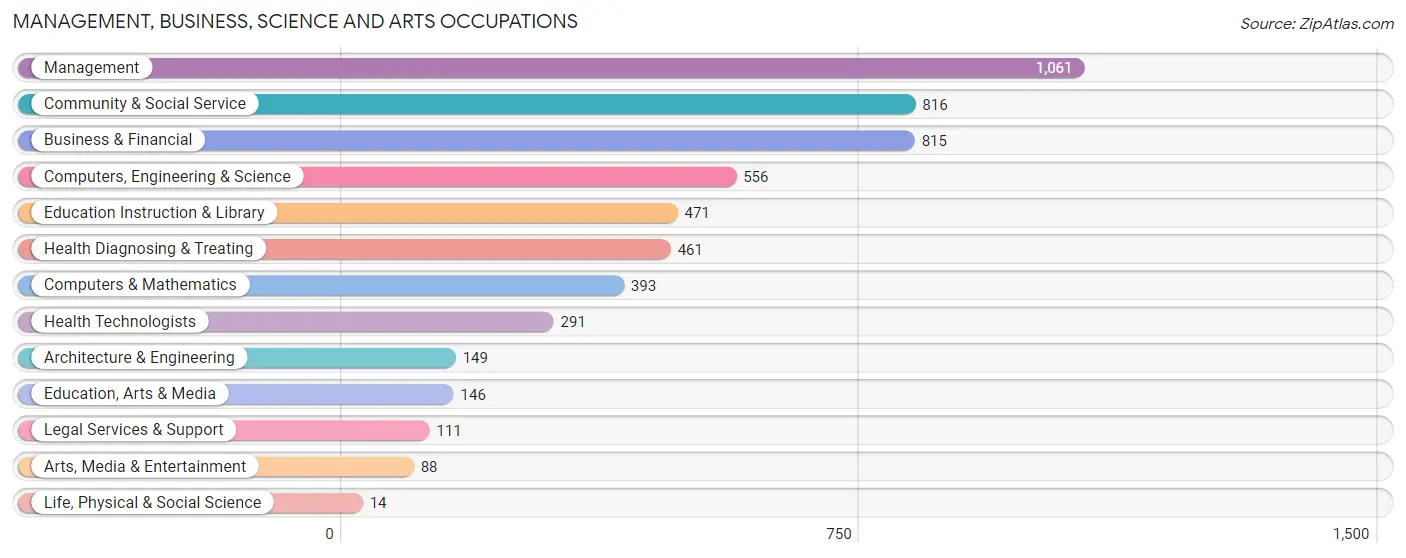
Management, Business, Science and Arts Occupations
The most common Management, Business, Science and Arts occupations in Buda are Management (1,061 | 14.0%), Community & Social Service (816 | 10.8%), Business & Financial (815 | 10.8%), Computers, Engineering & Science (556 | 7.4%), and Education Instruction & Library (471 | 6.2%).
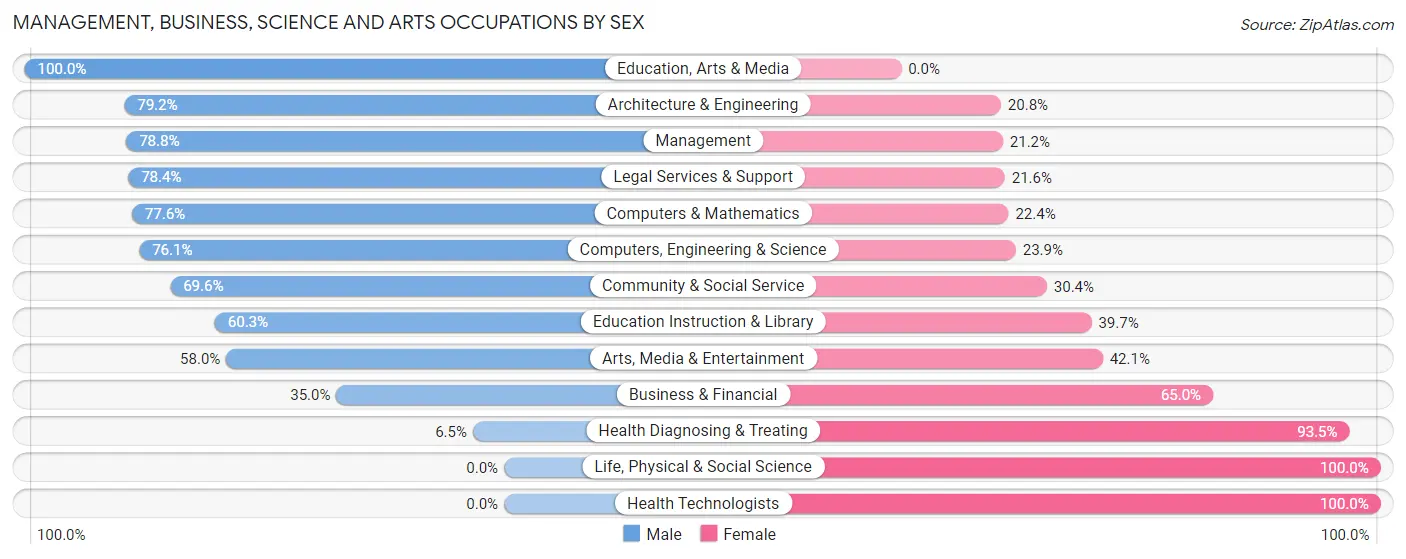
Management, Business, Science and Arts Occupations by Sex
Within the Management, Business, Science and Arts occupations in Buda, the most male-oriented occupations are Education, Arts & Media (100.0%), Architecture & Engineering (79.2%), and Management (78.8%), while the most female-oriented occupations are Life, Physical & Social Science (100.0%), Health Technologists (100.0%), and Health Diagnosing & Treating (93.5%).
| Occupation | Male | Female |
| Management | 836 (78.8%) | 225 (21.2%) |
| Business & Financial | 285 (35.0%) | 530 (65.0%) |
| Computers, Engineering & Science | 423 (76.1%) | 133 (23.9%) |
| Computers & Mathematics | 305 (77.6%) | 88 (22.4%) |
| Architecture & Engineering | 118 (79.2%) | 31 (20.8%) |
| Life, Physical & Social Science | 0 (0.0%) | 14 (100.0%) |
| Community & Social Service | 568 (69.6%) | 248 (30.4%) |
| Education, Arts & Media | 146 (100.0%) | 0 (0.0%) |
| Legal Services & Support | 87 (78.4%) | 24 (21.6%) |
| Education Instruction & Library | 284 (60.3%) | 187 (39.7%) |
| Arts, Media & Entertainment | 51 (58.0%) | 37 (42.0%) |
| Health Diagnosing & Treating | 30 (6.5%) | 431 (93.5%) |
| Health Technologists | 0 (0.0%) | 291 (100.0%) |
| Total (Category) | 2,142 (57.8%) | 1,567 (42.2%) |
| Total (Overall) | 4,192 (55.5%) | 3,366 (44.5%) |
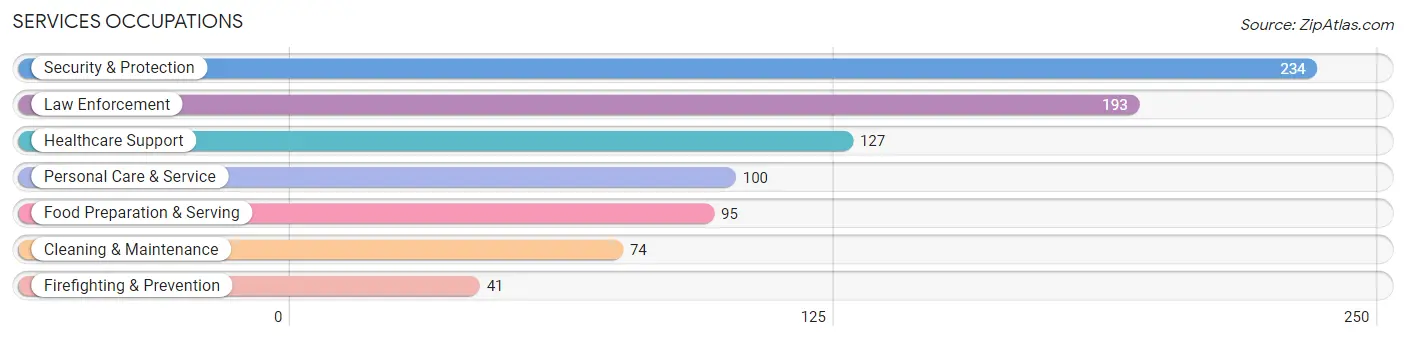
Services Occupations
The most common Services occupations in Buda are Security & Protection (234 | 3.1%), Law Enforcement (193 | 2.5%), Healthcare Support (127 | 1.7%), Personal Care & Service (100 | 1.3%), and Food Preparation & Serving (95 | 1.3%).
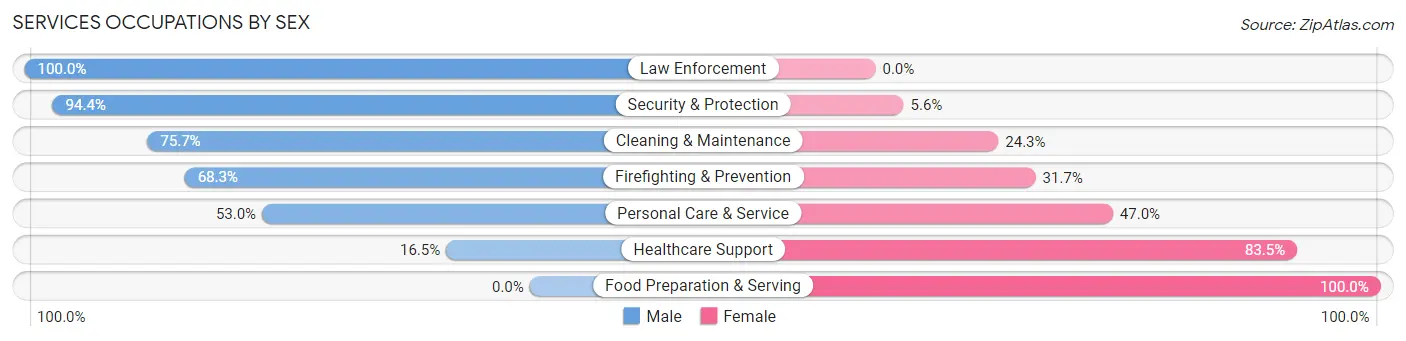
Services Occupations by Sex
Within the Services occupations in Buda, the most male-oriented occupations are Law Enforcement (100.0%), Security & Protection (94.4%), and Cleaning & Maintenance (75.7%), while the most female-oriented occupations are Food Preparation & Serving (100.0%), Healthcare Support (83.5%), and Personal Care & Service (47.0%).
| Occupation | Male | Female |
| Healthcare Support | 21 (16.5%) | 106 (83.5%) |
| Security & Protection | 221 (94.4%) | 13 (5.6%) |
| Firefighting & Prevention | 28 (68.3%) | 13 (31.7%) |
| Law Enforcement | 193 (100.0%) | 0 (0.0%) |
| Food Preparation & Serving | 0 (0.0%) | 95 (100.0%) |
| Cleaning & Maintenance | 56 (75.7%) | 18 (24.3%) |
| Personal Care & Service | 53 (53.0%) | 47 (47.0%) |
| Total (Category) | 351 (55.7%) | 279 (44.3%) |
| Total (Overall) | 4,192 (55.5%) | 3,366 (44.5%) |
Sales and Office Occupations
The most common Sales and Office occupations in Buda are Office & Administration (1,336 | 17.7%), and Sales & Related (987 | 13.1%).

Sales and Office Occupations by Sex

| Occupation | Male | Female |
| Sales & Related | 460 (46.6%) | 527 (53.4%) |
| Office & Administration | 511 (38.3%) | 825 (61.8%) |
| Total (Category) | 971 (41.8%) | 1,352 (58.2%) |
| Total (Overall) | 4,192 (55.5%) | 3,366 (44.5%) |
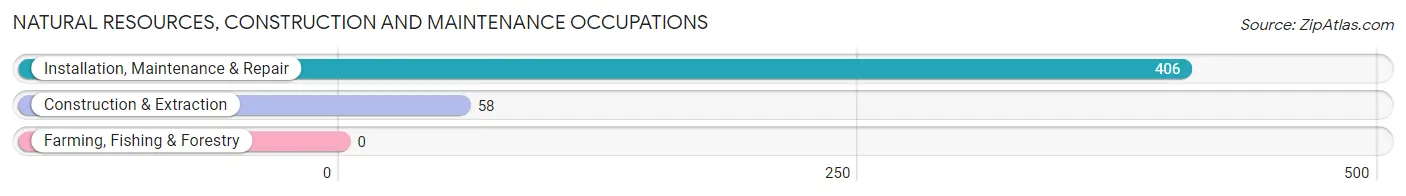
Natural Resources, Construction and Maintenance Occupations
The most common Natural Resources, Construction and Maintenance occupations in Buda are Installation, Maintenance & Repair (406 | 5.4%), and Construction & Extraction (58 | 0.8%).
Natural Resources, Construction and Maintenance Occupations by Sex
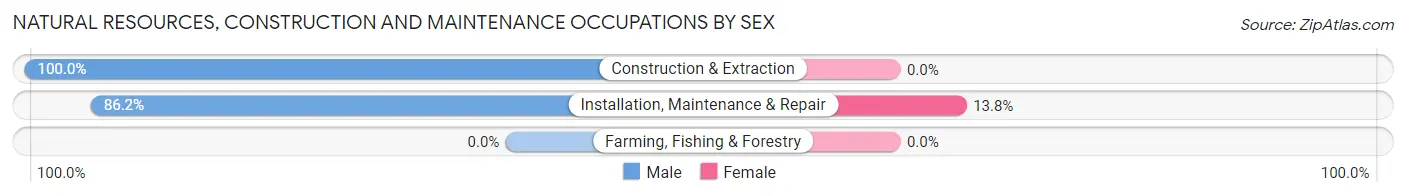
| Occupation | Male | Female |
| Farming, Fishing & Forestry | 0 (0.0%) | 0 (0.0%) |
| Construction & Extraction | 58 (100.0%) | 0 (0.0%) |
| Installation, Maintenance & Repair | 350 (86.2%) | 56 (13.8%) |
| Total (Category) | 408 (87.9%) | 56 (12.1%) |
| Total (Overall) | 4,192 (55.5%) | 3,366 (44.5%) |
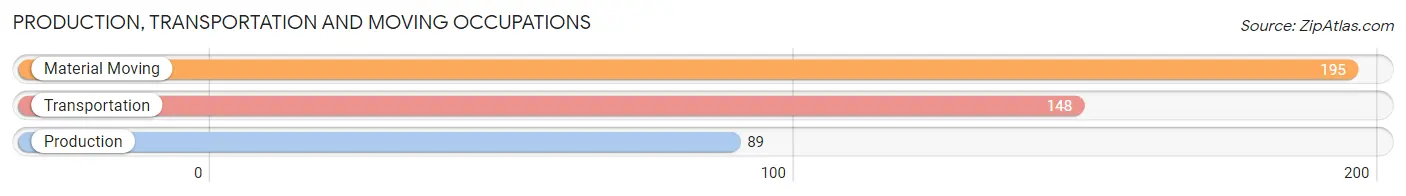
Production, Transportation and Moving Occupations
The most common Production, Transportation and Moving occupations in Buda are Material Moving (195 | 2.6%), Transportation (148 | 2.0%), and Production (89 | 1.2%).
Production, Transportation and Moving Occupations by Sex
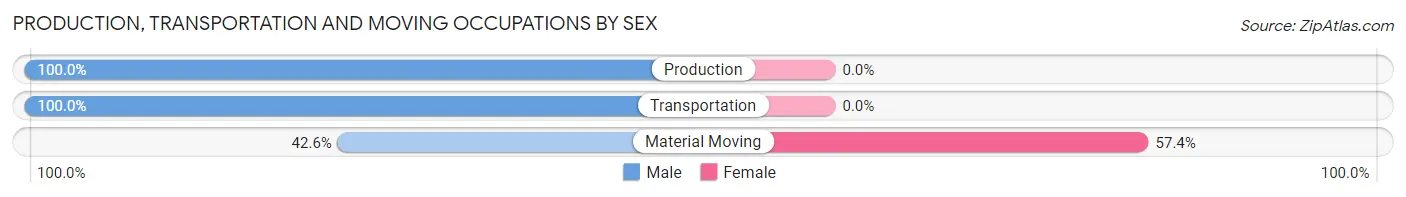
| Occupation | Male | Female |
| Production | 89 (100.0%) | 0 (0.0%) |
| Transportation | 148 (100.0%) | 0 (0.0%) |
| Material Moving | 83 (42.6%) | 112 (57.4%) |
| Total (Category) | 320 (74.1%) | 112 (25.9%) |
| Total (Overall) | 4,192 (55.5%) | 3,366 (44.5%) |
Employment Industries by Sex in Buda
Employment Industries in Buda
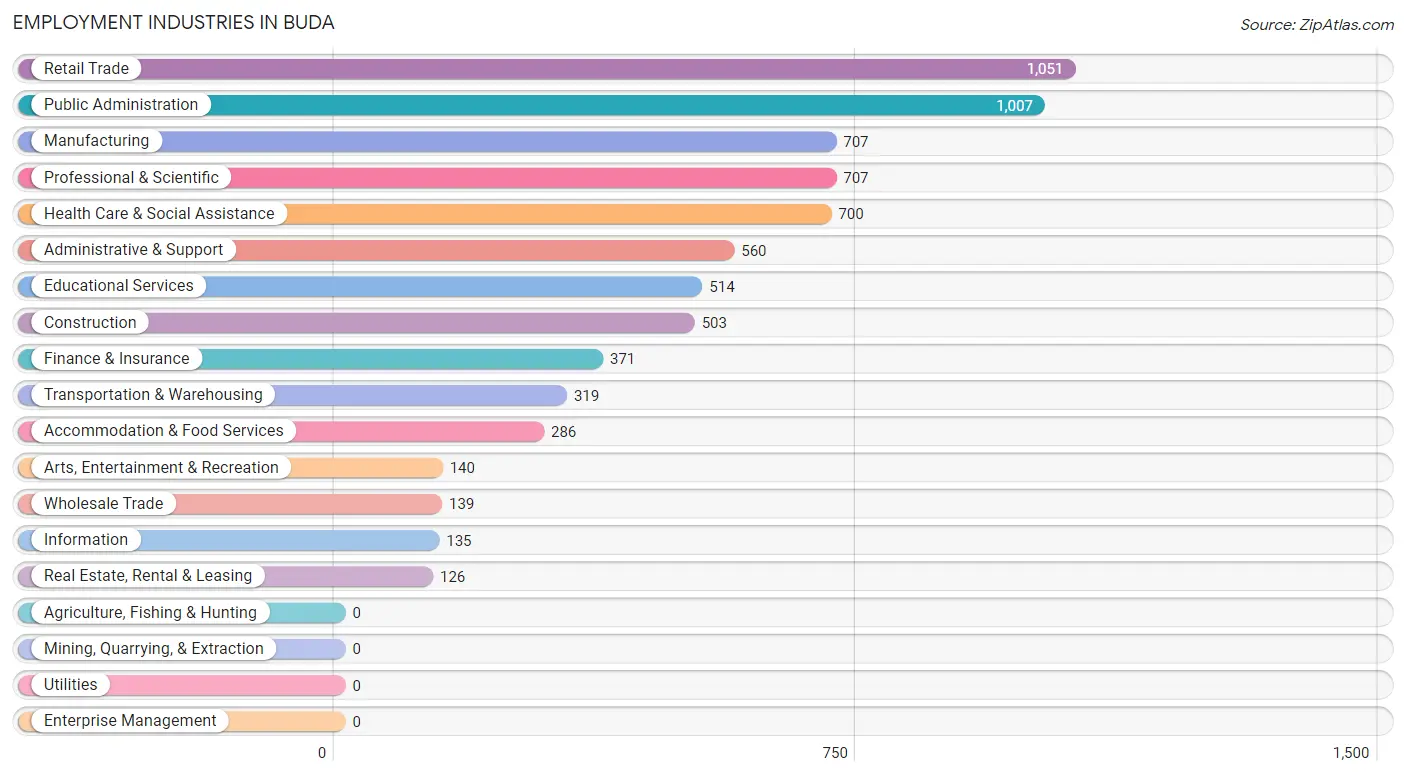
The major employment industries in Buda include Retail Trade (1,051 | 13.9%), Public Administration (1,007 | 13.3%), Manufacturing (707 | 9.3%), Professional & Scientific (707 | 9.3%), and Health Care & Social Assistance (700 | 9.3%).
Employment Industries by Sex in Buda
The Buda industries that see more men than women are Manufacturing (91.5%), Arts, Entertainment & Recreation (90.7%), and Construction (86.5%), whereas the industries that tend to have a higher number of women are Health Care & Social Assistance (79.7%), Wholesale Trade (77.7%), and Real Estate, Rental & Leasing (67.5%).
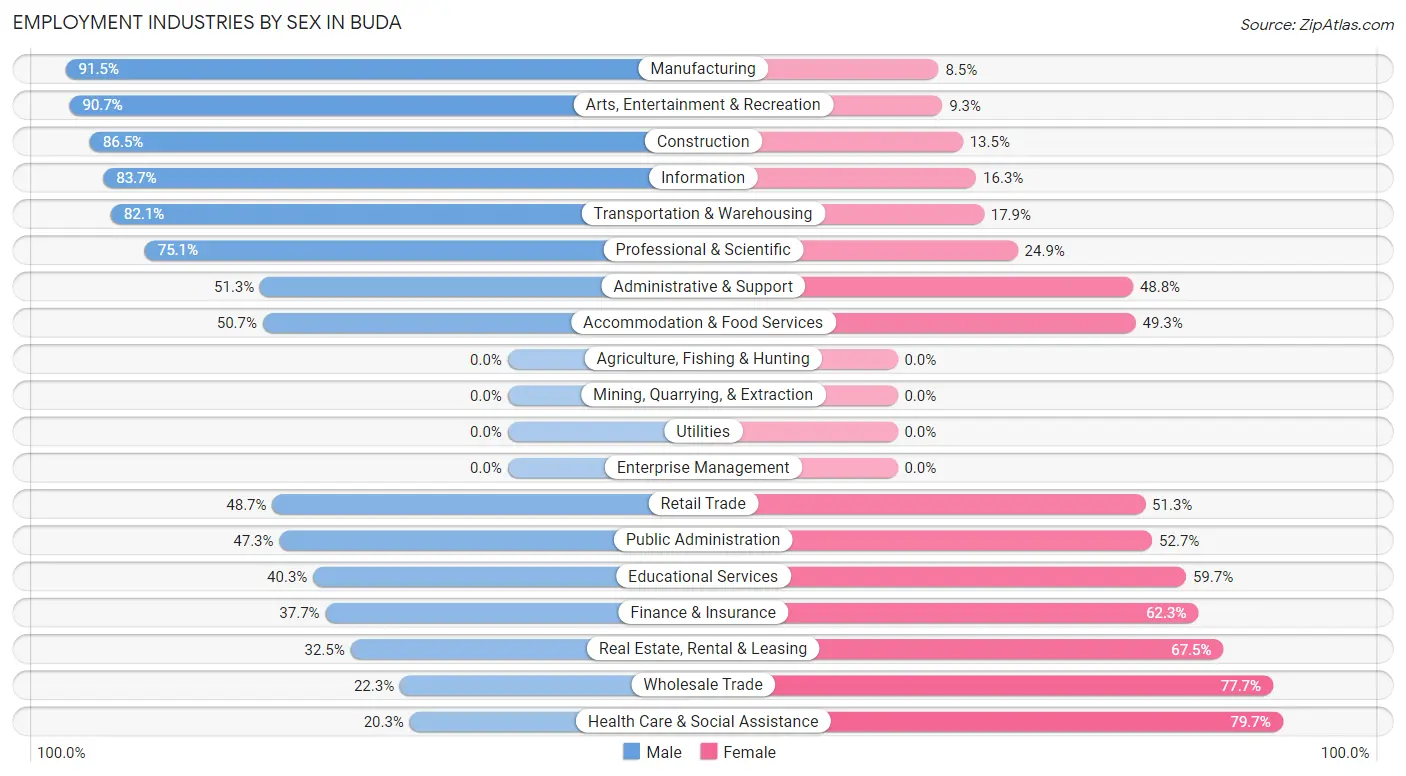
| Industry | Male | Female |
| Agriculture, Fishing & Hunting | 0 (0.0%) | 0 (0.0%) |
| Mining, Quarrying, & Extraction | 0 (0.0%) | 0 (0.0%) |
| Construction | 435 (86.5%) | 68 (13.5%) |
| Manufacturing | 647 (91.5%) | 60 (8.5%) |
| Wholesale Trade | 31 (22.3%) | 108 (77.7%) |
| Retail Trade | 512 (48.7%) | 539 (51.3%) |
| Transportation & Warehousing | 262 (82.1%) | 57 (17.9%) |
| Utilities | 0 (0.0%) | 0 (0.0%) |
| Information | 113 (83.7%) | 22 (16.3%) |
| Finance & Insurance | 140 (37.7%) | 231 (62.3%) |
| Real Estate, Rental & Leasing | 41 (32.5%) | 85 (67.5%) |
| Professional & Scientific | 531 (75.1%) | 176 (24.9%) |
| Enterprise Management | 0 (0.0%) | 0 (0.0%) |
| Administrative & Support | 287 (51.2%) | 273 (48.7%) |
| Educational Services | 207 (40.3%) | 307 (59.7%) |
| Health Care & Social Assistance | 142 (20.3%) | 558 (79.7%) |
| Arts, Entertainment & Recreation | 127 (90.7%) | 13 (9.3%) |
| Accommodation & Food Services | 145 (50.7%) | 141 (49.3%) |
| Public Administration | 476 (47.3%) | 531 (52.7%) |
| Total | 4,192 (55.5%) | 3,366 (44.5%) |
Education in Buda
School Enrollment in Buda
The most common levels of schooling among the 4,093 students in Buda are elementary school (1,509 | 36.9%), high school (772 | 18.9%), and middle school (610 | 14.9%).
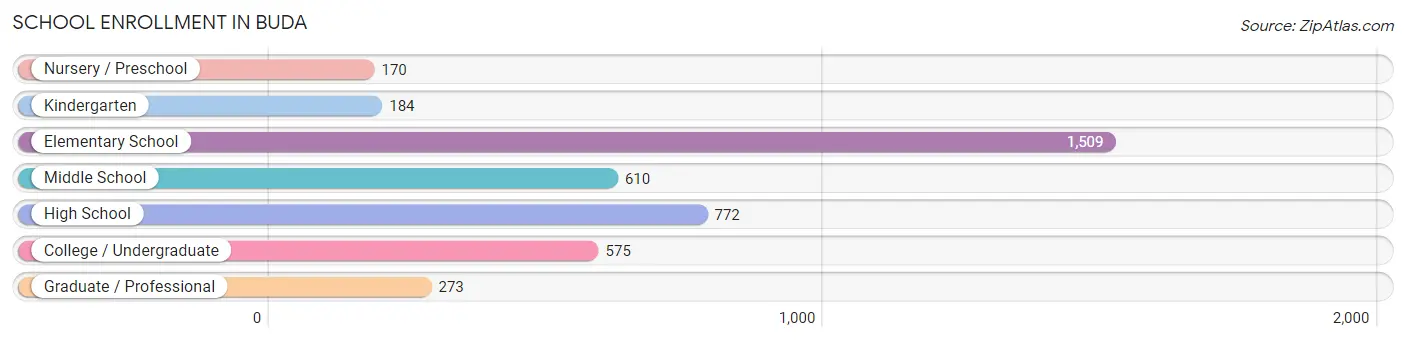
| School Level | # Students | % Students |
| Nursery / Preschool | 170 | 4.2% |
| Kindergarten | 184 | 4.5% |
| Elementary School | 1,509 | 36.9% |
| Middle School | 610 | 14.9% |
| High School | 772 | 18.9% |
| College / Undergraduate | 575 | 14.1% |
| Graduate / Professional | 273 | 6.7% |
| Total | 4,093 | 100.0% |
School Enrollment by Age by Funding Source in Buda
Out of a total of 4,093 students who are enrolled in schools in Buda, 389 (9.5%) attend a private institution, while the remaining 3,704 (90.5%) are enrolled in public schools. The age group of 3 to 4 year olds has the highest likelihood of being enrolled in private schools, with 73 (42.9% in the age bracket) enrolled. Conversely, the age group of 5 to 9 year old has the lowest likelihood of being enrolled in a private school, with 1,405 (100.0% in the age bracket) attending a public institution.
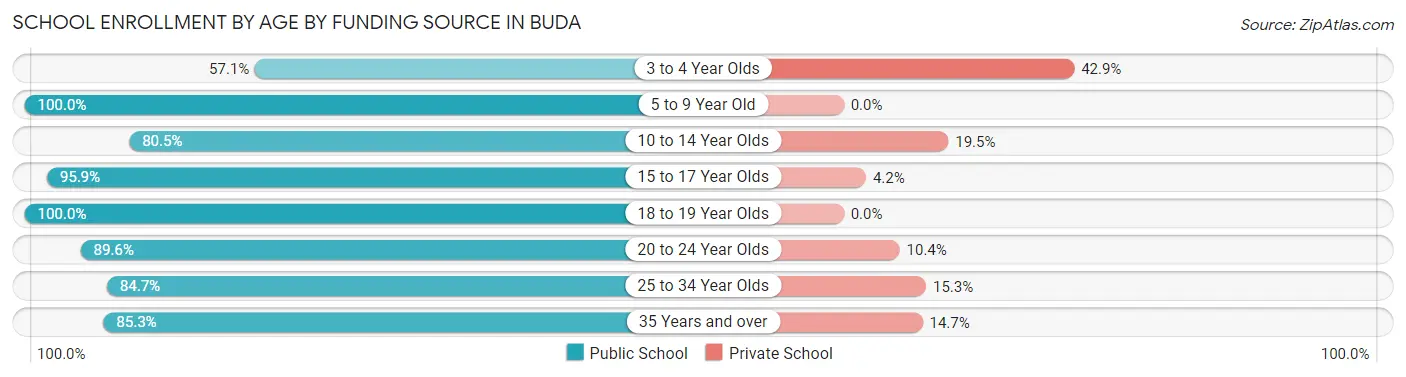
| Age Bracket | Public School | Private School |
| 3 to 4 Year Olds | 97 (57.1%) | 73 (42.9%) |
| 5 to 9 Year Old | 1,405 (100.0%) | 0 (0.0%) |
| 10 to 14 Year Olds | 723 (80.5%) | 175 (19.5%) |
| 15 to 17 Year Olds | 740 (95.9%) | 32 (4.2%) |
| 18 to 19 Year Olds | 32 (100.0%) | 0 (0.0%) |
| 20 to 24 Year Olds | 275 (89.6%) | 32 (10.4%) |
| 25 to 34 Year Olds | 160 (84.7%) | 29 (15.3%) |
| 35 Years and over | 273 (85.3%) | 47 (14.7%) |
| Total | 3,704 (90.5%) | 389 (9.5%) |
Educational Attainment by Field of Study in Buda
Business (825 | 15.2%), social sciences (564 | 10.4%), arts & humanities (536 | 9.9%), communications (498 | 9.2%), and psychology (491 | 9.0%) are the most common fields of study among 5,431 individuals in Buda who have obtained a bachelor's degree or higher.
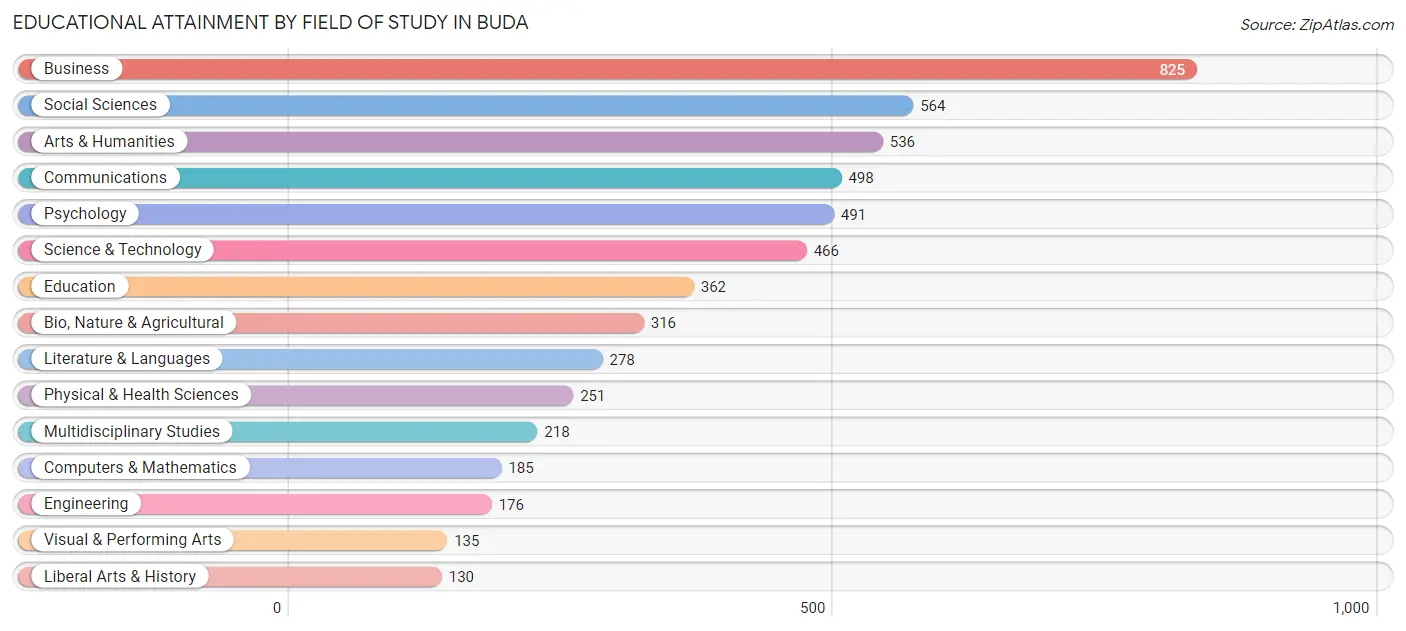
| Field of Study | # Graduates | % Graduates |
| Computers & Mathematics | 185 | 3.4% |
| Bio, Nature & Agricultural | 316 | 5.8% |
| Physical & Health Sciences | 251 | 4.6% |
| Psychology | 491 | 9.0% |
| Social Sciences | 564 | 10.4% |
| Engineering | 176 | 3.2% |
| Multidisciplinary Studies | 218 | 4.0% |
| Science & Technology | 466 | 8.6% |
| Business | 825 | 15.2% |
| Education | 362 | 6.7% |
| Literature & Languages | 278 | 5.1% |
| Liberal Arts & History | 130 | 2.4% |
| Visual & Performing Arts | 135 | 2.5% |
| Communications | 498 | 9.2% |
| Arts & Humanities | 536 | 9.9% |
| Total | 5,431 | 100.0% |
Transportation & Commute in Buda
Vehicle Availability by Sex in Buda
The most prevalent vehicle ownership categories in Buda are males with 2 vehicles (2,374, accounting for 55.9%) and females with 2 vehicles (1,673, making up 71.6%).
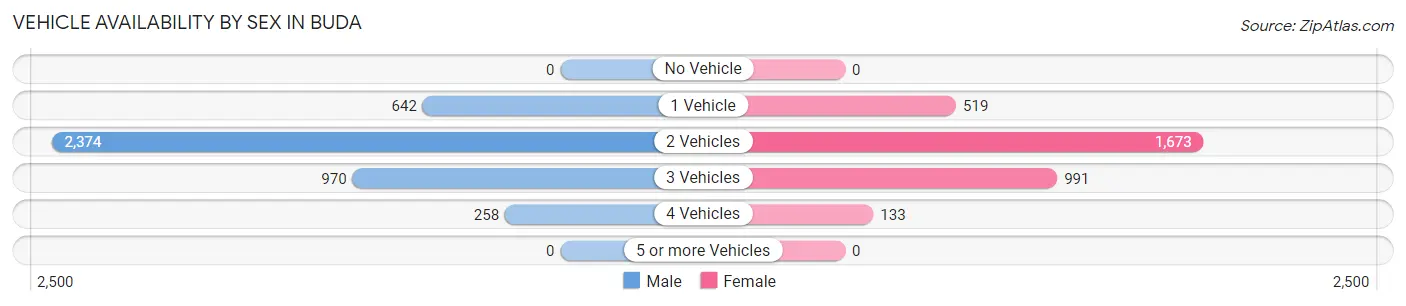
| Vehicles Available | Male | Female |
| No Vehicle | 0 (0.0%) | 0 (0.0%) |
| 1 Vehicle | 642 (15.1%) | 519 (15.7%) |
| 2 Vehicles | 2,374 (55.9%) | 1,673 (50.4%) |
| 3 Vehicles | 970 (22.9%) | 991 (29.9%) |
| 4 Vehicles | 258 (6.1%) | 133 (4.0%) |
| 5 or more Vehicles | 0 (0.0%) | 0 (0.0%) |
| Total | 4,244 (100.0%) | 3,316 (100.0%) |
Commute Time in Buda
The most frequently occuring commute durations in Buda are 30 to 34 minutes (1,283 commuters, 20.2%), 20 to 24 minutes (984 commuters, 15.5%), and 45 to 59 minutes (958 commuters, 15.0%).
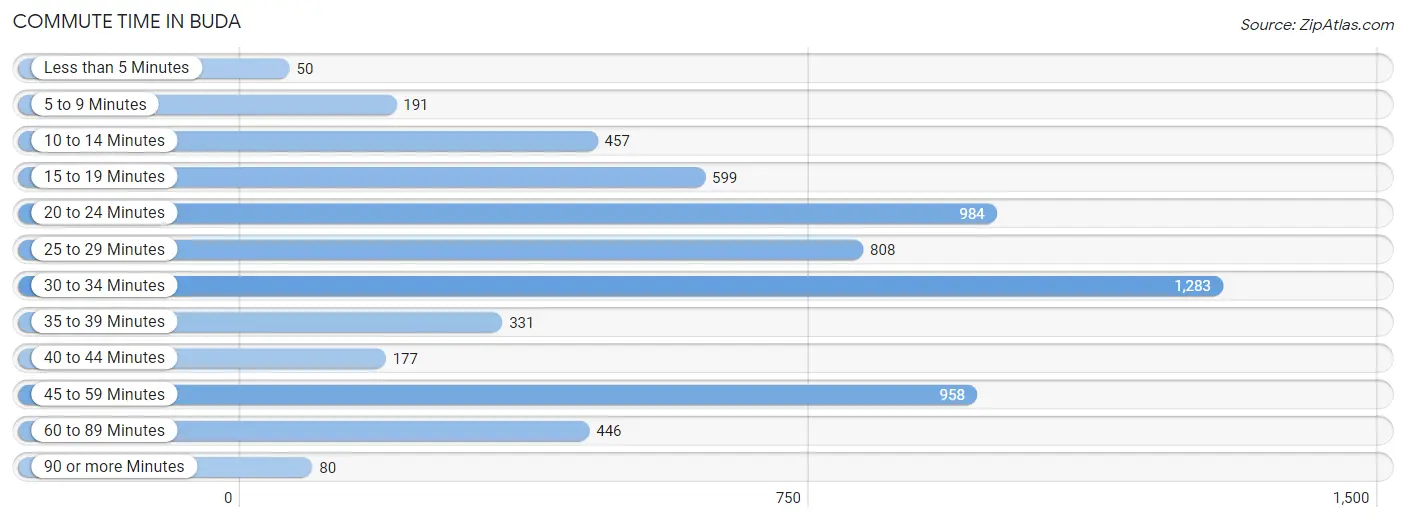
| Commute Time | # Commuters | % Commuters |
| Less than 5 Minutes | 50 | 0.8% |
| 5 to 9 Minutes | 191 | 3.0% |
| 10 to 14 Minutes | 457 | 7.2% |
| 15 to 19 Minutes | 599 | 9.4% |
| 20 to 24 Minutes | 984 | 15.5% |
| 25 to 29 Minutes | 808 | 12.7% |
| 30 to 34 Minutes | 1,283 | 20.2% |
| 35 to 39 Minutes | 331 | 5.2% |
| 40 to 44 Minutes | 177 | 2.8% |
| 45 to 59 Minutes | 958 | 15.0% |
| 60 to 89 Minutes | 446 | 7.0% |
| 90 or more Minutes | 80 | 1.3% |
Commute Time by Sex in Buda
The most common commute times in Buda are 30 to 34 minutes (901 commuters, 23.8%) for males and 15 to 19 minutes (425 commuters, 16.5%) for females.
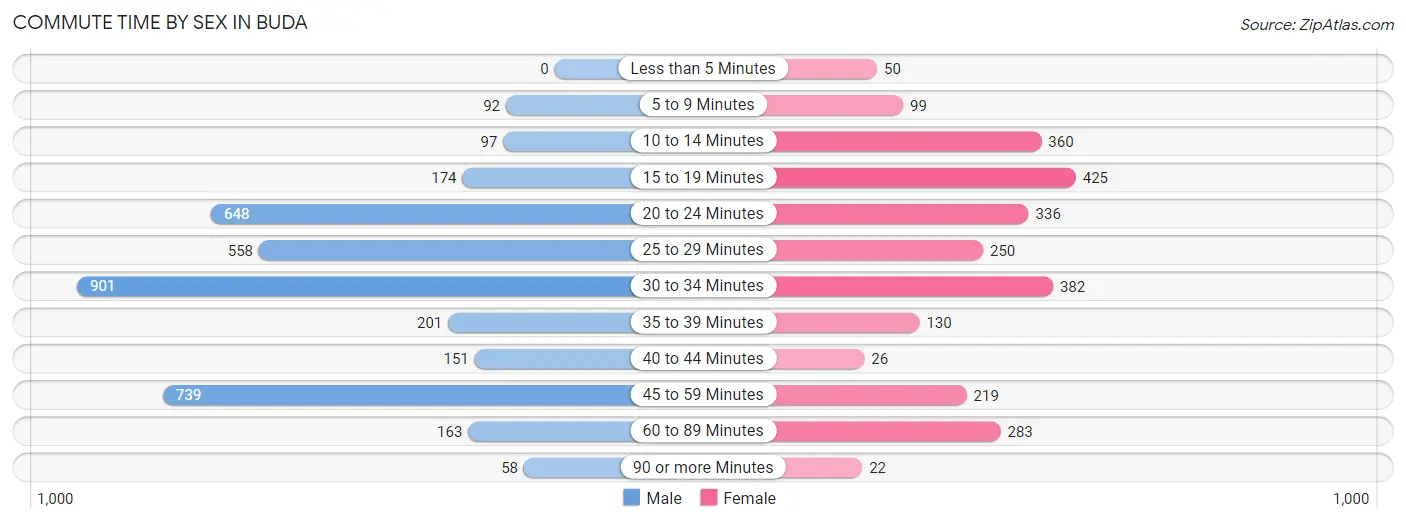
| Commute Time | Male | Female |
| Less than 5 Minutes | 0 (0.0%) | 50 (1.9%) |
| 5 to 9 Minutes | 92 (2.4%) | 99 (3.8%) |
| 10 to 14 Minutes | 97 (2.6%) | 360 (13.9%) |
| 15 to 19 Minutes | 174 (4.6%) | 425 (16.5%) |
| 20 to 24 Minutes | 648 (17.1%) | 336 (13.0%) |
| 25 to 29 Minutes | 558 (14.7%) | 250 (9.7%) |
| 30 to 34 Minutes | 901 (23.8%) | 382 (14.8%) |
| 35 to 39 Minutes | 201 (5.3%) | 130 (5.0%) |
| 40 to 44 Minutes | 151 (4.0%) | 26 (1.0%) |
| 45 to 59 Minutes | 739 (19.5%) | 219 (8.5%) |
| 60 to 89 Minutes | 163 (4.3%) | 283 (11.0%) |
| 90 or more Minutes | 58 (1.5%) | 22 (0.9%) |
Time of Departure to Work by Sex in Buda
The most frequent times of departure to work in Buda are 6:30 AM to 6:59 AM (700, 18.5%) for males and 6:30 AM to 6:59 AM (539, 20.9%) for females.
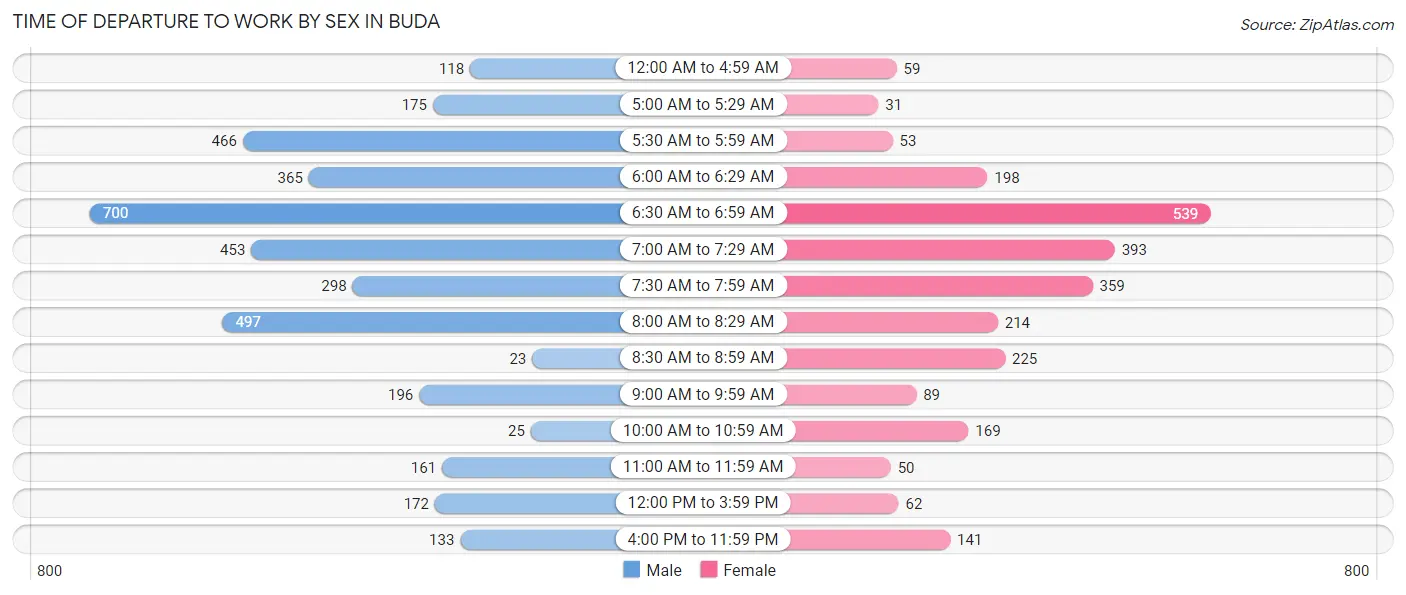
| Time of Departure | Male | Female |
| 12:00 AM to 4:59 AM | 118 (3.1%) | 59 (2.3%) |
| 5:00 AM to 5:29 AM | 175 (4.6%) | 31 (1.2%) |
| 5:30 AM to 5:59 AM | 466 (12.3%) | 53 (2.1%) |
| 6:00 AM to 6:29 AM | 365 (9.7%) | 198 (7.7%) |
| 6:30 AM to 6:59 AM | 700 (18.5%) | 539 (20.9%) |
| 7:00 AM to 7:29 AM | 453 (12.0%) | 393 (15.2%) |
| 7:30 AM to 7:59 AM | 298 (7.9%) | 359 (13.9%) |
| 8:00 AM to 8:29 AM | 497 (13.1%) | 214 (8.3%) |
| 8:30 AM to 8:59 AM | 23 (0.6%) | 225 (8.7%) |
| 9:00 AM to 9:59 AM | 196 (5.2%) | 89 (3.5%) |
| 10:00 AM to 10:59 AM | 25 (0.7%) | 169 (6.6%) |
| 11:00 AM to 11:59 AM | 161 (4.3%) | 50 (1.9%) |
| 12:00 PM to 3:59 PM | 172 (4.5%) | 62 (2.4%) |
| 4:00 PM to 11:59 PM | 133 (3.5%) | 141 (5.5%) |
| Total | 3,782 (100.0%) | 2,582 (100.0%) |
Housing Occupancy in Buda
Occupancy by Ownership in Buda
Of the total 5,695 dwellings in Buda, owner-occupied units account for 4,123 (72.4%), while renter-occupied units make up 1,572 (27.6%).
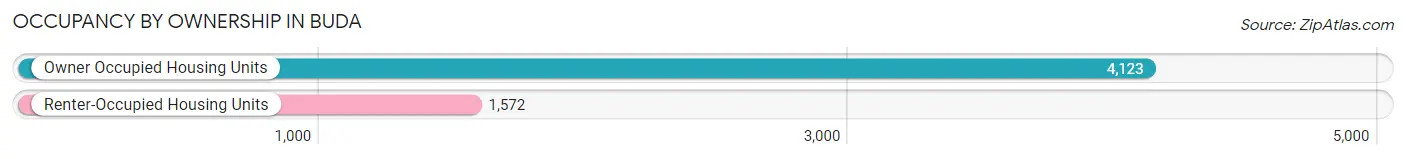
| Occupancy | # Housing Units | % Housing Units |
| Owner Occupied Housing Units | 4,123 | 72.4% |
| Renter-Occupied Housing Units | 1,572 | 27.6% |
| Total Occupied Housing Units | 5,695 | 100.0% |
Occupancy by Household Size in Buda
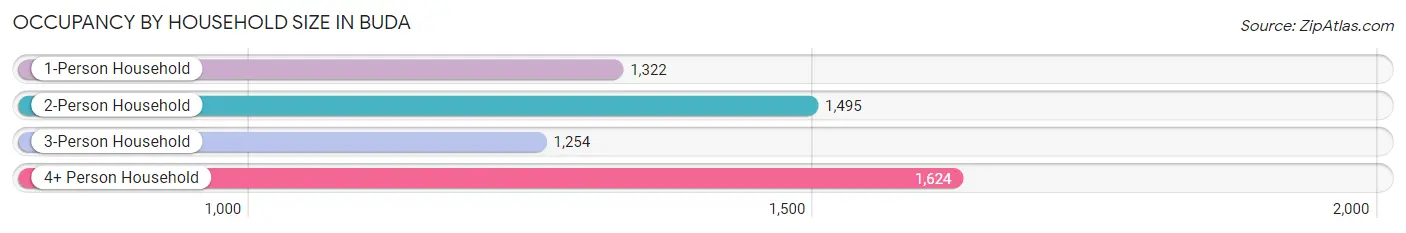
| Household Size | # Housing Units | % Housing Units |
| 1-Person Household | 1,322 | 23.2% |
| 2-Person Household | 1,495 | 26.3% |
| 3-Person Household | 1,254 | 22.0% |
| 4+ Person Household | 1,624 | 28.5% |
| Total Housing Units | 5,695 | 100.0% |
Occupancy by Ownership by Household Size in Buda
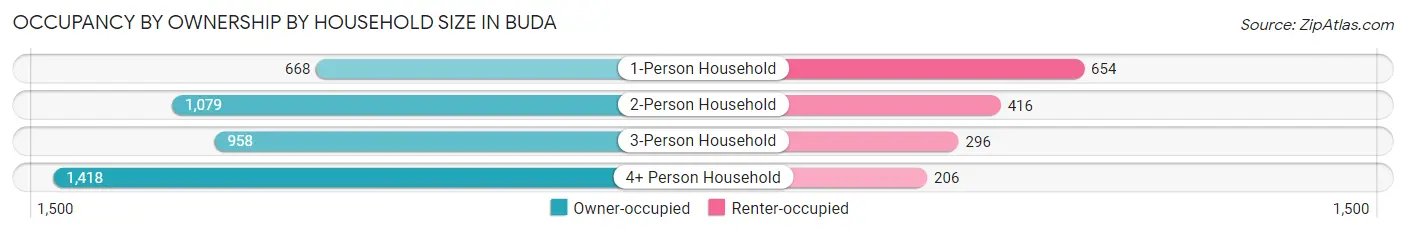
| Household Size | Owner-occupied | Renter-occupied |
| 1-Person Household | 668 (50.5%) | 654 (49.5%) |
| 2-Person Household | 1,079 (72.2%) | 416 (27.8%) |
| 3-Person Household | 958 (76.4%) | 296 (23.6%) |
| 4+ Person Household | 1,418 (87.3%) | 206 (12.7%) |
| Total Housing Units | 4,123 (72.4%) | 1,572 (27.6%) |
Occupancy by Educational Attainment in Buda
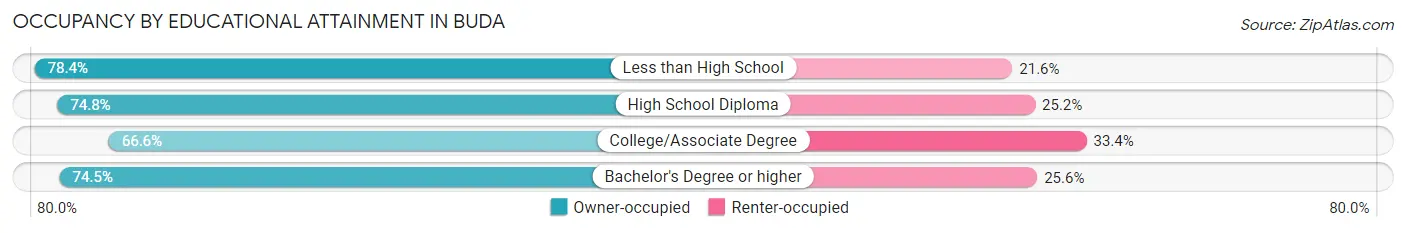
| Household Size | Owner-occupied | Renter-occupied |
| Less than High School | 127 (78.4%) | 35 (21.6%) |
| High School Diploma | 635 (74.8%) | 214 (25.2%) |
| College/Associate Degree | 1,074 (66.6%) | 538 (33.4%) |
| Bachelor's Degree or higher | 2,287 (74.5%) | 785 (25.6%) |
Occupancy by Age of Householder in Buda
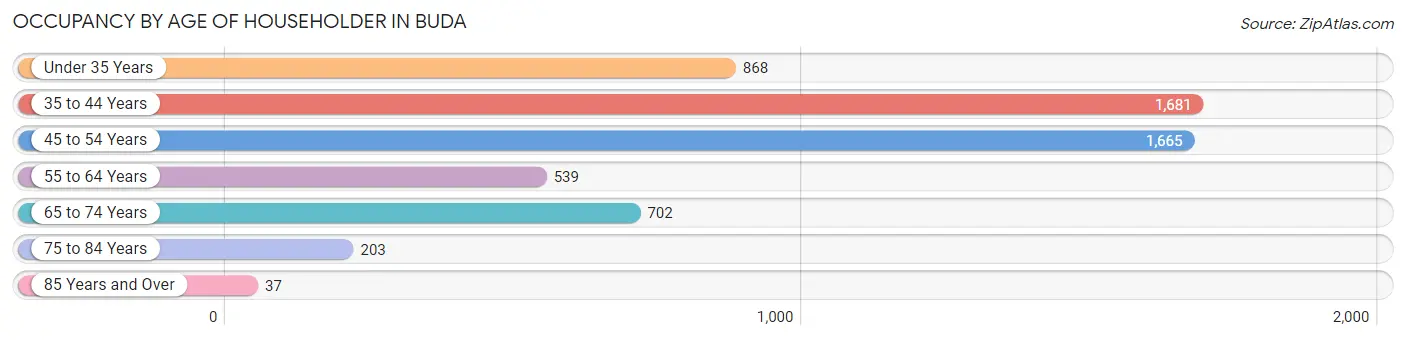
| Age Bracket | # Households | % Households |
| Under 35 Years | 868 | 15.2% |
| 35 to 44 Years | 1,681 | 29.5% |
| 45 to 54 Years | 1,665 | 29.2% |
| 55 to 64 Years | 539 | 9.5% |
| 65 to 74 Years | 702 | 12.3% |
| 75 to 84 Years | 203 | 3.6% |
| 85 Years and Over | 37 | 0.6% |
| Total | 5,695 | 100.0% |
Housing Finances in Buda
Median Income by Occupancy in Buda
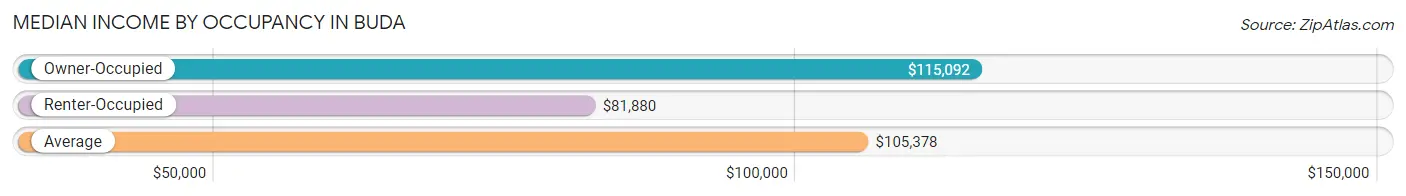
| Occupancy Type | # Households | Median Income |
| Owner-Occupied | 4,123 (72.4%) | $115,092 |
| Renter-Occupied | 1,572 (27.6%) | $81,880 |
| Average | 5,695 (100.0%) | $105,378 |
Occupancy by Householder Income Bracket in Buda
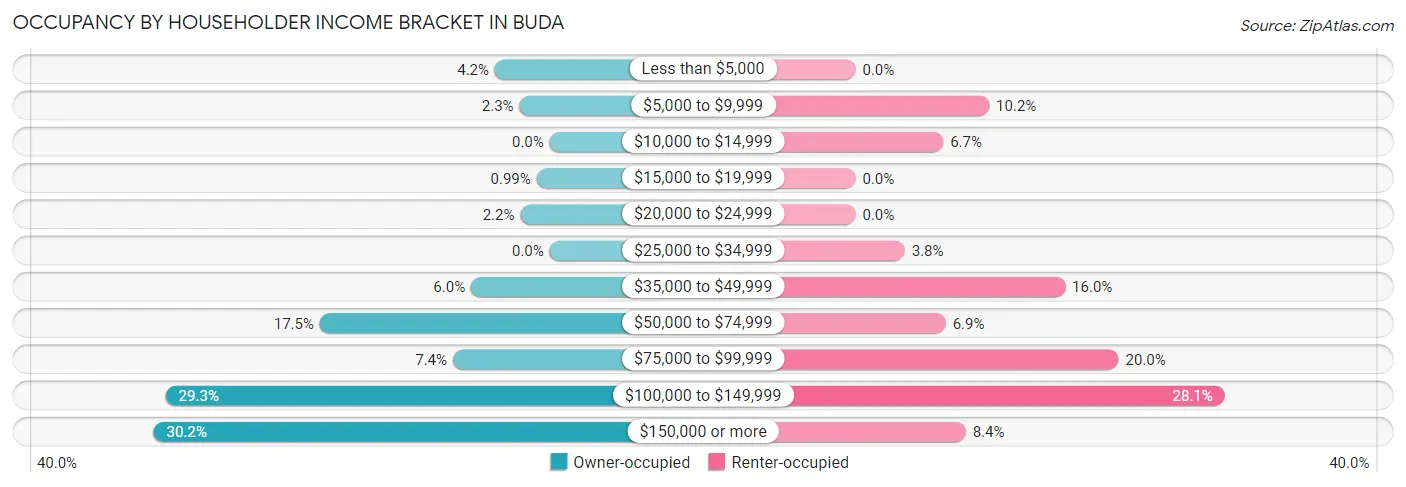
| Income Bracket | Owner-occupied | Renter-occupied |
| Less than $5,000 | 172 (4.2%) | 0 (0.0%) |
| $5,000 to $9,999 | 95 (2.3%) | 160 (10.2%) |
| $10,000 to $14,999 | 0 (0.0%) | 105 (6.7%) |
| $15,000 to $19,999 | 41 (1.0%) | 0 (0.0%) |
| $20,000 to $24,999 | 92 (2.2%) | 0 (0.0%) |
| $25,000 to $34,999 | 0 (0.0%) | 59 (3.7%) |
| $35,000 to $49,999 | 247 (6.0%) | 251 (16.0%) |
| $50,000 to $74,999 | 722 (17.5%) | 108 (6.9%) |
| $75,000 to $99,999 | 304 (7.4%) | 315 (20.0%) |
| $100,000 to $149,999 | 1,206 (29.2%) | 442 (28.1%) |
| $150,000 or more | 1,244 (30.2%) | 132 (8.4%) |
| Total | 4,123 (100.0%) | 1,572 (100.0%) |
Monthly Housing Cost Tiers in Buda
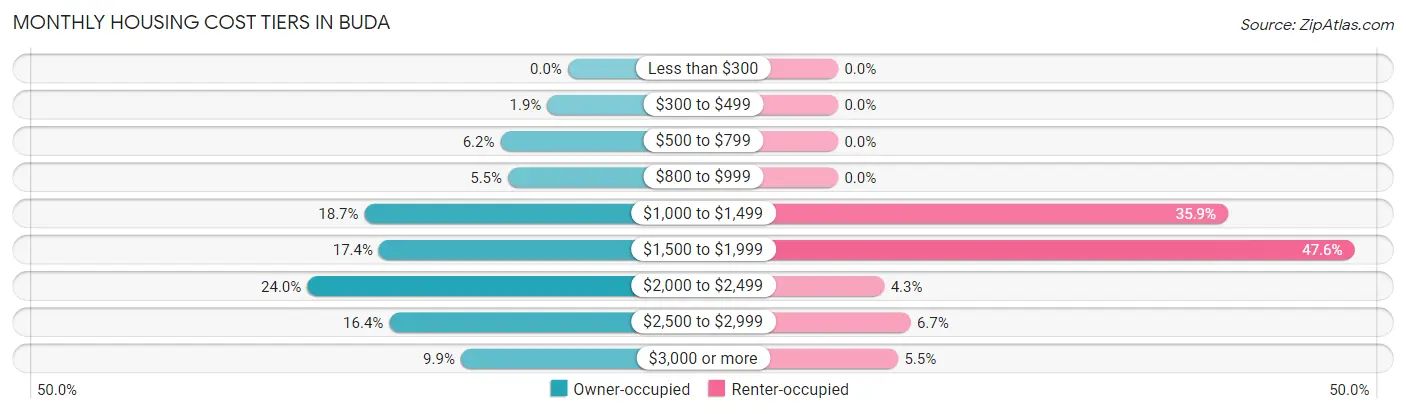
| Monthly Cost | Owner-occupied | Renter-occupied |
| Less than $300 | 0 (0.0%) | 0 (0.0%) |
| $300 to $499 | 78 (1.9%) | 0 (0.0%) |
| $500 to $799 | 256 (6.2%) | 0 (0.0%) |
| $800 to $999 | 227 (5.5%) | 0 (0.0%) |
| $1,000 to $1,499 | 772 (18.7%) | 565 (35.9%) |
| $1,500 to $1,999 | 717 (17.4%) | 748 (47.6%) |
| $2,000 to $2,499 | 989 (24.0%) | 67 (4.3%) |
| $2,500 to $2,999 | 678 (16.4%) | 105 (6.7%) |
| $3,000 or more | 406 (9.9%) | 87 (5.5%) |
| Total | 4,123 (100.0%) | 1,572 (100.0%) |
Physical Housing Characteristics in Buda
Housing Structures in Buda
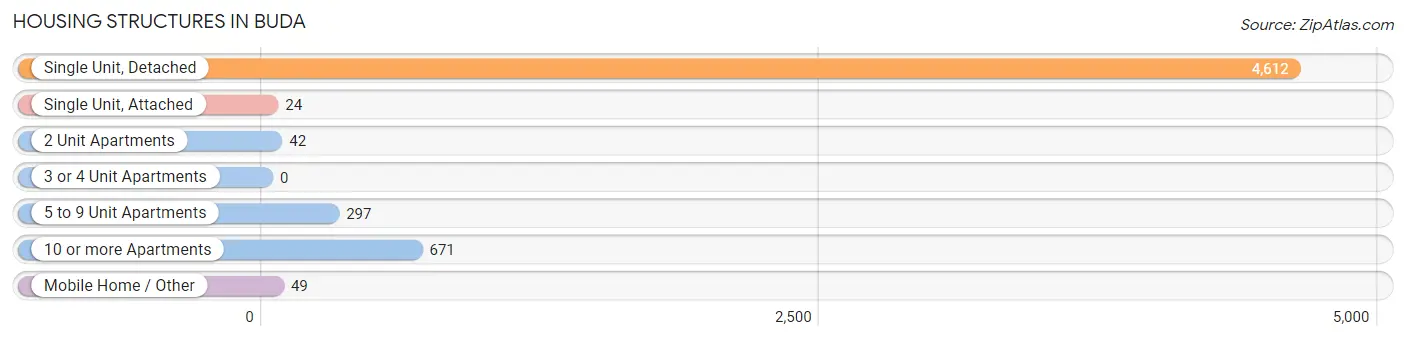
| Structure Type | # Housing Units | % Housing Units |
| Single Unit, Detached | 4,612 | 81.0% |
| Single Unit, Attached | 24 | 0.4% |
| 2 Unit Apartments | 42 | 0.7% |
| 3 or 4 Unit Apartments | 0 | 0.0% |
| 5 to 9 Unit Apartments | 297 | 5.2% |
| 10 or more Apartments | 671 | 11.8% |
| Mobile Home / Other | 49 | 0.9% |
| Total | 5,695 | 100.0% |
Housing Structures by Occupancy in Buda
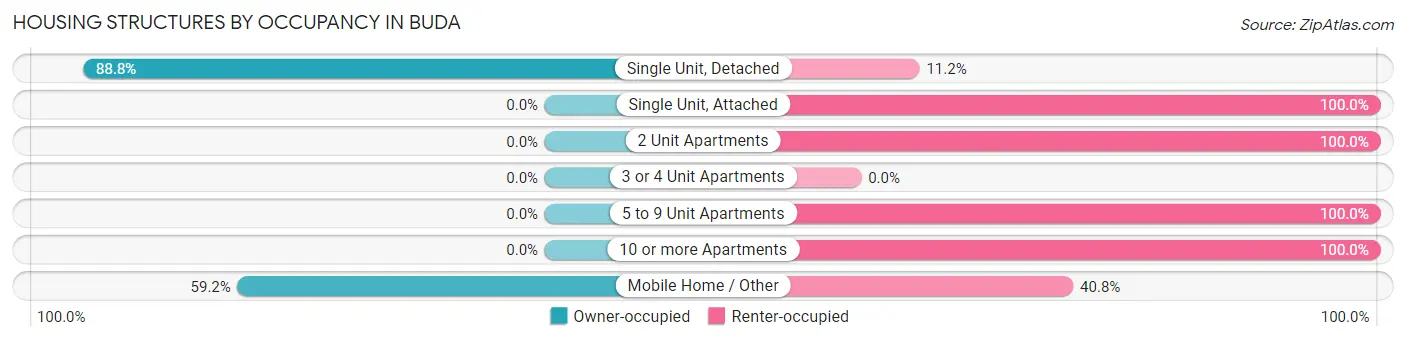
| Structure Type | Owner-occupied | Renter-occupied |
| Single Unit, Detached | 4,094 (88.8%) | 518 (11.2%) |
| Single Unit, Attached | 0 (0.0%) | 24 (100.0%) |
| 2 Unit Apartments | 0 (0.0%) | 42 (100.0%) |
| 3 or 4 Unit Apartments | 0 (0.0%) | 0 (0.0%) |
| 5 to 9 Unit Apartments | 0 (0.0%) | 297 (100.0%) |
| 10 or more Apartments | 0 (0.0%) | 671 (100.0%) |
| Mobile Home / Other | 29 (59.2%) | 20 (40.8%) |
| Total | 4,123 (72.4%) | 1,572 (27.6%) |
Housing Structures by Number of Rooms in Buda
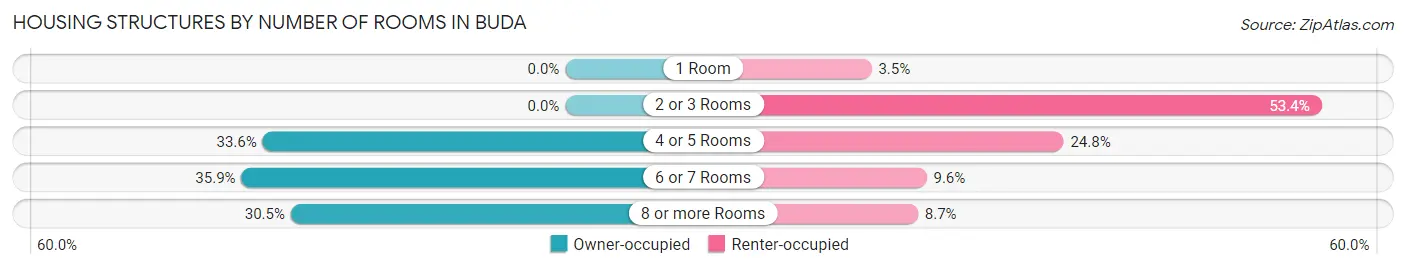
| Number of Rooms | Owner-occupied | Renter-occupied |
| 1 Room | 0 (0.0%) | 55 (3.5%) |
| 2 or 3 Rooms | 0 (0.0%) | 840 (53.4%) |
| 4 or 5 Rooms | 1,385 (33.6%) | 390 (24.8%) |
| 6 or 7 Rooms | 1,482 (35.9%) | 151 (9.6%) |
| 8 or more Rooms | 1,256 (30.5%) | 136 (8.6%) |
| Total | 4,123 (100.0%) | 1,572 (100.0%) |
Housing Structure by Heating Type in Buda
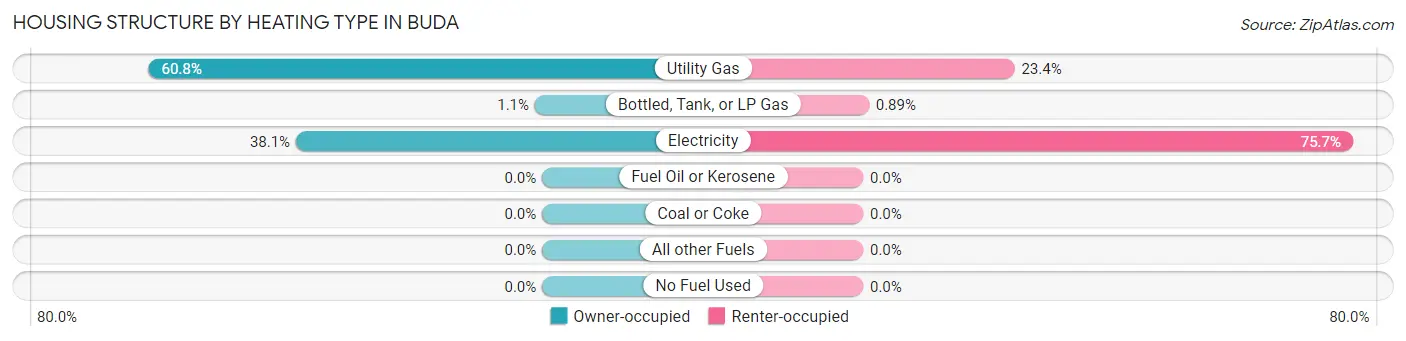
| Heating Type | Owner-occupied | Renter-occupied |
| Utility Gas | 2,508 (60.8%) | 368 (23.4%) |
| Bottled, Tank, or LP Gas | 46 (1.1%) | 14 (0.9%) |
| Electricity | 1,569 (38.1%) | 1,190 (75.7%) |
| Fuel Oil or Kerosene | 0 (0.0%) | 0 (0.0%) |
| Coal or Coke | 0 (0.0%) | 0 (0.0%) |
| All other Fuels | 0 (0.0%) | 0 (0.0%) |
| No Fuel Used | 0 (0.0%) | 0 (0.0%) |
| Total | 4,123 (100.0%) | 1,572 (100.0%) |
Household Vehicle Usage in Buda
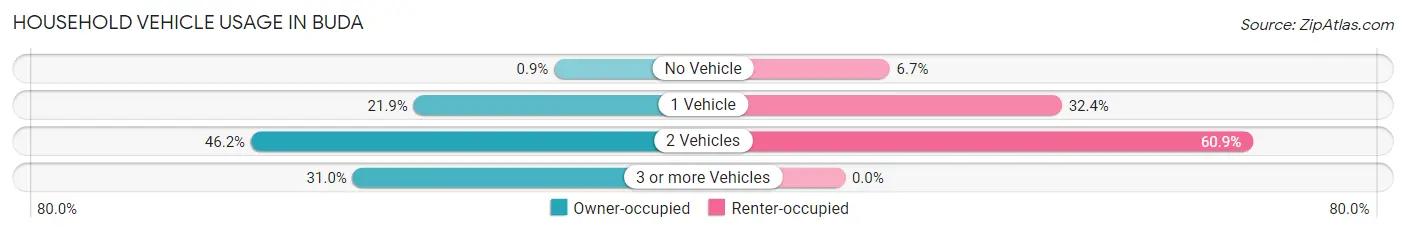
| Vehicles per Household | Owner-occupied | Renter-occupied |
| No Vehicle | 37 (0.9%) | 105 (6.7%) |
| 1 Vehicle | 903 (21.9%) | 509 (32.4%) |
| 2 Vehicles | 1,905 (46.2%) | 958 (60.9%) |
| 3 or more Vehicles | 1,278 (31.0%) | 0 (0.0%) |
| Total | 4,123 (100.0%) | 1,572 (100.0%) |
Real Estate & Mortgages in Buda
Real Estate and Mortgage Overview in Buda
| Characteristic | Without Mortgage | With Mortgage |
| Housing Units | 889 | 3,234 |
| Median Property Value | $351,900 | $360,400 |
| Median Household Income | $97,390 | $1,041 |
| Monthly Housing Costs | $909 | $406 |
| Real Estate Taxes | $6,750 | $64 |
Property Value by Mortgage Status in Buda
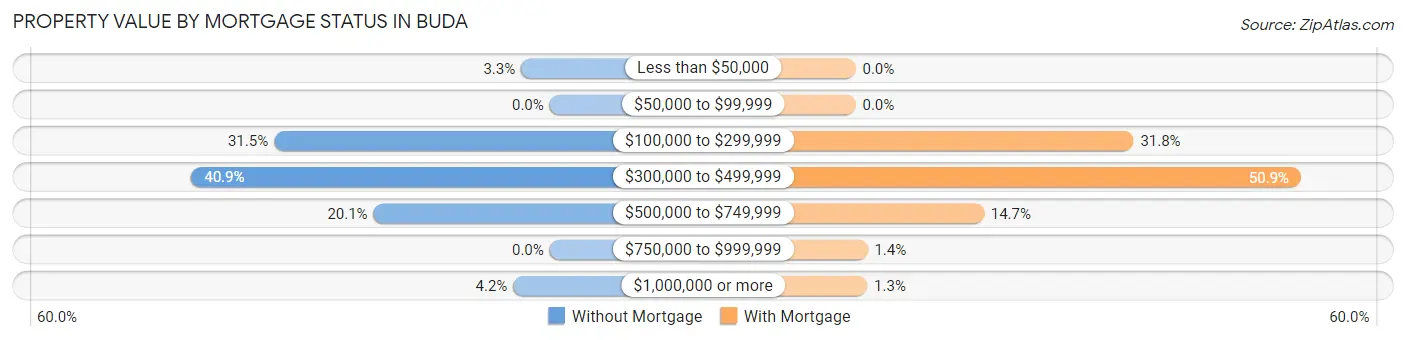
| Property Value | Without Mortgage | With Mortgage |
| Less than $50,000 | 29 (3.3%) | 0 (0.0%) |
| $50,000 to $99,999 | 0 (0.0%) | 0 (0.0%) |
| $100,000 to $299,999 | 280 (31.5%) | 1,027 (31.8%) |
| $300,000 to $499,999 | 364 (40.9%) | 1,646 (50.9%) |
| $500,000 to $749,999 | 179 (20.1%) | 474 (14.7%) |
| $750,000 to $999,999 | 0 (0.0%) | 44 (1.4%) |
| $1,000,000 or more | 37 (4.2%) | 43 (1.3%) |
| Total | 889 (100.0%) | 3,234 (100.0%) |
Household Income by Mortgage Status in Buda
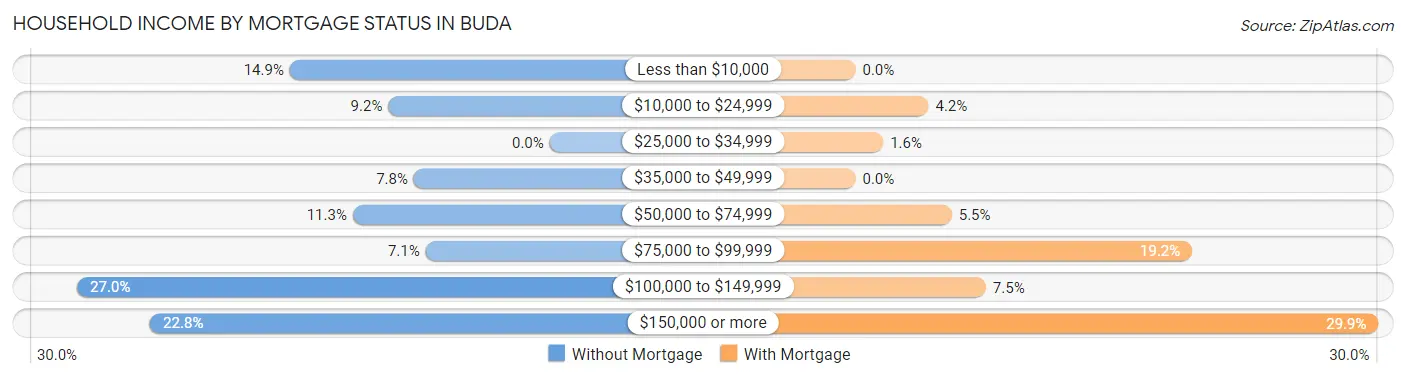
| Household Income | Without Mortgage | With Mortgage |
| Less than $10,000 | 132 (14.8%) | 0 (0.0%) |
| $10,000 to $24,999 | 82 (9.2%) | 135 (4.2%) |
| $25,000 to $34,999 | 0 (0.0%) | 51 (1.6%) |
| $35,000 to $49,999 | 69 (7.8%) | 0 (0.0%) |
| $50,000 to $74,999 | 100 (11.3%) | 178 (5.5%) |
| $75,000 to $99,999 | 63 (7.1%) | 622 (19.2%) |
| $100,000 to $149,999 | 240 (27.0%) | 241 (7.4%) |
| $150,000 or more | 203 (22.8%) | 966 (29.9%) |
| Total | 889 (100.0%) | 3,234 (100.0%) |
Property Value to Household Income Ratio in Buda
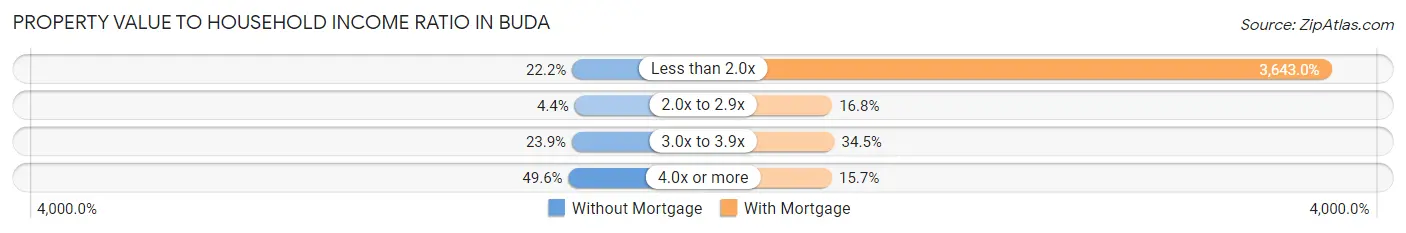
| Value-to-Income Ratio | Without Mortgage | With Mortgage |
| Less than 2.0x | 197 (22.2%) | 117,813 (3,642.9%) |
| 2.0x to 2.9x | 39 (4.4%) | 542 (16.8%) |
| 3.0x to 3.9x | 212 (23.8%) | 1,116 (34.5%) |
| 4.0x or more | 441 (49.6%) | 506 (15.7%) |
| Total | 889 (100.0%) | 3,234 (100.0%) |
Real Estate Taxes by Mortgage Status in Buda

| Property Taxes | Without Mortgage | With Mortgage |
| Less than $800 | 29 (3.3%) | 135 (4.2%) |
| $800 to $1,499 | 0 (0.0%) | 0 (0.0%) |
| $800 to $1,499 | 782 (88.0%) | 13 (0.4%) |
| Total | 889 (100.0%) | 3,234 (100.0%) |
Health & Disability in Buda
Health Insurance Coverage by Age in Buda
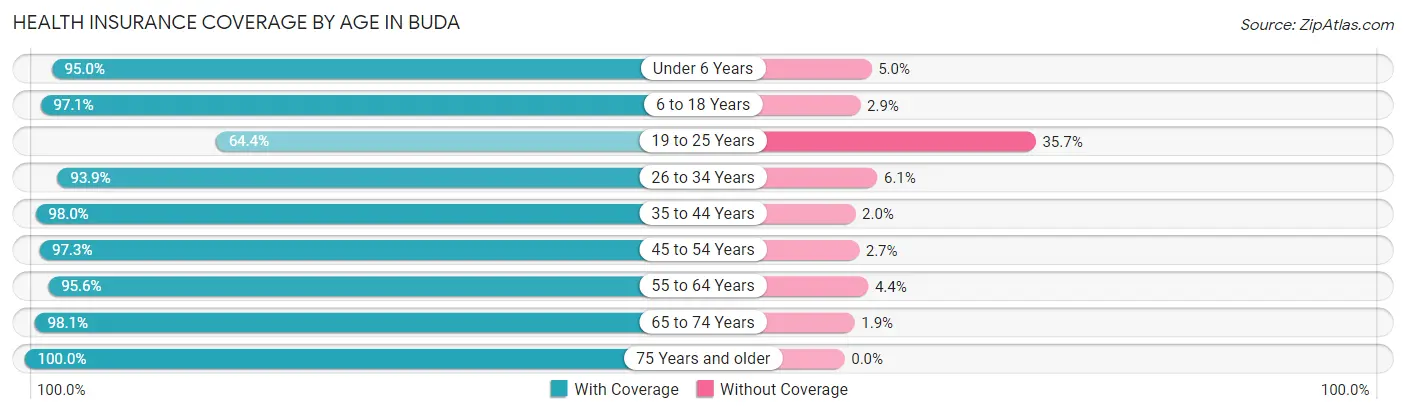
| Age Bracket | With Coverage | Without Coverage |
| Under 6 Years | 1,154 (95.0%) | 61 (5.0%) |
| 6 to 18 Years | 3,140 (97.1%) | 95 (2.9%) |
| 19 to 25 Years | 565 (64.3%) | 313 (35.6%) |
| 26 to 34 Years | 1,382 (93.9%) | 90 (6.1%) |
| 35 to 44 Years | 3,059 (98.0%) | 63 (2.0%) |
| 45 to 54 Years | 2,376 (97.3%) | 66 (2.7%) |
| 55 to 64 Years | 1,062 (95.6%) | 49 (4.4%) |
| 65 to 74 Years | 1,044 (98.1%) | 20 (1.9%) |
| 75 Years and older | 400 (100.0%) | 0 (0.0%) |
| Total | 14,182 (94.9%) | 757 (5.1%) |
Health Insurance Coverage by Citizenship Status in Buda
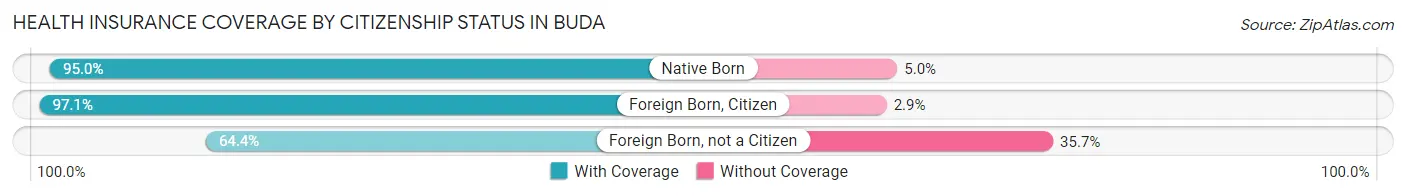
| Citizenship Status | With Coverage | Without Coverage |
| Native Born | 1,154 (95.0%) | 61 (5.0%) |
| Foreign Born, Citizen | 3,140 (97.1%) | 95 (2.9%) |
| Foreign Born, not a Citizen | 565 (64.3%) | 313 (35.6%) |
Health Insurance Coverage by Household Income in Buda
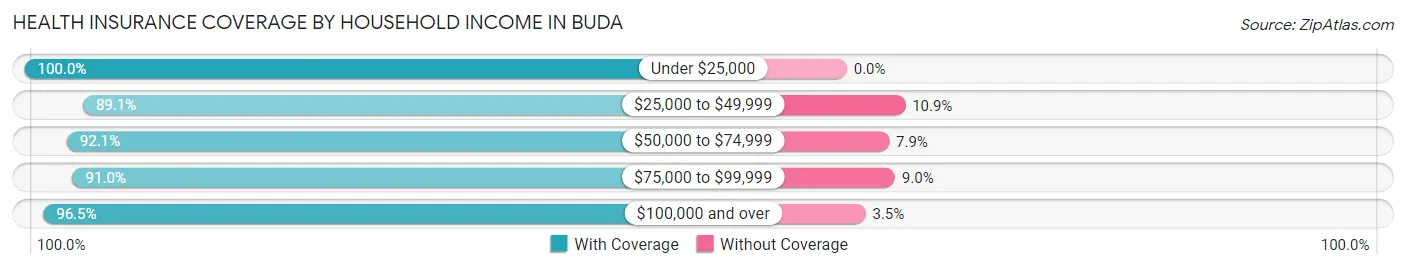
| Household Income | With Coverage | Without Coverage |
| Under $25,000 | 1,135 (100.0%) | 0 (0.0%) |
| $25,000 to $49,999 | 936 (89.1%) | 115 (10.9%) |
| $50,000 to $74,999 | 1,651 (92.1%) | 142 (7.9%) |
| $75,000 to $99,999 | 1,828 (91.0%) | 181 (9.0%) |
| $100,000 and over | 8,628 (96.5%) | 314 (3.5%) |
Public vs Private Health Insurance Coverage by Age in Buda
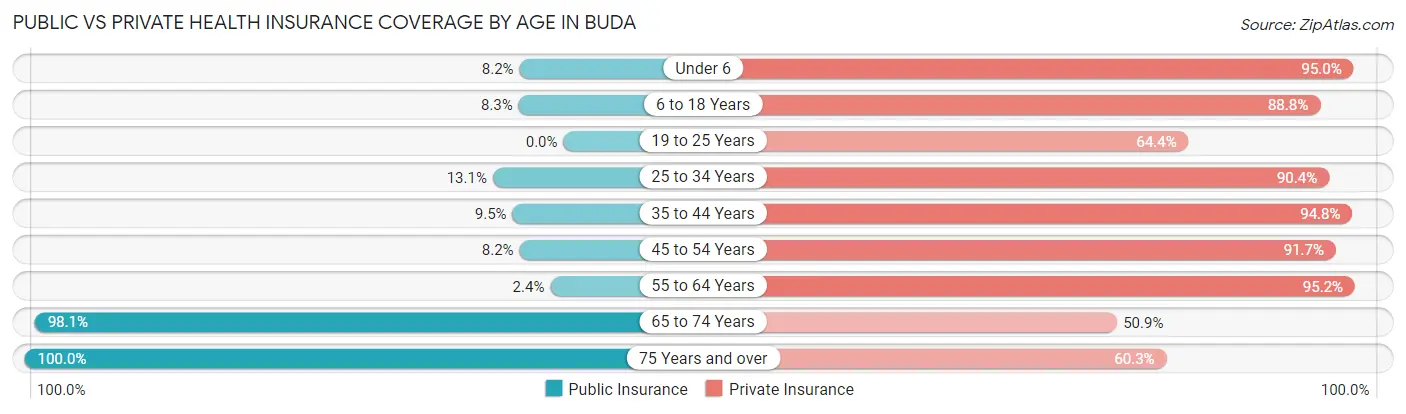
| Age Bracket | Public Insurance | Private Insurance |
| Under 6 | 99 (8.2%) | 1,154 (95.0%) |
| 6 to 18 Years | 269 (8.3%) | 2,871 (88.7%) |
| 19 to 25 Years | 0 (0.0%) | 565 (64.3%) |
| 25 to 34 Years | 193 (13.1%) | 1,331 (90.4%) |
| 35 to 44 Years | 295 (9.5%) | 2,958 (94.8%) |
| 45 to 54 Years | 199 (8.2%) | 2,239 (91.7%) |
| 55 to 64 Years | 27 (2.4%) | 1,058 (95.2%) |
| 65 to 74 Years | 1,044 (98.1%) | 542 (50.9%) |
| 75 Years and over | 400 (100.0%) | 241 (60.3%) |
| Total | 2,526 (16.9%) | 12,959 (86.8%) |
Disability Status by Sex by Age in Buda
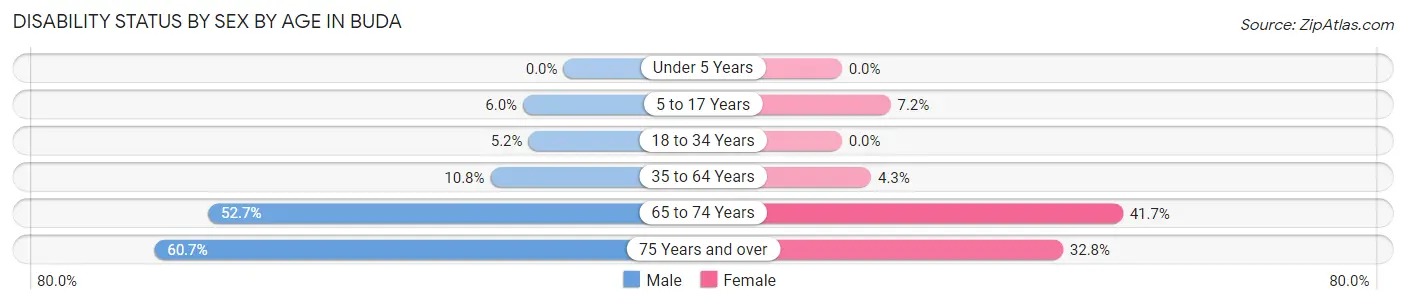
| Age Bracket | Male | Female |
| Under 5 Years | 0 (0.0%) | 0 (0.0%) |
| 5 to 17 Years | 113 (6.0%) | 114 (7.2%) |
| 18 to 34 Years | 72 (5.2%) | 0 (0.0%) |
| 35 to 64 Years | 364 (10.8%) | 144 (4.3%) |
| 65 to 74 Years | 173 (52.7%) | 307 (41.7%) |
| 75 Years and over | 82 (60.7%) | 87 (32.8%) |
Disability Class by Sex by Age in Buda
Disability Class: Hearing Difficulty
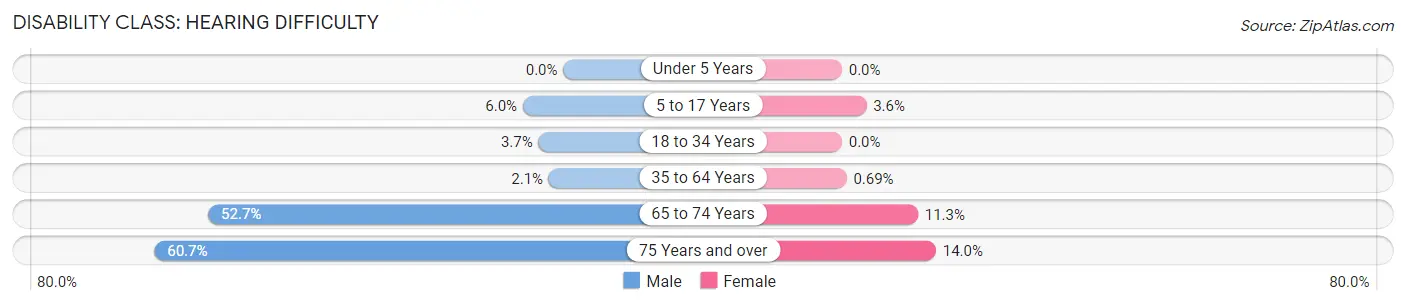
| Age Bracket | Male | Female |
| Under 5 Years | 0 (0.0%) | 0 (0.0%) |
| 5 to 17 Years | 113 (6.0%) | 57 (3.6%) |
| 18 to 34 Years | 51 (3.7%) | 0 (0.0%) |
| 35 to 64 Years | 72 (2.1%) | 23 (0.7%) |
| 65 to 74 Years | 173 (52.7%) | 83 (11.3%) |
| 75 Years and over | 82 (60.7%) | 37 (14.0%) |
Disability Class: Vision Difficulty
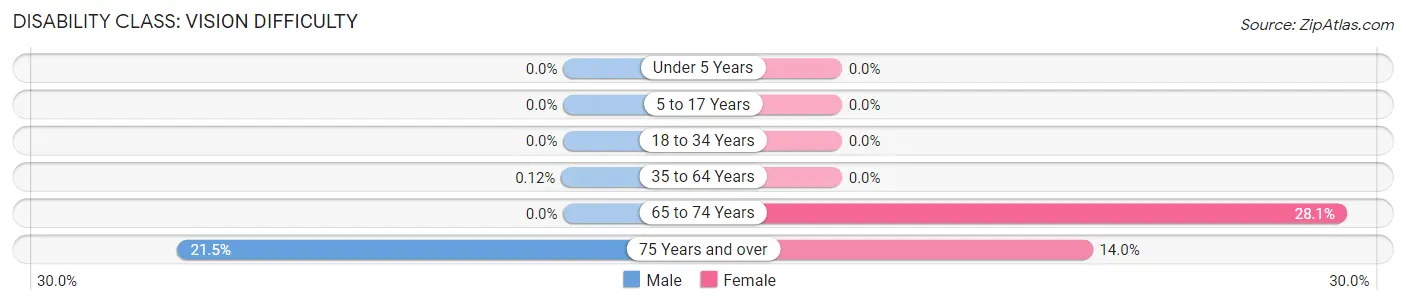
| Age Bracket | Male | Female |
| Under 5 Years | 0 (0.0%) | 0 (0.0%) |
| 5 to 17 Years | 0 (0.0%) | 0 (0.0%) |
| 18 to 34 Years | 0 (0.0%) | 0 (0.0%) |
| 35 to 64 Years | 4 (0.1%) | 0 (0.0%) |
| 65 to 74 Years | 0 (0.0%) | 207 (28.1%) |
| 75 Years and over | 29 (21.5%) | 37 (14.0%) |
Disability Class: Cognitive Difficulty
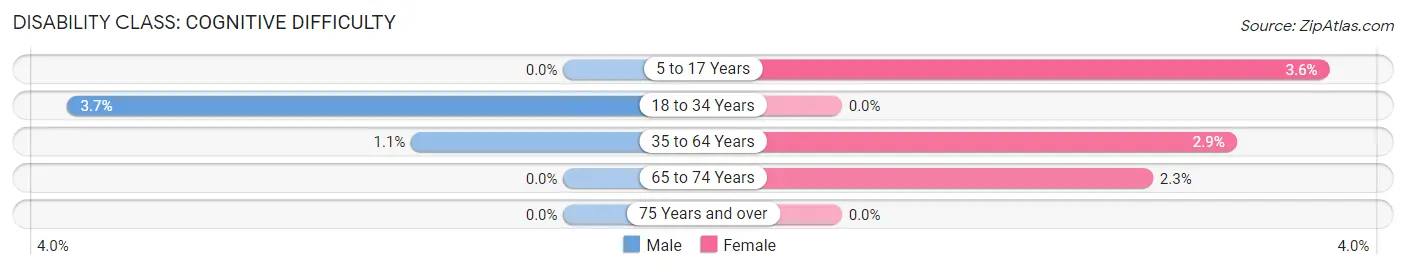
| Age Bracket | Male | Female |
| 5 to 17 Years | 0 (0.0%) | 57 (3.6%) |
| 18 to 34 Years | 51 (3.7%) | 0 (0.0%) |
| 35 to 64 Years | 38 (1.1%) | 97 (2.9%) |
| 65 to 74 Years | 0 (0.0%) | 17 (2.3%) |
| 75 Years and over | 0 (0.0%) | 0 (0.0%) |
Disability Class: Ambulatory Difficulty
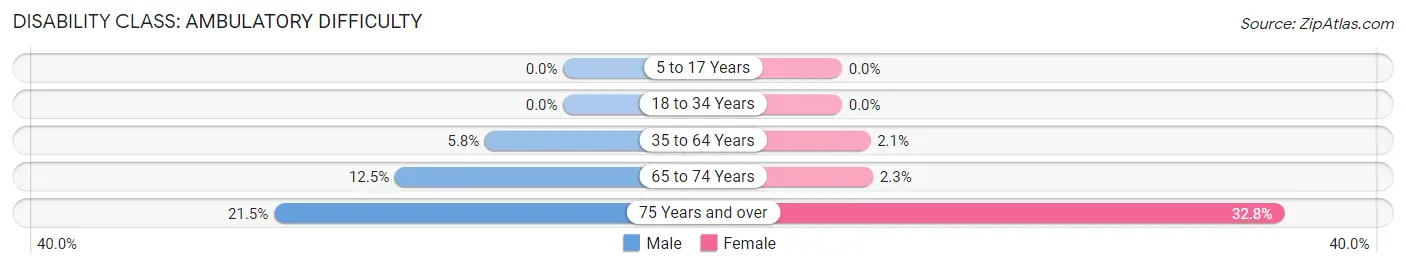
| Age Bracket | Male | Female |
| 5 to 17 Years | 0 (0.0%) | 0 (0.0%) |
| 18 to 34 Years | 0 (0.0%) | 0 (0.0%) |
| 35 to 64 Years | 195 (5.8%) | 70 (2.1%) |
| 65 to 74 Years | 41 (12.5%) | 17 (2.3%) |
| 75 Years and over | 29 (21.5%) | 87 (32.8%) |
Disability Class: Self-Care Difficulty
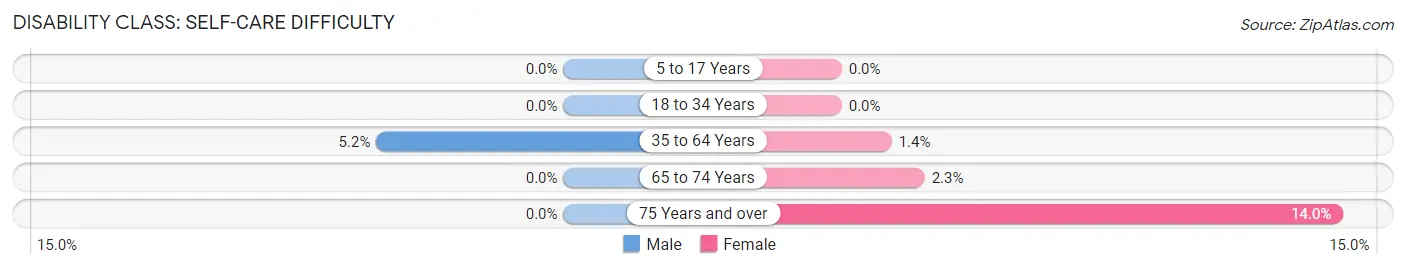
| Age Bracket | Male | Female |
| 5 to 17 Years | 0 (0.0%) | 0 (0.0%) |
| 18 to 34 Years | 0 (0.0%) | 0 (0.0%) |
| 35 to 64 Years | 175 (5.2%) | 46 (1.4%) |
| 65 to 74 Years | 0 (0.0%) | 17 (2.3%) |
| 75 Years and over | 0 (0.0%) | 37 (14.0%) |
Technology Access in Buda
Computing Device Access in Buda
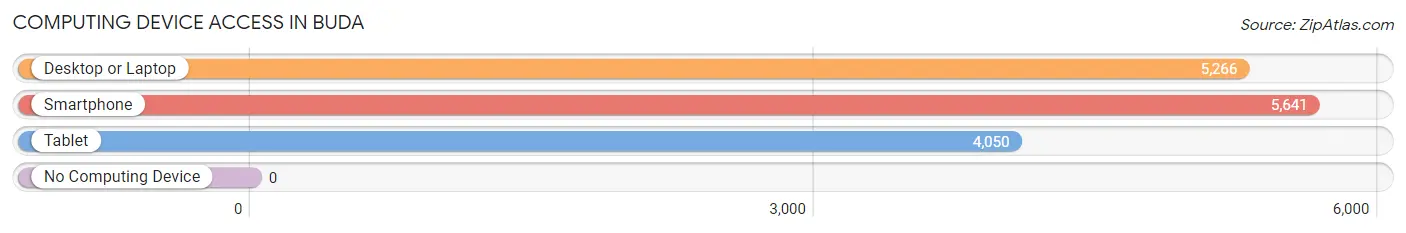
| Device Type | # Households | % Households |
| Desktop or Laptop | 5,266 | 92.5% |
| Smartphone | 5,641 | 99.1% |
| Tablet | 4,050 | 71.1% |
| No Computing Device | 0 | 0.0% |
| Total | 5,695 | 100.0% |
Internet Access in Buda
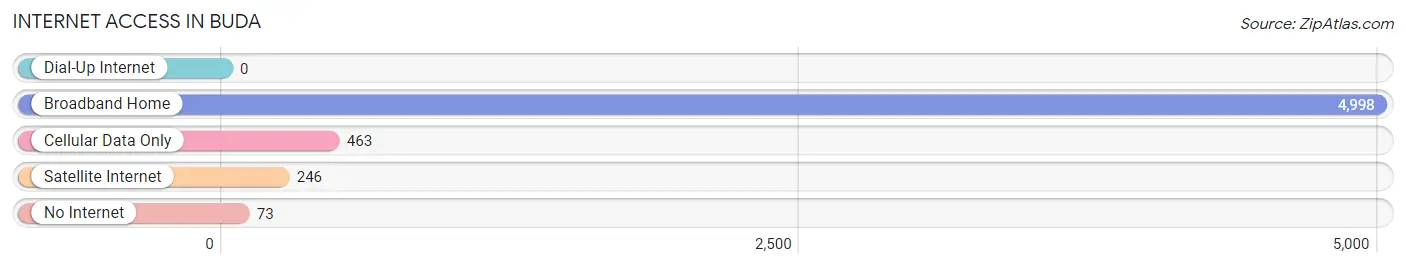
| Internet Type | # Households | % Households |
| Dial-Up Internet | 0 | 0.0% |
| Broadband Home | 4,998 | 87.8% |
| Cellular Data Only | 463 | 8.1% |
| Satellite Internet | 246 | 4.3% |
| No Internet | 73 | 1.3% |
| Total | 5,695 | 100.0% |
Buda Summary
Buda, Texas is a small city located in Hays County, Texas, United States. It is situated along the I-35 corridor, about 20 miles south of Austin and about 60 miles north of San Antonio. The city has a population of approximately 8,000 people and is part of the Austin-Round Rock metropolitan area.
History
The area that is now Buda was first settled in the mid-1800s by German and Czech immigrants. The town was originally known as Du Pre, after the Du Pre family who were among the first settlers. The town was renamed Buda in 1887, after the Hungarian city of the same name.
The town was incorporated in 1933 and has since grown steadily. In the 1950s, the city began to experience a population boom as people moved to the area to take advantage of the booming economy. This growth continued into the 1970s and 1980s, and the city has continued to grow since then.
Geography
Buda is located in Hays County, Texas, about 20 miles south of Austin and about 60 miles north of San Antonio. The city is situated along the I-35 corridor and is part of the Austin-Round Rock metropolitan area. The city has a total area of 4.2 square miles, all of which is land.
The city is located in the Hill Country region of Texas, and is characterized by rolling hills and limestone outcroppings. The city is also home to several creeks and rivers, including the Blanco River, Onion Creek, and the San Marcos River.
Economy
Buda’s economy is largely based on the service industry, with many businesses providing services to the surrounding area. The city is also home to several manufacturing companies, including a large plant operated by the Hays County Water District.
The city is also home to several retail stores, including a Walmart Supercenter, a Home Depot, and several other stores. The city is also home to several restaurants, including several Mexican restaurants, a few fast food restaurants, and several other eateries.
Demographics
As of the 2010 census, the population of Buda was 7,343. The racial makeup of the city was 79.3% White, 8.2% Hispanic or Latino, 6.7% African American, and 5.8% other. The median household income was $60,945, and the median family income was $71,945.
The city is home to several schools, including Buda Elementary School, Buda Middle School, and Jack C. Hays High School. The city is also home to several churches, including the First United Methodist Church, the Church of Jesus Christ of Latter-day Saints, and the Church of the Nazarene.
Conclusion
Buda, Texas is a small city located in Hays County, Texas, United States. It is situated along the I-35 corridor, about 20 miles south of Austin and about 60 miles north of San Antonio. The city has a population of approximately 8,000 people and is part of the Austin-Round Rock metropolitan area. The city has a long history, dating back to the mid-1800s when it was first settled by German and Czech immigrants. The city’s economy is largely based on the service industry, with many businesses providing services to the surrounding area. The city is also home to several manufacturing companies, retail stores, and restaurants. The population of Buda is largely White, with a significant Hispanic or Latino population. The city is home to several schools and churches, and is a great place to live and work.
Common Questions
What is Per Capita Income in Buda?
Per Capita income in Buda is $43,280.
What is the Median Family Income in Buda?
Median Family Income in Buda is $116,922.
What is the Median Household income in Buda?
Median Household Income in Buda is $105,378.
What is Income or Wage Gap in Buda?
Income or Wage Gap in Buda is 23.6%.
Women in Buda earn 76.4 cents for every dollar earned by a man.
What is Inequality or Gini Index in Buda?
Inequality or Gini Index in Buda is 0.38.
What is the Total Population of Buda?
Total Population of Buda is 14,997.
What is the Total Male Population of Buda?
Total Male Population of Buda is 7,784.
What is the Total Female Population of Buda?
Total Female Population of Buda is 7,213.
What is the Ratio of Males per 100 Females in Buda?
There are 107.92 Males per 100 Females in Buda.
What is the Ratio of Females per 100 Males in Buda?
There are 92.66 Females per 100 Males in Buda.
What is the Median Population Age in Buda?
Median Population Age in Buda is 36.8 Years.
What is the Average Family Size in Buda
Average Family Size in Buda is 3.1 People.
What is the Average Household Size in Buda
Average Household Size in Buda is 2.6 People.
How Large is the Labor Force in Buda?
There are 7,899 People in the Labor Forcein in Buda.
What is the Percentage of People in the Labor Force in Buda?
71.5% of People are in the Labor Force in Buda.
What is the Unemployment Rate in Buda?
Unemployment Rate in Buda is 3.6%.