Edmore, MI Map & Demographics
Edmore Map
Edmore Overview
$22,305
PER CAPITA INCOME
$62,500
AVG FAMILY INCOME
$51,029
AVG HOUSEHOLD INCOME
$10,156
FAMILY INCOME DEFICIT
0.36
INEQUALITY / GINI INDEX
1,474
TOTAL POPULATION
766
MALE POPULATION
708
FEMALE POPULATION
108.19
MALES / 100 FEMALES
92.43
FEMALES / 100 MALES
42.9
MEDIAN AGE
3.4
AVG FAMILY SIZE
2.6
AVG HOUSEHOLD SIZE
576
LABOR FORCE [ PEOPLE ]
47.8%
PERCENT IN LABOR FORCE
5.0%
UNEMPLOYMENT RATE
Edmore Zip Codes
Edmore Area Codes
Income in Edmore
Income Overview in Edmore
Per Capita Income in Edmore is $22,305, while median incomes of families and households are $62,500 and $51,029 respectively.
| Characteristic | Number | Measure |
| Per Capita Income | 1,474 | $22,305 |
| Median Family Income | 348 | $62,500 |
| Mean Family Income | 348 | $64,329 |
| Median Household Income | 572 | $51,029 |
| Mean Household Income | 572 | $55,059 |
| Income Deficit | 348 | $10,156 |
| Wage / Income Gap (%) | 1,474 | 0.00% |
| Wage / Income Gap ($) | 1,474 | 100.00¢ per $1 |
| Gini / Inequality Index | 1,474 | 0.36 |
Earnings by Sex in Edmore
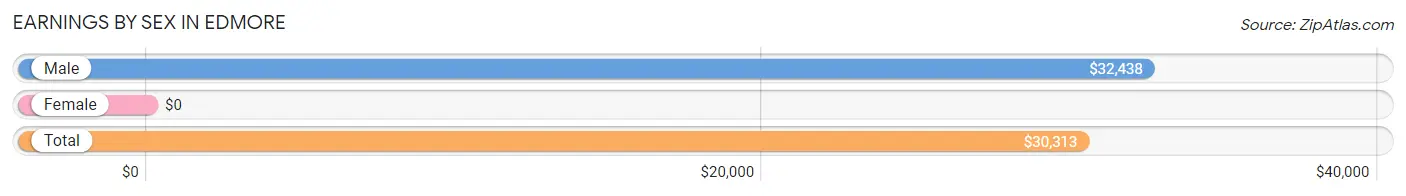
| Sex | Number | Average Earnings |
| Male | 369 (57.8%) | $32,438 |
| Female | 270 (42.2%) | $0 |
| Total | 639 (100.0%) | $30,313 |
Earnings by Sex by Income Bracket in Edmore
The most common earnings brackets in Edmore are $65,000 to $74,999 for men (92 | 24.9%) and $2,499 or less for women (76 | 28.1%).
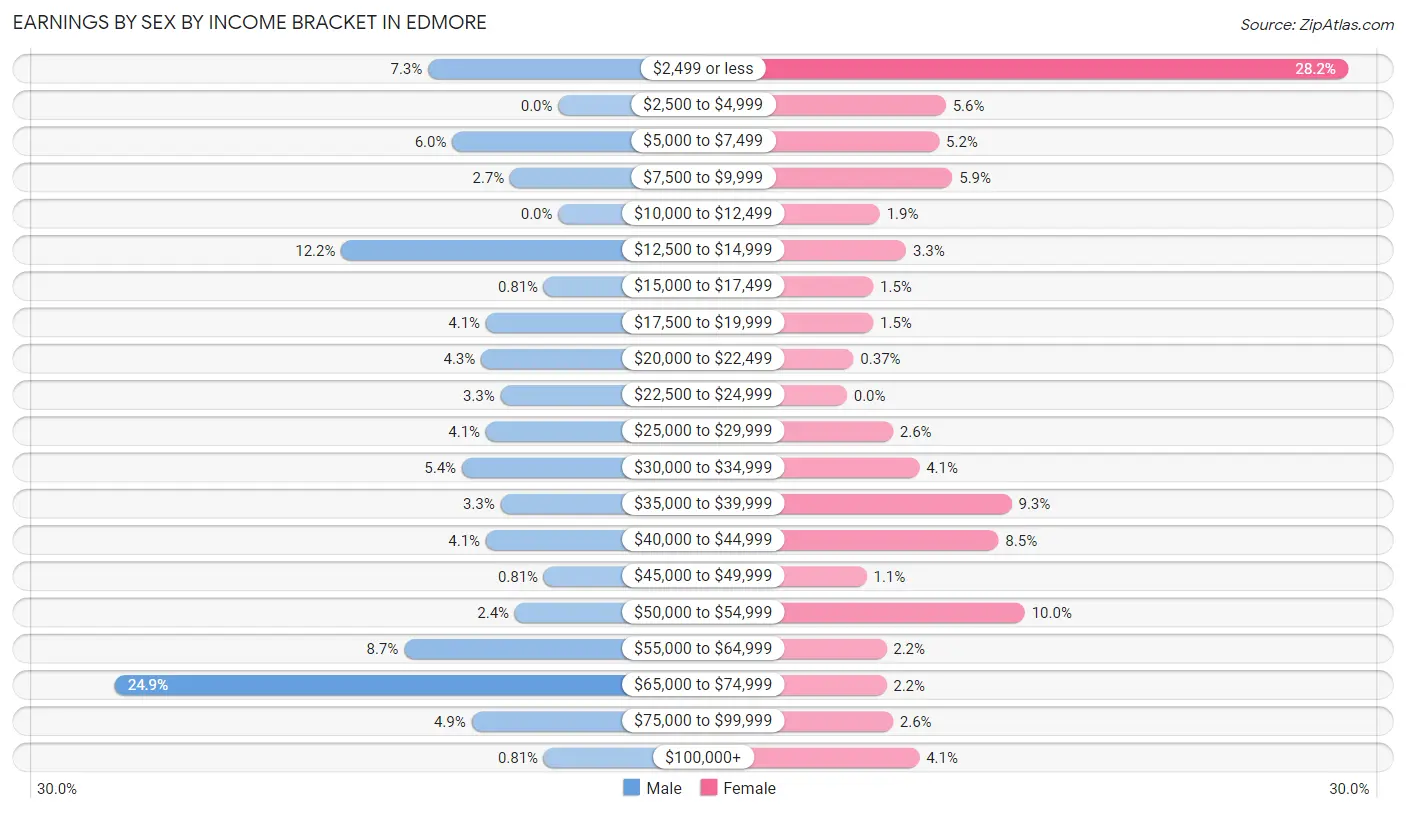
| Income | Male | Female |
| $2,499 or less | 27 (7.3%) | 76 (28.1%) |
| $2,500 to $4,999 | 0 (0.0%) | 15 (5.6%) |
| $5,000 to $7,499 | 22 (6.0%) | 14 (5.2%) |
| $7,500 to $9,999 | 10 (2.7%) | 16 (5.9%) |
| $10,000 to $12,499 | 0 (0.0%) | 5 (1.8%) |
| $12,500 to $14,999 | 45 (12.2%) | 9 (3.3%) |
| $15,000 to $17,499 | 3 (0.8%) | 4 (1.5%) |
| $17,500 to $19,999 | 15 (4.1%) | 4 (1.5%) |
| $20,000 to $22,499 | 16 (4.3%) | 1 (0.4%) |
| $22,500 to $24,999 | 12 (3.3%) | 0 (0.0%) |
| $25,000 to $29,999 | 15 (4.1%) | 7 (2.6%) |
| $30,000 to $34,999 | 20 (5.4%) | 11 (4.1%) |
| $35,000 to $39,999 | 12 (3.3%) | 25 (9.3%) |
| $40,000 to $44,999 | 15 (4.1%) | 23 (8.5%) |
| $45,000 to $49,999 | 3 (0.8%) | 3 (1.1%) |
| $50,000 to $54,999 | 9 (2.4%) | 27 (10.0%) |
| $55,000 to $64,999 | 32 (8.7%) | 6 (2.2%) |
| $65,000 to $74,999 | 92 (24.9%) | 6 (2.2%) |
| $75,000 to $99,999 | 18 (4.9%) | 7 (2.6%) |
| $100,000+ | 3 (0.8%) | 11 (4.1%) |
| Total | 369 (100.0%) | 270 (100.0%) |
Earnings by Sex by Educational Attainment in Edmore
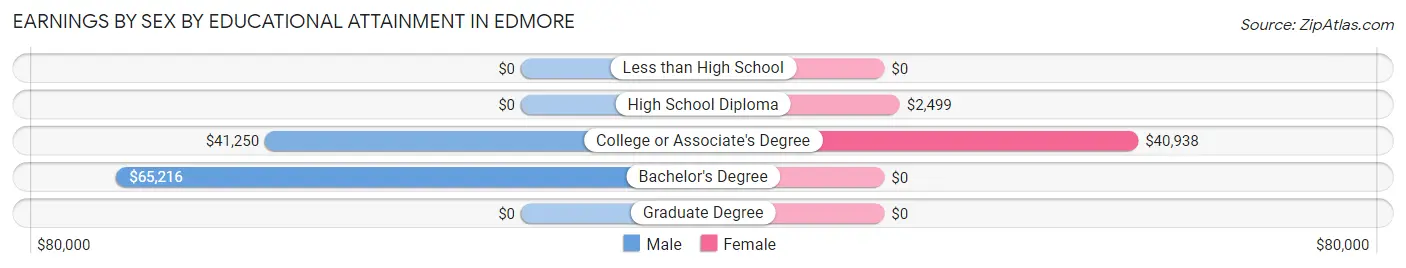
| Educational Attainment | Male Income | Female Income |
| Less than High School | - | - |
| High School Diploma | - | - |
| College or Associate's Degree | $41,250 | $40,938 |
| Bachelor's Degree | $65,216 | $0 |
| Graduate Degree | - | - |
| Total | $44,063 | $0 |
Family Income in Edmore
Family Income Brackets in Edmore
According to the Edmore family income data, there are 116 families falling into the $75,000 to $99,999 income range, which is the most common income bracket and makes up 33.3% of all families.
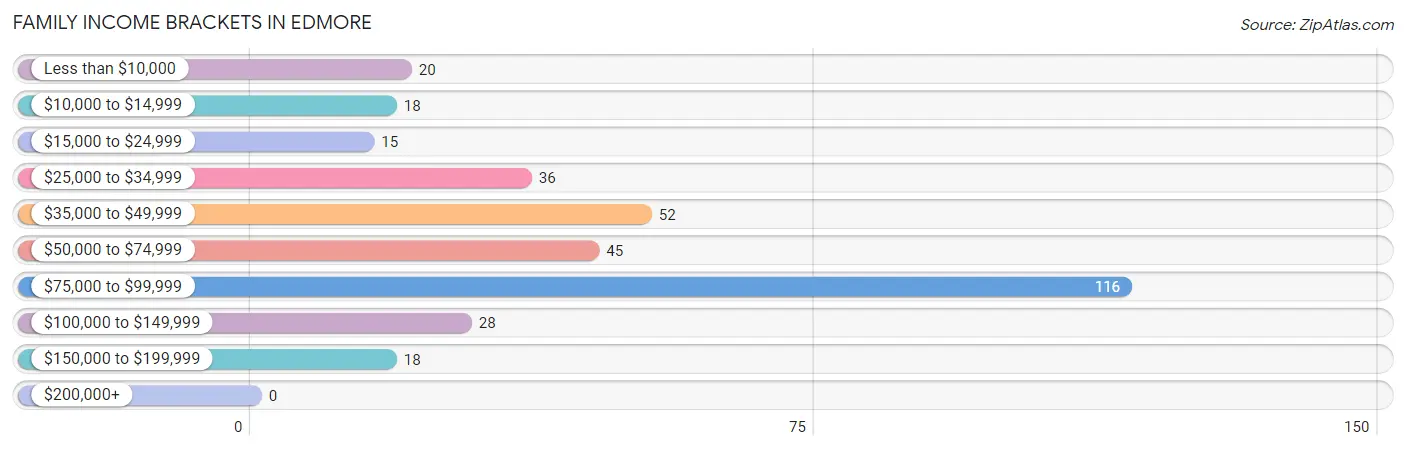
| Income Bracket | # Families | % Families |
| Less than $10,000 | 20 | 5.7% |
| $10,000 to $14,999 | 18 | 5.2% |
| $15,000 to $24,999 | 15 | 4.3% |
| $25,000 to $34,999 | 36 | 10.3% |
| $35,000 to $49,999 | 52 | 14.9% |
| $50,000 to $74,999 | 45 | 12.9% |
| $75,000 to $99,999 | 116 | 33.3% |
| $100,000 to $149,999 | 28 | 8.0% |
| $150,000 to $199,999 | 18 | 5.2% |
| $200,000+ | 0 | 0.0% |
Family Income by Famaliy Size in Edmore
6-person families (13 | 3.7%) account for the highest median family income in Edmore with $172,679 per family, while 6-person families (13 | 3.7%) have the highest median income of $28,780 per family member.
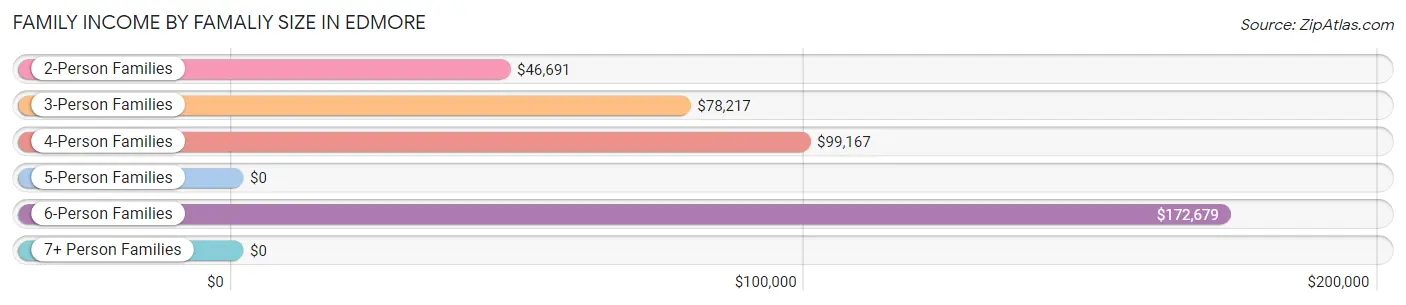
| Income Bracket | # Families | Median Income |
| 2-Person Families | 137 (39.4%) | $46,691 |
| 3-Person Families | 137 (39.4%) | $78,217 |
| 4-Person Families | 34 (9.8%) | $99,167 |
| 5-Person Families | 27 (7.8%) | $0 |
| 6-Person Families | 13 (3.7%) | $172,679 |
| 7+ Person Families | 0 (0.0%) | $0 |
| Total | 348 (100.0%) | $62,500 |
Family Income by Number of Earners in Edmore
The median family income in Edmore is $62,500, with families comprising 3+ earners (18) having the highest median family income of $111,250, while families with no earners (70) have the lowest median family income of $33,750, accounting for 5.2% and 20.1% of families, respectively.
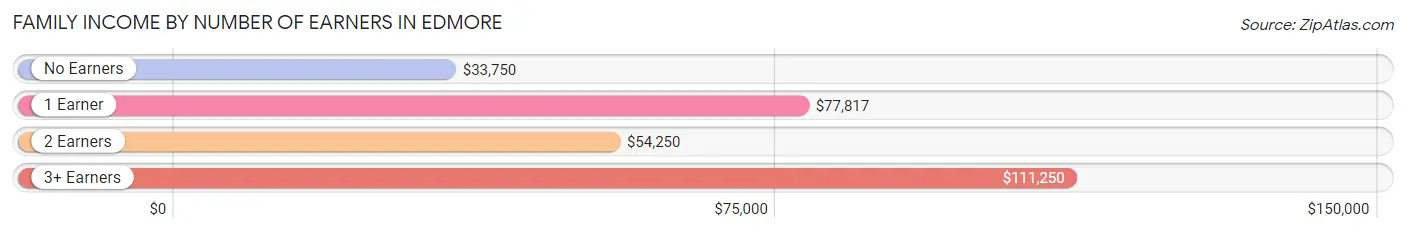
| Number of Earners | # Families | Median Income |
| No Earners | 70 (20.1%) | $33,750 |
| 1 Earner | 156 (44.8%) | $77,817 |
| 2 Earners | 104 (29.9%) | $54,250 |
| 3+ Earners | 18 (5.2%) | $111,250 |
| Total | 348 (100.0%) | $62,500 |
Household Income in Edmore
Household Income Brackets in Edmore
With 131 households falling in the category, the $75,000 to $99,999 income range is the most frequent in Edmore, accounting for 22.9% of all households.
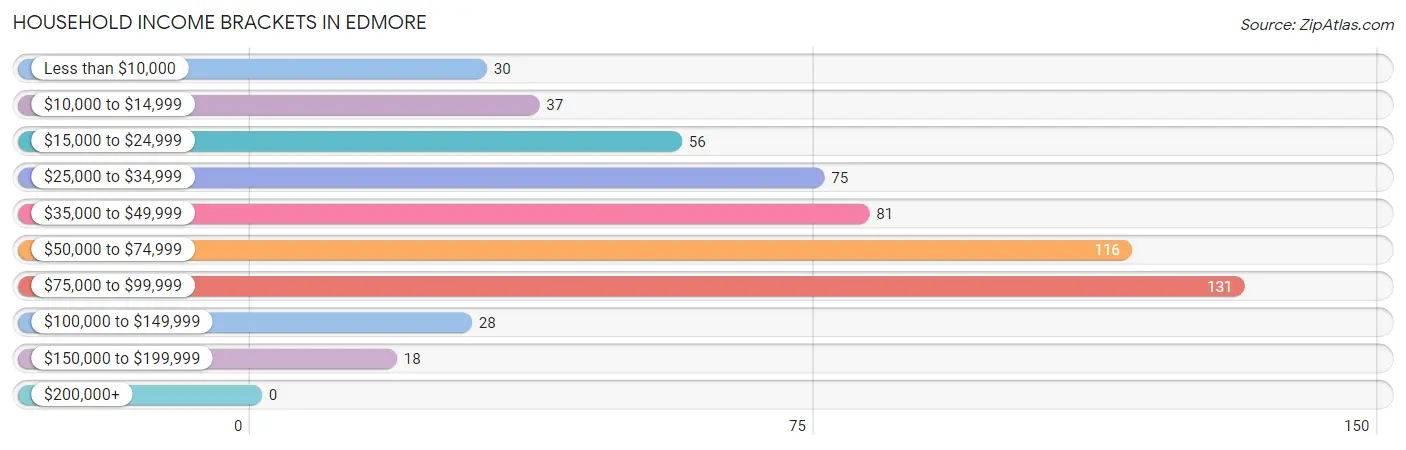
| Income Bracket | # Households | % Households |
| Less than $10,000 | 30 | 5.2% |
| $10,000 to $14,999 | 37 | 6.5% |
| $15,000 to $24,999 | 56 | 9.8% |
| $25,000 to $34,999 | 75 | 13.1% |
| $35,000 to $49,999 | 81 | 14.2% |
| $50,000 to $74,999 | 116 | 20.3% |
| $75,000 to $99,999 | 131 | 22.9% |
| $100,000 to $149,999 | 28 | 4.9% |
| $150,000 to $199,999 | 18 | 3.1% |
| $200,000+ | 0 | 0.0% |
Household Income by Householder Age in Edmore
The median household income in Edmore is $51,029, with the highest median household income of $66,681 found in the 25 to 44 years age bracket for the primary householder. A total of 111 households (19.4%) fall into this category. Meanwhile, the 15 to 24 years age bracket for the primary householder has the lowest median household income of $0, with 3 households (0.5%) in this group.
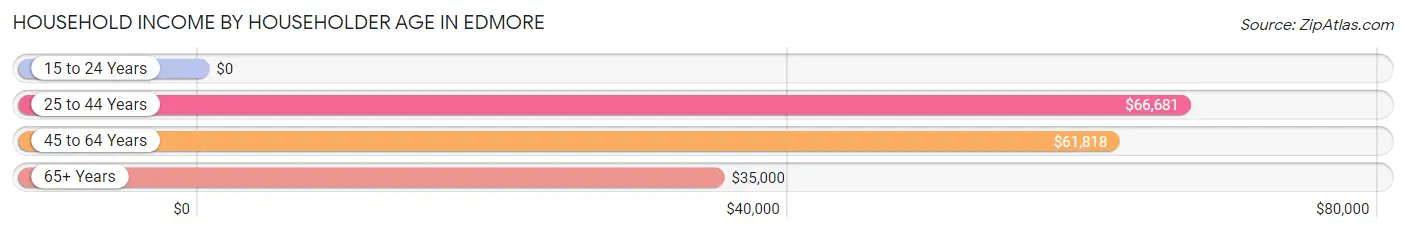
| Income Bracket | # Households | Median Income |
| 15 to 24 Years | 3 (0.5%) | $0 |
| 25 to 44 Years | 111 (19.4%) | $66,681 |
| 45 to 64 Years | 246 (43.0%) | $61,818 |
| 65+ Years | 212 (37.1%) | $35,000 |
| Total | 572 (100.0%) | $51,029 |
Poverty in Edmore
Income Below Poverty by Sex and Age in Edmore
With 21.0% poverty level for males and 31.6% for females among the residents of Edmore, 18 to 24 year old males and 35 to 44 year old females are the most vulnerable to poverty, with 26 males (55.3%) and 85 females (74.6%) in their respective age groups living below the poverty level.
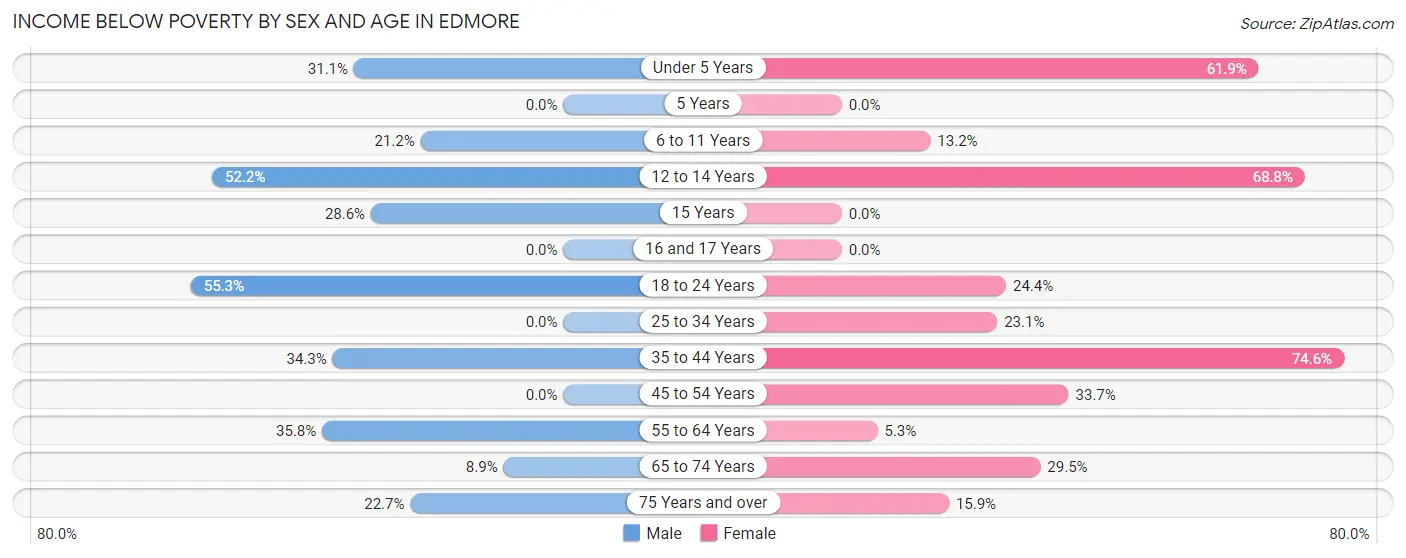
| Age Bracket | Male | Female |
| Under 5 Years | 14 (31.1%) | 26 (61.9%) |
| 5 Years | 0 (0.0%) | 0 (0.0%) |
| 6 to 11 Years | 7 (21.2%) | 5 (13.2%) |
| 12 to 14 Years | 24 (52.2%) | 11 (68.8%) |
| 15 Years | 4 (28.6%) | 0 (0.0%) |
| 16 and 17 Years | 0 (0.0%) | 0 (0.0%) |
| 18 to 24 Years | 26 (55.3%) | 10 (24.4%) |
| 25 to 34 Years | 0 (0.0%) | 12 (23.1%) |
| 35 to 44 Years | 49 (34.3%) | 85 (74.6%) |
| 45 to 54 Years | 0 (0.0%) | 32 (33.7%) |
| 55 to 64 Years | 24 (35.8%) | 6 (5.3%) |
| 65 to 74 Years | 8 (8.9%) | 23 (29.5%) |
| 75 Years and over | 5 (22.7%) | 14 (15.9%) |
| Total | 161 (21.0%) | 224 (31.6%) |
Income Above Poverty by Sex and Age in Edmore
According to the poverty statistics in Edmore, males aged 5 years and females aged 15 years are the age groups that are most secure financially, with 100.0% of males and 100.0% of females in these age groups living above the poverty line.
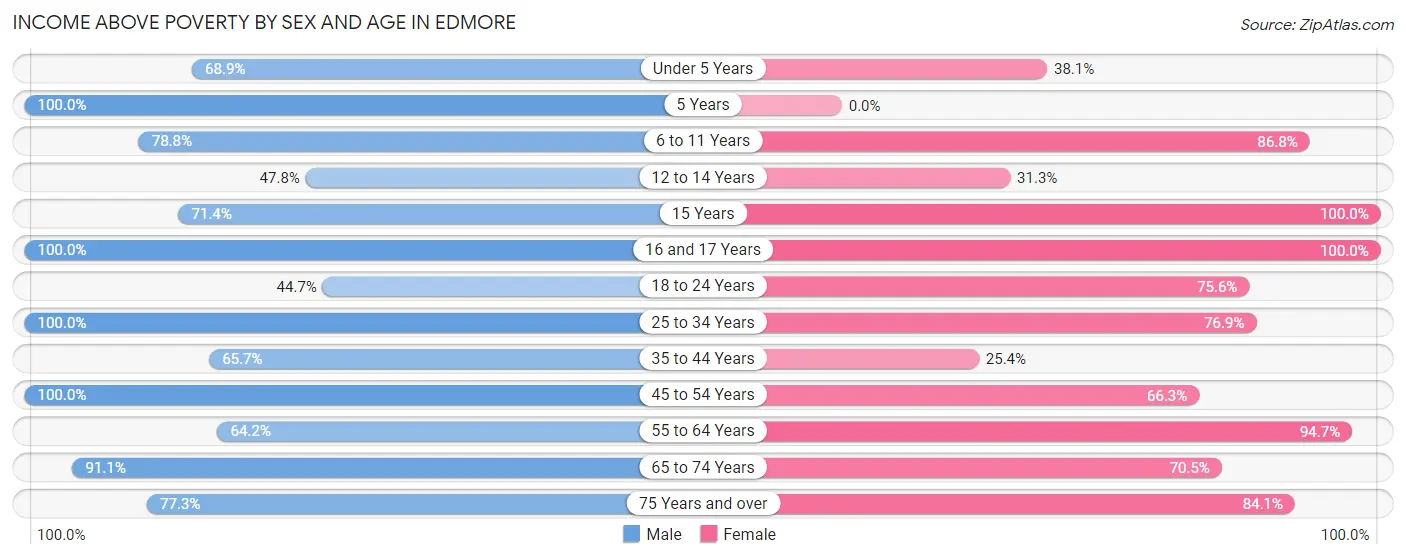
| Age Bracket | Male | Female |
| Under 5 Years | 31 (68.9%) | 16 (38.1%) |
| 5 Years | 10 (100.0%) | 0 (0.0%) |
| 6 to 11 Years | 26 (78.8%) | 33 (86.8%) |
| 12 to 14 Years | 22 (47.8%) | 5 (31.2%) |
| 15 Years | 10 (71.4%) | 25 (100.0%) |
| 16 and 17 Years | 83 (100.0%) | 6 (100.0%) |
| 18 to 24 Years | 21 (44.7%) | 31 (75.6%) |
| 25 to 34 Years | 26 (100.0%) | 40 (76.9%) |
| 35 to 44 Years | 94 (65.7%) | 29 (25.4%) |
| 45 to 54 Years | 140 (100.0%) | 63 (66.3%) |
| 55 to 64 Years | 43 (64.2%) | 107 (94.7%) |
| 65 to 74 Years | 82 (91.1%) | 55 (70.5%) |
| 75 Years and over | 17 (77.3%) | 74 (84.1%) |
| Total | 605 (79.0%) | 484 (68.4%) |
Income Below Poverty Among Married-Couple Families in Edmore
The poverty statistics for married-couple families in Edmore show that 12.7% or 28 of the total 221 families live below the poverty line. Families with no children have the highest poverty rate of 18.8%, comprising of 21 families. On the other hand, families with 3 or 4 children have the lowest poverty rate of 0.0%, which includes 0 families.
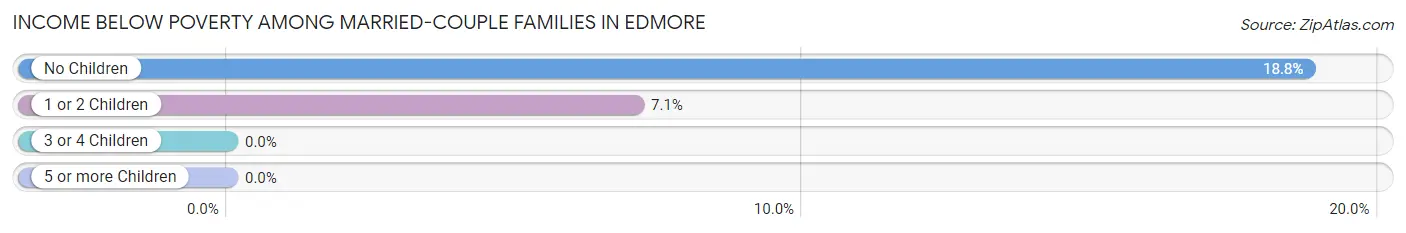
| Children | Above Poverty | Below Poverty |
| No Children | 91 (81.2%) | 21 (18.8%) |
| 1 or 2 Children | 92 (92.9%) | 7 (7.1%) |
| 3 or 4 Children | 10 (100.0%) | 0 (0.0%) |
| 5 or more Children | 0 (0.0%) | 0 (0.0%) |
| Total | 193 (87.3%) | 28 (12.7%) |
Income Below Poverty Among Single-Parent Households in Edmore
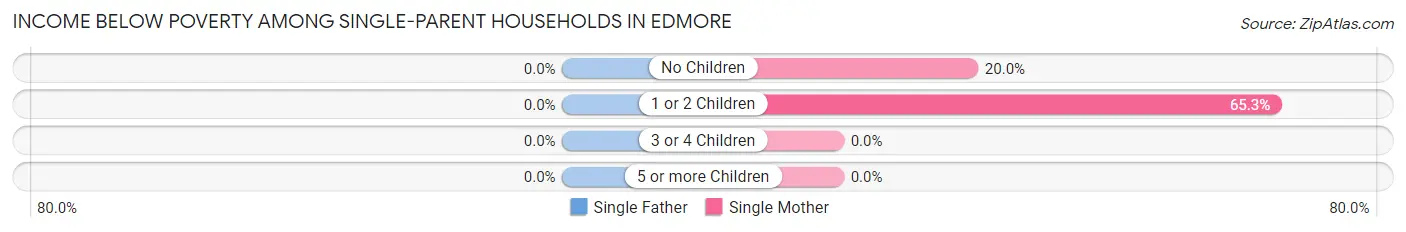
| Children | Single Father | Single Mother |
| No Children | 0 (0.0%) | 8 (20.0%) |
| 1 or 2 Children | 0 (0.0%) | 32 (65.3%) |
| 3 or 4 Children | 0 (0.0%) | 0 (0.0%) |
| 5 or more Children | 0 (0.0%) | 0 (0.0%) |
| Total | 0 (0.0%) | 40 (44.9%) |
Income Below Poverty Among Married-Couple vs Single-Parent Households in Edmore
The poverty data for Edmore shows that 28 of the married-couple family households (12.7%) and 40 of the single-parent households (31.5%) are living below the poverty level. Within the married-couple family households, those with no children have the highest poverty rate, with 21 households (18.8%) falling below the poverty line. Among the single-parent households, those with 1 or 2 children have the highest poverty rate, with 32 household (60.4%) living below poverty.
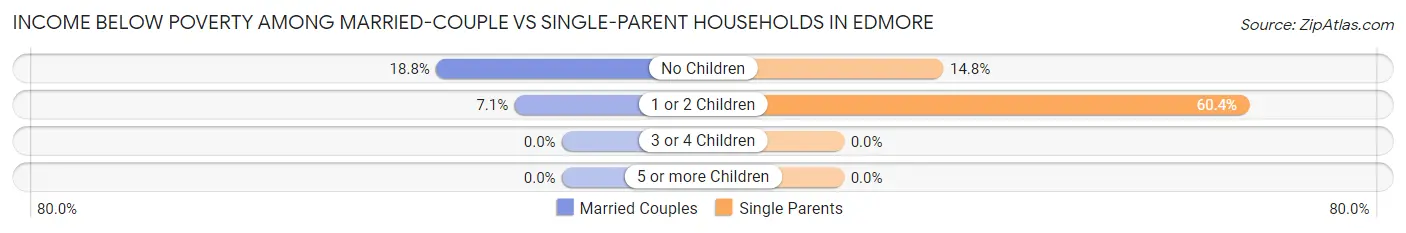
| Children | Married-Couple Families | Single-Parent Households |
| No Children | 21 (18.8%) | 8 (14.8%) |
| 1 or 2 Children | 7 (7.1%) | 32 (60.4%) |
| 3 or 4 Children | 0 (0.0%) | 0 (0.0%) |
| 5 or more Children | 0 (0.0%) | 0 (0.0%) |
| Total | 28 (12.7%) | 40 (31.5%) |
Race in Edmore
The most populous races in Edmore are White / Caucasian (1,434 | 97.3%), Hispanic or Latino (104 | 7.1%), and Two or more Races (23 | 1.6%).
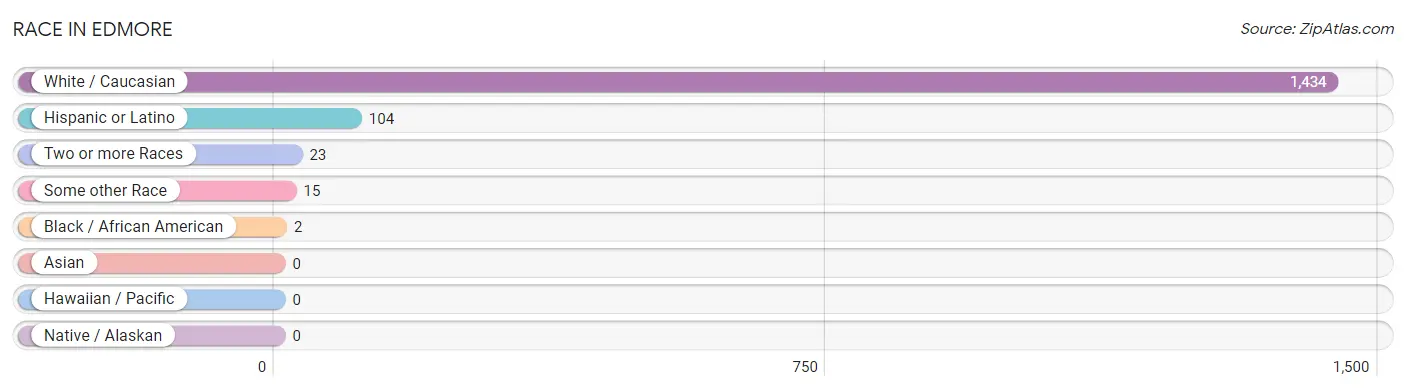
| Race | # Population | % Population |
| Asian | 0 | 0.0% |
| Black / African American | 2 | 0.1% |
| Hawaiian / Pacific | 0 | 0.0% |
| Hispanic or Latino | 104 | 7.1% |
| Native / Alaskan | 0 | 0.0% |
| White / Caucasian | 1,434 | 97.3% |
| Two or more Races | 23 | 1.6% |
| Some other Race | 15 | 1.0% |
| Total | 1,474 | 100.0% |
Ancestry in Edmore
The most populous ancestries reported in Edmore are German (290 | 19.7%), Irish (122 | 8.3%), English (97 | 6.6%), Mexican (89 | 6.0%), and American (88 | 6.0%), together accounting for 46.5% of all Edmore residents.
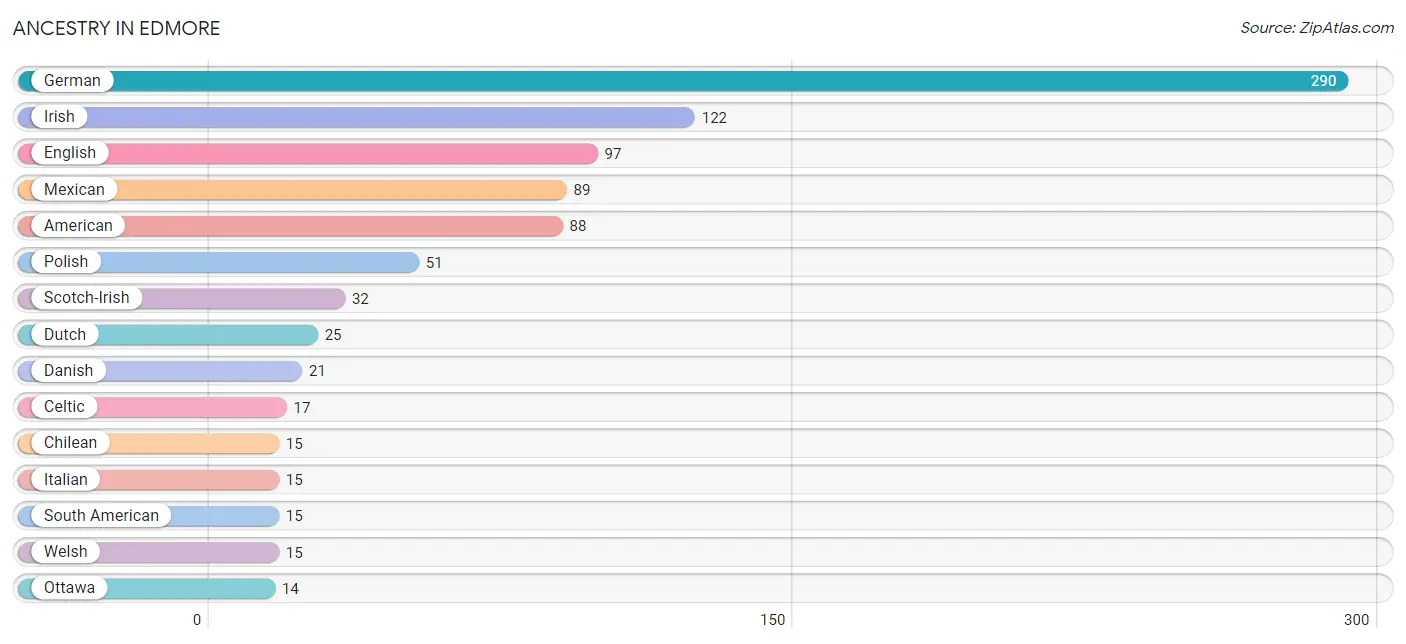
| Ancestry | # Population | % Population |
| American | 88 | 6.0% |
| Arab | 11 | 0.7% |
| Assyrian / Chaldean / Syriac | 9 | 0.6% |
| British | 8 | 0.5% |
| Celtic | 17 | 1.1% |
| Chilean | 15 | 1.0% |
| Danish | 21 | 1.4% |
| Dutch | 25 | 1.7% |
| English | 97 | 6.6% |
| French | 3 | 0.2% |
| French Canadian | 3 | 0.2% |
| German | 290 | 19.7% |
| Irish | 122 | 8.3% |
| Italian | 15 | 1.0% |
| Mexican | 89 | 6.0% |
| Norwegian | 4 | 0.3% |
| Ottawa | 14 | 0.9% |
| Polish | 51 | 3.5% |
| Scotch-Irish | 32 | 2.2% |
| Scottish | 13 | 0.9% |
| South American | 15 | 1.0% |
| Swedish | 6 | 0.4% |
| Welsh | 15 | 1.0% | View All 23 Rows |
Immigrants in Edmore
The most numerous immigrant groups reported in Edmore came from Latin America (26 | 1.8%), Asia (23 | 1.6%), Iraq (23 | 1.6%), Western Asia (23 | 1.6%), and Chile (15 | 1.0%), together accounting for 7.5% of all Edmore residents.
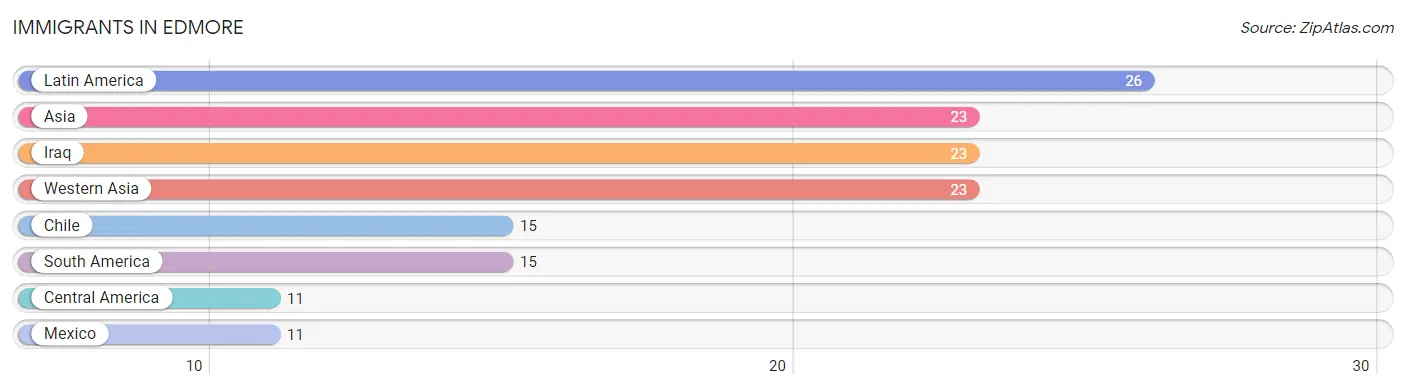
| Immigration Origin | # Population | % Population |
| Asia | 23 | 1.6% |
| Central America | 11 | 0.7% |
| Chile | 15 | 1.0% |
| Iraq | 23 | 1.6% |
| Latin America | 26 | 1.8% |
| Mexico | 11 | 0.7% |
| South America | 15 | 1.0% |
| Western Asia | 23 | 1.6% | View All 8 Rows |
Sex and Age in Edmore
Sex and Age in Edmore
The most populous age groups in Edmore are 15 to 19 Years (126 | 16.5%) for men and 40 to 44 Years (87 | 12.3%) for women.
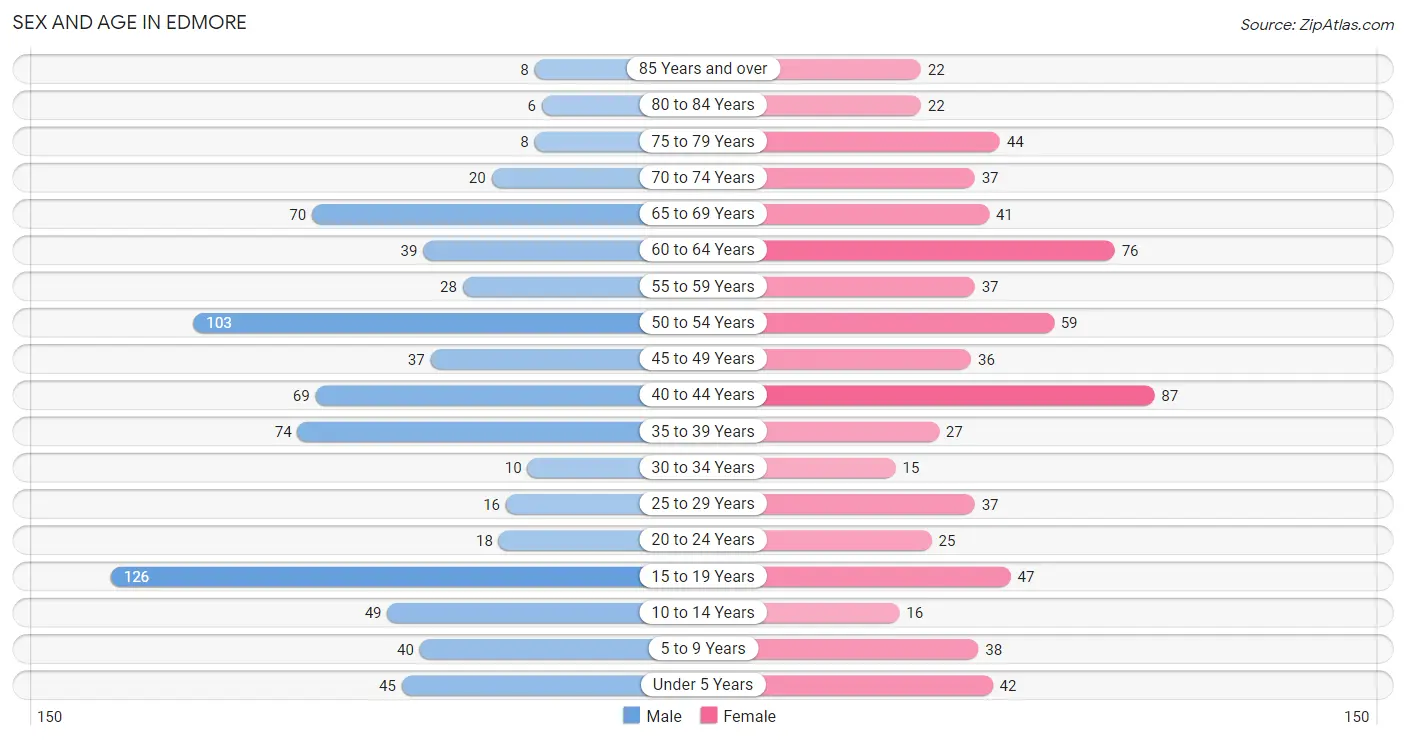
| Age Bracket | Male | Female |
| Under 5 Years | 45 (5.9%) | 42 (5.9%) |
| 5 to 9 Years | 40 (5.2%) | 38 (5.4%) |
| 10 to 14 Years | 49 (6.4%) | 16 (2.3%) |
| 15 to 19 Years | 126 (16.5%) | 47 (6.6%) |
| 20 to 24 Years | 18 (2.4%) | 25 (3.5%) |
| 25 to 29 Years | 16 (2.1%) | 37 (5.2%) |
| 30 to 34 Years | 10 (1.3%) | 15 (2.1%) |
| 35 to 39 Years | 74 (9.7%) | 27 (3.8%) |
| 40 to 44 Years | 69 (9.0%) | 87 (12.3%) |
| 45 to 49 Years | 37 (4.8%) | 36 (5.1%) |
| 50 to 54 Years | 103 (13.5%) | 59 (8.3%) |
| 55 to 59 Years | 28 (3.7%) | 37 (5.2%) |
| 60 to 64 Years | 39 (5.1%) | 76 (10.7%) |
| 65 to 69 Years | 70 (9.1%) | 41 (5.8%) |
| 70 to 74 Years | 20 (2.6%) | 37 (5.2%) |
| 75 to 79 Years | 8 (1.0%) | 44 (6.2%) |
| 80 to 84 Years | 6 (0.8%) | 22 (3.1%) |
| 85 Years and over | 8 (1.0%) | 22 (3.1%) |
| Total | 766 (100.0%) | 708 (100.0%) |
Families and Households in Edmore
Median Family Size in Edmore
The median family size in Edmore is 3.41 persons per family, with single female/mother families (89 | 25.6%) accounting for the largest median family size of 4.43 persons per family. On the other hand, married-couple families (221 | 63.5%) represent the smallest median family size with 2.89 persons per family.
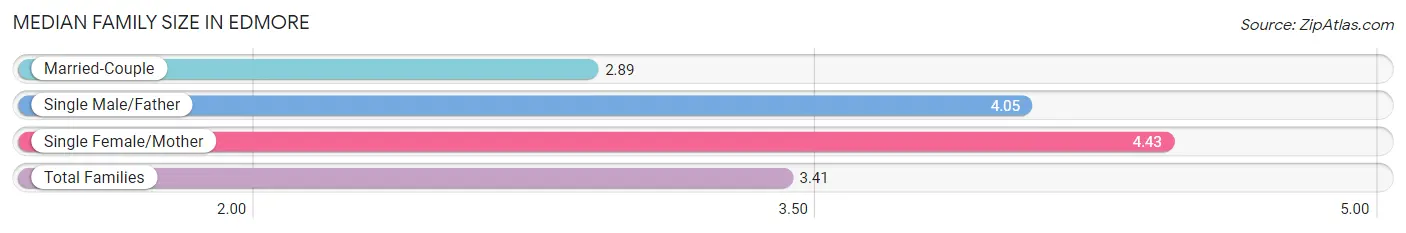
| Family Type | # Families | Family Size |
| Married-Couple | 221 (63.5%) | 2.89 |
| Single Male/Father | 38 (10.9%) | 4.05 |
| Single Female/Mother | 89 (25.6%) | 4.43 |
| Total Families | 348 (100.0%) | 3.41 |
Median Household Size in Edmore
The median household size in Edmore is 2.57 persons per household, with single female/mother households (89 | 15.6%) accounting for the largest median household size of 4.6 persons per household. non-family households (224 | 39.2%) represent the smallest median household size with 1.09 persons per household.
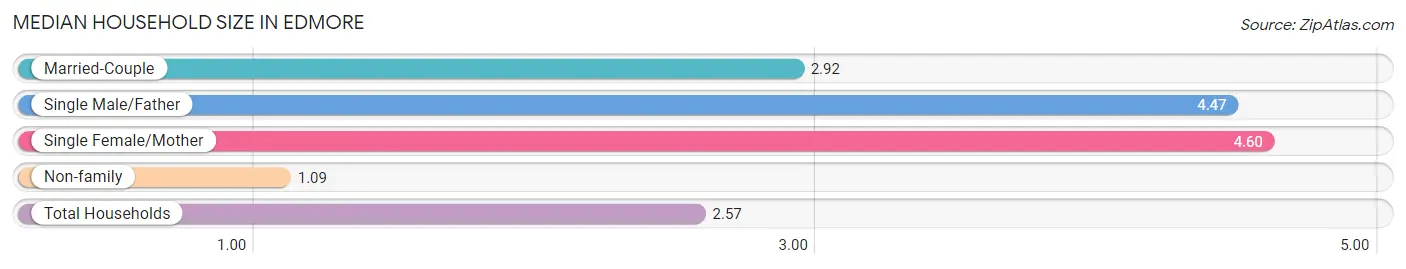
| Household Type | # Households | Household Size |
| Married-Couple | 221 (38.6%) | 2.92 |
| Single Male/Father | 38 (6.6%) | 4.47 |
| Single Female/Mother | 89 (15.6%) | 4.60 |
| Non-family | 224 (39.2%) | 1.09 |
| Total Households | 572 (100.0%) | 2.57 |
Household Size by Marriage Status in Edmore
Out of a total of 572 households in Edmore, 348 (60.8%) are family households, while 224 (39.2%) are nonfamily households. The most numerous type of family households are 2-person households, comprising 133, and the most common type of nonfamily households are 1-person households, comprising 207.
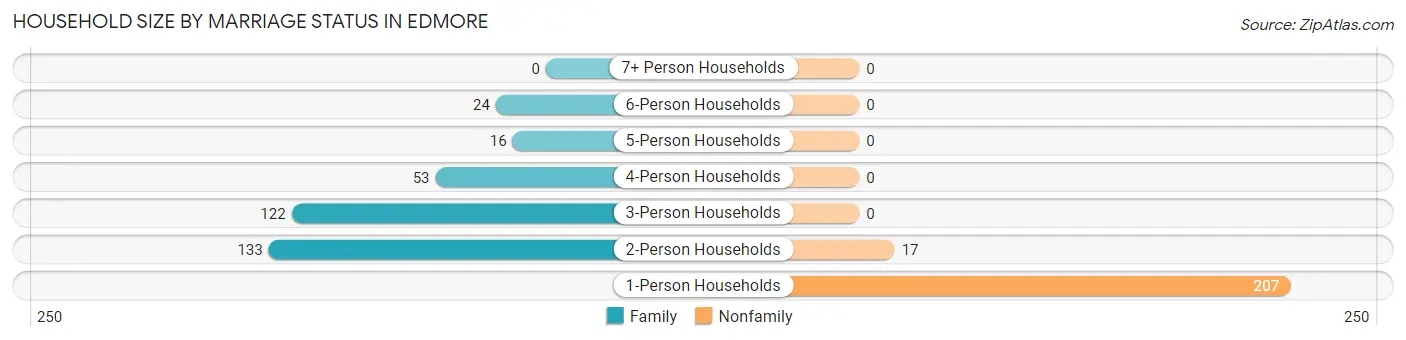
| Household Size | Family Households | Nonfamily Households |
| 1-Person Households | - | 207 (36.2%) |
| 2-Person Households | 133 (23.3%) | 17 (3.0%) |
| 3-Person Households | 122 (21.3%) | 0 (0.0%) |
| 4-Person Households | 53 (9.3%) | 0 (0.0%) |
| 5-Person Households | 16 (2.8%) | 0 (0.0%) |
| 6-Person Households | 24 (4.2%) | 0 (0.0%) |
| 7+ Person Households | 0 (0.0%) | 0 (0.0%) |
| Total | 348 (60.8%) | 224 (39.2%) |
Female Fertility in Edmore
Fertility by Age in Edmore
Average fertility rate in Edmore is 18.0 births per 1,000 women. Women in the age bracket of 20 to 34 years have the highest fertility rate with 26.0 births per 1,000 women. Women in the age bracket of 35 to 50 years acount for 60.0% of all women with births.
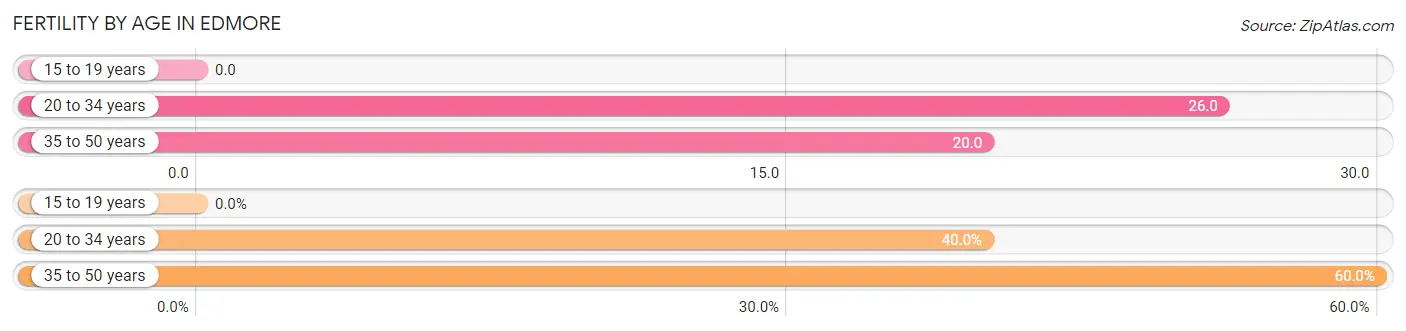
| Age Bracket | Women with Births | Births / 1,000 Women |
| 15 to 19 years | 0 (0.0%) | 0.0 |
| 20 to 34 years | 2 (40.0%) | 26.0 |
| 35 to 50 years | 3 (60.0%) | 20.0 |
| Total | 5 (100.0%) | 18.0 |
Fertility by Age by Marriage Status in Edmore
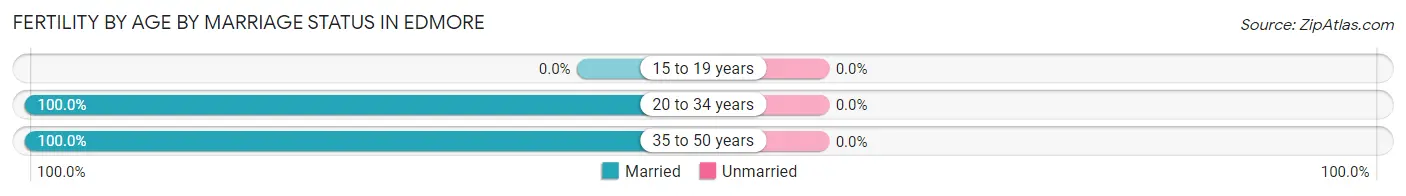
| Age Bracket | Married | Unmarried |
| 15 to 19 years | 0 (0.0%) | 0 (0.0%) |
| 20 to 34 years | 2 (100.0%) | 0 (0.0%) |
| 35 to 50 years | 3 (100.0%) | 0 (0.0%) |
| Total | 5 (100.0%) | 0 (0.0%) |
Fertility by Education in Edmore
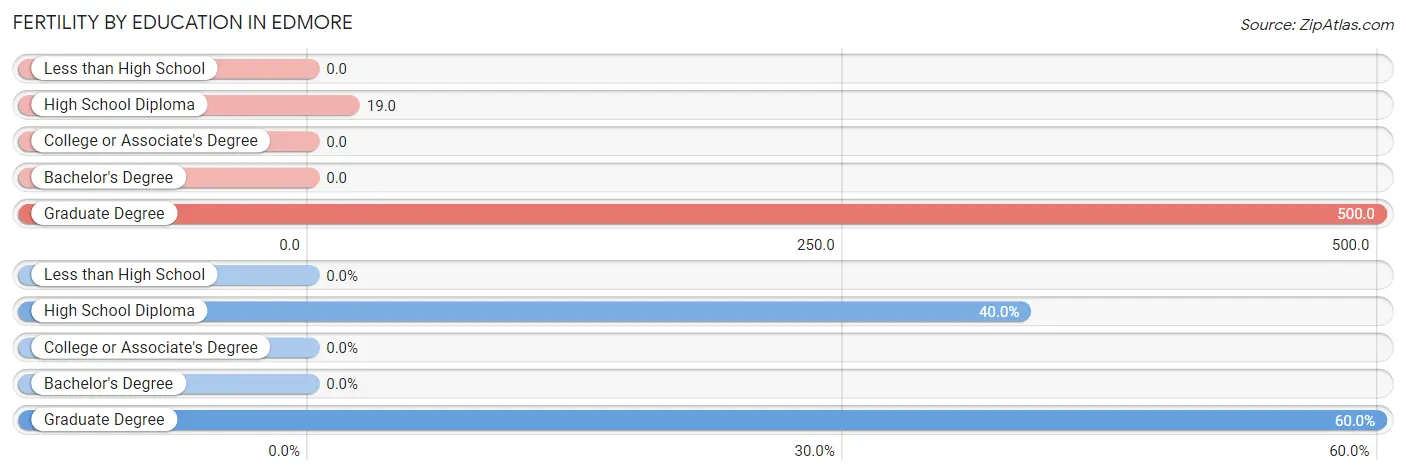
| Educational Attainment | Women with Births | Births / 1,000 Women |
| Less than High School | 0 (0.0%) | 0.0 |
| High School Diploma | 2 (40.0%) | 19.0 |
| College or Associate's Degree | 0 (0.0%) | 0.0 |
| Bachelor's Degree | 0 (0.0%) | 0.0 |
| Graduate Degree | 3 (60.0%) | 500.0 |
| Total | 5 (100.0%) | 18.0 |
Fertility by Education by Marriage Status in Edmore
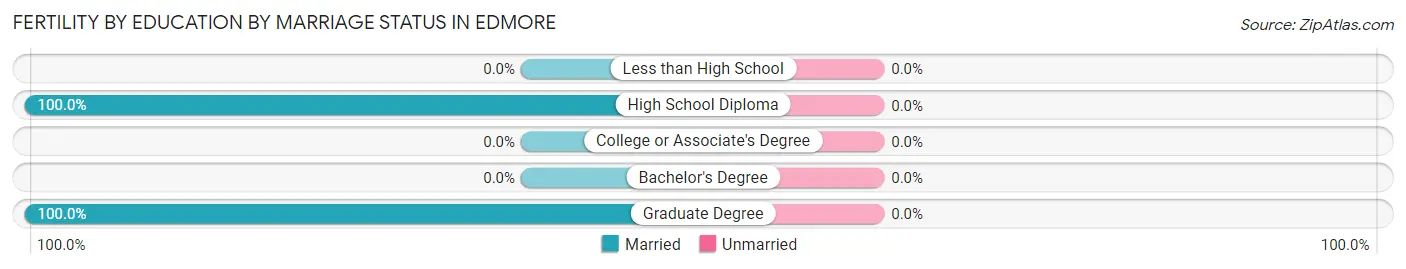
| Educational Attainment | Married | Unmarried |
| Less than High School | 0 (0.0%) | 0 (0.0%) |
| High School Diploma | 2 (100.0%) | 0 (0.0%) |
| College or Associate's Degree | 0 (0.0%) | 0 (0.0%) |
| Bachelor's Degree | 0 (0.0%) | 0 (0.0%) |
| Graduate Degree | 3 (100.0%) | 0 (0.0%) |
| Total | 5 (100.0%) | 0 (0.0%) |
Employment Characteristics in Edmore
Employment by Class of Employer in Edmore
Among the 545 employed individuals in Edmore, private company employees (414 | 76.0%), local government employees (56 | 10.3%), and not-for-profit organizations (24 | 4.4%) make up the most common classes of employment.
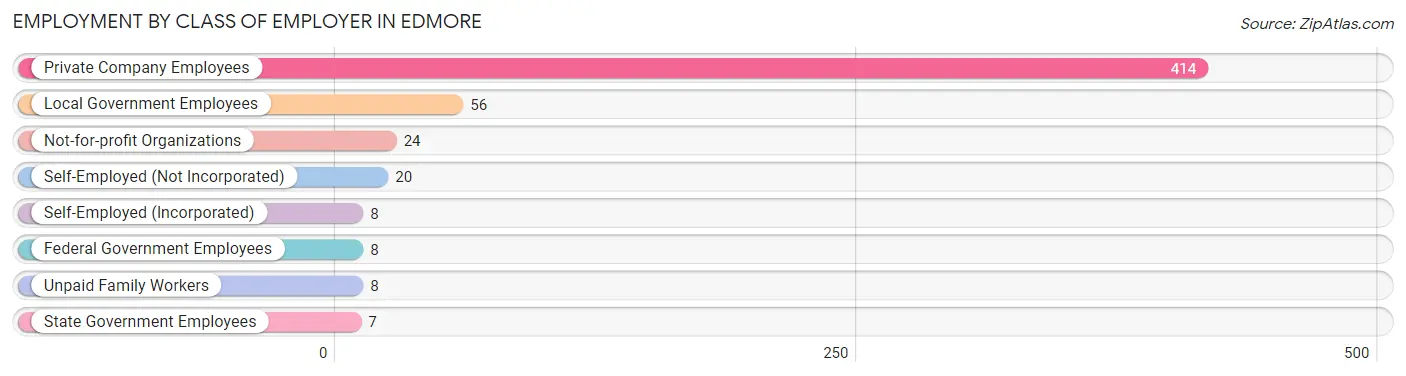
| Employer Class | # Employees | % Employees |
| Private Company Employees | 414 | 76.0% |
| Self-Employed (Incorporated) | 8 | 1.5% |
| Self-Employed (Not Incorporated) | 20 | 3.7% |
| Not-for-profit Organizations | 24 | 4.4% |
| Local Government Employees | 56 | 10.3% |
| State Government Employees | 7 | 1.3% |
| Federal Government Employees | 8 | 1.5% |
| Unpaid Family Workers | 8 | 1.5% |
| Total | 545 | 100.0% |
Employment Status by Age in Edmore
According to the labor force statistics for Edmore, out of the total population over 16 years of age (1,205), 47.8% or 576 individuals are in the labor force, with 5.0% or 29 of them unemployed. The age group with the highest labor force participation rate is 30 to 34 years, with 100.0% or 25 individuals in the labor force. Within the labor force, the 20 to 24 years age range has the highest percentage of unemployed individuals, with 41.9% or 13 of them being unemployed.
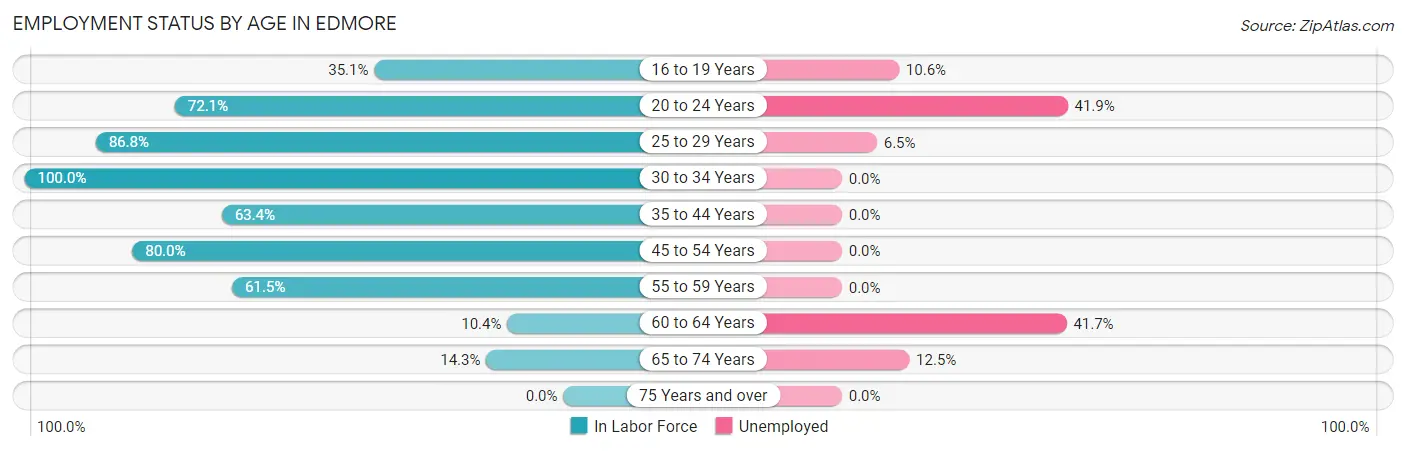
| Age Bracket | In Labor Force | Unemployed |
| 16 to 19 Years | 47 (35.1%) | 5 (10.6%) |
| 20 to 24 Years | 31 (72.1%) | 13 (41.9%) |
| 25 to 29 Years | 46 (86.8%) | 3 (6.5%) |
| 30 to 34 Years | 25 (100.0%) | 0 (0.0%) |
| 35 to 44 Years | 163 (63.4%) | 0 (0.0%) |
| 45 to 54 Years | 188 (80.0%) | 0 (0.0%) |
| 55 to 59 Years | 40 (61.5%) | 0 (0.0%) |
| 60 to 64 Years | 12 (10.4%) | 5 (41.7%) |
| 65 to 74 Years | 24 (14.3%) | 3 (12.5%) |
| 75 Years and over | 0 (0.0%) | 0 (0.0%) |
| Total | 576 (47.8%) | 29 (5.0%) |
Employment Status by Educational Attainment in Edmore
According to labor force statistics for Edmore, 63.2% of individuals (474) out of the total population between 25 and 64 years of age (750) are in the labor force, with 1.7% or 8 of them being unemployed. The group with the highest labor force participation rate are those with the educational attainment of bachelor's degree or higher, with 89.8% or 88 individuals in the labor force. Within the labor force, individuals with college / associate degree education have the highest percentage of unemployment, with 2.9% or 3 of them being unemployed.
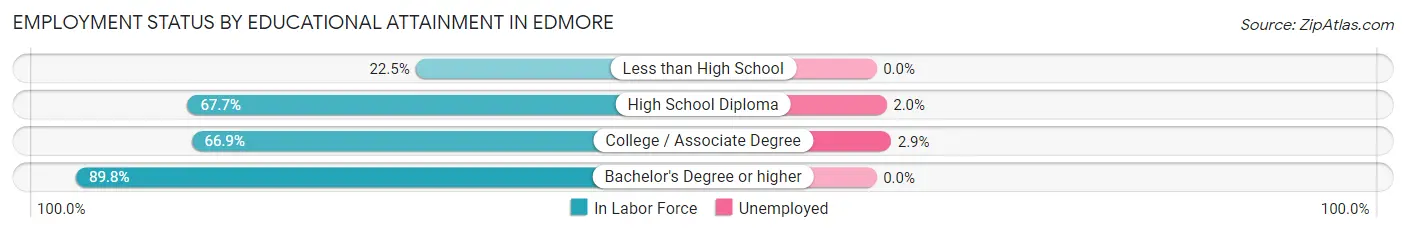
| Educational Attainment | In Labor Force | Unemployed |
| Less than High School | 27 (22.5%) | 0 (0.0%) |
| High School Diploma | 254 (67.7%) | 8 (2.0%) |
| College / Associate Degree | 105 (66.9%) | 5 (2.9%) |
| Bachelor's Degree or higher | 88 (89.8%) | 0 (0.0%) |
| Total | 474 (63.2%) | 13 (1.7%) |
Employment Occupations by Sex in Edmore
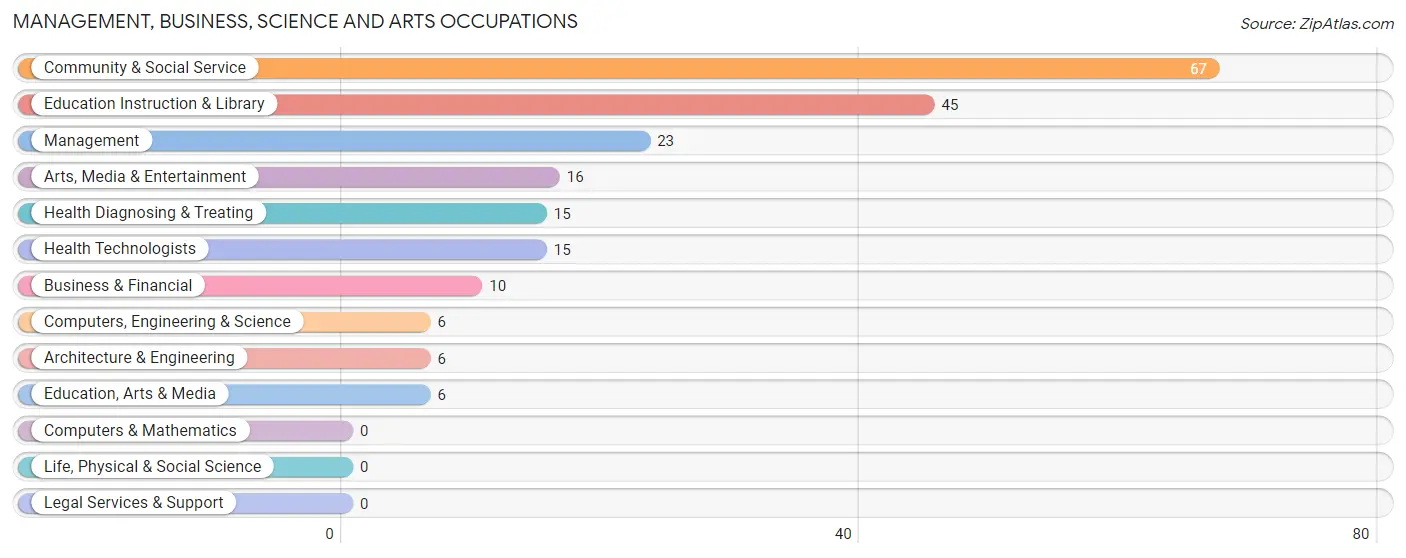
Management, Business, Science and Arts Occupations
The most common Management, Business, Science and Arts occupations in Edmore are Community & Social Service (67 | 12.2%), Education Instruction & Library (45 | 8.2%), Management (23 | 4.2%), Arts, Media & Entertainment (16 | 2.9%), and Health Diagnosing & Treating (15 | 2.7%).
Management, Business, Science and Arts Occupations by Sex
Within the Management, Business, Science and Arts occupations in Edmore, the most male-oriented occupations are Computers, Engineering & Science (100.0%), Architecture & Engineering (100.0%), and Arts, Media & Entertainment (100.0%), while the most female-oriented occupations are Business & Financial (100.0%), Management (78.3%), and Health Diagnosing & Treating (73.3%).
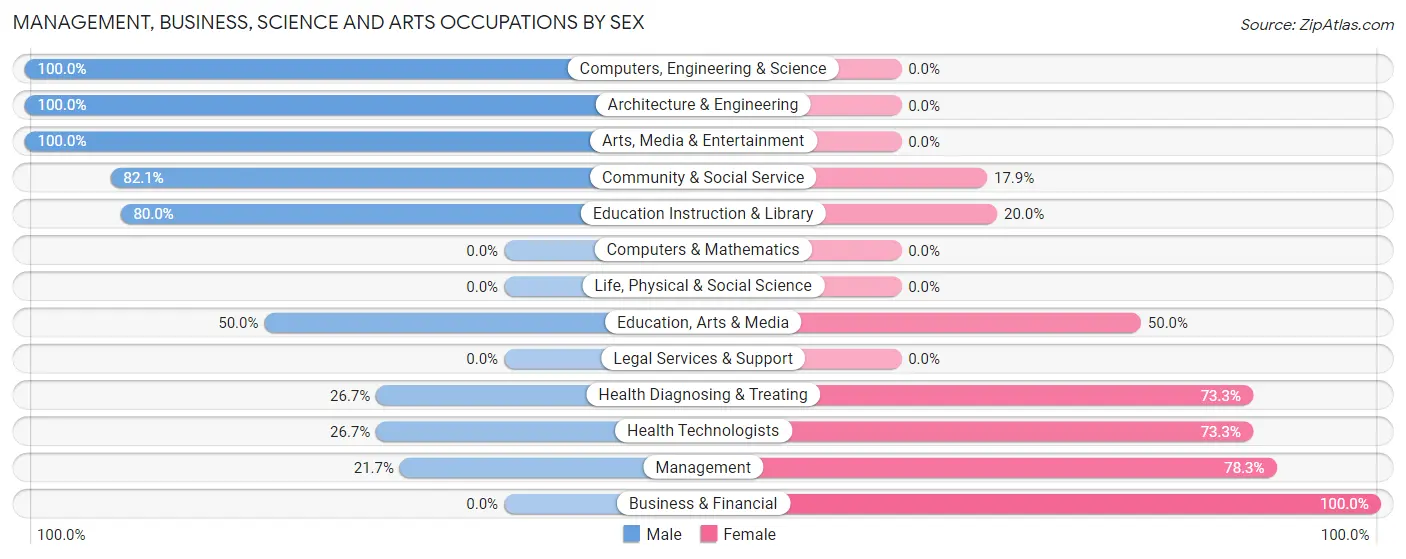
| Occupation | Male | Female |
| Management | 5 (21.7%) | 18 (78.3%) |
| Business & Financial | 0 (0.0%) | 10 (100.0%) |
| Computers, Engineering & Science | 6 (100.0%) | 0 (0.0%) |
| Computers & Mathematics | 0 (0.0%) | 0 (0.0%) |
| Architecture & Engineering | 6 (100.0%) | 0 (0.0%) |
| Life, Physical & Social Science | 0 (0.0%) | 0 (0.0%) |
| Community & Social Service | 55 (82.1%) | 12 (17.9%) |
| Education, Arts & Media | 3 (50.0%) | 3 (50.0%) |
| Legal Services & Support | 0 (0.0%) | 0 (0.0%) |
| Education Instruction & Library | 36 (80.0%) | 9 (20.0%) |
| Arts, Media & Entertainment | 16 (100.0%) | 0 (0.0%) |
| Health Diagnosing & Treating | 4 (26.7%) | 11 (73.3%) |
| Health Technologists | 4 (26.7%) | 11 (73.3%) |
| Total (Category) | 70 (57.9%) | 51 (42.1%) |
| Total (Overall) | 346 (63.2%) | 201 (36.7%) |
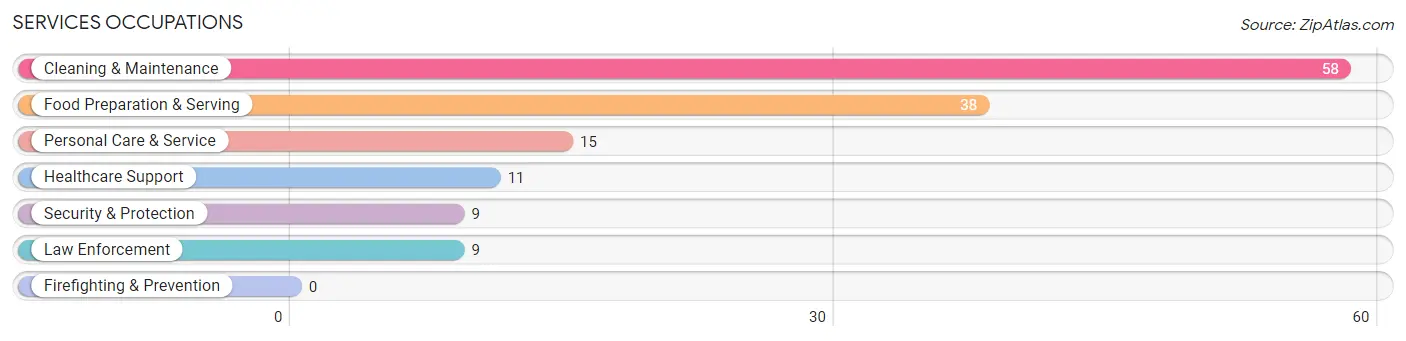
Services Occupations
The most common Services occupations in Edmore are Cleaning & Maintenance (58 | 10.6%), Food Preparation & Serving (38 | 7.0%), Personal Care & Service (15 | 2.7%), Healthcare Support (11 | 2.0%), and Security & Protection (9 | 1.7%).
Services Occupations by Sex
Within the Services occupations in Edmore, the most male-oriented occupations are Security & Protection (100.0%), Law Enforcement (100.0%), and Cleaning & Maintenance (82.8%), while the most female-oriented occupations are Healthcare Support (100.0%), Personal Care & Service (100.0%), and Food Preparation & Serving (57.9%).
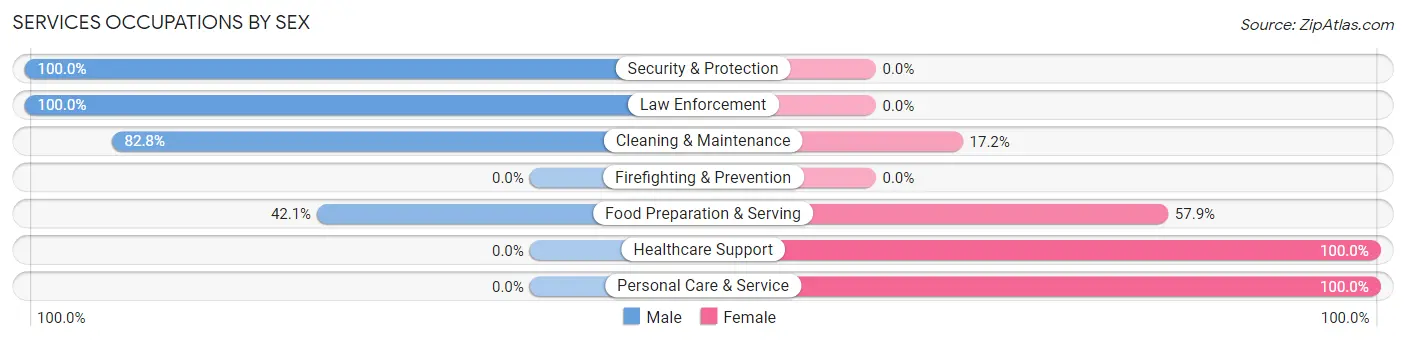
| Occupation | Male | Female |
| Healthcare Support | 0 (0.0%) | 11 (100.0%) |
| Security & Protection | 9 (100.0%) | 0 (0.0%) |
| Firefighting & Prevention | 0 (0.0%) | 0 (0.0%) |
| Law Enforcement | 9 (100.0%) | 0 (0.0%) |
| Food Preparation & Serving | 16 (42.1%) | 22 (57.9%) |
| Cleaning & Maintenance | 48 (82.8%) | 10 (17.2%) |
| Personal Care & Service | 0 (0.0%) | 15 (100.0%) |
| Total (Category) | 73 (55.7%) | 58 (44.3%) |
| Total (Overall) | 346 (63.2%) | 201 (36.7%) |
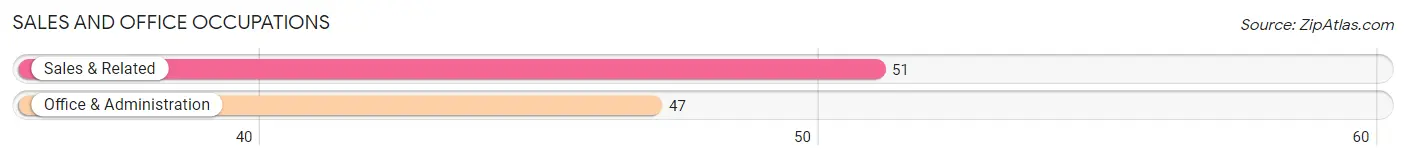
Sales and Office Occupations
The most common Sales and Office occupations in Edmore are Sales & Related (51 | 9.3%), and Office & Administration (47 | 8.6%).
Sales and Office Occupations by Sex
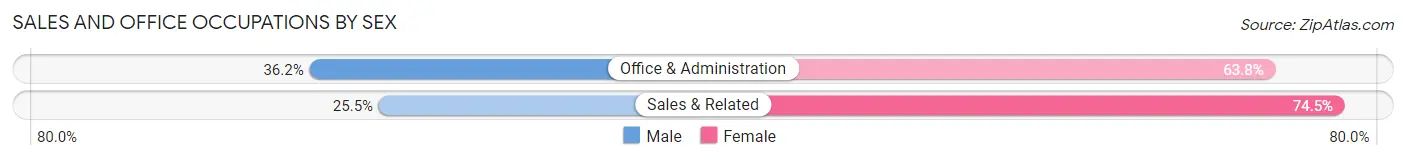
| Occupation | Male | Female |
| Sales & Related | 13 (25.5%) | 38 (74.5%) |
| Office & Administration | 17 (36.2%) | 30 (63.8%) |
| Total (Category) | 30 (30.6%) | 68 (69.4%) |
| Total (Overall) | 346 (63.2%) | 201 (36.7%) |
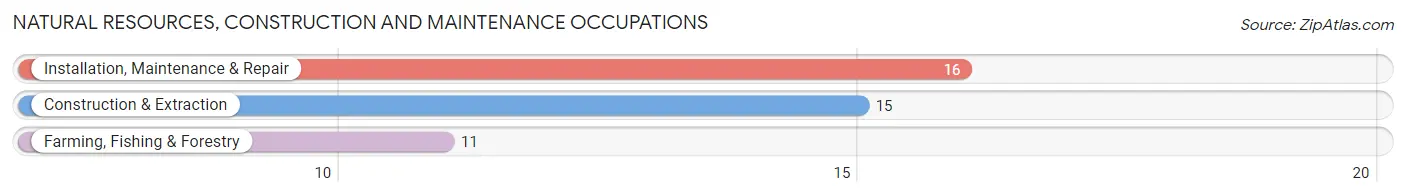
Natural Resources, Construction and Maintenance Occupations
The most common Natural Resources, Construction and Maintenance occupations in Edmore are Installation, Maintenance & Repair (16 | 2.9%), Construction & Extraction (15 | 2.7%), and Farming, Fishing & Forestry (11 | 2.0%).
Natural Resources, Construction and Maintenance Occupations by Sex
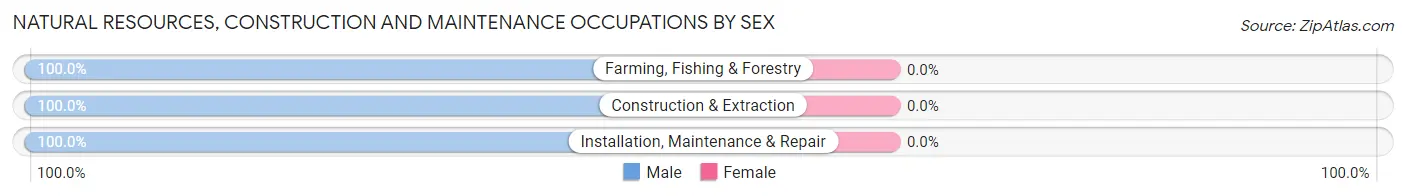
| Occupation | Male | Female |
| Farming, Fishing & Forestry | 11 (100.0%) | 0 (0.0%) |
| Construction & Extraction | 15 (100.0%) | 0 (0.0%) |
| Installation, Maintenance & Repair | 16 (100.0%) | 0 (0.0%) |
| Total (Category) | 42 (100.0%) | 0 (0.0%) |
| Total (Overall) | 346 (63.2%) | 201 (36.7%) |
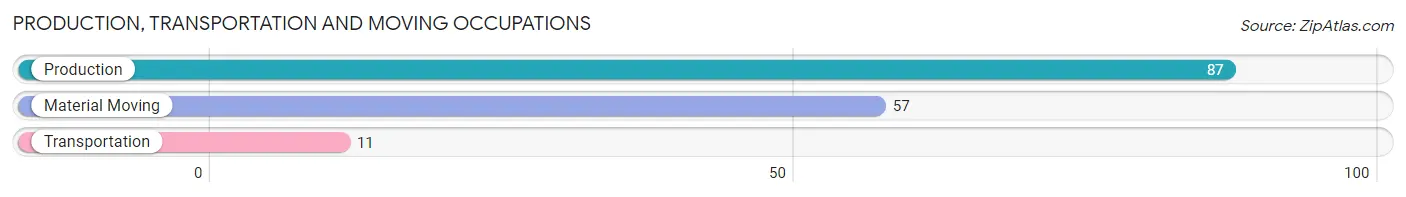
Production, Transportation and Moving Occupations
The most common Production, Transportation and Moving occupations in Edmore are Production (87 | 15.9%), Material Moving (57 | 10.4%), and Transportation (11 | 2.0%).
Production, Transportation and Moving Occupations by Sex
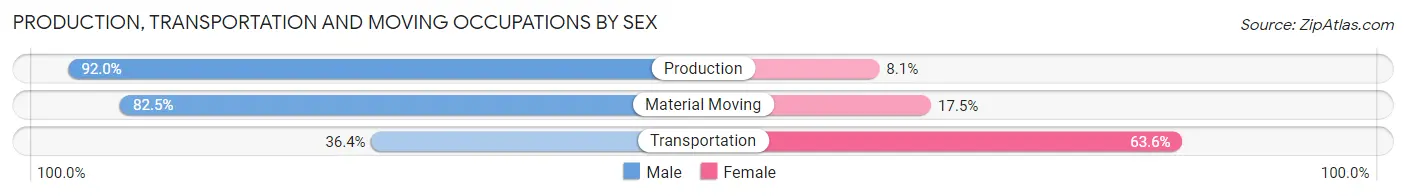
| Occupation | Male | Female |
| Production | 80 (91.9%) | 7 (8.1%) |
| Transportation | 4 (36.4%) | 7 (63.6%) |
| Material Moving | 47 (82.5%) | 10 (17.5%) |
| Total (Category) | 131 (84.5%) | 24 (15.5%) |
| Total (Overall) | 346 (63.2%) | 201 (36.7%) |
Employment Industries by Sex in Edmore
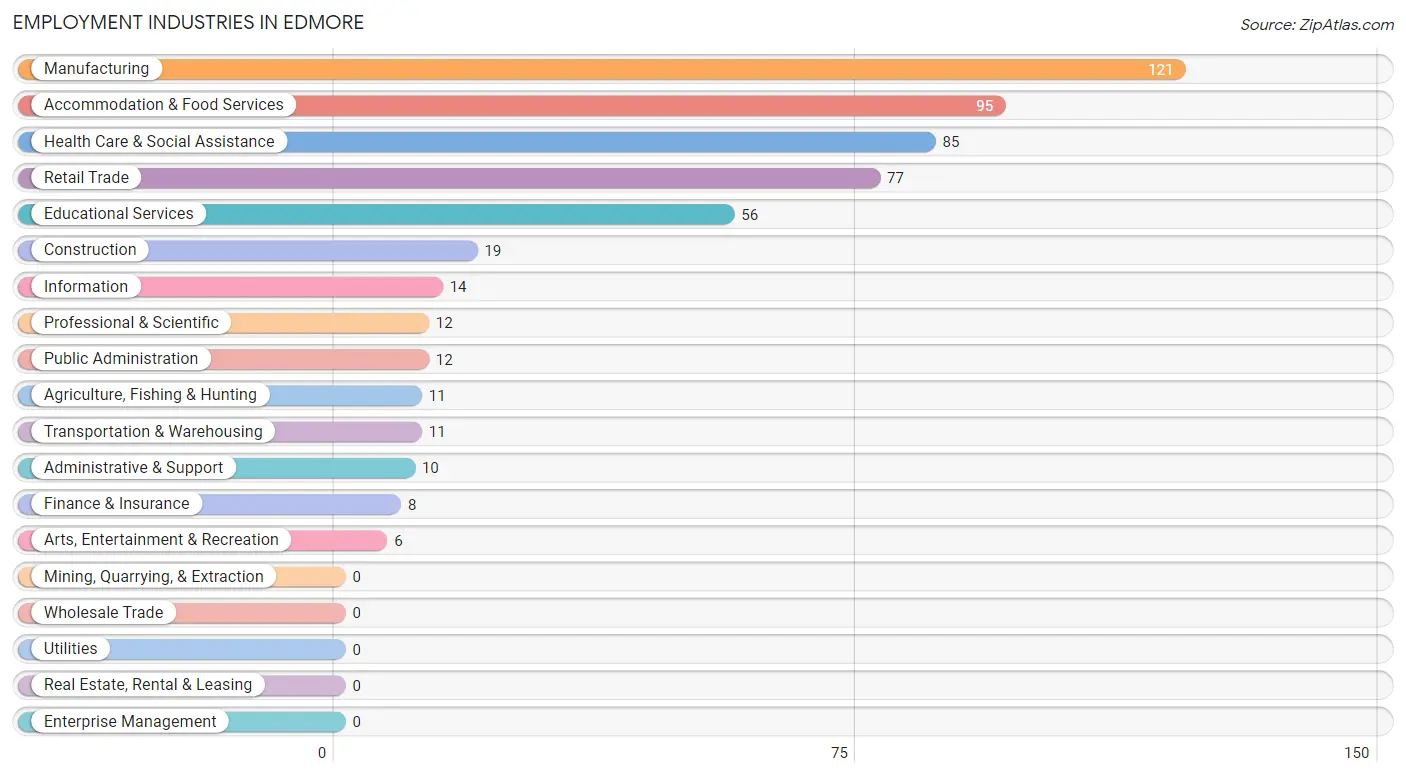
Employment Industries in Edmore
The major employment industries in Edmore include Manufacturing (121 | 22.1%), Accommodation & Food Services (95 | 17.4%), Health Care & Social Assistance (85 | 15.5%), Retail Trade (77 | 14.1%), and Educational Services (56 | 10.2%).
Employment Industries by Sex in Edmore
The Edmore industries that see more men than women are Agriculture, Fishing & Hunting (100.0%), Construction (100.0%), and Professional & Scientific (100.0%), whereas the industries that tend to have a higher number of women are Finance & Insurance (100.0%), Administrative & Support (100.0%), and Health Care & Social Assistance (69.4%).
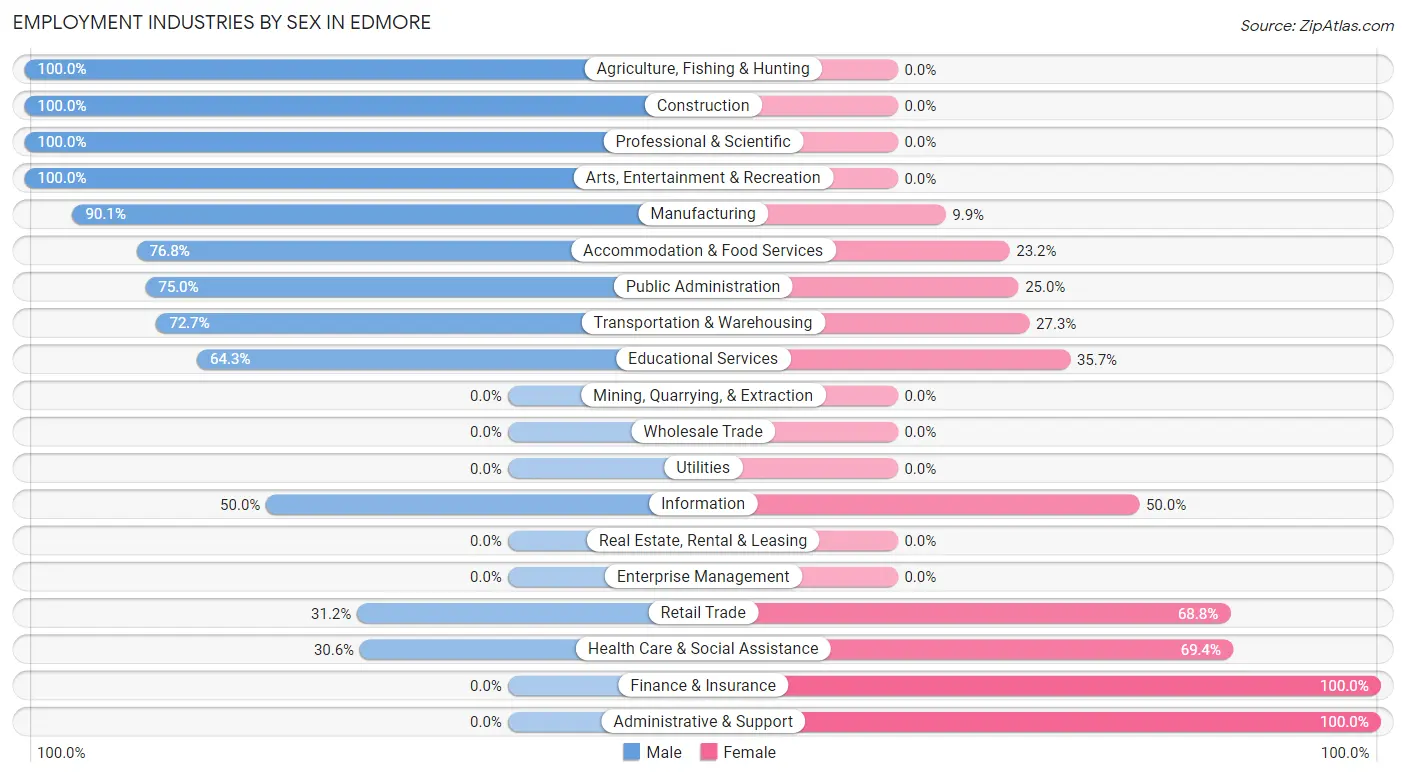
| Industry | Male | Female |
| Agriculture, Fishing & Hunting | 11 (100.0%) | 0 (0.0%) |
| Mining, Quarrying, & Extraction | 0 (0.0%) | 0 (0.0%) |
| Construction | 19 (100.0%) | 0 (0.0%) |
| Manufacturing | 109 (90.1%) | 12 (9.9%) |
| Wholesale Trade | 0 (0.0%) | 0 (0.0%) |
| Retail Trade | 24 (31.2%) | 53 (68.8%) |
| Transportation & Warehousing | 8 (72.7%) | 3 (27.3%) |
| Utilities | 0 (0.0%) | 0 (0.0%) |
| Information | 7 (50.0%) | 7 (50.0%) |
| Finance & Insurance | 0 (0.0%) | 8 (100.0%) |
| Real Estate, Rental & Leasing | 0 (0.0%) | 0 (0.0%) |
| Professional & Scientific | 12 (100.0%) | 0 (0.0%) |
| Enterprise Management | 0 (0.0%) | 0 (0.0%) |
| Administrative & Support | 0 (0.0%) | 10 (100.0%) |
| Educational Services | 36 (64.3%) | 20 (35.7%) |
| Health Care & Social Assistance | 26 (30.6%) | 59 (69.4%) |
| Arts, Entertainment & Recreation | 6 (100.0%) | 0 (0.0%) |
| Accommodation & Food Services | 73 (76.8%) | 22 (23.2%) |
| Public Administration | 9 (75.0%) | 3 (25.0%) |
| Total | 346 (63.2%) | 201 (36.7%) |
Education in Edmore
School Enrollment in Edmore
The most common levels of schooling among the 329 students in Edmore are high school (154 | 46.8%), elementary school (56 | 17.0%), and middle school (51 | 15.5%).
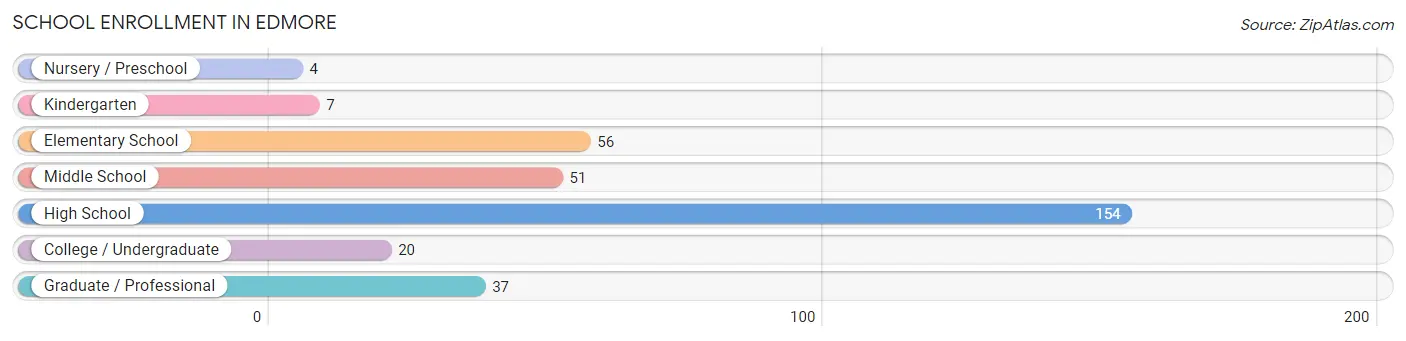
| School Level | # Students | % Students |
| Nursery / Preschool | 4 | 1.2% |
| Kindergarten | 7 | 2.1% |
| Elementary School | 56 | 17.0% |
| Middle School | 51 | 15.5% |
| High School | 154 | 46.8% |
| College / Undergraduate | 20 | 6.1% |
| Graduate / Professional | 37 | 11.3% |
| Total | 329 | 100.0% |
School Enrollment by Age by Funding Source in Edmore
Out of a total of 329 students who are enrolled in schools in Edmore, 30 (9.1%) attend a private institution, while the remaining 299 (90.9%) are enrolled in public schools. The age group of 3 to 4 year olds has the highest likelihood of being enrolled in private schools, with 4 (100.0% in the age bracket) enrolled. Conversely, the age group of 15 to 17 year olds has the lowest likelihood of being enrolled in a private school, with 123 (100.0% in the age bracket) attending a public institution.
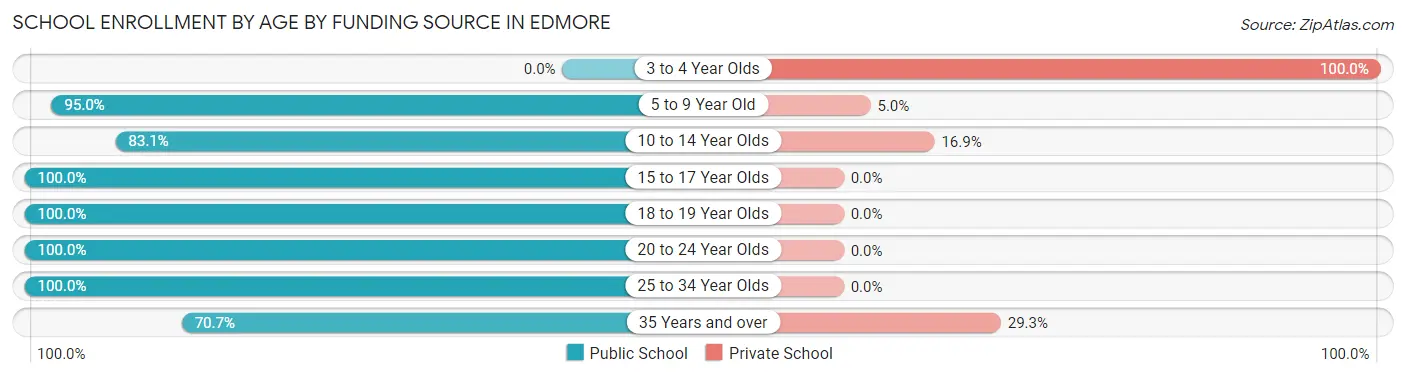
| Age Bracket | Public School | Private School |
| 3 to 4 Year Olds | 0 (0.0%) | 4 (100.0%) |
| 5 to 9 Year Old | 57 (95.0%) | 3 (5.0%) |
| 10 to 14 Year Olds | 54 (83.1%) | 11 (16.9%) |
| 15 to 17 Year Olds | 123 (100.0%) | 0 (0.0%) |
| 18 to 19 Year Olds | 18 (100.0%) | 0 (0.0%) |
| 20 to 24 Year Olds | 12 (100.0%) | 0 (0.0%) |
| 25 to 34 Year Olds | 6 (100.0%) | 0 (0.0%) |
| 35 Years and over | 29 (70.7%) | 12 (29.3%) |
| Total | 299 (90.9%) | 30 (9.1%) |
Educational Attainment by Field of Study in Edmore
Business (41 | 27.0%), education (36 | 23.7%), science & technology (21 | 13.8%), psychology (17 | 11.2%), and arts & humanities (11 | 7.2%) are the most common fields of study among 152 individuals in Edmore who have obtained a bachelor's degree or higher.
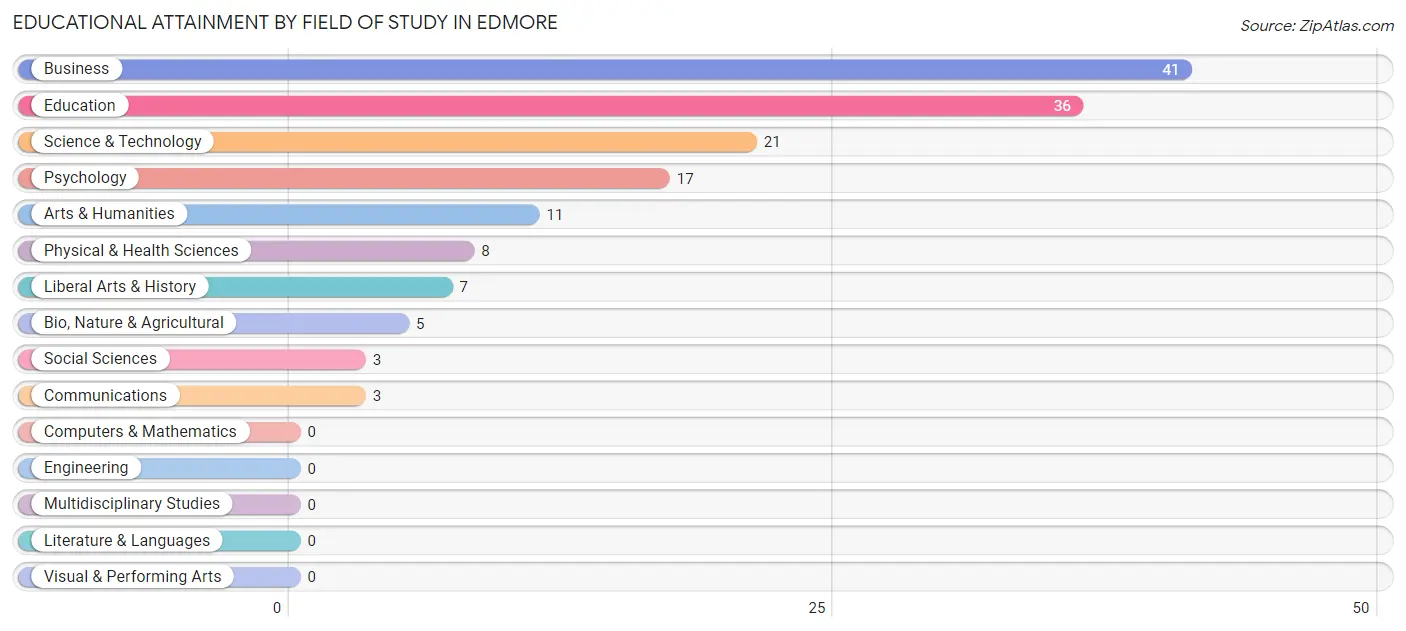
| Field of Study | # Graduates | % Graduates |
| Computers & Mathematics | 0 | 0.0% |
| Bio, Nature & Agricultural | 5 | 3.3% |
| Physical & Health Sciences | 8 | 5.3% |
| Psychology | 17 | 11.2% |
| Social Sciences | 3 | 2.0% |
| Engineering | 0 | 0.0% |
| Multidisciplinary Studies | 0 | 0.0% |
| Science & Technology | 21 | 13.8% |
| Business | 41 | 27.0% |
| Education | 36 | 23.7% |
| Literature & Languages | 0 | 0.0% |
| Liberal Arts & History | 7 | 4.6% |
| Visual & Performing Arts | 0 | 0.0% |
| Communications | 3 | 2.0% |
| Arts & Humanities | 11 | 7.2% |
| Total | 152 | 100.0% |
Transportation & Commute in Edmore
Vehicle Availability by Sex in Edmore
The most prevalent vehicle ownership categories in Edmore are males with 2 vehicles (172, accounting for 49.7%) and females with 2 vehicles (85, making up 86.9%).
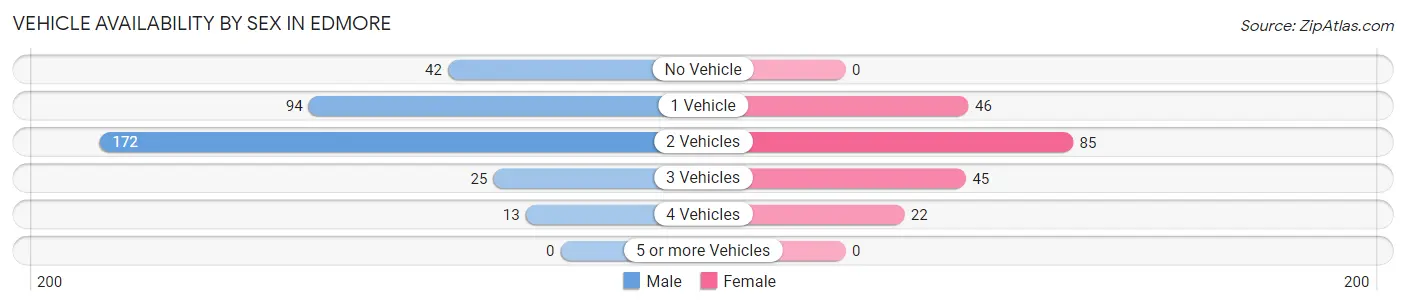
| Vehicles Available | Male | Female |
| No Vehicle | 42 (12.1%) | 0 (0.0%) |
| 1 Vehicle | 94 (27.2%) | 46 (23.2%) |
| 2 Vehicles | 172 (49.7%) | 85 (42.9%) |
| 3 Vehicles | 25 (7.2%) | 45 (22.7%) |
| 4 Vehicles | 13 (3.8%) | 22 (11.1%) |
| 5 or more Vehicles | 0 (0.0%) | 0 (0.0%) |
| Total | 346 (100.0%) | 198 (100.0%) |
Commute Time in Edmore
The most frequently occuring commute durations in Edmore are 5 to 9 minutes (101 commuters, 19.5%), 15 to 19 minutes (101 commuters, 19.5%), and 20 to 24 minutes (88 commuters, 17.0%).
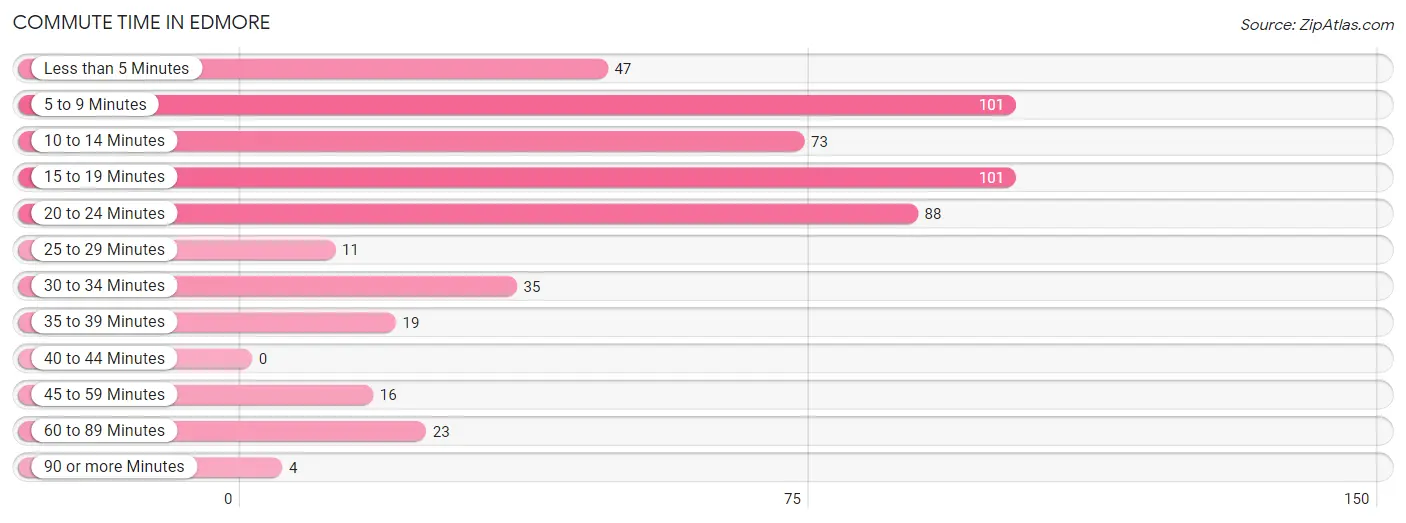
| Commute Time | # Commuters | % Commuters |
| Less than 5 Minutes | 47 | 9.1% |
| 5 to 9 Minutes | 101 | 19.5% |
| 10 to 14 Minutes | 73 | 14.1% |
| 15 to 19 Minutes | 101 | 19.5% |
| 20 to 24 Minutes | 88 | 17.0% |
| 25 to 29 Minutes | 11 | 2.1% |
| 30 to 34 Minutes | 35 | 6.8% |
| 35 to 39 Minutes | 19 | 3.7% |
| 40 to 44 Minutes | 0 | 0.0% |
| 45 to 59 Minutes | 16 | 3.1% |
| 60 to 89 Minutes | 23 | 4.4% |
| 90 or more Minutes | 4 | 0.8% |
Commute Time by Sex in Edmore
The most common commute times in Edmore are 5 to 9 minutes (71 commuters, 20.5%) for males and 15 to 19 minutes (31 commuters, 18.0%) for females.
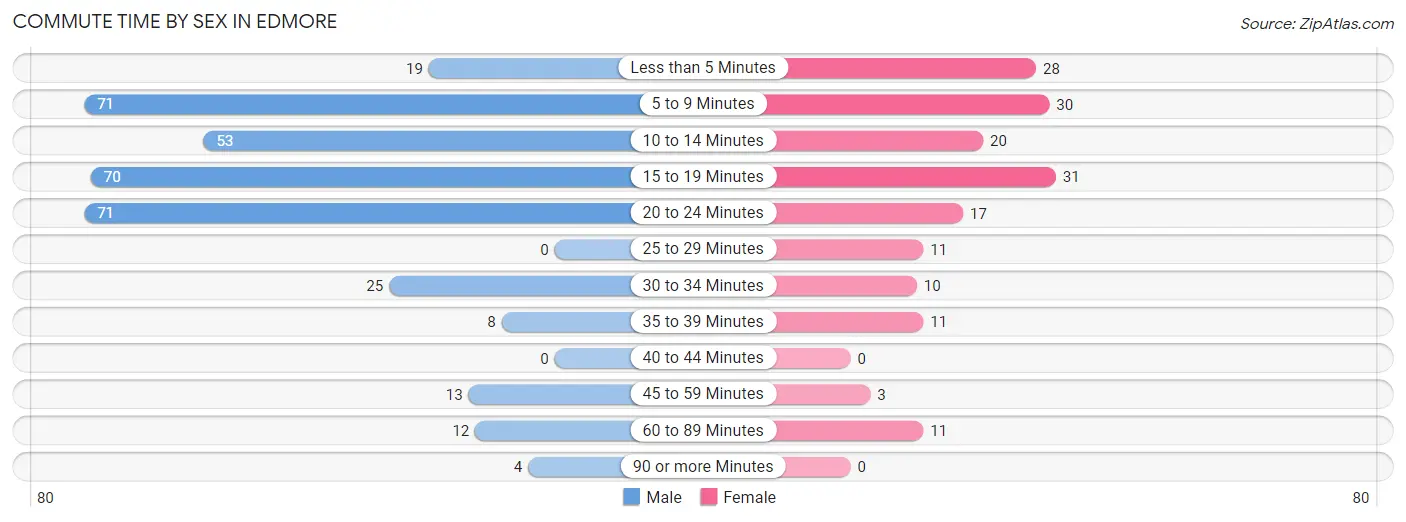
| Commute Time | Male | Female |
| Less than 5 Minutes | 19 (5.5%) | 28 (16.3%) |
| 5 to 9 Minutes | 71 (20.5%) | 30 (17.4%) |
| 10 to 14 Minutes | 53 (15.3%) | 20 (11.6%) |
| 15 to 19 Minutes | 70 (20.2%) | 31 (18.0%) |
| 20 to 24 Minutes | 71 (20.5%) | 17 (9.9%) |
| 25 to 29 Minutes | 0 (0.0%) | 11 (6.4%) |
| 30 to 34 Minutes | 25 (7.2%) | 10 (5.8%) |
| 35 to 39 Minutes | 8 (2.3%) | 11 (6.4%) |
| 40 to 44 Minutes | 0 (0.0%) | 0 (0.0%) |
| 45 to 59 Minutes | 13 (3.8%) | 3 (1.7%) |
| 60 to 89 Minutes | 12 (3.5%) | 11 (6.4%) |
| 90 or more Minutes | 4 (1.2%) | 0 (0.0%) |
Time of Departure to Work by Sex in Edmore
The most frequent times of departure to work in Edmore are 7:00 AM to 7:29 AM (76, 22.0%) for males and 5:30 AM to 5:59 AM (25, 14.5%) for females.
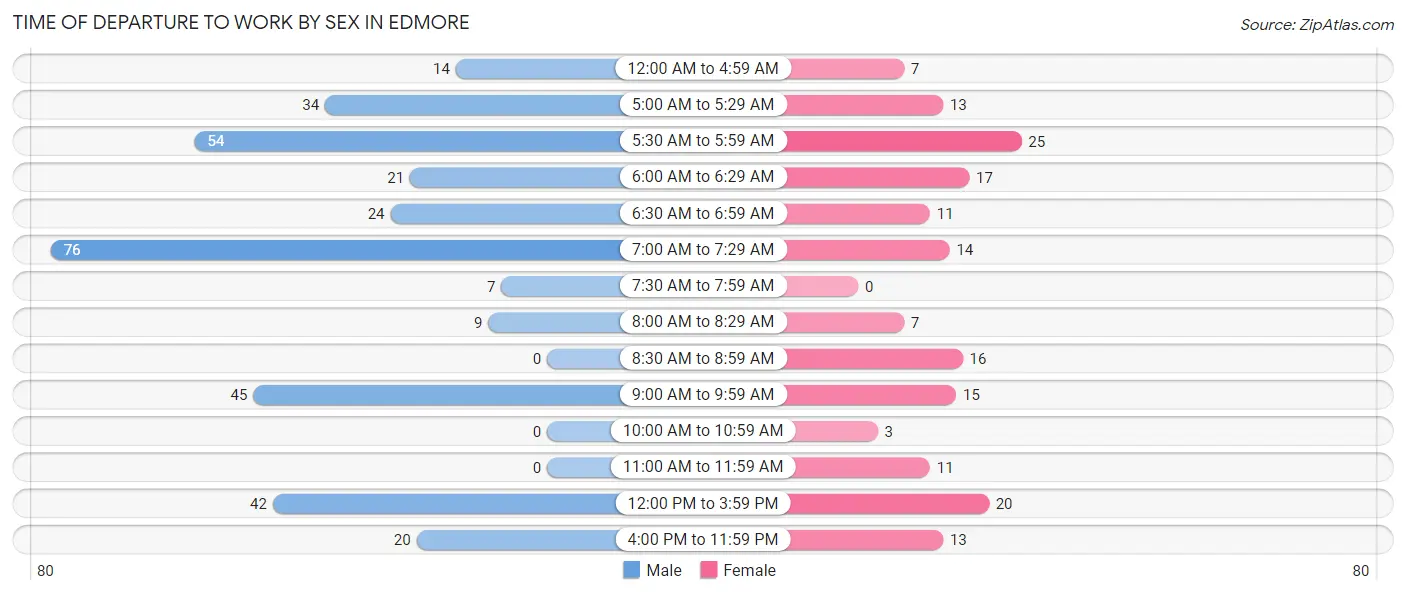
| Time of Departure | Male | Female |
| 12:00 AM to 4:59 AM | 14 (4.1%) | 7 (4.1%) |
| 5:00 AM to 5:29 AM | 34 (9.8%) | 13 (7.6%) |
| 5:30 AM to 5:59 AM | 54 (15.6%) | 25 (14.5%) |
| 6:00 AM to 6:29 AM | 21 (6.1%) | 17 (9.9%) |
| 6:30 AM to 6:59 AM | 24 (6.9%) | 11 (6.4%) |
| 7:00 AM to 7:29 AM | 76 (22.0%) | 14 (8.1%) |
| 7:30 AM to 7:59 AM | 7 (2.0%) | 0 (0.0%) |
| 8:00 AM to 8:29 AM | 9 (2.6%) | 7 (4.1%) |
| 8:30 AM to 8:59 AM | 0 (0.0%) | 16 (9.3%) |
| 9:00 AM to 9:59 AM | 45 (13.0%) | 15 (8.7%) |
| 10:00 AM to 10:59 AM | 0 (0.0%) | 3 (1.7%) |
| 11:00 AM to 11:59 AM | 0 (0.0%) | 11 (6.4%) |
| 12:00 PM to 3:59 PM | 42 (12.1%) | 20 (11.6%) |
| 4:00 PM to 11:59 PM | 20 (5.8%) | 13 (7.6%) |
| Total | 346 (100.0%) | 172 (100.0%) |
Housing Occupancy in Edmore
Occupancy by Ownership in Edmore
Of the total 572 dwellings in Edmore, owner-occupied units account for 418 (73.1%), while renter-occupied units make up 154 (26.9%).
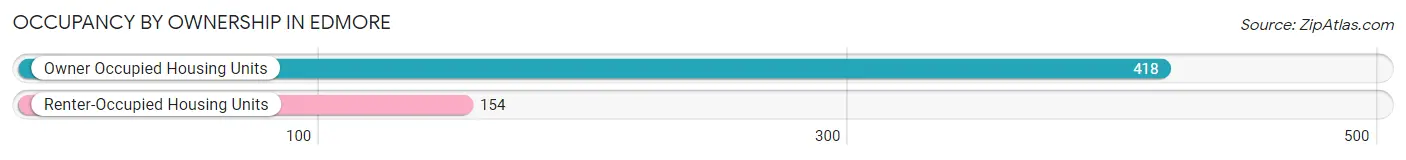
| Occupancy | # Housing Units | % Housing Units |
| Owner Occupied Housing Units | 418 | 73.1% |
| Renter-Occupied Housing Units | 154 | 26.9% |
| Total Occupied Housing Units | 572 | 100.0% |
Occupancy by Household Size in Edmore
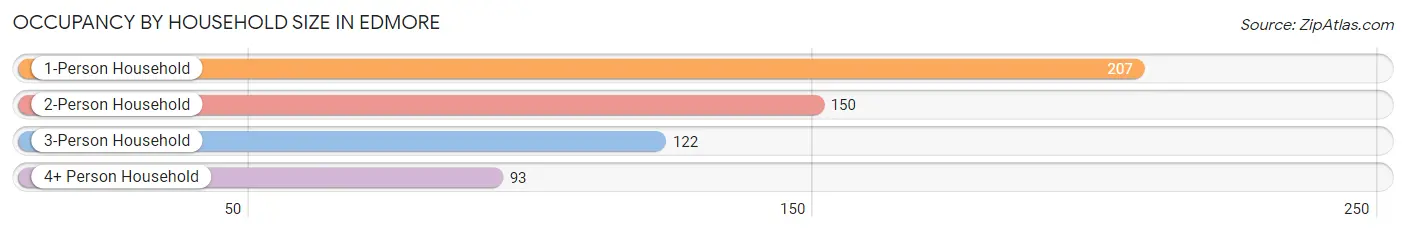
| Household Size | # Housing Units | % Housing Units |
| 1-Person Household | 207 | 36.2% |
| 2-Person Household | 150 | 26.2% |
| 3-Person Household | 122 | 21.3% |
| 4+ Person Household | 93 | 16.3% |
| Total Housing Units | 572 | 100.0% |
Occupancy by Ownership by Household Size in Edmore
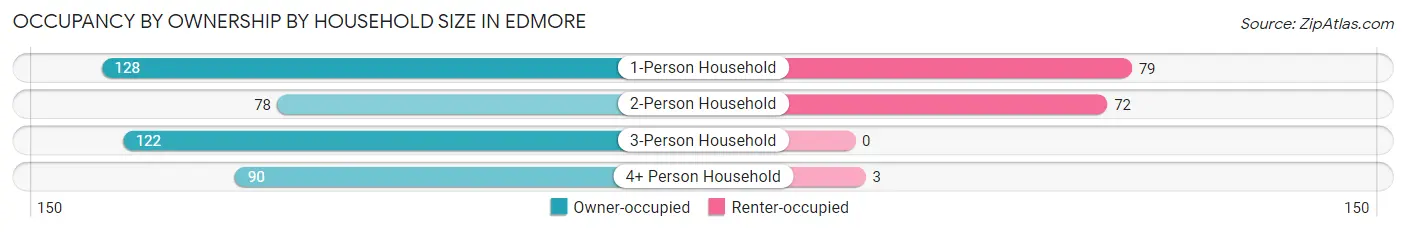
| Household Size | Owner-occupied | Renter-occupied |
| 1-Person Household | 128 (61.8%) | 79 (38.2%) |
| 2-Person Household | 78 (52.0%) | 72 (48.0%) |
| 3-Person Household | 122 (100.0%) | 0 (0.0%) |
| 4+ Person Household | 90 (96.8%) | 3 (3.2%) |
| Total Housing Units | 418 (73.1%) | 154 (26.9%) |
Occupancy by Educational Attainment in Edmore
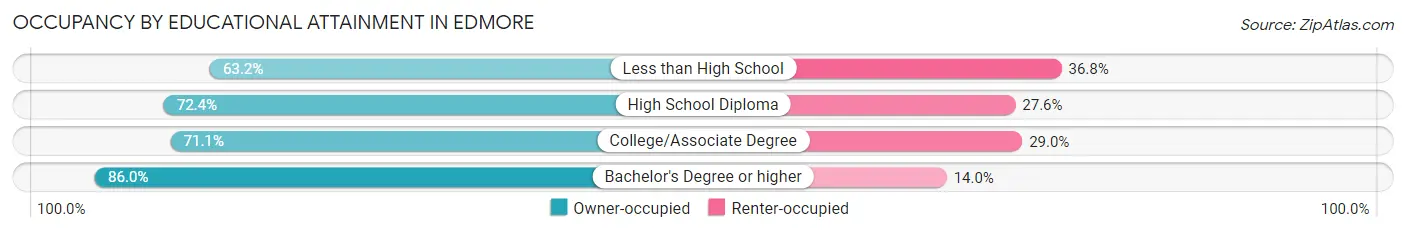
| Household Size | Owner-occupied | Renter-occupied |
| Less than High School | 43 (63.2%) | 25 (36.8%) |
| High School Diploma | 160 (72.4%) | 61 (27.6%) |
| College/Associate Degree | 135 (71.1%) | 55 (28.9%) |
| Bachelor's Degree or higher | 80 (86.0%) | 13 (14.0%) |
Occupancy by Age of Householder in Edmore
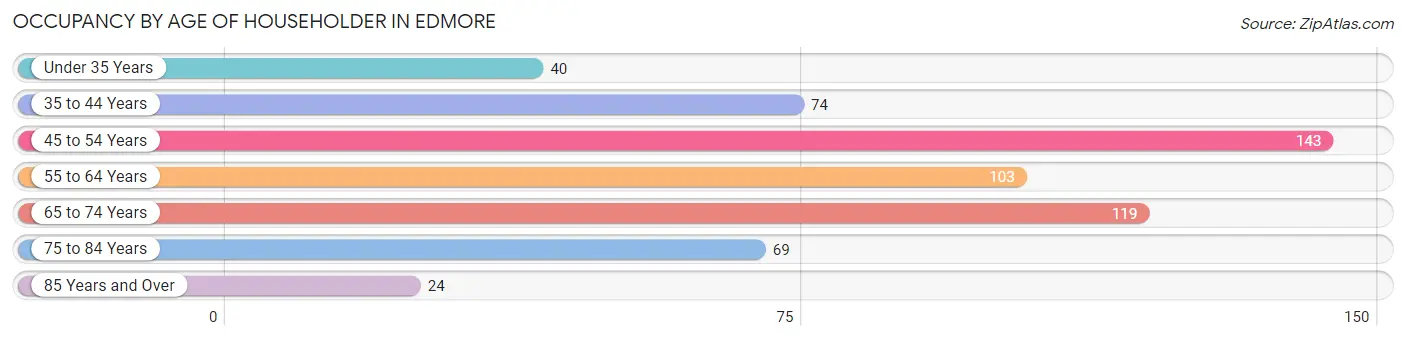
| Age Bracket | # Households | % Households |
| Under 35 Years | 40 | 7.0% |
| 35 to 44 Years | 74 | 12.9% |
| 45 to 54 Years | 143 | 25.0% |
| 55 to 64 Years | 103 | 18.0% |
| 65 to 74 Years | 119 | 20.8% |
| 75 to 84 Years | 69 | 12.1% |
| 85 Years and Over | 24 | 4.2% |
| Total | 572 | 100.0% |
Housing Finances in Edmore
Median Income by Occupancy in Edmore
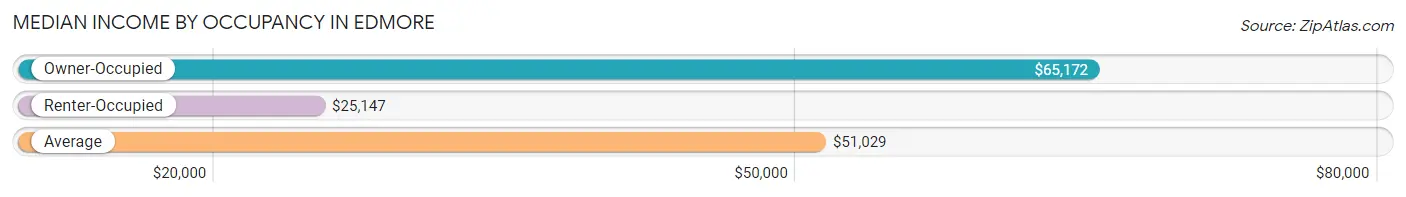
| Occupancy Type | # Households | Median Income |
| Owner-Occupied | 418 (73.1%) | $65,172 |
| Renter-Occupied | 154 (26.9%) | $25,147 |
| Average | 572 (100.0%) | $51,029 |
Occupancy by Householder Income Bracket in Edmore
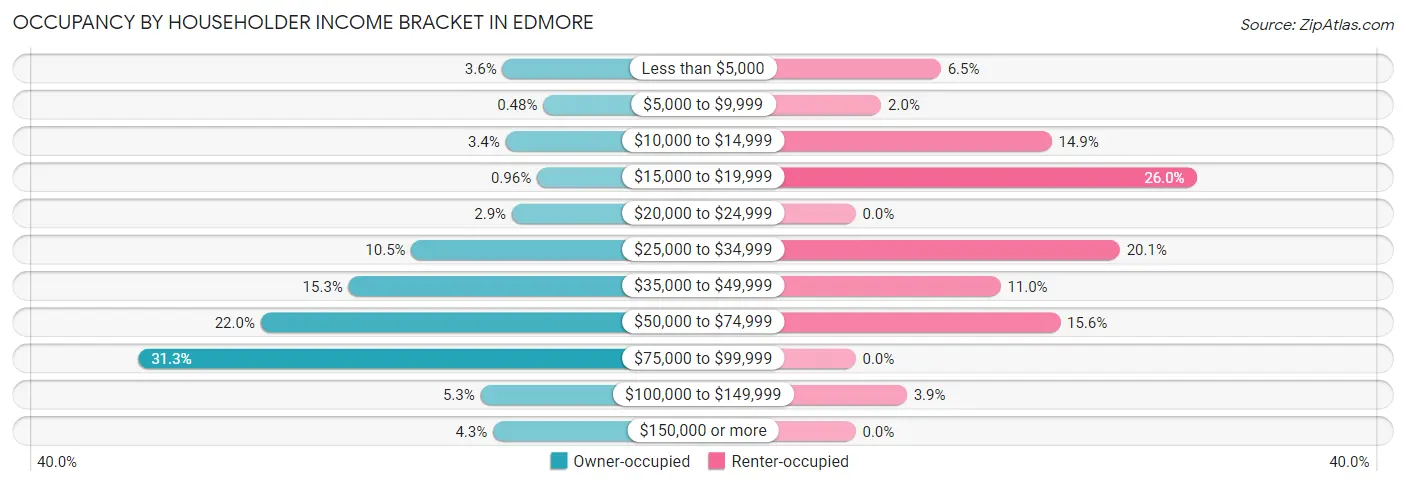
| Income Bracket | Owner-occupied | Renter-occupied |
| Less than $5,000 | 15 (3.6%) | 10 (6.5%) |
| $5,000 to $9,999 | 2 (0.5%) | 3 (1.9%) |
| $10,000 to $14,999 | 14 (3.4%) | 23 (14.9%) |
| $15,000 to $19,999 | 4 (1.0%) | 40 (26.0%) |
| $20,000 to $24,999 | 12 (2.9%) | 0 (0.0%) |
| $25,000 to $34,999 | 44 (10.5%) | 31 (20.1%) |
| $35,000 to $49,999 | 64 (15.3%) | 17 (11.0%) |
| $50,000 to $74,999 | 92 (22.0%) | 24 (15.6%) |
| $75,000 to $99,999 | 131 (31.3%) | 0 (0.0%) |
| $100,000 to $149,999 | 22 (5.3%) | 6 (3.9%) |
| $150,000 or more | 18 (4.3%) | 0 (0.0%) |
| Total | 418 (100.0%) | 154 (100.0%) |
Monthly Housing Cost Tiers in Edmore
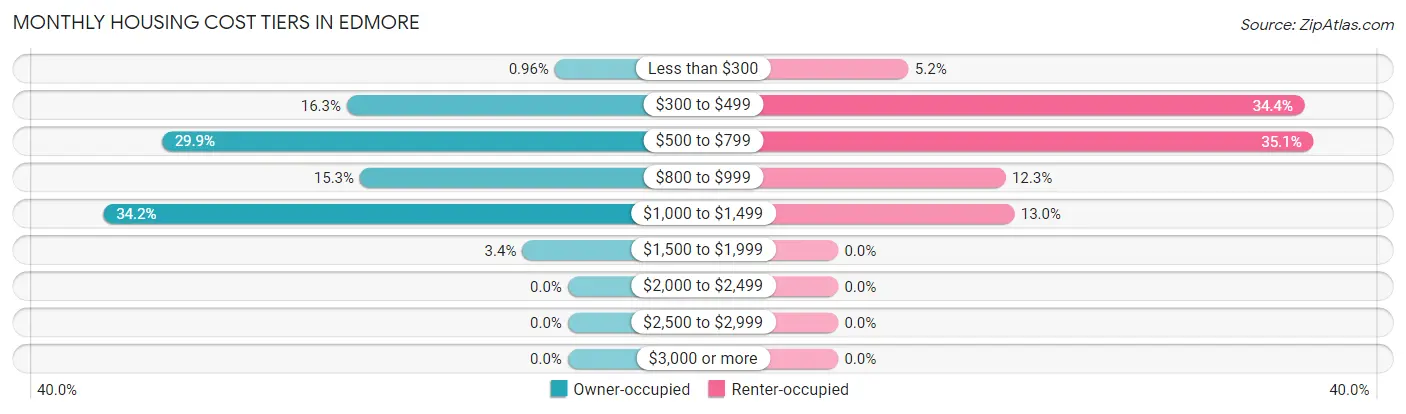
| Monthly Cost | Owner-occupied | Renter-occupied |
| Less than $300 | 4 (1.0%) | 8 (5.2%) |
| $300 to $499 | 68 (16.3%) | 53 (34.4%) |
| $500 to $799 | 125 (29.9%) | 54 (35.1%) |
| $800 to $999 | 64 (15.3%) | 19 (12.3%) |
| $1,000 to $1,499 | 143 (34.2%) | 20 (13.0%) |
| $1,500 to $1,999 | 14 (3.4%) | 0 (0.0%) |
| $2,000 to $2,499 | 0 (0.0%) | 0 (0.0%) |
| $2,500 to $2,999 | 0 (0.0%) | 0 (0.0%) |
| $3,000 or more | 0 (0.0%) | 0 (0.0%) |
| Total | 418 (100.0%) | 154 (100.0%) |
Physical Housing Characteristics in Edmore
Housing Structures in Edmore
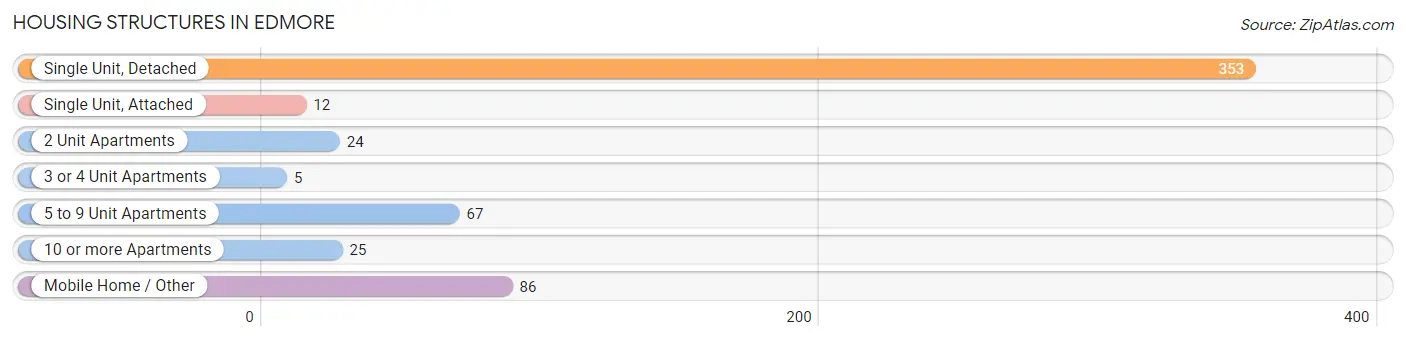
| Structure Type | # Housing Units | % Housing Units |
| Single Unit, Detached | 353 | 61.7% |
| Single Unit, Attached | 12 | 2.1% |
| 2 Unit Apartments | 24 | 4.2% |
| 3 or 4 Unit Apartments | 5 | 0.9% |
| 5 to 9 Unit Apartments | 67 | 11.7% |
| 10 or more Apartments | 25 | 4.4% |
| Mobile Home / Other | 86 | 15.0% |
| Total | 572 | 100.0% |
Housing Structures by Occupancy in Edmore
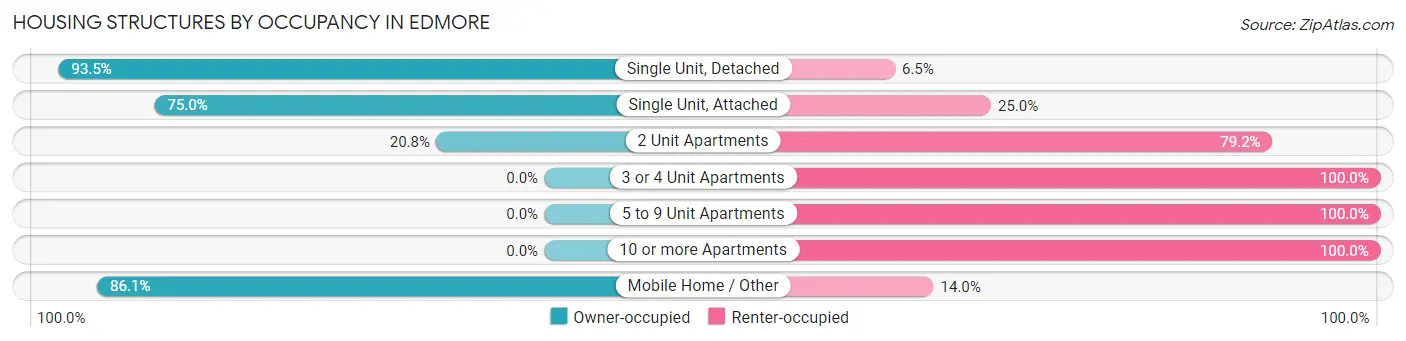
| Structure Type | Owner-occupied | Renter-occupied |
| Single Unit, Detached | 330 (93.5%) | 23 (6.5%) |
| Single Unit, Attached | 9 (75.0%) | 3 (25.0%) |
| 2 Unit Apartments | 5 (20.8%) | 19 (79.2%) |
| 3 or 4 Unit Apartments | 0 (0.0%) | 5 (100.0%) |
| 5 to 9 Unit Apartments | 0 (0.0%) | 67 (100.0%) |
| 10 or more Apartments | 0 (0.0%) | 25 (100.0%) |
| Mobile Home / Other | 74 (86.1%) | 12 (14.0%) |
| Total | 418 (73.1%) | 154 (26.9%) |
Housing Structures by Number of Rooms in Edmore
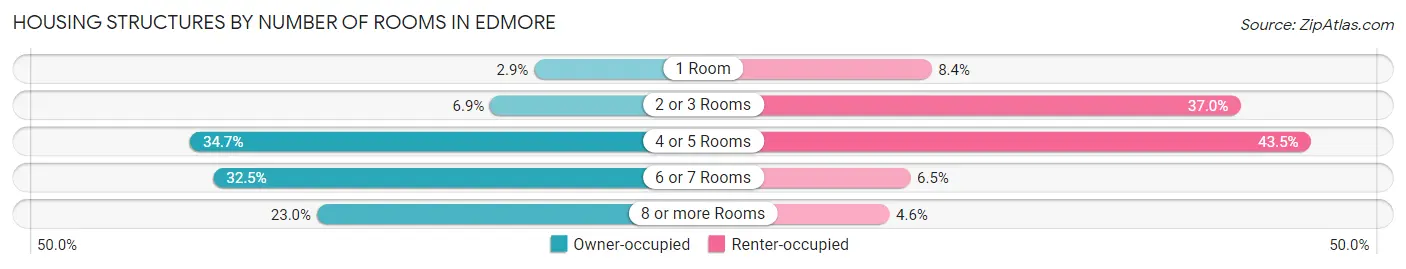
| Number of Rooms | Owner-occupied | Renter-occupied |
| 1 Room | 12 (2.9%) | 13 (8.4%) |
| 2 or 3 Rooms | 29 (6.9%) | 57 (37.0%) |
| 4 or 5 Rooms | 145 (34.7%) | 67 (43.5%) |
| 6 or 7 Rooms | 136 (32.5%) | 10 (6.5%) |
| 8 or more Rooms | 96 (23.0%) | 7 (4.5%) |
| Total | 418 (100.0%) | 154 (100.0%) |
Housing Structure by Heating Type in Edmore
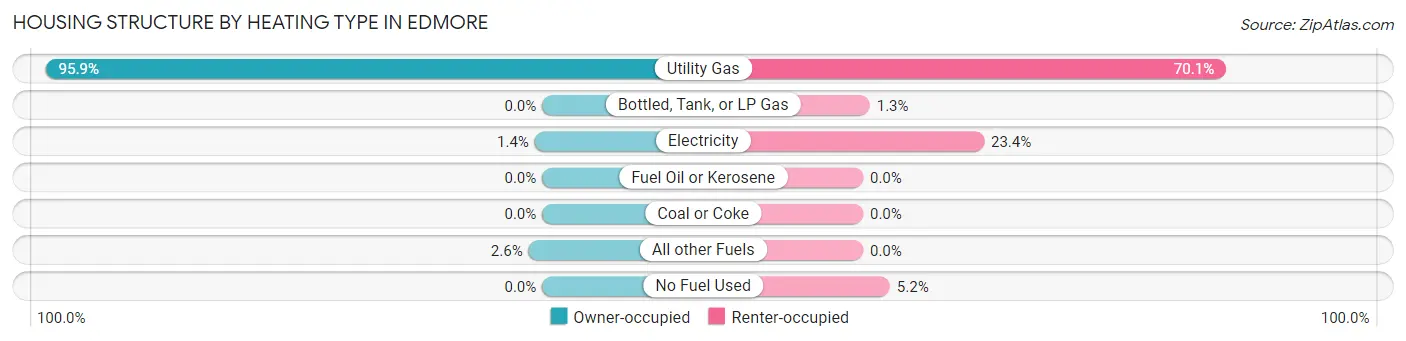
| Heating Type | Owner-occupied | Renter-occupied |
| Utility Gas | 401 (95.9%) | 108 (70.1%) |
| Bottled, Tank, or LP Gas | 0 (0.0%) | 2 (1.3%) |
| Electricity | 6 (1.4%) | 36 (23.4%) |
| Fuel Oil or Kerosene | 0 (0.0%) | 0 (0.0%) |
| Coal or Coke | 0 (0.0%) | 0 (0.0%) |
| All other Fuels | 11 (2.6%) | 0 (0.0%) |
| No Fuel Used | 0 (0.0%) | 8 (5.2%) |
| Total | 418 (100.0%) | 154 (100.0%) |
Household Vehicle Usage in Edmore
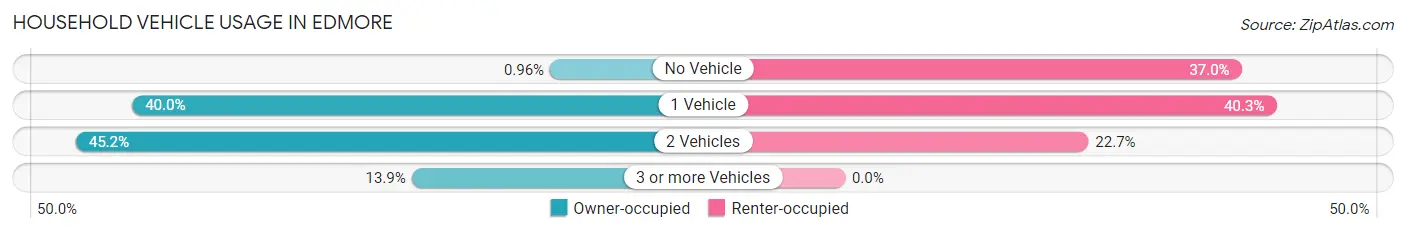
| Vehicles per Household | Owner-occupied | Renter-occupied |
| No Vehicle | 4 (1.0%) | 57 (37.0%) |
| 1 Vehicle | 167 (40.0%) | 62 (40.3%) |
| 2 Vehicles | 189 (45.2%) | 35 (22.7%) |
| 3 or more Vehicles | 58 (13.9%) | 0 (0.0%) |
| Total | 418 (100.0%) | 154 (100.0%) |
Real Estate & Mortgages in Edmore
Real Estate and Mortgage Overview in Edmore
| Characteristic | Without Mortgage | With Mortgage |
| Housing Units | 141 | 277 |
| Median Property Value | $119,100 | $73,200 |
| Median Household Income | $38,750 | $14 |
| Monthly Housing Costs | $510 | $0 |
| Real Estate Taxes | $1,437 | $74 |
Property Value by Mortgage Status in Edmore
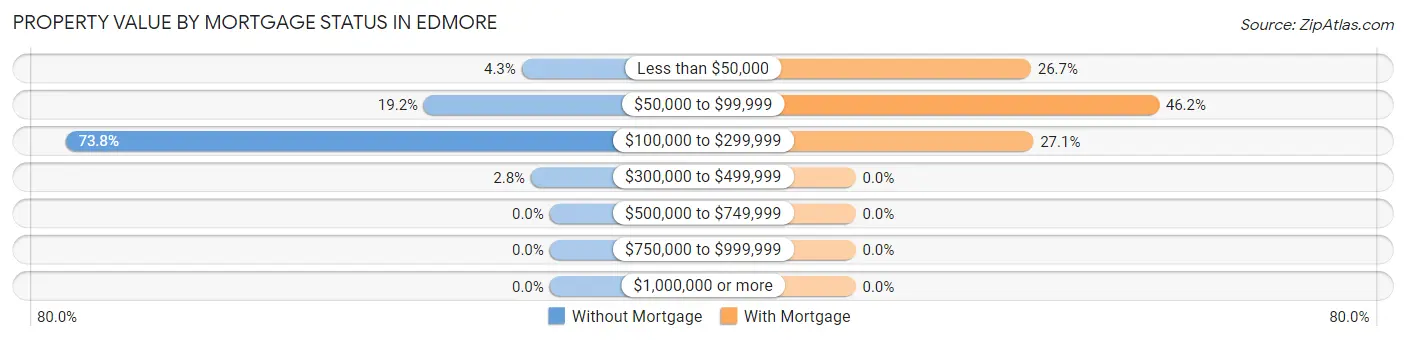
| Property Value | Without Mortgage | With Mortgage |
| Less than $50,000 | 6 (4.3%) | 74 (26.7%) |
| $50,000 to $99,999 | 27 (19.2%) | 128 (46.2%) |
| $100,000 to $299,999 | 104 (73.8%) | 75 (27.1%) |
| $300,000 to $499,999 | 4 (2.8%) | 0 (0.0%) |
| $500,000 to $749,999 | 0 (0.0%) | 0 (0.0%) |
| $750,000 to $999,999 | 0 (0.0%) | 0 (0.0%) |
| $1,000,000 or more | 0 (0.0%) | 0 (0.0%) |
| Total | 141 (100.0%) | 277 (100.0%) |
Household Income by Mortgage Status in Edmore
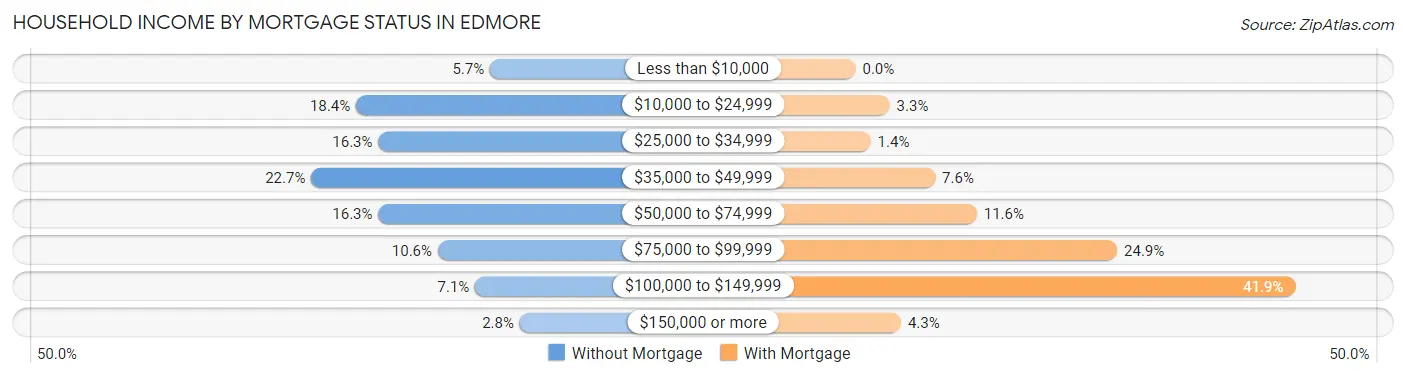
| Household Income | Without Mortgage | With Mortgage |
| Less than $10,000 | 8 (5.7%) | 0 (0.0%) |
| $10,000 to $24,999 | 26 (18.4%) | 9 (3.3%) |
| $25,000 to $34,999 | 23 (16.3%) | 4 (1.4%) |
| $35,000 to $49,999 | 32 (22.7%) | 21 (7.6%) |
| $50,000 to $74,999 | 23 (16.3%) | 32 (11.6%) |
| $75,000 to $99,999 | 15 (10.6%) | 69 (24.9%) |
| $100,000 to $149,999 | 10 (7.1%) | 116 (41.9%) |
| $150,000 or more | 4 (2.8%) | 12 (4.3%) |
| Total | 141 (100.0%) | 277 (100.0%) |
Property Value to Household Income Ratio in Edmore
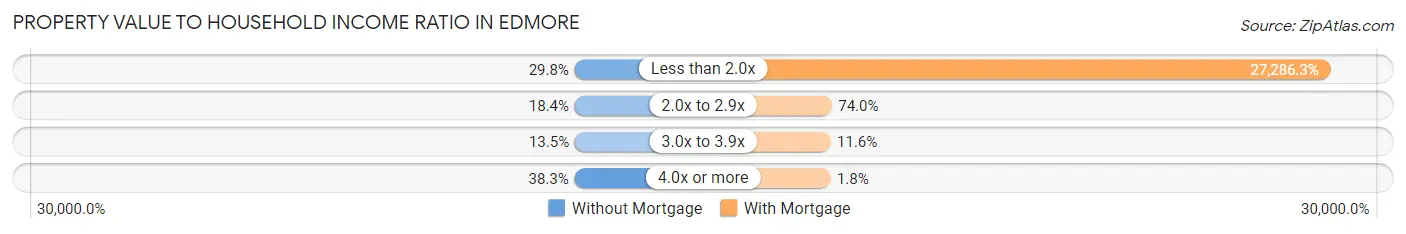
| Value-to-Income Ratio | Without Mortgage | With Mortgage |
| Less than 2.0x | 42 (29.8%) | 75,583 (27,286.3%) |
| 2.0x to 2.9x | 26 (18.4%) | 205 (74.0%) |
| 3.0x to 3.9x | 19 (13.5%) | 32 (11.6%) |
| 4.0x or more | 54 (38.3%) | 5 (1.8%) |
| Total | 141 (100.0%) | 277 (100.0%) |
Real Estate Taxes by Mortgage Status in Edmore
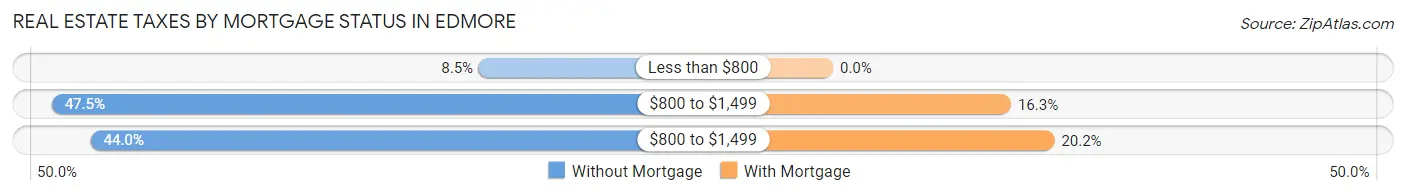
| Property Taxes | Without Mortgage | With Mortgage |
| Less than $800 | 12 (8.5%) | 0 (0.0%) |
| $800 to $1,499 | 67 (47.5%) | 45 (16.3%) |
| $800 to $1,499 | 62 (44.0%) | 56 (20.2%) |
| Total | 141 (100.0%) | 277 (100.0%) |
Health & Disability in Edmore
Health Insurance Coverage by Age in Edmore
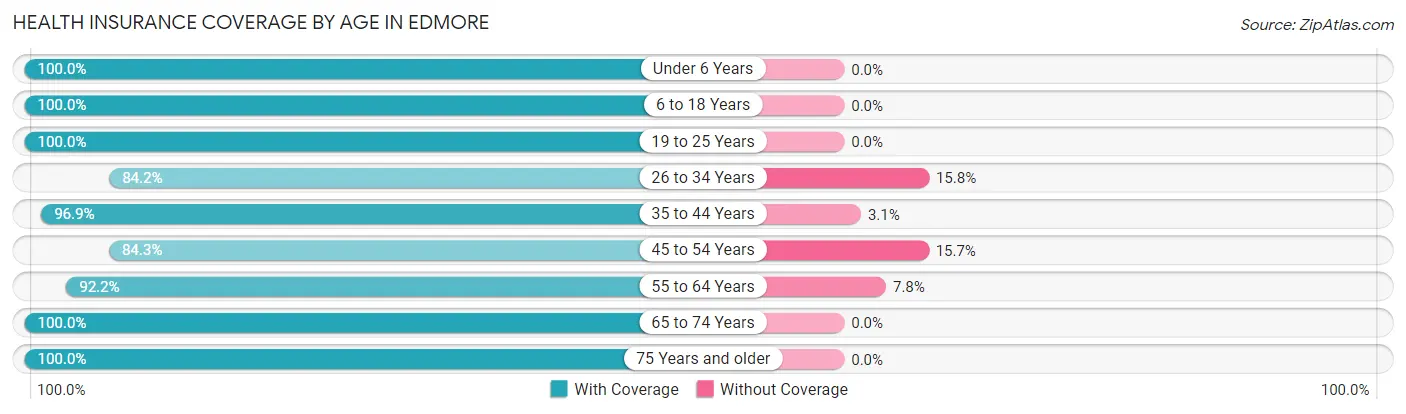
| Age Bracket | With Coverage | Without Coverage |
| Under 6 Years | 97 (100.0%) | 0 (0.0%) |
| 6 to 18 Years | 277 (100.0%) | 0 (0.0%) |
| 19 to 25 Years | 93 (100.0%) | 0 (0.0%) |
| 26 to 34 Years | 48 (84.2%) | 9 (15.8%) |
| 35 to 44 Years | 249 (96.9%) | 8 (3.1%) |
| 45 to 54 Years | 198 (84.3%) | 37 (15.7%) |
| 55 to 64 Years | 166 (92.2%) | 14 (7.8%) |
| 65 to 74 Years | 168 (100.0%) | 0 (0.0%) |
| 75 Years and older | 110 (100.0%) | 0 (0.0%) |
| Total | 1,406 (95.4%) | 68 (4.6%) |
Health Insurance Coverage by Citizenship Status in Edmore
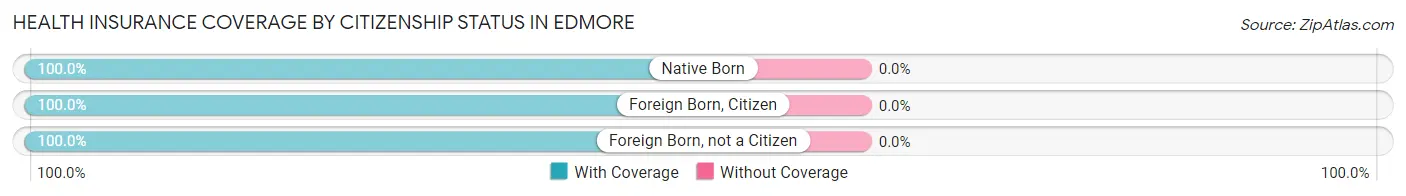
| Citizenship Status | With Coverage | Without Coverage |
| Native Born | 97 (100.0%) | 0 (0.0%) |
| Foreign Born, Citizen | 277 (100.0%) | 0 (0.0%) |
| Foreign Born, not a Citizen | 93 (100.0%) | 0 (0.0%) |
Health Insurance Coverage by Household Income in Edmore
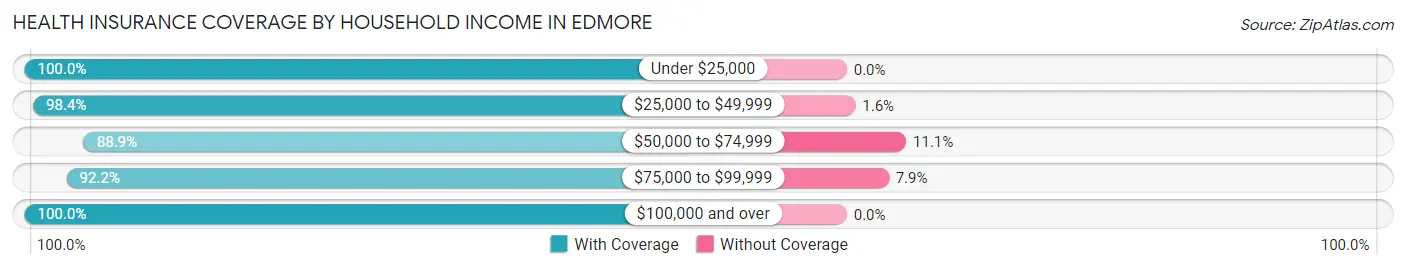
| Household Income | With Coverage | Without Coverage |
| Under $25,000 | 209 (100.0%) | 0 (0.0%) |
| $25,000 to $49,999 | 429 (98.4%) | 7 (1.6%) |
| $50,000 to $74,999 | 272 (88.9%) | 34 (11.1%) |
| $75,000 to $99,999 | 317 (92.1%) | 27 (7.9%) |
| $100,000 and over | 174 (100.0%) | 0 (0.0%) |
Public vs Private Health Insurance Coverage by Age in Edmore
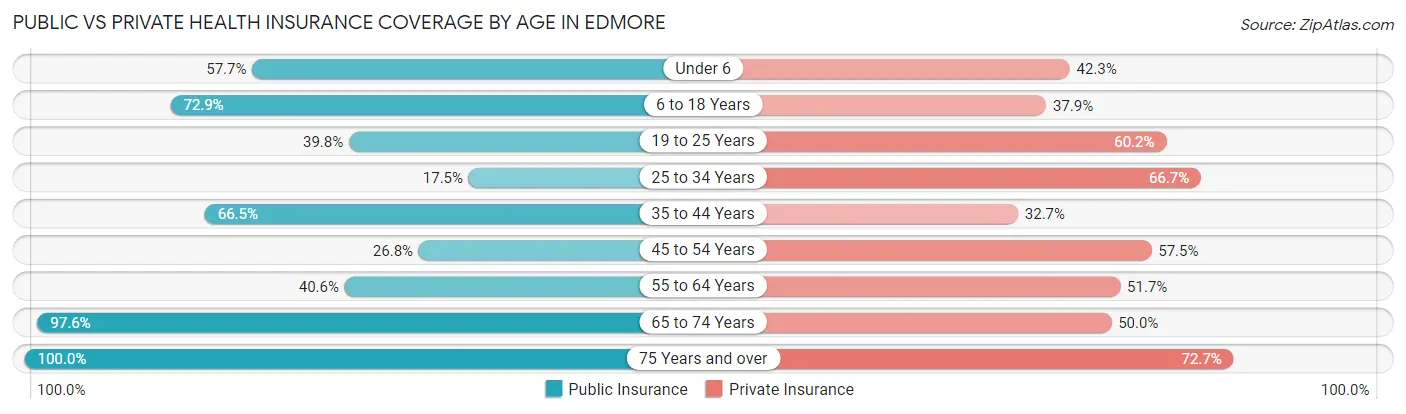
| Age Bracket | Public Insurance | Private Insurance |
| Under 6 | 56 (57.7%) | 41 (42.3%) |
| 6 to 18 Years | 202 (72.9%) | 105 (37.9%) |
| 19 to 25 Years | 37 (39.8%) | 56 (60.2%) |
| 25 to 34 Years | 10 (17.5%) | 38 (66.7%) |
| 35 to 44 Years | 171 (66.5%) | 84 (32.7%) |
| 45 to 54 Years | 63 (26.8%) | 135 (57.5%) |
| 55 to 64 Years | 73 (40.6%) | 93 (51.7%) |
| 65 to 74 Years | 164 (97.6%) | 84 (50.0%) |
| 75 Years and over | 110 (100.0%) | 80 (72.7%) |
| Total | 886 (60.1%) | 716 (48.6%) |
Disability Status by Sex by Age in Edmore
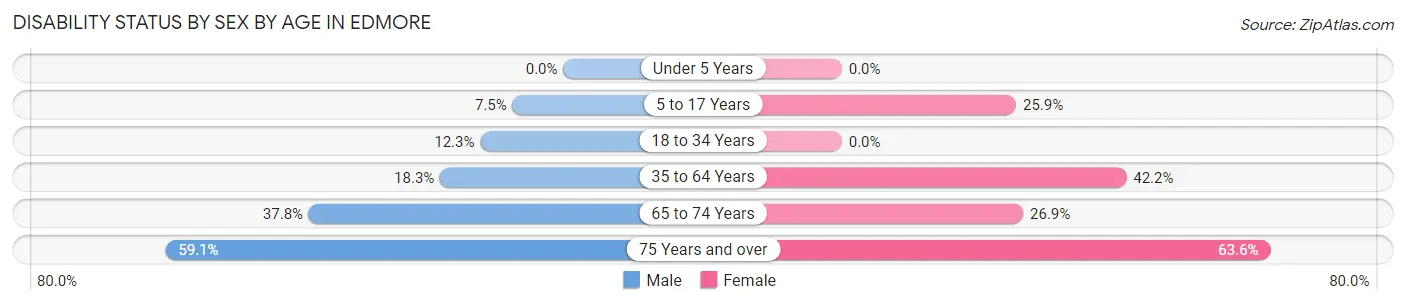
| Age Bracket | Male | Female |
| Under 5 Years | 0 (0.0%) | 0 (0.0%) |
| 5 to 17 Years | 14 (7.5%) | 22 (25.9%) |
| 18 to 34 Years | 9 (12.3%) | 0 (0.0%) |
| 35 to 64 Years | 64 (18.3%) | 136 (42.2%) |
| 65 to 74 Years | 34 (37.8%) | 21 (26.9%) |
| 75 Years and over | 13 (59.1%) | 56 (63.6%) |
Disability Class by Sex by Age in Edmore
Disability Class: Hearing Difficulty
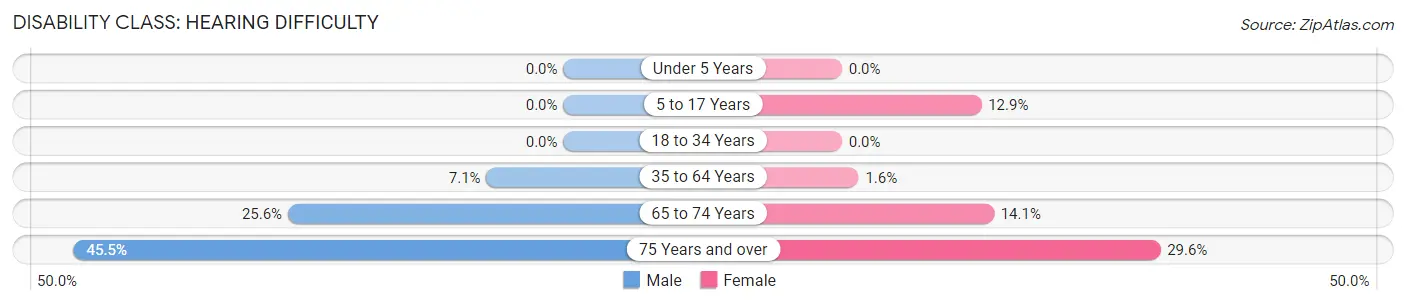
| Age Bracket | Male | Female |
| Under 5 Years | 0 (0.0%) | 0 (0.0%) |
| 5 to 17 Years | 0 (0.0%) | 11 (12.9%) |
| 18 to 34 Years | 0 (0.0%) | 0 (0.0%) |
| 35 to 64 Years | 25 (7.1%) | 5 (1.5%) |
| 65 to 74 Years | 23 (25.6%) | 11 (14.1%) |
| 75 Years and over | 10 (45.5%) | 26 (29.5%) |
Disability Class: Vision Difficulty
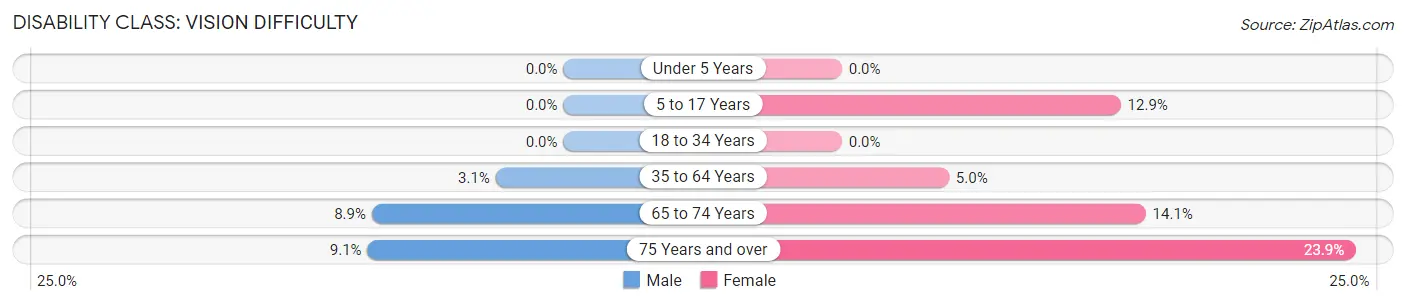
| Age Bracket | Male | Female |
| Under 5 Years | 0 (0.0%) | 0 (0.0%) |
| 5 to 17 Years | 0 (0.0%) | 11 (12.9%) |
| 18 to 34 Years | 0 (0.0%) | 0 (0.0%) |
| 35 to 64 Years | 11 (3.1%) | 16 (5.0%) |
| 65 to 74 Years | 8 (8.9%) | 11 (14.1%) |
| 75 Years and over | 2 (9.1%) | 21 (23.9%) |
Disability Class: Cognitive Difficulty
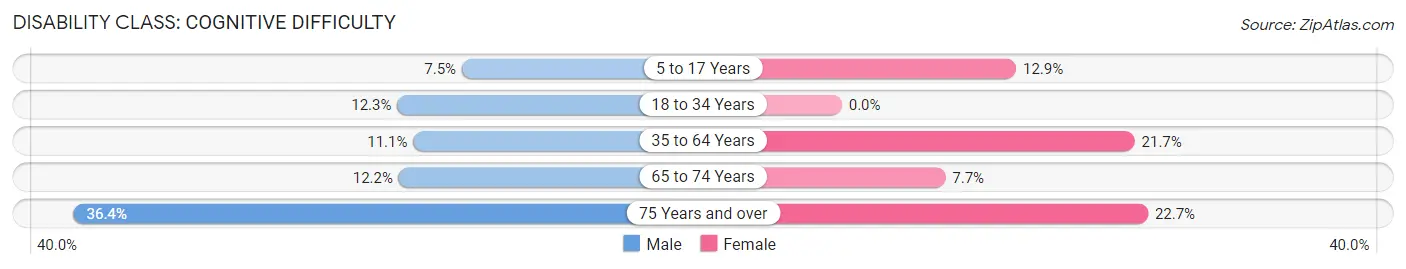
| Age Bracket | Male | Female |
| 5 to 17 Years | 14 (7.5%) | 11 (12.9%) |
| 18 to 34 Years | 9 (12.3%) | 0 (0.0%) |
| 35 to 64 Years | 39 (11.1%) | 70 (21.7%) |
| 65 to 74 Years | 11 (12.2%) | 6 (7.7%) |
| 75 Years and over | 8 (36.4%) | 20 (22.7%) |
Disability Class: Ambulatory Difficulty
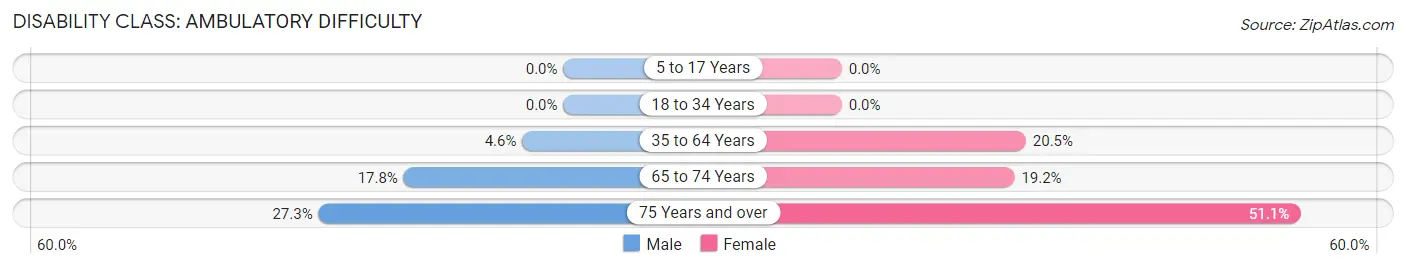
| Age Bracket | Male | Female |
| 5 to 17 Years | 0 (0.0%) | 0 (0.0%) |
| 18 to 34 Years | 0 (0.0%) | 0 (0.0%) |
| 35 to 64 Years | 16 (4.6%) | 66 (20.5%) |
| 65 to 74 Years | 16 (17.8%) | 15 (19.2%) |
| 75 Years and over | 6 (27.3%) | 45 (51.1%) |
Disability Class: Self-Care Difficulty
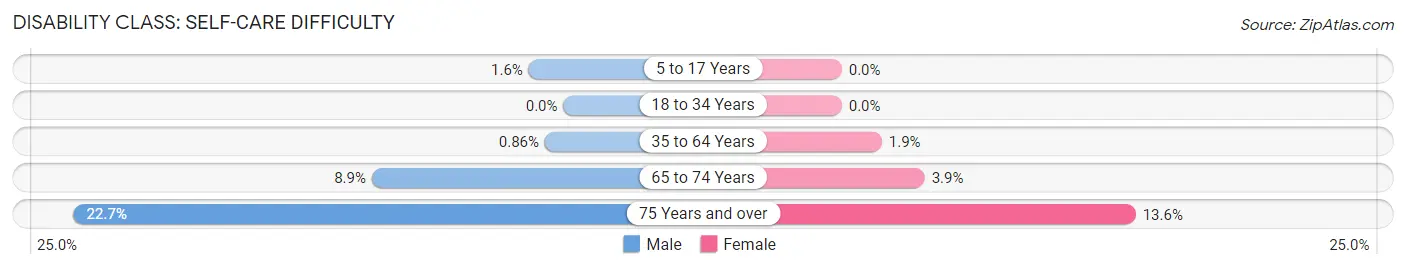
| Age Bracket | Male | Female |
| 5 to 17 Years | 3 (1.6%) | 0 (0.0%) |
| 18 to 34 Years | 0 (0.0%) | 0 (0.0%) |
| 35 to 64 Years | 3 (0.9%) | 6 (1.9%) |
| 65 to 74 Years | 8 (8.9%) | 3 (3.8%) |
| 75 Years and over | 5 (22.7%) | 12 (13.6%) |
Technology Access in Edmore
Computing Device Access in Edmore
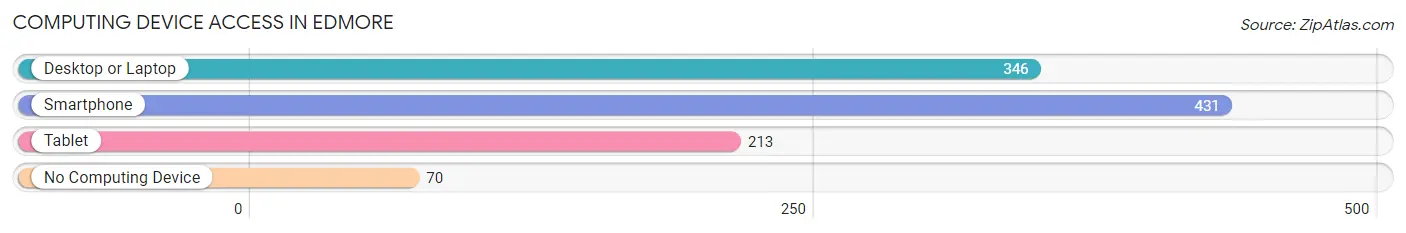
| Device Type | # Households | % Households |
| Desktop or Laptop | 346 | 60.5% |
| Smartphone | 431 | 75.3% |
| Tablet | 213 | 37.2% |
| No Computing Device | 70 | 12.2% |
| Total | 572 | 100.0% |
Internet Access in Edmore
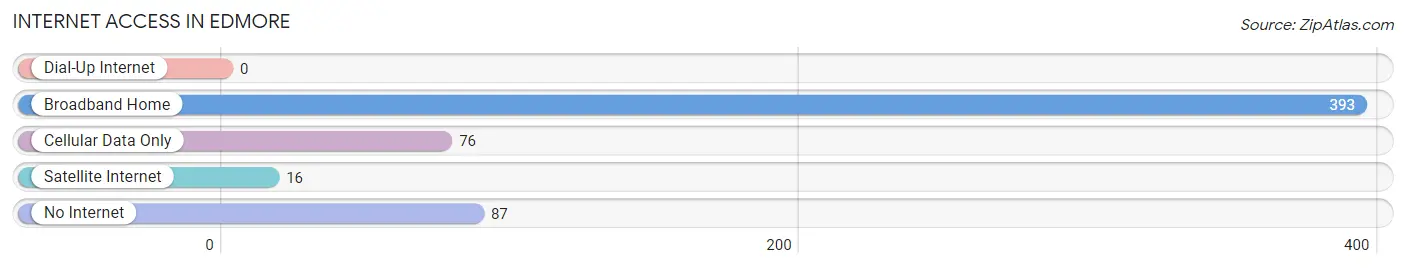
| Internet Type | # Households | % Households |
| Dial-Up Internet | 0 | 0.0% |
| Broadband Home | 393 | 68.7% |
| Cellular Data Only | 76 | 13.3% |
| Satellite Internet | 16 | 2.8% |
| No Internet | 87 | 15.2% |
| Total | 572 | 100.0% |
Edmore Summary
Edmore, Michigan is a small village located in Montcalm County in the central part of the state. It is situated on the banks of the Pine River, about 25 miles northeast of Grand Rapids. The village has a population of about 1,000 people and is part of the larger Montcalm County area.
History
Edmore was first settled in 1871 by a group of settlers from Ohio. The village was named after Edmore, Ohio, the hometown of the settlers. The first post office was established in 1872 and the village was incorporated in 1875.
The village grew slowly over the years, but it was not until the early 1900s that it began to experience significant growth. This was due to the arrival of the railroad, which allowed for the transportation of goods and people to and from the village. The railroad also allowed for the development of the local lumber industry, which was a major source of employment for the village.
In the 1920s, Edmore experienced a period of rapid growth. This was due to the discovery of oil in the area, which led to the development of several oil wells. This led to an influx of people to the village, which further increased its population.
Geography
Edmore is located in the central part of Michigan, about 25 miles northeast of Grand Rapids. It is situated on the banks of the Pine River, which flows through the village. The village is surrounded by rolling hills and farmland, and is located in a rural area.
The climate in Edmore is typical of the Midwest, with cold winters and hot summers. The average temperature in the winter is around 25 degrees Fahrenheit, while the average temperature in the summer is around 75 degrees Fahrenheit.
Economy
The economy of Edmore is largely based on agriculture and tourism. The village is home to several farms, which produce a variety of crops, including corn, soybeans, and wheat. The village also has several small businesses, including restaurants, shops, and a few small manufacturing companies.
Tourism is also an important part of the local economy. The village is home to several attractions, including the Pine River Nature Center, which offers educational programs and outdoor activities. The village also hosts several festivals throughout the year, including the Edmore Summer Festival and the Edmore Fall Festival.
Demographics
As of the 2010 census, the population of Edmore was 1,000 people. The racial makeup of the village was 97.2% White, 0.7% African American, 0.3% Native American, 0.2% Asian, 0.1% Pacific Islander, and 1.5% from other races. The median household income was $37,500, and the median age was 40 years.
Conclusion
Edmore, Michigan is a small village located in Montcalm County in the central part of the state. It has a population of about 1,000 people and is part of the larger Montcalm County area. The village has a long history, dating back to the 1800s, and has experienced periods of growth and decline over the years. The economy of Edmore is largely based on agriculture and tourism, and the village is home to several attractions, including the Pine River Nature Center. The population of Edmore is mostly White, with a median household income of $37,500 and a median age of 40 years.
Common Questions
What is Per Capita Income in Edmore?
Per Capita income in Edmore is $22,305.
What is the Median Family Income in Edmore?
Median Family Income in Edmore is $62,500.
What is the Median Household income in Edmore?
Median Household Income in Edmore is $51,029.
What is Family Income Deficit in Edmore?
Family Income Deficit in Edmore is $10,156.
Families that are below poverty line in Edmore earn $10,156 less on average than the poverty threshold level.
What is Inequality or Gini Index in Edmore?
Inequality or Gini Index in Edmore is 0.36.
What is the Total Population of Edmore?
Total Population of Edmore is 1,474.
What is the Total Male Population of Edmore?
Total Male Population of Edmore is 766.
What is the Total Female Population of Edmore?
Total Female Population of Edmore is 708.
What is the Ratio of Males per 100 Females in Edmore?
There are 108.19 Males per 100 Females in Edmore.
What is the Ratio of Females per 100 Males in Edmore?
There are 92.43 Females per 100 Males in Edmore.
What is the Median Population Age in Edmore?
Median Population Age in Edmore is 42.9 Years.
What is the Average Family Size in Edmore
Average Family Size in Edmore is 3.4 People.
What is the Average Household Size in Edmore
Average Household Size in Edmore is 2.6 People.
How Large is the Labor Force in Edmore?
There are 576 People in the Labor Forcein in Edmore.
What is the Percentage of People in the Labor Force in Edmore?
47.8% of People are in the Labor Force in Edmore.
What is the Unemployment Rate in Edmore?
Unemployment Rate in Edmore is 5.0%.