Walled Lake, MI Map & Demographics
Walled Lake Map
Walled Lake Overview
$41,617
PER CAPITA INCOME
$85,205
AVG FAMILY INCOME
$65,031
AVG HOUSEHOLD INCOME
29.4%
WAGE / INCOME GAP [ % ]
70.6¢/ $1
WAGE / INCOME GAP [ $ ]
0.44
INEQUALITY / GINI INDEX
7,262
TOTAL POPULATION
3,531
MALE POPULATION
3,731
FEMALE POPULATION
94.64
MALES / 100 FEMALES
105.66
FEMALES / 100 MALES
42.1
MEDIAN AGE
3.0
AVG FAMILY SIZE
2.1
AVG HOUSEHOLD SIZE
4,398
LABOR FORCE [ PEOPLE ]
72.0%
PERCENT IN LABOR FORCE
2.4%
UNEMPLOYMENT RATE
Walled Lake Zip Codes
Walled Lake Area Codes
Income in Walled Lake
Income Overview in Walled Lake
Per Capita Income in Walled Lake is $41,617, while median incomes of families and households are $85,205 and $65,031 respectively.
| Characteristic | Number | Measure |
| Per Capita Income | 7,262 | $41,617 |
| Median Family Income | 1,736 | $85,205 |
| Mean Family Income | 1,736 | $113,539 |
| Median Household Income | 3,436 | $65,031 |
| Mean Household Income | 3,436 | $87,196 |
| Income Deficit | 1,736 | $0 |
| Wage / Income Gap (%) | 7,262 | 29.44% |
| Wage / Income Gap ($) | 7,262 | 70.56¢ per $1 |
| Gini / Inequality Index | 7,262 | 0.44 |
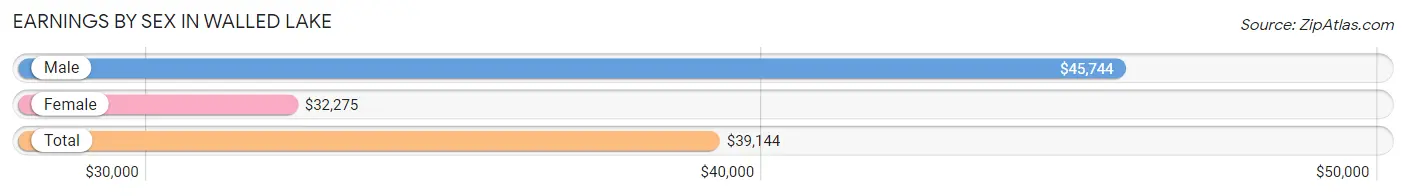
Earnings by Sex in Walled Lake
Average Earnings in Walled Lake are $39,144, $45,744 for men and $32,275 for women, a difference of 29.4%.
| Sex | Number | Average Earnings |
| Male | 2,370 (52.0%) | $45,744 |
| Female | 2,183 (47.9%) | $32,275 |
| Total | 4,553 (100.0%) | $39,144 |
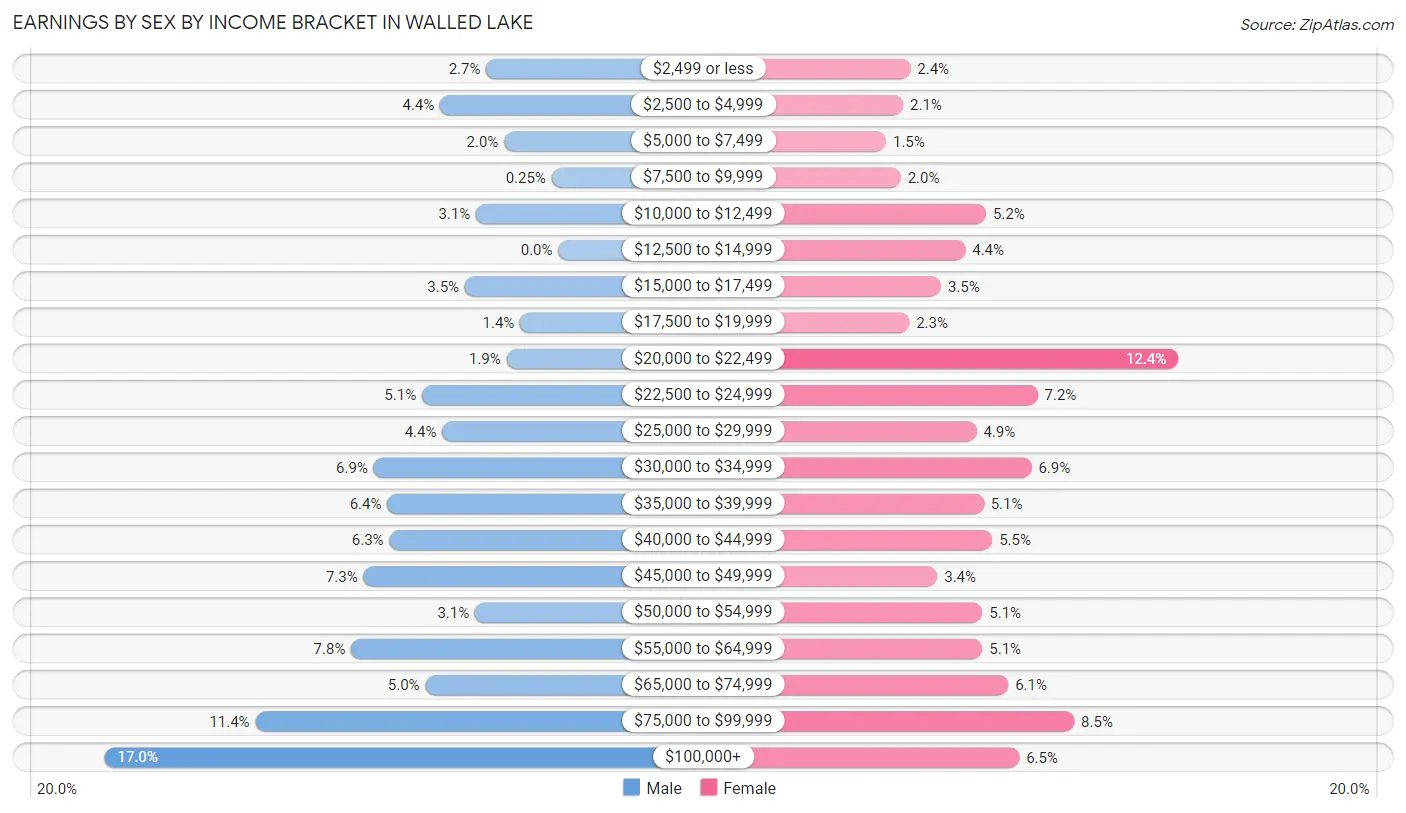
Earnings by Sex by Income Bracket in Walled Lake
The most common earnings brackets in Walled Lake are $100,000+ for men (403 | 17.0%) and $20,000 to $22,499 for women (271 | 12.4%).
| Income | Male | Female |
| $2,499 or less | 64 (2.7%) | 52 (2.4%) |
| $2,500 to $4,999 | 105 (4.4%) | 46 (2.1%) |
| $5,000 to $7,499 | 48 (2.0%) | 32 (1.5%) |
| $7,500 to $9,999 | 6 (0.3%) | 44 (2.0%) |
| $10,000 to $12,499 | 73 (3.1%) | 114 (5.2%) |
| $12,500 to $14,999 | 0 (0.0%) | 97 (4.4%) |
| $15,000 to $17,499 | 83 (3.5%) | 77 (3.5%) |
| $17,500 to $19,999 | 34 (1.4%) | 51 (2.3%) |
| $20,000 to $22,499 | 46 (1.9%) | 271 (12.4%) |
| $22,500 to $24,999 | 121 (5.1%) | 156 (7.1%) |
| $25,000 to $29,999 | 103 (4.3%) | 106 (4.9%) |
| $30,000 to $34,999 | 164 (6.9%) | 151 (6.9%) |
| $35,000 to $39,999 | 152 (6.4%) | 112 (5.1%) |
| $40,000 to $44,999 | 150 (6.3%) | 119 (5.4%) |
| $45,000 to $49,999 | 173 (7.3%) | 74 (3.4%) |
| $50,000 to $54,999 | 74 (3.1%) | 111 (5.1%) |
| $55,000 to $64,999 | 184 (7.8%) | 111 (5.1%) |
| $65,000 to $74,999 | 118 (5.0%) | 132 (6.0%) |
| $75,000 to $99,999 | 269 (11.4%) | 186 (8.5%) |
| $100,000+ | 403 (17.0%) | 141 (6.5%) |
| Total | 2,370 (100.0%) | 2,183 (100.0%) |
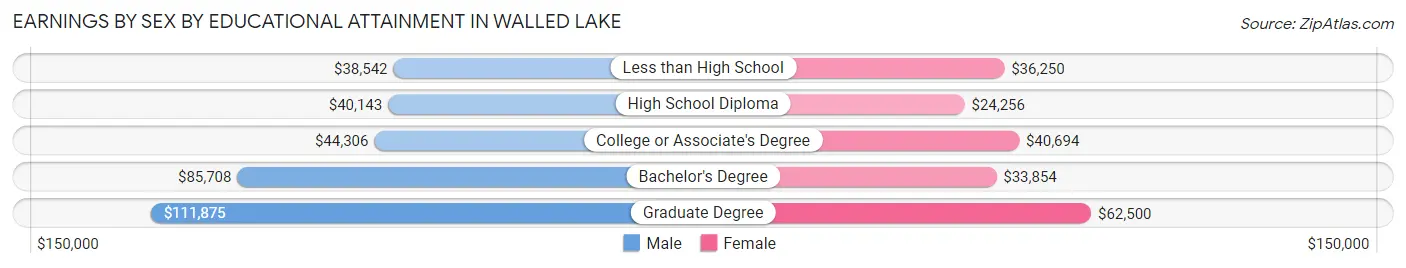
Earnings by Sex by Educational Attainment in Walled Lake
Average earnings in Walled Lake are $47,788 for men and $35,082 for women, a difference of 26.6%. Men with an educational attainment of graduate degree enjoy the highest average annual earnings of $111,875, while those with less than high school education earn the least with $38,542. Women with an educational attainment of graduate degree earn the most with the average annual earnings of $62,500, while those with high school diploma education have the smallest earnings of $24,256.
| Educational Attainment | Male Income | Female Income |
| Less than High School | $38,542 | $36,250 |
| High School Diploma | $40,143 | $24,256 |
| College or Associate's Degree | $44,306 | $40,694 |
| Bachelor's Degree | $85,708 | $33,854 |
| Graduate Degree | $111,875 | $62,500 |
| Total | $47,788 | $35,082 |
Family Income in Walled Lake
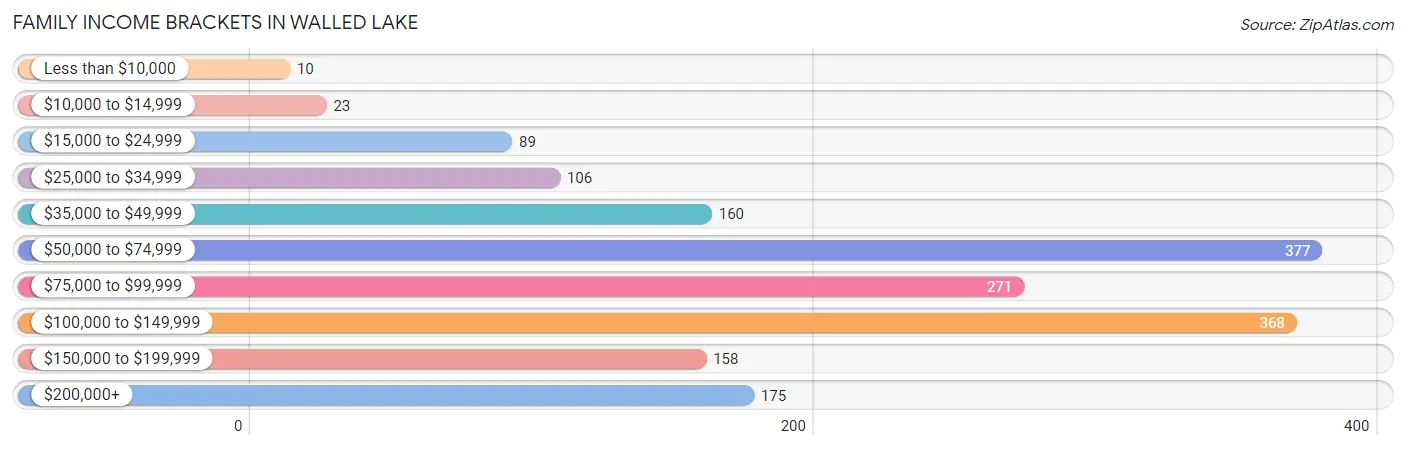
Family Income Brackets in Walled Lake
According to the Walled Lake family income data, there are 377 families falling into the $50,000 to $74,999 income range, which is the most common income bracket and makes up 21.7% of all families. Conversely, the less than $10,000 income bracket is the least frequent group with only 10 families (0.6%) belonging to this category.
| Income Bracket | # Families | % Families |
| Less than $10,000 | 10 | 0.6% |
| $10,000 to $14,999 | 23 | 1.3% |
| $15,000 to $24,999 | 89 | 5.1% |
| $25,000 to $34,999 | 106 | 6.1% |
| $35,000 to $49,999 | 160 | 9.2% |
| $50,000 to $74,999 | 377 | 21.7% |
| $75,000 to $99,999 | 271 | 15.6% |
| $100,000 to $149,999 | 368 | 21.2% |
| $150,000 to $199,999 | 158 | 9.1% |
| $200,000+ | 175 | 10.1% |
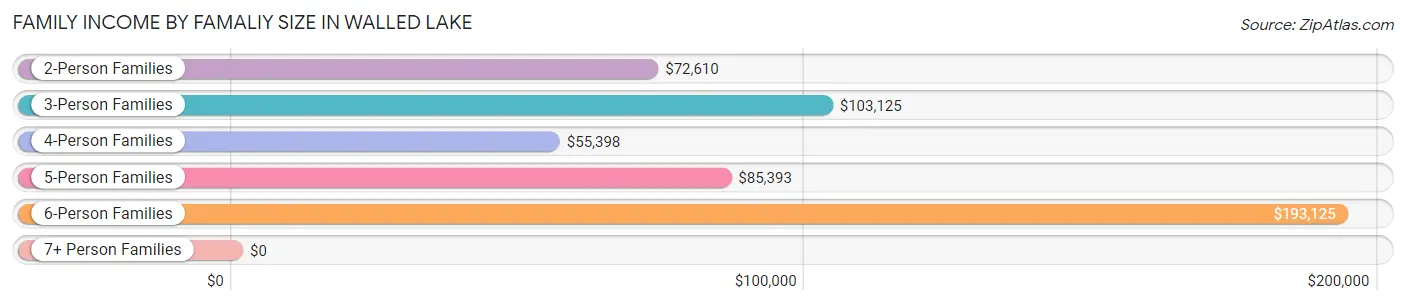
Family Income by Famaliy Size in Walled Lake
6-person families (35 | 2.0%) account for the highest median family income in Walled Lake with $193,125 per family, while 2-person families (759 | 43.7%) have the highest median income of $36,305 per family member.
| Income Bracket | # Families | Median Income |
| 2-Person Families | 759 (43.7%) | $72,610 |
| 3-Person Families | 578 (33.3%) | $103,125 |
| 4-Person Families | 269 (15.5%) | $55,398 |
| 5-Person Families | 95 (5.5%) | $85,393 |
| 6-Person Families | 35 (2.0%) | $193,125 |
| 7+ Person Families | 0 (0.0%) | $0 |
| Total | 1,736 (100.0%) | $85,205 |
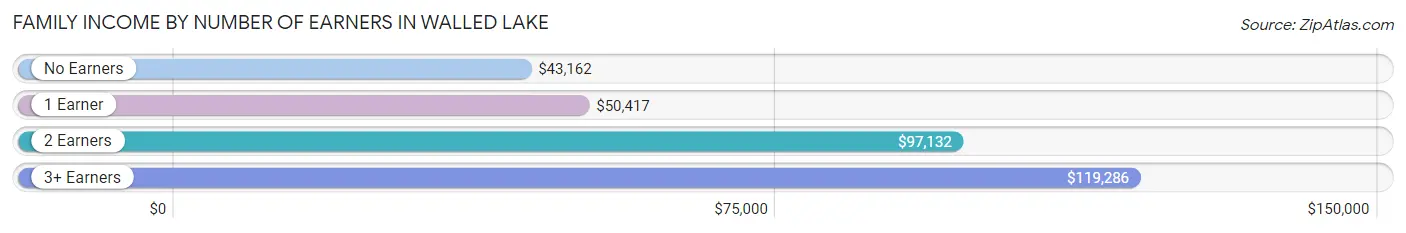
Family Income by Number of Earners in Walled Lake
The median family income in Walled Lake is $85,205, with families comprising 3+ earners (174) having the highest median family income of $119,286, while families with no earners (119) have the lowest median family income of $43,162, accounting for 10.0% and 6.9% of families, respectively.
| Number of Earners | # Families | Median Income |
| No Earners | 119 (6.9%) | $43,162 |
| 1 Earner | 545 (31.4%) | $50,417 |
| 2 Earners | 898 (51.7%) | $97,132 |
| 3+ Earners | 174 (10.0%) | $119,286 |
| Total | 1,736 (100.0%) | $85,205 |
Household Income in Walled Lake
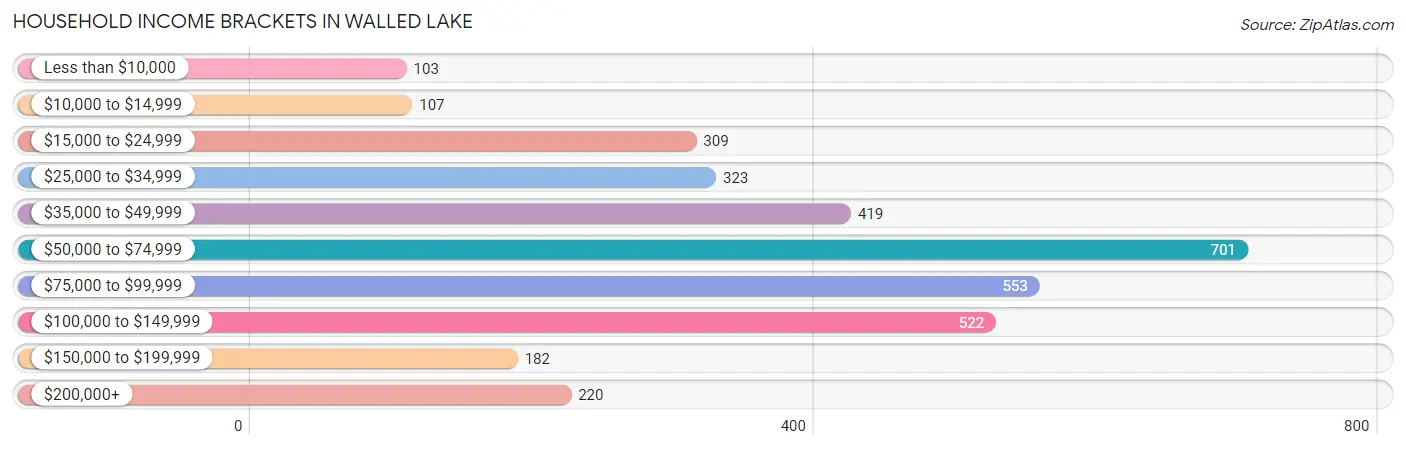
Household Income Brackets in Walled Lake
With 701 households falling in the category, the $50,000 to $74,999 income range is the most frequent in Walled Lake, accounting for 20.4% of all households. In contrast, only 103 households (3.0%) fall into the less than $10,000 income bracket, making it the least populous group.
| Income Bracket | # Households | % Households |
| Less than $10,000 | 103 | 3.0% |
| $10,000 to $14,999 | 107 | 3.1% |
| $15,000 to $24,999 | 309 | 9.0% |
| $25,000 to $34,999 | 323 | 9.4% |
| $35,000 to $49,999 | 419 | 12.2% |
| $50,000 to $74,999 | 701 | 20.4% |
| $75,000 to $99,999 | 553 | 16.1% |
| $100,000 to $149,999 | 522 | 15.2% |
| $150,000 to $199,999 | 182 | 5.3% |
| $200,000+ | 220 | 6.4% |
Household Income by Householder Age in Walled Lake
The median household income in Walled Lake is $65,031, with the highest median household income of $85,225 found in the 45 to 64 years age bracket for the primary householder. A total of 1,517 households (44.2%) fall into this category. Meanwhile, the 65+ years age bracket for the primary householder has the lowest median household income of $36,844, with 813 households (23.7%) in this group.
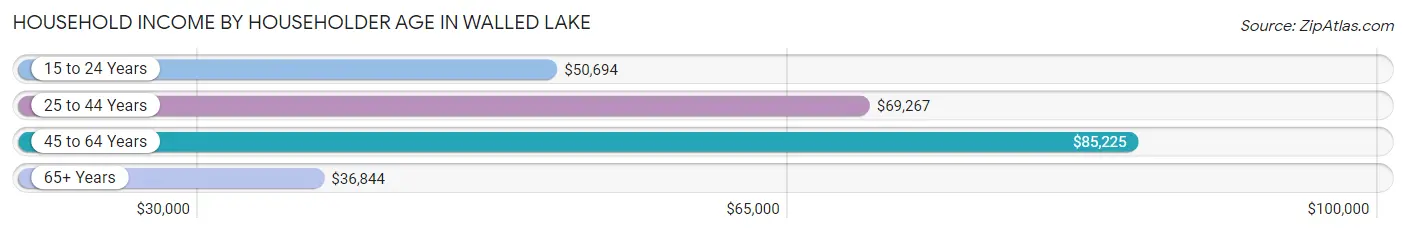
| Income Bracket | # Households | Median Income |
| 15 to 24 Years | 39 (1.1%) | $50,694 |
| 25 to 44 Years | 1,067 (31.0%) | $69,267 |
| 45 to 64 Years | 1,517 (44.2%) | $85,225 |
| 65+ Years | 813 (23.7%) | $36,844 |
| Total | 3,436 (100.0%) | $65,031 |
Poverty in Walled Lake
Income Below Poverty by Sex and Age in Walled Lake
With 6.9% poverty level for males and 12.5% for females among the residents of Walled Lake, 12 to 14 year old males and 6 to 11 year old females are the most vulnerable to poverty, with 22 males (16.9%) and 164 females (50.8%) in their respective age groups living below the poverty level.
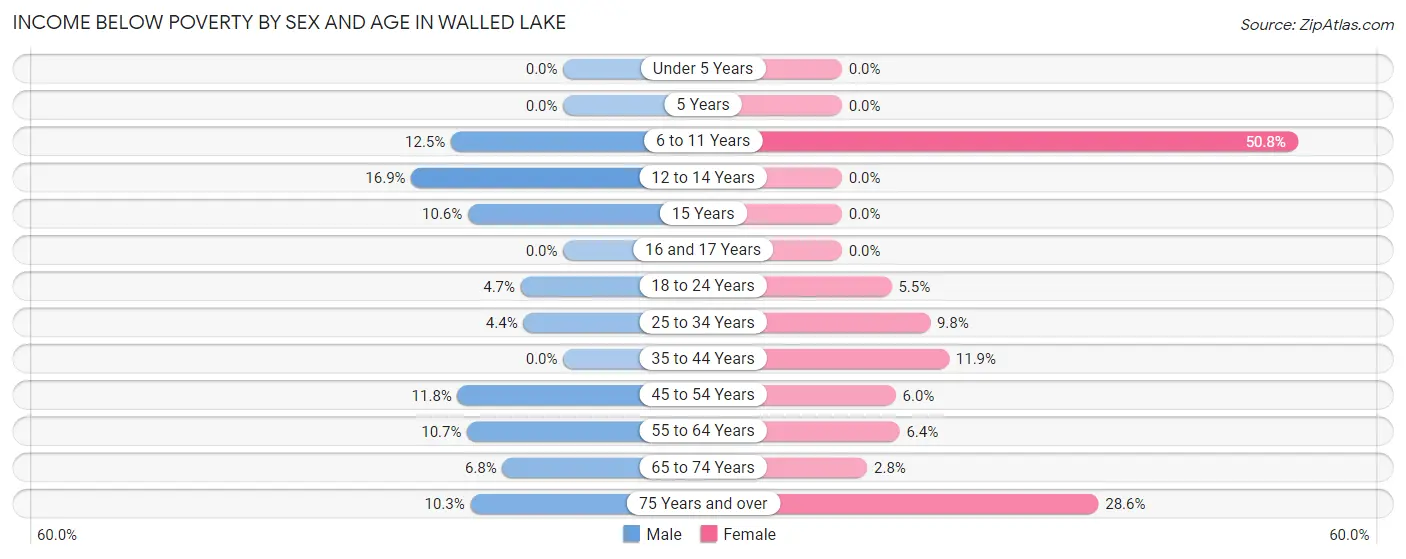
| Age Bracket | Male | Female |
| Under 5 Years | 0 (0.0%) | 0 (0.0%) |
| 5 Years | 0 (0.0%) | 0 (0.0%) |
| 6 to 11 Years | 16 (12.5%) | 164 (50.8%) |
| 12 to 14 Years | 22 (16.9%) | 0 (0.0%) |
| 15 Years | 7 (10.6%) | 0 (0.0%) |
| 16 and 17 Years | 0 (0.0%) | 0 (0.0%) |
| 18 to 24 Years | 8 (4.7%) | 14 (5.5%) |
| 25 to 34 Years | 27 (4.4%) | 50 (9.8%) |
| 35 to 44 Years | 0 (0.0%) | 51 (11.9%) |
| 45 to 54 Years | 69 (11.8%) | 43 (6.0%) |
| 55 to 64 Years | 55 (10.7%) | 31 (6.4%) |
| 65 to 74 Years | 17 (6.8%) | 9 (2.8%) |
| 75 Years and over | 18 (10.3%) | 104 (28.6%) |
| Total | 239 (6.9%) | 466 (12.5%) |
Income Above Poverty by Sex and Age in Walled Lake
According to the poverty statistics in Walled Lake, males aged under 5 years and females aged under 5 years are the age groups that are most secure financially, with 100.0% of males and 100.0% of females in these age groups living above the poverty line.
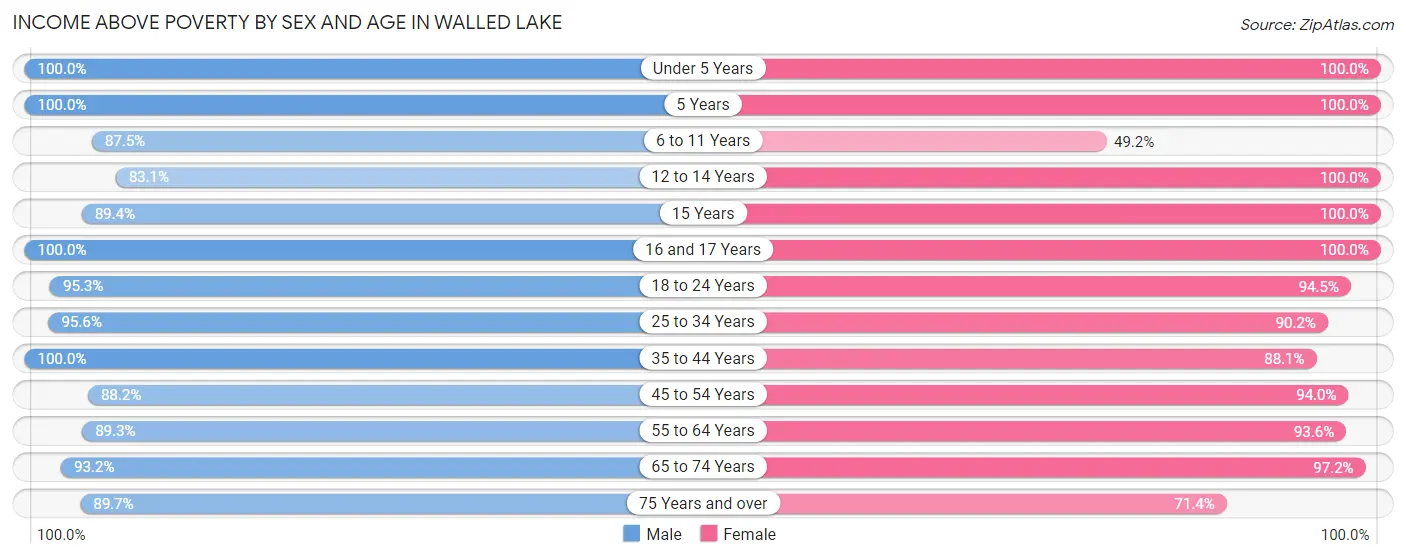
| Age Bracket | Male | Female |
| Under 5 Years | 185 (100.0%) | 55 (100.0%) |
| 5 Years | 8 (100.0%) | 31 (100.0%) |
| 6 to 11 Years | 112 (87.5%) | 159 (49.2%) |
| 12 to 14 Years | 108 (83.1%) | 134 (100.0%) |
| 15 Years | 59 (89.4%) | 49 (100.0%) |
| 16 and 17 Years | 129 (100.0%) | 65 (100.0%) |
| 18 to 24 Years | 161 (95.3%) | 239 (94.5%) |
| 25 to 34 Years | 581 (95.6%) | 459 (90.2%) |
| 35 to 44 Years | 538 (100.0%) | 377 (88.1%) |
| 45 to 54 Years | 517 (88.2%) | 675 (94.0%) |
| 55 to 64 Years | 459 (89.3%) | 452 (93.6%) |
| 65 to 74 Years | 234 (93.2%) | 310 (97.2%) |
| 75 Years and over | 156 (89.7%) | 260 (71.4%) |
| Total | 3,247 (93.1%) | 3,265 (87.5%) |
Income Below Poverty Among Married-Couple Families in Walled Lake
The poverty statistics for married-couple families in Walled Lake show that 8.5% or 104 of the total 1,219 families live below the poverty line. Families with 1 or 2 children have the highest poverty rate of 19.6%, comprising of 95 families. On the other hand, families with 3 or 4 children have the lowest poverty rate of 0.0%, which includes 0 families.
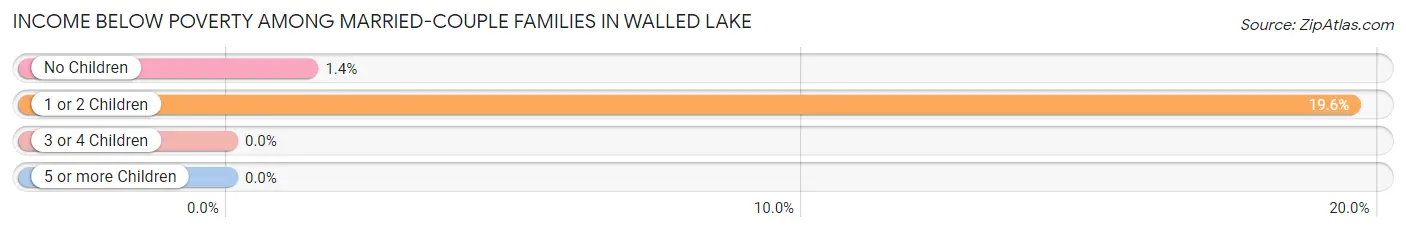
| Children | Above Poverty | Below Poverty |
| No Children | 635 (98.6%) | 9 (1.4%) |
| 1 or 2 Children | 391 (80.4%) | 95 (19.6%) |
| 3 or 4 Children | 89 (100.0%) | 0 (0.0%) |
| 5 or more Children | 0 (0.0%) | 0 (0.0%) |
| Total | 1,115 (91.5%) | 104 (8.5%) |
Income Below Poverty Among Single-Parent Households in Walled Lake
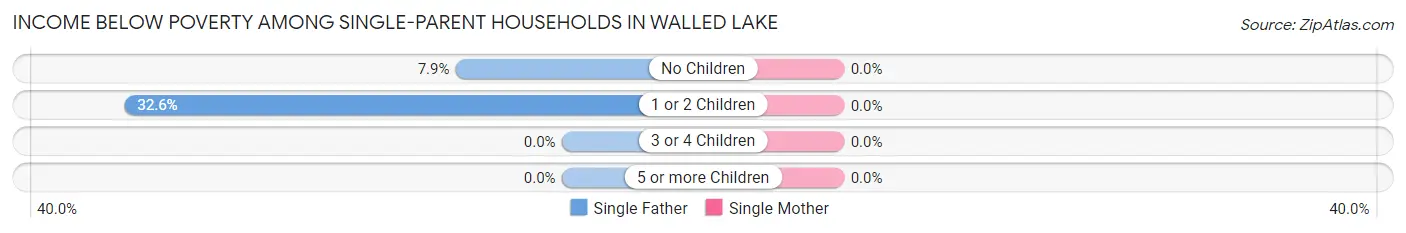
| Children | Single Father | Single Mother |
| No Children | 11 (7.9%) | 0 (0.0%) |
| 1 or 2 Children | 14 (32.6%) | 0 (0.0%) |
| 3 or 4 Children | 0 (0.0%) | 0 (0.0%) |
| 5 or more Children | 0 (0.0%) | 0 (0.0%) |
| Total | 25 (13.2%) | 0 (0.0%) |
Income Below Poverty Among Married-Couple vs Single-Parent Households in Walled Lake
The poverty data for Walled Lake shows that 104 of the married-couple family households (8.5%) and 25 of the single-parent households (4.8%) are living below the poverty level. Within the married-couple family households, those with 1 or 2 children have the highest poverty rate, with 95 households (19.6%) falling below the poverty line. Among the single-parent households, those with 1 or 2 children have the highest poverty rate, with 14 household (6.9%) living below poverty.
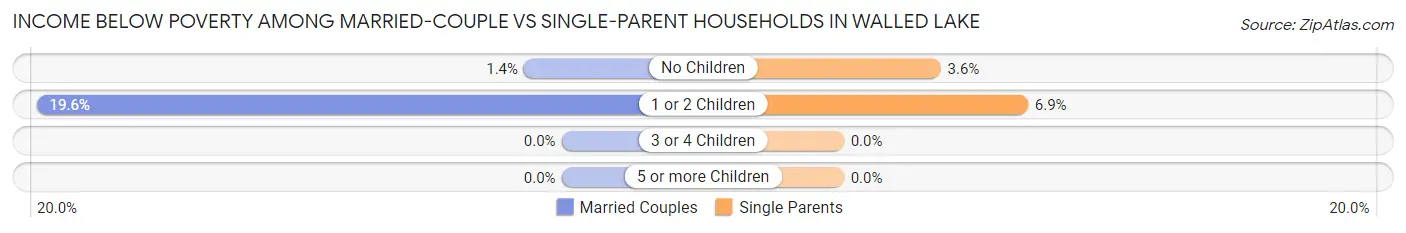
| Children | Married-Couple Families | Single-Parent Households |
| No Children | 9 (1.4%) | 11 (3.6%) |
| 1 or 2 Children | 95 (19.6%) | 14 (6.9%) |
| 3 or 4 Children | 0 (0.0%) | 0 (0.0%) |
| 5 or more Children | 0 (0.0%) | 0 (0.0%) |
| Total | 104 (8.5%) | 25 (4.8%) |
Race in Walled Lake
The most populous races in Walled Lake are White / Caucasian (6,244 | 86.0%), Asian (422 | 5.8%), and Black / African American (342 | 4.7%).
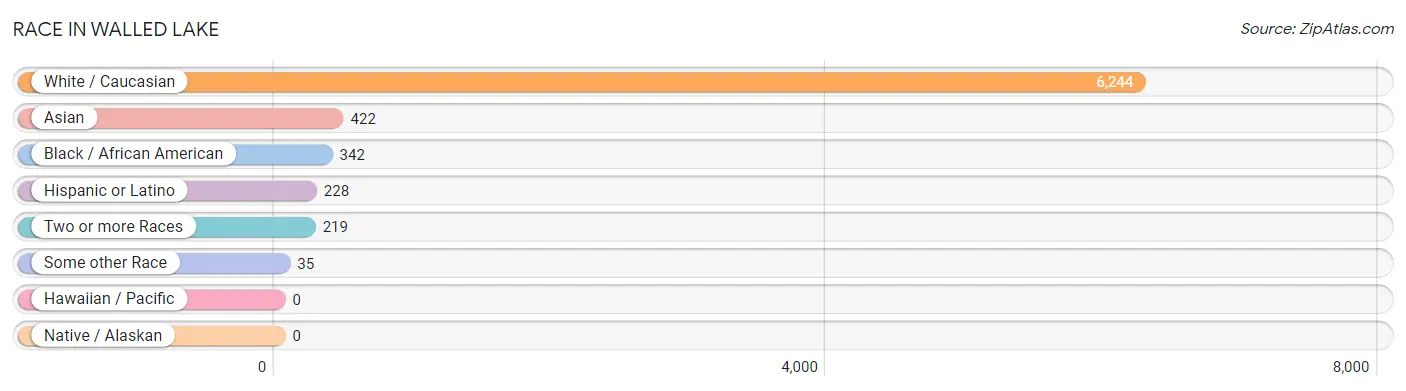
| Race | # Population | % Population |
| Asian | 422 | 5.8% |
| Black / African American | 342 | 4.7% |
| Hawaiian / Pacific | 0 | 0.0% |
| Hispanic or Latino | 228 | 3.1% |
| Native / Alaskan | 0 | 0.0% |
| White / Caucasian | 6,244 | 86.0% |
| Two or more Races | 219 | 3.0% |
| Some other Race | 35 | 0.5% |
| Total | 7,262 | 100.0% |
Ancestry in Walled Lake
The most populous ancestries reported in Walled Lake are German (1,336 | 18.4%), Irish (709 | 9.8%), Polish (601 | 8.3%), English (569 | 7.8%), and American (397 | 5.5%), together accounting for 49.7% of all Walled Lake residents.
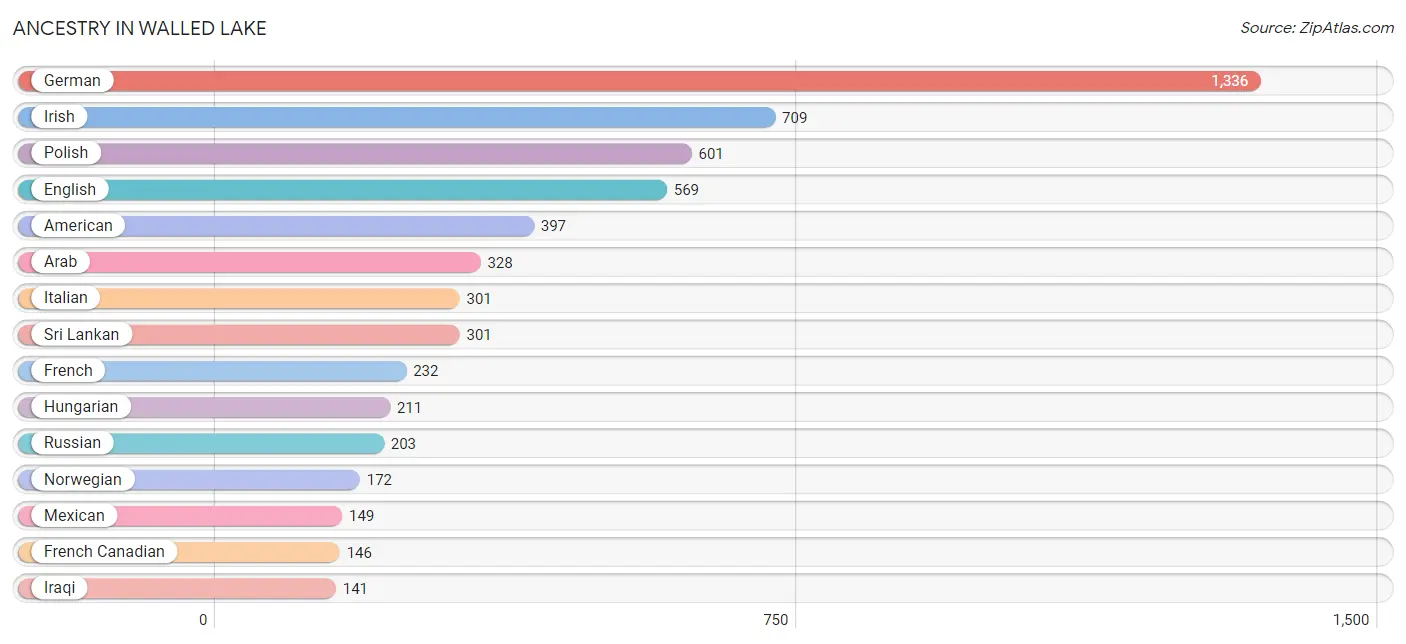
| Ancestry | # Population | % Population |
| African | 25 | 0.3% |
| Albanian | 85 | 1.2% |
| American | 397 | 5.5% |
| Arab | 328 | 4.5% |
| Armenian | 6 | 0.1% |
| Assyrian / Chaldean / Syriac | 137 | 1.9% |
| Austrian | 6 | 0.1% |
| Belgian | 89 | 1.2% |
| British | 19 | 0.3% |
| British West Indian | 8 | 0.1% |
| Burmese | 15 | 0.2% |
| Canadian | 108 | 1.5% |
| Central American | 26 | 0.4% |
| Cherokee | 48 | 0.7% |
| Croatian | 15 | 0.2% |
| Czech | 17 | 0.2% |
| Danish | 29 | 0.4% |
| Dutch | 122 | 1.7% |
| Eastern European | 8 | 0.1% |
| English | 569 | 7.8% |
| European | 23 | 0.3% |
| Finnish | 43 | 0.6% |
| French | 232 | 3.2% |
| French Canadian | 146 | 2.0% |
| German | 1,336 | 18.4% |
| Hungarian | 211 | 2.9% |
| Indian (Asian) | 61 | 0.8% |
| Iraqi | 141 | 1.9% |
| Irish | 709 | 9.8% |
| Italian | 301 | 4.1% |
| Jamaican | 62 | 0.9% |
| Lebanese | 47 | 0.6% |
| Mexican | 149 | 2.1% |
| Nigerian | 28 | 0.4% |
| Norwegian | 172 | 2.4% |
| Palestinian | 18 | 0.3% |
| Panamanian | 26 | 0.4% |
| Pennsylvania German | 9 | 0.1% |
| Polish | 601 | 8.3% |
| Portuguese | 15 | 0.2% |
| Puerto Rican | 33 | 0.4% |
| Romanian | 48 | 0.7% |
| Russian | 203 | 2.8% |
| Scandinavian | 16 | 0.2% |
| Scotch-Irish | 69 | 0.9% |
| Scottish | 84 | 1.2% |
| Senegalese | 39 | 0.5% |
| Slovak | 19 | 0.3% |
| Spaniard | 20 | 0.3% |
| Sri Lankan | 301 | 4.1% |
| Subsaharan African | 131 | 1.8% |
| Swedish | 82 | 1.1% |
| Swiss | 7 | 0.1% |
| Thai | 62 | 0.9% |
| Ukrainian | 116 | 1.6% |
| Welsh | 49 | 0.7% | View All 56 Rows |
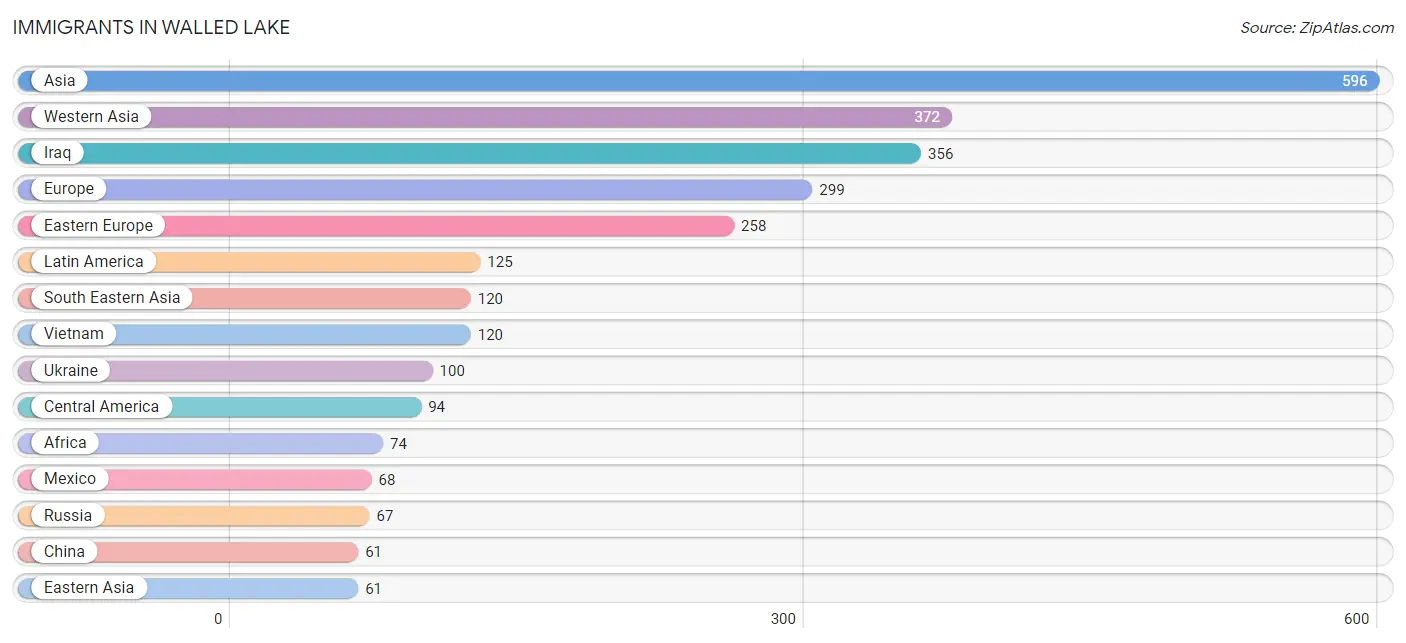
Immigrants in Walled Lake
The most numerous immigrant groups reported in Walled Lake came from Asia (596 | 8.2%), Western Asia (372 | 5.1%), Iraq (356 | 4.9%), Europe (299 | 4.1%), and Eastern Europe (258 | 3.5%), together accounting for 25.9% of all Walled Lake residents.
| Immigration Origin | # Population | % Population |
| Africa | 74 | 1.0% |
| Albania | 51 | 0.7% |
| Asia | 596 | 8.2% |
| Belarus | 31 | 0.4% |
| Canada | 51 | 0.7% |
| Caribbean | 31 | 0.4% |
| Central America | 94 | 1.3% |
| China | 61 | 0.8% |
| Eastern Africa | 25 | 0.3% |
| Eastern Asia | 61 | 0.8% |
| Eastern Europe | 258 | 3.5% |
| England | 10 | 0.1% |
| Europe | 299 | 4.1% |
| Hungary | 9 | 0.1% |
| India | 43 | 0.6% |
| Iraq | 356 | 4.9% |
| Italy | 25 | 0.3% |
| Jamaica | 31 | 0.4% |
| Kenya | 25 | 0.3% |
| Latin America | 125 | 1.7% |
| Mexico | 68 | 0.9% |
| Middle Africa | 14 | 0.2% |
| Netherlands | 6 | 0.1% |
| Nigeria | 13 | 0.2% |
| Northern Europe | 10 | 0.1% |
| Panama | 26 | 0.4% |
| Russia | 67 | 0.9% |
| Senegal | 22 | 0.3% |
| South Central Asia | 43 | 0.6% |
| South Eastern Asia | 120 | 1.7% |
| Southern Europe | 25 | 0.3% |
| Ukraine | 100 | 1.4% |
| Vietnam | 120 | 1.7% |
| Western Africa | 35 | 0.5% |
| Western Asia | 372 | 5.1% |
| Western Europe | 6 | 0.1% |
| Zaire | 14 | 0.2% | View All 37 Rows |
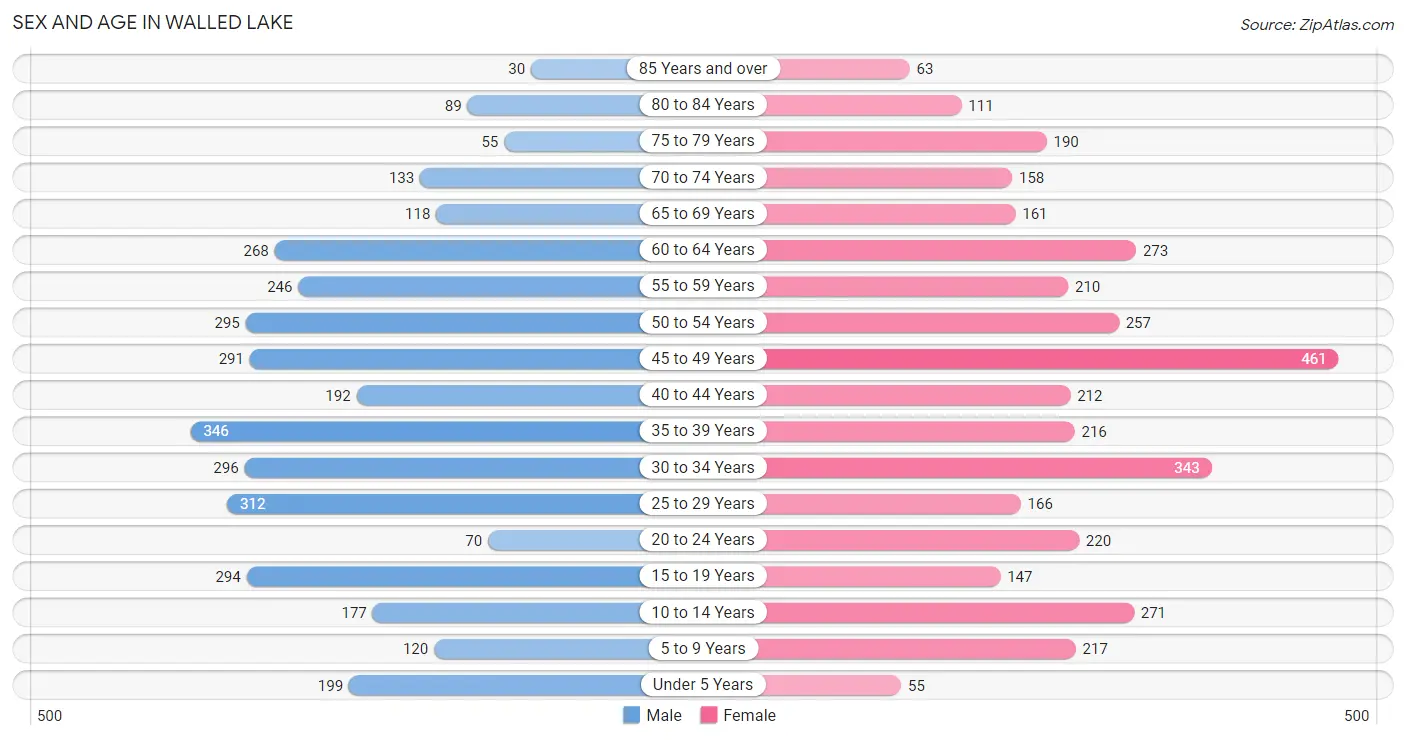
Sex and Age in Walled Lake
Sex and Age in Walled Lake
The most populous age groups in Walled Lake are 35 to 39 Years (346 | 9.8%) for men and 45 to 49 Years (461 | 12.4%) for women.
| Age Bracket | Male | Female |
| Under 5 Years | 199 (5.6%) | 55 (1.5%) |
| 5 to 9 Years | 120 (3.4%) | 217 (5.8%) |
| 10 to 14 Years | 177 (5.0%) | 271 (7.3%) |
| 15 to 19 Years | 294 (8.3%) | 147 (3.9%) |
| 20 to 24 Years | 70 (2.0%) | 220 (5.9%) |
| 25 to 29 Years | 312 (8.8%) | 166 (4.4%) |
| 30 to 34 Years | 296 (8.4%) | 343 (9.2%) |
| 35 to 39 Years | 346 (9.8%) | 216 (5.8%) |
| 40 to 44 Years | 192 (5.4%) | 212 (5.7%) |
| 45 to 49 Years | 291 (8.2%) | 461 (12.4%) |
| 50 to 54 Years | 295 (8.4%) | 257 (6.9%) |
| 55 to 59 Years | 246 (7.0%) | 210 (5.6%) |
| 60 to 64 Years | 268 (7.6%) | 273 (7.3%) |
| 65 to 69 Years | 118 (3.3%) | 161 (4.3%) |
| 70 to 74 Years | 133 (3.8%) | 158 (4.2%) |
| 75 to 79 Years | 55 (1.6%) | 190 (5.1%) |
| 80 to 84 Years | 89 (2.5%) | 111 (3.0%) |
| 85 Years and over | 30 (0.9%) | 63 (1.7%) |
| Total | 3,531 (100.0%) | 3,731 (100.0%) |
Families and Households in Walled Lake
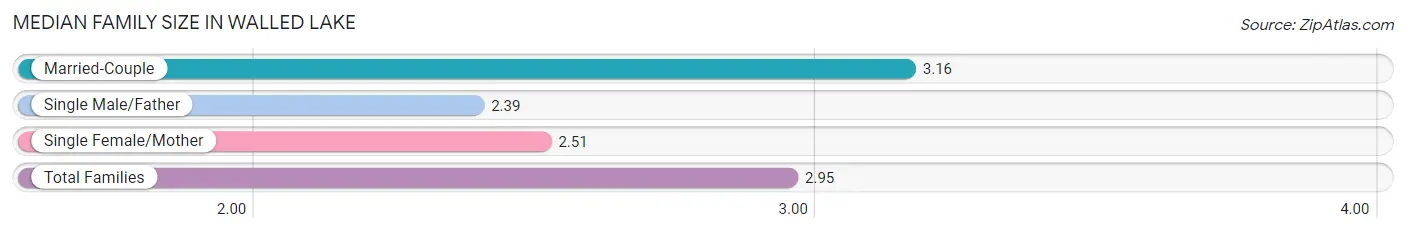
Median Family Size in Walled Lake
The median family size in Walled Lake is 2.95 persons per family, with married-couple families (1,219 | 70.2%) accounting for the largest median family size of 3.16 persons per family. On the other hand, single male/father families (190 | 10.9%) represent the smallest median family size with 2.39 persons per family.
| Family Type | # Families | Family Size |
| Married-Couple | 1,219 (70.2%) | 3.16 |
| Single Male/Father | 190 (10.9%) | 2.39 |
| Single Female/Mother | 327 (18.8%) | 2.51 |
| Total Families | 1,736 (100.0%) | 2.95 |
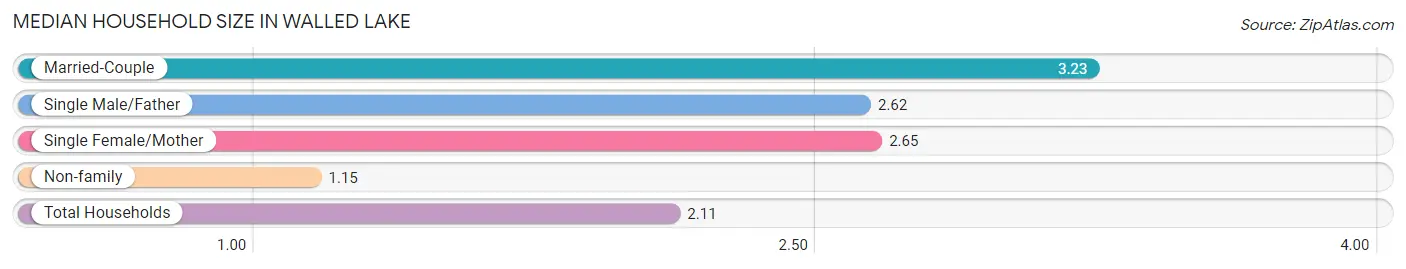
Median Household Size in Walled Lake
The median household size in Walled Lake is 2.11 persons per household, with married-couple households (1,219 | 35.5%) accounting for the largest median household size of 3.23 persons per household. non-family households (1,700 | 49.5%) represent the smallest median household size with 1.15 persons per household.
| Household Type | # Households | Household Size |
| Married-Couple | 1,219 (35.5%) | 3.23 |
| Single Male/Father | 190 (5.5%) | 2.62 |
| Single Female/Mother | 327 (9.5%) | 2.65 |
| Non-family | 1,700 (49.5%) | 1.15 |
| Total Households | 3,436 (100.0%) | 2.11 |
Household Size by Marriage Status in Walled Lake
Out of a total of 3,436 households in Walled Lake, 1,736 (50.5%) are family households, while 1,700 (49.5%) are nonfamily households. The most numerous type of family households are 2-person households, comprising 704, and the most common type of nonfamily households are 1-person households, comprising 1,476.
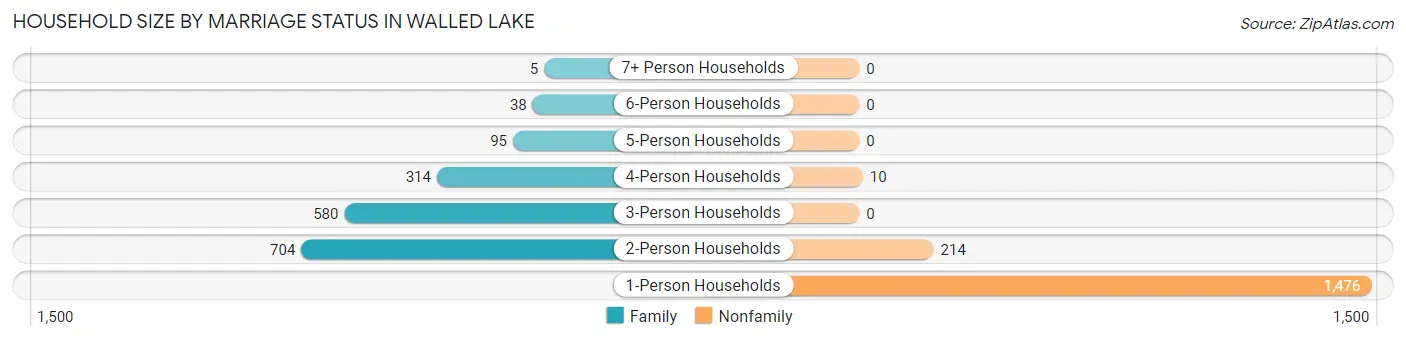
| Household Size | Family Households | Nonfamily Households |
| 1-Person Households | - | 1,476 (43.0%) |
| 2-Person Households | 704 (20.5%) | 214 (6.2%) |
| 3-Person Households | 580 (16.9%) | 0 (0.0%) |
| 4-Person Households | 314 (9.1%) | 10 (0.3%) |
| 5-Person Households | 95 (2.8%) | 0 (0.0%) |
| 6-Person Households | 38 (1.1%) | 0 (0.0%) |
| 7+ Person Households | 5 (0.2%) | 0 (0.0%) |
| Total | 1,736 (50.5%) | 1,700 (49.5%) |
Female Fertility in Walled Lake
Fertility by Age in Walled Lake
Average fertility rate in Walled Lake is 30.0 births per 1,000 women. Women in the age bracket of 20 to 34 years have the highest fertility rate with 74.0 births per 1,000 women. Women in the age bracket of 20 to 34 years acount for 100.0% of all women with births.
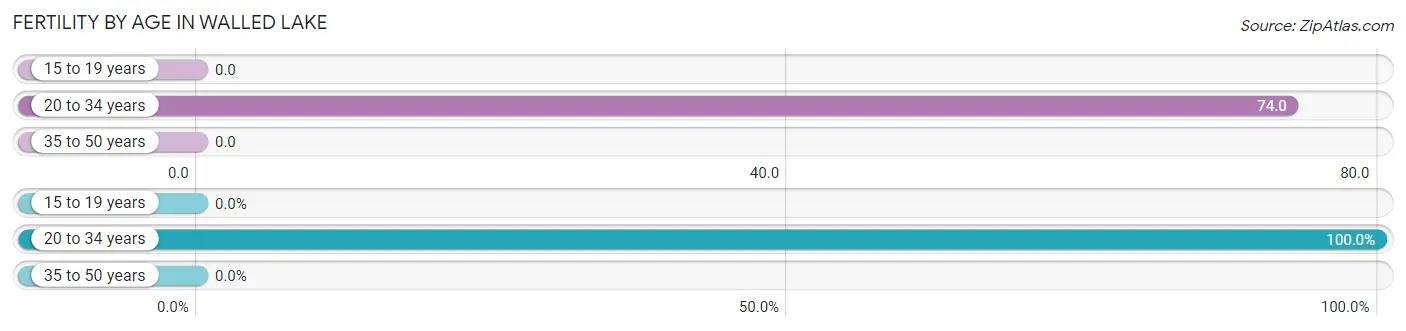
| Age Bracket | Women with Births | Births / 1,000 Women |
| 15 to 19 years | 0 (0.0%) | 0.0 |
| 20 to 34 years | 54 (100.0%) | 74.0 |
| 35 to 50 years | 0 (0.0%) | 0.0 |
| Total | 54 (100.0%) | 30.0 |
Fertility by Age by Marriage Status in Walled Lake
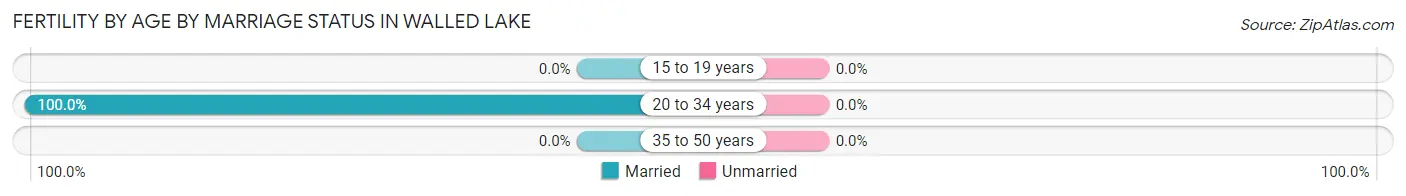
| Age Bracket | Married | Unmarried |
| 15 to 19 years | 0 (0.0%) | 0 (0.0%) |
| 20 to 34 years | 54 (100.0%) | 0 (0.0%) |
| 35 to 50 years | 0 (0.0%) | 0 (0.0%) |
| Total | 54 (100.0%) | 0 (0.0%) |
Fertility by Education in Walled Lake
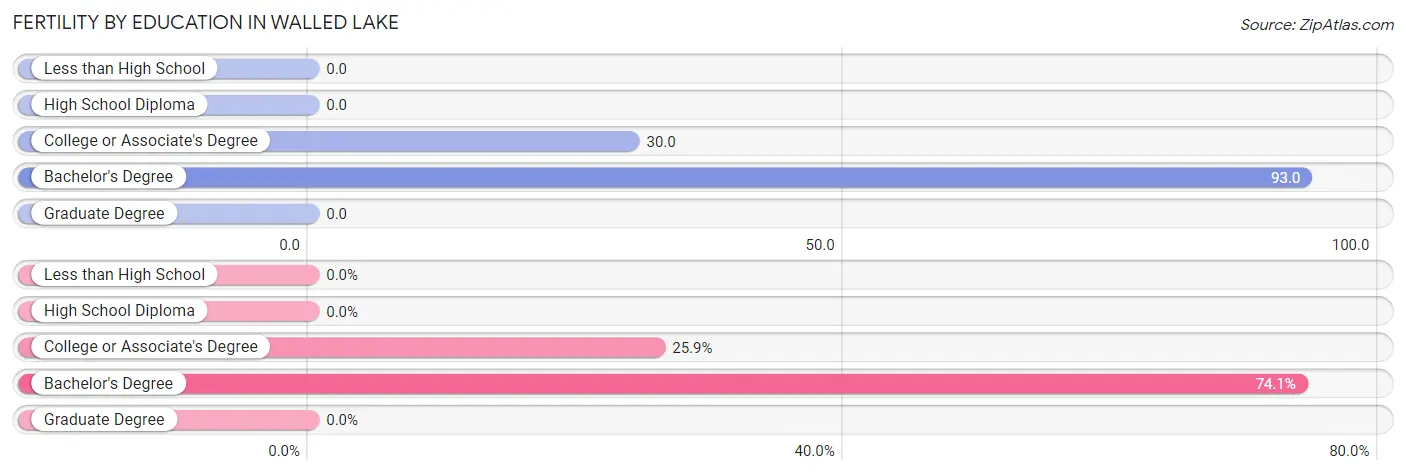
| Educational Attainment | Women with Births | Births / 1,000 Women |
| Less than High School | 0 (0.0%) | 0.0 |
| High School Diploma | 0 (0.0%) | 0.0 |
| College or Associate's Degree | 14 (25.9%) | 30.0 |
| Bachelor's Degree | 40 (74.1%) | 93.0 |
| Graduate Degree | 0 (0.0%) | 0.0 |
| Total | 54 (100.0%) | 30.0 |
Fertility by Education by Marriage Status in Walled Lake
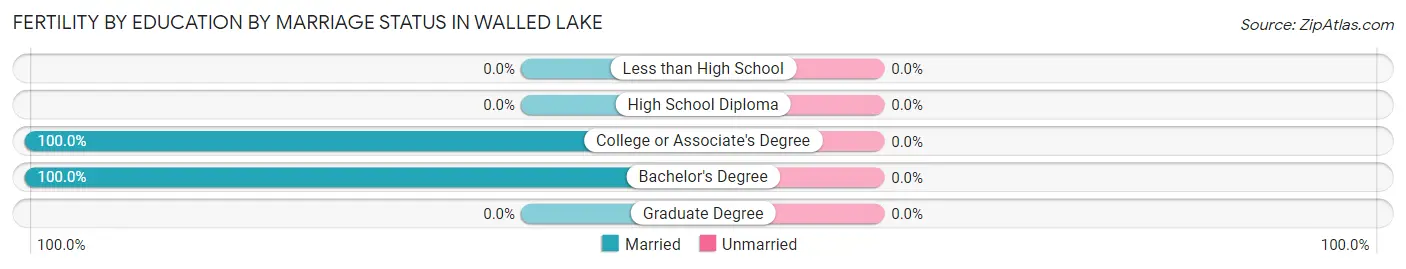
| Educational Attainment | Married | Unmarried |
| Less than High School | 0 (0.0%) | 0 (0.0%) |
| High School Diploma | 0 (0.0%) | 0 (0.0%) |
| College or Associate's Degree | 14 (100.0%) | 0 (0.0%) |
| Bachelor's Degree | 40 (100.0%) | 0 (0.0%) |
| Graduate Degree | 0 (0.0%) | 0 (0.0%) |
| Total | 54 (100.0%) | 0 (0.0%) |
Employment Characteristics in Walled Lake
Employment by Class of Employer in Walled Lake
Among the 4,257 employed individuals in Walled Lake, private company employees (3,288 | 77.2%), not-for-profit organizations (227 | 5.3%), and self-employed (not incorporated) (218 | 5.1%) make up the most common classes of employment.
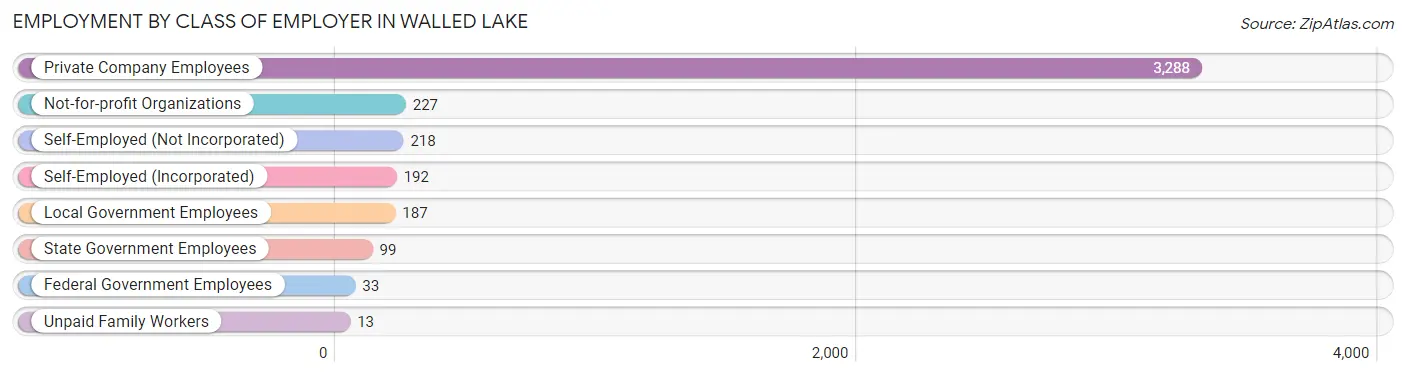
| Employer Class | # Employees | % Employees |
| Private Company Employees | 3,288 | 77.2% |
| Self-Employed (Incorporated) | 192 | 4.5% |
| Self-Employed (Not Incorporated) | 218 | 5.1% |
| Not-for-profit Organizations | 227 | 5.3% |
| Local Government Employees | 187 | 4.4% |
| State Government Employees | 99 | 2.3% |
| Federal Government Employees | 33 | 0.8% |
| Unpaid Family Workers | 13 | 0.3% |
| Total | 4,257 | 100.0% |
Employment Status by Age in Walled Lake
According to the labor force statistics for Walled Lake, out of the total population over 16 years of age (6,108), 72.0% or 4,398 individuals are in the labor force, with 2.4% or 106 of them unemployed. The age group with the highest labor force participation rate is 20 to 24 years, with 96.6% or 280 individuals in the labor force. Within the labor force, the 20 to 24 years age range has the highest percentage of unemployed individuals, with 13.9% or 39 of them being unemployed.
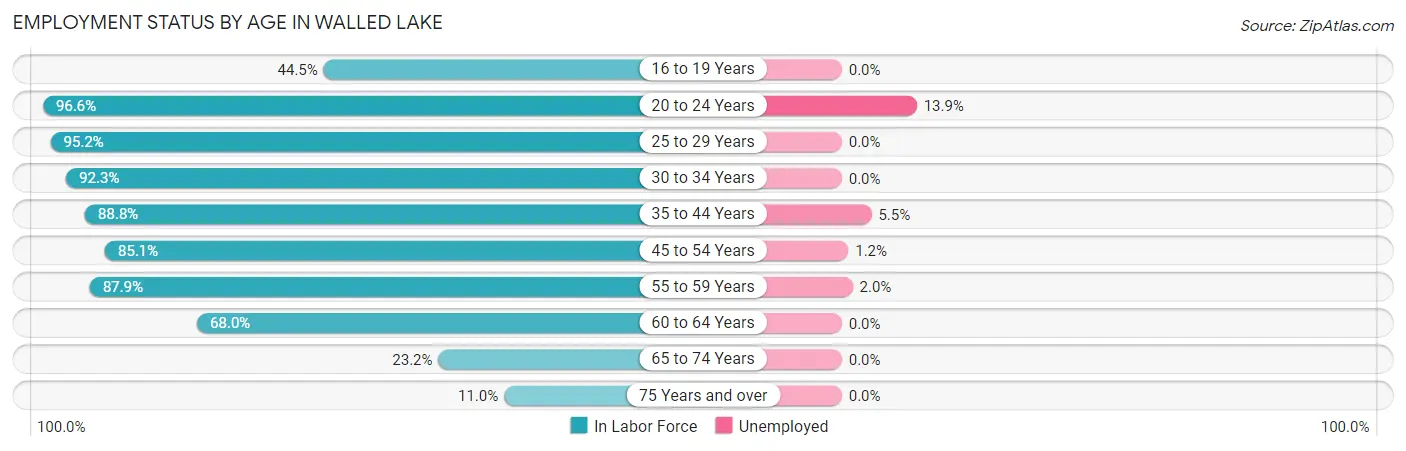
| Age Bracket | In Labor Force | Unemployed |
| 16 to 19 Years | 145 (44.5%) | 0 (0.0%) |
| 20 to 24 Years | 280 (96.6%) | 39 (13.9%) |
| 25 to 29 Years | 455 (95.2%) | 0 (0.0%) |
| 30 to 34 Years | 590 (92.3%) | 0 (0.0%) |
| 35 to 44 Years | 858 (88.8%) | 47 (5.5%) |
| 45 to 54 Years | 1,110 (85.1%) | 13 (1.2%) |
| 55 to 59 Years | 401 (87.9%) | 8 (2.0%) |
| 60 to 64 Years | 368 (68.0%) | 0 (0.0%) |
| 65 to 74 Years | 132 (23.2%) | 0 (0.0%) |
| 75 Years and over | 59 (11.0%) | 0 (0.0%) |
| Total | 4,398 (72.0%) | 106 (2.4%) |
Employment Status by Educational Attainment in Walled Lake
According to labor force statistics for Walled Lake, 86.3% of individuals (3,783) out of the total population between 25 and 64 years of age (4,384) are in the labor force, with 1.8% or 68 of them being unemployed. The group with the highest labor force participation rate are those with the educational attainment of bachelor's degree or higher, with 90.2% or 1,368 individuals in the labor force. Within the labor force, individuals with high school diploma education have the highest percentage of unemployment, with 3.2% or 33 of them being unemployed.
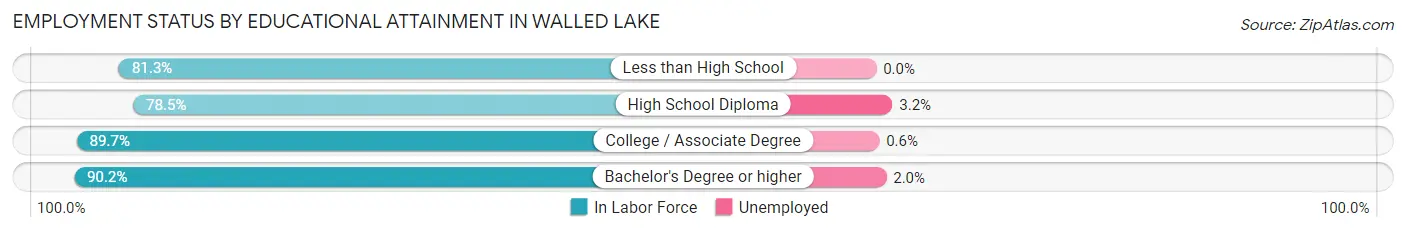
| Educational Attainment | In Labor Force | Unemployed |
| Less than High School | 100 (81.3%) | 0 (0.0%) |
| High School Diploma | 1,036 (78.5%) | 42 (3.2%) |
| College / Associate Degree | 1,277 (89.7%) | 9 (0.6%) |
| Bachelor's Degree or higher | 1,368 (90.2%) | 30 (2.0%) |
| Total | 3,783 (86.3%) | 79 (1.8%) |
Employment Occupations by Sex in Walled Lake
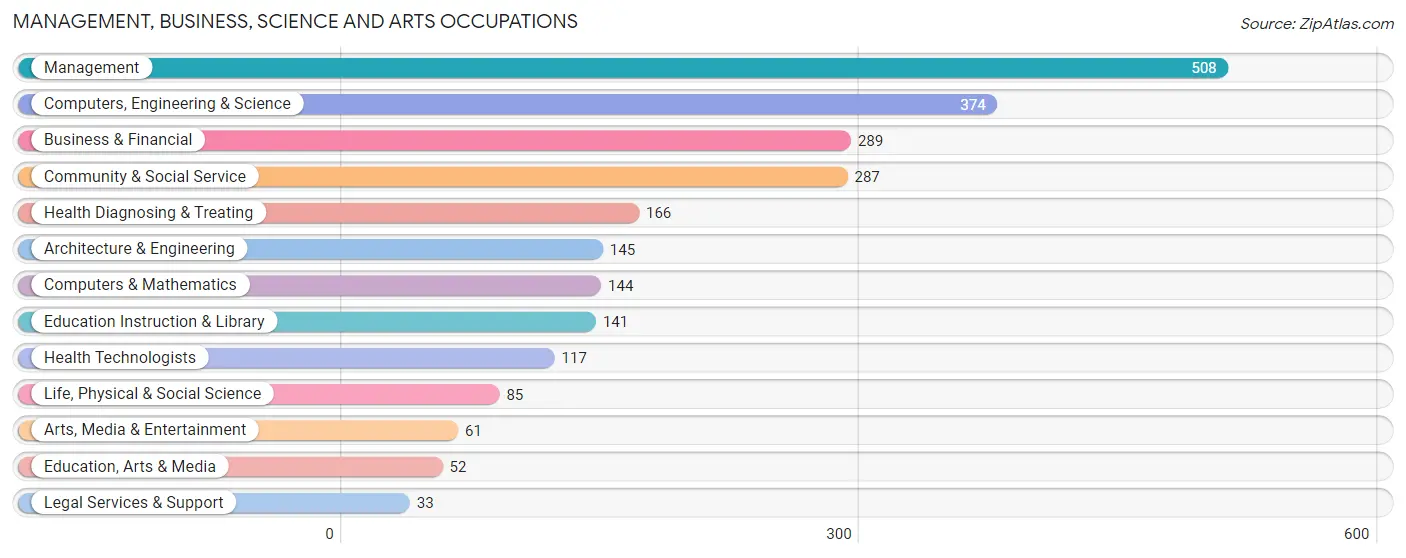
Management, Business, Science and Arts Occupations
The most common Management, Business, Science and Arts occupations in Walled Lake are Management (508 | 11.8%), Computers, Engineering & Science (374 | 8.7%), Business & Financial (289 | 6.7%), Community & Social Service (287 | 6.7%), and Health Diagnosing & Treating (166 | 3.9%).
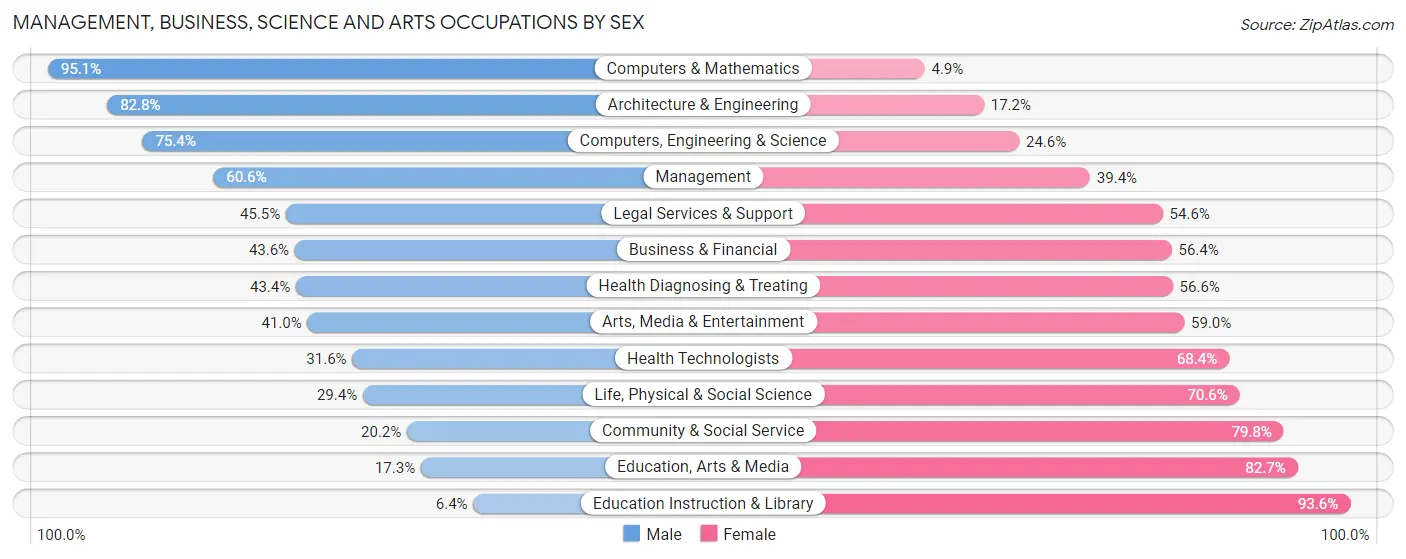
Management, Business, Science and Arts Occupations by Sex
Within the Management, Business, Science and Arts occupations in Walled Lake, the most male-oriented occupations are Computers & Mathematics (95.1%), Architecture & Engineering (82.8%), and Computers, Engineering & Science (75.4%), while the most female-oriented occupations are Education Instruction & Library (93.6%), Education, Arts & Media (82.7%), and Community & Social Service (79.8%).
| Occupation | Male | Female |
| Management | 308 (60.6%) | 200 (39.4%) |
| Business & Financial | 126 (43.6%) | 163 (56.4%) |
| Computers, Engineering & Science | 282 (75.4%) | 92 (24.6%) |
| Computers & Mathematics | 137 (95.1%) | 7 (4.9%) |
| Architecture & Engineering | 120 (82.8%) | 25 (17.2%) |
| Life, Physical & Social Science | 25 (29.4%) | 60 (70.6%) |
| Community & Social Service | 58 (20.2%) | 229 (79.8%) |
| Education, Arts & Media | 9 (17.3%) | 43 (82.7%) |
| Legal Services & Support | 15 (45.5%) | 18 (54.5%) |
| Education Instruction & Library | 9 (6.4%) | 132 (93.6%) |
| Arts, Media & Entertainment | 25 (41.0%) | 36 (59.0%) |
| Health Diagnosing & Treating | 72 (43.4%) | 94 (56.6%) |
| Health Technologists | 37 (31.6%) | 80 (68.4%) |
| Total (Category) | 846 (52.1%) | 778 (47.9%) |
| Total (Overall) | 2,235 (52.1%) | 2,056 (47.9%) |
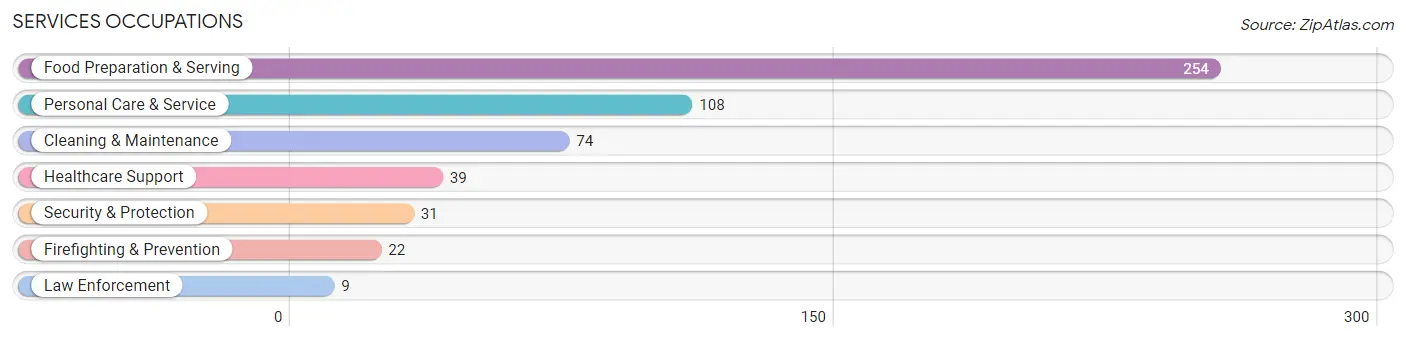
Services Occupations
The most common Services occupations in Walled Lake are Food Preparation & Serving (254 | 5.9%), Personal Care & Service (108 | 2.5%), Cleaning & Maintenance (74 | 1.7%), Healthcare Support (39 | 0.9%), and Security & Protection (31 | 0.7%).
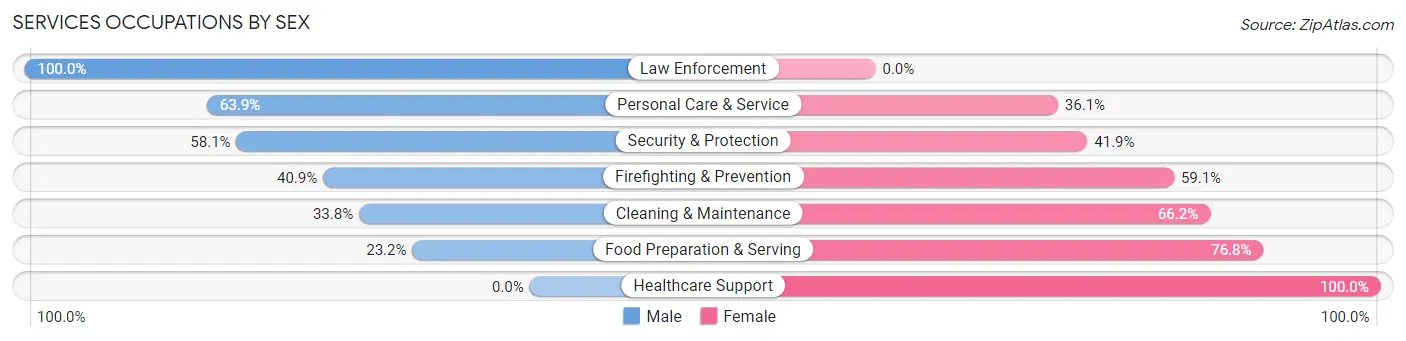
Services Occupations by Sex
Within the Services occupations in Walled Lake, the most male-oriented occupations are Law Enforcement (100.0%), Personal Care & Service (63.9%), and Security & Protection (58.1%), while the most female-oriented occupations are Healthcare Support (100.0%), Food Preparation & Serving (76.8%), and Cleaning & Maintenance (66.2%).
| Occupation | Male | Female |
| Healthcare Support | 0 (0.0%) | 39 (100.0%) |
| Security & Protection | 18 (58.1%) | 13 (41.9%) |
| Firefighting & Prevention | 9 (40.9%) | 13 (59.1%) |
| Law Enforcement | 9 (100.0%) | 0 (0.0%) |
| Food Preparation & Serving | 59 (23.2%) | 195 (76.8%) |
| Cleaning & Maintenance | 25 (33.8%) | 49 (66.2%) |
| Personal Care & Service | 69 (63.9%) | 39 (36.1%) |
| Total (Category) | 171 (33.8%) | 335 (66.2%) |
| Total (Overall) | 2,235 (52.1%) | 2,056 (47.9%) |
Sales and Office Occupations
The most common Sales and Office occupations in Walled Lake are Sales & Related (550 | 12.8%), and Office & Administration (505 | 11.8%).
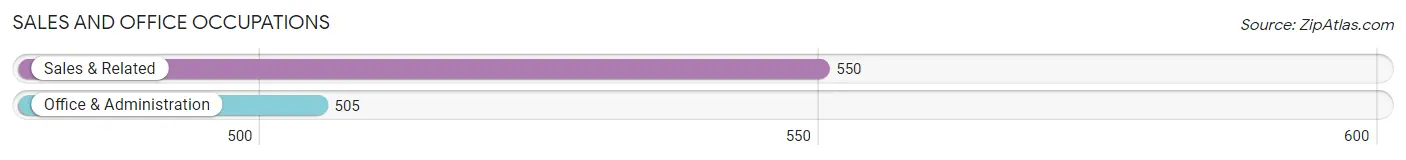
Sales and Office Occupations by Sex
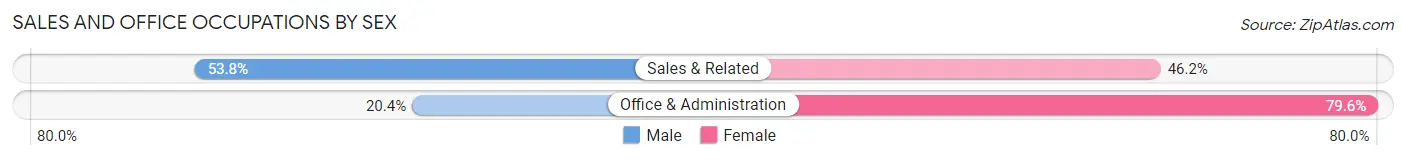
| Occupation | Male | Female |
| Sales & Related | 296 (53.8%) | 254 (46.2%) |
| Office & Administration | 103 (20.4%) | 402 (79.6%) |
| Total (Category) | 399 (37.8%) | 656 (62.2%) |
| Total (Overall) | 2,235 (52.1%) | 2,056 (47.9%) |
Natural Resources, Construction and Maintenance Occupations
The most common Natural Resources, Construction and Maintenance occupations in Walled Lake are Construction & Extraction (186 | 4.3%), Farming, Fishing & Forestry (94 | 2.2%), and Installation, Maintenance & Repair (76 | 1.8%).
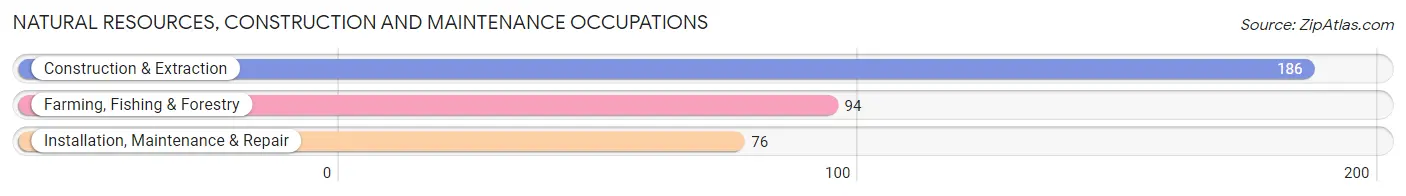
Natural Resources, Construction and Maintenance Occupations by Sex
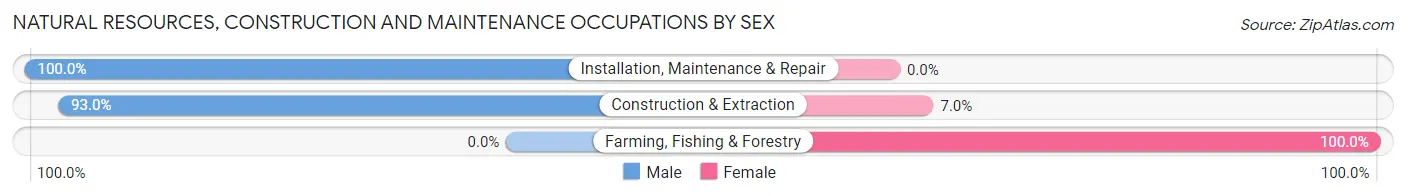
| Occupation | Male | Female |
| Farming, Fishing & Forestry | 0 (0.0%) | 94 (100.0%) |
| Construction & Extraction | 173 (93.0%) | 13 (7.0%) |
| Installation, Maintenance & Repair | 76 (100.0%) | 0 (0.0%) |
| Total (Category) | 249 (69.9%) | 107 (30.1%) |
| Total (Overall) | 2,235 (52.1%) | 2,056 (47.9%) |
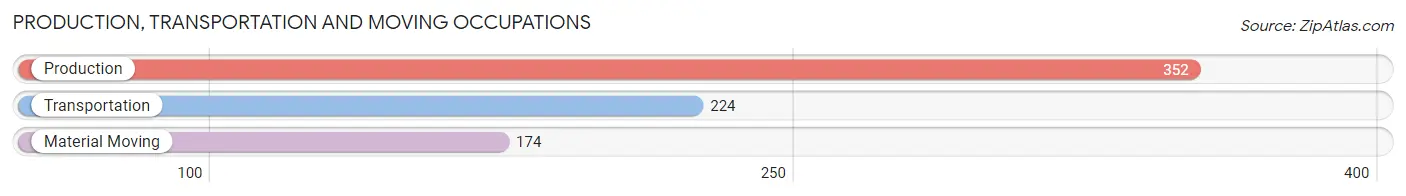
Production, Transportation and Moving Occupations
The most common Production, Transportation and Moving occupations in Walled Lake are Production (352 | 8.2%), Transportation (224 | 5.2%), and Material Moving (174 | 4.1%).
Production, Transportation and Moving Occupations by Sex
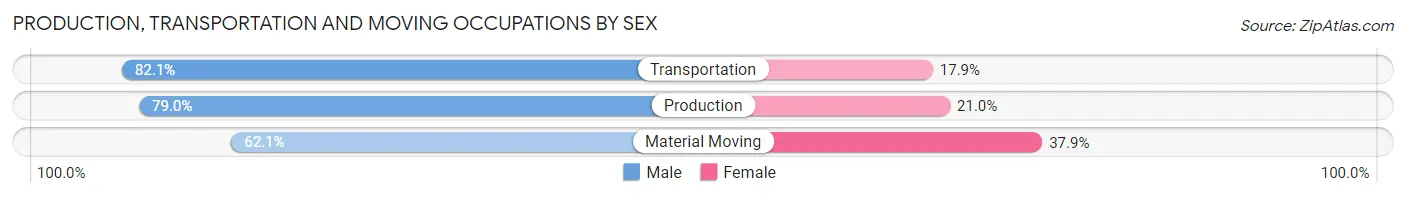
| Occupation | Male | Female |
| Production | 278 (79.0%) | 74 (21.0%) |
| Transportation | 184 (82.1%) | 40 (17.9%) |
| Material Moving | 108 (62.1%) | 66 (37.9%) |
| Total (Category) | 570 (76.0%) | 180 (24.0%) |
| Total (Overall) | 2,235 (52.1%) | 2,056 (47.9%) |
Employment Industries by Sex in Walled Lake
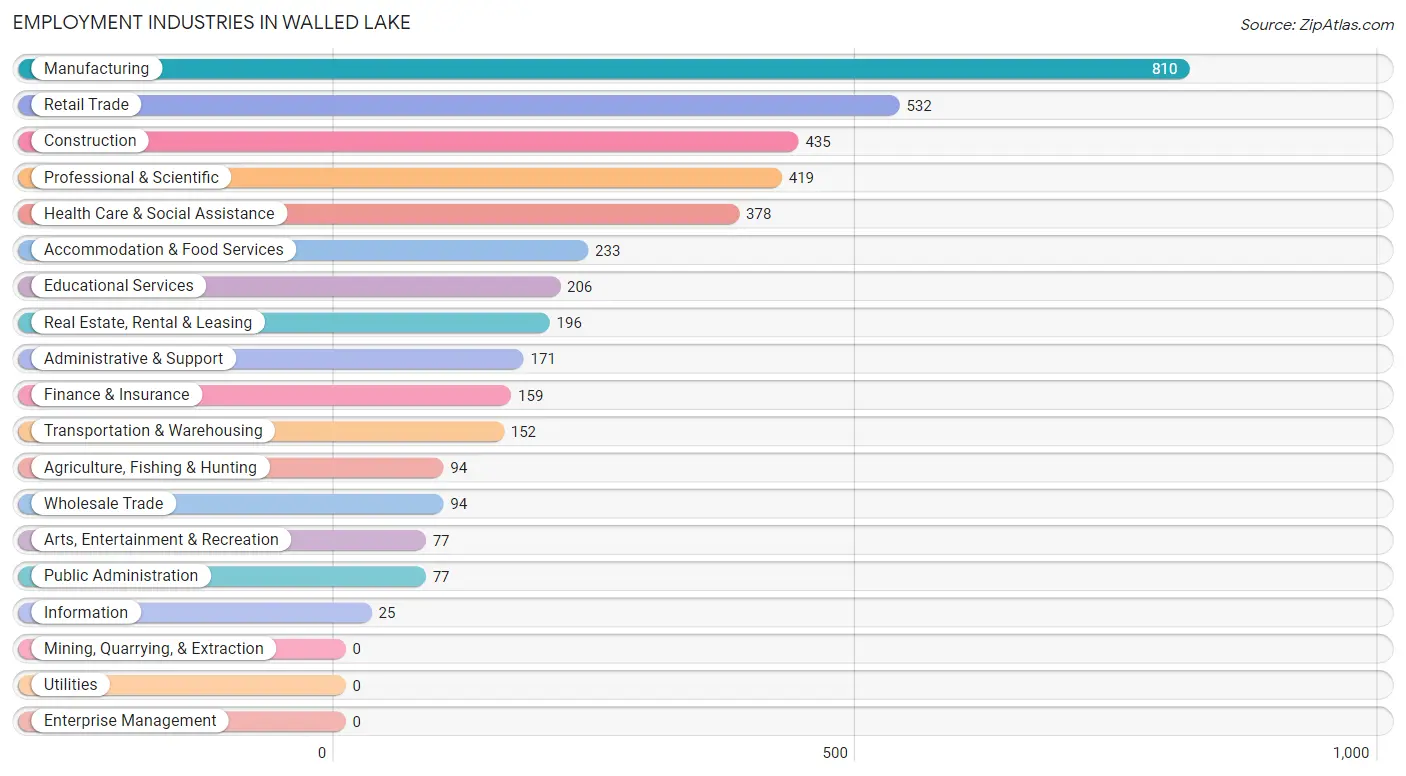
Employment Industries in Walled Lake
The major employment industries in Walled Lake include Manufacturing (810 | 18.9%), Retail Trade (532 | 12.4%), Construction (435 | 10.1%), Professional & Scientific (419 | 9.8%), and Health Care & Social Assistance (378 | 8.8%).
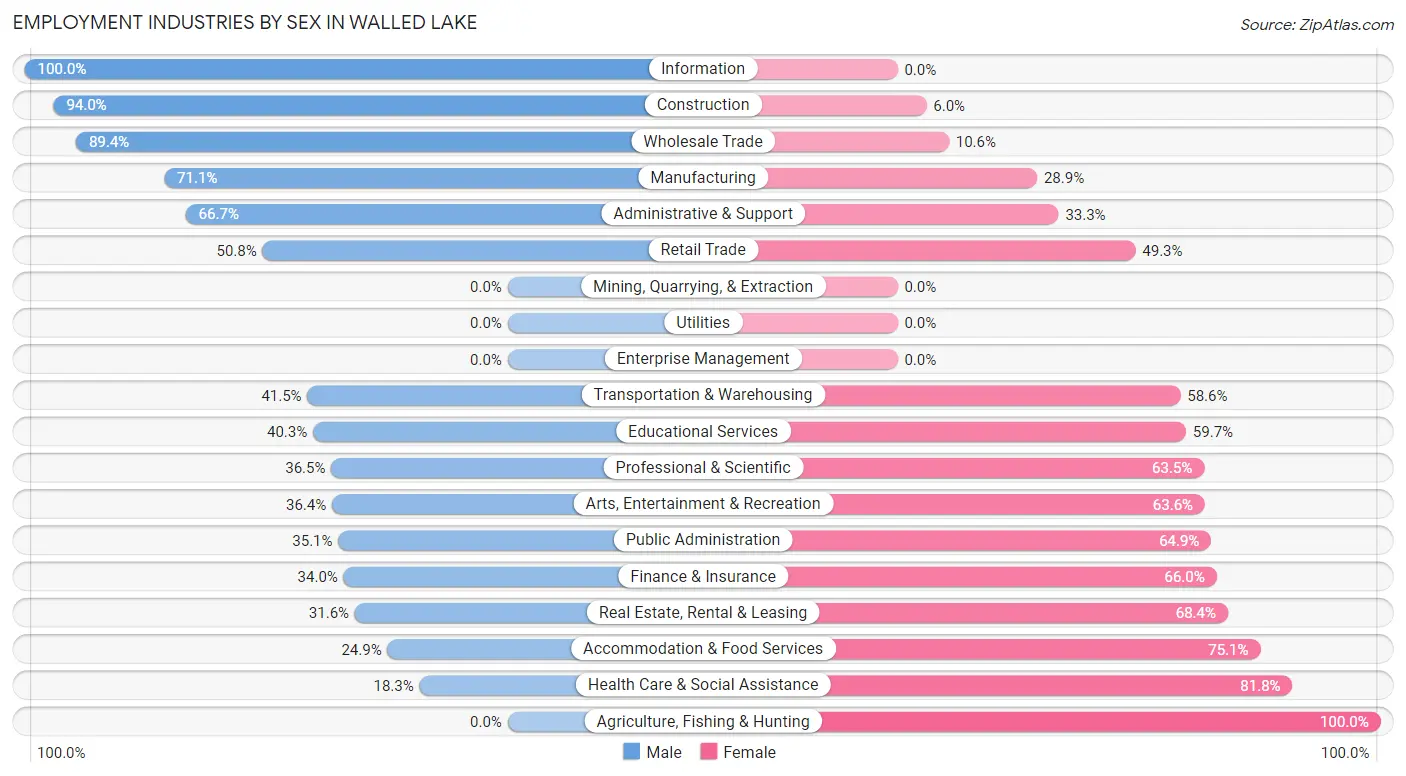
Employment Industries by Sex in Walled Lake
The Walled Lake industries that see more men than women are Information (100.0%), Construction (94.0%), and Wholesale Trade (89.4%), whereas the industries that tend to have a higher number of women are Agriculture, Fishing & Hunting (100.0%), Health Care & Social Assistance (81.8%), and Accommodation & Food Services (75.1%).
| Industry | Male | Female |
| Agriculture, Fishing & Hunting | 0 (0.0%) | 94 (100.0%) |
| Mining, Quarrying, & Extraction | 0 (0.0%) | 0 (0.0%) |
| Construction | 409 (94.0%) | 26 (6.0%) |
| Manufacturing | 576 (71.1%) | 234 (28.9%) |
| Wholesale Trade | 84 (89.4%) | 10 (10.6%) |
| Retail Trade | 270 (50.7%) | 262 (49.2%) |
| Transportation & Warehousing | 63 (41.4%) | 89 (58.6%) |
| Utilities | 0 (0.0%) | 0 (0.0%) |
| Information | 25 (100.0%) | 0 (0.0%) |
| Finance & Insurance | 54 (34.0%) | 105 (66.0%) |
| Real Estate, Rental & Leasing | 62 (31.6%) | 134 (68.4%) |
| Professional & Scientific | 153 (36.5%) | 266 (63.5%) |
| Enterprise Management | 0 (0.0%) | 0 (0.0%) |
| Administrative & Support | 114 (66.7%) | 57 (33.3%) |
| Educational Services | 83 (40.3%) | 123 (59.7%) |
| Health Care & Social Assistance | 69 (18.2%) | 309 (81.8%) |
| Arts, Entertainment & Recreation | 28 (36.4%) | 49 (63.6%) |
| Accommodation & Food Services | 58 (24.9%) | 175 (75.1%) |
| Public Administration | 27 (35.1%) | 50 (64.9%) |
| Total | 2,235 (52.1%) | 2,056 (47.9%) |
Education in Walled Lake
School Enrollment in Walled Lake
The most common levels of schooling among the 1,398 students in Walled Lake are high school (407 | 29.1%), middle school (383 | 27.4%), and college / undergraduate (277 | 19.8%).
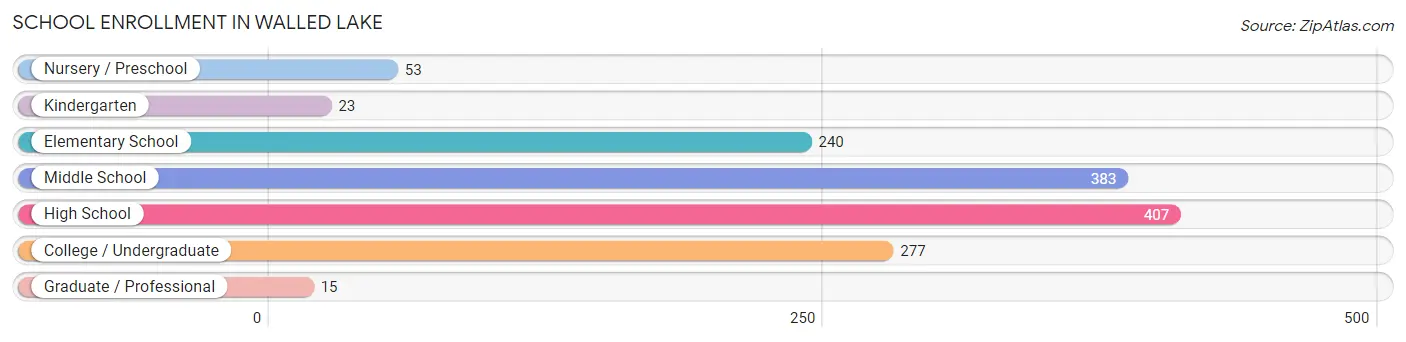
| School Level | # Students | % Students |
| Nursery / Preschool | 53 | 3.8% |
| Kindergarten | 23 | 1.7% |
| Elementary School | 240 | 17.2% |
| Middle School | 383 | 27.4% |
| High School | 407 | 29.1% |
| College / Undergraduate | 277 | 19.8% |
| Graduate / Professional | 15 | 1.1% |
| Total | 1,398 | 100.0% |
School Enrollment by Age by Funding Source in Walled Lake
Out of a total of 1,398 students who are enrolled in schools in Walled Lake, 169 (12.1%) attend a private institution, while the remaining 1,229 (87.9%) are enrolled in public schools. The age group of 3 to 4 year olds has the highest likelihood of being enrolled in private schools, with 14 (100.0% in the age bracket) enrolled. Conversely, the age group of 20 to 24 year olds has the lowest likelihood of being enrolled in a private school, with 47 (100.0% in the age bracket) attending a public institution.
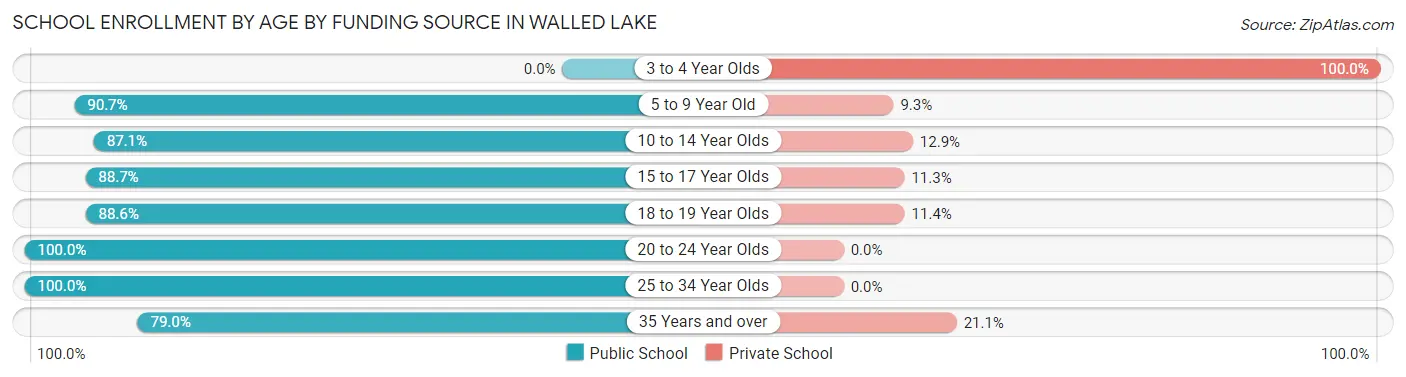
| Age Bracket | Public School | Private School |
| 3 to 4 Year Olds | 0 (0.0%) | 14 (100.0%) |
| 5 to 9 Year Old | 274 (90.7%) | 28 (9.3%) |
| 10 to 14 Year Olds | 385 (87.1%) | 57 (12.9%) |
| 15 to 17 Year Olds | 274 (88.7%) | 35 (11.3%) |
| 18 to 19 Year Olds | 117 (88.6%) | 15 (11.4%) |
| 20 to 24 Year Olds | 47 (100.0%) | 0 (0.0%) |
| 25 to 34 Year Olds | 57 (100.0%) | 0 (0.0%) |
| 35 Years and over | 75 (78.9%) | 20 (21.0%) |
| Total | 1,229 (87.9%) | 169 (12.1%) |
Educational Attainment by Field of Study in Walled Lake
Business (445 | 24.3%), engineering (237 | 12.9%), arts & humanities (179 | 9.8%), education (149 | 8.1%), and social sciences (136 | 7.4%) are the most common fields of study among 1,832 individuals in Walled Lake who have obtained a bachelor's degree or higher.
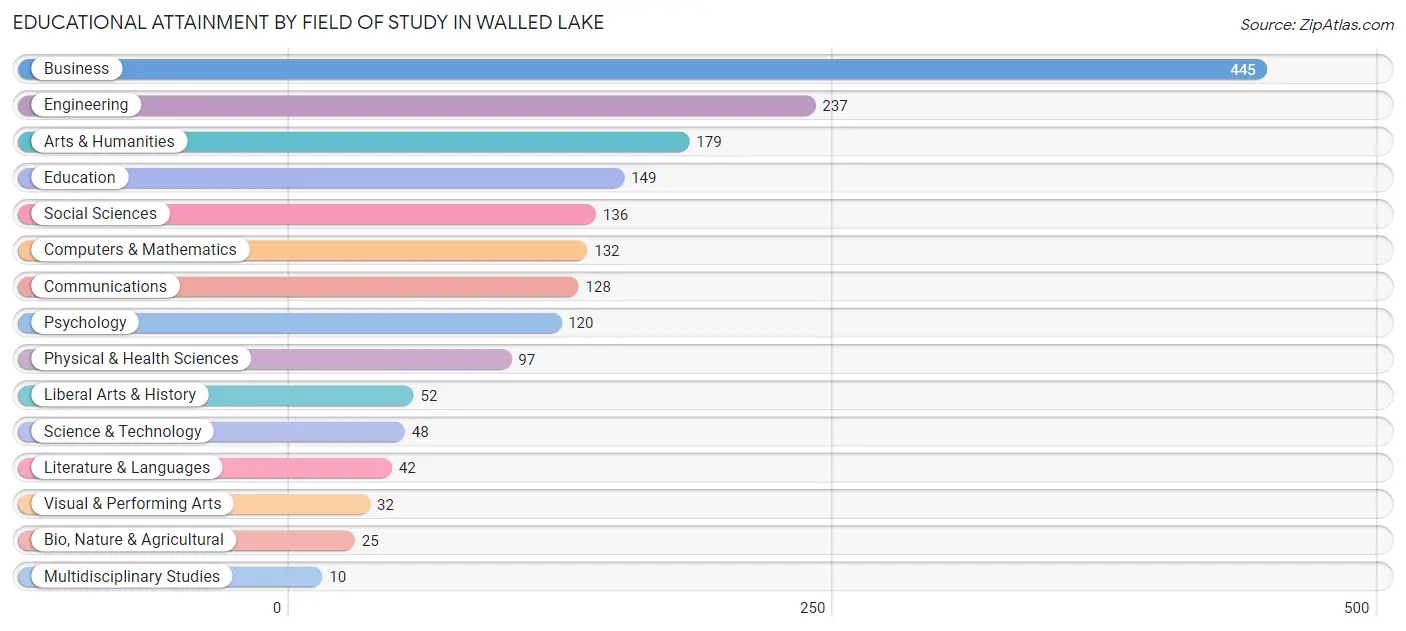
| Field of Study | # Graduates | % Graduates |
| Computers & Mathematics | 132 | 7.2% |
| Bio, Nature & Agricultural | 25 | 1.4% |
| Physical & Health Sciences | 97 | 5.3% |
| Psychology | 120 | 6.6% |
| Social Sciences | 136 | 7.4% |
| Engineering | 237 | 12.9% |
| Multidisciplinary Studies | 10 | 0.5% |
| Science & Technology | 48 | 2.6% |
| Business | 445 | 24.3% |
| Education | 149 | 8.1% |
| Literature & Languages | 42 | 2.3% |
| Liberal Arts & History | 52 | 2.8% |
| Visual & Performing Arts | 32 | 1.8% |
| Communications | 128 | 7.0% |
| Arts & Humanities | 179 | 9.8% |
| Total | 1,832 | 100.0% |
Transportation & Commute in Walled Lake
Vehicle Availability by Sex in Walled Lake
The most prevalent vehicle ownership categories in Walled Lake are males with 2 vehicles (1,035, accounting for 46.3%) and females with 2 vehicles (770, making up 51.2%).
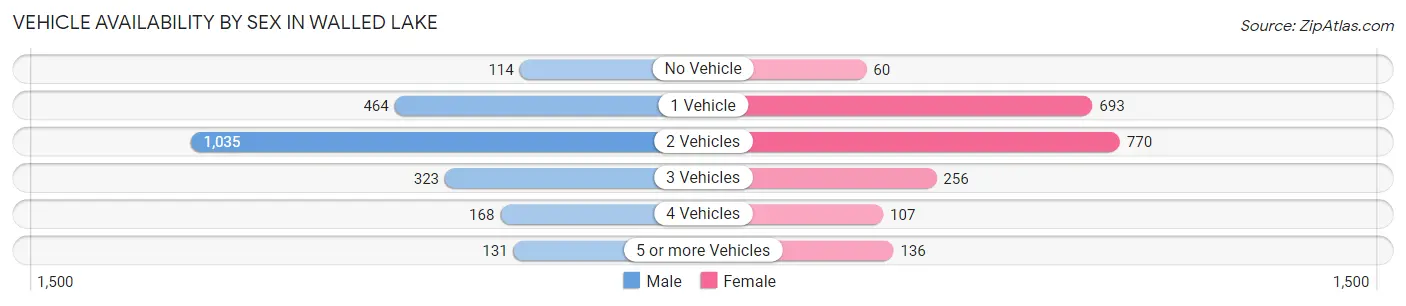
| Vehicles Available | Male | Female |
| No Vehicle | 114 (5.1%) | 60 (3.0%) |
| 1 Vehicle | 464 (20.8%) | 693 (34.3%) |
| 2 Vehicles | 1,035 (46.3%) | 770 (38.1%) |
| 3 Vehicles | 323 (14.4%) | 256 (12.7%) |
| 4 Vehicles | 168 (7.5%) | 107 (5.3%) |
| 5 or more Vehicles | 131 (5.9%) | 136 (6.7%) |
| Total | 2,235 (100.0%) | 2,022 (100.0%) |
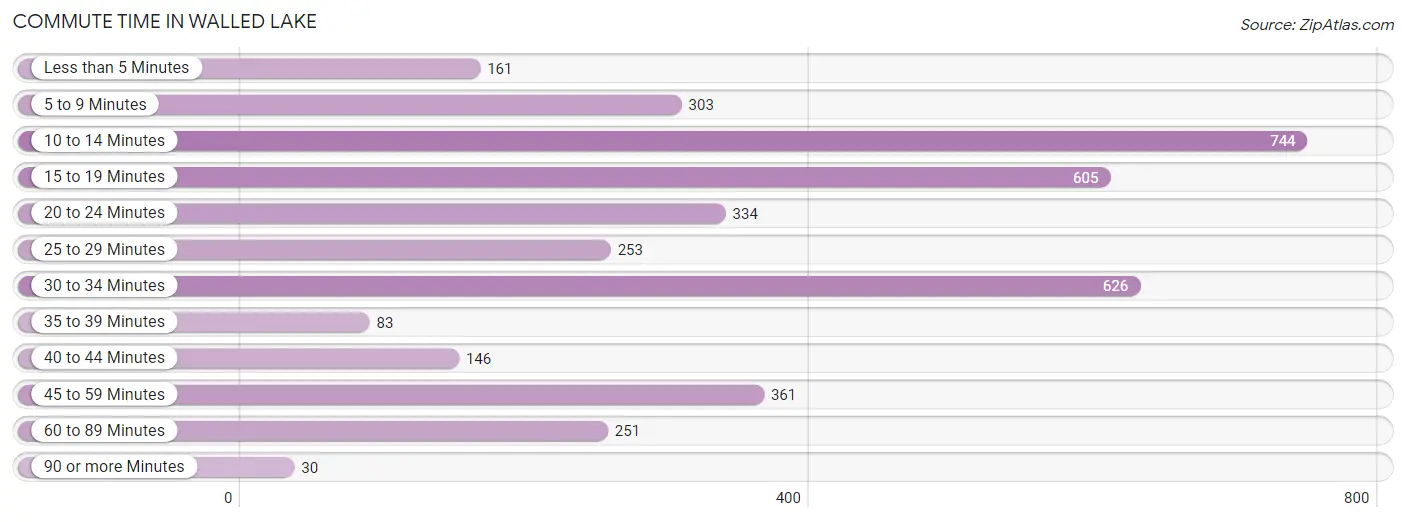
Commute Time in Walled Lake
The most frequently occuring commute durations in Walled Lake are 10 to 14 minutes (744 commuters, 19.1%), 30 to 34 minutes (626 commuters, 16.1%), and 15 to 19 minutes (605 commuters, 15.5%).
| Commute Time | # Commuters | % Commuters |
| Less than 5 Minutes | 161 | 4.1% |
| 5 to 9 Minutes | 303 | 7.8% |
| 10 to 14 Minutes | 744 | 19.1% |
| 15 to 19 Minutes | 605 | 15.5% |
| 20 to 24 Minutes | 334 | 8.6% |
| 25 to 29 Minutes | 253 | 6.5% |
| 30 to 34 Minutes | 626 | 16.1% |
| 35 to 39 Minutes | 83 | 2.1% |
| 40 to 44 Minutes | 146 | 3.7% |
| 45 to 59 Minutes | 361 | 9.3% |
| 60 to 89 Minutes | 251 | 6.4% |
| 90 or more Minutes | 30 | 0.8% |
Commute Time by Sex in Walled Lake
The most common commute times in Walled Lake are 30 to 34 minutes (432 commuters, 20.7%) for males and 10 to 14 minutes (385 commuters, 21.3%) for females.
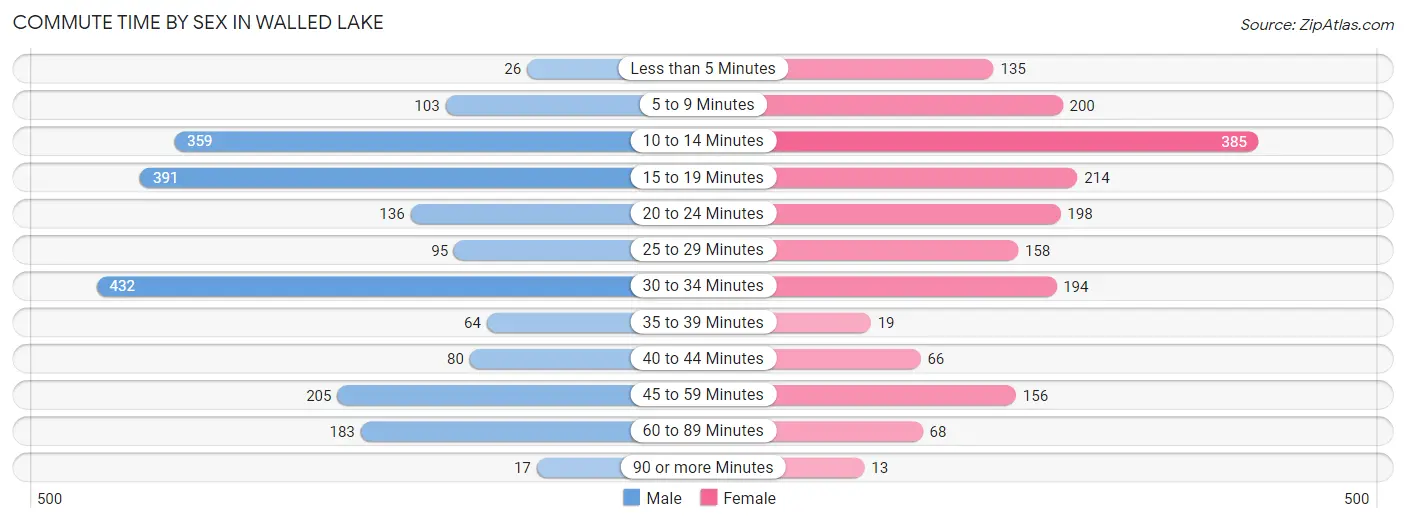
| Commute Time | Male | Female |
| Less than 5 Minutes | 26 (1.2%) | 135 (7.5%) |
| 5 to 9 Minutes | 103 (4.9%) | 200 (11.1%) |
| 10 to 14 Minutes | 359 (17.2%) | 385 (21.3%) |
| 15 to 19 Minutes | 391 (18.7%) | 214 (11.8%) |
| 20 to 24 Minutes | 136 (6.5%) | 198 (11.0%) |
| 25 to 29 Minutes | 95 (4.5%) | 158 (8.7%) |
| 30 to 34 Minutes | 432 (20.7%) | 194 (10.7%) |
| 35 to 39 Minutes | 64 (3.1%) | 19 (1.1%) |
| 40 to 44 Minutes | 80 (3.8%) | 66 (3.6%) |
| 45 to 59 Minutes | 205 (9.8%) | 156 (8.6%) |
| 60 to 89 Minutes | 183 (8.7%) | 68 (3.8%) |
| 90 or more Minutes | 17 (0.8%) | 13 (0.7%) |
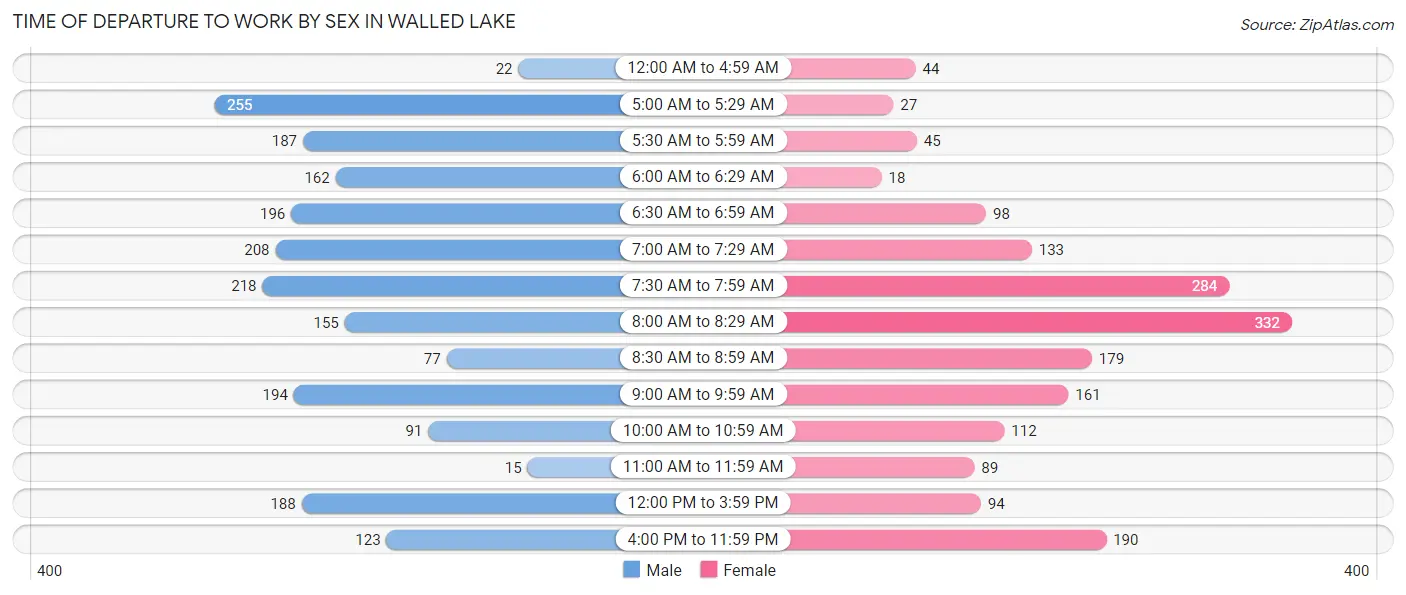
Time of Departure to Work by Sex in Walled Lake
The most frequent times of departure to work in Walled Lake are 5:00 AM to 5:29 AM (255, 12.2%) for males and 8:00 AM to 8:29 AM (332, 18.4%) for females.
| Time of Departure | Male | Female |
| 12:00 AM to 4:59 AM | 22 (1.1%) | 44 (2.4%) |
| 5:00 AM to 5:29 AM | 255 (12.2%) | 27 (1.5%) |
| 5:30 AM to 5:59 AM | 187 (8.9%) | 45 (2.5%) |
| 6:00 AM to 6:29 AM | 162 (7.7%) | 18 (1.0%) |
| 6:30 AM to 6:59 AM | 196 (9.4%) | 98 (5.4%) |
| 7:00 AM to 7:29 AM | 208 (10.0%) | 133 (7.4%) |
| 7:30 AM to 7:59 AM | 218 (10.4%) | 284 (15.7%) |
| 8:00 AM to 8:29 AM | 155 (7.4%) | 332 (18.4%) |
| 8:30 AM to 8:59 AM | 77 (3.7%) | 179 (9.9%) |
| 9:00 AM to 9:59 AM | 194 (9.3%) | 161 (8.9%) |
| 10:00 AM to 10:59 AM | 91 (4.3%) | 112 (6.2%) |
| 11:00 AM to 11:59 AM | 15 (0.7%) | 89 (4.9%) |
| 12:00 PM to 3:59 PM | 188 (9.0%) | 94 (5.2%) |
| 4:00 PM to 11:59 PM | 123 (5.9%) | 190 (10.5%) |
| Total | 2,091 (100.0%) | 1,806 (100.0%) |
Housing Occupancy in Walled Lake
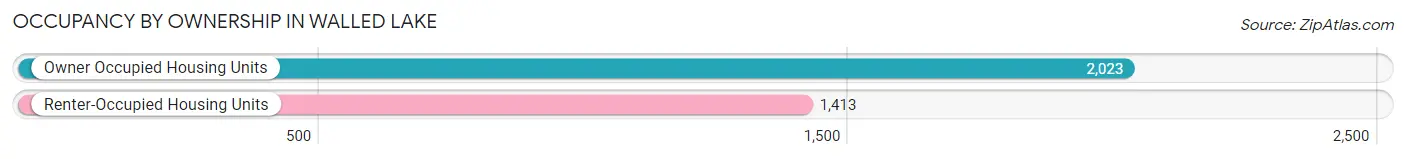
Occupancy by Ownership in Walled Lake
Of the total 3,436 dwellings in Walled Lake, owner-occupied units account for 2,023 (58.9%), while renter-occupied units make up 1,413 (41.1%).
| Occupancy | # Housing Units | % Housing Units |
| Owner Occupied Housing Units | 2,023 | 58.9% |
| Renter-Occupied Housing Units | 1,413 | 41.1% |
| Total Occupied Housing Units | 3,436 | 100.0% |
Occupancy by Household Size in Walled Lake
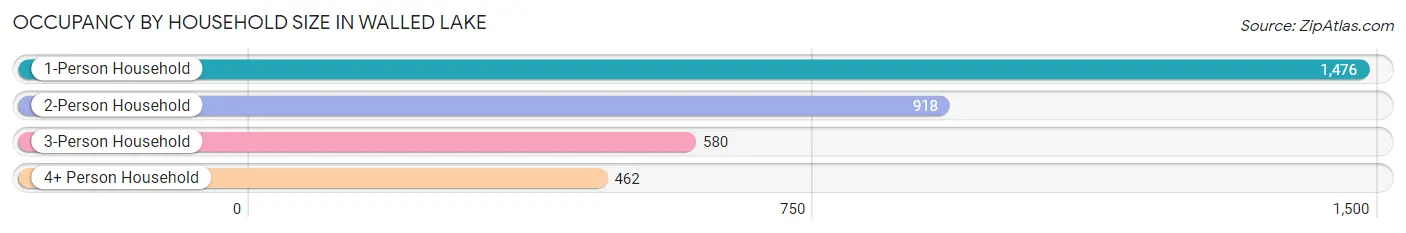
| Household Size | # Housing Units | % Housing Units |
| 1-Person Household | 1,476 | 43.0% |
| 2-Person Household | 918 | 26.7% |
| 3-Person Household | 580 | 16.9% |
| 4+ Person Household | 462 | 13.5% |
| Total Housing Units | 3,436 | 100.0% |
Occupancy by Ownership by Household Size in Walled Lake
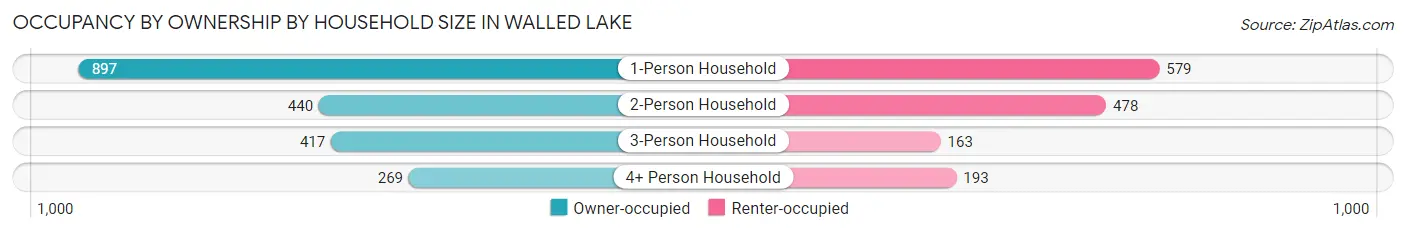
| Household Size | Owner-occupied | Renter-occupied |
| 1-Person Household | 897 (60.8%) | 579 (39.2%) |
| 2-Person Household | 440 (47.9%) | 478 (52.1%) |
| 3-Person Household | 417 (71.9%) | 163 (28.1%) |
| 4+ Person Household | 269 (58.2%) | 193 (41.8%) |
| Total Housing Units | 2,023 (58.9%) | 1,413 (41.1%) |
Occupancy by Educational Attainment in Walled Lake
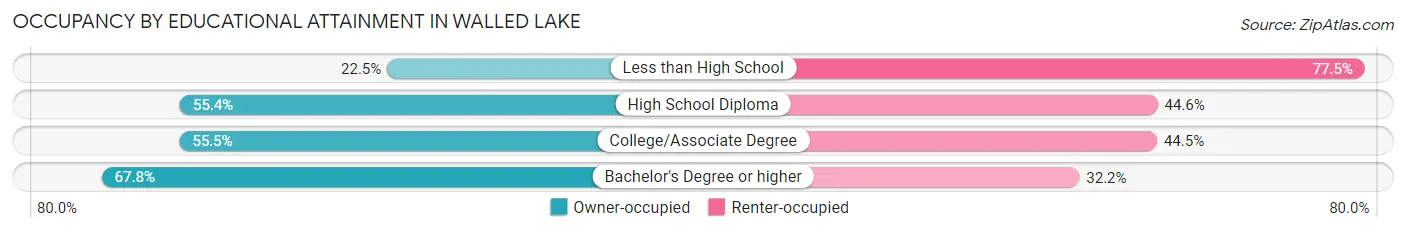
| Household Size | Owner-occupied | Renter-occupied |
| Less than High School | 18 (22.5%) | 62 (77.5%) |
| High School Diploma | 527 (55.4%) | 425 (44.6%) |
| College/Associate Degree | 681 (55.5%) | 547 (44.5%) |
| Bachelor's Degree or higher | 797 (67.8%) | 379 (32.2%) |
Occupancy by Age of Householder in Walled Lake
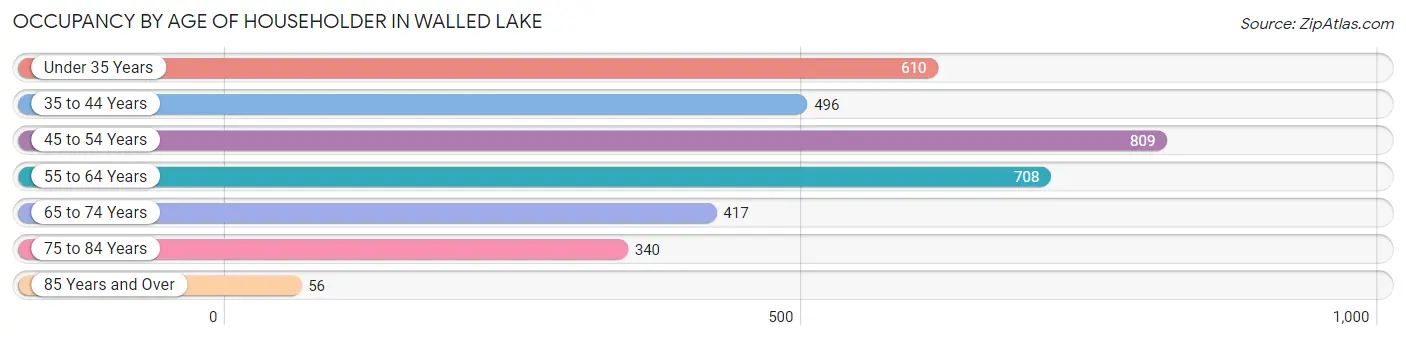
| Age Bracket | # Households | % Households |
| Under 35 Years | 610 | 17.7% |
| 35 to 44 Years | 496 | 14.4% |
| 45 to 54 Years | 809 | 23.5% |
| 55 to 64 Years | 708 | 20.6% |
| 65 to 74 Years | 417 | 12.1% |
| 75 to 84 Years | 340 | 9.9% |
| 85 Years and Over | 56 | 1.6% |
| Total | 3,436 | 100.0% |
Housing Finances in Walled Lake
Median Income by Occupancy in Walled Lake
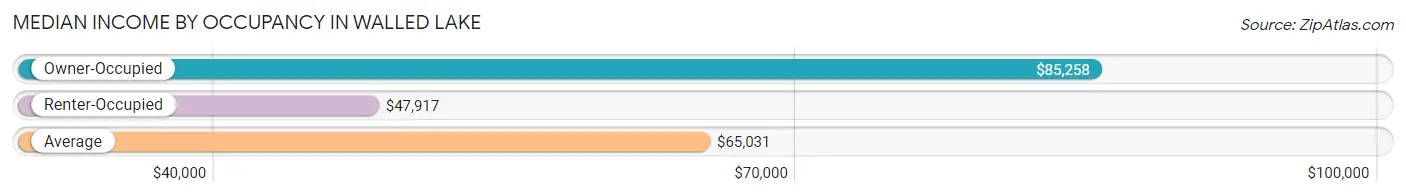
| Occupancy Type | # Households | Median Income |
| Owner-Occupied | 2,023 (58.9%) | $85,258 |
| Renter-Occupied | 1,413 (41.1%) | $47,917 |
| Average | 3,436 (100.0%) | $65,031 |
Occupancy by Householder Income Bracket in Walled Lake
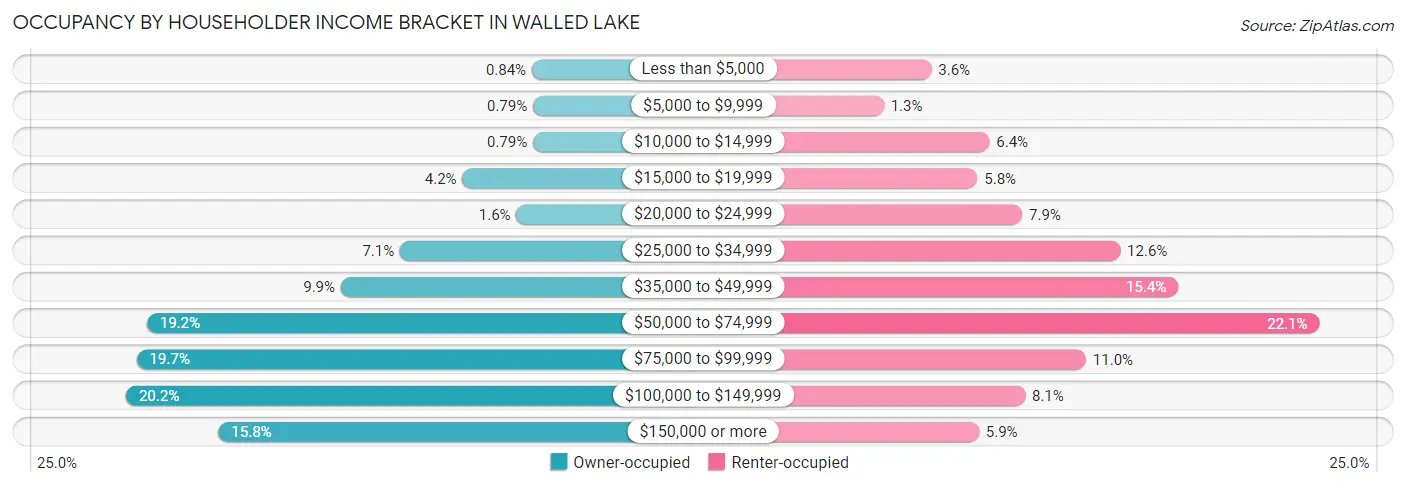
| Income Bracket | Owner-occupied | Renter-occupied |
| Less than $5,000 | 17 (0.8%) | 51 (3.6%) |
| $5,000 to $9,999 | 16 (0.8%) | 19 (1.3%) |
| $10,000 to $14,999 | 16 (0.8%) | 90 (6.4%) |
| $15,000 to $19,999 | 84 (4.2%) | 82 (5.8%) |
| $20,000 to $24,999 | 32 (1.6%) | 112 (7.9%) |
| $25,000 to $34,999 | 144 (7.1%) | 178 (12.6%) |
| $35,000 to $49,999 | 201 (9.9%) | 217 (15.4%) |
| $50,000 to $74,999 | 388 (19.2%) | 312 (22.1%) |
| $75,000 to $99,999 | 398 (19.7%) | 155 (11.0%) |
| $100,000 to $149,999 | 408 (20.2%) | 114 (8.1%) |
| $150,000 or more | 319 (15.8%) | 83 (5.9%) |
| Total | 2,023 (100.0%) | 1,413 (100.0%) |
Monthly Housing Cost Tiers in Walled Lake
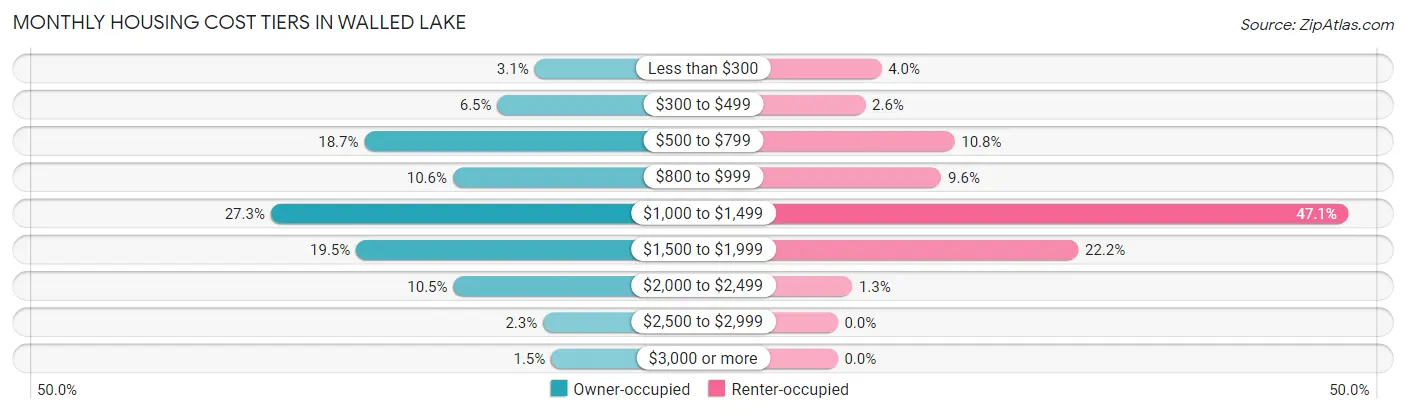
| Monthly Cost | Owner-occupied | Renter-occupied |
| Less than $300 | 62 (3.1%) | 57 (4.0%) |
| $300 to $499 | 131 (6.5%) | 36 (2.5%) |
| $500 to $799 | 379 (18.7%) | 152 (10.8%) |
| $800 to $999 | 214 (10.6%) | 135 (9.6%) |
| $1,000 to $1,499 | 553 (27.3%) | 665 (47.1%) |
| $1,500 to $1,999 | 394 (19.5%) | 313 (22.2%) |
| $2,000 to $2,499 | 213 (10.5%) | 19 (1.3%) |
| $2,500 to $2,999 | 46 (2.3%) | 0 (0.0%) |
| $3,000 or more | 31 (1.5%) | 0 (0.0%) |
| Total | 2,023 (100.0%) | 1,413 (100.0%) |
Physical Housing Characteristics in Walled Lake
Housing Structures in Walled Lake
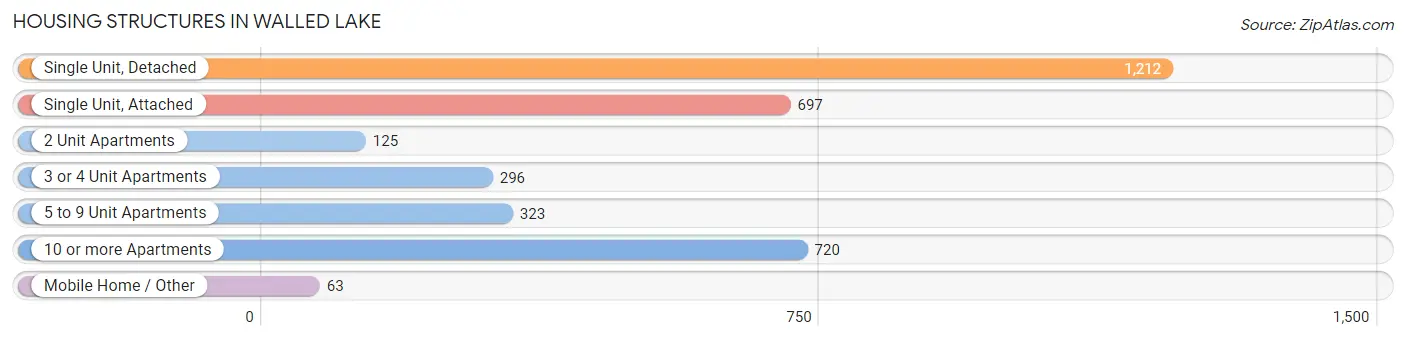
| Structure Type | # Housing Units | % Housing Units |
| Single Unit, Detached | 1,212 | 35.3% |
| Single Unit, Attached | 697 | 20.3% |
| 2 Unit Apartments | 125 | 3.6% |
| 3 or 4 Unit Apartments | 296 | 8.6% |
| 5 to 9 Unit Apartments | 323 | 9.4% |
| 10 or more Apartments | 720 | 20.9% |
| Mobile Home / Other | 63 | 1.8% |
| Total | 3,436 | 100.0% |
Housing Structures by Occupancy in Walled Lake
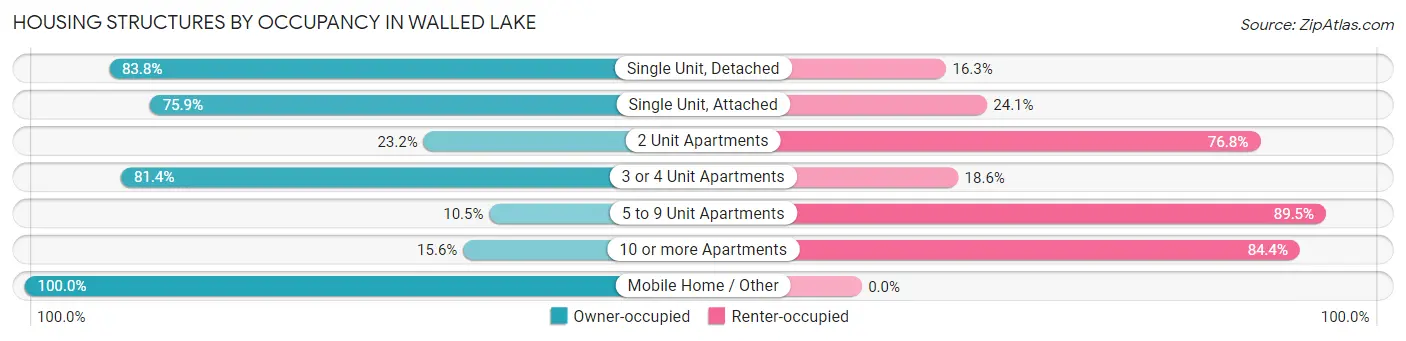
| Structure Type | Owner-occupied | Renter-occupied |
| Single Unit, Detached | 1,015 (83.8%) | 197 (16.3%) |
| Single Unit, Attached | 529 (75.9%) | 168 (24.1%) |
| 2 Unit Apartments | 29 (23.2%) | 96 (76.8%) |
| 3 or 4 Unit Apartments | 241 (81.4%) | 55 (18.6%) |
| 5 to 9 Unit Apartments | 34 (10.5%) | 289 (89.5%) |
| 10 or more Apartments | 112 (15.6%) | 608 (84.4%) |
| Mobile Home / Other | 63 (100.0%) | 0 (0.0%) |
| Total | 2,023 (58.9%) | 1,413 (41.1%) |
Housing Structures by Number of Rooms in Walled Lake
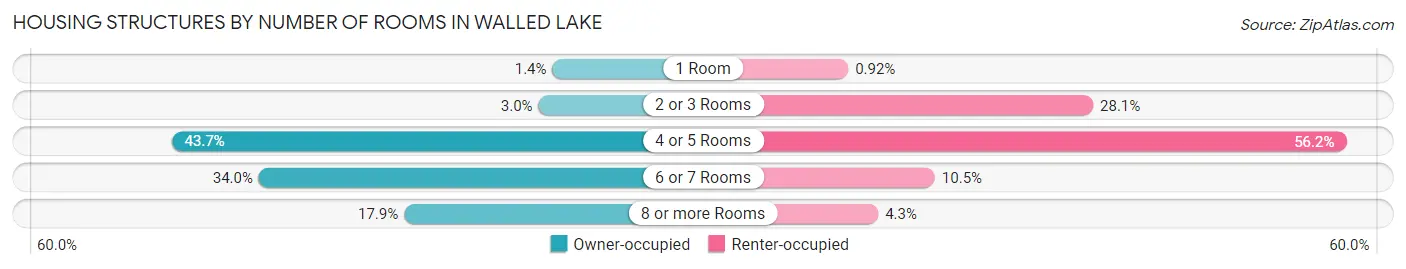
| Number of Rooms | Owner-occupied | Renter-occupied |
| 1 Room | 29 (1.4%) | 13 (0.9%) |
| 2 or 3 Rooms | 60 (3.0%) | 397 (28.1%) |
| 4 or 5 Rooms | 884 (43.7%) | 794 (56.2%) |
| 6 or 7 Rooms | 688 (34.0%) | 149 (10.5%) |
| 8 or more Rooms | 362 (17.9%) | 60 (4.3%) |
| Total | 2,023 (100.0%) | 1,413 (100.0%) |
Housing Structure by Heating Type in Walled Lake
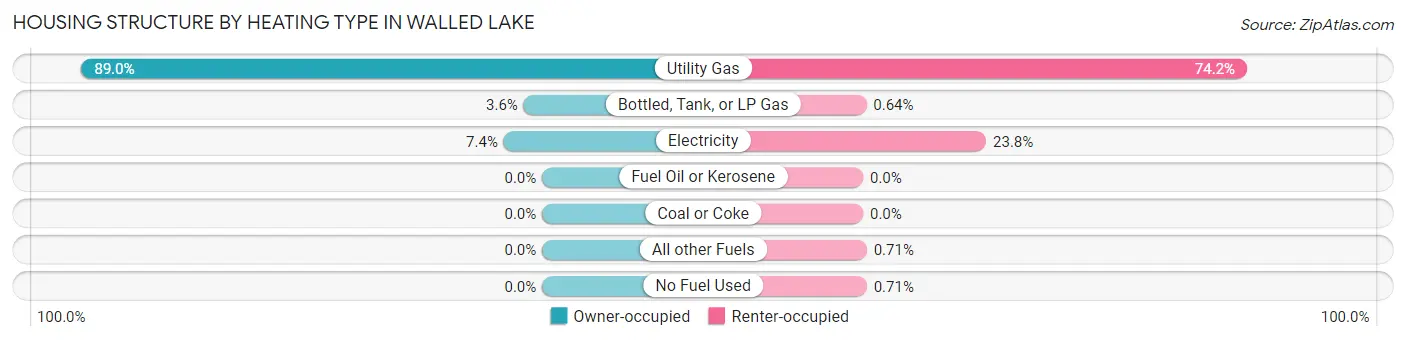
| Heating Type | Owner-occupied | Renter-occupied |
| Utility Gas | 1,801 (89.0%) | 1,048 (74.2%) |
| Bottled, Tank, or LP Gas | 72 (3.6%) | 9 (0.6%) |
| Electricity | 150 (7.4%) | 336 (23.8%) |
| Fuel Oil or Kerosene | 0 (0.0%) | 0 (0.0%) |
| Coal or Coke | 0 (0.0%) | 0 (0.0%) |
| All other Fuels | 0 (0.0%) | 10 (0.7%) |
| No Fuel Used | 0 (0.0%) | 10 (0.7%) |
| Total | 2,023 (100.0%) | 1,413 (100.0%) |
Household Vehicle Usage in Walled Lake
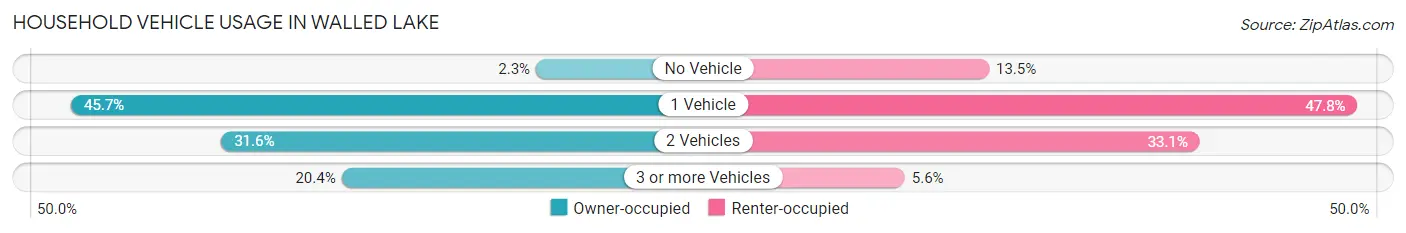
| Vehicles per Household | Owner-occupied | Renter-occupied |
| No Vehicle | 46 (2.3%) | 190 (13.5%) |
| 1 Vehicle | 924 (45.7%) | 676 (47.8%) |
| 2 Vehicles | 640 (31.6%) | 468 (33.1%) |
| 3 or more Vehicles | 413 (20.4%) | 79 (5.6%) |
| Total | 2,023 (100.0%) | 1,413 (100.0%) |
Real Estate & Mortgages in Walled Lake
Real Estate and Mortgage Overview in Walled Lake
| Characteristic | Without Mortgage | With Mortgage |
| Housing Units | 591 | 1,432 |
| Median Property Value | $159,300 | $206,900 |
| Median Household Income | $53,125 | $248 |
| Monthly Housing Costs | $561 | $31 |
| Real Estate Taxes | $2,149 | $45 |
Property Value by Mortgage Status in Walled Lake
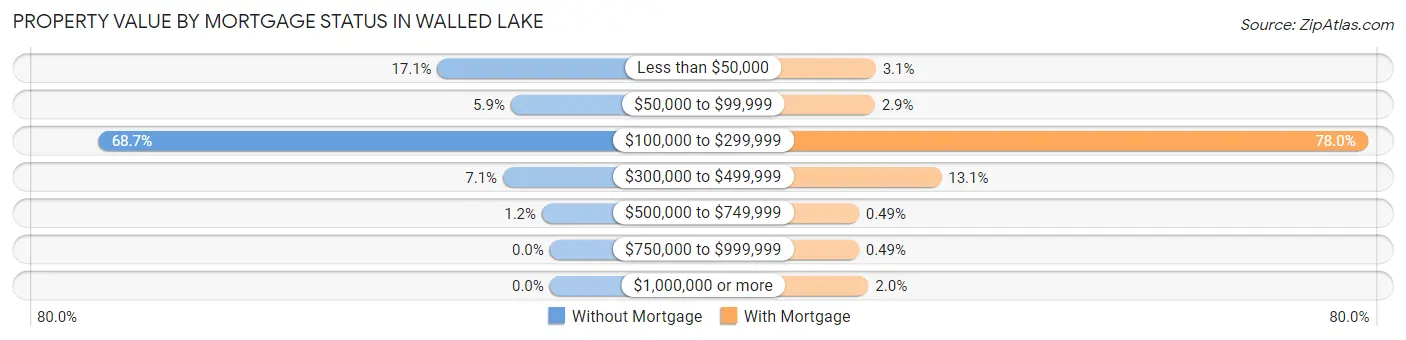
| Property Value | Without Mortgage | With Mortgage |
| Less than $50,000 | 101 (17.1%) | 44 (3.1%) |
| $50,000 to $99,999 | 35 (5.9%) | 42 (2.9%) |
| $100,000 to $299,999 | 406 (68.7%) | 1,117 (78.0%) |
| $300,000 to $499,999 | 42 (7.1%) | 187 (13.1%) |
| $500,000 to $749,999 | 7 (1.2%) | 7 (0.5%) |
| $750,000 to $999,999 | 0 (0.0%) | 7 (0.5%) |
| $1,000,000 or more | 0 (0.0%) | 28 (2.0%) |
| Total | 591 (100.0%) | 1,432 (100.0%) |
Household Income by Mortgage Status in Walled Lake
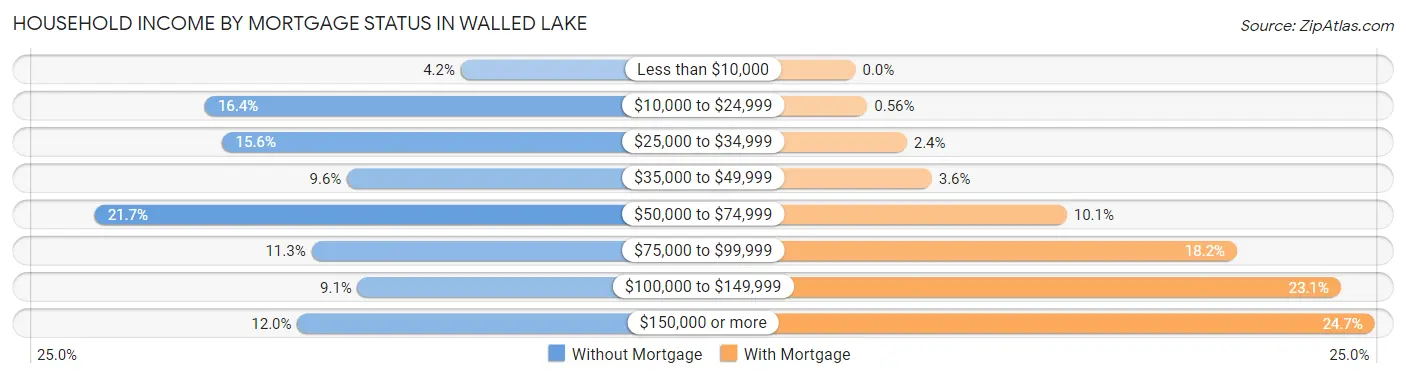
| Household Income | Without Mortgage | With Mortgage |
| Less than $10,000 | 25 (4.2%) | 0 (0.0%) |
| $10,000 to $24,999 | 97 (16.4%) | 8 (0.6%) |
| $25,000 to $34,999 | 92 (15.6%) | 35 (2.4%) |
| $35,000 to $49,999 | 57 (9.6%) | 52 (3.6%) |
| $50,000 to $74,999 | 128 (21.7%) | 144 (10.1%) |
| $75,000 to $99,999 | 67 (11.3%) | 260 (18.2%) |
| $100,000 to $149,999 | 54 (9.1%) | 331 (23.1%) |
| $150,000 or more | 71 (12.0%) | 354 (24.7%) |
| Total | 591 (100.0%) | 1,432 (100.0%) |
Property Value to Household Income Ratio in Walled Lake
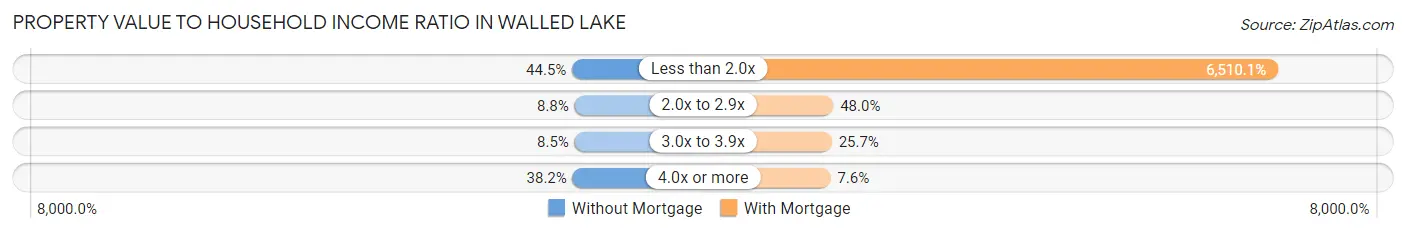
| Value-to-Income Ratio | Without Mortgage | With Mortgage |
| Less than 2.0x | 263 (44.5%) | 93,224 (6,510.1%) |
| 2.0x to 2.9x | 52 (8.8%) | 688 (48.0%) |
| 3.0x to 3.9x | 50 (8.5%) | 368 (25.7%) |
| 4.0x or more | 226 (38.2%) | 109 (7.6%) |
| Total | 591 (100.0%) | 1,432 (100.0%) |
Real Estate Taxes by Mortgage Status in Walled Lake
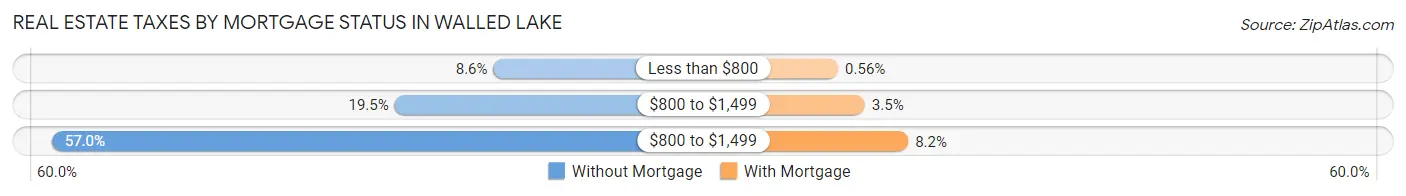
| Property Taxes | Without Mortgage | With Mortgage |
| Less than $800 | 51 (8.6%) | 8 (0.6%) |
| $800 to $1,499 | 115 (19.5%) | 50 (3.5%) |
| $800 to $1,499 | 337 (57.0%) | 118 (8.2%) |
| Total | 591 (100.0%) | 1,432 (100.0%) |
Health & Disability in Walled Lake
Health Insurance Coverage by Age in Walled Lake
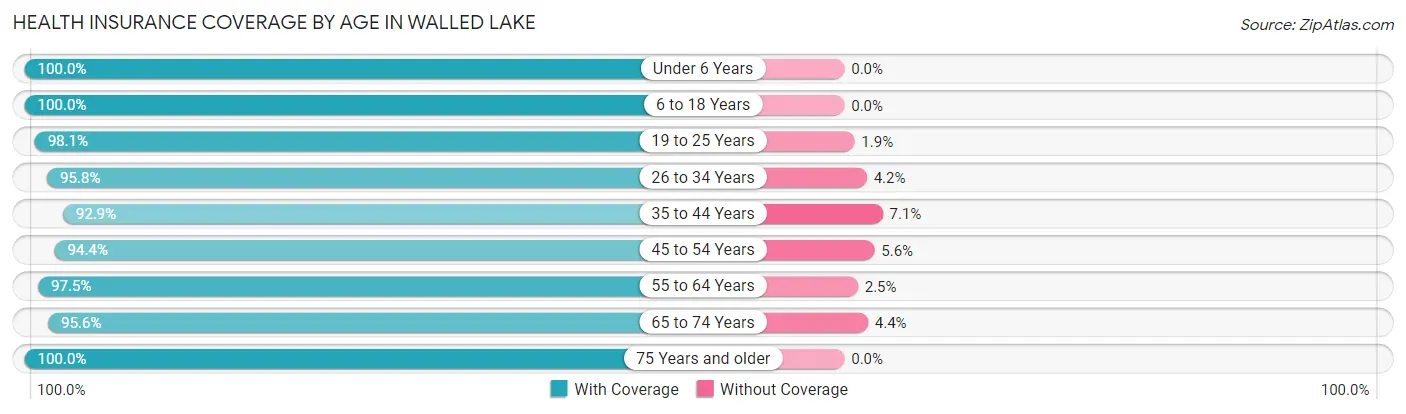
| Age Bracket | With Coverage | Without Coverage |
| Under 6 Years | 305 (100.0%) | 0 (0.0%) |
| 6 to 18 Years | 1,107 (100.0%) | 0 (0.0%) |
| 19 to 25 Years | 415 (98.1%) | 8 (1.9%) |
| 26 to 34 Years | 1,008 (95.8%) | 44 (4.2%) |
| 35 to 44 Years | 897 (92.9%) | 69 (7.1%) |
| 45 to 54 Years | 1,231 (94.4%) | 73 (5.6%) |
| 55 to 64 Years | 972 (97.5%) | 25 (2.5%) |
| 65 to 74 Years | 545 (95.6%) | 25 (4.4%) |
| 75 Years and older | 538 (100.0%) | 0 (0.0%) |
| Total | 7,018 (96.6%) | 244 (3.4%) |
Health Insurance Coverage by Citizenship Status in Walled Lake
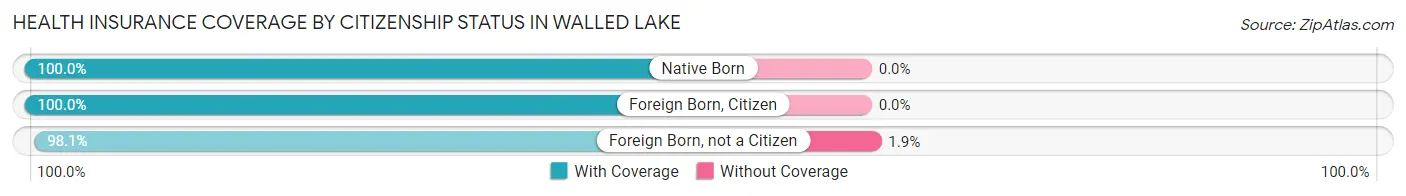
| Citizenship Status | With Coverage | Without Coverage |
| Native Born | 305 (100.0%) | 0 (0.0%) |
| Foreign Born, Citizen | 1,107 (100.0%) | 0 (0.0%) |
| Foreign Born, not a Citizen | 415 (98.1%) | 8 (1.9%) |
Health Insurance Coverage by Household Income in Walled Lake
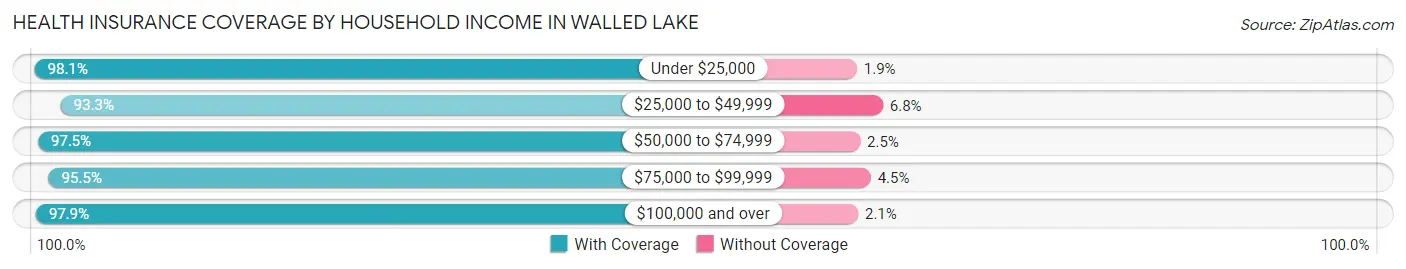
| Household Income | With Coverage | Without Coverage |
| Under $25,000 | 783 (98.1%) | 15 (1.9%) |
| $25,000 to $49,999 | 1,161 (93.2%) | 84 (6.8%) |
| $50,000 to $74,999 | 1,372 (97.5%) | 35 (2.5%) |
| $75,000 to $99,999 | 1,194 (95.5%) | 56 (4.5%) |
| $100,000 and over | 2,508 (97.9%) | 54 (2.1%) |
Public vs Private Health Insurance Coverage by Age in Walled Lake
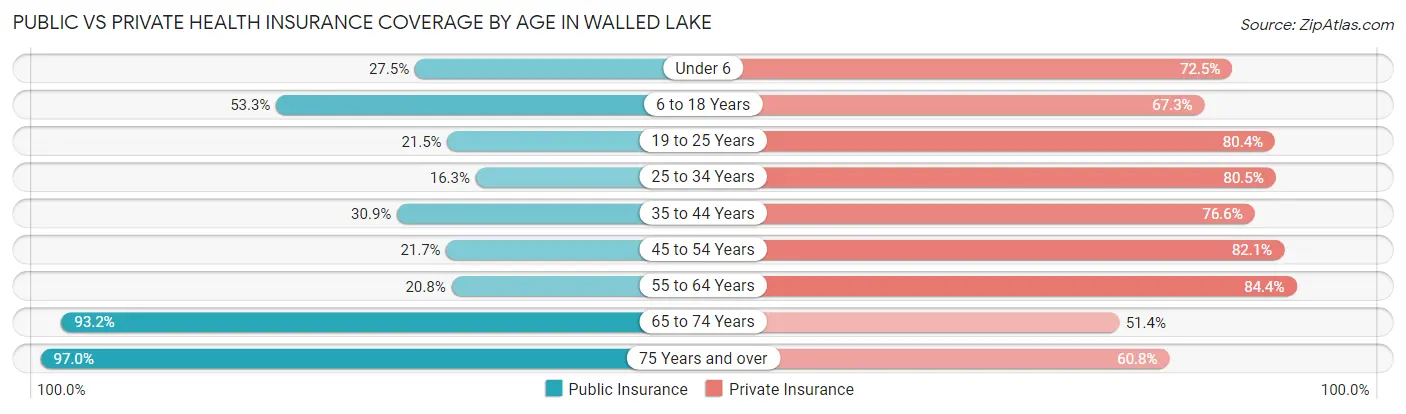
| Age Bracket | Public Insurance | Private Insurance |
| Under 6 | 84 (27.5%) | 221 (72.5%) |
| 6 to 18 Years | 590 (53.3%) | 745 (67.3%) |
| 19 to 25 Years | 91 (21.5%) | 340 (80.4%) |
| 25 to 34 Years | 171 (16.3%) | 847 (80.5%) |
| 35 to 44 Years | 298 (30.8%) | 740 (76.6%) |
| 45 to 54 Years | 283 (21.7%) | 1,070 (82.1%) |
| 55 to 64 Years | 207 (20.8%) | 841 (84.4%) |
| 65 to 74 Years | 531 (93.2%) | 293 (51.4%) |
| 75 Years and over | 522 (97.0%) | 327 (60.8%) |
| Total | 2,777 (38.2%) | 5,424 (74.7%) |
Disability Status by Sex by Age in Walled Lake
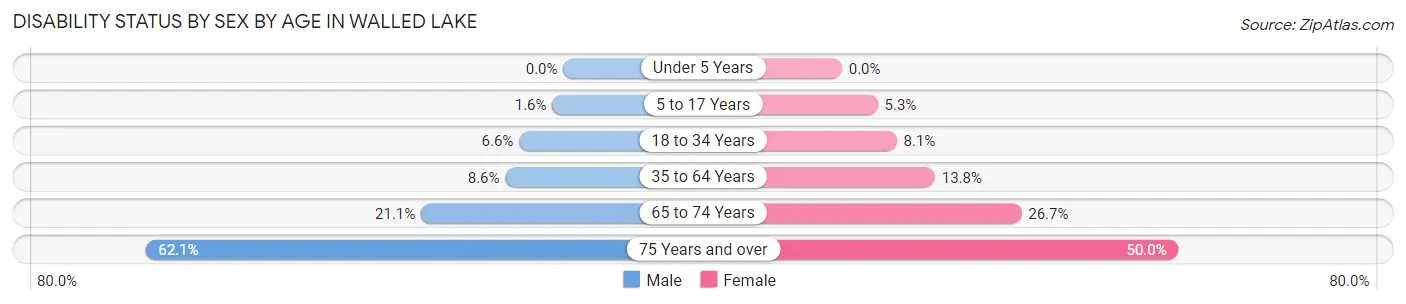
| Age Bracket | Male | Female |
| Under 5 Years | 0 (0.0%) | 0 (0.0%) |
| 5 to 17 Years | 8 (1.6%) | 32 (5.3%) |
| 18 to 34 Years | 51 (6.6%) | 62 (8.1%) |
| 35 to 64 Years | 141 (8.6%) | 225 (13.8%) |
| 65 to 74 Years | 53 (21.1%) | 85 (26.7%) |
| 75 Years and over | 108 (62.1%) | 182 (50.0%) |
Disability Class by Sex by Age in Walled Lake
Disability Class: Hearing Difficulty
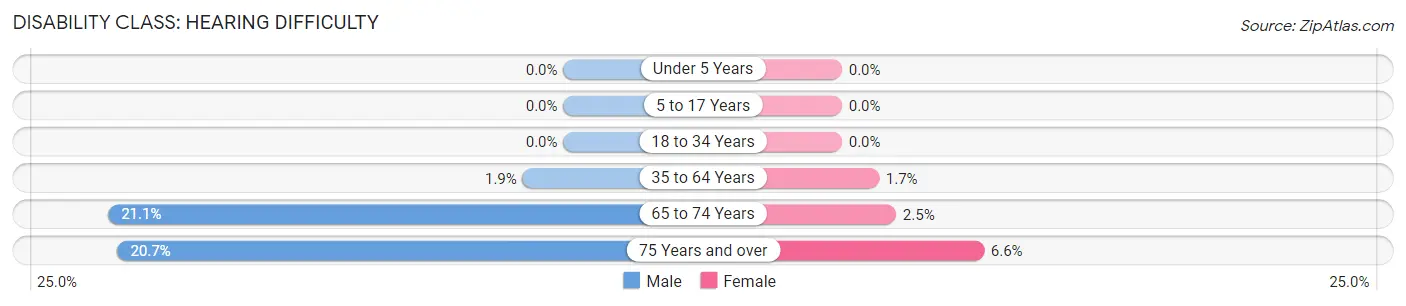
| Age Bracket | Male | Female |
| Under 5 Years | 0 (0.0%) | 0 (0.0%) |
| 5 to 17 Years | 0 (0.0%) | 0 (0.0%) |
| 18 to 34 Years | 0 (0.0%) | 0 (0.0%) |
| 35 to 64 Years | 31 (1.9%) | 28 (1.7%) |
| 65 to 74 Years | 53 (21.1%) | 8 (2.5%) |
| 75 Years and over | 36 (20.7%) | 24 (6.6%) |
Disability Class: Vision Difficulty
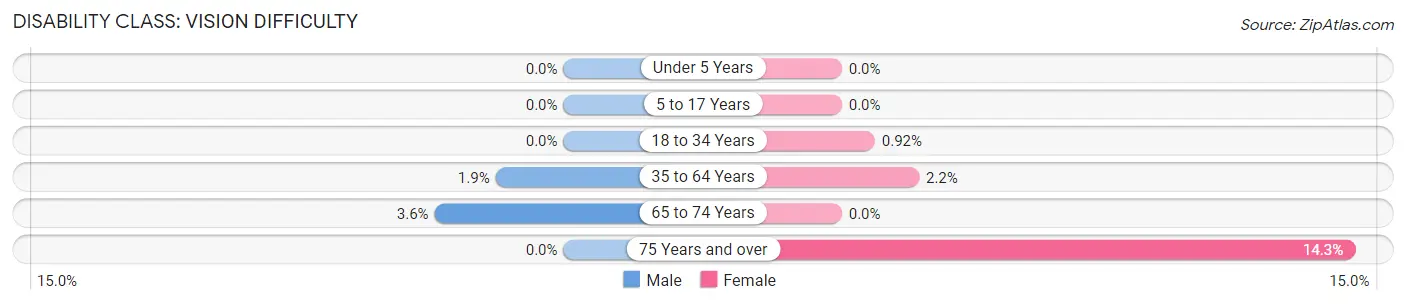
| Age Bracket | Male | Female |
| Under 5 Years | 0 (0.0%) | 0 (0.0%) |
| 5 to 17 Years | 0 (0.0%) | 0 (0.0%) |
| 18 to 34 Years | 0 (0.0%) | 7 (0.9%) |
| 35 to 64 Years | 31 (1.9%) | 35 (2.1%) |
| 65 to 74 Years | 9 (3.6%) | 0 (0.0%) |
| 75 Years and over | 0 (0.0%) | 52 (14.3%) |
Disability Class: Cognitive Difficulty
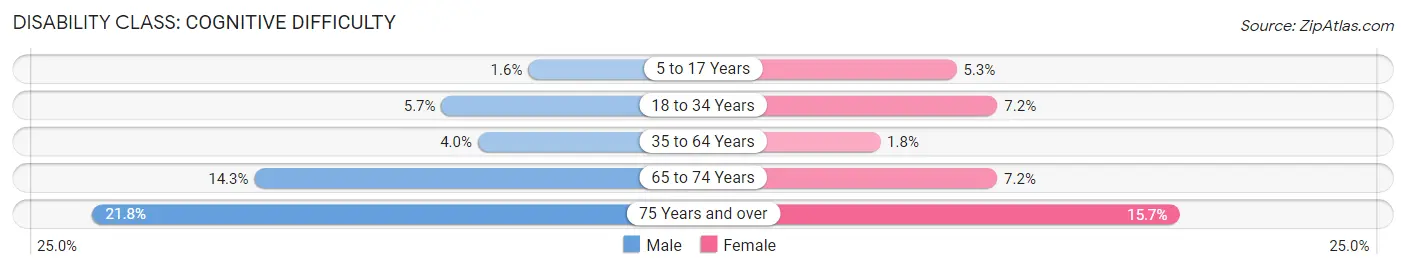
| Age Bracket | Male | Female |
| 5 to 17 Years | 8 (1.6%) | 32 (5.3%) |
| 18 to 34 Years | 44 (5.7%) | 55 (7.2%) |
| 35 to 64 Years | 65 (4.0%) | 29 (1.8%) |
| 65 to 74 Years | 36 (14.3%) | 23 (7.2%) |
| 75 Years and over | 38 (21.8%) | 57 (15.7%) |
Disability Class: Ambulatory Difficulty
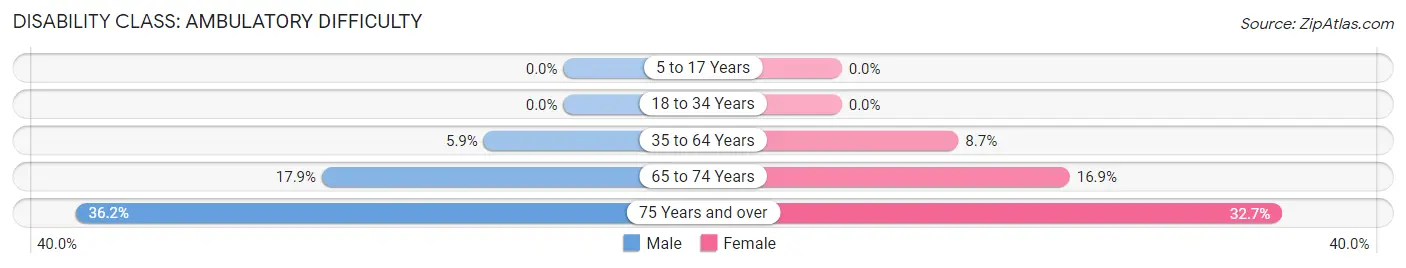
| Age Bracket | Male | Female |
| 5 to 17 Years | 0 (0.0%) | 0 (0.0%) |
| 18 to 34 Years | 0 (0.0%) | 0 (0.0%) |
| 35 to 64 Years | 97 (5.9%) | 141 (8.7%) |
| 65 to 74 Years | 45 (17.9%) | 54 (16.9%) |
| 75 Years and over | 63 (36.2%) | 119 (32.7%) |
Disability Class: Self-Care Difficulty
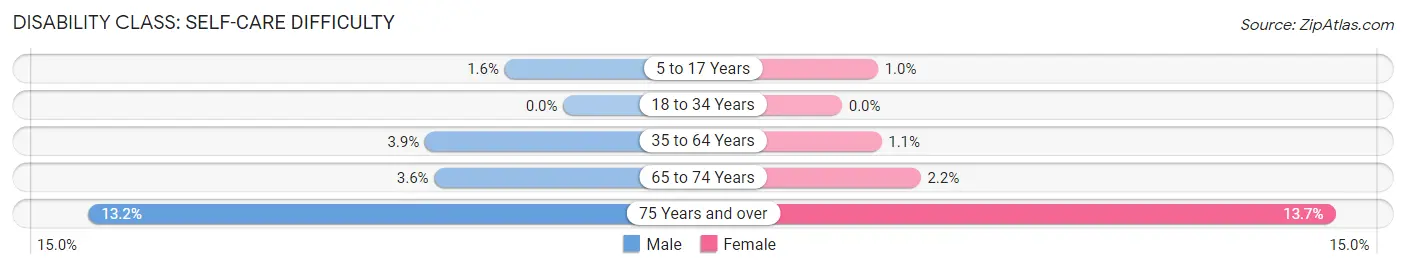
| Age Bracket | Male | Female |
| 5 to 17 Years | 8 (1.6%) | 6 (1.0%) |
| 18 to 34 Years | 0 (0.0%) | 0 (0.0%) |
| 35 to 64 Years | 63 (3.8%) | 18 (1.1%) |
| 65 to 74 Years | 9 (3.6%) | 7 (2.2%) |
| 75 Years and over | 23 (13.2%) | 50 (13.7%) |
Technology Access in Walled Lake
Computing Device Access in Walled Lake
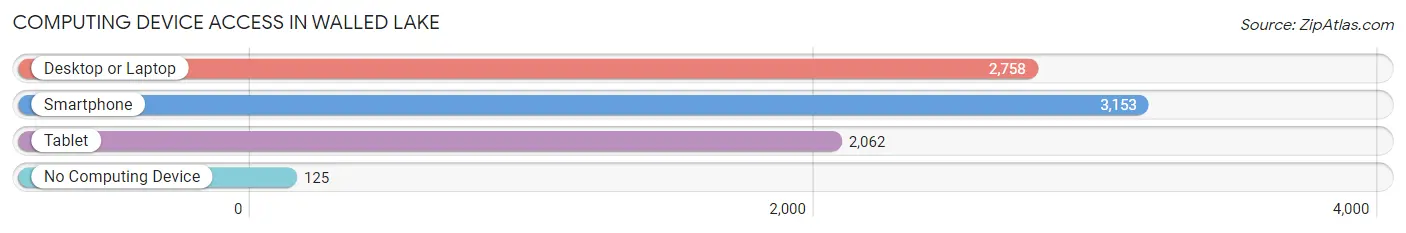
| Device Type | # Households | % Households |
| Desktop or Laptop | 2,758 | 80.3% |
| Smartphone | 3,153 | 91.8% |
| Tablet | 2,062 | 60.0% |
| No Computing Device | 125 | 3.6% |
| Total | 3,436 | 100.0% |
Internet Access in Walled Lake
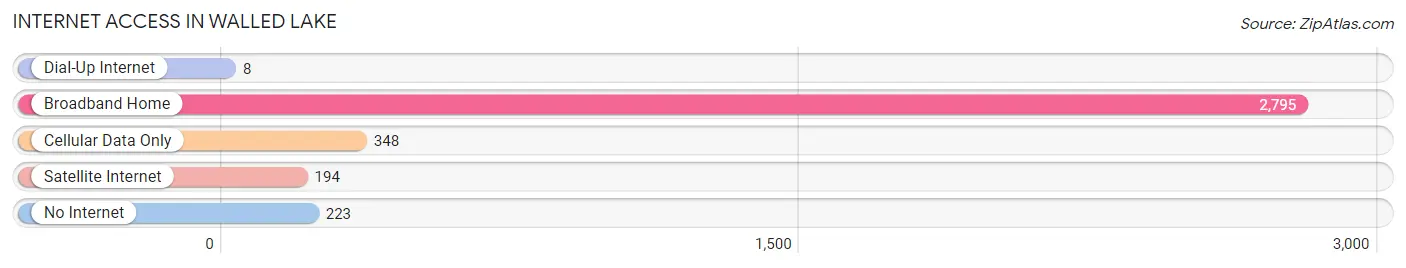
| Internet Type | # Households | % Households |
| Dial-Up Internet | 8 | 0.2% |
| Broadband Home | 2,795 | 81.3% |
| Cellular Data Only | 348 | 10.1% |
| Satellite Internet | 194 | 5.7% |
| No Internet | 223 | 6.5% |
| Total | 3,436 | 100.0% |
Walled Lake Summary
Walled Lake is a city located in Oakland County, Michigan, United States. It is a suburb of Detroit and is located about 20 miles northwest of the city. The population was 6,999 at the 2010 census.
History
The area that is now Walled Lake was originally inhabited by the Potawatomi Native Americans. The first white settlers arrived in the area in 1825. The area was named after Walled Lake, a small lake located in the area. The lake was named for the wall-like structure of logs that were placed around it to keep out predators.
In 1832, the first post office was established in the area. The first school was built in 1836. The first church was built in 1845.
In 1855, the first railroad line was built through the area. This allowed for the development of the area and the growth of the population.
In 1871 the village of Walled Lake was incorporated The village was named after the lake
In the late 19th century, the area became a popular resort destination. Several hotels and resorts were built in the area.
In the early 20th century, the area began to develop into a residential community. The population grew steadily throughout the century.
Geography
Walled Lake is located at 42°35′N 83°30′W (42.58, -83.50). According to the United States Census Bureau, the city has a total area of 3.2 square miles (8.3 km2), of which 3.1 square miles (8.0 km2) is land and 0.1 square miles (0.3 km2) (2.90%) is water.
Economy
The economy of Walled Lake is largely based on the service industry. The city is home to several restaurants, retail stores, and other businesses. The city is also home to several manufacturing companies, including automotive parts suppliers.
Demographics
As of the census of 2010, there were 6,999 people, 2,845 households, and 1,845 families residing in the city. The population density was 2,269.2 people per square mile (876.7/km2). There were 3,068 housing units at an average density of 990.2 per square mile (382.2/km2). The racial makeup of the city was 87.2% White, 5.2% African American, 0.4% Native American, 2.2% Asian, 0.1% Pacific Islander, 2.3% from other races, and 2.7% from two or more races. Hispanic or Latino of any race were 6.2% of the population.
There were 2,845 households, out of which 28.2% had children under the age of 18 living with them, 48.2% were married couples living together, 11.3% had a female householder with no husband present, and 36.2% were non-families. 30.2% of all households were made up of individuals, and 9.2% had someone living alone who was 65 years of age or older. The average household size was 2.45 and the average family size was 3.09.
In the city, the population was spread out, with 23.2% under the age of 18, 8.2% from 18 to 24, 30.2% from 25 to 44, 25.2% from 45 to 64, and 13.2% who were 65 years of age or older. The median age was 37 years. For every 100 females, there were 94.2 males. For every 100 females age 18 and over, there were 91.2 males.
The median income for a household in the city was $50,945, and the median income for a family was $62,917. Males had a median income of $45,917 versus $31,917 for females. The per capita income for the city was $25,945. About 4.2% of families and 6.2% of the population were below the poverty line, including 8.2% of those under age 18 and 4.2% of those age 65 or over.
Common Questions
What is Per Capita Income in Walled Lake?
Per Capita income in Walled Lake is $41,617.
What is the Median Family Income in Walled Lake?
Median Family Income in Walled Lake is $85,205.
What is the Median Household income in Walled Lake?
Median Household Income in Walled Lake is $65,031.
What is Income or Wage Gap in Walled Lake?
Income or Wage Gap in Walled Lake is 29.4%.
Women in Walled Lake earn 70.6 cents for every dollar earned by a man.
What is Inequality or Gini Index in Walled Lake?
Inequality or Gini Index in Walled Lake is 0.44.
What is the Total Population of Walled Lake?
Total Population of Walled Lake is 7,262.
What is the Total Male Population of Walled Lake?
Total Male Population of Walled Lake is 3,531.
What is the Total Female Population of Walled Lake?
Total Female Population of Walled Lake is 3,731.
What is the Ratio of Males per 100 Females in Walled Lake?
There are 94.64 Males per 100 Females in Walled Lake.
What is the Ratio of Females per 100 Males in Walled Lake?
There are 105.66 Females per 100 Males in Walled Lake.
What is the Median Population Age in Walled Lake?
Median Population Age in Walled Lake is 42.1 Years.
What is the Average Family Size in Walled Lake
Average Family Size in Walled Lake is 3.0 People.
What is the Average Household Size in Walled Lake
Average Household Size in Walled Lake is 2.1 People.
How Large is the Labor Force in Walled Lake?
There are 4,398 People in the Labor Forcein in Walled Lake.
What is the Percentage of People in the Labor Force in Walled Lake?
72.0% of People are in the Labor Force in Walled Lake.
What is the Unemployment Rate in Walled Lake?
Unemployment Rate in Walled Lake is 2.4%.