Ashland City, TN Map & Demographics
Ashland City Map
Ashland City Overview
$38,625
PER CAPITA INCOME
$73,893
AVG FAMILY INCOME
$69,974
AVG HOUSEHOLD INCOME
31.6%
WAGE / INCOME GAP [ % ]
68.4¢/ $1
WAGE / INCOME GAP [ $ ]
0.48
INEQUALITY / GINI INDEX
5,213
TOTAL POPULATION
2,483
MALE POPULATION
2,730
FEMALE POPULATION
90.95
MALES / 100 FEMALES
109.95
FEMALES / 100 MALES
40.3
MEDIAN AGE
3.2
AVG FAMILY SIZE
2.5
AVG HOUSEHOLD SIZE
2,754
LABOR FORCE [ PEOPLE ]
65.6%
PERCENT IN LABOR FORCE
4.9%
UNEMPLOYMENT RATE
Ashland City Zip Codes
Ashland City Area Codes
Income in Ashland City
Income Overview in Ashland City
Per Capita Income in Ashland City is $38,625, while median incomes of families and households are $73,893 and $69,974 respectively.
| Characteristic | Number | Measure |
| Per Capita Income | 5,213 | $38,625 |
| Median Family Income | 1,201 | $73,893 |
| Mean Family Income | 1,201 | $121,319 |
| Median Household Income | 1,995 | $69,974 |
| Mean Household Income | 1,995 | $100,066 |
| Income Deficit | 1,201 | $0 |
| Wage / Income Gap (%) | 5,213 | 31.65% |
| Wage / Income Gap ($) | 5,213 | 68.35¢ per $1 |
| Gini / Inequality Index | 5,213 | 0.48 |
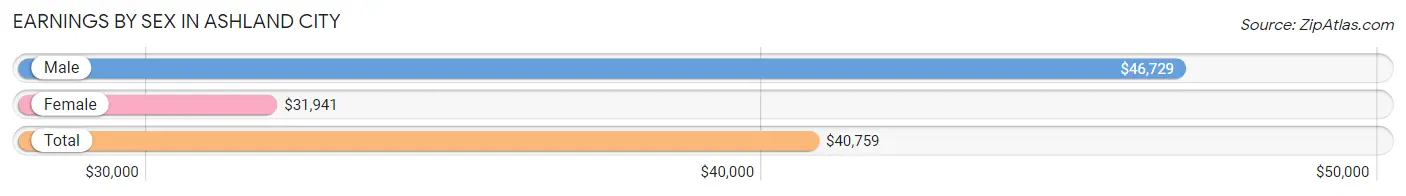
Earnings by Sex in Ashland City
Average Earnings in Ashland City are $40,759, $46,729 for men and $31,941 for women, a difference of 31.7%.
| Sex | Number | Average Earnings |
| Male | 1,582 (53.8%) | $46,729 |
| Female | 1,357 (46.2%) | $31,941 |
| Total | 2,939 (100.0%) | $40,759 |
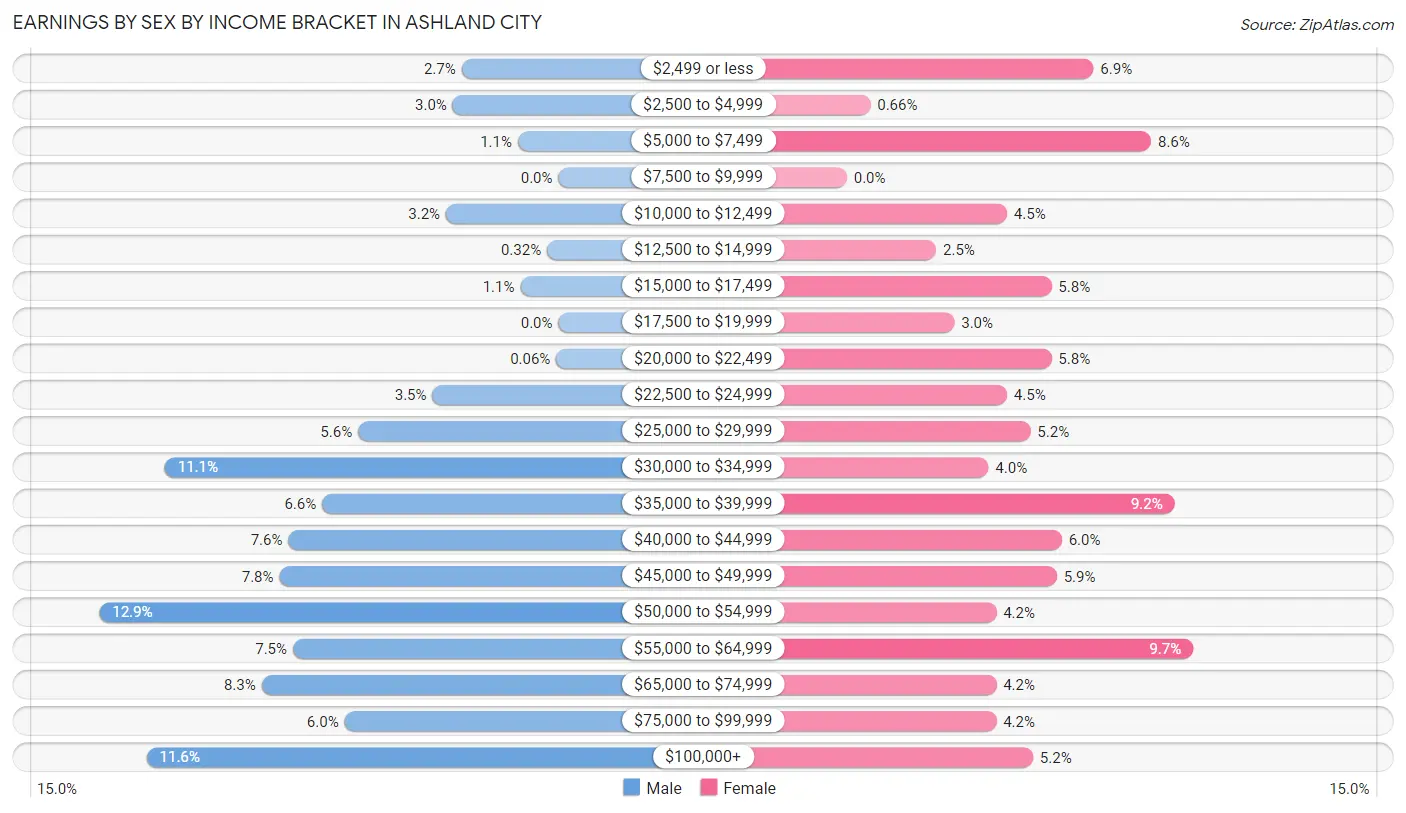
Earnings by Sex by Income Bracket in Ashland City
The most common earnings brackets in Ashland City are $50,000 to $54,999 for men (204 | 12.9%) and $55,000 to $64,999 for women (132 | 9.7%).
| Income | Male | Female |
| $2,499 or less | 43 (2.7%) | 94 (6.9%) |
| $2,500 to $4,999 | 47 (3.0%) | 9 (0.7%) |
| $5,000 to $7,499 | 18 (1.1%) | 116 (8.6%) |
| $7,500 to $9,999 | 0 (0.0%) | 0 (0.0%) |
| $10,000 to $12,499 | 50 (3.2%) | 61 (4.5%) |
| $12,500 to $14,999 | 5 (0.3%) | 34 (2.5%) |
| $15,000 to $17,499 | 17 (1.1%) | 78 (5.8%) |
| $17,500 to $19,999 | 0 (0.0%) | 41 (3.0%) |
| $20,000 to $22,499 | 1 (0.1%) | 78 (5.8%) |
| $22,500 to $24,999 | 56 (3.5%) | 61 (4.5%) |
| $25,000 to $29,999 | 89 (5.6%) | 70 (5.2%) |
| $30,000 to $34,999 | 175 (11.1%) | 54 (4.0%) |
| $35,000 to $39,999 | 105 (6.6%) | 125 (9.2%) |
| $40,000 to $44,999 | 120 (7.6%) | 82 (6.0%) |
| $45,000 to $49,999 | 124 (7.8%) | 80 (5.9%) |
| $50,000 to $54,999 | 204 (12.9%) | 57 (4.2%) |
| $55,000 to $64,999 | 118 (7.5%) | 132 (9.7%) |
| $65,000 to $74,999 | 132 (8.3%) | 57 (4.2%) |
| $75,000 to $99,999 | 95 (6.0%) | 57 (4.2%) |
| $100,000+ | 183 (11.6%) | 71 (5.2%) |
| Total | 1,582 (100.0%) | 1,357 (100.0%) |
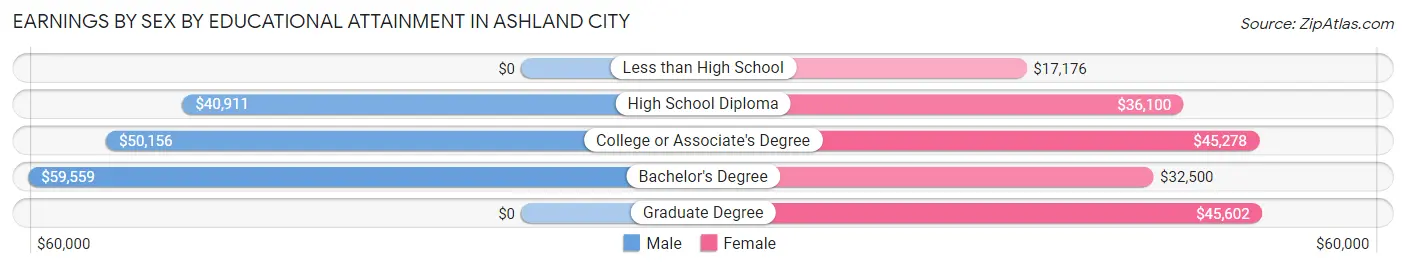
Earnings by Sex by Educational Attainment in Ashland City
Average earnings in Ashland City are $47,021 for men and $36,476 for women, a difference of 22.4%. Men with an educational attainment of bachelor's degree enjoy the highest average annual earnings of $59,559, while those with high school diploma education earn the least with $40,911. Women with an educational attainment of graduate degree earn the most with the average annual earnings of $45,602, while those with less than high school education have the smallest earnings of $17,176.
| Educational Attainment | Male Income | Female Income |
| Less than High School | - | - |
| High School Diploma | $40,911 | $36,100 |
| College or Associate's Degree | $50,156 | $45,278 |
| Bachelor's Degree | $59,559 | $32,500 |
| Graduate Degree | - | - |
| Total | $47,021 | $36,476 |
Family Income in Ashland City
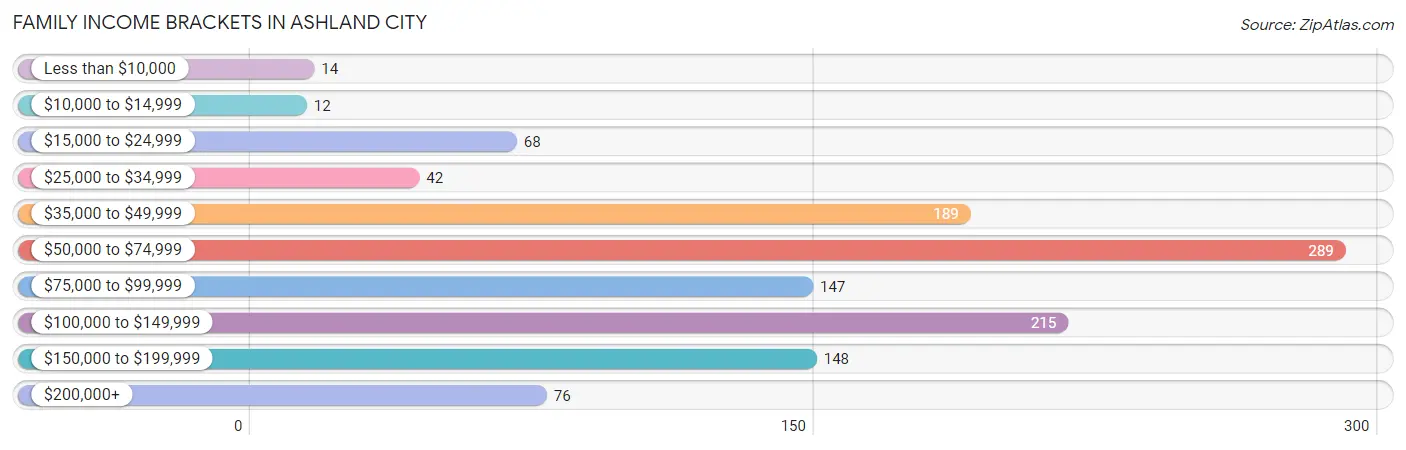
Family Income Brackets in Ashland City
According to the Ashland City family income data, there are 289 families falling into the $50,000 to $74,999 income range, which is the most common income bracket and makes up 24.1% of all families. Conversely, the $10,000 to $14,999 income bracket is the least frequent group with only 12 families (1.0%) belonging to this category.
| Income Bracket | # Families | % Families |
| Less than $10,000 | 14 | 1.2% |
| $10,000 to $14,999 | 12 | 1.0% |
| $15,000 to $24,999 | 68 | 5.7% |
| $25,000 to $34,999 | 42 | 3.5% |
| $35,000 to $49,999 | 189 | 15.7% |
| $50,000 to $74,999 | 289 | 24.1% |
| $75,000 to $99,999 | 147 | 12.2% |
| $100,000 to $149,999 | 215 | 17.9% |
| $150,000 to $199,999 | 148 | 12.3% |
| $200,000+ | 76 | 6.3% |
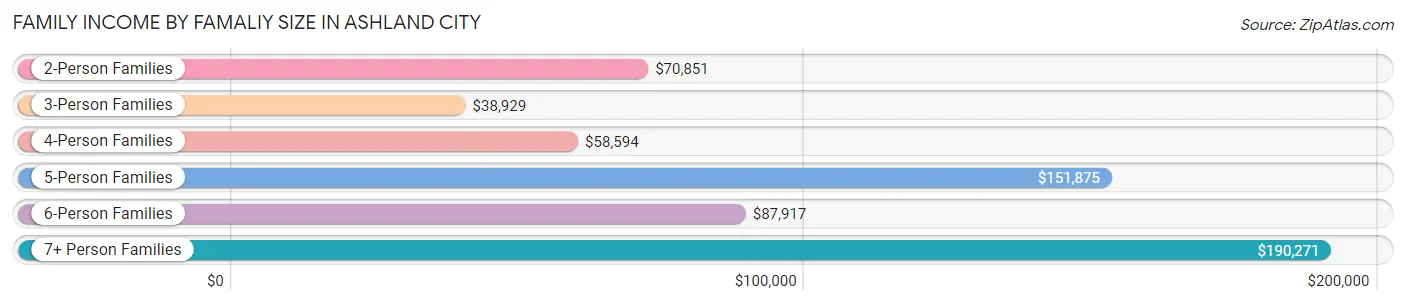
Family Income by Famaliy Size in Ashland City
7+ person families (107 | 8.9%) account for the highest median family income in Ashland City with $190,271 per family, while 2-person families (604 | 50.3%) have the highest median income of $35,426 per family member.
| Income Bracket | # Families | Median Income |
| 2-Person Families | 604 (50.3%) | $70,851 |
| 3-Person Families | 260 (21.6%) | $38,929 |
| 4-Person Families | 67 (5.6%) | $58,594 |
| 5-Person Families | 120 (10.0%) | $151,875 |
| 6-Person Families | 43 (3.6%) | $87,917 |
| 7+ Person Families | 107 (8.9%) | $190,271 |
| Total | 1,201 (100.0%) | $73,893 |
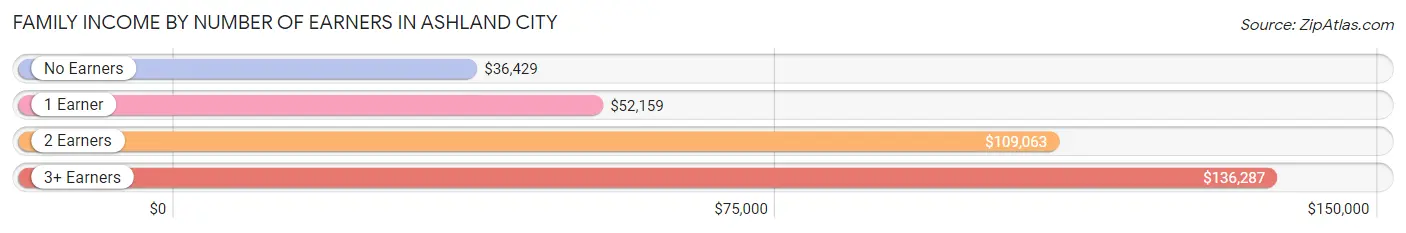
Family Income by Number of Earners in Ashland City
The median family income in Ashland City is $73,893, with families comprising 3+ earners (181) having the highest median family income of $136,287, while families with no earners (118) have the lowest median family income of $36,429, accounting for 15.1% and 9.8% of families, respectively.
| Number of Earners | # Families | Median Income |
| No Earners | 118 (9.8%) | $36,429 |
| 1 Earner | 447 (37.2%) | $52,159 |
| 2 Earners | 455 (37.9%) | $109,063 |
| 3+ Earners | 181 (15.1%) | $136,287 |
| Total | 1,201 (100.0%) | $73,893 |
Household Income in Ashland City
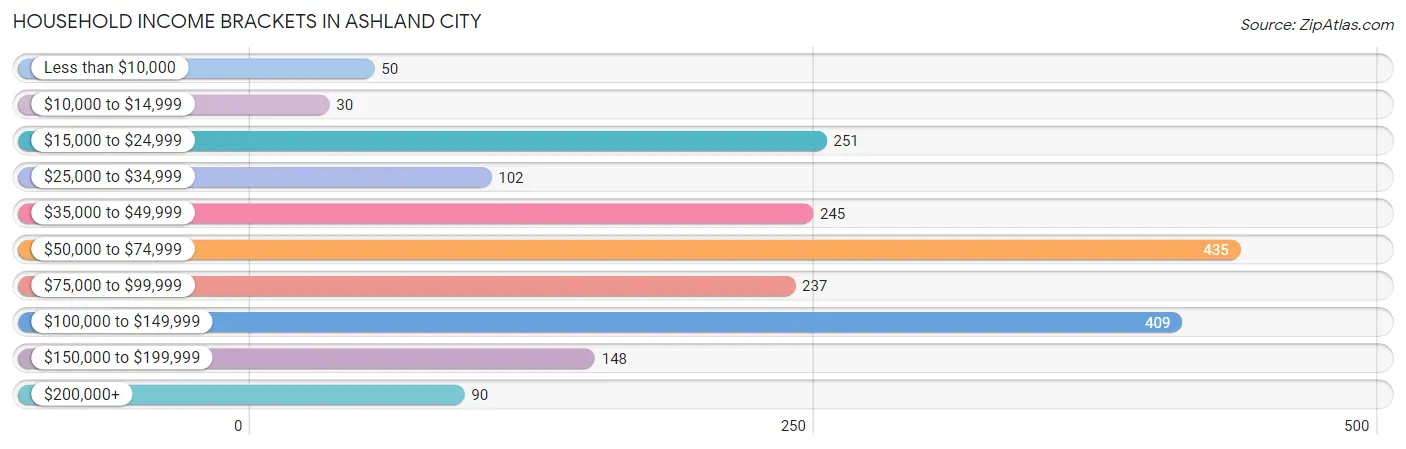
Household Income Brackets in Ashland City
With 435 households falling in the category, the $50,000 to $74,999 income range is the most frequent in Ashland City, accounting for 21.8% of all households. In contrast, only 30 households (1.5%) fall into the $10,000 to $14,999 income bracket, making it the least populous group.
| Income Bracket | # Households | % Households |
| Less than $10,000 | 50 | 2.5% |
| $10,000 to $14,999 | 30 | 1.5% |
| $15,000 to $24,999 | 251 | 12.6% |
| $25,000 to $34,999 | 102 | 5.1% |
| $35,000 to $49,999 | 245 | 12.3% |
| $50,000 to $74,999 | 435 | 21.8% |
| $75,000 to $99,999 | 237 | 11.9% |
| $100,000 to $149,999 | 409 | 20.5% |
| $150,000 to $199,999 | 148 | 7.4% |
| $200,000+ | 90 | 4.5% |
Household Income by Householder Age in Ashland City
The median household income in Ashland City is $69,974, with the highest median household income of $87,143 found in the 25 to 44 years age bracket for the primary householder. A total of 706 households (35.4%) fall into this category. Meanwhile, the 15 to 24 years age bracket for the primary householder has the lowest median household income of $0, with 45 households (2.3%) in this group.
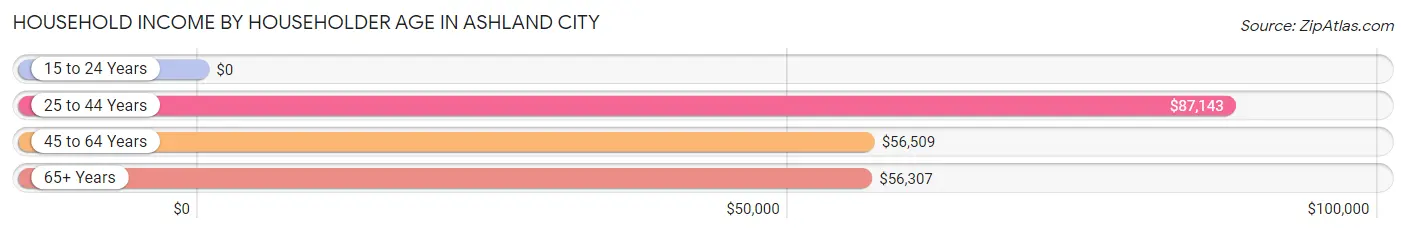
| Income Bracket | # Households | Median Income |
| 15 to 24 Years | 45 (2.3%) | $0 |
| 25 to 44 Years | 706 (35.4%) | $87,143 |
| 45 to 64 Years | 735 (36.8%) | $56,509 |
| 65+ Years | 509 (25.5%) | $56,307 |
| Total | 1,995 (100.0%) | $69,974 |
Poverty in Ashland City
Income Below Poverty by Sex and Age in Ashland City
With 8.7% poverty level for males and 10.5% for females among the residents of Ashland City, 12 to 14 year old males and 55 to 64 year old females are the most vulnerable to poverty, with 27 males (27.6%) and 155 females (40.1%) in their respective age groups living below the poverty level.
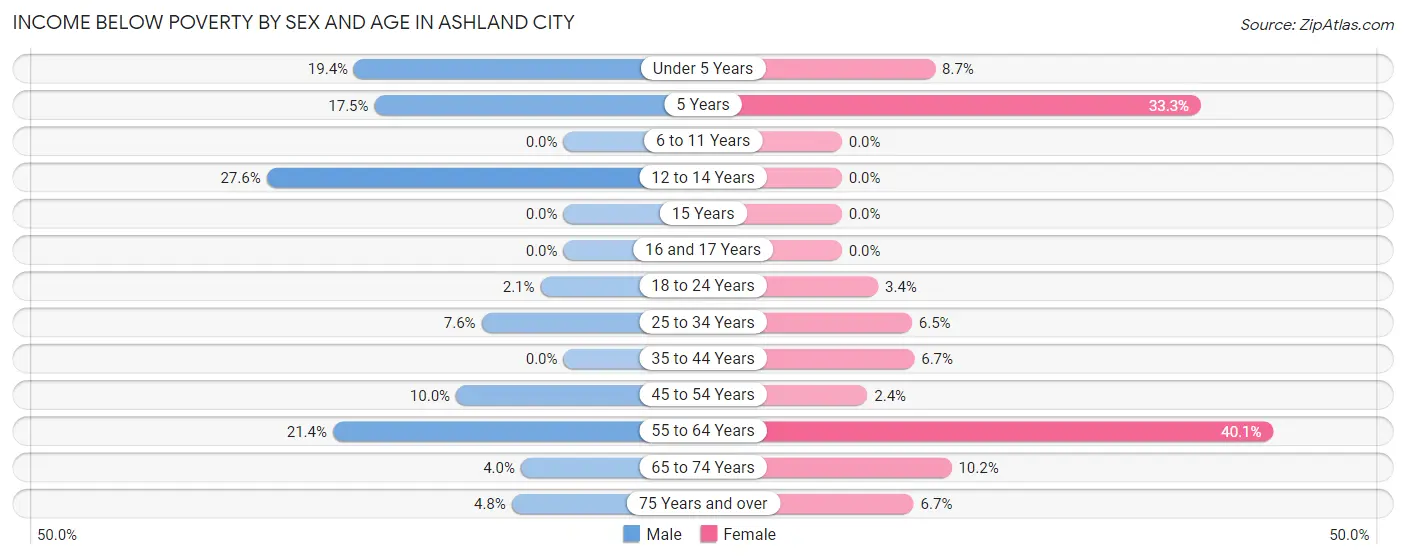
| Age Bracket | Male | Female |
| Under 5 Years | 28 (19.4%) | 11 (8.7%) |
| 5 Years | 10 (17.5%) | 10 (33.3%) |
| 6 to 11 Years | 0 (0.0%) | 0 (0.0%) |
| 12 to 14 Years | 27 (27.6%) | 0 (0.0%) |
| 15 Years | 0 (0.0%) | 0 (0.0%) |
| 16 and 17 Years | 0 (0.0%) | 0 (0.0%) |
| 18 to 24 Years | 2 (2.1%) | 3 (3.4%) |
| 25 to 34 Years | 26 (7.6%) | 23 (6.5%) |
| 35 to 44 Years | 0 (0.0%) | 27 (6.7%) |
| 45 to 54 Years | 33 (10.0%) | 7 (2.4%) |
| 55 to 64 Years | 64 (21.4%) | 155 (40.1%) |
| 65 to 74 Years | 10 (4.0%) | 34 (10.2%) |
| 75 Years and over | 6 (4.8%) | 7 (6.7%) |
| Total | 206 (8.7%) | 277 (10.5%) |
Income Above Poverty by Sex and Age in Ashland City
According to the poverty statistics in Ashland City, males aged 6 to 11 years and females aged 6 to 11 years are the age groups that are most secure financially, with 100.0% of males and 100.0% of females in these age groups living above the poverty line.
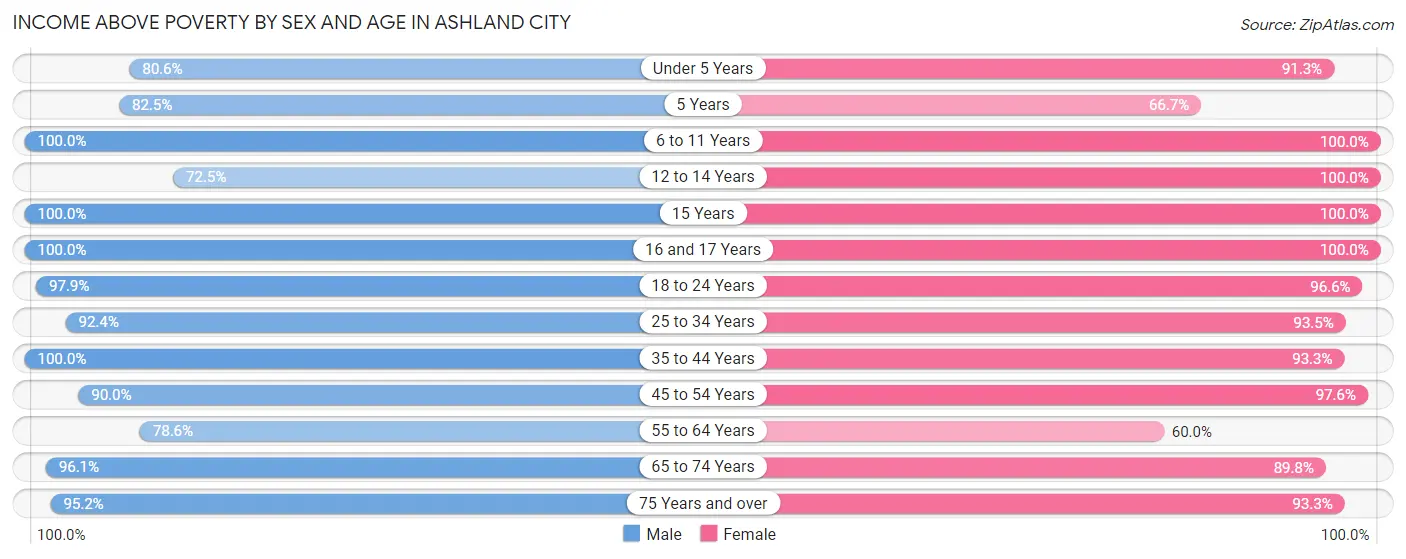
| Age Bracket | Male | Female |
| Under 5 Years | 116 (80.6%) | 116 (91.3%) |
| 5 Years | 47 (82.5%) | 20 (66.7%) |
| 6 to 11 Years | 158 (100.0%) | 202 (100.0%) |
| 12 to 14 Years | 71 (72.5%) | 111 (100.0%) |
| 15 Years | 39 (100.0%) | 49 (100.0%) |
| 16 and 17 Years | 27 (100.0%) | 154 (100.0%) |
| 18 to 24 Years | 92 (97.9%) | 86 (96.6%) |
| 25 to 34 Years | 316 (92.4%) | 331 (93.5%) |
| 35 to 44 Years | 386 (100.0%) | 374 (93.3%) |
| 45 to 54 Years | 298 (90.0%) | 288 (97.6%) |
| 55 to 64 Years | 235 (78.6%) | 232 (60.0%) |
| 65 to 74 Years | 243 (96.1%) | 300 (89.8%) |
| 75 Years and over | 119 (95.2%) | 98 (93.3%) |
| Total | 2,147 (91.2%) | 2,361 (89.5%) |
Income Below Poverty Among Married-Couple Families in Ashland City
The poverty statistics for married-couple families in Ashland City show that 4.4% or 41 of the total 926 families live below the poverty line. Families with 3 or 4 children have the highest poverty rate of 8.2%, comprising of 12 families. On the other hand, families with 5 or more children have the lowest poverty rate of 0.0%, which includes 0 families.
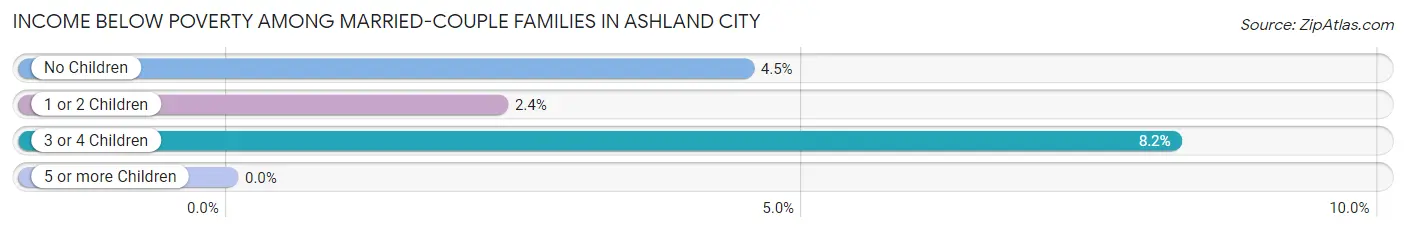
| Children | Above Poverty | Below Poverty |
| No Children | 489 (95.5%) | 23 (4.5%) |
| 1 or 2 Children | 249 (97.7%) | 6 (2.4%) |
| 3 or 4 Children | 134 (91.8%) | 12 (8.2%) |
| 5 or more Children | 13 (100.0%) | 0 (0.0%) |
| Total | 885 (95.6%) | 41 (4.4%) |
Income Below Poverty Among Single-Parent Households in Ashland City
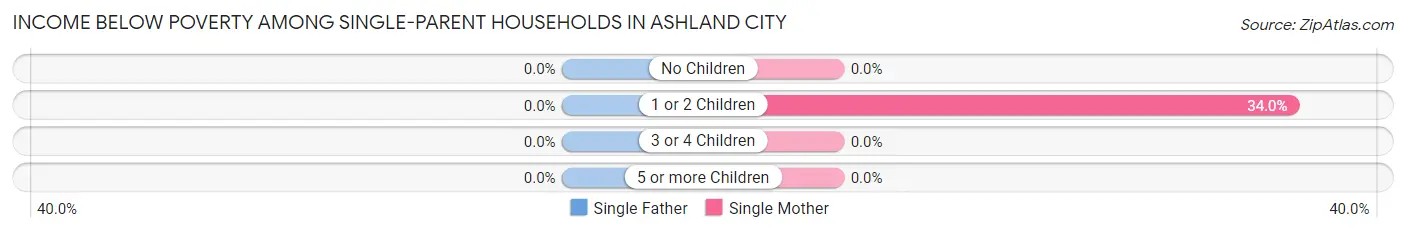
| Children | Single Father | Single Mother |
| No Children | 0 (0.0%) | 0 (0.0%) |
| 1 or 2 Children | 0 (0.0%) | 55 (34.0%) |
| 3 or 4 Children | 0 (0.0%) | 0 (0.0%) |
| 5 or more Children | 0 (0.0%) | 0 (0.0%) |
| Total | 0 (0.0%) | 55 (26.3%) |
Income Below Poverty Among Married-Couple vs Single-Parent Households in Ashland City
The poverty data for Ashland City shows that 41 of the married-couple family households (4.4%) and 55 of the single-parent households (20.0%) are living below the poverty level. Within the married-couple family households, those with 3 or 4 children have the highest poverty rate, with 12 households (8.2%) falling below the poverty line. Among the single-parent households, those with 1 or 2 children have the highest poverty rate, with 55 household (31.4%) living below poverty.
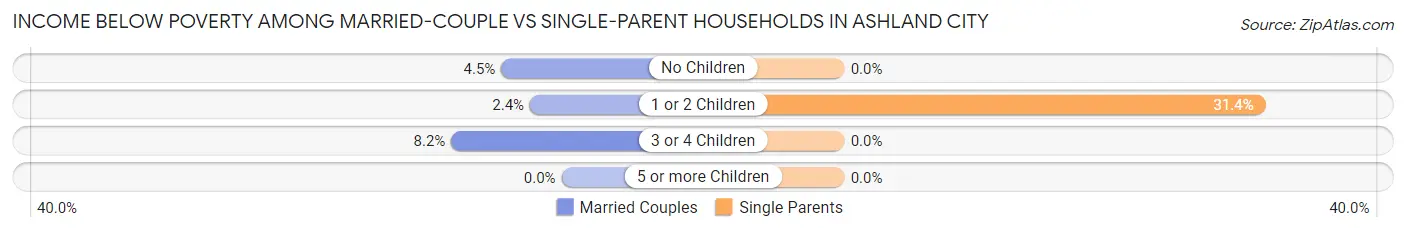
| Children | Married-Couple Families | Single-Parent Households |
| No Children | 23 (4.5%) | 0 (0.0%) |
| 1 or 2 Children | 6 (2.4%) | 55 (31.4%) |
| 3 or 4 Children | 12 (8.2%) | 0 (0.0%) |
| 5 or more Children | 0 (0.0%) | 0 (0.0%) |
| Total | 41 (4.4%) | 55 (20.0%) |
Race in Ashland City
The most populous races in Ashland City are White / Caucasian (4,661 | 89.4%), Black / African American (280 | 5.4%), and Hispanic or Latino (247 | 4.7%).
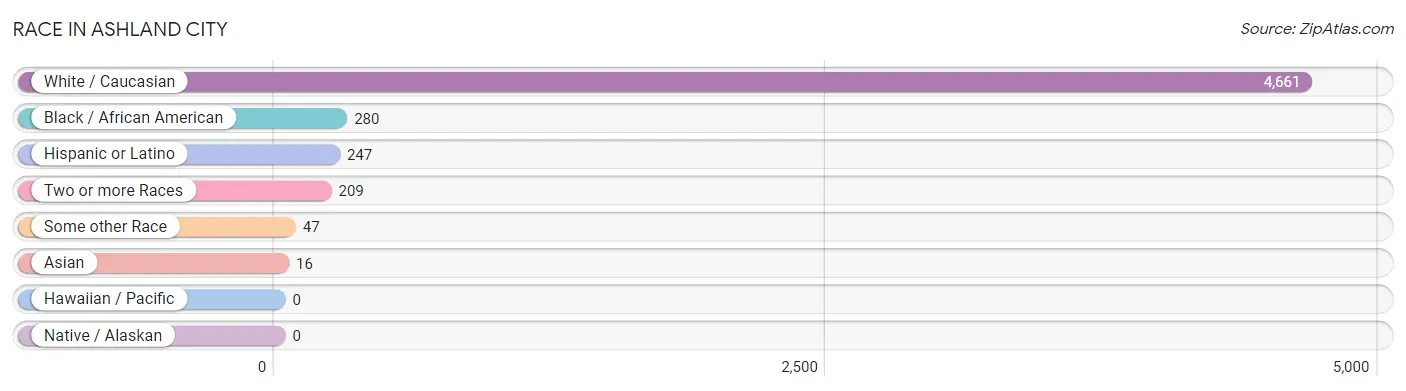
| Race | # Population | % Population |
| Asian | 16 | 0.3% |
| Black / African American | 280 | 5.4% |
| Hawaiian / Pacific | 0 | 0.0% |
| Hispanic or Latino | 247 | 4.7% |
| Native / Alaskan | 0 | 0.0% |
| White / Caucasian | 4,661 | 89.4% |
| Two or more Races | 209 | 4.0% |
| Some other Race | 47 | 0.9% |
| Total | 5,213 | 100.0% |
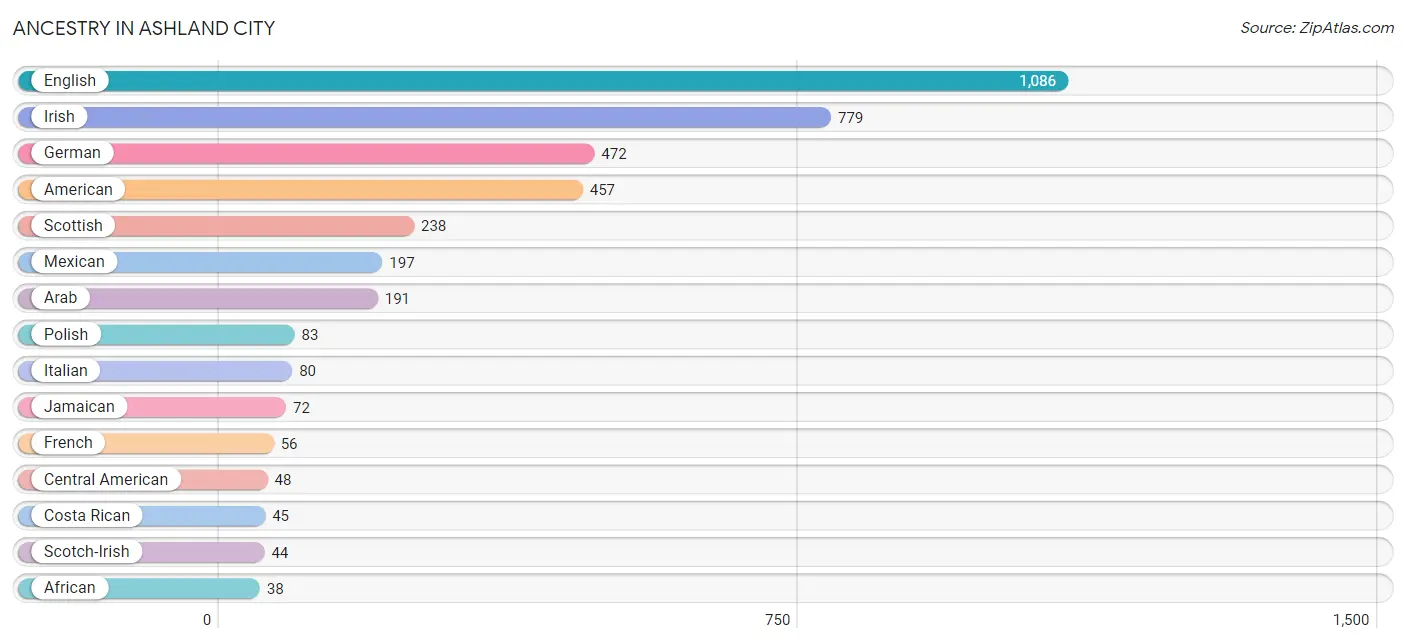
Ancestry in Ashland City
The most populous ancestries reported in Ashland City are English (1,086 | 20.8%), Irish (779 | 14.9%), German (472 | 9.0%), American (457 | 8.8%), and Scottish (238 | 4.6%), together accounting for 58.2% of all Ashland City residents.
| Ancestry | # Population | % Population |
| African | 38 | 0.7% |
| American | 457 | 8.8% |
| Arab | 191 | 3.7% |
| Armenian | 11 | 0.2% |
| Blackfeet | 1 | 0.0% |
| British | 17 | 0.3% |
| Cajun | 34 | 0.6% |
| Central American | 48 | 0.9% |
| Cherokee | 19 | 0.4% |
| Choctaw | 4 | 0.1% |
| Costa Rican | 45 | 0.9% |
| Dominican | 2 | 0.0% |
| Dutch | 38 | 0.7% |
| Eastern European | 15 | 0.3% |
| English | 1,086 | 20.8% |
| French | 56 | 1.1% |
| German | 472 | 9.0% |
| Greek | 28 | 0.5% |
| Honduran | 3 | 0.1% |
| Hungarian | 16 | 0.3% |
| Indian (Asian) | 16 | 0.3% |
| Irish | 779 | 14.9% |
| Italian | 80 | 1.5% |
| Jamaican | 72 | 1.4% |
| Mexican | 197 | 3.8% |
| Polish | 83 | 1.6% |
| Scandinavian | 24 | 0.5% |
| Scotch-Irish | 44 | 0.8% |
| Scottish | 238 | 4.6% |
| Subsaharan African | 38 | 0.7% |
| Swedish | 19 | 0.4% |
| Ukrainian | 10 | 0.2% |
| Welsh | 11 | 0.2% | View All 33 Rows |
Immigrants in Ashland City
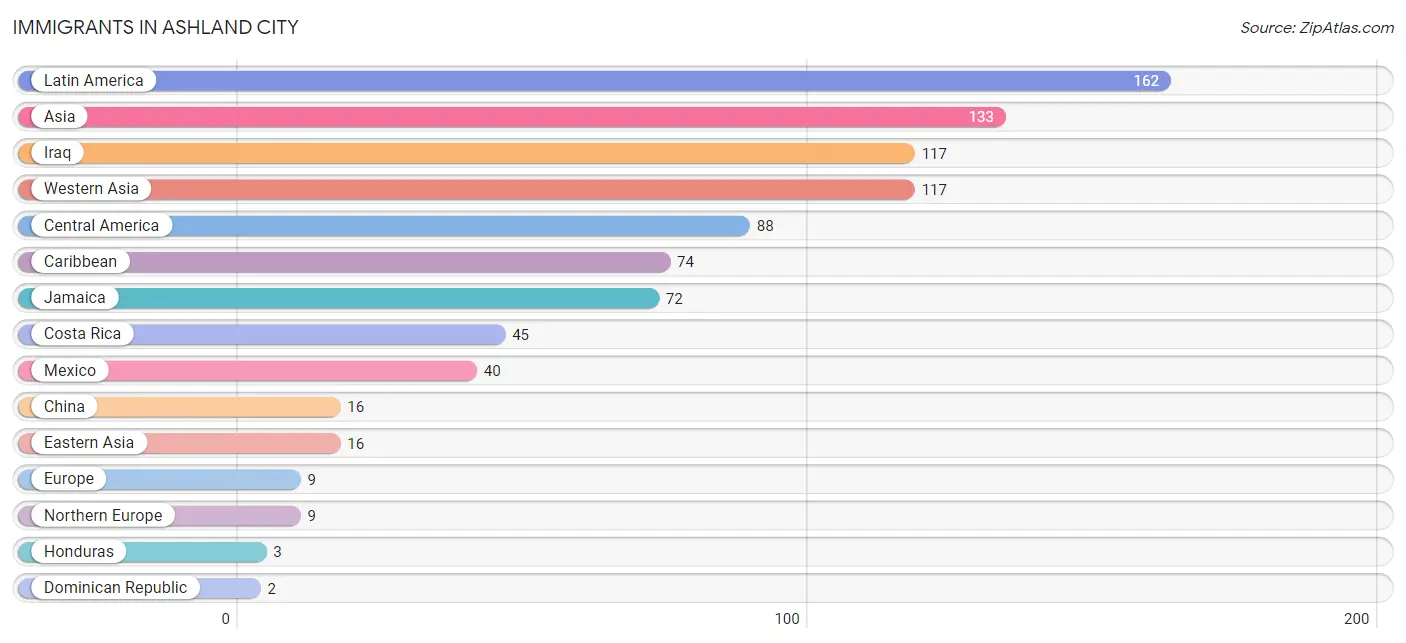
The most numerous immigrant groups reported in Ashland City came from Latin America (162 | 3.1%), Asia (133 | 2.5%), Iraq (117 | 2.2%), Western Asia (117 | 2.2%), and Central America (88 | 1.7%), together accounting for 11.8% of all Ashland City residents.
| Immigration Origin | # Population | % Population |
| Asia | 133 | 2.5% |
| Caribbean | 74 | 1.4% |
| Central America | 88 | 1.7% |
| China | 16 | 0.3% |
| Costa Rica | 45 | 0.9% |
| Dominican Republic | 2 | 0.0% |
| Eastern Asia | 16 | 0.3% |
| Europe | 9 | 0.2% |
| Honduras | 3 | 0.1% |
| Iraq | 117 | 2.2% |
| Jamaica | 72 | 1.4% |
| Latin America | 162 | 3.1% |
| Mexico | 40 | 0.8% |
| Northern Europe | 9 | 0.2% |
| Western Asia | 117 | 2.2% | View All 15 Rows |
Sex and Age in Ashland City
Sex and Age in Ashland City
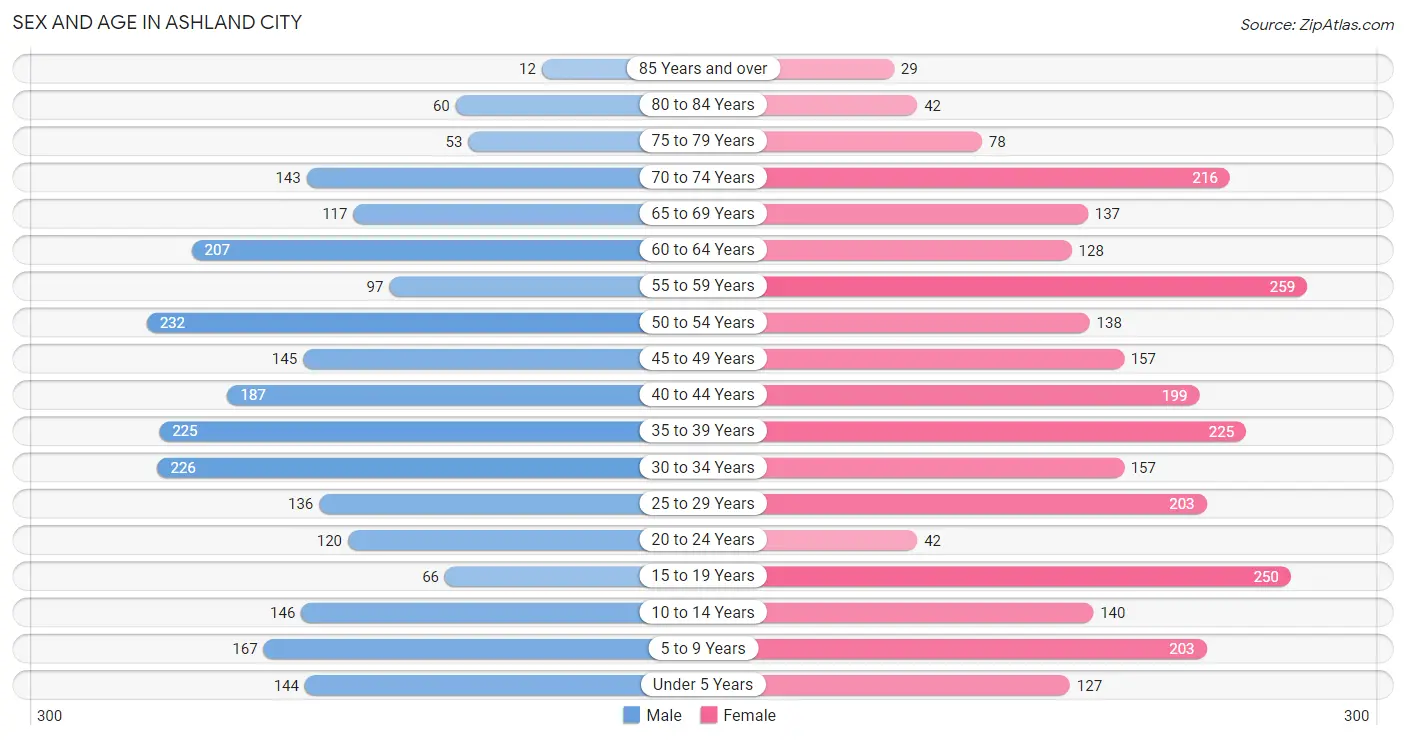
The most populous age groups in Ashland City are 50 to 54 Years (232 | 9.3%) for men and 55 to 59 Years (259 | 9.5%) for women.
| Age Bracket | Male | Female |
| Under 5 Years | 144 (5.8%) | 127 (4.6%) |
| 5 to 9 Years | 167 (6.7%) | 203 (7.4%) |
| 10 to 14 Years | 146 (5.9%) | 140 (5.1%) |
| 15 to 19 Years | 66 (2.7%) | 250 (9.2%) |
| 20 to 24 Years | 120 (4.8%) | 42 (1.5%) |
| 25 to 29 Years | 136 (5.5%) | 203 (7.4%) |
| 30 to 34 Years | 226 (9.1%) | 157 (5.8%) |
| 35 to 39 Years | 225 (9.1%) | 225 (8.2%) |
| 40 to 44 Years | 187 (7.5%) | 199 (7.3%) |
| 45 to 49 Years | 145 (5.8%) | 157 (5.8%) |
| 50 to 54 Years | 232 (9.3%) | 138 (5.1%) |
| 55 to 59 Years | 97 (3.9%) | 259 (9.5%) |
| 60 to 64 Years | 207 (8.3%) | 128 (4.7%) |
| 65 to 69 Years | 117 (4.7%) | 137 (5.0%) |
| 70 to 74 Years | 143 (5.8%) | 216 (7.9%) |
| 75 to 79 Years | 53 (2.1%) | 78 (2.9%) |
| 80 to 84 Years | 60 (2.4%) | 42 (1.5%) |
| 85 Years and over | 12 (0.5%) | 29 (1.1%) |
| Total | 2,483 (100.0%) | 2,730 (100.0%) |
Families and Households in Ashland City
Median Family Size in Ashland City
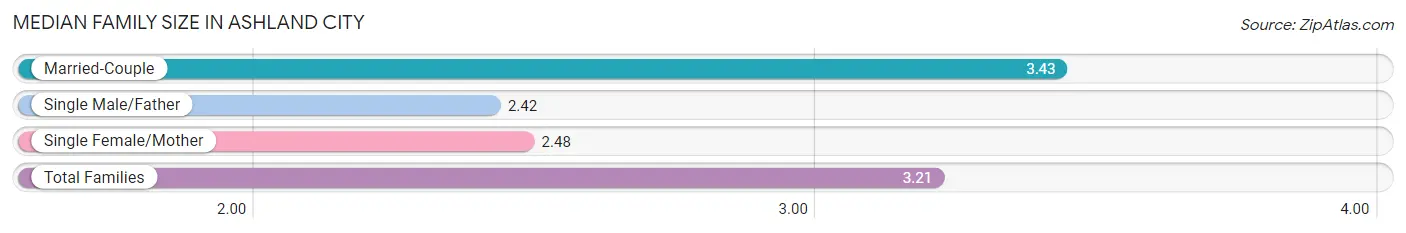
The median family size in Ashland City is 3.21 persons per family, with married-couple families (926 | 77.1%) accounting for the largest median family size of 3.43 persons per family. On the other hand, single male/father families (66 | 5.5%) represent the smallest median family size with 2.42 persons per family.
| Family Type | # Families | Family Size |
| Married-Couple | 926 (77.1%) | 3.43 |
| Single Male/Father | 66 (5.5%) | 2.42 |
| Single Female/Mother | 209 (17.4%) | 2.48 |
| Total Families | 1,201 (100.0%) | 3.21 |
Median Household Size in Ashland City
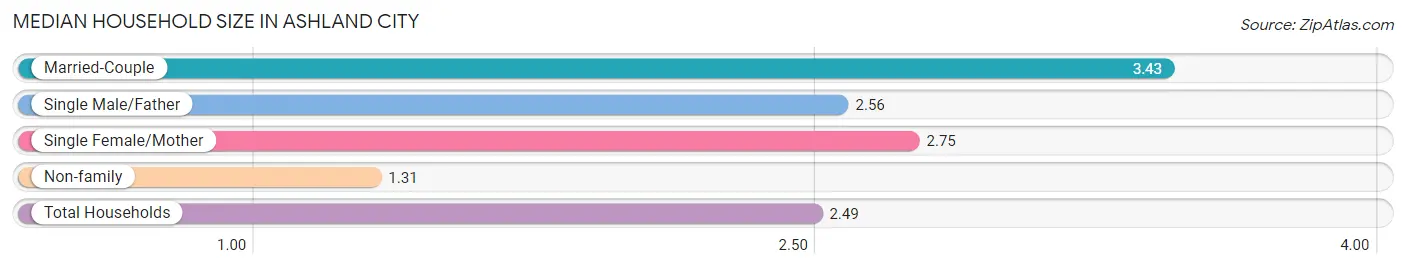
The median household size in Ashland City is 2.49 persons per household, with married-couple households (926 | 46.4%) accounting for the largest median household size of 3.43 persons per household. non-family households (794 | 39.8%) represent the smallest median household size with 1.31 persons per household.
| Household Type | # Households | Household Size |
| Married-Couple | 926 (46.4%) | 3.43 |
| Single Male/Father | 66 (3.3%) | 2.56 |
| Single Female/Mother | 209 (10.5%) | 2.75 |
| Non-family | 794 (39.8%) | 1.31 |
| Total Households | 1,995 (100.0%) | 2.49 |
Household Size by Marriage Status in Ashland City
Out of a total of 1,995 households in Ashland City, 1,201 (60.2%) are family households, while 794 (39.8%) are nonfamily households. The most numerous type of family households are 2-person households, comprising 584, and the most common type of nonfamily households are 1-person households, comprising 486.
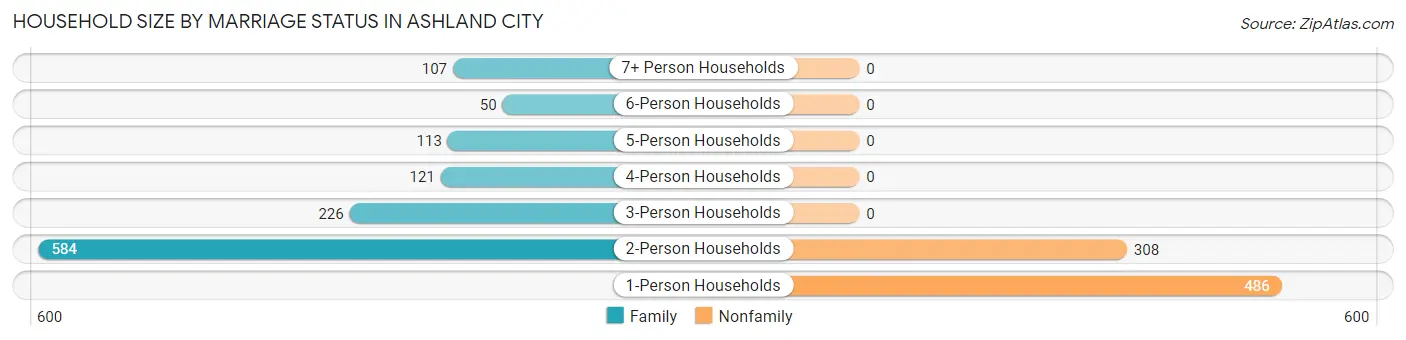
| Household Size | Family Households | Nonfamily Households |
| 1-Person Households | - | 486 (24.4%) |
| 2-Person Households | 584 (29.3%) | 308 (15.4%) |
| 3-Person Households | 226 (11.3%) | 0 (0.0%) |
| 4-Person Households | 121 (6.1%) | 0 (0.0%) |
| 5-Person Households | 113 (5.7%) | 0 (0.0%) |
| 6-Person Households | 50 (2.5%) | 0 (0.0%) |
| 7+ Person Households | 107 (5.4%) | 0 (0.0%) |
| Total | 1,201 (60.2%) | 794 (39.8%) |
Female Fertility in Ashland City
Fertility by Age in Ashland City
Average fertility rate in Ashland City is 29.0 births per 1,000 women. Women in the age bracket of 20 to 34 years have the highest fertility rate with 60.0 births per 1,000 women. Women in the age bracket of 20 to 34 years acount for 66.7% of all women with births.
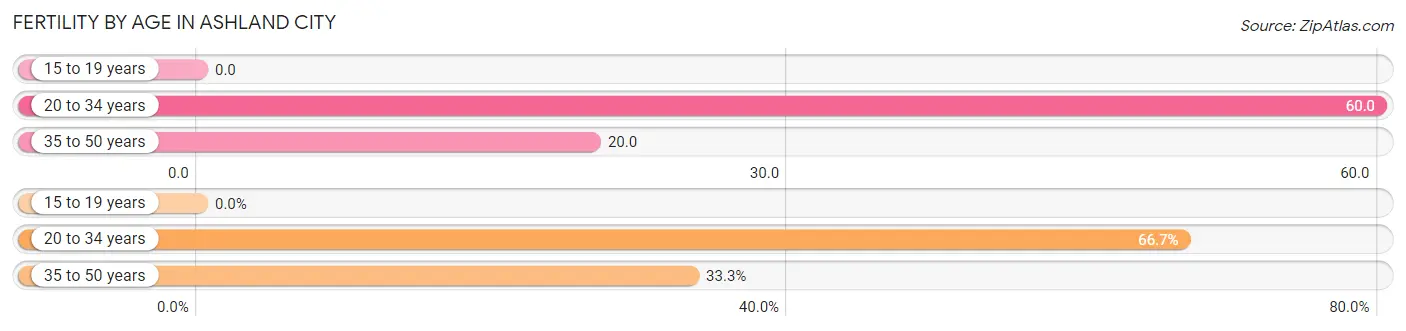
| Age Bracket | Women with Births | Births / 1,000 Women |
| 15 to 19 years | 0 (0.0%) | 0.0 |
| 20 to 34 years | 24 (66.7%) | 60.0 |
| 35 to 50 years | 12 (33.3%) | 20.0 |
| Total | 36 (100.0%) | 29.0 |
Fertility by Age by Marriage Status in Ashland City
66.7% of women with births (36) in Ashland City are married. The highest percentage of unmarried women with births falls into 35 to 50 years age bracket with 100.0% of them unmarried at the time of birth, while the lowest percentage of unmarried women with births belong to 20 to 34 years age bracket with 0.0% of them unmarried.
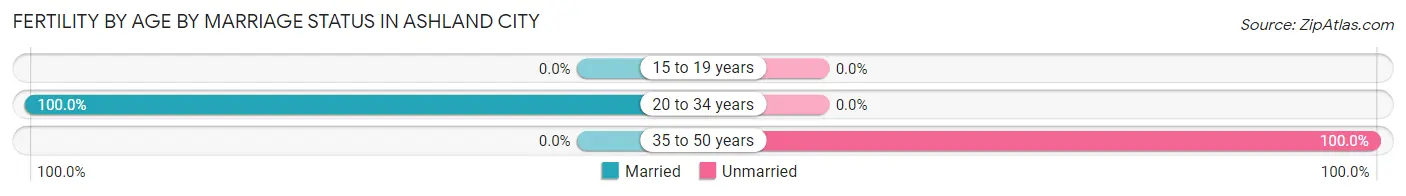
| Age Bracket | Married | Unmarried |
| 15 to 19 years | 0 (0.0%) | 0 (0.0%) |
| 20 to 34 years | 24 (100.0%) | 0 (0.0%) |
| 35 to 50 years | 0 (0.0%) | 12 (100.0%) |
| Total | 24 (66.7%) | 12 (33.3%) |
Fertility by Education in Ashland City
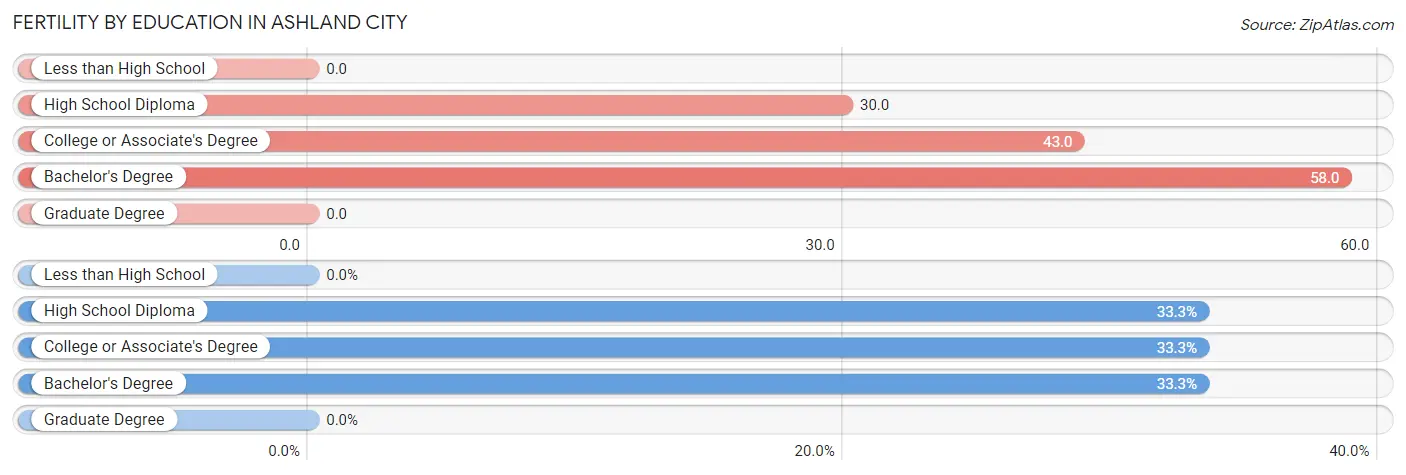
| Educational Attainment | Women with Births | Births / 1,000 Women |
| Less than High School | 0 (0.0%) | 0.0 |
| High School Diploma | 12 (33.3%) | 30.0 |
| College or Associate's Degree | 12 (33.3%) | 43.0 |
| Bachelor's Degree | 12 (33.3%) | 58.0 |
| Graduate Degree | 0 (0.0%) | 0.0 |
| Total | 36 (100.0%) | 29.0 |
Fertility by Education by Marriage Status in Ashland City
33.3% of women with births in Ashland City are unmarried. Women with the educational attainment of college or associate's degree are most likely to be married with 100.0% of them married at childbirth, while women with the educational attainment of high school diploma are least likely to be married with 100.0% of them unmarried at childbirth.
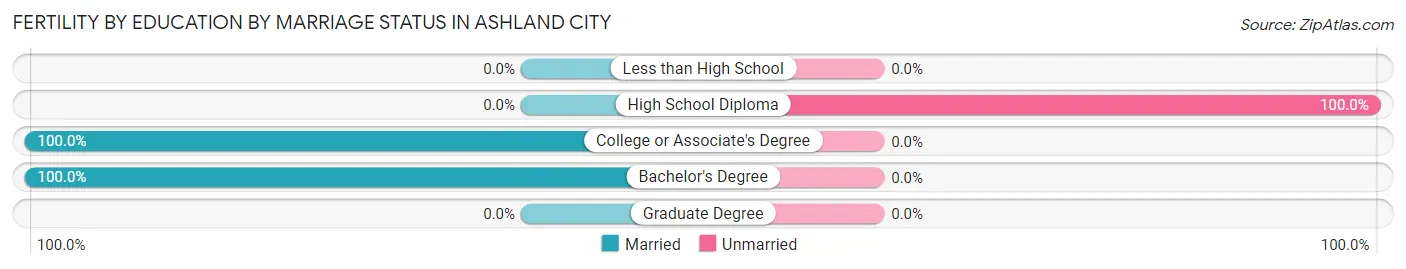
| Educational Attainment | Married | Unmarried |
| Less than High School | 0 (0.0%) | 0 (0.0%) |
| High School Diploma | 0 (0.0%) | 12 (100.0%) |
| College or Associate's Degree | 12 (100.0%) | 0 (0.0%) |
| Bachelor's Degree | 12 (100.0%) | 0 (0.0%) |
| Graduate Degree | 0 (0.0%) | 0 (0.0%) |
| Total | 24 (66.7%) | 12 (33.3%) |
Employment Characteristics in Ashland City
Employment by Class of Employer in Ashland City
Among the 2,529 employed individuals in Ashland City, private company employees (1,972 | 78.0%), self-employed (not incorporated) (159 | 6.3%), and state government employees (128 | 5.1%) make up the most common classes of employment.
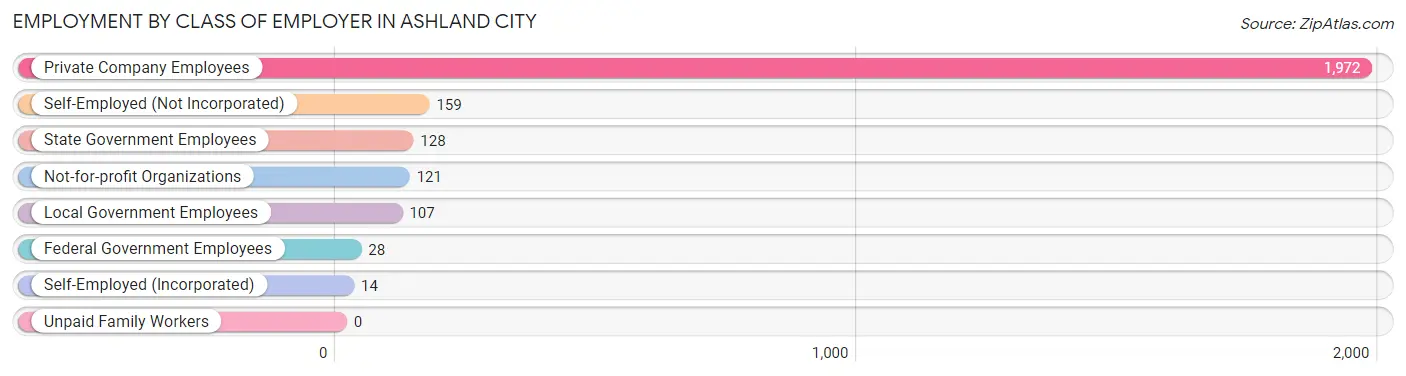
| Employer Class | # Employees | % Employees |
| Private Company Employees | 1,972 | 78.0% |
| Self-Employed (Incorporated) | 14 | 0.5% |
| Self-Employed (Not Incorporated) | 159 | 6.3% |
| Not-for-profit Organizations | 121 | 4.8% |
| Local Government Employees | 107 | 4.2% |
| State Government Employees | 128 | 5.1% |
| Federal Government Employees | 28 | 1.1% |
| Unpaid Family Workers | 0 | 0.0% |
| Total | 2,529 | 100.0% |
Employment Status by Age in Ashland City
According to the labor force statistics for Ashland City, out of the total population over 16 years of age (4,198), 65.6% or 2,754 individuals are in the labor force, with 4.9% or 135 of them unemployed. The age group with the highest labor force participation rate is 35 to 44 years, with 85.6% or 716 individuals in the labor force. Within the labor force, the 16 to 19 years age range has the highest percentage of unemployed individuals, with 17.9% or 27 of them being unemployed.
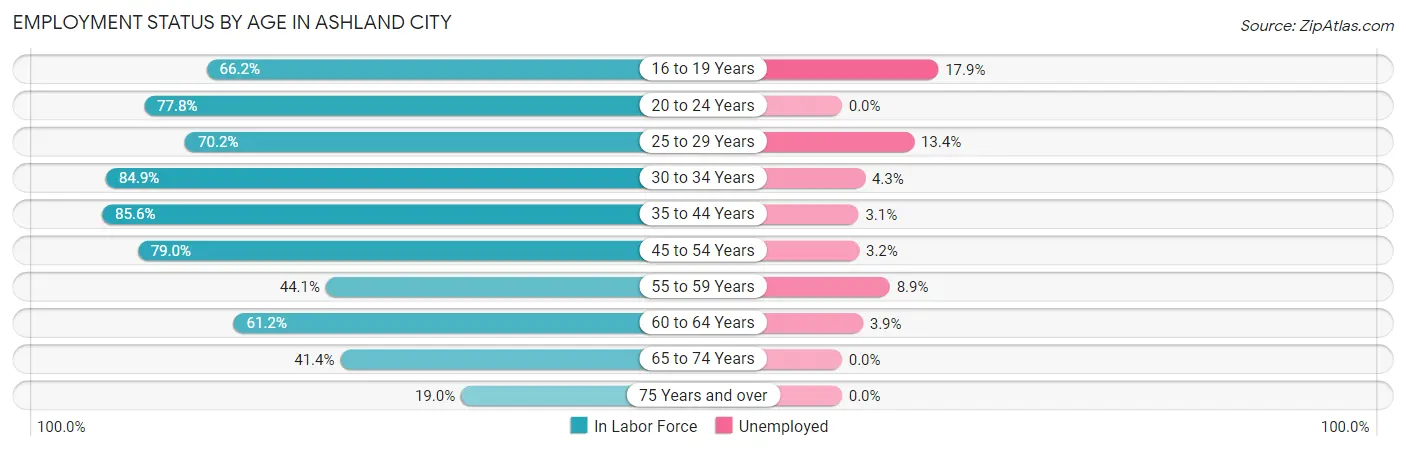
| Age Bracket | In Labor Force | Unemployed |
| 16 to 19 Years | 151 (66.2%) | 27 (17.9%) |
| 20 to 24 Years | 126 (77.8%) | 0 (0.0%) |
| 25 to 29 Years | 238 (70.2%) | 32 (13.4%) |
| 30 to 34 Years | 325 (84.9%) | 14 (4.3%) |
| 35 to 44 Years | 716 (85.6%) | 22 (3.1%) |
| 45 to 54 Years | 531 (79.0%) | 17 (3.2%) |
| 55 to 59 Years | 157 (44.1%) | 14 (8.9%) |
| 60 to 64 Years | 205 (61.2%) | 8 (3.9%) |
| 65 to 74 Years | 254 (41.4%) | 0 (0.0%) |
| 75 Years and over | 52 (19.0%) | 0 (0.0%) |
| Total | 2,754 (65.6%) | 135 (4.9%) |
Employment Status by Educational Attainment in Ashland City
According to labor force statistics for Ashland City, 74.4% of individuals (2,173) out of the total population between 25 and 64 years of age (2,921) are in the labor force, with 4.9% or 106 of them being unemployed. The group with the highest labor force participation rate are those with the educational attainment of college / associate degree, with 83.1% or 727 individuals in the labor force. Within the labor force, individuals with less than high school education have the highest percentage of unemployment, with 8.3% or 7 of them being unemployed.
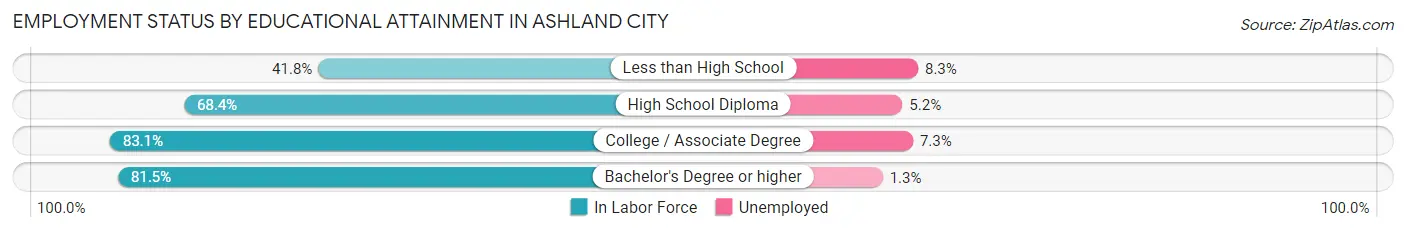
| Educational Attainment | In Labor Force | Unemployed |
| Less than High School | 84 (41.8%) | 17 (8.3%) |
| High School Diploma | 747 (68.4%) | 57 (5.2%) |
| College / Associate Degree | 727 (83.1%) | 64 (7.3%) |
| Bachelor's Degree or higher | 614 (81.5%) | 10 (1.3%) |
| Total | 2,173 (74.4%) | 143 (4.9%) |
Employment Occupations by Sex in Ashland City
Management, Business, Science and Arts Occupations
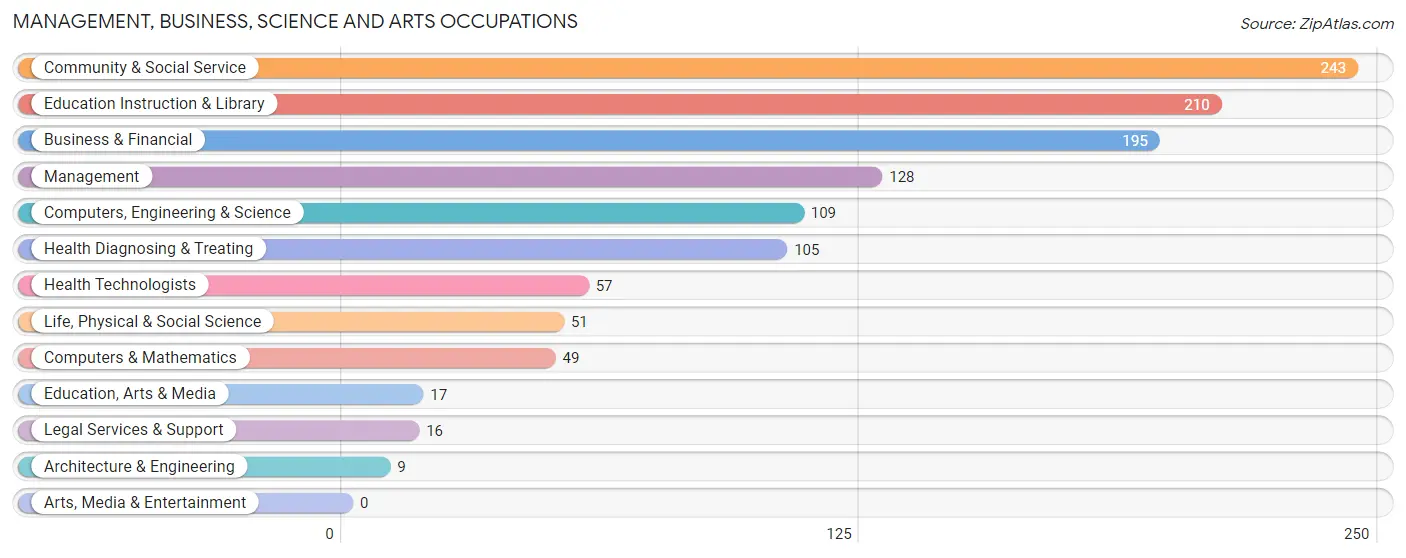
The most common Management, Business, Science and Arts occupations in Ashland City are Community & Social Service (243 | 9.3%), Education Instruction & Library (210 | 8.0%), Business & Financial (195 | 7.4%), Management (128 | 4.9%), and Computers, Engineering & Science (109 | 4.2%).
Management, Business, Science and Arts Occupations by Sex
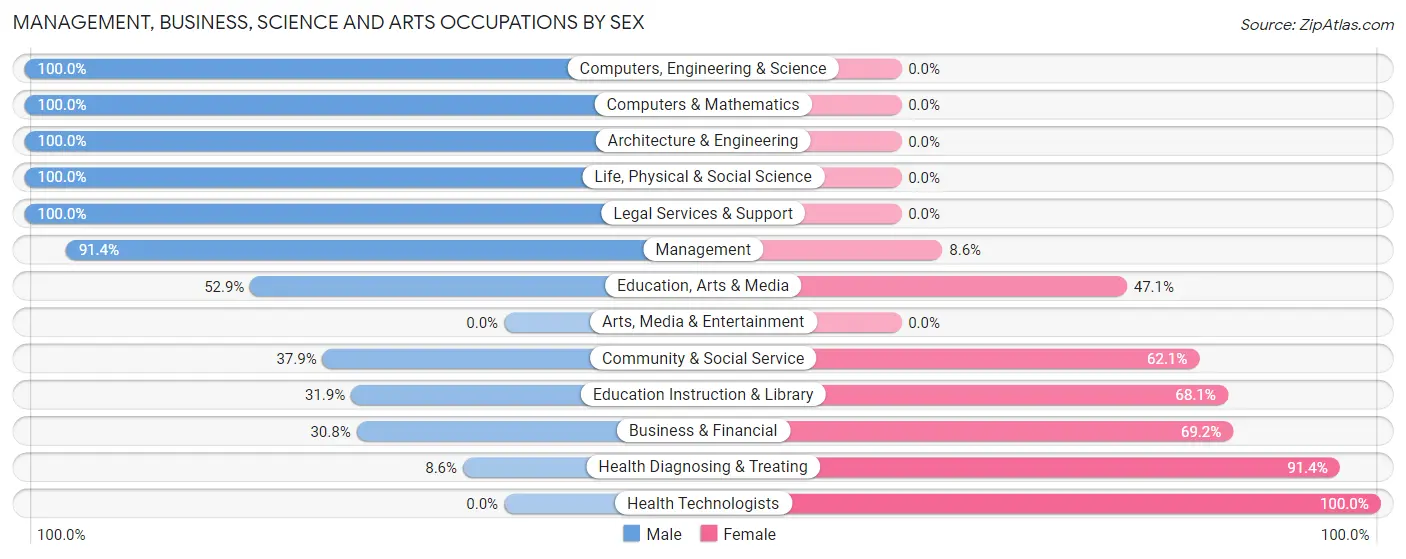
Within the Management, Business, Science and Arts occupations in Ashland City, the most male-oriented occupations are Computers, Engineering & Science (100.0%), Computers & Mathematics (100.0%), and Architecture & Engineering (100.0%), while the most female-oriented occupations are Health Technologists (100.0%), Health Diagnosing & Treating (91.4%), and Business & Financial (69.2%).
| Occupation | Male | Female |
| Management | 117 (91.4%) | 11 (8.6%) |
| Business & Financial | 60 (30.8%) | 135 (69.2%) |
| Computers, Engineering & Science | 109 (100.0%) | 0 (0.0%) |
| Computers & Mathematics | 49 (100.0%) | 0 (0.0%) |
| Architecture & Engineering | 9 (100.0%) | 0 (0.0%) |
| Life, Physical & Social Science | 51 (100.0%) | 0 (0.0%) |
| Community & Social Service | 92 (37.9%) | 151 (62.1%) |
| Education, Arts & Media | 9 (52.9%) | 8 (47.1%) |
| Legal Services & Support | 16 (100.0%) | 0 (0.0%) |
| Education Instruction & Library | 67 (31.9%) | 143 (68.1%) |
| Arts, Media & Entertainment | 0 (0.0%) | 0 (0.0%) |
| Health Diagnosing & Treating | 9 (8.6%) | 96 (91.4%) |
| Health Technologists | 0 (0.0%) | 57 (100.0%) |
| Total (Category) | 387 (49.6%) | 393 (50.4%) |
| Total (Overall) | 1,408 (53.7%) | 1,213 (46.3%) |
Services Occupations
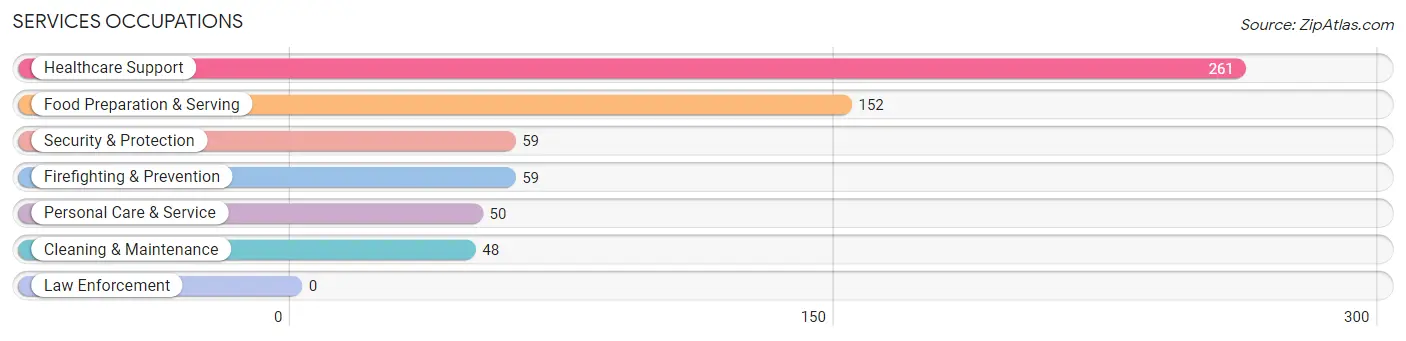
The most common Services occupations in Ashland City are Healthcare Support (261 | 10.0%), Food Preparation & Serving (152 | 5.8%), Security & Protection (59 | 2.2%), Firefighting & Prevention (59 | 2.2%), and Personal Care & Service (50 | 1.9%).
Services Occupations by Sex
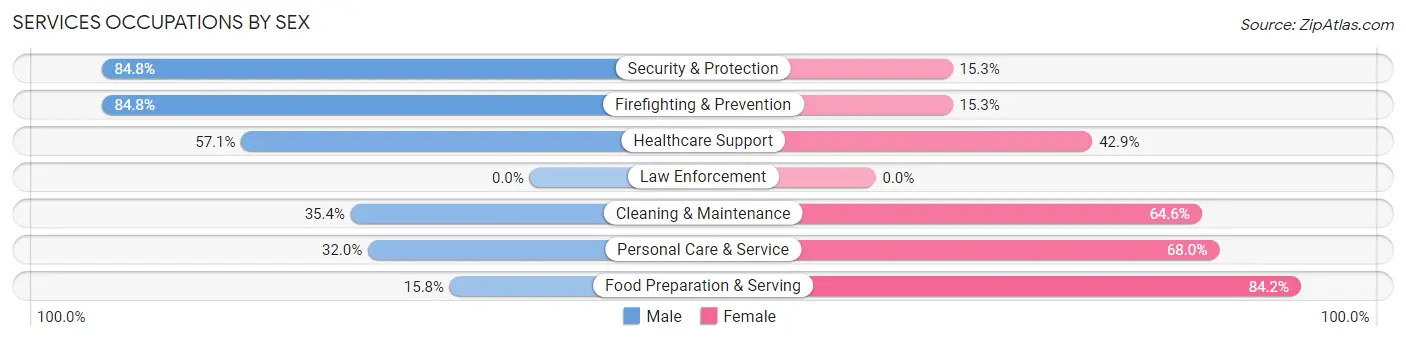
Within the Services occupations in Ashland City, the most male-oriented occupations are Security & Protection (84.8%), Firefighting & Prevention (84.8%), and Healthcare Support (57.1%), while the most female-oriented occupations are Food Preparation & Serving (84.2%), Personal Care & Service (68.0%), and Cleaning & Maintenance (64.6%).
| Occupation | Male | Female |
| Healthcare Support | 149 (57.1%) | 112 (42.9%) |
| Security & Protection | 50 (84.8%) | 9 (15.2%) |
| Firefighting & Prevention | 50 (84.8%) | 9 (15.2%) |
| Law Enforcement | 0 (0.0%) | 0 (0.0%) |
| Food Preparation & Serving | 24 (15.8%) | 128 (84.2%) |
| Cleaning & Maintenance | 17 (35.4%) | 31 (64.6%) |
| Personal Care & Service | 16 (32.0%) | 34 (68.0%) |
| Total (Category) | 256 (44.9%) | 314 (55.1%) |
| Total (Overall) | 1,408 (53.7%) | 1,213 (46.3%) |
Sales and Office Occupations
The most common Sales and Office occupations in Ashland City are Sales & Related (378 | 14.4%), and Office & Administration (151 | 5.8%).
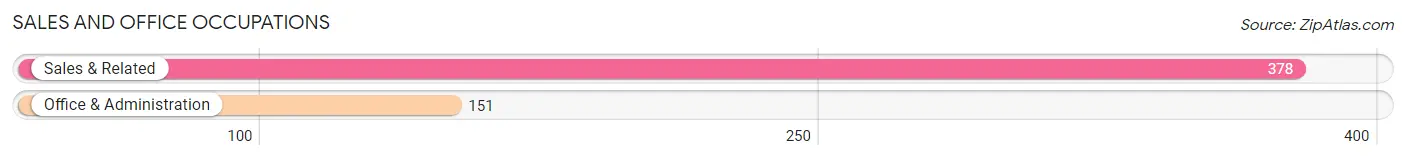
Sales and Office Occupations by Sex
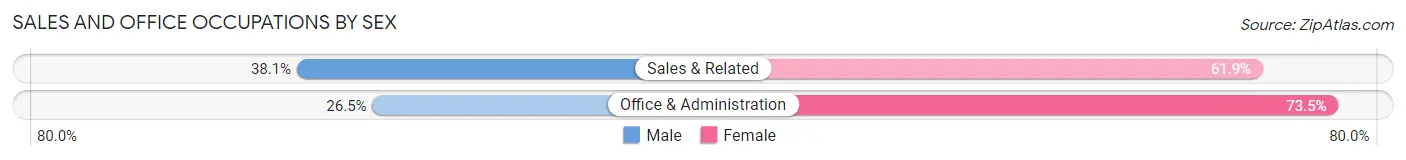
| Occupation | Male | Female |
| Sales & Related | 144 (38.1%) | 234 (61.9%) |
| Office & Administration | 40 (26.5%) | 111 (73.5%) |
| Total (Category) | 184 (34.8%) | 345 (65.2%) |
| Total (Overall) | 1,408 (53.7%) | 1,213 (46.3%) |
Natural Resources, Construction and Maintenance Occupations
The most common Natural Resources, Construction and Maintenance occupations in Ashland City are Construction & Extraction (145 | 5.5%), and Installation, Maintenance & Repair (90 | 3.4%).
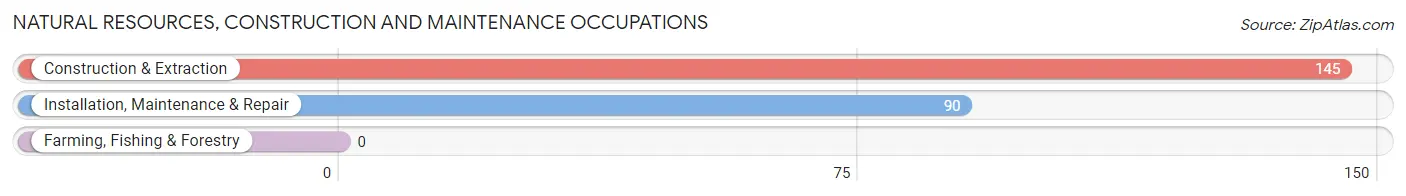
Natural Resources, Construction and Maintenance Occupations by Sex
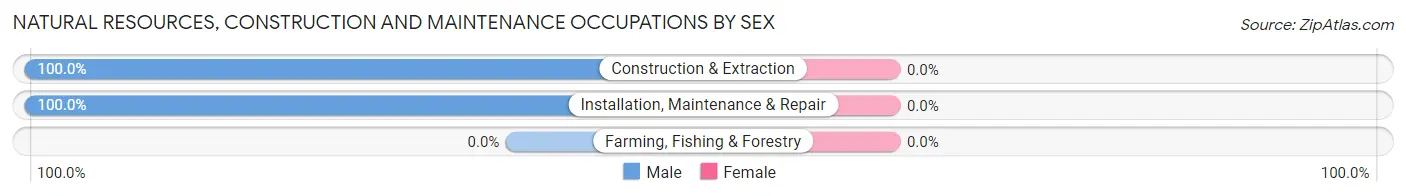
| Occupation | Male | Female |
| Farming, Fishing & Forestry | 0 (0.0%) | 0 (0.0%) |
| Construction & Extraction | 145 (100.0%) | 0 (0.0%) |
| Installation, Maintenance & Repair | 90 (100.0%) | 0 (0.0%) |
| Total (Category) | 235 (100.0%) | 0 (0.0%) |
| Total (Overall) | 1,408 (53.7%) | 1,213 (46.3%) |
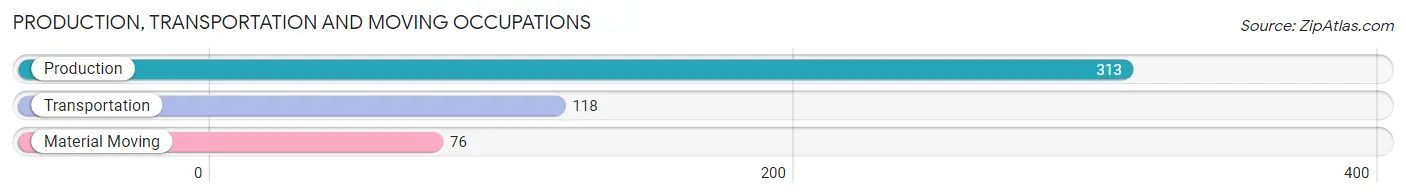
Production, Transportation and Moving Occupations
The most common Production, Transportation and Moving occupations in Ashland City are Production (313 | 11.9%), Transportation (118 | 4.5%), and Material Moving (76 | 2.9%).
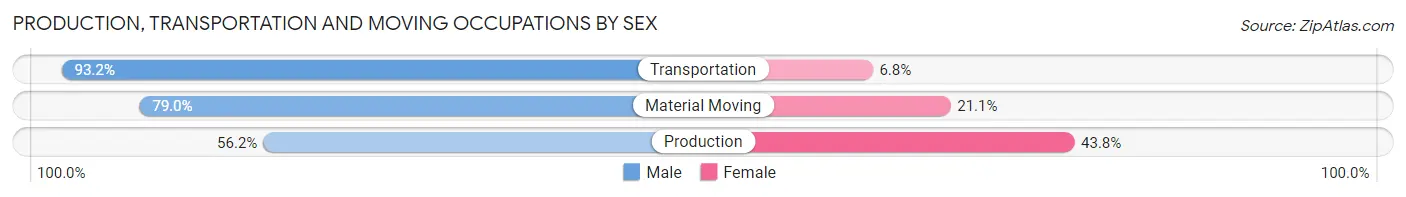
Production, Transportation and Moving Occupations by Sex
| Occupation | Male | Female |
| Production | 176 (56.2%) | 137 (43.8%) |
| Transportation | 110 (93.2%) | 8 (6.8%) |
| Material Moving | 60 (78.9%) | 16 (21.0%) |
| Total (Category) | 346 (68.2%) | 161 (31.8%) |
| Total (Overall) | 1,408 (53.7%) | 1,213 (46.3%) |
Employment Industries by Sex in Ashland City
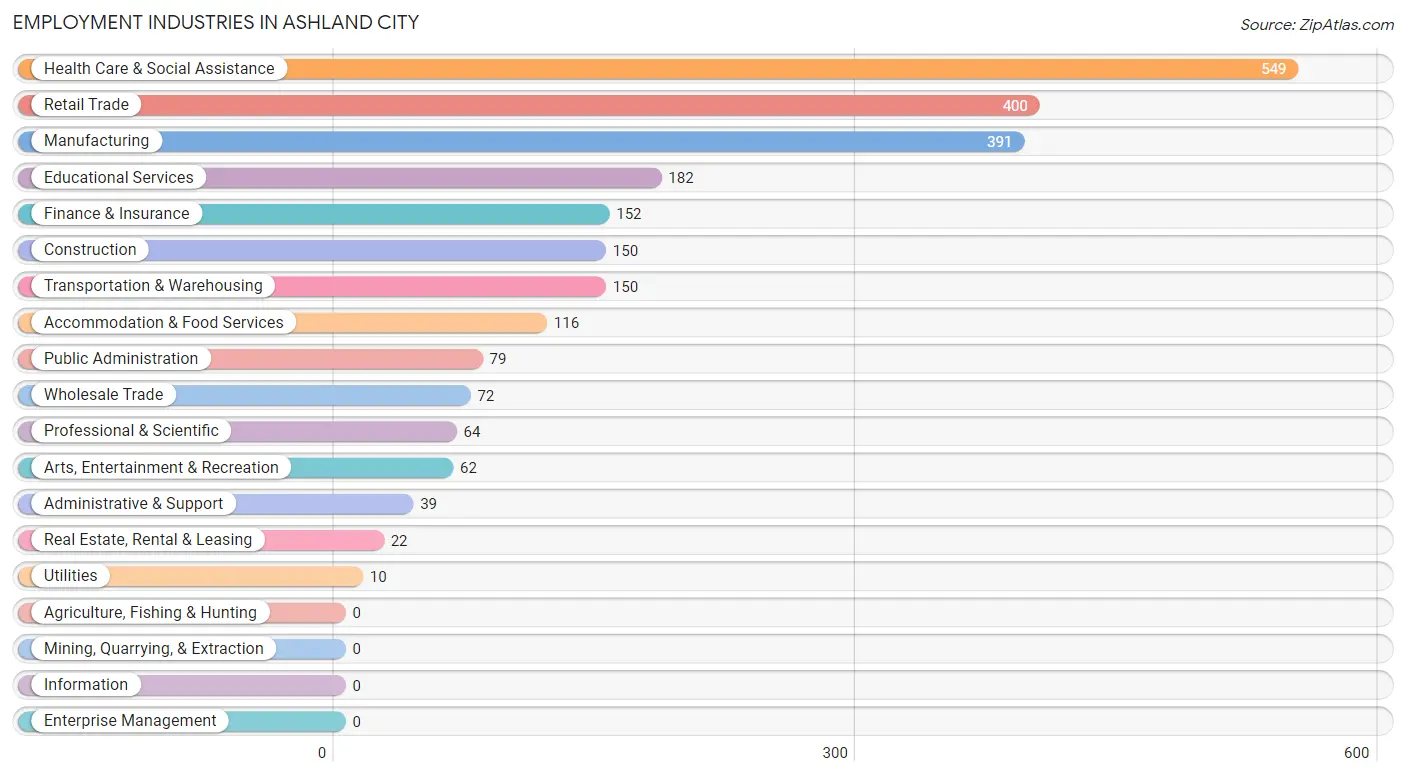
Employment Industries in Ashland City
The major employment industries in Ashland City include Health Care & Social Assistance (549 | 20.9%), Retail Trade (400 | 15.3%), Manufacturing (391 | 14.9%), Educational Services (182 | 6.9%), and Finance & Insurance (152 | 5.8%).
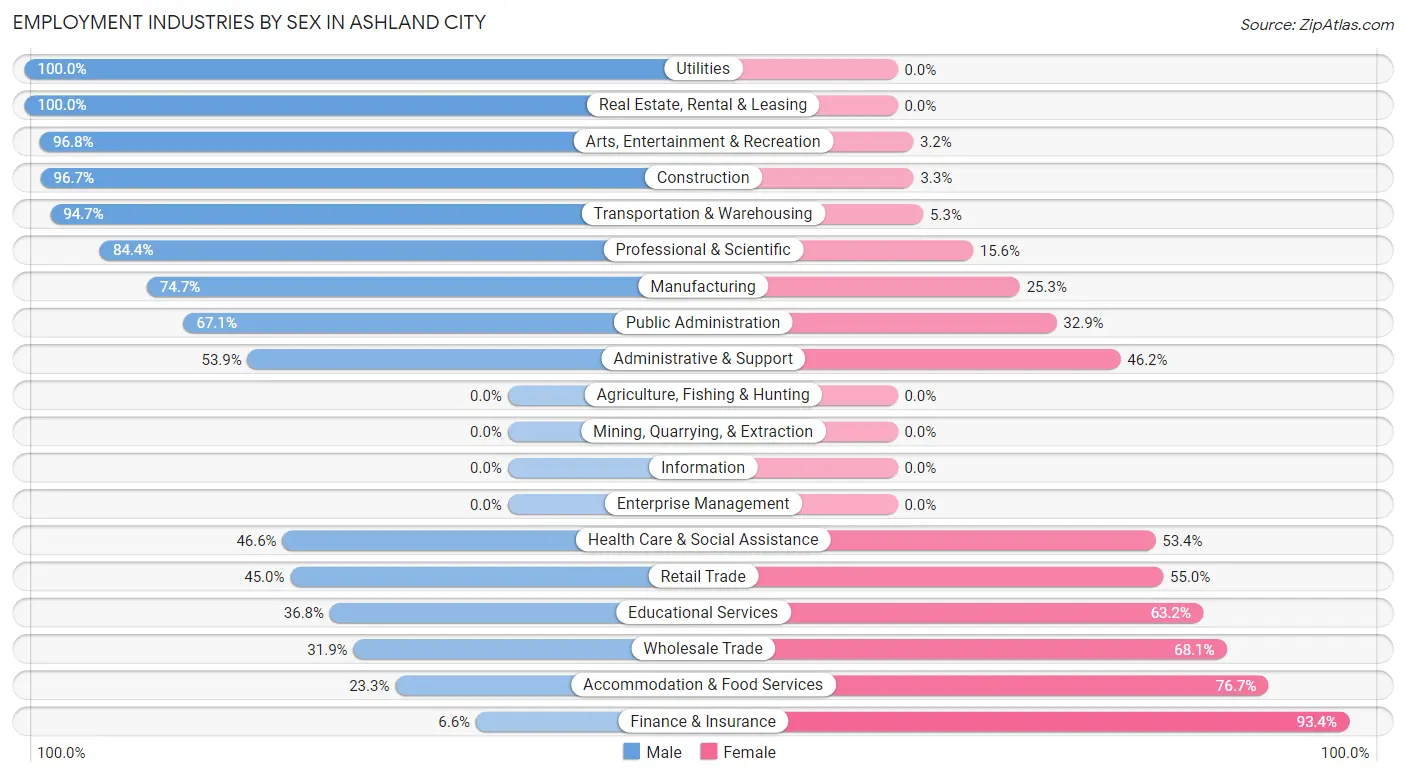
Employment Industries by Sex in Ashland City
The Ashland City industries that see more men than women are Utilities (100.0%), Real Estate, Rental & Leasing (100.0%), and Arts, Entertainment & Recreation (96.8%), whereas the industries that tend to have a higher number of women are Finance & Insurance (93.4%), Accommodation & Food Services (76.7%), and Wholesale Trade (68.1%).
| Industry | Male | Female |
| Agriculture, Fishing & Hunting | 0 (0.0%) | 0 (0.0%) |
| Mining, Quarrying, & Extraction | 0 (0.0%) | 0 (0.0%) |
| Construction | 145 (96.7%) | 5 (3.3%) |
| Manufacturing | 292 (74.7%) | 99 (25.3%) |
| Wholesale Trade | 23 (31.9%) | 49 (68.1%) |
| Retail Trade | 180 (45.0%) | 220 (55.0%) |
| Transportation & Warehousing | 142 (94.7%) | 8 (5.3%) |
| Utilities | 10 (100.0%) | 0 (0.0%) |
| Information | 0 (0.0%) | 0 (0.0%) |
| Finance & Insurance | 10 (6.6%) | 142 (93.4%) |
| Real Estate, Rental & Leasing | 22 (100.0%) | 0 (0.0%) |
| Professional & Scientific | 54 (84.4%) | 10 (15.6%) |
| Enterprise Management | 0 (0.0%) | 0 (0.0%) |
| Administrative & Support | 21 (53.8%) | 18 (46.2%) |
| Educational Services | 67 (36.8%) | 115 (63.2%) |
| Health Care & Social Assistance | 256 (46.6%) | 293 (53.4%) |
| Arts, Entertainment & Recreation | 60 (96.8%) | 2 (3.2%) |
| Accommodation & Food Services | 27 (23.3%) | 89 (76.7%) |
| Public Administration | 53 (67.1%) | 26 (32.9%) |
| Total | 1,408 (53.7%) | 1,213 (46.3%) |
Education in Ashland City
School Enrollment in Ashland City
The most common levels of schooling among the 1,170 students in Ashland City are high school (322 | 27.5%), elementary school (237 | 20.3%), and middle school (216 | 18.5%).
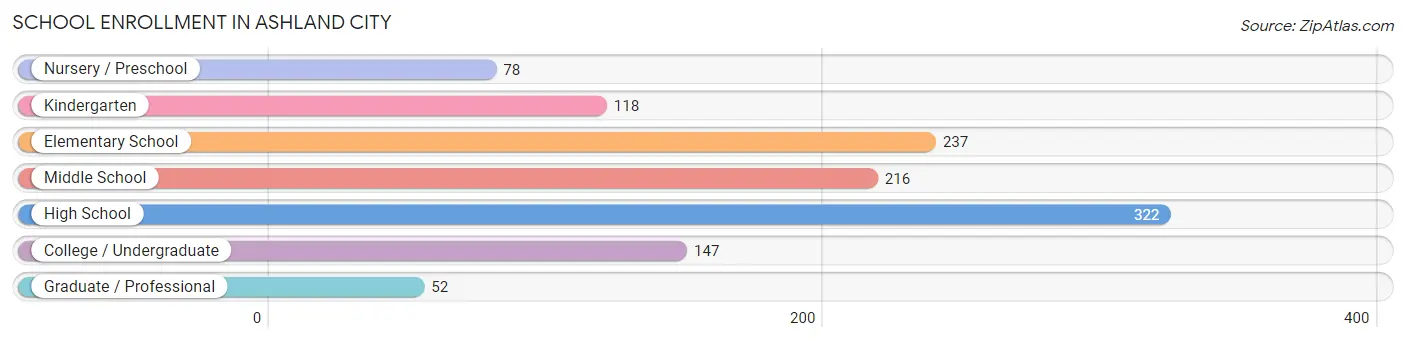
| School Level | # Students | % Students |
| Nursery / Preschool | 78 | 6.7% |
| Kindergarten | 118 | 10.1% |
| Elementary School | 237 | 20.3% |
| Middle School | 216 | 18.5% |
| High School | 322 | 27.5% |
| College / Undergraduate | 147 | 12.6% |
| Graduate / Professional | 52 | 4.4% |
| Total | 1,170 | 100.0% |
School Enrollment by Age by Funding Source in Ashland City
Out of a total of 1,170 students who are enrolled in schools in Ashland City, 270 (23.1%) attend a private institution, while the remaining 900 (76.9%) are enrolled in public schools. The age group of 3 to 4 year olds has the highest likelihood of being enrolled in private schools, with 44 (78.6% in the age bracket) enrolled. Conversely, the age group of 20 to 24 year olds has the lowest likelihood of being enrolled in a private school, with 27 (100.0% in the age bracket) attending a public institution.
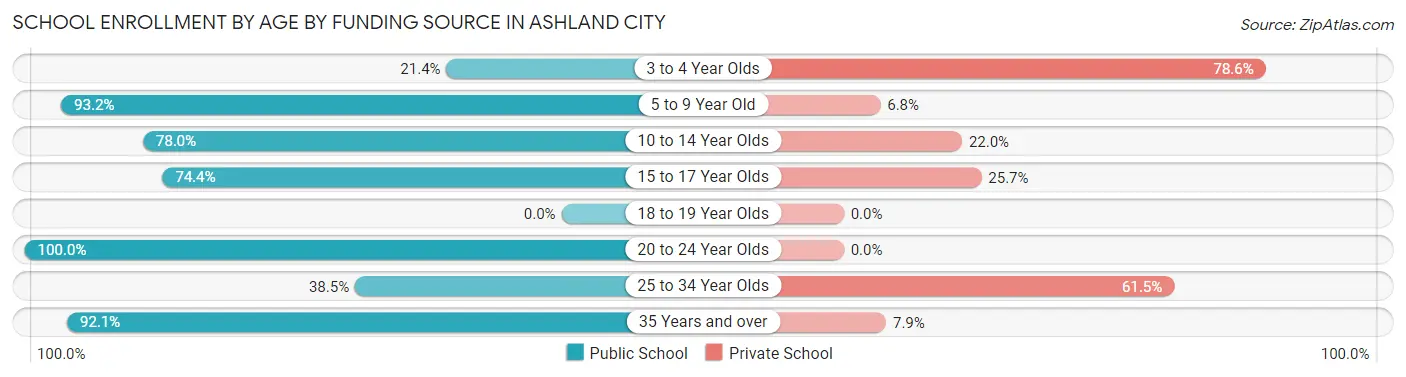
| Age Bracket | Public School | Private School |
| 3 to 4 Year Olds | 12 (21.4%) | 44 (78.6%) |
| 5 to 9 Year Old | 328 (93.2%) | 24 (6.8%) |
| 10 to 14 Year Olds | 223 (78.0%) | 63 (22.0%) |
| 15 to 17 Year Olds | 200 (74.4%) | 69 (25.7%) |
| 18 to 19 Year Olds | 0 (0.0%) | 0 (0.0%) |
| 20 to 24 Year Olds | 27 (100.0%) | 0 (0.0%) |
| 25 to 34 Year Olds | 40 (38.5%) | 64 (61.5%) |
| 35 Years and over | 70 (92.1%) | 6 (7.9%) |
| Total | 900 (76.9%) | 270 (23.1%) |
Educational Attainment by Field of Study in Ashland City
Business (212 | 22.1%), literature & languages (145 | 15.1%), education (114 | 11.9%), science & technology (105 | 11.0%), and computers & mathematics (84 | 8.8%) are the most common fields of study among 958 individuals in Ashland City who have obtained a bachelor's degree or higher.
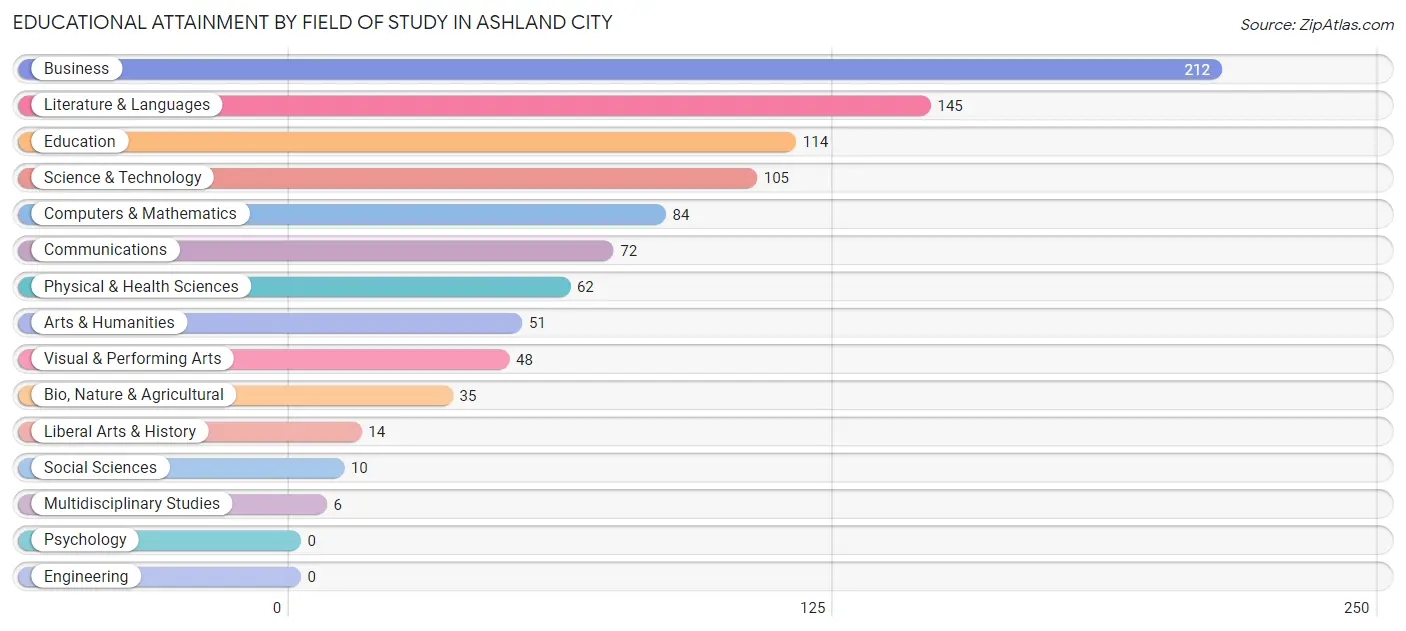
| Field of Study | # Graduates | % Graduates |
| Computers & Mathematics | 84 | 8.8% |
| Bio, Nature & Agricultural | 35 | 3.6% |
| Physical & Health Sciences | 62 | 6.5% |
| Psychology | 0 | 0.0% |
| Social Sciences | 10 | 1.0% |
| Engineering | 0 | 0.0% |
| Multidisciplinary Studies | 6 | 0.6% |
| Science & Technology | 105 | 11.0% |
| Business | 212 | 22.1% |
| Education | 114 | 11.9% |
| Literature & Languages | 145 | 15.1% |
| Liberal Arts & History | 14 | 1.5% |
| Visual & Performing Arts | 48 | 5.0% |
| Communications | 72 | 7.5% |
| Arts & Humanities | 51 | 5.3% |
| Total | 958 | 100.0% |
Transportation & Commute in Ashland City
Vehicle Availability by Sex in Ashland City
The most prevalent vehicle ownership categories in Ashland City are males with 2 vehicles (641, accounting for 45.7%) and females with 2 vehicles (471, making up 57.3%).
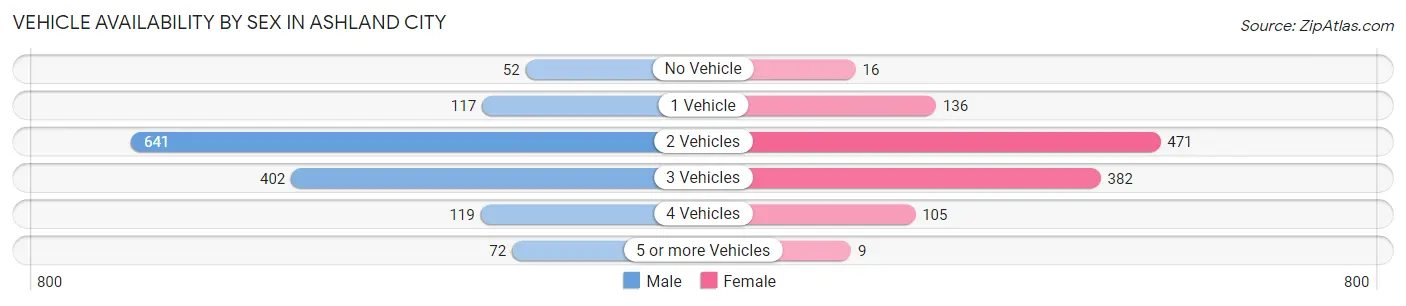
| Vehicles Available | Male | Female |
| No Vehicle | 52 (3.7%) | 16 (1.4%) |
| 1 Vehicle | 117 (8.3%) | 136 (12.1%) |
| 2 Vehicles | 641 (45.7%) | 471 (42.1%) |
| 3 Vehicles | 402 (28.6%) | 382 (34.1%) |
| 4 Vehicles | 119 (8.5%) | 105 (9.4%) |
| 5 or more Vehicles | 72 (5.1%) | 9 (0.8%) |
| Total | 1,403 (100.0%) | 1,119 (100.0%) |
Commute Time in Ashland City
The most frequently occuring commute durations in Ashland City are 30 to 34 minutes (401 commuters, 17.2%), 15 to 19 minutes (398 commuters, 17.1%), and 45 to 59 minutes (340 commuters, 14.6%).
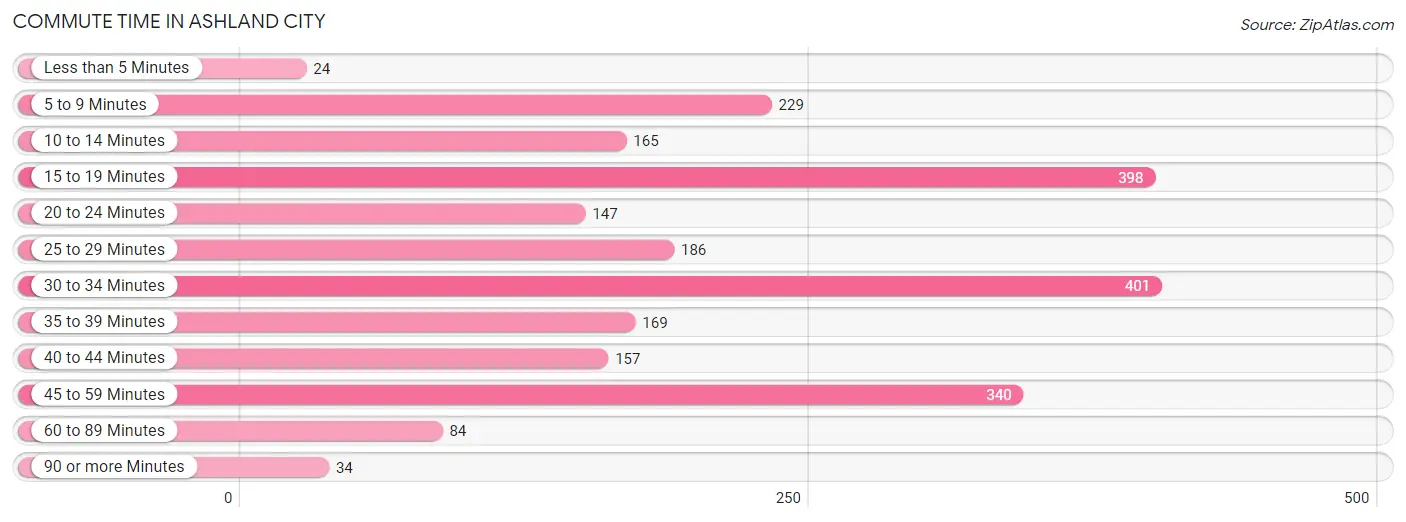
| Commute Time | # Commuters | % Commuters |
| Less than 5 Minutes | 24 | 1.0% |
| 5 to 9 Minutes | 229 | 9.8% |
| 10 to 14 Minutes | 165 | 7.1% |
| 15 to 19 Minutes | 398 | 17.1% |
| 20 to 24 Minutes | 147 | 6.3% |
| 25 to 29 Minutes | 186 | 8.0% |
| 30 to 34 Minutes | 401 | 17.2% |
| 35 to 39 Minutes | 169 | 7.2% |
| 40 to 44 Minutes | 157 | 6.7% |
| 45 to 59 Minutes | 340 | 14.6% |
| 60 to 89 Minutes | 84 | 3.6% |
| 90 or more Minutes | 34 | 1.5% |
Commute Time by Sex in Ashland City
The most common commute times in Ashland City are 30 to 34 minutes (311 commuters, 22.7%) for males and 45 to 59 minutes (230 commuters, 23.9%) for females.
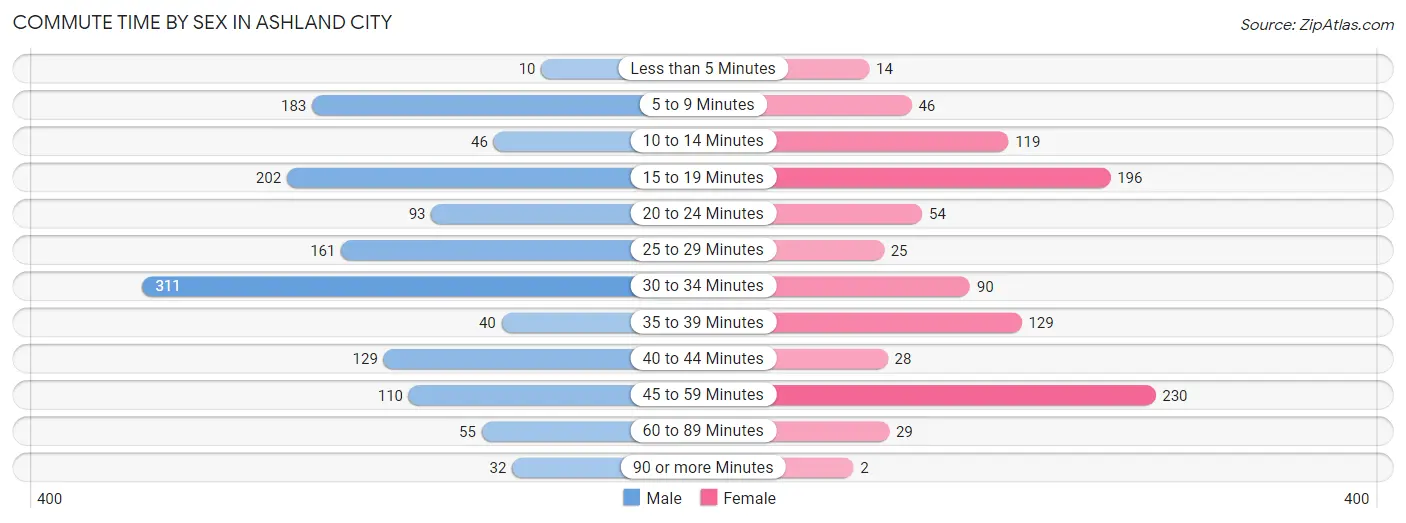
| Commute Time | Male | Female |
| Less than 5 Minutes | 10 (0.7%) | 14 (1.5%) |
| 5 to 9 Minutes | 183 (13.3%) | 46 (4.8%) |
| 10 to 14 Minutes | 46 (3.4%) | 119 (12.4%) |
| 15 to 19 Minutes | 202 (14.7%) | 196 (20.4%) |
| 20 to 24 Minutes | 93 (6.8%) | 54 (5.6%) |
| 25 to 29 Minutes | 161 (11.7%) | 25 (2.6%) |
| 30 to 34 Minutes | 311 (22.7%) | 90 (9.4%) |
| 35 to 39 Minutes | 40 (2.9%) | 129 (13.4%) |
| 40 to 44 Minutes | 129 (9.4%) | 28 (2.9%) |
| 45 to 59 Minutes | 110 (8.0%) | 230 (23.9%) |
| 60 to 89 Minutes | 55 (4.0%) | 29 (3.0%) |
| 90 or more Minutes | 32 (2.3%) | 2 (0.2%) |
Time of Departure to Work by Sex in Ashland City
The most frequent times of departure to work in Ashland City are 8:00 AM to 8:29 AM (175, 12.8%) for males and 8:00 AM to 8:29 AM (178, 18.5%) for females.
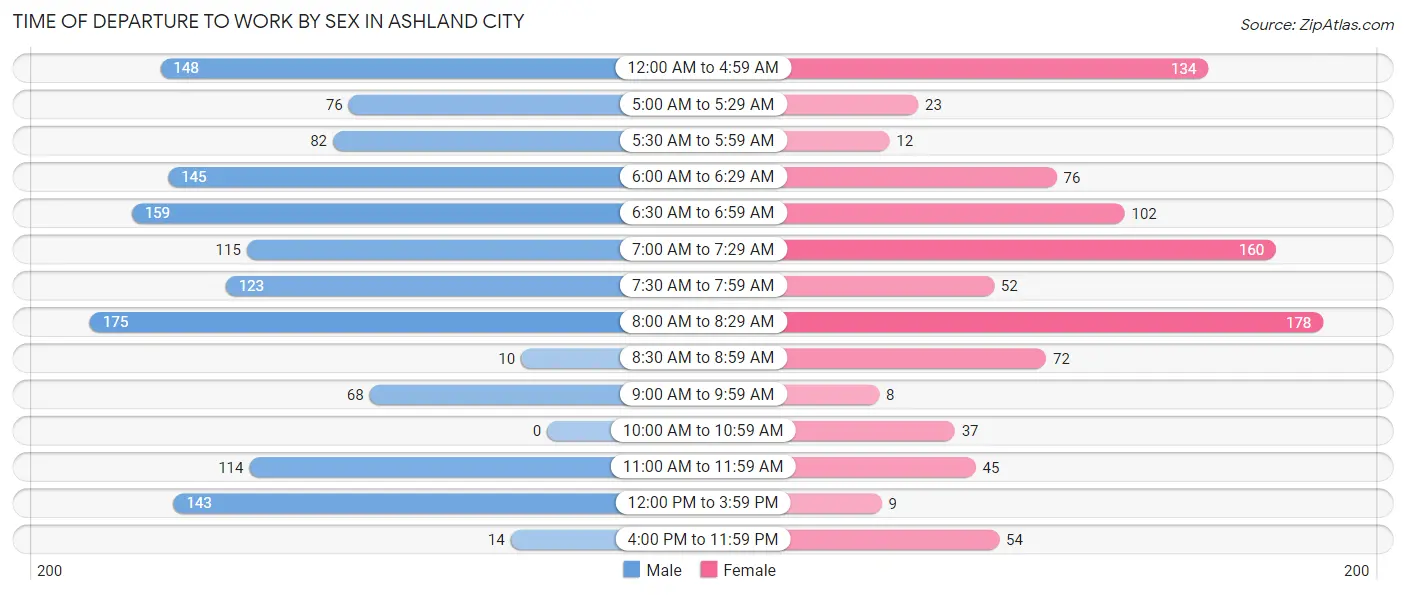
| Time of Departure | Male | Female |
| 12:00 AM to 4:59 AM | 148 (10.8%) | 134 (13.9%) |
| 5:00 AM to 5:29 AM | 76 (5.5%) | 23 (2.4%) |
| 5:30 AM to 5:59 AM | 82 (6.0%) | 12 (1.3%) |
| 6:00 AM to 6:29 AM | 145 (10.6%) | 76 (7.9%) |
| 6:30 AM to 6:59 AM | 159 (11.6%) | 102 (10.6%) |
| 7:00 AM to 7:29 AM | 115 (8.4%) | 160 (16.6%) |
| 7:30 AM to 7:59 AM | 123 (9.0%) | 52 (5.4%) |
| 8:00 AM to 8:29 AM | 175 (12.8%) | 178 (18.5%) |
| 8:30 AM to 8:59 AM | 10 (0.7%) | 72 (7.5%) |
| 9:00 AM to 9:59 AM | 68 (5.0%) | 8 (0.8%) |
| 10:00 AM to 10:59 AM | 0 (0.0%) | 37 (3.8%) |
| 11:00 AM to 11:59 AM | 114 (8.3%) | 45 (4.7%) |
| 12:00 PM to 3:59 PM | 143 (10.4%) | 9 (0.9%) |
| 4:00 PM to 11:59 PM | 14 (1.0%) | 54 (5.6%) |
| Total | 1,372 (100.0%) | 962 (100.0%) |
Housing Occupancy in Ashland City
Occupancy by Ownership in Ashland City
Of the total 1,995 dwellings in Ashland City, owner-occupied units account for 1,271 (63.7%), while renter-occupied units make up 724 (36.3%).
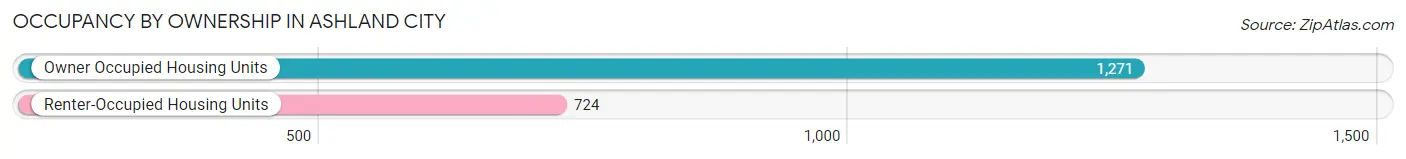
| Occupancy | # Housing Units | % Housing Units |
| Owner Occupied Housing Units | 1,271 | 63.7% |
| Renter-Occupied Housing Units | 724 | 36.3% |
| Total Occupied Housing Units | 1,995 | 100.0% |
Occupancy by Household Size in Ashland City
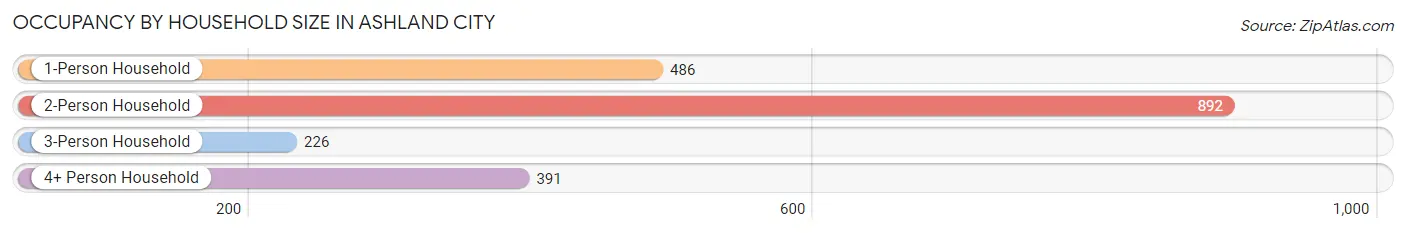
| Household Size | # Housing Units | % Housing Units |
| 1-Person Household | 486 | 24.4% |
| 2-Person Household | 892 | 44.7% |
| 3-Person Household | 226 | 11.3% |
| 4+ Person Household | 391 | 19.6% |
| Total Housing Units | 1,995 | 100.0% |
Occupancy by Ownership by Household Size in Ashland City
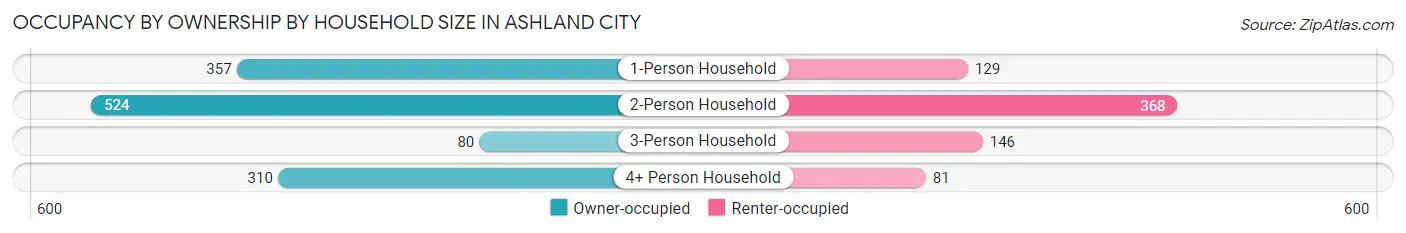
| Household Size | Owner-occupied | Renter-occupied |
| 1-Person Household | 357 (73.5%) | 129 (26.5%) |
| 2-Person Household | 524 (58.7%) | 368 (41.3%) |
| 3-Person Household | 80 (35.4%) | 146 (64.6%) |
| 4+ Person Household | 310 (79.3%) | 81 (20.7%) |
| Total Housing Units | 1,271 (63.7%) | 724 (36.3%) |
Occupancy by Educational Attainment in Ashland City
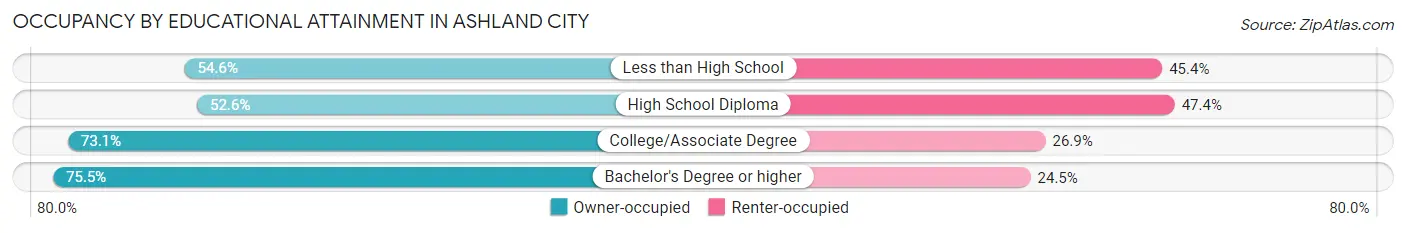
| Household Size | Owner-occupied | Renter-occupied |
| Less than High School | 59 (54.6%) | 49 (45.4%) |
| High School Diploma | 459 (52.6%) | 413 (47.4%) |
| College/Associate Degree | 411 (73.1%) | 151 (26.9%) |
| Bachelor's Degree or higher | 342 (75.5%) | 111 (24.5%) |
Occupancy by Age of Householder in Ashland City
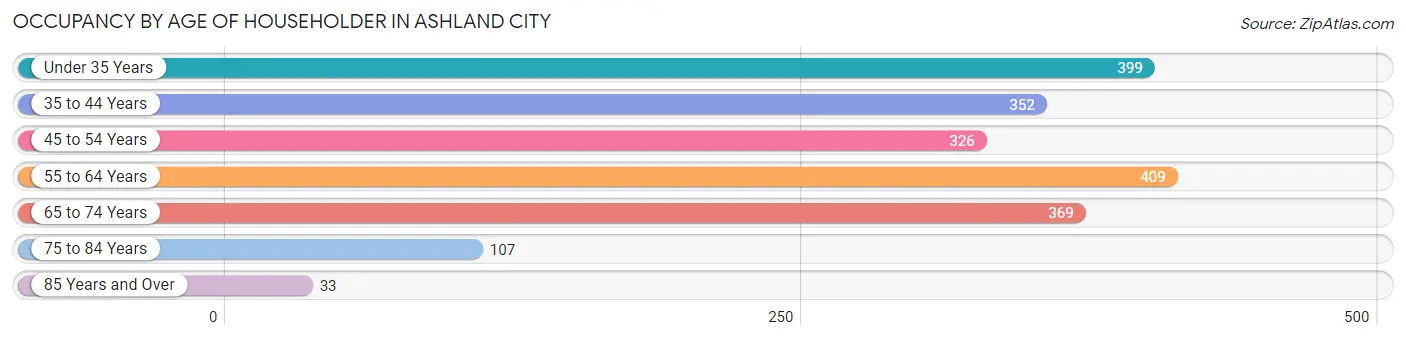
| Age Bracket | # Households | % Households |
| Under 35 Years | 399 | 20.0% |
| 35 to 44 Years | 352 | 17.6% |
| 45 to 54 Years | 326 | 16.3% |
| 55 to 64 Years | 409 | 20.5% |
| 65 to 74 Years | 369 | 18.5% |
| 75 to 84 Years | 107 | 5.4% |
| 85 Years and Over | 33 | 1.7% |
| Total | 1,995 | 100.0% |
Housing Finances in Ashland City
Median Income by Occupancy in Ashland City
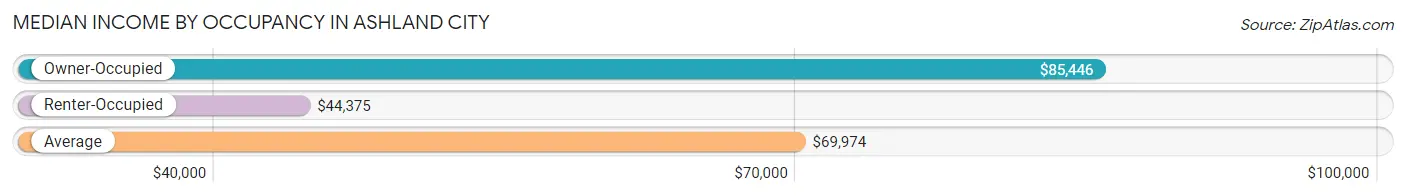
| Occupancy Type | # Households | Median Income |
| Owner-Occupied | 1,271 (63.7%) | $85,446 |
| Renter-Occupied | 724 (36.3%) | $44,375 |
| Average | 1,995 (100.0%) | $69,974 |
Occupancy by Householder Income Bracket in Ashland City
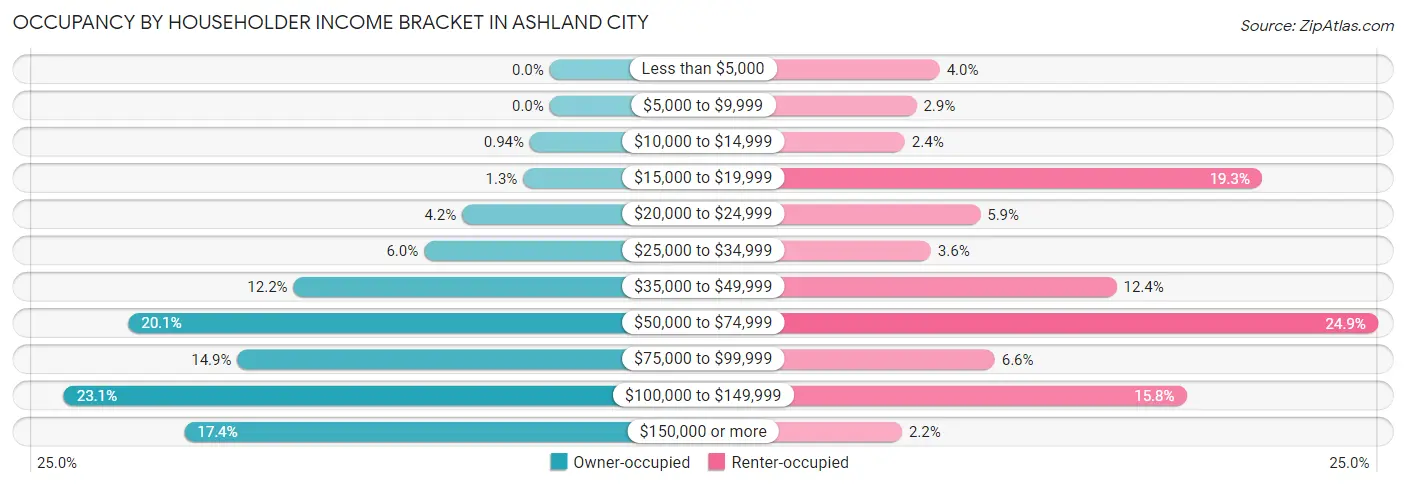
| Income Bracket | Owner-occupied | Renter-occupied |
| Less than $5,000 | 0 (0.0%) | 29 (4.0%) |
| $5,000 to $9,999 | 0 (0.0%) | 21 (2.9%) |
| $10,000 to $14,999 | 12 (0.9%) | 17 (2.4%) |
| $15,000 to $19,999 | 16 (1.3%) | 140 (19.3%) |
| $20,000 to $24,999 | 53 (4.2%) | 43 (5.9%) |
| $25,000 to $34,999 | 76 (6.0%) | 26 (3.6%) |
| $35,000 to $49,999 | 155 (12.2%) | 90 (12.4%) |
| $50,000 to $74,999 | 255 (20.1%) | 180 (24.9%) |
| $75,000 to $99,999 | 189 (14.9%) | 48 (6.6%) |
| $100,000 to $149,999 | 294 (23.1%) | 114 (15.8%) |
| $150,000 or more | 221 (17.4%) | 16 (2.2%) |
| Total | 1,271 (100.0%) | 724 (100.0%) |
Monthly Housing Cost Tiers in Ashland City
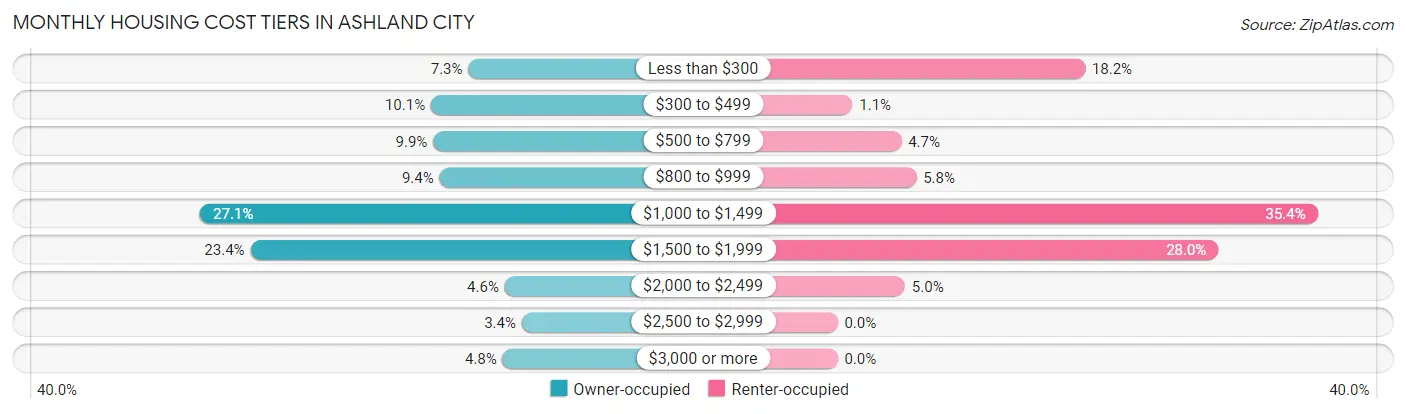
| Monthly Cost | Owner-occupied | Renter-occupied |
| Less than $300 | 93 (7.3%) | 132 (18.2%) |
| $300 to $499 | 128 (10.1%) | 8 (1.1%) |
| $500 to $799 | 126 (9.9%) | 34 (4.7%) |
| $800 to $999 | 120 (9.4%) | 42 (5.8%) |
| $1,000 to $1,499 | 344 (27.1%) | 256 (35.4%) |
| $1,500 to $1,999 | 297 (23.4%) | 203 (28.0%) |
| $2,000 to $2,499 | 59 (4.6%) | 36 (5.0%) |
| $2,500 to $2,999 | 43 (3.4%) | 0 (0.0%) |
| $3,000 or more | 61 (4.8%) | 0 (0.0%) |
| Total | 1,271 (100.0%) | 724 (100.0%) |
Physical Housing Characteristics in Ashland City
Housing Structures in Ashland City
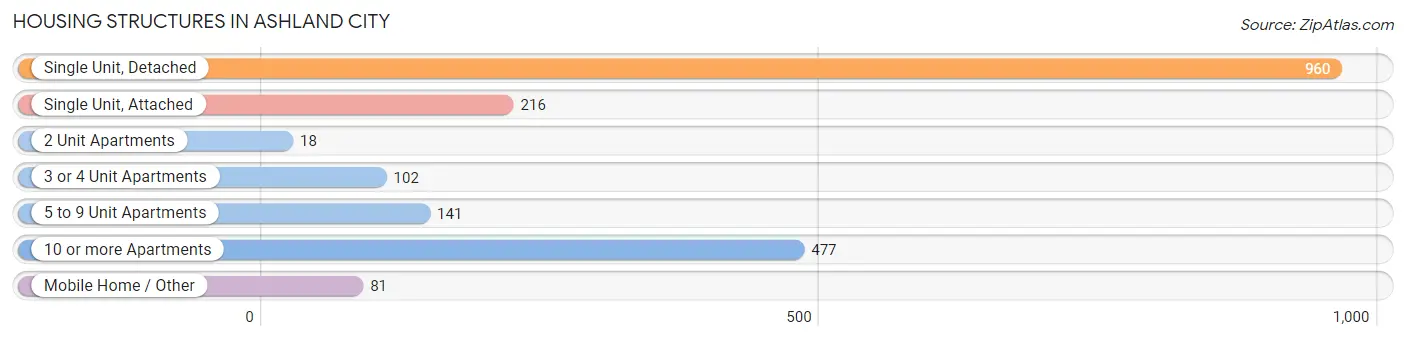
| Structure Type | # Housing Units | % Housing Units |
| Single Unit, Detached | 960 | 48.1% |
| Single Unit, Attached | 216 | 10.8% |
| 2 Unit Apartments | 18 | 0.9% |
| 3 or 4 Unit Apartments | 102 | 5.1% |
| 5 to 9 Unit Apartments | 141 | 7.1% |
| 10 or more Apartments | 477 | 23.9% |
| Mobile Home / Other | 81 | 4.1% |
| Total | 1,995 | 100.0% |
Housing Structures by Occupancy in Ashland City
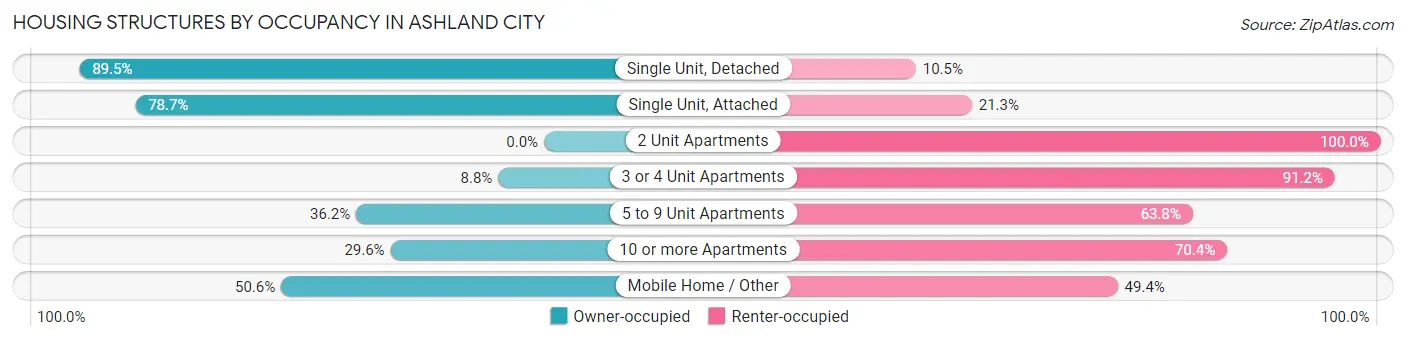
| Structure Type | Owner-occupied | Renter-occupied |
| Single Unit, Detached | 859 (89.5%) | 101 (10.5%) |
| Single Unit, Attached | 170 (78.7%) | 46 (21.3%) |
| 2 Unit Apartments | 0 (0.0%) | 18 (100.0%) |
| 3 or 4 Unit Apartments | 9 (8.8%) | 93 (91.2%) |
| 5 to 9 Unit Apartments | 51 (36.2%) | 90 (63.8%) |
| 10 or more Apartments | 141 (29.6%) | 336 (70.4%) |
| Mobile Home / Other | 41 (50.6%) | 40 (49.4%) |
| Total | 1,271 (63.7%) | 724 (36.3%) |
Housing Structures by Number of Rooms in Ashland City
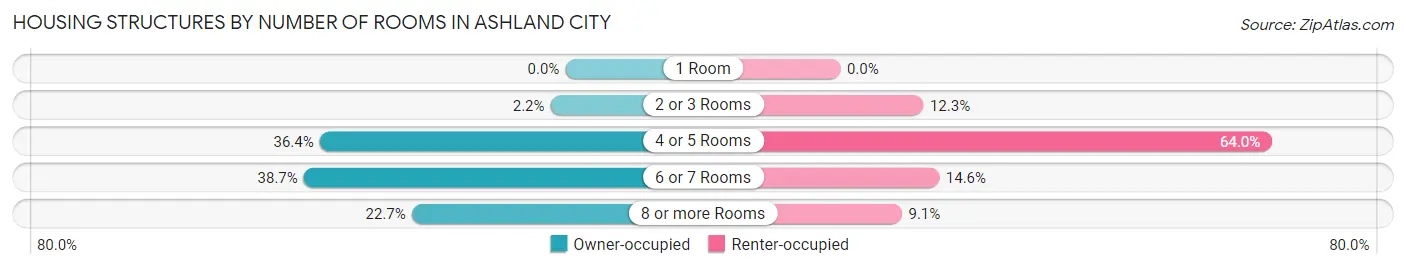
| Number of Rooms | Owner-occupied | Renter-occupied |
| 1 Room | 0 (0.0%) | 0 (0.0%) |
| 2 or 3 Rooms | 28 (2.2%) | 89 (12.3%) |
| 4 or 5 Rooms | 462 (36.3%) | 463 (63.9%) |
| 6 or 7 Rooms | 492 (38.7%) | 106 (14.6%) |
| 8 or more Rooms | 289 (22.7%) | 66 (9.1%) |
| Total | 1,271 (100.0%) | 724 (100.0%) |
Housing Structure by Heating Type in Ashland City
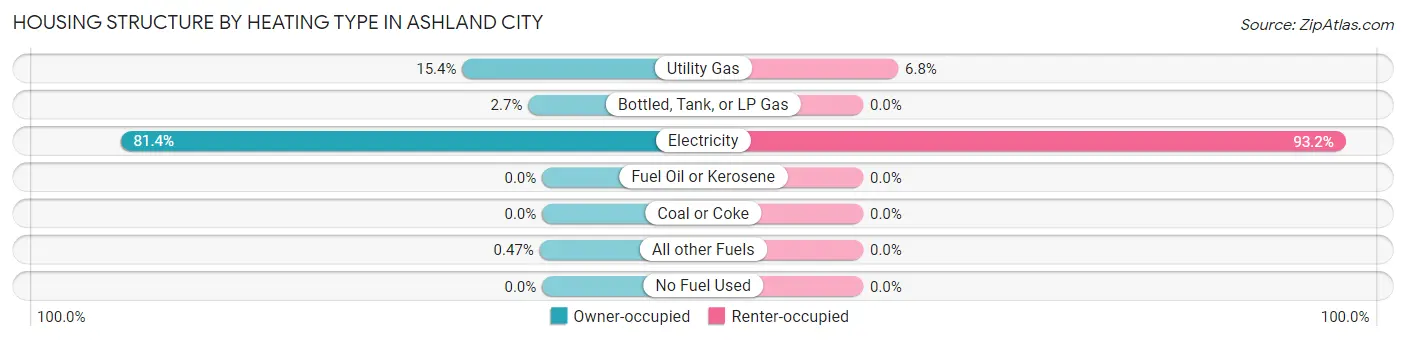
| Heating Type | Owner-occupied | Renter-occupied |
| Utility Gas | 196 (15.4%) | 49 (6.8%) |
| Bottled, Tank, or LP Gas | 34 (2.7%) | 0 (0.0%) |
| Electricity | 1,035 (81.4%) | 675 (93.2%) |
| Fuel Oil or Kerosene | 0 (0.0%) | 0 (0.0%) |
| Coal or Coke | 0 (0.0%) | 0 (0.0%) |
| All other Fuels | 6 (0.5%) | 0 (0.0%) |
| No Fuel Used | 0 (0.0%) | 0 (0.0%) |
| Total | 1,271 (100.0%) | 724 (100.0%) |
Household Vehicle Usage in Ashland City
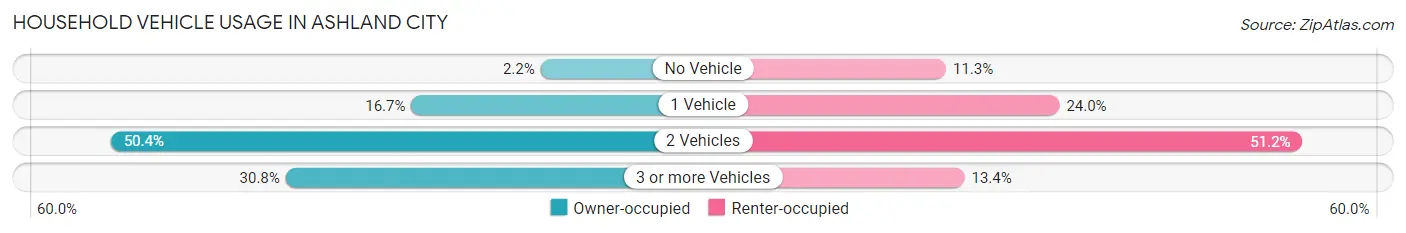
| Vehicles per Household | Owner-occupied | Renter-occupied |
| No Vehicle | 28 (2.2%) | 82 (11.3%) |
| 1 Vehicle | 212 (16.7%) | 174 (24.0%) |
| 2 Vehicles | 640 (50.3%) | 371 (51.2%) |
| 3 or more Vehicles | 391 (30.8%) | 97 (13.4%) |
| Total | 1,271 (100.0%) | 724 (100.0%) |
Real Estate & Mortgages in Ashland City
Real Estate and Mortgage Overview in Ashland City
| Characteristic | Without Mortgage | With Mortgage |
| Housing Units | 396 | 875 |
| Median Property Value | $210,200 | $237,200 |
| Median Household Income | $78,500 | $161 |
| Monthly Housing Costs | $475 | $61 |
| Real Estate Taxes | $1,326 | $21 |
Property Value by Mortgage Status in Ashland City
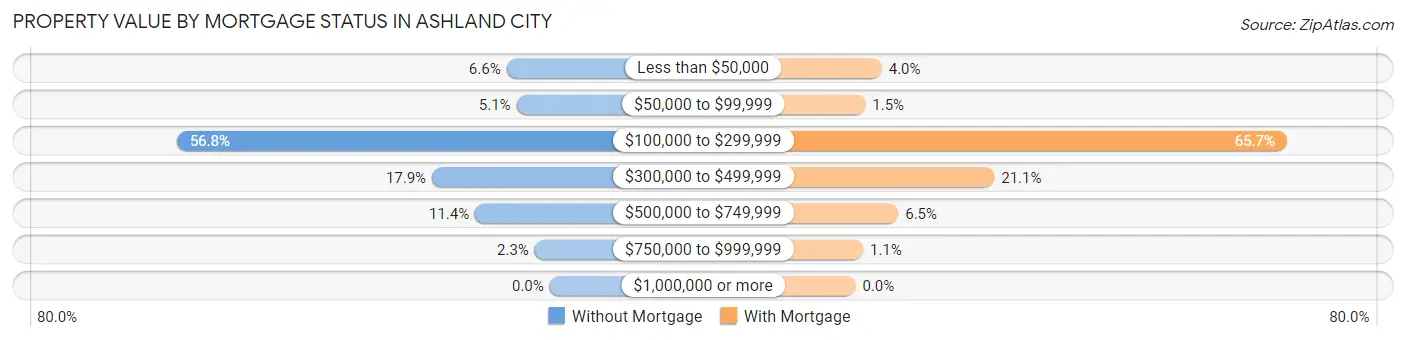
| Property Value | Without Mortgage | With Mortgage |
| Less than $50,000 | 26 (6.6%) | 35 (4.0%) |
| $50,000 to $99,999 | 20 (5.1%) | 13 (1.5%) |
| $100,000 to $299,999 | 225 (56.8%) | 575 (65.7%) |
| $300,000 to $499,999 | 71 (17.9%) | 185 (21.1%) |
| $500,000 to $749,999 | 45 (11.4%) | 57 (6.5%) |
| $750,000 to $999,999 | 9 (2.3%) | 10 (1.1%) |
| $1,000,000 or more | 0 (0.0%) | 0 (0.0%) |
| Total | 396 (100.0%) | 875 (100.0%) |
Household Income by Mortgage Status in Ashland City
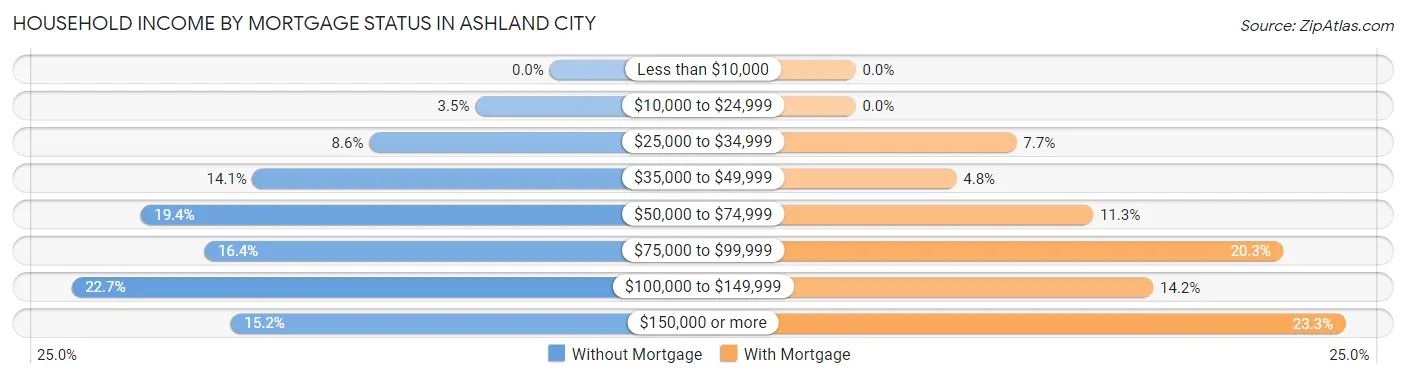
| Household Income | Without Mortgage | With Mortgage |
| Less than $10,000 | 0 (0.0%) | 0 (0.0%) |
| $10,000 to $24,999 | 14 (3.5%) | 0 (0.0%) |
| $25,000 to $34,999 | 34 (8.6%) | 67 (7.7%) |
| $35,000 to $49,999 | 56 (14.1%) | 42 (4.8%) |
| $50,000 to $74,999 | 77 (19.4%) | 99 (11.3%) |
| $75,000 to $99,999 | 65 (16.4%) | 178 (20.3%) |
| $100,000 to $149,999 | 90 (22.7%) | 124 (14.2%) |
| $150,000 or more | 60 (15.1%) | 204 (23.3%) |
| Total | 396 (100.0%) | 875 (100.0%) |
Property Value to Household Income Ratio in Ashland City
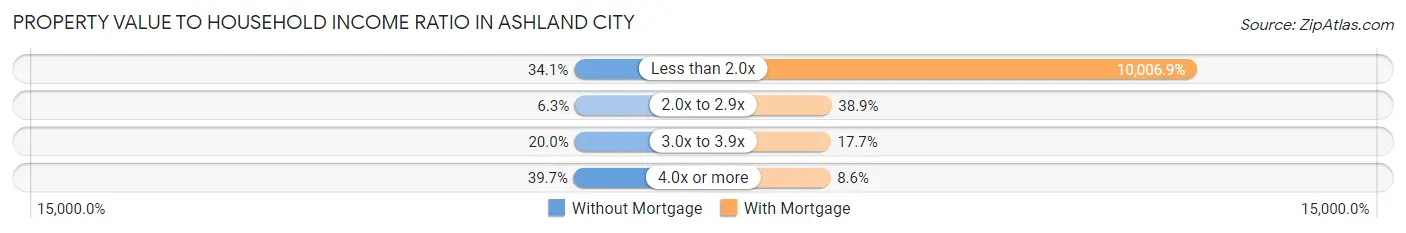
| Value-to-Income Ratio | Without Mortgage | With Mortgage |
| Less than 2.0x | 135 (34.1%) | 87,560 (10,006.9%) |
| 2.0x to 2.9x | 25 (6.3%) | 340 (38.9%) |
| 3.0x to 3.9x | 79 (20.0%) | 155 (17.7%) |
| 4.0x or more | 157 (39.7%) | 75 (8.6%) |
| Total | 396 (100.0%) | 875 (100.0%) |
Real Estate Taxes by Mortgage Status in Ashland City
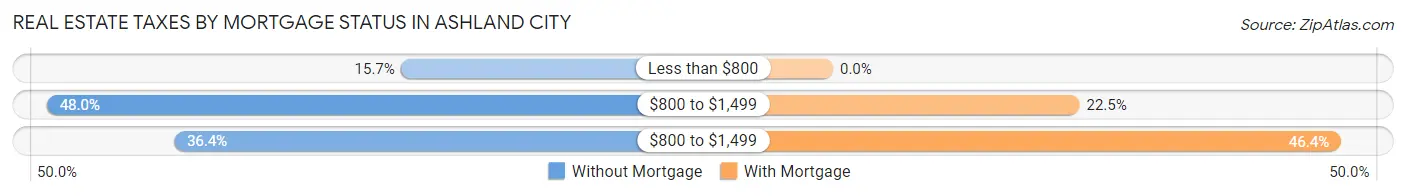
| Property Taxes | Without Mortgage | With Mortgage |
| Less than $800 | 62 (15.7%) | 0 (0.0%) |
| $800 to $1,499 | 190 (48.0%) | 197 (22.5%) |
| $800 to $1,499 | 144 (36.4%) | 406 (46.4%) |
| Total | 396 (100.0%) | 875 (100.0%) |
Health & Disability in Ashland City
Health Insurance Coverage by Age in Ashland City
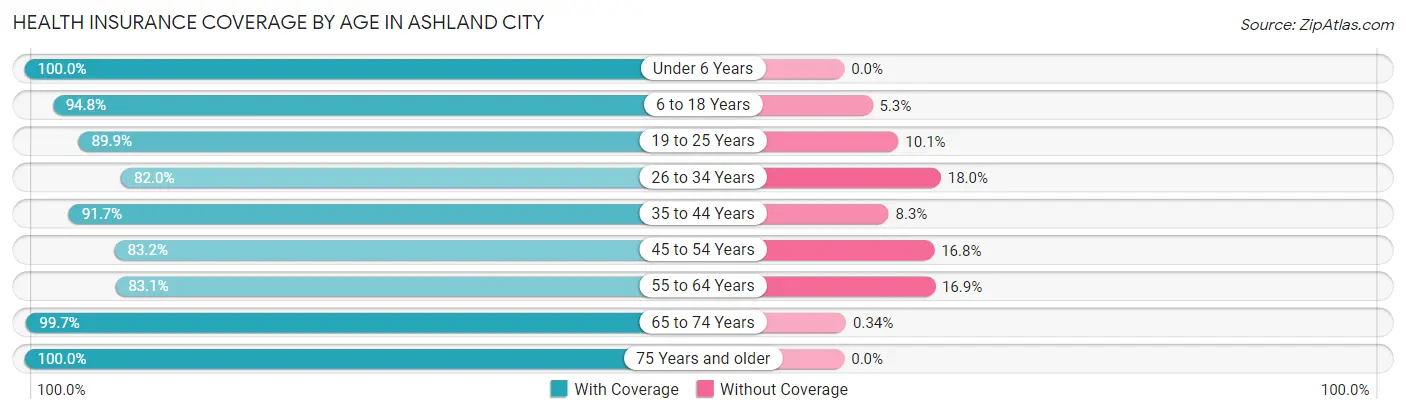
| Age Bracket | With Coverage | Without Coverage |
| Under 6 Years | 358 (100.0%) | 0 (0.0%) |
| 6 to 18 Years | 794 (94.8%) | 44 (5.2%) |
| 19 to 25 Years | 196 (89.9%) | 22 (10.1%) |
| 26 to 34 Years | 542 (82.0%) | 119 (18.0%) |
| 35 to 44 Years | 722 (91.7%) | 65 (8.3%) |
| 45 to 54 Years | 521 (83.2%) | 105 (16.8%) |
| 55 to 64 Years | 570 (83.1%) | 116 (16.9%) |
| 65 to 74 Years | 585 (99.7%) | 2 (0.3%) |
| 75 Years and older | 230 (100.0%) | 0 (0.0%) |
| Total | 4,518 (90.5%) | 473 (9.5%) |
Health Insurance Coverage by Citizenship Status in Ashland City
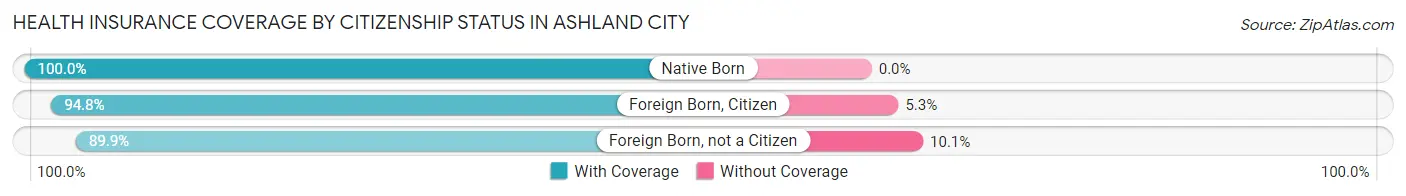
| Citizenship Status | With Coverage | Without Coverage |
| Native Born | 358 (100.0%) | 0 (0.0%) |
| Foreign Born, Citizen | 794 (94.8%) | 44 (5.2%) |
| Foreign Born, not a Citizen | 196 (89.9%) | 22 (10.1%) |
Health Insurance Coverage by Household Income in Ashland City
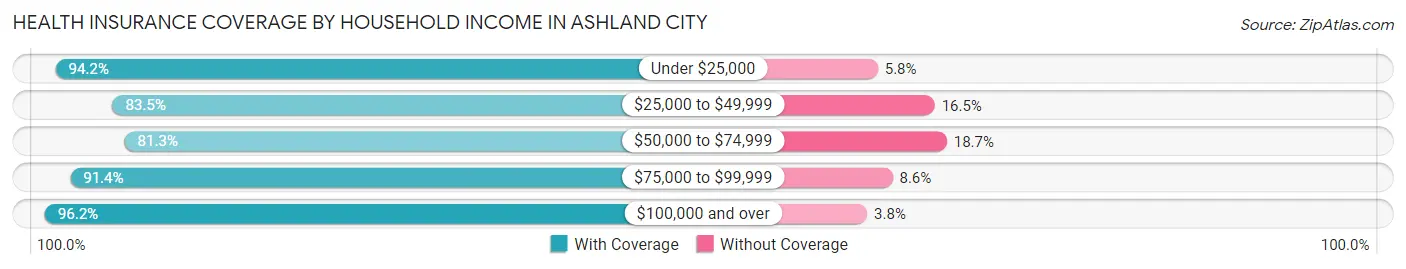
| Household Income | With Coverage | Without Coverage |
| Under $25,000 | 503 (94.2%) | 31 (5.8%) |
| $25,000 to $49,999 | 568 (83.5%) | 112 (16.5%) |
| $50,000 to $74,999 | 837 (81.3%) | 193 (18.7%) |
| $75,000 to $99,999 | 544 (91.4%) | 51 (8.6%) |
| $100,000 and over | 2,043 (96.2%) | 81 (3.8%) |
Public vs Private Health Insurance Coverage by Age in Ashland City
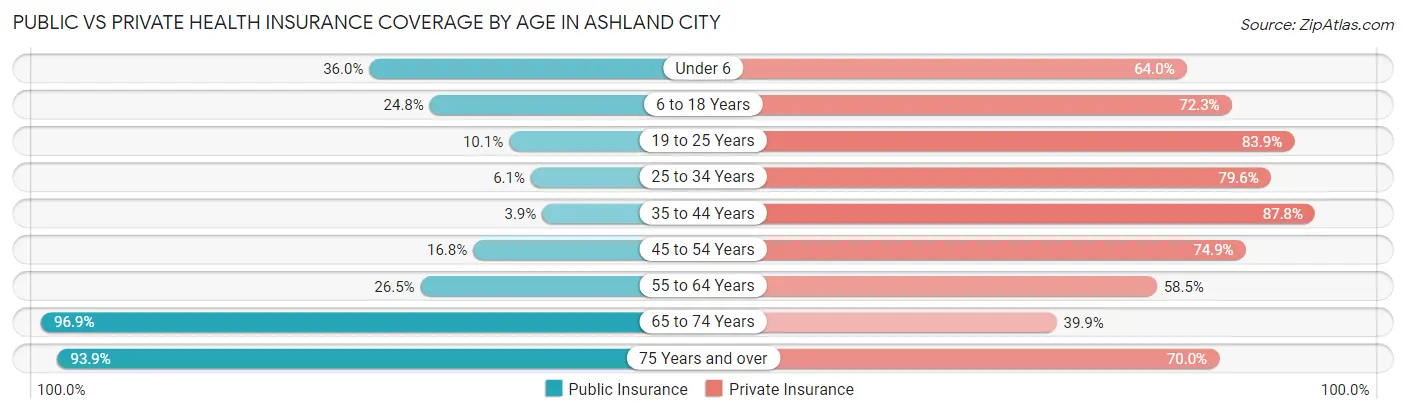
| Age Bracket | Public Insurance | Private Insurance |
| Under 6 | 129 (36.0%) | 229 (64.0%) |
| 6 to 18 Years | 208 (24.8%) | 606 (72.3%) |
| 19 to 25 Years | 22 (10.1%) | 183 (83.9%) |
| 25 to 34 Years | 40 (6.0%) | 526 (79.6%) |
| 35 to 44 Years | 31 (3.9%) | 691 (87.8%) |
| 45 to 54 Years | 105 (16.8%) | 469 (74.9%) |
| 55 to 64 Years | 182 (26.5%) | 401 (58.5%) |
| 65 to 74 Years | 569 (96.9%) | 234 (39.9%) |
| 75 Years and over | 216 (93.9%) | 161 (70.0%) |
| Total | 1,502 (30.1%) | 3,500 (70.1%) |
Disability Status by Sex by Age in Ashland City
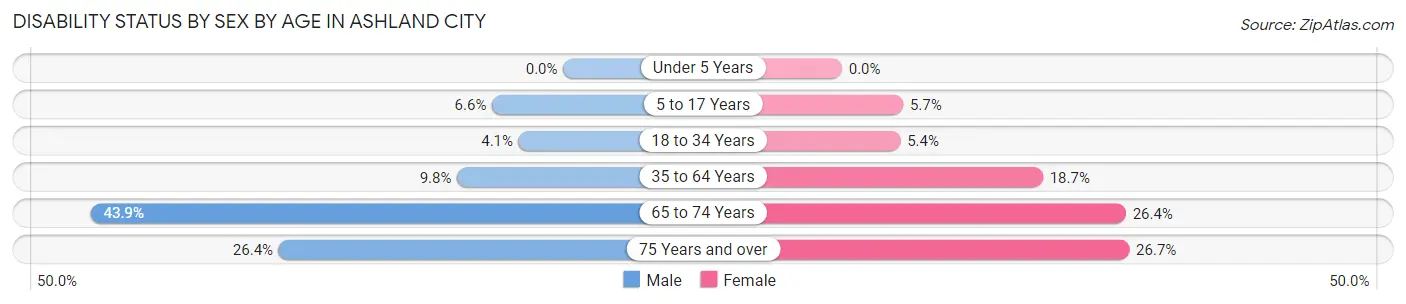
| Age Bracket | Male | Female |
| Under 5 Years | 0 (0.0%) | 0 (0.0%) |
| 5 to 17 Years | 25 (6.6%) | 31 (5.7%) |
| 18 to 34 Years | 18 (4.1%) | 24 (5.4%) |
| 35 to 64 Years | 100 (9.8%) | 202 (18.6%) |
| 65 to 74 Years | 111 (43.9%) | 88 (26.4%) |
| 75 Years and over | 33 (26.4%) | 28 (26.7%) |
Disability Class by Sex by Age in Ashland City
Disability Class: Hearing Difficulty
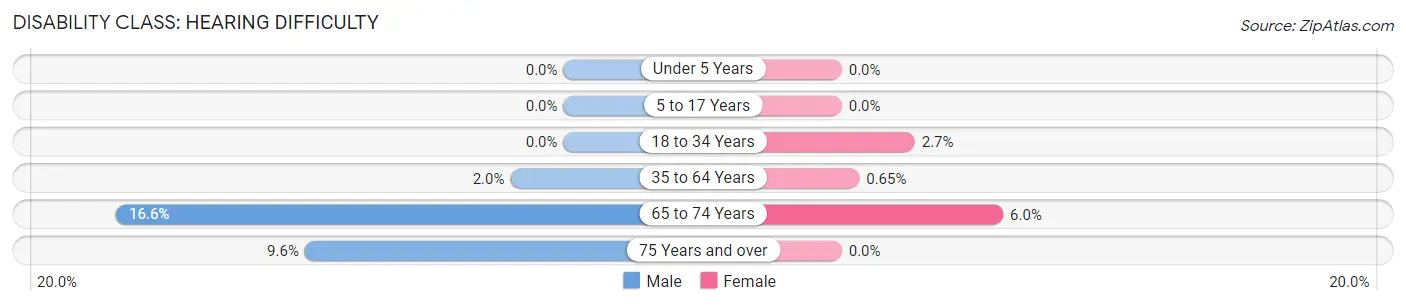
| Age Bracket | Male | Female |
| Under 5 Years | 0 (0.0%) | 0 (0.0%) |
| 5 to 17 Years | 0 (0.0%) | 0 (0.0%) |
| 18 to 34 Years | 0 (0.0%) | 12 (2.7%) |
| 35 to 64 Years | 20 (2.0%) | 7 (0.6%) |
| 65 to 74 Years | 42 (16.6%) | 20 (6.0%) |
| 75 Years and over | 12 (9.6%) | 0 (0.0%) |
Disability Class: Vision Difficulty
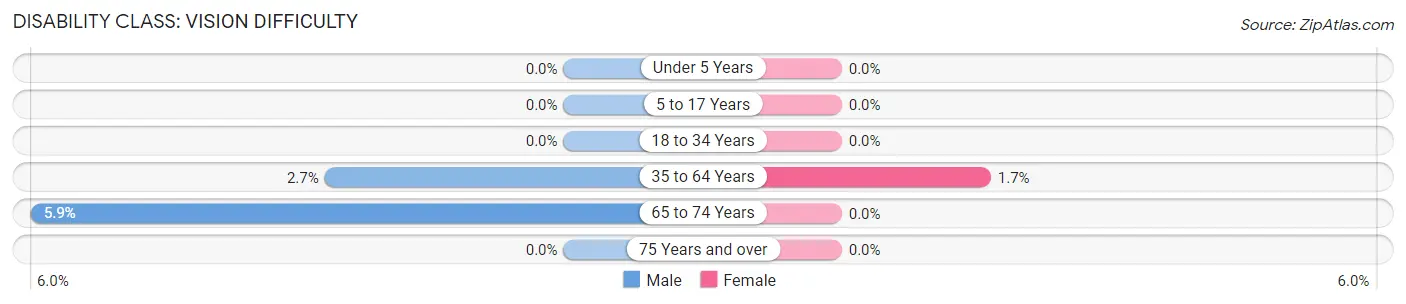
| Age Bracket | Male | Female |
| Under 5 Years | 0 (0.0%) | 0 (0.0%) |
| 5 to 17 Years | 0 (0.0%) | 0 (0.0%) |
| 18 to 34 Years | 0 (0.0%) | 0 (0.0%) |
| 35 to 64 Years | 27 (2.7%) | 18 (1.7%) |
| 65 to 74 Years | 15 (5.9%) | 0 (0.0%) |
| 75 Years and over | 0 (0.0%) | 0 (0.0%) |
Disability Class: Cognitive Difficulty
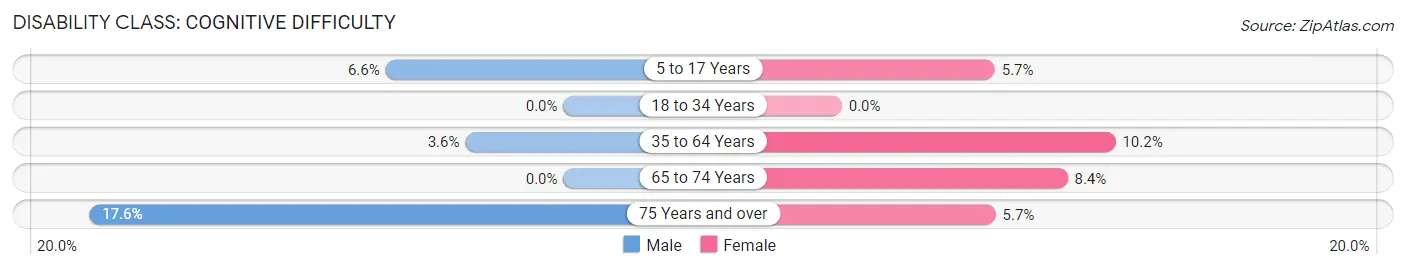
| Age Bracket | Male | Female |
| 5 to 17 Years | 25 (6.6%) | 31 (5.7%) |
| 18 to 34 Years | 0 (0.0%) | 0 (0.0%) |
| 35 to 64 Years | 37 (3.6%) | 110 (10.2%) |
| 65 to 74 Years | 0 (0.0%) | 28 (8.4%) |
| 75 Years and over | 22 (17.6%) | 6 (5.7%) |
Disability Class: Ambulatory Difficulty
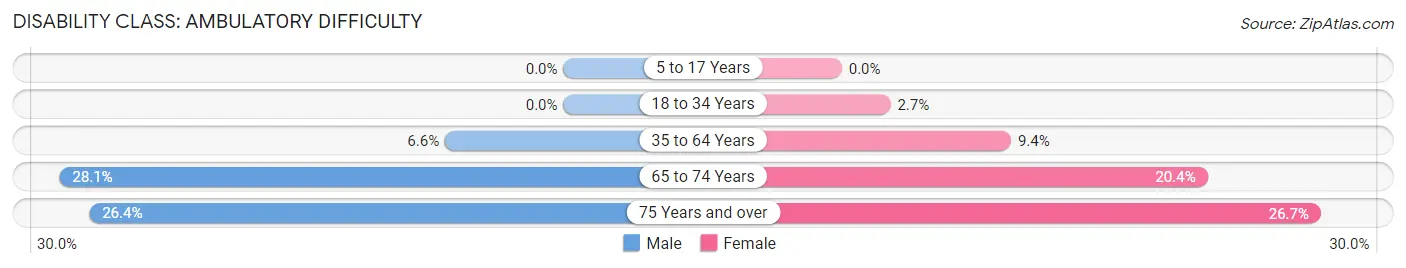
| Age Bracket | Male | Female |
| 5 to 17 Years | 0 (0.0%) | 0 (0.0%) |
| 18 to 34 Years | 0 (0.0%) | 12 (2.7%) |
| 35 to 64 Years | 67 (6.6%) | 102 (9.4%) |
| 65 to 74 Years | 71 (28.1%) | 68 (20.4%) |
| 75 Years and over | 33 (26.4%) | 28 (26.7%) |
Disability Class: Self-Care Difficulty
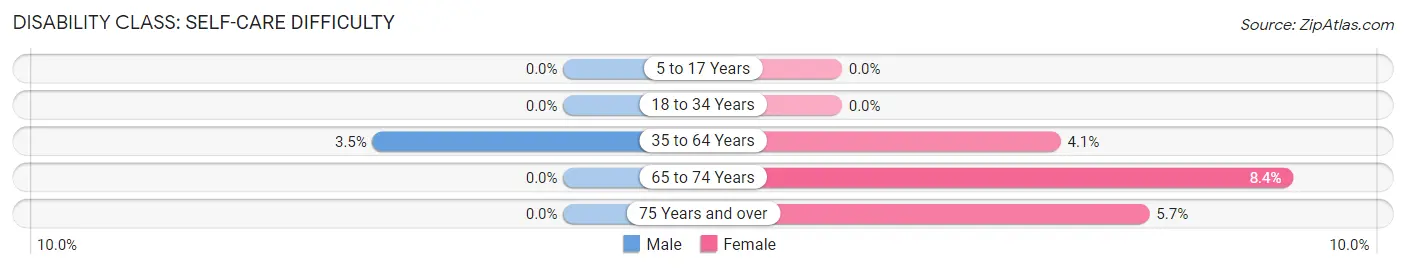
| Age Bracket | Male | Female |
| 5 to 17 Years | 0 (0.0%) | 0 (0.0%) |
| 18 to 34 Years | 0 (0.0%) | 0 (0.0%) |
| 35 to 64 Years | 36 (3.5%) | 44 (4.1%) |
| 65 to 74 Years | 0 (0.0%) | 28 (8.4%) |
| 75 Years and over | 0 (0.0%) | 6 (5.7%) |
Technology Access in Ashland City
Computing Device Access in Ashland City
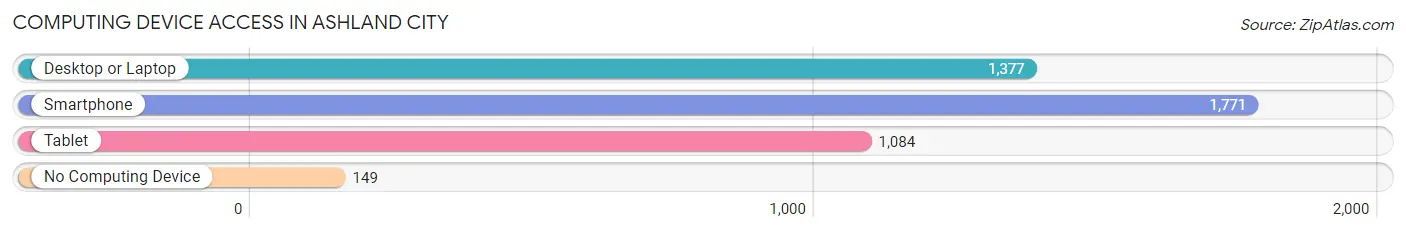
| Device Type | # Households | % Households |
| Desktop or Laptop | 1,377 | 69.0% |
| Smartphone | 1,771 | 88.8% |
| Tablet | 1,084 | 54.3% |
| No Computing Device | 149 | 7.5% |
| Total | 1,995 | 100.0% |
Internet Access in Ashland City
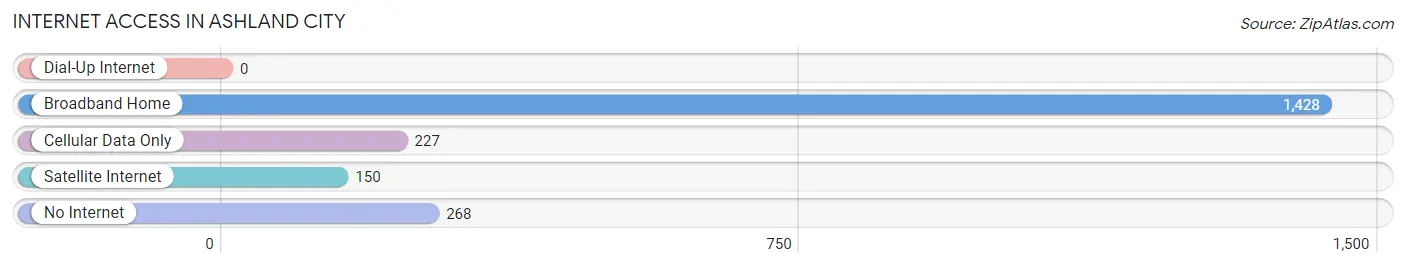
| Internet Type | # Households | % Households |
| Dial-Up Internet | 0 | 0.0% |
| Broadband Home | 1,428 | 71.6% |
| Cellular Data Only | 227 | 11.4% |
| Satellite Internet | 150 | 7.5% |
| No Internet | 268 | 13.4% |
| Total | 1,995 | 100.0% |
Ashland City Summary
Ashland City is a town located in Cheatham County, Tennessee, United States. It is located along the Cumberland River, approximately 25 miles northwest of Nashville. The population was 4,541 at the 2010 census.
History
The area that is now Ashland City was first settled in the early 1800s by a group of settlers from North Carolina. The town was originally known as "Cottonport" due to the large number of cotton plantations in the area. In 1856, the town was renamed Ashland City after the nearby Ashland estate of Henry Clay, a prominent Kentucky statesman.
The town was incorporated in 1859 and was the county seat of Cheatham County until 1887, when the county seat was moved to nearby Pleasant View. In the late 19th century, Ashland City was a major center for the production of cotton and tobacco. The town also had a large number of sawmills and gristmills, as well as a number of other businesses.
In the early 20th century, the town began to decline as the local economy shifted away from agriculture and towards manufacturing. The Great Depression further exacerbated the town's economic woes, and by the 1950s, the town had become a virtual ghost town.
In the late 20th century, the town began to experience a resurgence as a result of its proximity to Nashville. The town has since become a popular tourist destination, with a number of antique shops, restaurants, and other attractions.
Geography
Ashland City is located at 36°14'45" North, 87°2'45" West (36.245833, -87.045556). According to the United States Census Bureau, the town has a total area of 4.2 square miles, all of it land.
Economy
The economy of Ashland City is largely based on tourism and retail. The town is home to a number of antique shops, restaurants, and other attractions. The town is also home to a number of manufacturing and industrial businesses, including a paper mill and a plastics factory.
Demographics
As of the census of 2010, there were 4,541 people, 1,845 households, and 1,213 families residing in the town. The population density was 1,082.2 people per square mile. There were 2,039 housing units at an average density of 487.3 per square mile. The racial makeup of the town was 87.2% White, 8.3% African American, 0.3% Native American, 0.7% Asian, 0.1% Pacific Islander, 1.2% from other races, and 2.3% from two or more races. Hispanic or Latino of any race were 3.2% of the population.
There were 1,845 households, out of which 28.2% had children under the age of 18 living with them, 46.2% were married couples living together, 14.7% had a female householder with no husband present, and 33.7% were non-families. 28.2% of all households were made up of individuals, and 11.2% had someone living alone who was 65 years of age or older. The average household size was 2.44 and the average family size was 2.97.
In the town, the population was spread out, with 24.2% under the age of 18, 8.2% from 18 to 24, 28.7% from 25 to 44, 24.2% from 45 to 64, and 14.7% who were 65 years of age or older. The median age was 37 years. For every 100 females, there were 91.2 males. For every 100 females age 18 and over, there were 87.3 males.
The median income for a household in the town was $35,938, and the median income for a family was $41,964. Males had a median income of $31,964 versus $22,917 for females. The per capita income for the town was $17,945. About 10.2% of families and 13.2% of the population were below the poverty line, including 17.2% of those under age 18 and 11.2% of those age 65 or over.
Common Questions
What is Per Capita Income in Ashland City?
Per Capita income in Ashland City is $38,625.
What is the Median Family Income in Ashland City?
Median Family Income in Ashland City is $73,893.
What is the Median Household income in Ashland City?
Median Household Income in Ashland City is $69,974.
What is Income or Wage Gap in Ashland City?
Income or Wage Gap in Ashland City is 31.6%.
Women in Ashland City earn 68.4 cents for every dollar earned by a man.
What is Inequality or Gini Index in Ashland City?
Inequality or Gini Index in Ashland City is 0.48.
What is the Total Population of Ashland City?
Total Population of Ashland City is 5,213.
What is the Total Male Population of Ashland City?
Total Male Population of Ashland City is 2,483.
What is the Total Female Population of Ashland City?
Total Female Population of Ashland City is 2,730.
What is the Ratio of Males per 100 Females in Ashland City?
There are 90.95 Males per 100 Females in Ashland City.
What is the Ratio of Females per 100 Males in Ashland City?
There are 109.95 Females per 100 Males in Ashland City.
What is the Median Population Age in Ashland City?
Median Population Age in Ashland City is 40.3 Years.
What is the Average Family Size in Ashland City
Average Family Size in Ashland City is 3.2 People.
What is the Average Household Size in Ashland City
Average Household Size in Ashland City is 2.5 People.
How Large is the Labor Force in Ashland City?
There are 2,754 People in the Labor Forcein in Ashland City.
What is the Percentage of People in the Labor Force in Ashland City?
65.6% of People are in the Labor Force in Ashland City.
What is the Unemployment Rate in Ashland City?
Unemployment Rate in Ashland City is 4.9%.