Granite Hills, CA Map & Demographics
Granite Hills Map
Granite Hills Overview
$43,104
PER CAPITA INCOME
$154,107
AVG FAMILY INCOME
$141,774
AVG HOUSEHOLD INCOME
23.6%
WAGE / INCOME GAP [ % ]
76.4¢/ $1
WAGE / INCOME GAP [ $ ]
0.40
INEQUALITY / GINI INDEX
4,525
TOTAL POPULATION
2,345
MALE POPULATION
2,180
FEMALE POPULATION
107.57
MALES / 100 FEMALES
92.96
FEMALES / 100 MALES
38.0
MEDIAN AGE
3.9
AVG FAMILY SIZE
3.8
AVG HOUSEHOLD SIZE
2,162
LABOR FORCE [ PEOPLE ]
61.0%
PERCENT IN LABOR FORCE
14.4%
UNEMPLOYMENT RATE
Income in Granite Hills
Income Overview in Granite Hills
Per Capita Income in Granite Hills is $43,104, while median incomes of families and households are $154,107 and $141,774 respectively.
| Characteristic | Number | Measure |
| Per Capita Income | 4,525 | $43,104 |
| Median Family Income | 1,095 | $154,107 |
| Mean Family Income | 1,095 | $165,993 |
| Median Household Income | 1,192 | $141,774 |
| Mean Household Income | 1,192 | $159,132 |
| Income Deficit | 1,095 | $0 |
| Wage / Income Gap (%) | 4,525 | 23.63% |
| Wage / Income Gap ($) | 4,525 | 76.37¢ per $1 |
| Gini / Inequality Index | 4,525 | 0.40 |
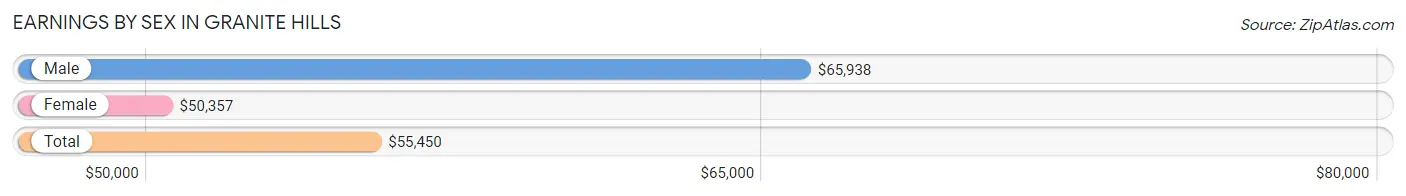
Earnings by Sex in Granite Hills
Average Earnings in Granite Hills are $55,450, $65,938 for men and $50,357 for women, a difference of 23.6%.
| Sex | Number | Average Earnings |
| Male | 1,184 (52.3%) | $65,938 |
| Female | 1,078 (47.7%) | $50,357 |
| Total | 2,262 (100.0%) | $55,450 |
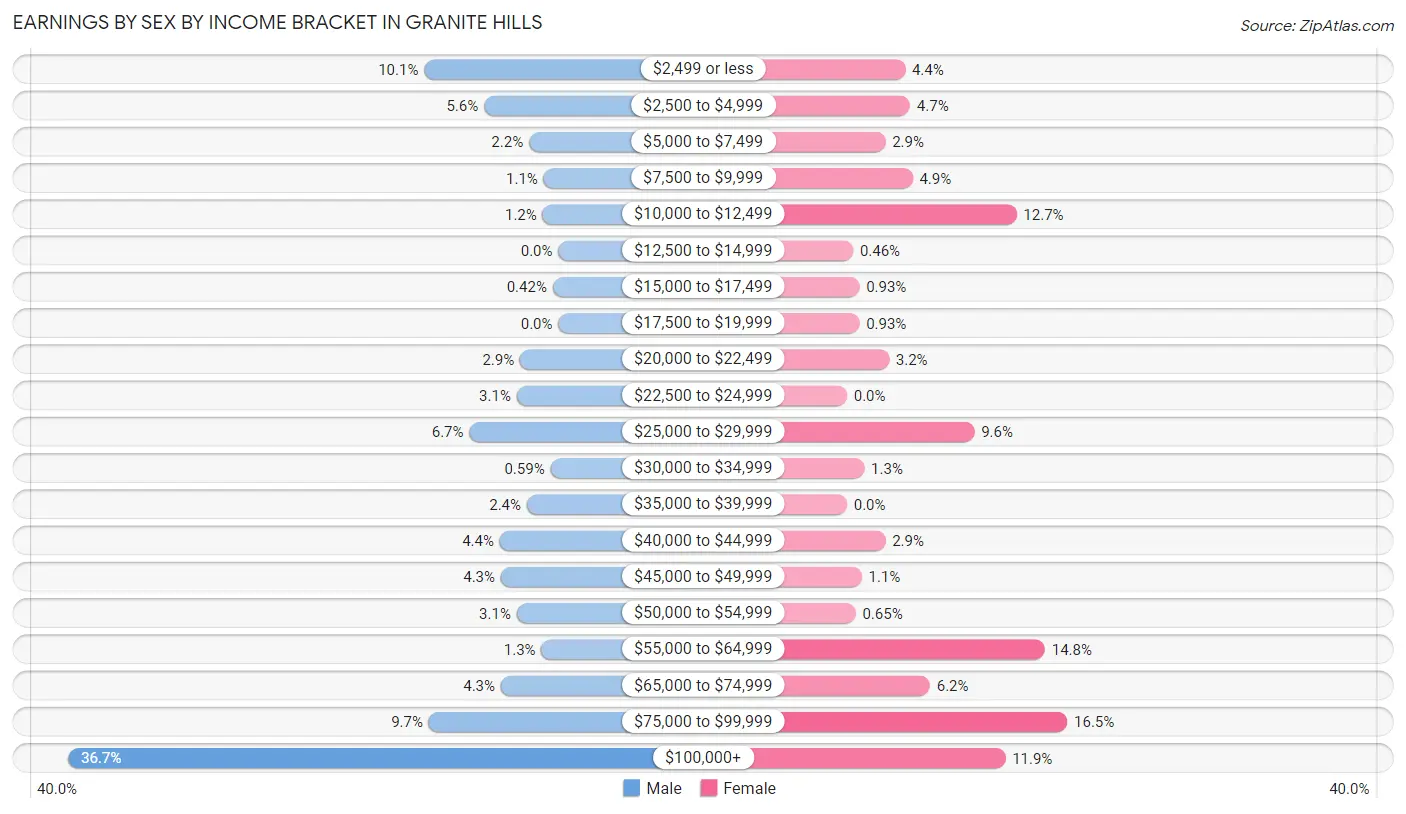
Earnings by Sex by Income Bracket in Granite Hills
The most common earnings brackets in Granite Hills are $100,000+ for men (435 | 36.7%) and $75,000 to $99,999 for women (178 | 16.5%).
| Income | Male | Female |
| $2,499 or less | 119 (10.1%) | 47 (4.4%) |
| $2,500 to $4,999 | 66 (5.6%) | 51 (4.7%) |
| $5,000 to $7,499 | 26 (2.2%) | 31 (2.9%) |
| $7,500 to $9,999 | 13 (1.1%) | 53 (4.9%) |
| $10,000 to $12,499 | 14 (1.2%) | 137 (12.7%) |
| $12,500 to $14,999 | 0 (0.0%) | 5 (0.5%) |
| $15,000 to $17,499 | 5 (0.4%) | 10 (0.9%) |
| $17,500 to $19,999 | 0 (0.0%) | 10 (0.9%) |
| $20,000 to $22,499 | 34 (2.9%) | 34 (3.2%) |
| $22,500 to $24,999 | 37 (3.1%) | 0 (0.0%) |
| $25,000 to $29,999 | 79 (6.7%) | 103 (9.6%) |
| $30,000 to $34,999 | 7 (0.6%) | 14 (1.3%) |
| $35,000 to $39,999 | 28 (2.4%) | 0 (0.0%) |
| $40,000 to $44,999 | 52 (4.4%) | 31 (2.9%) |
| $45,000 to $49,999 | 51 (4.3%) | 12 (1.1%) |
| $50,000 to $54,999 | 37 (3.1%) | 7 (0.6%) |
| $55,000 to $64,999 | 15 (1.3%) | 160 (14.8%) |
| $65,000 to $74,999 | 51 (4.3%) | 67 (6.2%) |
| $75,000 to $99,999 | 115 (9.7%) | 178 (16.5%) |
| $100,000+ | 435 (36.7%) | 128 (11.9%) |
| Total | 1,184 (100.0%) | 1,078 (100.0%) |
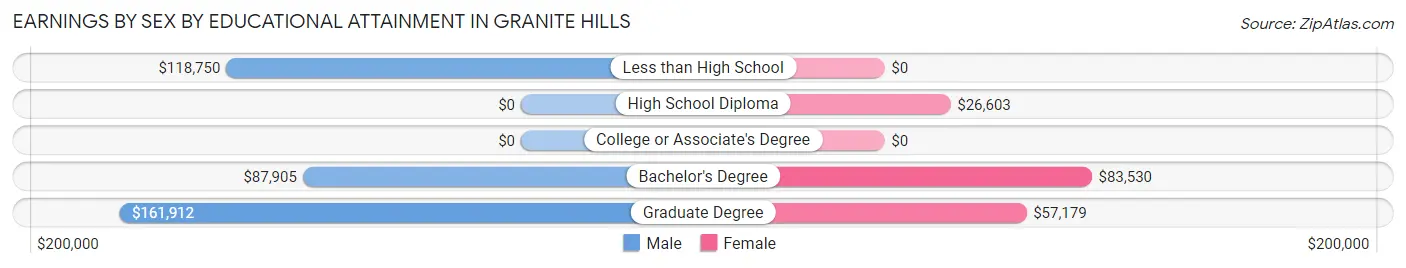
Earnings by Sex by Educational Attainment in Granite Hills
Average earnings in Granite Hills are $76,250 for men and $56,353 for women, a difference of 26.1%. Men with an educational attainment of graduate degree enjoy the highest average annual earnings of $161,912, while those with bachelor's degree education earn the least with $87,905. Women with an educational attainment of bachelor's degree earn the most with the average annual earnings of $83,530, while those with high school diploma education have the smallest earnings of $26,603.
| Educational Attainment | Male Income | Female Income |
| Less than High School | $118,750 | $0 |
| High School Diploma | - | - |
| College or Associate's Degree | - | - |
| Bachelor's Degree | $87,905 | $83,530 |
| Graduate Degree | $161,912 | $57,179 |
| Total | $76,250 | $56,353 |
Family Income in Granite Hills
Family Income Brackets in Granite Hills
According to the Granite Hills family income data, there are 418 families falling into the $200,000+ income range, which is the most common income bracket and makes up 38.2% of all families. Conversely, the $50,000 to $74,999 income bracket is the least frequent group with only 20 families (1.8%) belonging to this category.
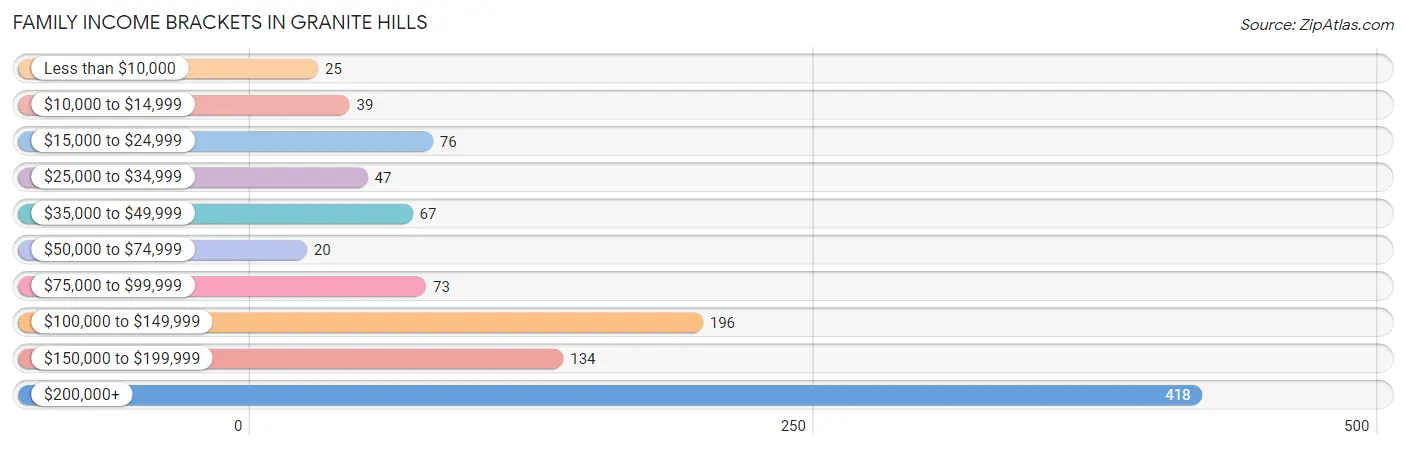
| Income Bracket | # Families | % Families |
| Less than $10,000 | 25 | 2.3% |
| $10,000 to $14,999 | 39 | 3.6% |
| $15,000 to $24,999 | 76 | 6.9% |
| $25,000 to $34,999 | 47 | 4.3% |
| $35,000 to $49,999 | 67 | 6.1% |
| $50,000 to $74,999 | 20 | 1.8% |
| $75,000 to $99,999 | 73 | 6.7% |
| $100,000 to $149,999 | 196 | 17.9% |
| $150,000 to $199,999 | 134 | 12.2% |
| $200,000+ | 418 | 38.2% |
Family Income by Famaliy Size in Granite Hills
5-person families (215 | 19.6%) account for the highest median family income in Granite Hills with $209,886 per family, while 3-person families (238 | 21.7%) have the highest median income of $68,490 per family member.
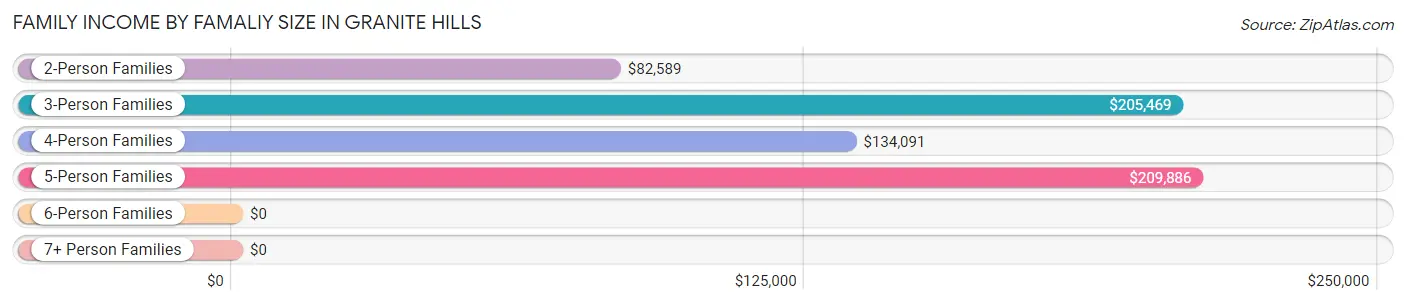
| Income Bracket | # Families | Median Income |
| 2-Person Families | 331 (30.2%) | $82,589 |
| 3-Person Families | 238 (21.7%) | $205,469 |
| 4-Person Families | 204 (18.6%) | $134,091 |
| 5-Person Families | 215 (19.6%) | $209,886 |
| 6-Person Families | 28 (2.6%) | $0 |
| 7+ Person Families | 79 (7.2%) | $0 |
| Total | 1,095 (100.0%) | $154,107 |
Family Income by Number of Earners in Granite Hills
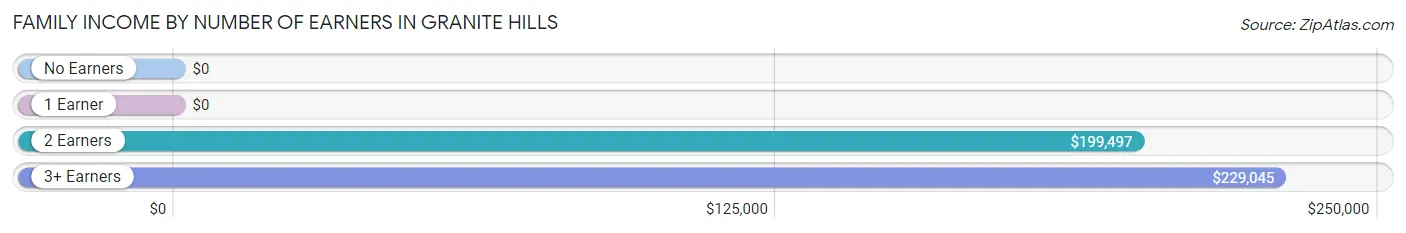
| Number of Earners | # Families | Median Income |
| No Earners | 113 (10.3%) | $0 |
| 1 Earner | 324 (29.6%) | $0 |
| 2 Earners | 411 (37.5%) | $199,497 |
| 3+ Earners | 247 (22.6%) | $229,045 |
| Total | 1,095 (100.0%) | $154,107 |
Household Income in Granite Hills
Household Income Brackets in Granite Hills
With 423 households falling in the category, the $200,000+ income range is the most frequent in Granite Hills, accounting for 35.5% of all households. In contrast, only 35 households (2.9%) fall into the $50,000 to $74,999 income bracket, making it the least populous group.
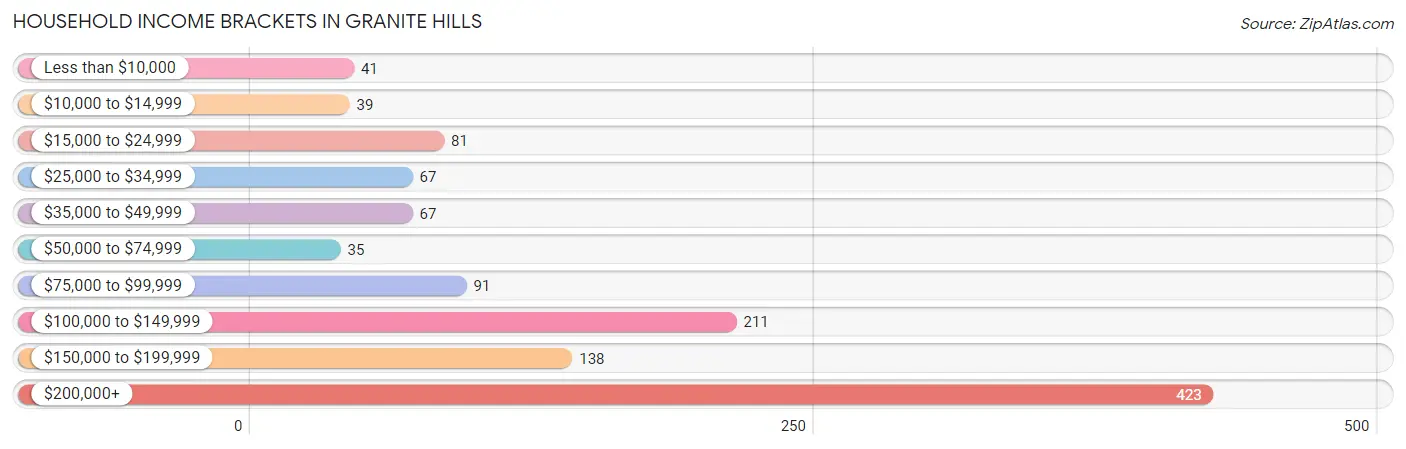
| Income Bracket | # Households | % Households |
| Less than $10,000 | 41 | 3.4% |
| $10,000 to $14,999 | 39 | 3.3% |
| $15,000 to $24,999 | 81 | 6.8% |
| $25,000 to $34,999 | 67 | 5.6% |
| $35,000 to $49,999 | 67 | 5.6% |
| $50,000 to $74,999 | 35 | 2.9% |
| $75,000 to $99,999 | 91 | 7.6% |
| $100,000 to $149,999 | 211 | 17.7% |
| $150,000 to $199,999 | 138 | 11.6% |
| $200,000+ | 423 | 35.5% |
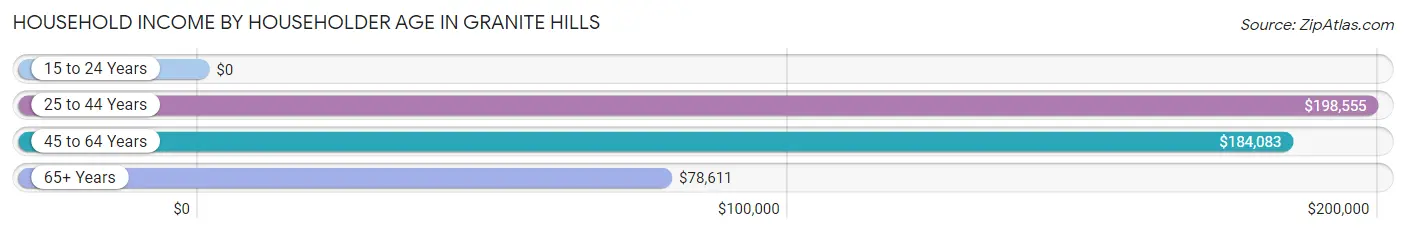
Household Income by Householder Age in Granite Hills
The median household income in Granite Hills is $141,774, with the highest median household income of $198,555 found in the 25 to 44 years age bracket for the primary householder. A total of 349 households (29.3%) fall into this category.
| Income Bracket | # Households | Median Income |
| 15 to 24 Years | 0 (0.0%) | $0 |
| 25 to 44 Years | 349 (29.3%) | $198,555 |
| 45 to 64 Years | 525 (44.0%) | $184,083 |
| 65+ Years | 318 (26.7%) | $78,611 |
| Total | 1,192 (100.0%) | $141,774 |
Poverty in Granite Hills
Income Below Poverty by Sex and Age in Granite Hills
With 9.9% poverty level for males and 11.7% for females among the residents of Granite Hills, 16 and 17 year old males and 15 year old females are the most vulnerable to poverty, with 51 males (65.4%) and 35 females (40.7%) in their respective age groups living below the poverty level.
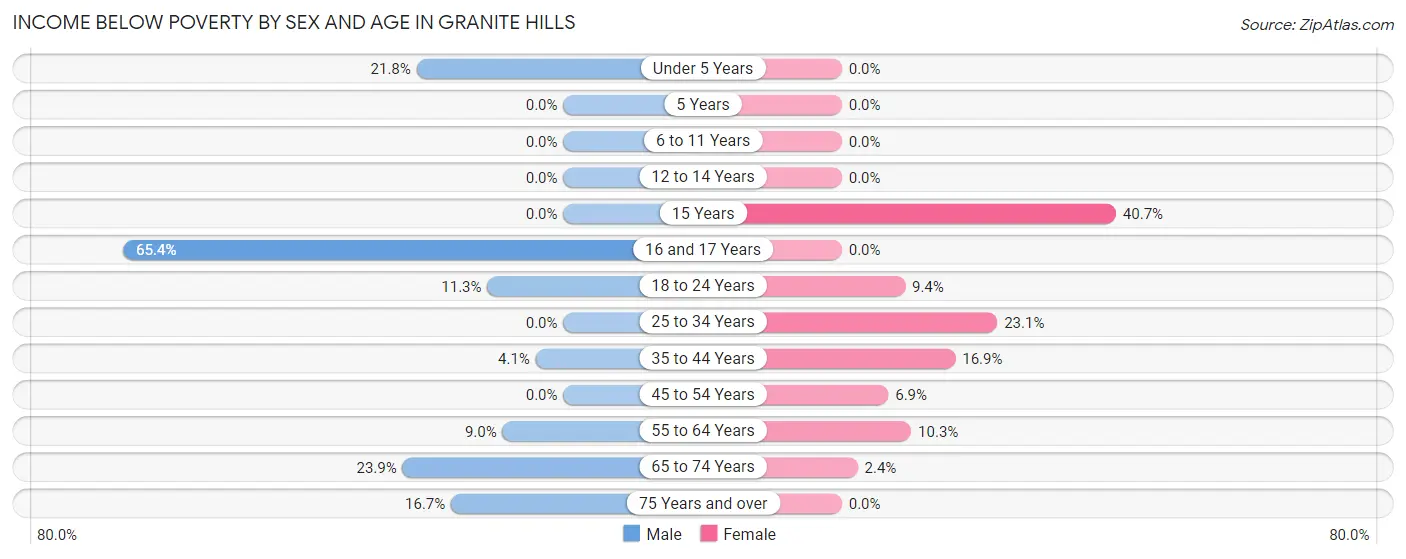
| Age Bracket | Male | Female |
| Under 5 Years | 34 (21.8%) | 0 (0.0%) |
| 5 Years | 0 (0.0%) | 0 (0.0%) |
| 6 to 11 Years | 0 (0.0%) | 0 (0.0%) |
| 12 to 14 Years | 0 (0.0%) | 0 (0.0%) |
| 15 Years | 0 (0.0%) | 35 (40.7%) |
| 16 and 17 Years | 51 (65.4%) | 0 (0.0%) |
| 18 to 24 Years | 15 (11.3%) | 17 (9.4%) |
| 25 to 34 Years | 0 (0.0%) | 87 (23.1%) |
| 35 to 44 Years | 18 (4.1%) | 62 (16.9%) |
| 45 to 54 Years | 0 (0.0%) | 6 (6.9%) |
| 55 to 64 Years | 39 (9.0%) | 44 (10.3%) |
| 65 to 74 Years | 64 (23.9%) | 4 (2.4%) |
| 75 Years and over | 12 (16.7%) | 0 (0.0%) |
| Total | 233 (9.9%) | 255 (11.7%) |
Income Above Poverty by Sex and Age in Granite Hills
According to the poverty statistics in Granite Hills, males aged 6 to 11 years and females aged under 5 years are the age groups that are most secure financially, with 100.0% of males and 100.0% of females in these age groups living above the poverty line.
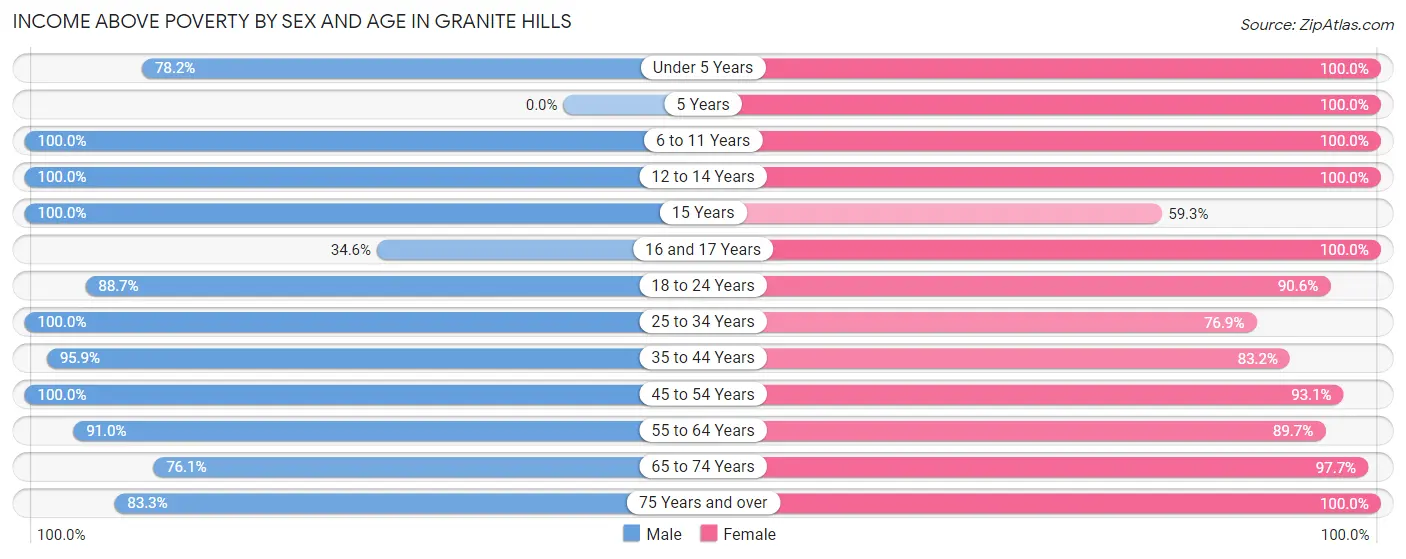
| Age Bracket | Male | Female |
| Under 5 Years | 122 (78.2%) | 96 (100.0%) |
| 5 Years | 0 (0.0%) | 9 (100.0%) |
| 6 to 11 Years | 279 (100.0%) | 156 (100.0%) |
| 12 to 14 Years | 135 (100.0%) | 50 (100.0%) |
| 15 Years | 14 (100.0%) | 51 (59.3%) |
| 16 and 17 Years | 27 (34.6%) | 50 (100.0%) |
| 18 to 24 Years | 118 (88.7%) | 164 (90.6%) |
| 25 to 34 Years | 249 (100.0%) | 290 (76.9%) |
| 35 to 44 Years | 420 (95.9%) | 306 (83.2%) |
| 45 to 54 Years | 91 (100.0%) | 81 (93.1%) |
| 55 to 64 Years | 393 (91.0%) | 383 (89.7%) |
| 65 to 74 Years | 204 (76.1%) | 166 (97.7%) |
| 75 Years and over | 60 (83.3%) | 123 (100.0%) |
| Total | 2,112 (90.1%) | 1,925 (88.3%) |
Income Below Poverty Among Married-Couple Families in Granite Hills
The poverty statistics for married-couple families in Granite Hills show that 3.7% or 34 of the total 928 families live below the poverty line. Families with 1 or 2 children have the highest poverty rate of 15.3%, comprising of 34 families. On the other hand, families with no children have the lowest poverty rate of 0.0%, which includes 0 families.
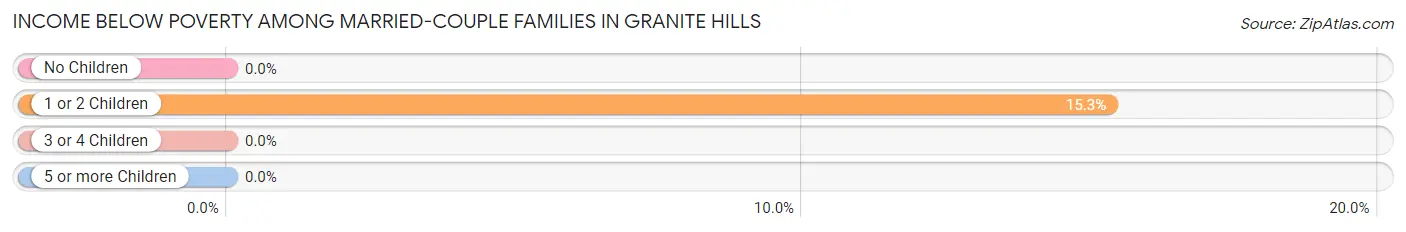
| Children | Above Poverty | Below Poverty |
| No Children | 533 (100.0%) | 0 (0.0%) |
| 1 or 2 Children | 188 (84.7%) | 34 (15.3%) |
| 3 or 4 Children | 173 (100.0%) | 0 (0.0%) |
| 5 or more Children | 0 (0.0%) | 0 (0.0%) |
| Total | 894 (96.3%) | 34 (3.7%) |
Income Below Poverty Among Single-Parent Households in Granite Hills
According to the poverty data in Granite Hills, 75.0% or 54 single-father households and 45.3% or 43 single-mother households are living below the poverty line. Among single-father households, those with no children have the highest poverty rate, with 54 households (87.1%) experiencing poverty. Likewise, among single-mother households, those with 1 or 2 children have the highest poverty rate, with 33 households (89.2%) falling below the poverty line.
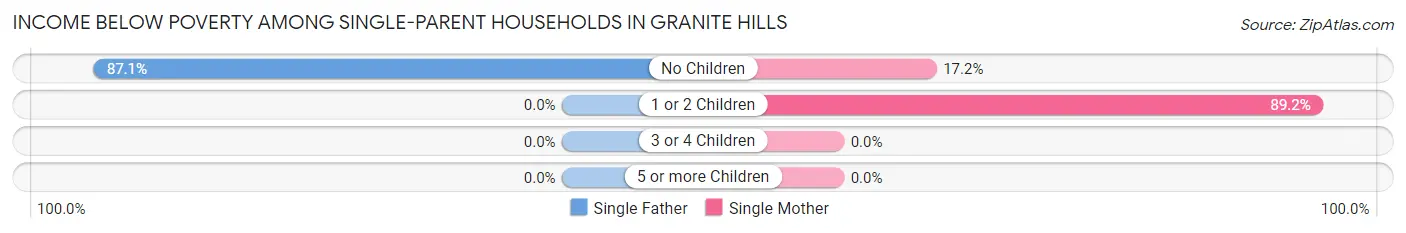
| Children | Single Father | Single Mother |
| No Children | 54 (87.1%) | 10 (17.2%) |
| 1 or 2 Children | 0 (0.0%) | 33 (89.2%) |
| 3 or 4 Children | 0 (0.0%) | 0 (0.0%) |
| 5 or more Children | 0 (0.0%) | 0 (0.0%) |
| Total | 54 (75.0%) | 43 (45.3%) |
Income Below Poverty Among Married-Couple vs Single-Parent Households in Granite Hills
The poverty data for Granite Hills shows that 34 of the married-couple family households (3.7%) and 97 of the single-parent households (58.1%) are living below the poverty level. Within the married-couple family households, those with 1 or 2 children have the highest poverty rate, with 34 households (15.3%) falling below the poverty line. Among the single-parent households, those with 1 or 2 children have the highest poverty rate, with 33 household (70.2%) living below poverty.
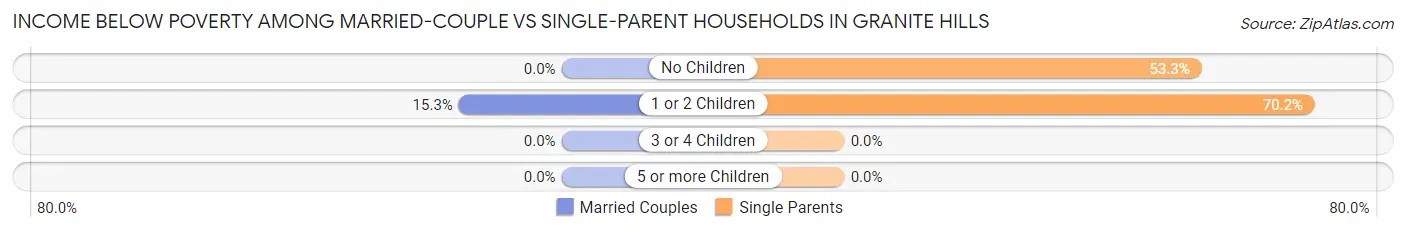
| Children | Married-Couple Families | Single-Parent Households |
| No Children | 0 (0.0%) | 64 (53.3%) |
| 1 or 2 Children | 34 (15.3%) | 33 (70.2%) |
| 3 or 4 Children | 0 (0.0%) | 0 (0.0%) |
| 5 or more Children | 0 (0.0%) | 0 (0.0%) |
| Total | 34 (3.7%) | 97 (58.1%) |
Race in Granite Hills
The most populous races in Granite Hills are White / Caucasian (3,742 | 82.7%), Hispanic or Latino (966 | 21.3%), and Two or more Races (499 | 11.0%).
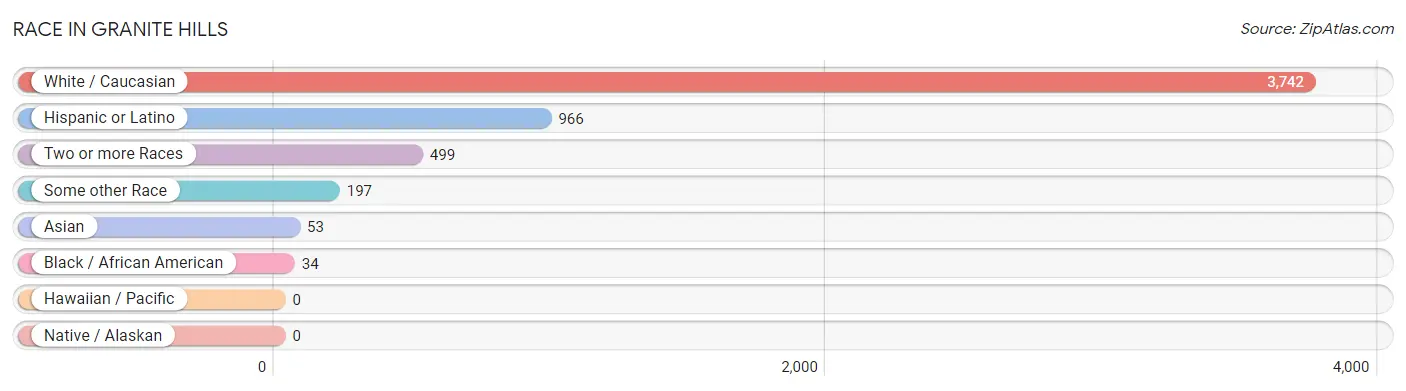
| Race | # Population | % Population |
| Asian | 53 | 1.2% |
| Black / African American | 34 | 0.7% |
| Hawaiian / Pacific | 0 | 0.0% |
| Hispanic or Latino | 966 | 21.3% |
| Native / Alaskan | 0 | 0.0% |
| White / Caucasian | 3,742 | 82.7% |
| Two or more Races | 499 | 11.0% |
| Some other Race | 197 | 4.3% |
| Total | 4,525 | 100.0% |
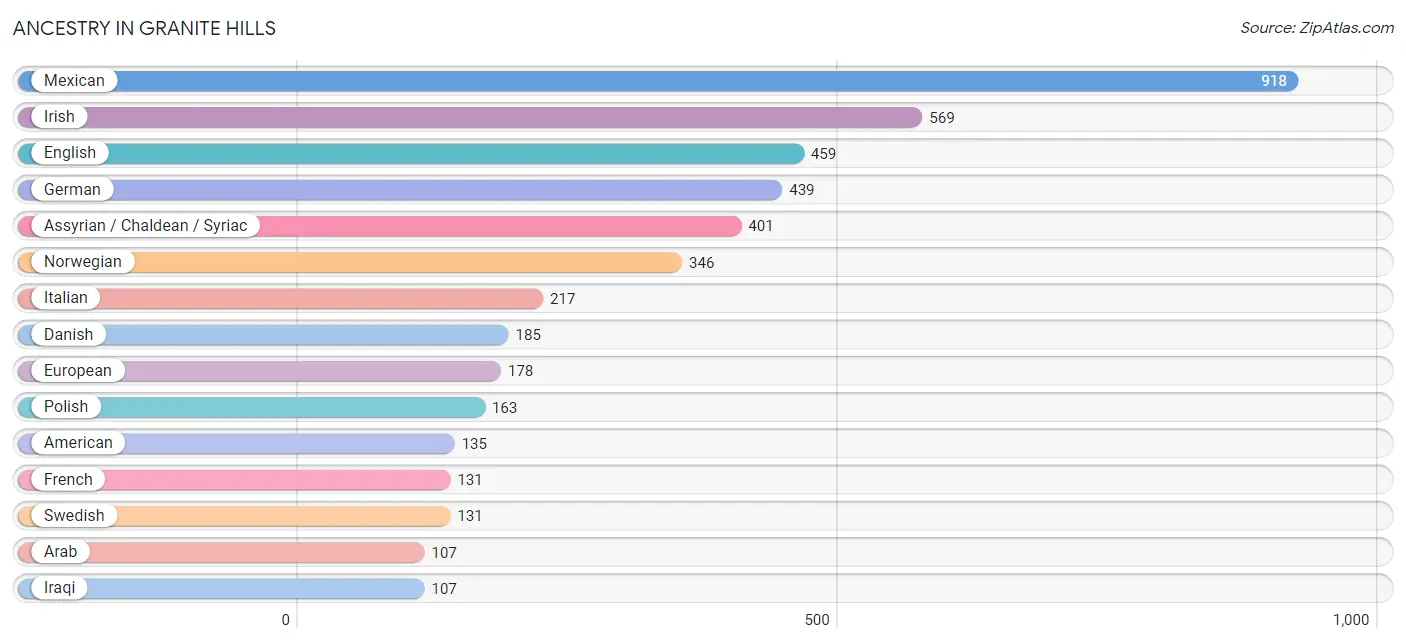
Ancestry in Granite Hills
The most populous ancestries reported in Granite Hills are Mexican (918 | 20.3%), Irish (569 | 12.6%), English (459 | 10.1%), German (439 | 9.7%), and Assyrian / Chaldean / Syriac (401 | 8.9%), together accounting for 61.6% of all Granite Hills residents.
| Ancestry | # Population | % Population |
| African | 17 | 0.4% |
| American | 135 | 3.0% |
| Arab | 107 | 2.4% |
| Assyrian / Chaldean / Syriac | 401 | 8.9% |
| Austrian | 61 | 1.3% |
| Bhutanese | 5 | 0.1% |
| British | 70 | 1.5% |
| Burmese | 5 | 0.1% |
| Choctaw | 15 | 0.3% |
| Creek | 15 | 0.3% |
| Danish | 185 | 4.1% |
| Dutch | 50 | 1.1% |
| English | 459 | 10.1% |
| European | 178 | 3.9% |
| Finnish | 44 | 1.0% |
| French | 131 | 2.9% |
| French Canadian | 13 | 0.3% |
| German | 439 | 9.7% |
| Greek | 20 | 0.4% |
| Indian (Asian) | 61 | 1.3% |
| Iraqi | 107 | 2.4% |
| Irish | 569 | 12.6% |
| Italian | 217 | 4.8% |
| Korean | 59 | 1.3% |
| Lithuanian | 10 | 0.2% |
| Mexican | 918 | 20.3% |
| Native Hawaiian | 94 | 2.1% |
| Northern European | 4 | 0.1% |
| Norwegian | 346 | 7.6% |
| Polish | 163 | 3.6% |
| Portuguese | 41 | 0.9% |
| Puerto Rican | 14 | 0.3% |
| Scotch-Irish | 50 | 1.1% |
| Scottish | 21 | 0.5% |
| Spaniard | 17 | 0.4% |
| Spanish | 17 | 0.4% |
| Subsaharan African | 17 | 0.4% |
| Swedish | 131 | 2.9% |
| Ukrainian | 8 | 0.2% |
| Yugoslavian | 48 | 1.1% | View All 40 Rows |
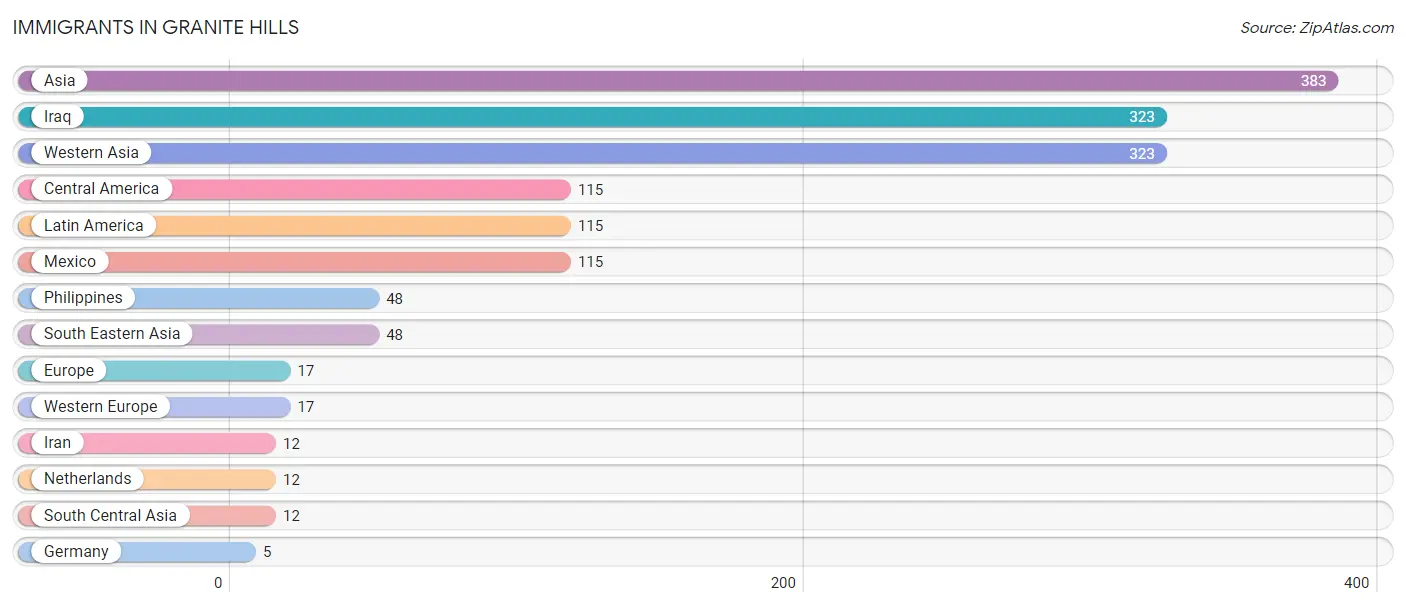
Immigrants in Granite Hills
The most numerous immigrant groups reported in Granite Hills came from Asia (383 | 8.5%), Iraq (323 | 7.1%), Western Asia (323 | 7.1%), Central America (115 | 2.5%), and Latin America (115 | 2.5%), together accounting for 27.8% of all Granite Hills residents.
| Immigration Origin | # Population | % Population |
| Asia | 383 | 8.5% |
| Central America | 115 | 2.5% |
| Europe | 17 | 0.4% |
| Germany | 5 | 0.1% |
| Iran | 12 | 0.3% |
| Iraq | 323 | 7.1% |
| Latin America | 115 | 2.5% |
| Mexico | 115 | 2.5% |
| Netherlands | 12 | 0.3% |
| Philippines | 48 | 1.1% |
| South Central Asia | 12 | 0.3% |
| South Eastern Asia | 48 | 1.1% |
| Western Asia | 323 | 7.1% |
| Western Europe | 17 | 0.4% | View All 14 Rows |
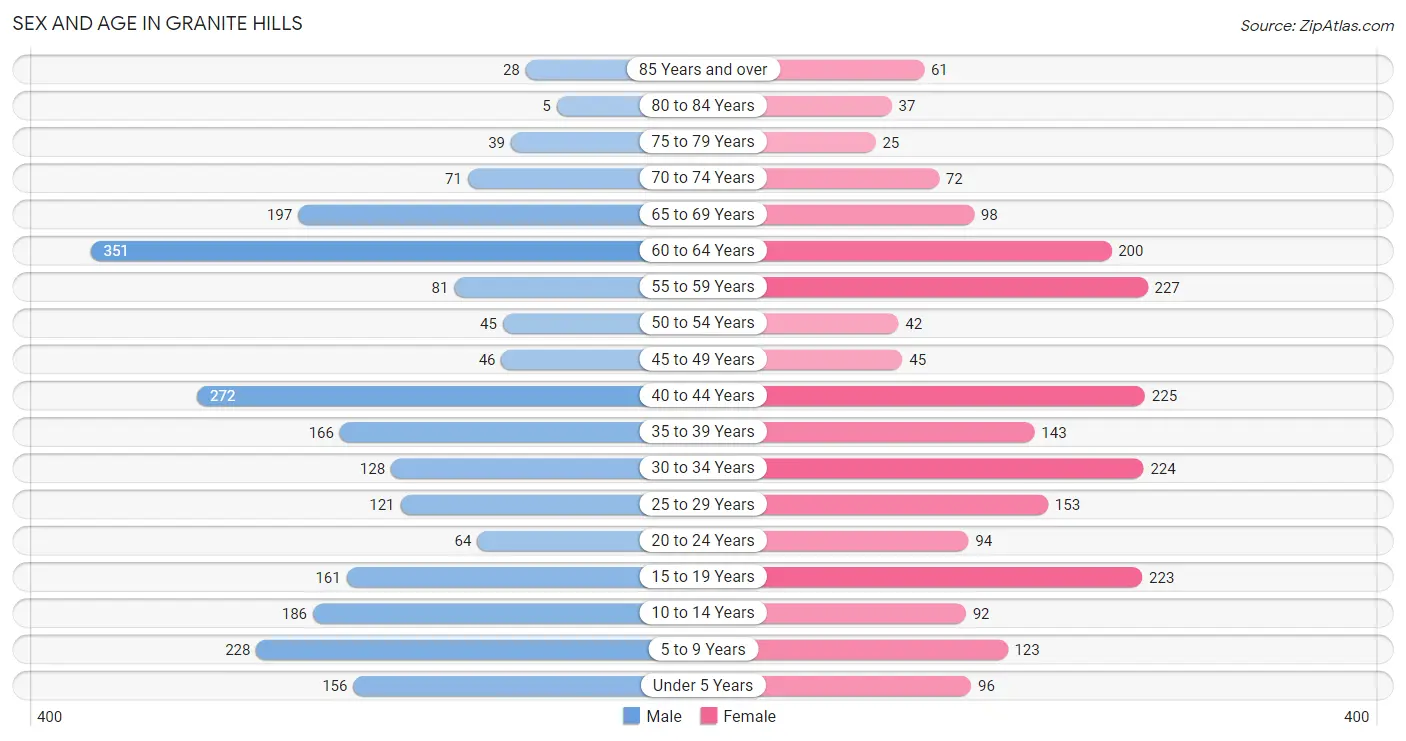
Sex and Age in Granite Hills
Sex and Age in Granite Hills
The most populous age groups in Granite Hills are 60 to 64 Years (351 | 15.0%) for men and 55 to 59 Years (227 | 10.4%) for women.
| Age Bracket | Male | Female |
| Under 5 Years | 156 (6.7%) | 96 (4.4%) |
| 5 to 9 Years | 228 (9.7%) | 123 (5.6%) |
| 10 to 14 Years | 186 (7.9%) | 92 (4.2%) |
| 15 to 19 Years | 161 (6.9%) | 223 (10.2%) |
| 20 to 24 Years | 64 (2.7%) | 94 (4.3%) |
| 25 to 29 Years | 121 (5.2%) | 153 (7.0%) |
| 30 to 34 Years | 128 (5.5%) | 224 (10.3%) |
| 35 to 39 Years | 166 (7.1%) | 143 (6.6%) |
| 40 to 44 Years | 272 (11.6%) | 225 (10.3%) |
| 45 to 49 Years | 46 (2.0%) | 45 (2.1%) |
| 50 to 54 Years | 45 (1.9%) | 42 (1.9%) |
| 55 to 59 Years | 81 (3.5%) | 227 (10.4%) |
| 60 to 64 Years | 351 (15.0%) | 200 (9.2%) |
| 65 to 69 Years | 197 (8.4%) | 98 (4.5%) |
| 70 to 74 Years | 71 (3.0%) | 72 (3.3%) |
| 75 to 79 Years | 39 (1.7%) | 25 (1.1%) |
| 80 to 84 Years | 5 (0.2%) | 37 (1.7%) |
| 85 Years and over | 28 (1.2%) | 61 (2.8%) |
| Total | 2,345 (100.0%) | 2,180 (100.0%) |
Families and Households in Granite Hills
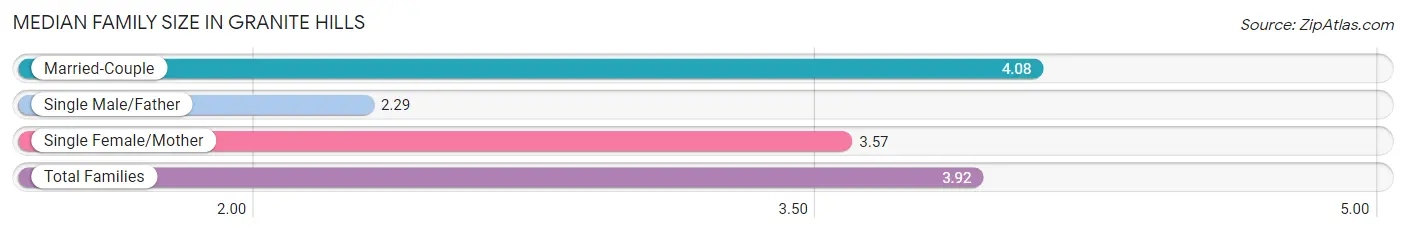
Median Family Size in Granite Hills
The median family size in Granite Hills is 3.92 persons per family, with married-couple families (928 | 84.8%) accounting for the largest median family size of 4.08 persons per family. On the other hand, single male/father families (72 | 6.6%) represent the smallest median family size with 2.29 persons per family.
| Family Type | # Families | Family Size |
| Married-Couple | 928 (84.8%) | 4.08 |
| Single Male/Father | 72 (6.6%) | 2.29 |
| Single Female/Mother | 95 (8.7%) | 3.57 |
| Total Families | 1,095 (100.0%) | 3.92 |
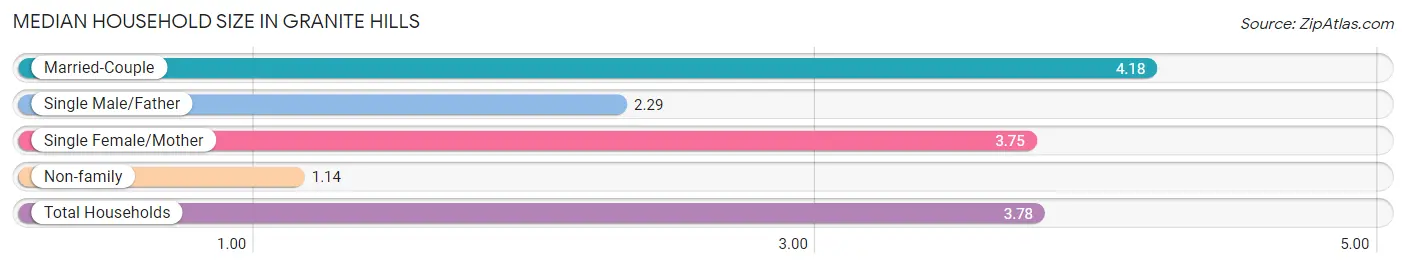
Median Household Size in Granite Hills
The median household size in Granite Hills is 3.78 persons per household, with married-couple households (928 | 77.8%) accounting for the largest median household size of 4.18 persons per household. non-family households (97 | 8.1%) represent the smallest median household size with 1.14 persons per household.
| Household Type | # Households | Household Size |
| Married-Couple | 928 (77.8%) | 4.18 |
| Single Male/Father | 72 (6.0%) | 2.29 |
| Single Female/Mother | 95 (8.0%) | 3.75 |
| Non-family | 97 (8.1%) | 1.14 |
| Total Households | 1,192 (100.0%) | 3.78 |
Household Size by Marriage Status in Granite Hills
Out of a total of 1,192 households in Granite Hills, 1,095 (91.9%) are family households, while 97 (8.1%) are nonfamily households. The most numerous type of family households are 2-person households, comprising 306, and the most common type of nonfamily households are 1-person households, comprising 85.
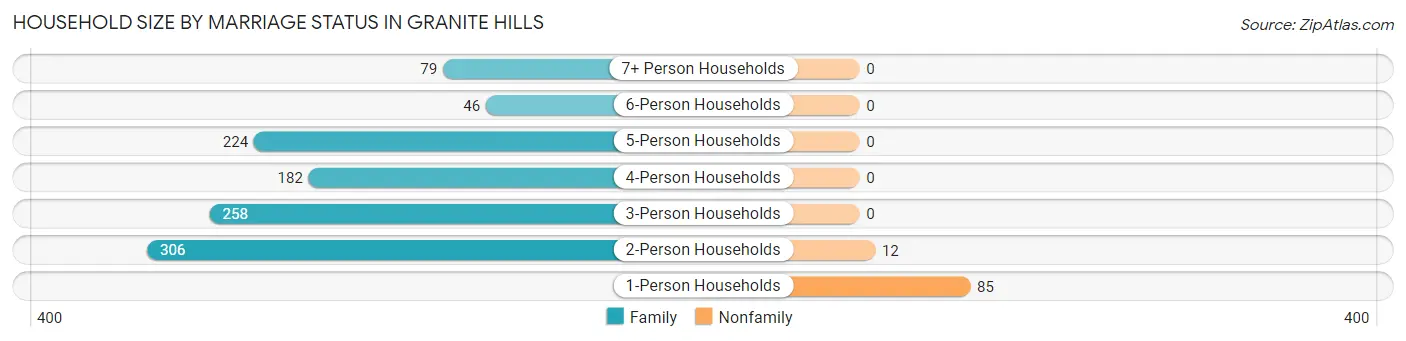
| Household Size | Family Households | Nonfamily Households |
| 1-Person Households | - | 85 (7.1%) |
| 2-Person Households | 306 (25.7%) | 12 (1.0%) |
| 3-Person Households | 258 (21.6%) | 0 (0.0%) |
| 4-Person Households | 182 (15.3%) | 0 (0.0%) |
| 5-Person Households | 224 (18.8%) | 0 (0.0%) |
| 6-Person Households | 46 (3.9%) | 0 (0.0%) |
| 7+ Person Households | 79 (6.6%) | 0 (0.0%) |
| Total | 1,095 (91.9%) | 97 (8.1%) |
Female Fertility in Granite Hills
Fertility by Age in Granite Hills
Average fertility rate in Granite Hills is 58.0 births per 1,000 women. Women in the age bracket of 20 to 34 years have the highest fertility rate with 136.0 births per 1,000 women. Women in the age bracket of 20 to 34 years acount for 100.0% of all women with births.
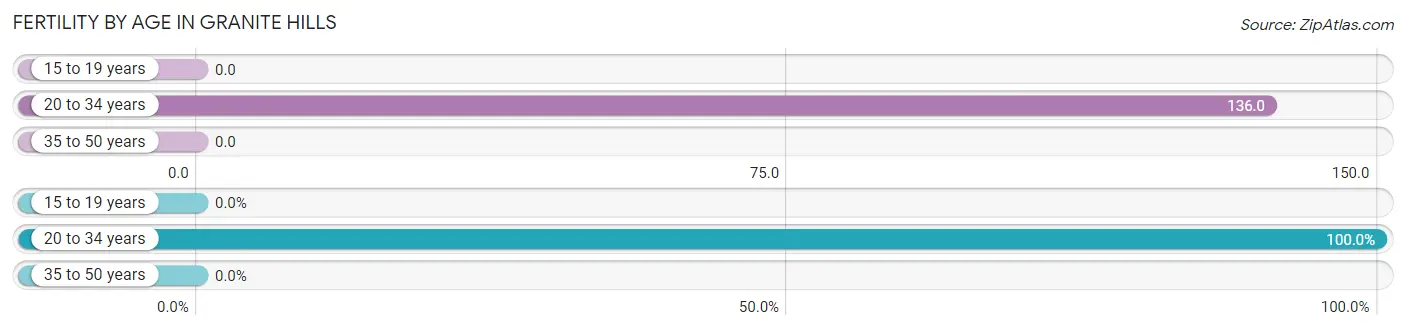
| Age Bracket | Women with Births | Births / 1,000 Women |
| 15 to 19 years | 0 (0.0%) | 0.0 |
| 20 to 34 years | 64 (100.0%) | 136.0 |
| 35 to 50 years | 0 (0.0%) | 0.0 |
| Total | 64 (100.0%) | 58.0 |
Fertility by Age by Marriage Status in Granite Hills
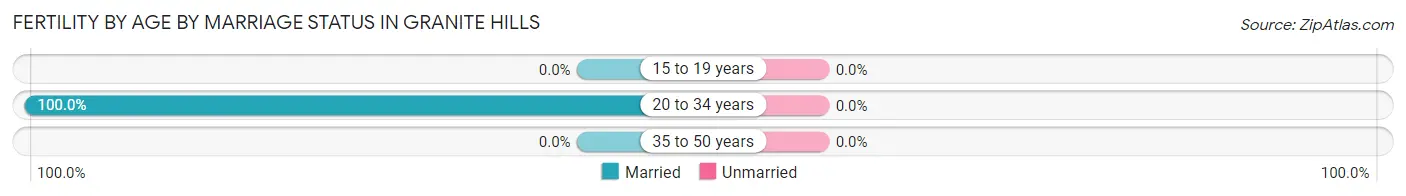
| Age Bracket | Married | Unmarried |
| 15 to 19 years | 0 (0.0%) | 0 (0.0%) |
| 20 to 34 years | 64 (100.0%) | 0 (0.0%) |
| 35 to 50 years | 0 (0.0%) | 0 (0.0%) |
| Total | 64 (100.0%) | 0 (0.0%) |
Fertility by Education in Granite Hills
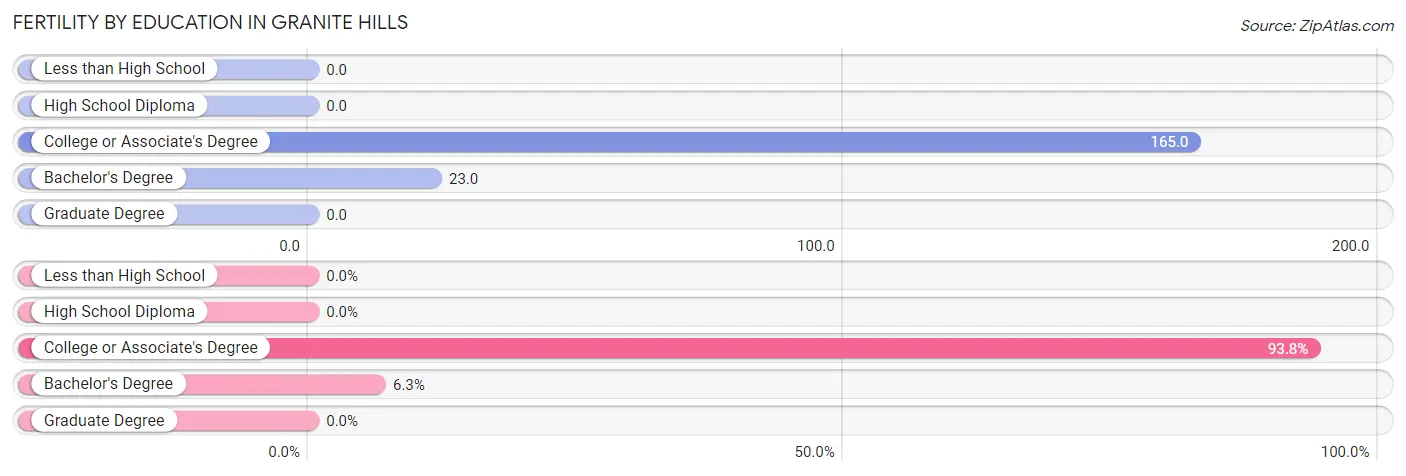
| Educational Attainment | Women with Births | Births / 1,000 Women |
| Less than High School | 0 (0.0%) | 0.0 |
| High School Diploma | 0 (0.0%) | 0.0 |
| College or Associate's Degree | 60 (93.8%) | 165.0 |
| Bachelor's Degree | 4 (6.2%) | 23.0 |
| Graduate Degree | 0 (0.0%) | 0.0 |
| Total | 64 (100.0%) | 58.0 |
Fertility by Education by Marriage Status in Granite Hills
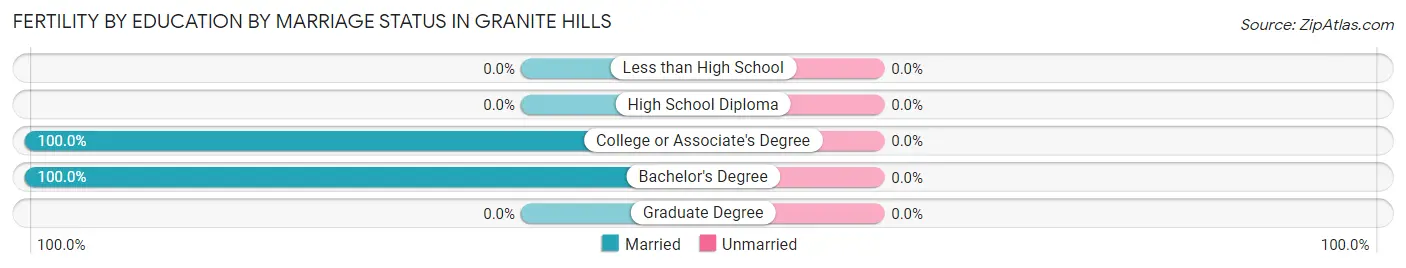
| Educational Attainment | Married | Unmarried |
| Less than High School | 0 (0.0%) | 0 (0.0%) |
| High School Diploma | 0 (0.0%) | 0 (0.0%) |
| College or Associate's Degree | 60 (100.0%) | 0 (0.0%) |
| Bachelor's Degree | 4 (100.0%) | 0 (0.0%) |
| Graduate Degree | 0 (0.0%) | 0 (0.0%) |
| Total | 64 (100.0%) | 0 (0.0%) |
Employment Characteristics in Granite Hills
Employment by Class of Employer in Granite Hills
Among the 1,849 employed individuals in Granite Hills, private company employees (1,097 | 59.3%), self-employed (not incorporated) (244 | 13.2%), and not-for-profit organizations (193 | 10.4%) make up the most common classes of employment.
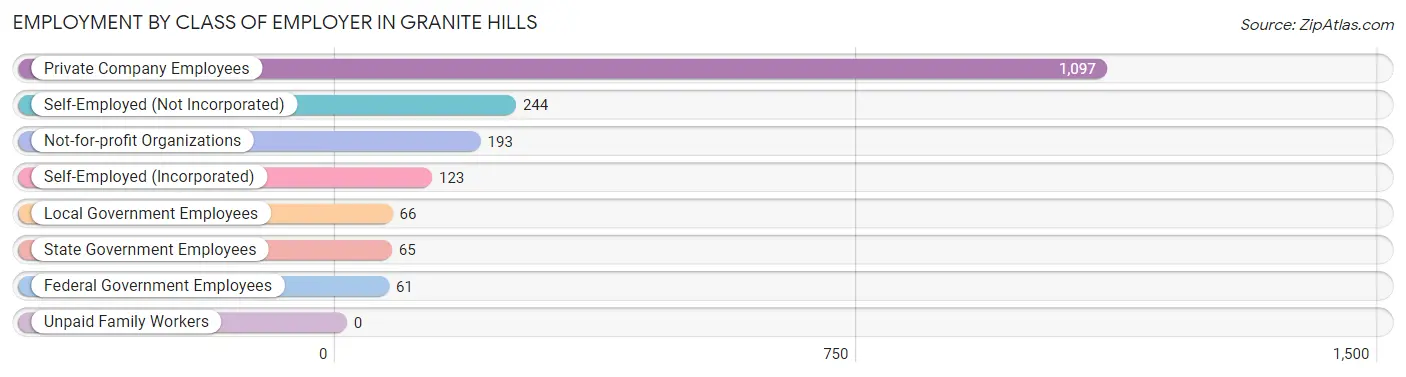
| Employer Class | # Employees | % Employees |
| Private Company Employees | 1,097 | 59.3% |
| Self-Employed (Incorporated) | 123 | 6.7% |
| Self-Employed (Not Incorporated) | 244 | 13.2% |
| Not-for-profit Organizations | 193 | 10.4% |
| Local Government Employees | 66 | 3.6% |
| State Government Employees | 65 | 3.5% |
| Federal Government Employees | 61 | 3.3% |
| Unpaid Family Workers | 0 | 0.0% |
| Total | 1,849 | 100.0% |
Employment Status by Age in Granite Hills
According to the labor force statistics for Granite Hills, out of the total population over 16 years of age (3,544), 61.0% or 2,162 individuals are in the labor force, with 14.4% or 311 of them unemployed. The age group with the highest labor force participation rate is 35 to 44 years, with 86.0% or 693 individuals in the labor force. Within the labor force, the 16 to 19 years age range has the highest percentage of unemployed individuals, with 29.1% or 50 of them being unemployed.
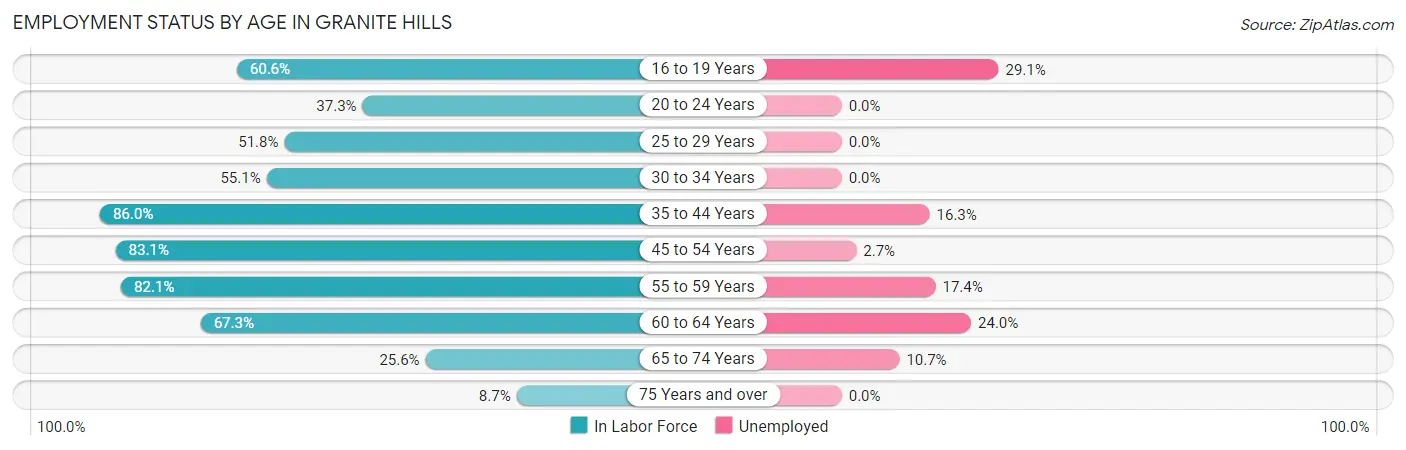
| Age Bracket | In Labor Force | Unemployed |
| 16 to 19 Years | 172 (60.6%) | 50 (29.1%) |
| 20 to 24 Years | 59 (37.3%) | 0 (0.0%) |
| 25 to 29 Years | 142 (51.8%) | 0 (0.0%) |
| 30 to 34 Years | 194 (55.1%) | 0 (0.0%) |
| 35 to 44 Years | 693 (86.0%) | 113 (16.3%) |
| 45 to 54 Years | 148 (83.1%) | 4 (2.7%) |
| 55 to 59 Years | 253 (82.1%) | 44 (17.4%) |
| 60 to 64 Years | 371 (67.3%) | 89 (24.0%) |
| 65 to 74 Years | 112 (25.6%) | 12 (10.7%) |
| 75 Years and over | 17 (8.7%) | 0 (0.0%) |
| Total | 2,162 (61.0%) | 311 (14.4%) |
Employment Status by Educational Attainment in Granite Hills
According to labor force statistics for Granite Hills, 72.9% of individuals (1,800) out of the total population between 25 and 64 years of age (2,469) are in the labor force, with 13.8% or 248 of them being unemployed. The group with the highest labor force participation rate are those with the educational attainment of bachelor's degree or higher, with 86.9% or 879 individuals in the labor force. Within the labor force, individuals with high school diploma education have the highest percentage of unemployment, with 31.1% or 89 of them being unemployed.
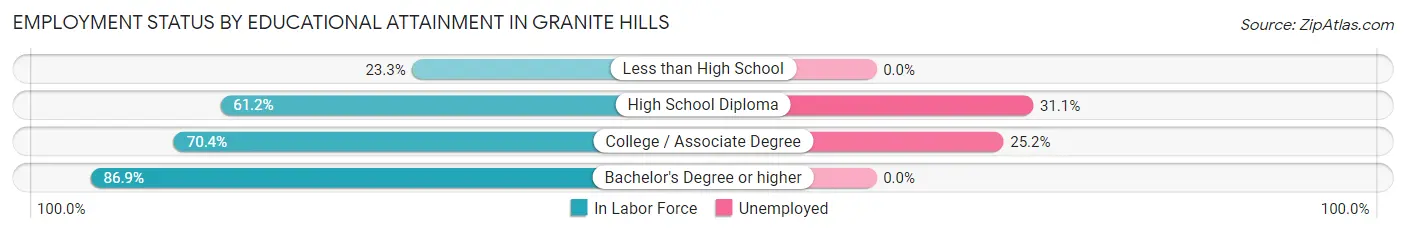
| Educational Attainment | In Labor Force | Unemployed |
| Less than High School | 30 (23.3%) | 0 (0.0%) |
| High School Diploma | 286 (61.2%) | 145 (31.1%) |
| College / Associate Degree | 606 (70.4%) | 217 (25.2%) |
| Bachelor's Degree or higher | 879 (86.9%) | 0 (0.0%) |
| Total | 1,800 (72.9%) | 341 (13.8%) |
Employment Occupations by Sex in Granite Hills
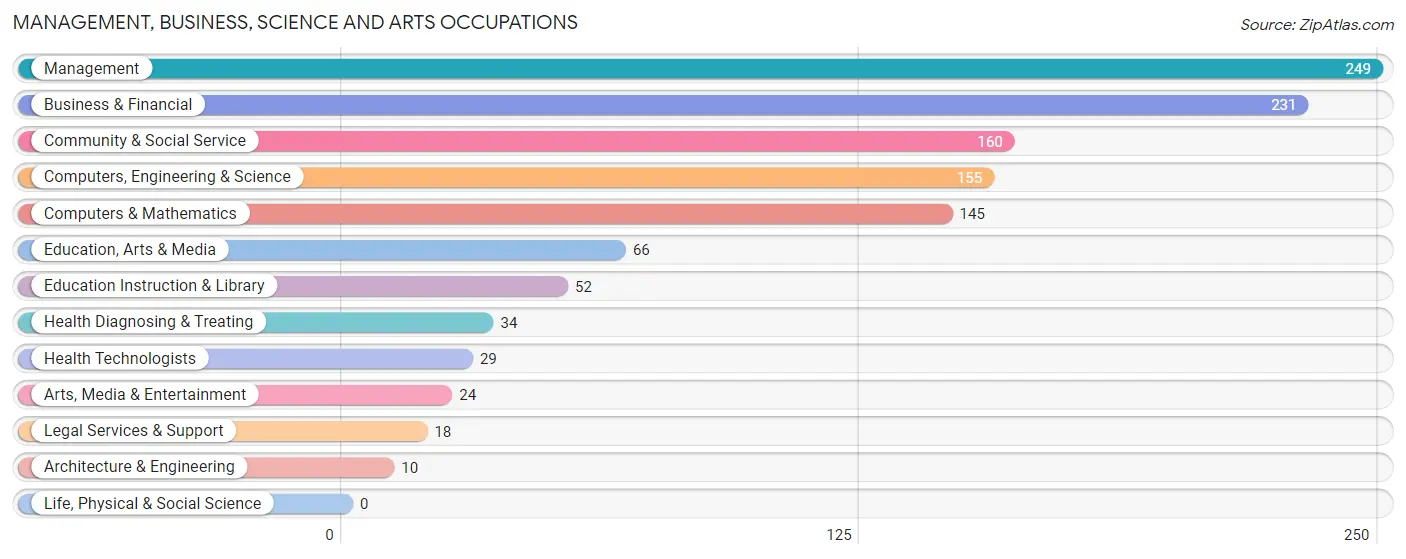
Management, Business, Science and Arts Occupations
The most common Management, Business, Science and Arts occupations in Granite Hills are Management (249 | 13.8%), Business & Financial (231 | 12.8%), Community & Social Service (160 | 8.8%), Computers, Engineering & Science (155 | 8.6%), and Computers & Mathematics (145 | 8.0%).
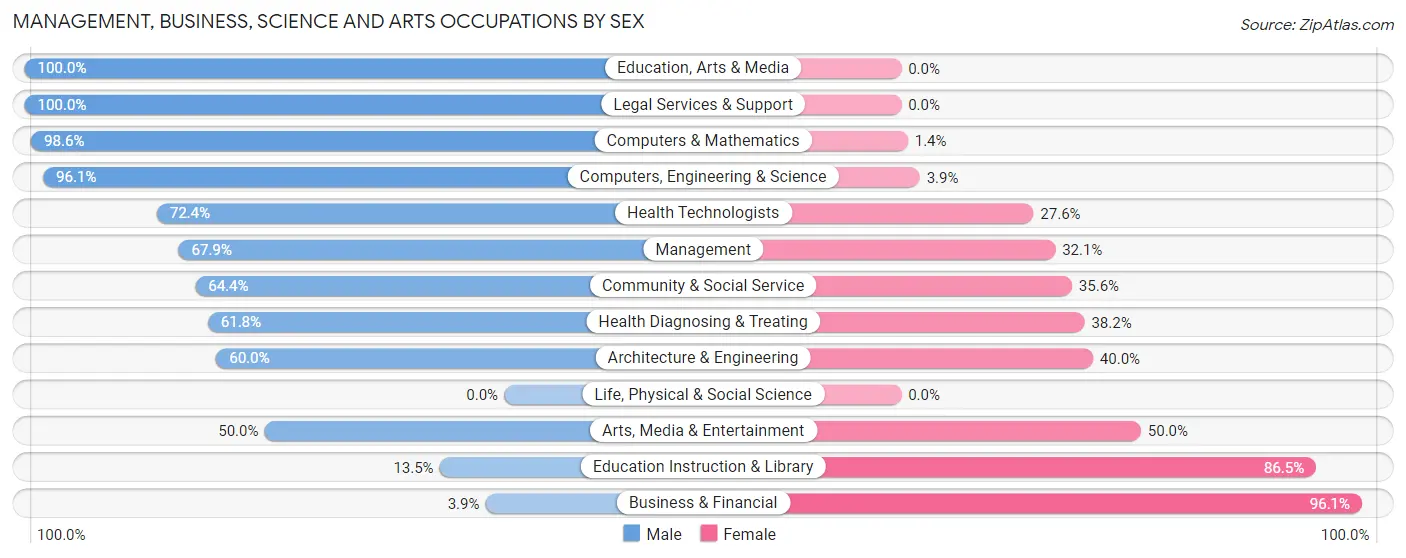
Management, Business, Science and Arts Occupations by Sex
Within the Management, Business, Science and Arts occupations in Granite Hills, the most male-oriented occupations are Education, Arts & Media (100.0%), Legal Services & Support (100.0%), and Computers & Mathematics (98.6%), while the most female-oriented occupations are Business & Financial (96.1%), Education Instruction & Library (86.5%), and Arts, Media & Entertainment (50.0%).
| Occupation | Male | Female |
| Management | 169 (67.9%) | 80 (32.1%) |
| Business & Financial | 9 (3.9%) | 222 (96.1%) |
| Computers, Engineering & Science | 149 (96.1%) | 6 (3.9%) |
| Computers & Mathematics | 143 (98.6%) | 2 (1.4%) |
| Architecture & Engineering | 6 (60.0%) | 4 (40.0%) |
| Life, Physical & Social Science | 0 (0.0%) | 0 (0.0%) |
| Community & Social Service | 103 (64.4%) | 57 (35.6%) |
| Education, Arts & Media | 66 (100.0%) | 0 (0.0%) |
| Legal Services & Support | 18 (100.0%) | 0 (0.0%) |
| Education Instruction & Library | 7 (13.5%) | 45 (86.5%) |
| Arts, Media & Entertainment | 12 (50.0%) | 12 (50.0%) |
| Health Diagnosing & Treating | 21 (61.8%) | 13 (38.2%) |
| Health Technologists | 21 (72.4%) | 8 (27.6%) |
| Total (Category) | 451 (54.4%) | 378 (45.6%) |
| Total (Overall) | 936 (51.7%) | 873 (48.3%) |
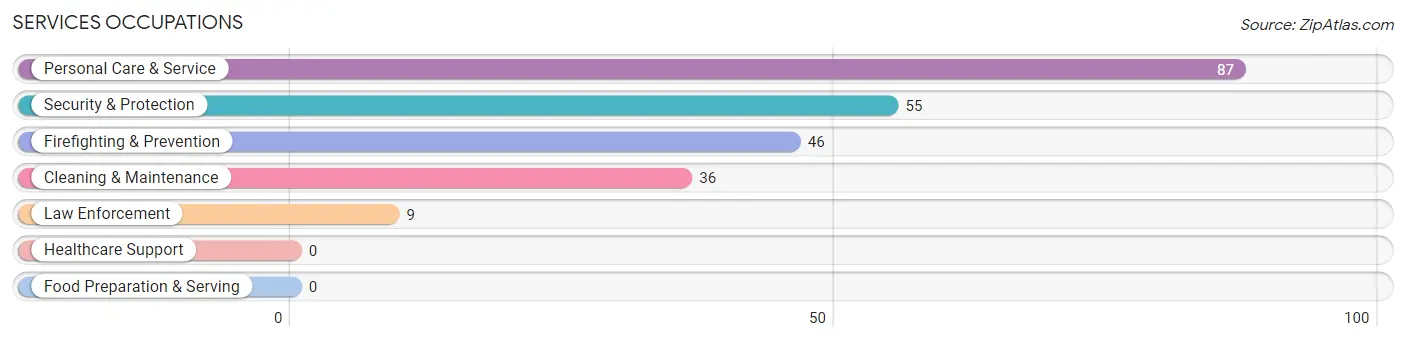
Services Occupations
The most common Services occupations in Granite Hills are Personal Care & Service (87 | 4.8%), Security & Protection (55 | 3.0%), Firefighting & Prevention (46 | 2.5%), Cleaning & Maintenance (36 | 2.0%), and Law Enforcement (9 | 0.5%).
Services Occupations by Sex
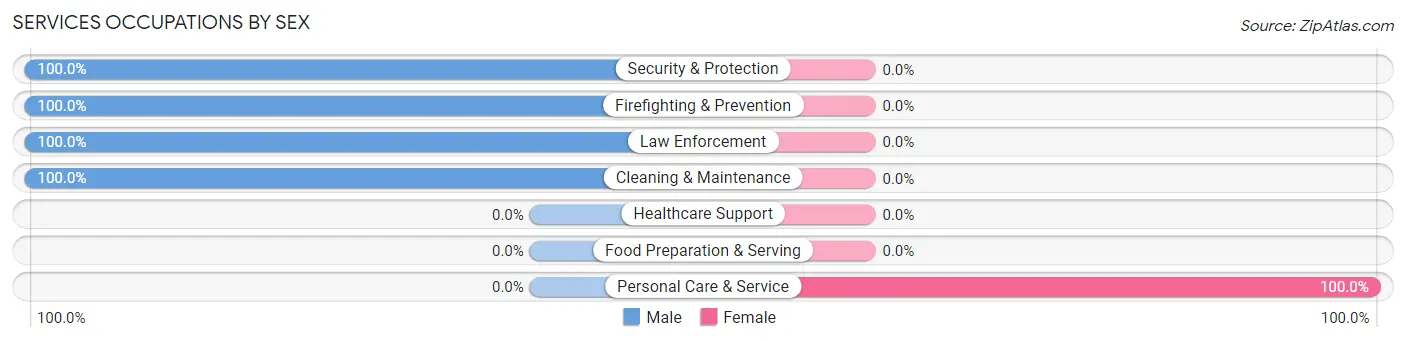
| Occupation | Male | Female |
| Healthcare Support | 0 (0.0%) | 0 (0.0%) |
| Security & Protection | 55 (100.0%) | 0 (0.0%) |
| Firefighting & Prevention | 46 (100.0%) | 0 (0.0%) |
| Law Enforcement | 9 (100.0%) | 0 (0.0%) |
| Food Preparation & Serving | 0 (0.0%) | 0 (0.0%) |
| Cleaning & Maintenance | 36 (100.0%) | 0 (0.0%) |
| Personal Care & Service | 0 (0.0%) | 87 (100.0%) |
| Total (Category) | 91 (51.1%) | 87 (48.9%) |
| Total (Overall) | 936 (51.7%) | 873 (48.3%) |
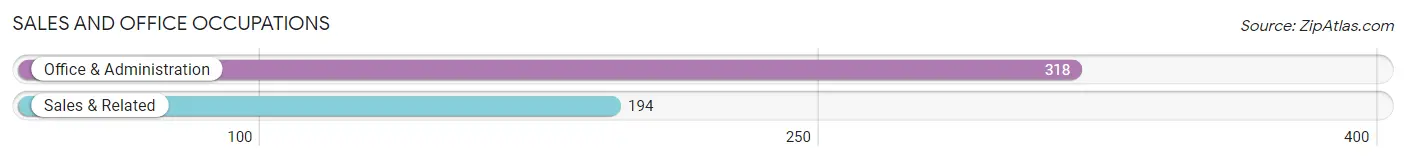
Sales and Office Occupations
The most common Sales and Office occupations in Granite Hills are Office & Administration (318 | 17.6%), and Sales & Related (194 | 10.7%).
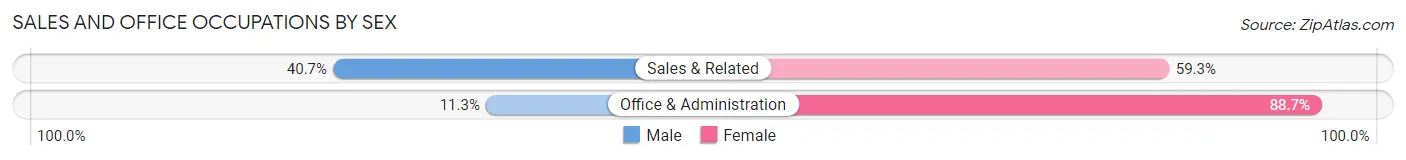
Sales and Office Occupations by Sex
| Occupation | Male | Female |
| Sales & Related | 79 (40.7%) | 115 (59.3%) |
| Office & Administration | 36 (11.3%) | 282 (88.7%) |
| Total (Category) | 115 (22.5%) | 397 (77.5%) |
| Total (Overall) | 936 (51.7%) | 873 (48.3%) |
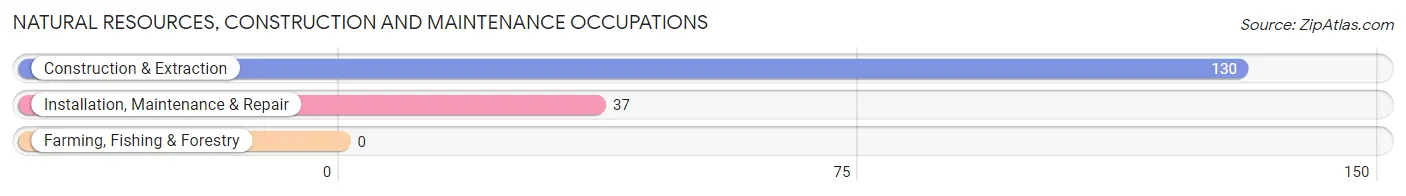
Natural Resources, Construction and Maintenance Occupations
The most common Natural Resources, Construction and Maintenance occupations in Granite Hills are Construction & Extraction (130 | 7.2%), and Installation, Maintenance & Repair (37 | 2.1%).
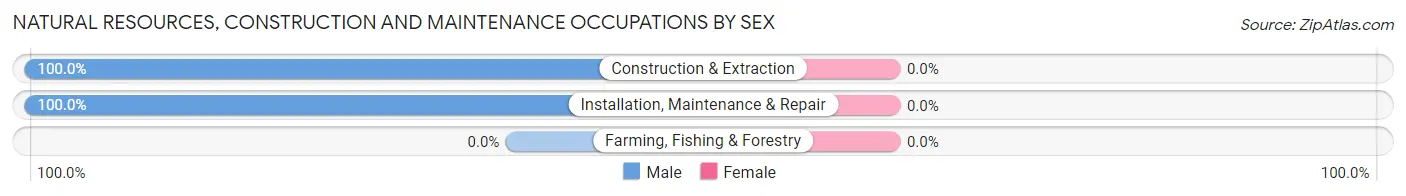
Natural Resources, Construction and Maintenance Occupations by Sex
| Occupation | Male | Female |
| Farming, Fishing & Forestry | 0 (0.0%) | 0 (0.0%) |
| Construction & Extraction | 130 (100.0%) | 0 (0.0%) |
| Installation, Maintenance & Repair | 37 (100.0%) | 0 (0.0%) |
| Total (Category) | 167 (100.0%) | 0 (0.0%) |
| Total (Overall) | 936 (51.7%) | 873 (48.3%) |
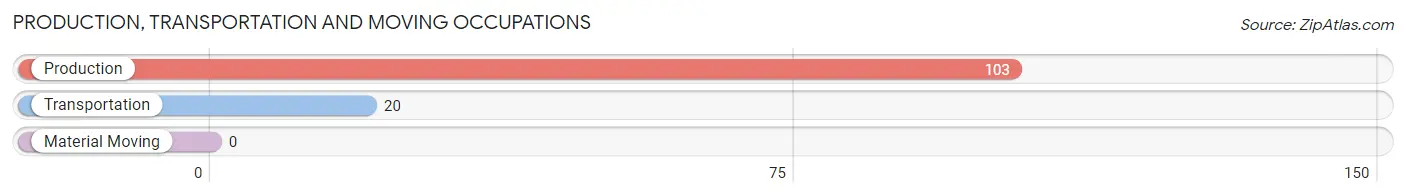
Production, Transportation and Moving Occupations
The most common Production, Transportation and Moving occupations in Granite Hills are Production (103 | 5.7%), and Transportation (20 | 1.1%).
Production, Transportation and Moving Occupations by Sex
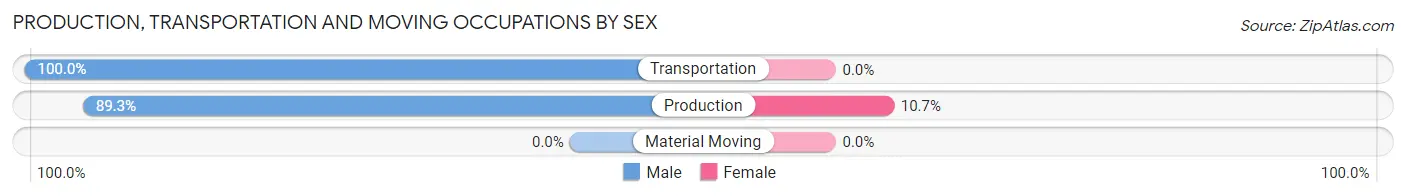
| Occupation | Male | Female |
| Production | 92 (89.3%) | 11 (10.7%) |
| Transportation | 20 (100.0%) | 0 (0.0%) |
| Material Moving | 0 (0.0%) | 0 (0.0%) |
| Total (Category) | 112 (91.1%) | 11 (8.9%) |
| Total (Overall) | 936 (51.7%) | 873 (48.3%) |
Employment Industries by Sex in Granite Hills
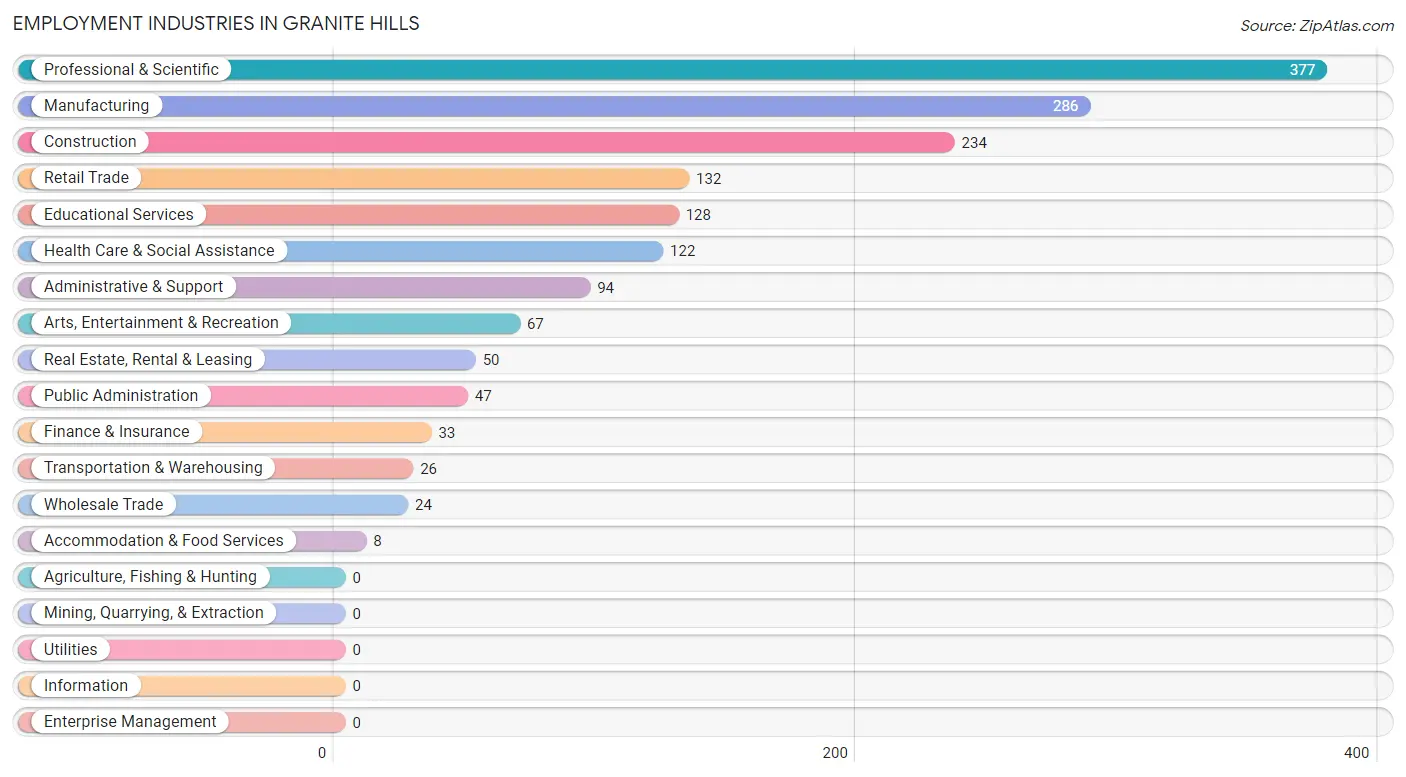
Employment Industries in Granite Hills
The major employment industries in Granite Hills include Professional & Scientific (377 | 20.8%), Manufacturing (286 | 15.8%), Construction (234 | 12.9%), Retail Trade (132 | 7.3%), and Educational Services (128 | 7.1%).
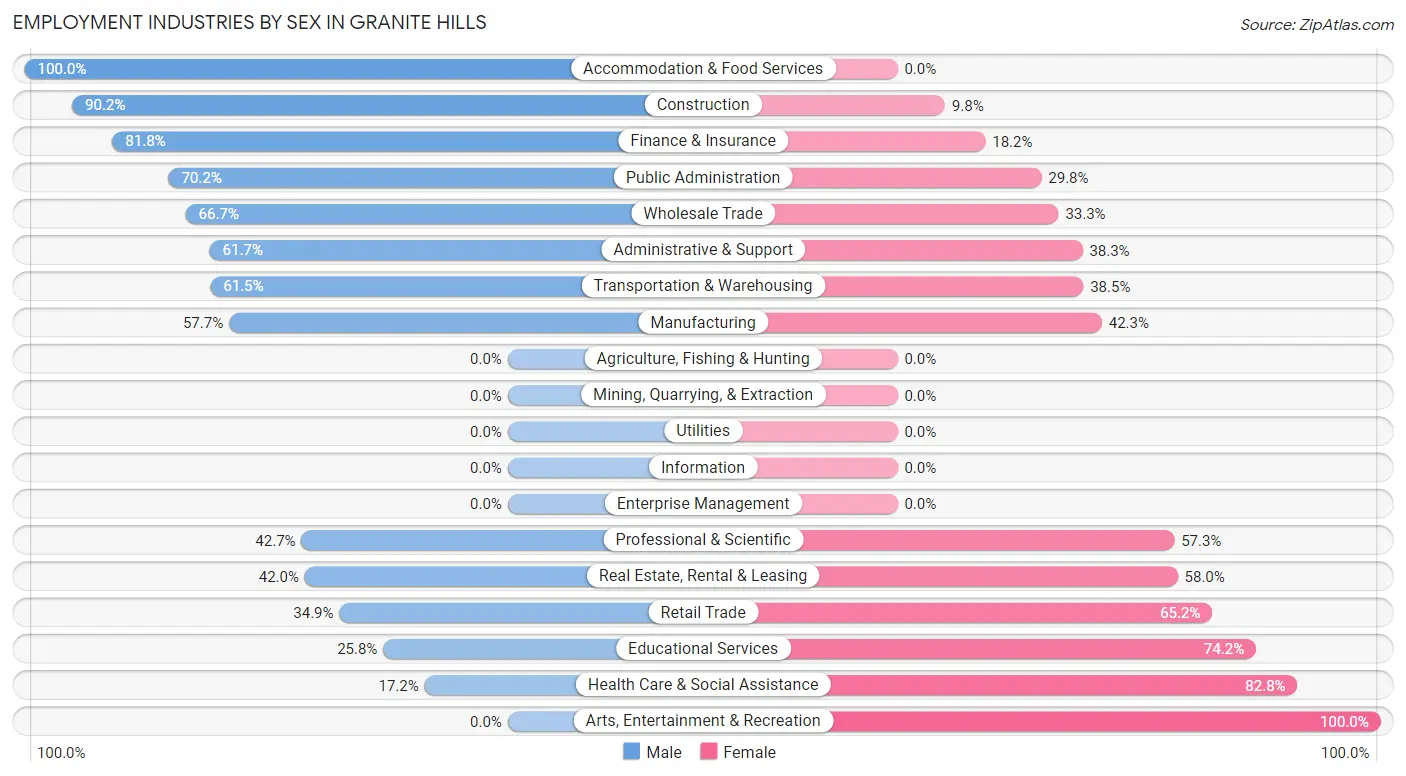
Employment Industries by Sex in Granite Hills
The Granite Hills industries that see more men than women are Accommodation & Food Services (100.0%), Construction (90.2%), and Finance & Insurance (81.8%), whereas the industries that tend to have a higher number of women are Arts, Entertainment & Recreation (100.0%), Health Care & Social Assistance (82.8%), and Educational Services (74.2%).
| Industry | Male | Female |
| Agriculture, Fishing & Hunting | 0 (0.0%) | 0 (0.0%) |
| Mining, Quarrying, & Extraction | 0 (0.0%) | 0 (0.0%) |
| Construction | 211 (90.2%) | 23 (9.8%) |
| Manufacturing | 165 (57.7%) | 121 (42.3%) |
| Wholesale Trade | 16 (66.7%) | 8 (33.3%) |
| Retail Trade | 46 (34.8%) | 86 (65.1%) |
| Transportation & Warehousing | 16 (61.5%) | 10 (38.5%) |
| Utilities | 0 (0.0%) | 0 (0.0%) |
| Information | 0 (0.0%) | 0 (0.0%) |
| Finance & Insurance | 27 (81.8%) | 6 (18.2%) |
| Real Estate, Rental & Leasing | 21 (42.0%) | 29 (58.0%) |
| Professional & Scientific | 161 (42.7%) | 216 (57.3%) |
| Enterprise Management | 0 (0.0%) | 0 (0.0%) |
| Administrative & Support | 58 (61.7%) | 36 (38.3%) |
| Educational Services | 33 (25.8%) | 95 (74.2%) |
| Health Care & Social Assistance | 21 (17.2%) | 101 (82.8%) |
| Arts, Entertainment & Recreation | 0 (0.0%) | 67 (100.0%) |
| Accommodation & Food Services | 8 (100.0%) | 0 (0.0%) |
| Public Administration | 33 (70.2%) | 14 (29.8%) |
| Total | 936 (51.7%) | 873 (48.3%) |
Education in Granite Hills
School Enrollment in Granite Hills
The most common levels of schooling among the 1,439 students in Granite Hills are college / undergraduate (433 | 30.1%), elementary school (360 | 25.0%), and high school (350 | 24.3%).
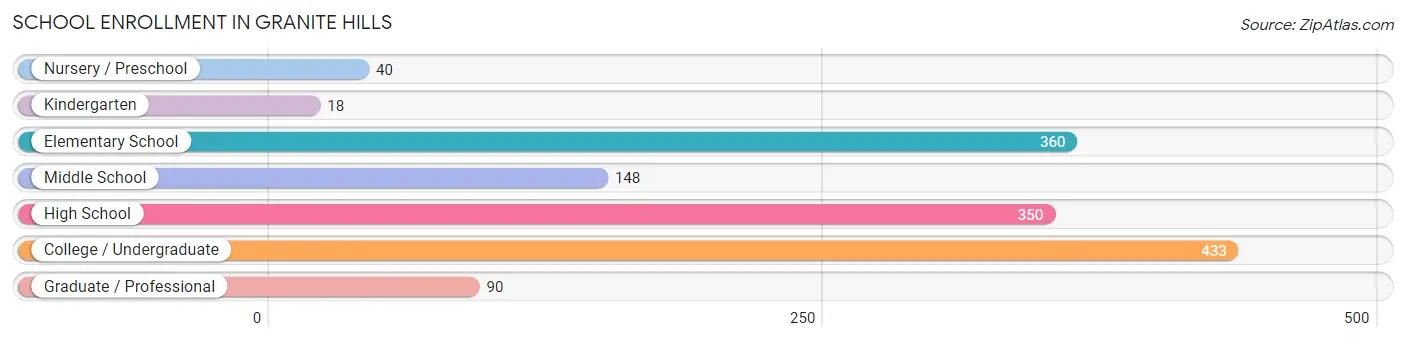
| School Level | # Students | % Students |
| Nursery / Preschool | 40 | 2.8% |
| Kindergarten | 18 | 1.3% |
| Elementary School | 360 | 25.0% |
| Middle School | 148 | 10.3% |
| High School | 350 | 24.3% |
| College / Undergraduate | 433 | 30.1% |
| Graduate / Professional | 90 | 6.2% |
| Total | 1,439 | 100.0% |
School Enrollment by Age by Funding Source in Granite Hills
Out of a total of 1,439 students who are enrolled in schools in Granite Hills, 435 (30.2%) attend a private institution, while the remaining 1,004 (69.8%) are enrolled in public schools. The age group of 35 years and over has the highest likelihood of being enrolled in private schools, with 94 (63.1% in the age bracket) enrolled. Conversely, the age group of 25 to 34 year olds has the lowest likelihood of being enrolled in a private school, with 126 (100.0% in the age bracket) attending a public institution.
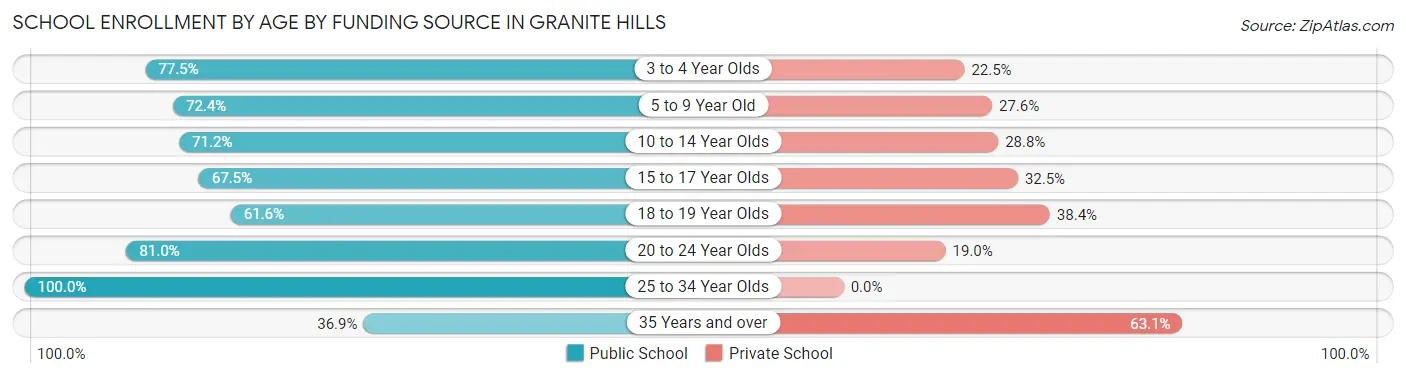
| Age Bracket | Public School | Private School |
| 3 to 4 Year Olds | 31 (77.5%) | 9 (22.5%) |
| 5 to 9 Year Old | 254 (72.4%) | 97 (27.6%) |
| 10 to 14 Year Olds | 198 (71.2%) | 80 (28.8%) |
| 15 to 17 Year Olds | 154 (67.5%) | 74 (32.5%) |
| 18 to 19 Year Olds | 93 (61.6%) | 58 (38.4%) |
| 20 to 24 Year Olds | 94 (81.0%) | 22 (19.0%) |
| 25 to 34 Year Olds | 126 (100.0%) | 0 (0.0%) |
| 35 Years and over | 55 (36.9%) | 94 (63.1%) |
| Total | 1,004 (69.8%) | 435 (30.2%) |
Educational Attainment by Field of Study in Granite Hills
Business (362 | 29.4%), computers & mathematics (177 | 14.4%), arts & humanities (134 | 10.9%), engineering (122 | 9.9%), and education (98 | 8.0%) are the most common fields of study among 1,229 individuals in Granite Hills who have obtained a bachelor's degree or higher.
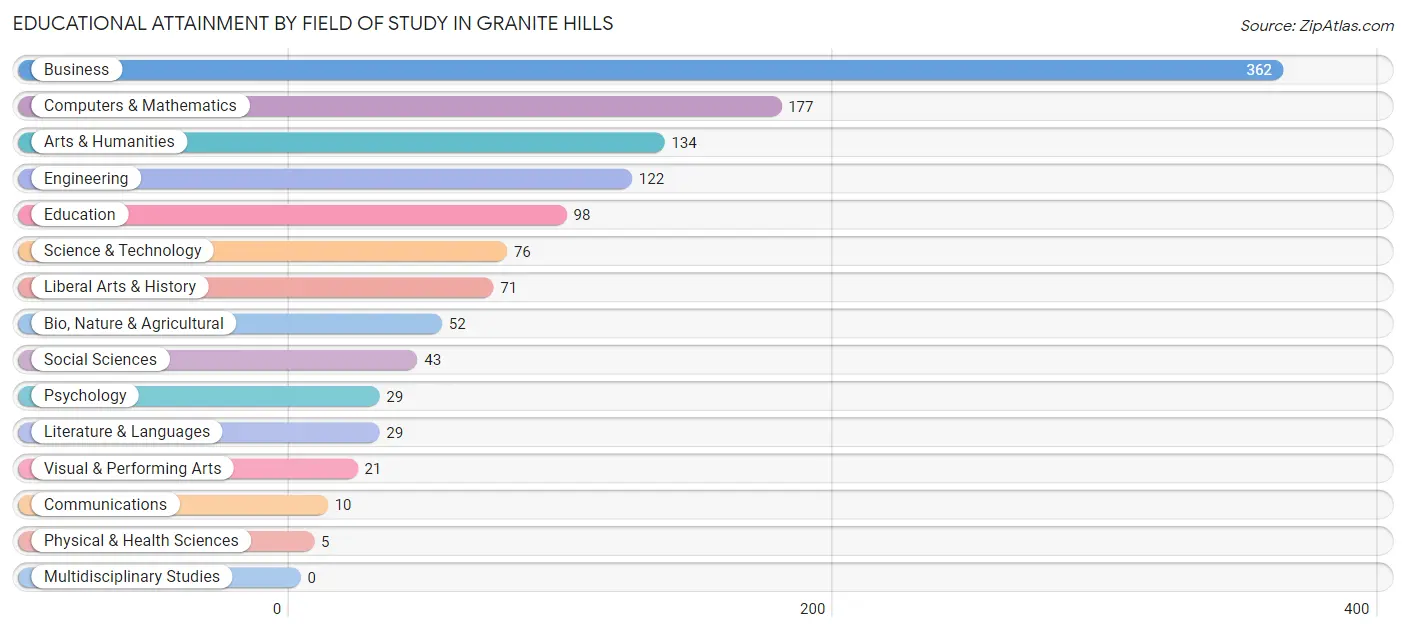
| Field of Study | # Graduates | % Graduates |
| Computers & Mathematics | 177 | 14.4% |
| Bio, Nature & Agricultural | 52 | 4.2% |
| Physical & Health Sciences | 5 | 0.4% |
| Psychology | 29 | 2.4% |
| Social Sciences | 43 | 3.5% |
| Engineering | 122 | 9.9% |
| Multidisciplinary Studies | 0 | 0.0% |
| Science & Technology | 76 | 6.2% |
| Business | 362 | 29.4% |
| Education | 98 | 8.0% |
| Literature & Languages | 29 | 2.4% |
| Liberal Arts & History | 71 | 5.8% |
| Visual & Performing Arts | 21 | 1.7% |
| Communications | 10 | 0.8% |
| Arts & Humanities | 134 | 10.9% |
| Total | 1,229 | 100.0% |
Transportation & Commute in Granite Hills
Vehicle Availability by Sex in Granite Hills
The most prevalent vehicle ownership categories in Granite Hills are males with 3 vehicles (328, accounting for 34.2%) and females with 3 vehicles (183, making up 37.6%).
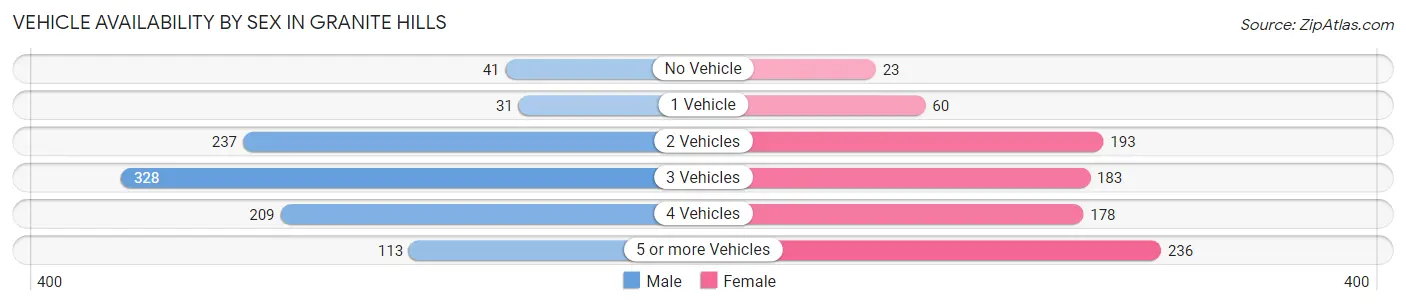
| Vehicles Available | Male | Female |
| No Vehicle | 41 (4.3%) | 23 (2.6%) |
| 1 Vehicle | 31 (3.2%) | 60 (6.9%) |
| 2 Vehicles | 237 (24.7%) | 193 (22.1%) |
| 3 Vehicles | 328 (34.2%) | 183 (21.0%) |
| 4 Vehicles | 209 (21.8%) | 178 (20.4%) |
| 5 or more Vehicles | 113 (11.8%) | 236 (27.0%) |
| Total | 959 (100.0%) | 873 (100.0%) |
Commute Time in Granite Hills
The most frequently occuring commute durations in Granite Hills are 20 to 24 minutes (320 commuters, 21.3%), 30 to 34 minutes (320 commuters, 21.3%), and 15 to 19 minutes (221 commuters, 14.7%).
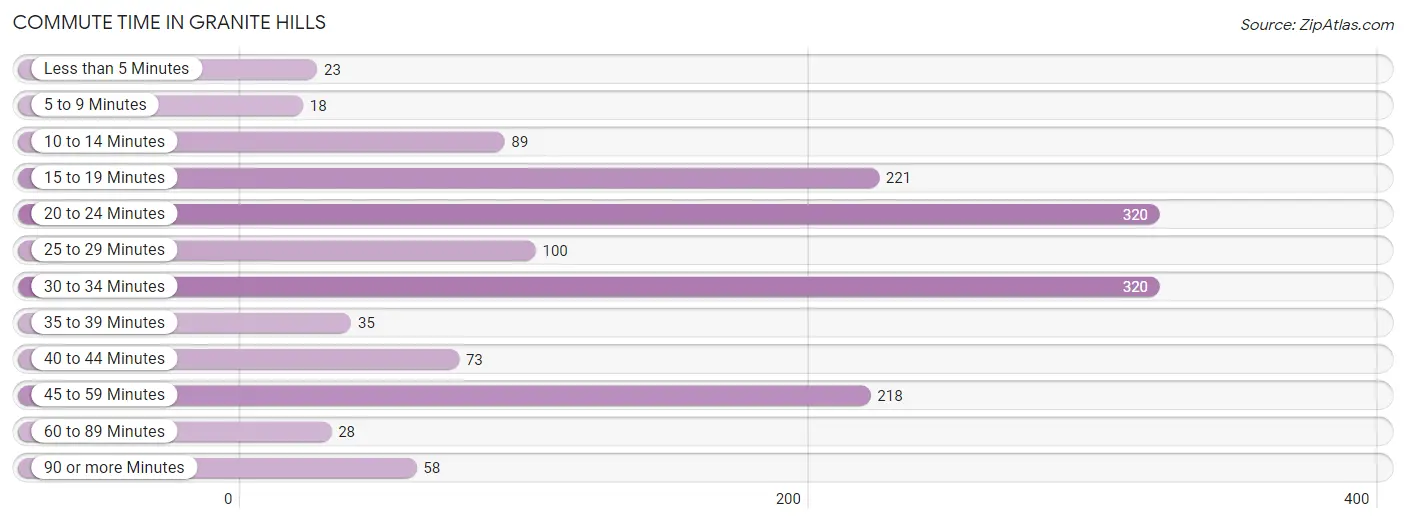
| Commute Time | # Commuters | % Commuters |
| Less than 5 Minutes | 23 | 1.5% |
| 5 to 9 Minutes | 18 | 1.2% |
| 10 to 14 Minutes | 89 | 5.9% |
| 15 to 19 Minutes | 221 | 14.7% |
| 20 to 24 Minutes | 320 | 21.3% |
| 25 to 29 Minutes | 100 | 6.7% |
| 30 to 34 Minutes | 320 | 21.3% |
| 35 to 39 Minutes | 35 | 2.3% |
| 40 to 44 Minutes | 73 | 4.9% |
| 45 to 59 Minutes | 218 | 14.5% |
| 60 to 89 Minutes | 28 | 1.9% |
| 90 or more Minutes | 58 | 3.9% |
Commute Time by Sex in Granite Hills
The most common commute times in Granite Hills are 30 to 34 minutes (234 commuters, 28.4%) for males and 45 to 59 minutes (193 commuters, 28.5%) for females.
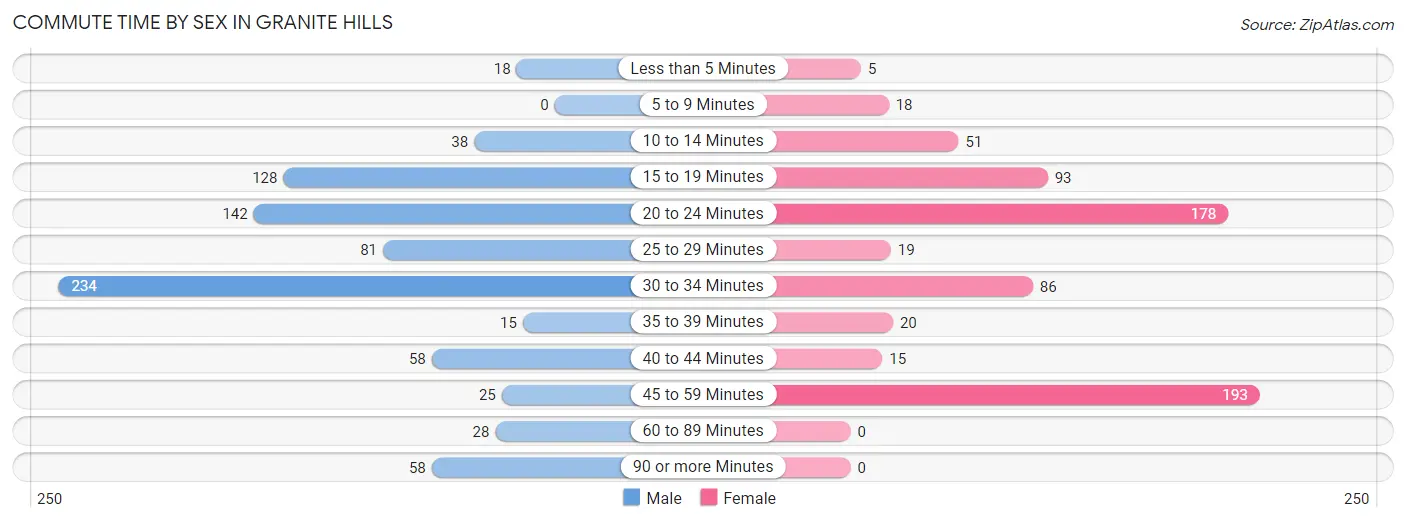
| Commute Time | Male | Female |
| Less than 5 Minutes | 18 (2.2%) | 5 (0.7%) |
| 5 to 9 Minutes | 0 (0.0%) | 18 (2.6%) |
| 10 to 14 Minutes | 38 (4.6%) | 51 (7.5%) |
| 15 to 19 Minutes | 128 (15.5%) | 93 (13.7%) |
| 20 to 24 Minutes | 142 (17.2%) | 178 (26.3%) |
| 25 to 29 Minutes | 81 (9.8%) | 19 (2.8%) |
| 30 to 34 Minutes | 234 (28.4%) | 86 (12.7%) |
| 35 to 39 Minutes | 15 (1.8%) | 20 (2.9%) |
| 40 to 44 Minutes | 58 (7.0%) | 15 (2.2%) |
| 45 to 59 Minutes | 25 (3.0%) | 193 (28.5%) |
| 60 to 89 Minutes | 28 (3.4%) | 0 (0.0%) |
| 90 or more Minutes | 58 (7.0%) | 0 (0.0%) |
Time of Departure to Work by Sex in Granite Hills
The most frequent times of departure to work in Granite Hills are 7:00 AM to 7:29 AM (147, 17.8%) for males and 7:00 AM to 7:29 AM (276, 40.7%) for females.
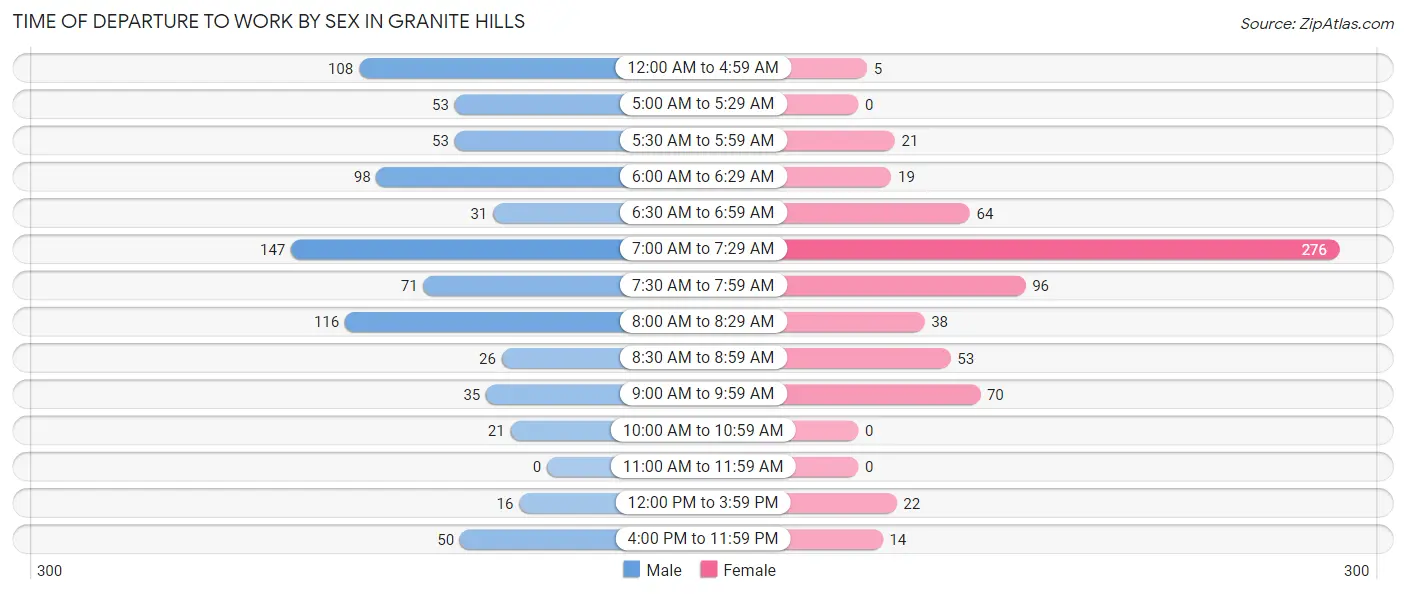
| Time of Departure | Male | Female |
| 12:00 AM to 4:59 AM | 108 (13.1%) | 5 (0.7%) |
| 5:00 AM to 5:29 AM | 53 (6.4%) | 0 (0.0%) |
| 5:30 AM to 5:59 AM | 53 (6.4%) | 21 (3.1%) |
| 6:00 AM to 6:29 AM | 98 (11.9%) | 19 (2.8%) |
| 6:30 AM to 6:59 AM | 31 (3.8%) | 64 (9.4%) |
| 7:00 AM to 7:29 AM | 147 (17.8%) | 276 (40.7%) |
| 7:30 AM to 7:59 AM | 71 (8.6%) | 96 (14.2%) |
| 8:00 AM to 8:29 AM | 116 (14.1%) | 38 (5.6%) |
| 8:30 AM to 8:59 AM | 26 (3.2%) | 53 (7.8%) |
| 9:00 AM to 9:59 AM | 35 (4.2%) | 70 (10.3%) |
| 10:00 AM to 10:59 AM | 21 (2.5%) | 0 (0.0%) |
| 11:00 AM to 11:59 AM | 0 (0.0%) | 0 (0.0%) |
| 12:00 PM to 3:59 PM | 16 (1.9%) | 22 (3.2%) |
| 4:00 PM to 11:59 PM | 50 (6.1%) | 14 (2.1%) |
| Total | 825 (100.0%) | 678 (100.0%) |
Housing Occupancy in Granite Hills
Occupancy by Ownership in Granite Hills
Of the total 1,192 dwellings in Granite Hills, owner-occupied units account for 1,047 (87.8%), while renter-occupied units make up 145 (12.2%).
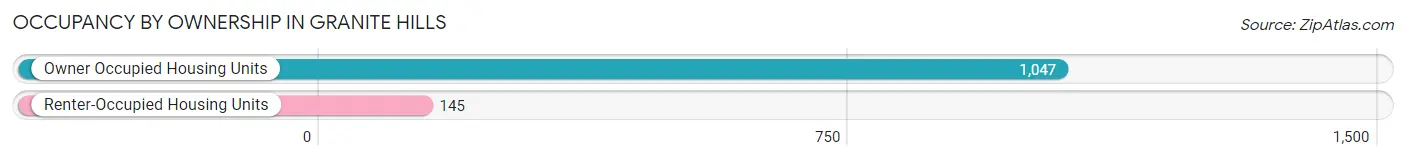
| Occupancy | # Housing Units | % Housing Units |
| Owner Occupied Housing Units | 1,047 | 87.8% |
| Renter-Occupied Housing Units | 145 | 12.2% |
| Total Occupied Housing Units | 1,192 | 100.0% |
Occupancy by Household Size in Granite Hills
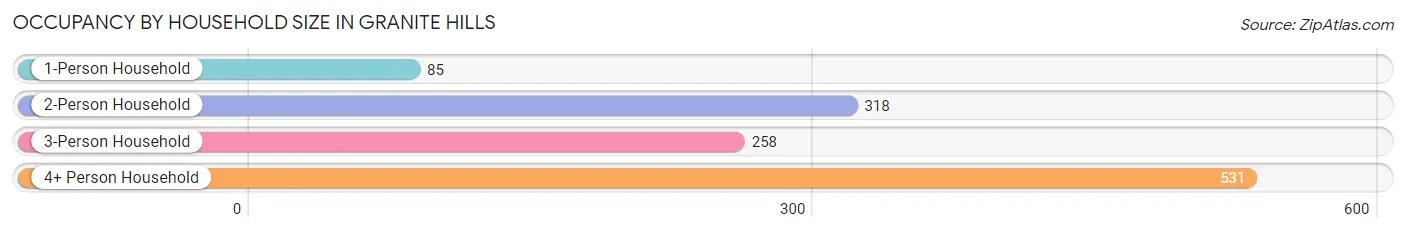
| Household Size | # Housing Units | % Housing Units |
| 1-Person Household | 85 | 7.1% |
| 2-Person Household | 318 | 26.7% |
| 3-Person Household | 258 | 21.6% |
| 4+ Person Household | 531 | 44.6% |
| Total Housing Units | 1,192 | 100.0% |
Occupancy by Ownership by Household Size in Granite Hills
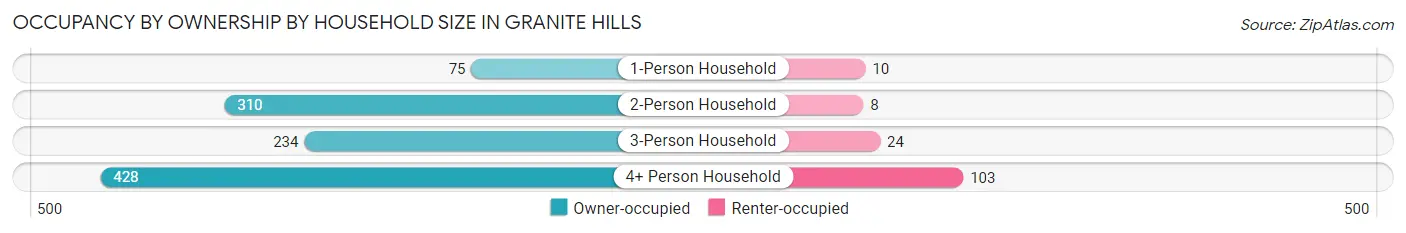
| Household Size | Owner-occupied | Renter-occupied |
| 1-Person Household | 75 (88.2%) | 10 (11.8%) |
| 2-Person Household | 310 (97.5%) | 8 (2.5%) |
| 3-Person Household | 234 (90.7%) | 24 (9.3%) |
| 4+ Person Household | 428 (80.6%) | 103 (19.4%) |
| Total Housing Units | 1,047 (87.8%) | 145 (12.2%) |
Occupancy by Educational Attainment in Granite Hills
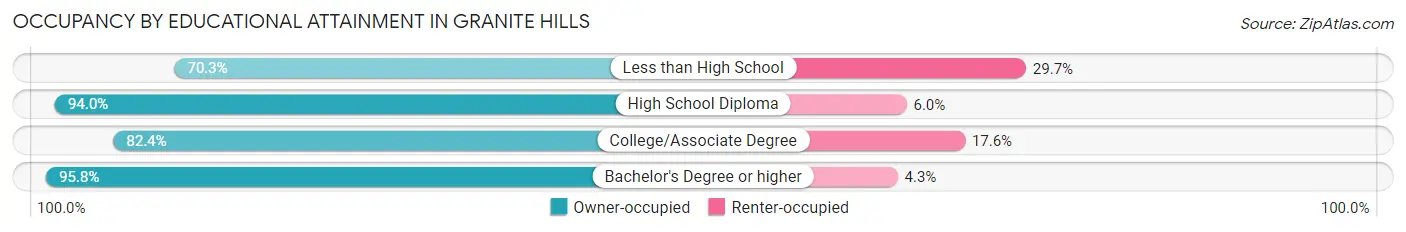
| Household Size | Owner-occupied | Renter-occupied |
| Less than High School | 45 (70.3%) | 19 (29.7%) |
| High School Diploma | 78 (94.0%) | 5 (6.0%) |
| College/Associate Degree | 473 (82.4%) | 101 (17.6%) |
| Bachelor's Degree or higher | 451 (95.8%) | 20 (4.3%) |
Occupancy by Age of Householder in Granite Hills
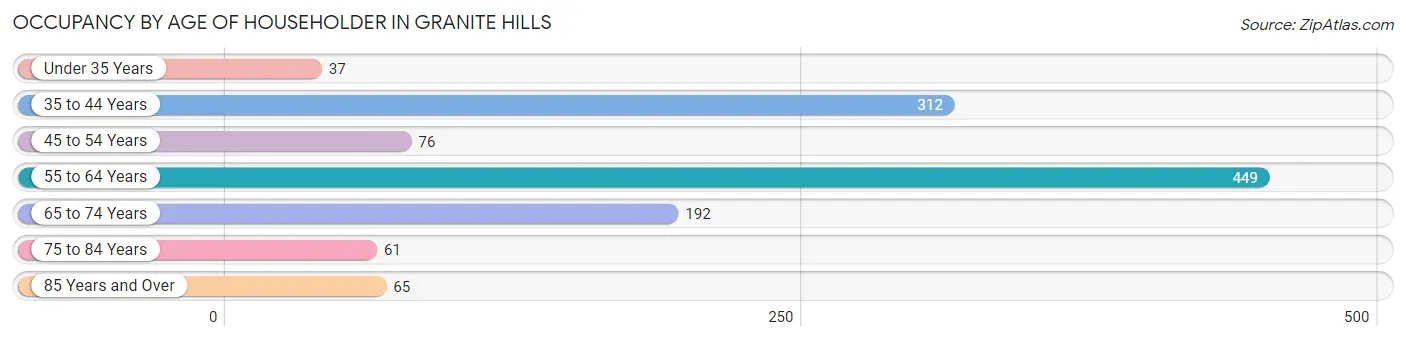
| Age Bracket | # Households | % Households |
| Under 35 Years | 37 | 3.1% |
| 35 to 44 Years | 312 | 26.2% |
| 45 to 54 Years | 76 | 6.4% |
| 55 to 64 Years | 449 | 37.7% |
| 65 to 74 Years | 192 | 16.1% |
| 75 to 84 Years | 61 | 5.1% |
| 85 Years and Over | 65 | 5.4% |
| Total | 1,192 | 100.0% |
Housing Finances in Granite Hills
Median Income by Occupancy in Granite Hills

| Occupancy Type | # Households | Median Income |
| Owner-Occupied | 1,047 (87.8%) | $147,188 |
| Renter-Occupied | 145 (12.2%) | $0 |
| Average | 1,192 (100.0%) | $141,774 |
Occupancy by Householder Income Bracket in Granite Hills
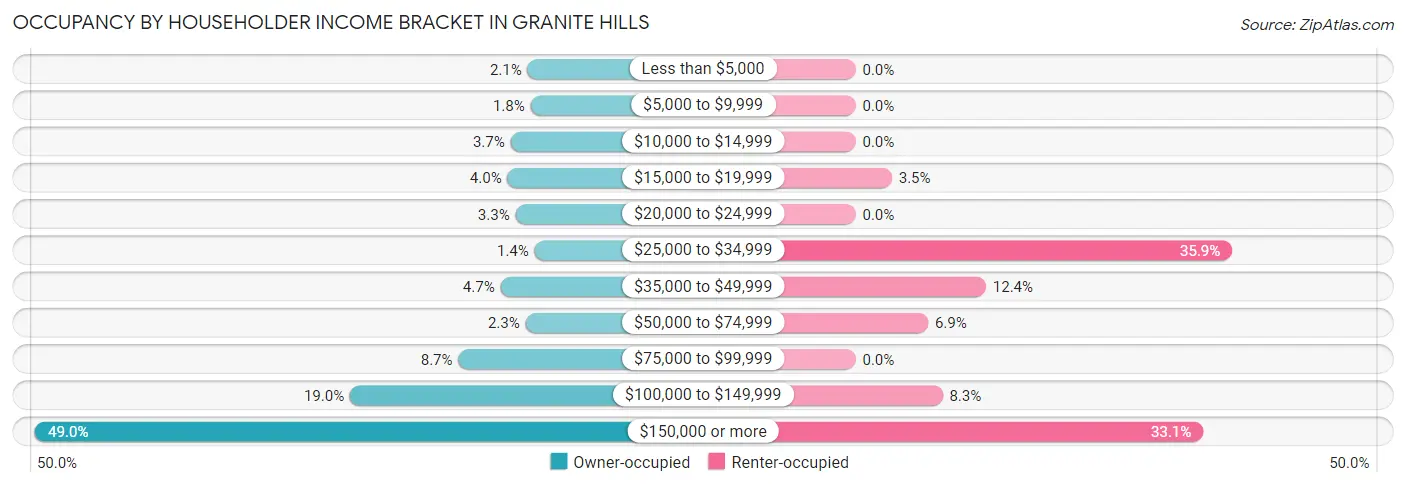
| Income Bracket | Owner-occupied | Renter-occupied |
| Less than $5,000 | 22 (2.1%) | 0 (0.0%) |
| $5,000 to $9,999 | 19 (1.8%) | 0 (0.0%) |
| $10,000 to $14,999 | 39 (3.7%) | 0 (0.0%) |
| $15,000 to $19,999 | 42 (4.0%) | 5 (3.5%) |
| $20,000 to $24,999 | 34 (3.3%) | 0 (0.0%) |
| $25,000 to $34,999 | 15 (1.4%) | 52 (35.9%) |
| $35,000 to $49,999 | 49 (4.7%) | 18 (12.4%) |
| $50,000 to $74,999 | 24 (2.3%) | 10 (6.9%) |
| $75,000 to $99,999 | 91 (8.7%) | 0 (0.0%) |
| $100,000 to $149,999 | 199 (19.0%) | 12 (8.3%) |
| $150,000 or more | 513 (49.0%) | 48 (33.1%) |
| Total | 1,047 (100.0%) | 145 (100.0%) |
Monthly Housing Cost Tiers in Granite Hills
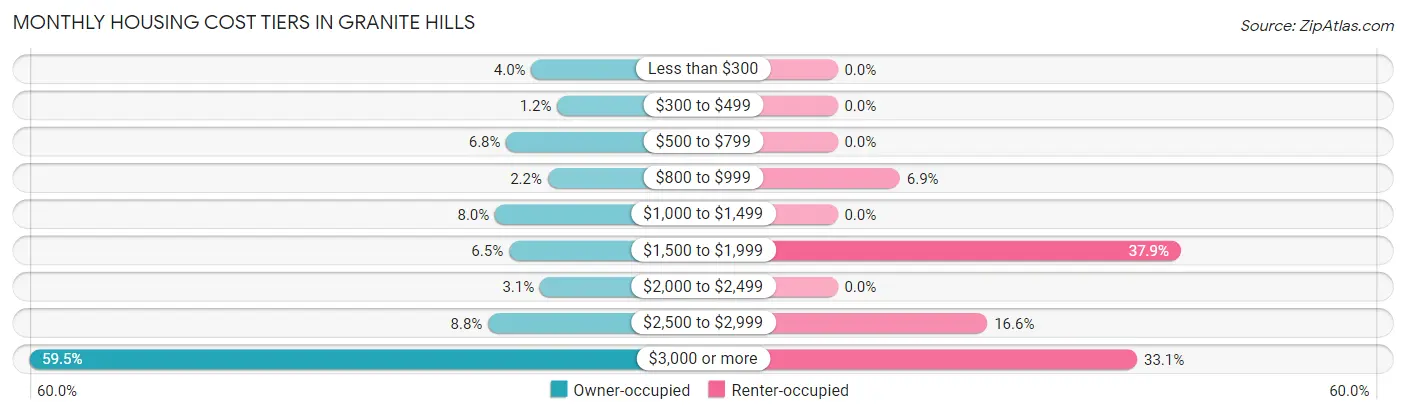
| Monthly Cost | Owner-occupied | Renter-occupied |
| Less than $300 | 42 (4.0%) | 0 (0.0%) |
| $300 to $499 | 12 (1.1%) | 0 (0.0%) |
| $500 to $799 | 71 (6.8%) | 0 (0.0%) |
| $800 to $999 | 23 (2.2%) | 10 (6.9%) |
| $1,000 to $1,499 | 84 (8.0%) | 0 (0.0%) |
| $1,500 to $1,999 | 68 (6.5%) | 55 (37.9%) |
| $2,000 to $2,499 | 32 (3.1%) | 0 (0.0%) |
| $2,500 to $2,999 | 92 (8.8%) | 24 (16.6%) |
| $3,000 or more | 623 (59.5%) | 48 (33.1%) |
| Total | 1,047 (100.0%) | 145 (100.0%) |
Physical Housing Characteristics in Granite Hills
Housing Structures in Granite Hills
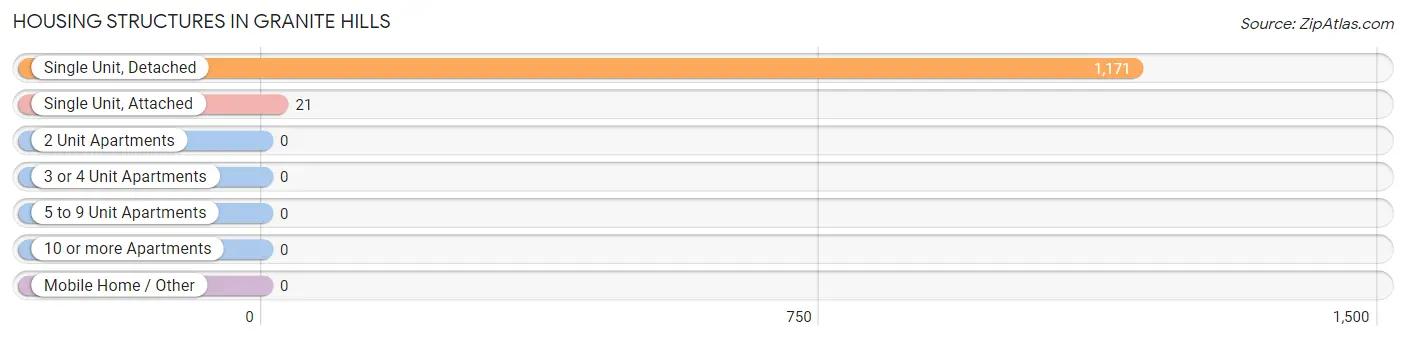
| Structure Type | # Housing Units | % Housing Units |
| Single Unit, Detached | 1,171 | 98.2% |
| Single Unit, Attached | 21 | 1.8% |
| 2 Unit Apartments | 0 | 0.0% |
| 3 or 4 Unit Apartments | 0 | 0.0% |
| 5 to 9 Unit Apartments | 0 | 0.0% |
| 10 or more Apartments | 0 | 0.0% |
| Mobile Home / Other | 0 | 0.0% |
| Total | 1,192 | 100.0% |
Housing Structures by Occupancy in Granite Hills
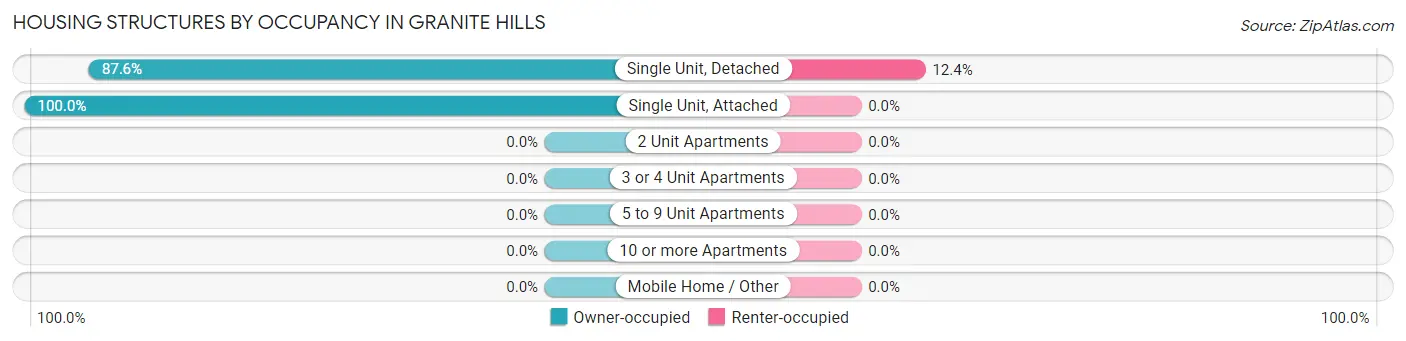
| Structure Type | Owner-occupied | Renter-occupied |
| Single Unit, Detached | 1,026 (87.6%) | 145 (12.4%) |
| Single Unit, Attached | 21 (100.0%) | 0 (0.0%) |
| 2 Unit Apartments | 0 (0.0%) | 0 (0.0%) |
| 3 or 4 Unit Apartments | 0 (0.0%) | 0 (0.0%) |
| 5 to 9 Unit Apartments | 0 (0.0%) | 0 (0.0%) |
| 10 or more Apartments | 0 (0.0%) | 0 (0.0%) |
| Mobile Home / Other | 0 (0.0%) | 0 (0.0%) |
| Total | 1,047 (87.8%) | 145 (12.2%) |
Housing Structures by Number of Rooms in Granite Hills
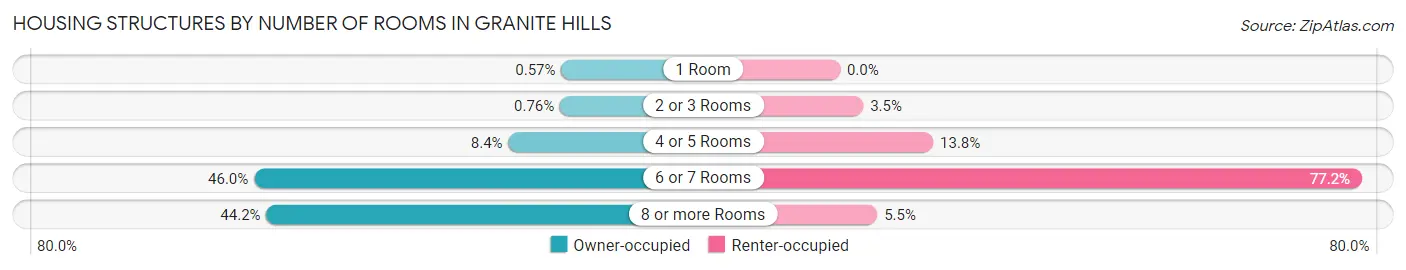
| Number of Rooms | Owner-occupied | Renter-occupied |
| 1 Room | 6 (0.6%) | 0 (0.0%) |
| 2 or 3 Rooms | 8 (0.8%) | 5 (3.5%) |
| 4 or 5 Rooms | 88 (8.4%) | 20 (13.8%) |
| 6 or 7 Rooms | 482 (46.0%) | 112 (77.2%) |
| 8 or more Rooms | 463 (44.2%) | 8 (5.5%) |
| Total | 1,047 (100.0%) | 145 (100.0%) |
Housing Structure by Heating Type in Granite Hills
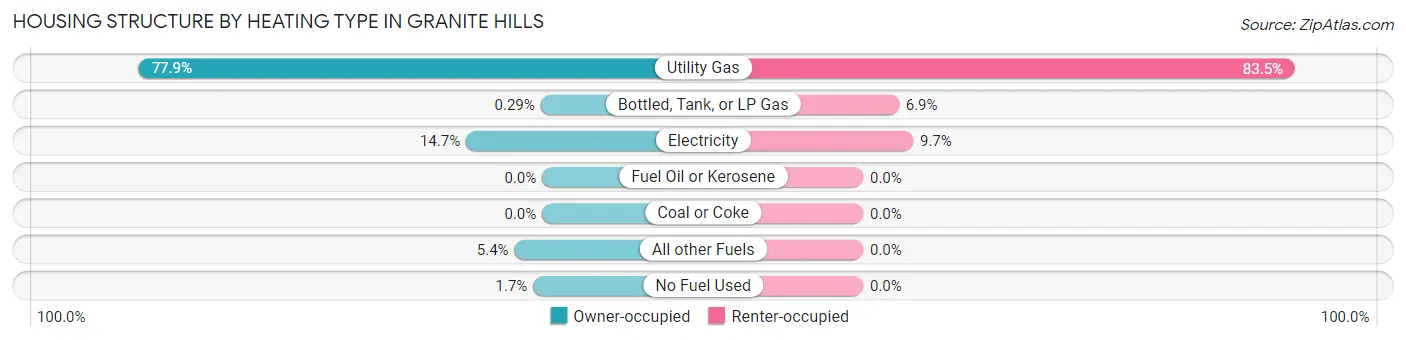
| Heating Type | Owner-occupied | Renter-occupied |
| Utility Gas | 816 (77.9%) | 121 (83.5%) |
| Bottled, Tank, or LP Gas | 3 (0.3%) | 10 (6.9%) |
| Electricity | 154 (14.7%) | 14 (9.7%) |
| Fuel Oil or Kerosene | 0 (0.0%) | 0 (0.0%) |
| Coal or Coke | 0 (0.0%) | 0 (0.0%) |
| All other Fuels | 56 (5.3%) | 0 (0.0%) |
| No Fuel Used | 18 (1.7%) | 0 (0.0%) |
| Total | 1,047 (100.0%) | 145 (100.0%) |
Household Vehicle Usage in Granite Hills
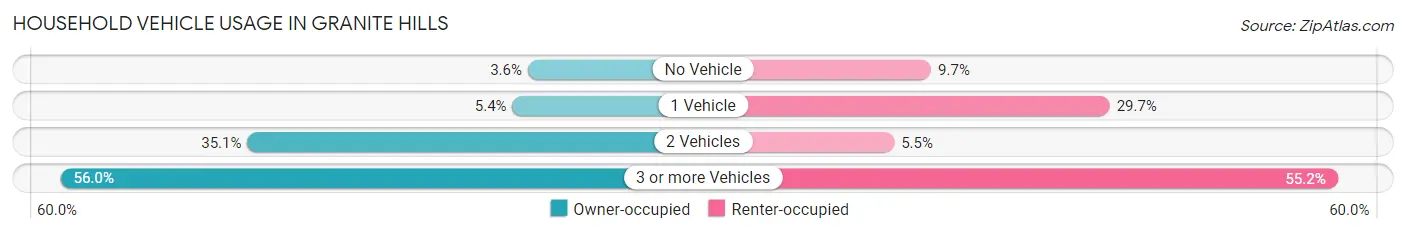
| Vehicles per Household | Owner-occupied | Renter-occupied |
| No Vehicle | 38 (3.6%) | 14 (9.7%) |
| 1 Vehicle | 56 (5.3%) | 43 (29.7%) |
| 2 Vehicles | 367 (35.0%) | 8 (5.5%) |
| 3 or more Vehicles | 586 (56.0%) | 80 (55.2%) |
| Total | 1,047 (100.0%) | 145 (100.0%) |
Real Estate & Mortgages in Granite Hills
Real Estate and Mortgage Overview in Granite Hills
| Characteristic | Without Mortgage | With Mortgage |
| Housing Units | 213 | 834 |
| Median Property Value | $703,500 | $876,900 |
| Median Household Income | $71,250 | $458 |
| Monthly Housing Costs | $712 | $623 |
| Real Estate Taxes | $3,014 | $2 |
Property Value by Mortgage Status in Granite Hills
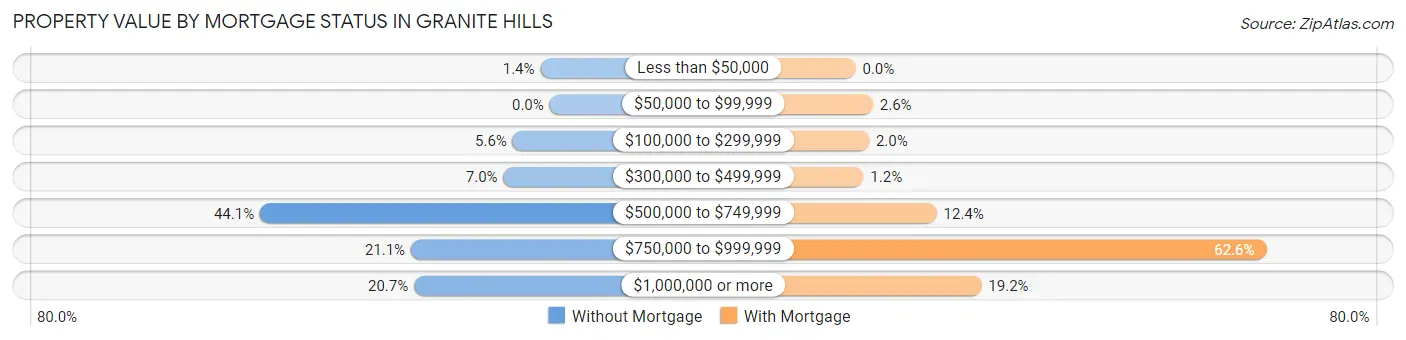
| Property Value | Without Mortgage | With Mortgage |
| Less than $50,000 | 3 (1.4%) | 0 (0.0%) |
| $50,000 to $99,999 | 0 (0.0%) | 22 (2.6%) |
| $100,000 to $299,999 | 12 (5.6%) | 17 (2.0%) |
| $300,000 to $499,999 | 15 (7.0%) | 10 (1.2%) |
| $500,000 to $749,999 | 94 (44.1%) | 103 (12.3%) |
| $750,000 to $999,999 | 45 (21.1%) | 522 (62.6%) |
| $1,000,000 or more | 44 (20.7%) | 160 (19.2%) |
| Total | 213 (100.0%) | 834 (100.0%) |
Household Income by Mortgage Status in Granite Hills
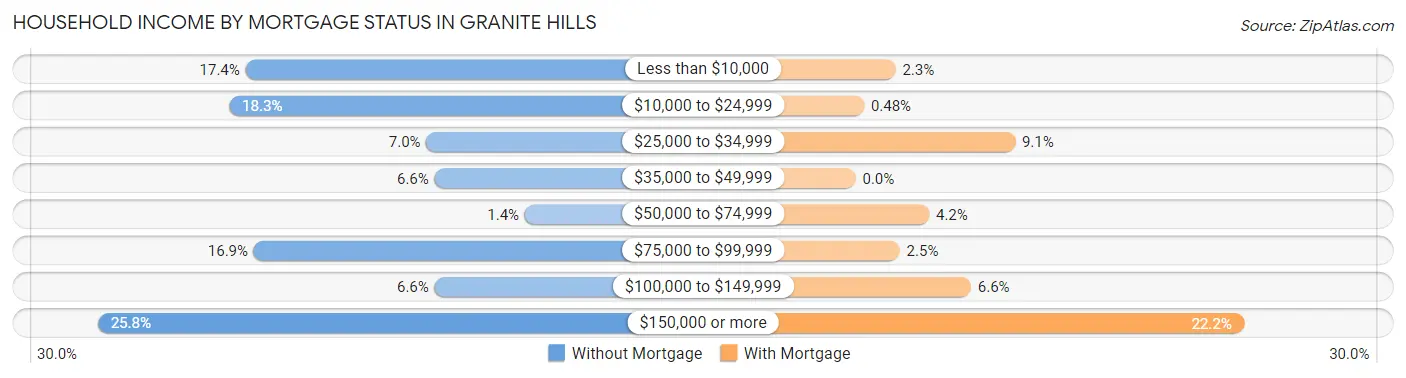
| Household Income | Without Mortgage | With Mortgage |
| Less than $10,000 | 37 (17.4%) | 19 (2.3%) |
| $10,000 to $24,999 | 39 (18.3%) | 4 (0.5%) |
| $25,000 to $34,999 | 15 (7.0%) | 76 (9.1%) |
| $35,000 to $49,999 | 14 (6.6%) | 0 (0.0%) |
| $50,000 to $74,999 | 3 (1.4%) | 35 (4.2%) |
| $75,000 to $99,999 | 36 (16.9%) | 21 (2.5%) |
| $100,000 to $149,999 | 14 (6.6%) | 55 (6.6%) |
| $150,000 or more | 55 (25.8%) | 185 (22.2%) |
| Total | 213 (100.0%) | 834 (100.0%) |
Property Value to Household Income Ratio in Granite Hills
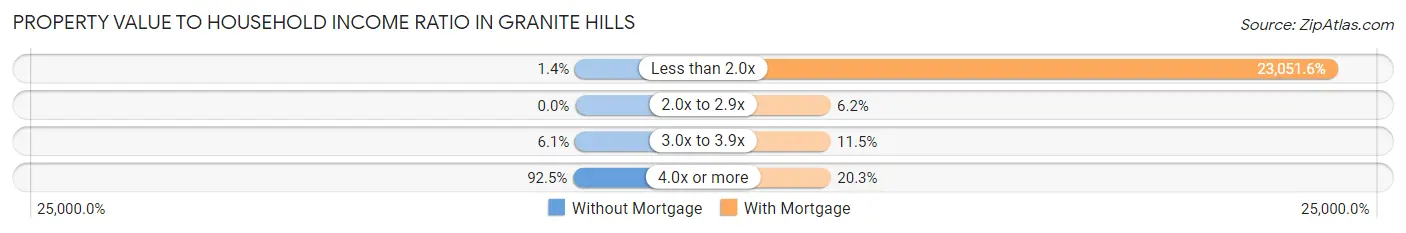
| Value-to-Income Ratio | Without Mortgage | With Mortgage |
| Less than 2.0x | 3 (1.4%) | 192,250 (23,051.6%) |
| 2.0x to 2.9x | 0 (0.0%) | 52 (6.2%) |
| 3.0x to 3.9x | 13 (6.1%) | 96 (11.5%) |
| 4.0x or more | 197 (92.5%) | 169 (20.3%) |
| Total | 213 (100.0%) | 834 (100.0%) |
Real Estate Taxes by Mortgage Status in Granite Hills
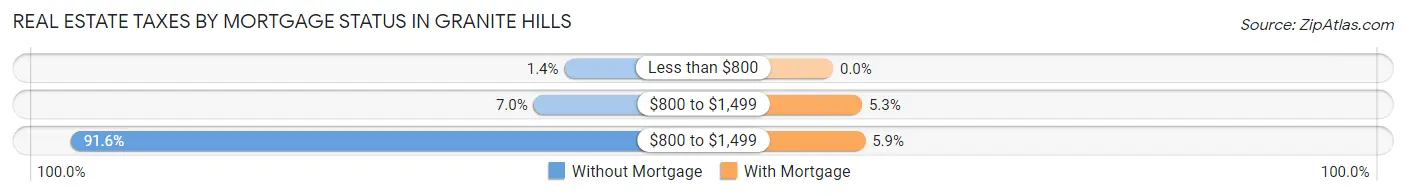
| Property Taxes | Without Mortgage | With Mortgage |
| Less than $800 | 3 (1.4%) | 0 (0.0%) |
| $800 to $1,499 | 15 (7.0%) | 44 (5.3%) |
| $800 to $1,499 | 195 (91.5%) | 49 (5.9%) |
| Total | 213 (100.0%) | 834 (100.0%) |
Health & Disability in Granite Hills
Health Insurance Coverage by Age in Granite Hills
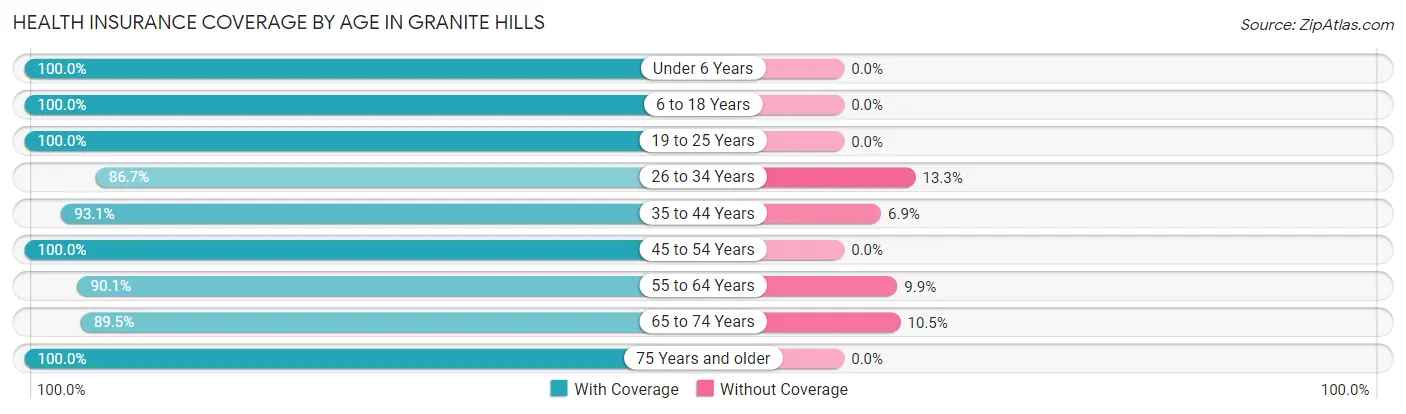
| Age Bracket | With Coverage | Without Coverage |
| Under 6 Years | 261 (100.0%) | 0 (0.0%) |
| 6 to 18 Years | 981 (100.0%) | 0 (0.0%) |
| 19 to 25 Years | 288 (100.0%) | 0 (0.0%) |
| 26 to 34 Years | 450 (86.7%) | 69 (13.3%) |
| 35 to 44 Years | 706 (93.1%) | 52 (6.9%) |
| 45 to 54 Years | 178 (100.0%) | 0 (0.0%) |
| 55 to 64 Years | 774 (90.1%) | 85 (9.9%) |
| 65 to 74 Years | 392 (89.5%) | 46 (10.5%) |
| 75 Years and older | 195 (100.0%) | 0 (0.0%) |
| Total | 4,225 (94.4%) | 252 (5.6%) |
Health Insurance Coverage by Citizenship Status in Granite Hills
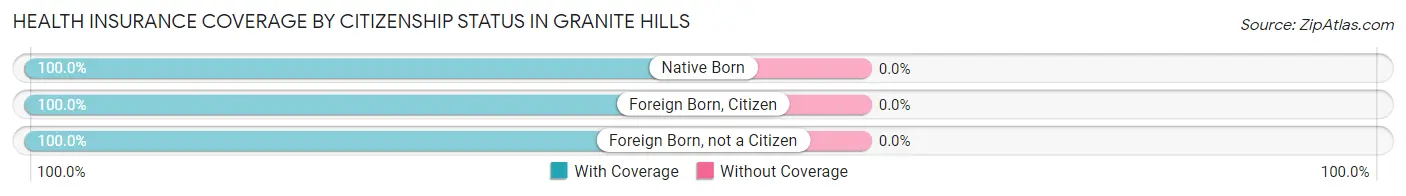
| Citizenship Status | With Coverage | Without Coverage |
| Native Born | 261 (100.0%) | 0 (0.0%) |
| Foreign Born, Citizen | 981 (100.0%) | 0 (0.0%) |
| Foreign Born, not a Citizen | 288 (100.0%) | 0 (0.0%) |
Health Insurance Coverage by Household Income in Granite Hills
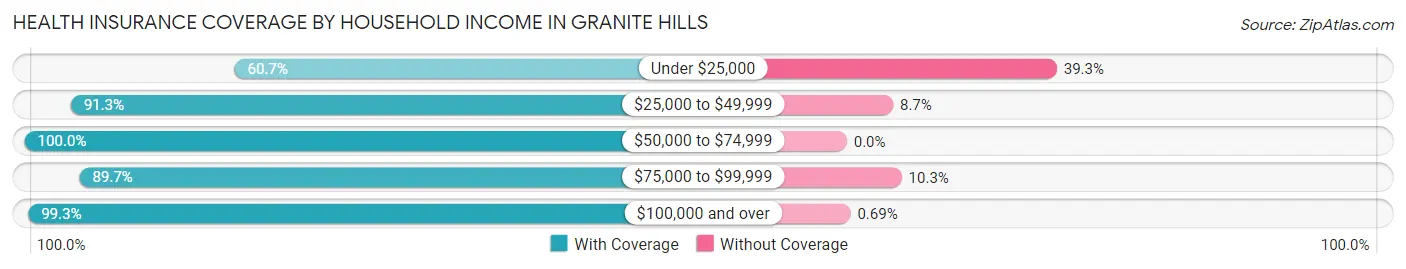
| Household Income | With Coverage | Without Coverage |
| Under $25,000 | 239 (60.7%) | 155 (39.3%) |
| $25,000 to $49,999 | 369 (91.3%) | 35 (8.7%) |
| $50,000 to $74,999 | 106 (100.0%) | 0 (0.0%) |
| $75,000 to $99,999 | 192 (89.7%) | 22 (10.3%) |
| $100,000 and over | 3,319 (99.3%) | 23 (0.7%) |
Public vs Private Health Insurance Coverage by Age in Granite Hills
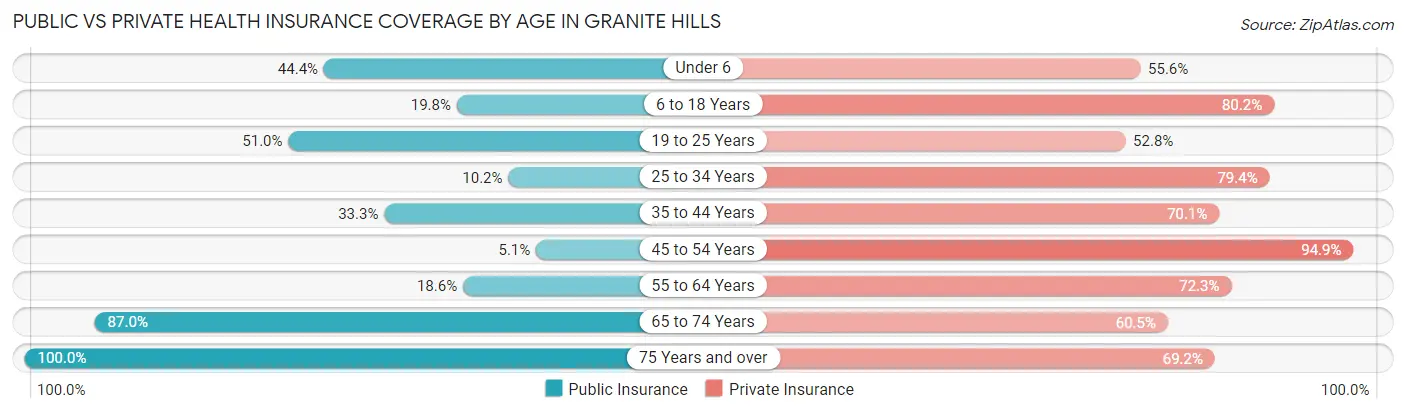
| Age Bracket | Public Insurance | Private Insurance |
| Under 6 | 116 (44.4%) | 145 (55.6%) |
| 6 to 18 Years | 194 (19.8%) | 787 (80.2%) |
| 19 to 25 Years | 147 (51.0%) | 152 (52.8%) |
| 25 to 34 Years | 53 (10.2%) | 412 (79.4%) |
| 35 to 44 Years | 252 (33.3%) | 531 (70.1%) |
| 45 to 54 Years | 9 (5.1%) | 169 (94.9%) |
| 55 to 64 Years | 160 (18.6%) | 621 (72.3%) |
| 65 to 74 Years | 381 (87.0%) | 265 (60.5%) |
| 75 Years and over | 195 (100.0%) | 135 (69.2%) |
| Total | 1,507 (33.7%) | 3,217 (71.9%) |
Disability Status by Sex by Age in Granite Hills
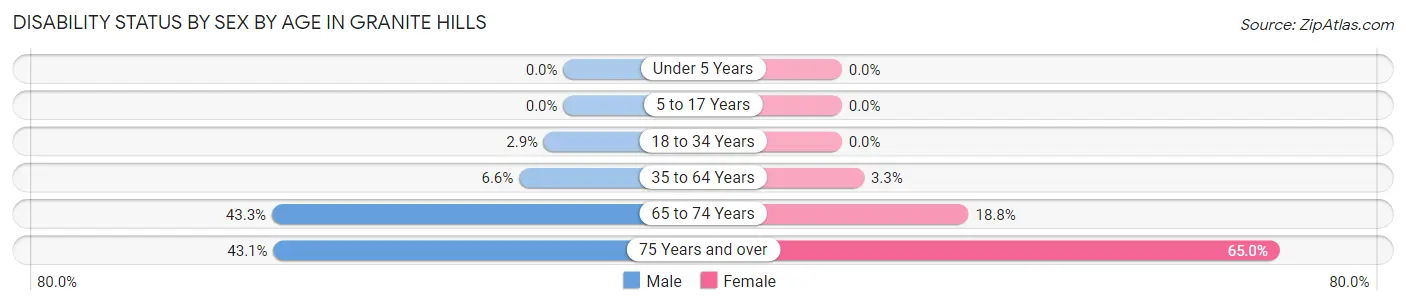
| Age Bracket | Male | Female |
| Under 5 Years | 0 (0.0%) | 0 (0.0%) |
| 5 to 17 Years | 0 (0.0%) | 0 (0.0%) |
| 18 to 34 Years | 11 (2.9%) | 0 (0.0%) |
| 35 to 64 Years | 60 (6.6%) | 29 (3.3%) |
| 65 to 74 Years | 116 (43.3%) | 32 (18.8%) |
| 75 Years and over | 31 (43.1%) | 80 (65.0%) |
Disability Class by Sex by Age in Granite Hills
Disability Class: Hearing Difficulty
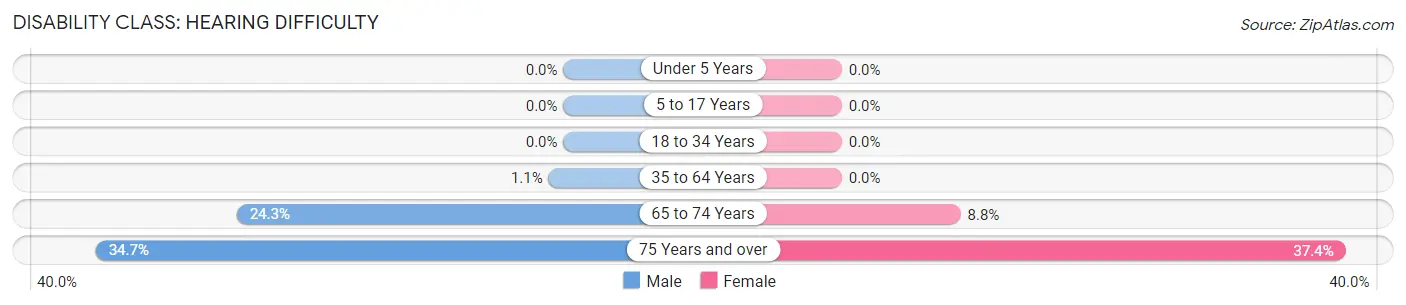
| Age Bracket | Male | Female |
| Under 5 Years | 0 (0.0%) | 0 (0.0%) |
| 5 to 17 Years | 0 (0.0%) | 0 (0.0%) |
| 18 to 34 Years | 0 (0.0%) | 0 (0.0%) |
| 35 to 64 Years | 10 (1.1%) | 0 (0.0%) |
| 65 to 74 Years | 65 (24.2%) | 15 (8.8%) |
| 75 Years and over | 25 (34.7%) | 46 (37.4%) |
Disability Class: Vision Difficulty
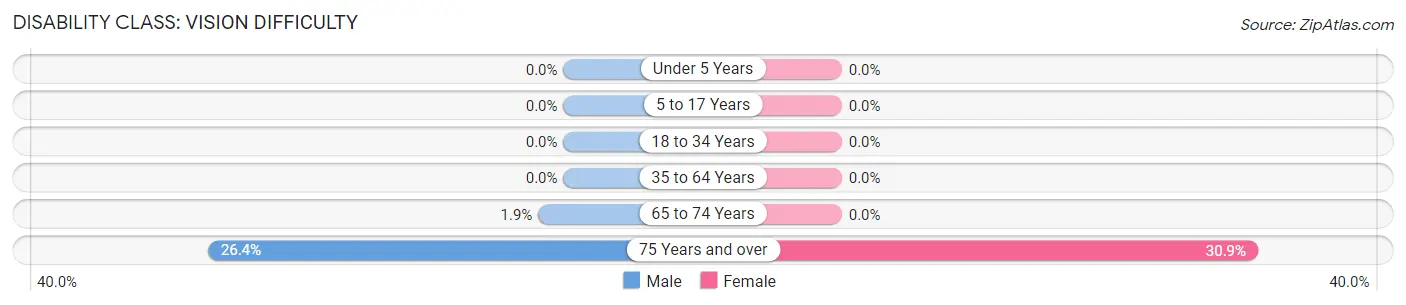
| Age Bracket | Male | Female |
| Under 5 Years | 0 (0.0%) | 0 (0.0%) |
| 5 to 17 Years | 0 (0.0%) | 0 (0.0%) |
| 18 to 34 Years | 0 (0.0%) | 0 (0.0%) |
| 35 to 64 Years | 0 (0.0%) | 0 (0.0%) |
| 65 to 74 Years | 5 (1.9%) | 0 (0.0%) |
| 75 Years and over | 19 (26.4%) | 38 (30.9%) |
Disability Class: Cognitive Difficulty
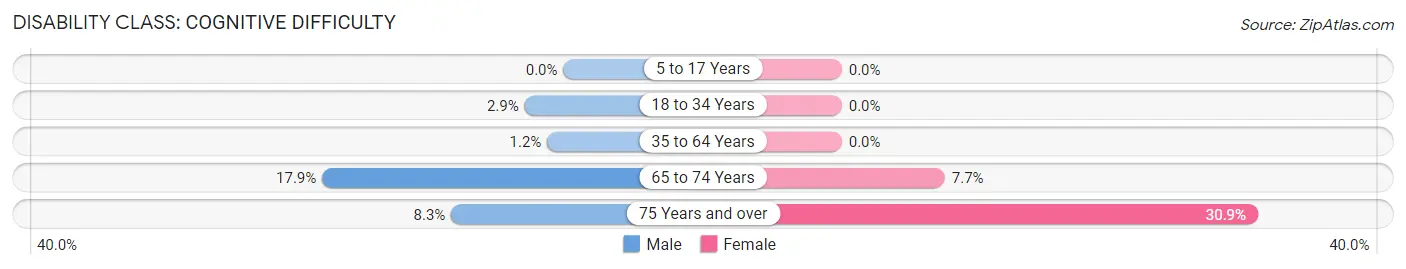
| Age Bracket | Male | Female |
| 5 to 17 Years | 0 (0.0%) | 0 (0.0%) |
| 18 to 34 Years | 11 (2.9%) | 0 (0.0%) |
| 35 to 64 Years | 11 (1.2%) | 0 (0.0%) |
| 65 to 74 Years | 48 (17.9%) | 13 (7.6%) |
| 75 Years and over | 6 (8.3%) | 38 (30.9%) |
Disability Class: Ambulatory Difficulty
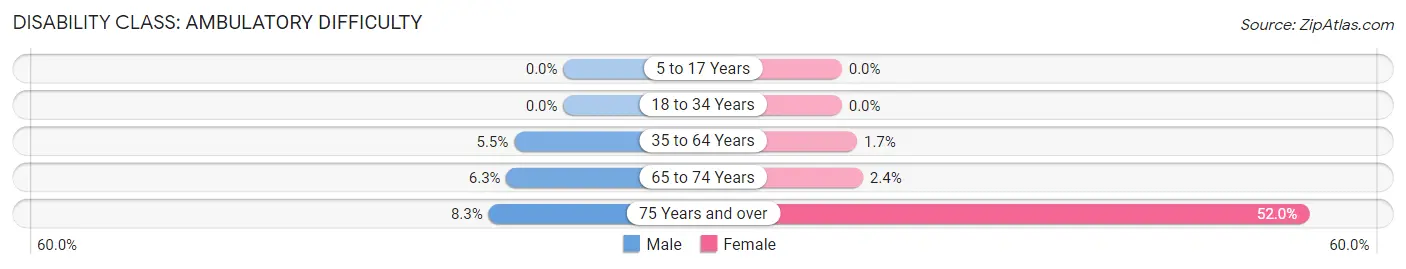
| Age Bracket | Male | Female |
| 5 to 17 Years | 0 (0.0%) | 0 (0.0%) |
| 18 to 34 Years | 0 (0.0%) | 0 (0.0%) |
| 35 to 64 Years | 50 (5.5%) | 15 (1.7%) |
| 65 to 74 Years | 17 (6.3%) | 4 (2.4%) |
| 75 Years and over | 6 (8.3%) | 64 (52.0%) |
Disability Class: Self-Care Difficulty
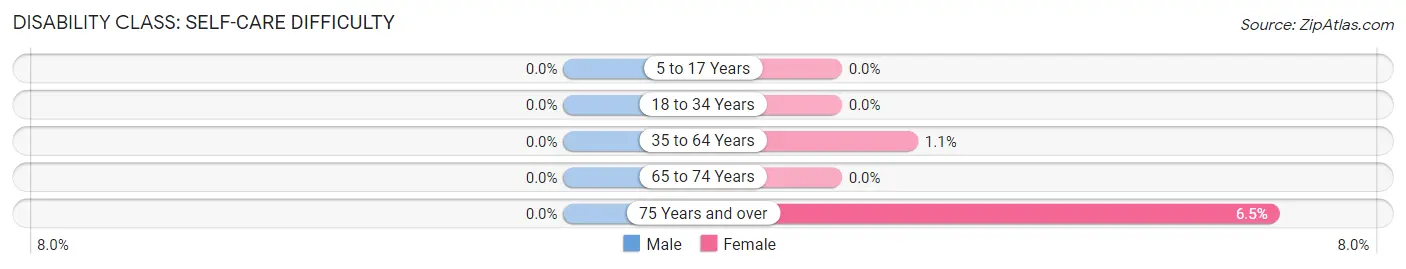
| Age Bracket | Male | Female |
| 5 to 17 Years | 0 (0.0%) | 0 (0.0%) |
| 18 to 34 Years | 0 (0.0%) | 0 (0.0%) |
| 35 to 64 Years | 0 (0.0%) | 10 (1.1%) |
| 65 to 74 Years | 0 (0.0%) | 0 (0.0%) |
| 75 Years and over | 0 (0.0%) | 8 (6.5%) |
Technology Access in Granite Hills
Computing Device Access in Granite Hills
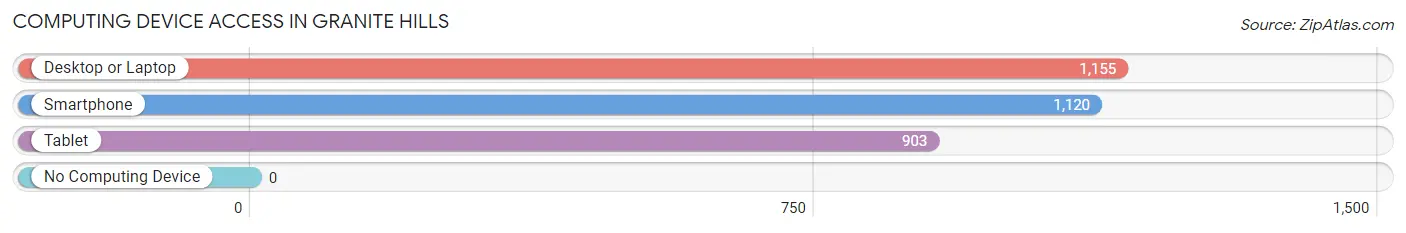
| Device Type | # Households | % Households |
| Desktop or Laptop | 1,155 | 96.9% |
| Smartphone | 1,120 | 94.0% |
| Tablet | 903 | 75.8% |
| No Computing Device | 0 | 0.0% |
| Total | 1,192 | 100.0% |
Internet Access in Granite Hills
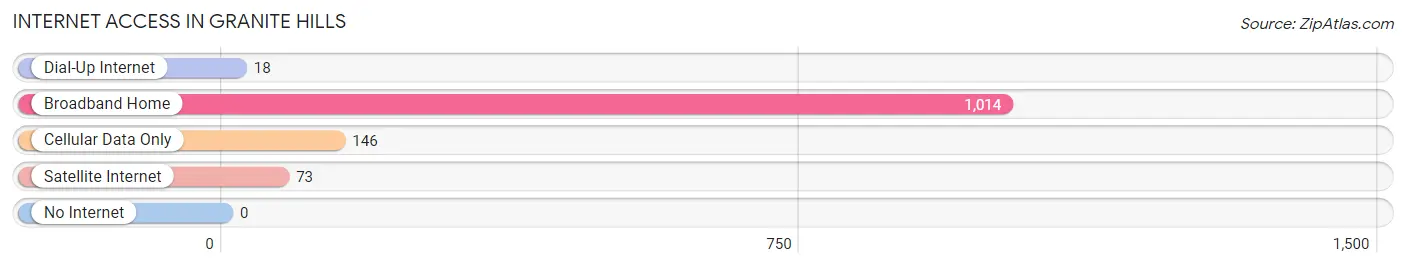
| Internet Type | # Households | % Households |
| Dial-Up Internet | 18 | 1.5% |
| Broadband Home | 1,014 | 85.1% |
| Cellular Data Only | 146 | 12.2% |
| Satellite Internet | 73 | 6.1% |
| No Internet | 0 | 0.0% |
| Total | 1,192 | 100.0% |
Granite Hills Summary
Granite Hills is a census-designated place located in San Diego County, California. It is located in the foothills of the Cuyamaca Mountains, approximately 25 miles east of downtown San Diego. The population was 8,485 at the 2010 census, up from 7,719 at the 2000 census.
History
Granite Hills was originally inhabited by the Kumeyaay people, who were the original inhabitants of the area. The first European settlers arrived in the area in the late 1800s, and the area was known as "Granite Hills" by the early 1900s. The area was primarily used for ranching and farming, and the first post office was established in the area in 1910.
In the 1950s, the area began to experience rapid growth as the city of San Diego expanded. The area was annexed by the city of El Cajon in the 1960s, and the population continued to grow. In the 1970s, the area was incorporated as the City of Granite Hills, and the population continued to grow.
Geography
Granite Hills is located at 32°49'25" North, 116°59'45" West (32.823861, -116.995890). It is situated in the foothills of the Cuyamaca Mountains, approximately 25 miles east of downtown San Diego. The area is characterized by rolling hills and valleys, with elevations ranging from 1,000 to 2,000 feet.
The climate in Granite Hills is semi-arid, with hot summers and mild winters. The average annual precipitation is approximately 12 inches.
Economy
Granite Hills is primarily a residential community, with most of the population employed in the service sector. The area is home to several small businesses, including restaurants, retail stores, and professional services.
The area is also home to several large employers, including the San Diego County Sheriff's Department, the San Diego County Fire Department, and the San Diego County Water Authority.
Demographics
As of the 2010 census, there were 8,485 people, 2,945 households, and 2,092 families residing in Granite Hills. The population density was 1,845.3 people per square mile (711.7/km2). The racial makeup of Granite Hills was 75.2% White, 8.2% African American, 0.7% Native American, 5.2% Asian, 0.2% Pacific Islander, 6.3% from other races, and 4.2% from two or more races. Hispanic or Latino of any race were 18.2% of the population.
The median income for a household in Granite Hills was $63,945, and the median income for a family was $71,945. The per capita income for the area was $27,945. About 5.2% of families and 7.2% of the population were below the poverty line, including 8.2% of those under age 18 and 5.2% of those age 65 or over.
Common Questions
What is Per Capita Income in Granite Hills?
Per Capita income in Granite Hills is $43,104.
What is the Median Family Income in Granite Hills?
Median Family Income in Granite Hills is $154,107.
What is the Median Household income in Granite Hills?
Median Household Income in Granite Hills is $141,774.
What is Income or Wage Gap in Granite Hills?
Income or Wage Gap in Granite Hills is 23.6%.
Women in Granite Hills earn 76.4 cents for every dollar earned by a man.
What is Inequality or Gini Index in Granite Hills?
Inequality or Gini Index in Granite Hills is 0.40.
What is the Total Population of Granite Hills?
Total Population of Granite Hills is 4,525.
What is the Total Male Population of Granite Hills?
Total Male Population of Granite Hills is 2,345.
What is the Total Female Population of Granite Hills?
Total Female Population of Granite Hills is 2,180.
What is the Ratio of Males per 100 Females in Granite Hills?
There are 107.57 Males per 100 Females in Granite Hills.
What is the Ratio of Females per 100 Males in Granite Hills?
There are 92.96 Females per 100 Males in Granite Hills.
What is the Median Population Age in Granite Hills?
Median Population Age in Granite Hills is 38.0 Years.
What is the Average Family Size in Granite Hills
Average Family Size in Granite Hills is 3.9 People.
What is the Average Household Size in Granite Hills
Average Household Size in Granite Hills is 3.8 People.
How Large is the Labor Force in Granite Hills?
There are 2,162 People in the Labor Forcein in Granite Hills.
What is the Percentage of People in the Labor Force in Granite Hills?
61.0% of People are in the Labor Force in Granite Hills.
What is the Unemployment Rate in Granite Hills?
Unemployment Rate in Granite Hills is 14.4%.