Broadway, VA Map & Demographics
Broadway Map
Broadway Overview
$34,388
PER CAPITA INCOME
$79,115
AVG FAMILY INCOME
$62,123
AVG HOUSEHOLD INCOME
20.6%
WAGE / INCOME GAP [ % ]
79.4¢/ $1
WAGE / INCOME GAP [ $ ]
0.44
INEQUALITY / GINI INDEX
4,169
TOTAL POPULATION
1,859
MALE POPULATION
2,310
FEMALE POPULATION
80.48
MALES / 100 FEMALES
124.26
FEMALES / 100 MALES
37.6
MEDIAN AGE
3.1
AVG FAMILY SIZE
2.5
AVG HOUSEHOLD SIZE
2,427
LABOR FORCE [ PEOPLE ]
74.3%
PERCENT IN LABOR FORCE
1.6%
UNEMPLOYMENT RATE
Broadway Zip Codes
Broadway Area Codes
Income in Broadway
Income Overview in Broadway
Per Capita Income in Broadway is $34,388, while median incomes of families and households are $79,115 and $62,123 respectively.
| Characteristic | Number | Measure |
| Per Capita Income | 4,169 | $34,388 |
| Median Family Income | 1,097 | $79,115 |
| Mean Family Income | 1,097 | $102,993 |
| Median Household Income | 1,637 | $62,123 |
| Mean Household Income | 1,637 | $84,717 |
| Income Deficit | 1,097 | $0 |
| Wage / Income Gap (%) | 4,169 | 20.55% |
| Wage / Income Gap ($) | 4,169 | 79.45¢ per $1 |
| Gini / Inequality Index | 4,169 | 0.44 |
Earnings by Sex in Broadway
Average Earnings in Broadway are $36,088, $41,727 for men and $33,152 for women, a difference of 20.5%.
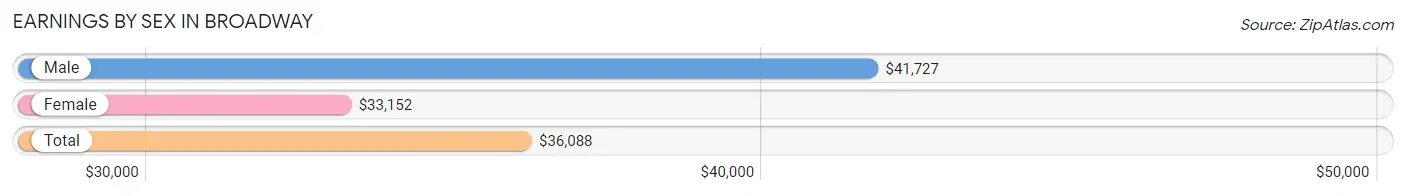
| Sex | Number | Average Earnings |
| Male | 1,132 (44.6%) | $41,727 |
| Female | 1,404 (55.4%) | $33,152 |
| Total | 2,536 (100.0%) | $36,088 |
Earnings by Sex by Income Bracket in Broadway
The most common earnings brackets in Broadway are $100,000+ for men (146 | 12.9%) and $40,000 to $44,999 for women (174 | 12.4%).
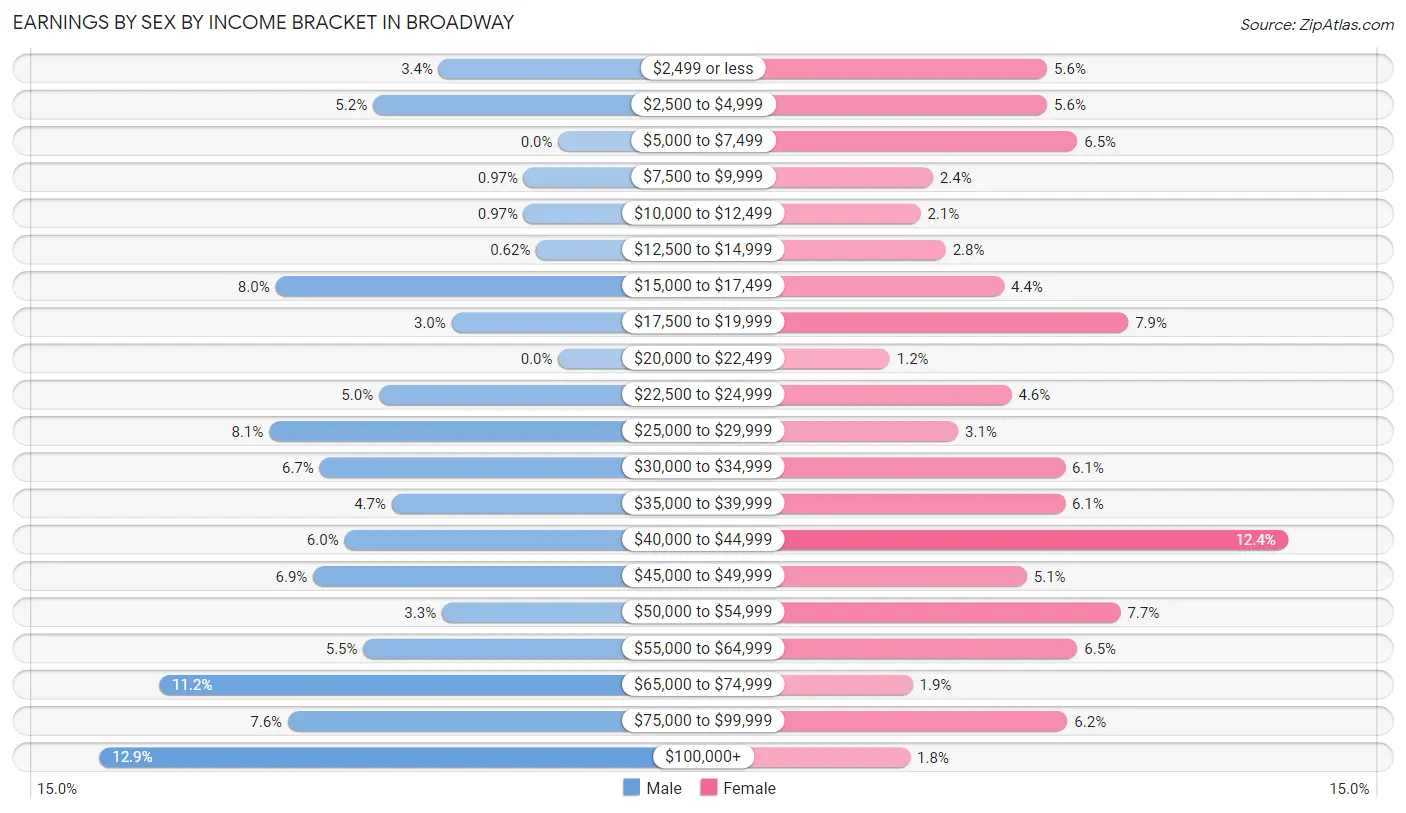
| Income | Male | Female |
| $2,499 or less | 38 (3.4%) | 79 (5.6%) |
| $2,500 to $4,999 | 59 (5.2%) | 79 (5.6%) |
| $5,000 to $7,499 | 0 (0.0%) | 91 (6.5%) |
| $7,500 to $9,999 | 11 (1.0%) | 34 (2.4%) |
| $10,000 to $12,499 | 11 (1.0%) | 29 (2.1%) |
| $12,500 to $14,999 | 7 (0.6%) | 39 (2.8%) |
| $15,000 to $17,499 | 90 (8.0%) | 62 (4.4%) |
| $17,500 to $19,999 | 34 (3.0%) | 111 (7.9%) |
| $20,000 to $22,499 | 0 (0.0%) | 17 (1.2%) |
| $22,500 to $24,999 | 57 (5.0%) | 65 (4.6%) |
| $25,000 to $29,999 | 92 (8.1%) | 44 (3.1%) |
| $30,000 to $34,999 | 76 (6.7%) | 86 (6.1%) |
| $35,000 to $39,999 | 53 (4.7%) | 86 (6.1%) |
| $40,000 to $44,999 | 68 (6.0%) | 174 (12.4%) |
| $45,000 to $49,999 | 78 (6.9%) | 71 (5.1%) |
| $50,000 to $54,999 | 37 (3.3%) | 108 (7.7%) |
| $55,000 to $64,999 | 62 (5.5%) | 91 (6.5%) |
| $65,000 to $74,999 | 127 (11.2%) | 26 (1.8%) |
| $75,000 to $99,999 | 86 (7.6%) | 87 (6.2%) |
| $100,000+ | 146 (12.9%) | 25 (1.8%) |
| Total | 1,132 (100.0%) | 1,404 (100.0%) |
Earnings by Sex by Educational Attainment in Broadway
Average earnings in Broadway are $54,479 for men and $42,143 for women, a difference of 22.6%. Men with an educational attainment of graduate degree enjoy the highest average annual earnings of $83,281, while those with bachelor's degree education earn the least with $40,139. Women with an educational attainment of graduate degree earn the most with the average annual earnings of $52,262, while those with high school diploma education have the smallest earnings of $36,683.
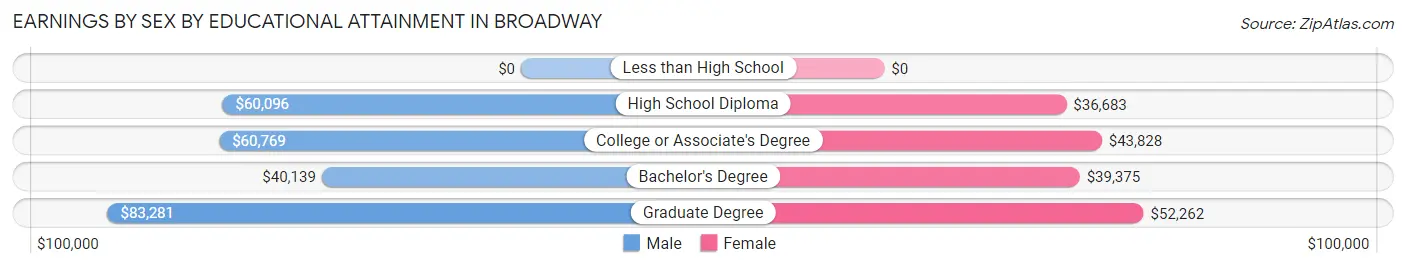
| Educational Attainment | Male Income | Female Income |
| Less than High School | - | - |
| High School Diploma | $60,096 | $36,683 |
| College or Associate's Degree | $60,769 | $43,828 |
| Bachelor's Degree | $40,139 | $39,375 |
| Graduate Degree | $83,281 | $52,262 |
| Total | $54,479 | $42,143 |
Family Income in Broadway
Family Income Brackets in Broadway
According to the Broadway family income data, there are 268 families falling into the $100,000 to $149,999 income range, which is the most common income bracket and makes up 24.4% of all families. Conversely, the $25,000 to $34,999 income bracket is the least frequent group with only 9 families (0.8%) belonging to this category.
| Income Bracket | # Families | % Families |
| Less than $10,000 | 23 | 2.1% |
| $10,000 to $14,999 | 16 | 1.5% |
| $15,000 to $24,999 | 86 | 7.8% |
| $25,000 to $34,999 | 9 | 0.8% |
| $35,000 to $49,999 | 128 | 11.7% |
| $50,000 to $74,999 | 224 | 20.4% |
| $75,000 to $99,999 | 176 | 16.0% |
| $100,000 to $149,999 | 268 | 24.4% |
| $150,000 to $199,999 | 81 | 7.4% |
| $200,000+ | 84 | 7.7% |
Family Income by Famaliy Size in Broadway
5-person families (28 | 2.5%) account for the highest median family income in Broadway with $118,636 per family, while 3-person families (258 | 23.5%) have the highest median income of $37,560 per family member.
| Income Bracket | # Families | Median Income |
| 2-Person Families | 533 (48.6%) | $67,580 |
| 3-Person Families | 258 (23.5%) | $112,679 |
| 4-Person Families | 207 (18.9%) | $64,088 |
| 5-Person Families | 28 (2.5%) | $118,636 |
| 6-Person Families | 49 (4.5%) | $0 |
| 7+ Person Families | 22 (2.0%) | $0 |
| Total | 1,097 (100.0%) | $79,115 |
Family Income by Number of Earners in Broadway
The median family income in Broadway is $79,115, with families comprising 3+ earners (213) having the highest median family income of $172,031, while families with 1 earner (349) have the lowest median family income of $48,972, accounting for 19.4% and 31.8% of families, respectively.
| Number of Earners | # Families | Median Income |
| No Earners | 44 (4.0%) | $86,250 |
| 1 Earner | 349 (31.8%) | $48,972 |
| 2 Earners | 491 (44.8%) | $90,027 |
| 3+ Earners | 213 (19.4%) | $172,031 |
| Total | 1,097 (100.0%) | $79,115 |
Household Income in Broadway
Household Income Brackets in Broadway
With 295 households falling in the category, the $35,000 to $49,999 income range is the most frequent in Broadway, accounting for 18.0% of all households. In contrast, only 44 households (2.7%) fall into the less than $10,000 income bracket, making it the least populous group.
| Income Bracket | # Households | % Households |
| Less than $10,000 | 44 | 2.7% |
| $10,000 to $14,999 | 47 | 2.9% |
| $15,000 to $24,999 | 123 | 7.5% |
| $25,000 to $34,999 | 185 | 11.3% |
| $35,000 to $49,999 | 295 | 18.0% |
| $50,000 to $74,999 | 255 | 15.6% |
| $75,000 to $99,999 | 228 | 13.9% |
| $100,000 to $149,999 | 226 | 13.8% |
| $150,000 to $199,999 | 147 | 9.0% |
| $200,000+ | 85 | 5.2% |
Household Income by Householder Age in Broadway
The median household income in Broadway is $62,123, with the highest median household income of $79,276 found in the 25 to 44 years age bracket for the primary householder. A total of 569 households (34.8%) fall into this category. Meanwhile, the 15 to 24 years age bracket for the primary householder has the lowest median household income of $32,000, with 112 households (6.8%) in this group.
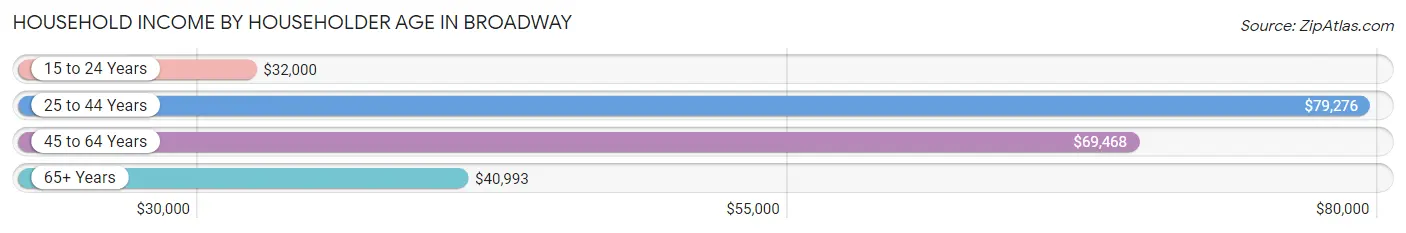
| Income Bracket | # Households | Median Income |
| 15 to 24 Years | 112 (6.8%) | $32,000 |
| 25 to 44 Years | 569 (34.8%) | $79,276 |
| 45 to 64 Years | 502 (30.7%) | $69,468 |
| 65+ Years | 454 (27.7%) | $40,993 |
| Total | 1,637 (100.0%) | $62,123 |
Poverty in Broadway
Income Below Poverty by Sex and Age in Broadway
With 9.1% poverty level for males and 9.1% for females among the residents of Broadway, 18 to 24 year old males and 18 to 24 year old females are the most vulnerable to poverty, with 70 males (29.0%) and 73 females (27.6%) in their respective age groups living below the poverty level.
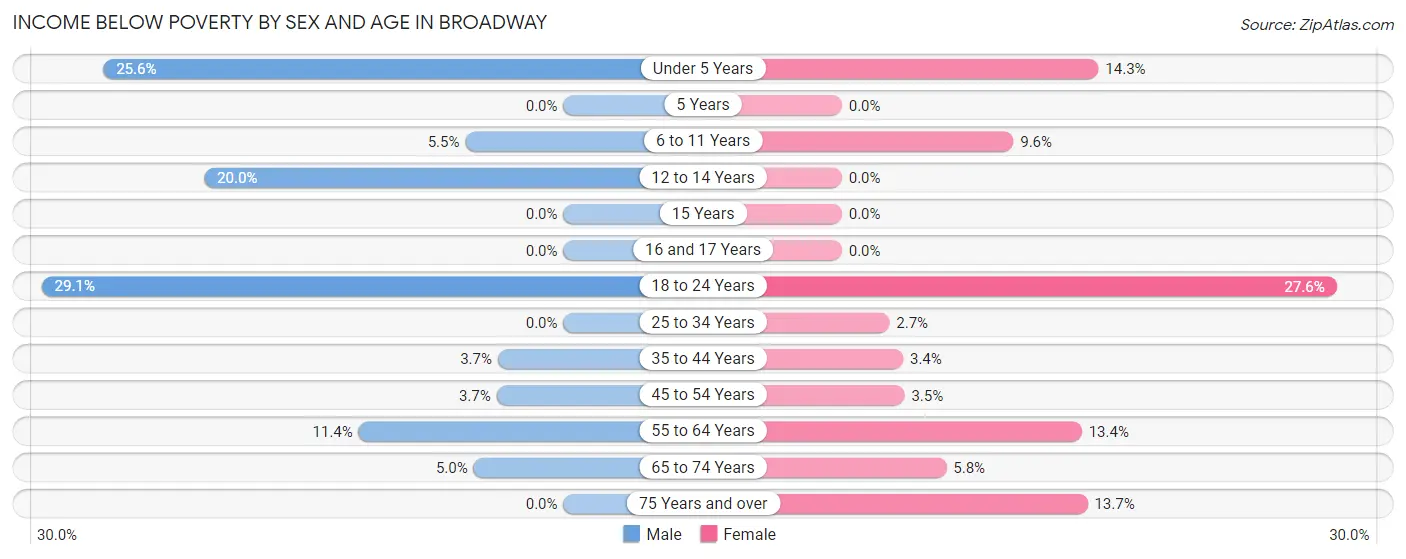
| Age Bracket | Male | Female |
| Under 5 Years | 31 (25.6%) | 21 (14.3%) |
| 5 Years | 0 (0.0%) | 0 (0.0%) |
| 6 to 11 Years | 10 (5.5%) | 19 (9.6%) |
| 12 to 14 Years | 5 (20.0%) | 0 (0.0%) |
| 15 Years | 0 (0.0%) | 0 (0.0%) |
| 16 and 17 Years | 0 (0.0%) | 0 (0.0%) |
| 18 to 24 Years | 70 (29.0%) | 73 (27.6%) |
| 25 to 34 Years | 0 (0.0%) | 9 (2.6%) |
| 35 to 44 Years | 12 (3.6%) | 11 (3.4%) |
| 45 to 54 Years | 7 (3.7%) | 8 (3.5%) |
| 55 to 64 Years | 22 (11.4%) | 33 (13.4%) |
| 65 to 74 Years | 12 (5.0%) | 11 (5.8%) |
| 75 Years and over | 0 (0.0%) | 26 (13.7%) |
| Total | 169 (9.1%) | 211 (9.1%) |
Income Above Poverty by Sex and Age in Broadway
According to the poverty statistics in Broadway, males aged 5 years and females aged 5 years are the age groups that are most secure financially, with 100.0% of males and 100.0% of females in these age groups living above the poverty line.
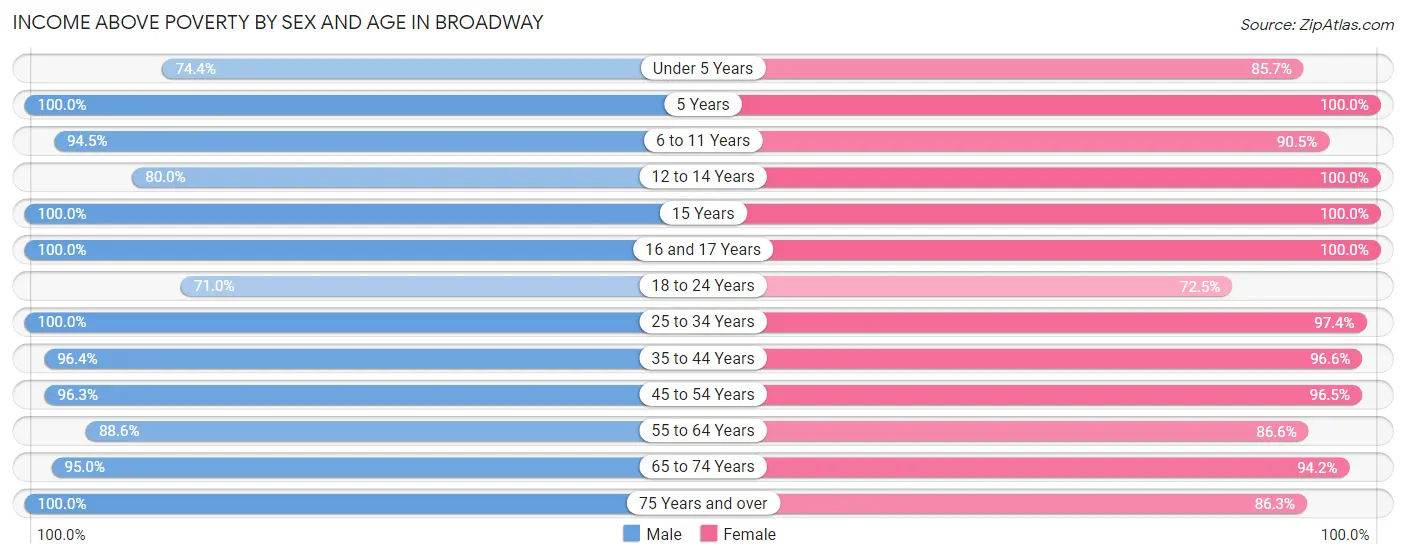
| Age Bracket | Male | Female |
| Under 5 Years | 90 (74.4%) | 126 (85.7%) |
| 5 Years | 78 (100.0%) | 15 (100.0%) |
| 6 to 11 Years | 173 (94.5%) | 180 (90.4%) |
| 12 to 14 Years | 20 (80.0%) | 71 (100.0%) |
| 15 Years | 20 (100.0%) | 43 (100.0%) |
| 16 and 17 Years | 64 (100.0%) | 53 (100.0%) |
| 18 to 24 Years | 171 (71.0%) | 192 (72.5%) |
| 25 to 34 Years | 130 (100.0%) | 330 (97.4%) |
| 35 to 44 Years | 317 (96.4%) | 312 (96.6%) |
| 45 to 54 Years | 181 (96.3%) | 221 (96.5%) |
| 55 to 64 Years | 171 (88.6%) | 214 (86.6%) |
| 65 to 74 Years | 228 (95.0%) | 178 (94.2%) |
| 75 Years and over | 47 (100.0%) | 164 (86.3%) |
| Total | 1,690 (90.9%) | 2,099 (90.9%) |
Income Below Poverty Among Married-Couple Families in Broadway
The poverty statistics for married-couple families in Broadway show that 1.6% or 12 of the total 763 families live below the poverty line. Families with no children have the highest poverty rate of 3.2%, comprising of 12 families. On the other hand, families with 1 or 2 children have the lowest poverty rate of 0.0%, which includes 0 families.
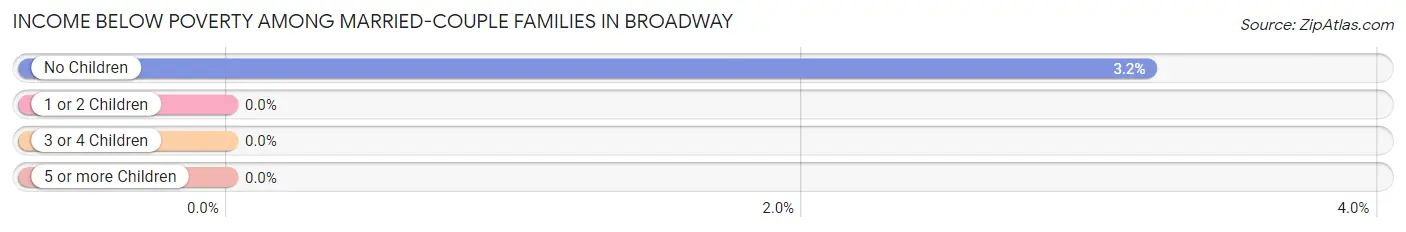
| Children | Above Poverty | Below Poverty |
| No Children | 363 (96.8%) | 12 (3.2%) |
| 1 or 2 Children | 354 (100.0%) | 0 (0.0%) |
| 3 or 4 Children | 28 (100.0%) | 0 (0.0%) |
| 5 or more Children | 6 (100.0%) | 0 (0.0%) |
| Total | 751 (98.4%) | 12 (1.6%) |
Income Below Poverty Among Single-Parent Households in Broadway
According to the poverty data in Broadway, 48.6% or 70 single-father households and 14.7% or 28 single-mother households are living below the poverty line. Among single-father households, those with 1 or 2 children have the highest poverty rate, with 70 households (50.7%) experiencing poverty. Likewise, among single-mother households, those with 3 or 4 children have the highest poverty rate, with 9 households (100.0%) falling below the poverty line.
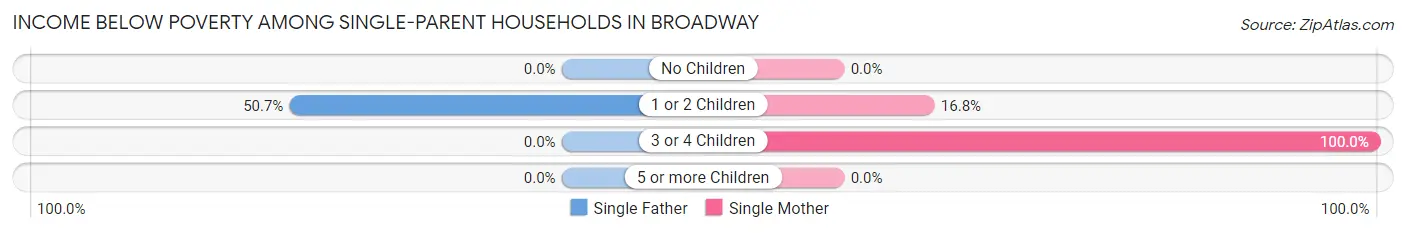
| Children | Single Father | Single Mother |
| No Children | 0 (0.0%) | 0 (0.0%) |
| 1 or 2 Children | 70 (50.7%) | 19 (16.8%) |
| 3 or 4 Children | 0 (0.0%) | 9 (100.0%) |
| 5 or more Children | 0 (0.0%) | 0 (0.0%) |
| Total | 70 (48.6%) | 28 (14.7%) |
Income Below Poverty Among Married-Couple vs Single-Parent Households in Broadway
The poverty data for Broadway shows that 12 of the married-couple family households (1.6%) and 98 of the single-parent households (29.3%) are living below the poverty level. Within the married-couple family households, those with no children have the highest poverty rate, with 12 households (3.2%) falling below the poverty line. Among the single-parent households, those with 3 or 4 children have the highest poverty rate, with 9 household (60.0%) living below poverty.
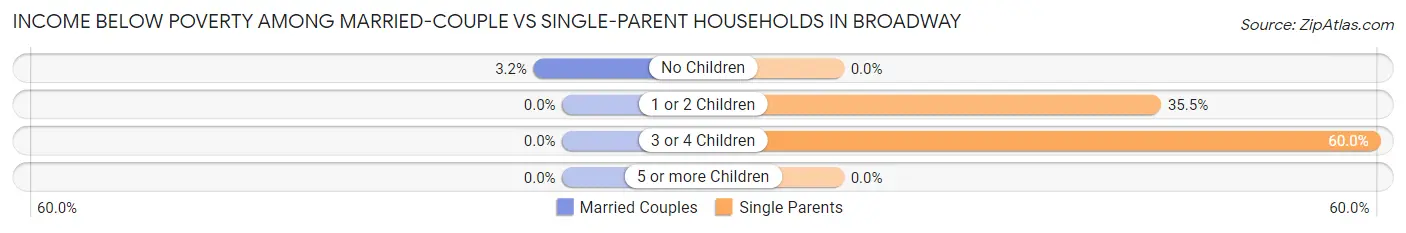
| Children | Married-Couple Families | Single-Parent Households |
| No Children | 12 (3.2%) | 0 (0.0%) |
| 1 or 2 Children | 0 (0.0%) | 89 (35.5%) |
| 3 or 4 Children | 0 (0.0%) | 9 (60.0%) |
| 5 or more Children | 0 (0.0%) | 0 (0.0%) |
| Total | 12 (1.6%) | 98 (29.3%) |
Race in Broadway
The most populous races in Broadway are White / Caucasian (3,795 | 91.0%), Hispanic or Latino (368 | 8.8%), and Some other Race (197 | 4.7%).
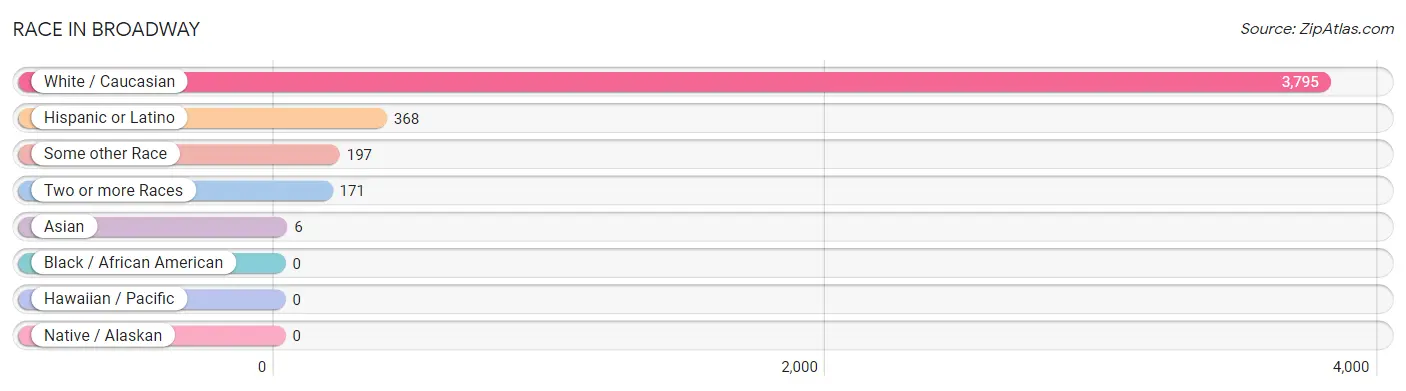
| Race | # Population | % Population |
| Asian | 6 | 0.1% |
| Black / African American | 0 | 0.0% |
| Hawaiian / Pacific | 0 | 0.0% |
| Hispanic or Latino | 368 | 8.8% |
| Native / Alaskan | 0 | 0.0% |
| White / Caucasian | 3,795 | 91.0% |
| Two or more Races | 171 | 4.1% |
| Some other Race | 197 | 4.7% |
| Total | 4,169 | 100.0% |
Ancestry in Broadway
The most populous ancestries reported in Broadway are German (836 | 20.1%), American (520 | 12.5%), English (405 | 9.7%), Mexican (217 | 5.2%), and Irish (161 | 3.9%), together accounting for 51.3% of all Broadway residents.
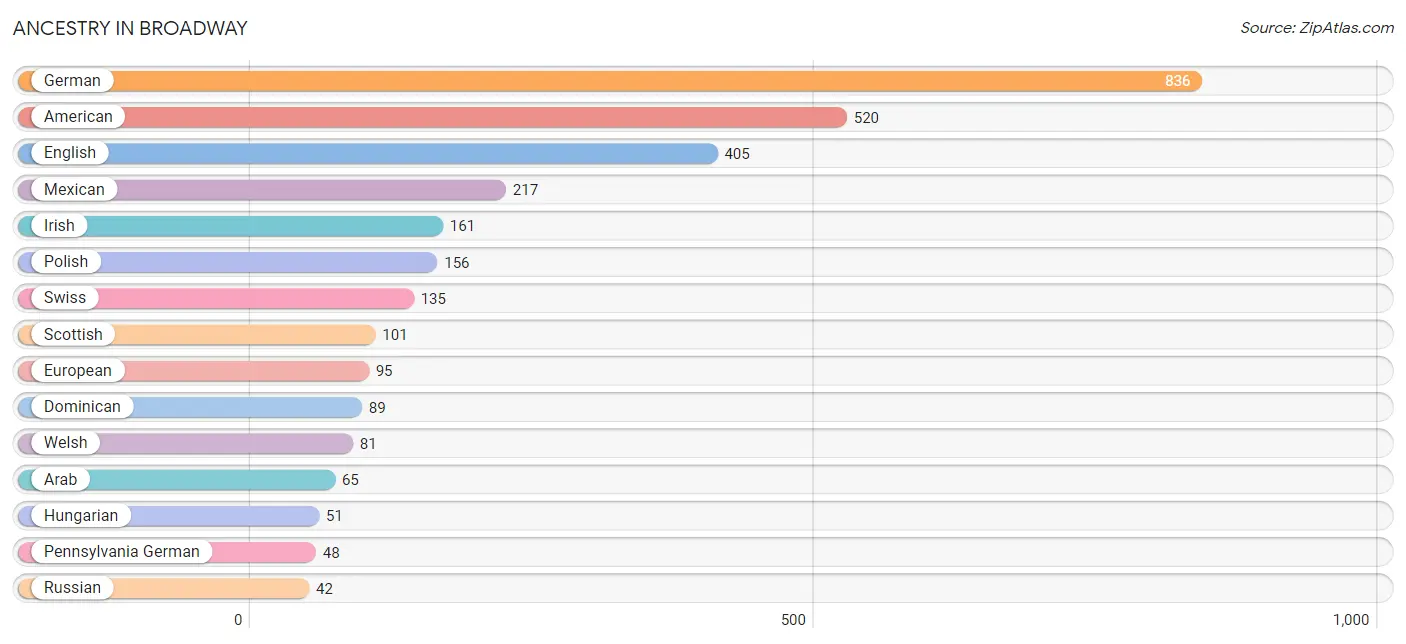
| Ancestry | # Population | % Population |
| American | 520 | 12.5% |
| Arab | 65 | 1.6% |
| Austrian | 13 | 0.3% |
| Bolivian | 6 | 0.1% |
| British | 23 | 0.5% |
| Central American | 9 | 0.2% |
| Colombian | 15 | 0.4% |
| Crow | 8 | 0.2% |
| Dominican | 89 | 2.1% |
| Dutch | 22 | 0.5% |
| English | 405 | 9.7% |
| European | 95 | 2.3% |
| French | 19 | 0.5% |
| German | 836 | 20.1% |
| Greek | 33 | 0.8% |
| Honduran | 9 | 0.2% |
| Hungarian | 51 | 1.2% |
| Irish | 161 | 3.9% |
| Italian | 26 | 0.6% |
| Lithuanian | 23 | 0.5% |
| Malaysian | 35 | 0.8% |
| Mexican | 217 | 5.2% |
| Northern European | 6 | 0.1% |
| Norwegian | 7 | 0.2% |
| Pennsylvania German | 48 | 1.1% |
| Polish | 156 | 3.7% |
| Puerto Rican | 32 | 0.8% |
| Russian | 42 | 1.0% |
| Scandinavian | 17 | 0.4% |
| Scotch-Irish | 21 | 0.5% |
| Scottish | 101 | 2.4% |
| South American | 21 | 0.5% |
| Sri Lankan | 35 | 0.8% |
| Swedish | 30 | 0.7% |
| Swiss | 135 | 3.2% |
| Welsh | 81 | 1.9% | View All 36 Rows |
Immigrants in Broadway
The most numerous immigrant groups reported in Broadway came from Latin America (133 | 3.2%), Europe (95 | 2.3%), Central America (91 | 2.2%), Mexico (91 | 2.2%), and Asia (65 | 1.6%), together accounting for 11.4% of all Broadway residents.
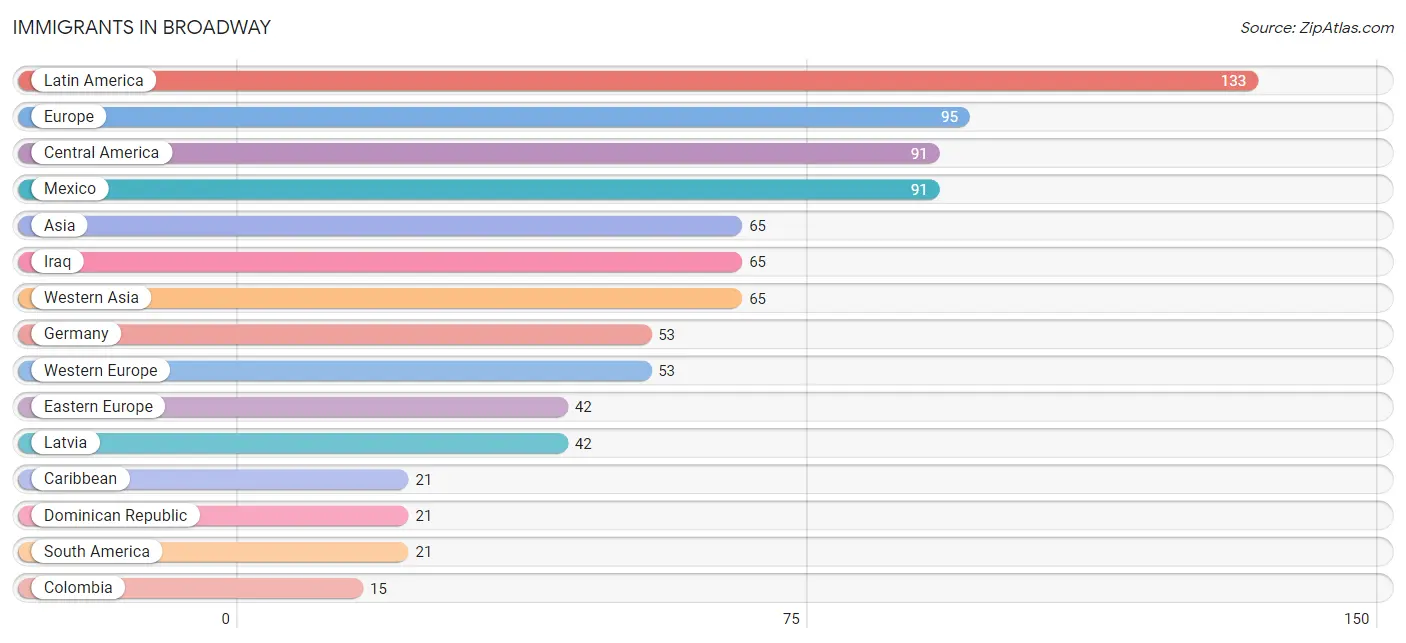
| Immigration Origin | # Population | % Population |
| Asia | 65 | 1.6% |
| Bolivia | 6 | 0.1% |
| Canada | 5 | 0.1% |
| Caribbean | 21 | 0.5% |
| Central America | 91 | 2.2% |
| Colombia | 15 | 0.4% |
| Dominican Republic | 21 | 0.5% |
| Eastern Europe | 42 | 1.0% |
| Europe | 95 | 2.3% |
| Germany | 53 | 1.3% |
| Iraq | 65 | 1.6% |
| Latin America | 133 | 3.2% |
| Latvia | 42 | 1.0% |
| Mexico | 91 | 2.2% |
| South America | 21 | 0.5% |
| Western Asia | 65 | 1.6% |
| Western Europe | 53 | 1.3% | View All 17 Rows |
Sex and Age in Broadway
Sex and Age in Broadway
The most populous age groups in Broadway are 20 to 24 Years (200 | 10.8%) for men and 15 to 19 Years (215 | 9.3%) for women.
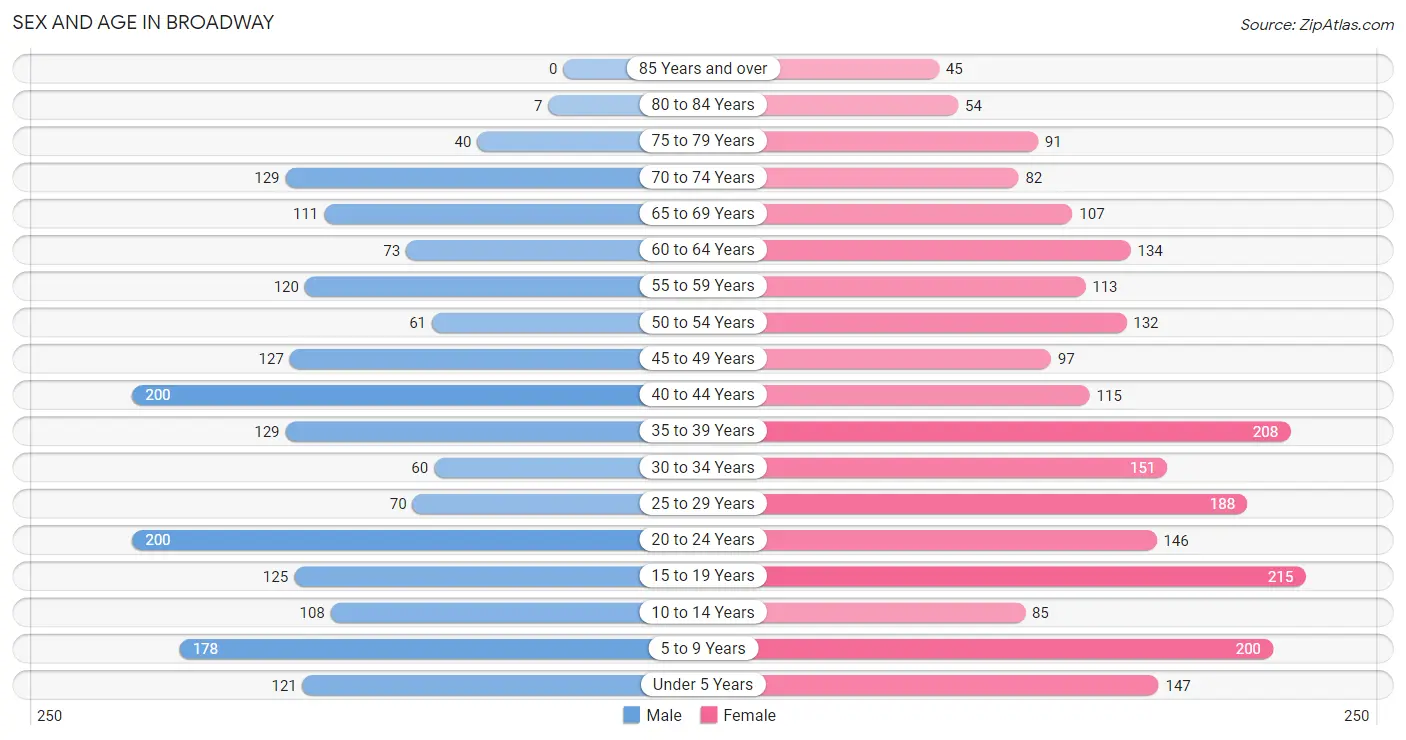
| Age Bracket | Male | Female |
| Under 5 Years | 121 (6.5%) | 147 (6.4%) |
| 5 to 9 Years | 178 (9.6%) | 200 (8.7%) |
| 10 to 14 Years | 108 (5.8%) | 85 (3.7%) |
| 15 to 19 Years | 125 (6.7%) | 215 (9.3%) |
| 20 to 24 Years | 200 (10.8%) | 146 (6.3%) |
| 25 to 29 Years | 70 (3.8%) | 188 (8.1%) |
| 30 to 34 Years | 60 (3.2%) | 151 (6.5%) |
| 35 to 39 Years | 129 (6.9%) | 208 (9.0%) |
| 40 to 44 Years | 200 (10.8%) | 115 (5.0%) |
| 45 to 49 Years | 127 (6.8%) | 97 (4.2%) |
| 50 to 54 Years | 61 (3.3%) | 132 (5.7%) |
| 55 to 59 Years | 120 (6.5%) | 113 (4.9%) |
| 60 to 64 Years | 73 (3.9%) | 134 (5.8%) |
| 65 to 69 Years | 111 (6.0%) | 107 (4.6%) |
| 70 to 74 Years | 129 (6.9%) | 82 (3.5%) |
| 75 to 79 Years | 40 (2.1%) | 91 (3.9%) |
| 80 to 84 Years | 7 (0.4%) | 54 (2.3%) |
| 85 Years and over | 0 (0.0%) | 45 (1.9%) |
| Total | 1,859 (100.0%) | 2,310 (100.0%) |
Families and Households in Broadway
Median Family Size in Broadway
The median family size in Broadway is 3.10 persons per family, with married-couple families (763 | 69.6%) accounting for the largest median family size of 3.39 persons per family. On the other hand, single male/father families (144 | 13.1%) represent the smallest median family size with 2.03 persons per family.
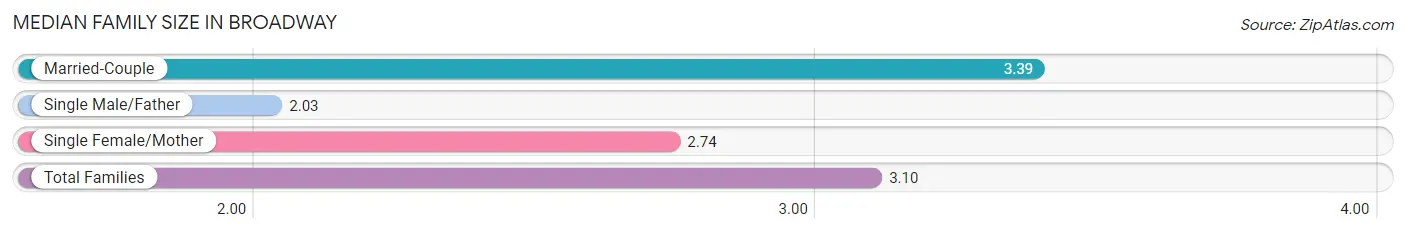
| Family Type | # Families | Family Size |
| Married-Couple | 763 (69.6%) | 3.39 |
| Single Male/Father | 144 (13.1%) | 2.03 |
| Single Female/Mother | 190 (17.3%) | 2.74 |
| Total Families | 1,097 (100.0%) | 3.10 |
Median Household Size in Broadway
The median household size in Broadway is 2.54 persons per household, with married-couple households (763 | 46.6%) accounting for the largest median household size of 3.42 persons per household. non-family households (540 | 33.0%) represent the smallest median household size with 1.18 persons per household.
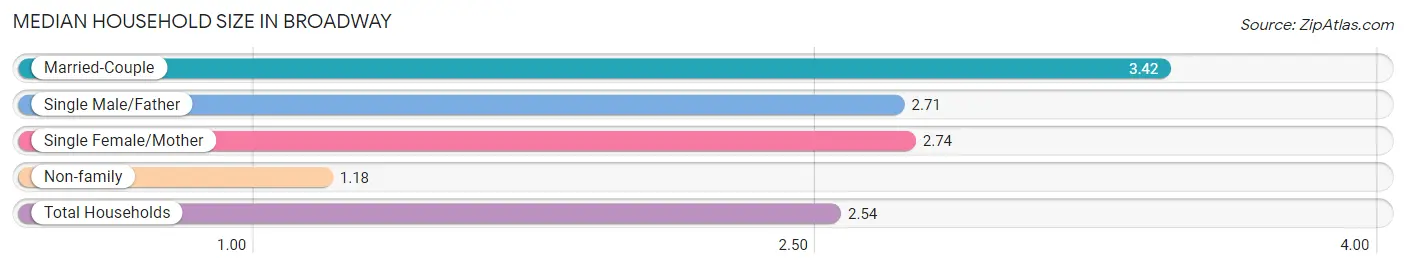
| Household Type | # Households | Household Size |
| Married-Couple | 763 (46.6%) | 3.42 |
| Single Male/Father | 144 (8.8%) | 2.71 |
| Single Female/Mother | 190 (11.6%) | 2.74 |
| Non-family | 540 (33.0%) | 1.18 |
| Total Households | 1,637 (100.0%) | 2.54 |
Household Size by Marriage Status in Broadway
Out of a total of 1,637 households in Broadway, 1,097 (67.0%) are family households, while 540 (33.0%) are nonfamily households. The most numerous type of family households are 2-person households, comprising 405, and the most common type of nonfamily households are 1-person households, comprising 475.
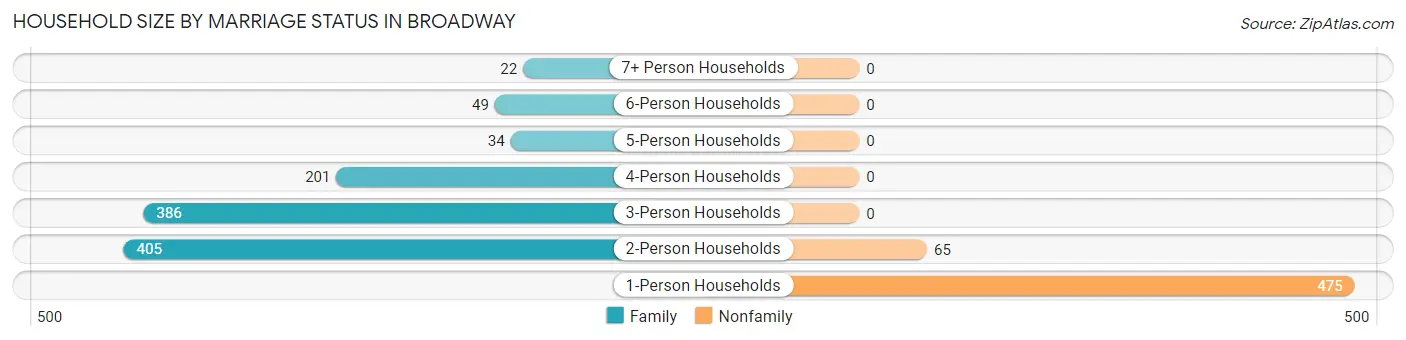
| Household Size | Family Households | Nonfamily Households |
| 1-Person Households | - | 475 (29.0%) |
| 2-Person Households | 405 (24.7%) | 65 (4.0%) |
| 3-Person Households | 386 (23.6%) | 0 (0.0%) |
| 4-Person Households | 201 (12.3%) | 0 (0.0%) |
| 5-Person Households | 34 (2.1%) | 0 (0.0%) |
| 6-Person Households | 49 (3.0%) | 0 (0.0%) |
| 7+ Person Households | 22 (1.3%) | 0 (0.0%) |
| Total | 1,097 (67.0%) | 540 (33.0%) |
Female Fertility in Broadway
Fertility by Age in Broadway
Average fertility rate in Broadway is 55.0 births per 1,000 women. Women in the age bracket of 15 to 19 years have the highest fertility rate with 181.0 births per 1,000 women. Women in the age bracket of 15 to 19 years acount for 60.0% of all women with births.
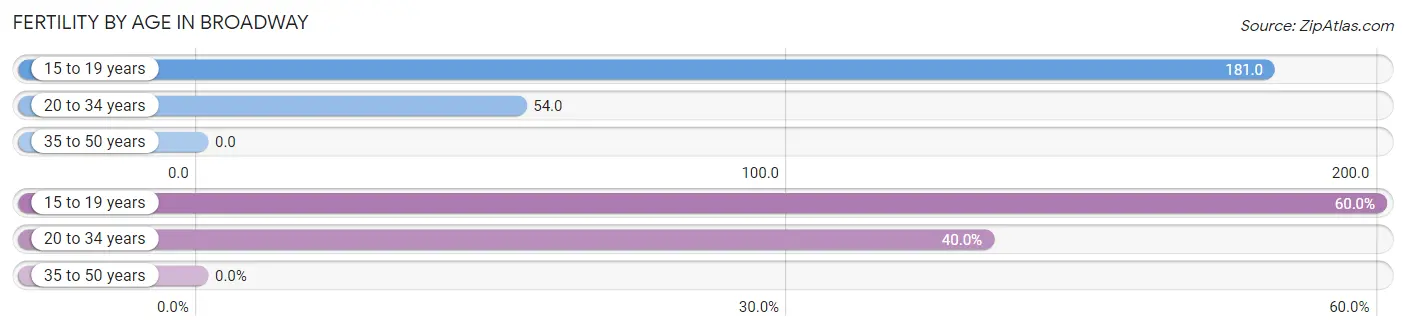
| Age Bracket | Women with Births | Births / 1,000 Women |
| 15 to 19 years | 39 (60.0%) | 181.0 |
| 20 to 34 years | 26 (40.0%) | 54.0 |
| 35 to 50 years | 0 (0.0%) | 0.0 |
| Total | 65 (100.0%) | 55.0 |
Fertility by Age by Marriage Status in Broadway
13.8% of women with births (65) in Broadway are married. The highest percentage of unmarried women with births falls into 15 to 19 years age bracket with 100.0% of them unmarried at the time of birth, while the lowest percentage of unmarried women with births belong to 20 to 34 years age bracket with 65.4% of them unmarried.
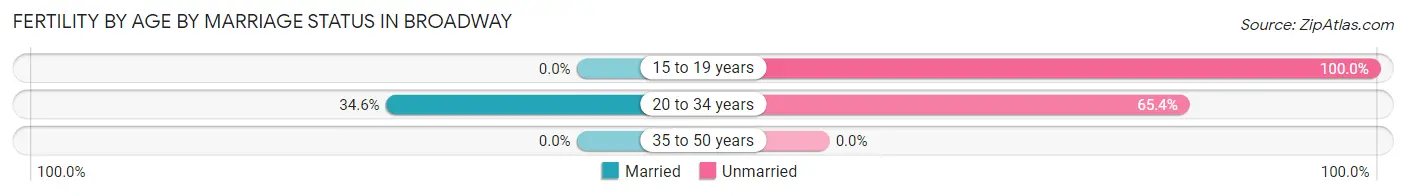
| Age Bracket | Married | Unmarried |
| 15 to 19 years | 0 (0.0%) | 39 (100.0%) |
| 20 to 34 years | 9 (34.6%) | 17 (65.4%) |
| 35 to 50 years | 0 (0.0%) | 0 (0.0%) |
| Total | 9 (13.9%) | 56 (86.2%) |
Fertility by Education in Broadway
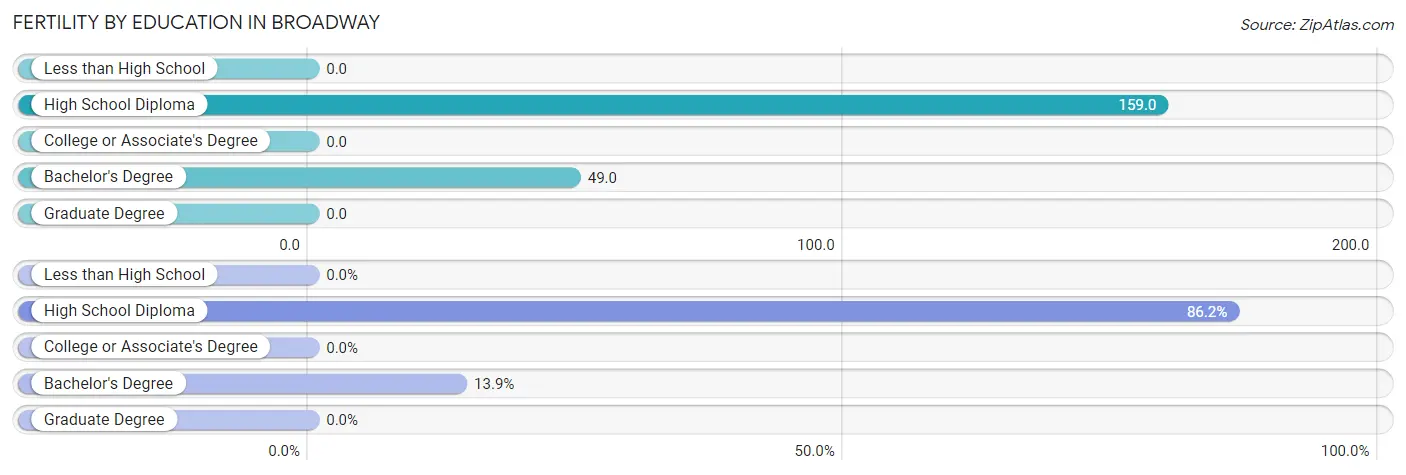
| Educational Attainment | Women with Births | Births / 1,000 Women |
| Less than High School | 0 (0.0%) | 0.0 |
| High School Diploma | 56 (86.2%) | 159.0 |
| College or Associate's Degree | 0 (0.0%) | 0.0 |
| Bachelor's Degree | 9 (13.9%) | 49.0 |
| Graduate Degree | 0 (0.0%) | 0.0 |
| Total | 65 (100.0%) | 55.0 |
Fertility by Education by Marriage Status in Broadway
86.2% of women with births in Broadway are unmarried. Women with the educational attainment of bachelor's degree are most likely to be married with 100.0% of them married at childbirth, while women with the educational attainment of high school diploma are least likely to be married with 100.0% of them unmarried at childbirth.
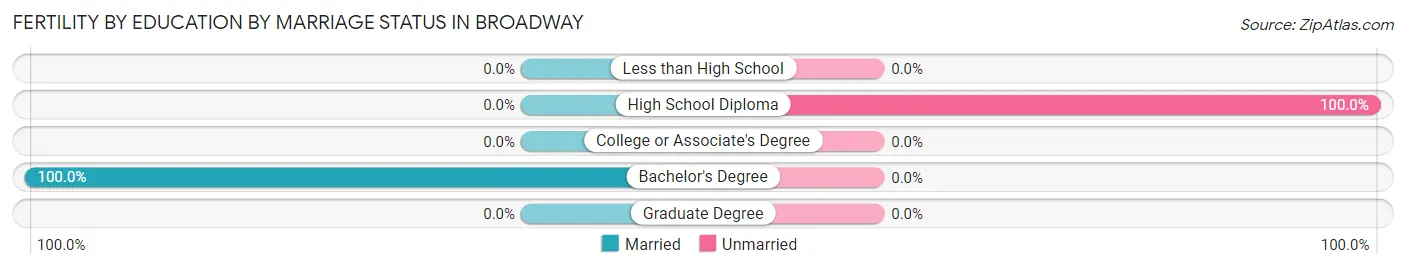
| Educational Attainment | Married | Unmarried |
| Less than High School | 0 (0.0%) | 0 (0.0%) |
| High School Diploma | 0 (0.0%) | 56 (100.0%) |
| College or Associate's Degree | 0 (0.0%) | 0 (0.0%) |
| Bachelor's Degree | 9 (100.0%) | 0 (0.0%) |
| Graduate Degree | 0 (0.0%) | 0 (0.0%) |
| Total | 9 (13.9%) | 56 (86.2%) |
Employment Characteristics in Broadway
Employment by Class of Employer in Broadway
Among the 2,380 employed individuals in Broadway, private company employees (1,623 | 68.2%), local government employees (379 | 15.9%), and not-for-profit organizations (214 | 9.0%) make up the most common classes of employment.
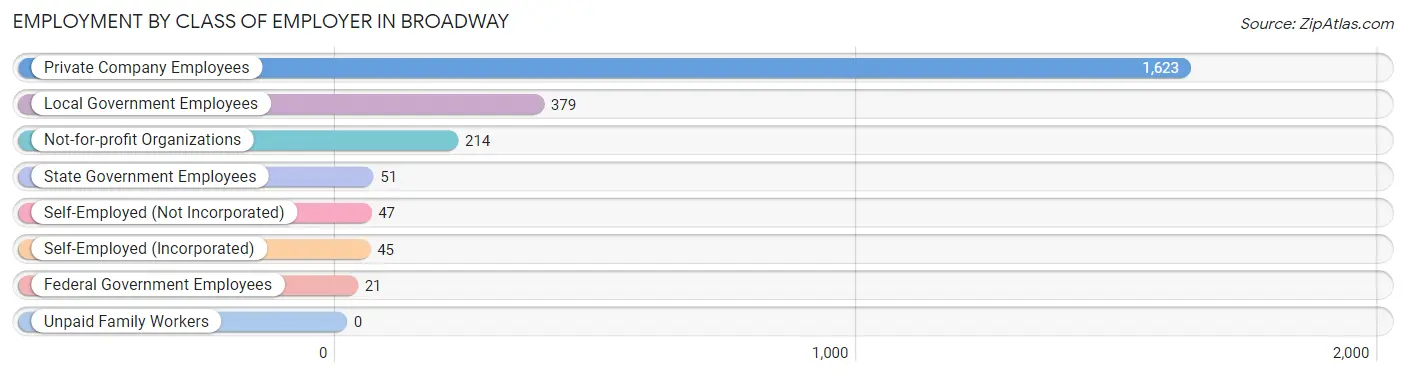
| Employer Class | # Employees | % Employees |
| Private Company Employees | 1,623 | 68.2% |
| Self-Employed (Incorporated) | 45 | 1.9% |
| Self-Employed (Not Incorporated) | 47 | 2.0% |
| Not-for-profit Organizations | 214 | 9.0% |
| Local Government Employees | 379 | 15.9% |
| State Government Employees | 51 | 2.1% |
| Federal Government Employees | 21 | 0.9% |
| Unpaid Family Workers | 0 | 0.0% |
| Total | 2,380 | 100.0% |
Employment Status by Age in Broadway
According to the labor force statistics for Broadway, out of the total population over 16 years of age (3,267), 74.3% or 2,427 individuals are in the labor force, with 1.6% or 39 of them unemployed. The age group with the highest labor force participation rate is 35 to 44 years, with 100.0% or 652 individuals in the labor force. Within the labor force, the 60 to 64 years age range has the highest percentage of unemployed individuals, with 12.2% or 14 of them being unemployed.
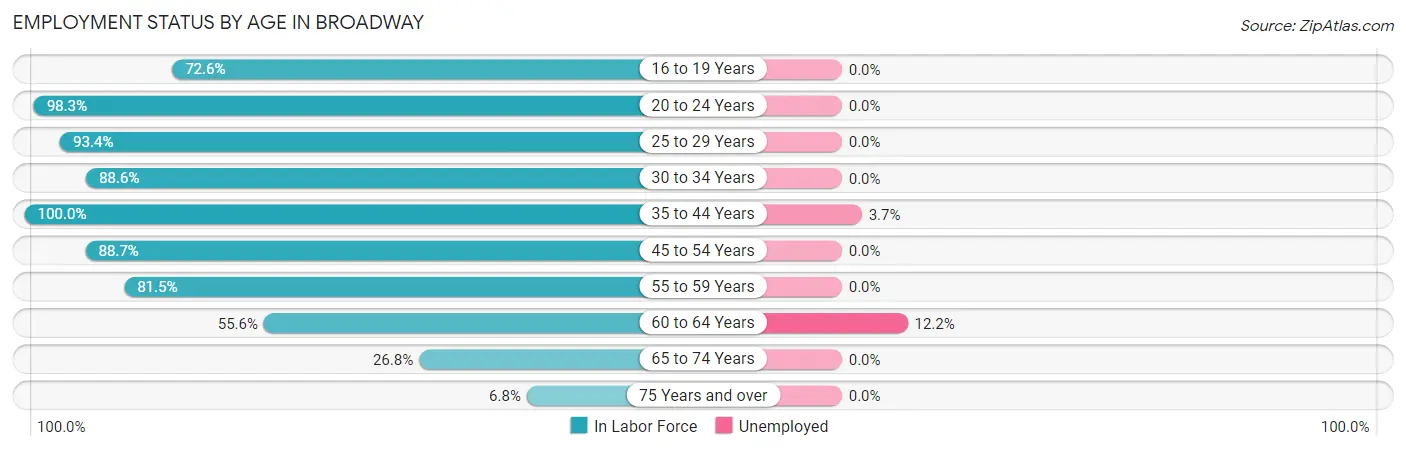
| Age Bracket | In Labor Force | Unemployed |
| 16 to 19 Years | 201 (72.6%) | 0 (0.0%) |
| 20 to 24 Years | 340 (98.3%) | 0 (0.0%) |
| 25 to 29 Years | 241 (93.4%) | 0 (0.0%) |
| 30 to 34 Years | 187 (88.6%) | 0 (0.0%) |
| 35 to 44 Years | 652 (100.0%) | 24 (3.7%) |
| 45 to 54 Years | 370 (88.7%) | 0 (0.0%) |
| 55 to 59 Years | 190 (81.5%) | 0 (0.0%) |
| 60 to 64 Years | 115 (55.6%) | 14 (12.2%) |
| 65 to 74 Years | 115 (26.8%) | 0 (0.0%) |
| 75 Years and over | 16 (6.8%) | 0 (0.0%) |
| Total | 2,427 (74.3%) | 39 (1.6%) |
Employment Status by Educational Attainment in Broadway
According to labor force statistics for Broadway, 88.7% of individuals (1,754) out of the total population between 25 and 64 years of age (1,978) are in the labor force, with 2.2% or 39 of them being unemployed. The group with the highest labor force participation rate are those with the educational attainment of high school diploma, with 90.7% or 725 individuals in the labor force. Within the labor force, individuals with bachelor's degree or higher education have the highest percentage of unemployment, with 3.8% or 14 of them being unemployed.
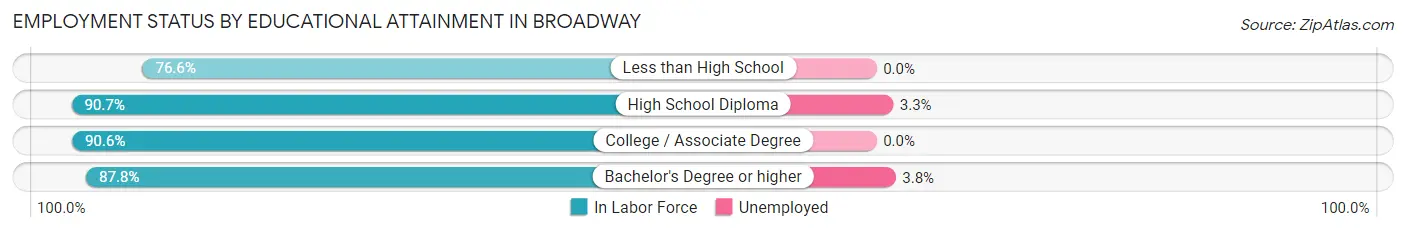
| Educational Attainment | In Labor Force | Unemployed |
| Less than High School | 144 (76.6%) | 0 (0.0%) |
| High School Diploma | 725 (90.7%) | 26 (3.3%) |
| College / Associate Degree | 520 (90.6%) | 0 (0.0%) |
| Bachelor's Degree or higher | 366 (87.8%) | 16 (3.8%) |
| Total | 1,754 (88.7%) | 44 (2.2%) |
Employment Occupations by Sex in Broadway
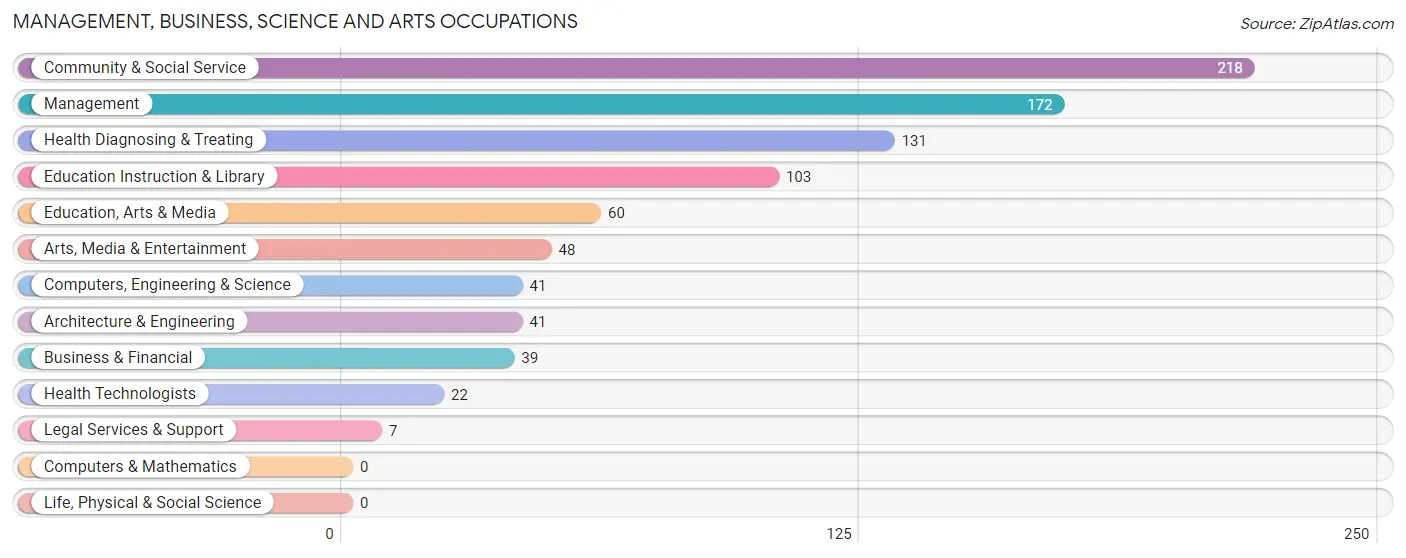
Management, Business, Science and Arts Occupations
The most common Management, Business, Science and Arts occupations in Broadway are Community & Social Service (218 | 9.1%), Management (172 | 7.2%), Health Diagnosing & Treating (131 | 5.5%), Education Instruction & Library (103 | 4.3%), and Education, Arts & Media (60 | 2.5%).
Management, Business, Science and Arts Occupations by Sex
Within the Management, Business, Science and Arts occupations in Broadway, the most male-oriented occupations are Legal Services & Support (100.0%), Business & Financial (56.4%), and Computers, Engineering & Science (39.0%), while the most female-oriented occupations are Education, Arts & Media (100.0%), Health Technologists (100.0%), and Education Instruction & Library (94.2%).
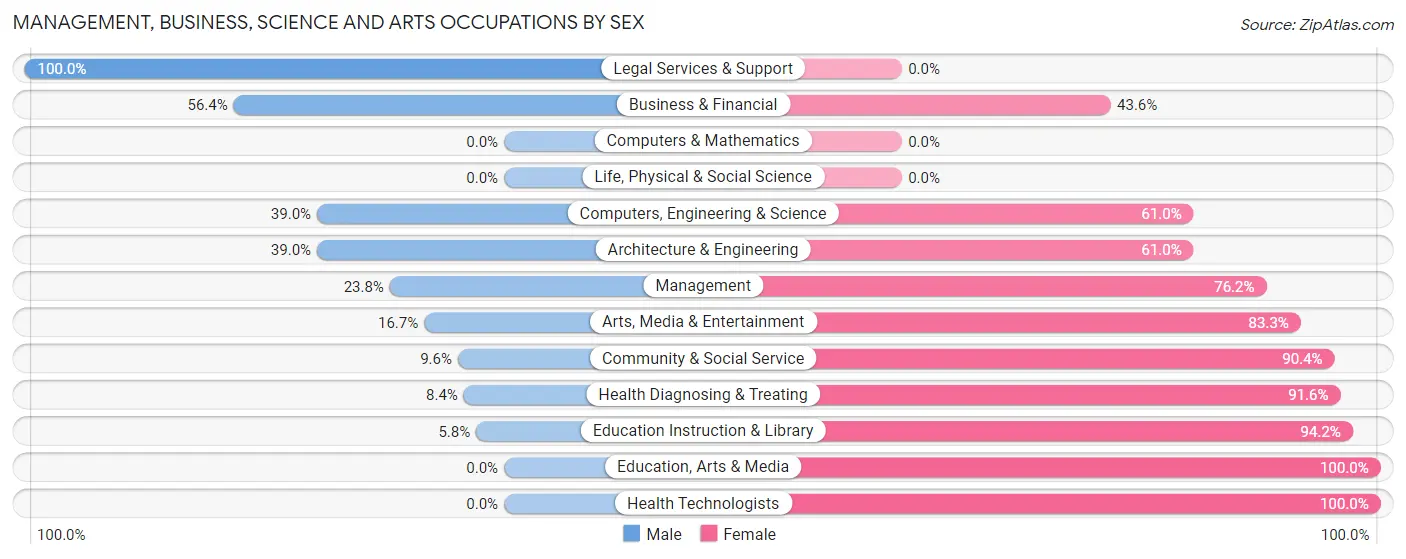
| Occupation | Male | Female |
| Management | 41 (23.8%) | 131 (76.2%) |
| Business & Financial | 22 (56.4%) | 17 (43.6%) |
| Computers, Engineering & Science | 16 (39.0%) | 25 (61.0%) |
| Computers & Mathematics | 0 (0.0%) | 0 (0.0%) |
| Architecture & Engineering | 16 (39.0%) | 25 (61.0%) |
| Life, Physical & Social Science | 0 (0.0%) | 0 (0.0%) |
| Community & Social Service | 21 (9.6%) | 197 (90.4%) |
| Education, Arts & Media | 0 (0.0%) | 60 (100.0%) |
| Legal Services & Support | 7 (100.0%) | 0 (0.0%) |
| Education Instruction & Library | 6 (5.8%) | 97 (94.2%) |
| Arts, Media & Entertainment | 8 (16.7%) | 40 (83.3%) |
| Health Diagnosing & Treating | 11 (8.4%) | 120 (91.6%) |
| Health Technologists | 0 (0.0%) | 22 (100.0%) |
| Total (Category) | 111 (18.5%) | 490 (81.5%) |
| Total (Overall) | 1,093 (45.8%) | 1,296 (54.2%) |
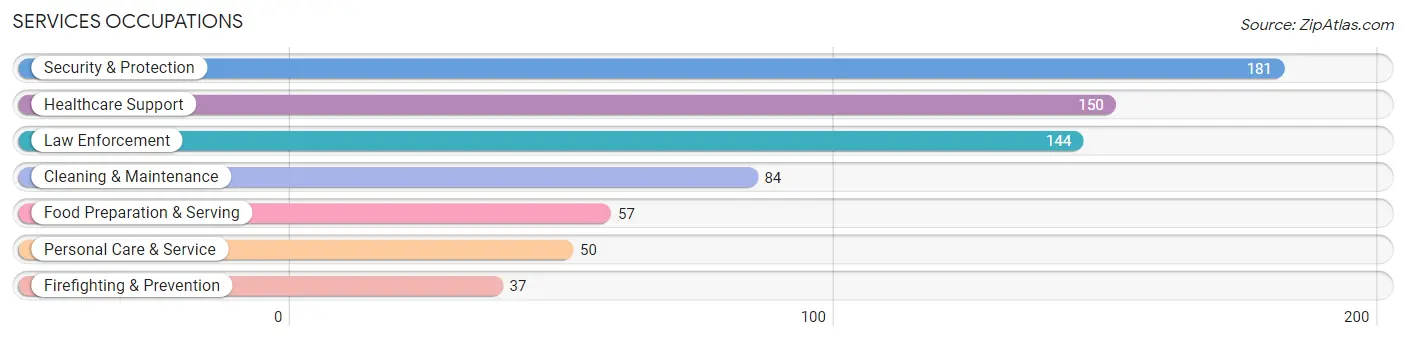
Services Occupations
The most common Services occupations in Broadway are Security & Protection (181 | 7.6%), Healthcare Support (150 | 6.3%), Law Enforcement (144 | 6.0%), Cleaning & Maintenance (84 | 3.5%), and Food Preparation & Serving (57 | 2.4%).
Services Occupations by Sex
Within the Services occupations in Broadway, the most male-oriented occupations are Firefighting & Prevention (89.2%), Cleaning & Maintenance (85.7%), and Security & Protection (79.6%), while the most female-oriented occupations are Healthcare Support (100.0%), Food Preparation & Serving (89.5%), and Personal Care & Service (54.0%).
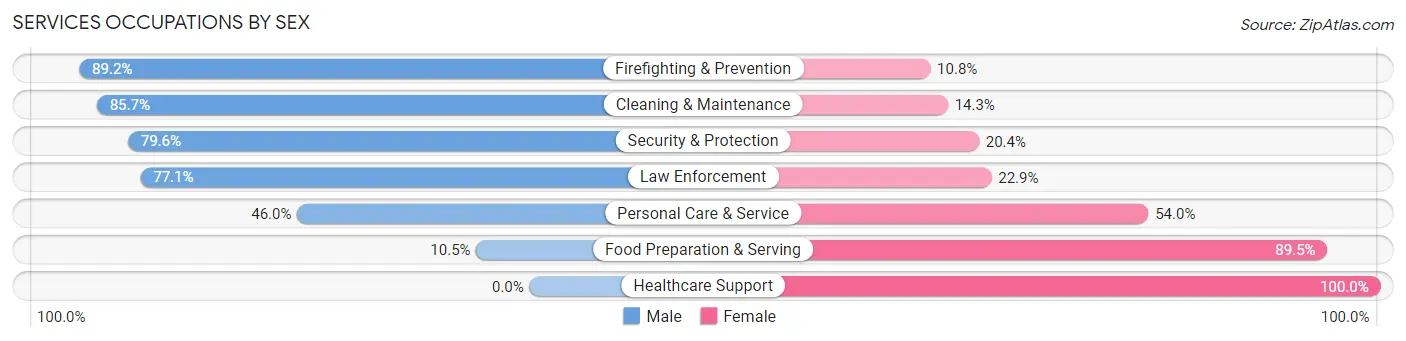
| Occupation | Male | Female |
| Healthcare Support | 0 (0.0%) | 150 (100.0%) |
| Security & Protection | 144 (79.6%) | 37 (20.4%) |
| Firefighting & Prevention | 33 (89.2%) | 4 (10.8%) |
| Law Enforcement | 111 (77.1%) | 33 (22.9%) |
| Food Preparation & Serving | 6 (10.5%) | 51 (89.5%) |
| Cleaning & Maintenance | 72 (85.7%) | 12 (14.3%) |
| Personal Care & Service | 23 (46.0%) | 27 (54.0%) |
| Total (Category) | 245 (46.9%) | 277 (53.1%) |
| Total (Overall) | 1,093 (45.8%) | 1,296 (54.2%) |
Sales and Office Occupations
The most common Sales and Office occupations in Broadway are Office & Administration (428 | 17.9%), and Sales & Related (244 | 10.2%).

Sales and Office Occupations by Sex
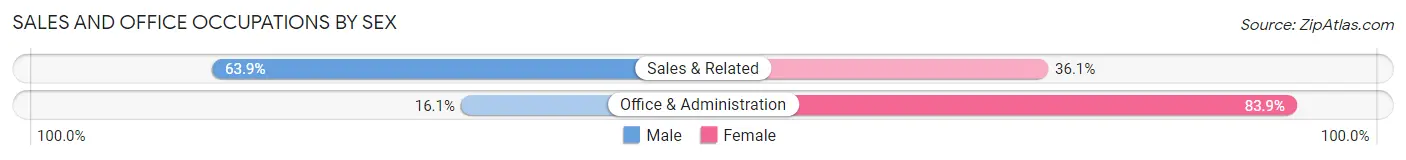
| Occupation | Male | Female |
| Sales & Related | 156 (63.9%) | 88 (36.1%) |
| Office & Administration | 69 (16.1%) | 359 (83.9%) |
| Total (Category) | 225 (33.5%) | 447 (66.5%) |
| Total (Overall) | 1,093 (45.8%) | 1,296 (54.2%) |
Natural Resources, Construction and Maintenance Occupations
The most common Natural Resources, Construction and Maintenance occupations in Broadway are Installation, Maintenance & Repair (148 | 6.2%), Construction & Extraction (47 | 2.0%), and Farming, Fishing & Forestry (4 | 0.2%).
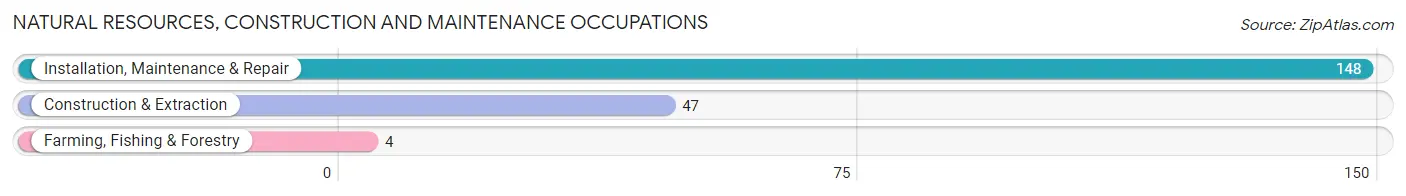
Natural Resources, Construction and Maintenance Occupations by Sex

| Occupation | Male | Female |
| Farming, Fishing & Forestry | 0 (0.0%) | 4 (100.0%) |
| Construction & Extraction | 47 (100.0%) | 0 (0.0%) |
| Installation, Maintenance & Repair | 148 (100.0%) | 0 (0.0%) |
| Total (Category) | 195 (98.0%) | 4 (2.0%) |
| Total (Overall) | 1,093 (45.8%) | 1,296 (54.2%) |
Production, Transportation and Moving Occupations
The most common Production, Transportation and Moving occupations in Broadway are Production (174 | 7.3%), Material Moving (148 | 6.2%), and Transportation (73 | 3.1%).
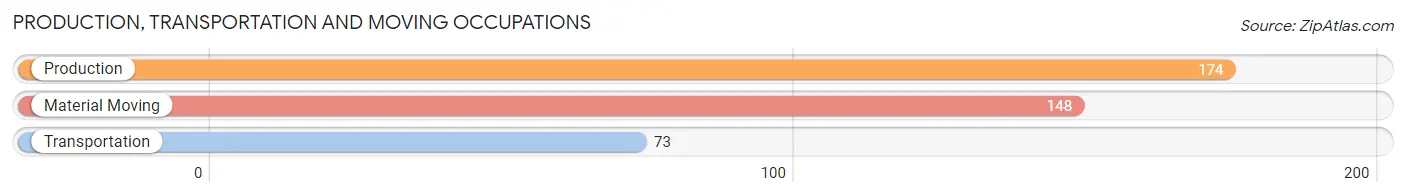
Production, Transportation and Moving Occupations by Sex
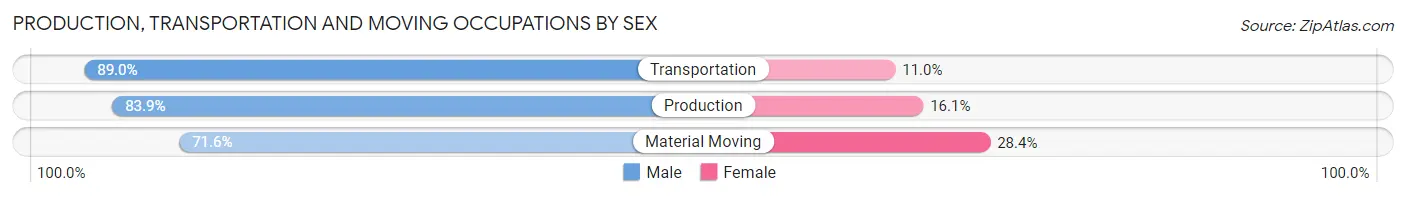
| Occupation | Male | Female |
| Production | 146 (83.9%) | 28 (16.1%) |
| Transportation | 65 (89.0%) | 8 (11.0%) |
| Material Moving | 106 (71.6%) | 42 (28.4%) |
| Total (Category) | 317 (80.2%) | 78 (19.8%) |
| Total (Overall) | 1,093 (45.8%) | 1,296 (54.2%) |
Employment Industries by Sex in Broadway
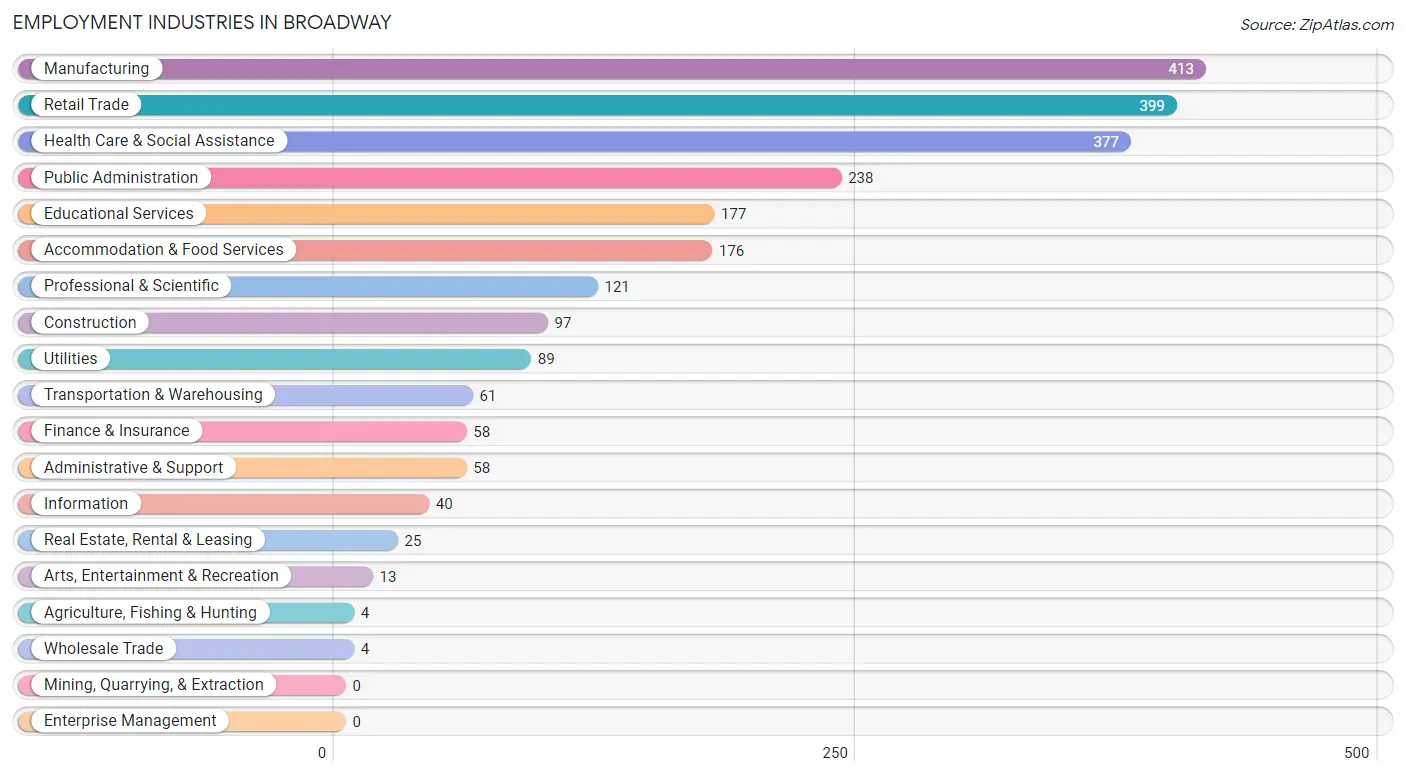
Employment Industries in Broadway
The major employment industries in Broadway include Manufacturing (413 | 17.3%), Retail Trade (399 | 16.7%), Health Care & Social Assistance (377 | 15.8%), Public Administration (238 | 10.0%), and Educational Services (177 | 7.4%).
Employment Industries by Sex in Broadway
The Broadway industries that see more men than women are Wholesale Trade (100.0%), Arts, Entertainment & Recreation (100.0%), and Transportation & Warehousing (78.7%), whereas the industries that tend to have a higher number of women are Agriculture, Fishing & Hunting (100.0%), Information (100.0%), and Health Care & Social Assistance (95.5%).
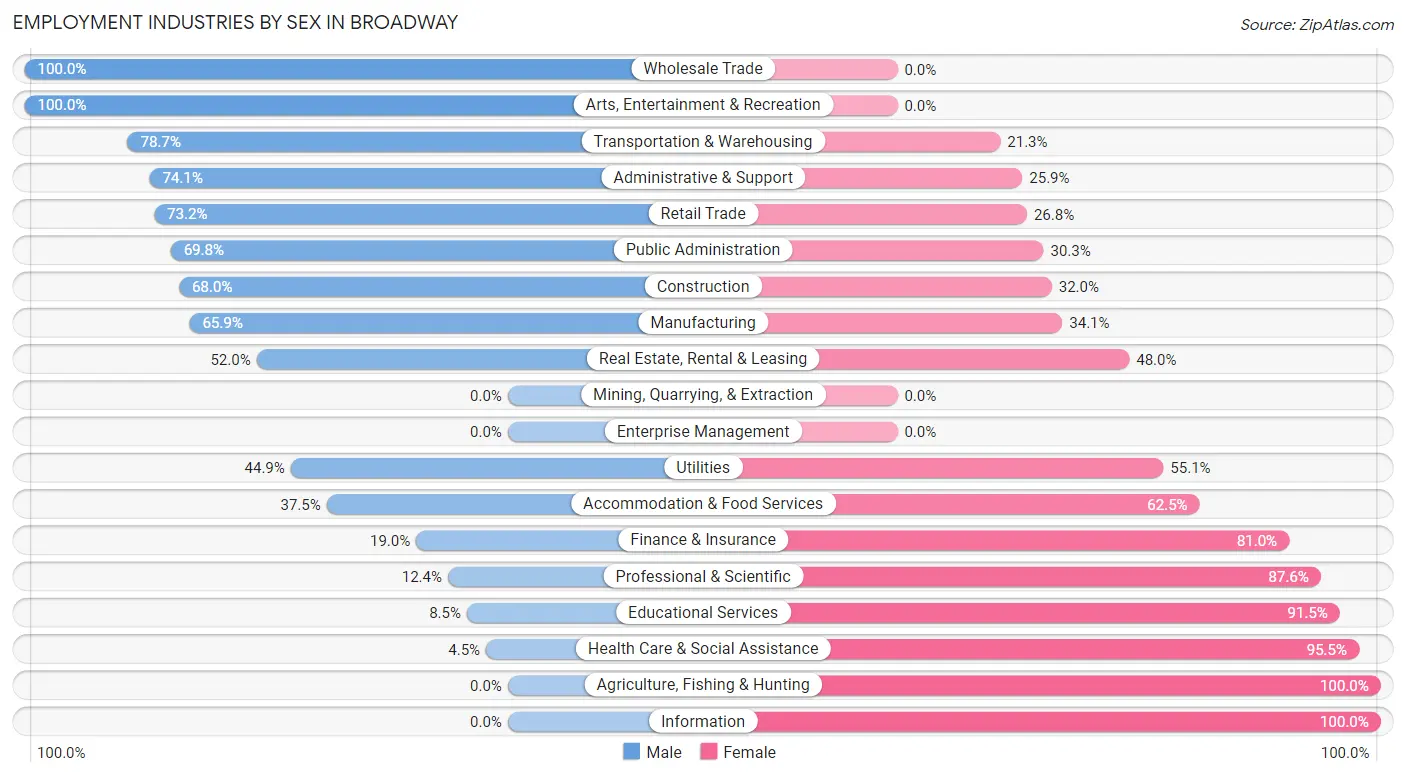
| Industry | Male | Female |
| Agriculture, Fishing & Hunting | 0 (0.0%) | 4 (100.0%) |
| Mining, Quarrying, & Extraction | 0 (0.0%) | 0 (0.0%) |
| Construction | 66 (68.0%) | 31 (32.0%) |
| Manufacturing | 272 (65.9%) | 141 (34.1%) |
| Wholesale Trade | 4 (100.0%) | 0 (0.0%) |
| Retail Trade | 292 (73.2%) | 107 (26.8%) |
| Transportation & Warehousing | 48 (78.7%) | 13 (21.3%) |
| Utilities | 40 (44.9%) | 49 (55.1%) |
| Information | 0 (0.0%) | 40 (100.0%) |
| Finance & Insurance | 11 (19.0%) | 47 (81.0%) |
| Real Estate, Rental & Leasing | 13 (52.0%) | 12 (48.0%) |
| Professional & Scientific | 15 (12.4%) | 106 (87.6%) |
| Enterprise Management | 0 (0.0%) | 0 (0.0%) |
| Administrative & Support | 43 (74.1%) | 15 (25.9%) |
| Educational Services | 15 (8.5%) | 162 (91.5%) |
| Health Care & Social Assistance | 17 (4.5%) | 360 (95.5%) |
| Arts, Entertainment & Recreation | 13 (100.0%) | 0 (0.0%) |
| Accommodation & Food Services | 66 (37.5%) | 110 (62.5%) |
| Public Administration | 166 (69.8%) | 72 (30.2%) |
| Total | 1,093 (45.8%) | 1,296 (54.2%) |
Education in Broadway
School Enrollment in Broadway
The most common levels of schooling among the 968 students in Broadway are elementary school (302 | 31.2%), high school (253 | 26.1%), and middle school (170 | 17.6%).
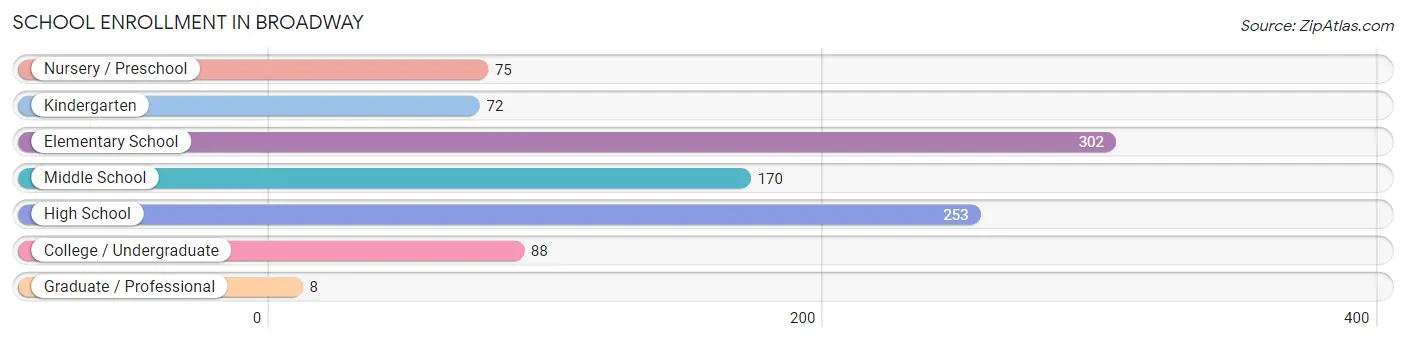
| School Level | # Students | % Students |
| Nursery / Preschool | 75 | 7.7% |
| Kindergarten | 72 | 7.4% |
| Elementary School | 302 | 31.2% |
| Middle School | 170 | 17.6% |
| High School | 253 | 26.1% |
| College / Undergraduate | 88 | 9.1% |
| Graduate / Professional | 8 | 0.8% |
| Total | 968 | 100.0% |
School Enrollment by Age by Funding Source in Broadway
Out of a total of 968 students who are enrolled in schools in Broadway, 96 (9.9%) attend a private institution, while the remaining 872 (90.1%) are enrolled in public schools. The age group of 3 to 4 year olds has the highest likelihood of being enrolled in private schools, with 50 (83.3% in the age bracket) enrolled. Conversely, the age group of 5 to 9 year old has the lowest likelihood of being enrolled in a private school, with 360 (100.0% in the age bracket) attending a public institution.
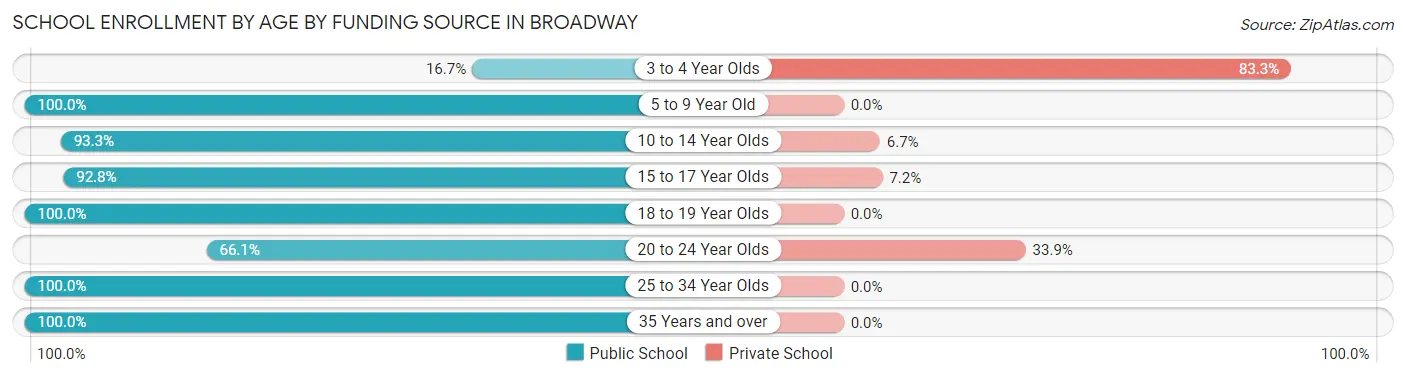
| Age Bracket | Public School | Private School |
| 3 to 4 Year Olds | 10 (16.7%) | 50 (83.3%) |
| 5 to 9 Year Old | 360 (100.0%) | 0 (0.0%) |
| 10 to 14 Year Olds | 180 (93.3%) | 13 (6.7%) |
| 15 to 17 Year Olds | 167 (92.8%) | 13 (7.2%) |
| 18 to 19 Year Olds | 91 (100.0%) | 0 (0.0%) |
| 20 to 24 Year Olds | 39 (66.1%) | 20 (33.9%) |
| 25 to 34 Year Olds | 17 (100.0%) | 0 (0.0%) |
| 35 Years and over | 8 (100.0%) | 0 (0.0%) |
| Total | 872 (90.1%) | 96 (9.9%) |
Educational Attainment by Field of Study in Broadway
Education (120 | 17.3%), engineering (102 | 14.7%), literature & languages (71 | 10.2%), psychology (65 | 9.4%), and arts & humanities (60 | 8.6%) are the most common fields of study among 694 individuals in Broadway who have obtained a bachelor's degree or higher.
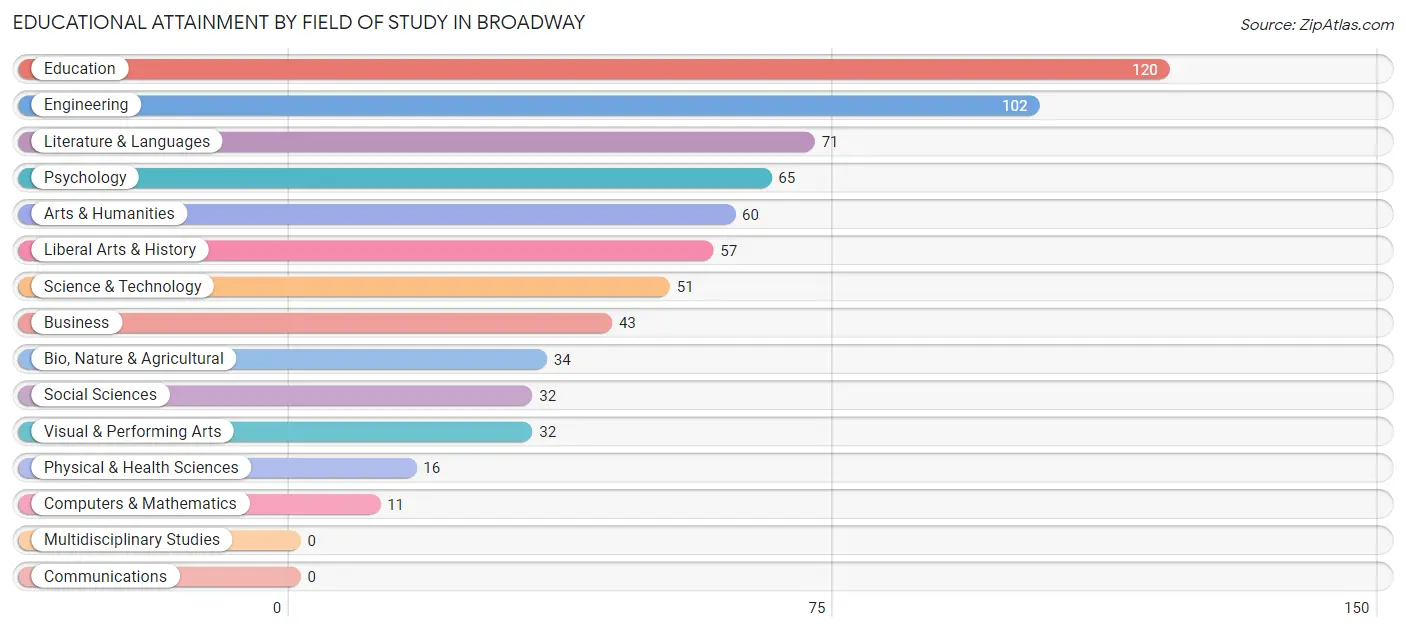
| Field of Study | # Graduates | % Graduates |
| Computers & Mathematics | 11 | 1.6% |
| Bio, Nature & Agricultural | 34 | 4.9% |
| Physical & Health Sciences | 16 | 2.3% |
| Psychology | 65 | 9.4% |
| Social Sciences | 32 | 4.6% |
| Engineering | 102 | 14.7% |
| Multidisciplinary Studies | 0 | 0.0% |
| Science & Technology | 51 | 7.3% |
| Business | 43 | 6.2% |
| Education | 120 | 17.3% |
| Literature & Languages | 71 | 10.2% |
| Liberal Arts & History | 57 | 8.2% |
| Visual & Performing Arts | 32 | 4.6% |
| Communications | 0 | 0.0% |
| Arts & Humanities | 60 | 8.6% |
| Total | 694 | 100.0% |
Transportation & Commute in Broadway
Vehicle Availability by Sex in Broadway
The most prevalent vehicle ownership categories in Broadway are males with 3 vehicles (399, accounting for 36.8%) and females with 3 vehicles (293, making up 30.8%).
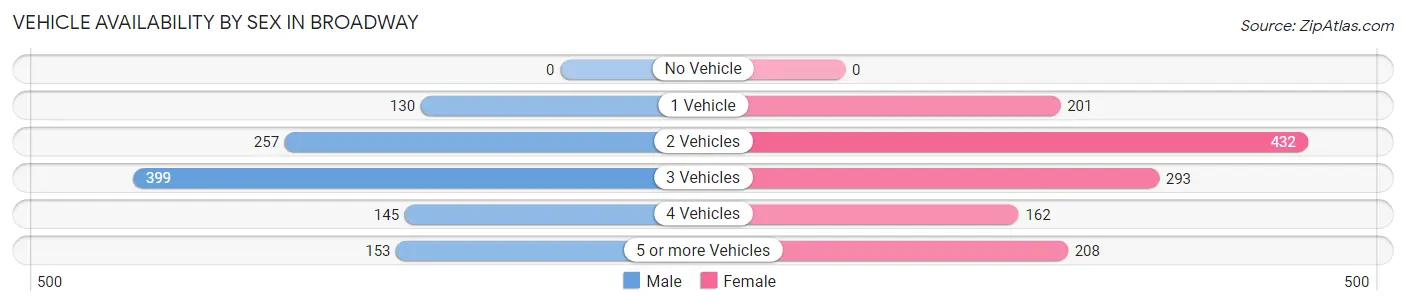
| Vehicles Available | Male | Female |
| No Vehicle | 0 (0.0%) | 0 (0.0%) |
| 1 Vehicle | 130 (12.0%) | 201 (15.5%) |
| 2 Vehicles | 257 (23.7%) | 432 (33.3%) |
| 3 Vehicles | 399 (36.8%) | 293 (22.6%) |
| 4 Vehicles | 145 (13.4%) | 162 (12.5%) |
| 5 or more Vehicles | 153 (14.1%) | 208 (16.1%) |
| Total | 1,084 (100.0%) | 1,296 (100.0%) |
Commute Time in Broadway
The most frequently occuring commute durations in Broadway are 30 to 34 minutes (452 commuters, 19.9%), 20 to 24 minutes (395 commuters, 17.4%), and 25 to 29 minutes (328 commuters, 14.4%).
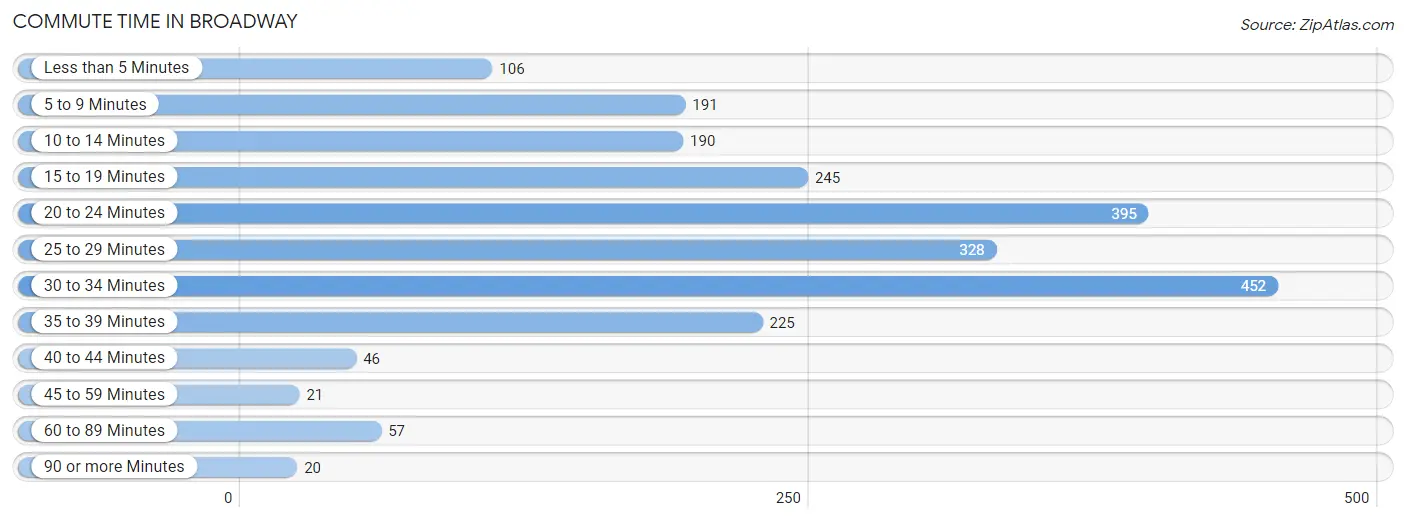
| Commute Time | # Commuters | % Commuters |
| Less than 5 Minutes | 106 | 4.7% |
| 5 to 9 Minutes | 191 | 8.4% |
| 10 to 14 Minutes | 190 | 8.4% |
| 15 to 19 Minutes | 245 | 10.8% |
| 20 to 24 Minutes | 395 | 17.4% |
| 25 to 29 Minutes | 328 | 14.4% |
| 30 to 34 Minutes | 452 | 19.9% |
| 35 to 39 Minutes | 225 | 9.9% |
| 40 to 44 Minutes | 46 | 2.0% |
| 45 to 59 Minutes | 21 | 0.9% |
| 60 to 89 Minutes | 57 | 2.5% |
| 90 or more Minutes | 20 | 0.9% |
Commute Time by Sex in Broadway
The most common commute times in Broadway are 30 to 34 minutes (273 commuters, 25.6%) for males and 20 to 24 minutes (241 commuters, 20.0%) for females.
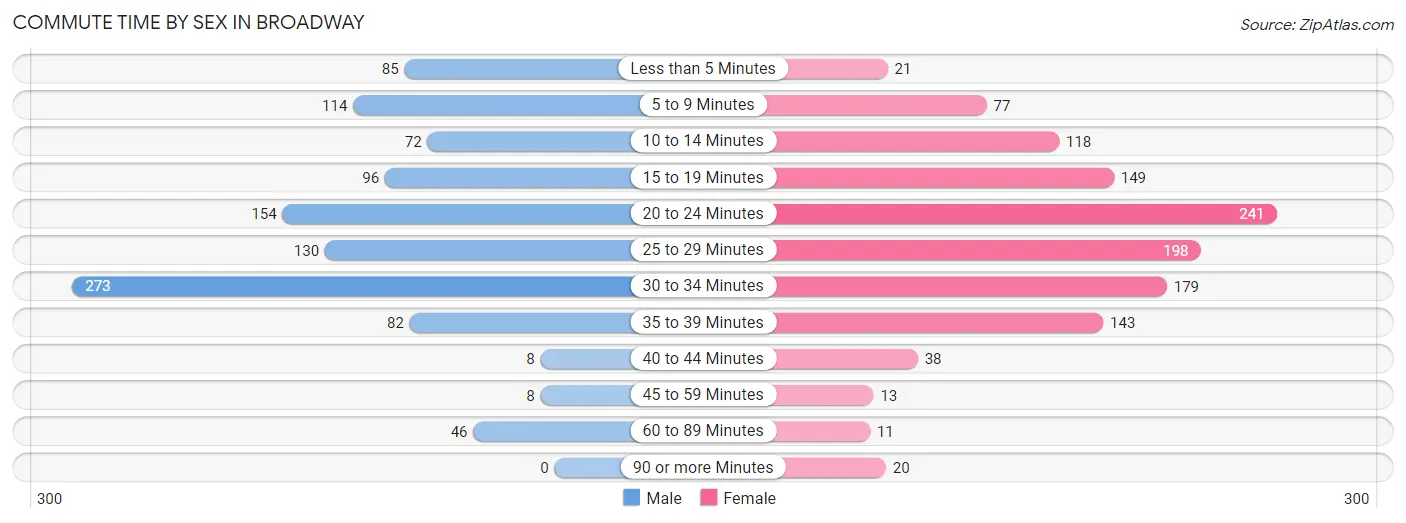
| Commute Time | Male | Female |
| Less than 5 Minutes | 85 (8.0%) | 21 (1.7%) |
| 5 to 9 Minutes | 114 (10.7%) | 77 (6.4%) |
| 10 to 14 Minutes | 72 (6.7%) | 118 (9.8%) |
| 15 to 19 Minutes | 96 (9.0%) | 149 (12.3%) |
| 20 to 24 Minutes | 154 (14.4%) | 241 (20.0%) |
| 25 to 29 Minutes | 130 (12.2%) | 198 (16.4%) |
| 30 to 34 Minutes | 273 (25.6%) | 179 (14.8%) |
| 35 to 39 Minutes | 82 (7.7%) | 143 (11.8%) |
| 40 to 44 Minutes | 8 (0.7%) | 38 (3.2%) |
| 45 to 59 Minutes | 8 (0.7%) | 13 (1.1%) |
| 60 to 89 Minutes | 46 (4.3%) | 11 (0.9%) |
| 90 or more Minutes | 0 (0.0%) | 20 (1.7%) |
Time of Departure to Work by Sex in Broadway
The most frequent times of departure to work in Broadway are 6:00 AM to 6:29 AM (168, 15.7%) for males and 7:00 AM to 7:29 AM (277, 22.9%) for females.
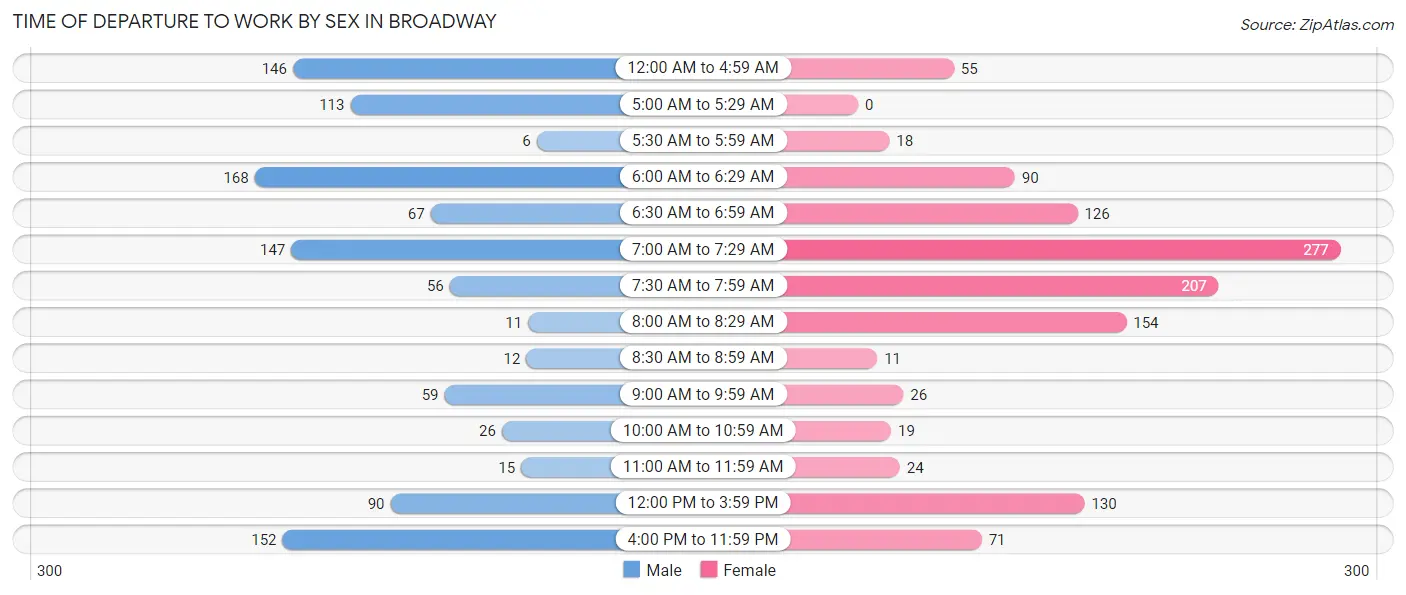
| Time of Departure | Male | Female |
| 12:00 AM to 4:59 AM | 146 (13.7%) | 55 (4.5%) |
| 5:00 AM to 5:29 AM | 113 (10.6%) | 0 (0.0%) |
| 5:30 AM to 5:59 AM | 6 (0.6%) | 18 (1.5%) |
| 6:00 AM to 6:29 AM | 168 (15.7%) | 90 (7.4%) |
| 6:30 AM to 6:59 AM | 67 (6.3%) | 126 (10.4%) |
| 7:00 AM to 7:29 AM | 147 (13.8%) | 277 (22.9%) |
| 7:30 AM to 7:59 AM | 56 (5.2%) | 207 (17.1%) |
| 8:00 AM to 8:29 AM | 11 (1.0%) | 154 (12.8%) |
| 8:30 AM to 8:59 AM | 12 (1.1%) | 11 (0.9%) |
| 9:00 AM to 9:59 AM | 59 (5.5%) | 26 (2.1%) |
| 10:00 AM to 10:59 AM | 26 (2.4%) | 19 (1.6%) |
| 11:00 AM to 11:59 AM | 15 (1.4%) | 24 (2.0%) |
| 12:00 PM to 3:59 PM | 90 (8.4%) | 130 (10.8%) |
| 4:00 PM to 11:59 PM | 152 (14.2%) | 71 (5.9%) |
| Total | 1,068 (100.0%) | 1,208 (100.0%) |
Housing Occupancy in Broadway
Occupancy by Ownership in Broadway
Of the total 1,637 dwellings in Broadway, owner-occupied units account for 1,069 (65.3%), while renter-occupied units make up 568 (34.7%).
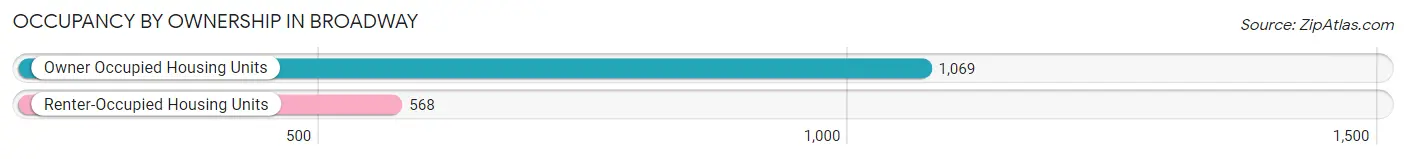
| Occupancy | # Housing Units | % Housing Units |
| Owner Occupied Housing Units | 1,069 | 65.3% |
| Renter-Occupied Housing Units | 568 | 34.7% |
| Total Occupied Housing Units | 1,637 | 100.0% |
Occupancy by Household Size in Broadway
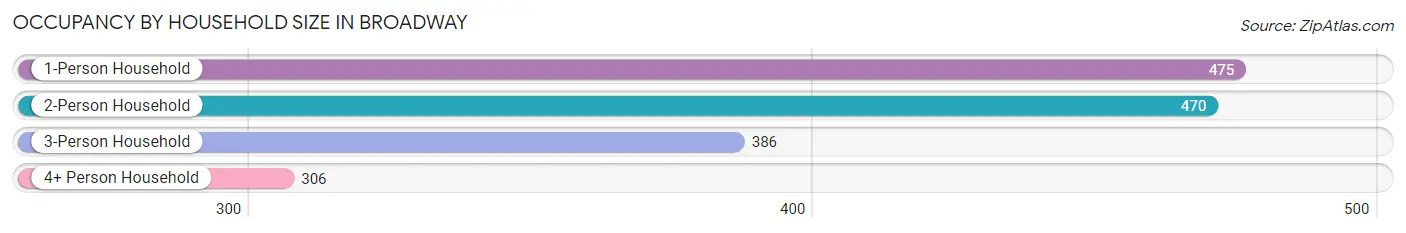
| Household Size | # Housing Units | % Housing Units |
| 1-Person Household | 475 | 29.0% |
| 2-Person Household | 470 | 28.7% |
| 3-Person Household | 386 | 23.6% |
| 4+ Person Household | 306 | 18.7% |
| Total Housing Units | 1,637 | 100.0% |
Occupancy by Ownership by Household Size in Broadway
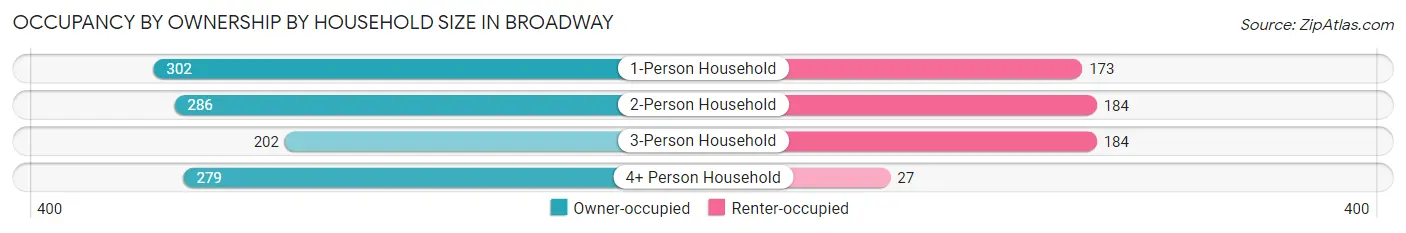
| Household Size | Owner-occupied | Renter-occupied |
| 1-Person Household | 302 (63.6%) | 173 (36.4%) |
| 2-Person Household | 286 (60.9%) | 184 (39.2%) |
| 3-Person Household | 202 (52.3%) | 184 (47.7%) |
| 4+ Person Household | 279 (91.2%) | 27 (8.8%) |
| Total Housing Units | 1,069 (65.3%) | 568 (34.7%) |
Occupancy by Educational Attainment in Broadway
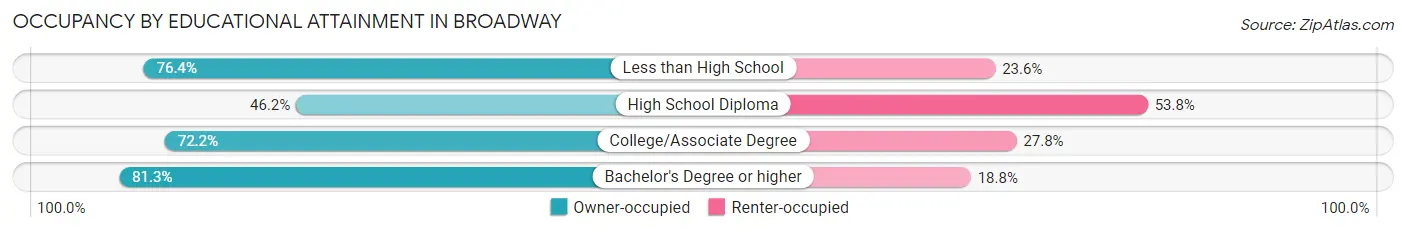
| Household Size | Owner-occupied | Renter-occupied |
| Less than High School | 68 (76.4%) | 21 (23.6%) |
| High School Diploma | 271 (46.2%) | 316 (53.8%) |
| College/Associate Degree | 405 (72.2%) | 156 (27.8%) |
| Bachelor's Degree or higher | 325 (81.2%) | 75 (18.8%) |
Occupancy by Age of Householder in Broadway
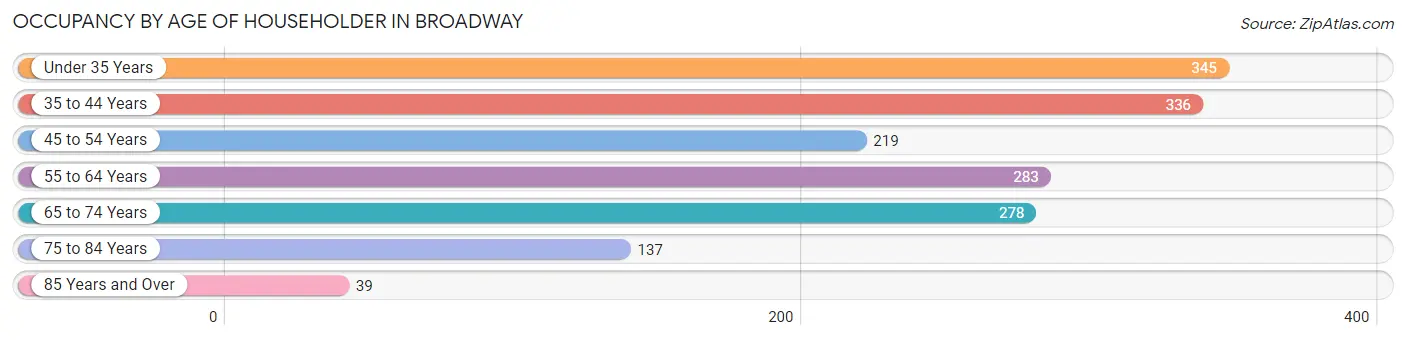
| Age Bracket | # Households | % Households |
| Under 35 Years | 345 | 21.1% |
| 35 to 44 Years | 336 | 20.5% |
| 45 to 54 Years | 219 | 13.4% |
| 55 to 64 Years | 283 | 17.3% |
| 65 to 74 Years | 278 | 17.0% |
| 75 to 84 Years | 137 | 8.4% |
| 85 Years and Over | 39 | 2.4% |
| Total | 1,637 | 100.0% |
Housing Finances in Broadway
Median Income by Occupancy in Broadway
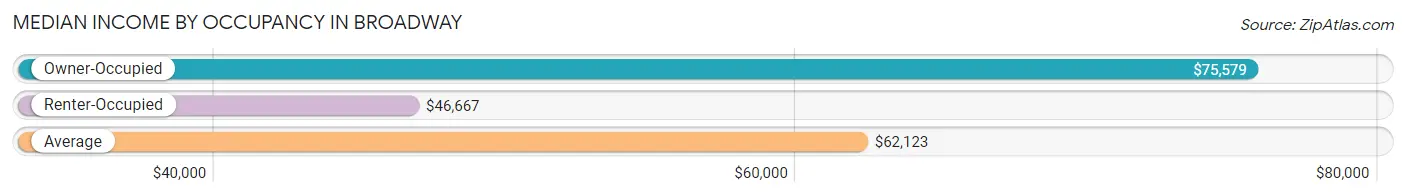
| Occupancy Type | # Households | Median Income |
| Owner-Occupied | 1,069 (65.3%) | $75,579 |
| Renter-Occupied | 568 (34.7%) | $46,667 |
| Average | 1,637 (100.0%) | $62,123 |
Occupancy by Householder Income Bracket in Broadway
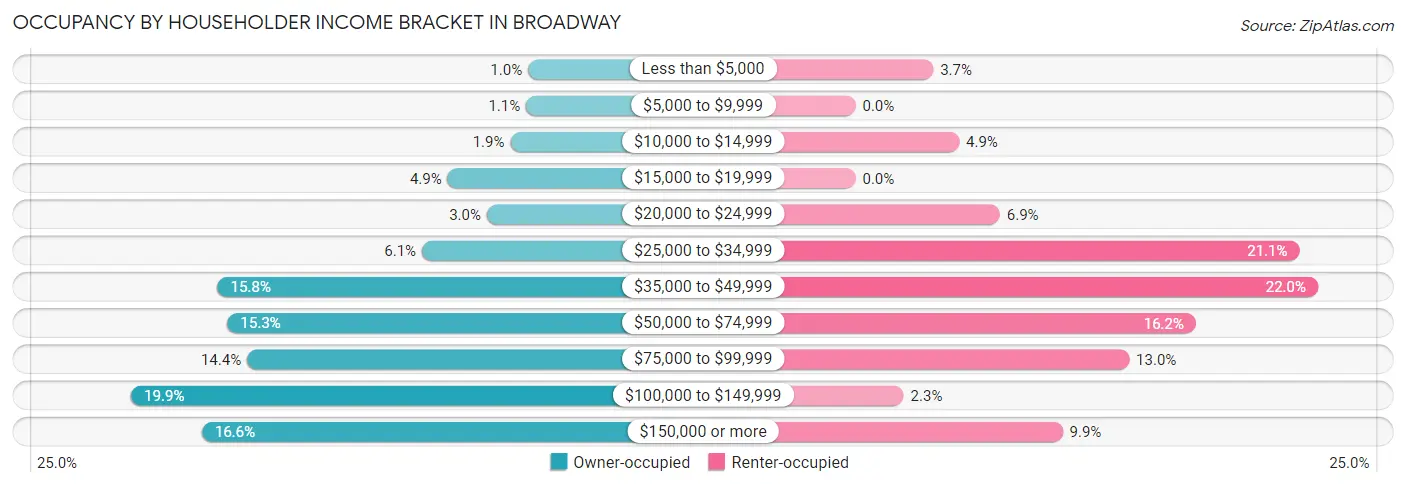
| Income Bracket | Owner-occupied | Renter-occupied |
| Less than $5,000 | 11 (1.0%) | 21 (3.7%) |
| $5,000 to $9,999 | 12 (1.1%) | 0 (0.0%) |
| $10,000 to $14,999 | 20 (1.9%) | 28 (4.9%) |
| $15,000 to $19,999 | 52 (4.9%) | 0 (0.0%) |
| $20,000 to $24,999 | 32 (3.0%) | 39 (6.9%) |
| $25,000 to $34,999 | 65 (6.1%) | 120 (21.1%) |
| $35,000 to $49,999 | 169 (15.8%) | 125 (22.0%) |
| $50,000 to $74,999 | 164 (15.3%) | 92 (16.2%) |
| $75,000 to $99,999 | 154 (14.4%) | 74 (13.0%) |
| $100,000 to $149,999 | 213 (19.9%) | 13 (2.3%) |
| $150,000 or more | 177 (16.6%) | 56 (9.9%) |
| Total | 1,069 (100.0%) | 568 (100.0%) |
Monthly Housing Cost Tiers in Broadway
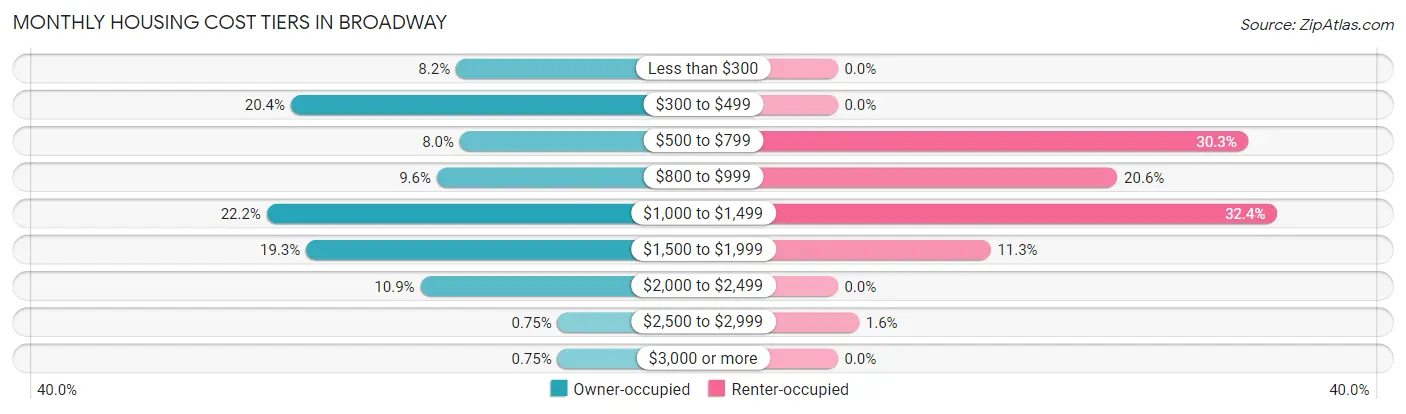
| Monthly Cost | Owner-occupied | Renter-occupied |
| Less than $300 | 88 (8.2%) | 0 (0.0%) |
| $300 to $499 | 218 (20.4%) | 0 (0.0%) |
| $500 to $799 | 85 (8.0%) | 172 (30.3%) |
| $800 to $999 | 103 (9.6%) | 117 (20.6%) |
| $1,000 to $1,499 | 237 (22.2%) | 184 (32.4%) |
| $1,500 to $1,999 | 206 (19.3%) | 64 (11.3%) |
| $2,000 to $2,499 | 116 (10.8%) | 0 (0.0%) |
| $2,500 to $2,999 | 8 (0.7%) | 9 (1.6%) |
| $3,000 or more | 8 (0.7%) | 0 (0.0%) |
| Total | 1,069 (100.0%) | 568 (100.0%) |
Physical Housing Characteristics in Broadway
Housing Structures in Broadway
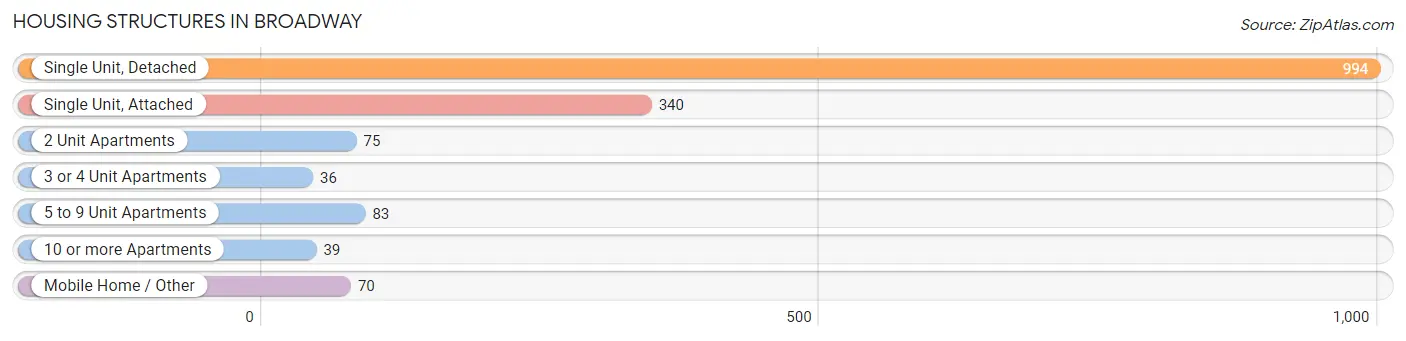
| Structure Type | # Housing Units | % Housing Units |
| Single Unit, Detached | 994 | 60.7% |
| Single Unit, Attached | 340 | 20.8% |
| 2 Unit Apartments | 75 | 4.6% |
| 3 or 4 Unit Apartments | 36 | 2.2% |
| 5 to 9 Unit Apartments | 83 | 5.1% |
| 10 or more Apartments | 39 | 2.4% |
| Mobile Home / Other | 70 | 4.3% |
| Total | 1,637 | 100.0% |
Housing Structures by Occupancy in Broadway
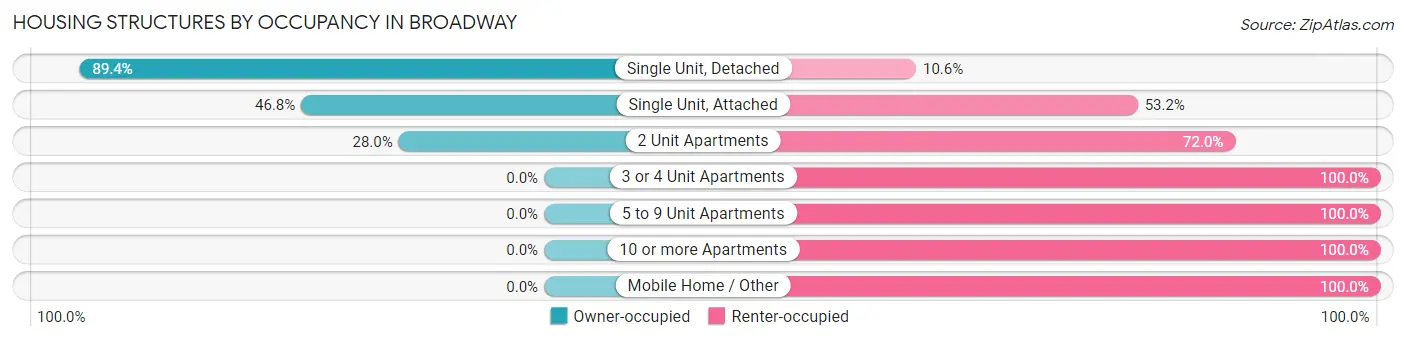
| Structure Type | Owner-occupied | Renter-occupied |
| Single Unit, Detached | 889 (89.4%) | 105 (10.6%) |
| Single Unit, Attached | 159 (46.8%) | 181 (53.2%) |
| 2 Unit Apartments | 21 (28.0%) | 54 (72.0%) |
| 3 or 4 Unit Apartments | 0 (0.0%) | 36 (100.0%) |
| 5 to 9 Unit Apartments | 0 (0.0%) | 83 (100.0%) |
| 10 or more Apartments | 0 (0.0%) | 39 (100.0%) |
| Mobile Home / Other | 0 (0.0%) | 70 (100.0%) |
| Total | 1,069 (65.3%) | 568 (34.7%) |
Housing Structures by Number of Rooms in Broadway
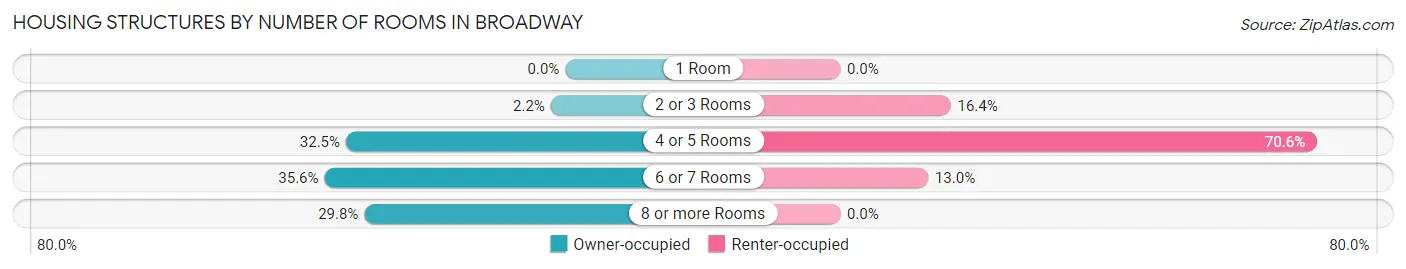
| Number of Rooms | Owner-occupied | Renter-occupied |
| 1 Room | 0 (0.0%) | 0 (0.0%) |
| 2 or 3 Rooms | 23 (2.1%) | 93 (16.4%) |
| 4 or 5 Rooms | 347 (32.5%) | 401 (70.6%) |
| 6 or 7 Rooms | 381 (35.6%) | 74 (13.0%) |
| 8 or more Rooms | 318 (29.7%) | 0 (0.0%) |
| Total | 1,069 (100.0%) | 568 (100.0%) |
Housing Structure by Heating Type in Broadway
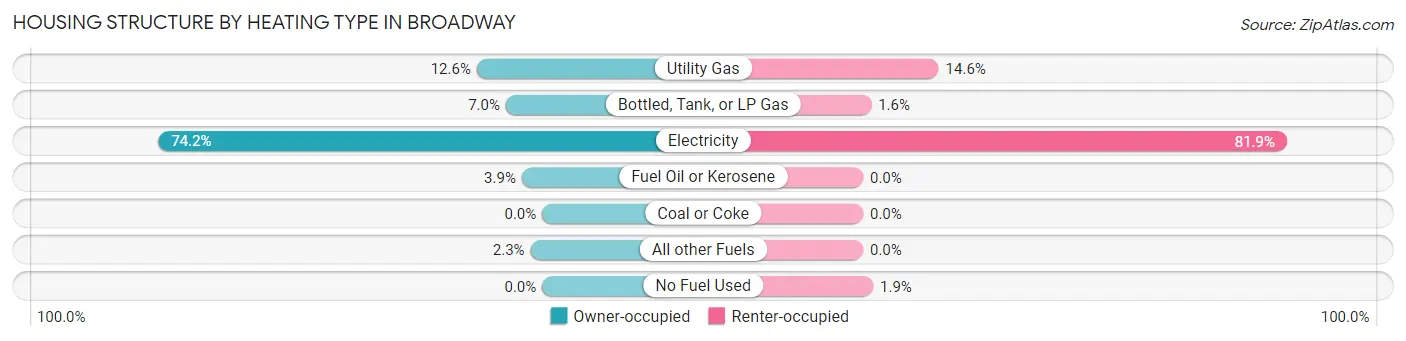
| Heating Type | Owner-occupied | Renter-occupied |
| Utility Gas | 135 (12.6%) | 83 (14.6%) |
| Bottled, Tank, or LP Gas | 75 (7.0%) | 9 (1.6%) |
| Electricity | 793 (74.2%) | 465 (81.9%) |
| Fuel Oil or Kerosene | 42 (3.9%) | 0 (0.0%) |
| Coal or Coke | 0 (0.0%) | 0 (0.0%) |
| All other Fuels | 24 (2.2%) | 0 (0.0%) |
| No Fuel Used | 0 (0.0%) | 11 (1.9%) |
| Total | 1,069 (100.0%) | 568 (100.0%) |
Household Vehicle Usage in Broadway
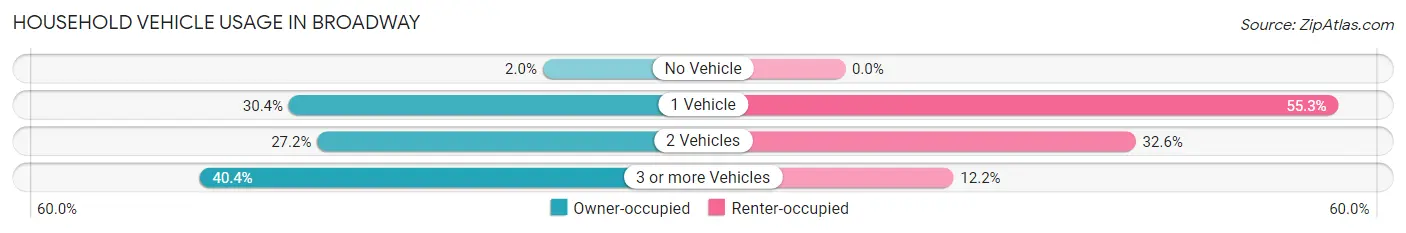
| Vehicles per Household | Owner-occupied | Renter-occupied |
| No Vehicle | 21 (2.0%) | 0 (0.0%) |
| 1 Vehicle | 325 (30.4%) | 314 (55.3%) |
| 2 Vehicles | 291 (27.2%) | 185 (32.6%) |
| 3 or more Vehicles | 432 (40.4%) | 69 (12.1%) |
| Total | 1,069 (100.0%) | 568 (100.0%) |
Real Estate & Mortgages in Broadway
Real Estate and Mortgage Overview in Broadway
| Characteristic | Without Mortgage | With Mortgage |
| Housing Units | 383 | 686 |
| Median Property Value | $244,800 | $244,700 |
| Median Household Income | $41,573 | $146 |
| Monthly Housing Costs | $366 | $8 |
| Real Estate Taxes | $1,409 | $13 |
Property Value by Mortgage Status in Broadway
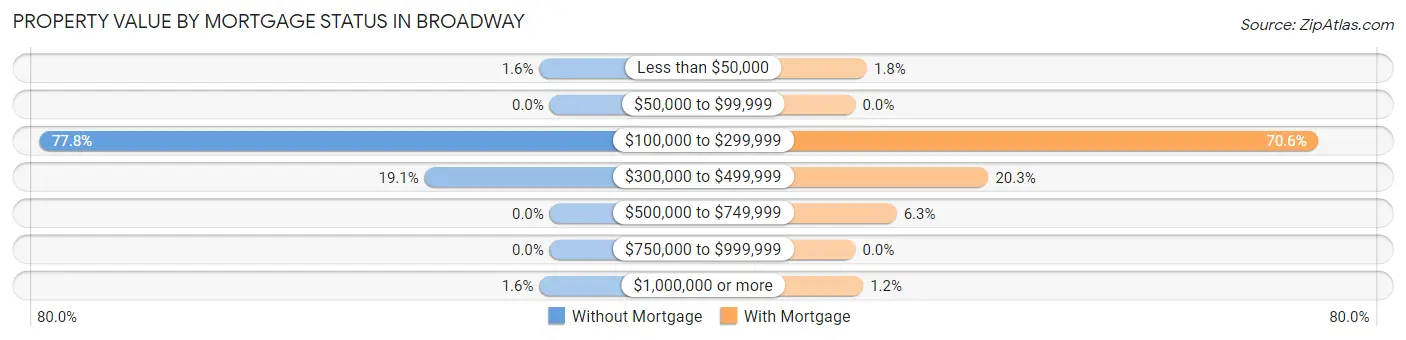
| Property Value | Without Mortgage | With Mortgage |
| Less than $50,000 | 6 (1.6%) | 12 (1.8%) |
| $50,000 to $99,999 | 0 (0.0%) | 0 (0.0%) |
| $100,000 to $299,999 | 298 (77.8%) | 484 (70.6%) |
| $300,000 to $499,999 | 73 (19.1%) | 139 (20.3%) |
| $500,000 to $749,999 | 0 (0.0%) | 43 (6.3%) |
| $750,000 to $999,999 | 0 (0.0%) | 0 (0.0%) |
| $1,000,000 or more | 6 (1.6%) | 8 (1.2%) |
| Total | 383 (100.0%) | 686 (100.0%) |
Household Income by Mortgage Status in Broadway
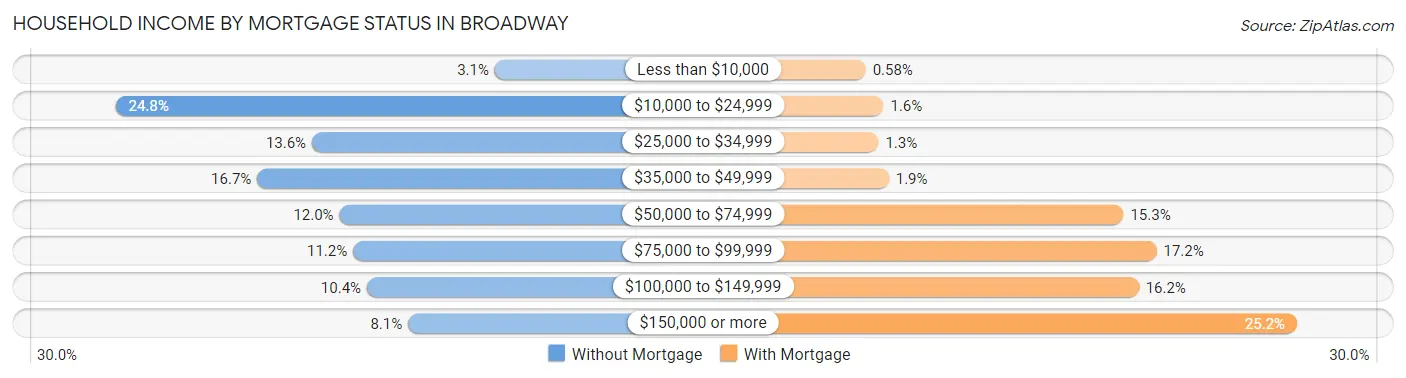
| Household Income | Without Mortgage | With Mortgage |
| Less than $10,000 | 12 (3.1%) | 4 (0.6%) |
| $10,000 to $24,999 | 95 (24.8%) | 11 (1.6%) |
| $25,000 to $34,999 | 52 (13.6%) | 9 (1.3%) |
| $35,000 to $49,999 | 64 (16.7%) | 13 (1.9%) |
| $50,000 to $74,999 | 46 (12.0%) | 105 (15.3%) |
| $75,000 to $99,999 | 43 (11.2%) | 118 (17.2%) |
| $100,000 to $149,999 | 40 (10.4%) | 111 (16.2%) |
| $150,000 or more | 31 (8.1%) | 173 (25.2%) |
| Total | 383 (100.0%) | 686 (100.0%) |
Property Value to Household Income Ratio in Broadway
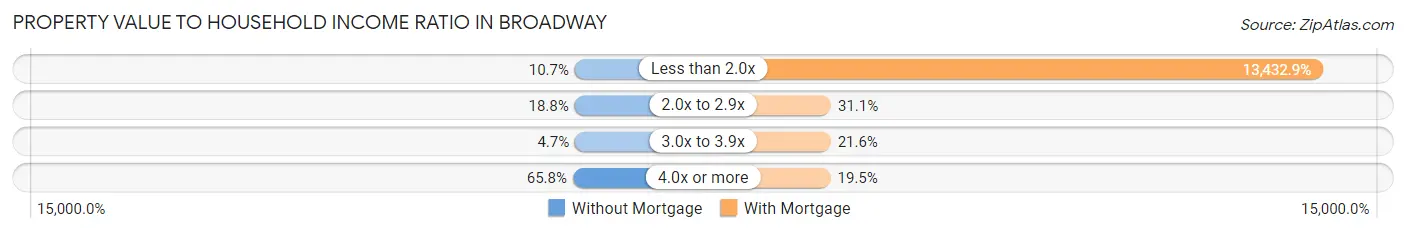
| Value-to-Income Ratio | Without Mortgage | With Mortgage |
| Less than 2.0x | 41 (10.7%) | 92,150 (13,432.9%) |
| 2.0x to 2.9x | 72 (18.8%) | 213 (31.0%) |
| 3.0x to 3.9x | 18 (4.7%) | 148 (21.6%) |
| 4.0x or more | 252 (65.8%) | 134 (19.5%) |
| Total | 383 (100.0%) | 686 (100.0%) |
Real Estate Taxes by Mortgage Status in Broadway
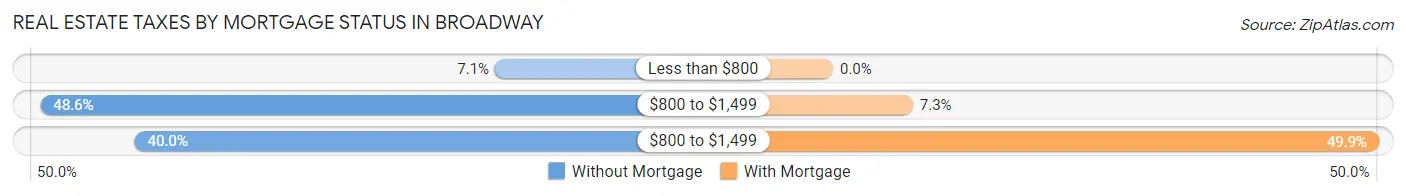
| Property Taxes | Without Mortgage | With Mortgage |
| Less than $800 | 27 (7.0%) | 0 (0.0%) |
| $800 to $1,499 | 186 (48.6%) | 50 (7.3%) |
| $800 to $1,499 | 153 (40.0%) | 342 (49.8%) |
| Total | 383 (100.0%) | 686 (100.0%) |
Health & Disability in Broadway
Health Insurance Coverage by Age in Broadway
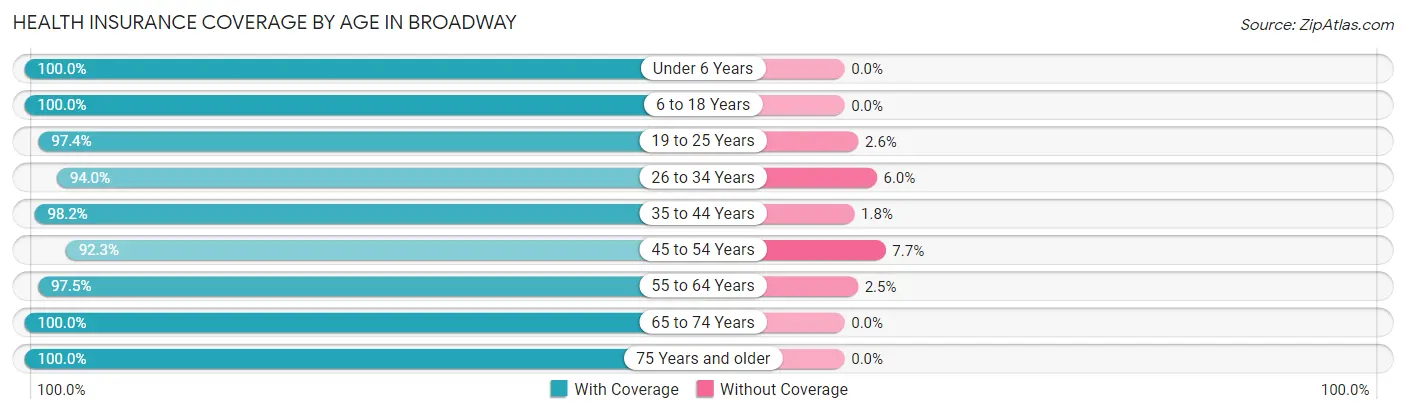
| Age Bracket | With Coverage | Without Coverage |
| Under 6 Years | 361 (100.0%) | 0 (0.0%) |
| 6 to 18 Years | 712 (100.0%) | 0 (0.0%) |
| 19 to 25 Years | 492 (97.4%) | 13 (2.6%) |
| 26 to 34 Years | 391 (94.0%) | 25 (6.0%) |
| 35 to 44 Years | 640 (98.2%) | 12 (1.8%) |
| 45 to 54 Years | 385 (92.3%) | 32 (7.7%) |
| 55 to 64 Years | 429 (97.5%) | 11 (2.5%) |
| 65 to 74 Years | 429 (100.0%) | 0 (0.0%) |
| 75 Years and older | 237 (100.0%) | 0 (0.0%) |
| Total | 4,076 (97.8%) | 93 (2.2%) |
Health Insurance Coverage by Citizenship Status in Broadway
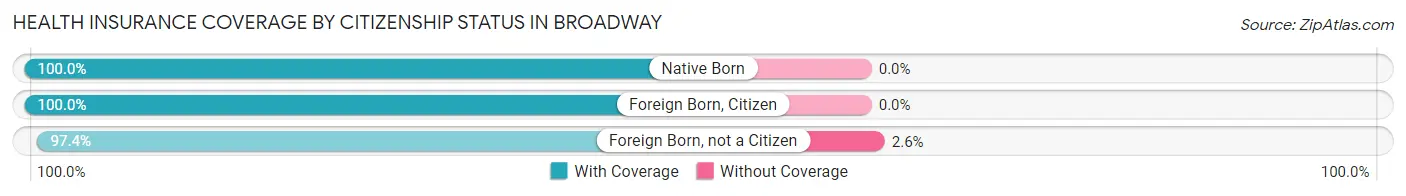
| Citizenship Status | With Coverage | Without Coverage |
| Native Born | 361 (100.0%) | 0 (0.0%) |
| Foreign Born, Citizen | 712 (100.0%) | 0 (0.0%) |
| Foreign Born, not a Citizen | 492 (97.4%) | 13 (2.6%) |
Health Insurance Coverage by Household Income in Broadway
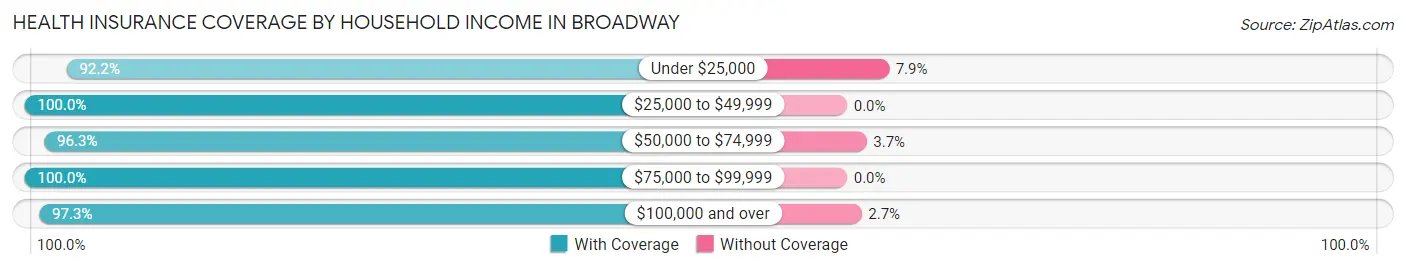
| Household Income | With Coverage | Without Coverage |
| Under $25,000 | 270 (92.1%) | 23 (7.9%) |
| $25,000 to $49,999 | 860 (100.0%) | 0 (0.0%) |
| $50,000 to $74,999 | 658 (96.3%) | 25 (3.7%) |
| $75,000 to $99,999 | 663 (100.0%) | 0 (0.0%) |
| $100,000 and over | 1,612 (97.3%) | 45 (2.7%) |
Public vs Private Health Insurance Coverage by Age in Broadway
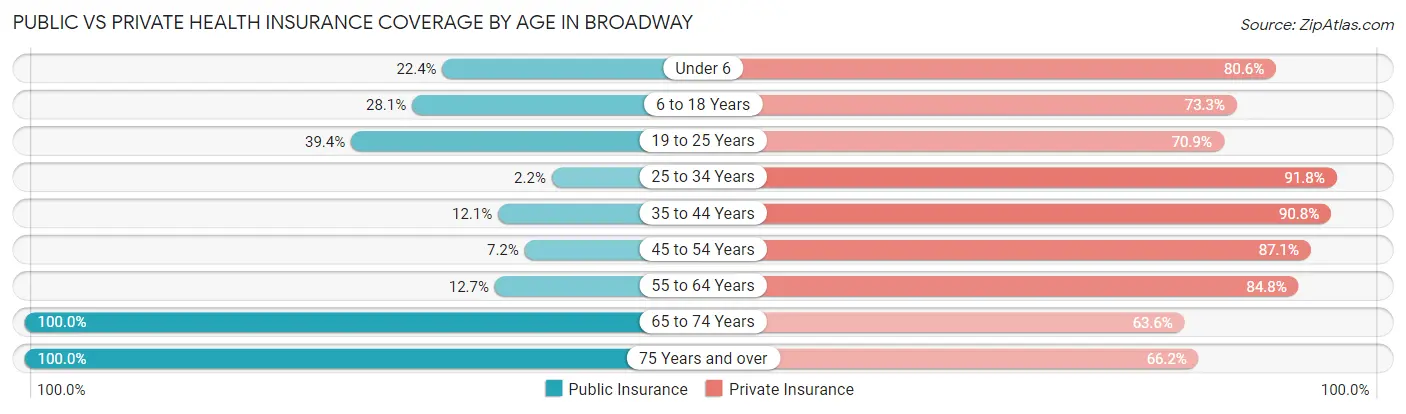
| Age Bracket | Public Insurance | Private Insurance |
| Under 6 | 81 (22.4%) | 291 (80.6%) |
| 6 to 18 Years | 200 (28.1%) | 522 (73.3%) |
| 19 to 25 Years | 199 (39.4%) | 358 (70.9%) |
| 25 to 34 Years | 9 (2.2%) | 382 (91.8%) |
| 35 to 44 Years | 79 (12.1%) | 592 (90.8%) |
| 45 to 54 Years | 30 (7.2%) | 363 (87.1%) |
| 55 to 64 Years | 56 (12.7%) | 373 (84.8%) |
| 65 to 74 Years | 429 (100.0%) | 273 (63.6%) |
| 75 Years and over | 237 (100.0%) | 157 (66.2%) |
| Total | 1,320 (31.7%) | 3,311 (79.4%) |
Disability Status by Sex by Age in Broadway
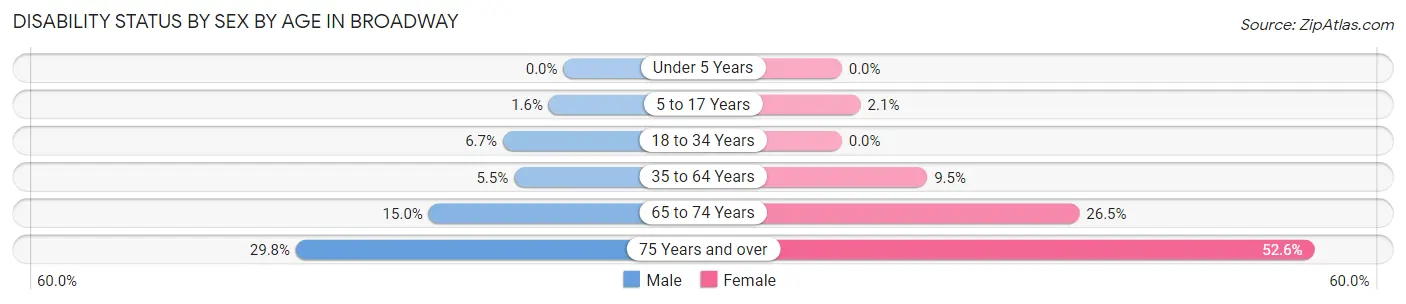
| Age Bracket | Male | Female |
| Under 5 Years | 0 (0.0%) | 0 (0.0%) |
| 5 to 17 Years | 6 (1.6%) | 8 (2.1%) |
| 18 to 34 Years | 25 (6.7%) | 0 (0.0%) |
| 35 to 64 Years | 39 (5.5%) | 76 (9.5%) |
| 65 to 74 Years | 36 (15.0%) | 50 (26.5%) |
| 75 Years and over | 14 (29.8%) | 100 (52.6%) |
Disability Class by Sex by Age in Broadway
Disability Class: Hearing Difficulty
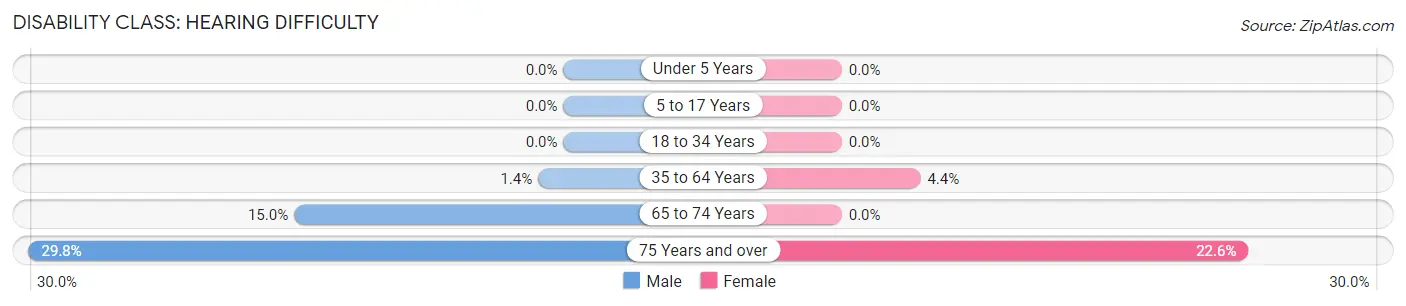
| Age Bracket | Male | Female |
| Under 5 Years | 0 (0.0%) | 0 (0.0%) |
| 5 to 17 Years | 0 (0.0%) | 0 (0.0%) |
| 18 to 34 Years | 0 (0.0%) | 0 (0.0%) |
| 35 to 64 Years | 10 (1.4%) | 35 (4.4%) |
| 65 to 74 Years | 36 (15.0%) | 0 (0.0%) |
| 75 Years and over | 14 (29.8%) | 43 (22.6%) |
Disability Class: Vision Difficulty
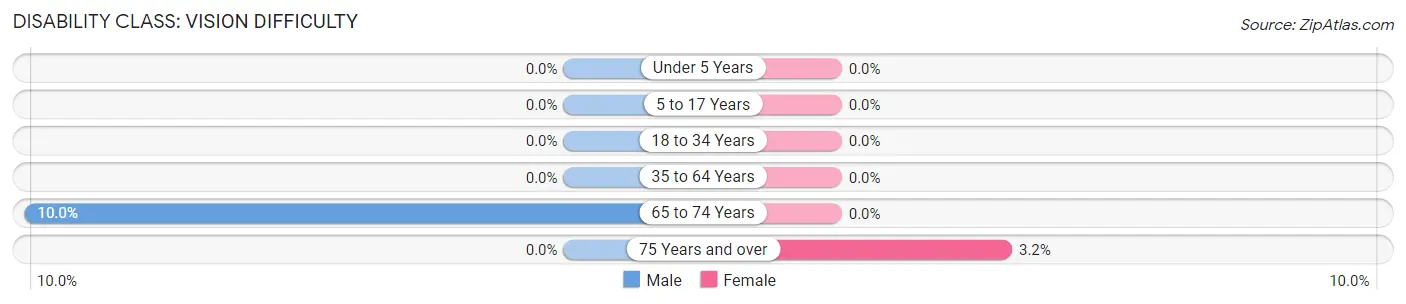
| Age Bracket | Male | Female |
| Under 5 Years | 0 (0.0%) | 0 (0.0%) |
| 5 to 17 Years | 0 (0.0%) | 0 (0.0%) |
| 18 to 34 Years | 0 (0.0%) | 0 (0.0%) |
| 35 to 64 Years | 0 (0.0%) | 0 (0.0%) |
| 65 to 74 Years | 24 (10.0%) | 0 (0.0%) |
| 75 Years and over | 0 (0.0%) | 6 (3.2%) |
Disability Class: Cognitive Difficulty
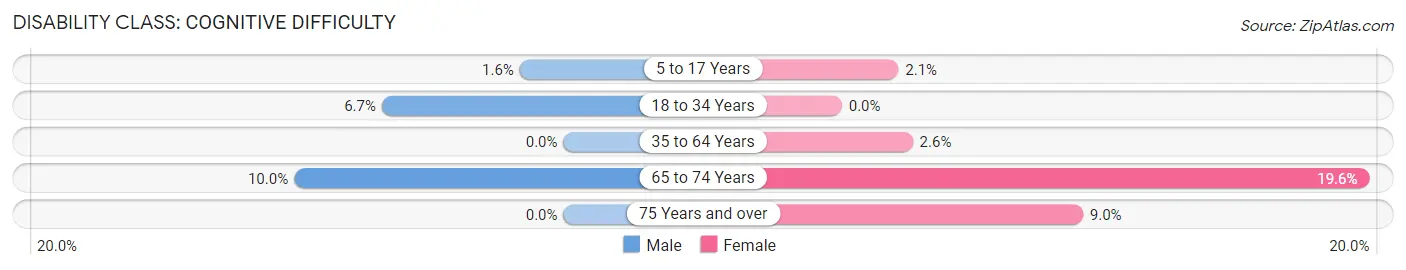
| Age Bracket | Male | Female |
| 5 to 17 Years | 6 (1.6%) | 8 (2.1%) |
| 18 to 34 Years | 25 (6.7%) | 0 (0.0%) |
| 35 to 64 Years | 0 (0.0%) | 21 (2.6%) |
| 65 to 74 Years | 24 (10.0%) | 37 (19.6%) |
| 75 Years and over | 0 (0.0%) | 17 (8.9%) |
Disability Class: Ambulatory Difficulty
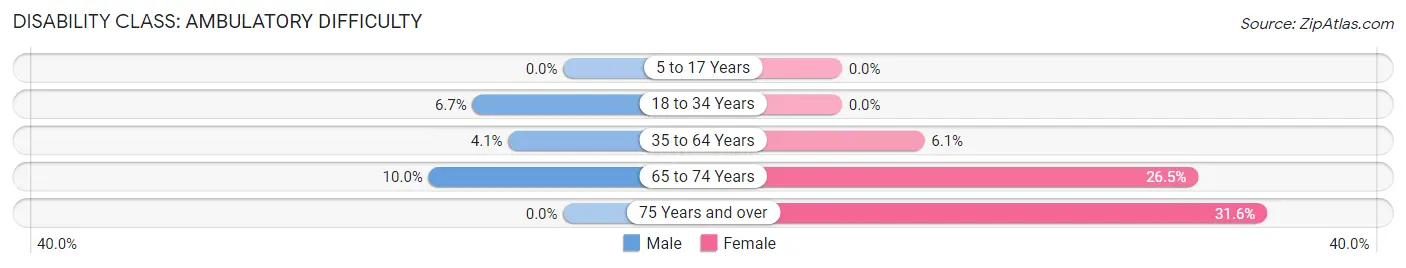
| Age Bracket | Male | Female |
| 5 to 17 Years | 0 (0.0%) | 0 (0.0%) |
| 18 to 34 Years | 25 (6.7%) | 0 (0.0%) |
| 35 to 64 Years | 29 (4.1%) | 49 (6.1%) |
| 65 to 74 Years | 24 (10.0%) | 50 (26.5%) |
| 75 Years and over | 0 (0.0%) | 60 (31.6%) |
Disability Class: Self-Care Difficulty
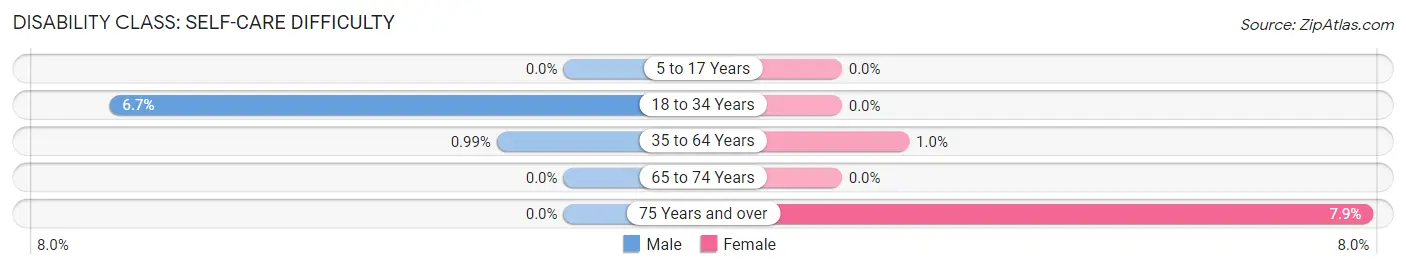
| Age Bracket | Male | Female |
| 5 to 17 Years | 0 (0.0%) | 0 (0.0%) |
| 18 to 34 Years | 25 (6.7%) | 0 (0.0%) |
| 35 to 64 Years | 7 (1.0%) | 8 (1.0%) |
| 65 to 74 Years | 0 (0.0%) | 0 (0.0%) |
| 75 Years and over | 0 (0.0%) | 15 (7.9%) |
Technology Access in Broadway
Computing Device Access in Broadway
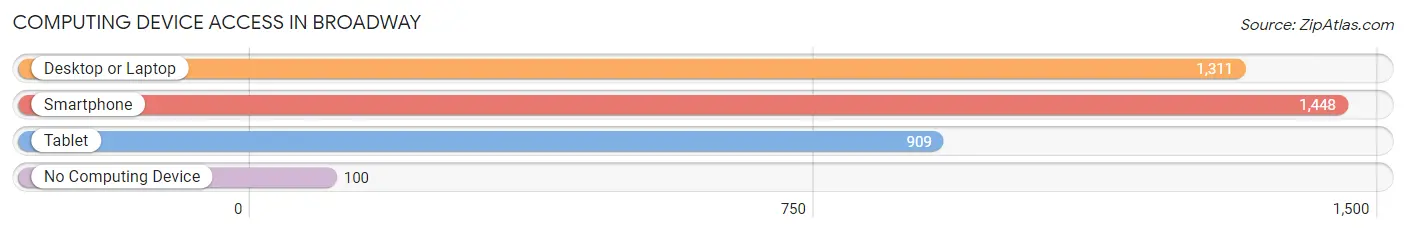
| Device Type | # Households | % Households |
| Desktop or Laptop | 1,311 | 80.1% |
| Smartphone | 1,448 | 88.4% |
| Tablet | 909 | 55.5% |
| No Computing Device | 100 | 6.1% |
| Total | 1,637 | 100.0% |
Internet Access in Broadway
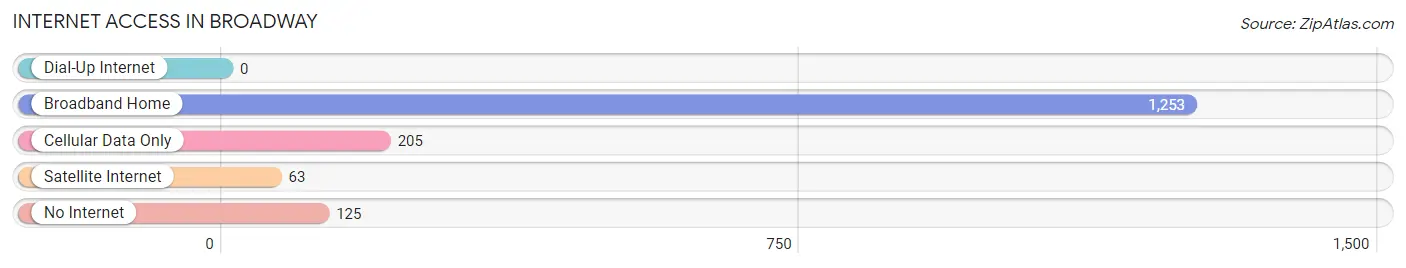
| Internet Type | # Households | % Households |
| Dial-Up Internet | 0 | 0.0% |
| Broadband Home | 1,253 | 76.5% |
| Cellular Data Only | 205 | 12.5% |
| Satellite Internet | 63 | 3.8% |
| No Internet | 125 | 7.6% |
| Total | 1,637 | 100.0% |
Broadway Summary
Broadway is a town located in Rockingham County, Virginia. It is situated in the Shenandoah Valley, approximately 25 miles north of Harrisonburg and 25 miles south of Winchester. The town has a population of 1,845 as of the 2010 census.
History
The area that is now Broadway was first settled in the late 1700s by German immigrants. The town was originally known as “Mudtown” due to the muddy roads that ran through the area. In 1832, the town was renamed Broadway after the Broadway Presbyterian Church, which was established in 1831.
The town was an important stop on the Valley Turnpike, which connected Winchester to Harrisonburg. The turnpike was a major transportation route for goods and people in the area.
During the Civil War, Broadway was the site of several skirmishes between Union and Confederate forces. The town was also the site of a major battle in 1864, known as the Battle of Broadway.
Geography
Broadway is located in the Shenandoah Valley, approximately 25 miles north of Harrisonburg and 25 miles south of Winchester. The town is situated in the foothills of the Blue Ridge Mountains. The town is located along the North Fork of the Shenandoah River.
The climate in Broadway is temperate, with hot summers and cold winters. The average annual temperature is 54 degrees Fahrenheit. The average annual precipitation is 40 inches.
Economy
The economy of Broadway is largely based on agriculture and tourism. The town is home to several farms, which produce a variety of crops, including corn, soybeans, wheat, and hay.
The town is also home to several businesses, including restaurants, retail stores, and a winery. The town is a popular tourist destination, with many visitors coming to enjoy the scenic views of the Shenandoah Valley.
Demographics
As of the 2010 census, the population of Broadway was 1,845. The racial makeup of the town was 94.3% White, 2.2% African American, 0.3% Native American, 0.7% Asian, 0.1% Pacific Islander, and 2.4% from other races.
The median household income in Broadway was $41,250, and the median family income was $50,000. The per capita income was $20,845. The town has a poverty rate of 11.3%.
Conclusion
Broadway is a small town located in Rockingham County, Virginia. It is situated in the Shenandoah Valley, approximately 25 miles north of Harrisonburg and 25 miles south of Winchester. The town has a population of 1,845 as of the 2010 census. The economy of Broadway is largely based on agriculture and tourism. The town is home to several farms, businesses, and is a popular tourist destination. The racial makeup of the town is 94.3% White, 2.2% African American, 0.3% Native American, 0.7% Asian, 0.1% Pacific Islander, and 2.4% from other races. The median household income in Broadway was $41,250, and the median family income was $50,000. The per capita income was $20,845. The town has a poverty rate of 11.3%.
Common Questions
What is Per Capita Income in Broadway?
Per Capita income in Broadway is $34,388.
What is the Median Family Income in Broadway?
Median Family Income in Broadway is $79,115.
What is the Median Household income in Broadway?
Median Household Income in Broadway is $62,123.
What is Income or Wage Gap in Broadway?
Income or Wage Gap in Broadway is 20.6%.
Women in Broadway earn 79.4 cents for every dollar earned by a man.
What is Inequality or Gini Index in Broadway?
Inequality or Gini Index in Broadway is 0.44.
What is the Total Population of Broadway?
Total Population of Broadway is 4,169.
What is the Total Male Population of Broadway?
Total Male Population of Broadway is 1,859.
What is the Total Female Population of Broadway?
Total Female Population of Broadway is 2,310.
What is the Ratio of Males per 100 Females in Broadway?
There are 80.48 Males per 100 Females in Broadway.
What is the Ratio of Females per 100 Males in Broadway?
There are 124.26 Females per 100 Males in Broadway.
What is the Median Population Age in Broadway?
Median Population Age in Broadway is 37.6 Years.
What is the Average Family Size in Broadway
Average Family Size in Broadway is 3.1 People.
What is the Average Household Size in Broadway
Average Household Size in Broadway is 2.5 People.
How Large is the Labor Force in Broadway?
There are 2,427 People in the Labor Forcein in Broadway.
What is the Percentage of People in the Labor Force in Broadway?
74.3% of People are in the Labor Force in Broadway.
What is the Unemployment Rate in Broadway?
Unemployment Rate in Broadway is 1.6%.