Youngtown, AZ Map & Demographics
Youngtown Map
Youngtown Overview
$24,425
PER CAPITA INCOME
$68,281
AVG FAMILY INCOME
$56,449
AVG HOUSEHOLD INCOME
29.5%
WAGE / INCOME GAP [ % ]
70.5¢/ $1
WAGE / INCOME GAP [ $ ]
0.38
INEQUALITY / GINI INDEX
6,980
TOTAL POPULATION
3,745
MALE POPULATION
3,235
FEMALE POPULATION
115.77
MALES / 100 FEMALES
86.38
FEMALES / 100 MALES
37.6
MEDIAN AGE
3.5
AVG FAMILY SIZE
2.7
AVG HOUSEHOLD SIZE
3,249
LABOR FORCE [ PEOPLE ]
56.9%
PERCENT IN LABOR FORCE
5.1%
UNEMPLOYMENT RATE
Youngtown Zip Codes
Youngtown Area Codes
Income in Youngtown
Income Overview in Youngtown
Per Capita Income in Youngtown is $24,425, while median incomes of families and households are $68,281 and $56,449 respectively.
| Characteristic | Number | Measure |
| Per Capita Income | 6,980 | $24,425 |
| Median Family Income | 1,390 | $68,281 |
| Mean Family Income | 1,390 | $70,857 |
| Median Household Income | 2,499 | $56,449 |
| Mean Household Income | 2,499 | $64,387 |
| Income Deficit | 1,390 | $0 |
| Wage / Income Gap (%) | 6,980 | 29.49% |
| Wage / Income Gap ($) | 6,980 | 70.51¢ per $1 |
| Gini / Inequality Index | 6,980 | 0.38 |
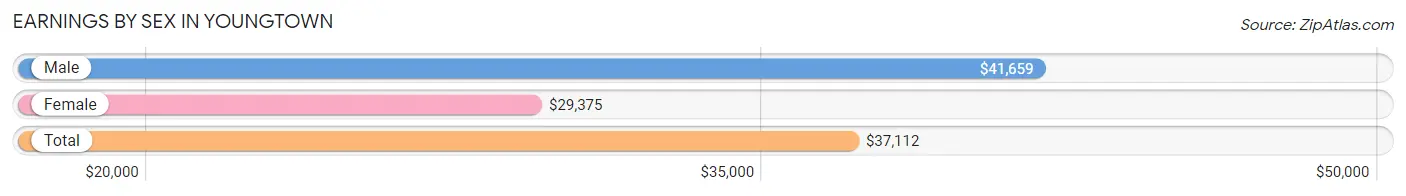
Earnings by Sex in Youngtown
Average Earnings in Youngtown are $37,112, $41,659 for men and $29,375 for women, a difference of 29.5%.
| Sex | Number | Average Earnings |
| Male | 1,823 (56.2%) | $41,659 |
| Female | 1,419 (43.8%) | $29,375 |
| Total | 3,242 (100.0%) | $37,112 |
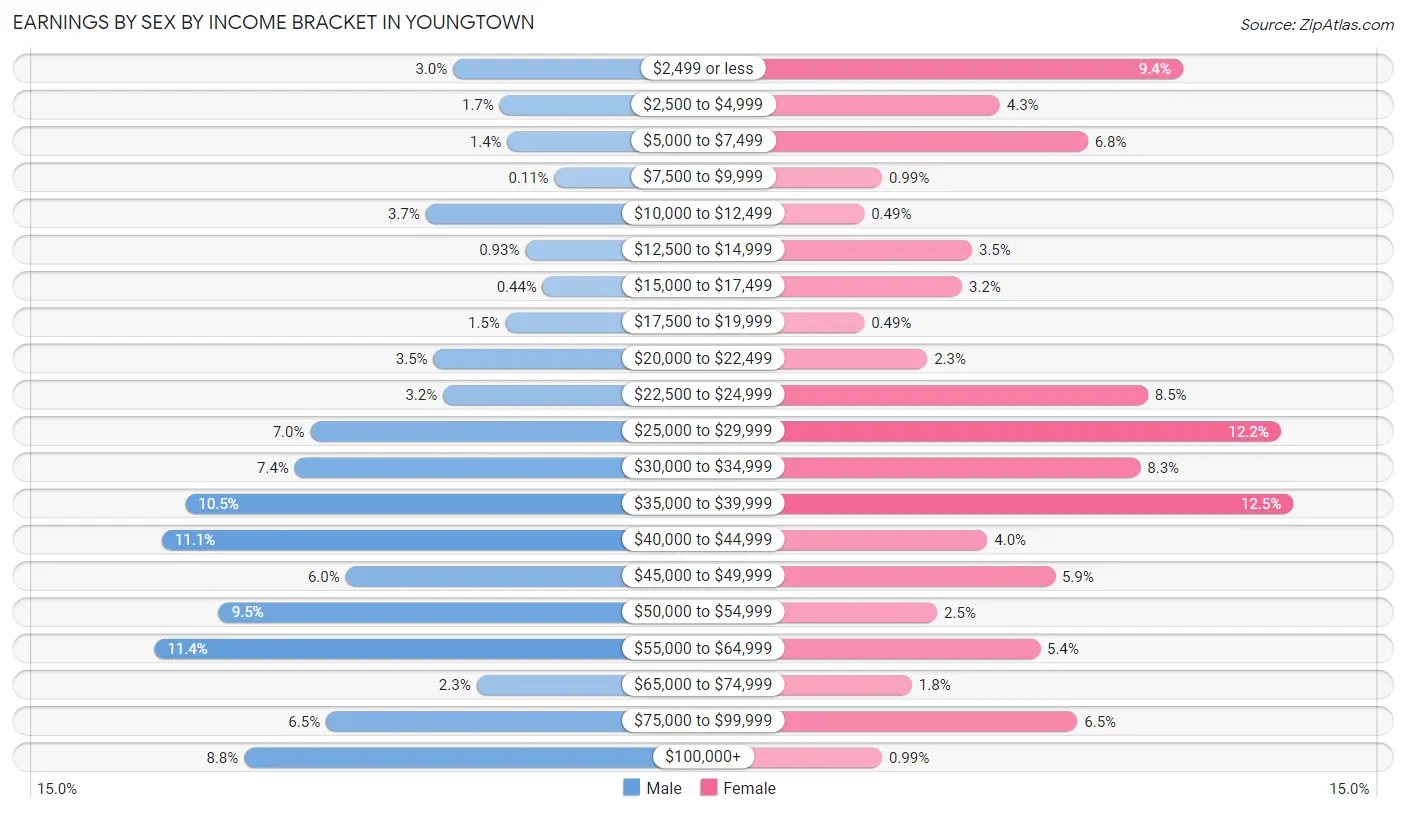
Earnings by Sex by Income Bracket in Youngtown
The most common earnings brackets in Youngtown are $55,000 to $64,999 for men (207 | 11.4%) and $35,000 to $39,999 for women (178 | 12.5%).
| Income | Male | Female |
| $2,499 or less | 54 (3.0%) | 134 (9.4%) |
| $2,500 to $4,999 | 30 (1.7%) | 61 (4.3%) |
| $5,000 to $7,499 | 26 (1.4%) | 96 (6.8%) |
| $7,500 to $9,999 | 2 (0.1%) | 14 (1.0%) |
| $10,000 to $12,499 | 68 (3.7%) | 7 (0.5%) |
| $12,500 to $14,999 | 17 (0.9%) | 50 (3.5%) |
| $15,000 to $17,499 | 8 (0.4%) | 46 (3.2%) |
| $17,500 to $19,999 | 27 (1.5%) | 7 (0.5%) |
| $20,000 to $22,499 | 64 (3.5%) | 32 (2.3%) |
| $22,500 to $24,999 | 59 (3.2%) | 120 (8.5%) |
| $25,000 to $29,999 | 127 (7.0%) | 173 (12.2%) |
| $30,000 to $34,999 | 135 (7.4%) | 117 (8.3%) |
| $35,000 to $39,999 | 191 (10.5%) | 178 (12.5%) |
| $40,000 to $44,999 | 203 (11.1%) | 56 (4.0%) |
| $45,000 to $49,999 | 109 (6.0%) | 83 (5.9%) |
| $50,000 to $54,999 | 174 (9.5%) | 36 (2.5%) |
| $55,000 to $64,999 | 207 (11.4%) | 77 (5.4%) |
| $65,000 to $74,999 | 42 (2.3%) | 26 (1.8%) |
| $75,000 to $99,999 | 119 (6.5%) | 92 (6.5%) |
| $100,000+ | 161 (8.8%) | 14 (1.0%) |
| Total | 1,823 (100.0%) | 1,419 (100.0%) |
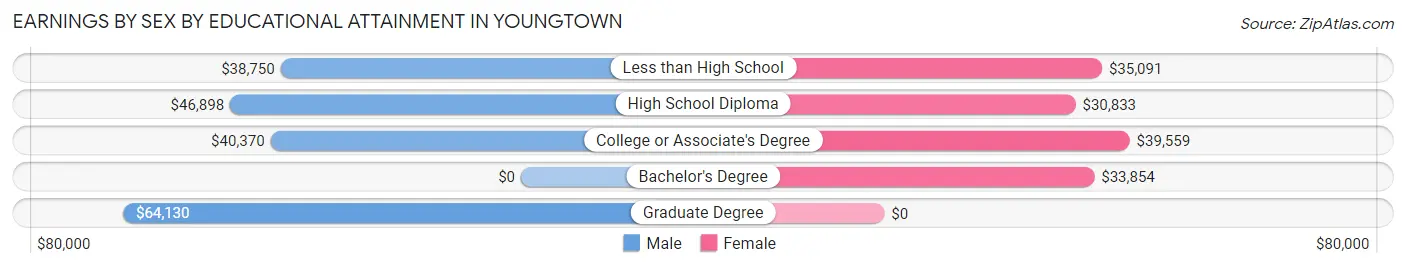
Earnings by Sex by Educational Attainment in Youngtown
Average earnings in Youngtown are $42,917 for men and $34,500 for women, a difference of 19.6%. Men with an educational attainment of graduate degree enjoy the highest average annual earnings of $64,130, while those with less than high school education earn the least with $38,750. Women with an educational attainment of college or associate's degree earn the most with the average annual earnings of $39,559, while those with high school diploma education have the smallest earnings of $30,833.
| Educational Attainment | Male Income | Female Income |
| Less than High School | $38,750 | $35,091 |
| High School Diploma | $46,898 | $30,833 |
| College or Associate's Degree | $40,370 | $39,559 |
| Bachelor's Degree | - | - |
| Graduate Degree | $64,130 | $0 |
| Total | $42,917 | $34,500 |
Family Income in Youngtown
Family Income Brackets in Youngtown
According to the Youngtown family income data, there are 391 families falling into the $50,000 to $74,999 income range, which is the most common income bracket and makes up 28.1% of all families. Conversely, the $10,000 to $14,999 income bracket is the least frequent group with only 8 families (0.6%) belonging to this category.
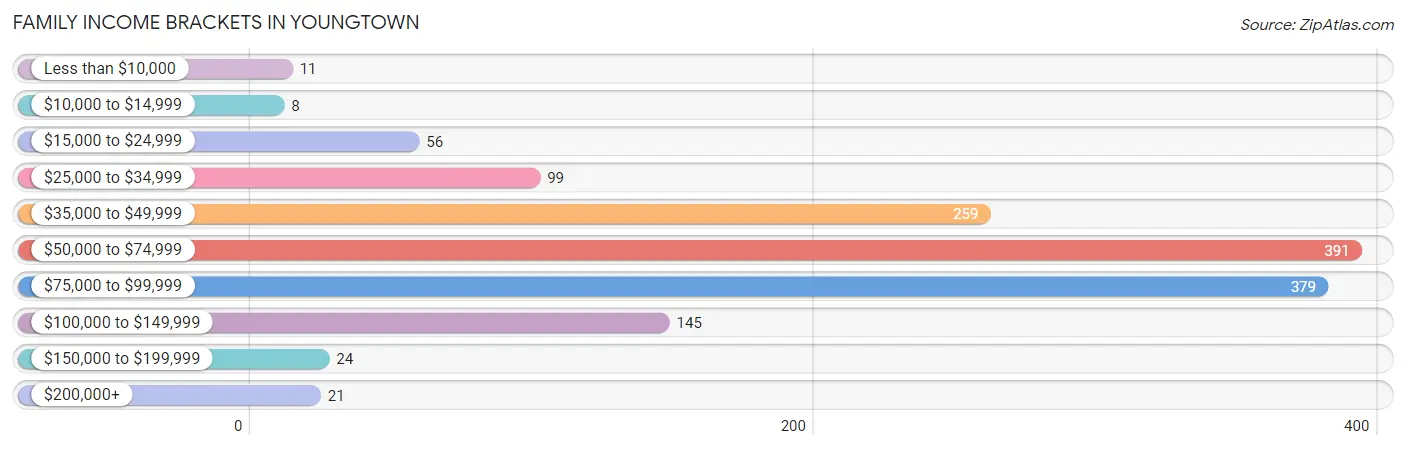
| Income Bracket | # Families | % Families |
| Less than $10,000 | 11 | 0.8% |
| $10,000 to $14,999 | 8 | 0.6% |
| $15,000 to $24,999 | 56 | 4.0% |
| $25,000 to $34,999 | 99 | 7.1% |
| $35,000 to $49,999 | 259 | 18.6% |
| $50,000 to $74,999 | 391 | 28.1% |
| $75,000 to $99,999 | 379 | 27.3% |
| $100,000 to $149,999 | 145 | 10.4% |
| $150,000 to $199,999 | 24 | 1.7% |
| $200,000+ | 21 | 1.5% |
Family Income by Famaliy Size in Youngtown
5-person families (216 | 15.5%) account for the highest median family income in Youngtown with $75,511 per family, while 2-person families (444 | 31.9%) have the highest median income of $33,472 per family member.
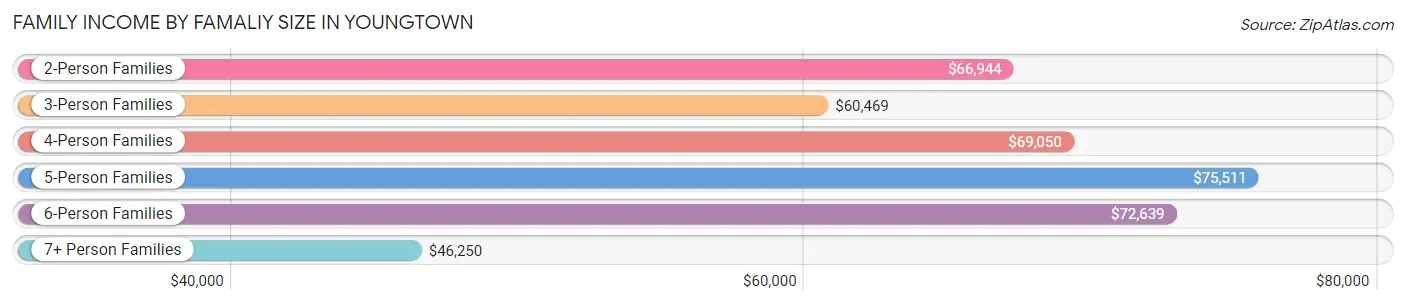
| Income Bracket | # Families | Median Income |
| 2-Person Families | 444 (31.9%) | $66,944 |
| 3-Person Families | 294 (21.1%) | $60,469 |
| 4-Person Families | 315 (22.7%) | $69,050 |
| 5-Person Families | 216 (15.5%) | $75,511 |
| 6-Person Families | 70 (5.0%) | $72,639 |
| 7+ Person Families | 51 (3.7%) | $46,250 |
| Total | 1,390 (100.0%) | $68,281 |
Family Income by Number of Earners in Youngtown
The median family income in Youngtown is $68,281, with families comprising 2 earners (600) having the highest median family income of $77,215, while families with no earners (126) have the lowest median family income of $32,125, accounting for 43.2% and 9.1% of families, respectively.
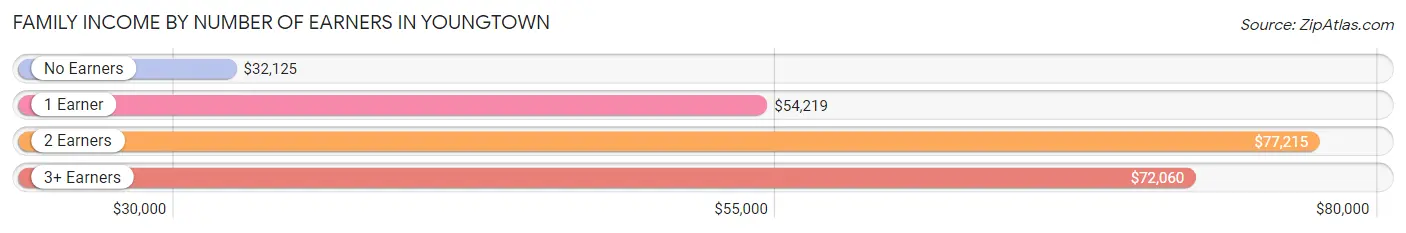
| Number of Earners | # Families | Median Income |
| No Earners | 126 (9.1%) | $32,125 |
| 1 Earner | 485 (34.9%) | $54,219 |
| 2 Earners | 600 (43.2%) | $77,215 |
| 3+ Earners | 179 (12.9%) | $72,060 |
| Total | 1,390 (100.0%) | $68,281 |
Household Income in Youngtown
Household Income Brackets in Youngtown
With 612 households falling in the category, the $75,000 to $99,999 income range is the most frequent in Youngtown, accounting for 24.5% of all households. In contrast, only 40 households (1.6%) fall into the $200,000+ income bracket, making it the least populous group.
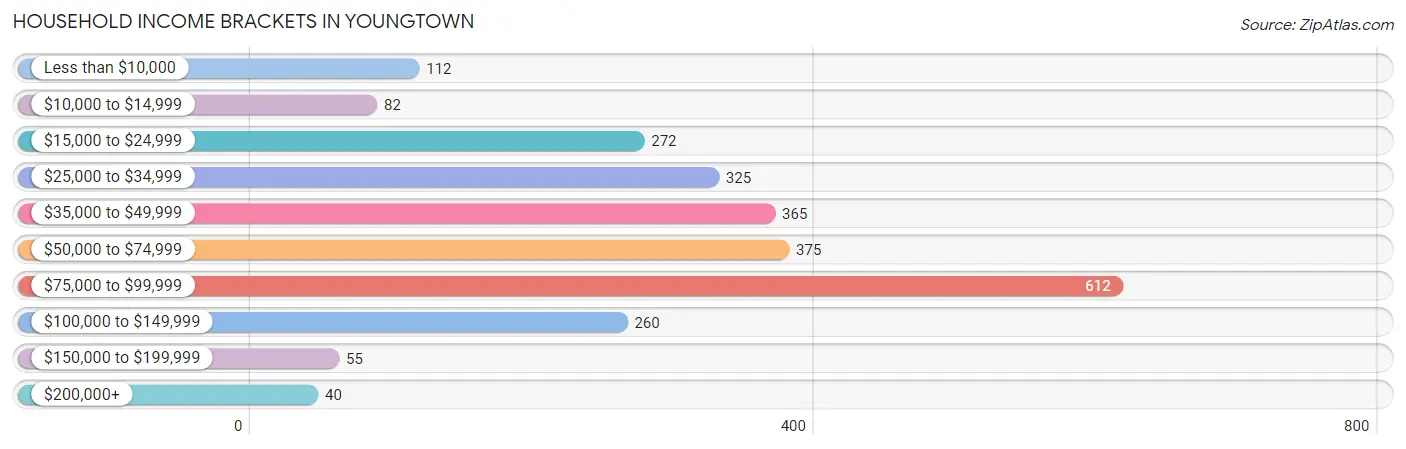
| Income Bracket | # Households | % Households |
| Less than $10,000 | 112 | 4.5% |
| $10,000 to $14,999 | 82 | 3.3% |
| $15,000 to $24,999 | 272 | 10.9% |
| $25,000 to $34,999 | 325 | 13.0% |
| $35,000 to $49,999 | 365 | 14.6% |
| $50,000 to $74,999 | 375 | 15.0% |
| $75,000 to $99,999 | 612 | 24.5% |
| $100,000 to $149,999 | 260 | 10.4% |
| $150,000 to $199,999 | 55 | 2.2% |
| $200,000+ | 40 | 1.6% |
Household Income by Householder Age in Youngtown
The median household income in Youngtown is $56,449, with the highest median household income of $73,169 found in the 45 to 64 years age bracket for the primary householder. A total of 917 households (36.7%) fall into this category. Meanwhile, the 15 to 24 years age bracket for the primary householder has the lowest median household income of $0, with 33 households (1.3%) in this group.
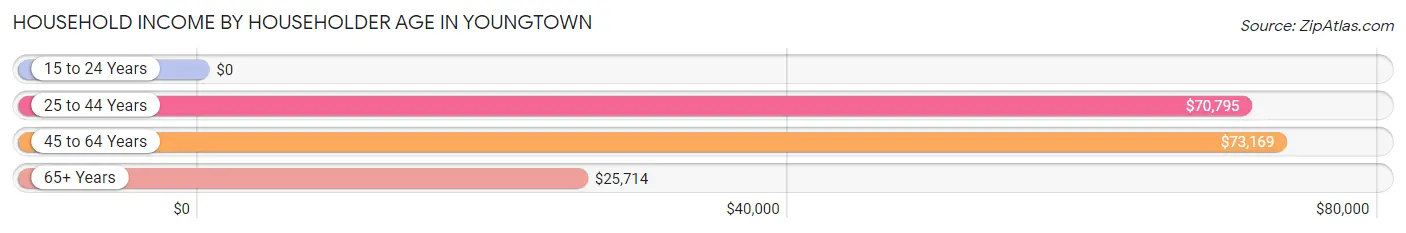
| Income Bracket | # Households | Median Income |
| 15 to 24 Years | 33 (1.3%) | $0 |
| 25 to 44 Years | 909 (36.4%) | $70,795 |
| 45 to 64 Years | 917 (36.7%) | $73,169 |
| 65+ Years | 640 (25.6%) | $25,714 |
| Total | 2,499 (100.0%) | $56,449 |
Poverty in Youngtown
Income Below Poverty by Sex and Age in Youngtown
With 9.6% poverty level for males and 12.5% for females among the residents of Youngtown, 35 to 44 year old males and 12 to 14 year old females are the most vulnerable to poverty, with 99 males (20.6%) and 13 females (41.9%) in their respective age groups living below the poverty level.
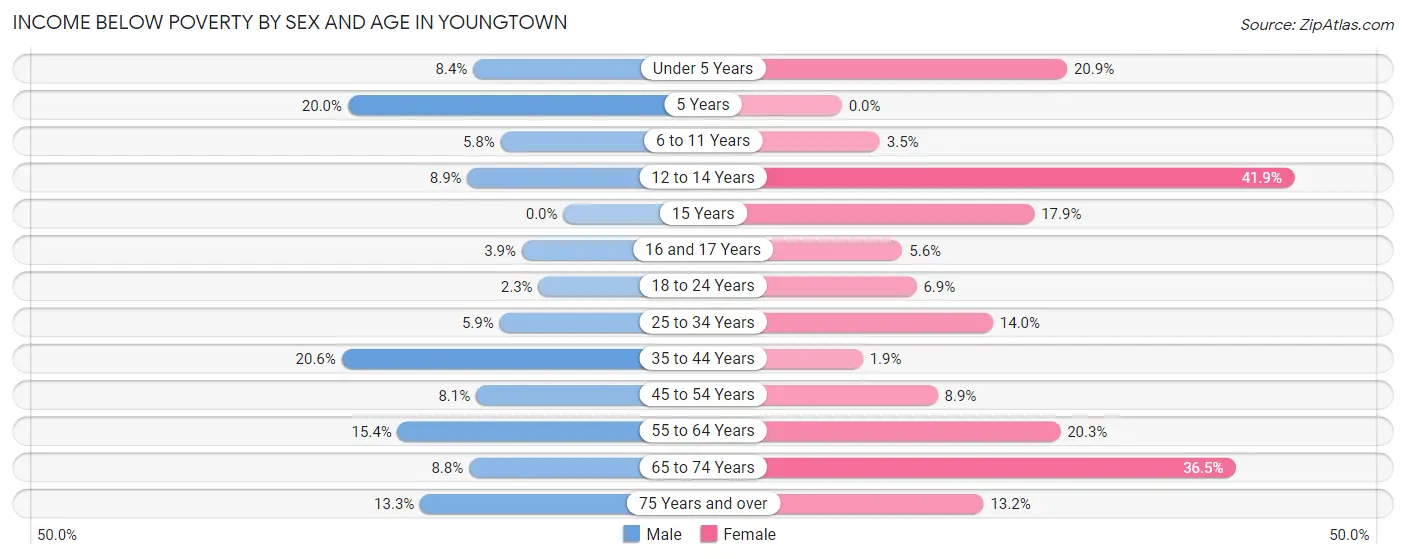
| Age Bracket | Male | Female |
| Under 5 Years | 18 (8.4%) | 14 (20.9%) |
| 5 Years | 13 (20.0%) | 0 (0.0%) |
| 6 to 11 Years | 20 (5.8%) | 9 (3.5%) |
| 12 to 14 Years | 17 (8.9%) | 13 (41.9%) |
| 15 Years | 0 (0.0%) | 5 (17.9%) |
| 16 and 17 Years | 8 (3.8%) | 14 (5.6%) |
| 18 to 24 Years | 8 (2.3%) | 14 (6.9%) |
| 25 to 34 Years | 39 (5.9%) | 61 (14.0%) |
| 35 to 44 Years | 99 (20.6%) | 8 (1.9%) |
| 45 to 54 Years | 32 (8.1%) | 36 (8.9%) |
| 55 to 64 Years | 54 (15.4%) | 76 (20.3%) |
| 65 to 74 Years | 14 (8.7%) | 92 (36.5%) |
| 75 Years and over | 21 (13.3%) | 43 (13.2%) |
| Total | 343 (9.6%) | 385 (12.5%) |
Income Above Poverty by Sex and Age in Youngtown
According to the poverty statistics in Youngtown, males aged 15 years and females aged 5 years are the age groups that are most secure financially, with 100.0% of males and 100.0% of females in these age groups living above the poverty line.
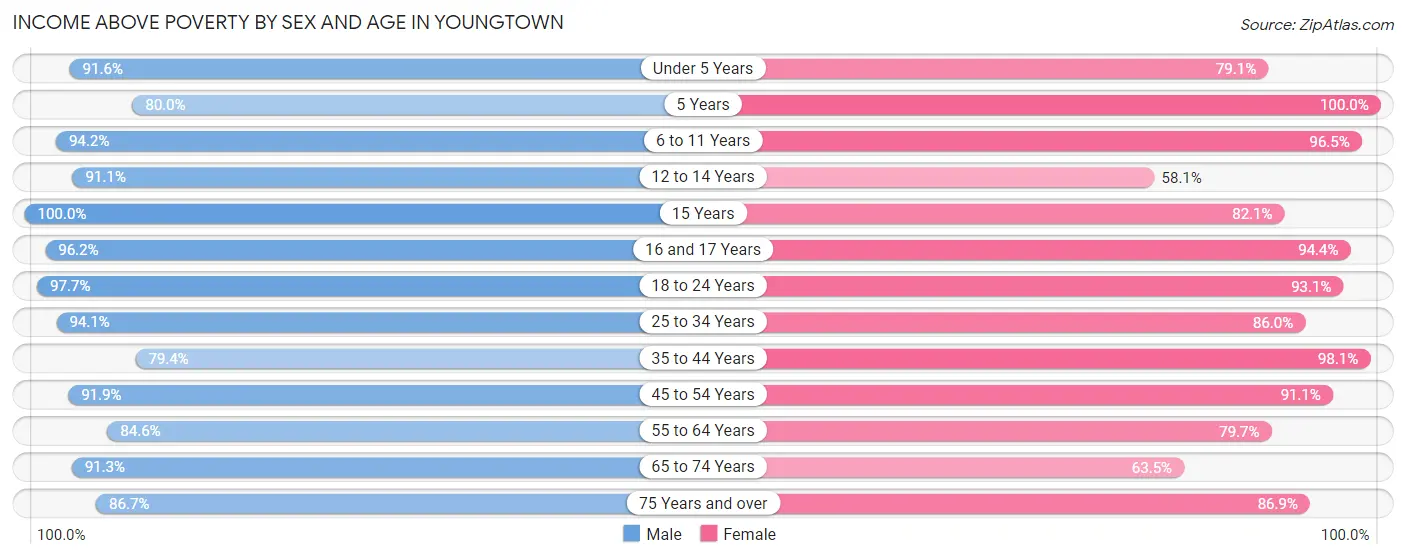
| Age Bracket | Male | Female |
| Under 5 Years | 197 (91.6%) | 53 (79.1%) |
| 5 Years | 52 (80.0%) | 52 (100.0%) |
| 6 to 11 Years | 323 (94.2%) | 246 (96.5%) |
| 12 to 14 Years | 174 (91.1%) | 18 (58.1%) |
| 15 Years | 14 (100.0%) | 23 (82.1%) |
| 16 and 17 Years | 200 (96.2%) | 235 (94.4%) |
| 18 to 24 Years | 339 (97.7%) | 188 (93.1%) |
| 25 to 34 Years | 620 (94.1%) | 374 (86.0%) |
| 35 to 44 Years | 382 (79.4%) | 404 (98.1%) |
| 45 to 54 Years | 363 (91.9%) | 369 (91.1%) |
| 55 to 64 Years | 297 (84.6%) | 299 (79.7%) |
| 65 to 74 Years | 146 (91.2%) | 160 (63.5%) |
| 75 Years and over | 137 (86.7%) | 284 (86.9%) |
| Total | 3,244 (90.4%) | 2,705 (87.5%) |
Income Below Poverty Among Married-Couple Families in Youngtown
The poverty statistics for married-couple families in Youngtown show that 5.6% or 48 of the total 865 families live below the poverty line. Families with 5 or more children have the highest poverty rate of 50.0%, comprising of 13 families. On the other hand, families with 3 or 4 children have the lowest poverty rate of 0.0%, which includes 0 families.
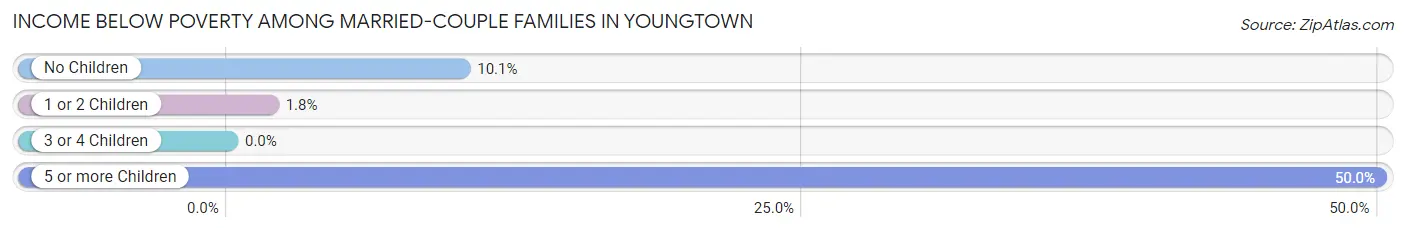
| Children | Above Poverty | Below Poverty |
| No Children | 240 (89.9%) | 27 (10.1%) |
| 1 or 2 Children | 443 (98.2%) | 8 (1.8%) |
| 3 or 4 Children | 121 (100.0%) | 0 (0.0%) |
| 5 or more Children | 13 (50.0%) | 13 (50.0%) |
| Total | 817 (94.5%) | 48 (5.6%) |
Income Below Poverty Among Single-Parent Households in Youngtown
According to the poverty data in Youngtown, 6.9% or 18 single-father households and 4.9% or 13 single-mother households are living below the poverty line. Among single-father households, those with no children have the highest poverty rate, with 9 households (7.6%) experiencing poverty. Likewise, among single-mother households, those with no children have the highest poverty rate, with 9 households (9.1%) falling below the poverty line.
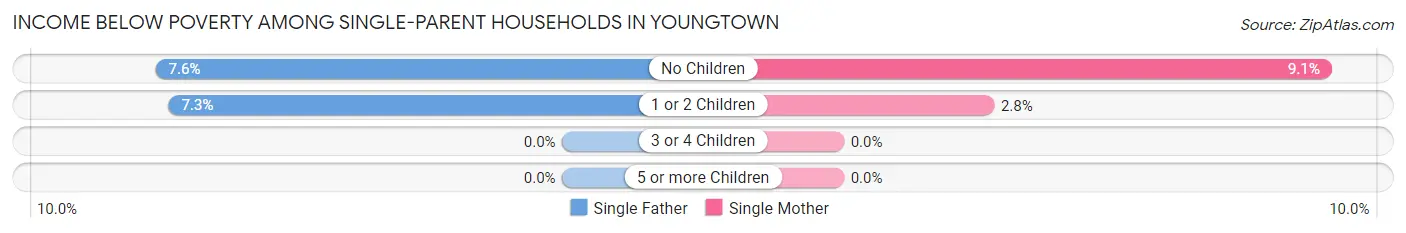
| Children | Single Father | Single Mother |
| No Children | 9 (7.6%) | 9 (9.1%) |
| 1 or 2 Children | 9 (7.3%) | 4 (2.8%) |
| 3 or 4 Children | 0 (0.0%) | 0 (0.0%) |
| 5 or more Children | 0 (0.0%) | 0 (0.0%) |
| Total | 18 (6.9%) | 13 (4.9%) |
Income Below Poverty Among Married-Couple vs Single-Parent Households in Youngtown
The poverty data for Youngtown shows that 48 of the married-couple family households (5.6%) and 31 of the single-parent households (5.9%) are living below the poverty level. Within the married-couple family households, those with 5 or more children have the highest poverty rate, with 13 households (50.0%) falling below the poverty line. Among the single-parent households, those with no children have the highest poverty rate, with 18 household (8.3%) living below poverty.
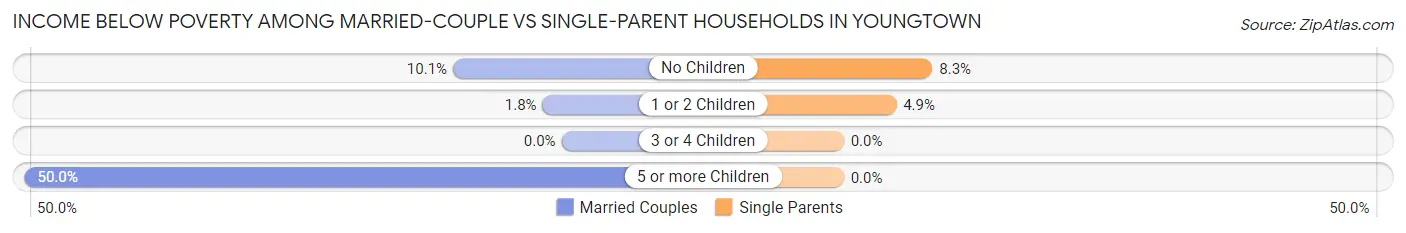
| Children | Married-Couple Families | Single-Parent Households |
| No Children | 27 (10.1%) | 18 (8.3%) |
| 1 or 2 Children | 8 (1.8%) | 13 (4.9%) |
| 3 or 4 Children | 0 (0.0%) | 0 (0.0%) |
| 5 or more Children | 13 (50.0%) | 0 (0.0%) |
| Total | 48 (5.6%) | 31 (5.9%) |
Race in Youngtown
The most populous races in Youngtown are White / Caucasian (4,602 | 65.9%), Hispanic or Latino (2,945 | 42.2%), and Two or more Races (1,209 | 17.3%).
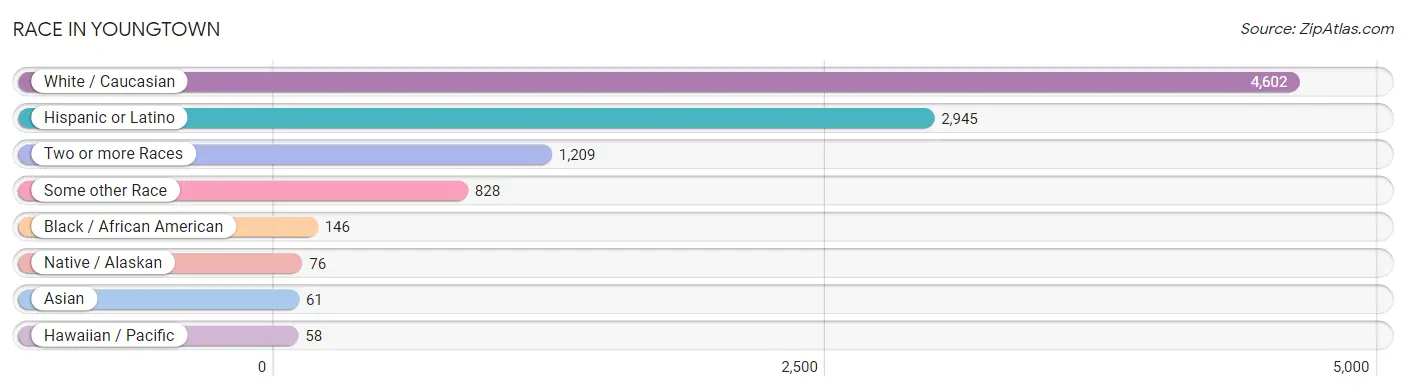
| Race | # Population | % Population |
| Asian | 61 | 0.9% |
| Black / African American | 146 | 2.1% |
| Hawaiian / Pacific | 58 | 0.8% |
| Hispanic or Latino | 2,945 | 42.2% |
| Native / Alaskan | 76 | 1.1% |
| White / Caucasian | 4,602 | 65.9% |
| Two or more Races | 1,209 | 17.3% |
| Some other Race | 828 | 11.9% |
| Total | 6,980 | 100.0% |
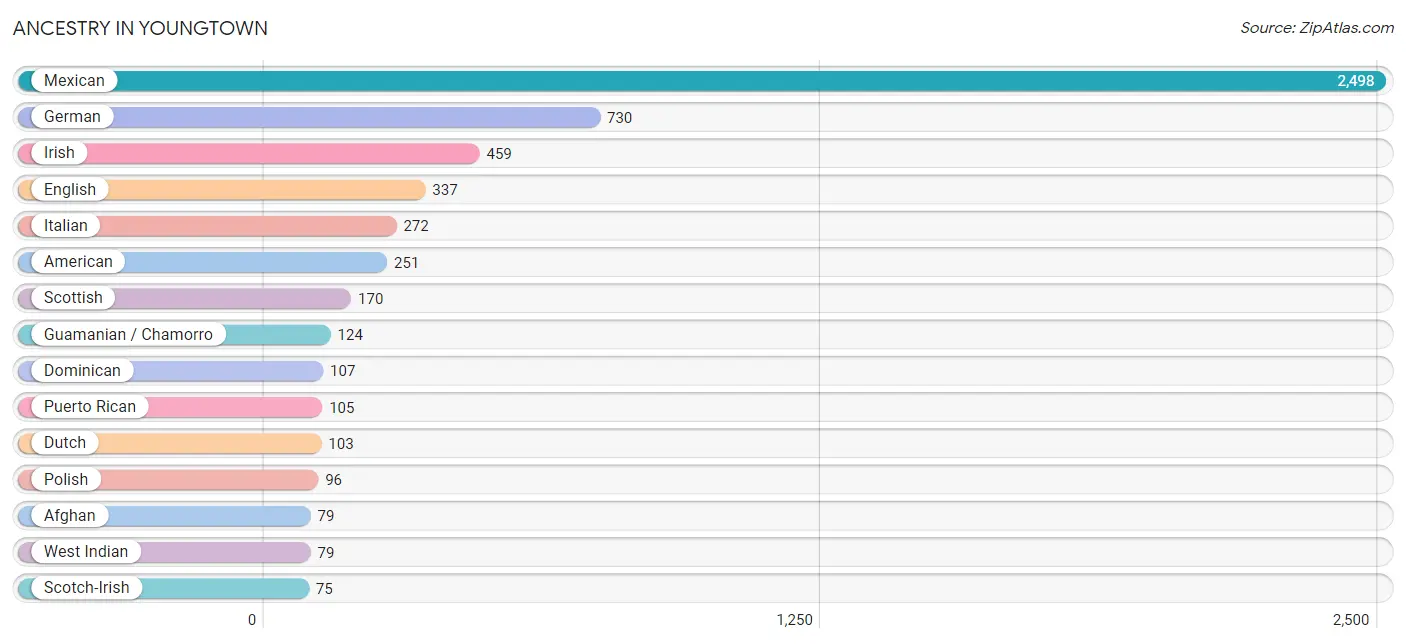
Ancestry in Youngtown
The most populous ancestries reported in Youngtown are Mexican (2,498 | 35.8%), German (730 | 10.5%), Irish (459 | 6.6%), English (337 | 4.8%), and Italian (272 | 3.9%), together accounting for 61.6% of all Youngtown residents.
| Ancestry | # Population | % Population |
| Afghan | 79 | 1.1% |
| African | 33 | 0.5% |
| American | 251 | 3.6% |
| Apache | 11 | 0.2% |
| Arab | 22 | 0.3% |
| Armenian | 9 | 0.1% |
| Austrian | 44 | 0.6% |
| Belgian | 6 | 0.1% |
| British | 7 | 0.1% |
| Burmese | 6 | 0.1% |
| Central American | 58 | 0.8% |
| Costa Rican | 53 | 0.8% |
| Croatian | 7 | 0.1% |
| Czech | 50 | 0.7% |
| Czechoslovakian | 24 | 0.3% |
| Danish | 19 | 0.3% |
| Dominican | 107 | 1.5% |
| Dutch | 103 | 1.5% |
| English | 337 | 4.8% |
| European | 28 | 0.4% |
| French | 67 | 1.0% |
| German | 730 | 10.5% |
| Ghanaian | 23 | 0.3% |
| Guamanian / Chamorro | 124 | 1.8% |
| Guatemalan | 5 | 0.1% |
| Hopi | 46 | 0.7% |
| Indian (Asian) | 73 | 1.1% |
| Irish | 459 | 6.6% |
| Italian | 272 | 3.9% |
| Korean | 42 | 0.6% |
| Lebanese | 22 | 0.3% |
| Lithuanian | 6 | 0.1% |
| Mexican | 2,498 | 35.8% |
| Navajo | 19 | 0.3% |
| Nigerian | 23 | 0.3% |
| Norwegian | 48 | 0.7% |
| Peruvian | 19 | 0.3% |
| Polish | 96 | 1.4% |
| Portuguese | 37 | 0.5% |
| Puerto Rican | 105 | 1.5% |
| Scotch-Irish | 75 | 1.1% |
| Scottish | 170 | 2.4% |
| Slovene | 8 | 0.1% |
| South American | 19 | 0.3% |
| Spaniard | 43 | 0.6% |
| Spanish | 7 | 0.1% |
| Sri Lankan | 28 | 0.4% |
| Subsaharan African | 56 | 0.8% |
| Swedish | 24 | 0.3% |
| Thai | 5 | 0.1% |
| Welsh | 46 | 0.7% |
| West Indian | 79 | 1.1% | View All 52 Rows |
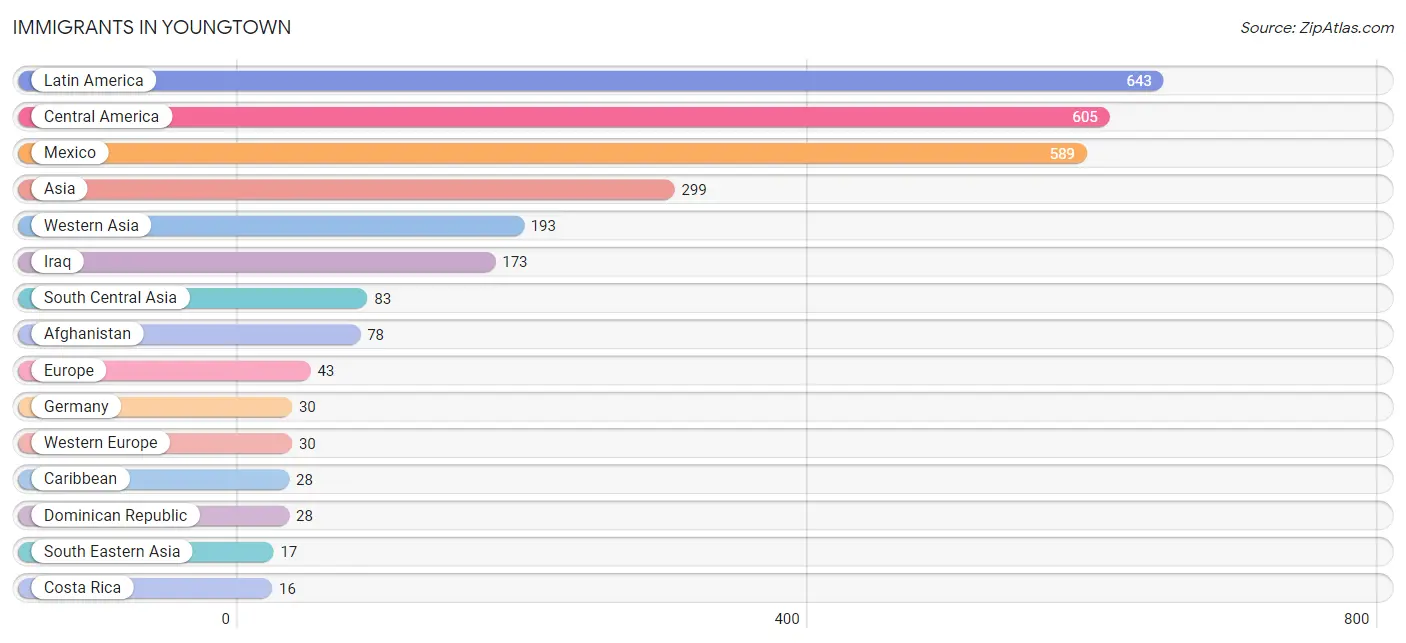
Immigrants in Youngtown
The most numerous immigrant groups reported in Youngtown came from Latin America (643 | 9.2%), Central America (605 | 8.7%), Mexico (589 | 8.4%), Asia (299 | 4.3%), and Western Asia (193 | 2.8%), together accounting for 33.4% of all Youngtown residents.
| Immigration Origin | # Population | % Population |
| Afghanistan | 78 | 1.1% |
| Asia | 299 | 4.3% |
| Australia | 10 | 0.1% |
| Bosnia and Herzegovina | 7 | 0.1% |
| Caribbean | 28 | 0.4% |
| Central America | 605 | 8.7% |
| Costa Rica | 16 | 0.2% |
| Dominican Republic | 28 | 0.4% |
| Eastern Asia | 6 | 0.1% |
| Eastern Europe | 7 | 0.1% |
| England | 6 | 0.1% |
| Europe | 43 | 0.6% |
| Germany | 30 | 0.4% |
| India | 5 | 0.1% |
| Iraq | 173 | 2.5% |
| Jordan | 7 | 0.1% |
| Korea | 6 | 0.1% |
| Latin America | 643 | 9.2% |
| Lebanon | 13 | 0.2% |
| Mexico | 589 | 8.4% |
| Northern Europe | 6 | 0.1% |
| Oceania | 10 | 0.1% |
| Peru | 10 | 0.1% |
| Philippines | 9 | 0.1% |
| South America | 10 | 0.1% |
| South Central Asia | 83 | 1.2% |
| South Eastern Asia | 17 | 0.2% |
| Vietnam | 8 | 0.1% |
| Western Asia | 193 | 2.8% |
| Western Europe | 30 | 0.4% | View All 30 Rows |
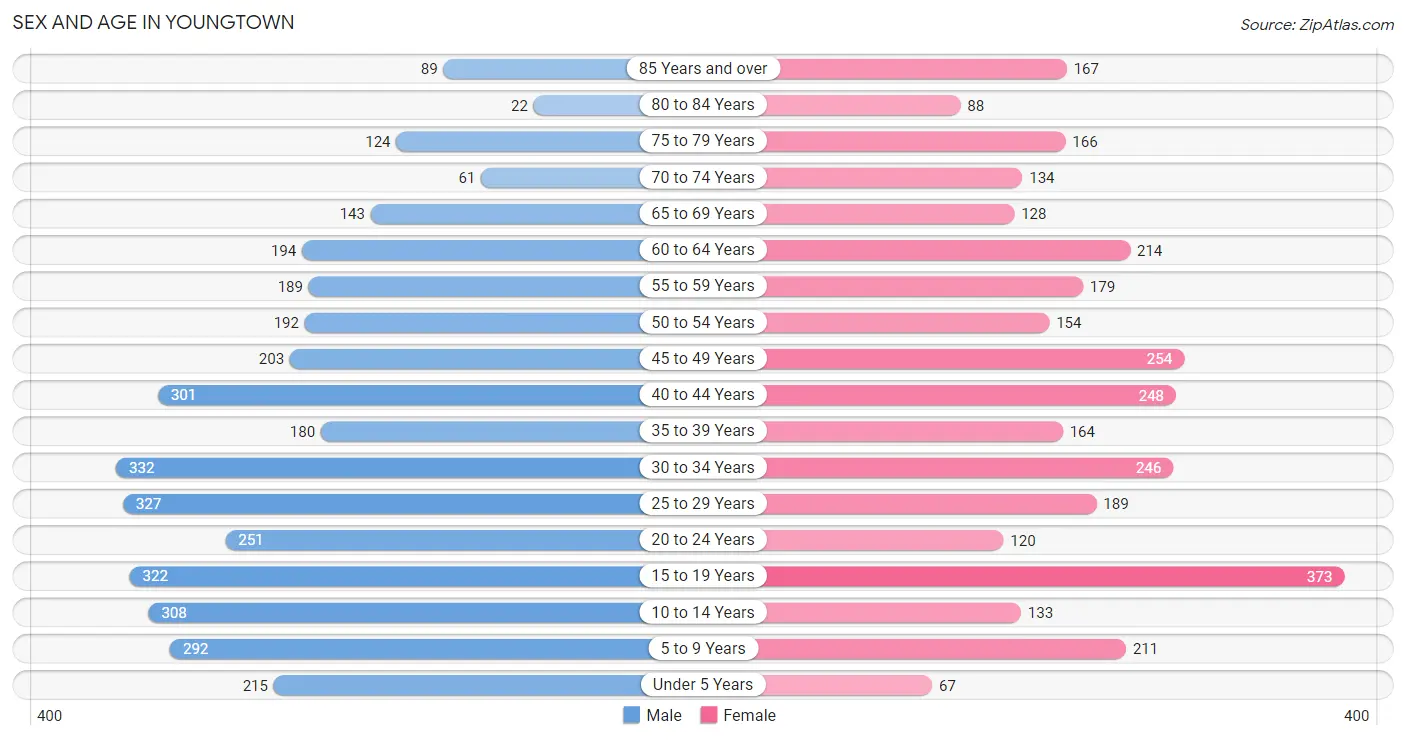
Sex and Age in Youngtown
Sex and Age in Youngtown
The most populous age groups in Youngtown are 30 to 34 Years (332 | 8.9%) for men and 15 to 19 Years (373 | 11.5%) for women.
| Age Bracket | Male | Female |
| Under 5 Years | 215 (5.7%) | 67 (2.1%) |
| 5 to 9 Years | 292 (7.8%) | 211 (6.5%) |
| 10 to 14 Years | 308 (8.2%) | 133 (4.1%) |
| 15 to 19 Years | 322 (8.6%) | 373 (11.5%) |
| 20 to 24 Years | 251 (6.7%) | 120 (3.7%) |
| 25 to 29 Years | 327 (8.7%) | 189 (5.8%) |
| 30 to 34 Years | 332 (8.9%) | 246 (7.6%) |
| 35 to 39 Years | 180 (4.8%) | 164 (5.1%) |
| 40 to 44 Years | 301 (8.0%) | 248 (7.7%) |
| 45 to 49 Years | 203 (5.4%) | 254 (7.9%) |
| 50 to 54 Years | 192 (5.1%) | 154 (4.8%) |
| 55 to 59 Years | 189 (5.1%) | 179 (5.5%) |
| 60 to 64 Years | 194 (5.2%) | 214 (6.6%) |
| 65 to 69 Years | 143 (3.8%) | 128 (4.0%) |
| 70 to 74 Years | 61 (1.6%) | 134 (4.1%) |
| 75 to 79 Years | 124 (3.3%) | 166 (5.1%) |
| 80 to 84 Years | 22 (0.6%) | 88 (2.7%) |
| 85 Years and over | 89 (2.4%) | 167 (5.2%) |
| Total | 3,745 (100.0%) | 3,235 (100.0%) |
Families and Households in Youngtown
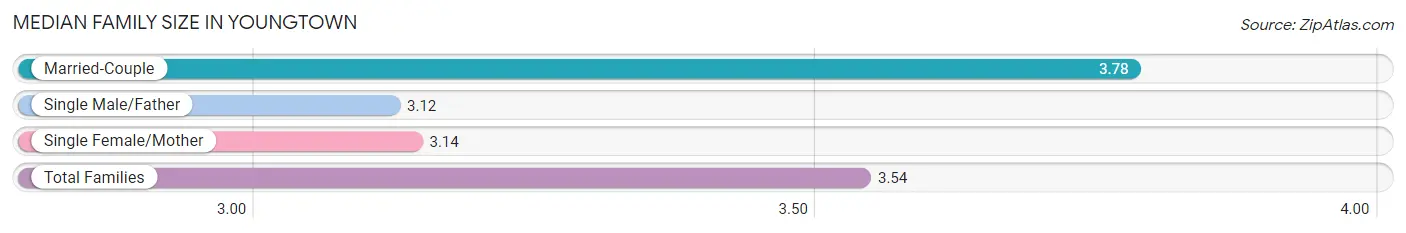
Median Family Size in Youngtown
The median family size in Youngtown is 3.54 persons per family, with married-couple families (865 | 62.2%) accounting for the largest median family size of 3.78 persons per family. On the other hand, single male/father families (260 | 18.7%) represent the smallest median family size with 3.12 persons per family.
| Family Type | # Families | Family Size |
| Married-Couple | 865 (62.2%) | 3.78 |
| Single Male/Father | 260 (18.7%) | 3.12 |
| Single Female/Mother | 265 (19.1%) | 3.14 |
| Total Families | 1,390 (100.0%) | 3.54 |
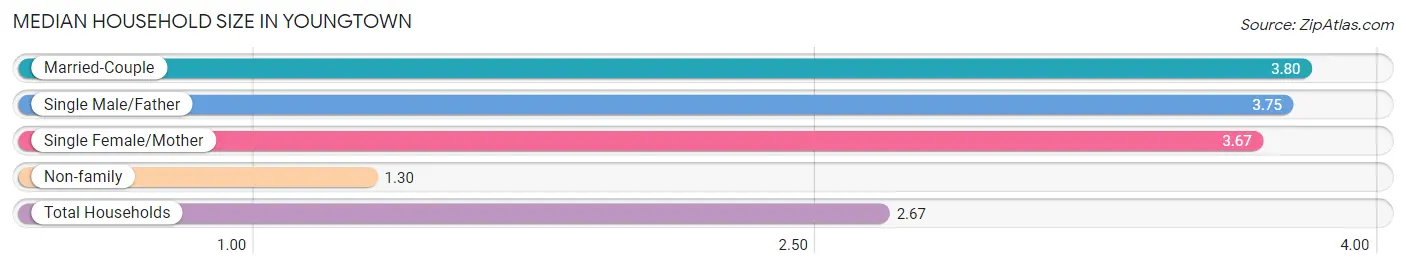
Median Household Size in Youngtown
The median household size in Youngtown is 2.67 persons per household, with married-couple households (865 | 34.6%) accounting for the largest median household size of 3.8 persons per household. non-family households (1,109 | 44.4%) represent the smallest median household size with 1.30 persons per household.
| Household Type | # Households | Household Size |
| Married-Couple | 865 (34.6%) | 3.80 |
| Single Male/Father | 260 (10.4%) | 3.75 |
| Single Female/Mother | 265 (10.6%) | 3.67 |
| Non-family | 1,109 (44.4%) | 1.30 |
| Total Households | 2,499 (100.0%) | 2.67 |
Household Size by Marriage Status in Youngtown
Out of a total of 2,499 households in Youngtown, 1,390 (55.6%) are family households, while 1,109 (44.4%) are nonfamily households. The most numerous type of family households are 2-person households, comprising 351, and the most common type of nonfamily households are 1-person households, comprising 939.
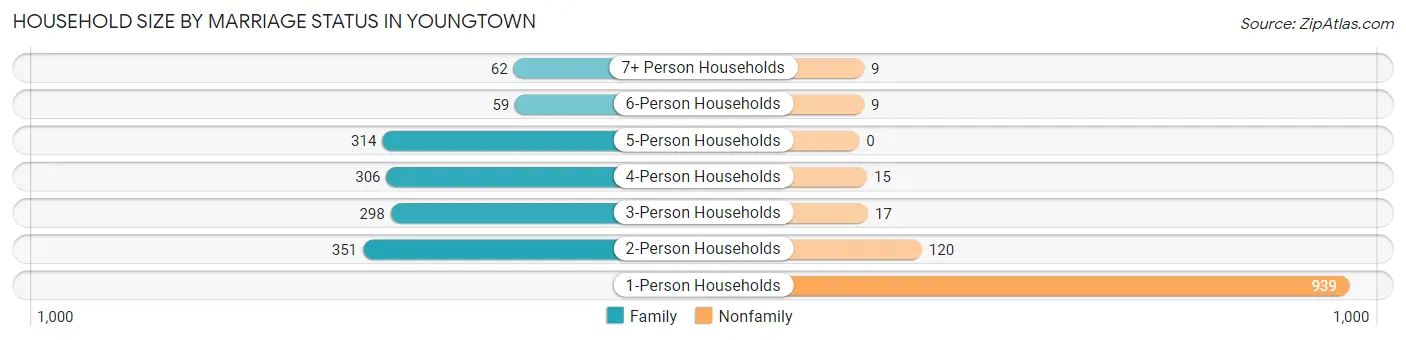
| Household Size | Family Households | Nonfamily Households |
| 1-Person Households | - | 939 (37.6%) |
| 2-Person Households | 351 (14.1%) | 120 (4.8%) |
| 3-Person Households | 298 (11.9%) | 17 (0.7%) |
| 4-Person Households | 306 (12.2%) | 15 (0.6%) |
| 5-Person Households | 314 (12.6%) | 0 (0.0%) |
| 6-Person Households | 59 (2.4%) | 9 (0.4%) |
| 7+ Person Households | 62 (2.5%) | 9 (0.4%) |
| Total | 1,390 (55.6%) | 1,109 (44.4%) |
Female Fertility in Youngtown
Fertility by Age in Youngtown
Average fertility rate in Youngtown is 51.0 births per 1,000 women. Women in the age bracket of 20 to 34 years have the highest fertility rate with 151.0 births per 1,000 women. Women in the age bracket of 20 to 34 years acount for 100.0% of all women with births.
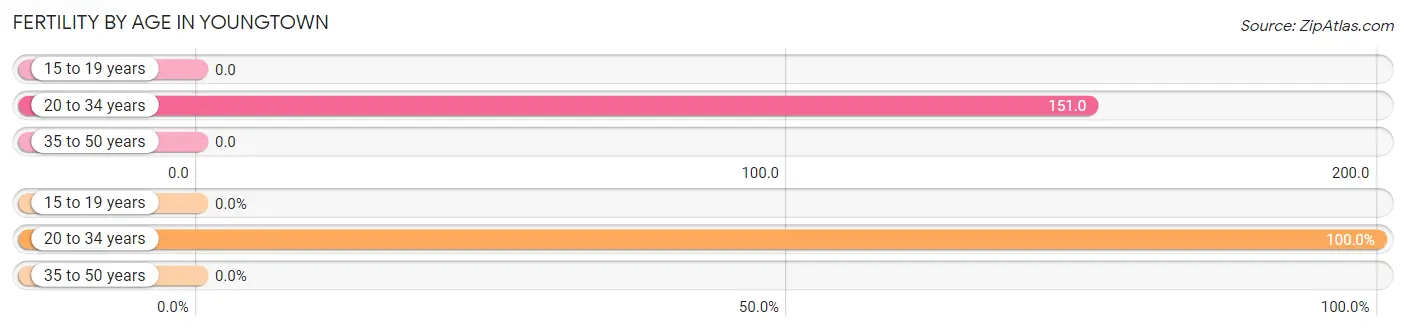
| Age Bracket | Women with Births | Births / 1,000 Women |
| 15 to 19 years | 0 (0.0%) | 0.0 |
| 20 to 34 years | 84 (100.0%) | 151.0 |
| 35 to 50 years | 0 (0.0%) | 0.0 |
| Total | 84 (100.0%) | 51.0 |
Fertility by Age by Marriage Status in Youngtown
91.7% of women with births (84) in Youngtown are married. The highest percentage of unmarried women with births falls into 20 to 34 years age bracket with 8.3% of them unmarried at the time of birth, while the lowest percentage of unmarried women with births belong to 20 to 34 years age bracket with 8.3% of them unmarried.
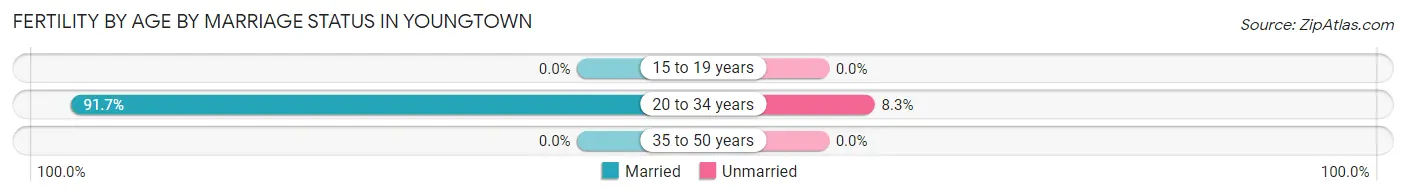
| Age Bracket | Married | Unmarried |
| 15 to 19 years | 0 (0.0%) | 0 (0.0%) |
| 20 to 34 years | 77 (91.7%) | 7 (8.3%) |
| 35 to 50 years | 0 (0.0%) | 0 (0.0%) |
| Total | 77 (91.7%) | 7 (8.3%) |
Fertility by Education in Youngtown
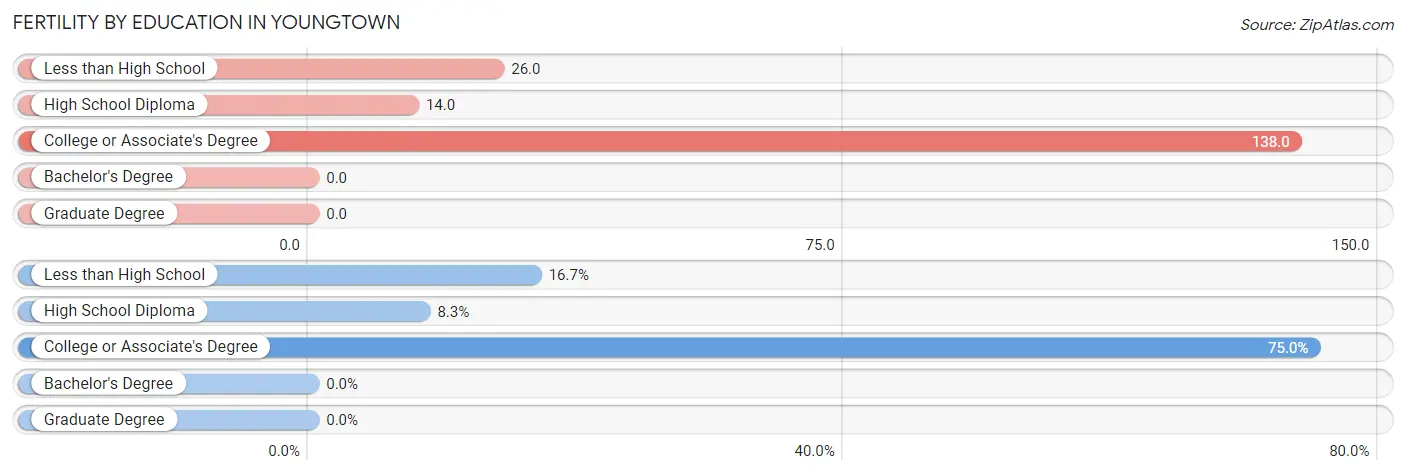
| Educational Attainment | Women with Births | Births / 1,000 Women |
| Less than High School | 14 (16.7%) | 26.0 |
| High School Diploma | 7 (8.3%) | 14.0 |
| College or Associate's Degree | 63 (75.0%) | 138.0 |
| Bachelor's Degree | 0 (0.0%) | 0.0 |
| Graduate Degree | 0 (0.0%) | 0.0 |
| Total | 84 (100.0%) | 51.0 |
Fertility by Education by Marriage Status in Youngtown
8.3% of women with births in Youngtown are unmarried. Women with the educational attainment of less than high school are most likely to be married with 100.0% of them married at childbirth, while women with the educational attainment of high school diploma are least likely to be married with 100.0% of them unmarried at childbirth.
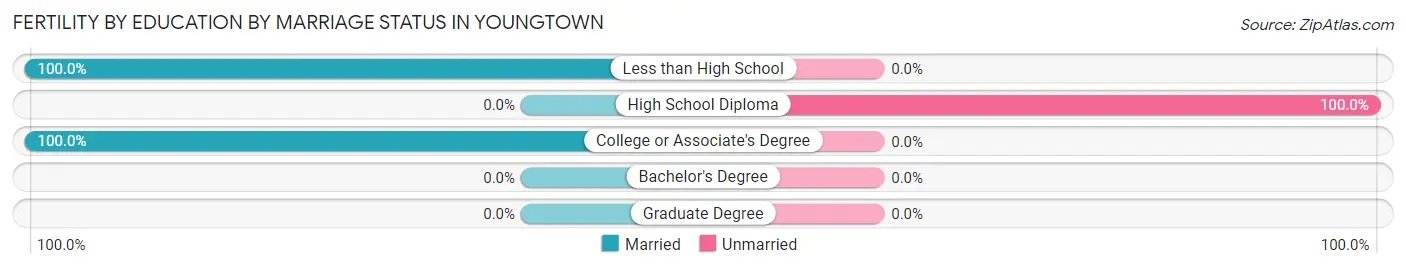
| Educational Attainment | Married | Unmarried |
| Less than High School | 14 (100.0%) | 0 (0.0%) |
| High School Diploma | 0 (0.0%) | 7 (100.0%) |
| College or Associate's Degree | 63 (100.0%) | 0 (0.0%) |
| Bachelor's Degree | 0 (0.0%) | 0 (0.0%) |
| Graduate Degree | 0 (0.0%) | 0 (0.0%) |
| Total | 77 (91.7%) | 7 (8.3%) |
Employment Characteristics in Youngtown
Employment by Class of Employer in Youngtown
Among the 3,012 employed individuals in Youngtown, private company employees (2,192 | 72.8%), not-for-profit organizations (315 | 10.5%), and local government employees (218 | 7.2%) make up the most common classes of employment.
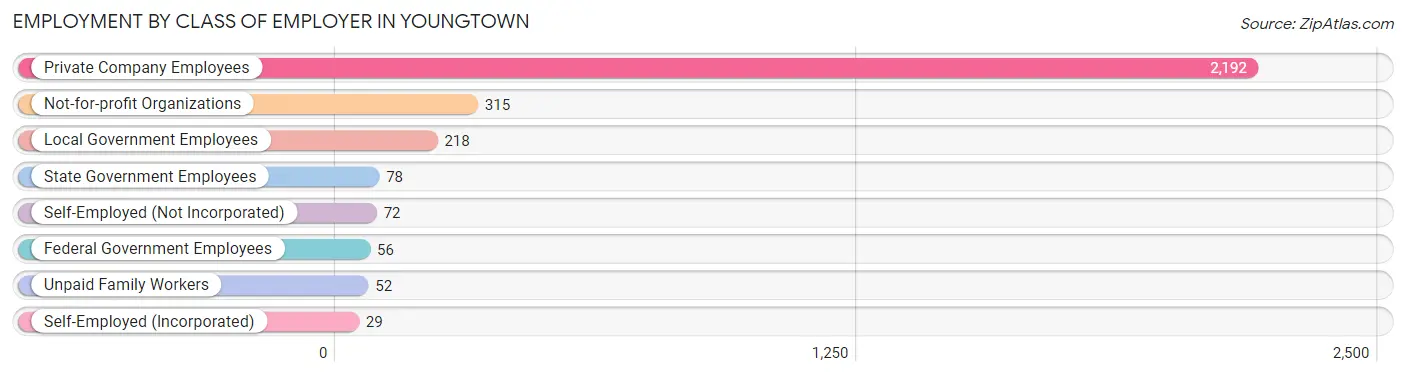
| Employer Class | # Employees | % Employees |
| Private Company Employees | 2,192 | 72.8% |
| Self-Employed (Incorporated) | 29 | 1.0% |
| Self-Employed (Not Incorporated) | 72 | 2.4% |
| Not-for-profit Organizations | 315 | 10.5% |
| Local Government Employees | 218 | 7.2% |
| State Government Employees | 78 | 2.6% |
| Federal Government Employees | 56 | 1.9% |
| Unpaid Family Workers | 52 | 1.7% |
| Total | 3,012 | 100.0% |
Employment Status by Age in Youngtown
According to the labor force statistics for Youngtown, out of the total population over 16 years of age (5,710), 56.9% or 3,249 individuals are in the labor force, with 5.1% or 166 of them unemployed. The age group with the highest labor force participation rate is 20 to 24 years, with 87.9% or 326 individuals in the labor force. Within the labor force, the 20 to 24 years age range has the highest percentage of unemployed individuals, with 23.0% or 75 of them being unemployed.
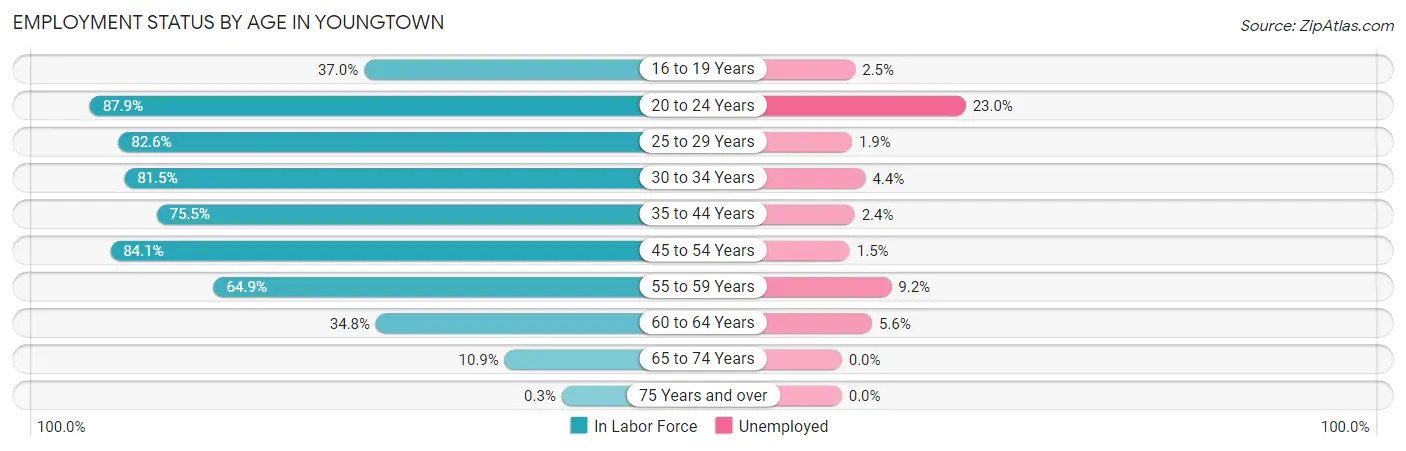
| Age Bracket | In Labor Force | Unemployed |
| 16 to 19 Years | 241 (37.0%) | 6 (2.5%) |
| 20 to 24 Years | 326 (87.9%) | 75 (23.0%) |
| 25 to 29 Years | 426 (82.6%) | 8 (1.9%) |
| 30 to 34 Years | 471 (81.5%) | 21 (4.4%) |
| 35 to 44 Years | 674 (75.5%) | 16 (2.4%) |
| 45 to 54 Years | 675 (84.1%) | 10 (1.5%) |
| 55 to 59 Years | 239 (64.9%) | 22 (9.2%) |
| 60 to 64 Years | 142 (34.8%) | 8 (5.6%) |
| 65 to 74 Years | 51 (10.9%) | 0 (0.0%) |
| 75 Years and over | 2 (0.3%) | 0 (0.0%) |
| Total | 3,249 (56.9%) | 166 (5.1%) |
Employment Status by Educational Attainment in Youngtown
According to labor force statistics for Youngtown, 73.7% of individuals (2,628) out of the total population between 25 and 64 years of age (3,566) are in the labor force, with 3.2% or 84 of them being unemployed. The group with the highest labor force participation rate are those with the educational attainment of bachelor's degree or higher, with 91.1% or 441 individuals in the labor force. Within the labor force, individuals with college / associate degree education have the highest percentage of unemployment, with 5.9% or 45 of them being unemployed.
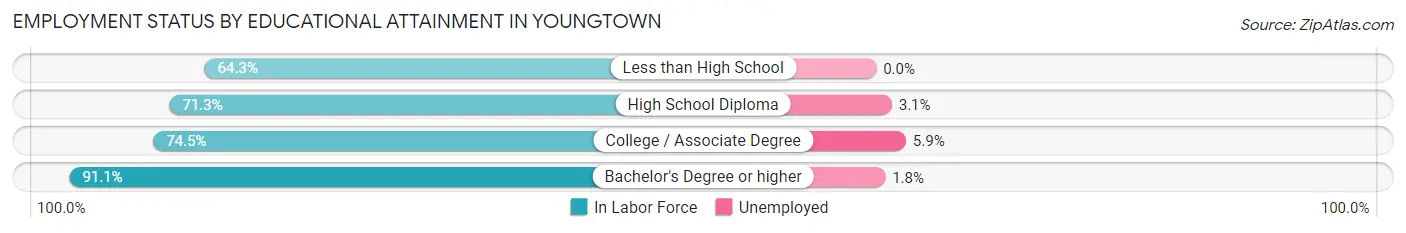
| Educational Attainment | In Labor Force | Unemployed |
| Less than High School | 403 (64.3%) | 0 (0.0%) |
| High School Diploma | 1,017 (71.3%) | 44 (3.1%) |
| College / Associate Degree | 766 (74.5%) | 61 (5.9%) |
| Bachelor's Degree or higher | 441 (91.1%) | 9 (1.8%) |
| Total | 2,628 (73.7%) | 114 (3.2%) |
Employment Occupations by Sex in Youngtown
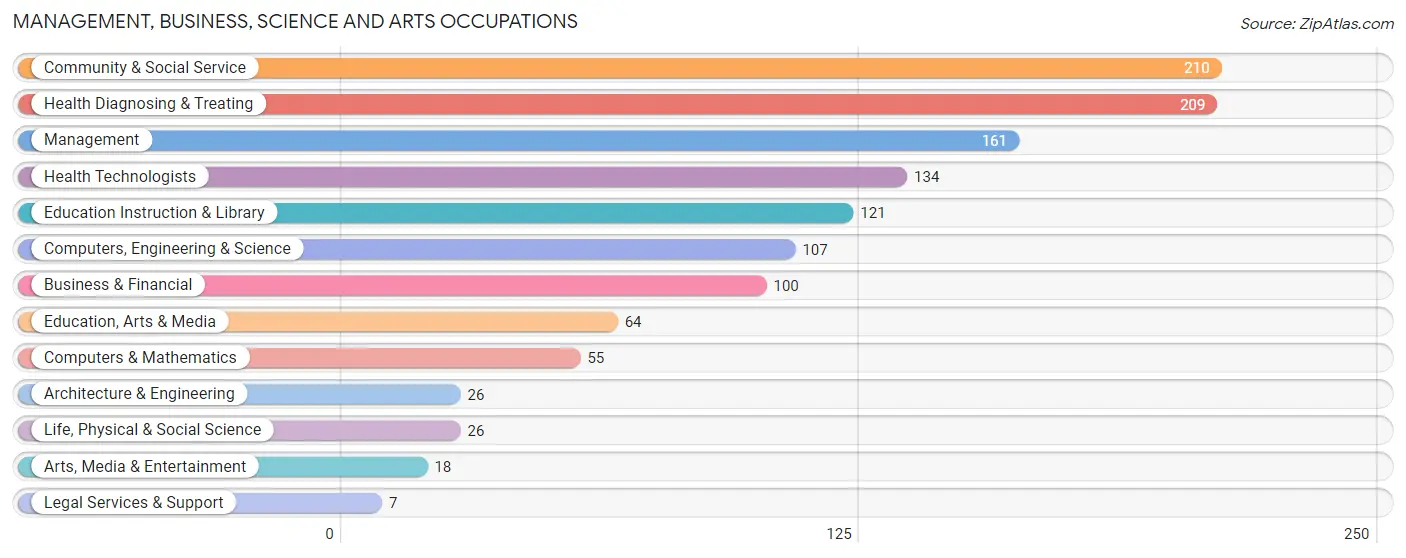
Management, Business, Science and Arts Occupations
The most common Management, Business, Science and Arts occupations in Youngtown are Community & Social Service (210 | 6.9%), Health Diagnosing & Treating (209 | 6.8%), Management (161 | 5.2%), Health Technologists (134 | 4.4%), and Education Instruction & Library (121 | 4.0%).
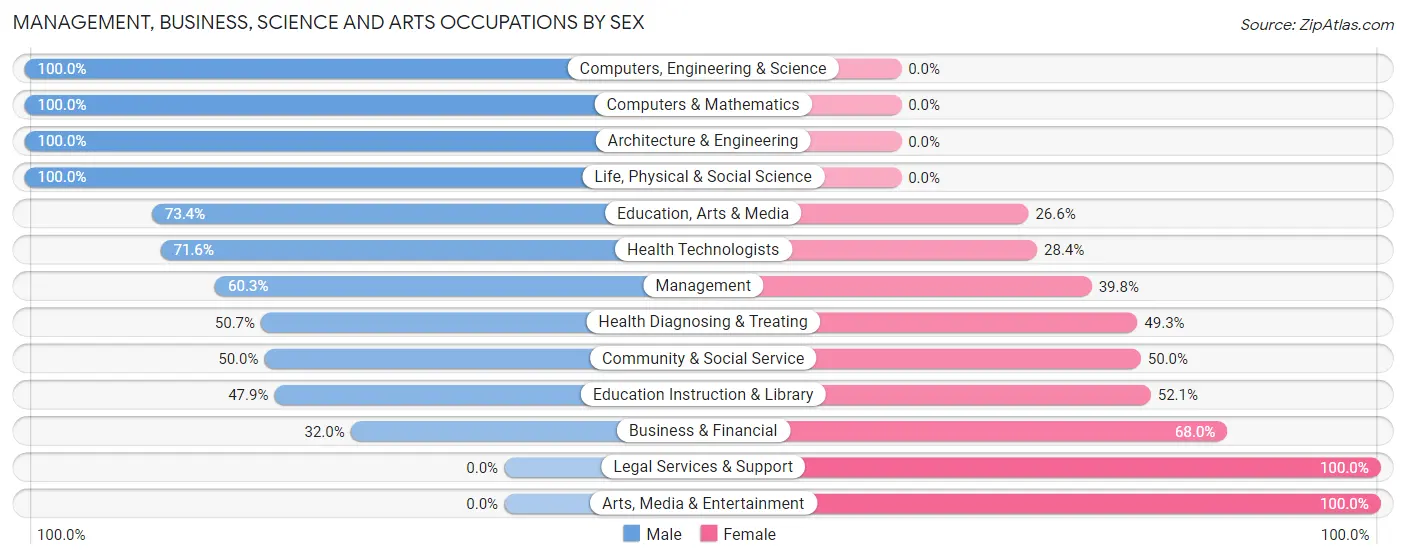
Management, Business, Science and Arts Occupations by Sex
Within the Management, Business, Science and Arts occupations in Youngtown, the most male-oriented occupations are Computers, Engineering & Science (100.0%), Computers & Mathematics (100.0%), and Architecture & Engineering (100.0%), while the most female-oriented occupations are Legal Services & Support (100.0%), Arts, Media & Entertainment (100.0%), and Business & Financial (68.0%).
| Occupation | Male | Female |
| Management | 97 (60.3%) | 64 (39.8%) |
| Business & Financial | 32 (32.0%) | 68 (68.0%) |
| Computers, Engineering & Science | 107 (100.0%) | 0 (0.0%) |
| Computers & Mathematics | 55 (100.0%) | 0 (0.0%) |
| Architecture & Engineering | 26 (100.0%) | 0 (0.0%) |
| Life, Physical & Social Science | 26 (100.0%) | 0 (0.0%) |
| Community & Social Service | 105 (50.0%) | 105 (50.0%) |
| Education, Arts & Media | 47 (73.4%) | 17 (26.6%) |
| Legal Services & Support | 0 (0.0%) | 7 (100.0%) |
| Education Instruction & Library | 58 (47.9%) | 63 (52.1%) |
| Arts, Media & Entertainment | 0 (0.0%) | 18 (100.0%) |
| Health Diagnosing & Treating | 106 (50.7%) | 103 (49.3%) |
| Health Technologists | 96 (71.6%) | 38 (28.4%) |
| Total (Category) | 447 (56.8%) | 340 (43.2%) |
| Total (Overall) | 1,759 (57.4%) | 1,305 (42.6%) |
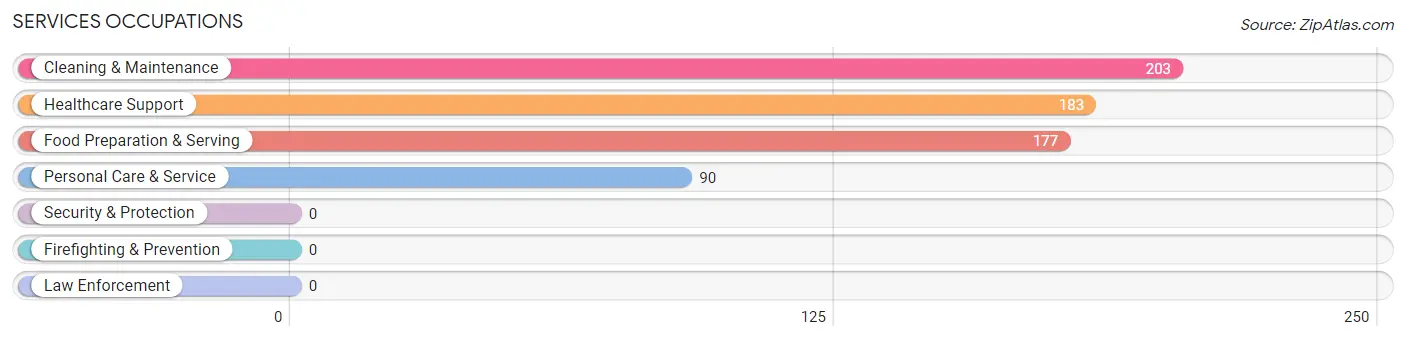
Services Occupations
The most common Services occupations in Youngtown are Cleaning & Maintenance (203 | 6.6%), Healthcare Support (183 | 6.0%), Food Preparation & Serving (177 | 5.8%), and Personal Care & Service (90 | 2.9%).
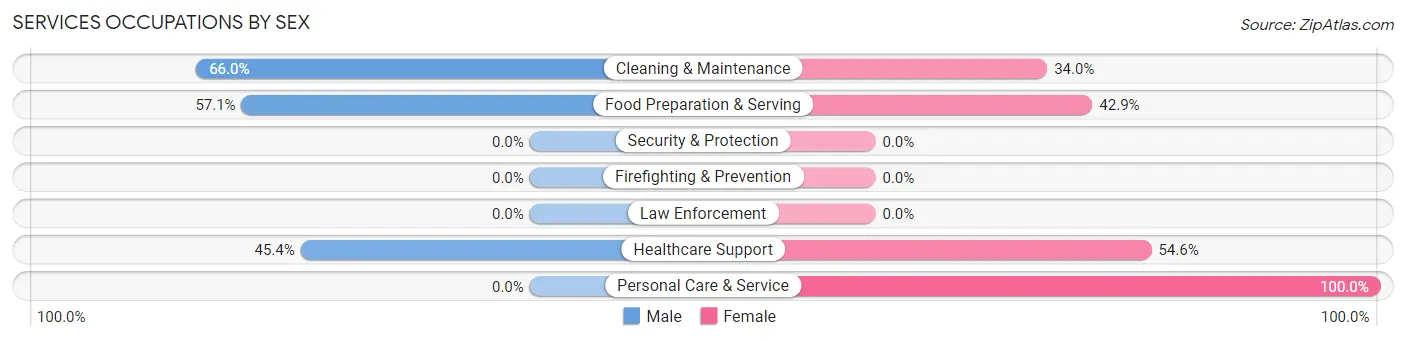
Services Occupations by Sex
Within the Services occupations in Youngtown, the most male-oriented occupations are Cleaning & Maintenance (66.0%), Food Preparation & Serving (57.1%), and Healthcare Support (45.4%), while the most female-oriented occupations are Personal Care & Service (100.0%), Healthcare Support (54.6%), and Food Preparation & Serving (42.9%).
| Occupation | Male | Female |
| Healthcare Support | 83 (45.4%) | 100 (54.6%) |
| Security & Protection | 0 (0.0%) | 0 (0.0%) |
| Firefighting & Prevention | 0 (0.0%) | 0 (0.0%) |
| Law Enforcement | 0 (0.0%) | 0 (0.0%) |
| Food Preparation & Serving | 101 (57.1%) | 76 (42.9%) |
| Cleaning & Maintenance | 134 (66.0%) | 69 (34.0%) |
| Personal Care & Service | 0 (0.0%) | 90 (100.0%) |
| Total (Category) | 318 (48.7%) | 335 (51.3%) |
| Total (Overall) | 1,759 (57.4%) | 1,305 (42.6%) |
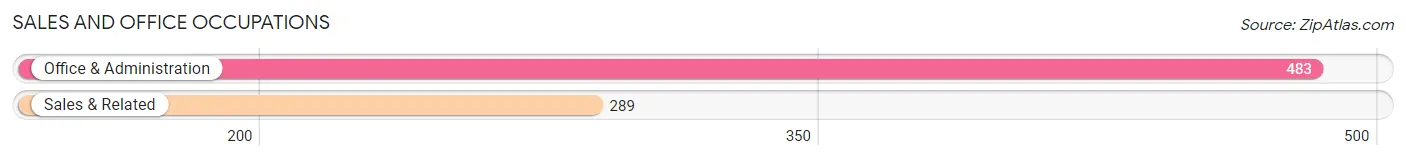
Sales and Office Occupations
The most common Sales and Office occupations in Youngtown are Office & Administration (483 | 15.8%), and Sales & Related (289 | 9.4%).
Sales and Office Occupations by Sex
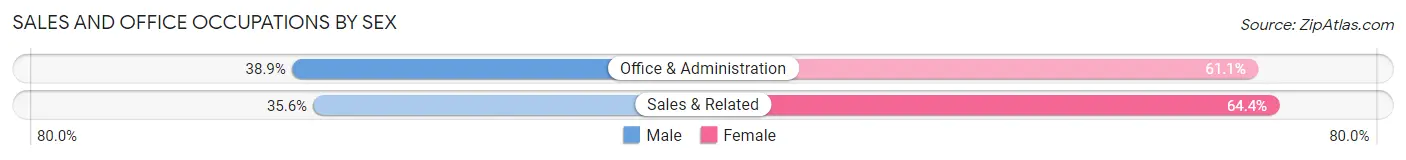
| Occupation | Male | Female |
| Sales & Related | 103 (35.6%) | 186 (64.4%) |
| Office & Administration | 188 (38.9%) | 295 (61.1%) |
| Total (Category) | 291 (37.7%) | 481 (62.3%) |
| Total (Overall) | 1,759 (57.4%) | 1,305 (42.6%) |
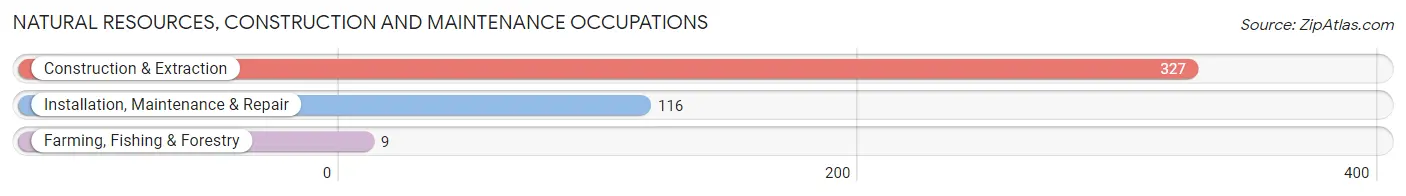
Natural Resources, Construction and Maintenance Occupations
The most common Natural Resources, Construction and Maintenance occupations in Youngtown are Construction & Extraction (327 | 10.7%), Installation, Maintenance & Repair (116 | 3.8%), and Farming, Fishing & Forestry (9 | 0.3%).
Natural Resources, Construction and Maintenance Occupations by Sex
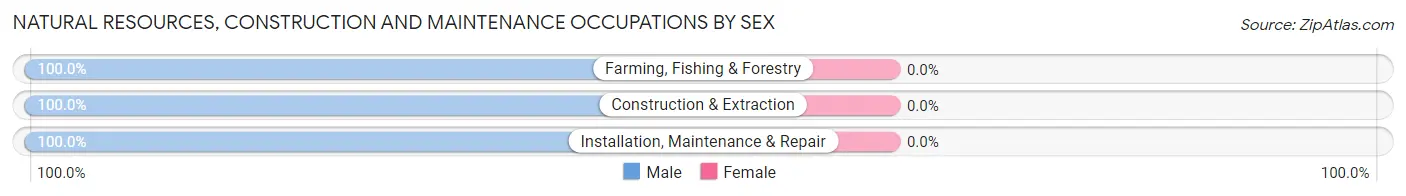
| Occupation | Male | Female |
| Farming, Fishing & Forestry | 9 (100.0%) | 0 (0.0%) |
| Construction & Extraction | 327 (100.0%) | 0 (0.0%) |
| Installation, Maintenance & Repair | 116 (100.0%) | 0 (0.0%) |
| Total (Category) | 452 (100.0%) | 0 (0.0%) |
| Total (Overall) | 1,759 (57.4%) | 1,305 (42.6%) |
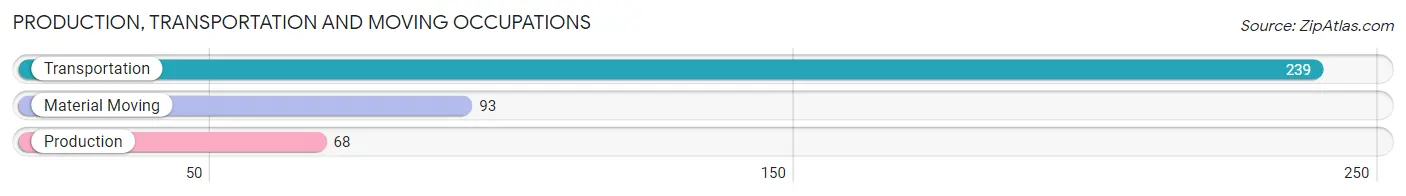
Production, Transportation and Moving Occupations
The most common Production, Transportation and Moving occupations in Youngtown are Transportation (239 | 7.8%), Material Moving (93 | 3.0%), and Production (68 | 2.2%).
Production, Transportation and Moving Occupations by Sex
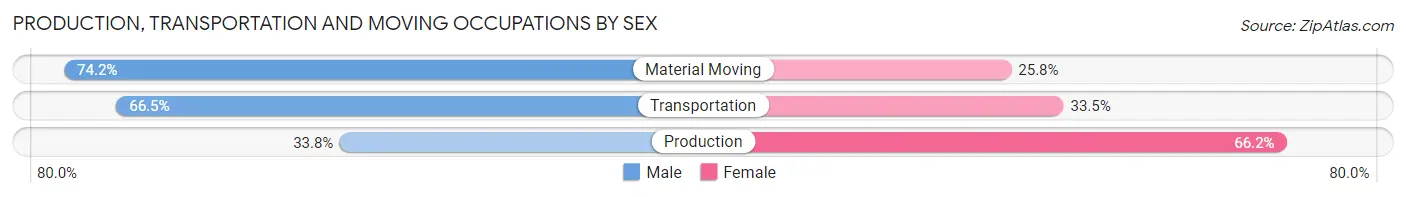
| Occupation | Male | Female |
| Production | 23 (33.8%) | 45 (66.2%) |
| Transportation | 159 (66.5%) | 80 (33.5%) |
| Material Moving | 69 (74.2%) | 24 (25.8%) |
| Total (Category) | 251 (62.7%) | 149 (37.2%) |
| Total (Overall) | 1,759 (57.4%) | 1,305 (42.6%) |
Employment Industries by Sex in Youngtown
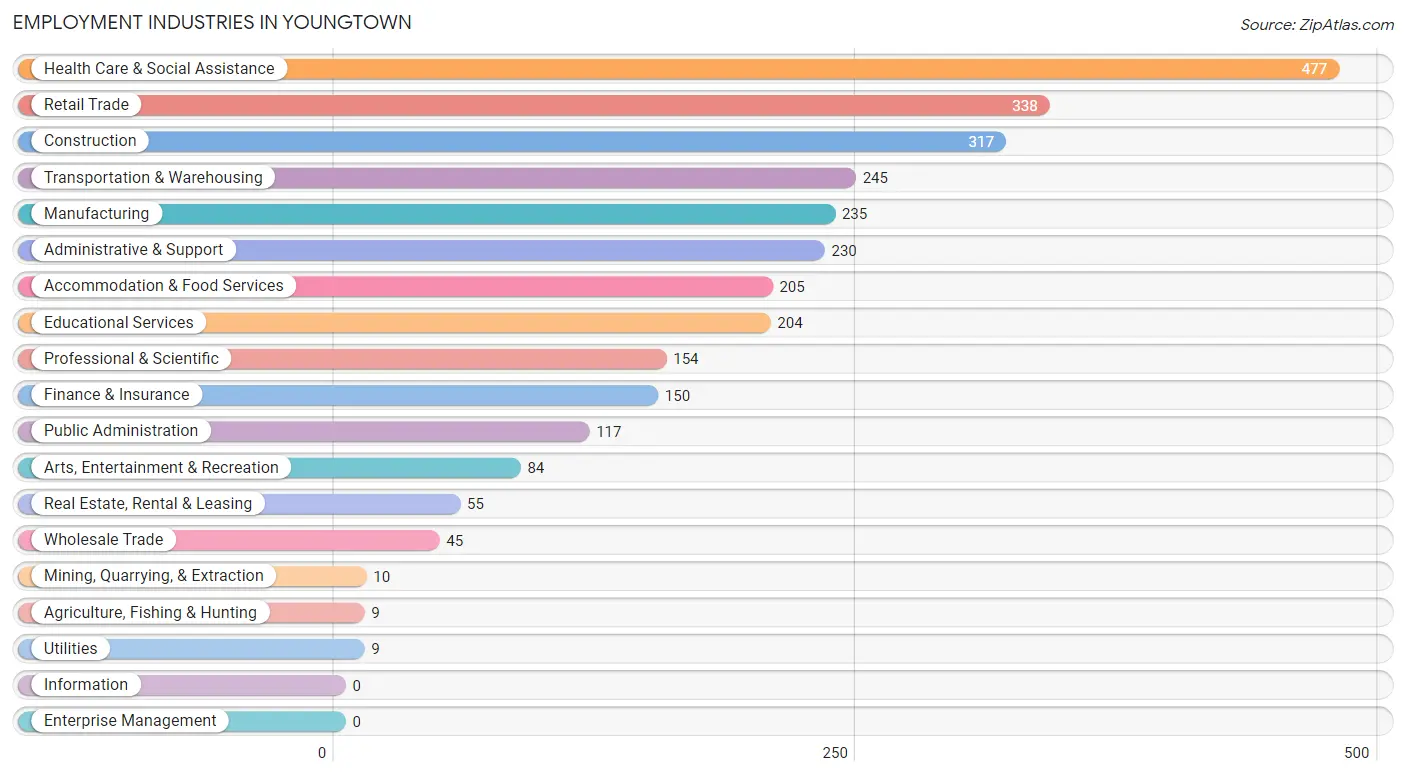
Employment Industries in Youngtown
The major employment industries in Youngtown include Health Care & Social Assistance (477 | 15.6%), Retail Trade (338 | 11.0%), Construction (317 | 10.3%), Transportation & Warehousing (245 | 8.0%), and Manufacturing (235 | 7.7%).
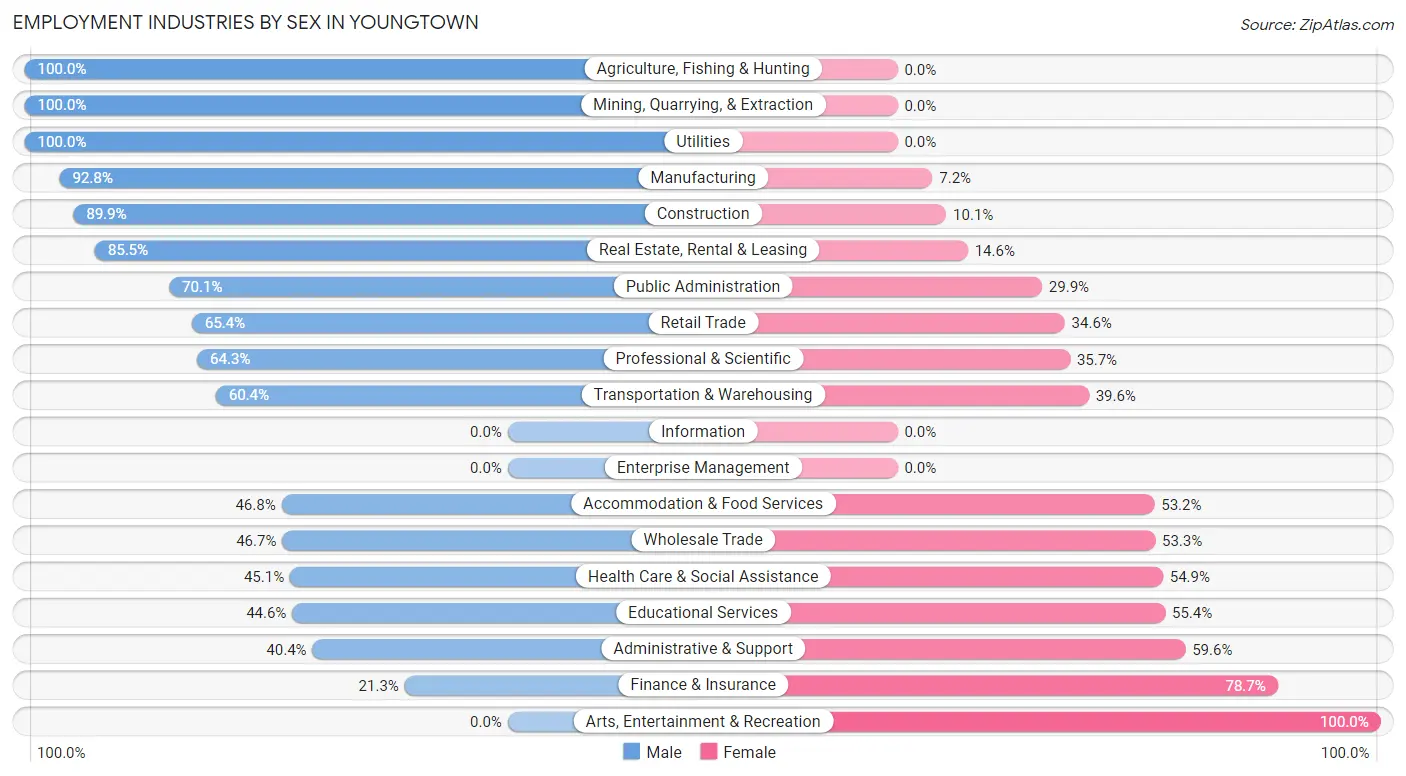
Employment Industries by Sex in Youngtown
The Youngtown industries that see more men than women are Agriculture, Fishing & Hunting (100.0%), Mining, Quarrying, & Extraction (100.0%), and Utilities (100.0%), whereas the industries that tend to have a higher number of women are Arts, Entertainment & Recreation (100.0%), Finance & Insurance (78.7%), and Administrative & Support (59.6%).
| Industry | Male | Female |
| Agriculture, Fishing & Hunting | 9 (100.0%) | 0 (0.0%) |
| Mining, Quarrying, & Extraction | 10 (100.0%) | 0 (0.0%) |
| Construction | 285 (89.9%) | 32 (10.1%) |
| Manufacturing | 218 (92.8%) | 17 (7.2%) |
| Wholesale Trade | 21 (46.7%) | 24 (53.3%) |
| Retail Trade | 221 (65.4%) | 117 (34.6%) |
| Transportation & Warehousing | 148 (60.4%) | 97 (39.6%) |
| Utilities | 9 (100.0%) | 0 (0.0%) |
| Information | 0 (0.0%) | 0 (0.0%) |
| Finance & Insurance | 32 (21.3%) | 118 (78.7%) |
| Real Estate, Rental & Leasing | 47 (85.5%) | 8 (14.5%) |
| Professional & Scientific | 99 (64.3%) | 55 (35.7%) |
| Enterprise Management | 0 (0.0%) | 0 (0.0%) |
| Administrative & Support | 93 (40.4%) | 137 (59.6%) |
| Educational Services | 91 (44.6%) | 113 (55.4%) |
| Health Care & Social Assistance | 215 (45.1%) | 262 (54.9%) |
| Arts, Entertainment & Recreation | 0 (0.0%) | 84 (100.0%) |
| Accommodation & Food Services | 96 (46.8%) | 109 (53.2%) |
| Public Administration | 82 (70.1%) | 35 (29.9%) |
| Total | 1,759 (57.4%) | 1,305 (42.6%) |
Education in Youngtown
School Enrollment in Youngtown
The most common levels of schooling among the 1,535 students in Youngtown are high school (454 | 29.6%), middle school (407 | 26.5%), and elementary school (360 | 23.4%).
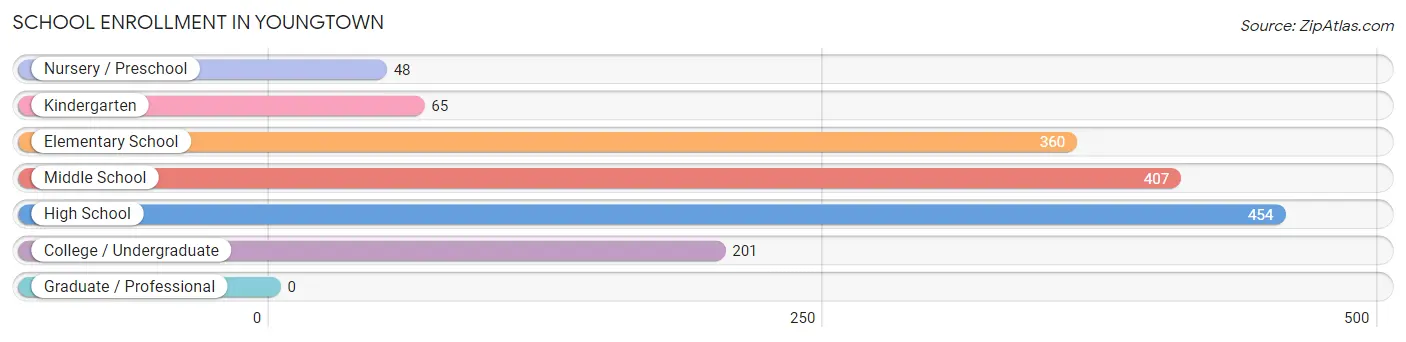
| School Level | # Students | % Students |
| Nursery / Preschool | 48 | 3.1% |
| Kindergarten | 65 | 4.2% |
| Elementary School | 360 | 23.4% |
| Middle School | 407 | 26.5% |
| High School | 454 | 29.6% |
| College / Undergraduate | 201 | 13.1% |
| Graduate / Professional | 0 | 0.0% |
| Total | 1,535 | 100.0% |
School Enrollment by Age by Funding Source in Youngtown
Out of a total of 1,535 students who are enrolled in schools in Youngtown, 258 (16.8%) attend a private institution, while the remaining 1,277 (83.2%) are enrolled in public schools. The age group of 20 to 24 year olds has the highest likelihood of being enrolled in private schools, with 22 (47.8% in the age bracket) enrolled. Conversely, the age group of 25 to 34 year olds has the lowest likelihood of being enrolled in a private school, with 77 (100.0% in the age bracket) attending a public institution.
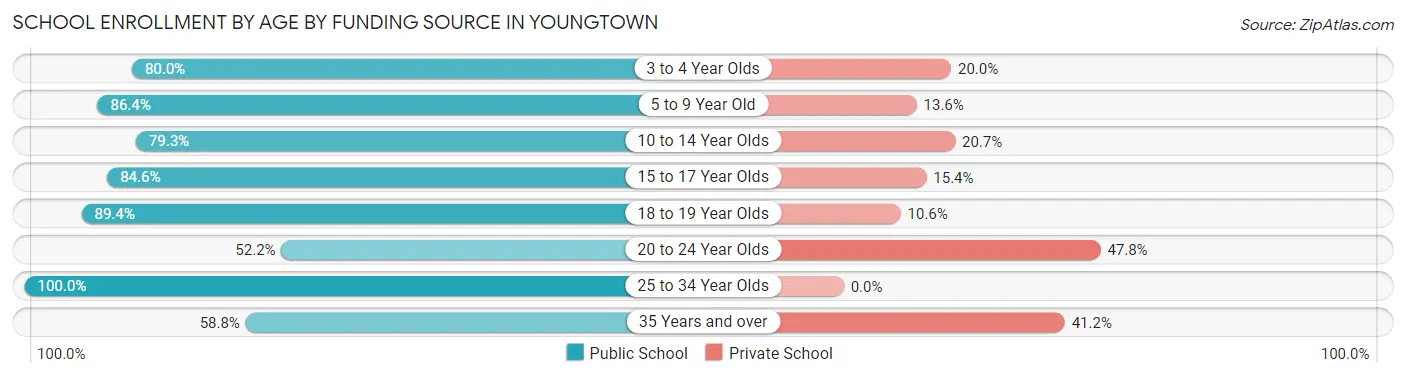
| Age Bracket | Public School | Private School |
| 3 to 4 Year Olds | 28 (80.0%) | 7 (20.0%) |
| 5 to 9 Year Old | 356 (86.4%) | 56 (13.6%) |
| 10 to 14 Year Olds | 344 (79.3%) | 90 (20.7%) |
| 15 to 17 Year Olds | 379 (84.6%) | 69 (15.4%) |
| 18 to 19 Year Olds | 59 (89.4%) | 7 (10.6%) |
| 20 to 24 Year Olds | 24 (52.2%) | 22 (47.8%) |
| 25 to 34 Year Olds | 77 (100.0%) | 0 (0.0%) |
| 35 Years and over | 10 (58.8%) | 7 (41.2%) |
| Total | 1,277 (83.2%) | 258 (16.8%) |
Educational Attainment by Field of Study in Youngtown
Business (163 | 24.7%), education (142 | 21.5%), science & technology (111 | 16.8%), communications (48 | 7.3%), and engineering (45 | 6.8%) are the most common fields of study among 660 individuals in Youngtown who have obtained a bachelor's degree or higher.
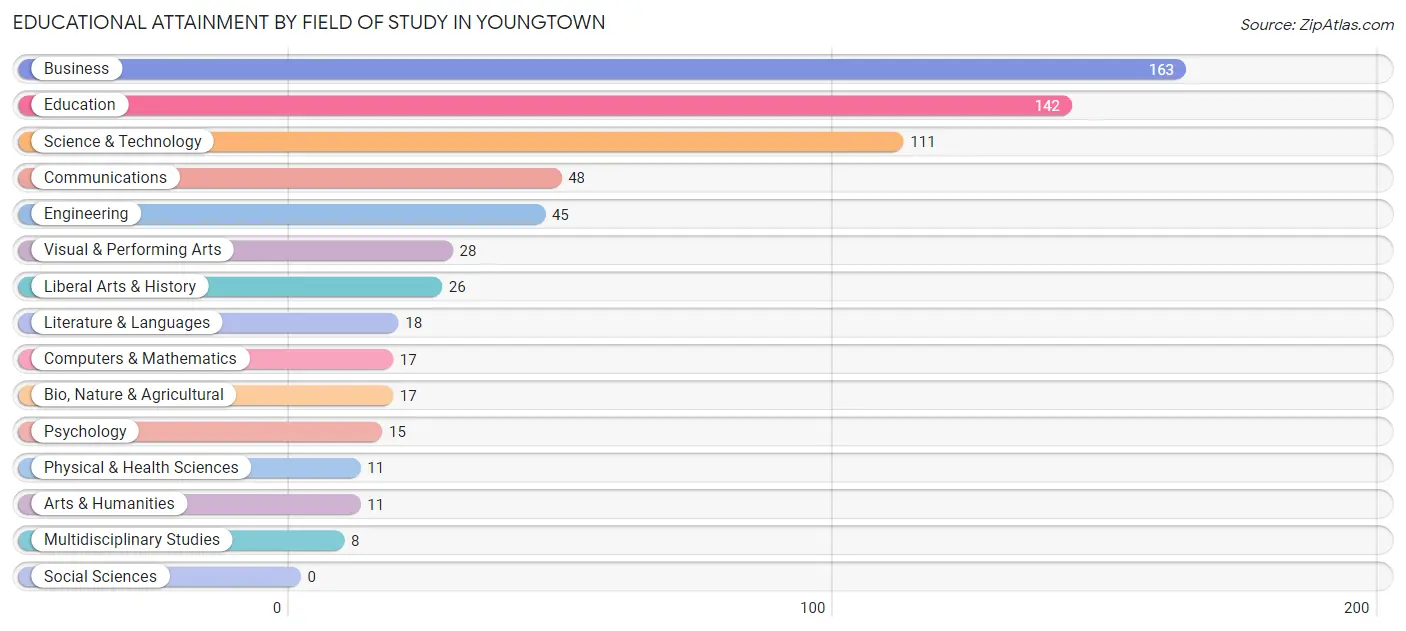
| Field of Study | # Graduates | % Graduates |
| Computers & Mathematics | 17 | 2.6% |
| Bio, Nature & Agricultural | 17 | 2.6% |
| Physical & Health Sciences | 11 | 1.7% |
| Psychology | 15 | 2.3% |
| Social Sciences | 0 | 0.0% |
| Engineering | 45 | 6.8% |
| Multidisciplinary Studies | 8 | 1.2% |
| Science & Technology | 111 | 16.8% |
| Business | 163 | 24.7% |
| Education | 142 | 21.5% |
| Literature & Languages | 18 | 2.7% |
| Liberal Arts & History | 26 | 3.9% |
| Visual & Performing Arts | 28 | 4.2% |
| Communications | 48 | 7.3% |
| Arts & Humanities | 11 | 1.7% |
| Total | 660 | 100.0% |
Transportation & Commute in Youngtown
Vehicle Availability by Sex in Youngtown
The most prevalent vehicle ownership categories in Youngtown are males with 2 vehicles (693, accounting for 39.5%) and females with 2 vehicles (458, making up 55.2%).
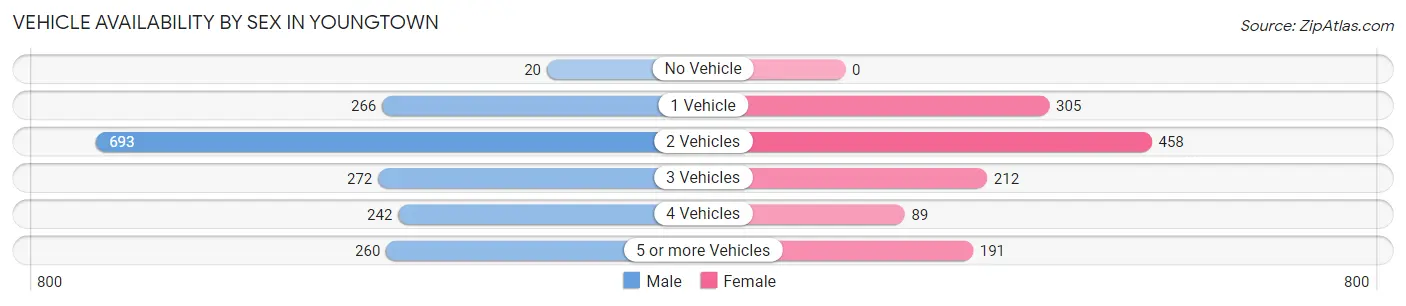
| Vehicles Available | Male | Female |
| No Vehicle | 20 (1.1%) | 0 (0.0%) |
| 1 Vehicle | 266 (15.2%) | 305 (24.3%) |
| 2 Vehicles | 693 (39.5%) | 458 (36.5%) |
| 3 Vehicles | 272 (15.5%) | 212 (16.9%) |
| 4 Vehicles | 242 (13.8%) | 89 (7.1%) |
| 5 or more Vehicles | 260 (14.8%) | 191 (15.2%) |
| Total | 1,753 (100.0%) | 1,255 (100.0%) |
Commute Time in Youngtown
The most frequently occuring commute durations in Youngtown are 30 to 34 minutes (620 commuters, 22.5%), 20 to 24 minutes (544 commuters, 19.8%), and 15 to 19 minutes (389 commuters, 14.1%).
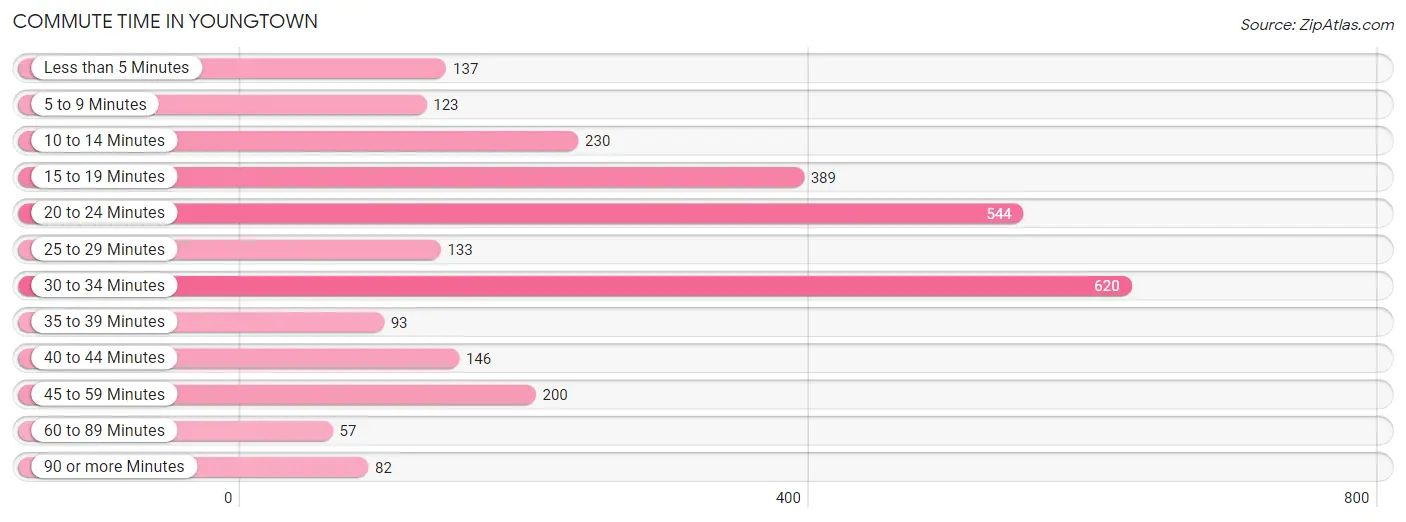
| Commute Time | # Commuters | % Commuters |
| Less than 5 Minutes | 137 | 5.0% |
| 5 to 9 Minutes | 123 | 4.5% |
| 10 to 14 Minutes | 230 | 8.4% |
| 15 to 19 Minutes | 389 | 14.1% |
| 20 to 24 Minutes | 544 | 19.8% |
| 25 to 29 Minutes | 133 | 4.8% |
| 30 to 34 Minutes | 620 | 22.5% |
| 35 to 39 Minutes | 93 | 3.4% |
| 40 to 44 Minutes | 146 | 5.3% |
| 45 to 59 Minutes | 200 | 7.3% |
| 60 to 89 Minutes | 57 | 2.1% |
| 90 or more Minutes | 82 | 3.0% |
Commute Time by Sex in Youngtown
The most common commute times in Youngtown are 30 to 34 minutes (495 commuters, 29.4%) for males and 20 to 24 minutes (189 commuters, 17.7%) for females.
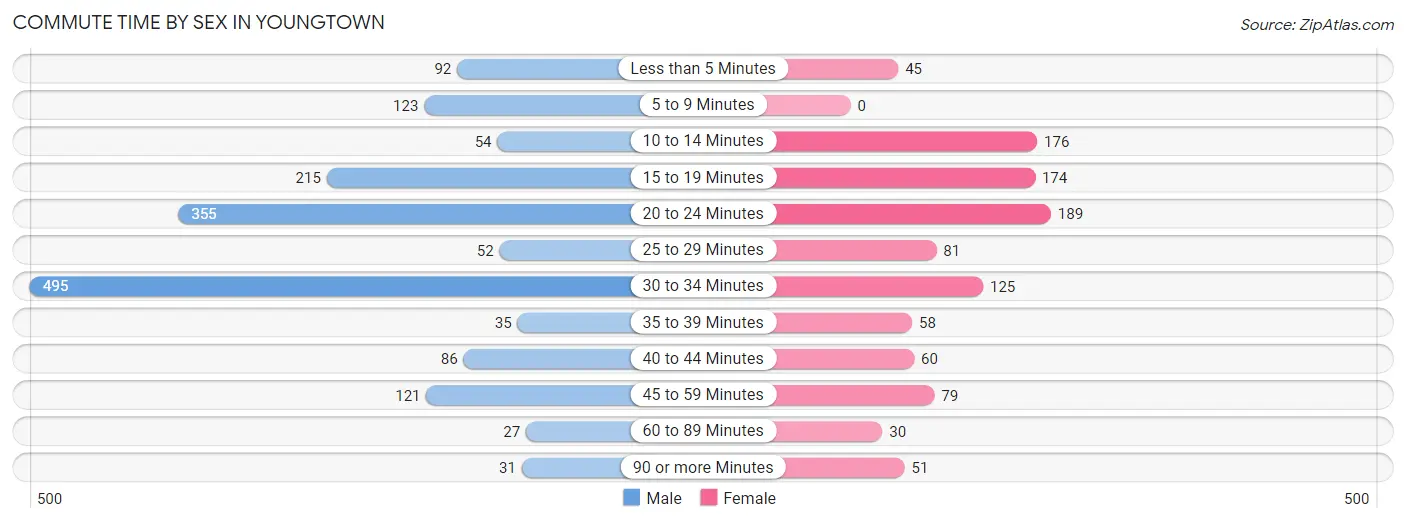
| Commute Time | Male | Female |
| Less than 5 Minutes | 92 (5.5%) | 45 (4.2%) |
| 5 to 9 Minutes | 123 (7.3%) | 0 (0.0%) |
| 10 to 14 Minutes | 54 (3.2%) | 176 (16.5%) |
| 15 to 19 Minutes | 215 (12.8%) | 174 (16.3%) |
| 20 to 24 Minutes | 355 (21.1%) | 189 (17.7%) |
| 25 to 29 Minutes | 52 (3.1%) | 81 (7.6%) |
| 30 to 34 Minutes | 495 (29.4%) | 125 (11.7%) |
| 35 to 39 Minutes | 35 (2.1%) | 58 (5.4%) |
| 40 to 44 Minutes | 86 (5.1%) | 60 (5.6%) |
| 45 to 59 Minutes | 121 (7.2%) | 79 (7.4%) |
| 60 to 89 Minutes | 27 (1.6%) | 30 (2.8%) |
| 90 or more Minutes | 31 (1.8%) | 51 (4.8%) |
Time of Departure to Work by Sex in Youngtown
The most frequent times of departure to work in Youngtown are 6:00 AM to 6:29 AM (349, 20.7%) for males and 6:30 AM to 6:59 AM (175, 16.4%) for females.
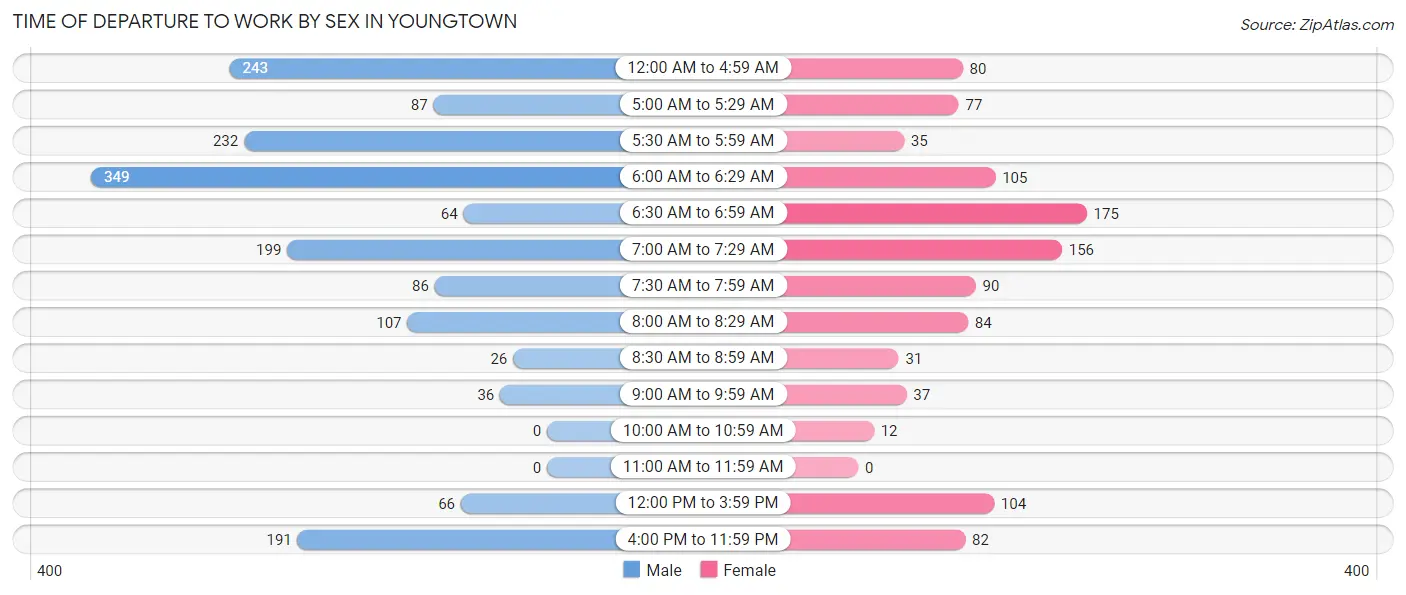
| Time of Departure | Male | Female |
| 12:00 AM to 4:59 AM | 243 (14.4%) | 80 (7.5%) |
| 5:00 AM to 5:29 AM | 87 (5.2%) | 77 (7.2%) |
| 5:30 AM to 5:59 AM | 232 (13.8%) | 35 (3.3%) |
| 6:00 AM to 6:29 AM | 349 (20.7%) | 105 (9.8%) |
| 6:30 AM to 6:59 AM | 64 (3.8%) | 175 (16.4%) |
| 7:00 AM to 7:29 AM | 199 (11.8%) | 156 (14.6%) |
| 7:30 AM to 7:59 AM | 86 (5.1%) | 90 (8.4%) |
| 8:00 AM to 8:29 AM | 107 (6.4%) | 84 (7.9%) |
| 8:30 AM to 8:59 AM | 26 (1.5%) | 31 (2.9%) |
| 9:00 AM to 9:59 AM | 36 (2.1%) | 37 (3.5%) |
| 10:00 AM to 10:59 AM | 0 (0.0%) | 12 (1.1%) |
| 11:00 AM to 11:59 AM | 0 (0.0%) | 0 (0.0%) |
| 12:00 PM to 3:59 PM | 66 (3.9%) | 104 (9.7%) |
| 4:00 PM to 11:59 PM | 191 (11.3%) | 82 (7.7%) |
| Total | 1,686 (100.0%) | 1,068 (100.0%) |
Housing Occupancy in Youngtown
Occupancy by Ownership in Youngtown
Of the total 2,499 dwellings in Youngtown, owner-occupied units account for 1,341 (53.7%), while renter-occupied units make up 1,158 (46.3%).
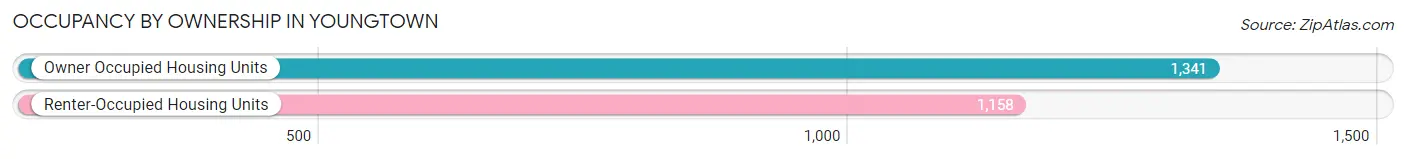
| Occupancy | # Housing Units | % Housing Units |
| Owner Occupied Housing Units | 1,341 | 53.7% |
| Renter-Occupied Housing Units | 1,158 | 46.3% |
| Total Occupied Housing Units | 2,499 | 100.0% |
Occupancy by Household Size in Youngtown
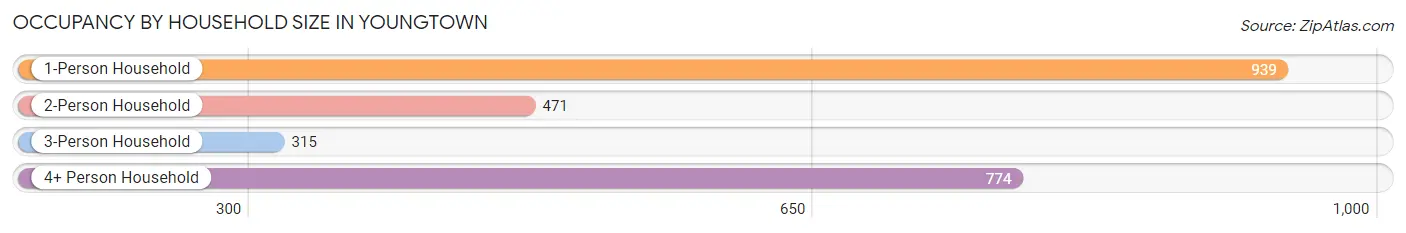
| Household Size | # Housing Units | % Housing Units |
| 1-Person Household | 939 | 37.6% |
| 2-Person Household | 471 | 18.9% |
| 3-Person Household | 315 | 12.6% |
| 4+ Person Household | 774 | 31.0% |
| Total Housing Units | 2,499 | 100.0% |
Occupancy by Ownership by Household Size in Youngtown
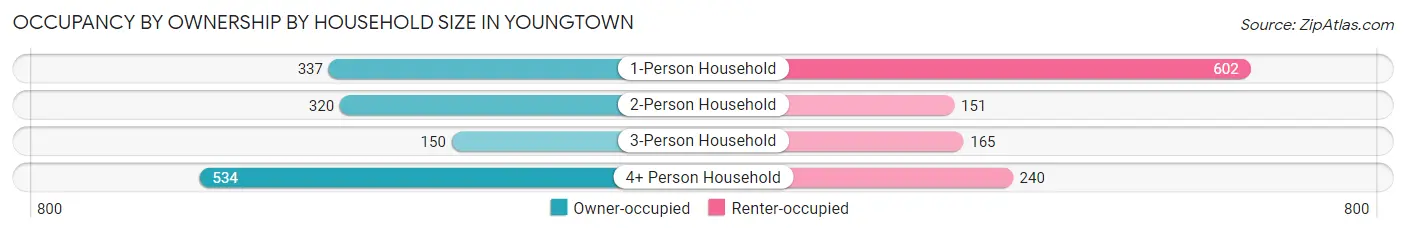
| Household Size | Owner-occupied | Renter-occupied |
| 1-Person Household | 337 (35.9%) | 602 (64.1%) |
| 2-Person Household | 320 (67.9%) | 151 (32.1%) |
| 3-Person Household | 150 (47.6%) | 165 (52.4%) |
| 4+ Person Household | 534 (69.0%) | 240 (31.0%) |
| Total Housing Units | 1,341 (53.7%) | 1,158 (46.3%) |
Occupancy by Educational Attainment in Youngtown
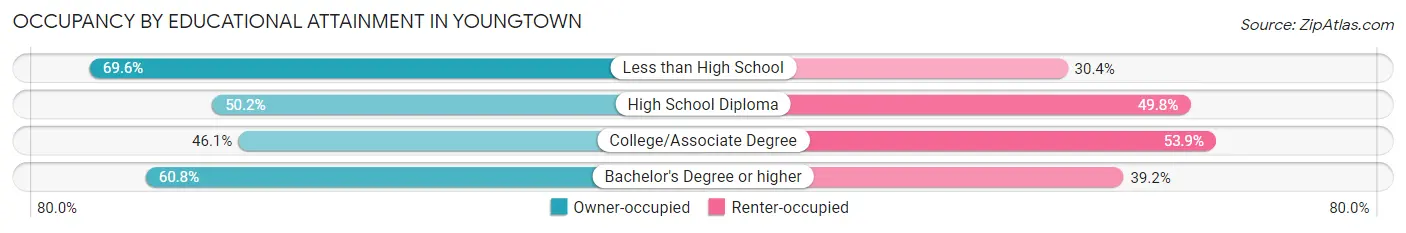
| Household Size | Owner-occupied | Renter-occupied |
| Less than High School | 273 (69.6%) | 119 (30.4%) |
| High School Diploma | 435 (50.2%) | 431 (49.8%) |
| College/Associate Degree | 382 (46.1%) | 446 (53.9%) |
| Bachelor's Degree or higher | 251 (60.8%) | 162 (39.2%) |
Occupancy by Age of Householder in Youngtown
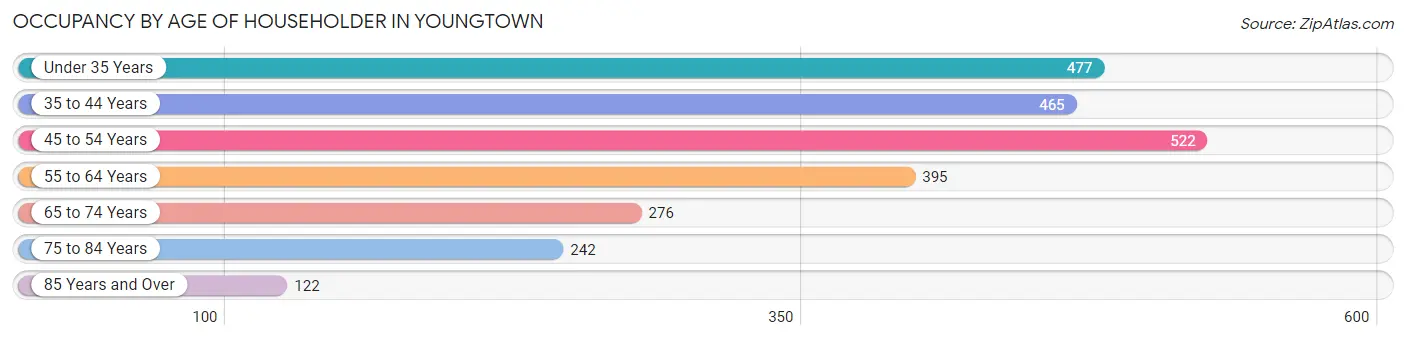
| Age Bracket | # Households | % Households |
| Under 35 Years | 477 | 19.1% |
| 35 to 44 Years | 465 | 18.6% |
| 45 to 54 Years | 522 | 20.9% |
| 55 to 64 Years | 395 | 15.8% |
| 65 to 74 Years | 276 | 11.0% |
| 75 to 84 Years | 242 | 9.7% |
| 85 Years and Over | 122 | 4.9% |
| Total | 2,499 | 100.0% |
Housing Finances in Youngtown
Median Income by Occupancy in Youngtown
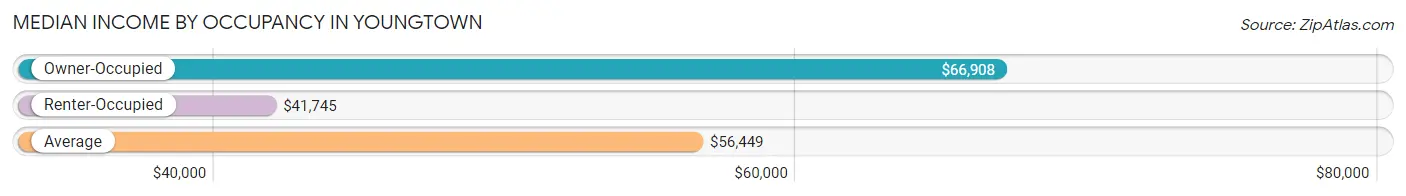
| Occupancy Type | # Households | Median Income |
| Owner-Occupied | 1,341 (53.7%) | $66,908 |
| Renter-Occupied | 1,158 (46.3%) | $41,745 |
| Average | 2,499 (100.0%) | $56,449 |
Occupancy by Householder Income Bracket in Youngtown
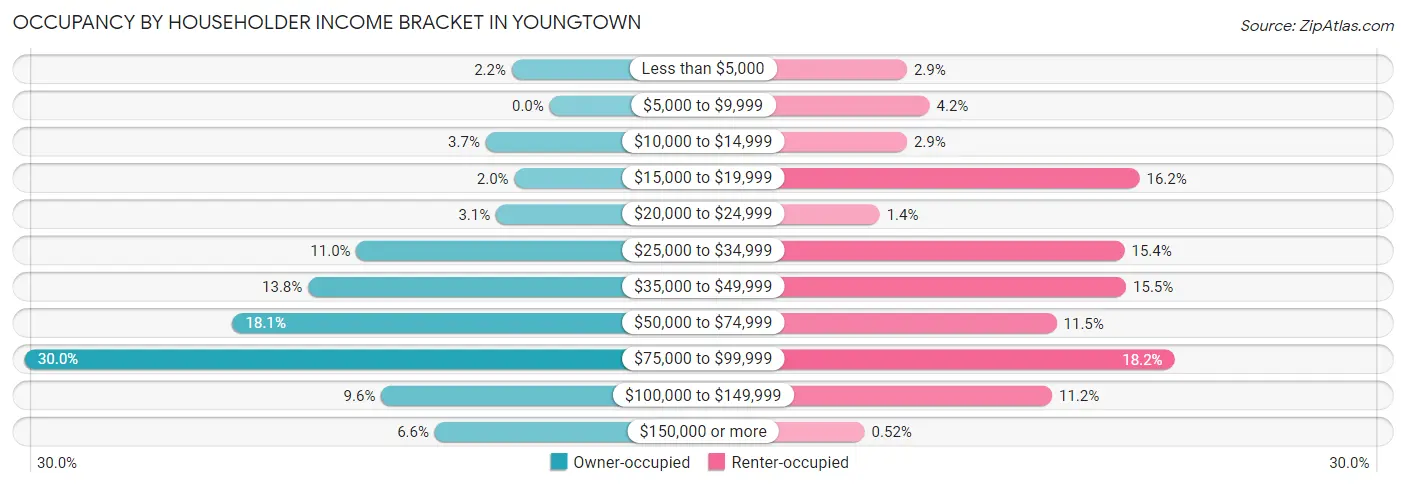
| Income Bracket | Owner-occupied | Renter-occupied |
| Less than $5,000 | 29 (2.2%) | 34 (2.9%) |
| $5,000 to $9,999 | 0 (0.0%) | 49 (4.2%) |
| $10,000 to $14,999 | 49 (3.6%) | 34 (2.9%) |
| $15,000 to $19,999 | 27 (2.0%) | 188 (16.2%) |
| $20,000 to $24,999 | 41 (3.1%) | 16 (1.4%) |
| $25,000 to $34,999 | 148 (11.0%) | 178 (15.4%) |
| $35,000 to $49,999 | 185 (13.8%) | 179 (15.5%) |
| $50,000 to $74,999 | 243 (18.1%) | 133 (11.5%) |
| $75,000 to $99,999 | 402 (30.0%) | 211 (18.2%) |
| $100,000 to $149,999 | 129 (9.6%) | 130 (11.2%) |
| $150,000 or more | 88 (6.6%) | 6 (0.5%) |
| Total | 1,341 (100.0%) | 1,158 (100.0%) |
Monthly Housing Cost Tiers in Youngtown
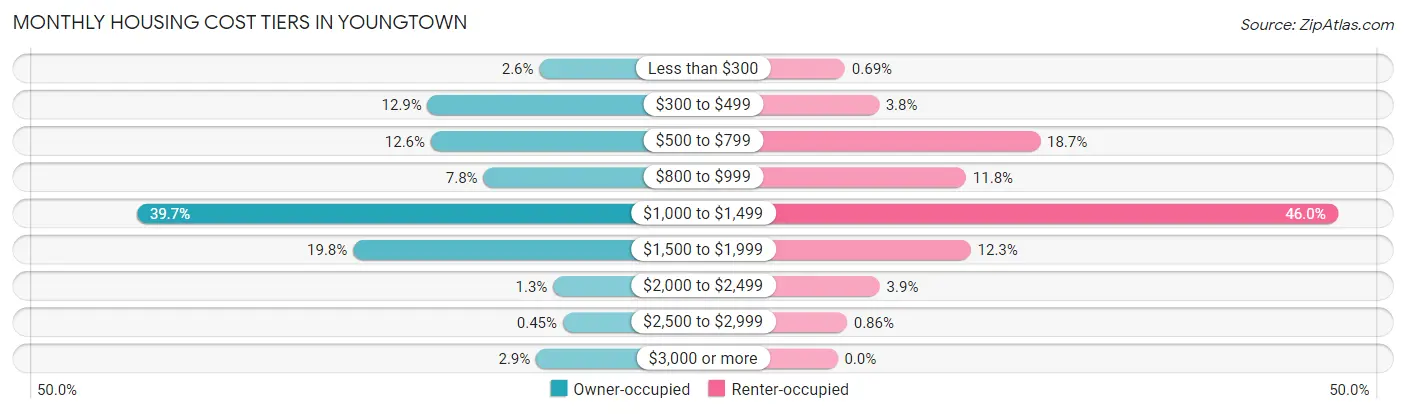
| Monthly Cost | Owner-occupied | Renter-occupied |
| Less than $300 | 35 (2.6%) | 8 (0.7%) |
| $300 to $499 | 173 (12.9%) | 44 (3.8%) |
| $500 to $799 | 169 (12.6%) | 216 (18.6%) |
| $800 to $999 | 104 (7.8%) | 137 (11.8%) |
| $1,000 to $1,499 | 532 (39.7%) | 533 (46.0%) |
| $1,500 to $1,999 | 265 (19.8%) | 142 (12.3%) |
| $2,000 to $2,499 | 18 (1.3%) | 45 (3.9%) |
| $2,500 to $2,999 | 6 (0.4%) | 10 (0.9%) |
| $3,000 or more | 39 (2.9%) | 0 (0.0%) |
| Total | 1,341 (100.0%) | 1,158 (100.0%) |
Physical Housing Characteristics in Youngtown
Housing Structures in Youngtown
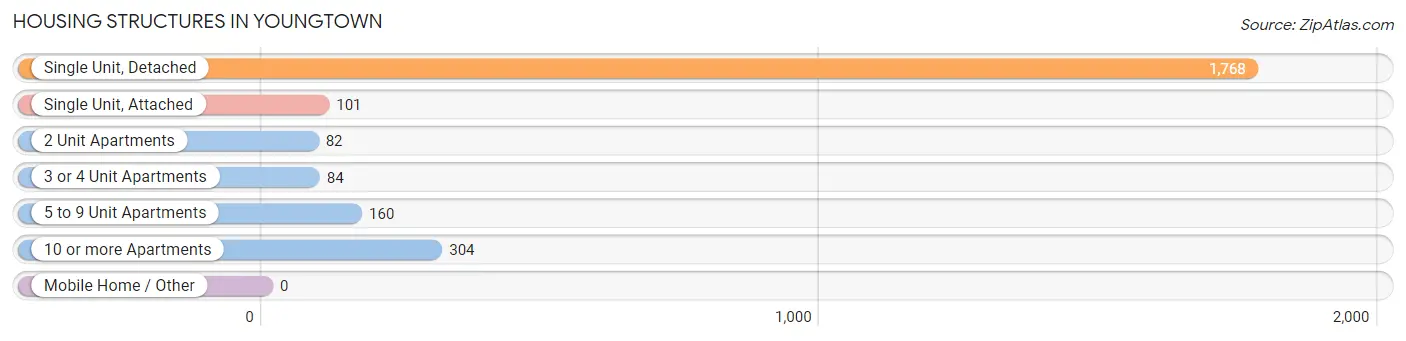
| Structure Type | # Housing Units | % Housing Units |
| Single Unit, Detached | 1,768 | 70.8% |
| Single Unit, Attached | 101 | 4.0% |
| 2 Unit Apartments | 82 | 3.3% |
| 3 or 4 Unit Apartments | 84 | 3.4% |
| 5 to 9 Unit Apartments | 160 | 6.4% |
| 10 or more Apartments | 304 | 12.2% |
| Mobile Home / Other | 0 | 0.0% |
| Total | 2,499 | 100.0% |
Housing Structures by Occupancy in Youngtown
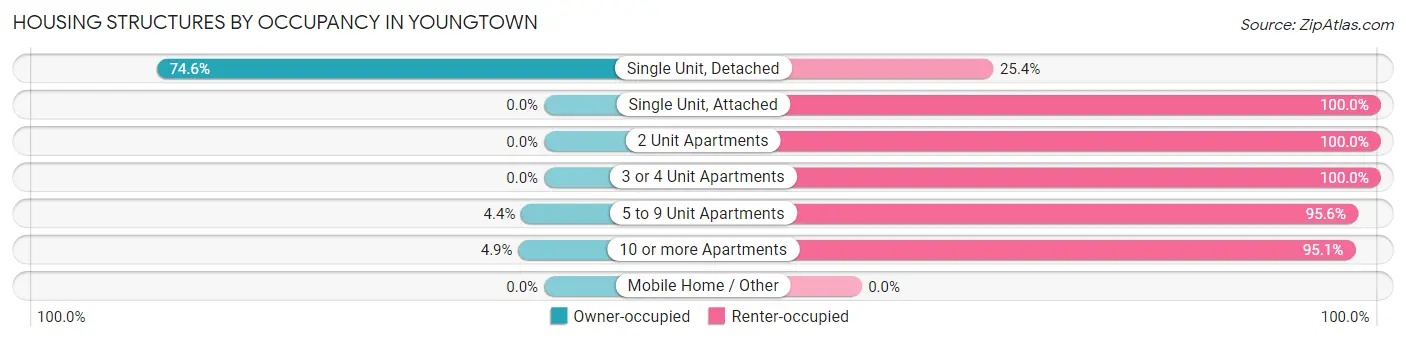
| Structure Type | Owner-occupied | Renter-occupied |
| Single Unit, Detached | 1,319 (74.6%) | 449 (25.4%) |
| Single Unit, Attached | 0 (0.0%) | 101 (100.0%) |
| 2 Unit Apartments | 0 (0.0%) | 82 (100.0%) |
| 3 or 4 Unit Apartments | 0 (0.0%) | 84 (100.0%) |
| 5 to 9 Unit Apartments | 7 (4.4%) | 153 (95.6%) |
| 10 or more Apartments | 15 (4.9%) | 289 (95.1%) |
| Mobile Home / Other | 0 (0.0%) | 0 (0.0%) |
| Total | 1,341 (53.7%) | 1,158 (46.3%) |
Housing Structures by Number of Rooms in Youngtown
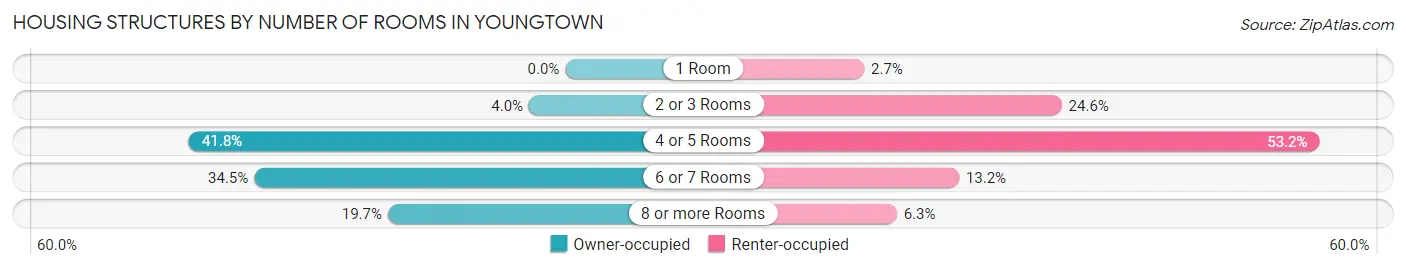
| Number of Rooms | Owner-occupied | Renter-occupied |
| 1 Room | 0 (0.0%) | 31 (2.7%) |
| 2 or 3 Rooms | 54 (4.0%) | 285 (24.6%) |
| 4 or 5 Rooms | 560 (41.8%) | 616 (53.2%) |
| 6 or 7 Rooms | 463 (34.5%) | 153 (13.2%) |
| 8 or more Rooms | 264 (19.7%) | 73 (6.3%) |
| Total | 1,341 (100.0%) | 1,158 (100.0%) |
Housing Structure by Heating Type in Youngtown
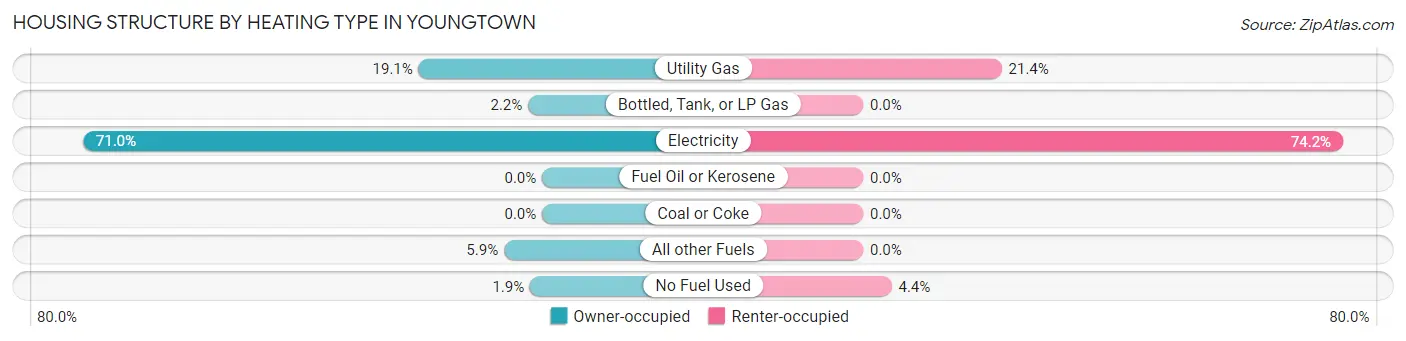
| Heating Type | Owner-occupied | Renter-occupied |
| Utility Gas | 256 (19.1%) | 248 (21.4%) |
| Bottled, Tank, or LP Gas | 29 (2.2%) | 0 (0.0%) |
| Electricity | 952 (71.0%) | 859 (74.2%) |
| Fuel Oil or Kerosene | 0 (0.0%) | 0 (0.0%) |
| Coal or Coke | 0 (0.0%) | 0 (0.0%) |
| All other Fuels | 79 (5.9%) | 0 (0.0%) |
| No Fuel Used | 25 (1.9%) | 51 (4.4%) |
| Total | 1,341 (100.0%) | 1,158 (100.0%) |
Household Vehicle Usage in Youngtown
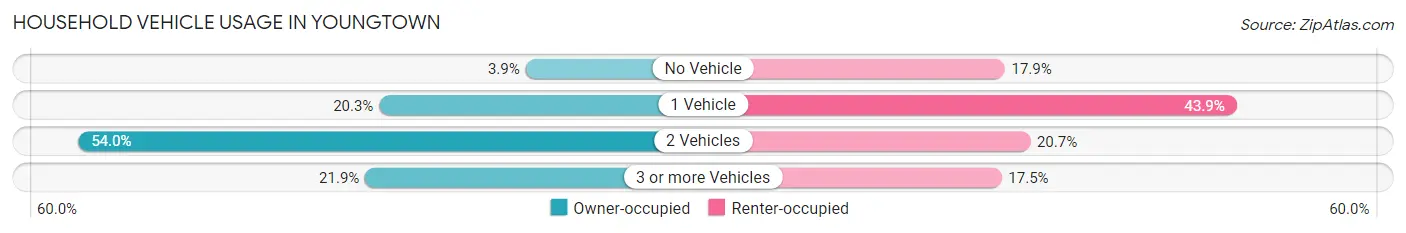
| Vehicles per Household | Owner-occupied | Renter-occupied |
| No Vehicle | 52 (3.9%) | 207 (17.9%) |
| 1 Vehicle | 272 (20.3%) | 508 (43.9%) |
| 2 Vehicles | 724 (54.0%) | 240 (20.7%) |
| 3 or more Vehicles | 293 (21.8%) | 203 (17.5%) |
| Total | 1,341 (100.0%) | 1,158 (100.0%) |
Real Estate & Mortgages in Youngtown
Real Estate and Mortgage Overview in Youngtown
| Characteristic | Without Mortgage | With Mortgage |
| Housing Units | 299 | 1,042 |
| Median Property Value | $244,800 | $266,500 |
| Median Household Income | $50,694 | $70 |
| Monthly Housing Costs | $390 | $39 |
| Real Estate Taxes | $937 | $27 |
Property Value by Mortgage Status in Youngtown
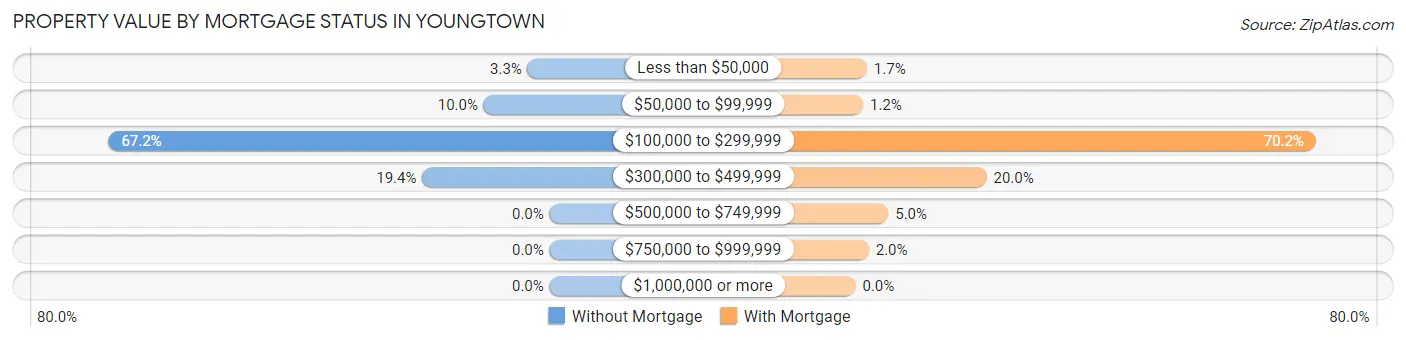
| Property Value | Without Mortgage | With Mortgage |
| Less than $50,000 | 10 (3.3%) | 18 (1.7%) |
| $50,000 to $99,999 | 30 (10.0%) | 12 (1.1%) |
| $100,000 to $299,999 | 201 (67.2%) | 731 (70.2%) |
| $300,000 to $499,999 | 58 (19.4%) | 208 (20.0%) |
| $500,000 to $749,999 | 0 (0.0%) | 52 (5.0%) |
| $750,000 to $999,999 | 0 (0.0%) | 21 (2.0%) |
| $1,000,000 or more | 0 (0.0%) | 0 (0.0%) |
| Total | 299 (100.0%) | 1,042 (100.0%) |
Household Income by Mortgage Status in Youngtown
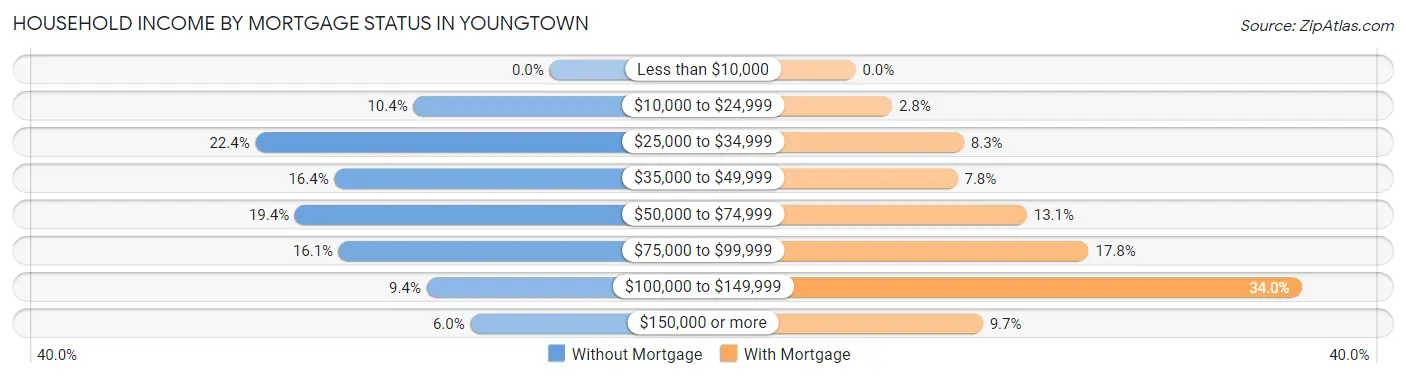
| Household Income | Without Mortgage | With Mortgage |
| Less than $10,000 | 0 (0.0%) | 0 (0.0%) |
| $10,000 to $24,999 | 31 (10.4%) | 29 (2.8%) |
| $25,000 to $34,999 | 67 (22.4%) | 86 (8.3%) |
| $35,000 to $49,999 | 49 (16.4%) | 81 (7.8%) |
| $50,000 to $74,999 | 58 (19.4%) | 136 (13.1%) |
| $75,000 to $99,999 | 48 (16.1%) | 185 (17.7%) |
| $100,000 to $149,999 | 28 (9.4%) | 354 (34.0%) |
| $150,000 or more | 18 (6.0%) | 101 (9.7%) |
| Total | 299 (100.0%) | 1,042 (100.0%) |
Property Value to Household Income Ratio in Youngtown
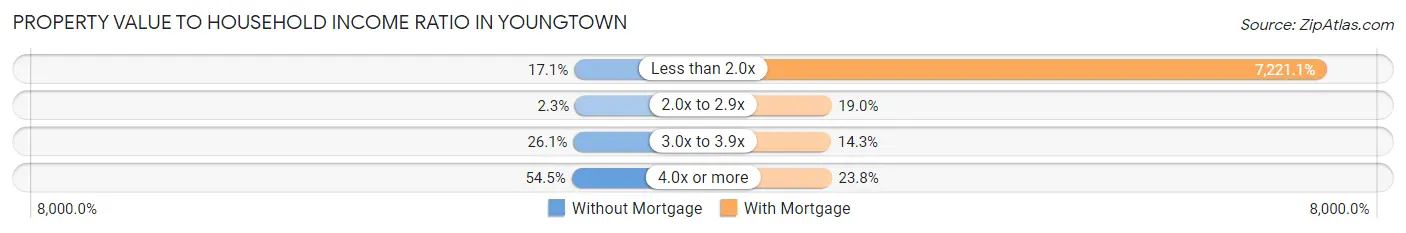
| Value-to-Income Ratio | Without Mortgage | With Mortgage |
| Less than 2.0x | 51 (17.1%) | 75,244 (7,221.1%) |
| 2.0x to 2.9x | 7 (2.3%) | 198 (19.0%) |
| 3.0x to 3.9x | 78 (26.1%) | 149 (14.3%) |
| 4.0x or more | 163 (54.5%) | 248 (23.8%) |
| Total | 299 (100.0%) | 1,042 (100.0%) |
Real Estate Taxes by Mortgage Status in Youngtown
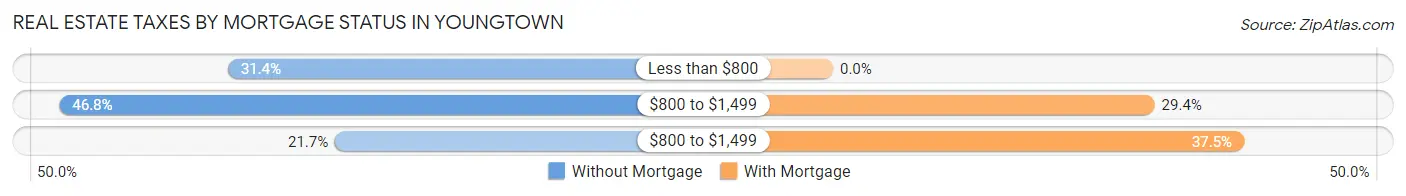
| Property Taxes | Without Mortgage | With Mortgage |
| Less than $800 | 94 (31.4%) | 0 (0.0%) |
| $800 to $1,499 | 140 (46.8%) | 306 (29.4%) |
| $800 to $1,499 | 65 (21.7%) | 391 (37.5%) |
| Total | 299 (100.0%) | 1,042 (100.0%) |
Health & Disability in Youngtown
Health Insurance Coverage by Age in Youngtown
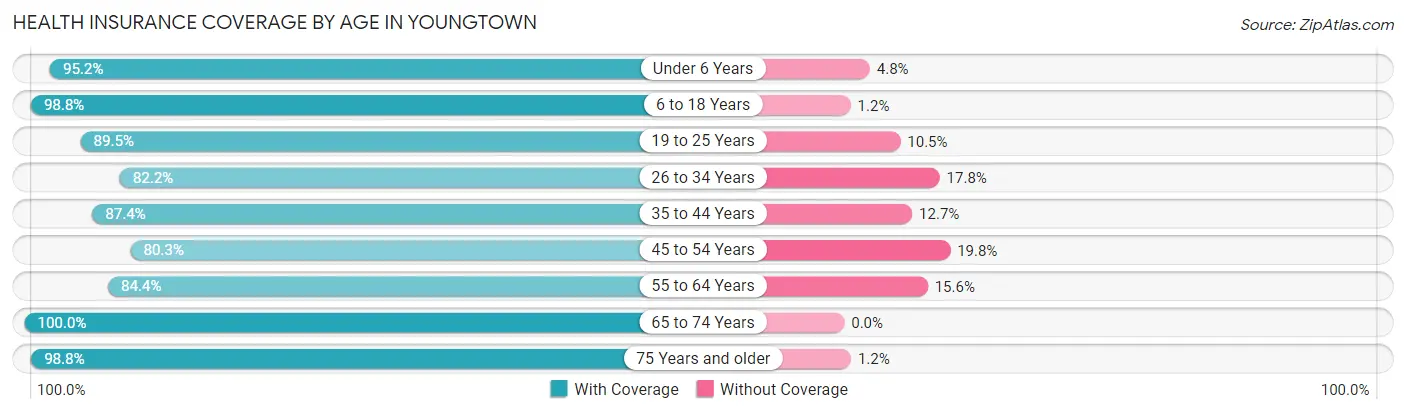
| Age Bracket | With Coverage | Without Coverage |
| Under 6 Years | 380 (95.2%) | 19 (4.8%) |
| 6 to 18 Years | 1,409 (98.8%) | 17 (1.2%) |
| 19 to 25 Years | 428 (89.5%) | 50 (10.5%) |
| 26 to 34 Years | 860 (82.2%) | 186 (17.8%) |
| 35 to 44 Years | 780 (87.4%) | 113 (12.7%) |
| 45 to 54 Years | 642 (80.2%) | 158 (19.8%) |
| 55 to 64 Years | 613 (84.4%) | 113 (15.6%) |
| 65 to 74 Years | 412 (100.0%) | 0 (0.0%) |
| 75 Years and older | 479 (98.8%) | 6 (1.2%) |
| Total | 6,003 (90.1%) | 662 (9.9%) |
Health Insurance Coverage by Citizenship Status in Youngtown
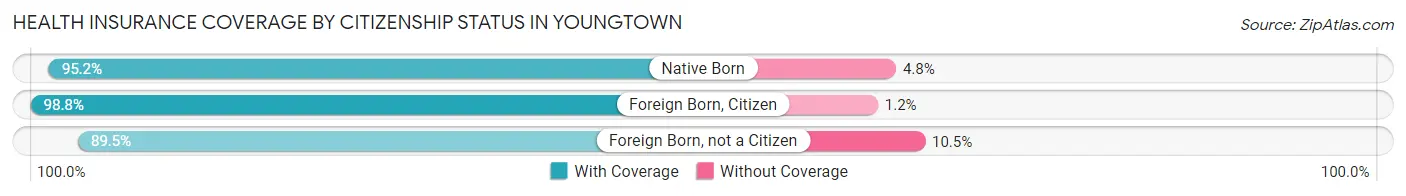
| Citizenship Status | With Coverage | Without Coverage |
| Native Born | 380 (95.2%) | 19 (4.8%) |
| Foreign Born, Citizen | 1,409 (98.8%) | 17 (1.2%) |
| Foreign Born, not a Citizen | 428 (89.5%) | 50 (10.5%) |
Health Insurance Coverage by Household Income in Youngtown
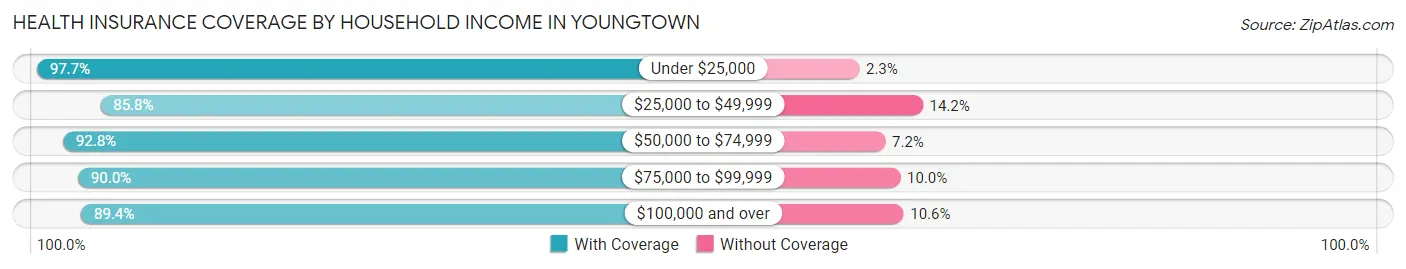
| Household Income | With Coverage | Without Coverage |
| Under $25,000 | 555 (97.7%) | 13 (2.3%) |
| $25,000 to $49,999 | 1,421 (85.8%) | 235 (14.2%) |
| $50,000 to $74,999 | 1,215 (92.8%) | 94 (7.2%) |
| $75,000 to $99,999 | 1,702 (90.0%) | 189 (10.0%) |
| $100,000 and over | 1,106 (89.4%) | 131 (10.6%) |
Public vs Private Health Insurance Coverage by Age in Youngtown
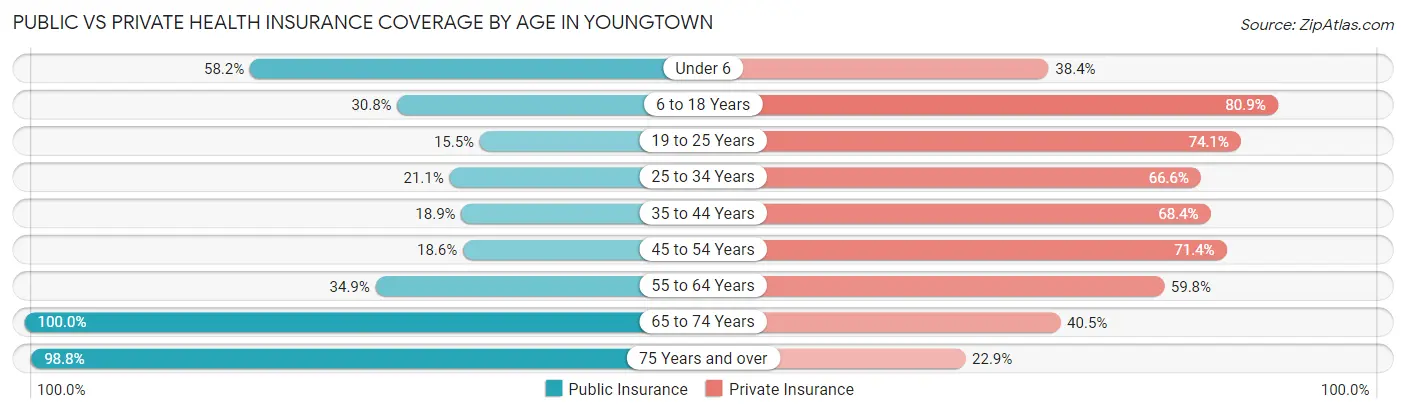
| Age Bracket | Public Insurance | Private Insurance |
| Under 6 | 232 (58.2%) | 153 (38.4%) |
| 6 to 18 Years | 439 (30.8%) | 1,153 (80.9%) |
| 19 to 25 Years | 74 (15.5%) | 354 (74.1%) |
| 25 to 34 Years | 221 (21.1%) | 697 (66.6%) |
| 35 to 44 Years | 169 (18.9%) | 611 (68.4%) |
| 45 to 54 Years | 149 (18.6%) | 571 (71.4%) |
| 55 to 64 Years | 253 (34.8%) | 434 (59.8%) |
| 65 to 74 Years | 412 (100.0%) | 167 (40.5%) |
| 75 Years and over | 479 (98.8%) | 111 (22.9%) |
| Total | 2,428 (36.4%) | 4,251 (63.8%) |
Disability Status by Sex by Age in Youngtown
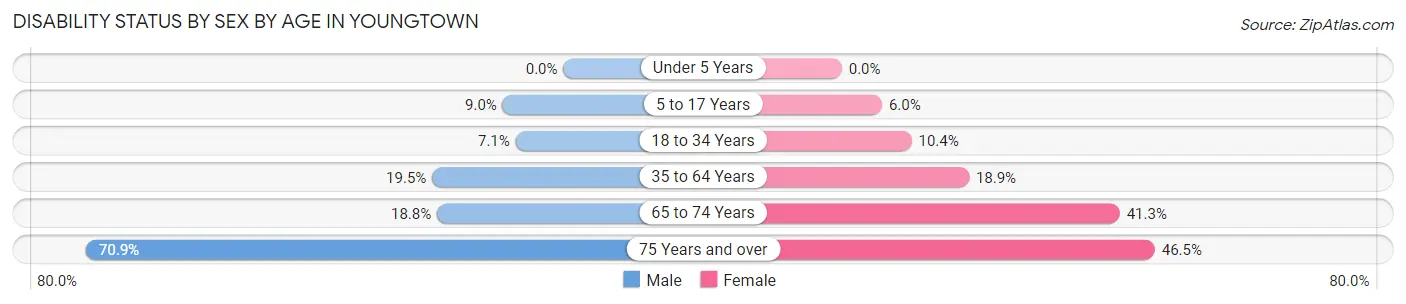
| Age Bracket | Male | Female |
| Under 5 Years | 0 (0.0%) | 0 (0.0%) |
| 5 to 17 Years | 74 (9.0%) | 37 (6.0%) |
| 18 to 34 Years | 70 (7.1%) | 66 (10.4%) |
| 35 to 64 Years | 239 (19.5%) | 225 (18.9%) |
| 65 to 74 Years | 30 (18.8%) | 104 (41.3%) |
| 75 Years and over | 112 (70.9%) | 152 (46.5%) |
Disability Class by Sex by Age in Youngtown
Disability Class: Hearing Difficulty
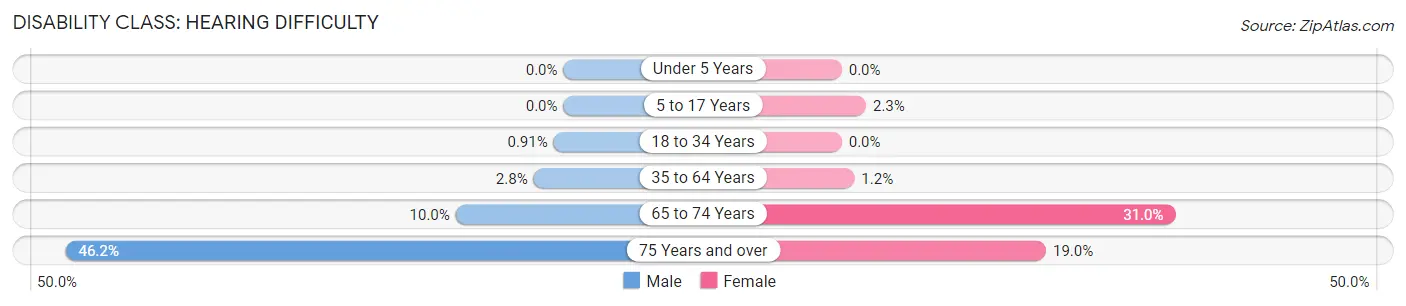
| Age Bracket | Male | Female |
| Under 5 Years | 0 (0.0%) | 0 (0.0%) |
| 5 to 17 Years | 0 (0.0%) | 14 (2.2%) |
| 18 to 34 Years | 9 (0.9%) | 0 (0.0%) |
| 35 to 64 Years | 34 (2.8%) | 14 (1.2%) |
| 65 to 74 Years | 16 (10.0%) | 78 (30.9%) |
| 75 Years and over | 73 (46.2%) | 62 (19.0%) |
Disability Class: Vision Difficulty
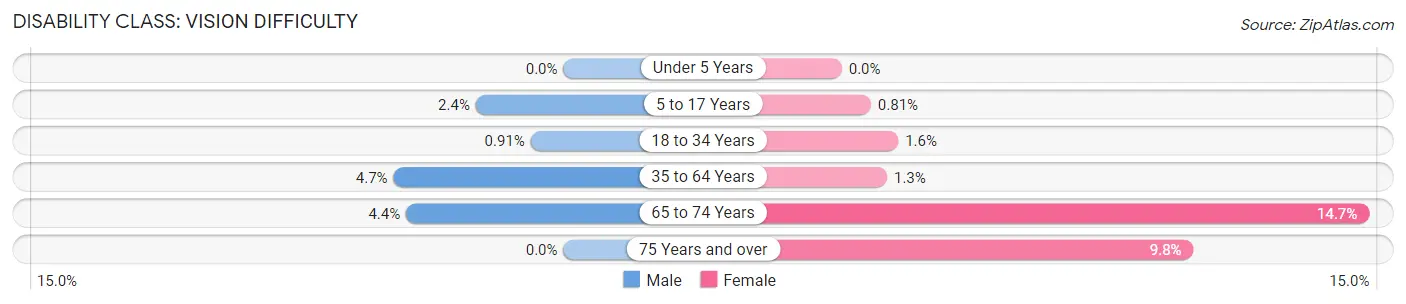
| Age Bracket | Male | Female |
| Under 5 Years | 0 (0.0%) | 0 (0.0%) |
| 5 to 17 Years | 20 (2.4%) | 5 (0.8%) |
| 18 to 34 Years | 9 (0.9%) | 10 (1.6%) |
| 35 to 64 Years | 58 (4.7%) | 15 (1.3%) |
| 65 to 74 Years | 7 (4.4%) | 37 (14.7%) |
| 75 Years and over | 0 (0.0%) | 32 (9.8%) |
Disability Class: Cognitive Difficulty
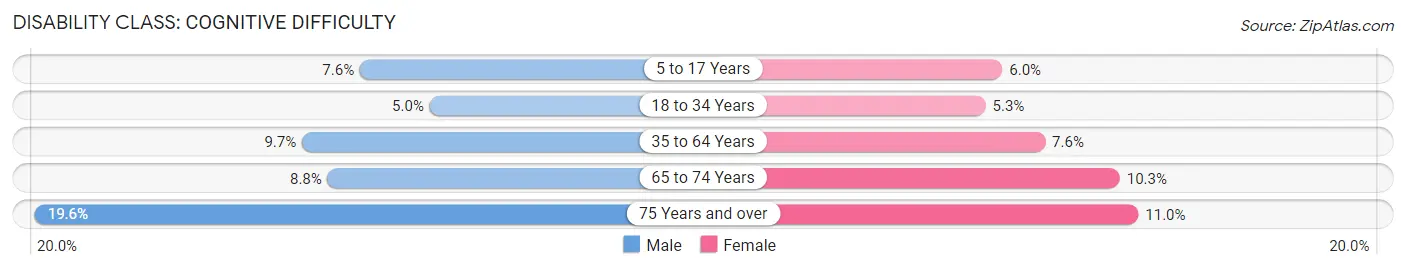
| Age Bracket | Male | Female |
| 5 to 17 Years | 62 (7.5%) | 37 (6.0%) |
| 18 to 34 Years | 49 (5.0%) | 34 (5.3%) |
| 35 to 64 Years | 119 (9.7%) | 90 (7.5%) |
| 65 to 74 Years | 14 (8.7%) | 26 (10.3%) |
| 75 Years and over | 31 (19.6%) | 36 (11.0%) |
Disability Class: Ambulatory Difficulty
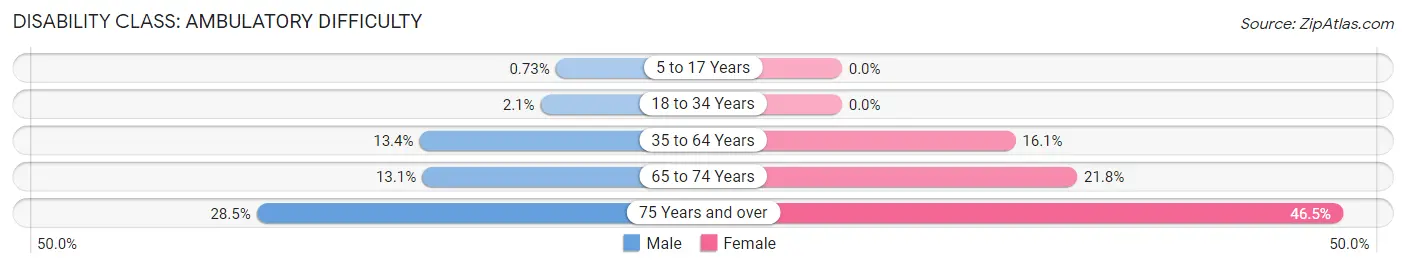
| Age Bracket | Male | Female |
| 5 to 17 Years | 6 (0.7%) | 0 (0.0%) |
| 18 to 34 Years | 21 (2.1%) | 0 (0.0%) |
| 35 to 64 Years | 164 (13.4%) | 192 (16.1%) |
| 65 to 74 Years | 21 (13.1%) | 55 (21.8%) |
| 75 Years and over | 45 (28.5%) | 152 (46.5%) |
Disability Class: Self-Care Difficulty
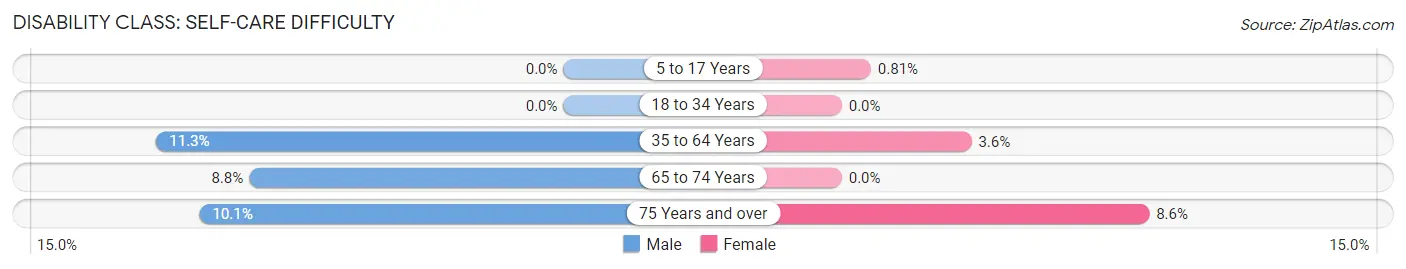
| Age Bracket | Male | Female |
| 5 to 17 Years | 0 (0.0%) | 5 (0.8%) |
| 18 to 34 Years | 0 (0.0%) | 0 (0.0%) |
| 35 to 64 Years | 139 (11.3%) | 43 (3.6%) |
| 65 to 74 Years | 14 (8.7%) | 0 (0.0%) |
| 75 Years and over | 16 (10.1%) | 28 (8.6%) |
Technology Access in Youngtown
Computing Device Access in Youngtown
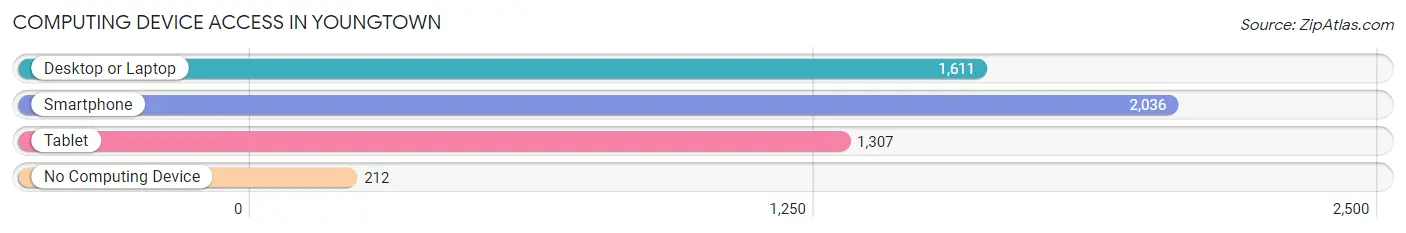
| Device Type | # Households | % Households |
| Desktop or Laptop | 1,611 | 64.5% |
| Smartphone | 2,036 | 81.5% |
| Tablet | 1,307 | 52.3% |
| No Computing Device | 212 | 8.5% |
| Total | 2,499 | 100.0% |
Internet Access in Youngtown
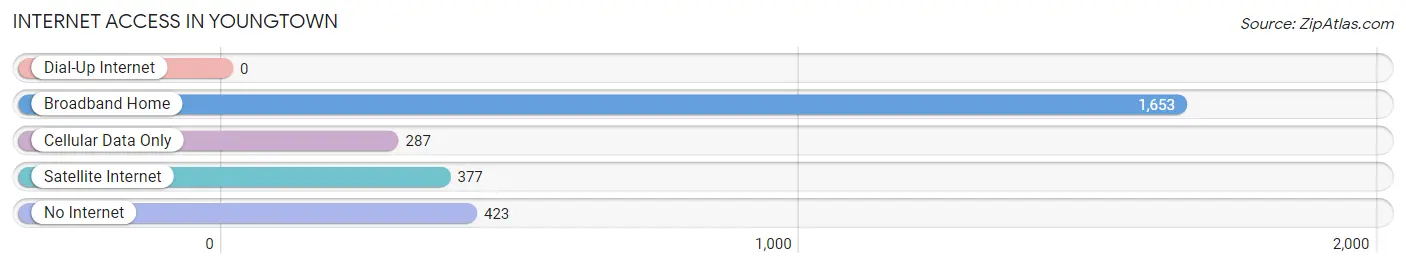
| Internet Type | # Households | % Households |
| Dial-Up Internet | 0 | 0.0% |
| Broadband Home | 1,653 | 66.1% |
| Cellular Data Only | 287 | 11.5% |
| Satellite Internet | 377 | 15.1% |
| No Internet | 423 | 16.9% |
| Total | 2,499 | 100.0% |
Youngtown Summary
Town of Youngtown Arizona
Youngtown, Arizona is a small town located in Maricopa County, Arizona. It is situated in the northwest corner of the Phoenix metropolitan area, and is bordered by the cities of Glendale, Peoria, and Sun City. The town was founded in 1954 and is the oldest incorporated town in Arizona. It is home to a population of approximately 6,000 people.
History
Youngtown was founded in 1954 by a group of retirees from the Midwest. The town was named after the founder, John C. Young, who was a retired businessman from Ohio. The town was incorporated in 1955 and was the first town in Arizona to be incorporated by a group of retirees.
The town was originally designed as a retirement community, and it was the first town in Arizona to have a retirement community. The town was designed to be a self-contained community, with its own shopping center, library, and recreational facilities.
In the early 1960s, the town began to expand and attract more people. The population grew from 1,000 in 1960 to over 6,000 in 2000. The town has continued to grow and attract more people, and the population is now estimated to be around 8,000.
Geography
Youngtown is located in the northwest corner of the Phoenix metropolitan area. It is bordered by the cities of Glendale, Peoria, and Sun City. The town is situated in the Sonoran Desert, and is surrounded by desert vegetation. The town is located at an elevation of 1,100 feet above sea level.
The town is located in the Salt River Valley, and is close to the Salt River. The town is also close to the White Tank Mountains, which are located to the west of the town.
Economy
Youngtown is a small town, and the economy is largely based on tourism and retail. The town is home to several small businesses, including restaurants, shops, and other services. The town also has a few larger businesses, such as a Walmart Supercenter and a Home Depot.
The town is also home to several retirement communities, which provide a steady source of income for the town. The town also has a few manufacturing companies, which provide jobs for the local population.
Demographics
As of the 2010 census, the population of Youngtown was 8,000. The population is largely composed of retirees, with the median age being 65. The town is also home to a large Hispanic population, with over 40% of the population being of Hispanic or Latino origin.
The town is also home to a large number of immigrants, with over 20% of the population being foreign-born. The town is also home to a large number of veterans, with over 10% of the population being veterans.
Conclusion
Youngtown, Arizona is a small town located in Maricopa County, Arizona. It is situated in the northwest corner of the Phoenix metropolitan area, and is bordered by the cities of Glendale, Peoria, and Sun City. The town was founded in 1954 and is the oldest incorporated town in Arizona. It is home to a population of approximately 8,000 people. The town is largely composed of retirees, with the median age being 65. The town is also home to a large Hispanic population, with over 40% of the population being of Hispanic or Latino origin. The town is also home to a large number of immigrants, with over 20% of the population being foreign-born. The town is largely based on tourism and retail, and is home to several small businesses, as well as a few larger businesses. The town is also home to several retirement communities, which provide a steady source of income for the town.
Common Questions
What is Per Capita Income in Youngtown?
Per Capita income in Youngtown is $24,425.
What is the Median Family Income in Youngtown?
Median Family Income in Youngtown is $68,281.
What is the Median Household income in Youngtown?
Median Household Income in Youngtown is $56,449.
What is Income or Wage Gap in Youngtown?
Income or Wage Gap in Youngtown is 29.5%.
Women in Youngtown earn 70.5 cents for every dollar earned by a man.
What is Inequality or Gini Index in Youngtown?
Inequality or Gini Index in Youngtown is 0.38.
What is the Total Population of Youngtown?
Total Population of Youngtown is 6,980.
What is the Total Male Population of Youngtown?
Total Male Population of Youngtown is 3,745.
What is the Total Female Population of Youngtown?
Total Female Population of Youngtown is 3,235.
What is the Ratio of Males per 100 Females in Youngtown?
There are 115.77 Males per 100 Females in Youngtown.
What is the Ratio of Females per 100 Males in Youngtown?
There are 86.38 Females per 100 Males in Youngtown.
What is the Median Population Age in Youngtown?
Median Population Age in Youngtown is 37.6 Years.
What is the Average Family Size in Youngtown
Average Family Size in Youngtown is 3.5 People.
What is the Average Household Size in Youngtown
Average Household Size in Youngtown is 2.7 People.
How Large is the Labor Force in Youngtown?
There are 3,249 People in the Labor Forcein in Youngtown.
What is the Percentage of People in the Labor Force in Youngtown?
56.9% of People are in the Labor Force in Youngtown.
What is the Unemployment Rate in Youngtown?
Unemployment Rate in Youngtown is 5.1%.