Ypsilanti, MI Map & Demographics
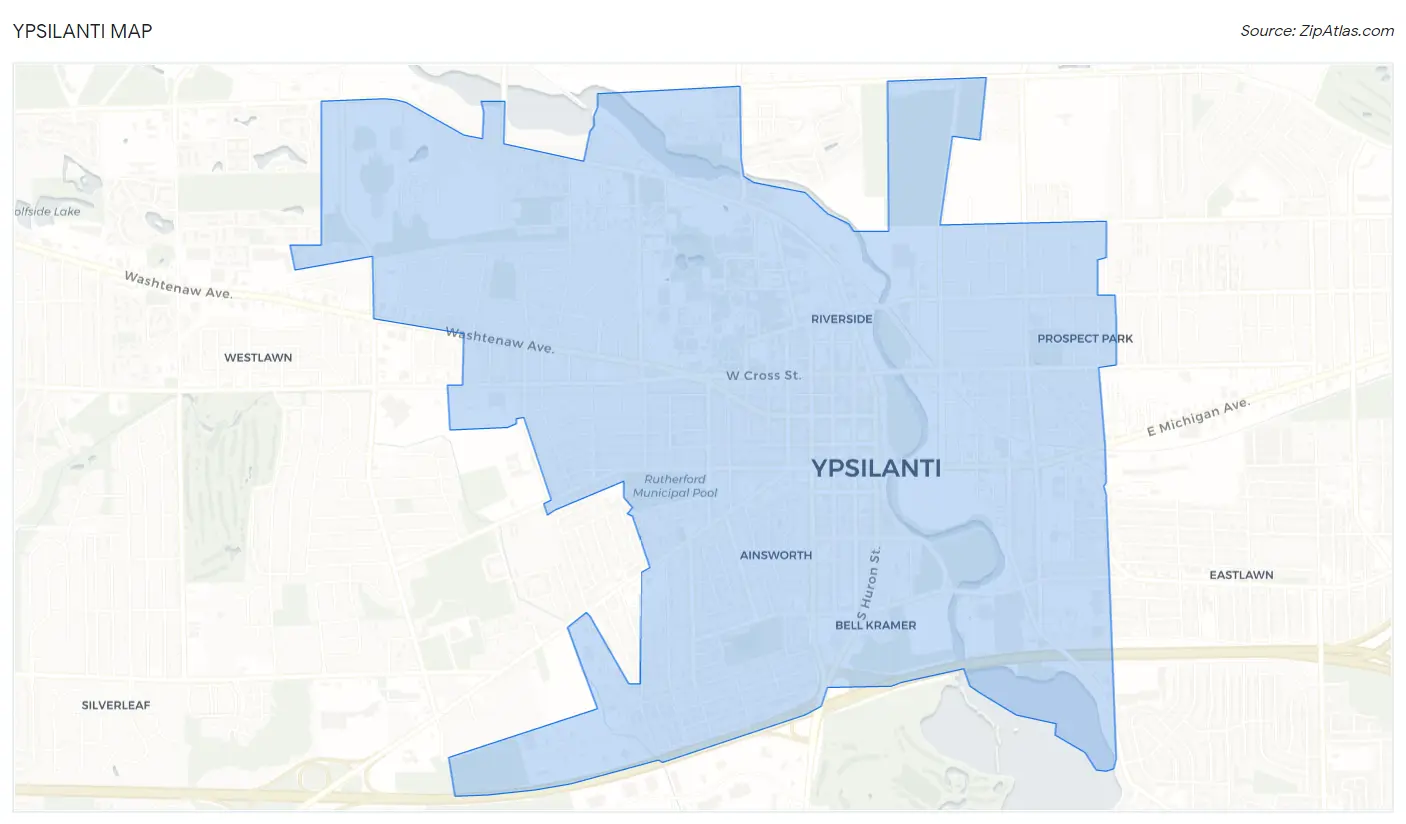
Ypsilanti Map
Ypsilanti Overview
$30,863
PER CAPITA INCOME
$59,542
AVG FAMILY INCOME
$41,914
AVG HOUSEHOLD INCOME
37.3%
WAGE / INCOME GAP [ % ]
62.7¢/ $1
WAGE / INCOME GAP [ $ ]
$11,074
FAMILY INCOME DEFICIT
0.49
INEQUALITY / GINI INDEX
20,204
TOTAL POPULATION
10,100
MALE POPULATION
10,104
FEMALE POPULATION
99.96
MALES / 100 FEMALES
100.04
FEMALES / 100 MALES
26.5
MEDIAN AGE
3.0
AVG FAMILY SIZE
2.0
AVG HOUSEHOLD SIZE
11,407
LABOR FORCE [ PEOPLE ]
65.2%
PERCENT IN LABOR FORCE
8.1%
UNEMPLOYMENT RATE
Ypsilanti Area Codes
Income in Ypsilanti
Income Overview in Ypsilanti
Per Capita Income in Ypsilanti is $30,863, while median incomes of families and households are $59,542 and $41,914 respectively.
| Characteristic | Number | Measure |
| Per Capita Income | 20,204 | $30,863 |
| Median Family Income | 2,886 | $59,542 |
| Mean Family Income | 2,886 | $83,775 |
| Median Household Income | 8,625 | $41,914 |
| Mean Household Income | 8,625 | $60,920 |
| Income Deficit | 2,886 | $11,074 |
| Wage / Income Gap (%) | 20,204 | 37.27% |
| Wage / Income Gap ($) | 20,204 | 62.73¢ per $1 |
| Gini / Inequality Index | 20,204 | 0.49 |
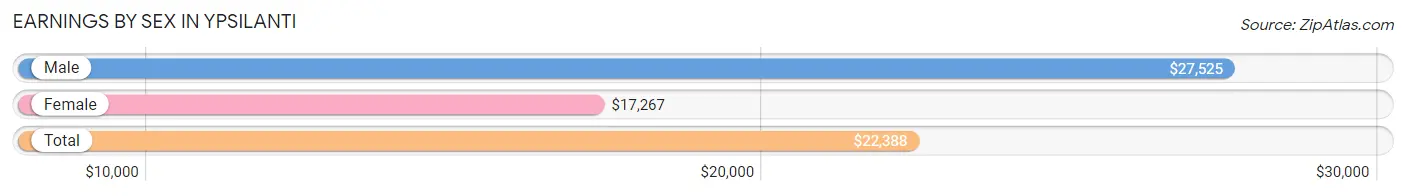
Earnings by Sex in Ypsilanti
Average Earnings in Ypsilanti are $22,388, $27,525 for men and $17,267 for women, a difference of 37.3%.
| Sex | Number | Average Earnings |
| Male | 6,816 (51.1%) | $27,525 |
| Female | 6,524 (48.9%) | $17,267 |
| Total | 13,340 (100.0%) | $22,388 |
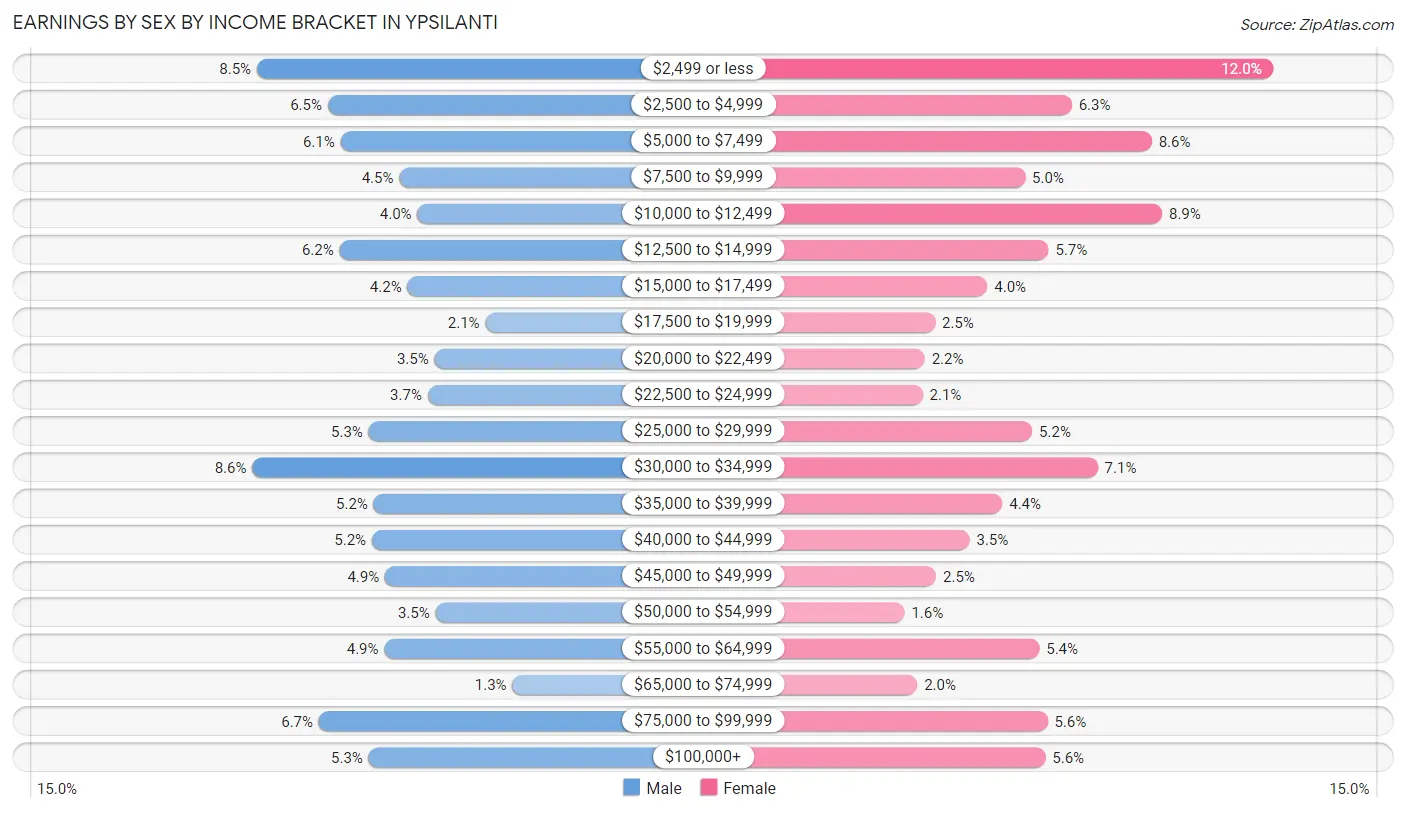
Earnings by Sex by Income Bracket in Ypsilanti
The most common earnings brackets in Ypsilanti are $30,000 to $34,999 for men (586 | 8.6%) and $2,499 or less for women (782 | 12.0%).
| Income | Male | Female |
| $2,499 or less | 577 (8.5%) | 782 (12.0%) |
| $2,500 to $4,999 | 442 (6.5%) | 412 (6.3%) |
| $5,000 to $7,499 | 417 (6.1%) | 559 (8.6%) |
| $7,500 to $9,999 | 305 (4.5%) | 327 (5.0%) |
| $10,000 to $12,499 | 270 (4.0%) | 578 (8.9%) |
| $12,500 to $14,999 | 419 (6.1%) | 370 (5.7%) |
| $15,000 to $17,499 | 289 (4.2%) | 258 (4.0%) |
| $17,500 to $19,999 | 140 (2.1%) | 162 (2.5%) |
| $20,000 to $22,499 | 237 (3.5%) | 143 (2.2%) |
| $22,500 to $24,999 | 250 (3.7%) | 139 (2.1%) |
| $25,000 to $29,999 | 363 (5.3%) | 340 (5.2%) |
| $30,000 to $34,999 | 586 (8.6%) | 460 (7.0%) |
| $35,000 to $39,999 | 354 (5.2%) | 285 (4.4%) |
| $40,000 to $44,999 | 357 (5.2%) | 225 (3.5%) |
| $45,000 to $49,999 | 332 (4.9%) | 164 (2.5%) |
| $50,000 to $54,999 | 235 (3.5%) | 106 (1.6%) |
| $55,000 to $64,999 | 333 (4.9%) | 353 (5.4%) |
| $65,000 to $74,999 | 88 (1.3%) | 129 (2.0%) |
| $75,000 to $99,999 | 459 (6.7%) | 368 (5.6%) |
| $100,000+ | 363 (5.3%) | 364 (5.6%) |
| Total | 6,816 (100.0%) | 6,524 (100.0%) |
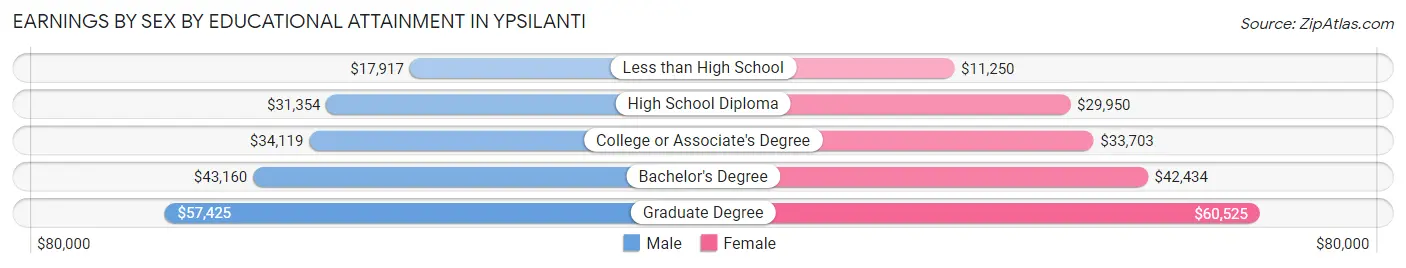
Earnings by Sex by Educational Attainment in Ypsilanti
Average earnings in Ypsilanti are $38,522 for men and $37,232 for women, a difference of 3.4%. Men with an educational attainment of graduate degree enjoy the highest average annual earnings of $57,425, while those with less than high school education earn the least with $17,917. Women with an educational attainment of graduate degree earn the most with the average annual earnings of $60,525, while those with less than high school education have the smallest earnings of $11,250.
| Educational Attainment | Male Income | Female Income |
| Less than High School | $17,917 | $11,250 |
| High School Diploma | $31,354 | $29,950 |
| College or Associate's Degree | $34,119 | $33,703 |
| Bachelor's Degree | $43,160 | $42,434 |
| Graduate Degree | $57,425 | $60,525 |
| Total | $38,522 | $37,232 |
Family Income in Ypsilanti
Family Income Brackets in Ypsilanti
According to the Ypsilanti family income data, there are 540 families falling into the $50,000 to $74,999 income range, which is the most common income bracket and makes up 18.7% of all families. Conversely, the $10,000 to $14,999 income bracket is the least frequent group with only 173 families (6.0%) belonging to this category.
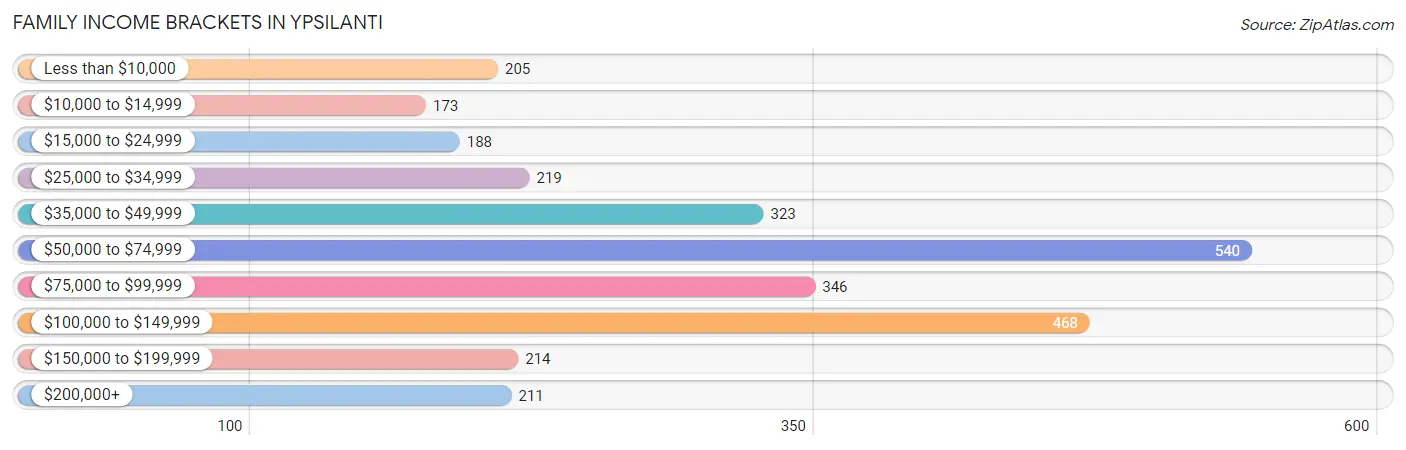
| Income Bracket | # Families | % Families |
| Less than $10,000 | 205 | 7.1% |
| $10,000 to $14,999 | 173 | 6.0% |
| $15,000 to $24,999 | 188 | 6.5% |
| $25,000 to $34,999 | 219 | 7.6% |
| $35,000 to $49,999 | 323 | 11.2% |
| $50,000 to $74,999 | 540 | 18.7% |
| $75,000 to $99,999 | 346 | 12.0% |
| $100,000 to $149,999 | 468 | 16.2% |
| $150,000 to $199,999 | 214 | 7.4% |
| $200,000+ | 211 | 7.3% |
Family Income by Famaliy Size in Ypsilanti
7+ person families (39 | 1.3%) account for the highest median family income in Ypsilanti with $76,336 per family, while 2-person families (1,536 | 53.2%) have the highest median income of $28,125 per family member.
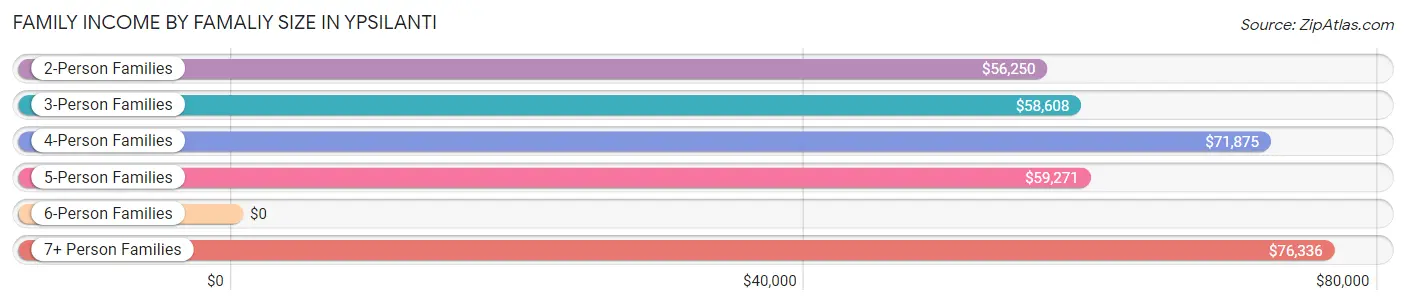
| Income Bracket | # Families | Median Income |
| 2-Person Families | 1,536 (53.2%) | $56,250 |
| 3-Person Families | 670 (23.2%) | $58,608 |
| 4-Person Families | 421 (14.6%) | $71,875 |
| 5-Person Families | 163 (5.7%) | $59,271 |
| 6-Person Families | 57 (2.0%) | $0 |
| 7+ Person Families | 39 (1.3%) | $76,336 |
| Total | 2,886 (100.0%) | $59,542 |
Family Income by Number of Earners in Ypsilanti
The median family income in Ypsilanti is $59,542, with families comprising 3+ earners (144) having the highest median family income of $104,432, while families with 1 earner (1,259) have the lowest median family income of $40,293, accounting for 5.0% and 43.6% of families, respectively.
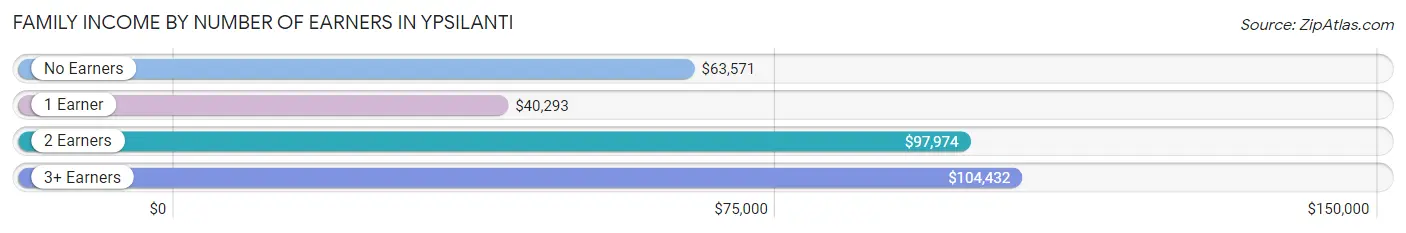
| Number of Earners | # Families | Median Income |
| No Earners | 414 (14.3%) | $63,571 |
| 1 Earner | 1,259 (43.6%) | $40,293 |
| 2 Earners | 1,069 (37.0%) | $97,974 |
| 3+ Earners | 144 (5.0%) | $104,432 |
| Total | 2,886 (100.0%) | $59,542 |
Household Income in Ypsilanti
Household Income Brackets in Ypsilanti
With 1,466 households falling in the category, the $50,000 to $74,999 income range is the most frequent in Ypsilanti, accounting for 17.0% of all households. In contrast, only 345 households (4.0%) fall into the $150,000 to $199,999 income bracket, making it the least populous group.
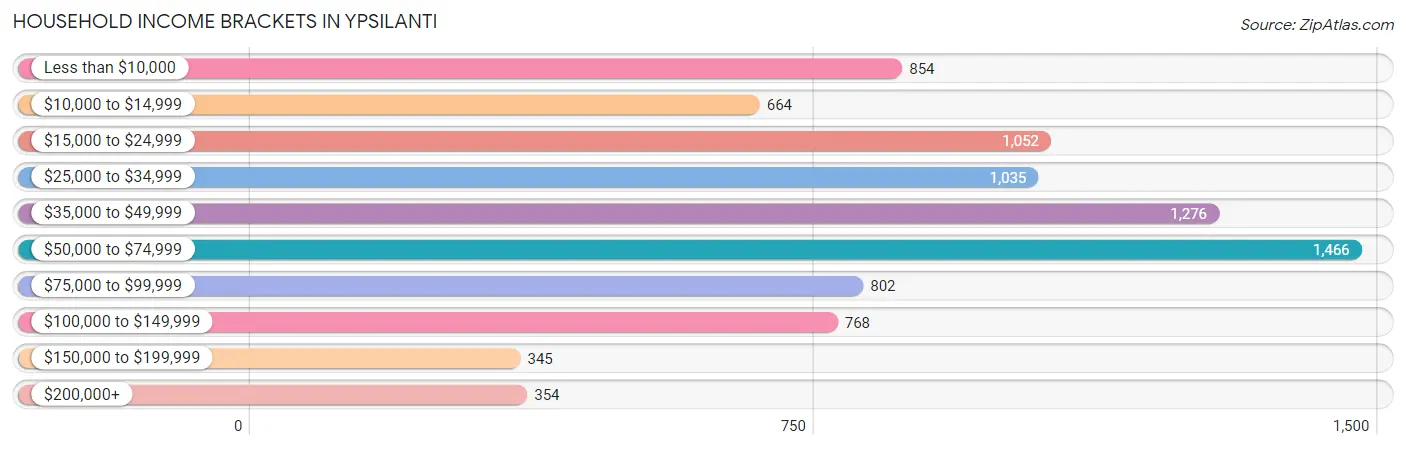
| Income Bracket | # Households | % Households |
| Less than $10,000 | 854 | 9.9% |
| $10,000 to $14,999 | 664 | 7.7% |
| $15,000 to $24,999 | 1,052 | 12.2% |
| $25,000 to $34,999 | 1,035 | 12.0% |
| $35,000 to $49,999 | 1,276 | 14.8% |
| $50,000 to $74,999 | 1,466 | 17.0% |
| $75,000 to $99,999 | 802 | 9.3% |
| $100,000 to $149,999 | 768 | 8.9% |
| $150,000 to $199,999 | 345 | 4.0% |
| $200,000+ | 354 | 4.1% |
Household Income by Householder Age in Ypsilanti
The median household income in Ypsilanti is $41,914, with the highest median household income of $48,308 found in the 25 to 44 years age bracket for the primary householder. A total of 3,755 households (43.5%) fall into this category. Meanwhile, the 15 to 24 years age bracket for the primary householder has the lowest median household income of $26,571, with 1,667 households (19.3%) in this group.
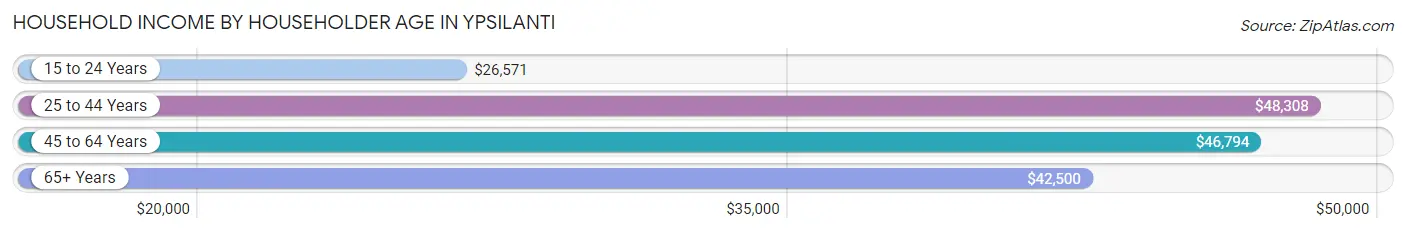
| Income Bracket | # Households | Median Income |
| 15 to 24 Years | 1,667 (19.3%) | $26,571 |
| 25 to 44 Years | 3,755 (43.5%) | $48,308 |
| 45 to 64 Years | 2,087 (24.2%) | $46,794 |
| 65+ Years | 1,116 (12.9%) | $42,500 |
| Total | 8,625 (100.0%) | $41,914 |
Poverty in Ypsilanti
Income Below Poverty by Sex and Age in Ypsilanti
With 25.3% poverty level for males and 29.3% for females among the residents of Ypsilanti, 18 to 24 year old males and 5 year old females are the most vulnerable to poverty, with 977 males (50.0%) and 48 females (66.7%) in their respective age groups living below the poverty level.
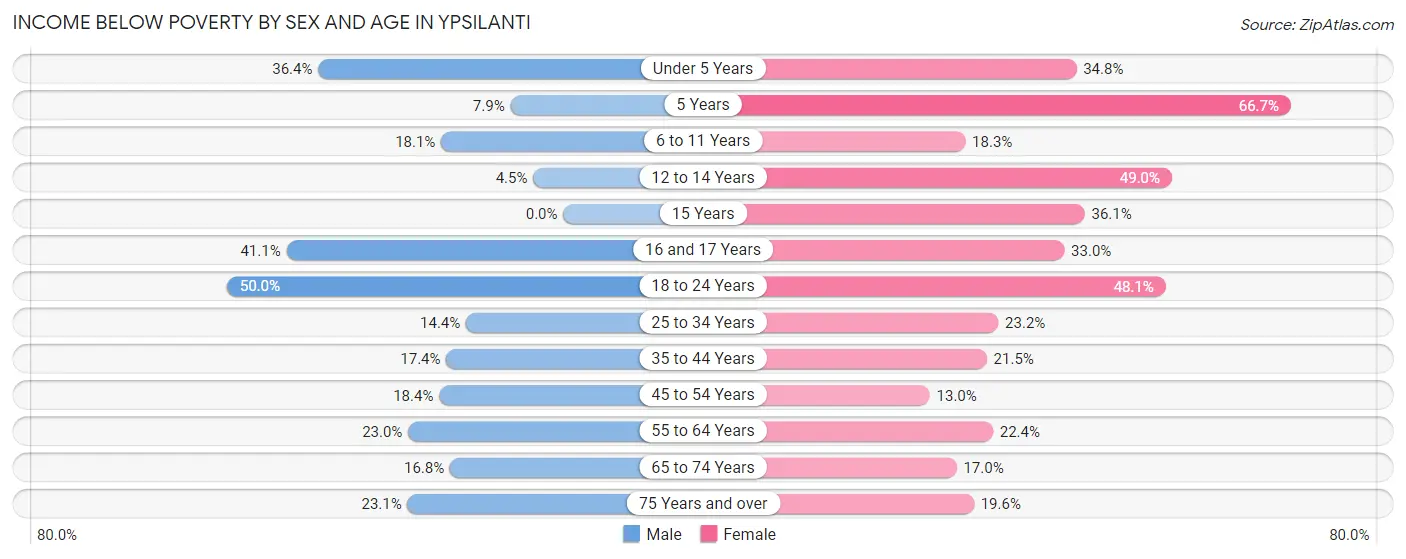
| Age Bracket | Male | Female |
| Under 5 Years | 115 (36.4%) | 181 (34.8%) |
| 5 Years | 19 (7.9%) | 48 (66.7%) |
| 6 to 11 Years | 82 (18.1%) | 87 (18.3%) |
| 12 to 14 Years | 10 (4.5%) | 149 (49.0%) |
| 15 Years | 0 (0.0%) | 31 (36.0%) |
| 16 and 17 Years | 74 (41.1%) | 71 (33.0%) |
| 18 to 24 Years | 977 (50.0%) | 917 (48.1%) |
| 25 to 34 Years | 287 (14.4%) | 366 (23.2%) |
| 35 to 44 Years | 178 (17.4%) | 242 (21.5%) |
| 45 to 54 Years | 162 (18.4%) | 82 (13.0%) |
| 55 to 64 Years | 162 (23.0%) | 180 (22.4%) |
| 65 to 74 Years | 85 (16.8%) | 87 (17.0%) |
| 75 Years and over | 68 (23.1%) | 67 (19.6%) |
| Total | 2,219 (25.3%) | 2,508 (29.3%) |
Income Above Poverty by Sex and Age in Ypsilanti
According to the poverty statistics in Ypsilanti, males aged 15 years and females aged 45 to 54 years are the age groups that are most secure financially, with 100.0% of males and 87.0% of females in these age groups living above the poverty line.
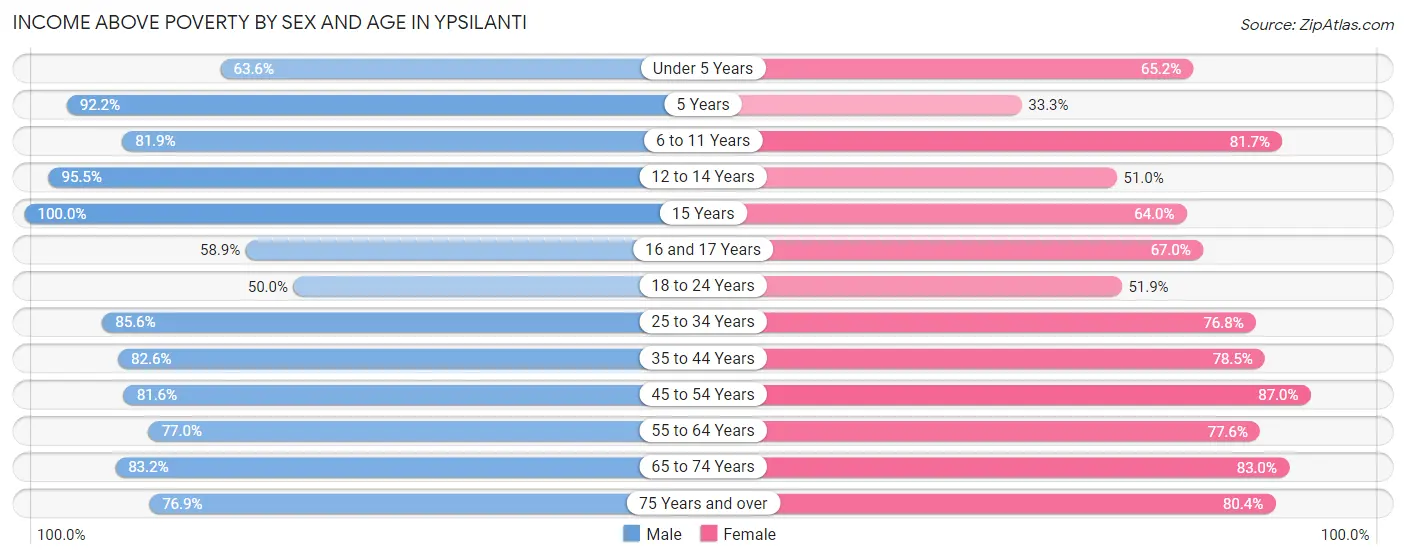
| Age Bracket | Male | Female |
| Under 5 Years | 201 (63.6%) | 339 (65.2%) |
| 5 Years | 223 (92.1%) | 24 (33.3%) |
| 6 to 11 Years | 370 (81.9%) | 388 (81.7%) |
| 12 to 14 Years | 214 (95.5%) | 155 (51.0%) |
| 15 Years | 11 (100.0%) | 55 (63.9%) |
| 16 and 17 Years | 106 (58.9%) | 144 (67.0%) |
| 18 to 24 Years | 978 (50.0%) | 990 (51.9%) |
| 25 to 34 Years | 1,701 (85.6%) | 1,210 (76.8%) |
| 35 to 44 Years | 847 (82.6%) | 883 (78.5%) |
| 45 to 54 Years | 717 (81.6%) | 547 (87.0%) |
| 55 to 64 Years | 541 (77.0%) | 623 (77.6%) |
| 65 to 74 Years | 420 (83.2%) | 424 (83.0%) |
| 75 Years and over | 226 (76.9%) | 275 (80.4%) |
| Total | 6,555 (74.7%) | 6,057 (70.7%) |
Income Below Poverty Among Married-Couple Families in Ypsilanti
The poverty statistics for married-couple families in Ypsilanti show that 9.3% or 157 of the total 1,679 families live below the poverty line. Families with 3 or 4 children have the highest poverty rate of 15.8%, comprising of 19 families. On the other hand, families with 5 or more children have the lowest poverty rate of 0.0%, which includes 0 families.
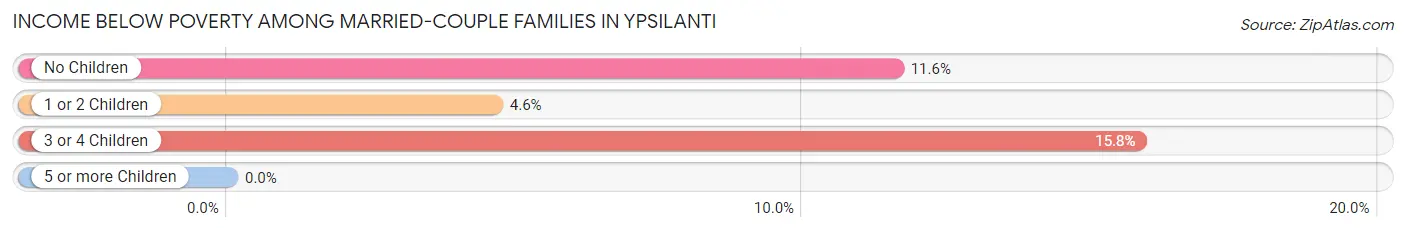
| Children | Above Poverty | Below Poverty |
| No Children | 839 (88.4%) | 110 (11.6%) |
| 1 or 2 Children | 580 (95.4%) | 28 (4.6%) |
| 3 or 4 Children | 101 (84.2%) | 19 (15.8%) |
| 5 or more Children | 2 (100.0%) | 0 (0.0%) |
| Total | 1,522 (90.6%) | 157 (9.3%) |
Income Below Poverty Among Single-Parent Households in Ypsilanti
According to the poverty data in Ypsilanti, 9.8% or 24 single-father households and 41.2% or 397 single-mother households are living below the poverty line. Among single-father households, those with 1 or 2 children have the highest poverty rate, with 7 households (11.3%) experiencing poverty. Likewise, among single-mother households, those with 3 or 4 children have the highest poverty rate, with 107 households (83.0%) falling below the poverty line.
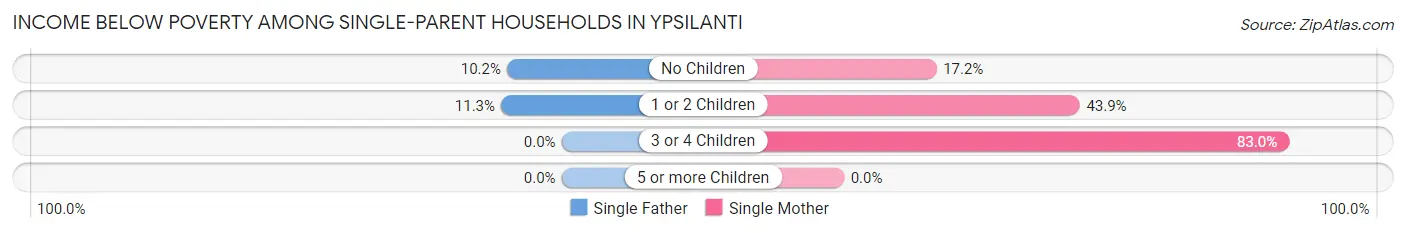
| Children | Single Father | Single Mother |
| No Children | 17 (10.2%) | 41 (17.2%) |
| 1 or 2 Children | 7 (11.3%) | 249 (43.9%) |
| 3 or 4 Children | 0 (0.0%) | 107 (83.0%) |
| 5 or more Children | 0 (0.0%) | 0 (0.0%) |
| Total | 24 (9.8%) | 397 (41.2%) |
Income Below Poverty Among Married-Couple vs Single-Parent Households in Ypsilanti
The poverty data for Ypsilanti shows that 157 of the married-couple family households (9.3%) and 421 of the single-parent households (34.9%) are living below the poverty level. Within the married-couple family households, those with 3 or 4 children have the highest poverty rate, with 19 households (15.8%) falling below the poverty line. Among the single-parent households, those with 3 or 4 children have the highest poverty rate, with 107 household (74.3%) living below poverty.
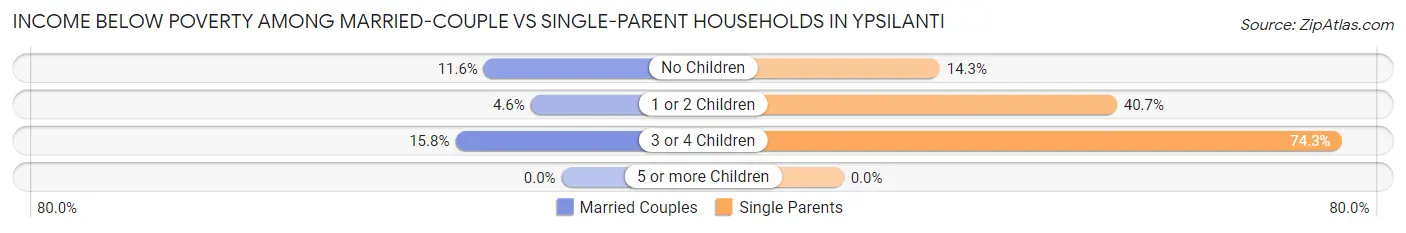
| Children | Married-Couple Families | Single-Parent Households |
| No Children | 110 (11.6%) | 58 (14.3%) |
| 1 or 2 Children | 28 (4.6%) | 256 (40.7%) |
| 3 or 4 Children | 19 (15.8%) | 107 (74.3%) |
| 5 or more Children | 0 (0.0%) | 0 (0.0%) |
| Total | 157 (9.3%) | 421 (34.9%) |
Race in Ypsilanti
The most populous races in Ypsilanti are White / Caucasian (12,253 | 60.7%), Black / African American (4,861 | 24.1%), and Two or more Races (1,764 | 8.7%).
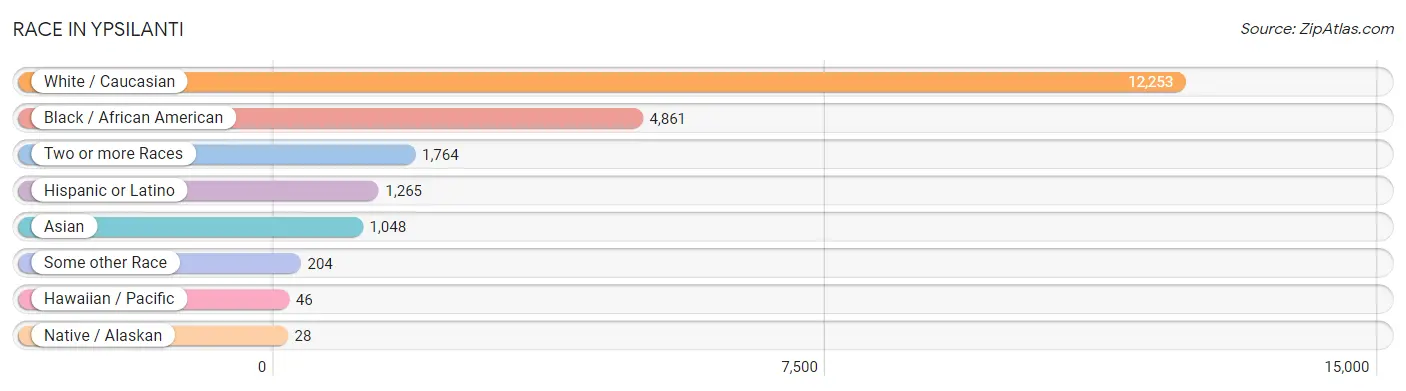
| Race | # Population | % Population |
| Asian | 1,048 | 5.2% |
| Black / African American | 4,861 | 24.1% |
| Hawaiian / Pacific | 46 | 0.2% |
| Hispanic or Latino | 1,265 | 6.3% |
| Native / Alaskan | 28 | 0.1% |
| White / Caucasian | 12,253 | 60.7% |
| Two or more Races | 1,764 | 8.7% |
| Some other Race | 204 | 1.0% |
| Total | 20,204 | 100.0% |
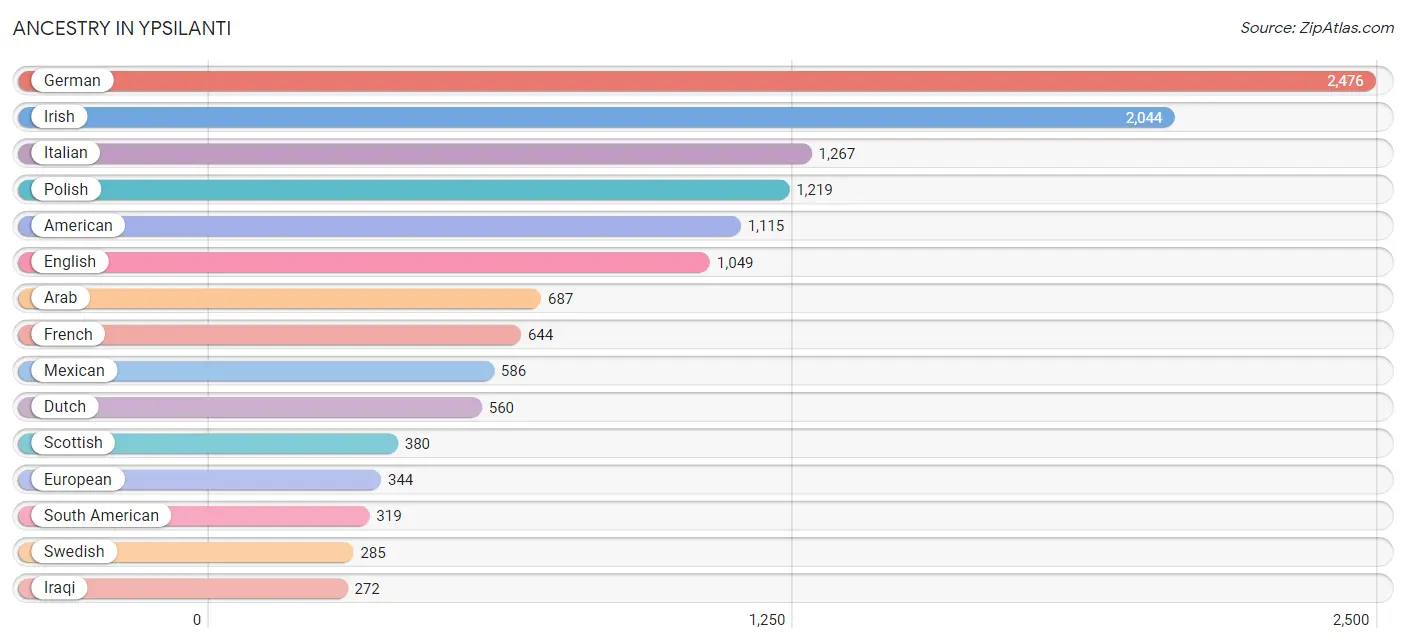
Ancestry in Ypsilanti
The most populous ancestries reported in Ypsilanti are German (2,476 | 12.2%), Irish (2,044 | 10.1%), Italian (1,267 | 6.3%), Polish (1,219 | 6.0%), and American (1,115 | 5.5%), together accounting for 40.2% of all Ypsilanti residents.
| Ancestry | # Population | % Population |
| Afghan | 240 | 1.2% |
| African | 98 | 0.5% |
| Albanian | 53 | 0.3% |
| American | 1,115 | 5.5% |
| Arab | 687 | 3.4% |
| Argentinean | 5 | 0.0% |
| Armenian | 30 | 0.2% |
| Assyrian / Chaldean / Syriac | 14 | 0.1% |
| Austrian | 42 | 0.2% |
| Belgian | 44 | 0.2% |
| Bhutanese | 67 | 0.3% |
| Blackfeet | 110 | 0.5% |
| Bolivian | 18 | 0.1% |
| Brazilian | 30 | 0.2% |
| British | 253 | 1.3% |
| Burmese | 167 | 0.8% |
| Canadian | 121 | 0.6% |
| Celtic | 46 | 0.2% |
| Central American | 175 | 0.9% |
| Cherokee | 92 | 0.5% |
| Chickasaw | 27 | 0.1% |
| Chilean | 242 | 1.2% |
| Chippewa | 36 | 0.2% |
| Colombian | 14 | 0.1% |
| Croatian | 50 | 0.3% |
| Czech | 73 | 0.4% |
| Czechoslovakian | 16 | 0.1% |
| Danish | 17 | 0.1% |
| Delaware | 4 | 0.0% |
| Dominican | 4 | 0.0% |
| Dutch | 560 | 2.8% |
| Eastern European | 30 | 0.2% |
| English | 1,049 | 5.2% |
| Ethiopian | 8 | 0.0% |
| European | 344 | 1.7% |
| Filipino | 26 | 0.1% |
| Finnish | 97 | 0.5% |
| French | 644 | 3.2% |
| French American Indian | 27 | 0.1% |
| French Canadian | 98 | 0.5% |
| German | 2,476 | 12.2% |
| Greek | 147 | 0.7% |
| Guamanian / Chamorro | 46 | 0.2% |
| Guatemalan | 48 | 0.2% |
| Haitian | 6 | 0.0% |
| Honduran | 120 | 0.6% |
| Hungarian | 169 | 0.8% |
| Indian (Asian) | 263 | 1.3% |
| Iranian | 15 | 0.1% |
| Iraqi | 272 | 1.3% |
| Irish | 2,044 | 10.1% |
| Israeli | 9 | 0.0% |
| Italian | 1,267 | 6.3% |
| Japanese | 10 | 0.1% |
| Korean | 54 | 0.3% |
| Laotian | 22 | 0.1% |
| Latvian | 22 | 0.1% |
| Lebanese | 31 | 0.2% |
| Lithuanian | 75 | 0.4% |
| Macedonian | 22 | 0.1% |
| Maltese | 17 | 0.1% |
| Mexican | 586 | 2.9% |
| Mexican American Indian | 9 | 0.0% |
| Moroccan | 8 | 0.0% |
| Native Hawaiian | 4 | 0.0% |
| Nigerian | 77 | 0.4% |
| Northern European | 28 | 0.1% |
| Norwegian | 139 | 0.7% |
| Ottawa | 22 | 0.1% |
| Panamanian | 7 | 0.0% |
| Paraguayan | 18 | 0.1% |
| Peruvian | 9 | 0.0% |
| Polish | 1,219 | 6.0% |
| Portuguese | 19 | 0.1% |
| Puerto Rican | 132 | 0.6% |
| Romanian | 20 | 0.1% |
| Russian | 157 | 0.8% |
| Samoan | 15 | 0.1% |
| Scandinavian | 31 | 0.2% |
| Scotch-Irish | 234 | 1.2% |
| Scottish | 380 | 1.9% |
| Seminole | 7 | 0.0% |
| Serbian | 28 | 0.1% |
| Sioux | 3 | 0.0% |
| Slovak | 32 | 0.2% |
| South American | 319 | 1.6% |
| Spanish | 19 | 0.1% |
| Spanish American | 11 | 0.1% |
| Sri Lankan | 65 | 0.3% |
| Subsaharan African | 260 | 1.3% |
| Sudanese | 77 | 0.4% |
| Swedish | 285 | 1.4% |
| Swiss | 16 | 0.1% |
| Syrian | 32 | 0.2% |
| Thai | 265 | 1.3% |
| Ukrainian | 96 | 0.5% |
| Venezuelan | 13 | 0.1% |
| Vietnamese | 6 | 0.0% |
| Welsh | 69 | 0.3% |
| West Indian | 13 | 0.1% |
| Yaqui | 1 | 0.0% | View All 101 Rows |
Immigrants in Ypsilanti
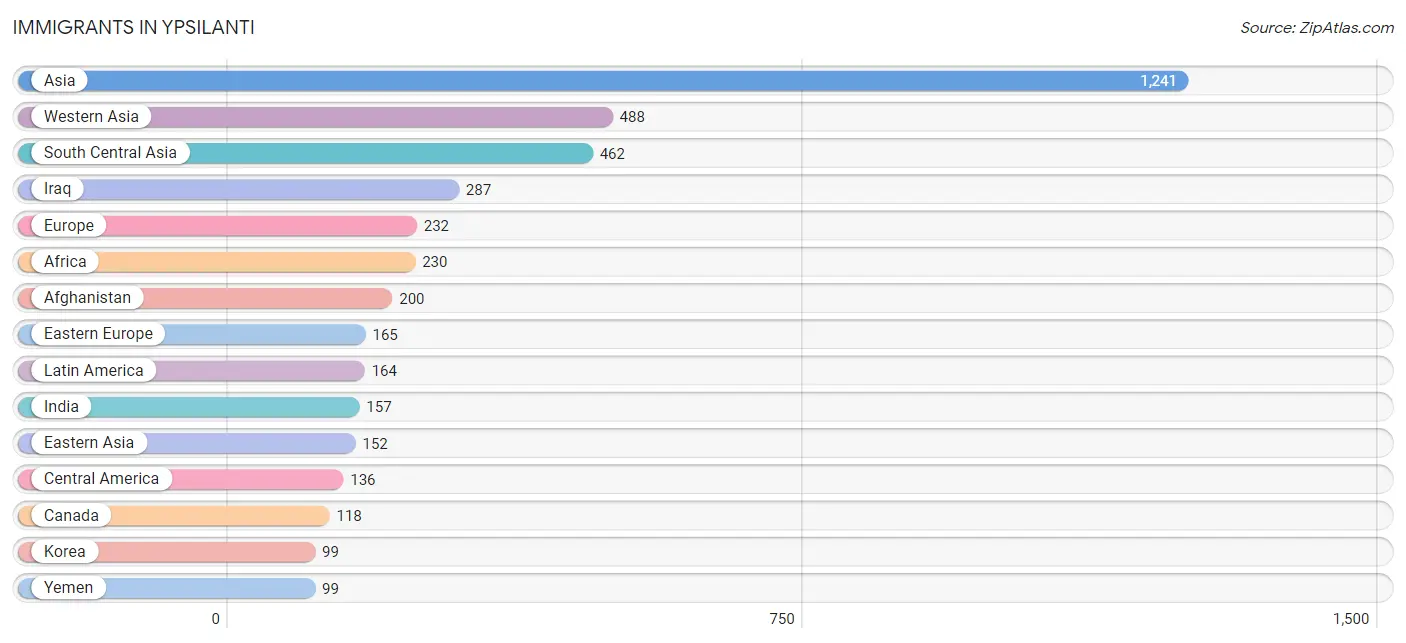
The most numerous immigrant groups reported in Ypsilanti came from Asia (1,241 | 6.1%), Western Asia (488 | 2.4%), South Central Asia (462 | 2.3%), Iraq (287 | 1.4%), and Europe (232 | 1.1%), together accounting for 13.4% of all Ypsilanti residents.
| Immigration Origin | # Population | % Population |
| Afghanistan | 200 | 1.0% |
| Africa | 230 | 1.1% |
| Albania | 48 | 0.2% |
| Asia | 1,241 | 6.1% |
| Austria | 3 | 0.0% |
| Brazil | 11 | 0.1% |
| Canada | 118 | 0.6% |
| Central America | 136 | 0.7% |
| Chile | 2 | 0.0% |
| China | 40 | 0.2% |
| Eastern Africa | 49 | 0.2% |
| Eastern Asia | 152 | 0.7% |
| Eastern Europe | 165 | 0.8% |
| Ethiopia | 34 | 0.2% |
| Europe | 232 | 1.1% |
| Germany | 22 | 0.1% |
| Guatemala | 35 | 0.2% |
| Guyana | 7 | 0.0% |
| Honduras | 59 | 0.3% |
| Hong Kong | 3 | 0.0% |
| India | 157 | 0.8% |
| Indonesia | 5 | 0.0% |
| Iran | 19 | 0.1% |
| Iraq | 287 | 1.4% |
| Israel | 5 | 0.0% |
| Italy | 6 | 0.0% |
| Japan | 13 | 0.1% |
| Jordan | 11 | 0.1% |
| Kenya | 4 | 0.0% |
| Korea | 99 | 0.5% |
| Latin America | 164 | 0.8% |
| Latvia | 53 | 0.3% |
| Lebanon | 8 | 0.0% |
| Lithuania | 12 | 0.1% |
| Malaysia | 3 | 0.0% |
| Mexico | 42 | 0.2% |
| Middle Africa | 16 | 0.1% |
| Morocco | 8 | 0.0% |
| Nepal | 6 | 0.0% |
| Netherlands | 21 | 0.1% |
| Nigeria | 26 | 0.1% |
| Northern Africa | 53 | 0.3% |
| Northern Europe | 15 | 0.1% |
| Pakistan | 27 | 0.1% |
| Philippines | 12 | 0.1% |
| Poland | 11 | 0.1% |
| Russia | 12 | 0.1% |
| South Africa | 5 | 0.0% |
| South America | 28 | 0.1% |
| South Central Asia | 462 | 2.3% |
| South Eastern Asia | 53 | 0.3% |
| Southern Europe | 6 | 0.0% |
| Sudan | 27 | 0.1% |
| Syria | 78 | 0.4% |
| Taiwan | 16 | 0.1% |
| Uganda | 11 | 0.1% |
| Ukraine | 29 | 0.1% |
| Uzbekistan | 53 | 0.3% |
| Venezuela | 1 | 0.0% |
| Vietnam | 33 | 0.2% |
| Western Africa | 26 | 0.1% |
| Western Asia | 488 | 2.4% |
| Western Europe | 46 | 0.2% |
| Yemen | 99 | 0.5% |
| Zaire | 16 | 0.1% | View All 65 Rows |
Sex and Age in Ypsilanti
Sex and Age in Ypsilanti
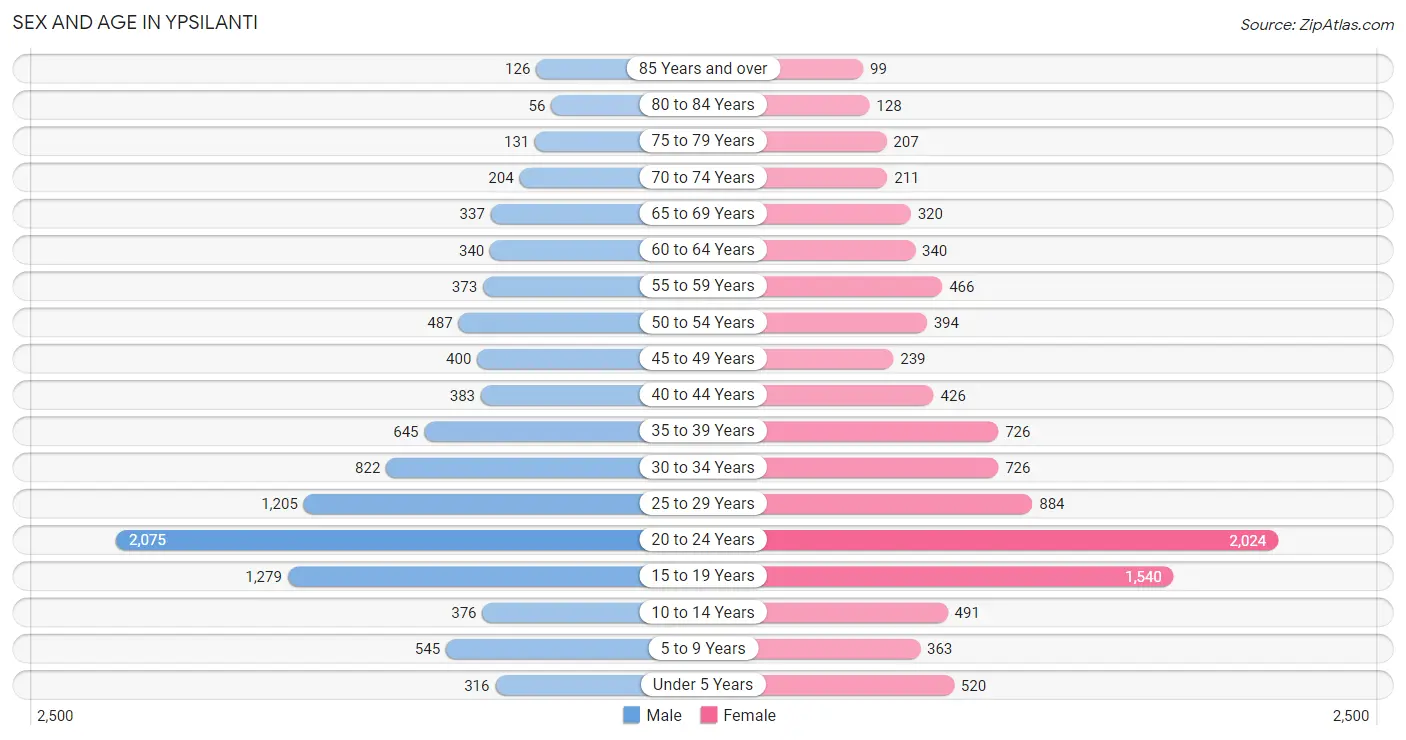
The most populous age groups in Ypsilanti are 20 to 24 Years (2,075 | 20.5%) for men and 20 to 24 Years (2,024 | 20.0%) for women.
| Age Bracket | Male | Female |
| Under 5 Years | 316 (3.1%) | 520 (5.1%) |
| 5 to 9 Years | 545 (5.4%) | 363 (3.6%) |
| 10 to 14 Years | 376 (3.7%) | 491 (4.9%) |
| 15 to 19 Years | 1,279 (12.7%) | 1,540 (15.2%) |
| 20 to 24 Years | 2,075 (20.5%) | 2,024 (20.0%) |
| 25 to 29 Years | 1,205 (11.9%) | 884 (8.7%) |
| 30 to 34 Years | 822 (8.1%) | 726 (7.2%) |
| 35 to 39 Years | 645 (6.4%) | 726 (7.2%) |
| 40 to 44 Years | 383 (3.8%) | 426 (4.2%) |
| 45 to 49 Years | 400 (4.0%) | 239 (2.4%) |
| 50 to 54 Years | 487 (4.8%) | 394 (3.9%) |
| 55 to 59 Years | 373 (3.7%) | 466 (4.6%) |
| 60 to 64 Years | 340 (3.4%) | 340 (3.4%) |
| 65 to 69 Years | 337 (3.3%) | 320 (3.2%) |
| 70 to 74 Years | 204 (2.0%) | 211 (2.1%) |
| 75 to 79 Years | 131 (1.3%) | 207 (2.1%) |
| 80 to 84 Years | 56 (0.5%) | 128 (1.3%) |
| 85 Years and over | 126 (1.3%) | 99 (1.0%) |
| Total | 10,100 (100.0%) | 10,104 (100.0%) |
Families and Households in Ypsilanti
Median Family Size in Ypsilanti
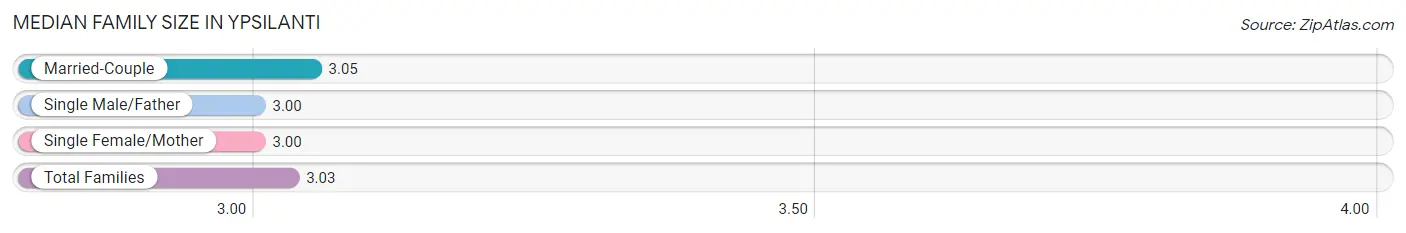
The median family size in Ypsilanti is 3.03 persons per family, with married-couple families (1,679 | 58.2%) accounting for the largest median family size of 3.05 persons per family. On the other hand, single male/father families (244 | 8.5%) represent the smallest median family size with 3.00 persons per family.
| Family Type | # Families | Family Size |
| Married-Couple | 1,679 (58.2%) | 3.05 |
| Single Male/Father | 244 (8.5%) | 3.00 |
| Single Female/Mother | 963 (33.4%) | 3.00 |
| Total Families | 2,886 (100.0%) | 3.03 |
Median Household Size in Ypsilanti
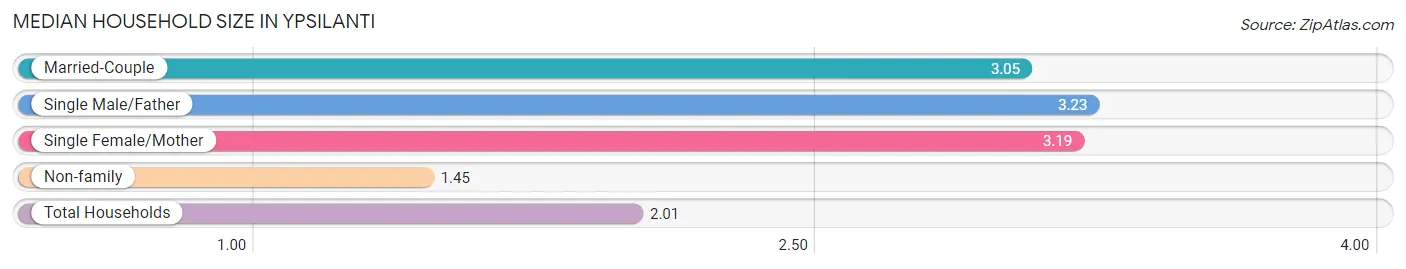
The median household size in Ypsilanti is 2.01 persons per household, with single male/father households (244 | 2.8%) accounting for the largest median household size of 3.23 persons per household. non-family households (5,739 | 66.5%) represent the smallest median household size with 1.45 persons per household.
| Household Type | # Households | Household Size |
| Married-Couple | 1,679 (19.5%) | 3.05 |
| Single Male/Father | 244 (2.8%) | 3.23 |
| Single Female/Mother | 963 (11.2%) | 3.19 |
| Non-family | 5,739 (66.5%) | 1.45 |
| Total Households | 8,625 (100.0%) | 2.01 |
Household Size by Marriage Status in Ypsilanti
Out of a total of 8,625 households in Ypsilanti, 2,886 (33.5%) are family households, while 5,739 (66.5%) are nonfamily households. The most numerous type of family households are 2-person households, comprising 1,415, and the most common type of nonfamily households are 1-person households, comprising 3,919.
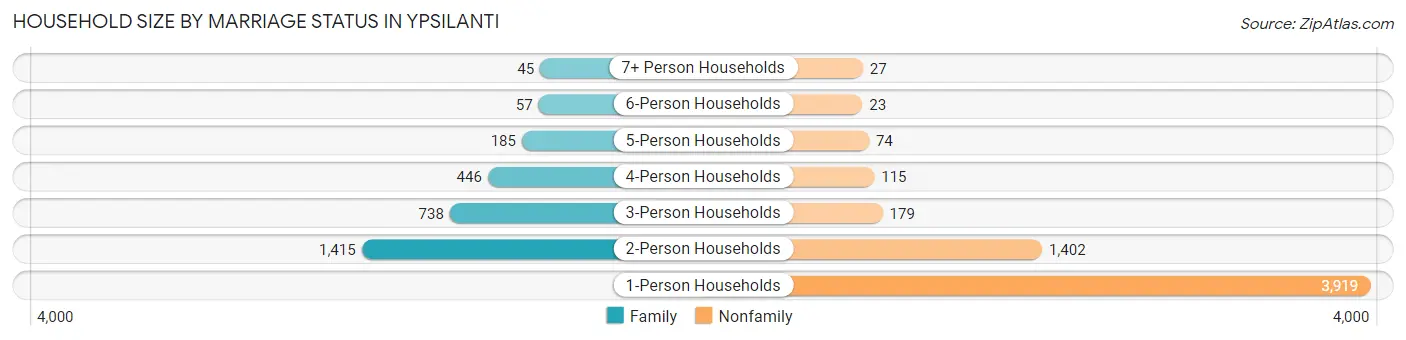
| Household Size | Family Households | Nonfamily Households |
| 1-Person Households | - | 3,919 (45.4%) |
| 2-Person Households | 1,415 (16.4%) | 1,402 (16.3%) |
| 3-Person Households | 738 (8.6%) | 179 (2.1%) |
| 4-Person Households | 446 (5.2%) | 115 (1.3%) |
| 5-Person Households | 185 (2.1%) | 74 (0.9%) |
| 6-Person Households | 57 (0.7%) | 23 (0.3%) |
| 7+ Person Households | 45 (0.5%) | 27 (0.3%) |
| Total | 2,886 (33.5%) | 5,739 (66.5%) |
Female Fertility in Ypsilanti
Fertility by Age in Ypsilanti
Average fertility rate in Ypsilanti is 35.0 births per 1,000 women. Women in the age bracket of 20 to 34 years have the highest fertility rate with 47.0 births per 1,000 women. Women in the age bracket of 20 to 34 years acount for 72.0% of all women with births.
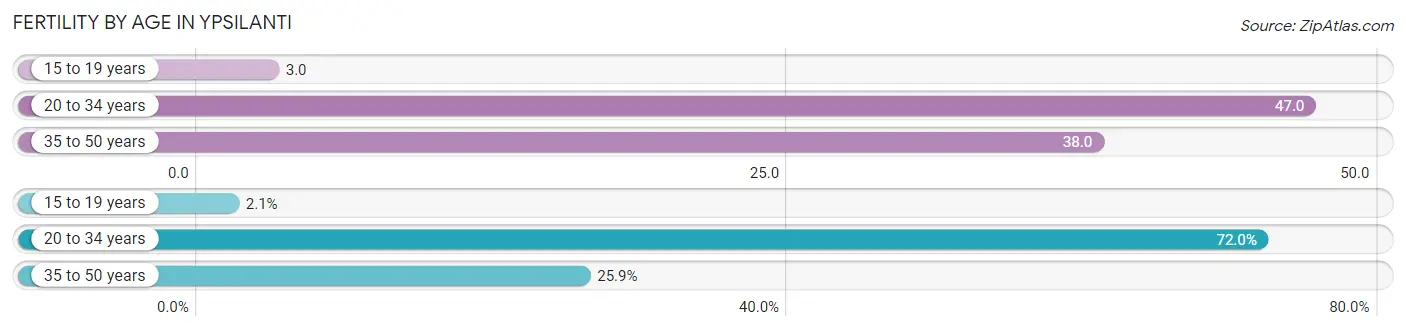
| Age Bracket | Women with Births | Births / 1,000 Women |
| 15 to 19 years | 5 (2.1%) | 3.0 |
| 20 to 34 years | 172 (72.0%) | 47.0 |
| 35 to 50 years | 62 (25.9%) | 38.0 |
| Total | 239 (100.0%) | 35.0 |
Fertility by Age by Marriage Status in Ypsilanti
23.0% of women with births (239) in Ypsilanti are married. The highest percentage of unmarried women with births falls into 15 to 19 years age bracket with 100.0% of them unmarried at the time of birth, while the lowest percentage of unmarried women with births belong to 35 to 50 years age bracket with 59.7% of them unmarried.
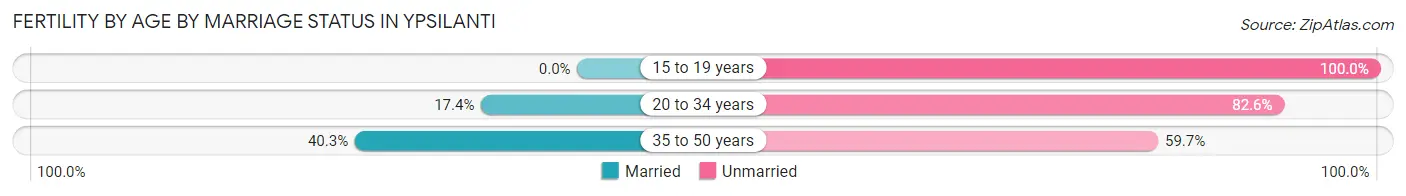
| Age Bracket | Married | Unmarried |
| 15 to 19 years | 0 (0.0%) | 5 (100.0%) |
| 20 to 34 years | 30 (17.4%) | 142 (82.6%) |
| 35 to 50 years | 25 (40.3%) | 37 (59.7%) |
| Total | 55 (23.0%) | 184 (77.0%) |
Fertility by Education in Ypsilanti
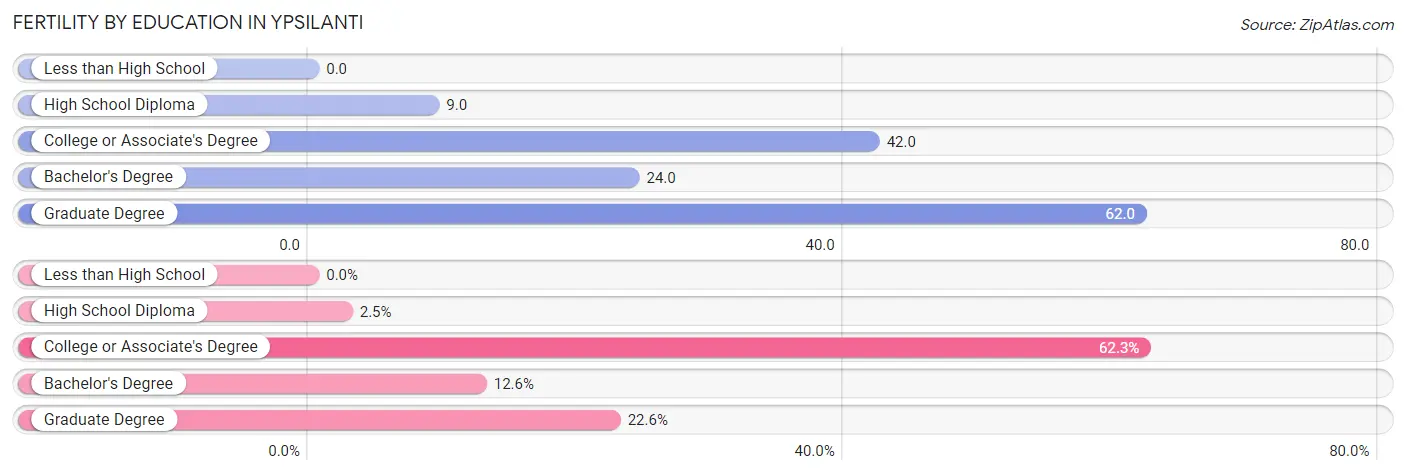
| Educational Attainment | Women with Births | Births / 1,000 Women |
| Less than High School | 0 (0.0%) | 0.0 |
| High School Diploma | 6 (2.5%) | 9.0 |
| College or Associate's Degree | 149 (62.3%) | 42.0 |
| Bachelor's Degree | 30 (12.6%) | 24.0 |
| Graduate Degree | 54 (22.6%) | 62.0 |
| Total | 239 (100.0%) | 35.0 |
Fertility by Education by Marriage Status in Ypsilanti
77.0% of women with births in Ypsilanti are unmarried. Women with the educational attainment of bachelor's degree are most likely to be married with 100.0% of them married at childbirth, while women with the educational attainment of high school diploma are least likely to be married with 100.0% of them unmarried at childbirth.
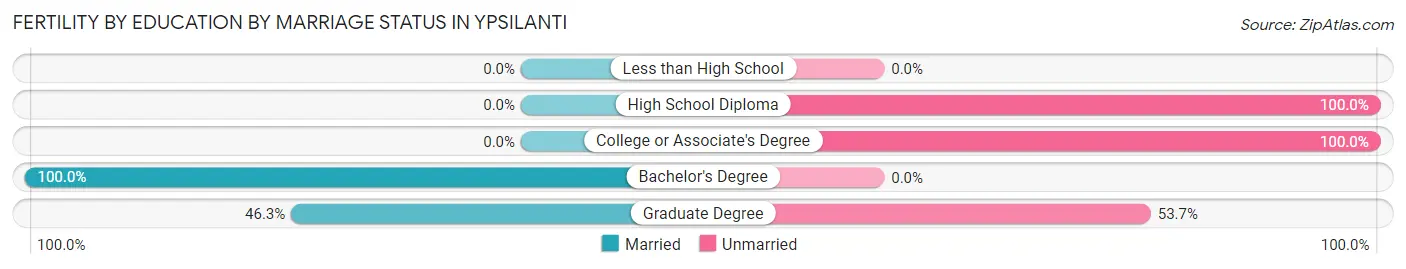
| Educational Attainment | Married | Unmarried |
| Less than High School | 0 (0.0%) | 0 (0.0%) |
| High School Diploma | 0 (0.0%) | 6 (100.0%) |
| College or Associate's Degree | 0 (0.0%) | 149 (100.0%) |
| Bachelor's Degree | 30 (100.0%) | 0 (0.0%) |
| Graduate Degree | 25 (46.3%) | 29 (53.7%) |
| Total | 55 (23.0%) | 184 (77.0%) |
Employment Characteristics in Ypsilanti
Employment by Class of Employer in Ypsilanti
Among the 10,189 employed individuals in Ypsilanti, private company employees (6,782 | 66.6%), state government employees (1,537 | 15.1%), and not-for-profit organizations (879 | 8.6%) make up the most common classes of employment.
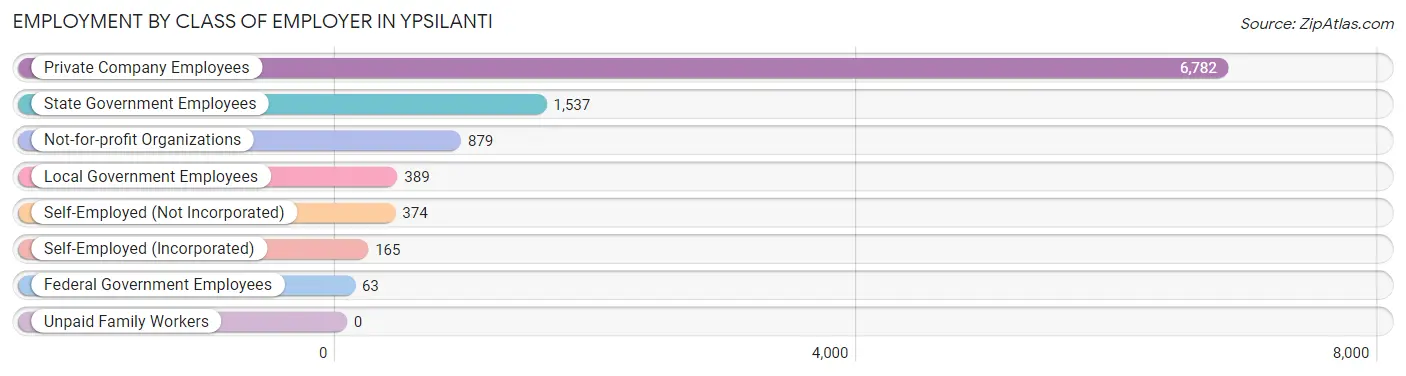
| Employer Class | # Employees | % Employees |
| Private Company Employees | 6,782 | 66.6% |
| Self-Employed (Incorporated) | 165 | 1.6% |
| Self-Employed (Not Incorporated) | 374 | 3.7% |
| Not-for-profit Organizations | 879 | 8.6% |
| Local Government Employees | 389 | 3.8% |
| State Government Employees | 1,537 | 15.1% |
| Federal Government Employees | 63 | 0.6% |
| Unpaid Family Workers | 0 | 0.0% |
| Total | 10,189 | 100.0% |
Employment Status by Age in Ypsilanti
According to the labor force statistics for Ypsilanti, out of the total population over 16 years of age (17,496), 65.2% or 11,407 individuals are in the labor force, with 8.1% or 924 of them unemployed. The age group with the highest labor force participation rate is 30 to 34 years, with 84.8% or 1,313 individuals in the labor force. Within the labor force, the 16 to 19 years age range has the highest percentage of unemployed individuals, with 17.1% or 165 of them being unemployed.
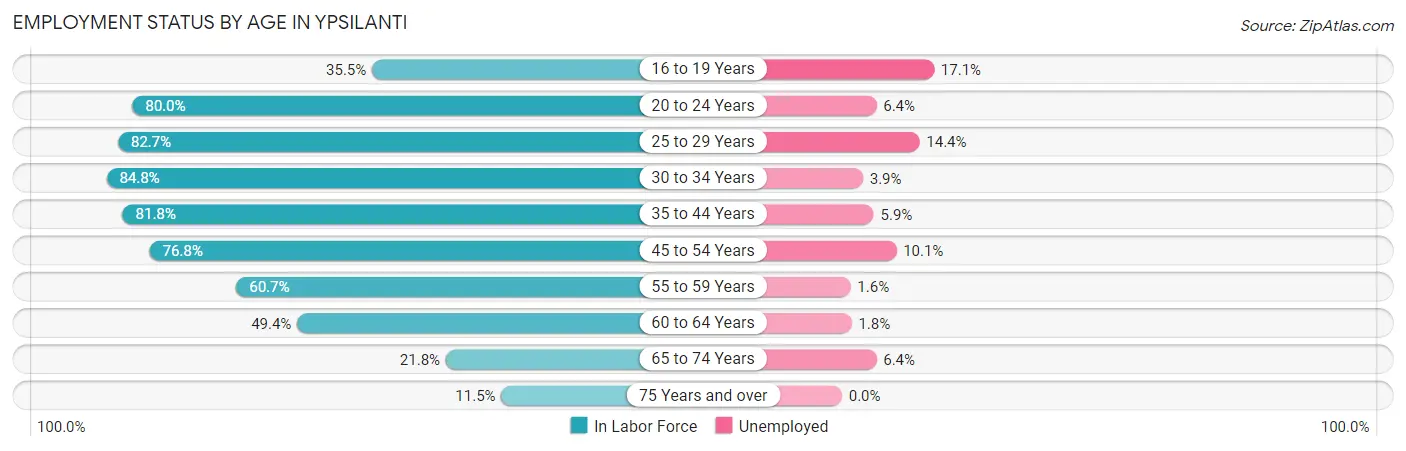
| Age Bracket | In Labor Force | Unemployed |
| 16 to 19 Years | 966 (35.5%) | 165 (17.1%) |
| 20 to 24 Years | 3,279 (80.0%) | 210 (6.4%) |
| 25 to 29 Years | 1,728 (82.7%) | 249 (14.4%) |
| 30 to 34 Years | 1,313 (84.8%) | 51 (3.9%) |
| 35 to 44 Years | 1,783 (81.8%) | 105 (5.9%) |
| 45 to 54 Years | 1,167 (76.8%) | 118 (10.1%) |
| 55 to 59 Years | 509 (60.7%) | 8 (1.6%) |
| 60 to 64 Years | 336 (49.4%) | 6 (1.8%) |
| 65 to 74 Years | 234 (21.8%) | 15 (6.4%) |
| 75 Years and over | 86 (11.5%) | 0 (0.0%) |
| Total | 11,407 (65.2%) | 924 (8.1%) |
Employment Status by Educational Attainment in Ypsilanti
According to labor force statistics for Ypsilanti, 77.2% of individuals (6,837) out of the total population between 25 and 64 years of age (8,856) are in the labor force, with 7.8% or 533 of them being unemployed. The group with the highest labor force participation rate are those with the educational attainment of bachelor's degree or higher, with 86.5% or 3,476 individuals in the labor force. Within the labor force, individuals with less than high school education have the highest percentage of unemployment, with 40.2% or 100 of them being unemployed.
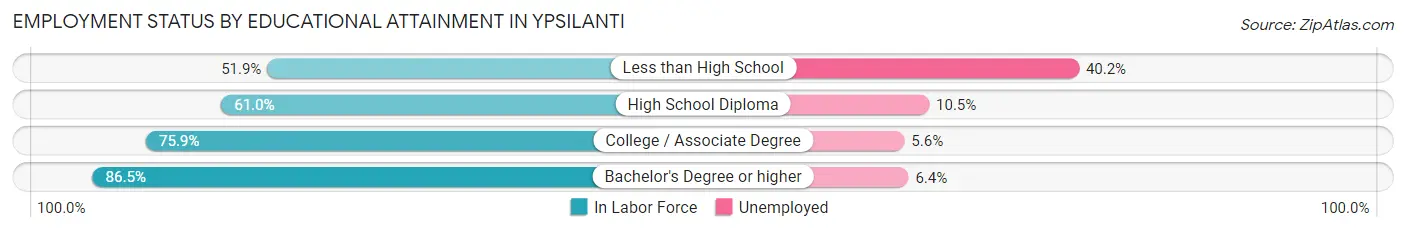
| Educational Attainment | In Labor Force | Unemployed |
| Less than High School | 249 (51.9%) | 193 (40.2%) |
| High School Diploma | 794 (61.0%) | 137 (10.5%) |
| College / Associate Degree | 2,320 (75.9%) | 171 (5.6%) |
| Bachelor's Degree or higher | 3,476 (86.5%) | 257 (6.4%) |
| Total | 6,837 (77.2%) | 691 (7.8%) |
Employment Occupations by Sex in Ypsilanti
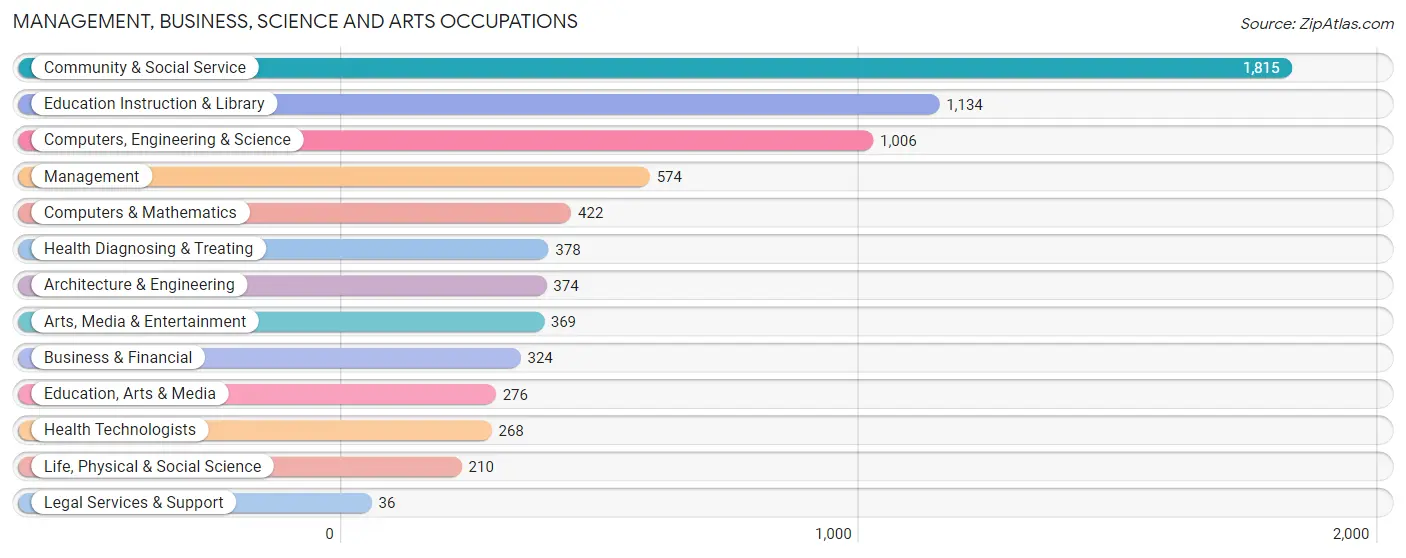
Management, Business, Science and Arts Occupations
The most common Management, Business, Science and Arts occupations in Ypsilanti are Community & Social Service (1,815 | 17.3%), Education Instruction & Library (1,134 | 10.8%), Computers, Engineering & Science (1,006 | 9.6%), Management (574 | 5.5%), and Computers & Mathematics (422 | 4.0%).
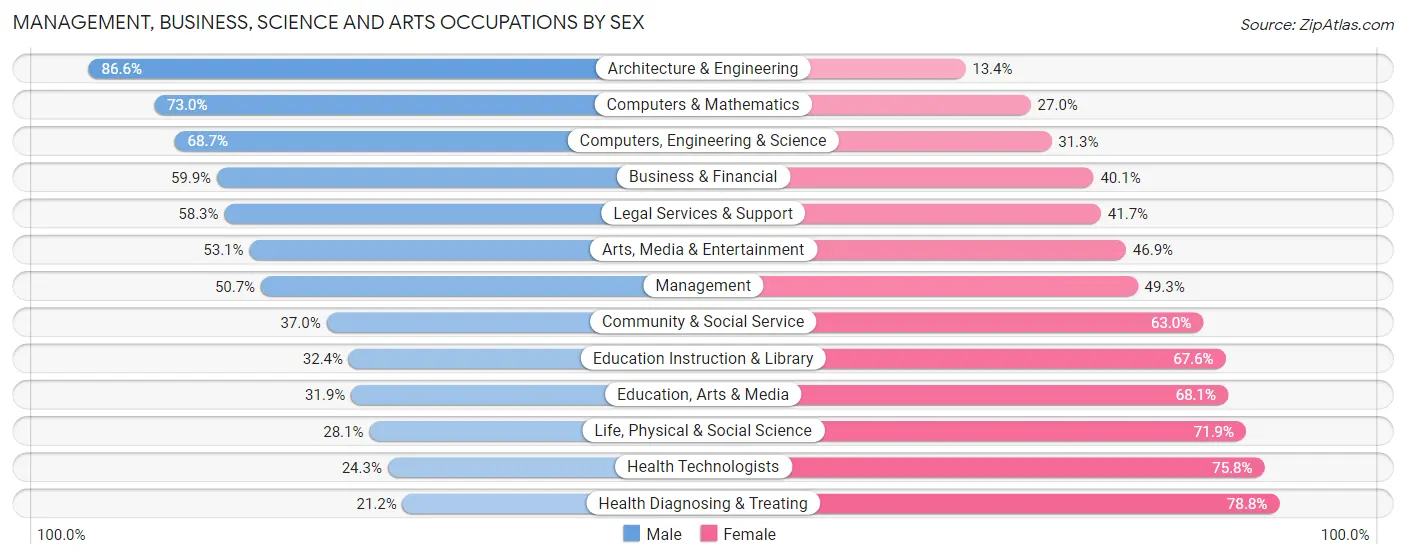
Management, Business, Science and Arts Occupations by Sex
Within the Management, Business, Science and Arts occupations in Ypsilanti, the most male-oriented occupations are Architecture & Engineering (86.6%), Computers & Mathematics (73.0%), and Computers, Engineering & Science (68.7%), while the most female-oriented occupations are Health Diagnosing & Treating (78.8%), Health Technologists (75.7%), and Life, Physical & Social Science (71.9%).
| Occupation | Male | Female |
| Management | 291 (50.7%) | 283 (49.3%) |
| Business & Financial | 194 (59.9%) | 130 (40.1%) |
| Computers, Engineering & Science | 691 (68.7%) | 315 (31.3%) |
| Computers & Mathematics | 308 (73.0%) | 114 (27.0%) |
| Architecture & Engineering | 324 (86.6%) | 50 (13.4%) |
| Life, Physical & Social Science | 59 (28.1%) | 151 (71.9%) |
| Community & Social Service | 672 (37.0%) | 1,143 (63.0%) |
| Education, Arts & Media | 88 (31.9%) | 188 (68.1%) |
| Legal Services & Support | 21 (58.3%) | 15 (41.7%) |
| Education Instruction & Library | 367 (32.4%) | 767 (67.6%) |
| Arts, Media & Entertainment | 196 (53.1%) | 173 (46.9%) |
| Health Diagnosing & Treating | 80 (21.2%) | 298 (78.8%) |
| Health Technologists | 65 (24.2%) | 203 (75.7%) |
| Total (Category) | 1,928 (47.1%) | 2,169 (52.9%) |
| Total (Overall) | 5,295 (50.6%) | 5,178 (49.4%) |
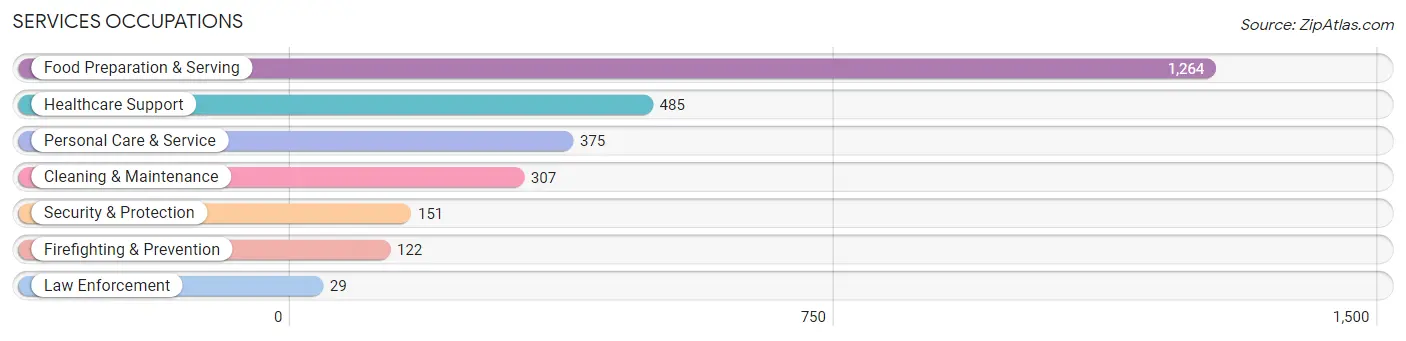
Services Occupations
The most common Services occupations in Ypsilanti are Food Preparation & Serving (1,264 | 12.1%), Healthcare Support (485 | 4.6%), Personal Care & Service (375 | 3.6%), Cleaning & Maintenance (307 | 2.9%), and Security & Protection (151 | 1.4%).
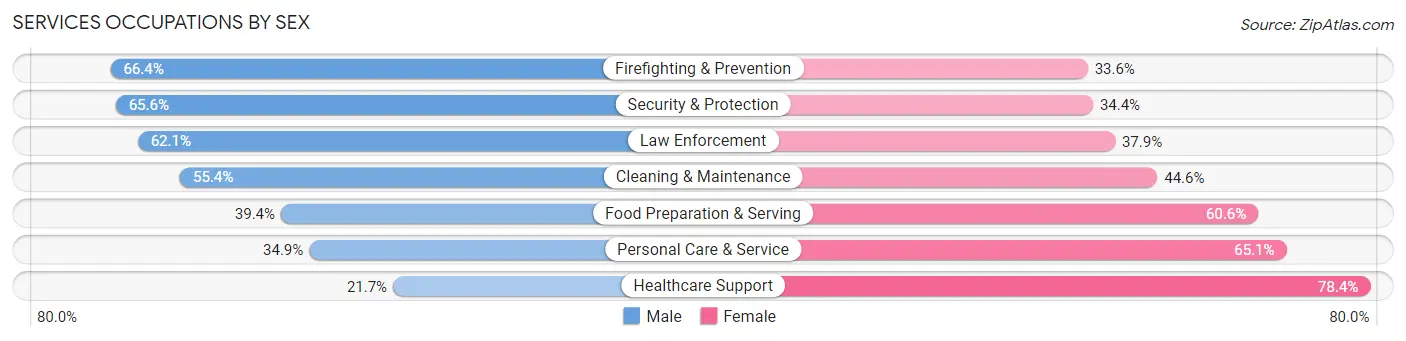
Services Occupations by Sex
Within the Services occupations in Ypsilanti, the most male-oriented occupations are Firefighting & Prevention (66.4%), Security & Protection (65.6%), and Law Enforcement (62.1%), while the most female-oriented occupations are Healthcare Support (78.3%), Personal Care & Service (65.1%), and Food Preparation & Serving (60.6%).
| Occupation | Male | Female |
| Healthcare Support | 105 (21.6%) | 380 (78.3%) |
| Security & Protection | 99 (65.6%) | 52 (34.4%) |
| Firefighting & Prevention | 81 (66.4%) | 41 (33.6%) |
| Law Enforcement | 18 (62.1%) | 11 (37.9%) |
| Food Preparation & Serving | 498 (39.4%) | 766 (60.6%) |
| Cleaning & Maintenance | 170 (55.4%) | 137 (44.6%) |
| Personal Care & Service | 131 (34.9%) | 244 (65.1%) |
| Total (Category) | 1,003 (38.9%) | 1,579 (61.2%) |
| Total (Overall) | 5,295 (50.6%) | 5,178 (49.4%) |
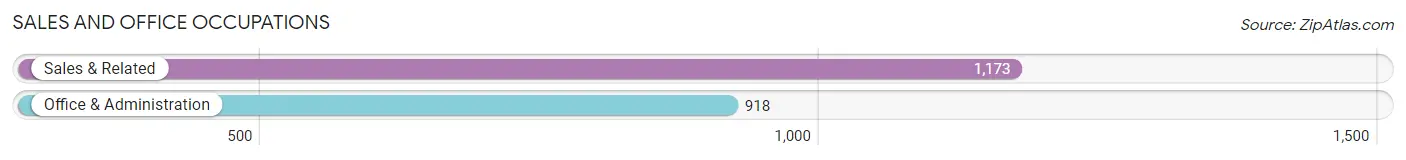
Sales and Office Occupations
The most common Sales and Office occupations in Ypsilanti are Sales & Related (1,173 | 11.2%), and Office & Administration (918 | 8.8%).
Sales and Office Occupations by Sex
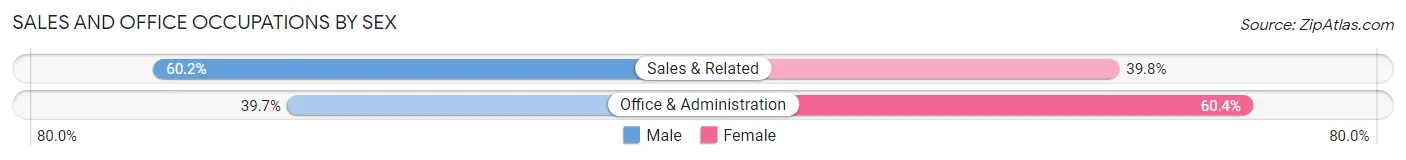
| Occupation | Male | Female |
| Sales & Related | 706 (60.2%) | 467 (39.8%) |
| Office & Administration | 364 (39.7%) | 554 (60.4%) |
| Total (Category) | 1,070 (51.2%) | 1,021 (48.8%) |
| Total (Overall) | 5,295 (50.6%) | 5,178 (49.4%) |
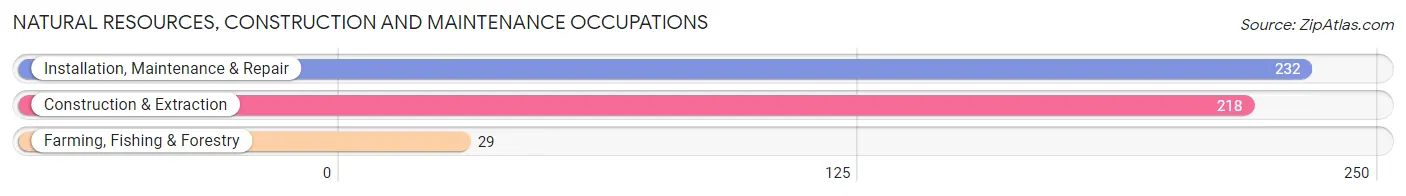
Natural Resources, Construction and Maintenance Occupations
The most common Natural Resources, Construction and Maintenance occupations in Ypsilanti are Installation, Maintenance & Repair (232 | 2.2%), Construction & Extraction (218 | 2.1%), and Farming, Fishing & Forestry (29 | 0.3%).
Natural Resources, Construction and Maintenance Occupations by Sex
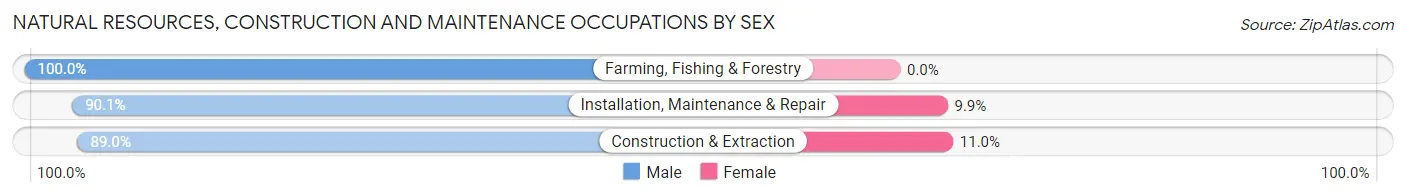
| Occupation | Male | Female |
| Farming, Fishing & Forestry | 29 (100.0%) | 0 (0.0%) |
| Construction & Extraction | 194 (89.0%) | 24 (11.0%) |
| Installation, Maintenance & Repair | 209 (90.1%) | 23 (9.9%) |
| Total (Category) | 432 (90.2%) | 47 (9.8%) |
| Total (Overall) | 5,295 (50.6%) | 5,178 (49.4%) |
Production, Transportation and Moving Occupations
The most common Production, Transportation and Moving occupations in Ypsilanti are Production (433 | 4.1%), Transportation (433 | 4.1%), and Material Moving (358 | 3.4%).
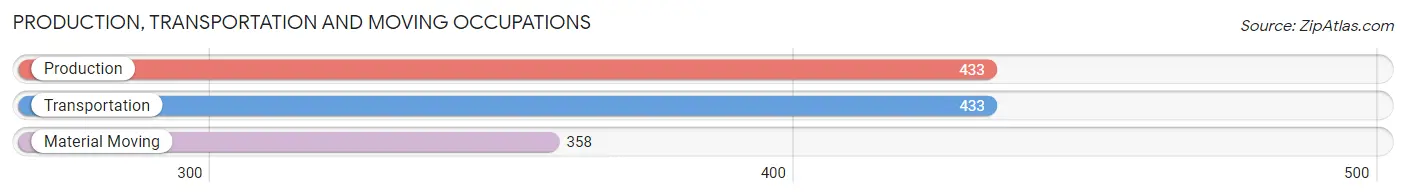
Production, Transportation and Moving Occupations by Sex
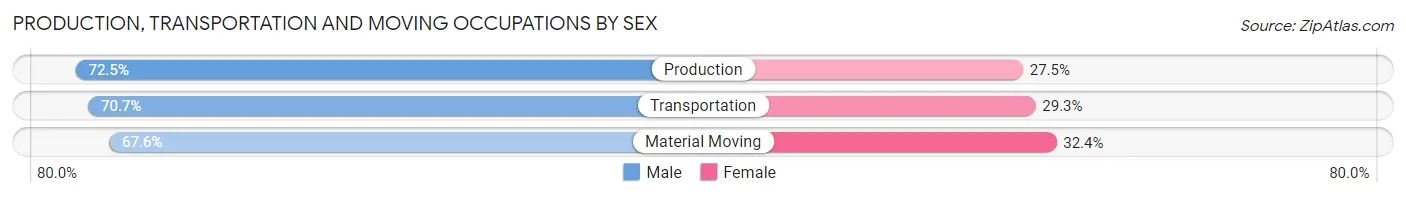
| Occupation | Male | Female |
| Production | 314 (72.5%) | 119 (27.5%) |
| Transportation | 306 (70.7%) | 127 (29.3%) |
| Material Moving | 242 (67.6%) | 116 (32.4%) |
| Total (Category) | 862 (70.4%) | 362 (29.6%) |
| Total (Overall) | 5,295 (50.6%) | 5,178 (49.4%) |
Employment Industries by Sex in Ypsilanti
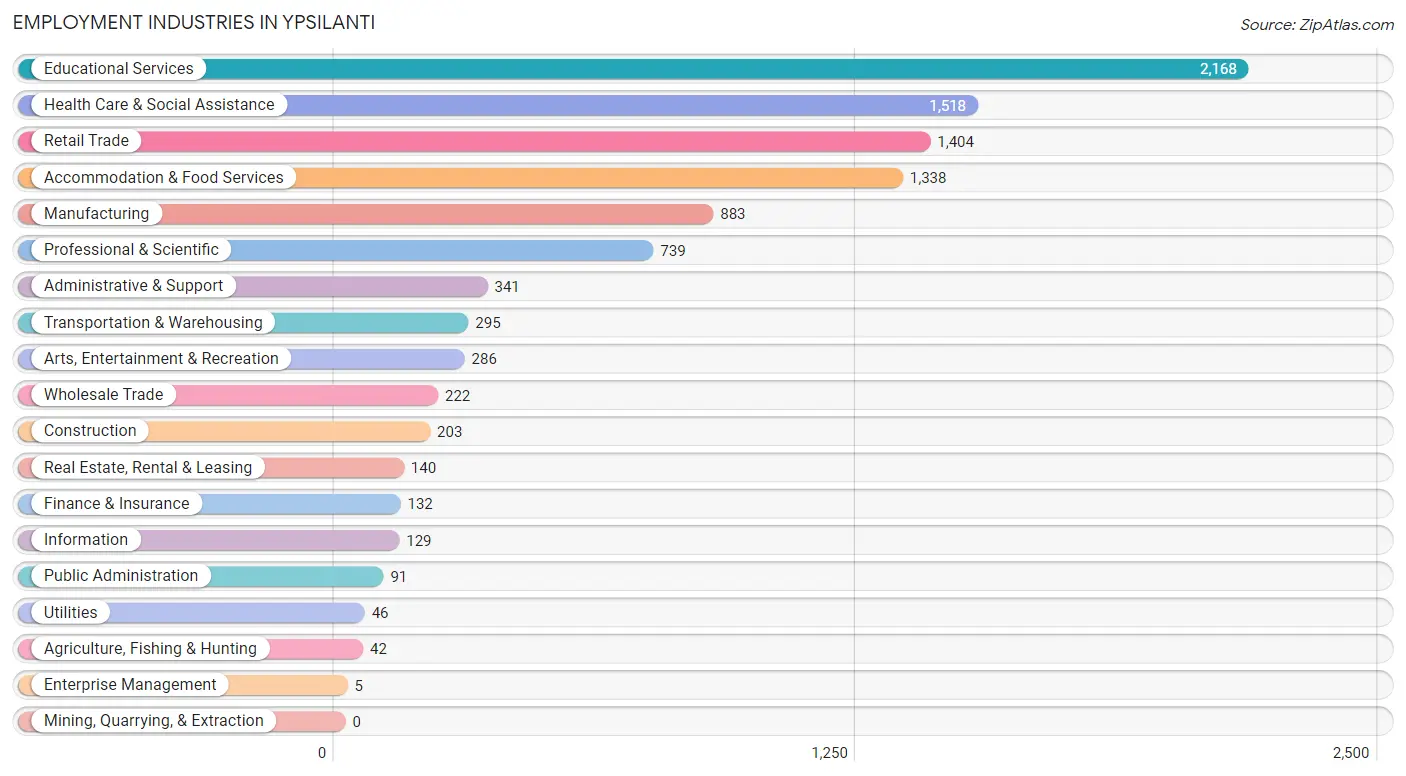
Employment Industries in Ypsilanti
The major employment industries in Ypsilanti include Educational Services (2,168 | 20.7%), Health Care & Social Assistance (1,518 | 14.5%), Retail Trade (1,404 | 13.4%), Accommodation & Food Services (1,338 | 12.8%), and Manufacturing (883 | 8.4%).
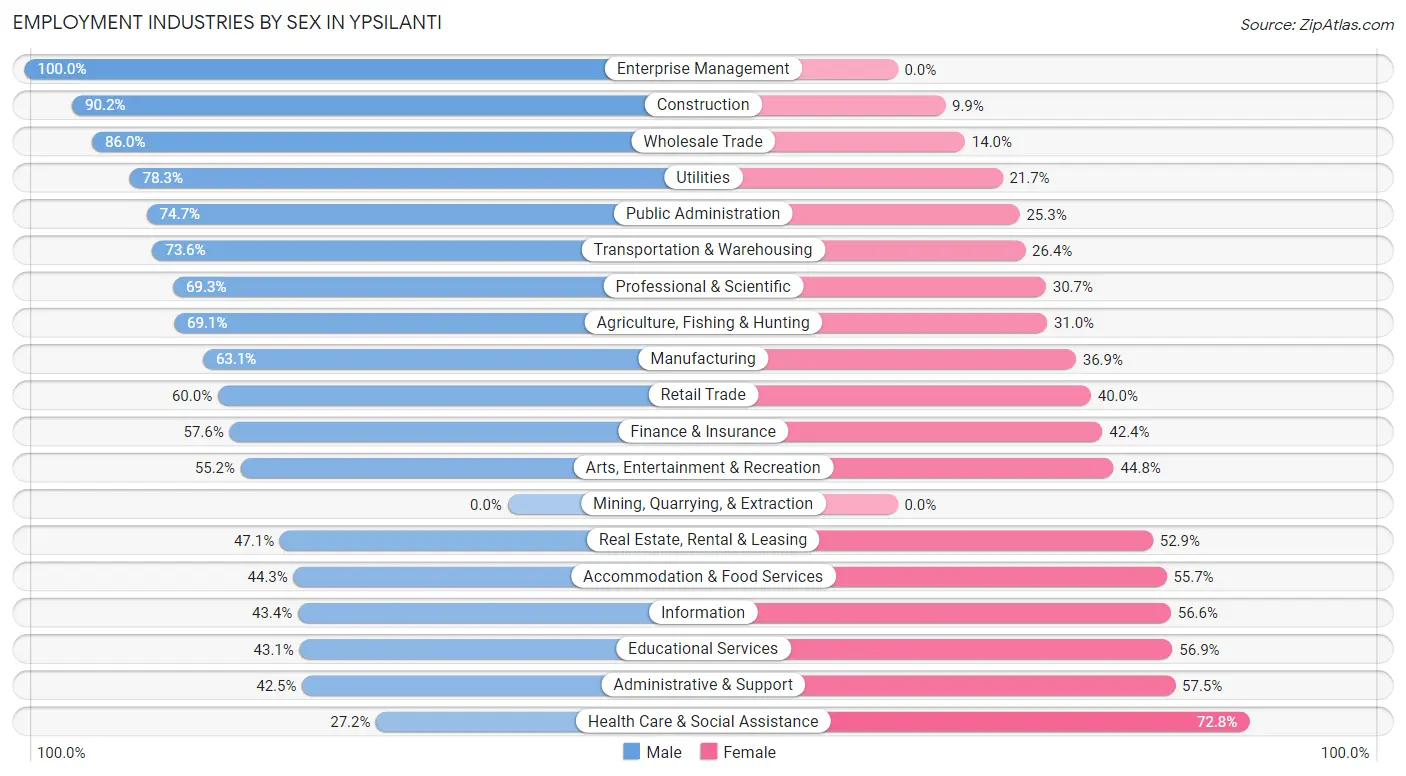
Employment Industries by Sex in Ypsilanti
The Ypsilanti industries that see more men than women are Enterprise Management (100.0%), Construction (90.1%), and Wholesale Trade (86.0%), whereas the industries that tend to have a higher number of women are Health Care & Social Assistance (72.8%), Administrative & Support (57.5%), and Educational Services (56.9%).
| Industry | Male | Female |
| Agriculture, Fishing & Hunting | 29 (69.1%) | 13 (30.9%) |
| Mining, Quarrying, & Extraction | 0 (0.0%) | 0 (0.0%) |
| Construction | 183 (90.1%) | 20 (9.9%) |
| Manufacturing | 557 (63.1%) | 326 (36.9%) |
| Wholesale Trade | 191 (86.0%) | 31 (14.0%) |
| Retail Trade | 842 (60.0%) | 562 (40.0%) |
| Transportation & Warehousing | 217 (73.6%) | 78 (26.4%) |
| Utilities | 36 (78.3%) | 10 (21.7%) |
| Information | 56 (43.4%) | 73 (56.6%) |
| Finance & Insurance | 76 (57.6%) | 56 (42.4%) |
| Real Estate, Rental & Leasing | 66 (47.1%) | 74 (52.9%) |
| Professional & Scientific | 512 (69.3%) | 227 (30.7%) |
| Enterprise Management | 5 (100.0%) | 0 (0.0%) |
| Administrative & Support | 145 (42.5%) | 196 (57.5%) |
| Educational Services | 934 (43.1%) | 1,234 (56.9%) |
| Health Care & Social Assistance | 413 (27.2%) | 1,105 (72.8%) |
| Arts, Entertainment & Recreation | 158 (55.2%) | 128 (44.8%) |
| Accommodation & Food Services | 593 (44.3%) | 745 (55.7%) |
| Public Administration | 68 (74.7%) | 23 (25.3%) |
| Total | 5,295 (50.6%) | 5,178 (49.4%) |
Education in Ypsilanti
School Enrollment in Ypsilanti
The most common levels of schooling among the 8,617 students in Ypsilanti are college / undergraduate (5,316 | 61.7%), graduate / professional (775 | 9.0%), and high school (752 | 8.7%).
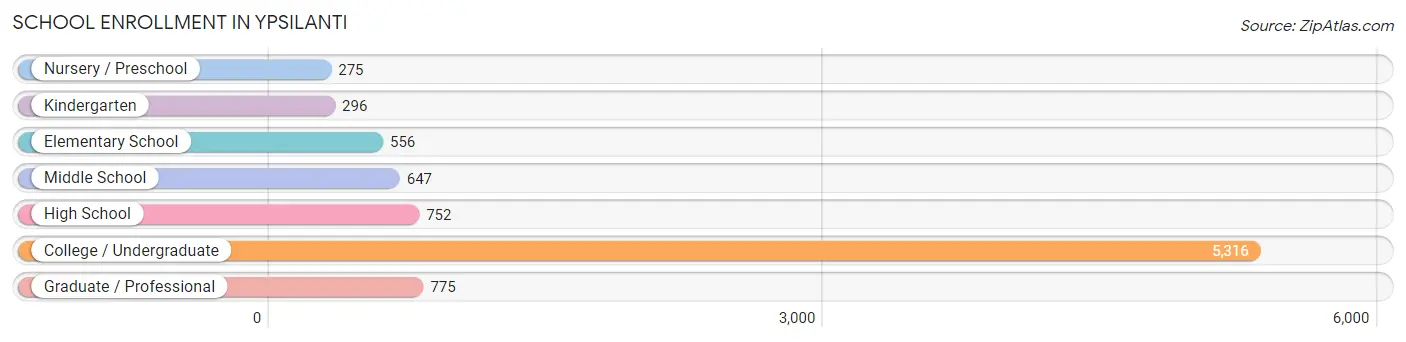
| School Level | # Students | % Students |
| Nursery / Preschool | 275 | 3.2% |
| Kindergarten | 296 | 3.4% |
| Elementary School | 556 | 6.5% |
| Middle School | 647 | 7.5% |
| High School | 752 | 8.7% |
| College / Undergraduate | 5,316 | 61.7% |
| Graduate / Professional | 775 | 9.0% |
| Total | 8,617 | 100.0% |
School Enrollment by Age by Funding Source in Ypsilanti
Out of a total of 8,617 students who are enrolled in schools in Ypsilanti, 569 (6.6%) attend a private institution, while the remaining 8,048 (93.4%) are enrolled in public schools. The age group of 3 to 4 year olds has the highest likelihood of being enrolled in private schools, with 80 (33.9% in the age bracket) enrolled. Conversely, the age group of 18 to 19 year olds has the lowest likelihood of being enrolled in a private school, with 2,135 (99.4% in the age bracket) attending a public institution.
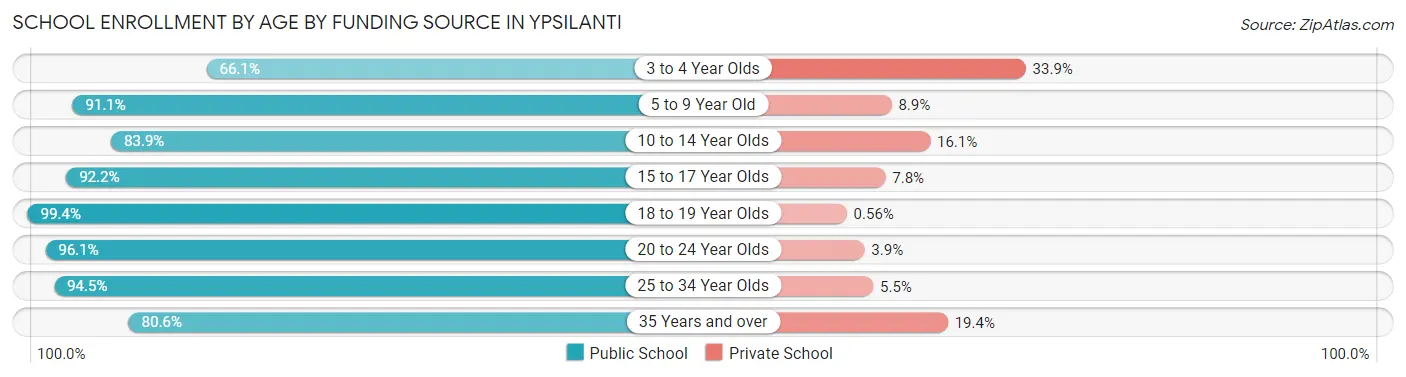
| Age Bracket | Public School | Private School |
| 3 to 4 Year Olds | 156 (66.1%) | 80 (33.9%) |
| 5 to 9 Year Old | 757 (91.1%) | 74 (8.9%) |
| 10 to 14 Year Olds | 725 (83.9%) | 139 (16.1%) |
| 15 to 17 Year Olds | 499 (92.2%) | 42 (7.8%) |
| 18 to 19 Year Olds | 2,135 (99.4%) | 12 (0.6%) |
| 20 to 24 Year Olds | 2,589 (96.1%) | 104 (3.9%) |
| 25 to 34 Year Olds | 897 (94.5%) | 52 (5.5%) |
| 35 Years and over | 287 (80.6%) | 69 (19.4%) |
| Total | 8,048 (93.4%) | 569 (6.6%) |
Educational Attainment by Field of Study in Ypsilanti
Business (597 | 11.3%), literature & languages (570 | 10.7%), social sciences (541 | 10.2%), education (472 | 8.9%), and liberal arts & history (436 | 8.2%) are the most common fields of study among 5,303 individuals in Ypsilanti who have obtained a bachelor's degree or higher.
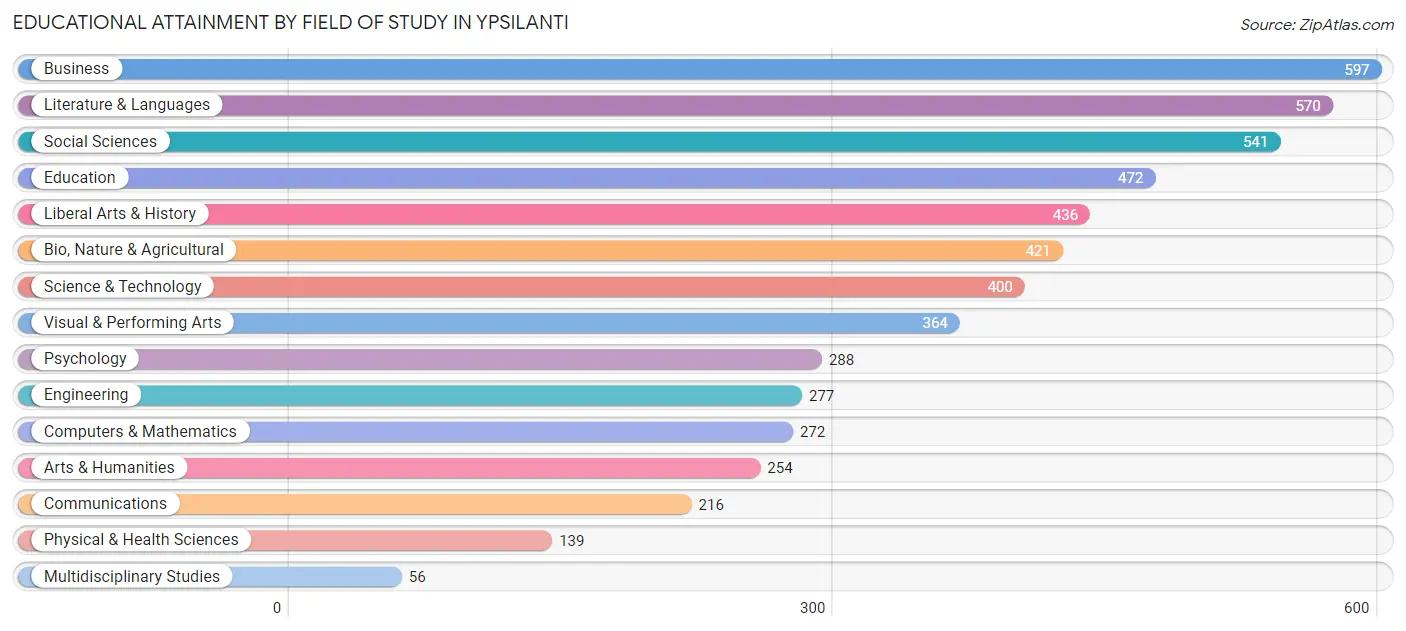
| Field of Study | # Graduates | % Graduates |
| Computers & Mathematics | 272 | 5.1% |
| Bio, Nature & Agricultural | 421 | 7.9% |
| Physical & Health Sciences | 139 | 2.6% |
| Psychology | 288 | 5.4% |
| Social Sciences | 541 | 10.2% |
| Engineering | 277 | 5.2% |
| Multidisciplinary Studies | 56 | 1.1% |
| Science & Technology | 400 | 7.5% |
| Business | 597 | 11.3% |
| Education | 472 | 8.9% |
| Literature & Languages | 570 | 10.7% |
| Liberal Arts & History | 436 | 8.2% |
| Visual & Performing Arts | 364 | 6.9% |
| Communications | 216 | 4.1% |
| Arts & Humanities | 254 | 4.8% |
| Total | 5,303 | 100.0% |
Transportation & Commute in Ypsilanti
Vehicle Availability by Sex in Ypsilanti
The most prevalent vehicle ownership categories in Ypsilanti are males with 1 vehicle (1,757, accounting for 36.3%) and females with 1 vehicle (1,850, making up 39.9%).
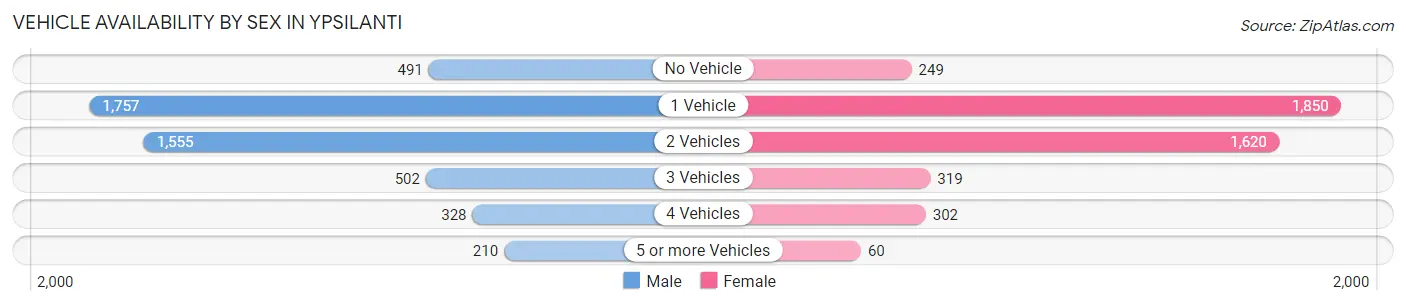
| Vehicles Available | Male | Female |
| No Vehicle | 491 (10.1%) | 249 (5.7%) |
| 1 Vehicle | 1,757 (36.3%) | 1,850 (42.0%) |
| 2 Vehicles | 1,555 (32.1%) | 1,620 (36.8%) |
| 3 Vehicles | 502 (10.4%) | 319 (7.2%) |
| 4 Vehicles | 328 (6.8%) | 302 (6.9%) |
| 5 or more Vehicles | 210 (4.3%) | 60 (1.4%) |
| Total | 4,843 (100.0%) | 4,400 (100.0%) |
Commute Time in Ypsilanti
The most frequently occuring commute durations in Ypsilanti are 15 to 19 minutes (1,789 commuters, 20.3%), 20 to 24 minutes (1,480 commuters, 16.8%), and 30 to 34 minutes (1,025 commuters, 11.6%).
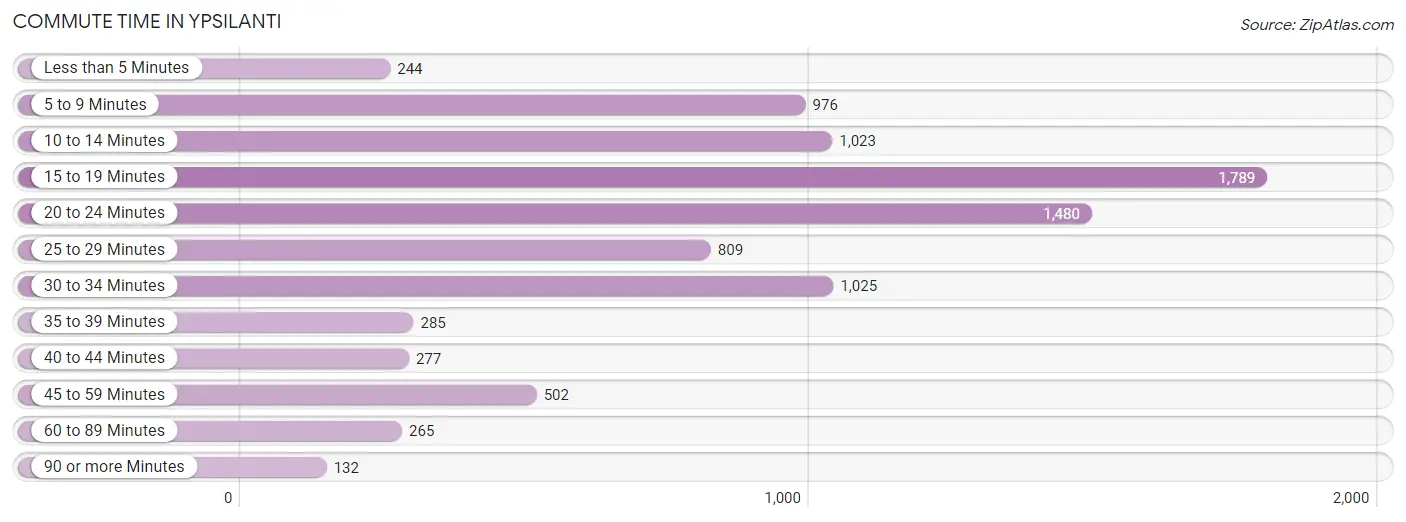
| Commute Time | # Commuters | % Commuters |
| Less than 5 Minutes | 244 | 2.8% |
| 5 to 9 Minutes | 976 | 11.1% |
| 10 to 14 Minutes | 1,023 | 11.6% |
| 15 to 19 Minutes | 1,789 | 20.3% |
| 20 to 24 Minutes | 1,480 | 16.8% |
| 25 to 29 Minutes | 809 | 9.2% |
| 30 to 34 Minutes | 1,025 | 11.6% |
| 35 to 39 Minutes | 285 | 3.2% |
| 40 to 44 Minutes | 277 | 3.2% |
| 45 to 59 Minutes | 502 | 5.7% |
| 60 to 89 Minutes | 265 | 3.0% |
| 90 or more Minutes | 132 | 1.5% |
Commute Time by Sex in Ypsilanti
The most common commute times in Ypsilanti are 15 to 19 minutes (999 commuters, 21.8%) for males and 20 to 24 minutes (832 commuters, 19.7%) for females.
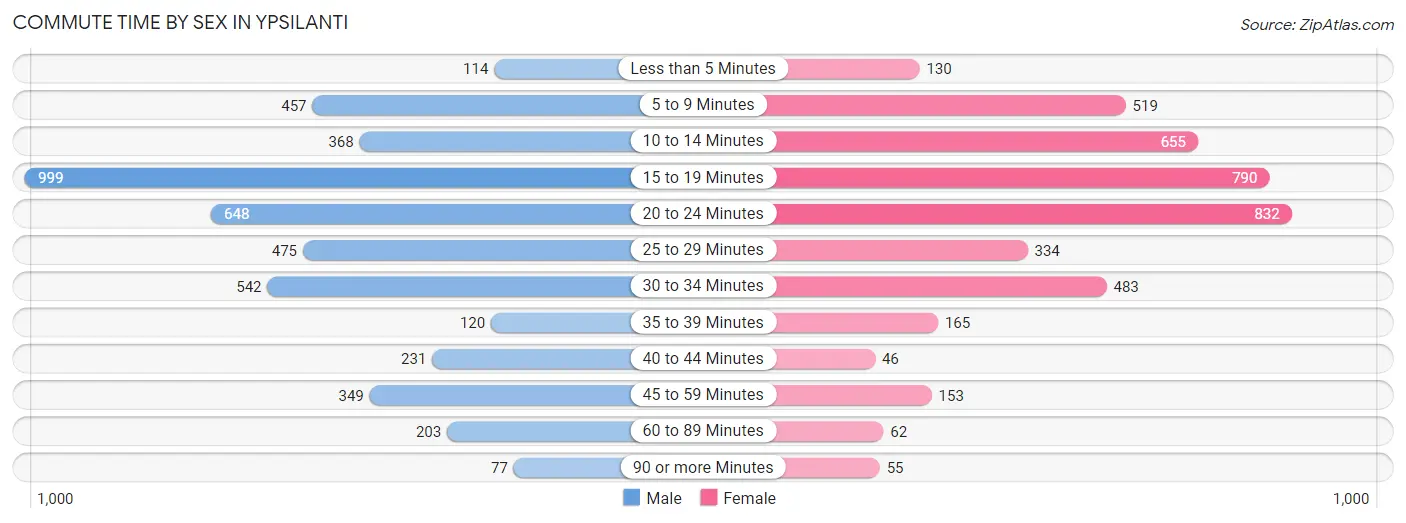
| Commute Time | Male | Female |
| Less than 5 Minutes | 114 (2.5%) | 130 (3.1%) |
| 5 to 9 Minutes | 457 (10.0%) | 519 (12.3%) |
| 10 to 14 Minutes | 368 (8.0%) | 655 (15.5%) |
| 15 to 19 Minutes | 999 (21.8%) | 790 (18.7%) |
| 20 to 24 Minutes | 648 (14.1%) | 832 (19.7%) |
| 25 to 29 Minutes | 475 (10.4%) | 334 (7.9%) |
| 30 to 34 Minutes | 542 (11.8%) | 483 (11.4%) |
| 35 to 39 Minutes | 120 (2.6%) | 165 (3.9%) |
| 40 to 44 Minutes | 231 (5.0%) | 46 (1.1%) |
| 45 to 59 Minutes | 349 (7.6%) | 153 (3.6%) |
| 60 to 89 Minutes | 203 (4.4%) | 62 (1.5%) |
| 90 or more Minutes | 77 (1.7%) | 55 (1.3%) |
Time of Departure to Work by Sex in Ypsilanti
The most frequent times of departure to work in Ypsilanti are 12:00 PM to 3:59 PM (665, 14.5%) for males and 12:00 PM to 3:59 PM (807, 19.1%) for females.
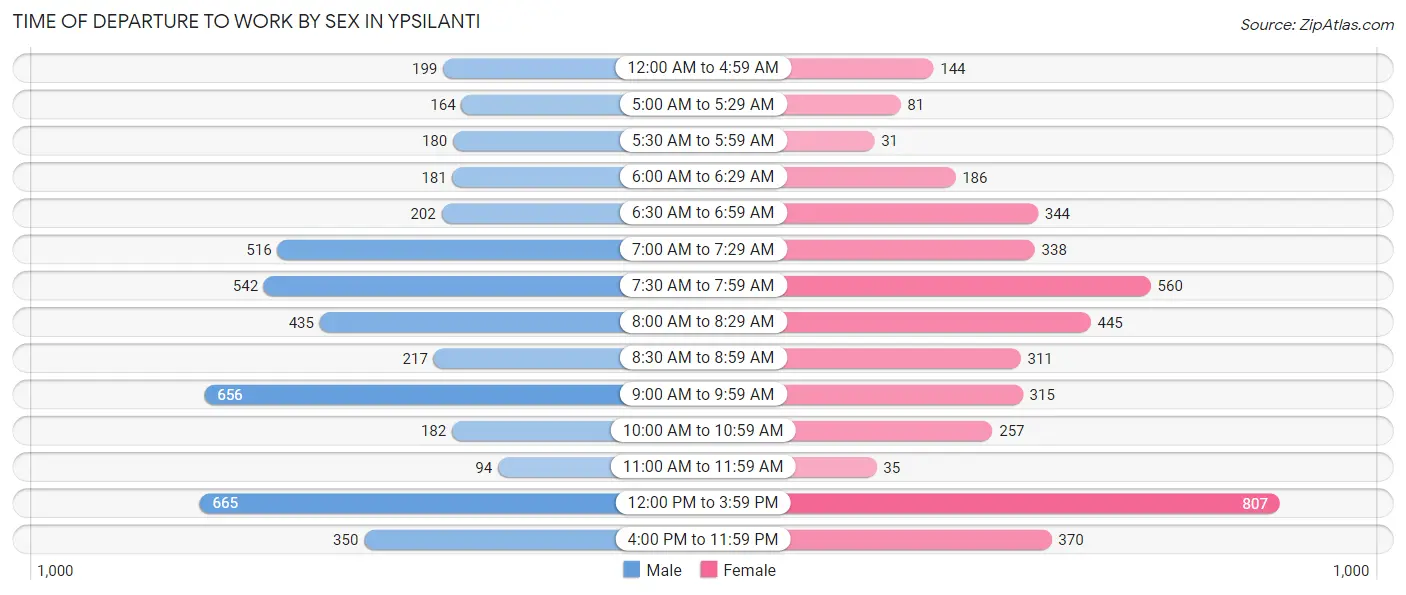
| Time of Departure | Male | Female |
| 12:00 AM to 4:59 AM | 199 (4.3%) | 144 (3.4%) |
| 5:00 AM to 5:29 AM | 164 (3.6%) | 81 (1.9%) |
| 5:30 AM to 5:59 AM | 180 (3.9%) | 31 (0.7%) |
| 6:00 AM to 6:29 AM | 181 (4.0%) | 186 (4.4%) |
| 6:30 AM to 6:59 AM | 202 (4.4%) | 344 (8.1%) |
| 7:00 AM to 7:29 AM | 516 (11.3%) | 338 (8.0%) |
| 7:30 AM to 7:59 AM | 542 (11.8%) | 560 (13.3%) |
| 8:00 AM to 8:29 AM | 435 (9.5%) | 445 (10.5%) |
| 8:30 AM to 8:59 AM | 217 (4.7%) | 311 (7.4%) |
| 9:00 AM to 9:59 AM | 656 (14.3%) | 315 (7.5%) |
| 10:00 AM to 10:59 AM | 182 (4.0%) | 257 (6.1%) |
| 11:00 AM to 11:59 AM | 94 (2.1%) | 35 (0.8%) |
| 12:00 PM to 3:59 PM | 665 (14.5%) | 807 (19.1%) |
| 4:00 PM to 11:59 PM | 350 (7.6%) | 370 (8.8%) |
| Total | 4,583 (100.0%) | 4,224 (100.0%) |
Housing Occupancy in Ypsilanti
Occupancy by Ownership in Ypsilanti
Of the total 8,625 dwellings in Ypsilanti, owner-occupied units account for 2,900 (33.6%), while renter-occupied units make up 5,725 (66.4%).
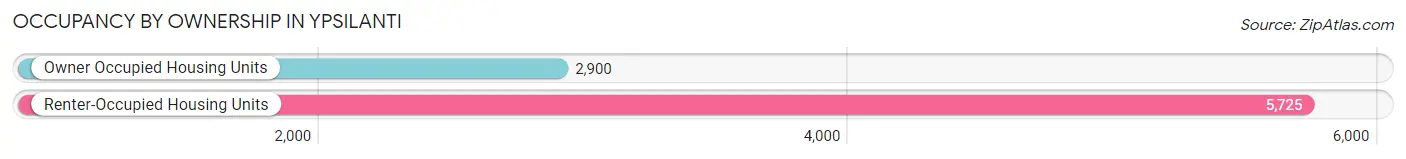
| Occupancy | # Housing Units | % Housing Units |
| Owner Occupied Housing Units | 2,900 | 33.6% |
| Renter-Occupied Housing Units | 5,725 | 66.4% |
| Total Occupied Housing Units | 8,625 | 100.0% |
Occupancy by Household Size in Ypsilanti
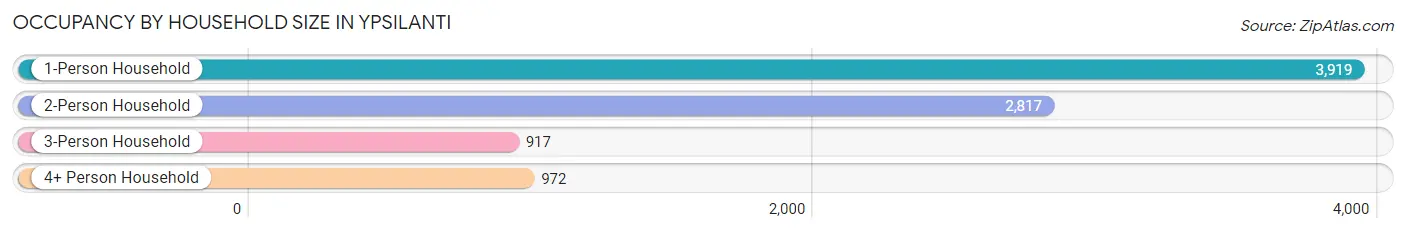
| Household Size | # Housing Units | % Housing Units |
| 1-Person Household | 3,919 | 45.4% |
| 2-Person Household | 2,817 | 32.7% |
| 3-Person Household | 917 | 10.6% |
| 4+ Person Household | 972 | 11.3% |
| Total Housing Units | 8,625 | 100.0% |
Occupancy by Ownership by Household Size in Ypsilanti
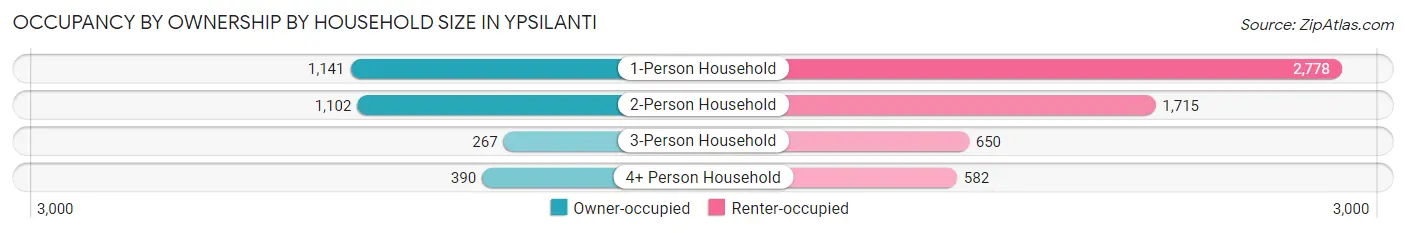
| Household Size | Owner-occupied | Renter-occupied |
| 1-Person Household | 1,141 (29.1%) | 2,778 (70.9%) |
| 2-Person Household | 1,102 (39.1%) | 1,715 (60.9%) |
| 3-Person Household | 267 (29.1%) | 650 (70.9%) |
| 4+ Person Household | 390 (40.1%) | 582 (59.9%) |
| Total Housing Units | 2,900 (33.6%) | 5,725 (66.4%) |
Occupancy by Educational Attainment in Ypsilanti
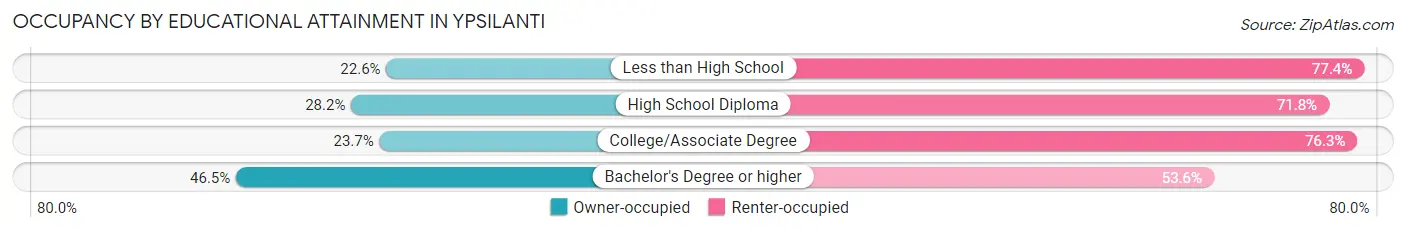
| Household Size | Owner-occupied | Renter-occupied |
| Less than High School | 85 (22.6%) | 291 (77.4%) |
| High School Diploma | 353 (28.2%) | 899 (71.8%) |
| College/Associate Degree | 821 (23.7%) | 2,643 (76.3%) |
| Bachelor's Degree or higher | 1,641 (46.5%) | 1,892 (53.5%) |
Occupancy by Age of Householder in Ypsilanti
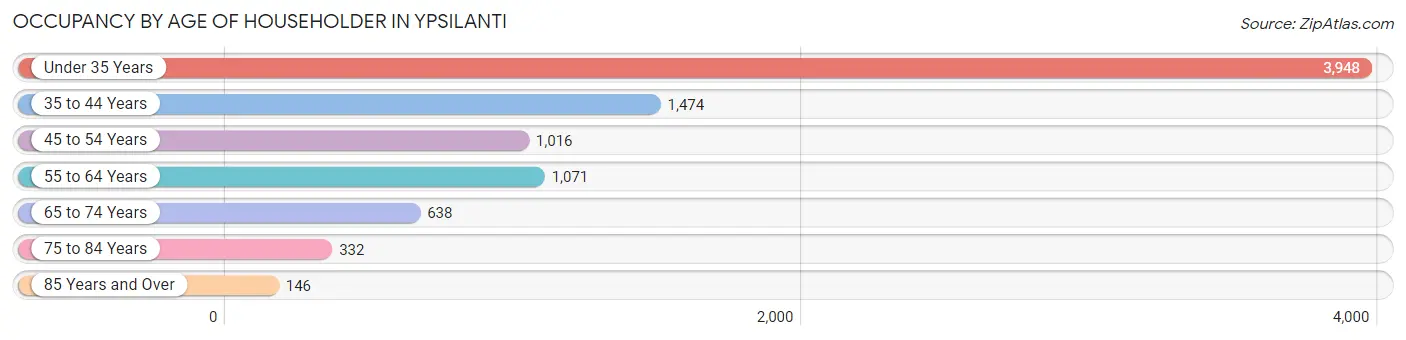
| Age Bracket | # Households | % Households |
| Under 35 Years | 3,948 | 45.8% |
| 35 to 44 Years | 1,474 | 17.1% |
| 45 to 54 Years | 1,016 | 11.8% |
| 55 to 64 Years | 1,071 | 12.4% |
| 65 to 74 Years | 638 | 7.4% |
| 75 to 84 Years | 332 | 3.8% |
| 85 Years and Over | 146 | 1.7% |
| Total | 8,625 | 100.0% |
Housing Finances in Ypsilanti
Median Income by Occupancy in Ypsilanti
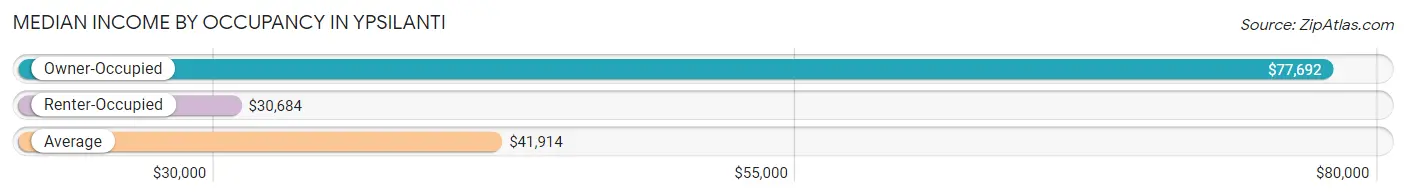
| Occupancy Type | # Households | Median Income |
| Owner-Occupied | 2,900 (33.6%) | $77,692 |
| Renter-Occupied | 5,725 (66.4%) | $30,684 |
| Average | 8,625 (100.0%) | $41,914 |
Occupancy by Householder Income Bracket in Ypsilanti
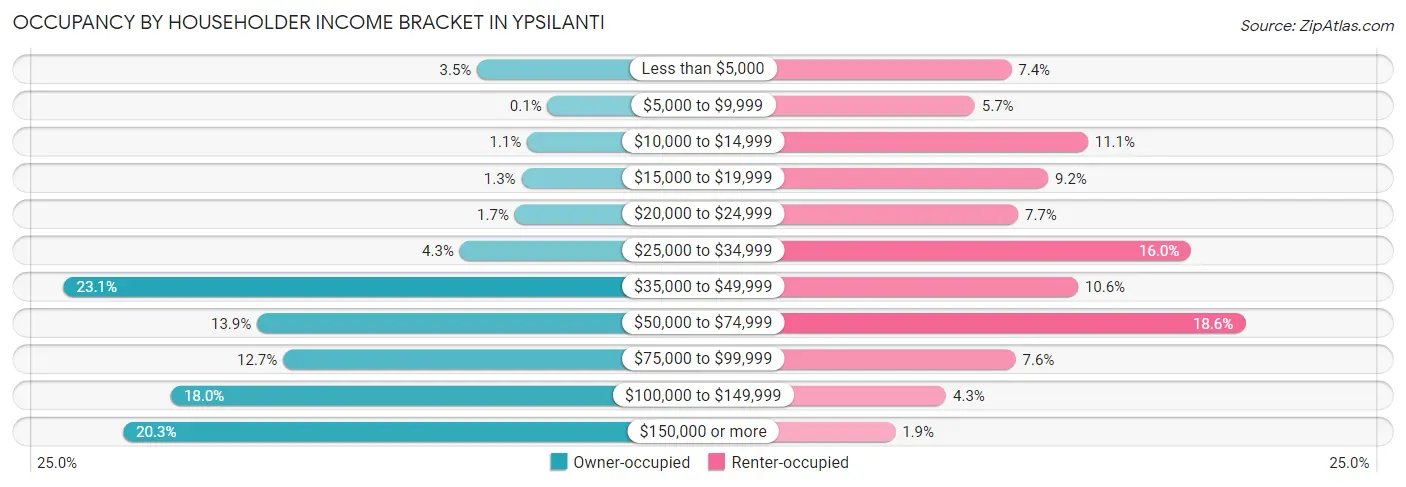
| Income Bracket | Owner-occupied | Renter-occupied |
| Less than $5,000 | 100 (3.5%) | 425 (7.4%) |
| $5,000 to $9,999 | 3 (0.1%) | 325 (5.7%) |
| $10,000 to $14,999 | 31 (1.1%) | 633 (11.1%) |
| $15,000 to $19,999 | 39 (1.3%) | 525 (9.2%) |
| $20,000 to $24,999 | 48 (1.7%) | 443 (7.7%) |
| $25,000 to $34,999 | 124 (4.3%) | 915 (16.0%) |
| $35,000 to $49,999 | 671 (23.1%) | 606 (10.6%) |
| $50,000 to $74,999 | 404 (13.9%) | 1,062 (18.5%) |
| $75,000 to $99,999 | 368 (12.7%) | 436 (7.6%) |
| $100,000 to $149,999 | 523 (18.0%) | 247 (4.3%) |
| $150,000 or more | 589 (20.3%) | 108 (1.9%) |
| Total | 2,900 (100.0%) | 5,725 (100.0%) |
Monthly Housing Cost Tiers in Ypsilanti
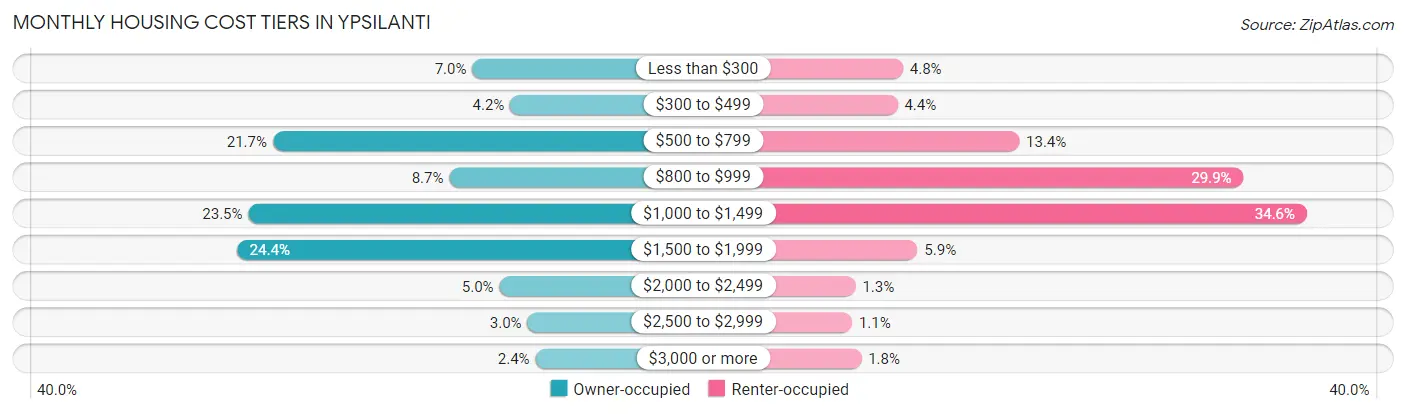
| Monthly Cost | Owner-occupied | Renter-occupied |
| Less than $300 | 204 (7.0%) | 276 (4.8%) |
| $300 to $499 | 123 (4.2%) | 253 (4.4%) |
| $500 to $799 | 630 (21.7%) | 766 (13.4%) |
| $800 to $999 | 253 (8.7%) | 1,712 (29.9%) |
| $1,000 to $1,499 | 682 (23.5%) | 1,979 (34.6%) |
| $1,500 to $1,999 | 707 (24.4%) | 337 (5.9%) |
| $2,000 to $2,499 | 146 (5.0%) | 76 (1.3%) |
| $2,500 to $2,999 | 86 (3.0%) | 61 (1.1%) |
| $3,000 or more | 69 (2.4%) | 100 (1.8%) |
| Total | 2,900 (100.0%) | 5,725 (100.0%) |
Physical Housing Characteristics in Ypsilanti
Housing Structures in Ypsilanti
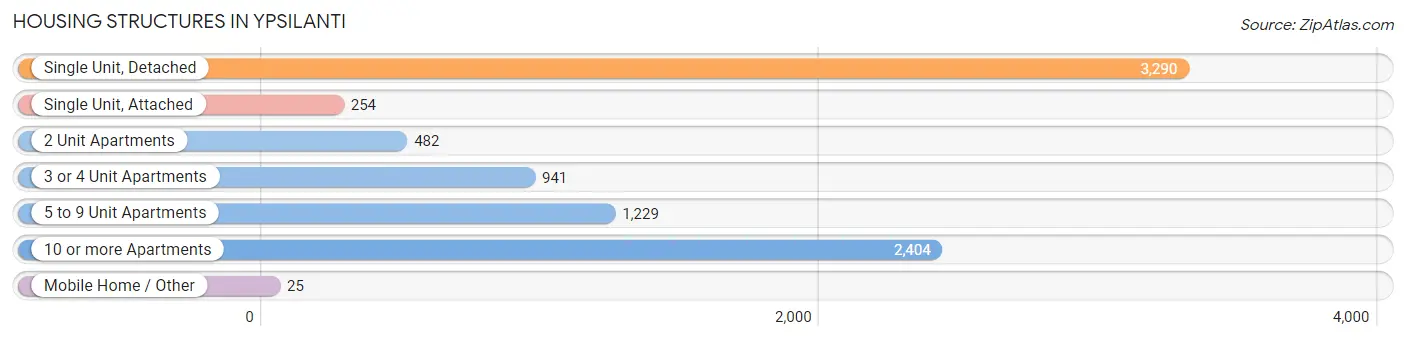
| Structure Type | # Housing Units | % Housing Units |
| Single Unit, Detached | 3,290 | 38.1% |
| Single Unit, Attached | 254 | 2.9% |
| 2 Unit Apartments | 482 | 5.6% |
| 3 or 4 Unit Apartments | 941 | 10.9% |
| 5 to 9 Unit Apartments | 1,229 | 14.2% |
| 10 or more Apartments | 2,404 | 27.9% |
| Mobile Home / Other | 25 | 0.3% |
| Total | 8,625 | 100.0% |
Housing Structures by Occupancy in Ypsilanti
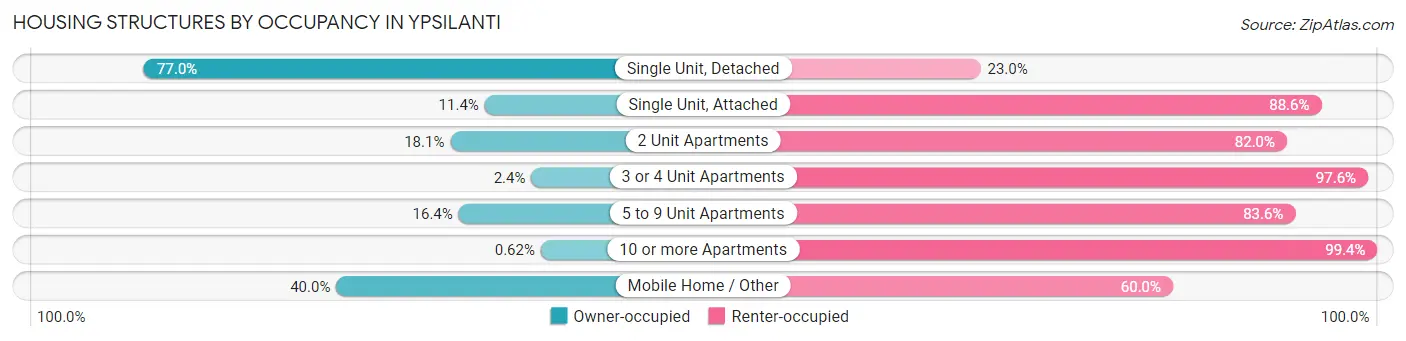
| Structure Type | Owner-occupied | Renter-occupied |
| Single Unit, Detached | 2,534 (77.0%) | 756 (23.0%) |
| Single Unit, Attached | 29 (11.4%) | 225 (88.6%) |
| 2 Unit Apartments | 87 (18.0%) | 395 (82.0%) |
| 3 or 4 Unit Apartments | 23 (2.4%) | 918 (97.6%) |
| 5 to 9 Unit Apartments | 202 (16.4%) | 1,027 (83.6%) |
| 10 or more Apartments | 15 (0.6%) | 2,389 (99.4%) |
| Mobile Home / Other | 10 (40.0%) | 15 (60.0%) |
| Total | 2,900 (33.6%) | 5,725 (66.4%) |
Housing Structures by Number of Rooms in Ypsilanti
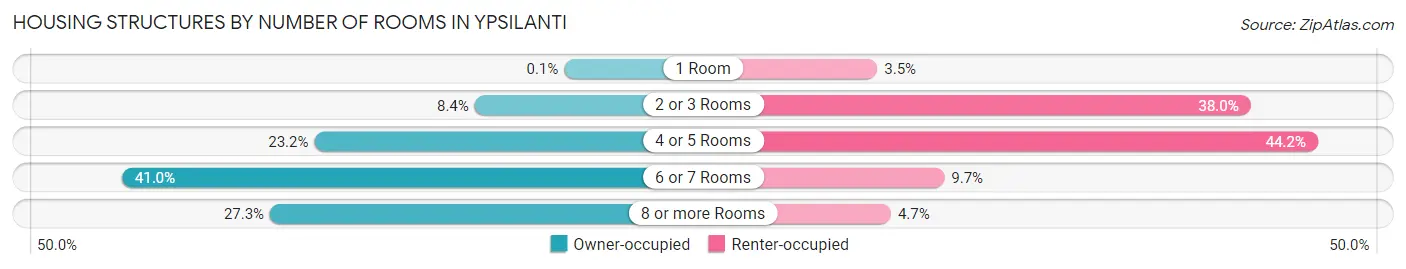
| Number of Rooms | Owner-occupied | Renter-occupied |
| 1 Room | 3 (0.1%) | 198 (3.5%) |
| 2 or 3 Rooms | 243 (8.4%) | 2,174 (38.0%) |
| 4 or 5 Rooms | 673 (23.2%) | 2,530 (44.2%) |
| 6 or 7 Rooms | 1,189 (41.0%) | 553 (9.7%) |
| 8 or more Rooms | 792 (27.3%) | 270 (4.7%) |
| Total | 2,900 (100.0%) | 5,725 (100.0%) |
Housing Structure by Heating Type in Ypsilanti
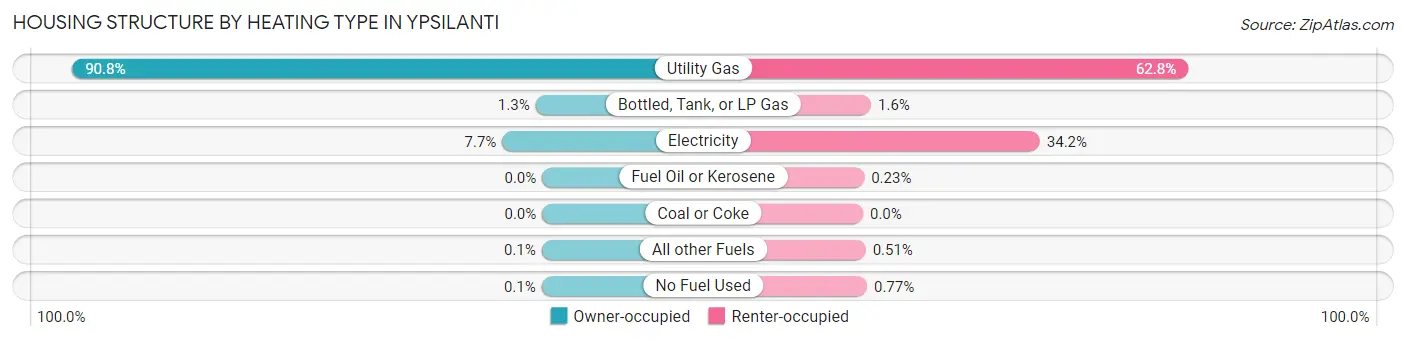
| Heating Type | Owner-occupied | Renter-occupied |
| Utility Gas | 2,633 (90.8%) | 3,594 (62.8%) |
| Bottled, Tank, or LP Gas | 37 (1.3%) | 89 (1.5%) |
| Electricity | 224 (7.7%) | 1,956 (34.2%) |
| Fuel Oil or Kerosene | 0 (0.0%) | 13 (0.2%) |
| Coal or Coke | 0 (0.0%) | 0 (0.0%) |
| All other Fuels | 3 (0.1%) | 29 (0.5%) |
| No Fuel Used | 3 (0.1%) | 44 (0.8%) |
| Total | 2,900 (100.0%) | 5,725 (100.0%) |
Household Vehicle Usage in Ypsilanti
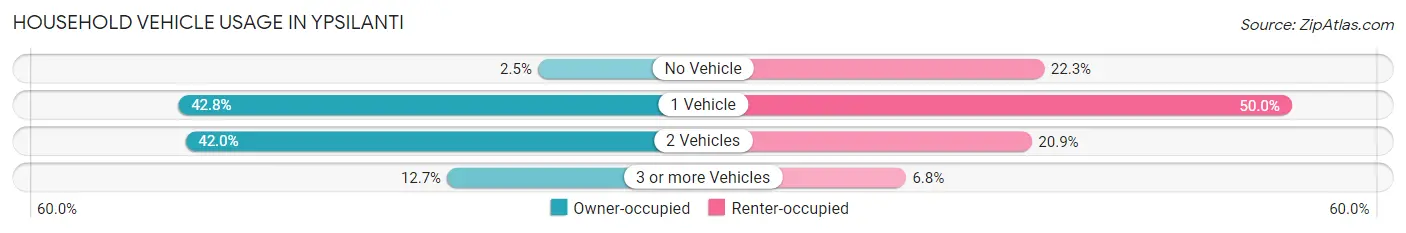
| Vehicles per Household | Owner-occupied | Renter-occupied |
| No Vehicle | 73 (2.5%) | 1,276 (22.3%) |
| 1 Vehicle | 1,241 (42.8%) | 2,865 (50.0%) |
| 2 Vehicles | 1,218 (42.0%) | 1,196 (20.9%) |
| 3 or more Vehicles | 368 (12.7%) | 388 (6.8%) |
| Total | 2,900 (100.0%) | 5,725 (100.0%) |
Real Estate & Mortgages in Ypsilanti
Real Estate and Mortgage Overview in Ypsilanti
| Characteristic | Without Mortgage | With Mortgage |
| Housing Units | 1,197 | 1,703 |
| Median Property Value | $161,100 | $226,400 |
| Median Household Income | $46,711 | $476 |
| Monthly Housing Costs | $610 | $69 |
| Real Estate Taxes | $3,469 | $47 |
Property Value by Mortgage Status in Ypsilanti
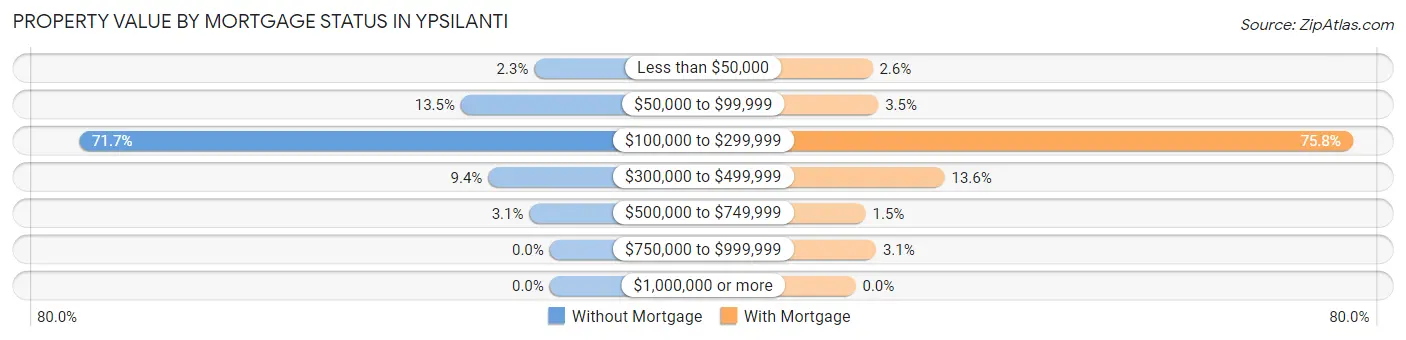
| Property Value | Without Mortgage | With Mortgage |
| Less than $50,000 | 28 (2.3%) | 44 (2.6%) |
| $50,000 to $99,999 | 162 (13.5%) | 59 (3.5%) |
| $100,000 to $299,999 | 858 (71.7%) | 1,290 (75.7%) |
| $300,000 to $499,999 | 112 (9.4%) | 231 (13.6%) |
| $500,000 to $749,999 | 37 (3.1%) | 26 (1.5%) |
| $750,000 to $999,999 | 0 (0.0%) | 53 (3.1%) |
| $1,000,000 or more | 0 (0.0%) | 0 (0.0%) |
| Total | 1,197 (100.0%) | 1,703 (100.0%) |
Household Income by Mortgage Status in Ypsilanti
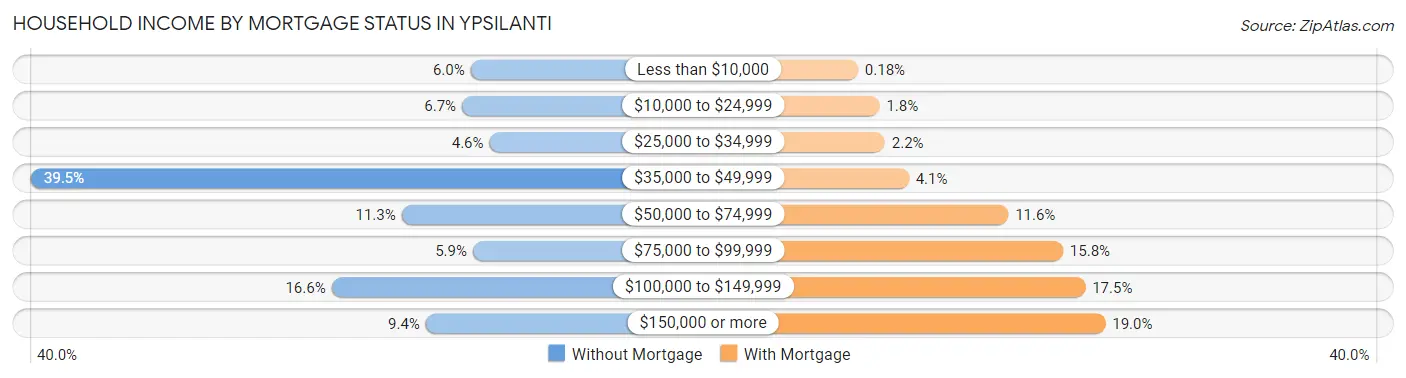
| Household Income | Without Mortgage | With Mortgage |
| Less than $10,000 | 72 (6.0%) | 3 (0.2%) |
| $10,000 to $24,999 | 80 (6.7%) | 31 (1.8%) |
| $25,000 to $34,999 | 55 (4.6%) | 38 (2.2%) |
| $35,000 to $49,999 | 473 (39.5%) | 69 (4.1%) |
| $50,000 to $74,999 | 135 (11.3%) | 198 (11.6%) |
| $75,000 to $99,999 | 70 (5.9%) | 269 (15.8%) |
| $100,000 to $149,999 | 199 (16.6%) | 298 (17.5%) |
| $150,000 or more | 113 (9.4%) | 324 (19.0%) |
| Total | 1,197 (100.0%) | 1,703 (100.0%) |
Property Value to Household Income Ratio in Ypsilanti
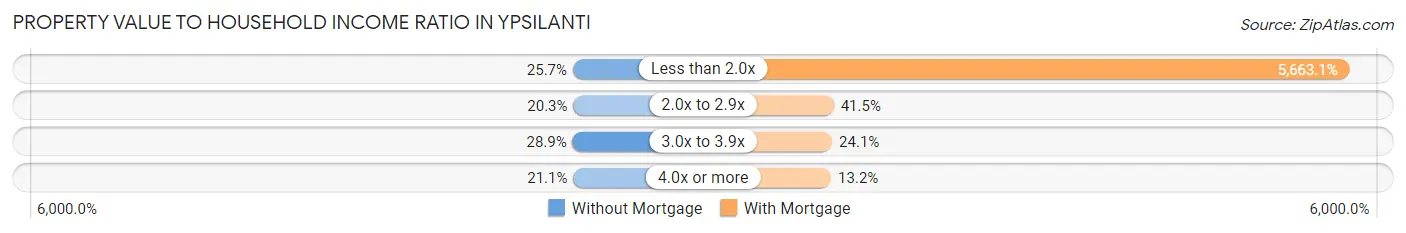
| Value-to-Income Ratio | Without Mortgage | With Mortgage |
| Less than 2.0x | 308 (25.7%) | 96,442 (5,663.1%) |
| 2.0x to 2.9x | 243 (20.3%) | 706 (41.5%) |
| 3.0x to 3.9x | 346 (28.9%) | 410 (24.1%) |
| 4.0x or more | 253 (21.1%) | 225 (13.2%) |
| Total | 1,197 (100.0%) | 1,703 (100.0%) |
Real Estate Taxes by Mortgage Status in Ypsilanti
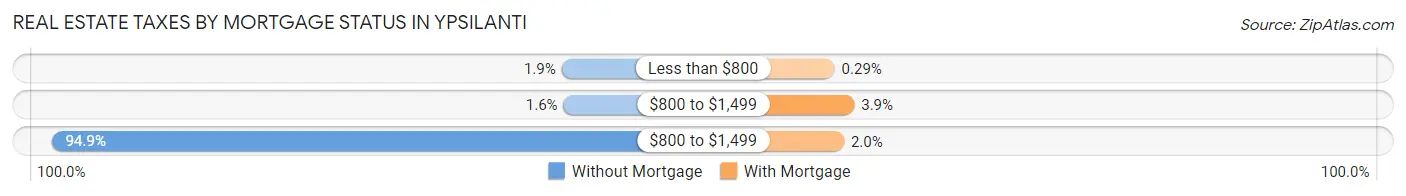
| Property Taxes | Without Mortgage | With Mortgage |
| Less than $800 | 23 (1.9%) | 5 (0.3%) |
| $800 to $1,499 | 19 (1.6%) | 66 (3.9%) |
| $800 to $1,499 | 1,136 (94.9%) | 34 (2.0%) |
| Total | 1,197 (100.0%) | 1,703 (100.0%) |
Health & Disability in Ypsilanti
Health Insurance Coverage by Age in Ypsilanti
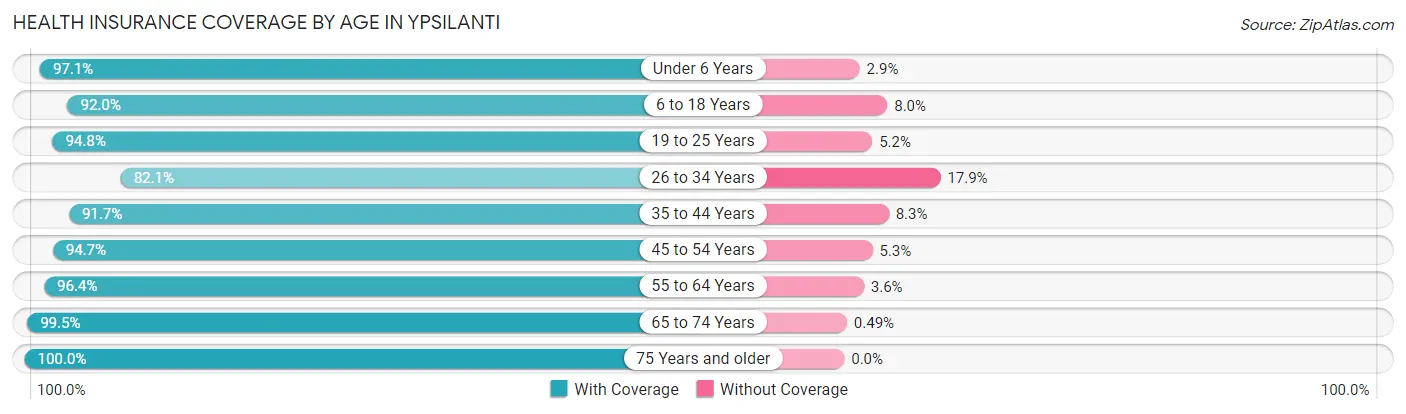
| Age Bracket | With Coverage | Without Coverage |
| Under 6 Years | 1,117 (97.1%) | 33 (2.9%) |
| 6 to 18 Years | 2,799 (92.0%) | 244 (8.0%) |
| 19 to 25 Years | 5,381 (94.8%) | 296 (5.2%) |
| 26 to 34 Years | 2,705 (82.1%) | 591 (17.9%) |
| 35 to 44 Years | 1,993 (91.7%) | 180 (8.3%) |
| 45 to 54 Years | 1,440 (94.7%) | 80 (5.3%) |
| 55 to 64 Years | 1,456 (96.4%) | 55 (3.6%) |
| 65 to 74 Years | 1,011 (99.5%) | 5 (0.5%) |
| 75 Years and older | 636 (100.0%) | 0 (0.0%) |
| Total | 18,538 (92.6%) | 1,484 (7.4%) |
Health Insurance Coverage by Citizenship Status in Ypsilanti
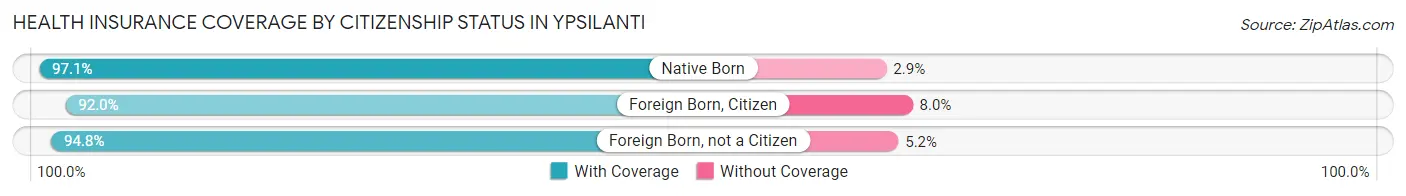
| Citizenship Status | With Coverage | Without Coverage |
| Native Born | 1,117 (97.1%) | 33 (2.9%) |
| Foreign Born, Citizen | 2,799 (92.0%) | 244 (8.0%) |
| Foreign Born, not a Citizen | 5,381 (94.8%) | 296 (5.2%) |
Health Insurance Coverage by Household Income in Ypsilanti
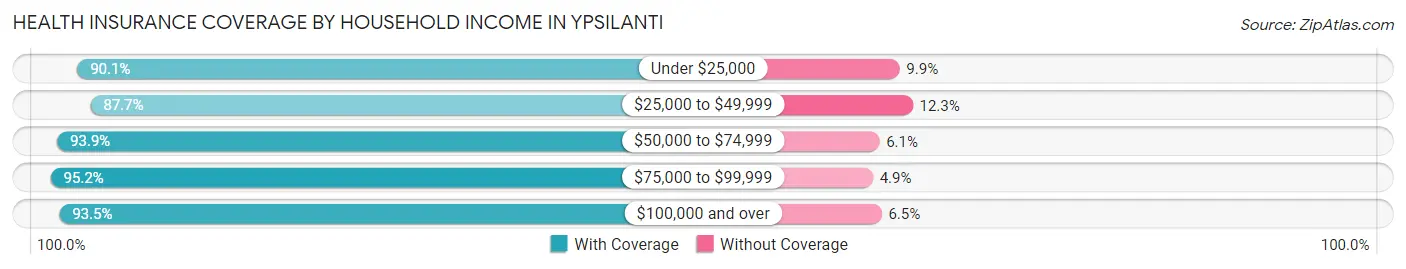
| Household Income | With Coverage | Without Coverage |
| Under $25,000 | 3,703 (90.1%) | 405 (9.9%) |
| $25,000 to $49,999 | 3,251 (87.7%) | 457 (12.3%) |
| $50,000 to $74,999 | 2,909 (93.9%) | 188 (6.1%) |
| $75,000 to $99,999 | 2,120 (95.2%) | 108 (4.9%) |
| $100,000 and over | 3,904 (93.5%) | 271 (6.5%) |
Public vs Private Health Insurance Coverage by Age in Ypsilanti
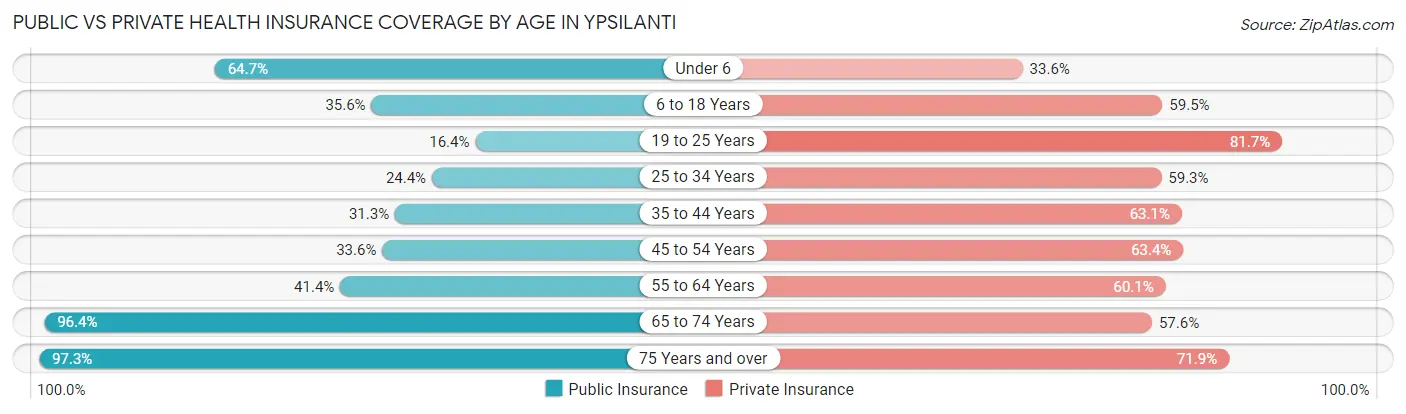
| Age Bracket | Public Insurance | Private Insurance |
| Under 6 | 744 (64.7%) | 386 (33.6%) |
| 6 to 18 Years | 1,084 (35.6%) | 1,811 (59.5%) |
| 19 to 25 Years | 928 (16.4%) | 4,638 (81.7%) |
| 25 to 34 Years | 804 (24.4%) | 1,955 (59.3%) |
| 35 to 44 Years | 679 (31.2%) | 1,371 (63.1%) |
| 45 to 54 Years | 511 (33.6%) | 963 (63.4%) |
| 55 to 64 Years | 626 (41.4%) | 908 (60.1%) |
| 65 to 74 Years | 979 (96.4%) | 585 (57.6%) |
| 75 Years and over | 619 (97.3%) | 457 (71.9%) |
| Total | 6,974 (34.8%) | 13,074 (65.3%) |
Disability Status by Sex by Age in Ypsilanti
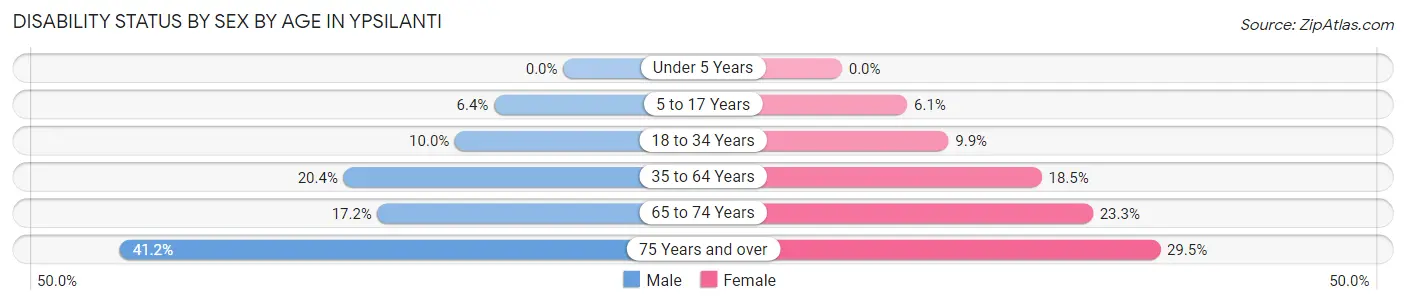
| Age Bracket | Male | Female |
| Under 5 Years | 0 (0.0%) | 0 (0.0%) |
| 5 to 17 Years | 72 (6.4%) | 73 (6.1%) |
| 18 to 34 Years | 520 (10.0%) | 477 (9.9%) |
| 35 to 64 Years | 534 (20.4%) | 479 (18.5%) |
| 65 to 74 Years | 87 (17.2%) | 119 (23.3%) |
| 75 Years and over | 121 (41.2%) | 101 (29.5%) |
Disability Class by Sex by Age in Ypsilanti
Disability Class: Hearing Difficulty
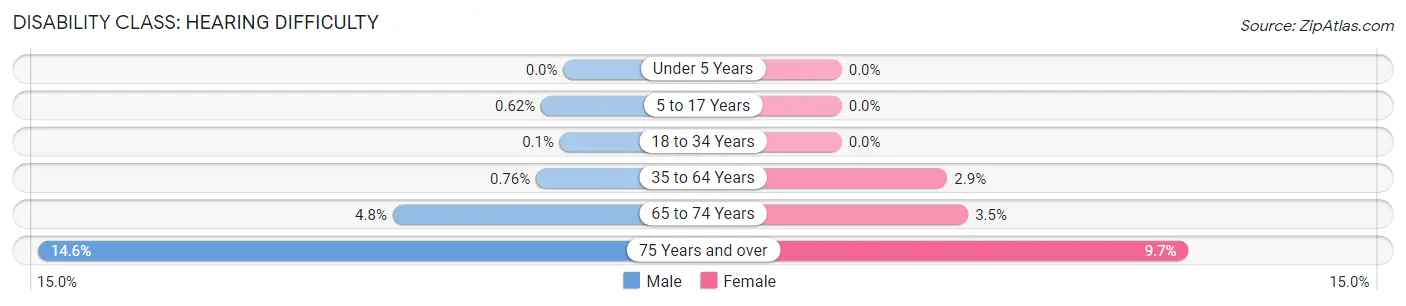
| Age Bracket | Male | Female |
| Under 5 Years | 0 (0.0%) | 0 (0.0%) |
| 5 to 17 Years | 7 (0.6%) | 0 (0.0%) |
| 18 to 34 Years | 5 (0.1%) | 0 (0.0%) |
| 35 to 64 Years | 20 (0.8%) | 76 (2.9%) |
| 65 to 74 Years | 24 (4.8%) | 18 (3.5%) |
| 75 Years and over | 43 (14.6%) | 33 (9.7%) |
Disability Class: Vision Difficulty
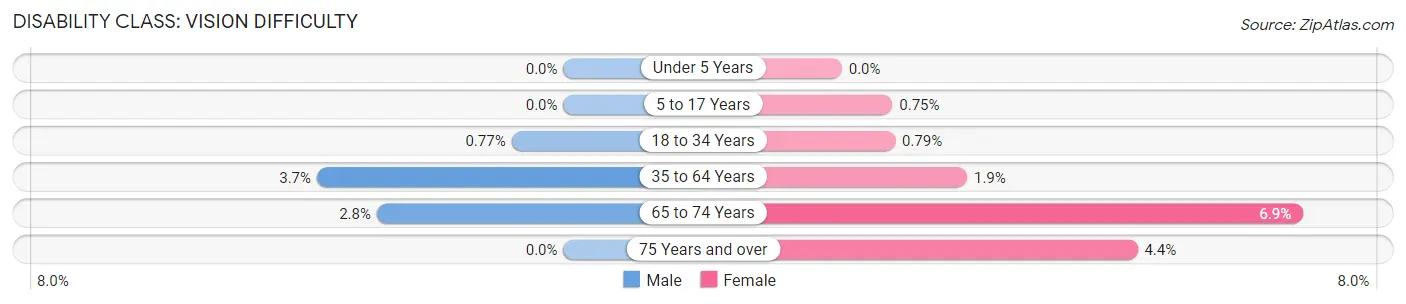
| Age Bracket | Male | Female |
| Under 5 Years | 0 (0.0%) | 0 (0.0%) |
| 5 to 17 Years | 0 (0.0%) | 9 (0.7%) |
| 18 to 34 Years | 40 (0.8%) | 38 (0.8%) |
| 35 to 64 Years | 96 (3.7%) | 48 (1.9%) |
| 65 to 74 Years | 14 (2.8%) | 35 (6.9%) |
| 75 Years and over | 0 (0.0%) | 15 (4.4%) |
Disability Class: Cognitive Difficulty
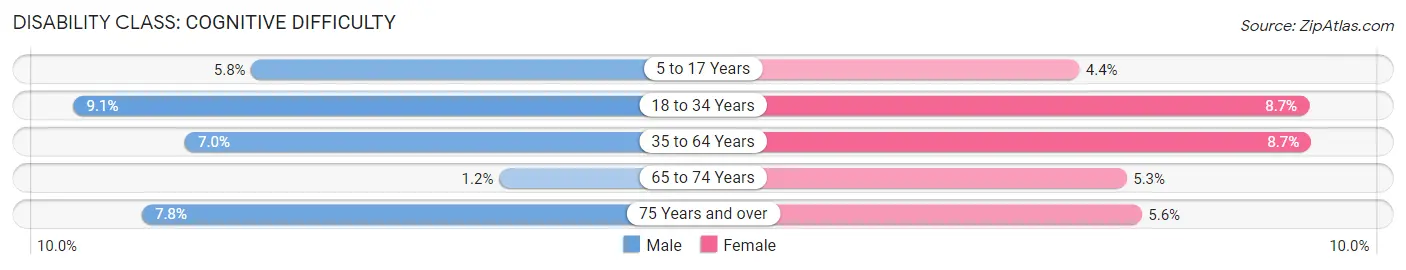
| Age Bracket | Male | Female |
| 5 to 17 Years | 65 (5.8%) | 53 (4.4%) |
| 18 to 34 Years | 471 (9.1%) | 418 (8.7%) |
| 35 to 64 Years | 184 (7.0%) | 225 (8.7%) |
| 65 to 74 Years | 6 (1.2%) | 27 (5.3%) |
| 75 Years and over | 23 (7.8%) | 19 (5.6%) |
Disability Class: Ambulatory Difficulty
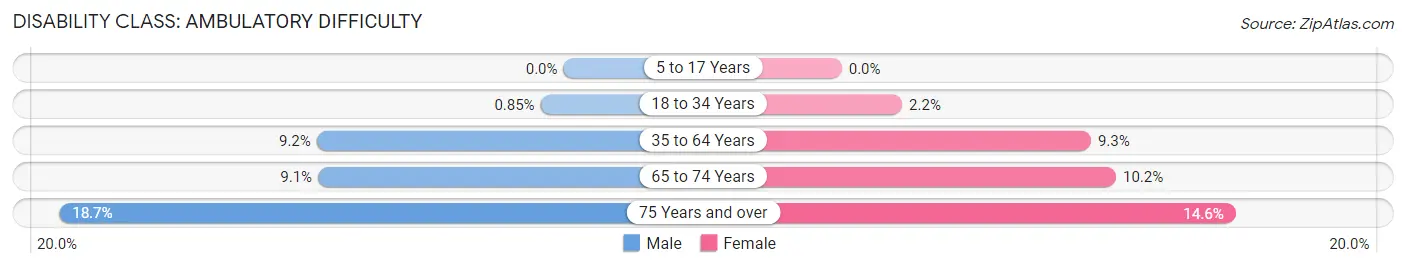
| Age Bracket | Male | Female |
| 5 to 17 Years | 0 (0.0%) | 0 (0.0%) |
| 18 to 34 Years | 44 (0.9%) | 108 (2.2%) |
| 35 to 64 Years | 240 (9.2%) | 239 (9.2%) |
| 65 to 74 Years | 46 (9.1%) | 52 (10.2%) |
| 75 Years and over | 55 (18.7%) | 50 (14.6%) |
Disability Class: Self-Care Difficulty
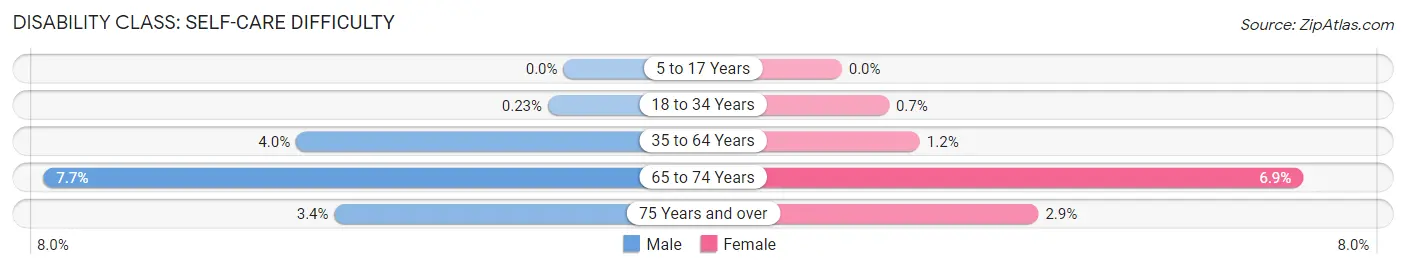
| Age Bracket | Male | Female |
| 5 to 17 Years | 0 (0.0%) | 0 (0.0%) |
| 18 to 34 Years | 12 (0.2%) | 34 (0.7%) |
| 35 to 64 Years | 104 (4.0%) | 30 (1.2%) |
| 65 to 74 Years | 39 (7.7%) | 35 (6.9%) |
| 75 Years and over | 10 (3.4%) | 10 (2.9%) |
Technology Access in Ypsilanti
Computing Device Access in Ypsilanti

| Device Type | # Households | % Households |
| Desktop or Laptop | 7,033 | 81.5% |
| Smartphone | 7,985 | 92.6% |
| Tablet | 5,080 | 58.9% |
| No Computing Device | 374 | 4.3% |
| Total | 8,625 | 100.0% |
Internet Access in Ypsilanti
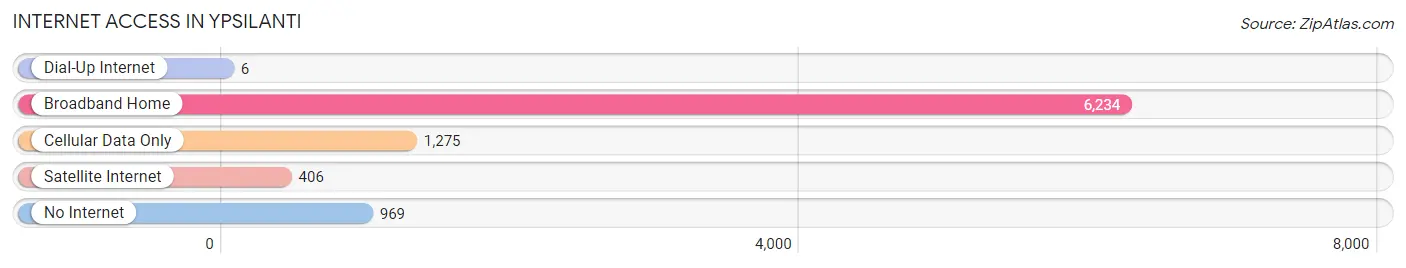
| Internet Type | # Households | % Households |
| Dial-Up Internet | 6 | 0.1% |
| Broadband Home | 6,234 | 72.3% |
| Cellular Data Only | 1,275 | 14.8% |
| Satellite Internet | 406 | 4.7% |
| No Internet | 969 | 11.2% |
| Total | 8,625 | 100.0% |
Ypsilanti Summary
Ypsilanti, Michigan is a city located in Washtenaw County in the southeastern part of the state. It is situated on the Huron River, approximately 8 miles east of Ann Arbor and 35 miles west of Detroit. The city is part of the Ann Arbor Metropolitan Statistical Area and has a population of approximately 21,000 people.
History
Ypsilanti was founded in 1823 by French-Canadian fur trader Gabriel Godfroy. The city was originally named Woodruff’s Grove, after the first settler, Major Thomas Woodruff. In 1825, the name was changed to Ypsilanti, after Demetrius Ypsilanti, a hero of the Greek War of Independence.
The city was incorporated in 1858 and grew rapidly in the late 19th century due to its proximity to the railroad. Ypsilanti was a major center for the automotive industry in the early 20th century, with several factories located in the city. The city also had a large population of immigrants from Europe, particularly from Germany and Poland.
Geography
Ypsilanti is located in southeastern Michigan, approximately 8 miles east of Ann Arbor and 35 miles west of Detroit. The city is situated on the Huron River, which flows through the city and into Lake Erie. The city is surrounded by several small towns and villages, including Ypsilanti Township, Superior Township, and Pittsfield Township.
The city has a total area of 8.3 square miles, of which 8.2 square miles is land and 0.1 square miles is water. The terrain is mostly flat, with some rolling hills in the northern part of the city.
Economy
Ypsilanti’s economy is largely based on manufacturing and education. The city is home to several automotive parts suppliers, including American Axle & Manufacturing, Inc., and Lear Corporation. The city is also home to Eastern Michigan University, which has an enrollment of over 20,000 students.
The city’s largest employers include Eastern Michigan University, St. Joseph Mercy Health System, Ypsilanti Community Schools, and the Ypsilanti Public Schools. The city also has a vibrant downtown area, with several restaurants, shops, and galleries.
Demographics
As of the 2010 census, Ypsilanti had a population of 21,018 people. The racial makeup of the city was 68.2% White, 22.3% African American, 0.4% Native American, 3.2% Asian, and 5.9% from other races. Hispanic or Latino of any race were 8.2% of the population.
The median household income in Ypsilanti was $37,945, and the median family income was $48,919. The per capita income was $20,945. About 17.2% of the population was below the poverty line.
Ypsilanti is a diverse city, with a large population of immigrants from Europe, particularly from Germany and Poland. The city also has a large African American population, with 22.3% of the population identifying as African American.
Common Questions
What is Per Capita Income in Ypsilanti?
Per Capita income in Ypsilanti is $30,863.
What is the Median Family Income in Ypsilanti?
Median Family Income in Ypsilanti is $59,542.
What is the Median Household income in Ypsilanti?
Median Household Income in Ypsilanti is $41,914.
What is Income or Wage Gap in Ypsilanti?
Income or Wage Gap in Ypsilanti is 37.3%.
Women in Ypsilanti earn 62.7 cents for every dollar earned by a man.
What is Family Income Deficit in Ypsilanti?
Family Income Deficit in Ypsilanti is $11,074.
Families that are below poverty line in Ypsilanti earn $11,074 less on average than the poverty threshold level.
What is Inequality or Gini Index in Ypsilanti?
Inequality or Gini Index in Ypsilanti is 0.49.
What is the Total Population of Ypsilanti?
Total Population of Ypsilanti is 20,204.
What is the Total Male Population of Ypsilanti?
Total Male Population of Ypsilanti is 10,100.
What is the Total Female Population of Ypsilanti?
Total Female Population of Ypsilanti is 10,104.
What is the Ratio of Males per 100 Females in Ypsilanti?
There are 99.96 Males per 100 Females in Ypsilanti.
What is the Ratio of Females per 100 Males in Ypsilanti?
There are 100.04 Females per 100 Males in Ypsilanti.
What is the Median Population Age in Ypsilanti?
Median Population Age in Ypsilanti is 26.5 Years.
What is the Average Family Size in Ypsilanti
Average Family Size in Ypsilanti is 3.0 People.
What is the Average Household Size in Ypsilanti
Average Household Size in Ypsilanti is 2.0 People.
How Large is the Labor Force in Ypsilanti?
There are 11,407 People in the Labor Forcein in Ypsilanti.
What is the Percentage of People in the Labor Force in Ypsilanti?
65.2% of People are in the Labor Force in Ypsilanti.
What is the Unemployment Rate in Ypsilanti?
Unemployment Rate in Ypsilanti is 8.1%.