Bloomfield Hills, MI Map & Demographics
Bloomfield Hills Map
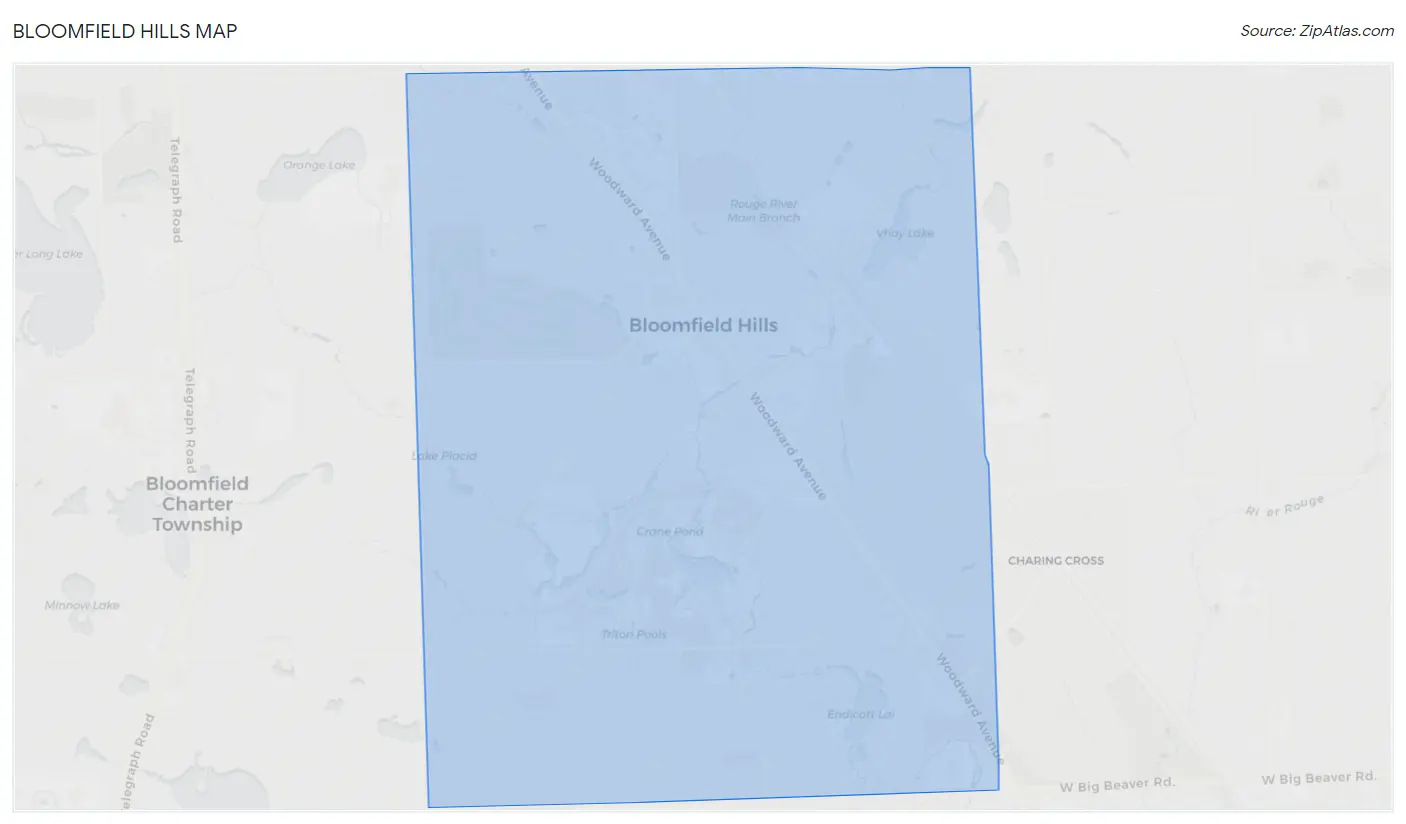
Bloomfield Hills Overview
$129,481
PER CAPITA INCOME
$222,283
AVG FAMILY INCOME
$200,054
AVG HOUSEHOLD INCOME
50.2%
WAGE / INCOME GAP [ % ]
49.8¢/ $1
WAGE / INCOME GAP [ $ ]
0.53
INEQUALITY / GINI INDEX
4,402
TOTAL POPULATION
1,987
MALE POPULATION
2,415
FEMALE POPULATION
82.28
MALES / 100 FEMALES
121.54
FEMALES / 100 MALES
50.2
MEDIAN AGE
3.2
AVG FAMILY SIZE
2.6
AVG HOUSEHOLD SIZE
1,758
LABOR FORCE [ PEOPLE ]
48.7%
PERCENT IN LABOR FORCE
4.4%
UNEMPLOYMENT RATE
Bloomfield Hills Area Codes
Income in Bloomfield Hills
Income Overview in Bloomfield Hills
Per Capita Income in Bloomfield Hills is $129,481, while median incomes of families and households are $222,283 and $200,054 respectively.
| Characteristic | Number | Measure |
| Per Capita Income | 4,402 | $129,481 |
| Median Family Income | 1,082 | $222,283 |
| Mean Family Income | 1,082 | $400,385 |
| Median Household Income | 1,571 | $200,054 |
| Mean Household Income | 1,571 | $351,685 |
| Income Deficit | 1,082 | $0 |
| Wage / Income Gap (%) | 4,402 | 50.15% |
| Wage / Income Gap ($) | 4,402 | 49.85¢ per $1 |
| Gini / Inequality Index | 4,402 | 0.53 |
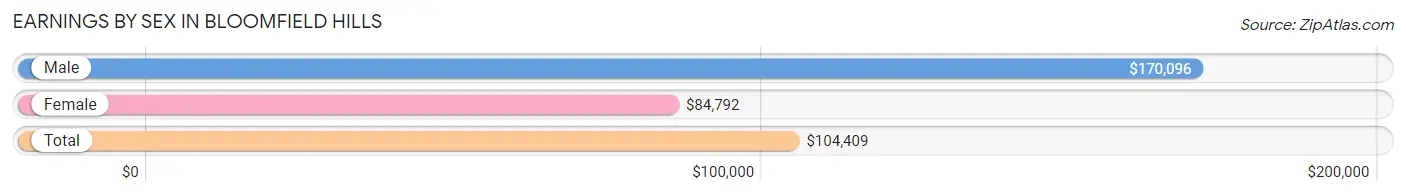
Earnings by Sex in Bloomfield Hills
Average Earnings in Bloomfield Hills are $104,409, $170,096 for men and $84,792 for women, a difference of 50.1%.
| Sex | Number | Average Earnings |
| Male | 1,167 (64.8%) | $170,096 |
| Female | 633 (35.2%) | $84,792 |
| Total | 1,800 (100.0%) | $104,409 |
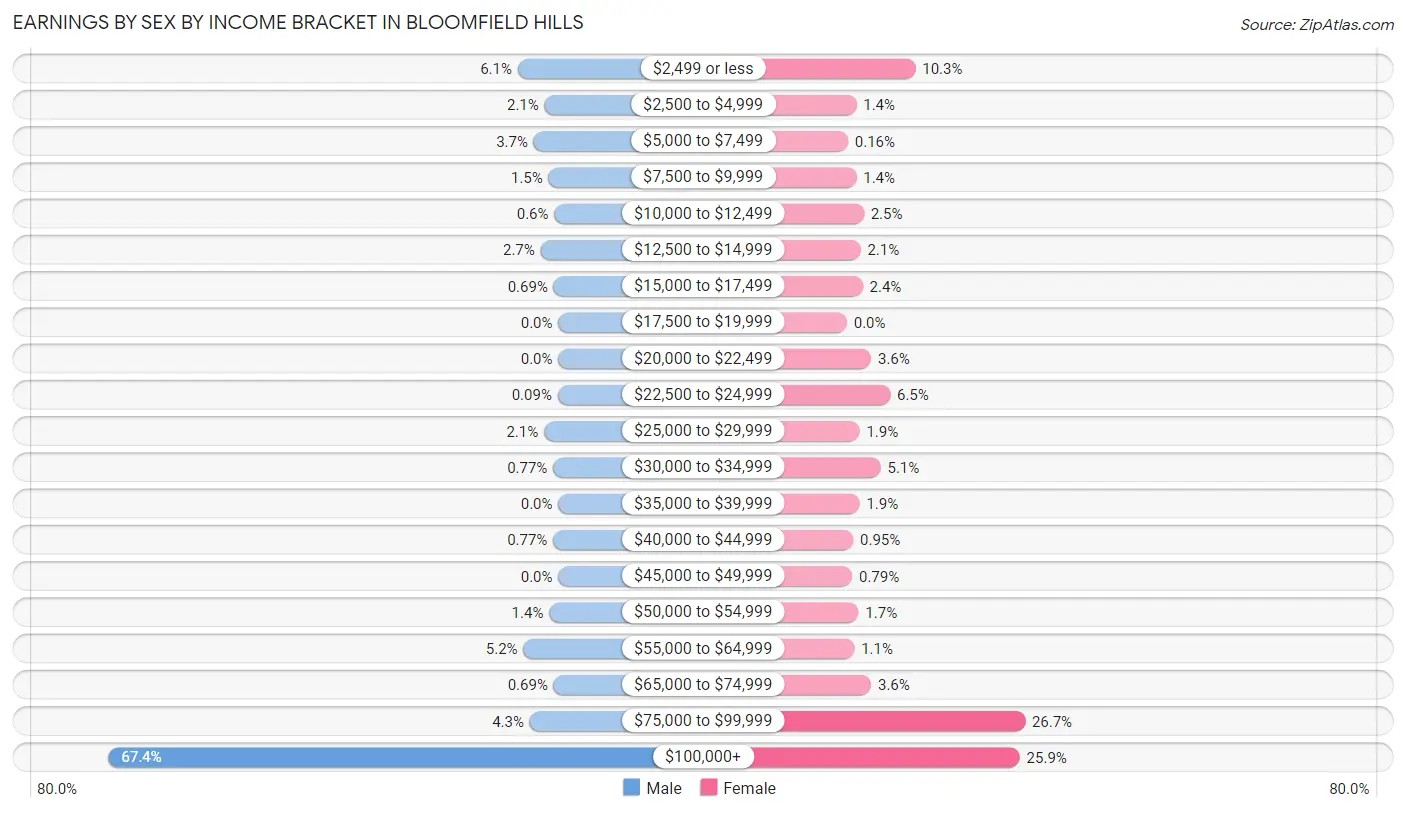
Earnings by Sex by Income Bracket in Bloomfield Hills
The most common earnings brackets in Bloomfield Hills are $100,000+ for men (787 | 67.4%) and $75,000 to $99,999 for women (169 | 26.7%).
| Income | Male | Female |
| $2,499 or less | 71 (6.1%) | 65 (10.3%) |
| $2,500 to $4,999 | 24 (2.1%) | 9 (1.4%) |
| $5,000 to $7,499 | 43 (3.7%) | 1 (0.2%) |
| $7,500 to $9,999 | 17 (1.5%) | 9 (1.4%) |
| $10,000 to $12,499 | 7 (0.6%) | 16 (2.5%) |
| $12,500 to $14,999 | 31 (2.7%) | 13 (2.1%) |
| $15,000 to $17,499 | 8 (0.7%) | 15 (2.4%) |
| $17,500 to $19,999 | 0 (0.0%) | 0 (0.0%) |
| $20,000 to $22,499 | 0 (0.0%) | 23 (3.6%) |
| $22,500 to $24,999 | 1 (0.1%) | 41 (6.5%) |
| $25,000 to $29,999 | 25 (2.1%) | 12 (1.9%) |
| $30,000 to $34,999 | 9 (0.8%) | 32 (5.1%) |
| $35,000 to $39,999 | 0 (0.0%) | 12 (1.9%) |
| $40,000 to $44,999 | 9 (0.8%) | 6 (0.9%) |
| $45,000 to $49,999 | 0 (0.0%) | 5 (0.8%) |
| $50,000 to $54,999 | 16 (1.4%) | 11 (1.7%) |
| $55,000 to $64,999 | 61 (5.2%) | 7 (1.1%) |
| $65,000 to $74,999 | 8 (0.7%) | 23 (3.6%) |
| $75,000 to $99,999 | 50 (4.3%) | 169 (26.7%) |
| $100,000+ | 787 (67.4%) | 164 (25.9%) |
| Total | 1,167 (100.0%) | 633 (100.0%) |
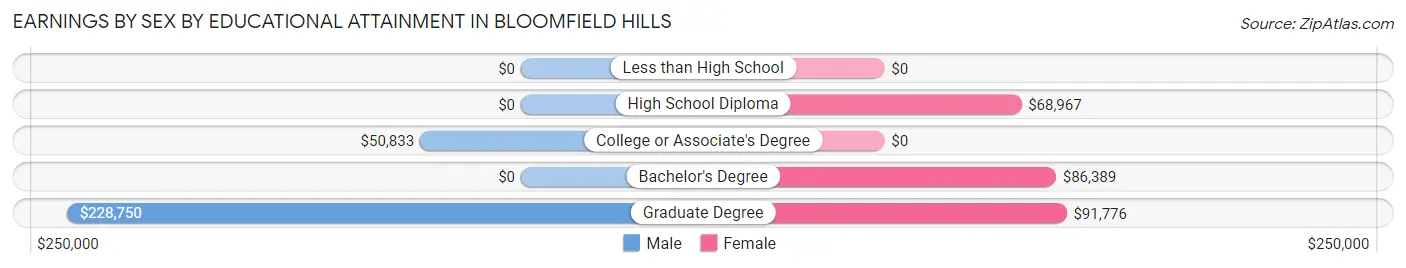
Earnings by Sex by Educational Attainment in Bloomfield Hills
Average earnings in Bloomfield Hills are $179,664 for men and $87,359 for women, a difference of 51.4%. Men with an educational attainment of graduate degree enjoy the highest average annual earnings of $228,750, while those with college or associate's degree education earn the least with $50,833. Women with an educational attainment of graduate degree earn the most with the average annual earnings of $91,776, while those with high school diploma education have the smallest earnings of $68,967.
| Educational Attainment | Male Income | Female Income |
| Less than High School | - | - |
| High School Diploma | - | - |
| College or Associate's Degree | $50,833 | $0 |
| Bachelor's Degree | - | - |
| Graduate Degree | $228,750 | $91,776 |
| Total | $179,664 | $87,359 |
Family Income in Bloomfield Hills
Family Income Brackets in Bloomfield Hills
According to the Bloomfield Hills family income data, there are 626 families falling into the $200,000+ income range, which is the most common income bracket and makes up 57.9% of all families.
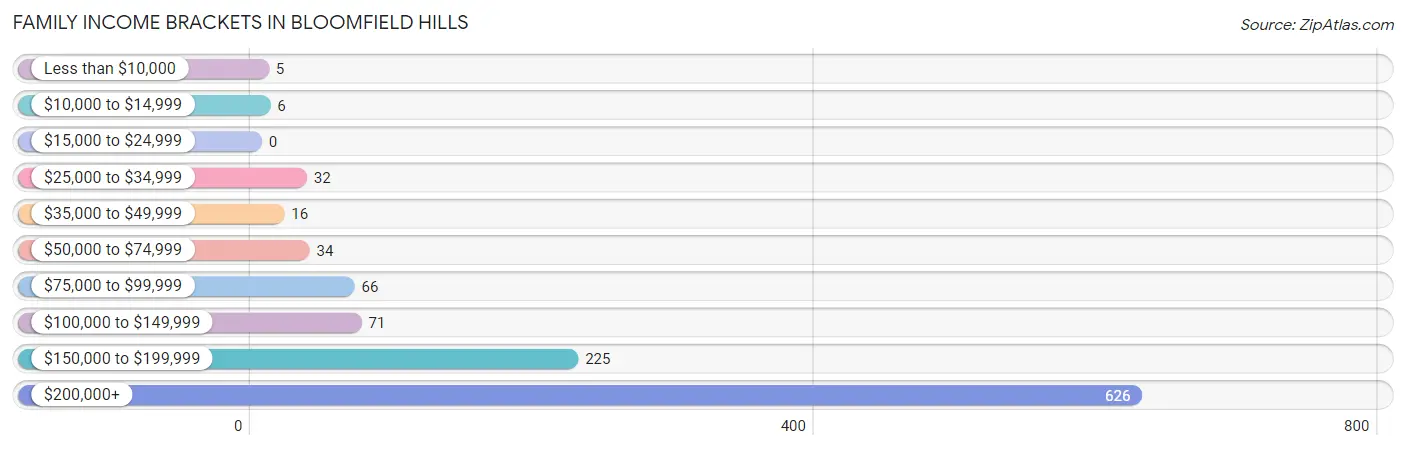
| Income Bracket | # Families | % Families |
| Less than $10,000 | 5 | 0.5% |
| $10,000 to $14,999 | 6 | 0.6% |
| $15,000 to $24,999 | 0 | 0.0% |
| $25,000 to $34,999 | 32 | 3.0% |
| $35,000 to $49,999 | 16 | 1.5% |
| $50,000 to $74,999 | 34 | 3.1% |
| $75,000 to $99,999 | 66 | 6.1% |
| $100,000 to $149,999 | 71 | 6.6% |
| $150,000 to $199,999 | 225 | 20.8% |
| $200,000+ | 626 | 57.9% |
Family Income by Famaliy Size in Bloomfield Hills
3-person families (119 | 11.0%) account for the highest median family income in Bloomfield Hills with $250,001 per family, while 2-person families (579 | 53.5%) have the highest median income of $97,046 per family member.
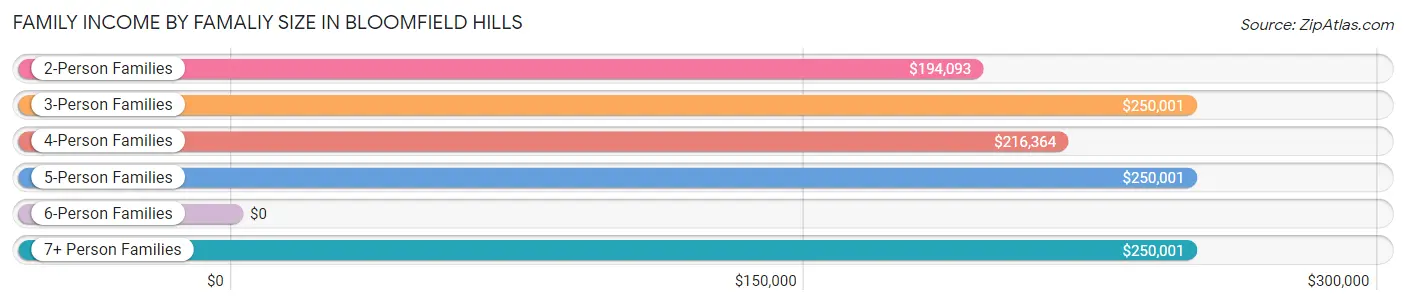
| Income Bracket | # Families | Median Income |
| 2-Person Families | 579 (53.5%) | $194,093 |
| 3-Person Families | 119 (11.0%) | $250,001 |
| 4-Person Families | 206 (19.0%) | $216,364 |
| 5-Person Families | 102 (9.4%) | $250,001 |
| 6-Person Families | 14 (1.3%) | $0 |
| 7+ Person Families | 62 (5.7%) | $250,001 |
| Total | 1,082 (100.0%) | $222,283 |
Family Income by Number of Earners in Bloomfield Hills
The median family income in Bloomfield Hills is $222,283, with families comprising 3+ earners (84) having the highest median family income of $250,001, while families with no earners (206) have the lowest median family income of $163,750, accounting for 7.8% and 19.0% of families, respectively.
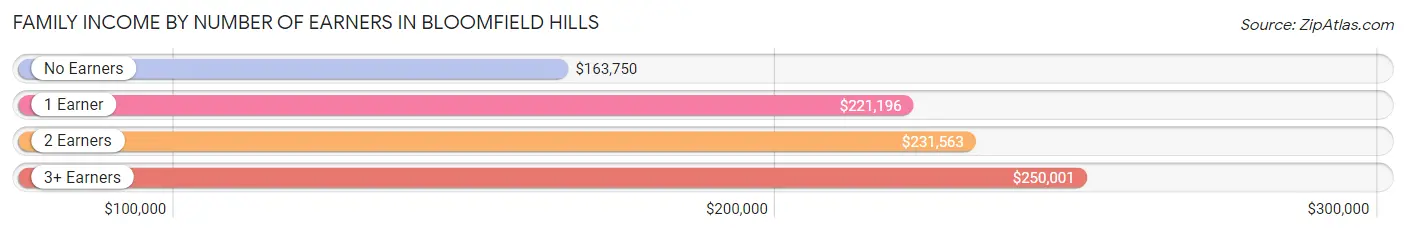
| Number of Earners | # Families | Median Income |
| No Earners | 206 (19.0%) | $163,750 |
| 1 Earner | 474 (43.8%) | $221,196 |
| 2 Earners | 318 (29.4%) | $231,563 |
| 3+ Earners | 84 (7.8%) | $250,001 |
| Total | 1,082 (100.0%) | $222,283 |
Household Income in Bloomfield Hills
Household Income Brackets in Bloomfield Hills
With 786 households falling in the category, the $200,000+ income range is the most frequent in Bloomfield Hills, accounting for 50.0% of all households.
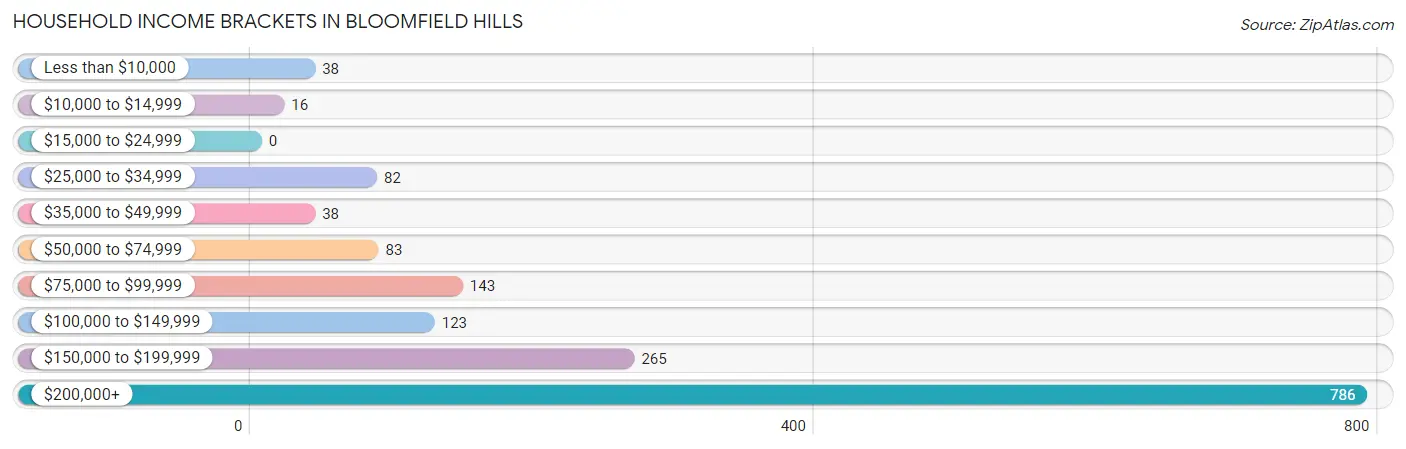
| Income Bracket | # Households | % Households |
| Less than $10,000 | 38 | 2.4% |
| $10,000 to $14,999 | 16 | 1.0% |
| $15,000 to $24,999 | 0 | 0.0% |
| $25,000 to $34,999 | 82 | 5.2% |
| $35,000 to $49,999 | 38 | 2.4% |
| $50,000 to $74,999 | 83 | 5.3% |
| $75,000 to $99,999 | 143 | 9.1% |
| $100,000 to $149,999 | 123 | 7.8% |
| $150,000 to $199,999 | 265 | 16.9% |
| $200,000+ | 786 | 50.0% |
Household Income by Householder Age in Bloomfield Hills
The median household income in Bloomfield Hills is $200,054, with the highest median household income of $223,409 found in the 45 to 64 years age bracket for the primary householder. A total of 618 households (39.3%) fall into this category.
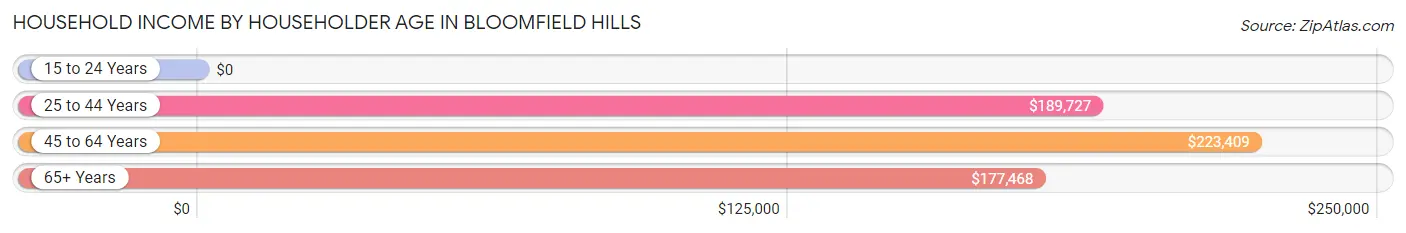
| Income Bracket | # Households | Median Income |
| 15 to 24 Years | 0 (0.0%) | $0 |
| 25 to 44 Years | 234 (14.9%) | $189,727 |
| 45 to 64 Years | 618 (39.3%) | $223,409 |
| 65+ Years | 719 (45.8%) | $177,468 |
| Total | 1,571 (100.0%) | $200,054 |
Poverty in Bloomfield Hills
Income Below Poverty by Sex and Age in Bloomfield Hills
With 3.8% poverty level for males and 2.9% for females among the residents of Bloomfield Hills, 16 and 17 year old males and 16 and 17 year old females are the most vulnerable to poverty, with 23 males (52.3%) and 12 females (20.0%) in their respective age groups living below the poverty level.
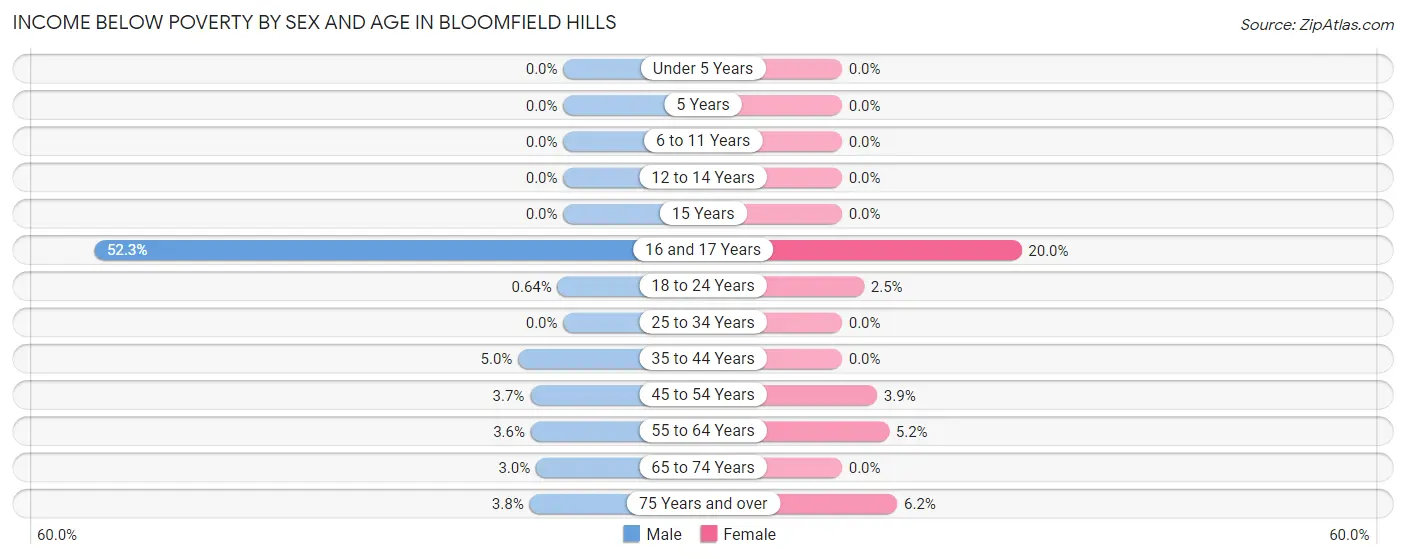
| Age Bracket | Male | Female |
| Under 5 Years | 0 (0.0%) | 0 (0.0%) |
| 5 Years | 0 (0.0%) | 0 (0.0%) |
| 6 to 11 Years | 0 (0.0%) | 0 (0.0%) |
| 12 to 14 Years | 0 (0.0%) | 0 (0.0%) |
| 15 Years | 0 (0.0%) | 0 (0.0%) |
| 16 and 17 Years | 23 (52.3%) | 12 (20.0%) |
| 18 to 24 Years | 1 (0.6%) | 6 (2.5%) |
| 25 to 34 Years | 0 (0.0%) | 0 (0.0%) |
| 35 to 44 Years | 8 (5.0%) | 0 (0.0%) |
| 45 to 54 Years | 12 (3.7%) | 12 (3.9%) |
| 55 to 64 Years | 9 (3.6%) | 11 (5.2%) |
| 65 to 74 Years | 7 (3.0%) | 0 (0.0%) |
| 75 Years and over | 9 (3.8%) | 25 (6.2%) |
| Total | 69 (3.8%) | 66 (2.9%) |
Income Above Poverty by Sex and Age in Bloomfield Hills
According to the poverty statistics in Bloomfield Hills, males aged under 5 years and females aged under 5 years are the age groups that are most secure financially, with 100.0% of males and 100.0% of females in these age groups living above the poverty line.
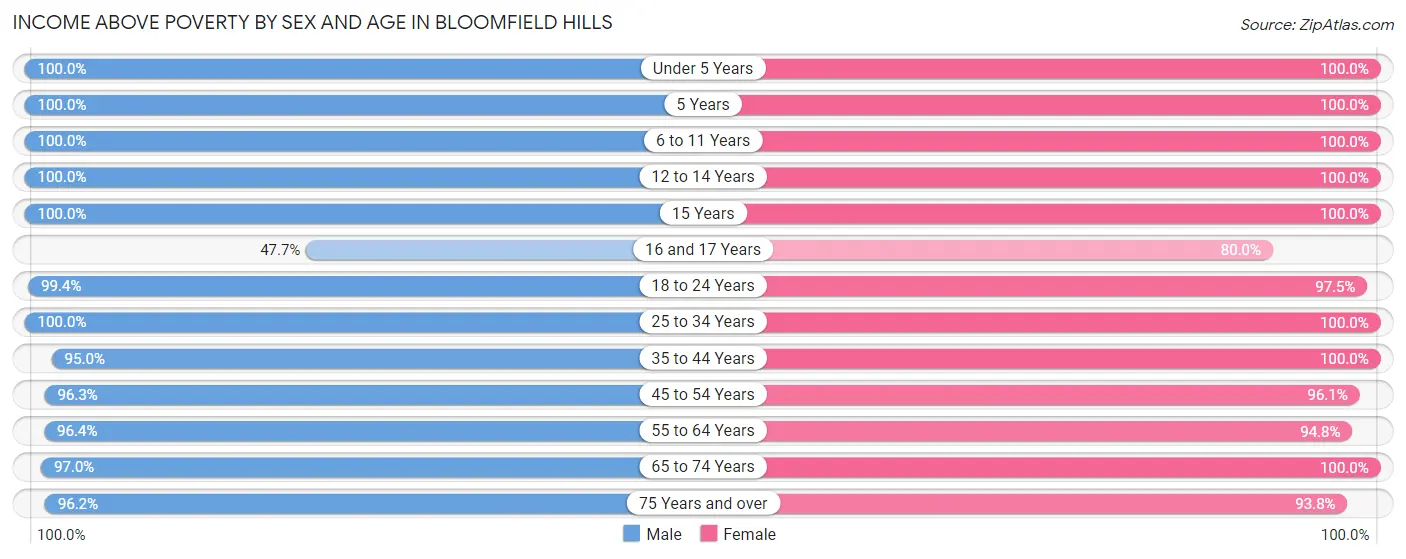
| Age Bracket | Male | Female |
| Under 5 Years | 122 (100.0%) | 73 (100.0%) |
| 5 Years | 13 (100.0%) | 57 (100.0%) |
| 6 to 11 Years | 129 (100.0%) | 160 (100.0%) |
| 12 to 14 Years | 25 (100.0%) | 121 (100.0%) |
| 15 Years | 48 (100.0%) | 45 (100.0%) |
| 16 and 17 Years | 21 (47.7%) | 48 (80.0%) |
| 18 to 24 Years | 155 (99.4%) | 238 (97.5%) |
| 25 to 34 Years | 82 (100.0%) | 122 (100.0%) |
| 35 to 44 Years | 151 (95.0%) | 216 (100.0%) |
| 45 to 54 Years | 313 (96.3%) | 295 (96.1%) |
| 55 to 64 Years | 239 (96.4%) | 199 (94.8%) |
| 65 to 74 Years | 223 (97.0%) | 229 (100.0%) |
| 75 Years and over | 230 (96.2%) | 381 (93.8%) |
| Total | 1,751 (96.2%) | 2,184 (97.1%) |
Income Below Poverty Among Married-Couple Families in Bloomfield Hills
The poverty statistics for married-couple families in Bloomfield Hills show that 2.0% or 18 of the total 912 families live below the poverty line. Families with 3 or 4 children have the highest poverty rate of 15.8%, comprising of 12 families. On the other hand, families with 1 or 2 children have the lowest poverty rate of 0.0%, which includes 0 families.
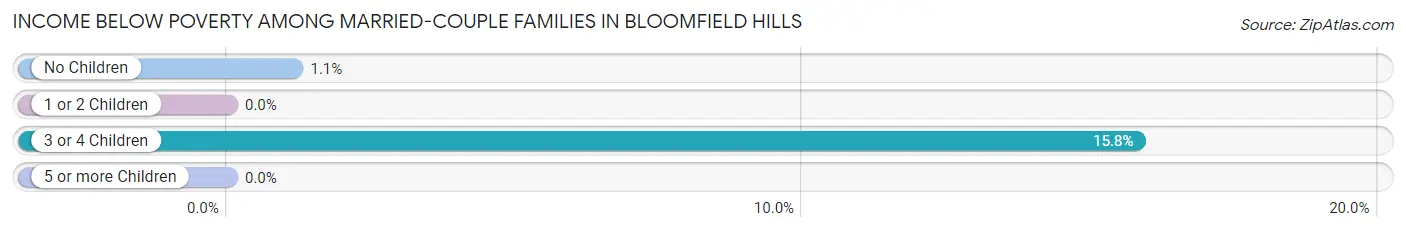
| Children | Above Poverty | Below Poverty |
| No Children | 522 (98.9%) | 6 (1.1%) |
| 1 or 2 Children | 278 (100.0%) | 0 (0.0%) |
| 3 or 4 Children | 64 (84.2%) | 12 (15.8%) |
| 5 or more Children | 30 (100.0%) | 0 (0.0%) |
| Total | 894 (98.0%) | 18 (2.0%) |
Income Below Poverty Among Single-Parent Households in Bloomfield Hills
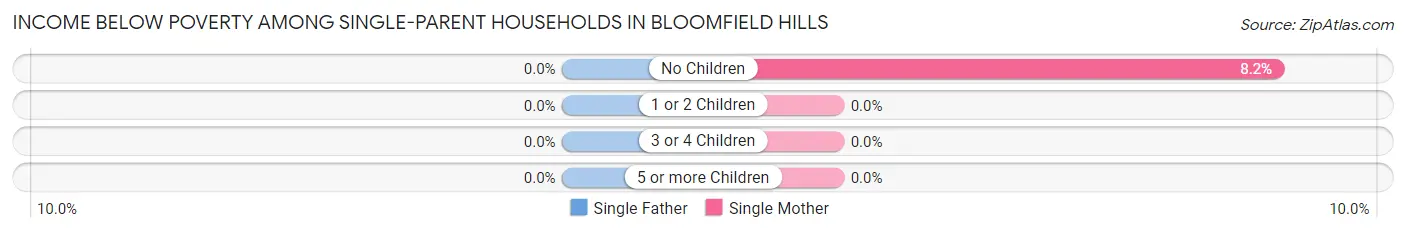
| Children | Single Father | Single Mother |
| No Children | 0 (0.0%) | 5 (8.2%) |
| 1 or 2 Children | 0 (0.0%) | 0 (0.0%) |
| 3 or 4 Children | 0 (0.0%) | 0 (0.0%) |
| 5 or more Children | 0 (0.0%) | 0 (0.0%) |
| Total | 0 (0.0%) | 5 (5.6%) |
Income Below Poverty Among Married-Couple vs Single-Parent Households in Bloomfield Hills
The poverty data for Bloomfield Hills shows that 18 of the married-couple family households (2.0%) and 5 of the single-parent households (2.9%) are living below the poverty level. Within the married-couple family households, those with 3 or 4 children have the highest poverty rate, with 12 households (15.8%) falling below the poverty line. Among the single-parent households, those with no children have the highest poverty rate, with 5 household (3.5%) living below poverty.
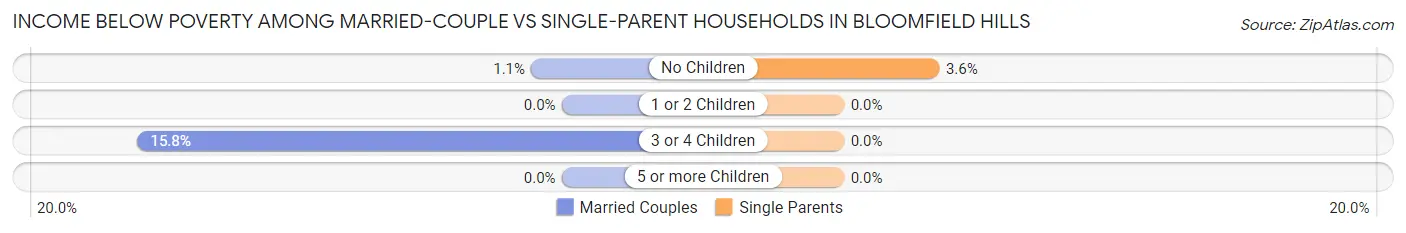
| Children | Married-Couple Families | Single-Parent Households |
| No Children | 6 (1.1%) | 5 (3.5%) |
| 1 or 2 Children | 0 (0.0%) | 0 (0.0%) |
| 3 or 4 Children | 12 (15.8%) | 0 (0.0%) |
| 5 or more Children | 0 (0.0%) | 0 (0.0%) |
| Total | 18 (2.0%) | 5 (2.9%) |
Race in Bloomfield Hills
The most populous races in Bloomfield Hills are White / Caucasian (3,706 | 84.2%), Two or more Races (341 | 7.7%), and Black / African American (190 | 4.3%).
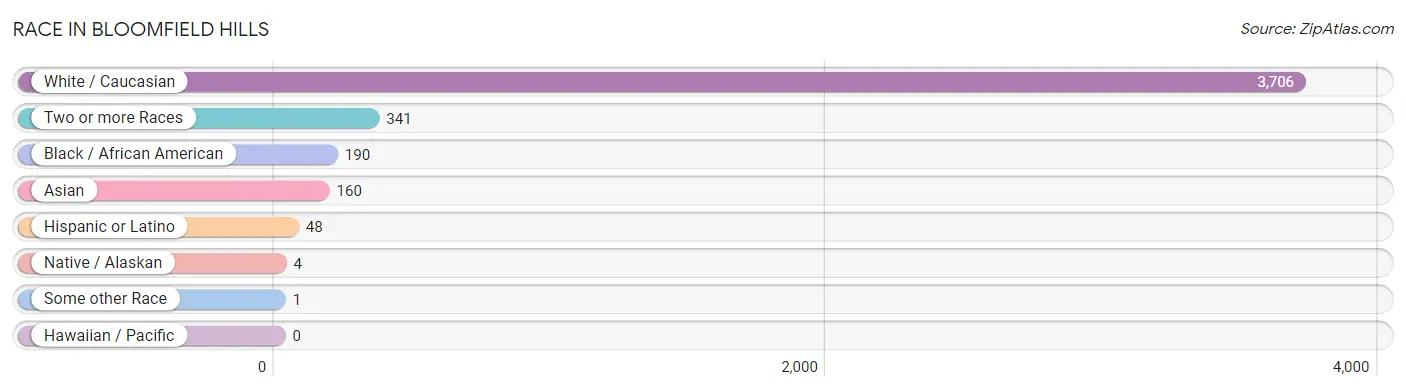
| Race | # Population | % Population |
| Asian | 160 | 3.6% |
| Black / African American | 190 | 4.3% |
| Hawaiian / Pacific | 0 | 0.0% |
| Hispanic or Latino | 48 | 1.1% |
| Native / Alaskan | 4 | 0.1% |
| White / Caucasian | 3,706 | 84.2% |
| Two or more Races | 341 | 7.7% |
| Some other Race | 1 | 0.0% |
| Total | 4,402 | 100.0% |
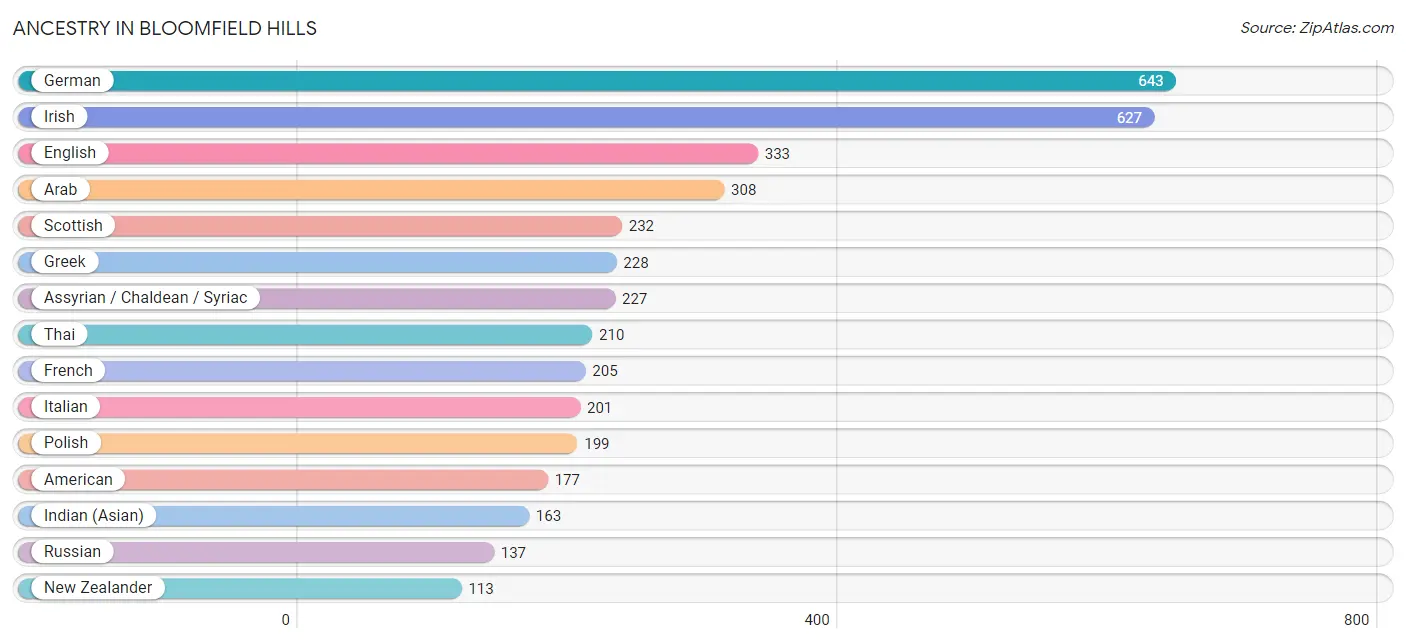
Ancestry in Bloomfield Hills
The most populous ancestries reported in Bloomfield Hills are German (643 | 14.6%), Irish (627 | 14.2%), English (333 | 7.6%), Arab (308 | 7.0%), and Scottish (232 | 5.3%), together accounting for 48.7% of all Bloomfield Hills residents.
| Ancestry | # Population | % Population |
| African | 17 | 0.4% |
| American | 177 | 4.0% |
| Arab | 308 | 7.0% |
| Armenian | 27 | 0.6% |
| Assyrian / Chaldean / Syriac | 227 | 5.2% |
| Austrian | 22 | 0.5% |
| Belgian | 21 | 0.5% |
| Bhutanese | 8 | 0.2% |
| British | 41 | 0.9% |
| Bulgarian | 6 | 0.1% |
| Burmese | 29 | 0.7% |
| Canadian | 8 | 0.2% |
| Central American | 1 | 0.0% |
| Cherokee | 11 | 0.3% |
| Chippewa | 4 | 0.1% |
| Colombian | 1 | 0.0% |
| Croatian | 46 | 1.0% |
| Czech | 8 | 0.2% |
| Dutch | 33 | 0.7% |
| Eastern European | 24 | 0.5% |
| English | 333 | 7.6% |
| European | 37 | 0.8% |
| French | 205 | 4.7% |
| French Canadian | 8 | 0.2% |
| German | 643 | 14.6% |
| Greek | 228 | 5.2% |
| Guatemalan | 1 | 0.0% |
| Hungarian | 23 | 0.5% |
| Indian (Asian) | 163 | 3.7% |
| Iraqi | 27 | 0.6% |
| Irish | 627 | 14.2% |
| Italian | 201 | 4.6% |
| Korean | 14 | 0.3% |
| Latvian | 12 | 0.3% |
| Lebanese | 38 | 0.9% |
| Lithuanian | 32 | 0.7% |
| Macedonian | 9 | 0.2% |
| Mexican | 1 | 0.0% |
| New Zealander | 113 | 2.6% |
| Nigerian | 7 | 0.2% |
| Norwegian | 38 | 0.9% |
| Polish | 199 | 4.5% |
| Portuguese | 34 | 0.8% |
| Romanian | 48 | 1.1% |
| Russian | 137 | 3.1% |
| Scottish | 232 | 5.3% |
| Serbian | 30 | 0.7% |
| Slovak | 1 | 0.0% |
| South American | 1 | 0.0% |
| Spanish | 33 | 0.7% |
| Subsaharan African | 17 | 0.4% |
| Swedish | 13 | 0.3% |
| Swiss | 9 | 0.2% |
| Thai | 210 | 4.8% |
| Turkish | 25 | 0.6% |
| Ukrainian | 29 | 0.7% |
| Welsh | 34 | 0.8% | View All 57 Rows |
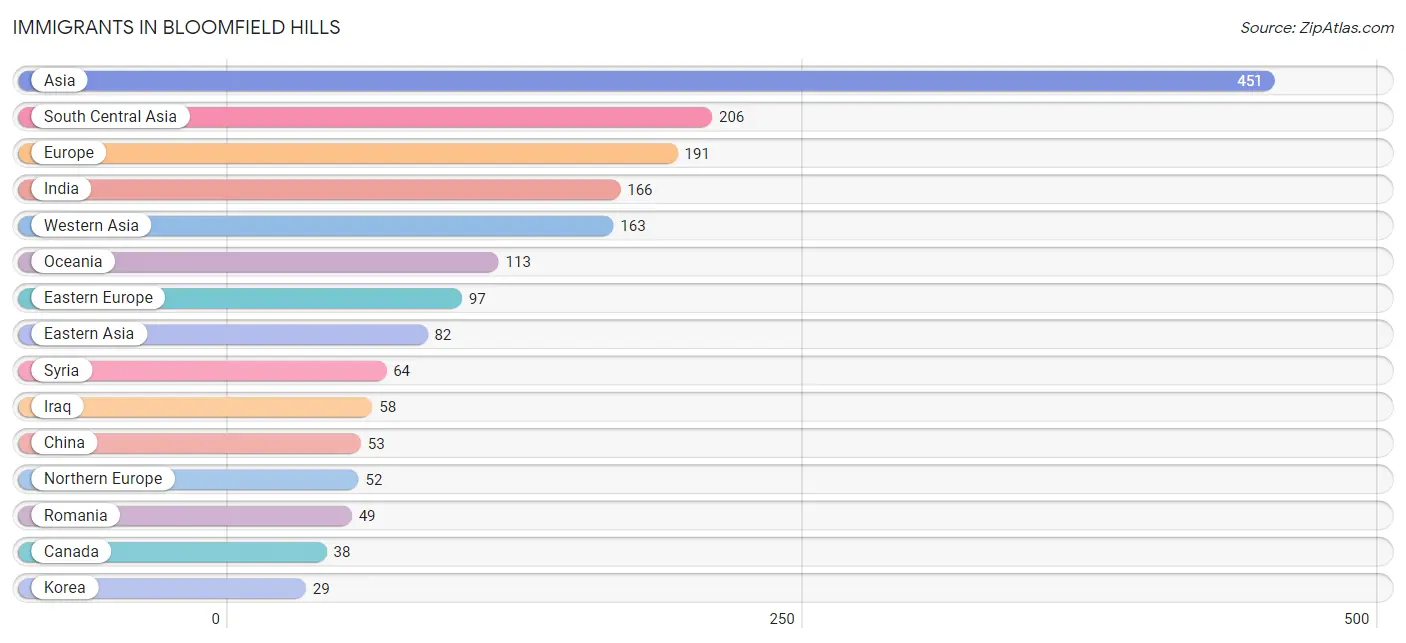
Immigrants in Bloomfield Hills
The most numerous immigrant groups reported in Bloomfield Hills came from Asia (451 | 10.2%), South Central Asia (206 | 4.7%), Europe (191 | 4.3%), India (166 | 3.8%), and Western Asia (163 | 3.7%), together accounting for 26.7% of all Bloomfield Hills residents.
| Immigration Origin | # Population | % Population |
| Africa | 7 | 0.2% |
| Asia | 451 | 10.2% |
| Bolivia | 12 | 0.3% |
| Canada | 38 | 0.9% |
| China | 53 | 1.2% |
| Czechoslovakia | 8 | 0.2% |
| Eastern Asia | 82 | 1.9% |
| Eastern Europe | 97 | 2.2% |
| England | 18 | 0.4% |
| Europe | 191 | 4.3% |
| France | 9 | 0.2% |
| Greece | 14 | 0.3% |
| India | 166 | 3.8% |
| Iraq | 58 | 1.3% |
| Italy | 15 | 0.3% |
| Korea | 29 | 0.7% |
| Latin America | 12 | 0.3% |
| Latvia | 12 | 0.3% |
| Lebanon | 24 | 0.5% |
| Nigeria | 7 | 0.2% |
| Northern Europe | 52 | 1.2% |
| Oceania | 113 | 2.6% |
| Pakistan | 23 | 0.5% |
| Romania | 49 | 1.1% |
| Russia | 6 | 0.1% |
| South America | 12 | 0.3% |
| South Central Asia | 206 | 4.7% |
| Southern Europe | 29 | 0.7% |
| Sri Lanka | 17 | 0.4% |
| Syria | 64 | 1.5% |
| Turkey | 17 | 0.4% |
| Western Africa | 7 | 0.2% |
| Western Asia | 163 | 3.7% |
| Western Europe | 13 | 0.3% | View All 34 Rows |
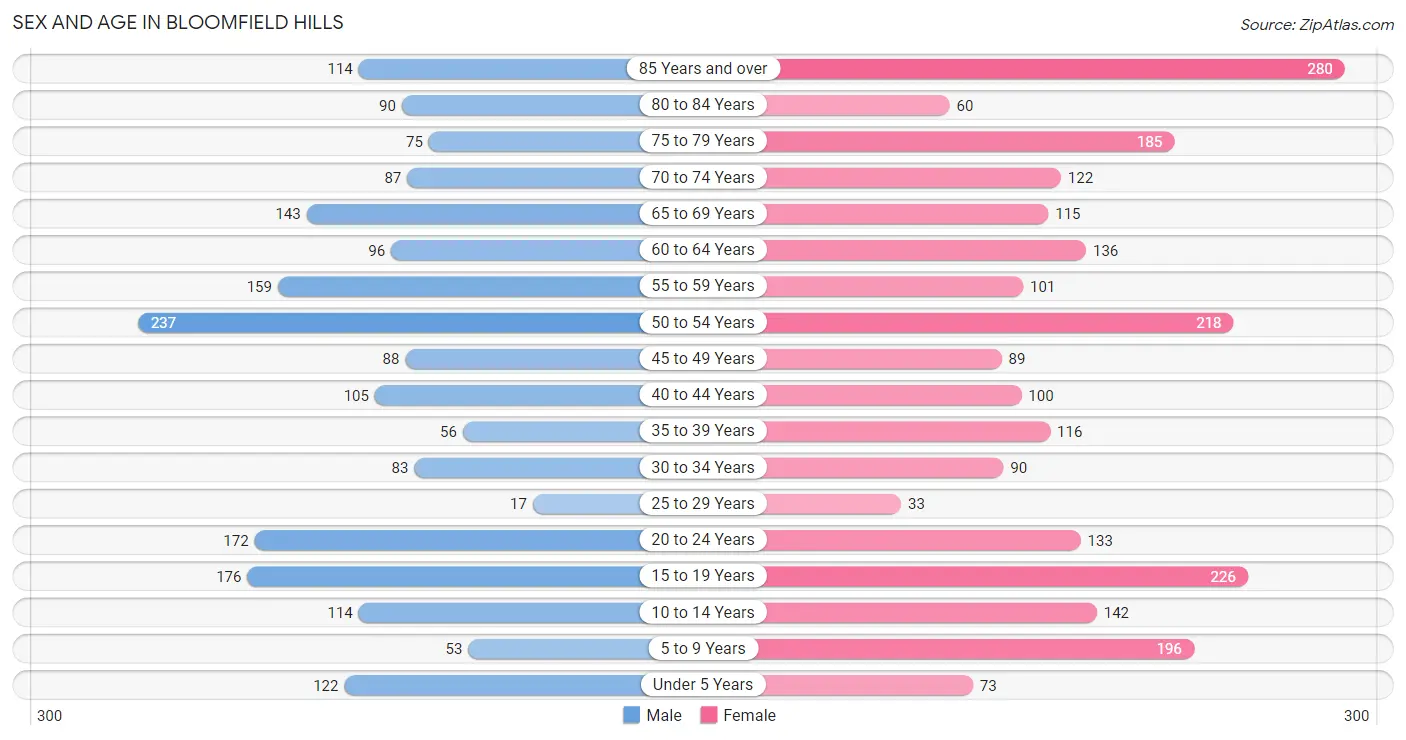
Sex and Age in Bloomfield Hills
Sex and Age in Bloomfield Hills
The most populous age groups in Bloomfield Hills are 50 to 54 Years (237 | 11.9%) for men and 85 Years and over (280 | 11.6%) for women.
| Age Bracket | Male | Female |
| Under 5 Years | 122 (6.1%) | 73 (3.0%) |
| 5 to 9 Years | 53 (2.7%) | 196 (8.1%) |
| 10 to 14 Years | 114 (5.7%) | 142 (5.9%) |
| 15 to 19 Years | 176 (8.9%) | 226 (9.4%) |
| 20 to 24 Years | 172 (8.7%) | 133 (5.5%) |
| 25 to 29 Years | 17 (0.9%) | 33 (1.4%) |
| 30 to 34 Years | 83 (4.2%) | 90 (3.7%) |
| 35 to 39 Years | 56 (2.8%) | 116 (4.8%) |
| 40 to 44 Years | 105 (5.3%) | 100 (4.1%) |
| 45 to 49 Years | 88 (4.4%) | 89 (3.7%) |
| 50 to 54 Years | 237 (11.9%) | 218 (9.0%) |
| 55 to 59 Years | 159 (8.0%) | 101 (4.2%) |
| 60 to 64 Years | 96 (4.8%) | 136 (5.6%) |
| 65 to 69 Years | 143 (7.2%) | 115 (4.8%) |
| 70 to 74 Years | 87 (4.4%) | 122 (5.1%) |
| 75 to 79 Years | 75 (3.8%) | 185 (7.7%) |
| 80 to 84 Years | 90 (4.5%) | 60 (2.5%) |
| 85 Years and over | 114 (5.7%) | 280 (11.6%) |
| Total | 1,987 (100.0%) | 2,415 (100.0%) |
Families and Households in Bloomfield Hills
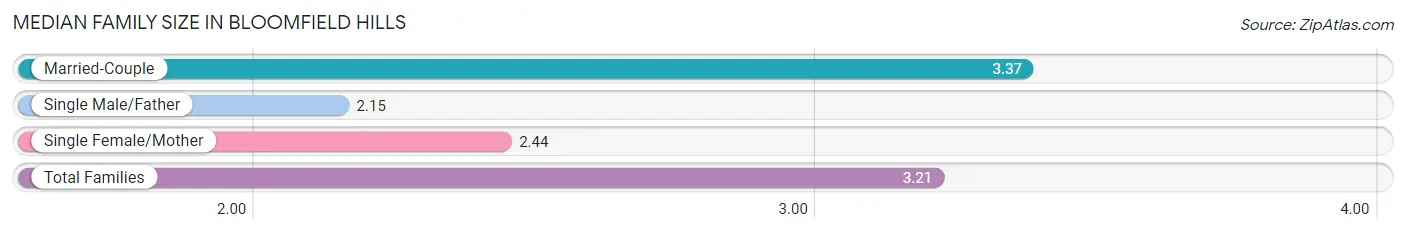
Median Family Size in Bloomfield Hills
The median family size in Bloomfield Hills is 3.21 persons per family, with married-couple families (912 | 84.3%) accounting for the largest median family size of 3.37 persons per family. On the other hand, single male/father families (80 | 7.4%) represent the smallest median family size with 2.15 persons per family.
| Family Type | # Families | Family Size |
| Married-Couple | 912 (84.3%) | 3.37 |
| Single Male/Father | 80 (7.4%) | 2.15 |
| Single Female/Mother | 90 (8.3%) | 2.44 |
| Total Families | 1,082 (100.0%) | 3.21 |
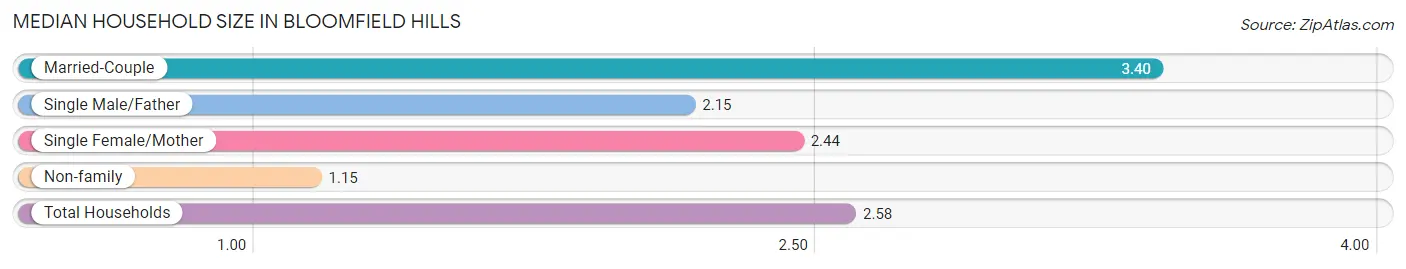
Median Household Size in Bloomfield Hills
The median household size in Bloomfield Hills is 2.58 persons per household, with married-couple households (912 | 58.1%) accounting for the largest median household size of 3.4 persons per household. non-family households (489 | 31.1%) represent the smallest median household size with 1.15 persons per household.
| Household Type | # Households | Household Size |
| Married-Couple | 912 (58.1%) | 3.40 |
| Single Male/Father | 80 (5.1%) | 2.15 |
| Single Female/Mother | 90 (5.7%) | 2.44 |
| Non-family | 489 (31.1%) | 1.15 |
| Total Households | 1,571 (100.0%) | 2.58 |
Household Size by Marriage Status in Bloomfield Hills
Out of a total of 1,571 households in Bloomfield Hills, 1,082 (68.9%) are family households, while 489 (31.1%) are nonfamily households. The most numerous type of family households are 2-person households, comprising 566, and the most common type of nonfamily households are 1-person households, comprising 426.
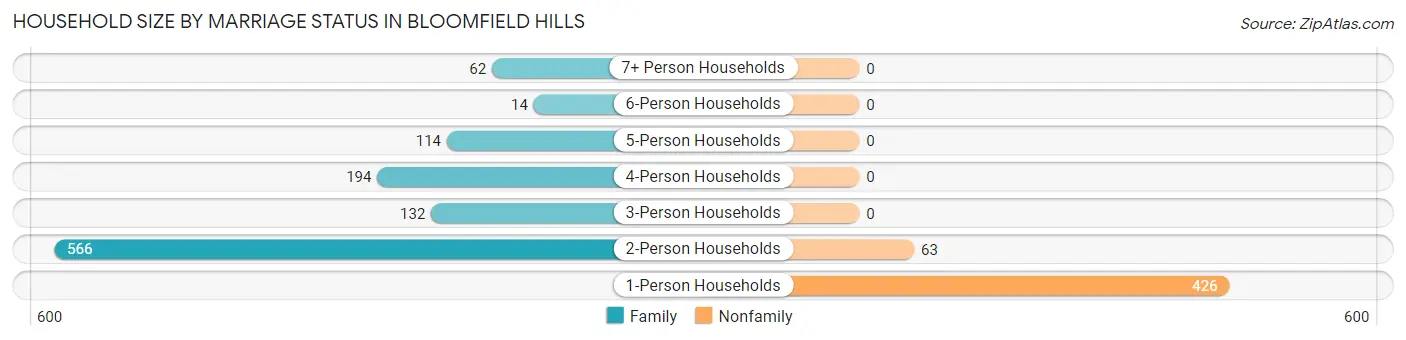
| Household Size | Family Households | Nonfamily Households |
| 1-Person Households | - | 426 (27.1%) |
| 2-Person Households | 566 (36.0%) | 63 (4.0%) |
| 3-Person Households | 132 (8.4%) | 0 (0.0%) |
| 4-Person Households | 194 (12.3%) | 0 (0.0%) |
| 5-Person Households | 114 (7.3%) | 0 (0.0%) |
| 6-Person Households | 14 (0.9%) | 0 (0.0%) |
| 7+ Person Households | 62 (4.0%) | 0 (0.0%) |
| Total | 1,082 (68.9%) | 489 (31.1%) |
Female Fertility in Bloomfield Hills
Fertility by Age in Bloomfield Hills
Average fertility rate in Bloomfield Hills is 55.0 births per 1,000 women. Women in the age bracket of 35 to 50 years have the highest fertility rate with 116.0 births per 1,000 women. Women in the age bracket of 35 to 50 years acount for 86.7% of all women with births.
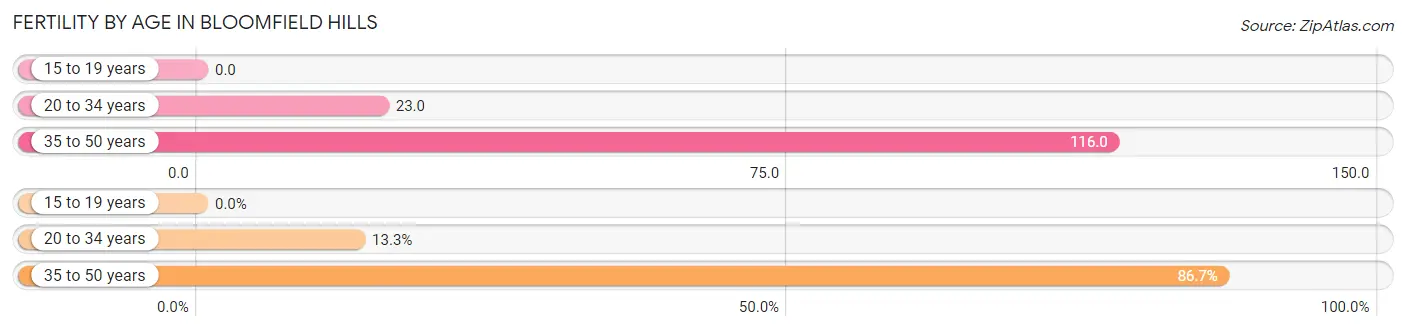
| Age Bracket | Women with Births | Births / 1,000 Women |
| 15 to 19 years | 0 (0.0%) | 0.0 |
| 20 to 34 years | 6 (13.3%) | 23.0 |
| 35 to 50 years | 39 (86.7%) | 116.0 |
| Total | 45 (100.0%) | 55.0 |
Fertility by Age by Marriage Status in Bloomfield Hills
66.7% of women with births (45) in Bloomfield Hills are married. The highest percentage of unmarried women with births falls into 35 to 50 years age bracket with 38.5% of them unmarried at the time of birth, while the lowest percentage of unmarried women with births belong to 20 to 34 years age bracket with 0.0% of them unmarried.
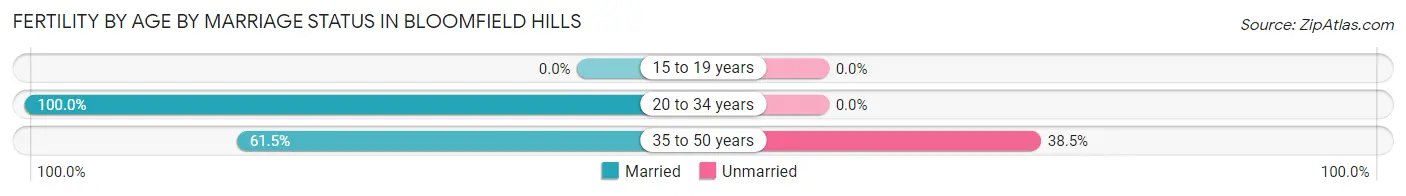
| Age Bracket | Married | Unmarried |
| 15 to 19 years | 0 (0.0%) | 0 (0.0%) |
| 20 to 34 years | 6 (100.0%) | 0 (0.0%) |
| 35 to 50 years | 24 (61.5%) | 15 (38.5%) |
| Total | 30 (66.7%) | 15 (33.3%) |
Fertility by Education in Bloomfield Hills
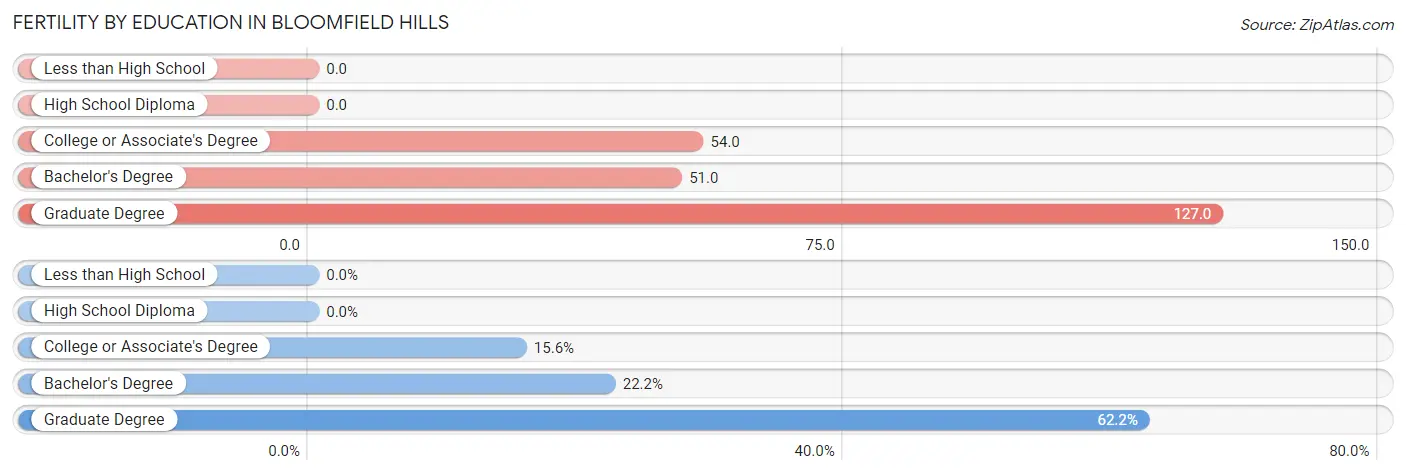
| Educational Attainment | Women with Births | Births / 1,000 Women |
| Less than High School | 0 (0.0%) | 0.0 |
| High School Diploma | 0 (0.0%) | 0.0 |
| College or Associate's Degree | 7 (15.6%) | 54.0 |
| Bachelor's Degree | 10 (22.2%) | 51.0 |
| Graduate Degree | 28 (62.2%) | 127.0 |
| Total | 45 (100.0%) | 55.0 |
Fertility by Education by Marriage Status in Bloomfield Hills
33.3% of women with births in Bloomfield Hills are unmarried. Women with the educational attainment of college or associate's degree are most likely to be married with 100.0% of them married at childbirth, while women with the educational attainment of graduate degree are least likely to be married with 53.6% of them unmarried at childbirth.
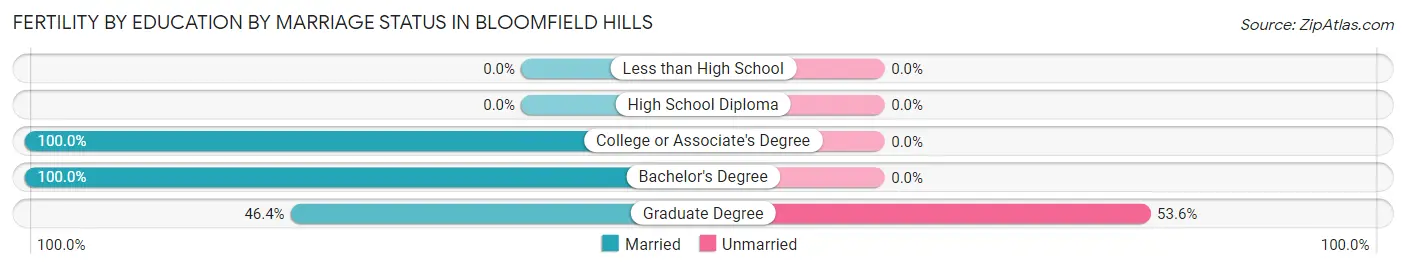
| Educational Attainment | Married | Unmarried |
| Less than High School | 0 (0.0%) | 0 (0.0%) |
| High School Diploma | 0 (0.0%) | 0 (0.0%) |
| College or Associate's Degree | 7 (100.0%) | 0 (0.0%) |
| Bachelor's Degree | 10 (100.0%) | 0 (0.0%) |
| Graduate Degree | 13 (46.4%) | 15 (53.6%) |
| Total | 30 (66.7%) | 15 (33.3%) |
Employment Characteristics in Bloomfield Hills
Employment by Class of Employer in Bloomfield Hills
Among the 1,647 employed individuals in Bloomfield Hills, private company employees (1,018 | 61.8%), self-employed (incorporated) (251 | 15.2%), and self-employed (not incorporated) (156 | 9.5%) make up the most common classes of employment.
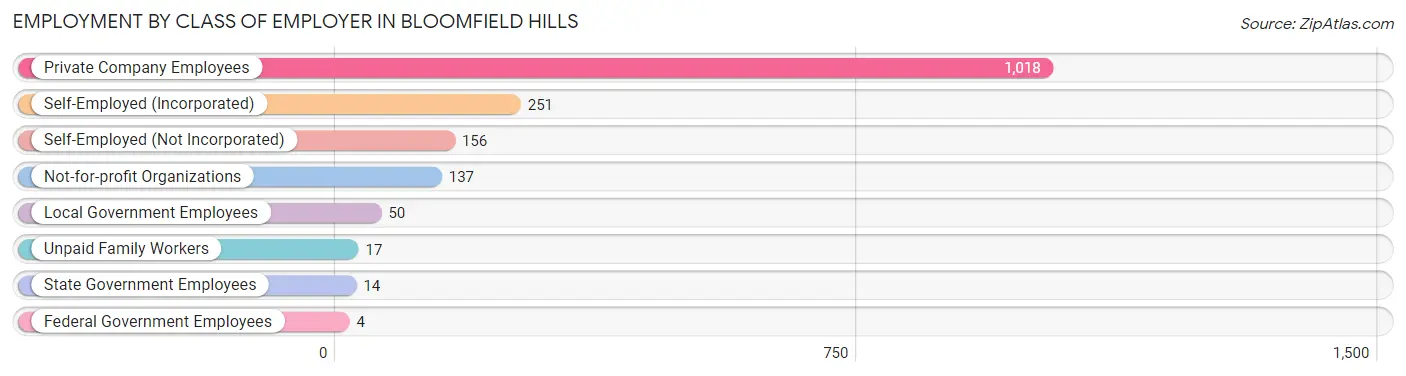
| Employer Class | # Employees | % Employees |
| Private Company Employees | 1,018 | 61.8% |
| Self-Employed (Incorporated) | 251 | 15.2% |
| Self-Employed (Not Incorporated) | 156 | 9.5% |
| Not-for-profit Organizations | 137 | 8.3% |
| Local Government Employees | 50 | 3.0% |
| State Government Employees | 14 | 0.9% |
| Federal Government Employees | 4 | 0.2% |
| Unpaid Family Workers | 17 | 1.0% |
| Total | 1,647 | 100.0% |
Employment Status by Age in Bloomfield Hills
According to the labor force statistics for Bloomfield Hills, out of the total population over 16 years of age (3,609), 48.7% or 1,758 individuals are in the labor force, with 4.4% or 77 of them unemployed. The age group with the highest labor force participation rate is 55 to 59 years, with 83.8% or 218 individuals in the labor force. Within the labor force, the 20 to 24 years age range has the highest percentage of unemployed individuals, with 20.3% or 24 of them being unemployed.
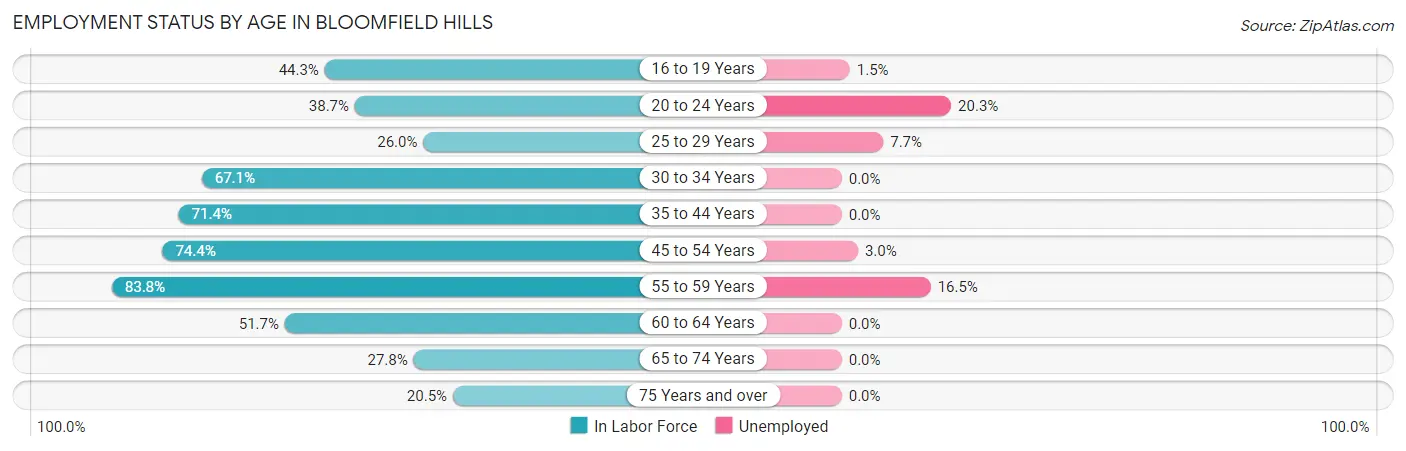
| Age Bracket | In Labor Force | Unemployed |
| 16 to 19 Years | 137 (44.3%) | 2 (1.5%) |
| 20 to 24 Years | 118 (38.7%) | 24 (20.3%) |
| 25 to 29 Years | 13 (26.0%) | 1 (7.7%) |
| 30 to 34 Years | 116 (67.1%) | 0 (0.0%) |
| 35 to 44 Years | 269 (71.4%) | 0 (0.0%) |
| 45 to 54 Years | 470 (74.4%) | 14 (3.0%) |
| 55 to 59 Years | 218 (83.8%) | 36 (16.5%) |
| 60 to 64 Years | 120 (51.7%) | 0 (0.0%) |
| 65 to 74 Years | 130 (27.8%) | 0 (0.0%) |
| 75 Years and over | 165 (20.5%) | 0 (0.0%) |
| Total | 1,758 (48.7%) | 77 (4.4%) |
Employment Status by Educational Attainment in Bloomfield Hills
According to labor force statistics for Bloomfield Hills, 70.0% of individuals (1,207) out of the total population between 25 and 64 years of age (1,724) are in the labor force, with 4.2% or 51 of them being unemployed. The group with the highest labor force participation rate are those with the educational attainment of bachelor's degree or higher, with 76.1% or 1,142 individuals in the labor force. Within the labor force, individuals with bachelor's degree or higher education have the highest percentage of unemployment, with 4.5% or 51 of them being unemployed.
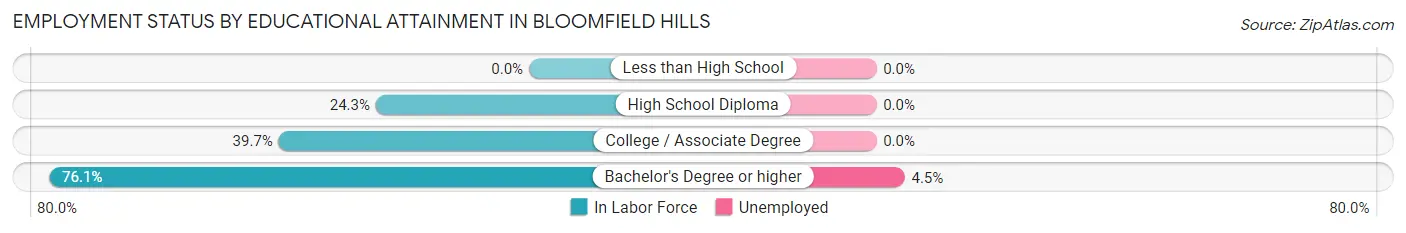
| Educational Attainment | In Labor Force | Unemployed |
| Less than High School | 0 (0.0%) | 0 (0.0%) |
| High School Diploma | 33 (24.3%) | 0 (0.0%) |
| College / Associate Degree | 31 (39.7%) | 0 (0.0%) |
| Bachelor's Degree or higher | 1,142 (76.1%) | 68 (4.5%) |
| Total | 1,207 (70.0%) | 72 (4.2%) |
Employment Occupations by Sex in Bloomfield Hills
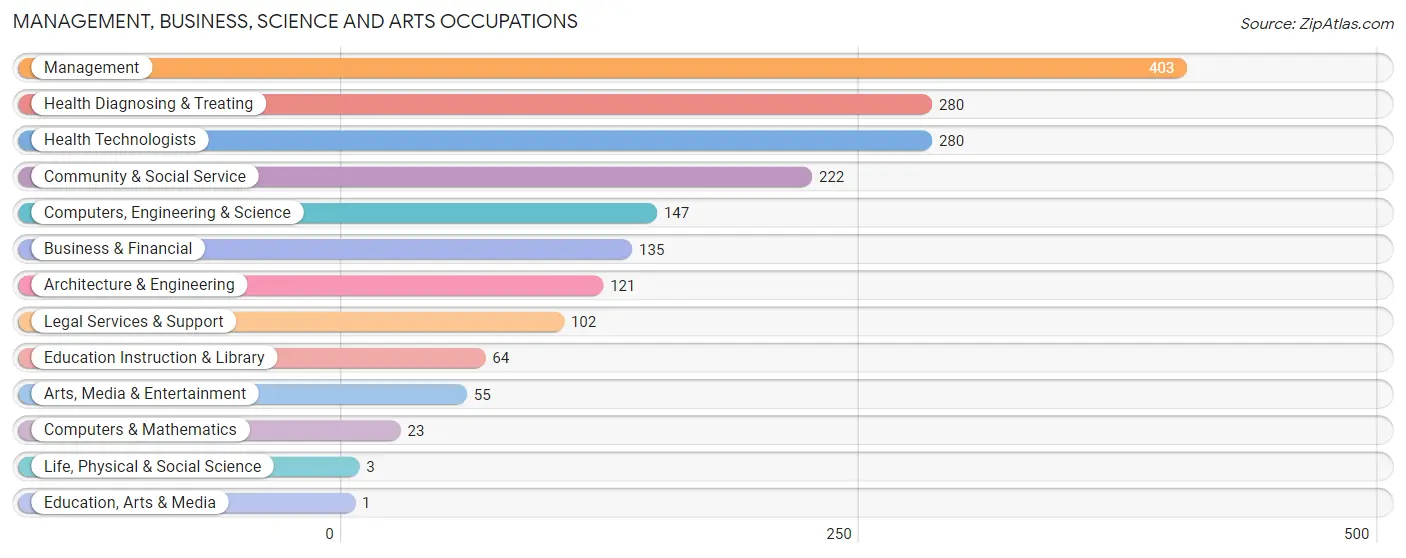
Management, Business, Science and Arts Occupations
The most common Management, Business, Science and Arts occupations in Bloomfield Hills are Management (403 | 24.0%), Health Diagnosing & Treating (280 | 16.7%), Health Technologists (280 | 16.7%), Community & Social Service (222 | 13.2%), and Computers, Engineering & Science (147 | 8.8%).
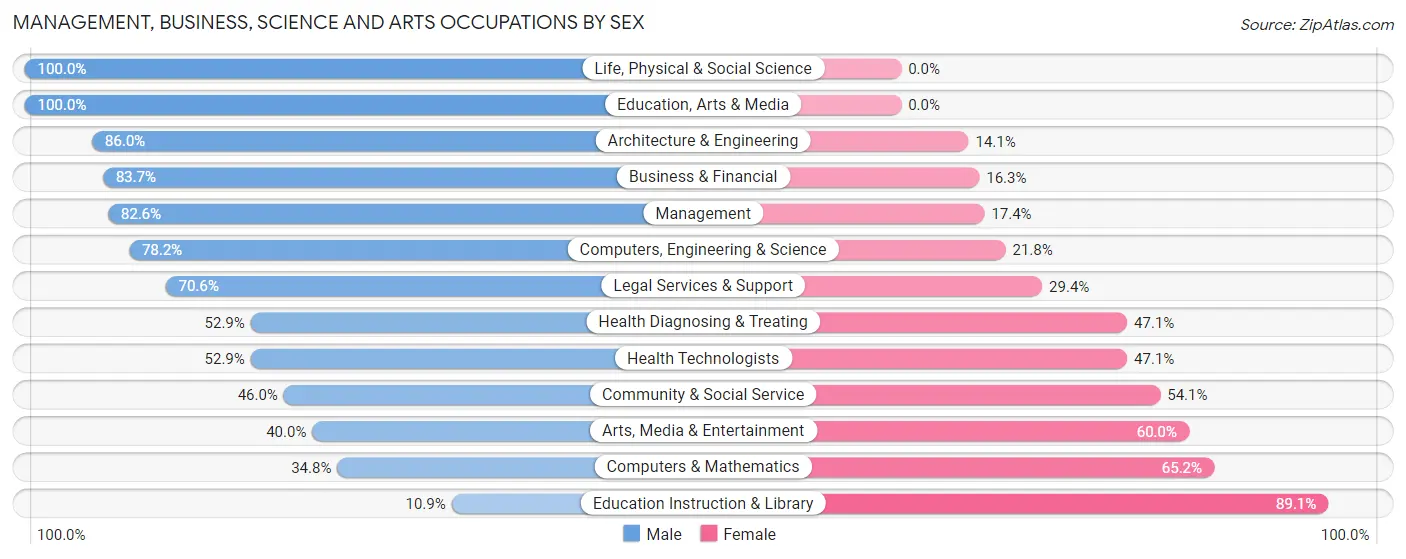
Management, Business, Science and Arts Occupations by Sex
Within the Management, Business, Science and Arts occupations in Bloomfield Hills, the most male-oriented occupations are Life, Physical & Social Science (100.0%), Education, Arts & Media (100.0%), and Architecture & Engineering (86.0%), while the most female-oriented occupations are Education Instruction & Library (89.1%), Computers & Mathematics (65.2%), and Arts, Media & Entertainment (60.0%).
| Occupation | Male | Female |
| Management | 333 (82.6%) | 70 (17.4%) |
| Business & Financial | 113 (83.7%) | 22 (16.3%) |
| Computers, Engineering & Science | 115 (78.2%) | 32 (21.8%) |
| Computers & Mathematics | 8 (34.8%) | 15 (65.2%) |
| Architecture & Engineering | 104 (86.0%) | 17 (14.1%) |
| Life, Physical & Social Science | 3 (100.0%) | 0 (0.0%) |
| Community & Social Service | 102 (46.0%) | 120 (54.0%) |
| Education, Arts & Media | 1 (100.0%) | 0 (0.0%) |
| Legal Services & Support | 72 (70.6%) | 30 (29.4%) |
| Education Instruction & Library | 7 (10.9%) | 57 (89.1%) |
| Arts, Media & Entertainment | 22 (40.0%) | 33 (60.0%) |
| Health Diagnosing & Treating | 148 (52.9%) | 132 (47.1%) |
| Health Technologists | 148 (52.9%) | 132 (47.1%) |
| Total (Category) | 811 (68.3%) | 376 (31.7%) |
| Total (Overall) | 1,072 (63.8%) | 607 (36.1%) |
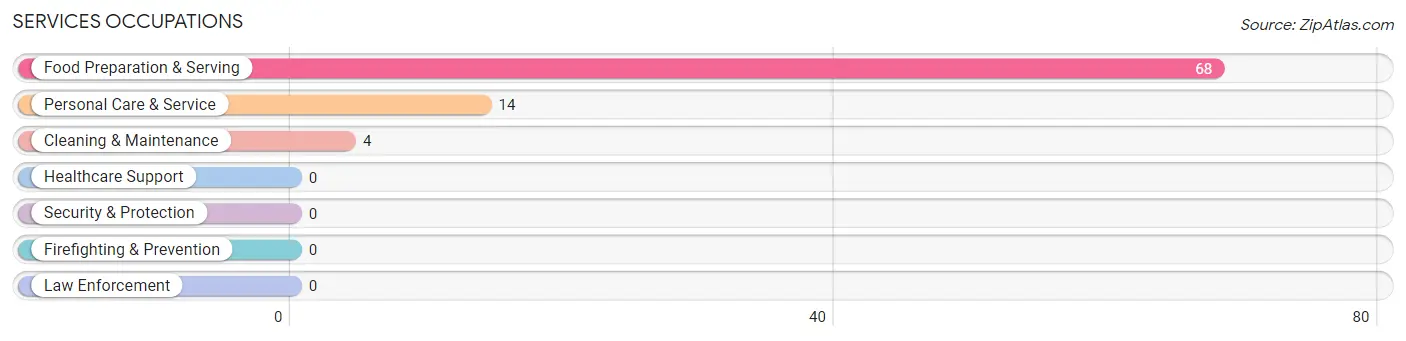
Services Occupations
The most common Services occupations in Bloomfield Hills are Food Preparation & Serving (68 | 4.1%), Personal Care & Service (14 | 0.8%), and Cleaning & Maintenance (4 | 0.2%).
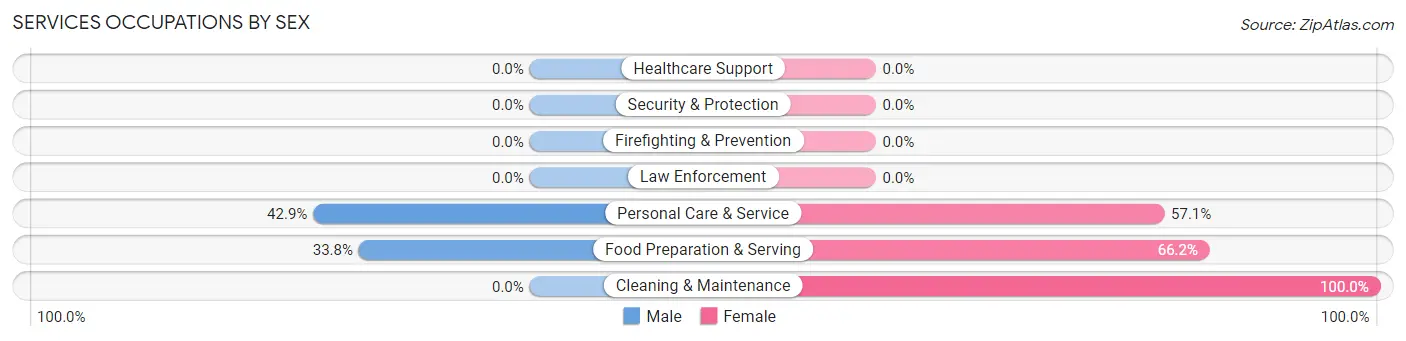
Services Occupations by Sex
Within the Services occupations in Bloomfield Hills, the most male-oriented occupations are Personal Care & Service (42.9%), and Food Preparation & Serving (33.8%), while the most female-oriented occupations are Cleaning & Maintenance (100.0%), Food Preparation & Serving (66.2%), and Personal Care & Service (57.1%).
| Occupation | Male | Female |
| Healthcare Support | 0 (0.0%) | 0 (0.0%) |
| Security & Protection | 0 (0.0%) | 0 (0.0%) |
| Firefighting & Prevention | 0 (0.0%) | 0 (0.0%) |
| Law Enforcement | 0 (0.0%) | 0 (0.0%) |
| Food Preparation & Serving | 23 (33.8%) | 45 (66.2%) |
| Cleaning & Maintenance | 0 (0.0%) | 4 (100.0%) |
| Personal Care & Service | 6 (42.9%) | 8 (57.1%) |
| Total (Category) | 29 (33.7%) | 57 (66.3%) |
| Total (Overall) | 1,072 (63.8%) | 607 (36.1%) |
Sales and Office Occupations
The most common Sales and Office occupations in Bloomfield Hills are Sales & Related (198 | 11.8%), and Office & Administration (143 | 8.5%).
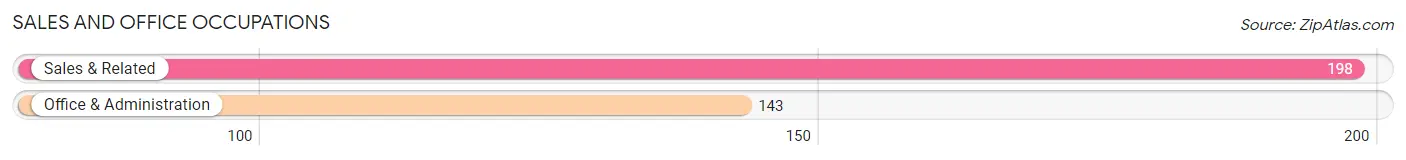
Sales and Office Occupations by Sex
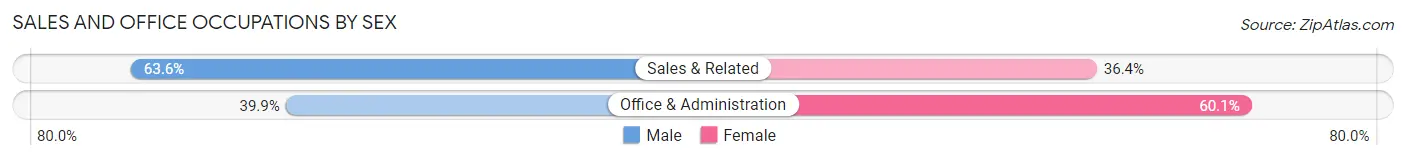
| Occupation | Male | Female |
| Sales & Related | 126 (63.6%) | 72 (36.4%) |
| Office & Administration | 57 (39.9%) | 86 (60.1%) |
| Total (Category) | 183 (53.7%) | 158 (46.3%) |
| Total (Overall) | 1,072 (63.8%) | 607 (36.1%) |
Natural Resources, Construction and Maintenance Occupations
The most common Natural Resources, Construction and Maintenance occupations in Bloomfield Hills are Construction & Extraction (30 | 1.8%), and Installation, Maintenance & Repair (1 | 0.1%).
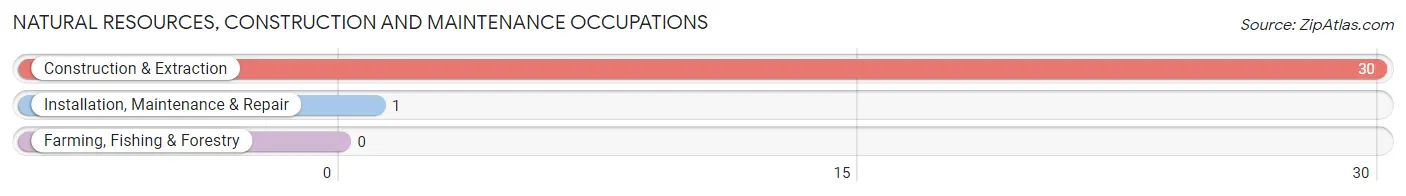
Natural Resources, Construction and Maintenance Occupations by Sex
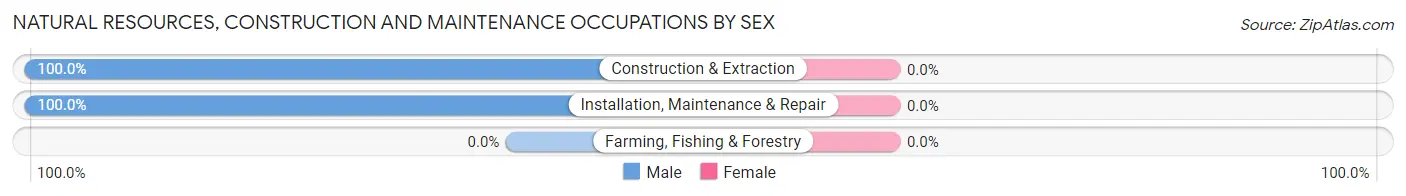
| Occupation | Male | Female |
| Farming, Fishing & Forestry | 0 (0.0%) | 0 (0.0%) |
| Construction & Extraction | 30 (100.0%) | 0 (0.0%) |
| Installation, Maintenance & Repair | 1 (100.0%) | 0 (0.0%) |
| Total (Category) | 31 (100.0%) | 0 (0.0%) |
| Total (Overall) | 1,072 (63.8%) | 607 (36.1%) |
Production, Transportation and Moving Occupations
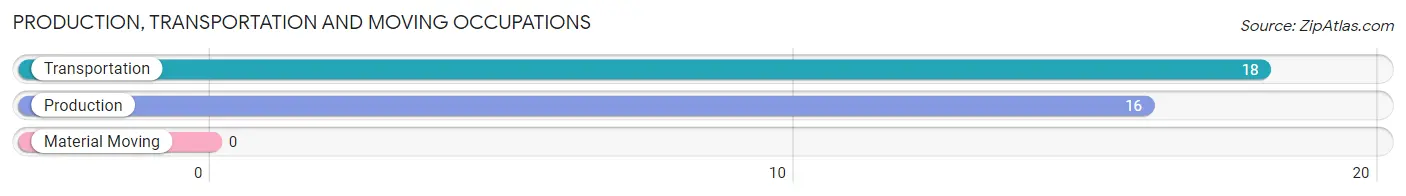
The most common Production, Transportation and Moving occupations in Bloomfield Hills are Transportation (18 | 1.1%), and Production (16 | 0.9%).
Production, Transportation and Moving Occupations by Sex
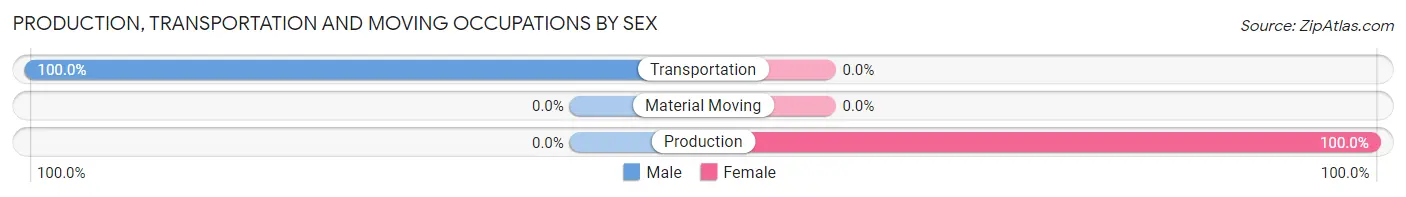
| Occupation | Male | Female |
| Production | 0 (0.0%) | 16 (100.0%) |
| Transportation | 18 (100.0%) | 0 (0.0%) |
| Material Moving | 0 (0.0%) | 0 (0.0%) |
| Total (Category) | 18 (52.9%) | 16 (47.1%) |
| Total (Overall) | 1,072 (63.8%) | 607 (36.1%) |
Employment Industries by Sex in Bloomfield Hills
Employment Industries in Bloomfield Hills
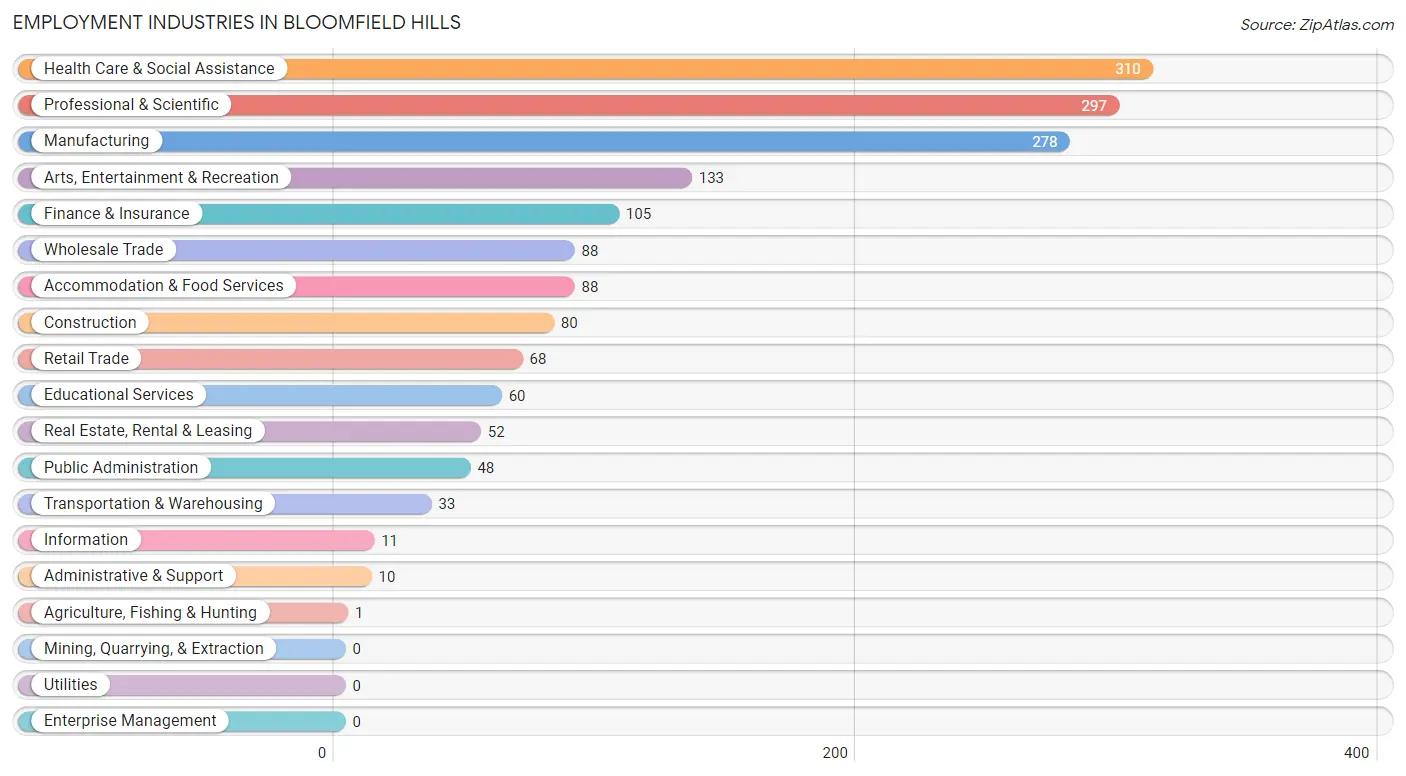
The major employment industries in Bloomfield Hills include Health Care & Social Assistance (310 | 18.5%), Professional & Scientific (297 | 17.7%), Manufacturing (278 | 16.6%), Arts, Entertainment & Recreation (133 | 7.9%), and Finance & Insurance (105 | 6.2%).
Employment Industries by Sex in Bloomfield Hills
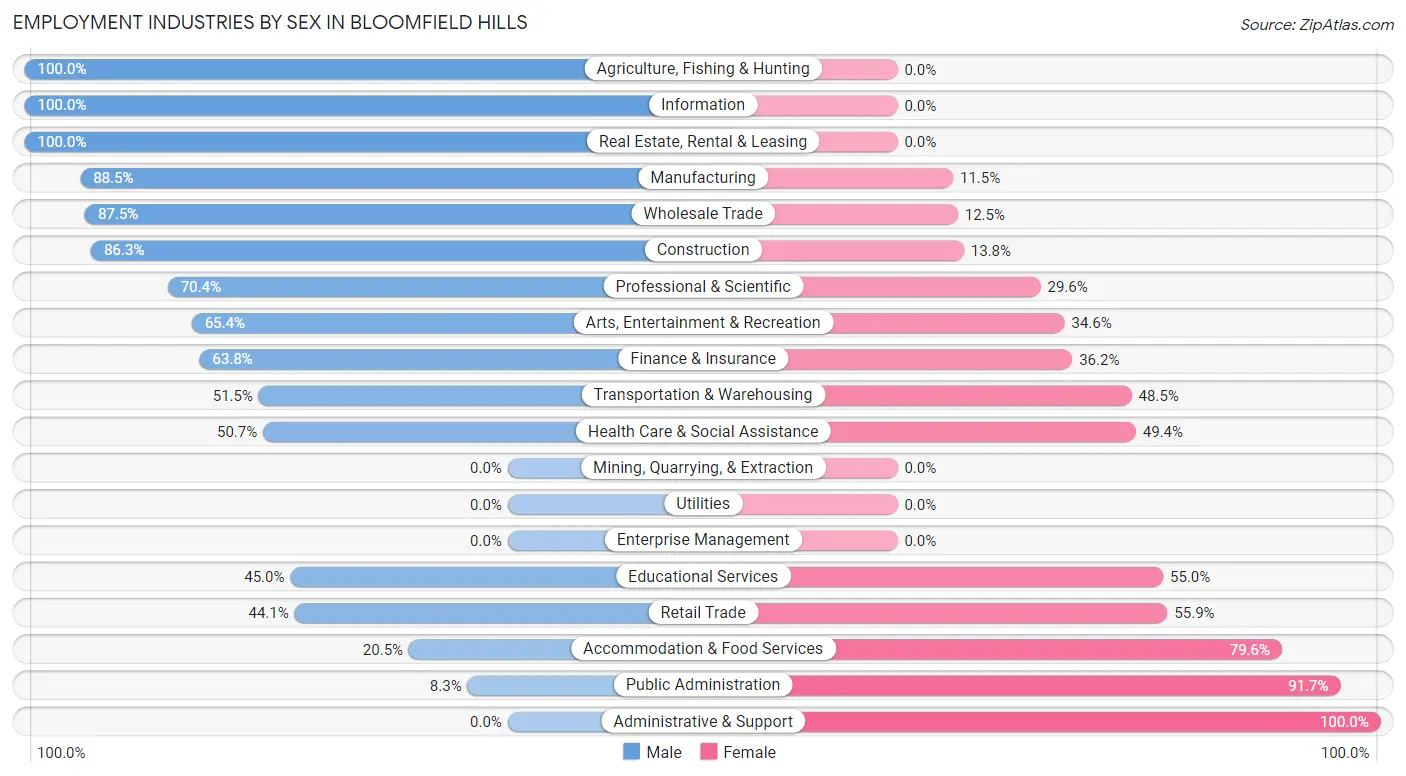
The Bloomfield Hills industries that see more men than women are Agriculture, Fishing & Hunting (100.0%), Information (100.0%), and Real Estate, Rental & Leasing (100.0%), whereas the industries that tend to have a higher number of women are Administrative & Support (100.0%), Public Administration (91.7%), and Accommodation & Food Services (79.5%).
| Industry | Male | Female |
| Agriculture, Fishing & Hunting | 1 (100.0%) | 0 (0.0%) |
| Mining, Quarrying, & Extraction | 0 (0.0%) | 0 (0.0%) |
| Construction | 69 (86.3%) | 11 (13.8%) |
| Manufacturing | 246 (88.5%) | 32 (11.5%) |
| Wholesale Trade | 77 (87.5%) | 11 (12.5%) |
| Retail Trade | 30 (44.1%) | 38 (55.9%) |
| Transportation & Warehousing | 17 (51.5%) | 16 (48.5%) |
| Utilities | 0 (0.0%) | 0 (0.0%) |
| Information | 11 (100.0%) | 0 (0.0%) |
| Finance & Insurance | 67 (63.8%) | 38 (36.2%) |
| Real Estate, Rental & Leasing | 52 (100.0%) | 0 (0.0%) |
| Professional & Scientific | 209 (70.4%) | 88 (29.6%) |
| Enterprise Management | 0 (0.0%) | 0 (0.0%) |
| Administrative & Support | 0 (0.0%) | 10 (100.0%) |
| Educational Services | 27 (45.0%) | 33 (55.0%) |
| Health Care & Social Assistance | 157 (50.6%) | 153 (49.3%) |
| Arts, Entertainment & Recreation | 87 (65.4%) | 46 (34.6%) |
| Accommodation & Food Services | 18 (20.4%) | 70 (79.5%) |
| Public Administration | 4 (8.3%) | 44 (91.7%) |
| Total | 1,072 (63.8%) | 607 (36.1%) |
Education in Bloomfield Hills
School Enrollment in Bloomfield Hills
The most common levels of schooling among the 1,284 students in Bloomfield Hills are high school (342 | 26.6%), college / undergraduate (335 | 26.1%), and elementary school (274 | 21.3%).
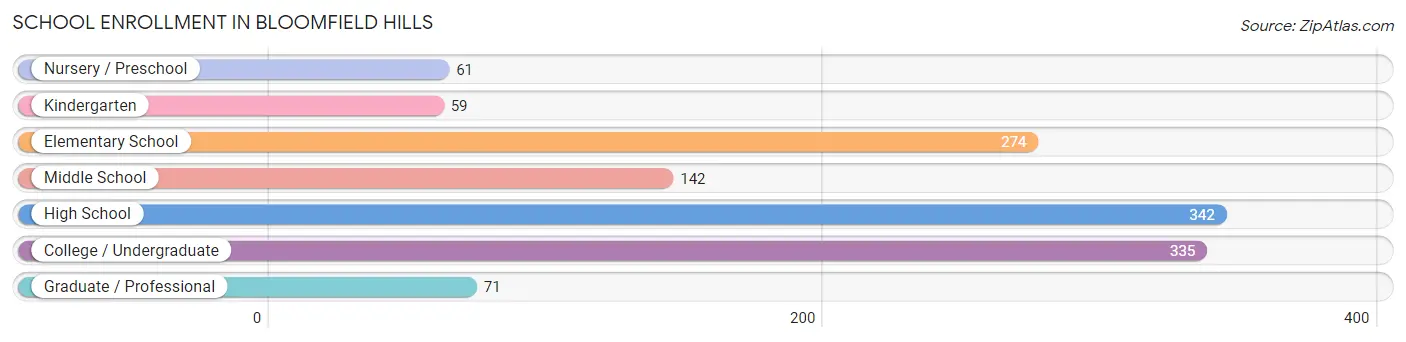
| School Level | # Students | % Students |
| Nursery / Preschool | 61 | 4.8% |
| Kindergarten | 59 | 4.6% |
| Elementary School | 274 | 21.3% |
| Middle School | 142 | 11.1% |
| High School | 342 | 26.6% |
| College / Undergraduate | 335 | 26.1% |
| Graduate / Professional | 71 | 5.5% |
| Total | 1,284 | 100.0% |
School Enrollment by Age by Funding Source in Bloomfield Hills
Out of a total of 1,284 students who are enrolled in schools in Bloomfield Hills, 541 (42.1%) attend a private institution, while the remaining 743 (57.9%) are enrolled in public schools. The age group of 15 to 17 year olds has the highest likelihood of being enrolled in private schools, with 120 (60.9% in the age bracket) enrolled. Conversely, the age group of 35 years and over has the lowest likelihood of being enrolled in a private school, with 34 (94.4% in the age bracket) attending a public institution.
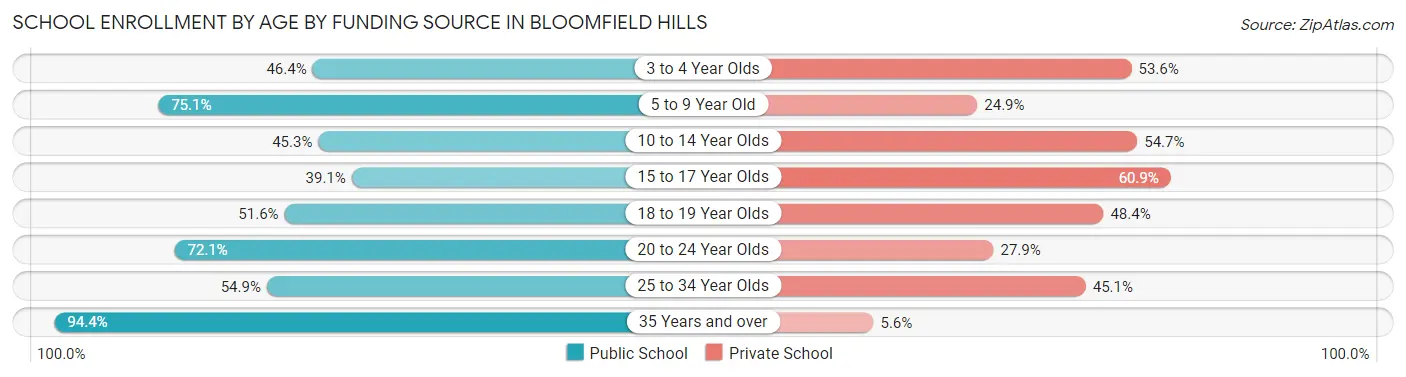
| Age Bracket | Public School | Private School |
| 3 to 4 Year Olds | 32 (46.4%) | 37 (53.6%) |
| 5 to 9 Year Old | 187 (75.1%) | 62 (24.9%) |
| 10 to 14 Year Olds | 116 (45.3%) | 140 (54.7%) |
| 15 to 17 Year Olds | 77 (39.1%) | 120 (60.9%) |
| 18 to 19 Year Olds | 96 (51.6%) | 90 (48.4%) |
| 20 to 24 Year Olds | 173 (72.1%) | 67 (27.9%) |
| 25 to 34 Year Olds | 28 (54.9%) | 23 (45.1%) |
| 35 Years and over | 34 (94.4%) | 2 (5.6%) |
| Total | 743 (57.9%) | 541 (42.1%) |
Educational Attainment by Field of Study in Bloomfield Hills
Business (400 | 16.2%), engineering (305 | 12.4%), education (277 | 11.2%), social sciences (276 | 11.2%), and bio, nature & agricultural (220 | 8.9%) are the most common fields of study among 2,466 individuals in Bloomfield Hills who have obtained a bachelor's degree or higher.
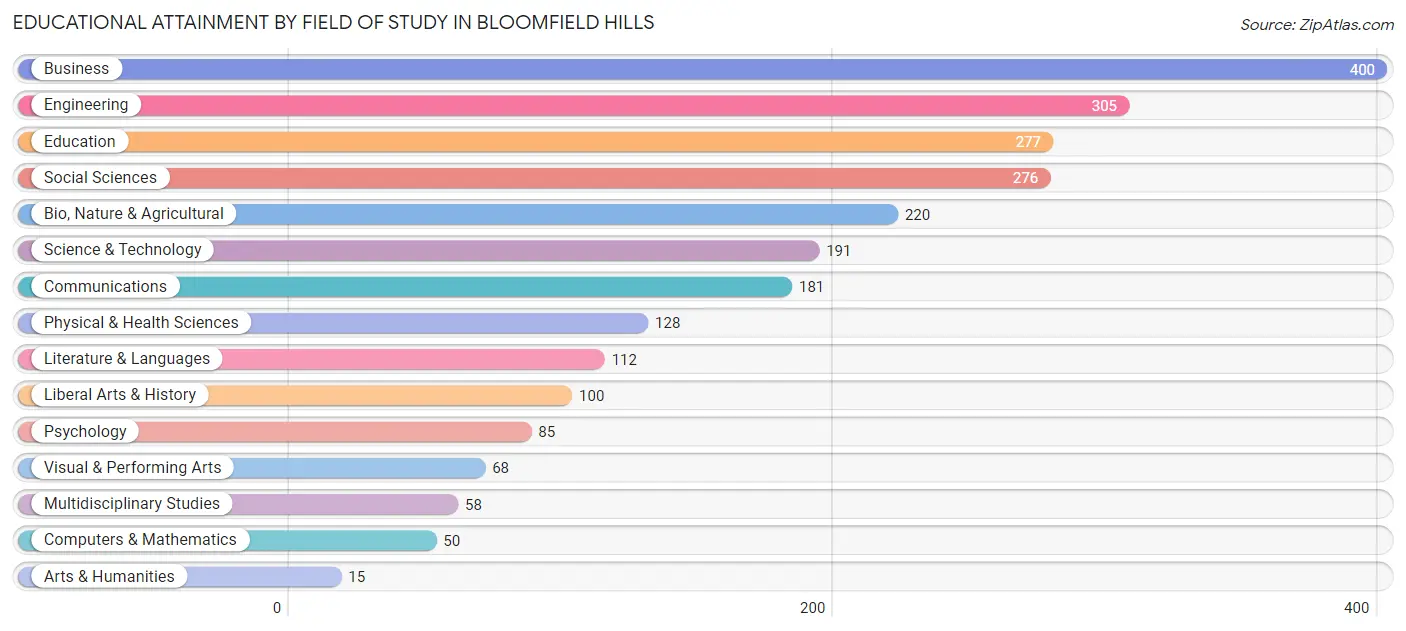
| Field of Study | # Graduates | % Graduates |
| Computers & Mathematics | 50 | 2.0% |
| Bio, Nature & Agricultural | 220 | 8.9% |
| Physical & Health Sciences | 128 | 5.2% |
| Psychology | 85 | 3.5% |
| Social Sciences | 276 | 11.2% |
| Engineering | 305 | 12.4% |
| Multidisciplinary Studies | 58 | 2.4% |
| Science & Technology | 191 | 7.7% |
| Business | 400 | 16.2% |
| Education | 277 | 11.2% |
| Literature & Languages | 112 | 4.5% |
| Liberal Arts & History | 100 | 4.1% |
| Visual & Performing Arts | 68 | 2.8% |
| Communications | 181 | 7.3% |
| Arts & Humanities | 15 | 0.6% |
| Total | 2,466 | 100.0% |
Transportation & Commute in Bloomfield Hills
Vehicle Availability by Sex in Bloomfield Hills
The most prevalent vehicle ownership categories in Bloomfield Hills are males with 2 vehicles (568, accounting for 56.4%) and females with 2 vehicles (265, making up 96.6%).
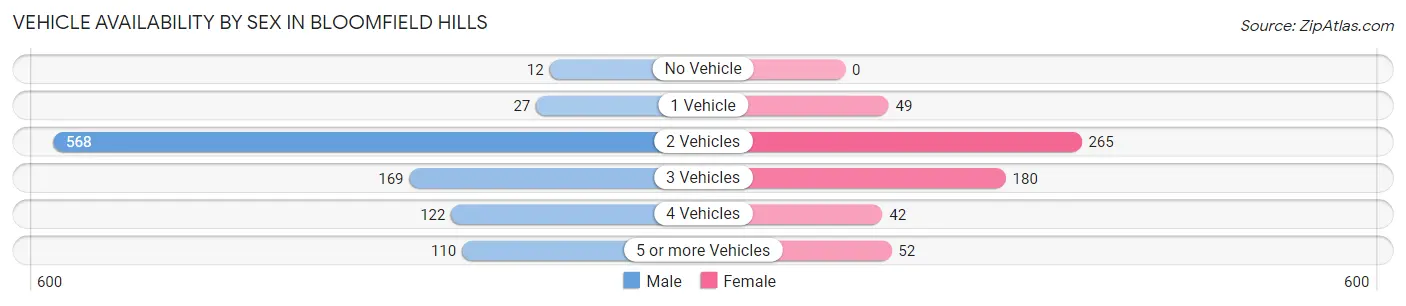
| Vehicles Available | Male | Female |
| No Vehicle | 12 (1.2%) | 0 (0.0%) |
| 1 Vehicle | 27 (2.7%) | 49 (8.3%) |
| 2 Vehicles | 568 (56.4%) | 265 (45.1%) |
| 3 Vehicles | 169 (16.8%) | 180 (30.6%) |
| 4 Vehicles | 122 (12.1%) | 42 (7.1%) |
| 5 or more Vehicles | 110 (10.9%) | 52 (8.8%) |
| Total | 1,008 (100.0%) | 588 (100.0%) |
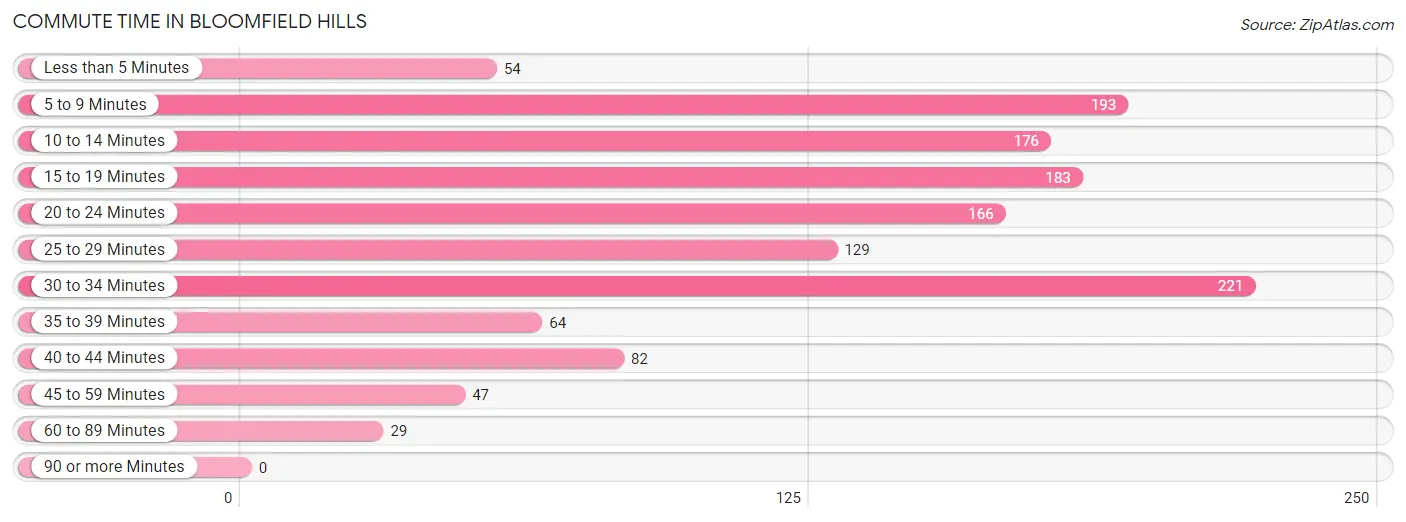
Commute Time in Bloomfield Hills
The most frequently occuring commute durations in Bloomfield Hills are 30 to 34 minutes (221 commuters, 16.4%), 5 to 9 minutes (193 commuters, 14.4%), and 15 to 19 minutes (183 commuters, 13.6%).
| Commute Time | # Commuters | % Commuters |
| Less than 5 Minutes | 54 | 4.0% |
| 5 to 9 Minutes | 193 | 14.4% |
| 10 to 14 Minutes | 176 | 13.1% |
| 15 to 19 Minutes | 183 | 13.6% |
| 20 to 24 Minutes | 166 | 12.3% |
| 25 to 29 Minutes | 129 | 9.6% |
| 30 to 34 Minutes | 221 | 16.4% |
| 35 to 39 Minutes | 64 | 4.8% |
| 40 to 44 Minutes | 82 | 6.1% |
| 45 to 59 Minutes | 47 | 3.5% |
| 60 to 89 Minutes | 29 | 2.2% |
| 90 or more Minutes | 0 | 0.0% |
Commute Time by Sex in Bloomfield Hills
The most common commute times in Bloomfield Hills are 30 to 34 minutes (137 commuters, 15.9%) for males and 30 to 34 minutes (84 commuters, 17.4%) for females.
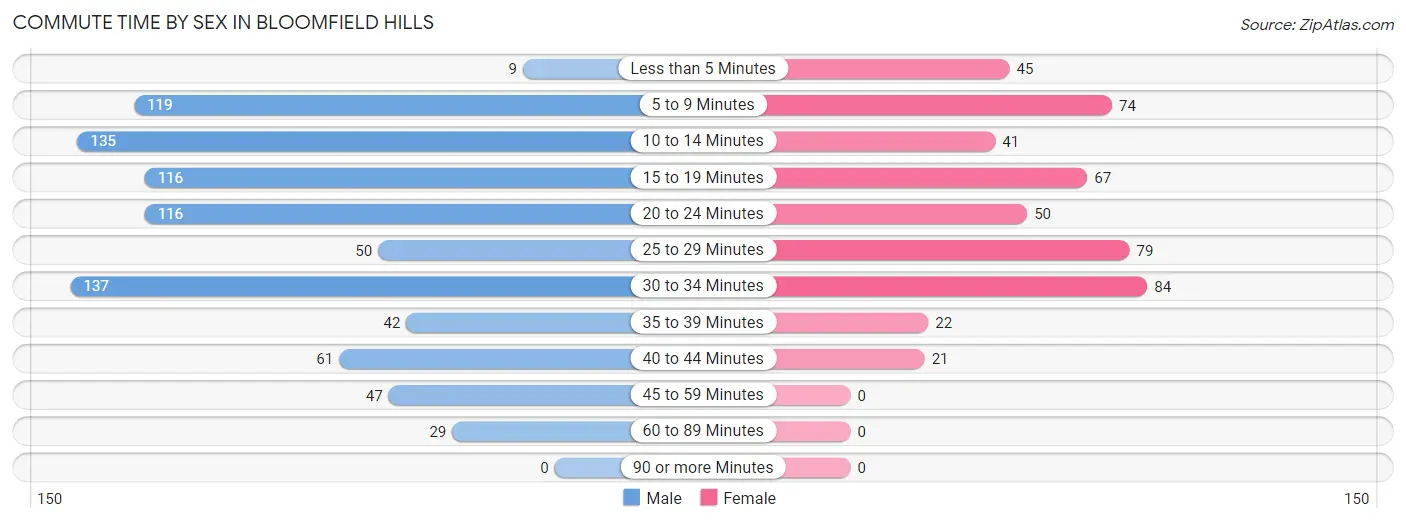
| Commute Time | Male | Female |
| Less than 5 Minutes | 9 (1.1%) | 45 (9.3%) |
| 5 to 9 Minutes | 119 (13.8%) | 74 (15.3%) |
| 10 to 14 Minutes | 135 (15.7%) | 41 (8.5%) |
| 15 to 19 Minutes | 116 (13.5%) | 67 (13.9%) |
| 20 to 24 Minutes | 116 (13.5%) | 50 (10.3%) |
| 25 to 29 Minutes | 50 (5.8%) | 79 (16.4%) |
| 30 to 34 Minutes | 137 (15.9%) | 84 (17.4%) |
| 35 to 39 Minutes | 42 (4.9%) | 22 (4.5%) |
| 40 to 44 Minutes | 61 (7.1%) | 21 (4.3%) |
| 45 to 59 Minutes | 47 (5.5%) | 0 (0.0%) |
| 60 to 89 Minutes | 29 (3.4%) | 0 (0.0%) |
| 90 or more Minutes | 0 (0.0%) | 0 (0.0%) |
Time of Departure to Work by Sex in Bloomfield Hills
The most frequent times of departure to work in Bloomfield Hills are 8:00 AM to 8:29 AM (208, 24.2%) for males and 8:00 AM to 8:29 AM (115, 23.8%) for females.
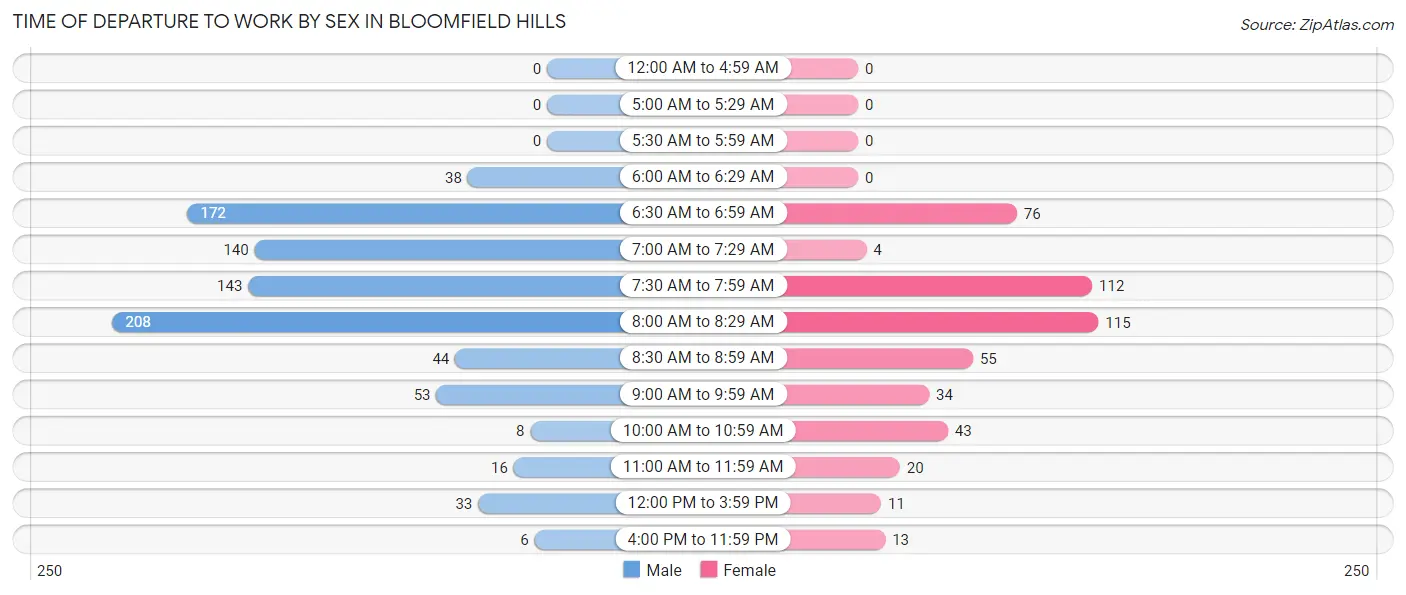
| Time of Departure | Male | Female |
| 12:00 AM to 4:59 AM | 0 (0.0%) | 0 (0.0%) |
| 5:00 AM to 5:29 AM | 0 (0.0%) | 0 (0.0%) |
| 5:30 AM to 5:59 AM | 0 (0.0%) | 0 (0.0%) |
| 6:00 AM to 6:29 AM | 38 (4.4%) | 0 (0.0%) |
| 6:30 AM to 6:59 AM | 172 (20.0%) | 76 (15.7%) |
| 7:00 AM to 7:29 AM | 140 (16.3%) | 4 (0.8%) |
| 7:30 AM to 7:59 AM | 143 (16.6%) | 112 (23.2%) |
| 8:00 AM to 8:29 AM | 208 (24.2%) | 115 (23.8%) |
| 8:30 AM to 8:59 AM | 44 (5.1%) | 55 (11.4%) |
| 9:00 AM to 9:59 AM | 53 (6.2%) | 34 (7.0%) |
| 10:00 AM to 10:59 AM | 8 (0.9%) | 43 (8.9%) |
| 11:00 AM to 11:59 AM | 16 (1.9%) | 20 (4.1%) |
| 12:00 PM to 3:59 PM | 33 (3.8%) | 11 (2.3%) |
| 4:00 PM to 11:59 PM | 6 (0.7%) | 13 (2.7%) |
| Total | 861 (100.0%) | 483 (100.0%) |
Housing Occupancy in Bloomfield Hills
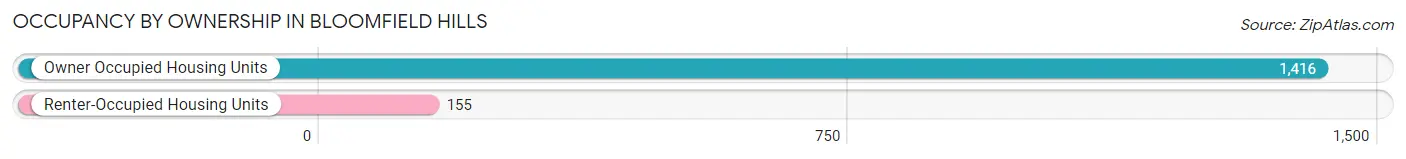
Occupancy by Ownership in Bloomfield Hills
Of the total 1,571 dwellings in Bloomfield Hills, owner-occupied units account for 1,416 (90.1%), while renter-occupied units make up 155 (9.9%).
| Occupancy | # Housing Units | % Housing Units |
| Owner Occupied Housing Units | 1,416 | 90.1% |
| Renter-Occupied Housing Units | 155 | 9.9% |
| Total Occupied Housing Units | 1,571 | 100.0% |
Occupancy by Household Size in Bloomfield Hills
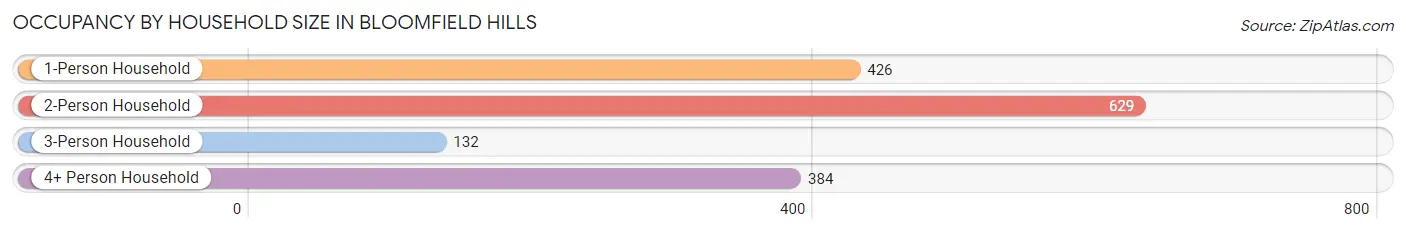
| Household Size | # Housing Units | % Housing Units |
| 1-Person Household | 426 | 27.1% |
| 2-Person Household | 629 | 40.0% |
| 3-Person Household | 132 | 8.4% |
| 4+ Person Household | 384 | 24.4% |
| Total Housing Units | 1,571 | 100.0% |
Occupancy by Ownership by Household Size in Bloomfield Hills
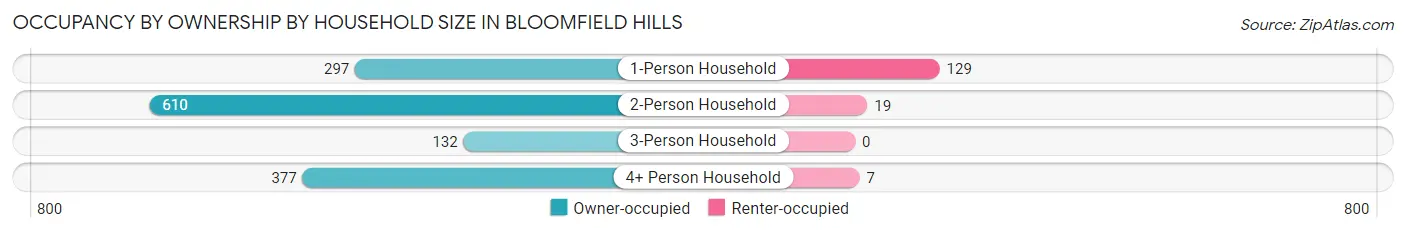
| Household Size | Owner-occupied | Renter-occupied |
| 1-Person Household | 297 (69.7%) | 129 (30.3%) |
| 2-Person Household | 610 (97.0%) | 19 (3.0%) |
| 3-Person Household | 132 (100.0%) | 0 (0.0%) |
| 4+ Person Household | 377 (98.2%) | 7 (1.8%) |
| Total Housing Units | 1,416 (90.1%) | 155 (9.9%) |
Occupancy by Educational Attainment in Bloomfield Hills
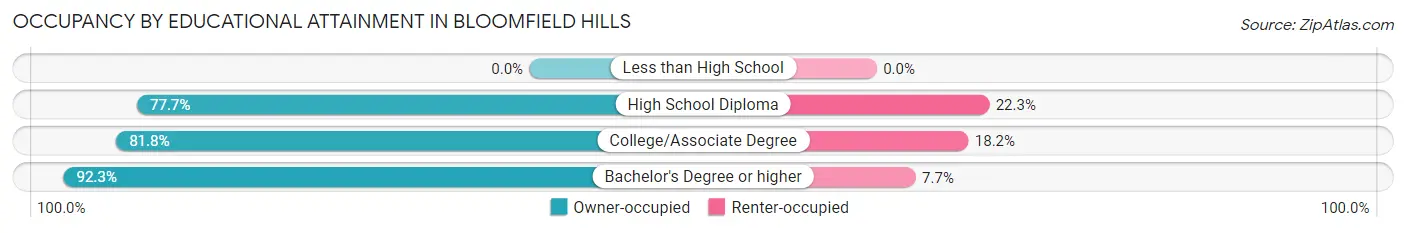
| Household Size | Owner-occupied | Renter-occupied |
| Less than High School | 0 (0.0%) | 0 (0.0%) |
| High School Diploma | 87 (77.7%) | 25 (22.3%) |
| College/Associate Degree | 135 (81.8%) | 30 (18.2%) |
| Bachelor's Degree or higher | 1,194 (92.3%) | 100 (7.7%) |
Occupancy by Age of Householder in Bloomfield Hills
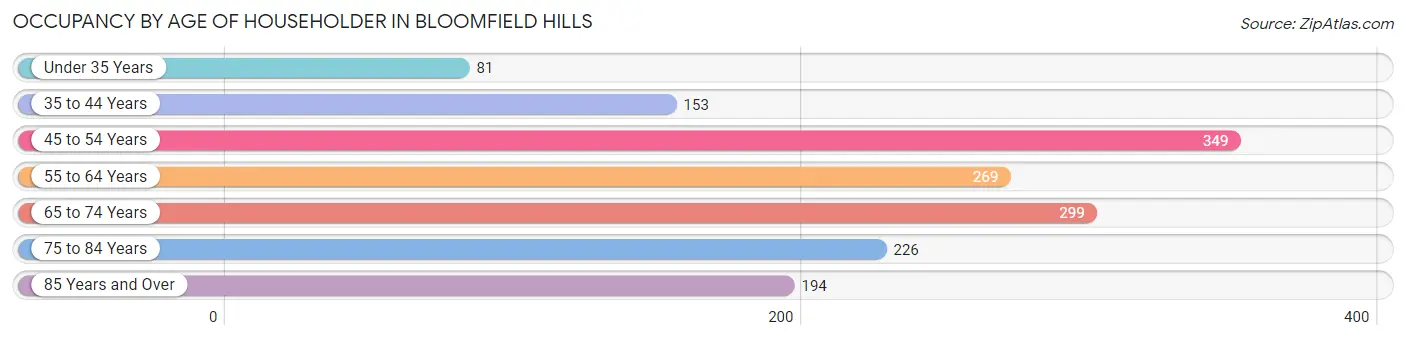
| Age Bracket | # Households | % Households |
| Under 35 Years | 81 | 5.2% |
| 35 to 44 Years | 153 | 9.7% |
| 45 to 54 Years | 349 | 22.2% |
| 55 to 64 Years | 269 | 17.1% |
| 65 to 74 Years | 299 | 19.0% |
| 75 to 84 Years | 226 | 14.4% |
| 85 Years and Over | 194 | 12.3% |
| Total | 1,571 | 100.0% |
Housing Finances in Bloomfield Hills
Median Income by Occupancy in Bloomfield Hills
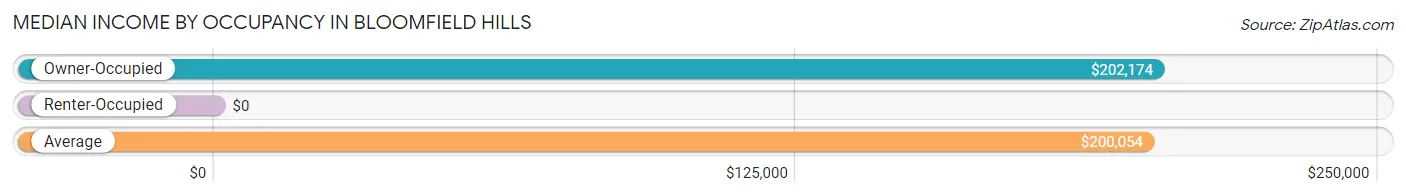
| Occupancy Type | # Households | Median Income |
| Owner-Occupied | 1,416 (90.1%) | $202,174 |
| Renter-Occupied | 155 (9.9%) | $0 |
| Average | 1,571 (100.0%) | $200,054 |
Occupancy by Householder Income Bracket in Bloomfield Hills
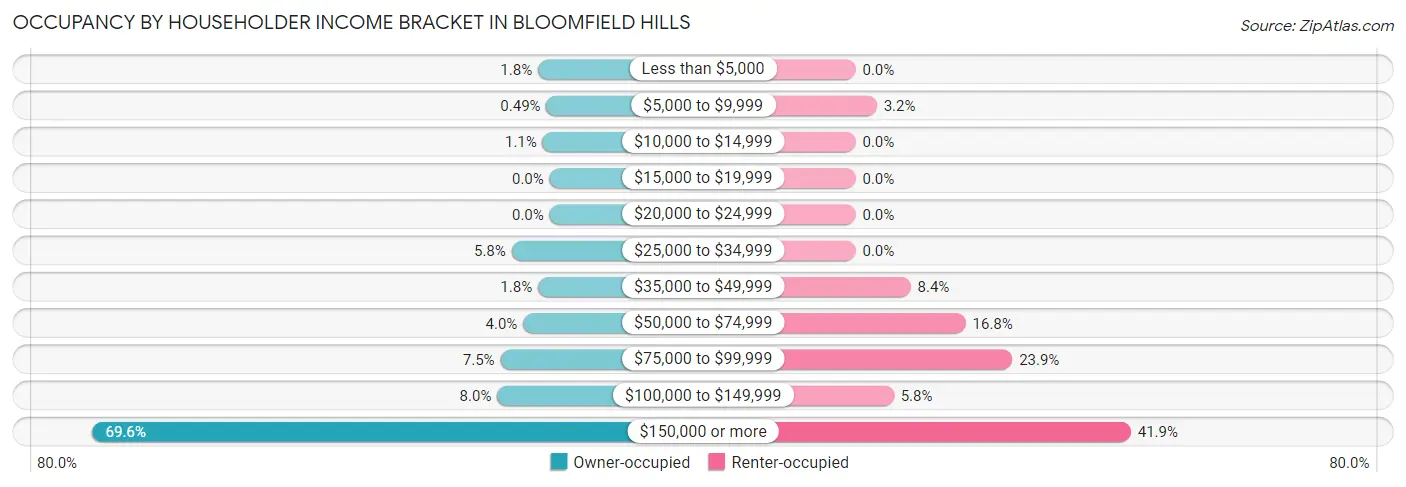
| Income Bracket | Owner-occupied | Renter-occupied |
| Less than $5,000 | 25 (1.8%) | 0 (0.0%) |
| $5,000 to $9,999 | 7 (0.5%) | 5 (3.2%) |
| $10,000 to $14,999 | 15 (1.1%) | 0 (0.0%) |
| $15,000 to $19,999 | 0 (0.0%) | 0 (0.0%) |
| $20,000 to $24,999 | 0 (0.0%) | 0 (0.0%) |
| $25,000 to $34,999 | 82 (5.8%) | 0 (0.0%) |
| $35,000 to $49,999 | 25 (1.8%) | 13 (8.4%) |
| $50,000 to $74,999 | 57 (4.0%) | 26 (16.8%) |
| $75,000 to $99,999 | 106 (7.5%) | 37 (23.9%) |
| $100,000 to $149,999 | 113 (8.0%) | 9 (5.8%) |
| $150,000 or more | 986 (69.6%) | 65 (41.9%) |
| Total | 1,416 (100.0%) | 155 (100.0%) |
Monthly Housing Cost Tiers in Bloomfield Hills
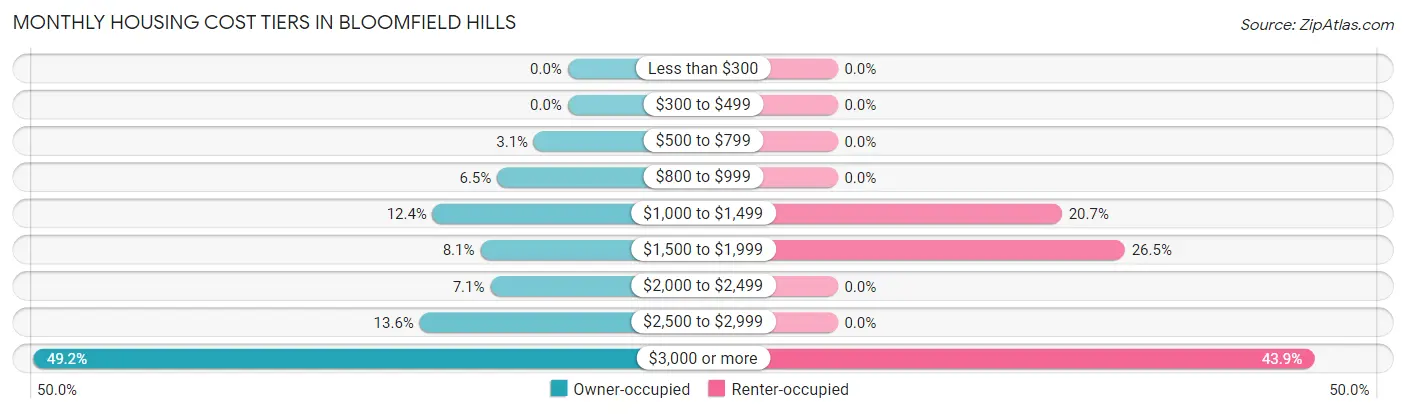
| Monthly Cost | Owner-occupied | Renter-occupied |
| Less than $300 | 0 (0.0%) | 0 (0.0%) |
| $300 to $499 | 0 (0.0%) | 0 (0.0%) |
| $500 to $799 | 44 (3.1%) | 0 (0.0%) |
| $800 to $999 | 92 (6.5%) | 0 (0.0%) |
| $1,000 to $1,499 | 176 (12.4%) | 32 (20.6%) |
| $1,500 to $1,999 | 114 (8.1%) | 41 (26.5%) |
| $2,000 to $2,499 | 101 (7.1%) | 0 (0.0%) |
| $2,500 to $2,999 | 193 (13.6%) | 0 (0.0%) |
| $3,000 or more | 696 (49.1%) | 68 (43.9%) |
| Total | 1,416 (100.0%) | 155 (100.0%) |
Physical Housing Characteristics in Bloomfield Hills
Housing Structures in Bloomfield Hills
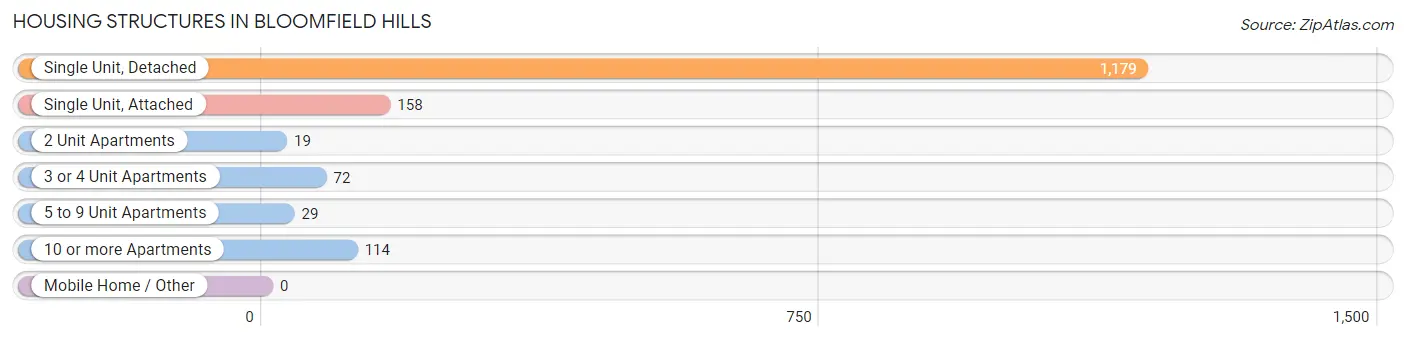
| Structure Type | # Housing Units | % Housing Units |
| Single Unit, Detached | 1,179 | 75.0% |
| Single Unit, Attached | 158 | 10.1% |
| 2 Unit Apartments | 19 | 1.2% |
| 3 or 4 Unit Apartments | 72 | 4.6% |
| 5 to 9 Unit Apartments | 29 | 1.8% |
| 10 or more Apartments | 114 | 7.3% |
| Mobile Home / Other | 0 | 0.0% |
| Total | 1,571 | 100.0% |
Housing Structures by Occupancy in Bloomfield Hills
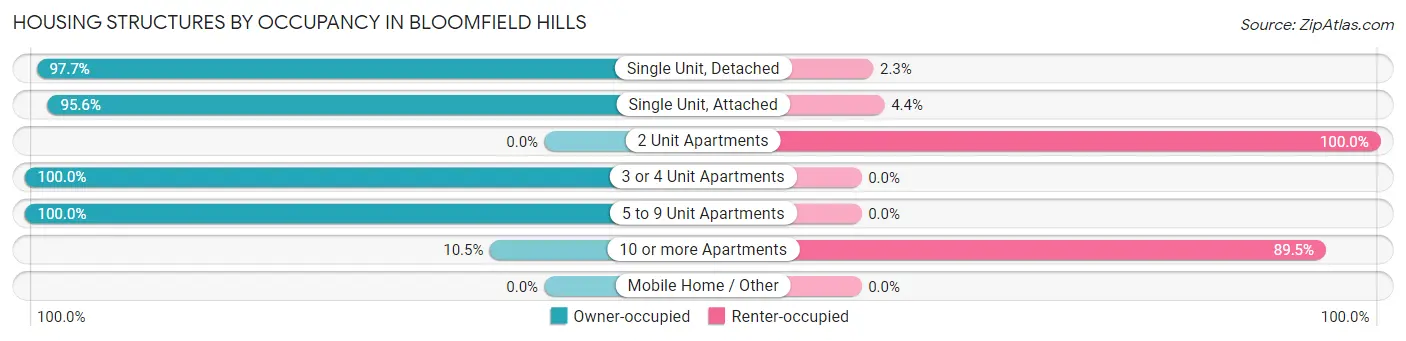
| Structure Type | Owner-occupied | Renter-occupied |
| Single Unit, Detached | 1,152 (97.7%) | 27 (2.3%) |
| Single Unit, Attached | 151 (95.6%) | 7 (4.4%) |
| 2 Unit Apartments | 0 (0.0%) | 19 (100.0%) |
| 3 or 4 Unit Apartments | 72 (100.0%) | 0 (0.0%) |
| 5 to 9 Unit Apartments | 29 (100.0%) | 0 (0.0%) |
| 10 or more Apartments | 12 (10.5%) | 102 (89.5%) |
| Mobile Home / Other | 0 (0.0%) | 0 (0.0%) |
| Total | 1,416 (90.1%) | 155 (9.9%) |
Housing Structures by Number of Rooms in Bloomfield Hills
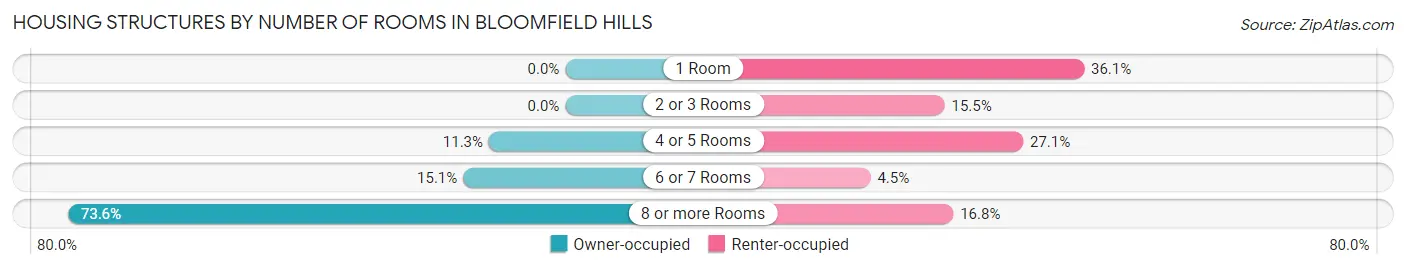
| Number of Rooms | Owner-occupied | Renter-occupied |
| 1 Room | 0 (0.0%) | 56 (36.1%) |
| 2 or 3 Rooms | 0 (0.0%) | 24 (15.5%) |
| 4 or 5 Rooms | 160 (11.3%) | 42 (27.1%) |
| 6 or 7 Rooms | 214 (15.1%) | 7 (4.5%) |
| 8 or more Rooms | 1,042 (73.6%) | 26 (16.8%) |
| Total | 1,416 (100.0%) | 155 (100.0%) |
Housing Structure by Heating Type in Bloomfield Hills
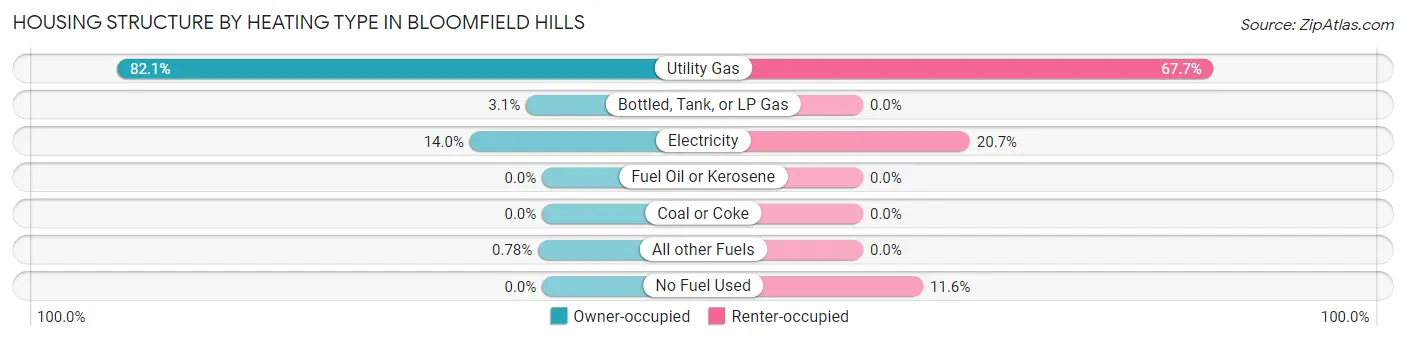
| Heating Type | Owner-occupied | Renter-occupied |
| Utility Gas | 1,163 (82.1%) | 105 (67.7%) |
| Bottled, Tank, or LP Gas | 44 (3.1%) | 0 (0.0%) |
| Electricity | 198 (14.0%) | 32 (20.6%) |
| Fuel Oil or Kerosene | 0 (0.0%) | 0 (0.0%) |
| Coal or Coke | 0 (0.0%) | 0 (0.0%) |
| All other Fuels | 11 (0.8%) | 0 (0.0%) |
| No Fuel Used | 0 (0.0%) | 18 (11.6%) |
| Total | 1,416 (100.0%) | 155 (100.0%) |
Household Vehicle Usage in Bloomfield Hills
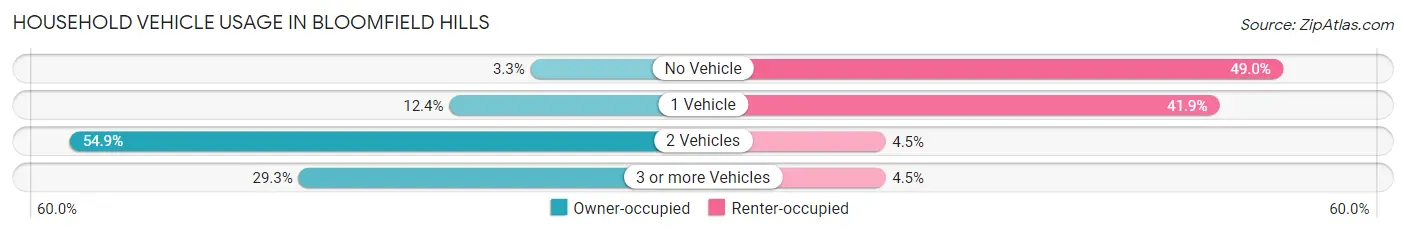
| Vehicles per Household | Owner-occupied | Renter-occupied |
| No Vehicle | 47 (3.3%) | 76 (49.0%) |
| 1 Vehicle | 176 (12.4%) | 65 (41.9%) |
| 2 Vehicles | 778 (54.9%) | 7 (4.5%) |
| 3 or more Vehicles | 415 (29.3%) | 7 (4.5%) |
| Total | 1,416 (100.0%) | 155 (100.0%) |
Real Estate & Mortgages in Bloomfield Hills
Real Estate and Mortgage Overview in Bloomfield Hills
| Characteristic | Without Mortgage | With Mortgage |
| Housing Units | 656 | 760 |
| Median Property Value | $786,500 | $970,600 |
| Median Household Income | $176,346 | $616 |
| Monthly Housing Costs | $1,501 | $547 |
| Real Estate Taxes | $10,001 | $0 |
Property Value by Mortgage Status in Bloomfield Hills
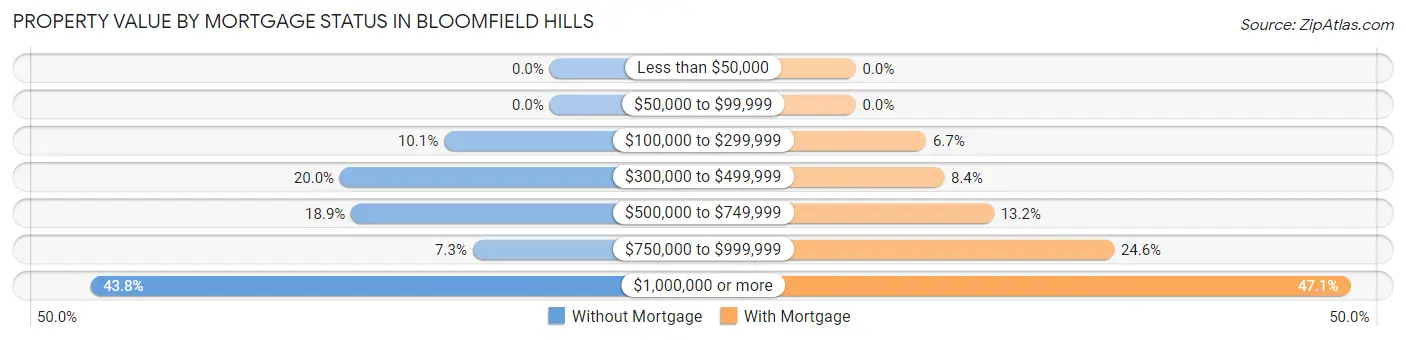
| Property Value | Without Mortgage | With Mortgage |
| Less than $50,000 | 0 (0.0%) | 0 (0.0%) |
| $50,000 to $99,999 | 0 (0.0%) | 0 (0.0%) |
| $100,000 to $299,999 | 66 (10.1%) | 51 (6.7%) |
| $300,000 to $499,999 | 131 (20.0%) | 64 (8.4%) |
| $500,000 to $749,999 | 124 (18.9%) | 100 (13.2%) |
| $750,000 to $999,999 | 48 (7.3%) | 187 (24.6%) |
| $1,000,000 or more | 287 (43.8%) | 358 (47.1%) |
| Total | 656 (100.0%) | 760 (100.0%) |
Household Income by Mortgage Status in Bloomfield Hills
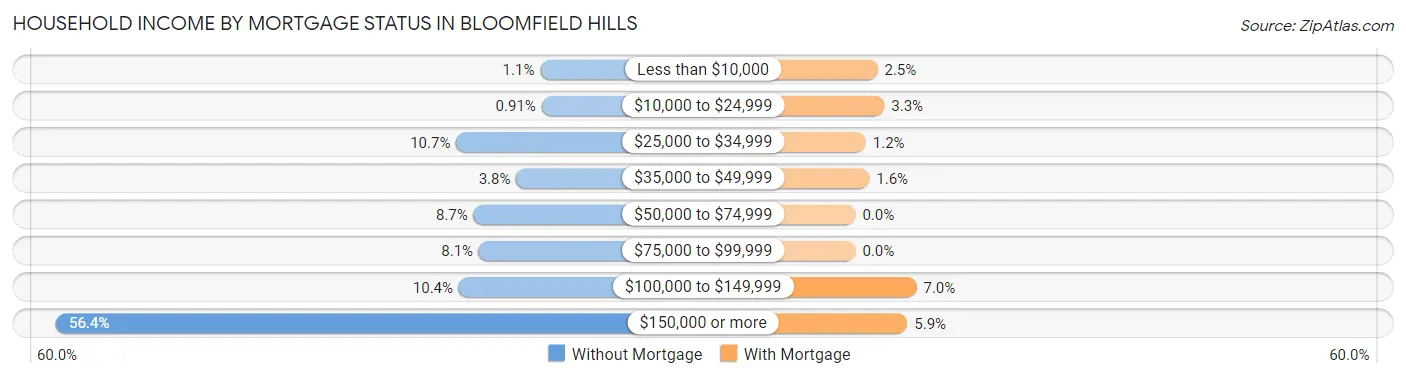
| Household Income | Without Mortgage | With Mortgage |
| Less than $10,000 | 7 (1.1%) | 19 (2.5%) |
| $10,000 to $24,999 | 6 (0.9%) | 25 (3.3%) |
| $25,000 to $34,999 | 70 (10.7%) | 9 (1.2%) |
| $35,000 to $49,999 | 25 (3.8%) | 12 (1.6%) |
| $50,000 to $74,999 | 57 (8.7%) | 0 (0.0%) |
| $75,000 to $99,999 | 53 (8.1%) | 0 (0.0%) |
| $100,000 to $149,999 | 68 (10.4%) | 53 (7.0%) |
| $150,000 or more | 370 (56.4%) | 45 (5.9%) |
| Total | 656 (100.0%) | 760 (100.0%) |
Property Value to Household Income Ratio in Bloomfield Hills
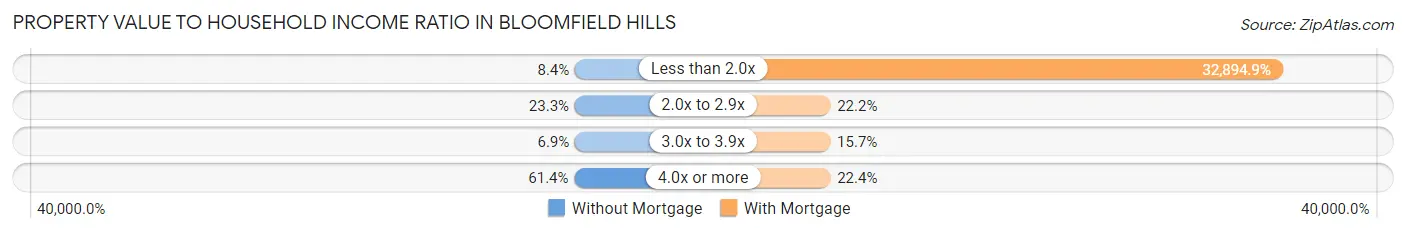
| Value-to-Income Ratio | Without Mortgage | With Mortgage |
| Less than 2.0x | 55 (8.4%) | 250,001 (32,894.9%) |
| 2.0x to 2.9x | 153 (23.3%) | 169 (22.2%) |
| 3.0x to 3.9x | 45 (6.9%) | 119 (15.7%) |
| 4.0x or more | 403 (61.4%) | 170 (22.4%) |
| Total | 656 (100.0%) | 760 (100.0%) |
Real Estate Taxes by Mortgage Status in Bloomfield Hills
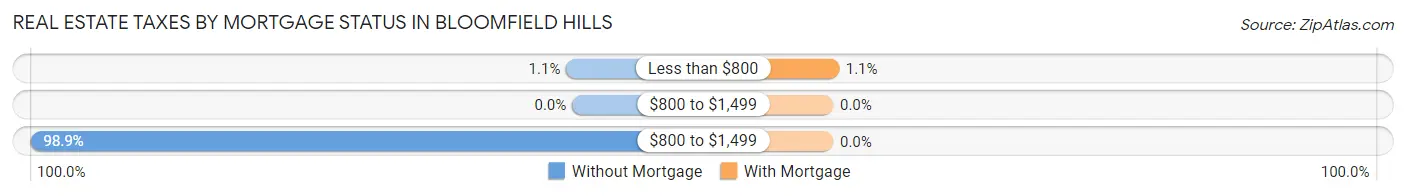
| Property Taxes | Without Mortgage | With Mortgage |
| Less than $800 | 7 (1.1%) | 8 (1.1%) |
| $800 to $1,499 | 0 (0.0%) | 0 (0.0%) |
| $800 to $1,499 | 649 (98.9%) | 0 (0.0%) |
| Total | 656 (100.0%) | 760 (100.0%) |
Health & Disability in Bloomfield Hills
Health Insurance Coverage by Age in Bloomfield Hills
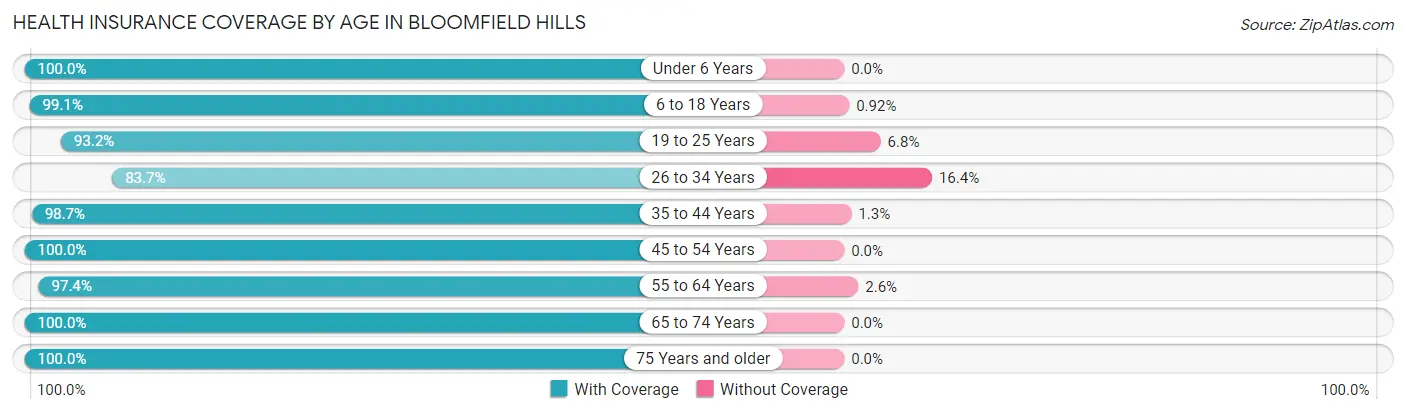
| Age Bracket | With Coverage | Without Coverage |
| Under 6 Years | 265 (100.0%) | 0 (0.0%) |
| 6 to 18 Years | 752 (99.1%) | 7 (0.9%) |
| 19 to 25 Years | 371 (93.2%) | 27 (6.8%) |
| 26 to 34 Years | 174 (83.7%) | 34 (16.4%) |
| 35 to 44 Years | 372 (98.7%) | 5 (1.3%) |
| 45 to 54 Years | 632 (100.0%) | 0 (0.0%) |
| 55 to 64 Years | 446 (97.4%) | 12 (2.6%) |
| 65 to 74 Years | 459 (100.0%) | 0 (0.0%) |
| 75 Years and older | 645 (100.0%) | 0 (0.0%) |
| Total | 4,116 (98.0%) | 85 (2.0%) |
Health Insurance Coverage by Citizenship Status in Bloomfield Hills
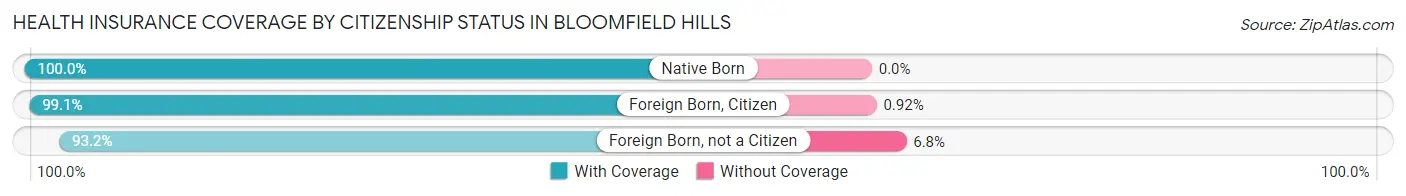
| Citizenship Status | With Coverage | Without Coverage |
| Native Born | 265 (100.0%) | 0 (0.0%) |
| Foreign Born, Citizen | 752 (99.1%) | 7 (0.9%) |
| Foreign Born, not a Citizen | 371 (93.2%) | 27 (6.8%) |
Health Insurance Coverage by Household Income in Bloomfield Hills
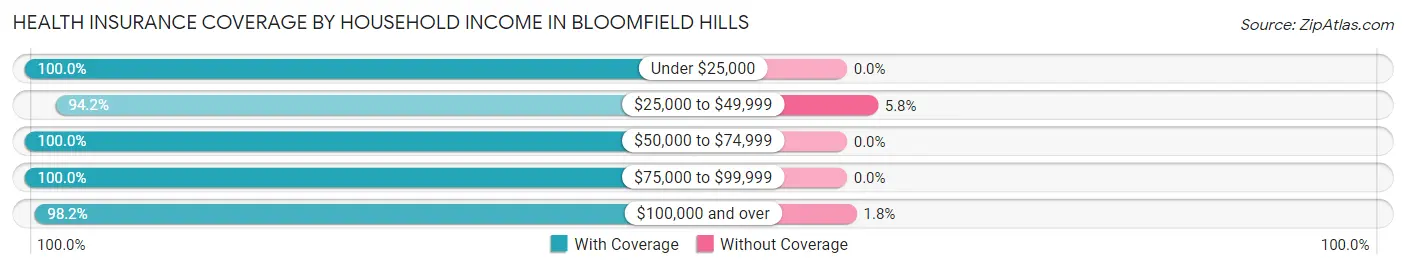
| Household Income | With Coverage | Without Coverage |
| Under $25,000 | 64 (100.0%) | 0 (0.0%) |
| $25,000 to $49,999 | 195 (94.2%) | 12 (5.8%) |
| $50,000 to $74,999 | 145 (100.0%) | 0 (0.0%) |
| $75,000 to $99,999 | 247 (100.0%) | 0 (0.0%) |
| $100,000 and over | 3,333 (98.2%) | 62 (1.8%) |
Public vs Private Health Insurance Coverage by Age in Bloomfield Hills
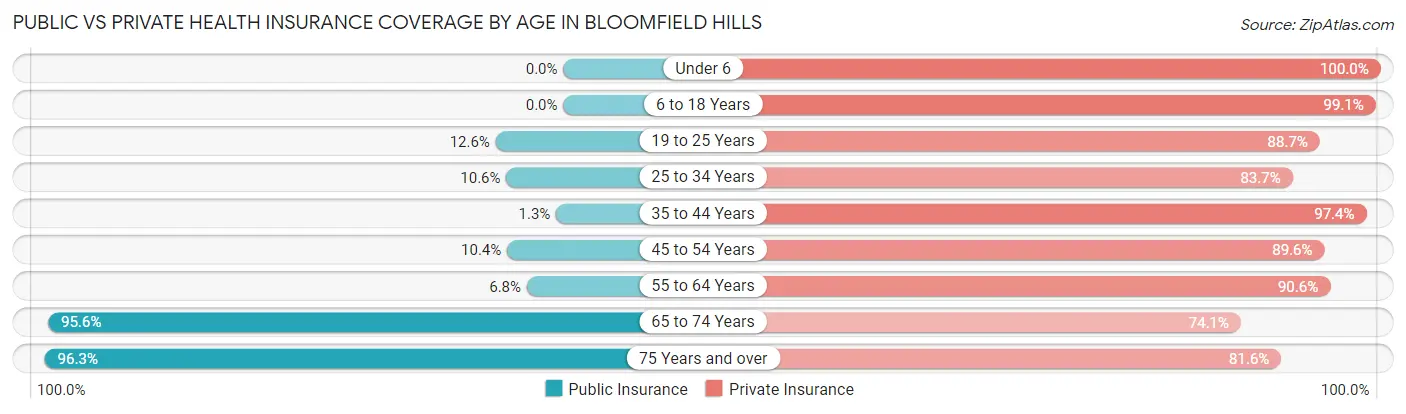
| Age Bracket | Public Insurance | Private Insurance |
| Under 6 | 0 (0.0%) | 265 (100.0%) |
| 6 to 18 Years | 0 (0.0%) | 752 (99.1%) |
| 19 to 25 Years | 50 (12.6%) | 353 (88.7%) |
| 25 to 34 Years | 22 (10.6%) | 174 (83.7%) |
| 35 to 44 Years | 5 (1.3%) | 367 (97.4%) |
| 45 to 54 Years | 66 (10.4%) | 566 (89.6%) |
| 55 to 64 Years | 31 (6.8%) | 415 (90.6%) |
| 65 to 74 Years | 439 (95.6%) | 340 (74.1%) |
| 75 Years and over | 621 (96.3%) | 526 (81.6%) |
| Total | 1,234 (29.4%) | 3,758 (89.4%) |
Disability Status by Sex by Age in Bloomfield Hills
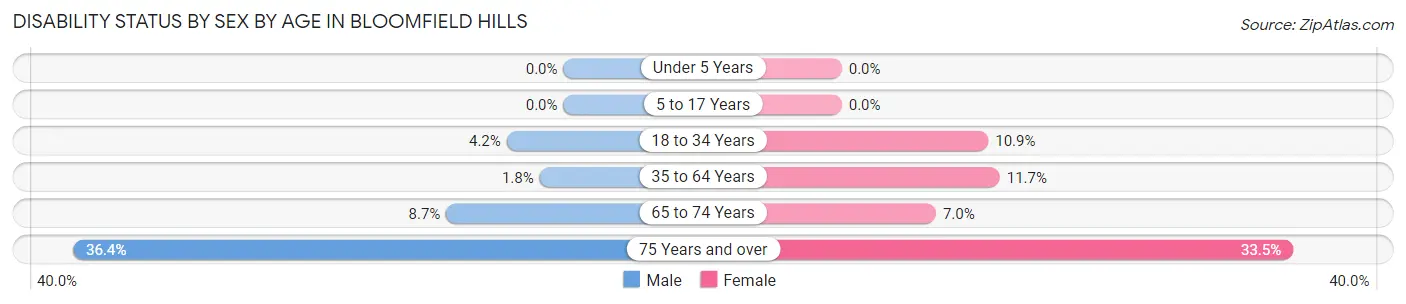
| Age Bracket | Male | Female |
| Under 5 Years | 0 (0.0%) | 0 (0.0%) |
| 5 to 17 Years | 0 (0.0%) | 0 (0.0%) |
| 18 to 34 Years | 15 (4.2%) | 41 (10.9%) |
| 35 to 64 Years | 13 (1.8%) | 86 (11.7%) |
| 65 to 74 Years | 20 (8.7%) | 16 (7.0%) |
| 75 Years and over | 87 (36.4%) | 136 (33.5%) |
Disability Class by Sex by Age in Bloomfield Hills
Disability Class: Hearing Difficulty
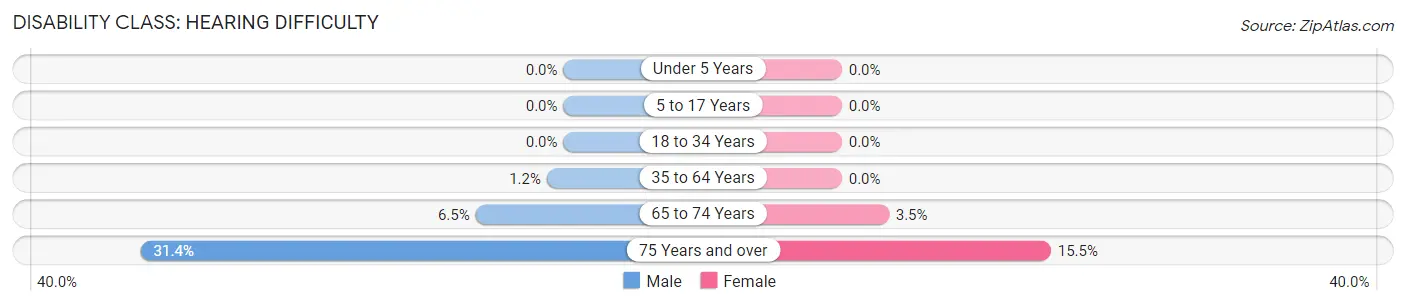
| Age Bracket | Male | Female |
| Under 5 Years | 0 (0.0%) | 0 (0.0%) |
| 5 to 17 Years | 0 (0.0%) | 0 (0.0%) |
| 18 to 34 Years | 0 (0.0%) | 0 (0.0%) |
| 35 to 64 Years | 9 (1.2%) | 0 (0.0%) |
| 65 to 74 Years | 15 (6.5%) | 8 (3.5%) |
| 75 Years and over | 75 (31.4%) | 63 (15.5%) |
Disability Class: Vision Difficulty
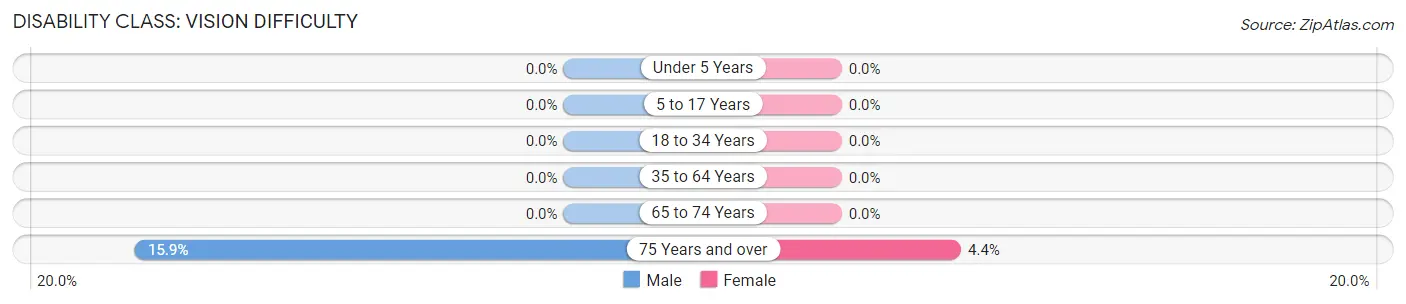
| Age Bracket | Male | Female |
| Under 5 Years | 0 (0.0%) | 0 (0.0%) |
| 5 to 17 Years | 0 (0.0%) | 0 (0.0%) |
| 18 to 34 Years | 0 (0.0%) | 0 (0.0%) |
| 35 to 64 Years | 0 (0.0%) | 0 (0.0%) |
| 65 to 74 Years | 0 (0.0%) | 0 (0.0%) |
| 75 Years and over | 38 (15.9%) | 18 (4.4%) |
Disability Class: Cognitive Difficulty
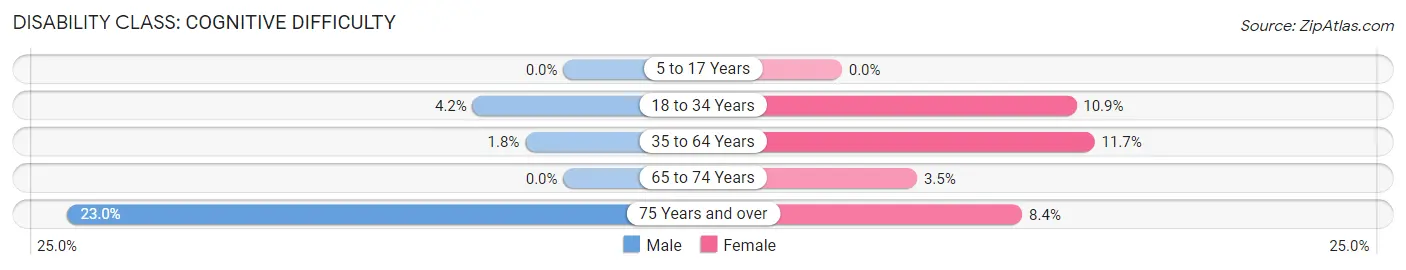
| Age Bracket | Male | Female |
| 5 to 17 Years | 0 (0.0%) | 0 (0.0%) |
| 18 to 34 Years | 15 (4.2%) | 41 (10.9%) |
| 35 to 64 Years | 13 (1.8%) | 86 (11.7%) |
| 65 to 74 Years | 0 (0.0%) | 8 (3.5%) |
| 75 Years and over | 55 (23.0%) | 34 (8.4%) |
Disability Class: Ambulatory Difficulty
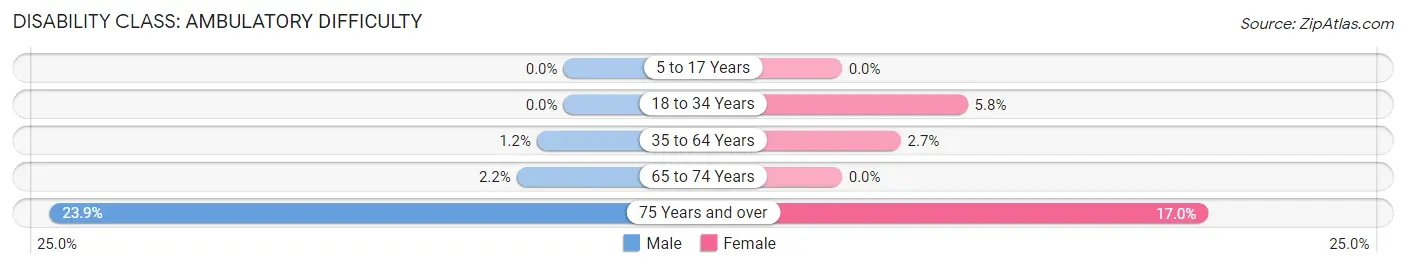
| Age Bracket | Male | Female |
| 5 to 17 Years | 0 (0.0%) | 0 (0.0%) |
| 18 to 34 Years | 0 (0.0%) | 22 (5.8%) |
| 35 to 64 Years | 9 (1.2%) | 20 (2.7%) |
| 65 to 74 Years | 5 (2.2%) | 0 (0.0%) |
| 75 Years and over | 57 (23.8%) | 69 (17.0%) |
Disability Class: Self-Care Difficulty
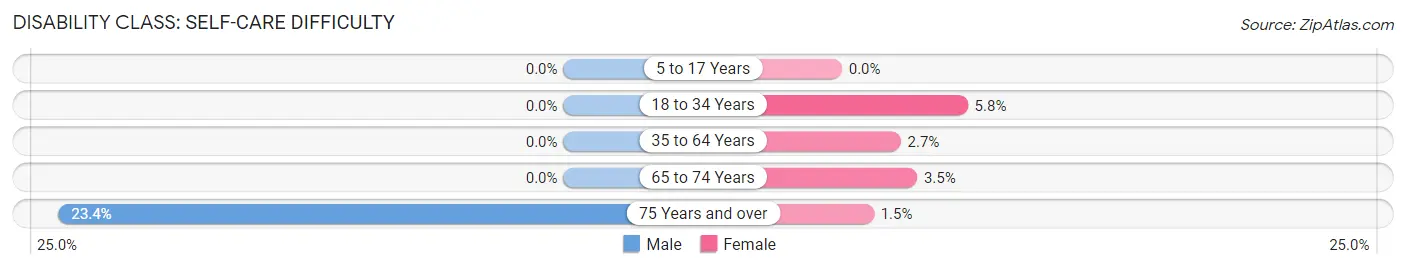
| Age Bracket | Male | Female |
| 5 to 17 Years | 0 (0.0%) | 0 (0.0%) |
| 18 to 34 Years | 0 (0.0%) | 22 (5.8%) |
| 35 to 64 Years | 0 (0.0%) | 20 (2.7%) |
| 65 to 74 Years | 0 (0.0%) | 8 (3.5%) |
| 75 Years and over | 56 (23.4%) | 6 (1.5%) |
Technology Access in Bloomfield Hills
Computing Device Access in Bloomfield Hills
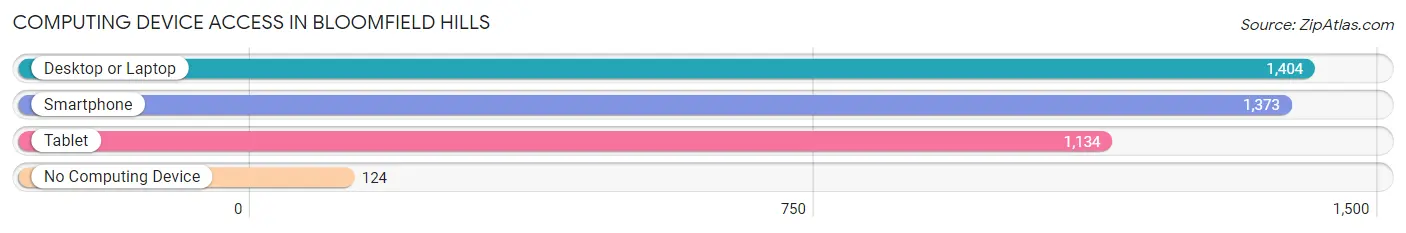
| Device Type | # Households | % Households |
| Desktop or Laptop | 1,404 | 89.4% |
| Smartphone | 1,373 | 87.4% |
| Tablet | 1,134 | 72.2% |
| No Computing Device | 124 | 7.9% |
| Total | 1,571 | 100.0% |
Internet Access in Bloomfield Hills
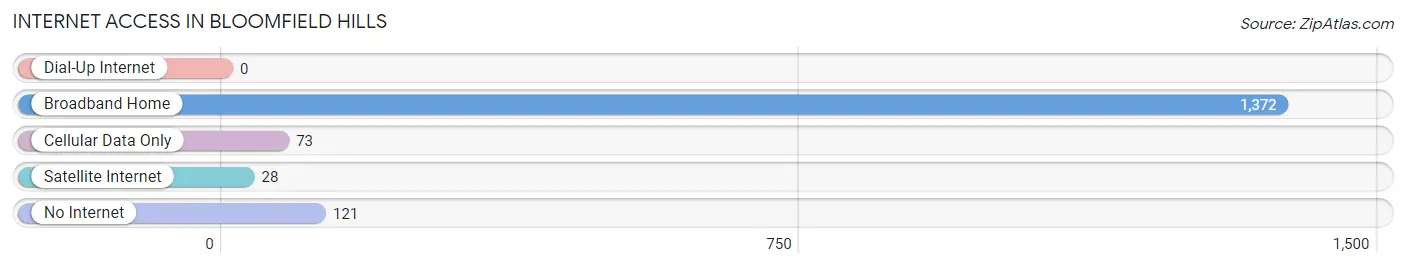
| Internet Type | # Households | % Households |
| Dial-Up Internet | 0 | 0.0% |
| Broadband Home | 1,372 | 87.3% |
| Cellular Data Only | 73 | 4.6% |
| Satellite Internet | 28 | 1.8% |
| No Internet | 121 | 7.7% |
| Total | 1,571 | 100.0% |
Bloomfield Hills Summary
Bloomfield Hills is a city located in Oakland County, Michigan. It is a suburb of Detroit and is part of the Detroit metropolitan area. As of the 2010 census, the city had a population of 3,869. The city is almost completely surrounded by Bloomfield Township.
History
The area that is now Bloomfield Hills was originally inhabited by the Potawatomi Native Americans. The first European settlers arrived in the area in the early 19th century. The area was originally part of Bloomfield Township, which was organized in 1827. In 1933, the area was incorporated as a village and was later reincorporated as a city in 1958.
Geography
Bloomfield Hills is located in southeastern Michigan, about 20 miles northwest of Detroit. It is bordered by Bloomfield Township to the north, west, and south, and by Birmingham to the east. According to the United States Census Bureau, the city has a total area of 4.2 square miles, all of which is land.
Economy
The economy of Bloomfield Hills is largely based on the service industry. The city is home to a number of corporate headquarters, including Taubman Centers, Penske Automotive Group, and PulteGroup. The city is also home to a number of upscale shopping centers, including the Somerset Collection and the Bloomfield Towne Square.
Demographics
As of the 2010 census, there were 3,869 people, 1,717 households, and 1,093 families residing in the city. The population density was 922.2 people per square mile. The racial makeup of the city was 92.2% White, 3.3% African American, 0.2% Native American, 3.2% Asian, 0.1% Pacific Islander, 0.3% from other races, and 0.7% from two or more races. Hispanic or Latino of any race were 1.7% of the population.
The median income for a household in the city was $117,945, and the median income for a family was $150,945. The per capita income for the city was $77,945. About 1.7% of families and 2.7% of the population were below the poverty line, including 2.2% of those under age 18 and 2.2% of those age 65 or over.
Common Questions
What is Per Capita Income in Bloomfield Hills?
Per Capita income in Bloomfield Hills is $129,481.
What is the Median Family Income in Bloomfield Hills?
Median Family Income in Bloomfield Hills is $222,283.
What is the Median Household income in Bloomfield Hills?
Median Household Income in Bloomfield Hills is $200,054.
What is Income or Wage Gap in Bloomfield Hills?
Income or Wage Gap in Bloomfield Hills is 50.2%.
Women in Bloomfield Hills earn 49.8 cents for every dollar earned by a man.
What is Inequality or Gini Index in Bloomfield Hills?
Inequality or Gini Index in Bloomfield Hills is 0.53.
What is the Total Population of Bloomfield Hills?
Total Population of Bloomfield Hills is 4,402.
What is the Total Male Population of Bloomfield Hills?
Total Male Population of Bloomfield Hills is 1,987.
What is the Total Female Population of Bloomfield Hills?
Total Female Population of Bloomfield Hills is 2,415.
What is the Ratio of Males per 100 Females in Bloomfield Hills?
There are 82.28 Males per 100 Females in Bloomfield Hills.
What is the Ratio of Females per 100 Males in Bloomfield Hills?
There are 121.54 Females per 100 Males in Bloomfield Hills.
What is the Median Population Age in Bloomfield Hills?
Median Population Age in Bloomfield Hills is 50.2 Years.
What is the Average Family Size in Bloomfield Hills
Average Family Size in Bloomfield Hills is 3.2 People.
What is the Average Household Size in Bloomfield Hills
Average Household Size in Bloomfield Hills is 2.6 People.
How Large is the Labor Force in Bloomfield Hills?
There are 1,758 People in the Labor Forcein in Bloomfield Hills.
What is the Percentage of People in the Labor Force in Bloomfield Hills?
48.7% of People are in the Labor Force in Bloomfield Hills.
What is the Unemployment Rate in Bloomfield Hills?
Unemployment Rate in Bloomfield Hills is 4.4%.