Big Bear Lake, CA Map & Demographics
Big Bear Lake Map
Big Bear Lake Overview
$46,147
PER CAPITA INCOME
$79,242
AVG FAMILY INCOME
$70,020
AVG HOUSEHOLD INCOME
13.1%
WAGE / INCOME GAP [ % ]
86.9¢/ $1
WAGE / INCOME GAP [ $ ]
$13,129
FAMILY INCOME DEFICIT
0.53
INEQUALITY / GINI INDEX
5,059
TOTAL POPULATION
2,706
MALE POPULATION
2,353
FEMALE POPULATION
115.00
MALES / 100 FEMALES
86.95
FEMALES / 100 MALES
47.5
MEDIAN AGE
3.0
AVG FAMILY SIZE
2.3
AVG HOUSEHOLD SIZE
2,319
LABOR FORCE [ PEOPLE ]
57.2%
PERCENT IN LABOR FORCE
6.0%
UNEMPLOYMENT RATE
Big Bear Lake Zip Codes
Big Bear Lake Area Codes
Income in Big Bear Lake
Income Overview in Big Bear Lake
Per Capita Income in Big Bear Lake is $46,147, while median incomes of families and households are $79,242 and $70,020 respectively.
| Characteristic | Number | Measure |
| Per Capita Income | 5,059 | $46,147 |
| Median Family Income | 1,290 | $79,242 |
| Mean Family Income | 1,290 | $129,287 |
| Median Household Income | 2,171 | $70,020 |
| Mean Household Income | 2,171 | $106,083 |
| Income Deficit | 1,290 | $13,129 |
| Wage / Income Gap (%) | 5,059 | 13.13% |
| Wage / Income Gap ($) | 5,059 | 86.87¢ per $1 |
| Gini / Inequality Index | 5,059 | 0.53 |
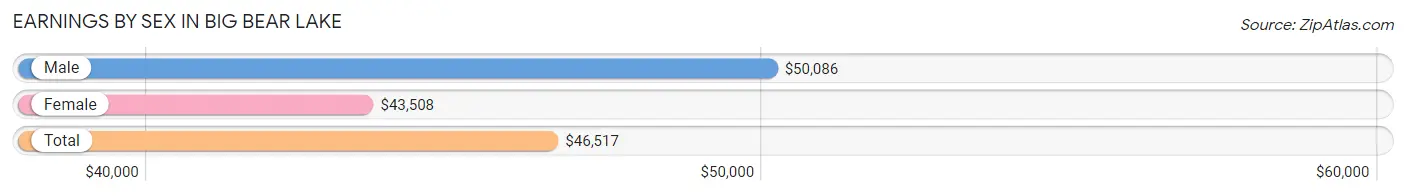
Earnings by Sex in Big Bear Lake
Average Earnings in Big Bear Lake are $46,517, $50,086 for men and $43,508 for women, a difference of 13.1%.
| Sex | Number | Average Earnings |
| Male | 1,356 (58.7%) | $50,086 |
| Female | 955 (41.3%) | $43,508 |
| Total | 2,311 (100.0%) | $46,517 |
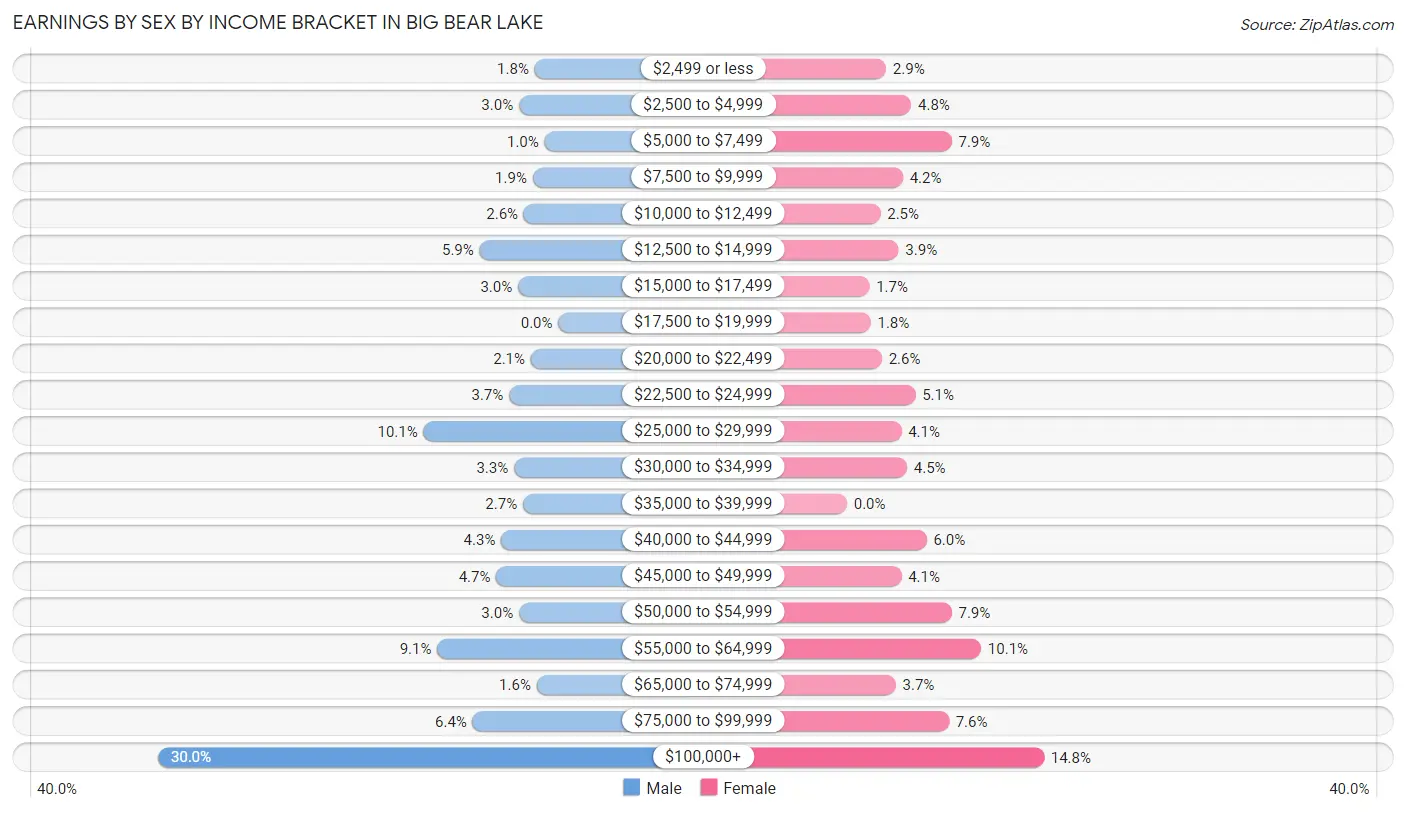
Earnings by Sex by Income Bracket in Big Bear Lake
The most common earnings brackets in Big Bear Lake are $100,000+ for men (407 | 30.0%) and $100,000+ for women (141 | 14.8%).
| Income | Male | Female |
| $2,499 or less | 24 (1.8%) | 28 (2.9%) |
| $2,500 to $4,999 | 40 (2.9%) | 46 (4.8%) |
| $5,000 to $7,499 | 14 (1.0%) | 75 (7.9%) |
| $7,500 to $9,999 | 26 (1.9%) | 40 (4.2%) |
| $10,000 to $12,499 | 35 (2.6%) | 24 (2.5%) |
| $12,500 to $14,999 | 80 (5.9%) | 37 (3.9%) |
| $15,000 to $17,499 | 41 (3.0%) | 16 (1.7%) |
| $17,500 to $19,999 | 0 (0.0%) | 17 (1.8%) |
| $20,000 to $22,499 | 28 (2.1%) | 25 (2.6%) |
| $22,500 to $24,999 | 50 (3.7%) | 49 (5.1%) |
| $25,000 to $29,999 | 137 (10.1%) | 39 (4.1%) |
| $30,000 to $34,999 | 45 (3.3%) | 43 (4.5%) |
| $35,000 to $39,999 | 36 (2.6%) | 0 (0.0%) |
| $40,000 to $44,999 | 58 (4.3%) | 57 (6.0%) |
| $45,000 to $49,999 | 63 (4.6%) | 39 (4.1%) |
| $50,000 to $54,999 | 40 (2.9%) | 75 (7.9%) |
| $55,000 to $64,999 | 123 (9.1%) | 96 (10.1%) |
| $65,000 to $74,999 | 22 (1.6%) | 35 (3.7%) |
| $75,000 to $99,999 | 87 (6.4%) | 73 (7.6%) |
| $100,000+ | 407 (30.0%) | 141 (14.8%) |
| Total | 1,356 (100.0%) | 955 (100.0%) |
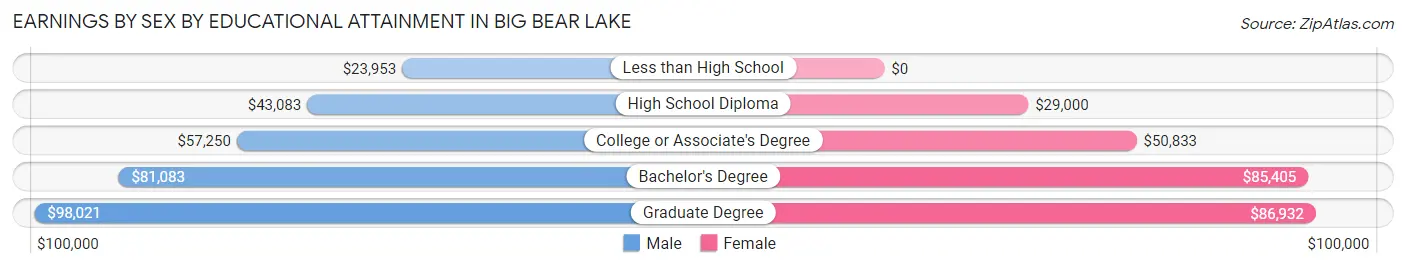
Earnings by Sex by Educational Attainment in Big Bear Lake
Average earnings in Big Bear Lake are $51,250 for men and $50,053 for women, a difference of 2.3%. Men with an educational attainment of graduate degree enjoy the highest average annual earnings of $98,021, while those with less than high school education earn the least with $23,953. Women with an educational attainment of graduate degree earn the most with the average annual earnings of $86,932, while those with high school diploma education have the smallest earnings of $29,000.
| Educational Attainment | Male Income | Female Income |
| Less than High School | $23,953 | $0 |
| High School Diploma | $43,083 | $29,000 |
| College or Associate's Degree | $57,250 | $50,833 |
| Bachelor's Degree | $81,083 | $85,405 |
| Graduate Degree | $98,021 | $86,932 |
| Total | $51,250 | $50,053 |
Family Income in Big Bear Lake
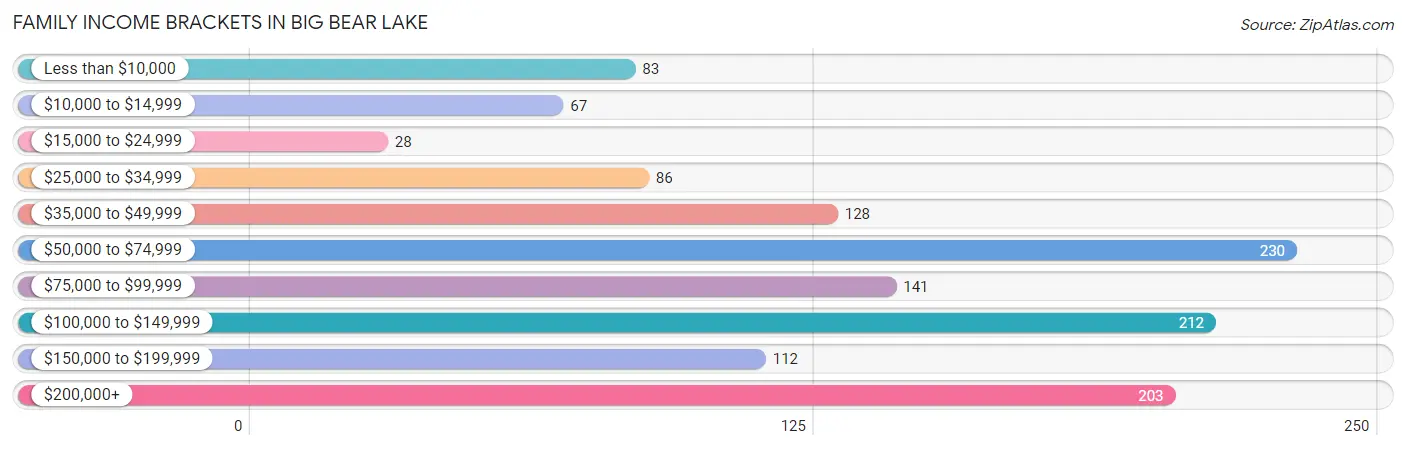
Family Income Brackets in Big Bear Lake
According to the Big Bear Lake family income data, there are 230 families falling into the $50,000 to $74,999 income range, which is the most common income bracket and makes up 17.8% of all families. Conversely, the $15,000 to $24,999 income bracket is the least frequent group with only 28 families (2.2%) belonging to this category.
| Income Bracket | # Families | % Families |
| Less than $10,000 | 83 | 6.4% |
| $10,000 to $14,999 | 67 | 5.2% |
| $15,000 to $24,999 | 28 | 2.2% |
| $25,000 to $34,999 | 86 | 6.7% |
| $35,000 to $49,999 | 128 | 9.9% |
| $50,000 to $74,999 | 230 | 17.8% |
| $75,000 to $99,999 | 141 | 10.9% |
| $100,000 to $149,999 | 212 | 16.4% |
| $150,000 to $199,999 | 112 | 8.7% |
| $200,000+ | 203 | 15.7% |
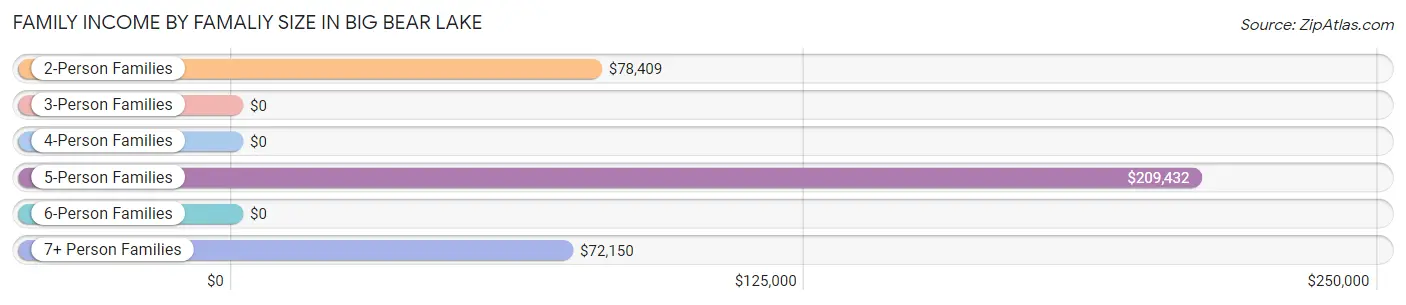
Family Income by Famaliy Size in Big Bear Lake
5-person families (77 | 6.0%) account for the highest median family income in Big Bear Lake with $209,432 per family, while 5-person families (77 | 6.0%) have the highest median income of $41,886 per family member.
| Income Bracket | # Families | Median Income |
| 2-Person Families | 826 (64.0%) | $78,409 |
| 3-Person Families | 172 (13.3%) | $0 |
| 4-Person Families | 121 (9.4%) | $0 |
| 5-Person Families | 77 (6.0%) | $209,432 |
| 6-Person Families | 51 (4.0%) | $0 |
| 7+ Person Families | 43 (3.3%) | $72,150 |
| Total | 1,290 (100.0%) | $79,242 |
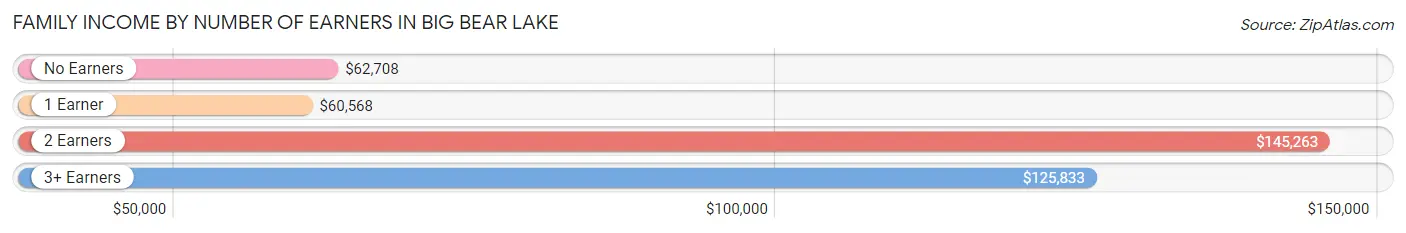
Family Income by Number of Earners in Big Bear Lake
The median family income in Big Bear Lake is $79,242, with families comprising 2 earners (430) having the highest median family income of $145,263, while families with 1 earner (416) have the lowest median family income of $60,568, accounting for 33.3% and 32.3% of families, respectively.
| Number of Earners | # Families | Median Income |
| No Earners | 364 (28.2%) | $62,708 |
| 1 Earner | 416 (32.3%) | $60,568 |
| 2 Earners | 430 (33.3%) | $145,263 |
| 3+ Earners | 80 (6.2%) | $125,833 |
| Total | 1,290 (100.0%) | $79,242 |
Household Income in Big Bear Lake
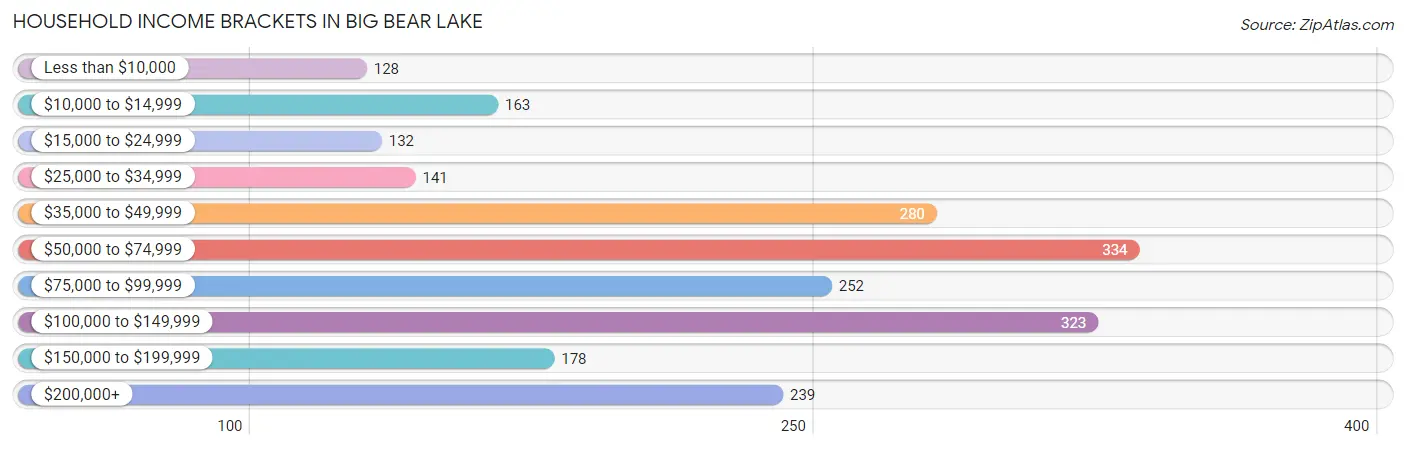
Household Income Brackets in Big Bear Lake
With 334 households falling in the category, the $50,000 to $74,999 income range is the most frequent in Big Bear Lake, accounting for 15.4% of all households. In contrast, only 128 households (5.9%) fall into the less than $10,000 income bracket, making it the least populous group.
| Income Bracket | # Households | % Households |
| Less than $10,000 | 128 | 5.9% |
| $10,000 to $14,999 | 163 | 7.5% |
| $15,000 to $24,999 | 132 | 6.1% |
| $25,000 to $34,999 | 141 | 6.5% |
| $35,000 to $49,999 | 280 | 12.9% |
| $50,000 to $74,999 | 334 | 15.4% |
| $75,000 to $99,999 | 252 | 11.6% |
| $100,000 to $149,999 | 323 | 14.9% |
| $150,000 to $199,999 | 178 | 8.2% |
| $200,000+ | 239 | 11.0% |
Household Income by Householder Age in Big Bear Lake
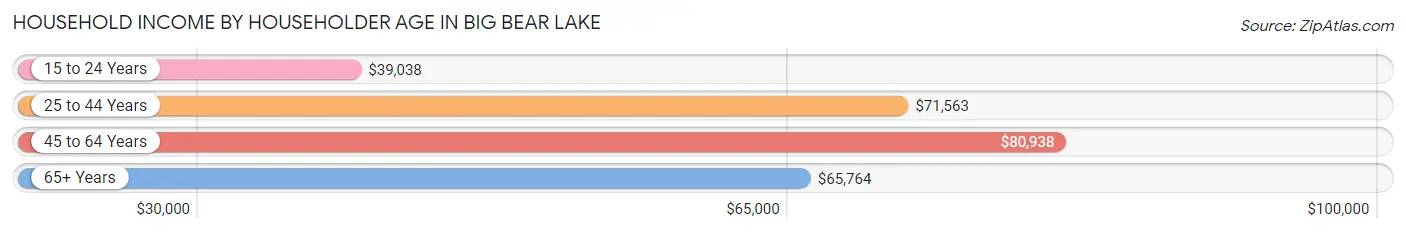
The median household income in Big Bear Lake is $70,020, with the highest median household income of $80,938 found in the 45 to 64 years age bracket for the primary householder. A total of 1,030 households (47.4%) fall into this category. Meanwhile, the 15 to 24 years age bracket for the primary householder has the lowest median household income of $39,038, with 36 households (1.7%) in this group.
| Income Bracket | # Households | Median Income |
| 15 to 24 Years | 36 (1.7%) | $39,038 |
| 25 to 44 Years | 439 (20.2%) | $71,563 |
| 45 to 64 Years | 1,030 (47.4%) | $80,938 |
| 65+ Years | 666 (30.7%) | $65,764 |
| Total | 2,171 (100.0%) | $70,020 |
Poverty in Big Bear Lake
Income Below Poverty by Sex and Age in Big Bear Lake
With 15.5% poverty level for males and 12.0% for females among the residents of Big Bear Lake, 6 to 11 year old males and 12 to 14 year old females are the most vulnerable to poverty, with 65 males (30.8%) and 49 females (49.5%) in their respective age groups living below the poverty level.
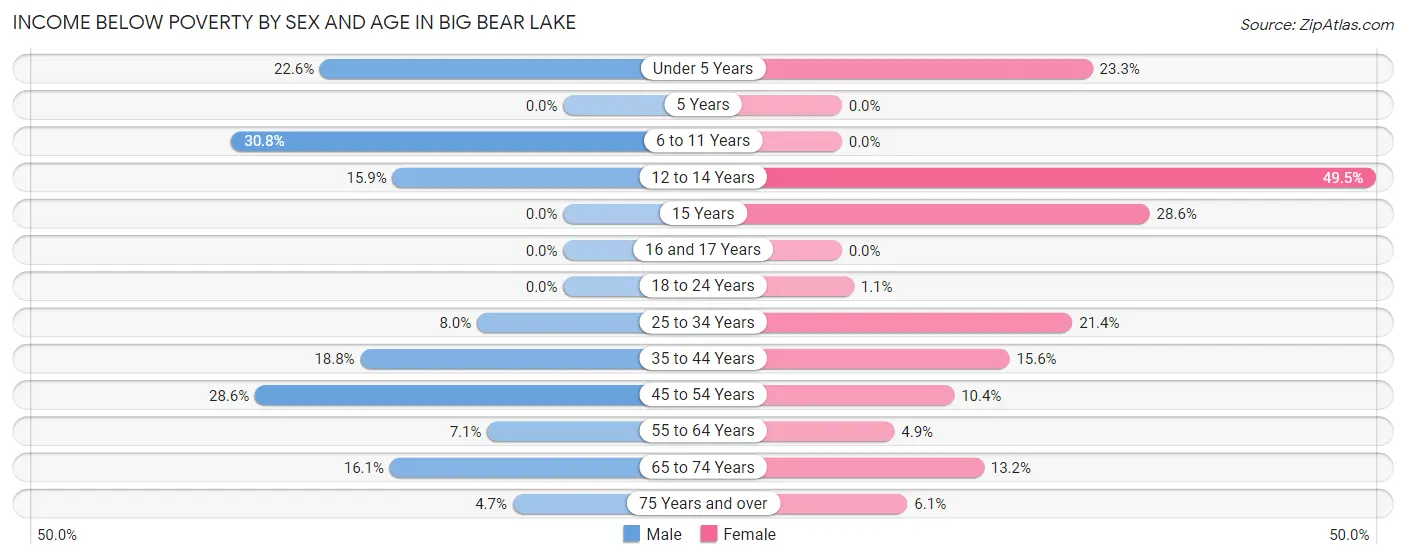
| Age Bracket | Male | Female |
| Under 5 Years | 28 (22.6%) | 27 (23.3%) |
| 5 Years | 0 (0.0%) | 0 (0.0%) |
| 6 to 11 Years | 65 (30.8%) | 0 (0.0%) |
| 12 to 14 Years | 29 (15.9%) | 49 (49.5%) |
| 15 Years | 0 (0.0%) | 10 (28.6%) |
| 16 and 17 Years | 0 (0.0%) | 0 (0.0%) |
| 18 to 24 Years | 0 (0.0%) | 1 (1.1%) |
| 25 to 34 Years | 25 (8.0%) | 43 (21.4%) |
| 35 to 44 Years | 61 (18.8%) | 42 (15.6%) |
| 45 to 54 Years | 107 (28.6%) | 36 (10.4%) |
| 55 to 64 Years | 38 (7.1%) | 21 (4.9%) |
| 65 to 74 Years | 58 (16.1%) | 41 (13.2%) |
| 75 Years and over | 6 (4.7%) | 12 (6.1%) |
| Total | 417 (15.5%) | 282 (12.0%) |
Income Above Poverty by Sex and Age in Big Bear Lake
According to the poverty statistics in Big Bear Lake, males aged 5 years and females aged 5 years are the age groups that are most secure financially, with 100.0% of males and 100.0% of females in these age groups living above the poverty line.
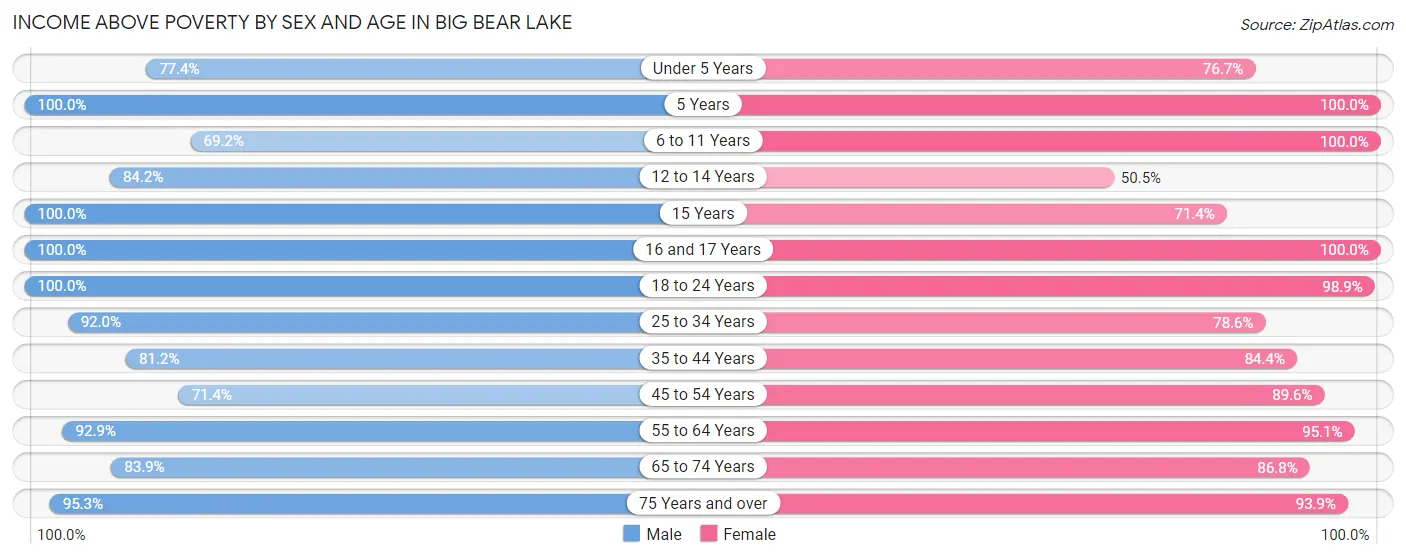
| Age Bracket | Male | Female |
| Under 5 Years | 96 (77.4%) | 89 (76.7%) |
| 5 Years | 56 (100.0%) | 13 (100.0%) |
| 6 to 11 Years | 146 (69.2%) | 150 (100.0%) |
| 12 to 14 Years | 154 (84.2%) | 50 (50.5%) |
| 15 Years | 18 (100.0%) | 25 (71.4%) |
| 16 and 17 Years | 33 (100.0%) | 96 (100.0%) |
| 18 to 24 Years | 27 (100.0%) | 89 (98.9%) |
| 25 to 34 Years | 287 (92.0%) | 158 (78.6%) |
| 35 to 44 Years | 263 (81.2%) | 228 (84.4%) |
| 45 to 54 Years | 267 (71.4%) | 309 (89.6%) |
| 55 to 64 Years | 500 (92.9%) | 409 (95.1%) |
| 65 to 74 Years | 302 (83.9%) | 270 (86.8%) |
| 75 Years and over | 122 (95.3%) | 185 (93.9%) |
| Total | 2,271 (84.5%) | 2,071 (88.0%) |
Income Below Poverty Among Married-Couple Families in Big Bear Lake
The poverty statistics for married-couple families in Big Bear Lake show that 8.8% or 89 of the total 1,013 families live below the poverty line. Families with 1 or 2 children have the highest poverty rate of 26.6%, comprising of 42 families. On the other hand, families with 3 or 4 children have the lowest poverty rate of 0.0%, which includes 0 families.
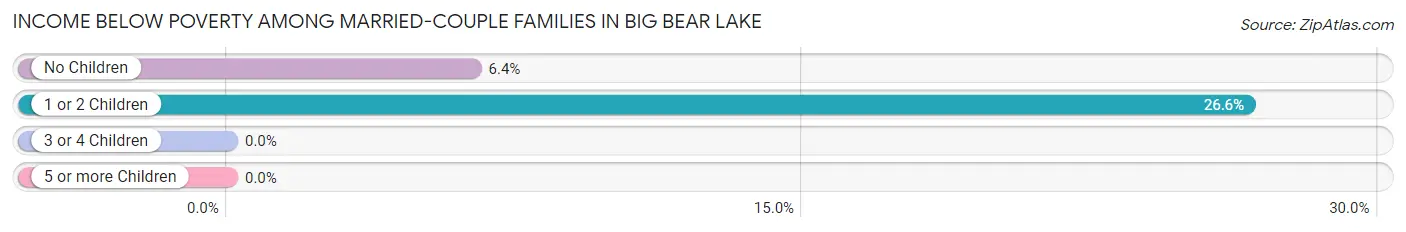
| Children | Above Poverty | Below Poverty |
| No Children | 692 (93.6%) | 47 (6.4%) |
| 1 or 2 Children | 116 (73.4%) | 42 (26.6%) |
| 3 or 4 Children | 98 (100.0%) | 0 (0.0%) |
| 5 or more Children | 18 (100.0%) | 0 (0.0%) |
| Total | 924 (91.2%) | 89 (8.8%) |
Income Below Poverty Among Single-Parent Households in Big Bear Lake
According to the poverty data in Big Bear Lake, 42.2% or 38 single-father households and 15.5% or 29 single-mother households are living below the poverty line. Among single-father households, those with 3 or 4 children have the highest poverty rate, with 12 households (100.0%) experiencing poverty. Likewise, among single-mother households, those with 3 or 4 children have the highest poverty rate, with 17 households (56.7%) falling below the poverty line.
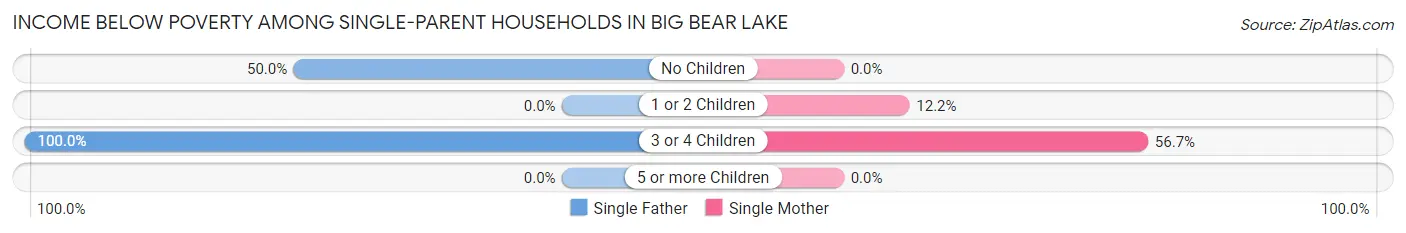
| Children | Single Father | Single Mother |
| No Children | 26 (50.0%) | 0 (0.0%) |
| 1 or 2 Children | 0 (0.0%) | 12 (12.2%) |
| 3 or 4 Children | 12 (100.0%) | 17 (56.7%) |
| 5 or more Children | 0 (0.0%) | 0 (0.0%) |
| Total | 38 (42.2%) | 29 (15.5%) |
Income Below Poverty Among Married-Couple vs Single-Parent Households in Big Bear Lake
The poverty data for Big Bear Lake shows that 89 of the married-couple family households (8.8%) and 67 of the single-parent households (24.2%) are living below the poverty level. Within the married-couple family households, those with 1 or 2 children have the highest poverty rate, with 42 households (26.6%) falling below the poverty line. Among the single-parent households, those with 3 or 4 children have the highest poverty rate, with 29 household (69.1%) living below poverty.
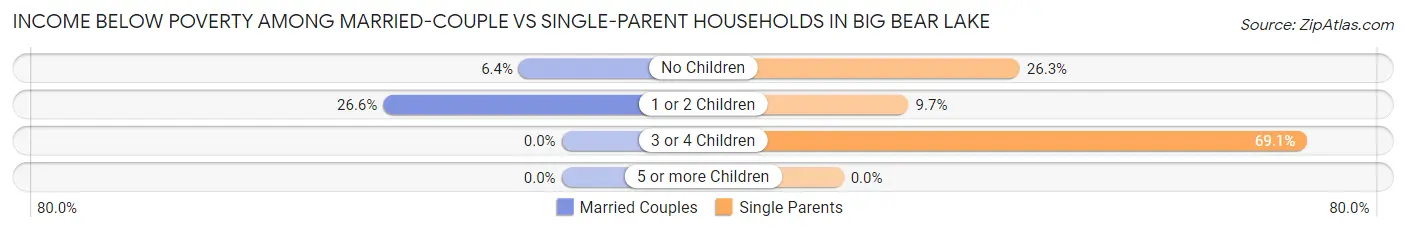
| Children | Married-Couple Families | Single-Parent Households |
| No Children | 47 (6.4%) | 26 (26.3%) |
| 1 or 2 Children | 42 (26.6%) | 12 (9.7%) |
| 3 or 4 Children | 0 (0.0%) | 29 (69.1%) |
| 5 or more Children | 0 (0.0%) | 0 (0.0%) |
| Total | 89 (8.8%) | 67 (24.2%) |
Race in Big Bear Lake
The most populous races in Big Bear Lake are White / Caucasian (3,889 | 76.9%), Hispanic or Latino (1,499 | 29.6%), and Two or more Races (792 | 15.7%).
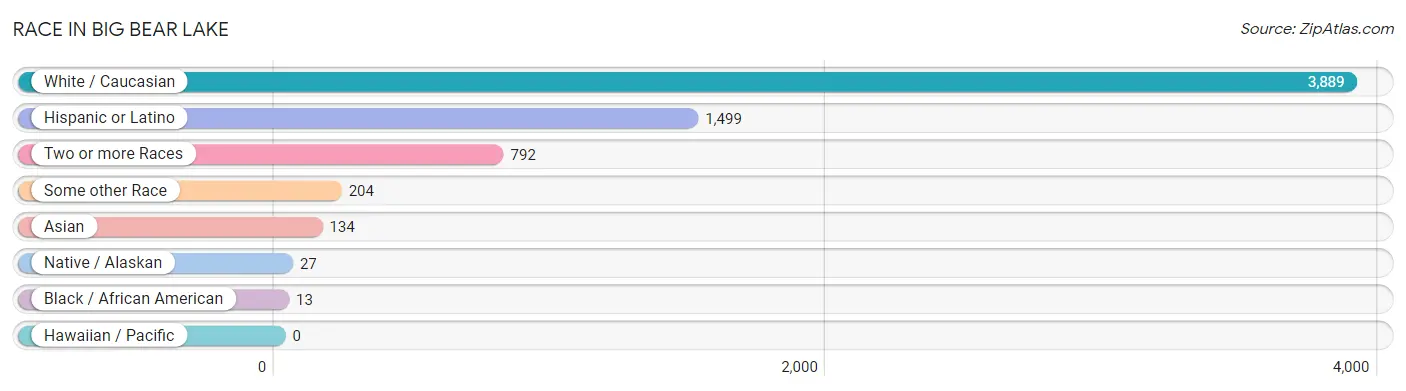
| Race | # Population | % Population |
| Asian | 134 | 2.6% |
| Black / African American | 13 | 0.3% |
| Hawaiian / Pacific | 0 | 0.0% |
| Hispanic or Latino | 1,499 | 29.6% |
| Native / Alaskan | 27 | 0.5% |
| White / Caucasian | 3,889 | 76.9% |
| Two or more Races | 792 | 15.7% |
| Some other Race | 204 | 4.0% |
| Total | 5,059 | 100.0% |
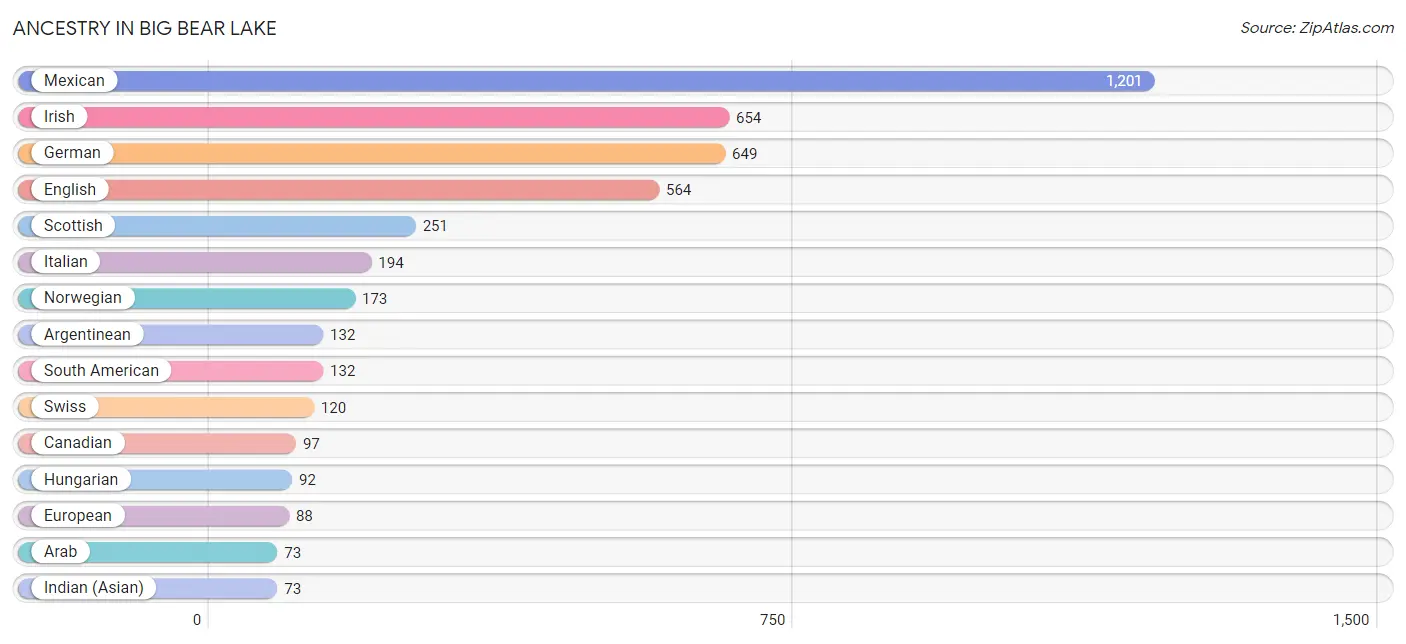
Ancestry in Big Bear Lake
The most populous ancestries reported in Big Bear Lake are Mexican (1,201 | 23.7%), Irish (654 | 12.9%), German (649 | 12.8%), English (564 | 11.2%), and Scottish (251 | 5.0%), together accounting for 65.6% of all Big Bear Lake residents.
| Ancestry | # Population | % Population |
| American | 20 | 0.4% |
| Apache | 18 | 0.4% |
| Arab | 73 | 1.4% |
| Argentinean | 132 | 2.6% |
| Assyrian / Chaldean / Syriac | 57 | 1.1% |
| Barbadian | 1 | 0.0% |
| Belgian | 24 | 0.5% |
| Bhutanese | 10 | 0.2% |
| British | 37 | 0.7% |
| Burmese | 22 | 0.4% |
| Cajun | 31 | 0.6% |
| Canadian | 97 | 1.9% |
| Central American | 18 | 0.4% |
| Cherokee | 9 | 0.2% |
| Croatian | 9 | 0.2% |
| Cuban | 11 | 0.2% |
| Czech | 36 | 0.7% |
| Danish | 25 | 0.5% |
| Dutch | 46 | 0.9% |
| English | 564 | 11.2% |
| European | 88 | 1.7% |
| Finnish | 14 | 0.3% |
| French | 66 | 1.3% |
| German | 649 | 12.8% |
| Greek | 22 | 0.4% |
| Honduran | 18 | 0.4% |
| Hungarian | 92 | 1.8% |
| Indian (Asian) | 73 | 1.4% |
| Iranian | 13 | 0.3% |
| Irish | 654 | 12.9% |
| Italian | 194 | 3.8% |
| Jamaican | 22 | 0.4% |
| Korean | 15 | 0.3% |
| Lebanese | 21 | 0.4% |
| Mexican | 1,201 | 23.7% |
| Norwegian | 173 | 3.4% |
| Pakistani | 41 | 0.8% |
| Polish | 26 | 0.5% |
| Portuguese | 23 | 0.4% |
| Puerto Rican | 14 | 0.3% |
| Russian | 50 | 1.0% |
| Scandinavian | 13 | 0.3% |
| Scotch-Irish | 31 | 0.6% |
| Scottish | 251 | 5.0% |
| Slovak | 13 | 0.3% |
| South American | 132 | 2.6% |
| Spanish | 24 | 0.5% |
| Swedish | 47 | 0.9% |
| Swiss | 120 | 2.4% |
| Syrian | 52 | 1.0% |
| Ukrainian | 11 | 0.2% |
| Welsh | 41 | 0.8% |
| Yaqui | 12 | 0.2% | View All 53 Rows |
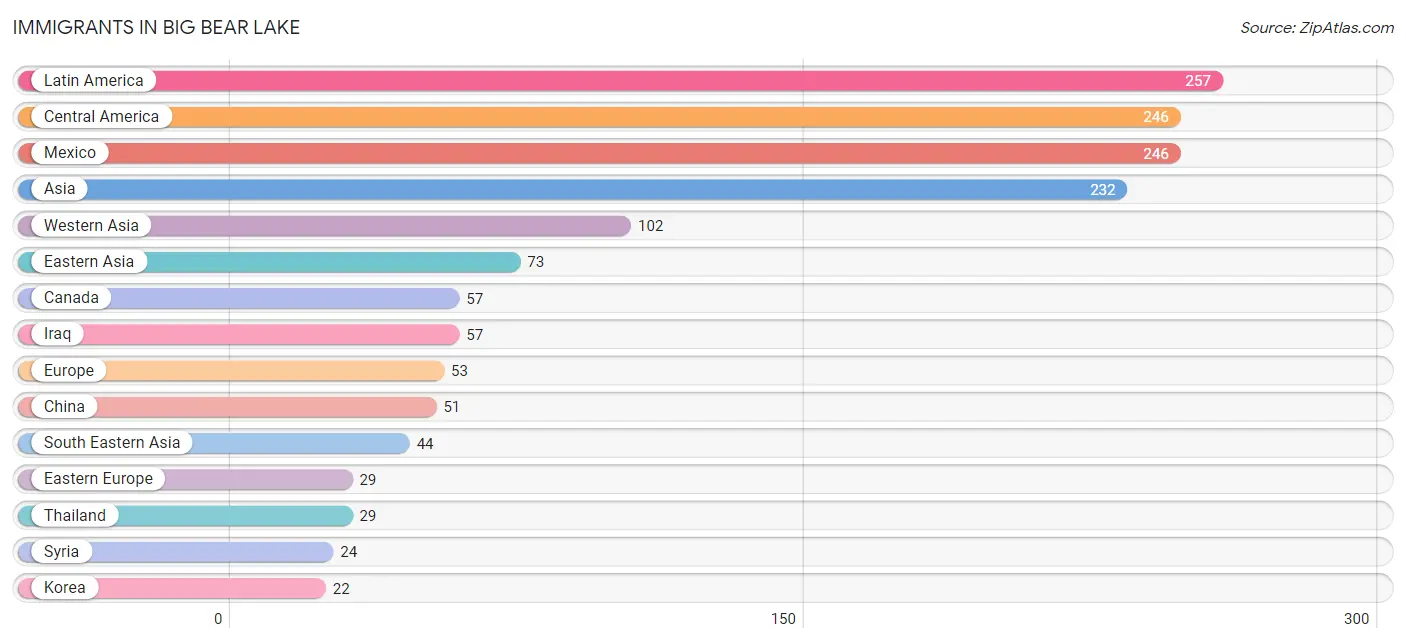
Immigrants in Big Bear Lake
The most numerous immigrant groups reported in Big Bear Lake came from Latin America (257 | 5.1%), Central America (246 | 4.9%), Mexico (246 | 4.9%), Asia (232 | 4.6%), and Western Asia (102 | 2.0%), together accounting for 21.4% of all Big Bear Lake residents.
| Immigration Origin | # Population | % Population |
| Asia | 232 | 4.6% |
| Australia | 19 | 0.4% |
| Barbados | 1 | 0.0% |
| Canada | 57 | 1.1% |
| Caribbean | 11 | 0.2% |
| Central America | 246 | 4.9% |
| China | 51 | 1.0% |
| Eastern Asia | 73 | 1.4% |
| Eastern Europe | 29 | 0.6% |
| Europe | 53 | 1.1% |
| France | 12 | 0.2% |
| Germany | 1 | 0.0% |
| Hungary | 14 | 0.3% |
| India | 11 | 0.2% |
| Iran | 2 | 0.0% |
| Iraq | 57 | 1.1% |
| Italy | 11 | 0.2% |
| Jamaica | 10 | 0.2% |
| Korea | 22 | 0.4% |
| Latin America | 257 | 5.1% |
| Lebanon | 21 | 0.4% |
| Mexico | 246 | 4.9% |
| Oceania | 19 | 0.4% |
| Philippines | 15 | 0.3% |
| Russia | 15 | 0.3% |
| South Central Asia | 13 | 0.3% |
| South Eastern Asia | 44 | 0.9% |
| Southern Europe | 11 | 0.2% |
| Syria | 24 | 0.5% |
| Thailand | 29 | 0.6% |
| Western Asia | 102 | 2.0% |
| Western Europe | 13 | 0.3% | View All 32 Rows |
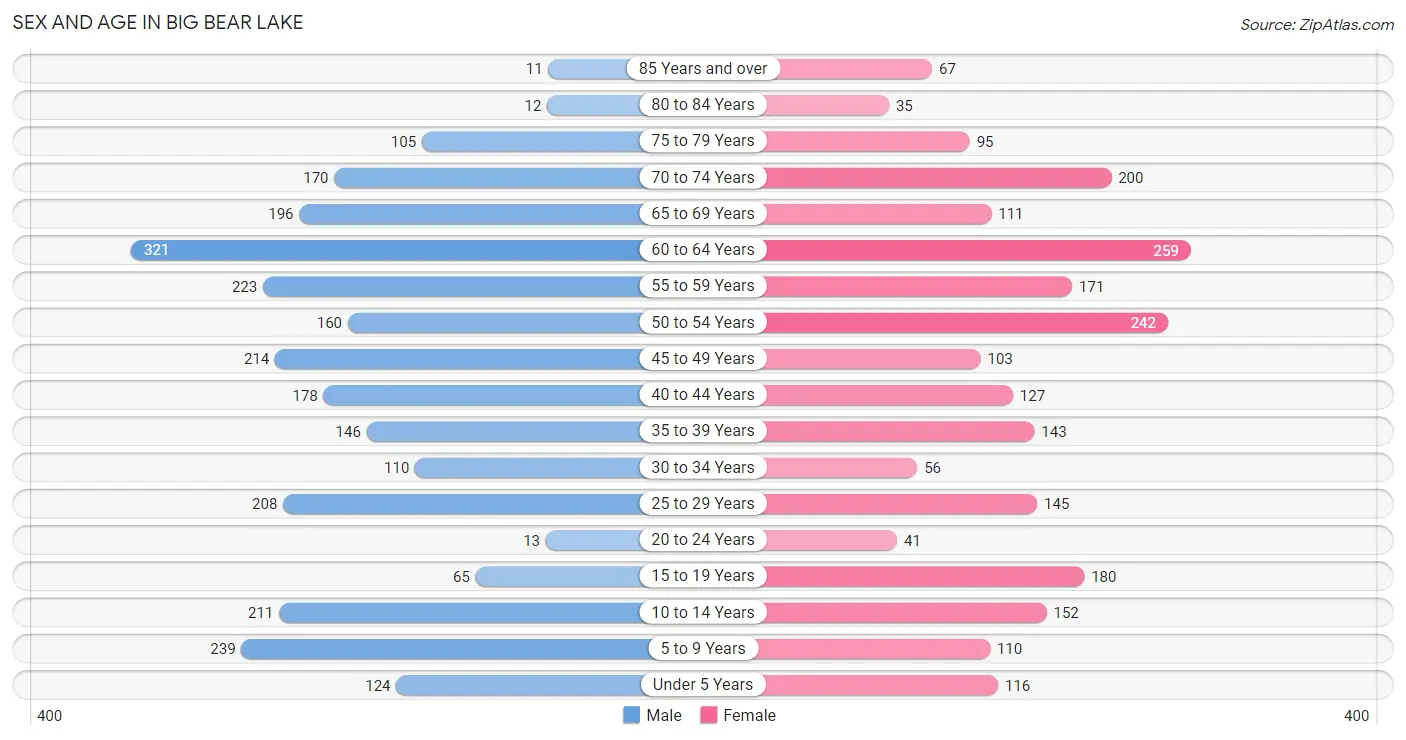
Sex and Age in Big Bear Lake
Sex and Age in Big Bear Lake
The most populous age groups in Big Bear Lake are 60 to 64 Years (321 | 11.9%) for men and 60 to 64 Years (259 | 11.0%) for women.
| Age Bracket | Male | Female |
| Under 5 Years | 124 (4.6%) | 116 (4.9%) |
| 5 to 9 Years | 239 (8.8%) | 110 (4.7%) |
| 10 to 14 Years | 211 (7.8%) | 152 (6.5%) |
| 15 to 19 Years | 65 (2.4%) | 180 (7.6%) |
| 20 to 24 Years | 13 (0.5%) | 41 (1.7%) |
| 25 to 29 Years | 208 (7.7%) | 145 (6.2%) |
| 30 to 34 Years | 110 (4.1%) | 56 (2.4%) |
| 35 to 39 Years | 146 (5.4%) | 143 (6.1%) |
| 40 to 44 Years | 178 (6.6%) | 127 (5.4%) |
| 45 to 49 Years | 214 (7.9%) | 103 (4.4%) |
| 50 to 54 Years | 160 (5.9%) | 242 (10.3%) |
| 55 to 59 Years | 223 (8.2%) | 171 (7.3%) |
| 60 to 64 Years | 321 (11.9%) | 259 (11.0%) |
| 65 to 69 Years | 196 (7.2%) | 111 (4.7%) |
| 70 to 74 Years | 170 (6.3%) | 200 (8.5%) |
| 75 to 79 Years | 105 (3.9%) | 95 (4.0%) |
| 80 to 84 Years | 12 (0.4%) | 35 (1.5%) |
| 85 Years and over | 11 (0.4%) | 67 (2.9%) |
| Total | 2,706 (100.0%) | 2,353 (100.0%) |
Families and Households in Big Bear Lake
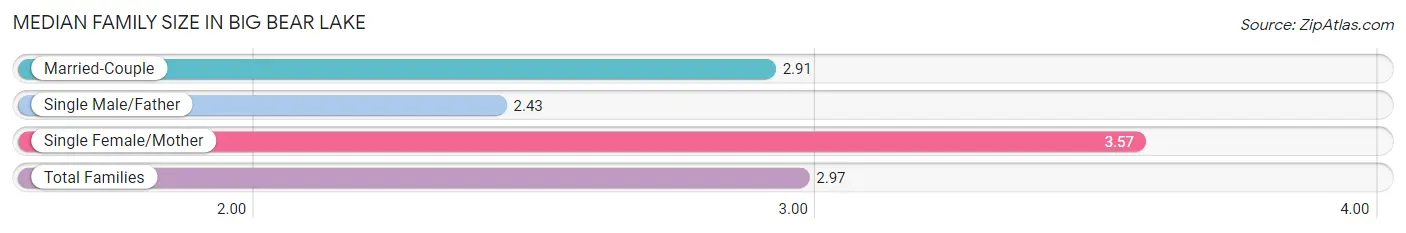
Median Family Size in Big Bear Lake
The median family size in Big Bear Lake is 2.97 persons per family, with single female/mother families (187 | 14.5%) accounting for the largest median family size of 3.57 persons per family. On the other hand, single male/father families (90 | 7.0%) represent the smallest median family size with 2.43 persons per family.
| Family Type | # Families | Family Size |
| Married-Couple | 1,013 (78.5%) | 2.91 |
| Single Male/Father | 90 (7.0%) | 2.43 |
| Single Female/Mother | 187 (14.5%) | 3.57 |
| Total Families | 1,290 (100.0%) | 2.97 |
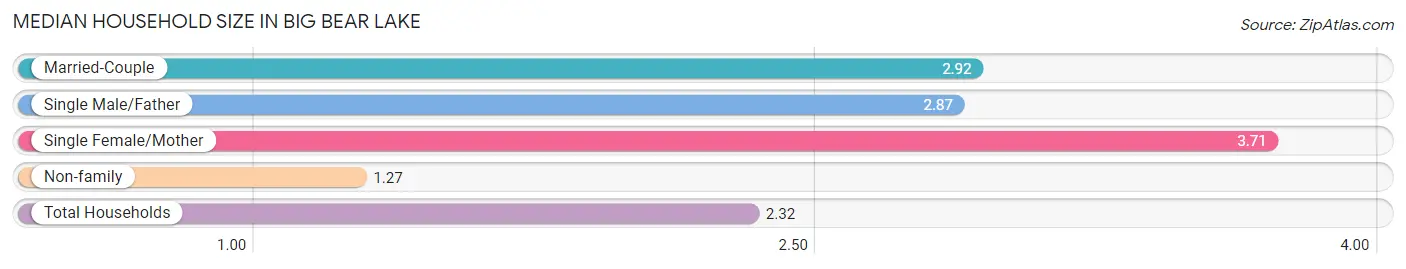
Median Household Size in Big Bear Lake
The median household size in Big Bear Lake is 2.32 persons per household, with single female/mother households (187 | 8.6%) accounting for the largest median household size of 3.71 persons per household. non-family households (881 | 40.6%) represent the smallest median household size with 1.27 persons per household.
| Household Type | # Households | Household Size |
| Married-Couple | 1,013 (46.7%) | 2.92 |
| Single Male/Father | 90 (4.2%) | 2.87 |
| Single Female/Mother | 187 (8.6%) | 3.71 |
| Non-family | 881 (40.6%) | 1.27 |
| Total Households | 2,171 (100.0%) | 2.32 |
Household Size by Marriage Status in Big Bear Lake
Out of a total of 2,171 households in Big Bear Lake, 1,290 (59.4%) are family households, while 881 (40.6%) are nonfamily households. The most numerous type of family households are 2-person households, comprising 789, and the most common type of nonfamily households are 1-person households, comprising 722.
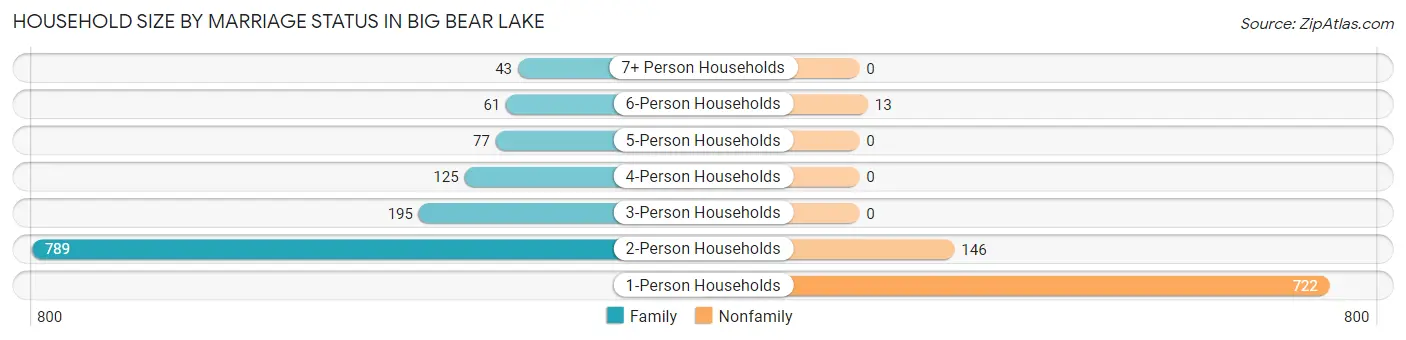
| Household Size | Family Households | Nonfamily Households |
| 1-Person Households | - | 722 (33.3%) |
| 2-Person Households | 789 (36.3%) | 146 (6.7%) |
| 3-Person Households | 195 (9.0%) | 0 (0.0%) |
| 4-Person Households | 125 (5.8%) | 0 (0.0%) |
| 5-Person Households | 77 (3.5%) | 0 (0.0%) |
| 6-Person Households | 61 (2.8%) | 13 (0.6%) |
| 7+ Person Households | 43 (2.0%) | 0 (0.0%) |
| Total | 1,290 (59.4%) | 881 (40.6%) |
Female Fertility in Big Bear Lake
Fertility by Age in Big Bear Lake
Average fertility rate in Big Bear Lake is 46.0 births per 1,000 women. Women in the age bracket of 20 to 34 years have the highest fertility rate with 107.0 births per 1,000 women. Women in the age bracket of 20 to 34 years acount for 68.4% of all women with births.
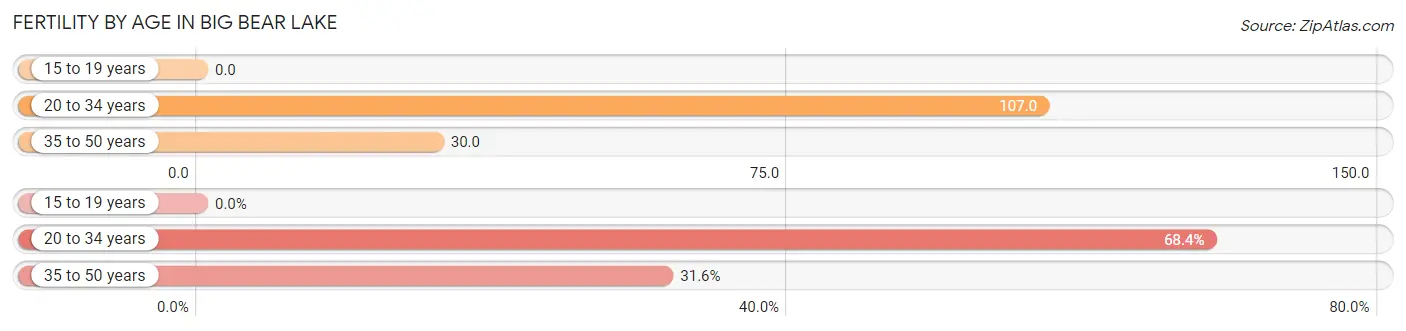
| Age Bracket | Women with Births | Births / 1,000 Women |
| 15 to 19 years | 0 (0.0%) | 0.0 |
| 20 to 34 years | 26 (68.4%) | 107.0 |
| 35 to 50 years | 12 (31.6%) | 30.0 |
| Total | 38 (100.0%) | 46.0 |
Fertility by Age by Marriage Status in Big Bear Lake
31.6% of women with births (38) in Big Bear Lake are married. The highest percentage of unmarried women with births falls into 20 to 34 years age bracket with 100.0% of them unmarried at the time of birth, while the lowest percentage of unmarried women with births belong to 35 to 50 years age bracket with 0.0% of them unmarried.
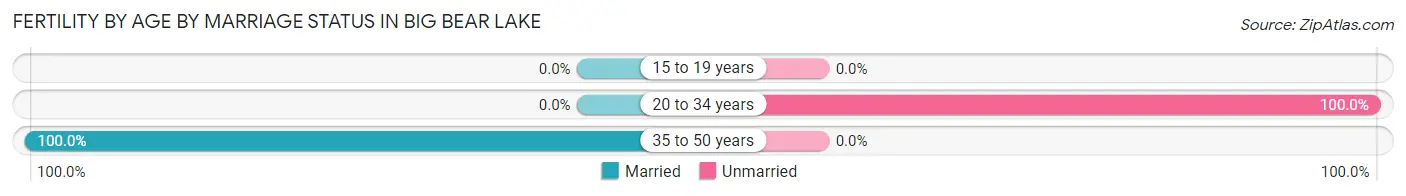
| Age Bracket | Married | Unmarried |
| 15 to 19 years | 0 (0.0%) | 0 (0.0%) |
| 20 to 34 years | 0 (0.0%) | 26 (100.0%) |
| 35 to 50 years | 12 (100.0%) | 0 (0.0%) |
| Total | 12 (31.6%) | 26 (68.4%) |
Fertility by Education in Big Bear Lake
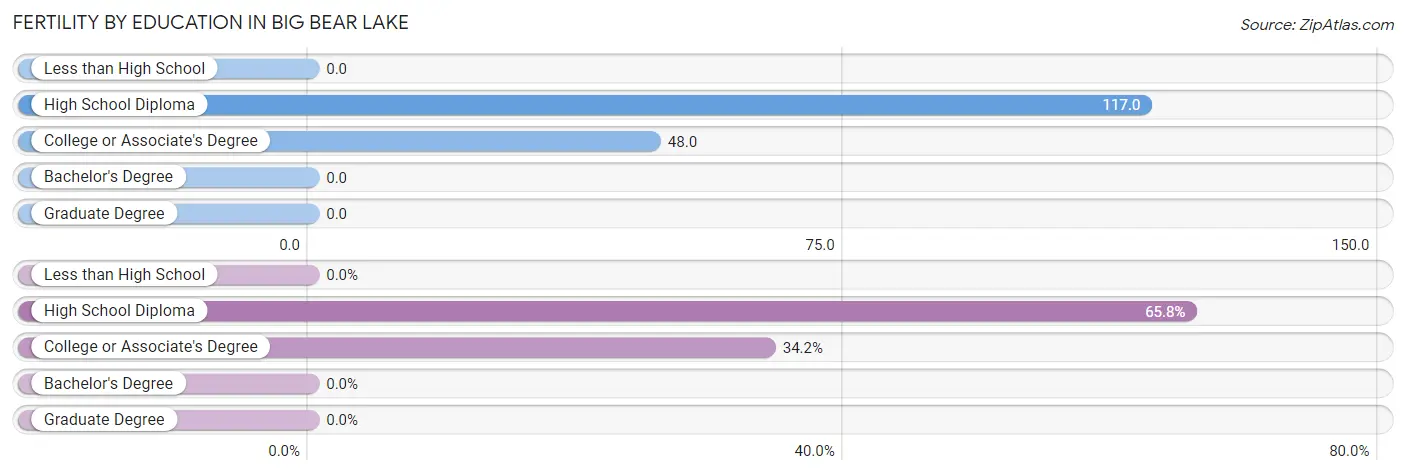
| Educational Attainment | Women with Births | Births / 1,000 Women |
| Less than High School | 0 (0.0%) | 0.0 |
| High School Diploma | 25 (65.8%) | 117.0 |
| College or Associate's Degree | 13 (34.2%) | 48.0 |
| Bachelor's Degree | 0 (0.0%) | 0.0 |
| Graduate Degree | 0 (0.0%) | 0.0 |
| Total | 38 (100.0%) | 46.0 |
Fertility by Education by Marriage Status in Big Bear Lake
68.4% of women with births in Big Bear Lake are unmarried. Women with the educational attainment of high school diploma are most likely to be married with 48.0% of them married at childbirth, while women with the educational attainment of college or associate's degree are least likely to be married with 100.0% of them unmarried at childbirth.
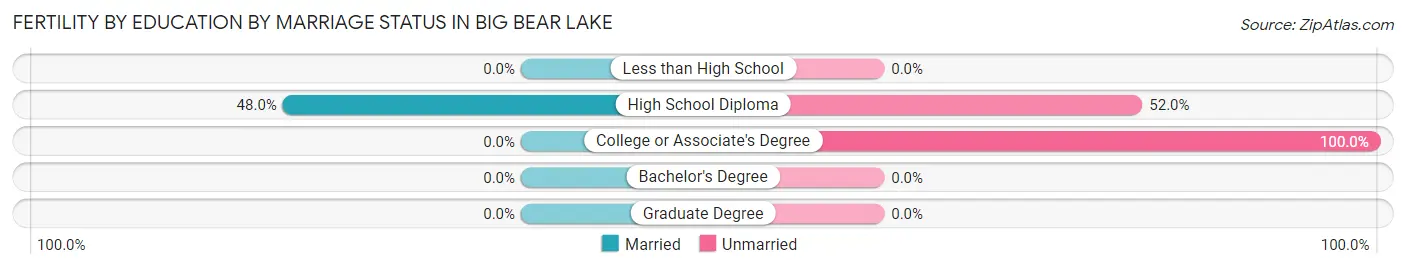
| Educational Attainment | Married | Unmarried |
| Less than High School | 0 (0.0%) | 0 (0.0%) |
| High School Diploma | 12 (48.0%) | 13 (52.0%) |
| College or Associate's Degree | 0 (0.0%) | 13 (100.0%) |
| Bachelor's Degree | 0 (0.0%) | 0 (0.0%) |
| Graduate Degree | 0 (0.0%) | 0 (0.0%) |
| Total | 12 (31.6%) | 26 (68.4%) |
Employment Characteristics in Big Bear Lake
Employment by Class of Employer in Big Bear Lake
Among the 2,162 employed individuals in Big Bear Lake, private company employees (1,213 | 56.1%), self-employed (not incorporated) (465 | 21.5%), and local government employees (175 | 8.1%) make up the most common classes of employment.
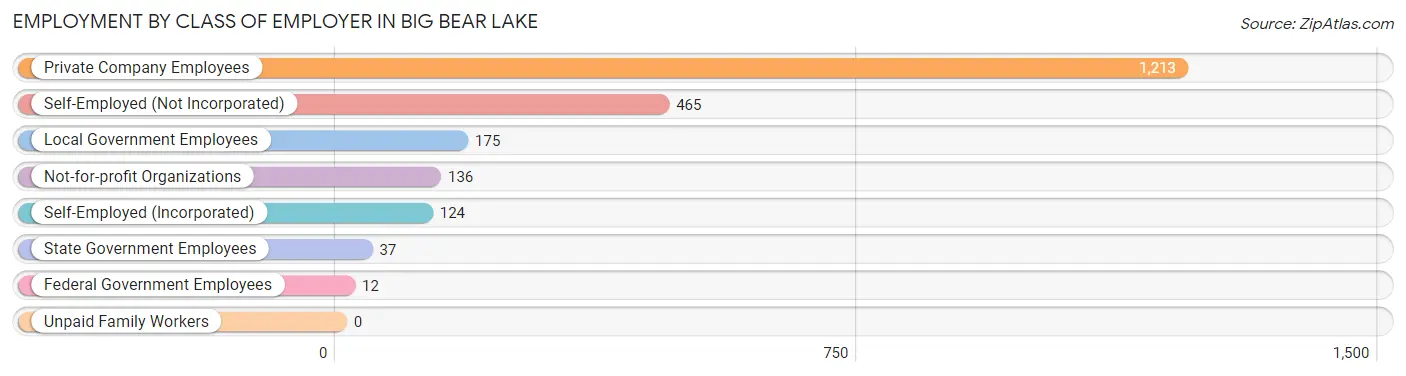
| Employer Class | # Employees | % Employees |
| Private Company Employees | 1,213 | 56.1% |
| Self-Employed (Incorporated) | 124 | 5.7% |
| Self-Employed (Not Incorporated) | 465 | 21.5% |
| Not-for-profit Organizations | 136 | 6.3% |
| Local Government Employees | 175 | 8.1% |
| State Government Employees | 37 | 1.7% |
| Federal Government Employees | 12 | 0.6% |
| Unpaid Family Workers | 0 | 0.0% |
| Total | 2,162 | 100.0% |
Employment Status by Age in Big Bear Lake
According to the labor force statistics for Big Bear Lake, out of the total population over 16 years of age (4,054), 57.2% or 2,319 individuals are in the labor force, with 6.0% or 139 of them unemployed. The age group with the highest labor force participation rate is 30 to 34 years, with 85.5% or 142 individuals in the labor force. Within the labor force, the 30 to 34 years age range has the highest percentage of unemployed individuals, with 15.5% or 22 of them being unemployed.
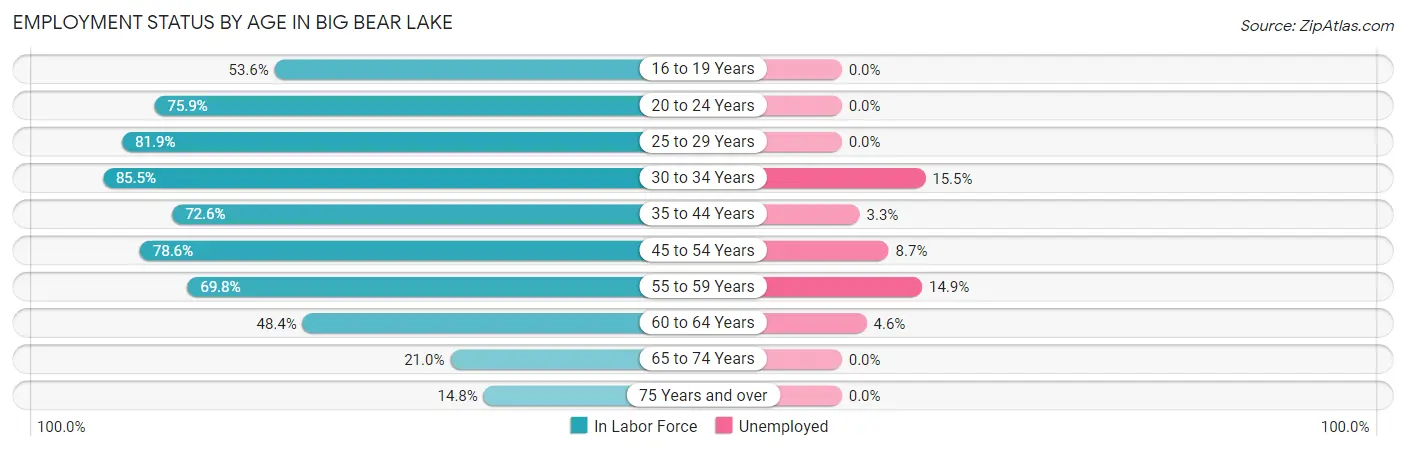
| Age Bracket | In Labor Force | Unemployed |
| 16 to 19 Years | 103 (53.6%) | 0 (0.0%) |
| 20 to 24 Years | 41 (75.9%) | 0 (0.0%) |
| 25 to 29 Years | 289 (81.9%) | 0 (0.0%) |
| 30 to 34 Years | 142 (85.5%) | 22 (15.5%) |
| 35 to 44 Years | 431 (72.6%) | 14 (3.3%) |
| 45 to 54 Years | 565 (78.6%) | 49 (8.7%) |
| 55 to 59 Years | 275 (69.8%) | 41 (14.9%) |
| 60 to 64 Years | 281 (48.4%) | 13 (4.6%) |
| 65 to 74 Years | 142 (21.0%) | 0 (0.0%) |
| 75 Years and over | 48 (14.8%) | 0 (0.0%) |
| Total | 2,319 (57.2%) | 139 (6.0%) |
Employment Status by Educational Attainment in Big Bear Lake
According to labor force statistics for Big Bear Lake, 70.7% of individuals (1,984) out of the total population between 25 and 64 years of age (2,806) are in the labor force, with 7.1% or 141 of them being unemployed. The group with the highest labor force participation rate are those with the educational attainment of less than high school, with 75.4% or 218 individuals in the labor force. Within the labor force, individuals with less than high school education have the highest percentage of unemployment, with 16.5% or 36 of them being unemployed.
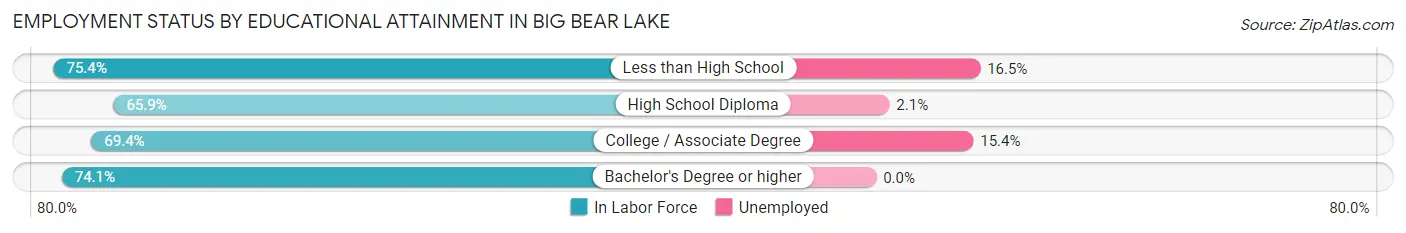
| Educational Attainment | In Labor Force | Unemployed |
| Less than High School | 218 (75.4%) | 48 (16.5%) |
| High School Diploma | 472 (65.9%) | 15 (2.1%) |
| College / Associate Degree | 616 (69.4%) | 137 (15.4%) |
| Bachelor's Degree or higher | 677 (74.1%) | 0 (0.0%) |
| Total | 1,984 (70.7%) | 199 (7.1%) |
Employment Occupations by Sex in Big Bear Lake
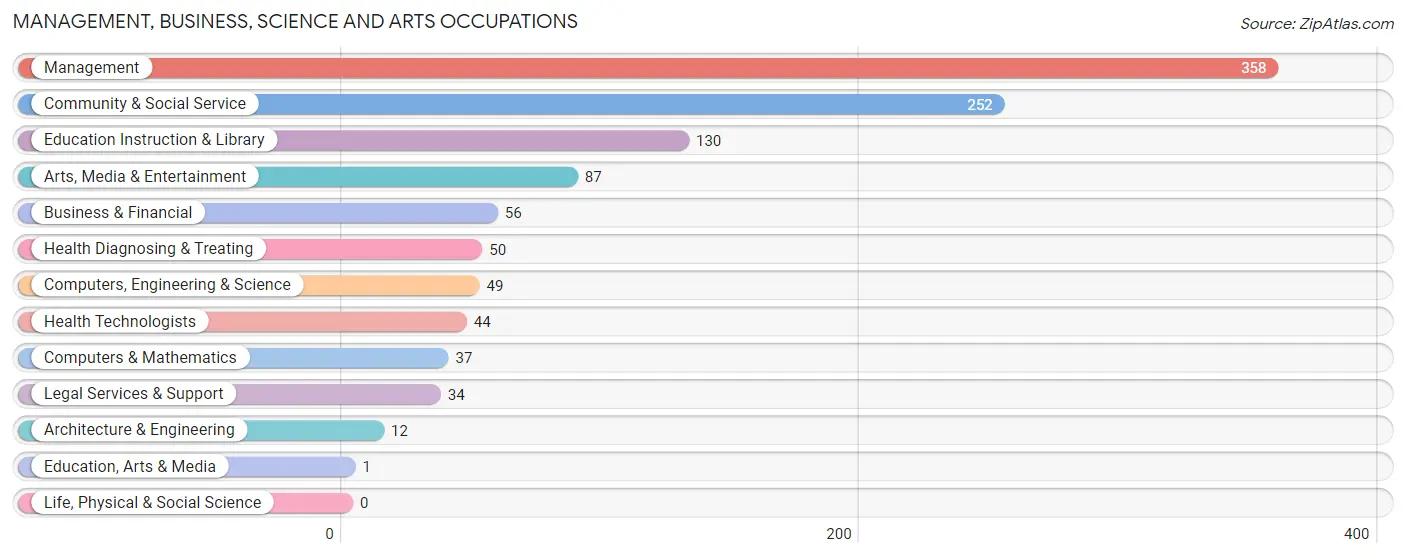
Management, Business, Science and Arts Occupations
The most common Management, Business, Science and Arts occupations in Big Bear Lake are Management (358 | 16.5%), Community & Social Service (252 | 11.6%), Education Instruction & Library (130 | 6.0%), Arts, Media & Entertainment (87 | 4.0%), and Business & Financial (56 | 2.6%).
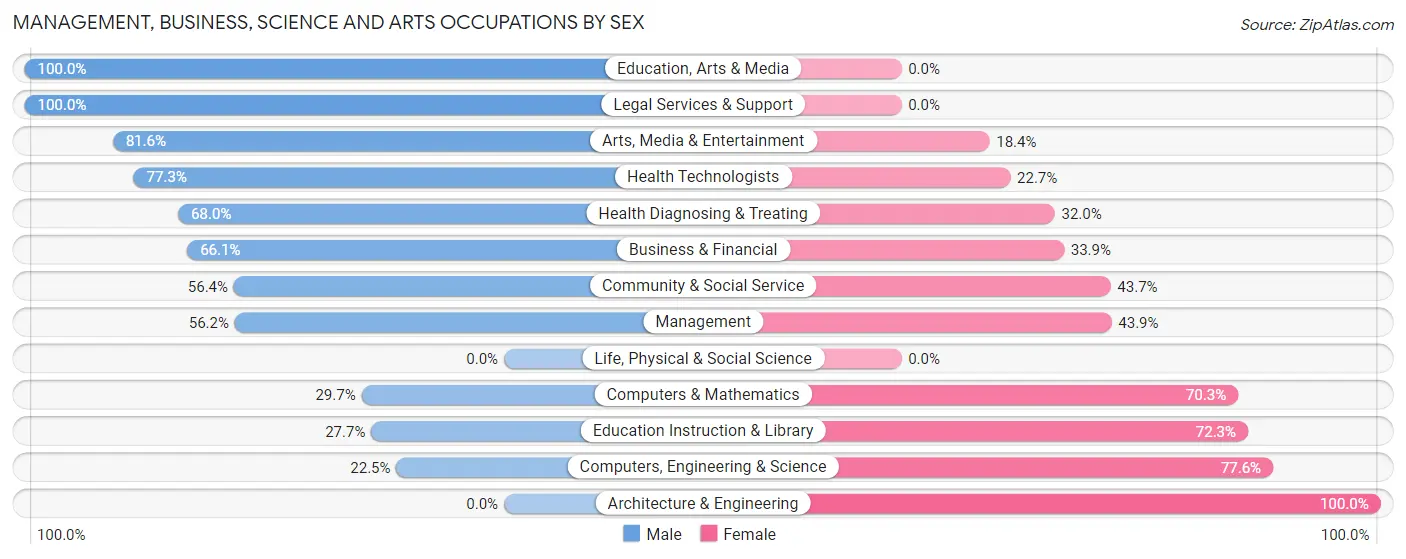
Management, Business, Science and Arts Occupations by Sex
Within the Management, Business, Science and Arts occupations in Big Bear Lake, the most male-oriented occupations are Education, Arts & Media (100.0%), Legal Services & Support (100.0%), and Arts, Media & Entertainment (81.6%), while the most female-oriented occupations are Architecture & Engineering (100.0%), Computers, Engineering & Science (77.5%), and Education Instruction & Library (72.3%).
| Occupation | Male | Female |
| Management | 201 (56.1%) | 157 (43.9%) |
| Business & Financial | 37 (66.1%) | 19 (33.9%) |
| Computers, Engineering & Science | 11 (22.5%) | 38 (77.5%) |
| Computers & Mathematics | 11 (29.7%) | 26 (70.3%) |
| Architecture & Engineering | 0 (0.0%) | 12 (100.0%) |
| Life, Physical & Social Science | 0 (0.0%) | 0 (0.0%) |
| Community & Social Service | 142 (56.4%) | 110 (43.6%) |
| Education, Arts & Media | 1 (100.0%) | 0 (0.0%) |
| Legal Services & Support | 34 (100.0%) | 0 (0.0%) |
| Education Instruction & Library | 36 (27.7%) | 94 (72.3%) |
| Arts, Media & Entertainment | 71 (81.6%) | 16 (18.4%) |
| Health Diagnosing & Treating | 34 (68.0%) | 16 (32.0%) |
| Health Technologists | 34 (77.3%) | 10 (22.7%) |
| Total (Category) | 425 (55.6%) | 340 (44.4%) |
| Total (Overall) | 1,261 (58.2%) | 905 (41.8%) |
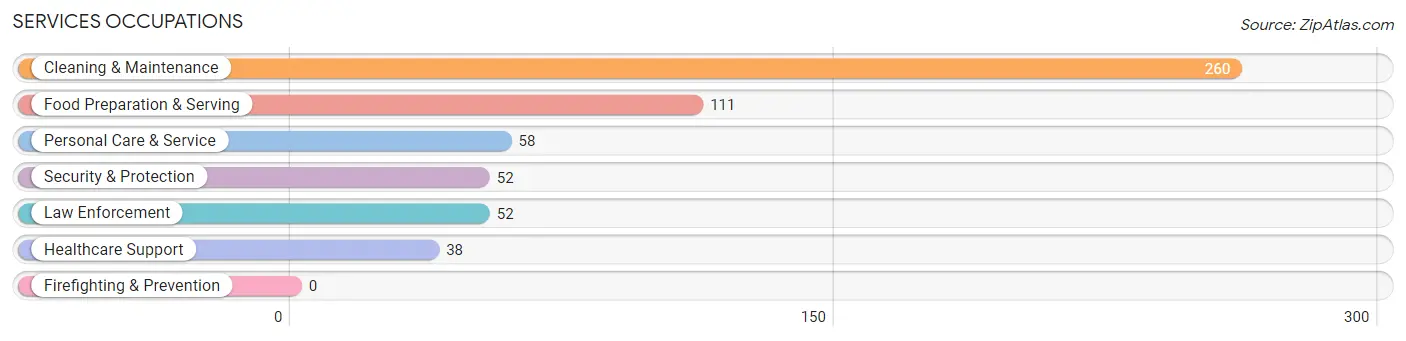
Services Occupations
The most common Services occupations in Big Bear Lake are Cleaning & Maintenance (260 | 12.0%), Food Preparation & Serving (111 | 5.1%), Personal Care & Service (58 | 2.7%), Security & Protection (52 | 2.4%), and Law Enforcement (52 | 2.4%).
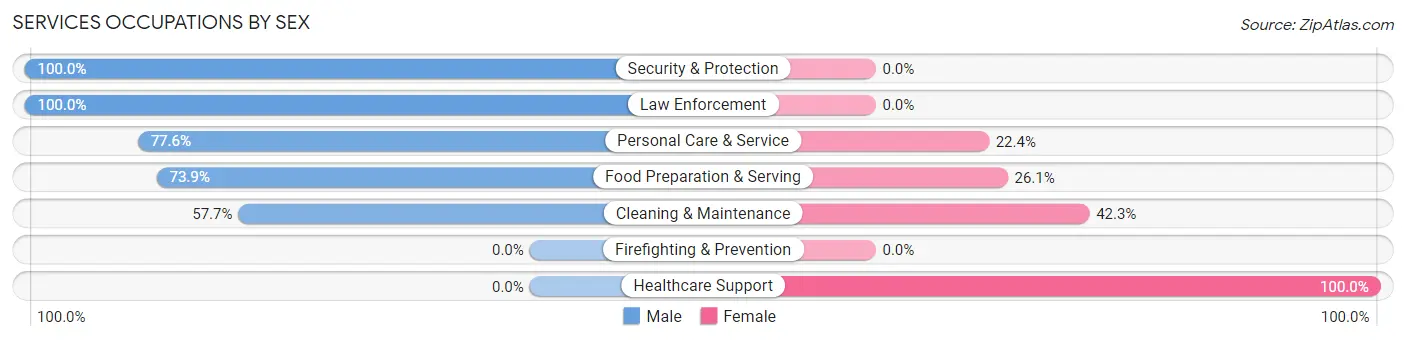
Services Occupations by Sex
Within the Services occupations in Big Bear Lake, the most male-oriented occupations are Security & Protection (100.0%), Law Enforcement (100.0%), and Personal Care & Service (77.6%), while the most female-oriented occupations are Healthcare Support (100.0%), Cleaning & Maintenance (42.3%), and Food Preparation & Serving (26.1%).
| Occupation | Male | Female |
| Healthcare Support | 0 (0.0%) | 38 (100.0%) |
| Security & Protection | 52 (100.0%) | 0 (0.0%) |
| Firefighting & Prevention | 0 (0.0%) | 0 (0.0%) |
| Law Enforcement | 52 (100.0%) | 0 (0.0%) |
| Food Preparation & Serving | 82 (73.9%) | 29 (26.1%) |
| Cleaning & Maintenance | 150 (57.7%) | 110 (42.3%) |
| Personal Care & Service | 45 (77.6%) | 13 (22.4%) |
| Total (Category) | 329 (63.4%) | 190 (36.6%) |
| Total (Overall) | 1,261 (58.2%) | 905 (41.8%) |
Sales and Office Occupations
The most common Sales and Office occupations in Big Bear Lake are Sales & Related (295 | 13.6%), and Office & Administration (258 | 11.9%).
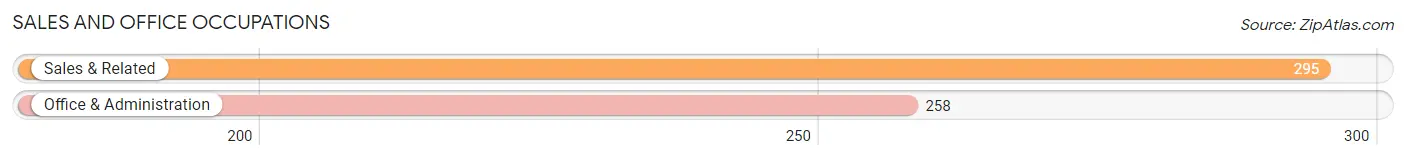
Sales and Office Occupations by Sex
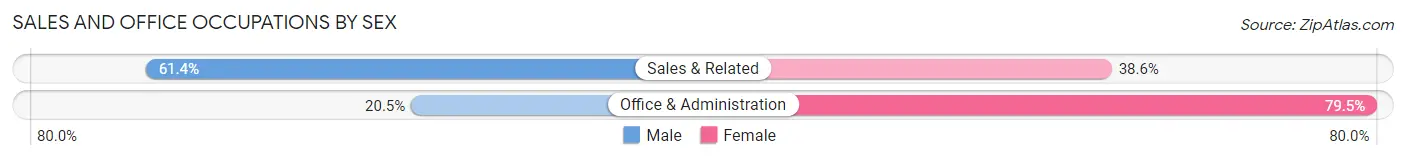
| Occupation | Male | Female |
| Sales & Related | 181 (61.4%) | 114 (38.6%) |
| Office & Administration | 53 (20.5%) | 205 (79.5%) |
| Total (Category) | 234 (42.3%) | 319 (57.7%) |
| Total (Overall) | 1,261 (58.2%) | 905 (41.8%) |
Natural Resources, Construction and Maintenance Occupations
The most common Natural Resources, Construction and Maintenance occupations in Big Bear Lake are Installation, Maintenance & Repair (62 | 2.9%), and Construction & Extraction (37 | 1.7%).
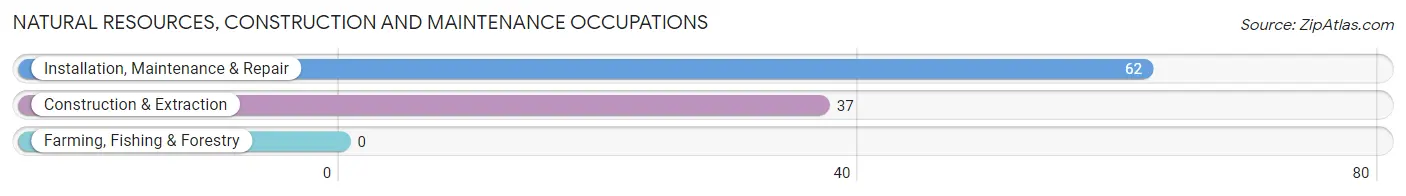
Natural Resources, Construction and Maintenance Occupations by Sex
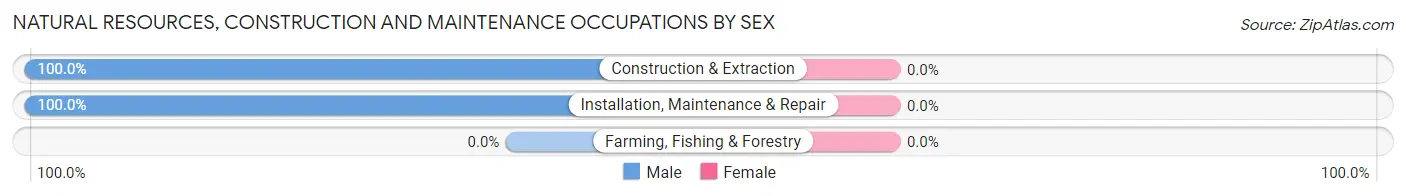
| Occupation | Male | Female |
| Farming, Fishing & Forestry | 0 (0.0%) | 0 (0.0%) |
| Construction & Extraction | 37 (100.0%) | 0 (0.0%) |
| Installation, Maintenance & Repair | 62 (100.0%) | 0 (0.0%) |
| Total (Category) | 99 (100.0%) | 0 (0.0%) |
| Total (Overall) | 1,261 (58.2%) | 905 (41.8%) |
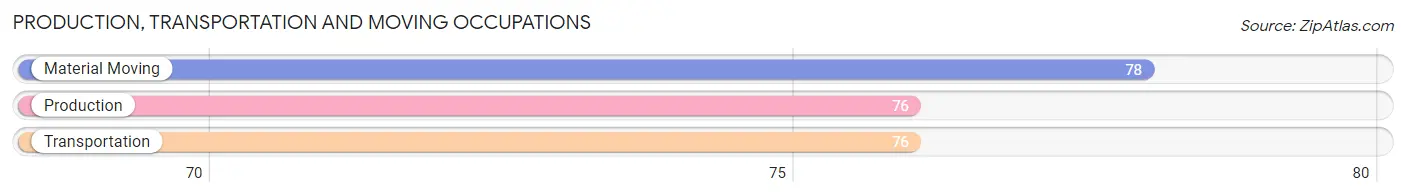
Production, Transportation and Moving Occupations
The most common Production, Transportation and Moving occupations in Big Bear Lake are Material Moving (78 | 3.6%), Production (76 | 3.5%), and Transportation (76 | 3.5%).
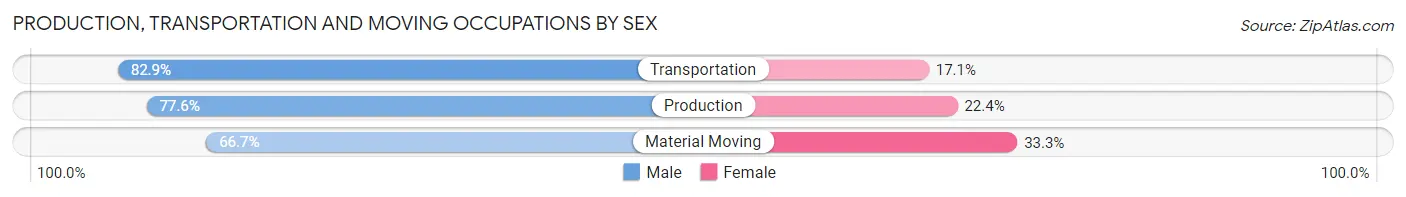
Production, Transportation and Moving Occupations by Sex
| Occupation | Male | Female |
| Production | 59 (77.6%) | 17 (22.4%) |
| Transportation | 63 (82.9%) | 13 (17.1%) |
| Material Moving | 52 (66.7%) | 26 (33.3%) |
| Total (Category) | 174 (75.6%) | 56 (24.3%) |
| Total (Overall) | 1,261 (58.2%) | 905 (41.8%) |
Employment Industries by Sex in Big Bear Lake
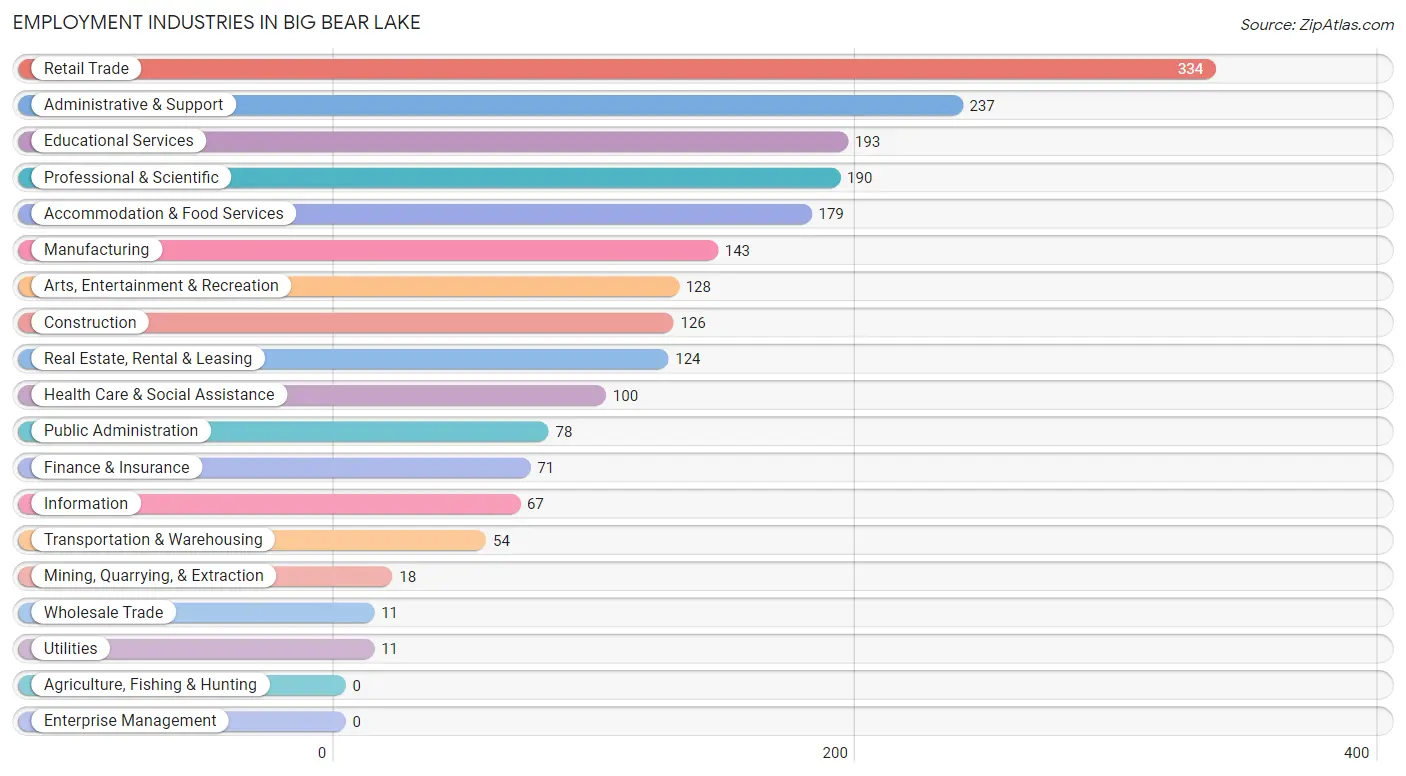
Employment Industries in Big Bear Lake
The major employment industries in Big Bear Lake include Retail Trade (334 | 15.4%), Administrative & Support (237 | 10.9%), Educational Services (193 | 8.9%), Professional & Scientific (190 | 8.8%), and Accommodation & Food Services (179 | 8.3%).
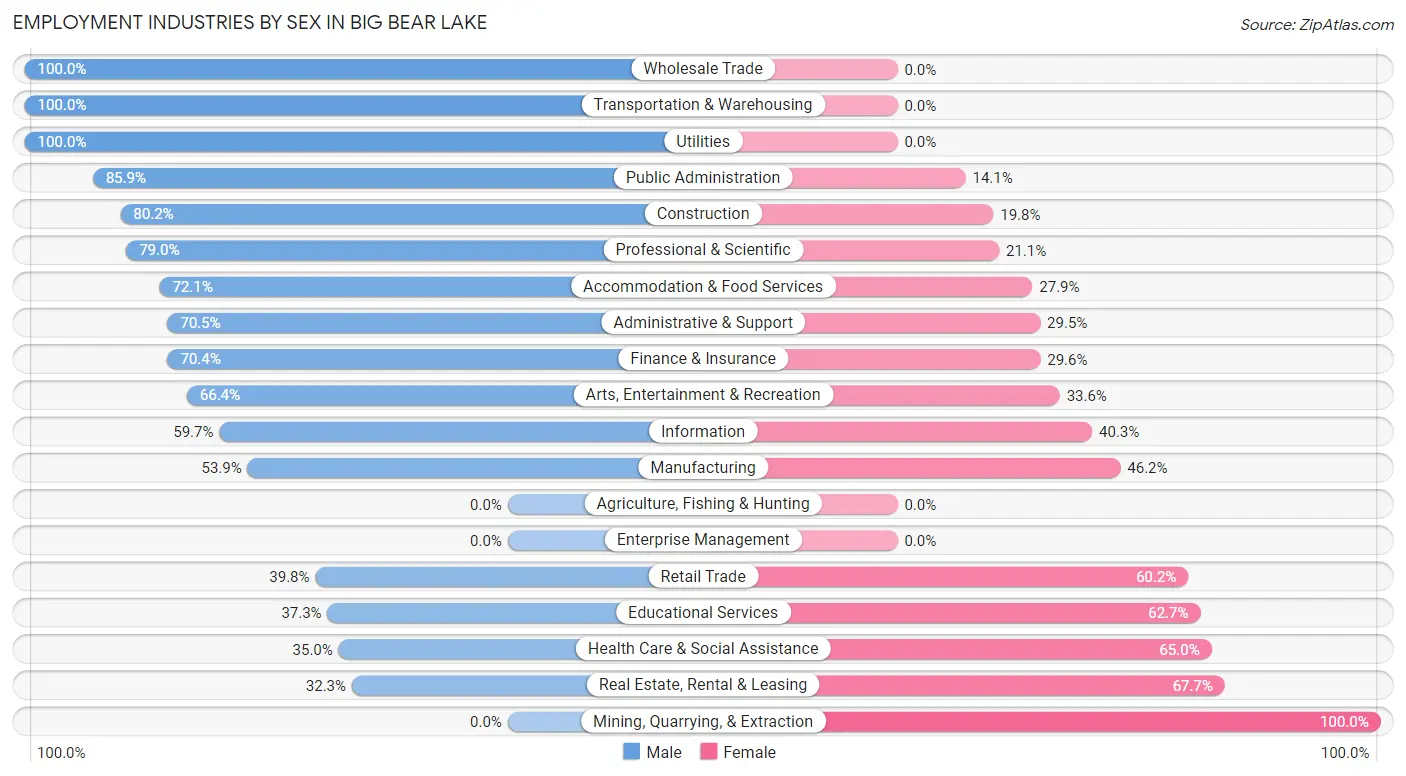
Employment Industries by Sex in Big Bear Lake
The Big Bear Lake industries that see more men than women are Wholesale Trade (100.0%), Transportation & Warehousing (100.0%), and Utilities (100.0%), whereas the industries that tend to have a higher number of women are Mining, Quarrying, & Extraction (100.0%), Real Estate, Rental & Leasing (67.7%), and Health Care & Social Assistance (65.0%).
| Industry | Male | Female |
| Agriculture, Fishing & Hunting | 0 (0.0%) | 0 (0.0%) |
| Mining, Quarrying, & Extraction | 0 (0.0%) | 18 (100.0%) |
| Construction | 101 (80.2%) | 25 (19.8%) |
| Manufacturing | 77 (53.8%) | 66 (46.2%) |
| Wholesale Trade | 11 (100.0%) | 0 (0.0%) |
| Retail Trade | 133 (39.8%) | 201 (60.2%) |
| Transportation & Warehousing | 54 (100.0%) | 0 (0.0%) |
| Utilities | 11 (100.0%) | 0 (0.0%) |
| Information | 40 (59.7%) | 27 (40.3%) |
| Finance & Insurance | 50 (70.4%) | 21 (29.6%) |
| Real Estate, Rental & Leasing | 40 (32.3%) | 84 (67.7%) |
| Professional & Scientific | 150 (78.9%) | 40 (21.0%) |
| Enterprise Management | 0 (0.0%) | 0 (0.0%) |
| Administrative & Support | 167 (70.5%) | 70 (29.5%) |
| Educational Services | 72 (37.3%) | 121 (62.7%) |
| Health Care & Social Assistance | 35 (35.0%) | 65 (65.0%) |
| Arts, Entertainment & Recreation | 85 (66.4%) | 43 (33.6%) |
| Accommodation & Food Services | 129 (72.1%) | 50 (27.9%) |
| Public Administration | 67 (85.9%) | 11 (14.1%) |
| Total | 1,261 (58.2%) | 905 (41.8%) |
Education in Big Bear Lake
School Enrollment in Big Bear Lake
The most common levels of schooling among the 1,050 students in Big Bear Lake are middle school (384 | 36.6%), elementary school (201 | 19.1%), and high school (181 | 17.2%).
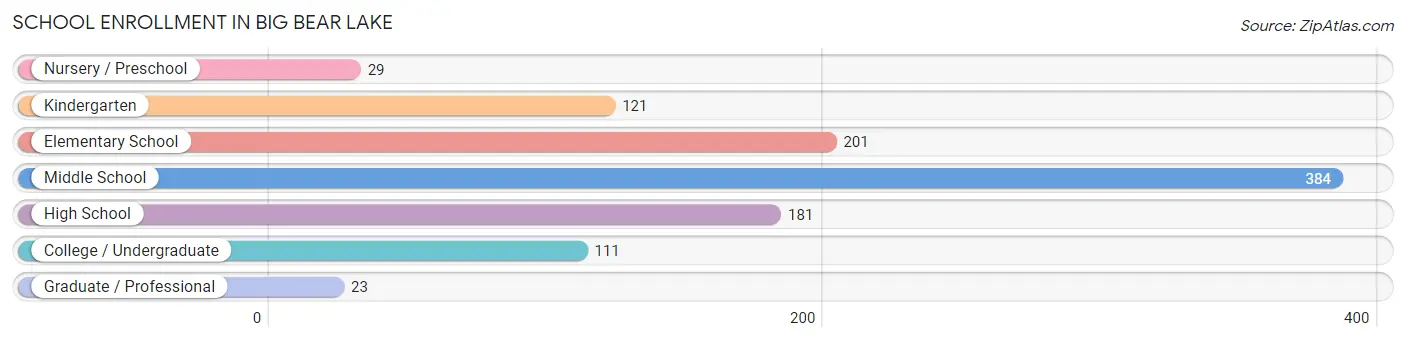
| School Level | # Students | % Students |
| Nursery / Preschool | 29 | 2.8% |
| Kindergarten | 121 | 11.5% |
| Elementary School | 201 | 19.1% |
| Middle School | 384 | 36.6% |
| High School | 181 | 17.2% |
| College / Undergraduate | 111 | 10.6% |
| Graduate / Professional | 23 | 2.2% |
| Total | 1,050 | 100.0% |
School Enrollment by Age by Funding Source in Big Bear Lake
Out of a total of 1,050 students who are enrolled in schools in Big Bear Lake, 43 (4.1%) attend a private institution, while the remaining 1,007 (95.9%) are enrolled in public schools. The age group of 35 years and over has the highest likelihood of being enrolled in private schools, with 9 (18.4% in the age bracket) enrolled. Conversely, the age group of 3 to 4 year olds has the lowest likelihood of being enrolled in a private school, with 29 (100.0% in the age bracket) attending a public institution.
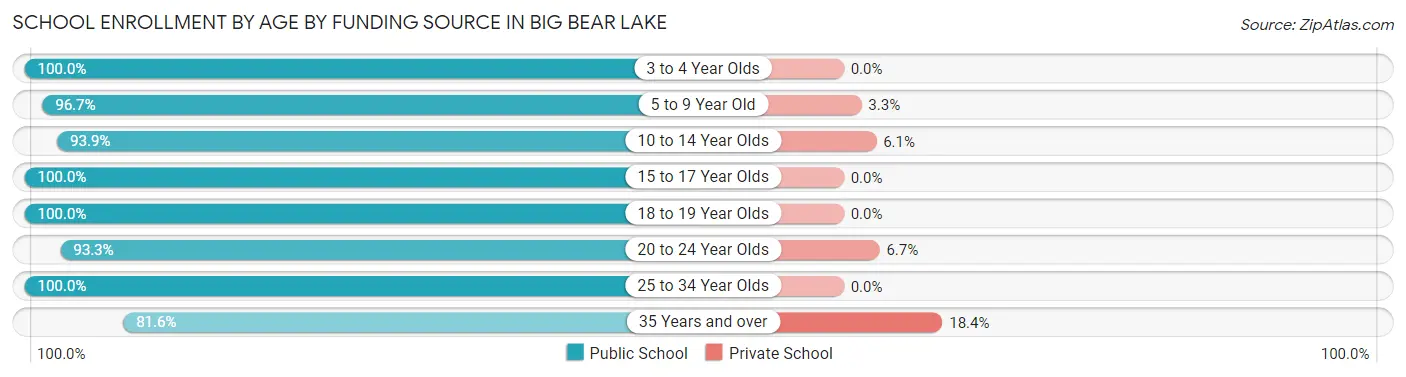
| Age Bracket | Public School | Private School |
| 3 to 4 Year Olds | 29 (100.0%) | 0 (0.0%) |
| 5 to 9 Year Old | 322 (96.7%) | 11 (3.3%) |
| 10 to 14 Year Olds | 341 (93.9%) | 22 (6.1%) |
| 15 to 17 Year Olds | 165 (100.0%) | 0 (0.0%) |
| 18 to 19 Year Olds | 39 (100.0%) | 0 (0.0%) |
| 20 to 24 Year Olds | 14 (93.3%) | 1 (6.7%) |
| 25 to 34 Year Olds | 57 (100.0%) | 0 (0.0%) |
| 35 Years and over | 40 (81.6%) | 9 (18.4%) |
| Total | 1,007 (95.9%) | 43 (4.1%) |
Educational Attainment by Field of Study in Big Bear Lake
Business (332 | 24.6%), science & technology (182 | 13.5%), education (150 | 11.1%), social sciences (123 | 9.1%), and arts & humanities (107 | 7.9%) are the most common fields of study among 1,350 individuals in Big Bear Lake who have obtained a bachelor's degree or higher.
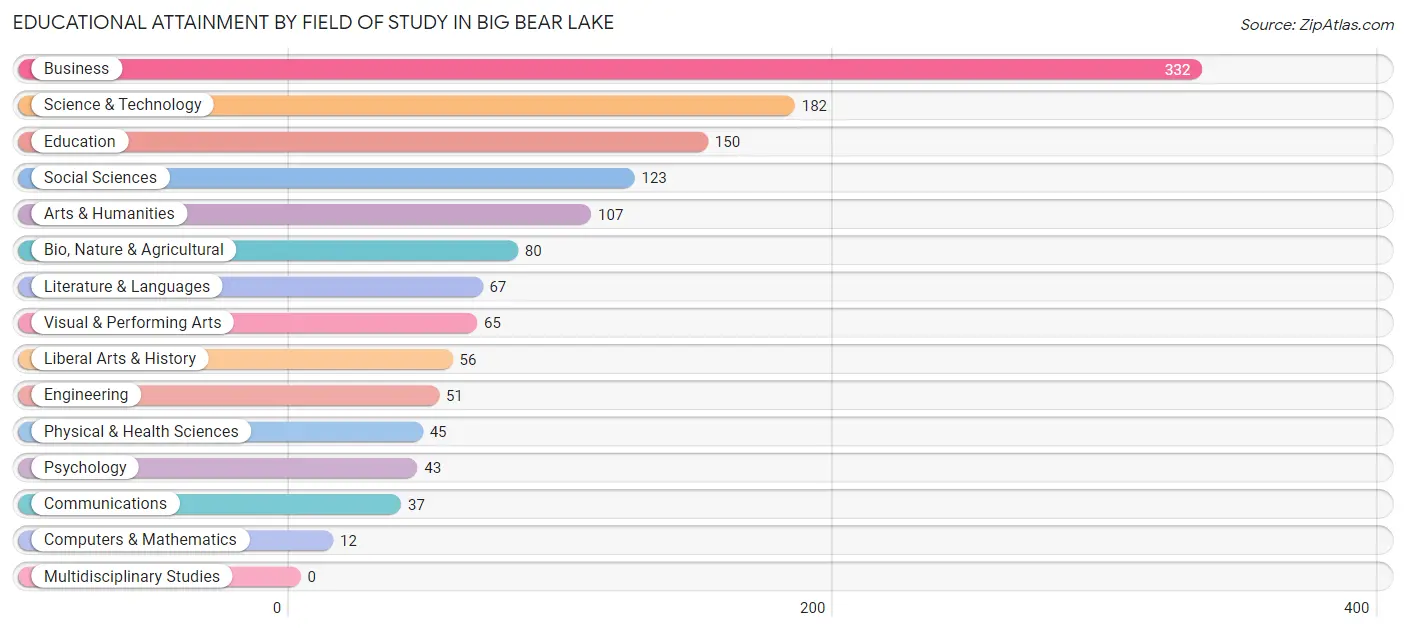
| Field of Study | # Graduates | % Graduates |
| Computers & Mathematics | 12 | 0.9% |
| Bio, Nature & Agricultural | 80 | 5.9% |
| Physical & Health Sciences | 45 | 3.3% |
| Psychology | 43 | 3.2% |
| Social Sciences | 123 | 9.1% |
| Engineering | 51 | 3.8% |
| Multidisciplinary Studies | 0 | 0.0% |
| Science & Technology | 182 | 13.5% |
| Business | 332 | 24.6% |
| Education | 150 | 11.1% |
| Literature & Languages | 67 | 5.0% |
| Liberal Arts & History | 56 | 4.2% |
| Visual & Performing Arts | 65 | 4.8% |
| Communications | 37 | 2.7% |
| Arts & Humanities | 107 | 7.9% |
| Total | 1,350 | 100.0% |
Transportation & Commute in Big Bear Lake
Vehicle Availability by Sex in Big Bear Lake
The most prevalent vehicle ownership categories in Big Bear Lake are males with 2 vehicles (522, accounting for 41.8%) and females with 2 vehicles (403, making up 57.3%).
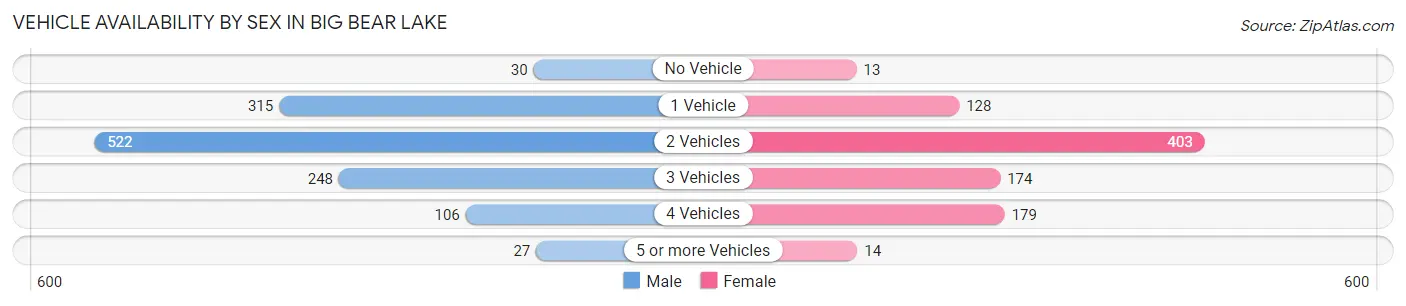
| Vehicles Available | Male | Female |
| No Vehicle | 30 (2.4%) | 13 (1.4%) |
| 1 Vehicle | 315 (25.2%) | 128 (14.1%) |
| 2 Vehicles | 522 (41.8%) | 403 (44.2%) |
| 3 Vehicles | 248 (19.9%) | 174 (19.1%) |
| 4 Vehicles | 106 (8.5%) | 179 (19.7%) |
| 5 or more Vehicles | 27 (2.2%) | 14 (1.5%) |
| Total | 1,248 (100.0%) | 911 (100.0%) |
Commute Time in Big Bear Lake
The most frequently occuring commute durations in Big Bear Lake are 5 to 9 minutes (792 commuters, 47.6%), 10 to 14 minutes (323 commuters, 19.4%), and 90 or more minutes (176 commuters, 10.6%).
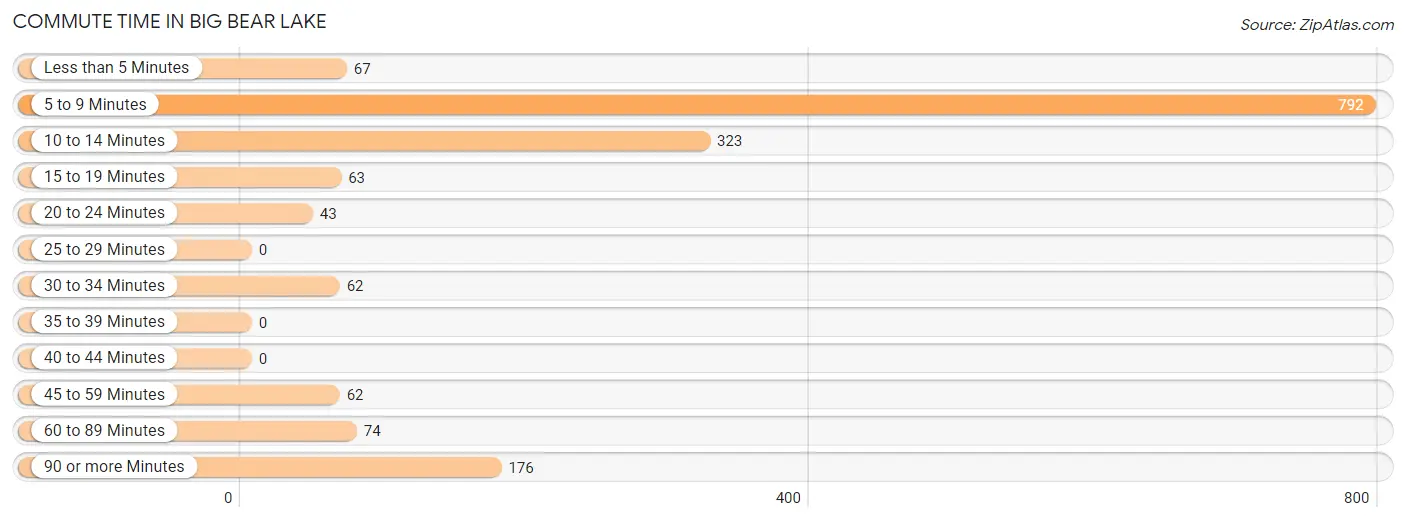
| Commute Time | # Commuters | % Commuters |
| Less than 5 Minutes | 67 | 4.0% |
| 5 to 9 Minutes | 792 | 47.6% |
| 10 to 14 Minutes | 323 | 19.4% |
| 15 to 19 Minutes | 63 | 3.8% |
| 20 to 24 Minutes | 43 | 2.6% |
| 25 to 29 Minutes | 0 | 0.0% |
| 30 to 34 Minutes | 62 | 3.7% |
| 35 to 39 Minutes | 0 | 0.0% |
| 40 to 44 Minutes | 0 | 0.0% |
| 45 to 59 Minutes | 62 | 3.7% |
| 60 to 89 Minutes | 74 | 4.4% |
| 90 or more Minutes | 176 | 10.6% |
Commute Time by Sex in Big Bear Lake
The most common commute times in Big Bear Lake are 5 to 9 minutes (426 commuters, 42.6%) for males and 5 to 9 minutes (366 commuters, 55.2%) for females.
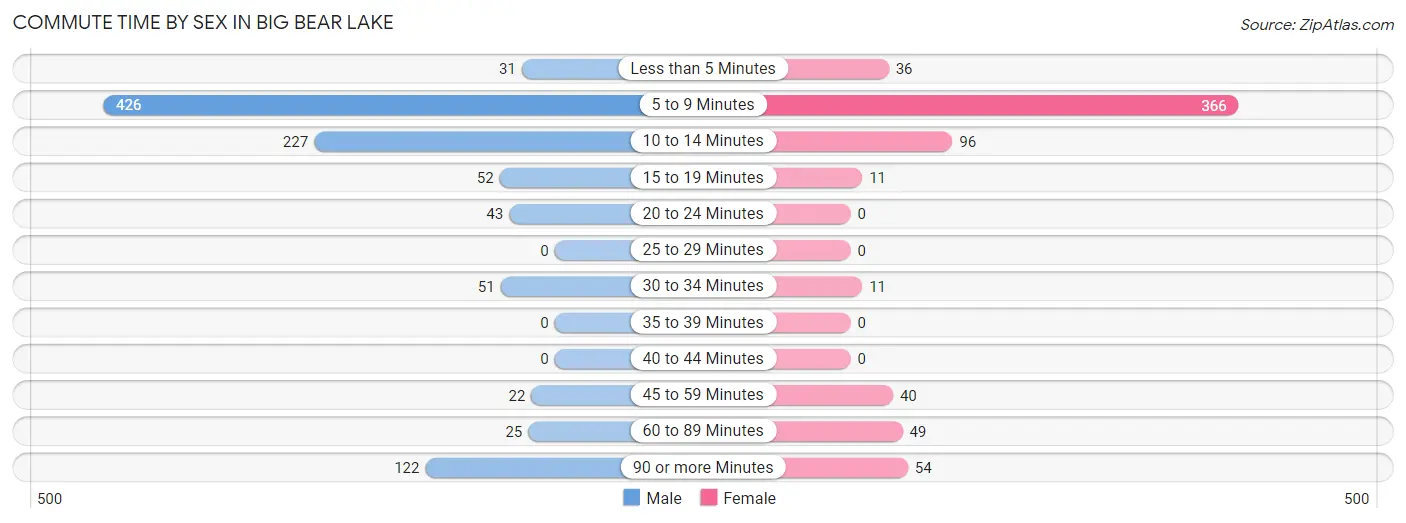
| Commute Time | Male | Female |
| Less than 5 Minutes | 31 (3.1%) | 36 (5.4%) |
| 5 to 9 Minutes | 426 (42.6%) | 366 (55.2%) |
| 10 to 14 Minutes | 227 (22.7%) | 96 (14.5%) |
| 15 to 19 Minutes | 52 (5.2%) | 11 (1.7%) |
| 20 to 24 Minutes | 43 (4.3%) | 0 (0.0%) |
| 25 to 29 Minutes | 0 (0.0%) | 0 (0.0%) |
| 30 to 34 Minutes | 51 (5.1%) | 11 (1.7%) |
| 35 to 39 Minutes | 0 (0.0%) | 0 (0.0%) |
| 40 to 44 Minutes | 0 (0.0%) | 0 (0.0%) |
| 45 to 59 Minutes | 22 (2.2%) | 40 (6.0%) |
| 60 to 89 Minutes | 25 (2.5%) | 49 (7.4%) |
| 90 or more Minutes | 122 (12.2%) | 54 (8.1%) |
Time of Departure to Work by Sex in Big Bear Lake
The most frequent times of departure to work in Big Bear Lake are 7:00 AM to 7:29 AM (275, 27.5%) for males and 7:30 AM to 7:59 AM (167, 25.2%) for females.
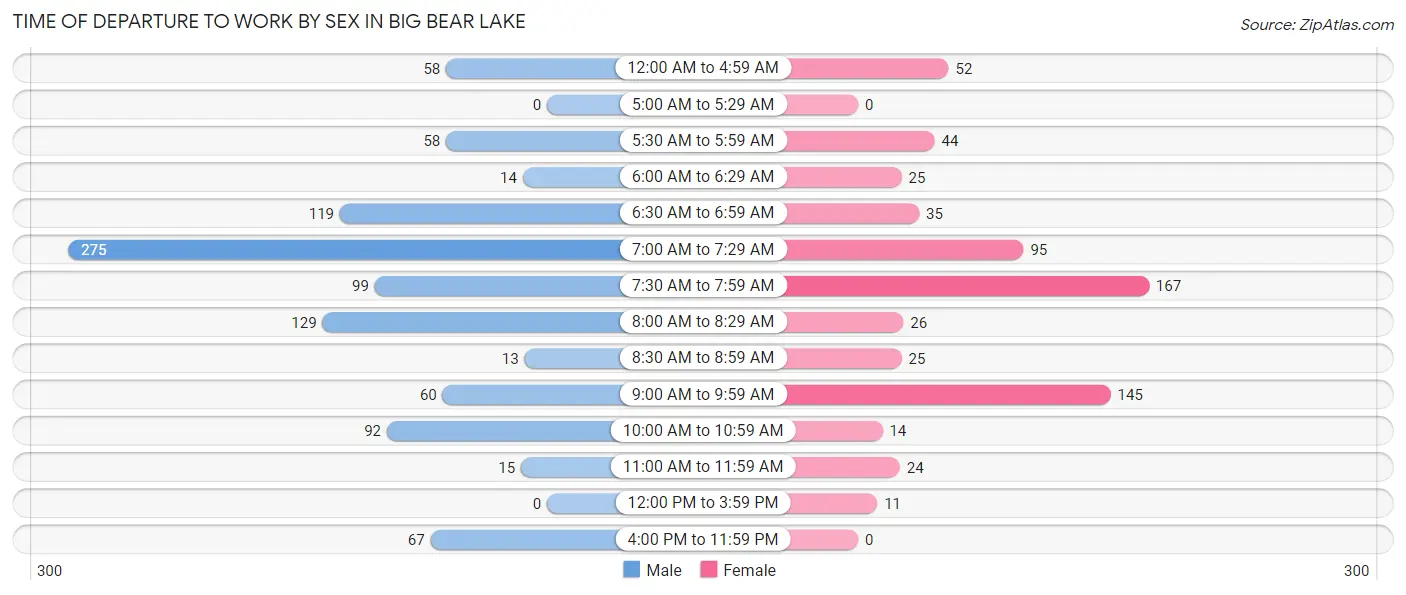
| Time of Departure | Male | Female |
| 12:00 AM to 4:59 AM | 58 (5.8%) | 52 (7.8%) |
| 5:00 AM to 5:29 AM | 0 (0.0%) | 0 (0.0%) |
| 5:30 AM to 5:59 AM | 58 (5.8%) | 44 (6.6%) |
| 6:00 AM to 6:29 AM | 14 (1.4%) | 25 (3.8%) |
| 6:30 AM to 6:59 AM | 119 (11.9%) | 35 (5.3%) |
| 7:00 AM to 7:29 AM | 275 (27.5%) | 95 (14.3%) |
| 7:30 AM to 7:59 AM | 99 (9.9%) | 167 (25.2%) |
| 8:00 AM to 8:29 AM | 129 (12.9%) | 26 (3.9%) |
| 8:30 AM to 8:59 AM | 13 (1.3%) | 25 (3.8%) |
| 9:00 AM to 9:59 AM | 60 (6.0%) | 145 (21.9%) |
| 10:00 AM to 10:59 AM | 92 (9.2%) | 14 (2.1%) |
| 11:00 AM to 11:59 AM | 15 (1.5%) | 24 (3.6%) |
| 12:00 PM to 3:59 PM | 0 (0.0%) | 11 (1.7%) |
| 4:00 PM to 11:59 PM | 67 (6.7%) | 0 (0.0%) |
| Total | 999 (100.0%) | 663 (100.0%) |
Housing Occupancy in Big Bear Lake
Occupancy by Ownership in Big Bear Lake
Of the total 2,171 dwellings in Big Bear Lake, owner-occupied units account for 1,421 (65.4%), while renter-occupied units make up 750 (34.5%).
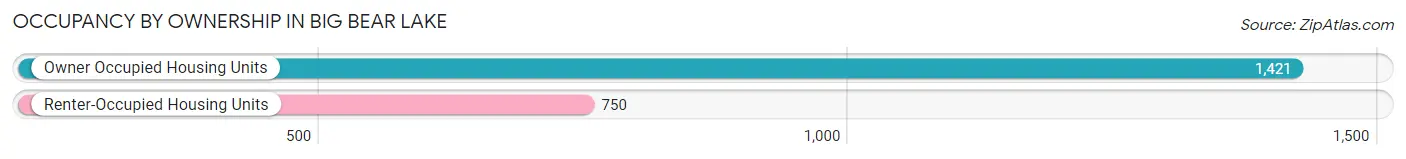
| Occupancy | # Housing Units | % Housing Units |
| Owner Occupied Housing Units | 1,421 | 65.4% |
| Renter-Occupied Housing Units | 750 | 34.5% |
| Total Occupied Housing Units | 2,171 | 100.0% |
Occupancy by Household Size in Big Bear Lake
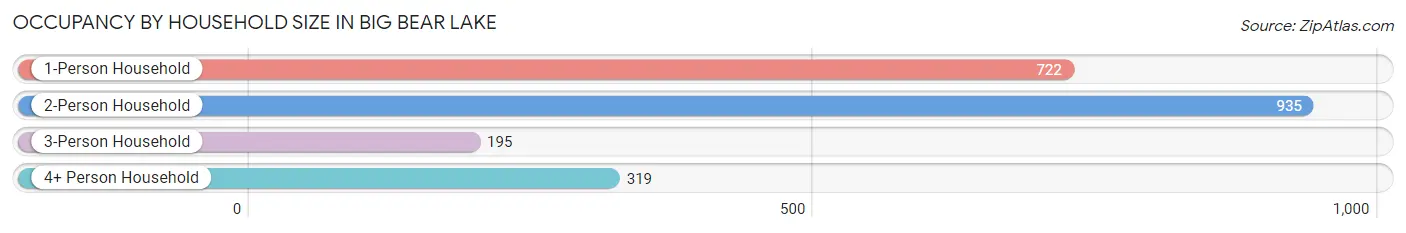
| Household Size | # Housing Units | % Housing Units |
| 1-Person Household | 722 | 33.3% |
| 2-Person Household | 935 | 43.1% |
| 3-Person Household | 195 | 9.0% |
| 4+ Person Household | 319 | 14.7% |
| Total Housing Units | 2,171 | 100.0% |
Occupancy by Ownership by Household Size in Big Bear Lake
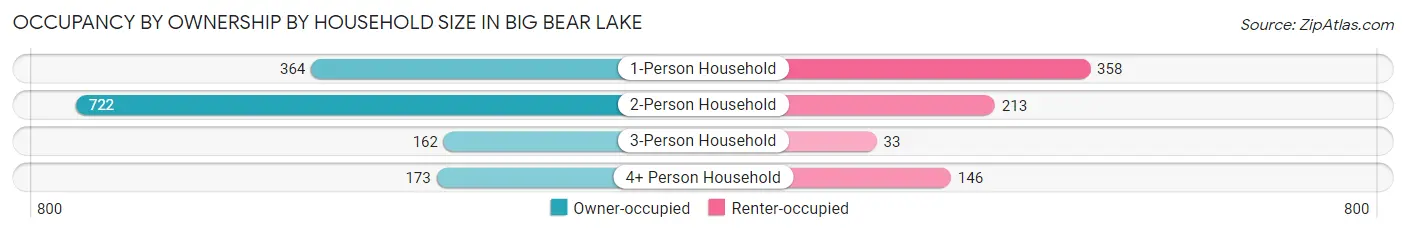
| Household Size | Owner-occupied | Renter-occupied |
| 1-Person Household | 364 (50.4%) | 358 (49.6%) |
| 2-Person Household | 722 (77.2%) | 213 (22.8%) |
| 3-Person Household | 162 (83.1%) | 33 (16.9%) |
| 4+ Person Household | 173 (54.2%) | 146 (45.8%) |
| Total Housing Units | 1,421 (65.4%) | 750 (34.5%) |
Occupancy by Educational Attainment in Big Bear Lake
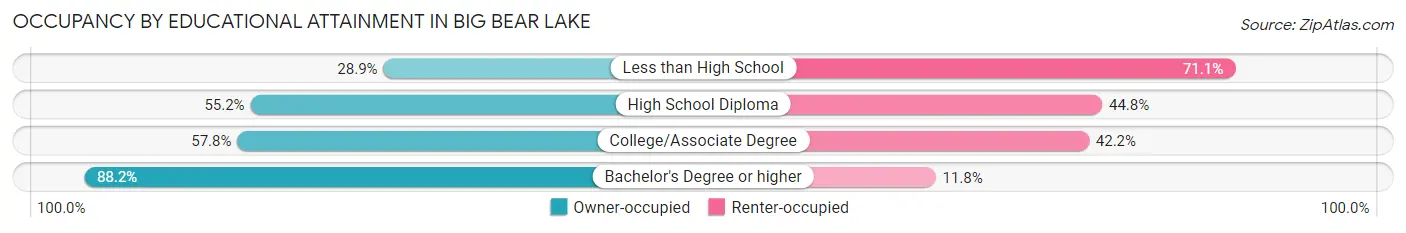
| Household Size | Owner-occupied | Renter-occupied |
| Less than High School | 58 (28.9%) | 143 (71.1%) |
| High School Diploma | 238 (55.2%) | 193 (44.8%) |
| College/Associate Degree | 443 (57.8%) | 323 (42.2%) |
| Bachelor's Degree or higher | 682 (88.2%) | 91 (11.8%) |
Occupancy by Age of Householder in Big Bear Lake
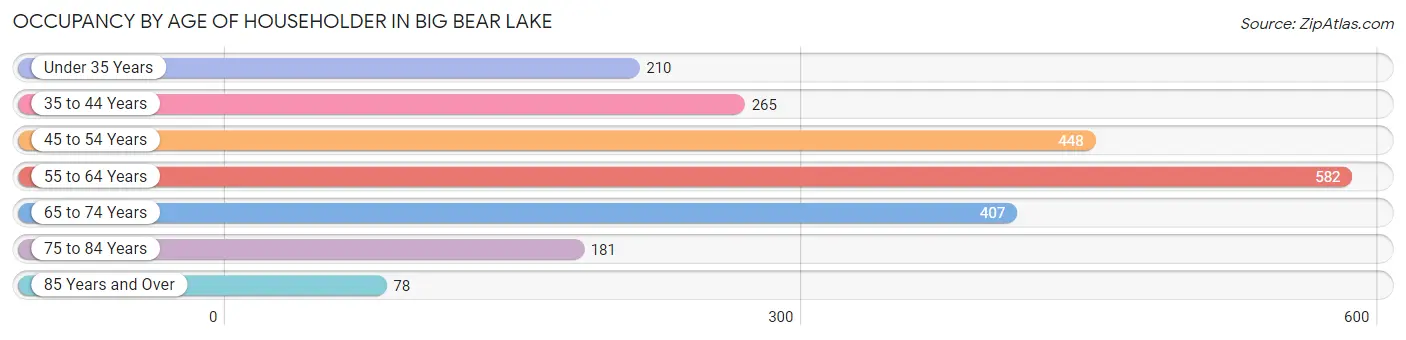
| Age Bracket | # Households | % Households |
| Under 35 Years | 210 | 9.7% |
| 35 to 44 Years | 265 | 12.2% |
| 45 to 54 Years | 448 | 20.6% |
| 55 to 64 Years | 582 | 26.8% |
| 65 to 74 Years | 407 | 18.8% |
| 75 to 84 Years | 181 | 8.3% |
| 85 Years and Over | 78 | 3.6% |
| Total | 2,171 | 100.0% |
Housing Finances in Big Bear Lake
Median Income by Occupancy in Big Bear Lake
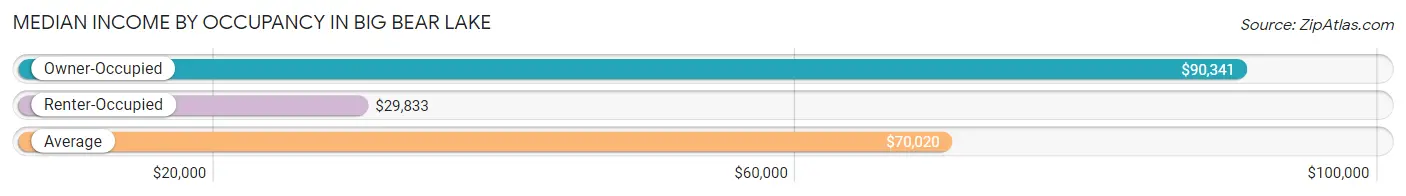
| Occupancy Type | # Households | Median Income |
| Owner-Occupied | 1,421 (65.4%) | $90,341 |
| Renter-Occupied | 750 (34.5%) | $29,833 |
| Average | 2,171 (100.0%) | $70,020 |
Occupancy by Householder Income Bracket in Big Bear Lake
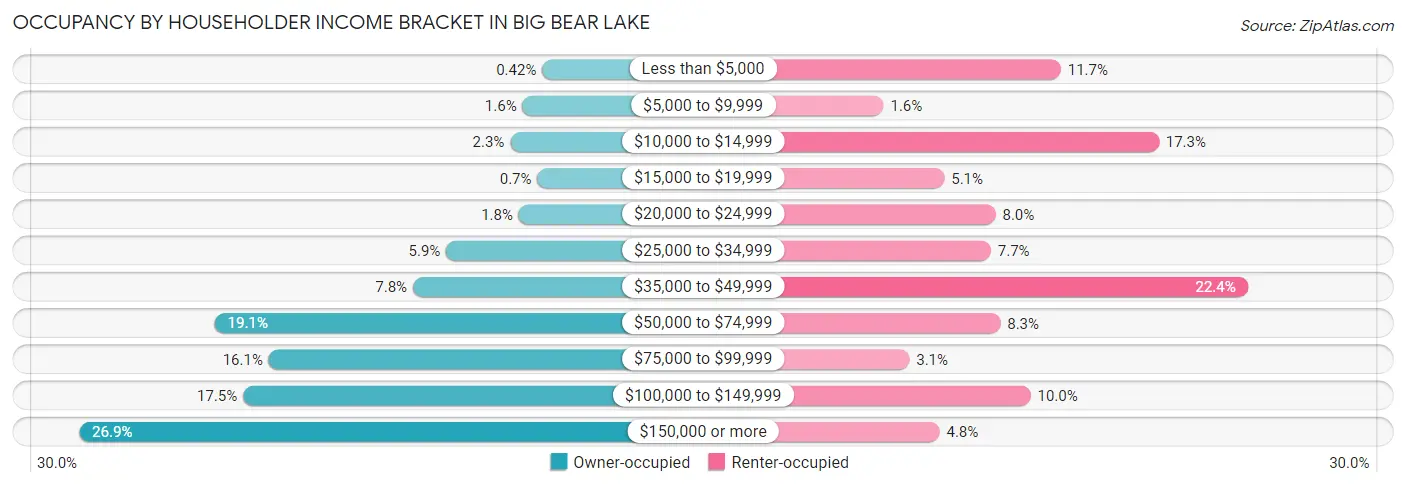
| Income Bracket | Owner-occupied | Renter-occupied |
| Less than $5,000 | 6 (0.4%) | 88 (11.7%) |
| $5,000 to $9,999 | 22 (1.5%) | 12 (1.6%) |
| $10,000 to $14,999 | 32 (2.2%) | 130 (17.3%) |
| $15,000 to $19,999 | 10 (0.7%) | 38 (5.1%) |
| $20,000 to $24,999 | 25 (1.8%) | 60 (8.0%) |
| $25,000 to $34,999 | 84 (5.9%) | 58 (7.7%) |
| $35,000 to $49,999 | 111 (7.8%) | 168 (22.4%) |
| $50,000 to $74,999 | 272 (19.1%) | 62 (8.3%) |
| $75,000 to $99,999 | 228 (16.1%) | 23 (3.1%) |
| $100,000 to $149,999 | 249 (17.5%) | 75 (10.0%) |
| $150,000 or more | 382 (26.9%) | 36 (4.8%) |
| Total | 1,421 (100.0%) | 750 (100.0%) |
Monthly Housing Cost Tiers in Big Bear Lake
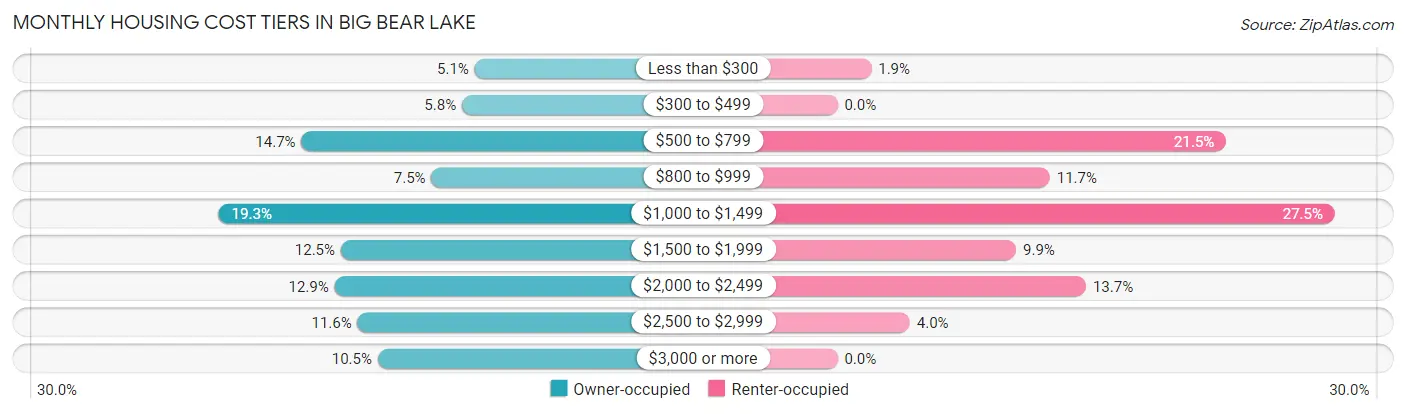
| Monthly Cost | Owner-occupied | Renter-occupied |
| Less than $300 | 73 (5.1%) | 14 (1.9%) |
| $300 to $499 | 83 (5.8%) | 0 (0.0%) |
| $500 to $799 | 209 (14.7%) | 161 (21.5%) |
| $800 to $999 | 107 (7.5%) | 88 (11.7%) |
| $1,000 to $1,499 | 274 (19.3%) | 206 (27.5%) |
| $1,500 to $1,999 | 178 (12.5%) | 74 (9.9%) |
| $2,000 to $2,499 | 183 (12.9%) | 103 (13.7%) |
| $2,500 to $2,999 | 165 (11.6%) | 30 (4.0%) |
| $3,000 or more | 149 (10.5%) | 0 (0.0%) |
| Total | 1,421 (100.0%) | 750 (100.0%) |
Physical Housing Characteristics in Big Bear Lake
Housing Structures in Big Bear Lake
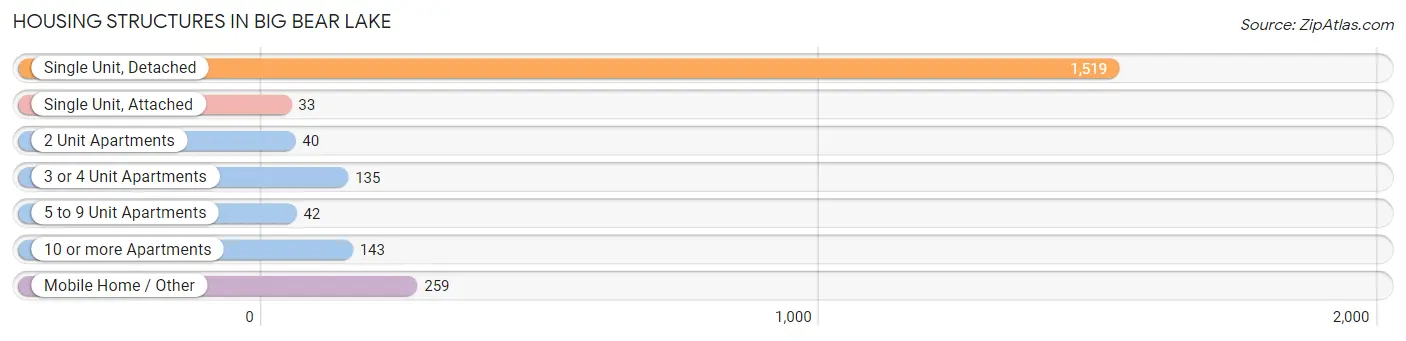
| Structure Type | # Housing Units | % Housing Units |
| Single Unit, Detached | 1,519 | 70.0% |
| Single Unit, Attached | 33 | 1.5% |
| 2 Unit Apartments | 40 | 1.8% |
| 3 or 4 Unit Apartments | 135 | 6.2% |
| 5 to 9 Unit Apartments | 42 | 1.9% |
| 10 or more Apartments | 143 | 6.6% |
| Mobile Home / Other | 259 | 11.9% |
| Total | 2,171 | 100.0% |
Housing Structures by Occupancy in Big Bear Lake
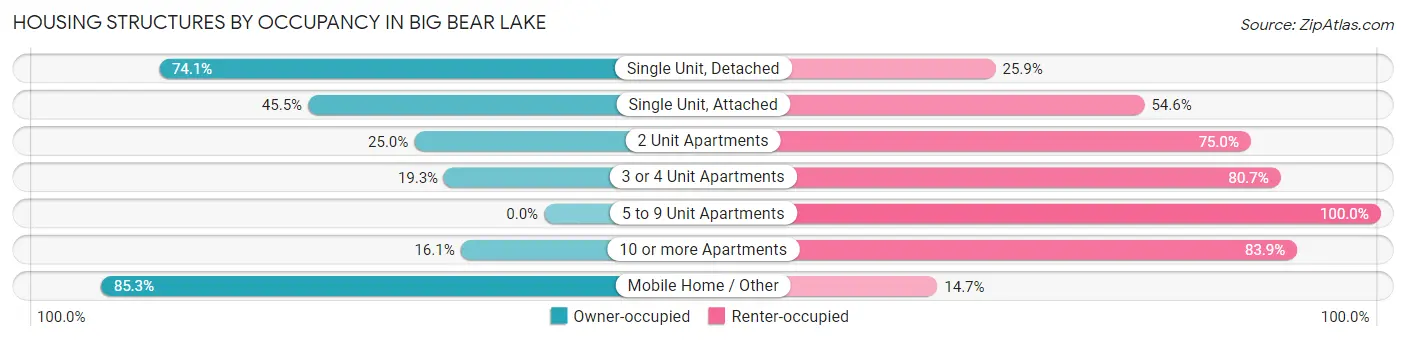
| Structure Type | Owner-occupied | Renter-occupied |
| Single Unit, Detached | 1,126 (74.1%) | 393 (25.9%) |
| Single Unit, Attached | 15 (45.5%) | 18 (54.5%) |
| 2 Unit Apartments | 10 (25.0%) | 30 (75.0%) |
| 3 or 4 Unit Apartments | 26 (19.3%) | 109 (80.7%) |
| 5 to 9 Unit Apartments | 0 (0.0%) | 42 (100.0%) |
| 10 or more Apartments | 23 (16.1%) | 120 (83.9%) |
| Mobile Home / Other | 221 (85.3%) | 38 (14.7%) |
| Total | 1,421 (65.4%) | 750 (34.5%) |
Housing Structures by Number of Rooms in Big Bear Lake
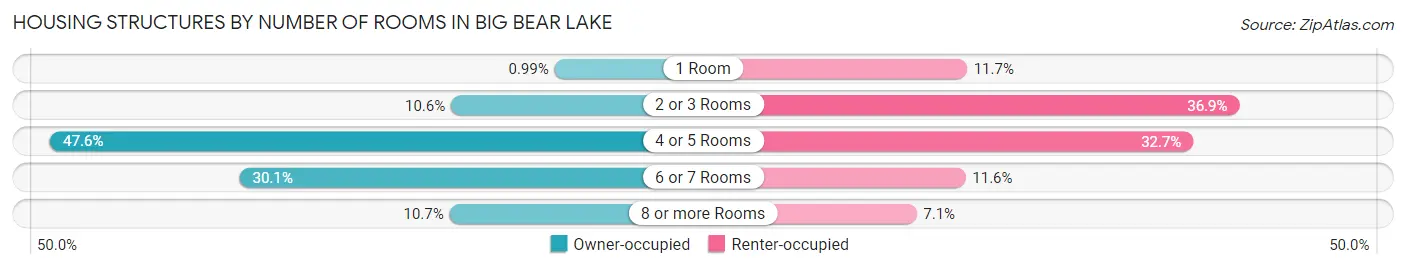
| Number of Rooms | Owner-occupied | Renter-occupied |
| 1 Room | 14 (1.0%) | 88 (11.7%) |
| 2 or 3 Rooms | 150 (10.6%) | 277 (36.9%) |
| 4 or 5 Rooms | 677 (47.6%) | 245 (32.7%) |
| 6 or 7 Rooms | 428 (30.1%) | 87 (11.6%) |
| 8 or more Rooms | 152 (10.7%) | 53 (7.1%) |
| Total | 1,421 (100.0%) | 750 (100.0%) |
Housing Structure by Heating Type in Big Bear Lake
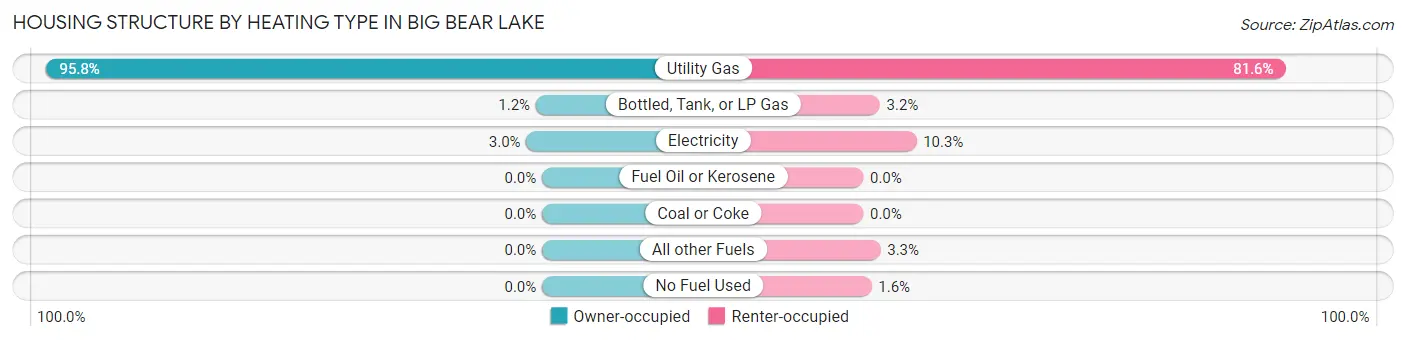
| Heating Type | Owner-occupied | Renter-occupied |
| Utility Gas | 1,361 (95.8%) | 612 (81.6%) |
| Bottled, Tank, or LP Gas | 17 (1.2%) | 24 (3.2%) |
| Electricity | 43 (3.0%) | 77 (10.3%) |
| Fuel Oil or Kerosene | 0 (0.0%) | 0 (0.0%) |
| Coal or Coke | 0 (0.0%) | 0 (0.0%) |
| All other Fuels | 0 (0.0%) | 25 (3.3%) |
| No Fuel Used | 0 (0.0%) | 12 (1.6%) |
| Total | 1,421 (100.0%) | 750 (100.0%) |
Household Vehicle Usage in Big Bear Lake
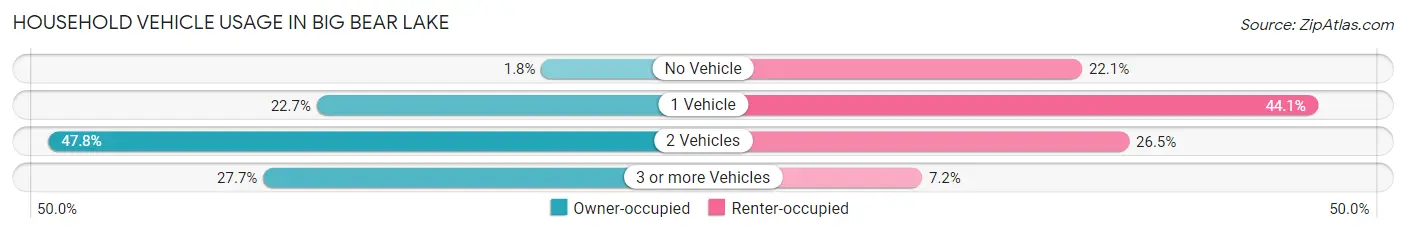
| Vehicles per Household | Owner-occupied | Renter-occupied |
| No Vehicle | 25 (1.8%) | 166 (22.1%) |
| 1 Vehicle | 323 (22.7%) | 331 (44.1%) |
| 2 Vehicles | 679 (47.8%) | 199 (26.5%) |
| 3 or more Vehicles | 394 (27.7%) | 54 (7.2%) |
| Total | 1,421 (100.0%) | 750 (100.0%) |
Real Estate & Mortgages in Big Bear Lake
Real Estate and Mortgage Overview in Big Bear Lake
| Characteristic | Without Mortgage | With Mortgage |
| Housing Units | 519 | 902 |
| Median Property Value | $399,300 | $555,700 |
| Median Household Income | $64,010 | $346 |
| Monthly Housing Costs | $702 | $149 |
| Real Estate Taxes | $3,071 | $0 |
Property Value by Mortgage Status in Big Bear Lake
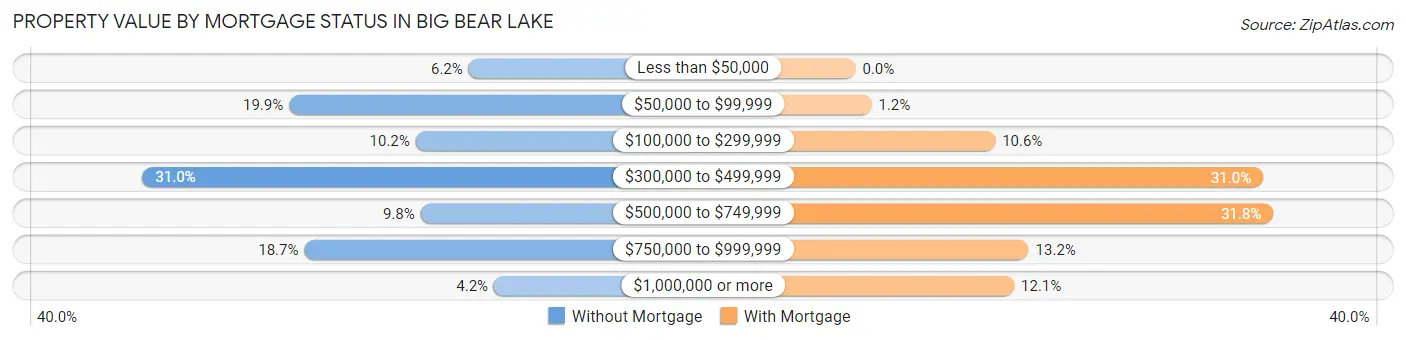
| Property Value | Without Mortgage | With Mortgage |
| Less than $50,000 | 32 (6.2%) | 0 (0.0%) |
| $50,000 to $99,999 | 103 (19.9%) | 11 (1.2%) |
| $100,000 to $299,999 | 53 (10.2%) | 96 (10.6%) |
| $300,000 to $499,999 | 161 (31.0%) | 280 (31.0%) |
| $500,000 to $749,999 | 51 (9.8%) | 287 (31.8%) |
| $750,000 to $999,999 | 97 (18.7%) | 119 (13.2%) |
| $1,000,000 or more | 22 (4.2%) | 109 (12.1%) |
| Total | 519 (100.0%) | 902 (100.0%) |
Household Income by Mortgage Status in Big Bear Lake
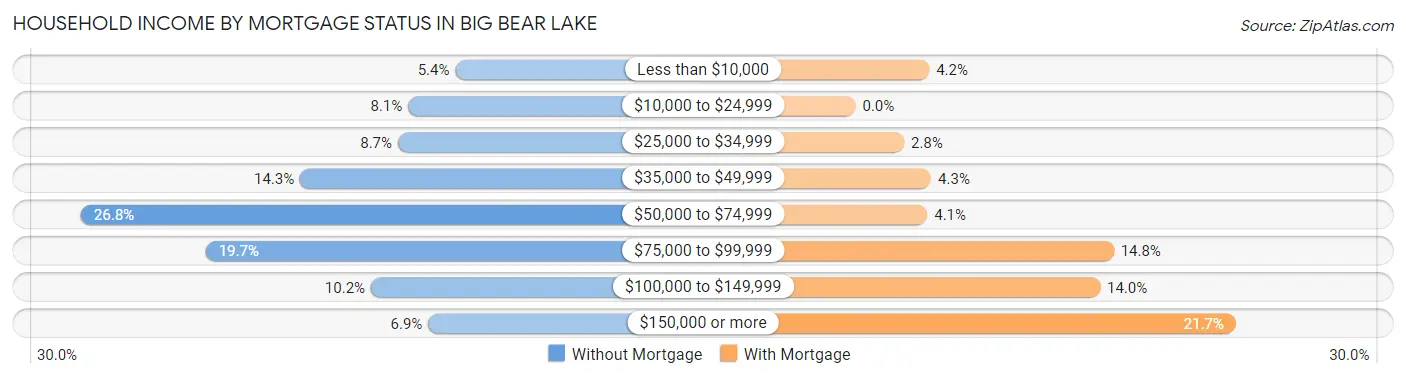
| Household Income | Without Mortgage | With Mortgage |
| Less than $10,000 | 28 (5.4%) | 38 (4.2%) |
| $10,000 to $24,999 | 42 (8.1%) | 0 (0.0%) |
| $25,000 to $34,999 | 45 (8.7%) | 25 (2.8%) |
| $35,000 to $49,999 | 74 (14.3%) | 39 (4.3%) |
| $50,000 to $74,999 | 139 (26.8%) | 37 (4.1%) |
| $75,000 to $99,999 | 102 (19.7%) | 133 (14.7%) |
| $100,000 to $149,999 | 53 (10.2%) | 126 (14.0%) |
| $150,000 or more | 36 (6.9%) | 196 (21.7%) |
| Total | 519 (100.0%) | 902 (100.0%) |
Property Value to Household Income Ratio in Big Bear Lake
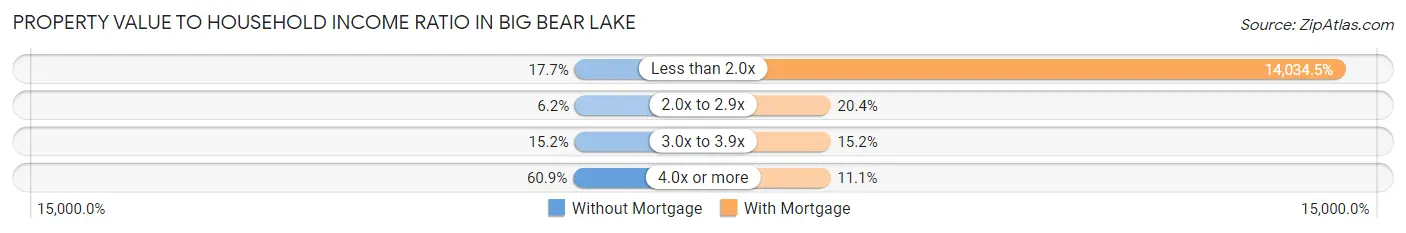
| Value-to-Income Ratio | Without Mortgage | With Mortgage |
| Less than 2.0x | 92 (17.7%) | 126,591 (14,034.5%) |
| 2.0x to 2.9x | 32 (6.2%) | 184 (20.4%) |
| 3.0x to 3.9x | 79 (15.2%) | 137 (15.2%) |
| 4.0x or more | 316 (60.9%) | 100 (11.1%) |
| Total | 519 (100.0%) | 902 (100.0%) |
Real Estate Taxes by Mortgage Status in Big Bear Lake
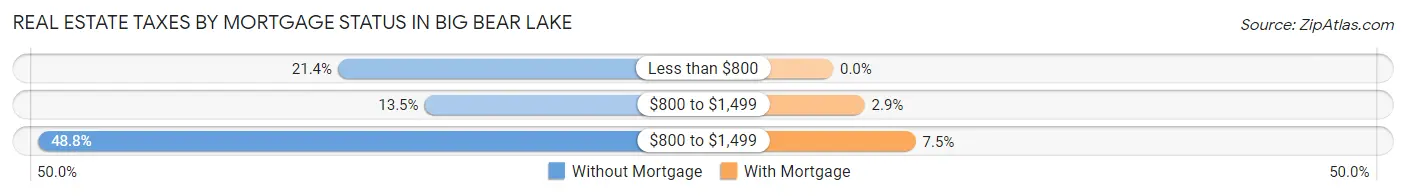
| Property Taxes | Without Mortgage | With Mortgage |
| Less than $800 | 111 (21.4%) | 0 (0.0%) |
| $800 to $1,499 | 70 (13.5%) | 26 (2.9%) |
| $800 to $1,499 | 253 (48.7%) | 68 (7.5%) |
| Total | 519 (100.0%) | 902 (100.0%) |
Health & Disability in Big Bear Lake
Health Insurance Coverage by Age in Big Bear Lake
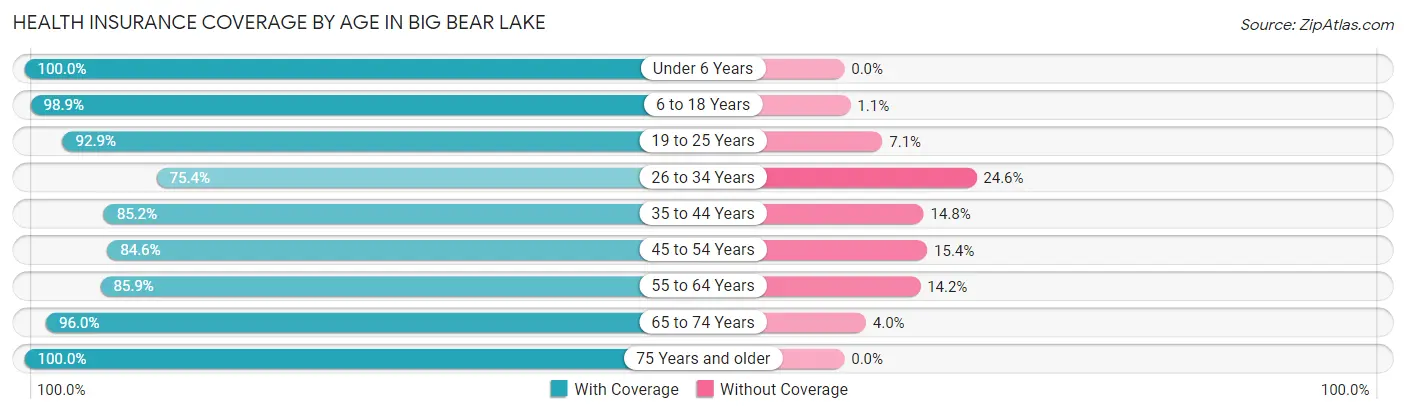
| Age Bracket | With Coverage | Without Coverage |
| Under 6 Years | 309 (100.0%) | 0 (0.0%) |
| 6 to 18 Years | 866 (98.9%) | 10 (1.1%) |
| 19 to 25 Years | 157 (92.9%) | 12 (7.1%) |
| 26 to 34 Years | 309 (75.4%) | 101 (24.6%) |
| 35 to 44 Years | 496 (85.2%) | 86 (14.8%) |
| 45 to 54 Years | 608 (84.6%) | 111 (15.4%) |
| 55 to 64 Years | 831 (85.9%) | 137 (14.1%) |
| 65 to 74 Years | 644 (96.0%) | 27 (4.0%) |
| 75 Years and older | 325 (100.0%) | 0 (0.0%) |
| Total | 4,545 (90.4%) | 484 (9.6%) |
Health Insurance Coverage by Citizenship Status in Big Bear Lake
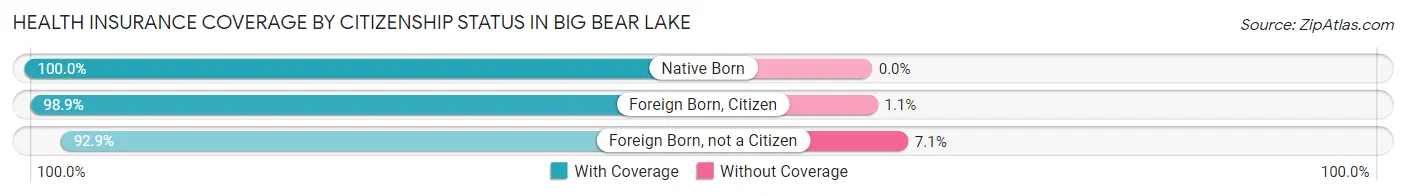
| Citizenship Status | With Coverage | Without Coverage |
| Native Born | 309 (100.0%) | 0 (0.0%) |
| Foreign Born, Citizen | 866 (98.9%) | 10 (1.1%) |
| Foreign Born, not a Citizen | 157 (92.9%) | 12 (7.1%) |
Health Insurance Coverage by Household Income in Big Bear Lake
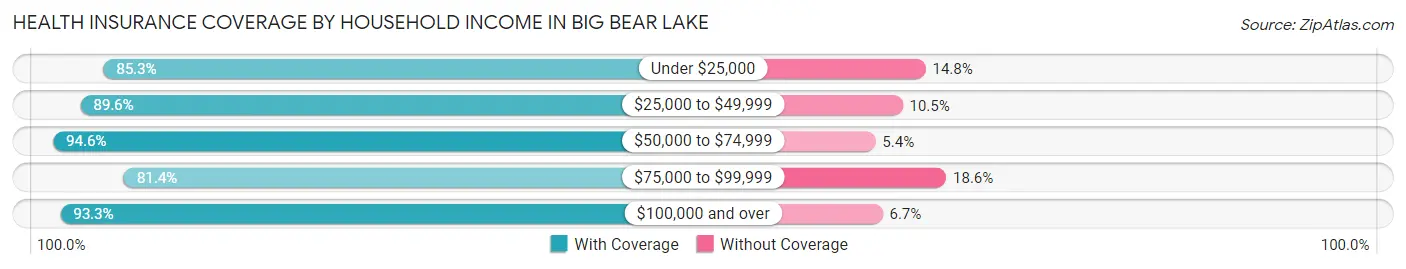
| Household Income | With Coverage | Without Coverage |
| Under $25,000 | 601 (85.3%) | 104 (14.7%) |
| $25,000 to $49,999 | 874 (89.5%) | 102 (10.4%) |
| $50,000 to $74,999 | 742 (94.6%) | 42 (5.4%) |
| $75,000 to $99,999 | 411 (81.4%) | 94 (18.6%) |
| $100,000 and over | 1,907 (93.3%) | 137 (6.7%) |
Public vs Private Health Insurance Coverage by Age in Big Bear Lake
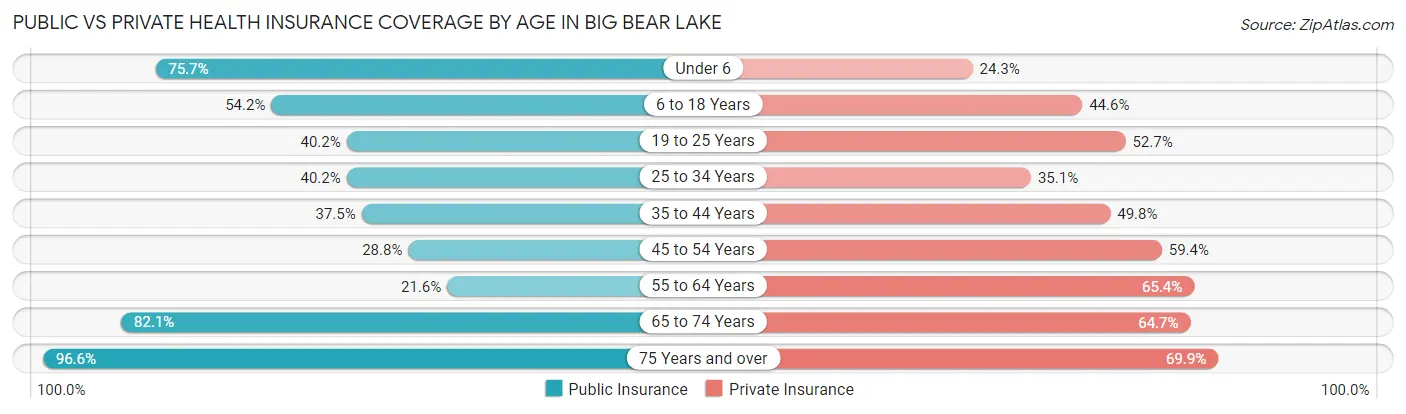
| Age Bracket | Public Insurance | Private Insurance |
| Under 6 | 234 (75.7%) | 75 (24.3%) |
| 6 to 18 Years | 475 (54.2%) | 391 (44.6%) |
| 19 to 25 Years | 68 (40.2%) | 89 (52.7%) |
| 25 to 34 Years | 165 (40.2%) | 144 (35.1%) |
| 35 to 44 Years | 218 (37.5%) | 290 (49.8%) |
| 45 to 54 Years | 207 (28.8%) | 427 (59.4%) |
| 55 to 64 Years | 209 (21.6%) | 633 (65.4%) |
| 65 to 74 Years | 551 (82.1%) | 434 (64.7%) |
| 75 Years and over | 314 (96.6%) | 227 (69.9%) |
| Total | 2,441 (48.5%) | 2,710 (53.9%) |
Disability Status by Sex by Age in Big Bear Lake
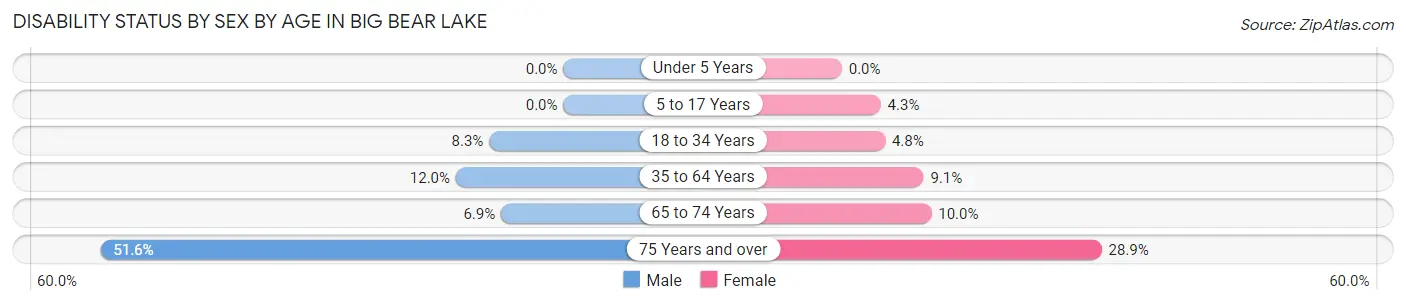
| Age Bracket | Male | Female |
| Under 5 Years | 0 (0.0%) | 0 (0.0%) |
| 5 to 17 Years | 0 (0.0%) | 17 (4.3%) |
| 18 to 34 Years | 28 (8.3%) | 14 (4.8%) |
| 35 to 64 Years | 148 (12.0%) | 94 (9.1%) |
| 65 to 74 Years | 25 (6.9%) | 31 (10.0%) |
| 75 Years and over | 66 (51.6%) | 57 (28.9%) |
Disability Class by Sex by Age in Big Bear Lake
Disability Class: Hearing Difficulty
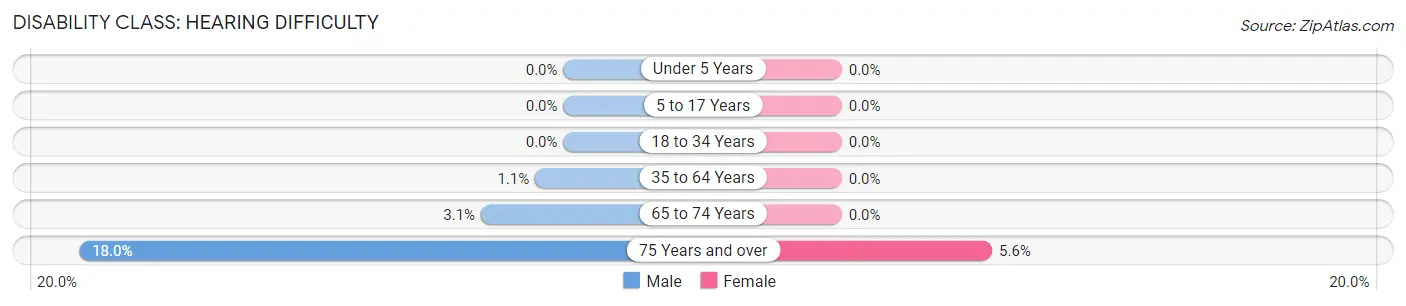
| Age Bracket | Male | Female |
| Under 5 Years | 0 (0.0%) | 0 (0.0%) |
| 5 to 17 Years | 0 (0.0%) | 0 (0.0%) |
| 18 to 34 Years | 0 (0.0%) | 0 (0.0%) |
| 35 to 64 Years | 13 (1.1%) | 0 (0.0%) |
| 65 to 74 Years | 11 (3.1%) | 0 (0.0%) |
| 75 Years and over | 23 (18.0%) | 11 (5.6%) |
Disability Class: Vision Difficulty
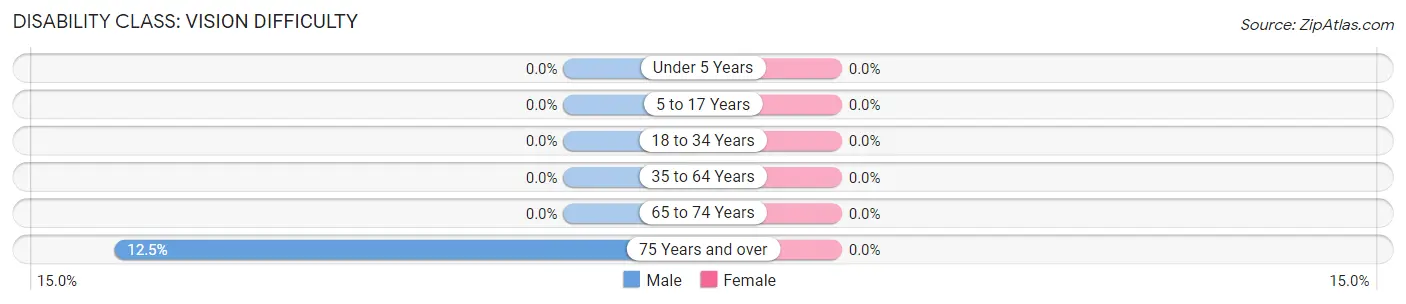
| Age Bracket | Male | Female |
| Under 5 Years | 0 (0.0%) | 0 (0.0%) |
| 5 to 17 Years | 0 (0.0%) | 0 (0.0%) |
| 18 to 34 Years | 0 (0.0%) | 0 (0.0%) |
| 35 to 64 Years | 0 (0.0%) | 0 (0.0%) |
| 65 to 74 Years | 0 (0.0%) | 0 (0.0%) |
| 75 Years and over | 16 (12.5%) | 0 (0.0%) |
Disability Class: Cognitive Difficulty
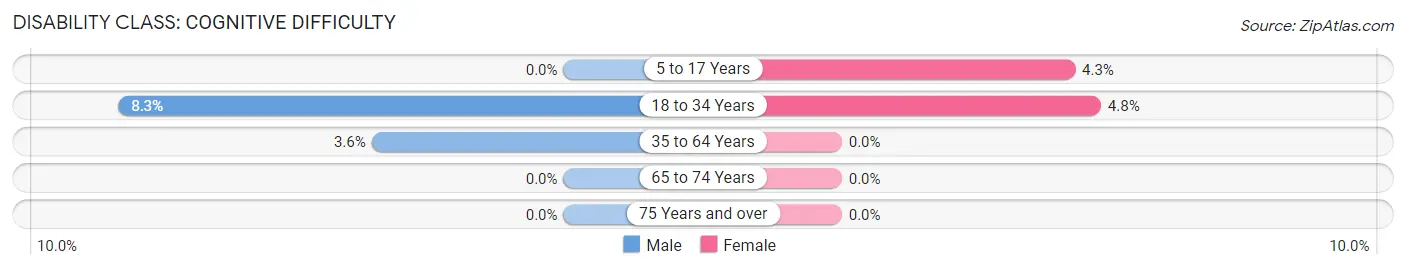
| Age Bracket | Male | Female |
| 5 to 17 Years | 0 (0.0%) | 17 (4.3%) |
| 18 to 34 Years | 28 (8.3%) | 14 (4.8%) |
| 35 to 64 Years | 44 (3.6%) | 0 (0.0%) |
| 65 to 74 Years | 0 (0.0%) | 0 (0.0%) |
| 75 Years and over | 0 (0.0%) | 0 (0.0%) |
Disability Class: Ambulatory Difficulty
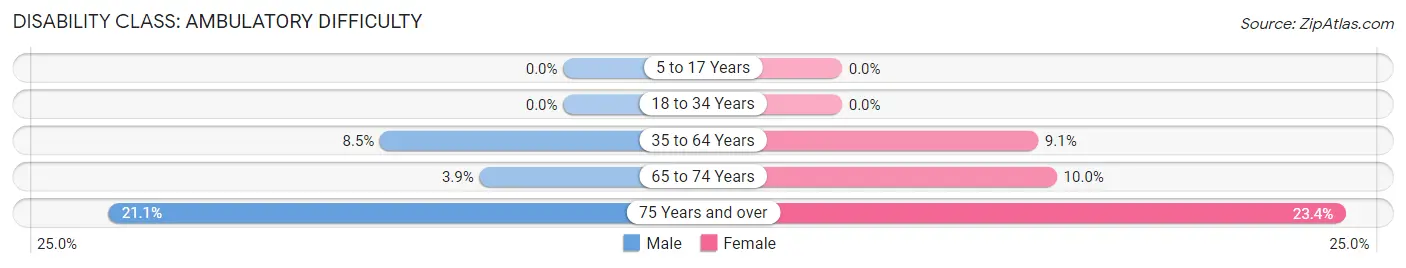
| Age Bracket | Male | Female |
| 5 to 17 Years | 0 (0.0%) | 0 (0.0%) |
| 18 to 34 Years | 0 (0.0%) | 0 (0.0%) |
| 35 to 64 Years | 105 (8.5%) | 94 (9.1%) |
| 65 to 74 Years | 14 (3.9%) | 31 (10.0%) |
| 75 Years and over | 27 (21.1%) | 46 (23.4%) |
Disability Class: Self-Care Difficulty
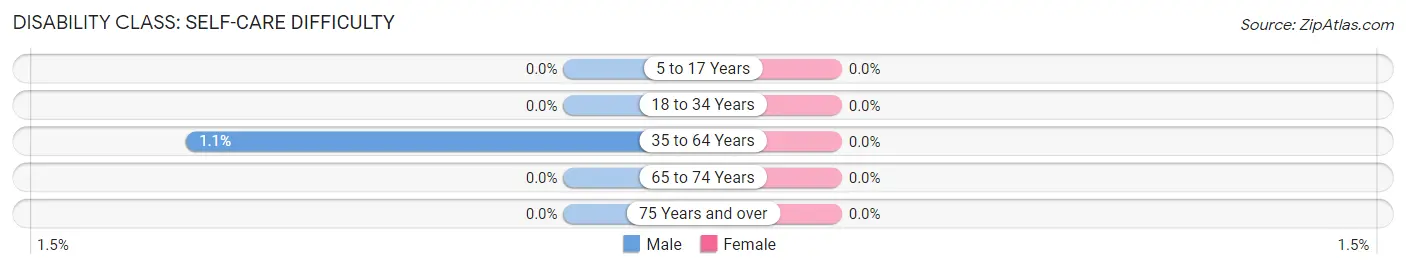
| Age Bracket | Male | Female |
| 5 to 17 Years | 0 (0.0%) | 0 (0.0%) |
| 18 to 34 Years | 0 (0.0%) | 0 (0.0%) |
| 35 to 64 Years | 13 (1.1%) | 0 (0.0%) |
| 65 to 74 Years | 0 (0.0%) | 0 (0.0%) |
| 75 Years and over | 0 (0.0%) | 0 (0.0%) |
Technology Access in Big Bear Lake
Computing Device Access in Big Bear Lake
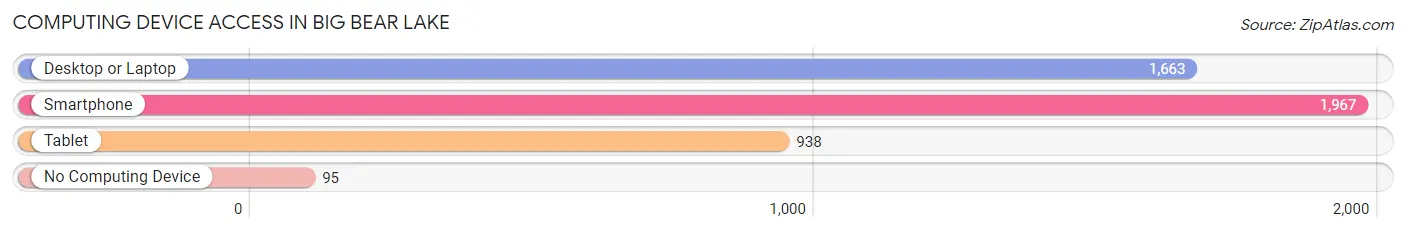
| Device Type | # Households | % Households |
| Desktop or Laptop | 1,663 | 76.6% |
| Smartphone | 1,967 | 90.6% |
| Tablet | 938 | 43.2% |
| No Computing Device | 95 | 4.4% |
| Total | 2,171 | 100.0% |
Internet Access in Big Bear Lake
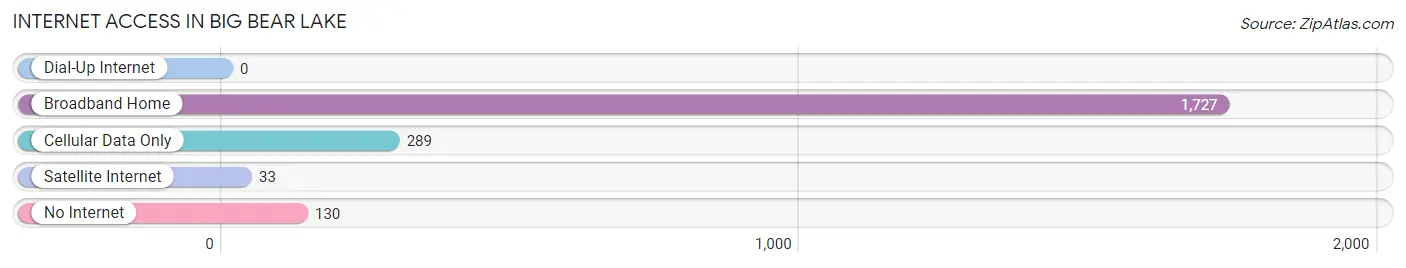
| Internet Type | # Households | % Households |
| Dial-Up Internet | 0 | 0.0% |
| Broadband Home | 1,727 | 79.5% |
| Cellular Data Only | 289 | 13.3% |
| Satellite Internet | 33 | 1.5% |
| No Internet | 130 | 6.0% |
| Total | 2,171 | 100.0% |
Big Bear Lake Summary
Big Bear Lake is a small town located in the San Bernardino Mountains of Southern California. It is situated at an elevation of 6,752 feet and is surrounded by the San Bernardino National Forest. The town is located about 100 miles east of Los Angeles and is a popular destination for outdoor recreation.
History
Big Bear Lake was originally inhabited by the Serrano Indians, who called the area Yuhaviat. The first non-native settlers arrived in the area in the late 1800s, and the town was officially founded in 1845. The town was named after a large grizzly bear that was killed in the area in 1845.
In the early 1900s, the town began to grow as a popular tourist destination. The first hotel was built in 1904, and the first ski resort opened in 1940. The town was incorporated in 1980.
Geography
Big Bear Lake is located in the San Bernardino Mountains of Southern California. It is situated at an elevation of 6,752 feet and is surrounded by the San Bernardino National Forest. The town is located about 100 miles east of Los Angeles and is a popular destination for outdoor recreation.
The town is situated on the north shore of Big Bear Lake, a large lake that is popular for fishing, boating, and other water activities. The lake is fed by several small streams and is the largest natural lake in Southern California.
The town is surrounded by mountains, including the San Gorgonio Mountain to the west and the San Bernardino Mountains to the east. The area is known for its scenic beauty and is a popular destination for hiking, camping, and other outdoor activities.
Economy
The economy of Big Bear Lake is largely based on tourism. The town is a popular destination for outdoor recreation, and the local economy is heavily reliant on visitors. The town is home to several ski resorts, which attract visitors from all over the world.
The town is also home to several restaurants, shops, and other businesses that cater to tourists. The town is also home to several manufacturing companies, including a furniture factory and a boat manufacturing company.
Demographics
As of the 2010 census, the population of Big Bear Lake was 5,019. The population is predominantly white (90.2%), with small percentages of other races. The median age is 44.7 years, and the median household income is $50,945.
The town is home to several churches, including the Big Bear Lake Community Church, the First Baptist Church of Big Bear Lake, and the Church of Jesus Christ of Latter-day Saints. The town is also home to several schools, including Big Bear High School and Big Bear Middle School.
Conclusion
Big Bear Lake is a small town located in the San Bernardino Mountains of Southern California. It is situated at an elevation of 6,752 feet and is surrounded by the San Bernardino National Forest. The town is a popular destination for outdoor recreation and is home to several ski resorts, restaurants, shops, and other businesses. The population of Big Bear Lake is predominantly white, with a median age of 44.7 years and a median household income of $50,945. The town is home to several churches and schools, and the local economy is heavily reliant on tourism.
Common Questions
What is Per Capita Income in Big Bear Lake?
Per Capita income in Big Bear Lake is $46,147.
What is the Median Family Income in Big Bear Lake?
Median Family Income in Big Bear Lake is $79,242.
What is the Median Household income in Big Bear Lake?
Median Household Income in Big Bear Lake is $70,020.
What is Income or Wage Gap in Big Bear Lake?
Income or Wage Gap in Big Bear Lake is 13.1%.
Women in Big Bear Lake earn 86.9 cents for every dollar earned by a man.
What is Family Income Deficit in Big Bear Lake?
Family Income Deficit in Big Bear Lake is $13,129.
Families that are below poverty line in Big Bear Lake earn $13,129 less on average than the poverty threshold level.
What is Inequality or Gini Index in Big Bear Lake?
Inequality or Gini Index in Big Bear Lake is 0.53.
What is the Total Population of Big Bear Lake?
Total Population of Big Bear Lake is 5,059.
What is the Total Male Population of Big Bear Lake?
Total Male Population of Big Bear Lake is 2,706.
What is the Total Female Population of Big Bear Lake?
Total Female Population of Big Bear Lake is 2,353.
What is the Ratio of Males per 100 Females in Big Bear Lake?
There are 115.00 Males per 100 Females in Big Bear Lake.
What is the Ratio of Females per 100 Males in Big Bear Lake?
There are 86.95 Females per 100 Males in Big Bear Lake.
What is the Median Population Age in Big Bear Lake?
Median Population Age in Big Bear Lake is 47.5 Years.
What is the Average Family Size in Big Bear Lake
Average Family Size in Big Bear Lake is 3.0 People.
What is the Average Household Size in Big Bear Lake
Average Household Size in Big Bear Lake is 2.3 People.
How Large is the Labor Force in Big Bear Lake?
There are 2,319 People in the Labor Forcein in Big Bear Lake.
What is the Percentage of People in the Labor Force in Big Bear Lake?
57.2% of People are in the Labor Force in Big Bear Lake.
What is the Unemployment Rate in Big Bear Lake?
Unemployment Rate in Big Bear Lake is 6.0%.