Solomons, MD Map & Demographics
Solomons Map
Solomons Overview
$58,330
PER CAPITA INCOME
$126,195
AVG FAMILY INCOME
$88,558
AVG HOUSEHOLD INCOME
48.2%
WAGE / INCOME GAP [ % ]
51.8¢/ $1
WAGE / INCOME GAP [ $ ]
0.38
INEQUALITY / GINI INDEX
2,242
TOTAL POPULATION
1,108
MALE POPULATION
1,134
FEMALE POPULATION
97.71
MALES / 100 FEMALES
102.35
FEMALES / 100 MALES
63.6
MEDIAN AGE
2.5
AVG FAMILY SIZE
1.9
AVG HOUSEHOLD SIZE
684
LABOR FORCE [ PEOPLE ]
32.0%
PERCENT IN LABOR FORCE
Solomons Zip Codes
Income in Solomons
Income Overview in Solomons
Per Capita Income in Solomons is $58,330, while median incomes of families and households are $126,195 and $88,558 respectively.
| Characteristic | Number | Measure |
| Per Capita Income | 2,242 | $58,330 |
| Median Family Income | 638 | $126,195 |
| Mean Family Income | 638 | $149,127 |
| Median Household Income | 1,089 | $88,558 |
| Mean Household Income | 1,089 | $118,022 |
| Income Deficit | 638 | $0 |
| Wage / Income Gap (%) | 2,242 | 48.16% |
| Wage / Income Gap ($) | 2,242 | 51.84¢ per $1 |
| Gini / Inequality Index | 2,242 | 0.38 |
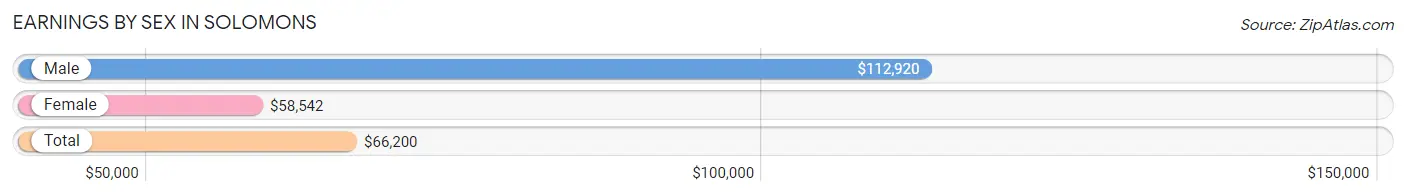
Earnings by Sex in Solomons
Average Earnings in Solomons are $66,200, $112,920 for men and $58,542 for women, a difference of 48.2%.
| Sex | Number | Average Earnings |
| Male | 416 (48.8%) | $112,920 |
| Female | 436 (51.2%) | $58,542 |
| Total | 852 (100.0%) | $66,200 |
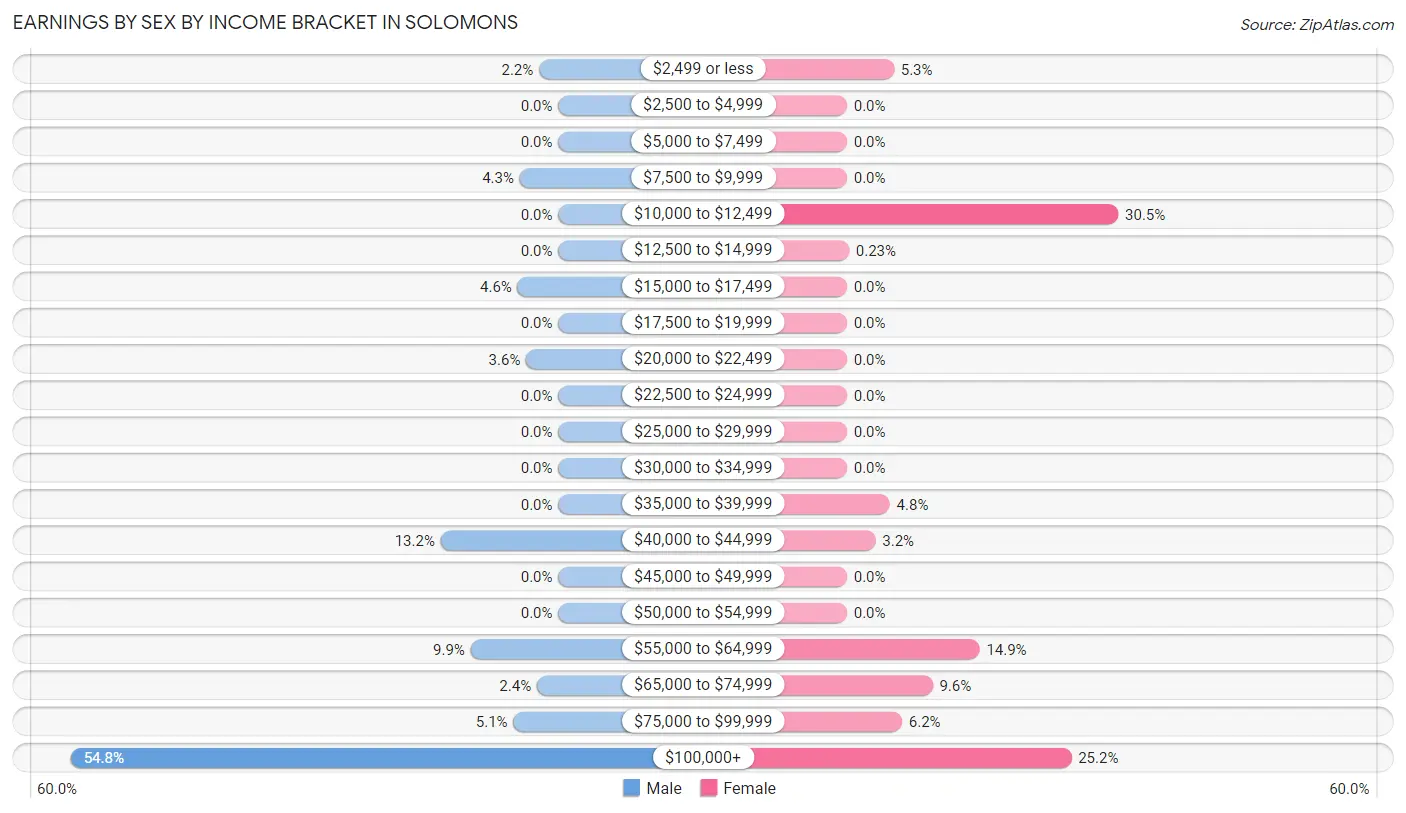
Earnings by Sex by Income Bracket in Solomons
The most common earnings brackets in Solomons are $100,000+ for men (228 | 54.8%) and $10,000 to $12,499 for women (133 | 30.5%).
| Income | Male | Female |
| $2,499 or less | 9 (2.2%) | 23 (5.3%) |
| $2,500 to $4,999 | 0 (0.0%) | 0 (0.0%) |
| $5,000 to $7,499 | 0 (0.0%) | 0 (0.0%) |
| $7,500 to $9,999 | 18 (4.3%) | 0 (0.0%) |
| $10,000 to $12,499 | 0 (0.0%) | 133 (30.5%) |
| $12,500 to $14,999 | 0 (0.0%) | 1 (0.2%) |
| $15,000 to $17,499 | 19 (4.6%) | 0 (0.0%) |
| $17,500 to $19,999 | 0 (0.0%) | 0 (0.0%) |
| $20,000 to $22,499 | 15 (3.6%) | 0 (0.0%) |
| $22,500 to $24,999 | 0 (0.0%) | 0 (0.0%) |
| $25,000 to $29,999 | 0 (0.0%) | 0 (0.0%) |
| $30,000 to $34,999 | 0 (0.0%) | 0 (0.0%) |
| $35,000 to $39,999 | 0 (0.0%) | 21 (4.8%) |
| $40,000 to $44,999 | 55 (13.2%) | 14 (3.2%) |
| $45,000 to $49,999 | 0 (0.0%) | 0 (0.0%) |
| $50,000 to $54,999 | 0 (0.0%) | 0 (0.0%) |
| $55,000 to $64,999 | 41 (9.9%) | 65 (14.9%) |
| $65,000 to $74,999 | 10 (2.4%) | 42 (9.6%) |
| $75,000 to $99,999 | 21 (5.1%) | 27 (6.2%) |
| $100,000+ | 228 (54.8%) | 110 (25.2%) |
| Total | 416 (100.0%) | 436 (100.0%) |
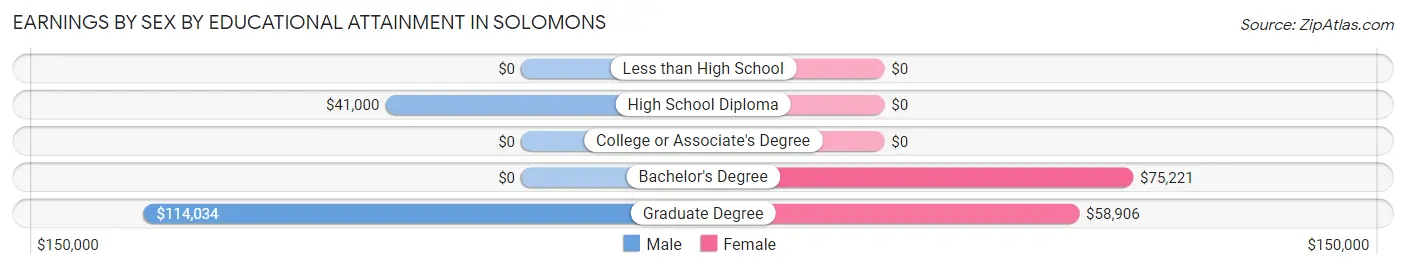
Earnings by Sex by Educational Attainment in Solomons
Average earnings in Solomons are $113,351 for men and $58,542 for women, a difference of 48.3%. Men with an educational attainment of graduate degree enjoy the highest average annual earnings of $114,034, while those with high school diploma education earn the least with $41,000. Women with an educational attainment of bachelor's degree earn the most with the average annual earnings of $75,221, while those with graduate degree education have the smallest earnings of $58,906.
| Educational Attainment | Male Income | Female Income |
| Less than High School | - | - |
| High School Diploma | $41,000 | $0 |
| College or Associate's Degree | - | - |
| Bachelor's Degree | - | - |
| Graduate Degree | $114,034 | $58,906 |
| Total | $113,351 | $58,542 |
Family Income in Solomons
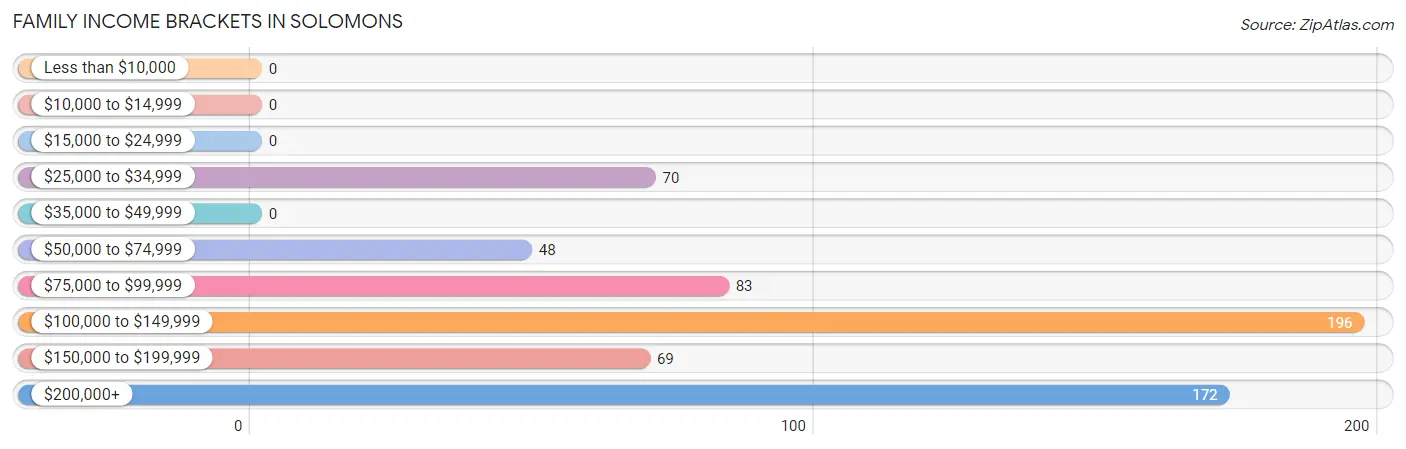
Family Income Brackets in Solomons
According to the Solomons family income data, there are 196 families falling into the $100,000 to $149,999 income range, which is the most common income bracket and makes up 30.7% of all families.
| Income Bracket | # Families | % Families |
| Less than $10,000 | 0 | 0.0% |
| $10,000 to $14,999 | 0 | 0.0% |
| $15,000 to $24,999 | 0 | 0.0% |
| $25,000 to $34,999 | 70 | 11.0% |
| $35,000 to $49,999 | 0 | 0.0% |
| $50,000 to $74,999 | 48 | 7.5% |
| $75,000 to $99,999 | 83 | 13.0% |
| $100,000 to $149,999 | 196 | 30.7% |
| $150,000 to $199,999 | 69 | 10.8% |
| $200,000+ | 172 | 27.0% |
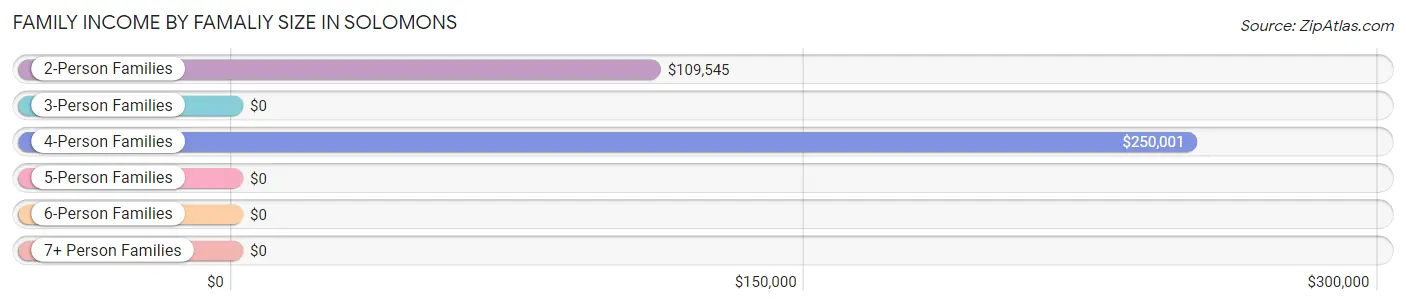
Family Income by Famaliy Size in Solomons
4-person families (87 | 13.6%) account for the highest median family income in Solomons with $250,001 per family, while 4-person families (87 | 13.6%) have the highest median income of $62,500 per family member.
| Income Bracket | # Families | Median Income |
| 2-Person Families | 428 (67.1%) | $109,545 |
| 3-Person Families | 123 (19.3%) | $0 |
| 4-Person Families | 87 (13.6%) | $250,001 |
| 5-Person Families | 0 (0.0%) | $0 |
| 6-Person Families | 0 (0.0%) | $0 |
| 7+ Person Families | 0 (0.0%) | $0 |
| Total | 638 (100.0%) | $126,195 |
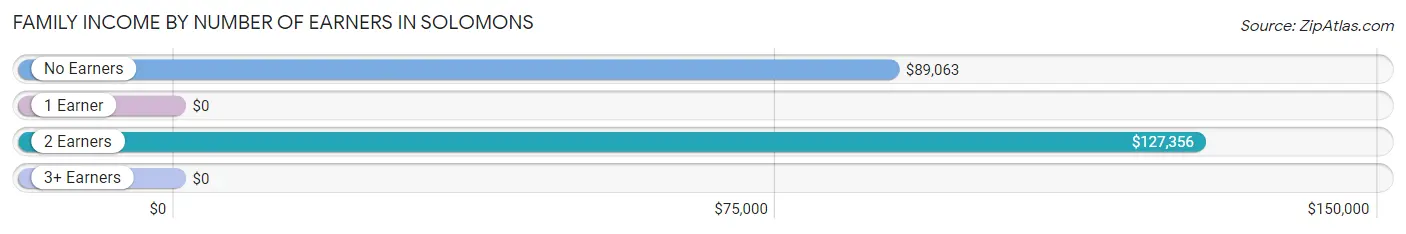
Family Income by Number of Earners in Solomons
| Number of Earners | # Families | Median Income |
| No Earners | 306 (48.0%) | $89,063 |
| 1 Earner | 66 (10.3%) | $0 |
| 2 Earners | 241 (37.8%) | $127,356 |
| 3+ Earners | 25 (3.9%) | $0 |
| Total | 638 (100.0%) | $126,195 |
Household Income in Solomons
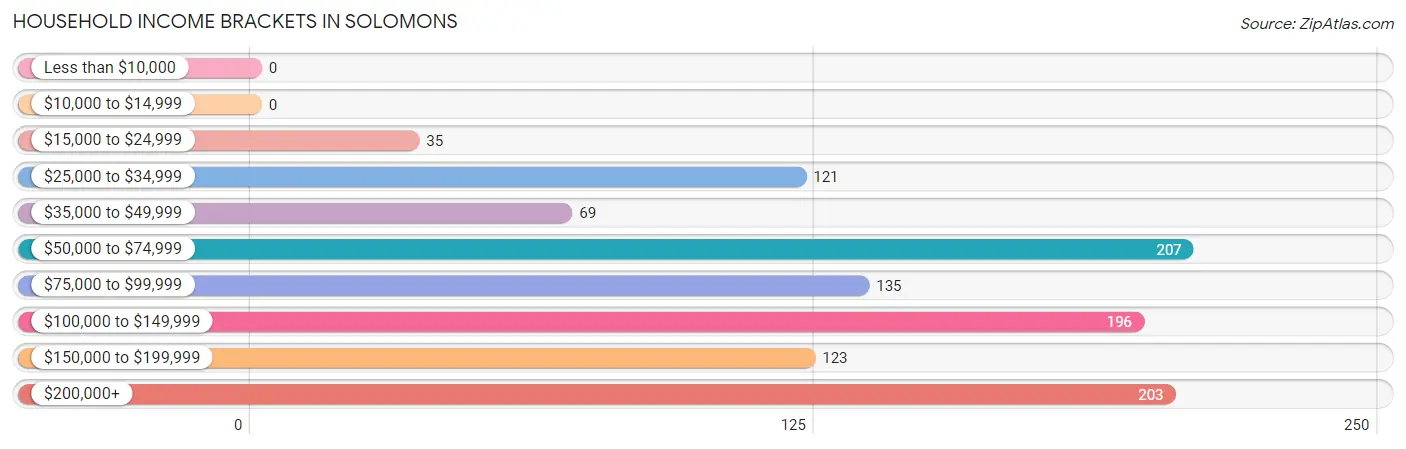
Household Income Brackets in Solomons
With 207 households falling in the category, the $50,000 to $74,999 income range is the most frequent in Solomons, accounting for 19.0% of all households.
| Income Bracket | # Households | % Households |
| Less than $10,000 | 0 | 0.0% |
| $10,000 to $14,999 | 0 | 0.0% |
| $15,000 to $24,999 | 35 | 3.2% |
| $25,000 to $34,999 | 121 | 11.1% |
| $35,000 to $49,999 | 69 | 6.3% |
| $50,000 to $74,999 | 207 | 19.0% |
| $75,000 to $99,999 | 135 | 12.4% |
| $100,000 to $149,999 | 196 | 18.0% |
| $150,000 to $199,999 | 123 | 11.3% |
| $200,000+ | 203 | 18.6% |
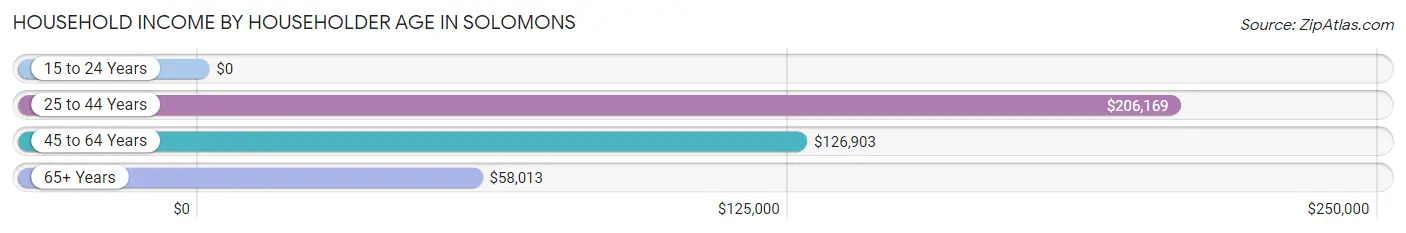
Household Income by Householder Age in Solomons
The median household income in Solomons is $88,558, with the highest median household income of $206,169 found in the 25 to 44 years age bracket for the primary householder. A total of 137 households (12.6%) fall into this category.
| Income Bracket | # Households | Median Income |
| 15 to 24 Years | 0 (0.0%) | $0 |
| 25 to 44 Years | 137 (12.6%) | $206,169 |
| 45 to 64 Years | 306 (28.1%) | $126,903 |
| 65+ Years | 646 (59.3%) | $58,013 |
| Total | 1,089 (100.0%) | $88,558 |
Poverty in Solomons
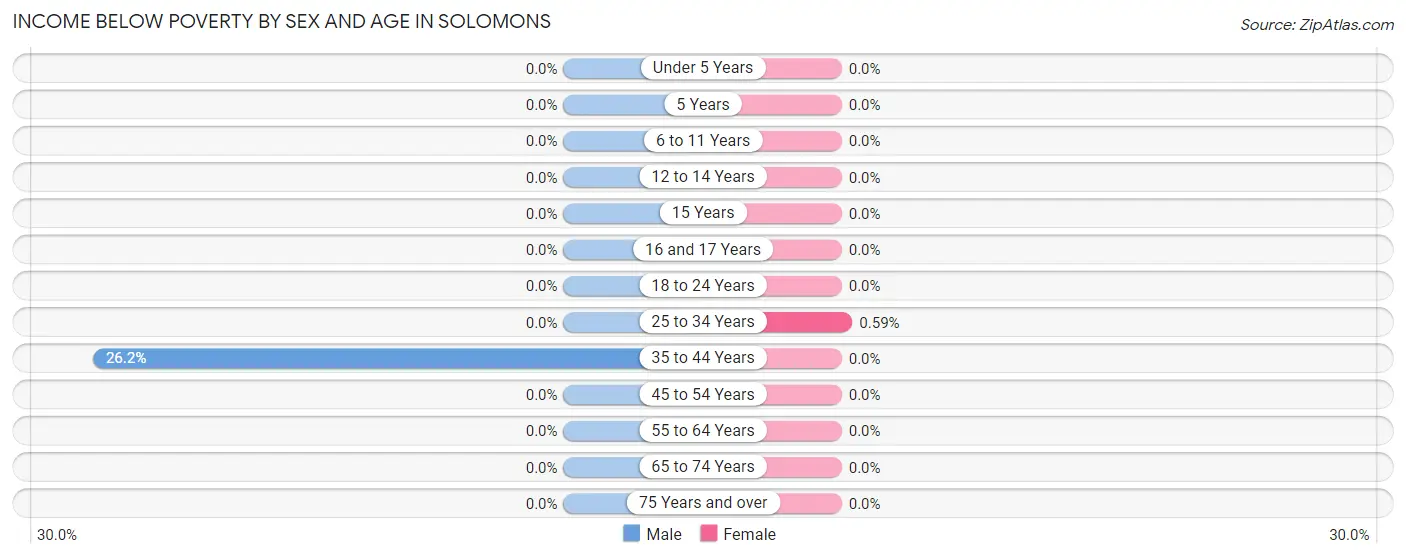
Income Below Poverty by Sex and Age in Solomons
With 1.1% poverty level for males and 0.1% for females among the residents of Solomons, 35 to 44 year old males and 25 to 34 year old females are the most vulnerable to poverty, with 11 males (26.2%) and 1 females (0.6%) in their respective age groups living below the poverty level.
| Age Bracket | Male | Female |
| Under 5 Years | 0 (0.0%) | 0 (0.0%) |
| 5 Years | 0 (0.0%) | 0 (0.0%) |
| 6 to 11 Years | 0 (0.0%) | 0 (0.0%) |
| 12 to 14 Years | 0 (0.0%) | 0 (0.0%) |
| 15 Years | 0 (0.0%) | 0 (0.0%) |
| 16 and 17 Years | 0 (0.0%) | 0 (0.0%) |
| 18 to 24 Years | 0 (0.0%) | 0 (0.0%) |
| 25 to 34 Years | 0 (0.0%) | 1 (0.6%) |
| 35 to 44 Years | 11 (26.2%) | 0 (0.0%) |
| 45 to 54 Years | 0 (0.0%) | 0 (0.0%) |
| 55 to 64 Years | 0 (0.0%) | 0 (0.0%) |
| 65 to 74 Years | 0 (0.0%) | 0 (0.0%) |
| 75 Years and over | 0 (0.0%) | 0 (0.0%) |
| Total | 11 (1.1%) | 1 (0.1%) |
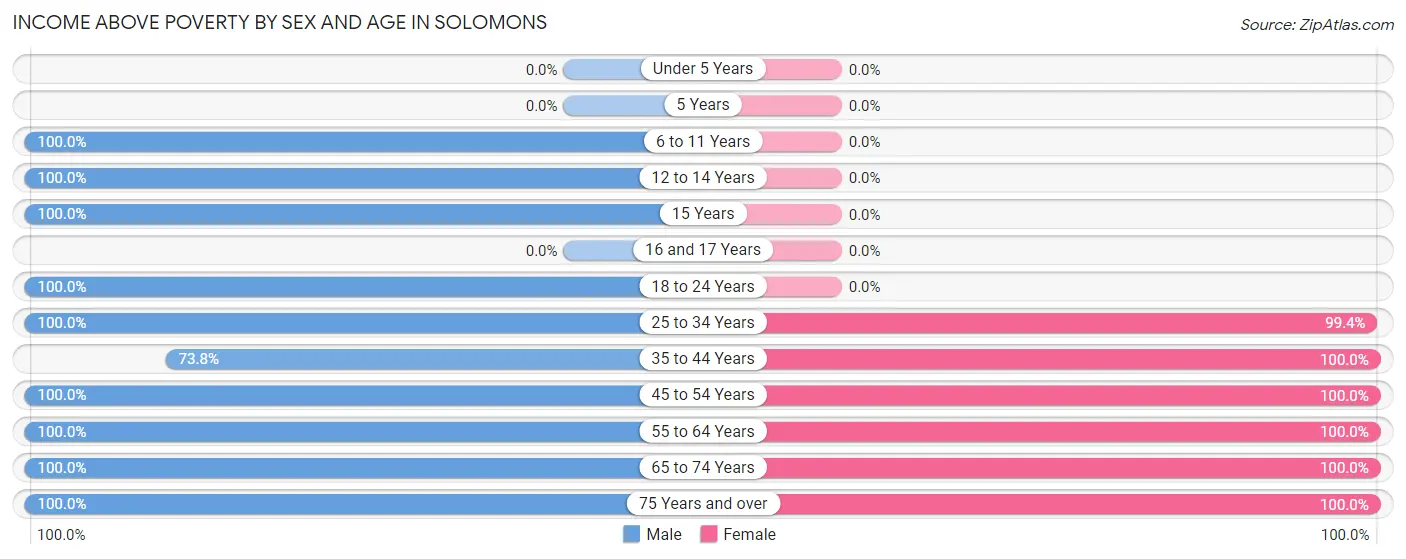
Income Above Poverty by Sex and Age in Solomons
According to the poverty statistics in Solomons, males aged 6 to 11 years and females aged 35 to 44 years are the age groups that are most secure financially, with 100.0% of males and 100.0% of females in these age groups living above the poverty line.
| Age Bracket | Male | Female |
| Under 5 Years | 0 (0.0%) | 0 (0.0%) |
| 5 Years | 0 (0.0%) | 0 (0.0%) |
| 6 to 11 Years | 61 (100.0%) | 0 (0.0%) |
| 12 to 14 Years | 26 (100.0%) | 0 (0.0%) |
| 15 Years | 18 (100.0%) | 0 (0.0%) |
| 16 and 17 Years | 0 (0.0%) | 0 (0.0%) |
| 18 to 24 Years | 64 (100.0%) | 0 (0.0%) |
| 25 to 34 Years | 33 (100.0%) | 168 (99.4%) |
| 35 to 44 Years | 31 (73.8%) | 92 (100.0%) |
| 45 to 54 Years | 149 (100.0%) | 42 (100.0%) |
| 55 to 64 Years | 199 (100.0%) | 260 (100.0%) |
| 65 to 74 Years | 164 (100.0%) | 240 (100.0%) |
| 75 Years and over | 275 (100.0%) | 280 (100.0%) |
| Total | 1,020 (98.9%) | 1,082 (99.9%) |
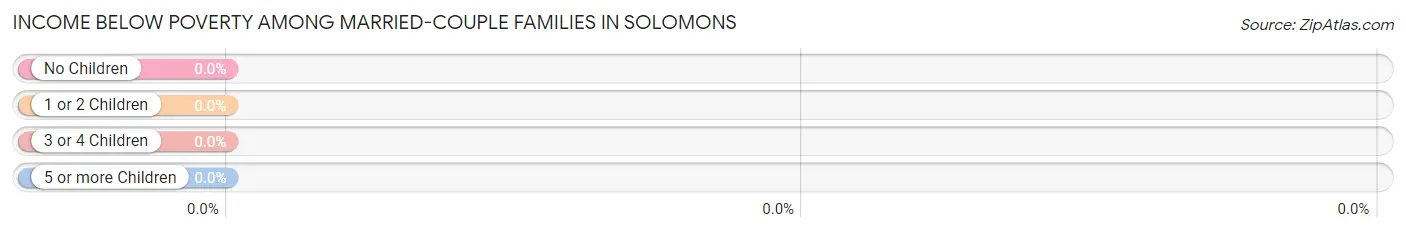
Income Below Poverty Among Married-Couple Families in Solomons
| Children | Above Poverty | Below Poverty |
| No Children | 524 (100.0%) | 0 (0.0%) |
| 1 or 2 Children | 87 (100.0%) | 0 (0.0%) |
| 3 or 4 Children | 0 (0.0%) | 0 (0.0%) |
| 5 or more Children | 0 (0.0%) | 0 (0.0%) |
| Total | 611 (100.0%) | 0 (0.0%) |
Income Below Poverty Among Single-Parent Households in Solomons
| Children | Single Father | Single Mother |
| No Children | 0 (0.0%) | 0 (0.0%) |
| 1 or 2 Children | 0 (0.0%) | 0 (0.0%) |
| 3 or 4 Children | 0 (0.0%) | 0 (0.0%) |
| 5 or more Children | 0 (0.0%) | 0 (0.0%) |
| Total | 0 (0.0%) | 0 (0.0%) |
Income Below Poverty Among Married-Couple vs Single-Parent Households in Solomons
| Children | Married-Couple Families | Single-Parent Households |
| No Children | 0 (0.0%) | 0 (0.0%) |
| 1 or 2 Children | 0 (0.0%) | 0 (0.0%) |
| 3 or 4 Children | 0 (0.0%) | 0 (0.0%) |
| 5 or more Children | 0 (0.0%) | 0 (0.0%) |
| Total | 0 (0.0%) | 0 (0.0%) |
Race in Solomons
The most populous races in Solomons are White / Caucasian (1,915 | 85.4%), Asian (186 | 8.3%), and Black / African American (90 | 4.0%).
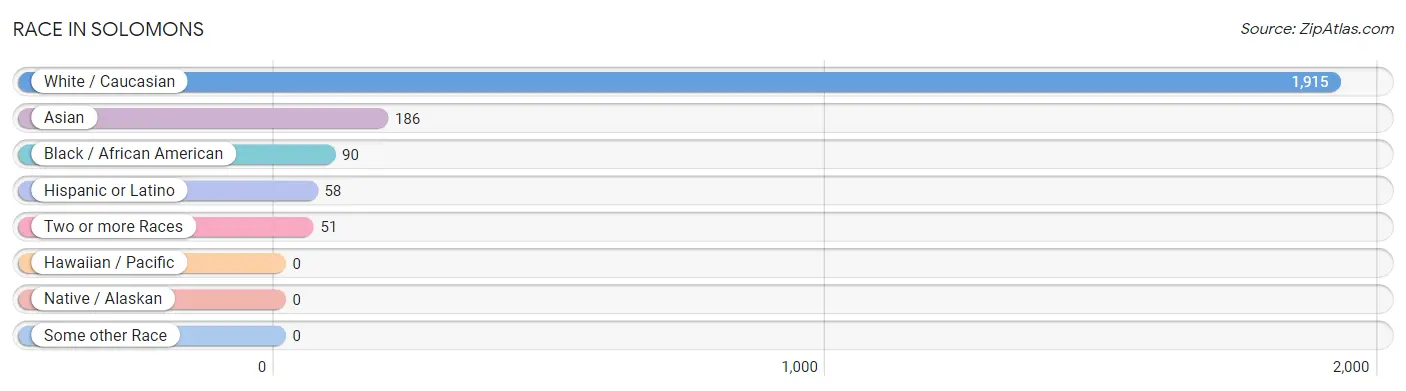
| Race | # Population | % Population |
| Asian | 186 | 8.3% |
| Black / African American | 90 | 4.0% |
| Hawaiian / Pacific | 0 | 0.0% |
| Hispanic or Latino | 58 | 2.6% |
| Native / Alaskan | 0 | 0.0% |
| White / Caucasian | 1,915 | 85.4% |
| Two or more Races | 51 | 2.3% |
| Some other Race | 0 | 0.0% |
| Total | 2,242 | 100.0% |
Ancestry in Solomons
The most populous ancestries reported in Solomons are English (730 | 32.6%), Irish (689 | 30.7%), German (397 | 17.7%), American (78 | 3.5%), and Italian (74 | 3.3%), together accounting for 87.8% of all Solomons residents.
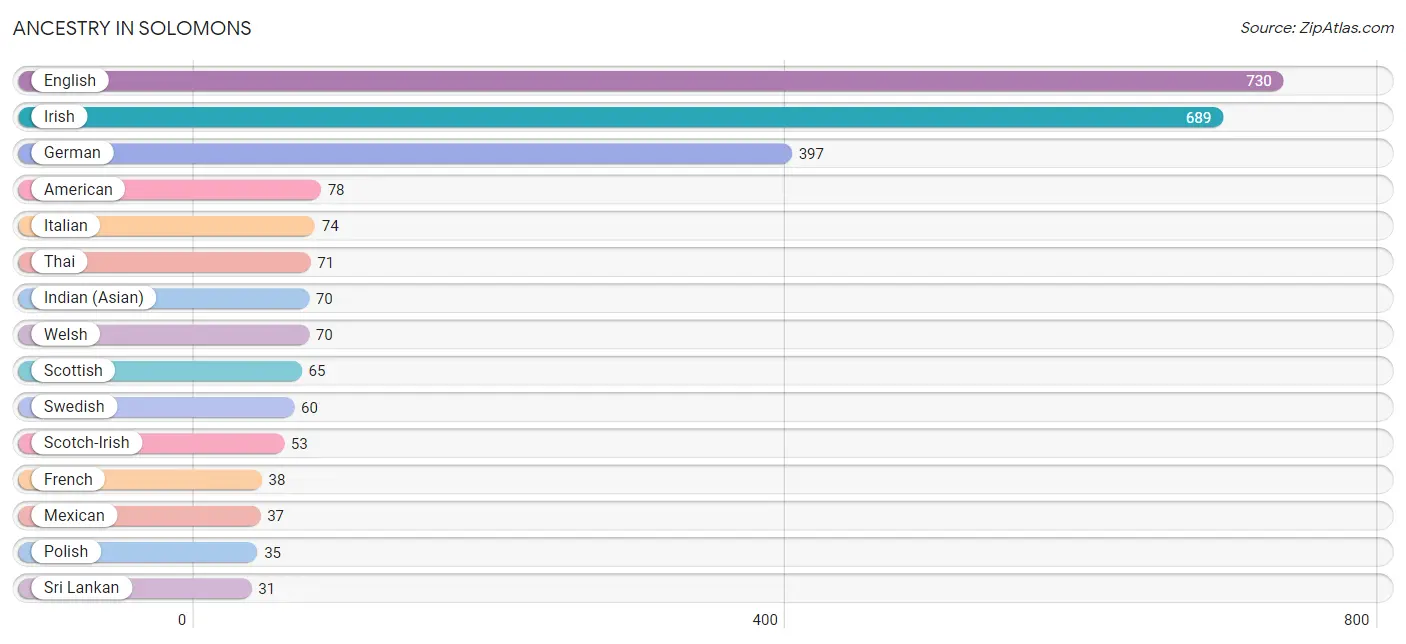
| Ancestry | # Population | % Population |
| American | 78 | 3.5% |
| British | 14 | 0.6% |
| Burmese | 8 | 0.4% |
| Danish | 13 | 0.6% |
| Dutch | 29 | 1.3% |
| Eastern European | 25 | 1.1% |
| English | 730 | 32.6% |
| European | 20 | 0.9% |
| French | 38 | 1.7% |
| German | 397 | 17.7% |
| Greek | 21 | 0.9% |
| Indian (Asian) | 70 | 3.1% |
| Irish | 689 | 30.7% |
| Italian | 74 | 3.3% |
| Mexican | 37 | 1.7% |
| Polish | 35 | 1.6% |
| Portuguese | 10 | 0.4% |
| Russian | 1 | 0.0% |
| Scotch-Irish | 53 | 2.4% |
| Scottish | 65 | 2.9% |
| Spanish | 21 | 0.9% |
| Sri Lankan | 31 | 1.4% |
| Swedish | 60 | 2.7% |
| Thai | 71 | 3.2% |
| Welsh | 70 | 3.1% | View All 25 Rows |
Immigrants in Solomons
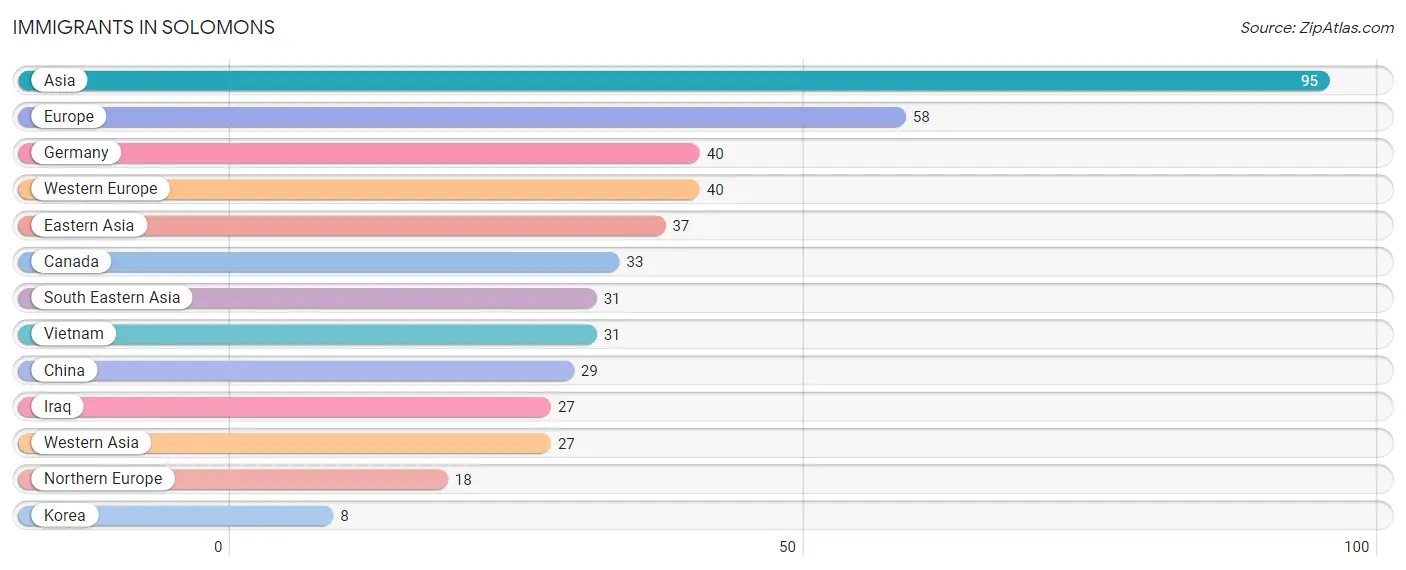
The most numerous immigrant groups reported in Solomons came from Asia (95 | 4.2%), Europe (58 | 2.6%), Germany (40 | 1.8%), Western Europe (40 | 1.8%), and Eastern Asia (37 | 1.7%), together accounting for 12.0% of all Solomons residents.
| Immigration Origin | # Population | % Population |
| Asia | 95 | 4.2% |
| Canada | 33 | 1.5% |
| China | 29 | 1.3% |
| Eastern Asia | 37 | 1.7% |
| Europe | 58 | 2.6% |
| Germany | 40 | 1.8% |
| Iraq | 27 | 1.2% |
| Korea | 8 | 0.4% |
| Northern Europe | 18 | 0.8% |
| South Eastern Asia | 31 | 1.4% |
| Vietnam | 31 | 1.4% |
| Western Asia | 27 | 1.2% |
| Western Europe | 40 | 1.8% | View All 13 Rows |
Sex and Age in Solomons
Sex and Age in Solomons
The most populous age groups in Solomons are 60 to 64 Years (175 | 15.8%) for men and 70 to 74 Years (138 | 12.2%) for women.
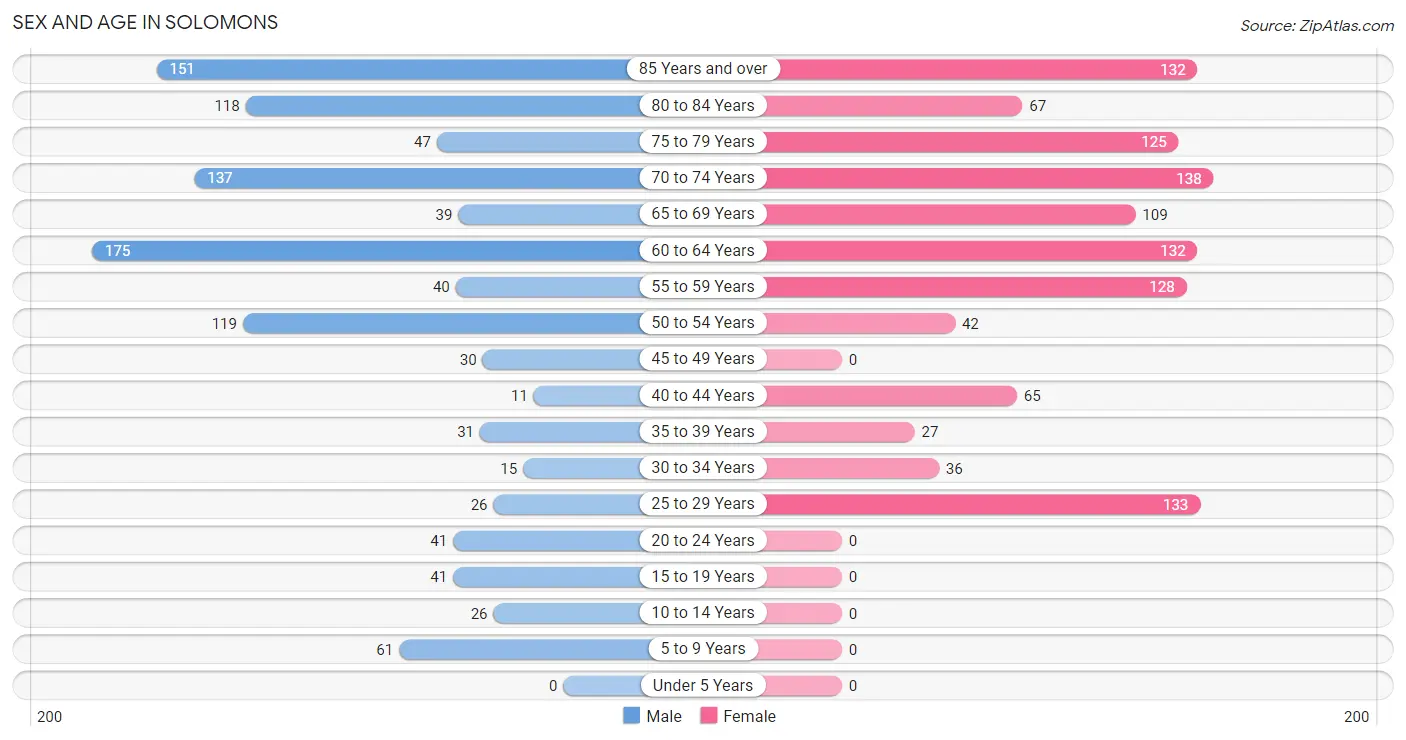
| Age Bracket | Male | Female |
| Under 5 Years | 0 (0.0%) | 0 (0.0%) |
| 5 to 9 Years | 61 (5.5%) | 0 (0.0%) |
| 10 to 14 Years | 26 (2.4%) | 0 (0.0%) |
| 15 to 19 Years | 41 (3.7%) | 0 (0.0%) |
| 20 to 24 Years | 41 (3.7%) | 0 (0.0%) |
| 25 to 29 Years | 26 (2.4%) | 133 (11.7%) |
| 30 to 34 Years | 15 (1.3%) | 36 (3.2%) |
| 35 to 39 Years | 31 (2.8%) | 27 (2.4%) |
| 40 to 44 Years | 11 (1.0%) | 65 (5.7%) |
| 45 to 49 Years | 30 (2.7%) | 0 (0.0%) |
| 50 to 54 Years | 119 (10.7%) | 42 (3.7%) |
| 55 to 59 Years | 40 (3.6%) | 128 (11.3%) |
| 60 to 64 Years | 175 (15.8%) | 132 (11.6%) |
| 65 to 69 Years | 39 (3.5%) | 109 (9.6%) |
| 70 to 74 Years | 137 (12.4%) | 138 (12.2%) |
| 75 to 79 Years | 47 (4.2%) | 125 (11.0%) |
| 80 to 84 Years | 118 (10.6%) | 67 (5.9%) |
| 85 Years and over | 151 (13.6%) | 132 (11.6%) |
| Total | 1,108 (100.0%) | 1,134 (100.0%) |
Families and Households in Solomons
Median Family Size in Solomons
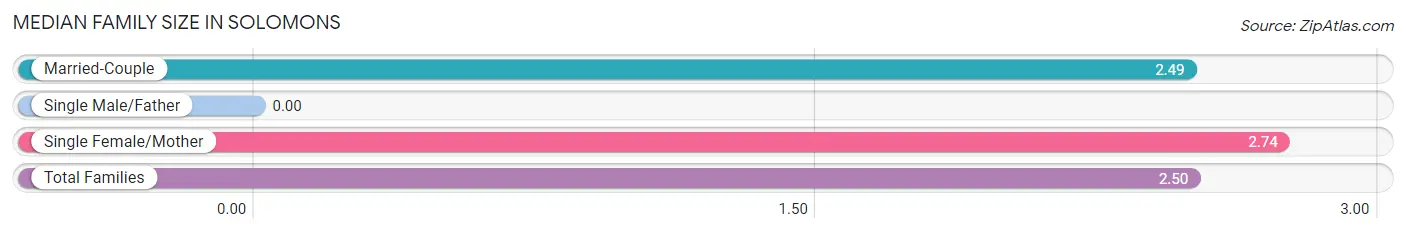
| Family Type | # Families | Family Size |
| Married-Couple | 611 (95.8%) | 2.49 |
| Single Male/Father | 0 (0.0%) | - |
| Single Female/Mother | 27 (4.2%) | 2.74 |
| Total Families | 638 (100.0%) | 2.50 |
Median Household Size in Solomons
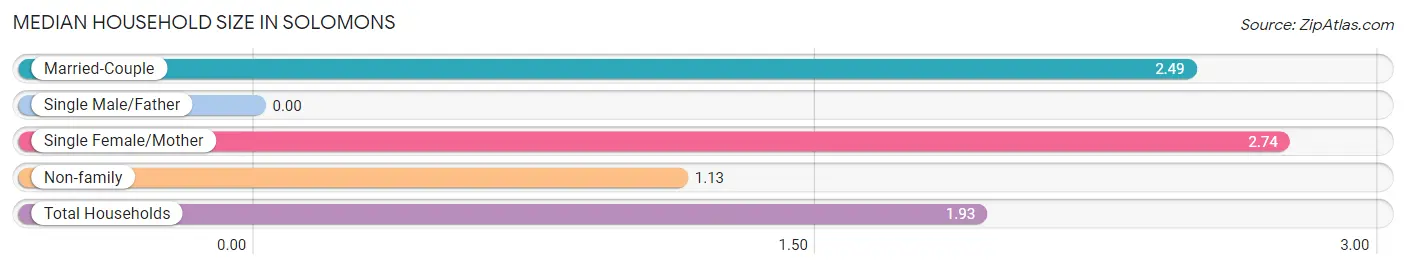
| Household Type | # Households | Household Size |
| Married-Couple | 611 (56.1%) | 2.49 |
| Single Male/Father | 0 (0.0%) | - |
| Single Female/Mother | 27 (2.5%) | 2.74 |
| Non-family | 451 (41.4%) | 1.13 |
| Total Households | 1,089 (100.0%) | 1.93 |
Household Size by Marriage Status in Solomons
Out of a total of 1,089 households in Solomons, 638 (58.6%) are family households, while 451 (41.4%) are nonfamily households. The most numerous type of family households are 2-person households, comprising 428, and the most common type of nonfamily households are 1-person households, comprising 380.
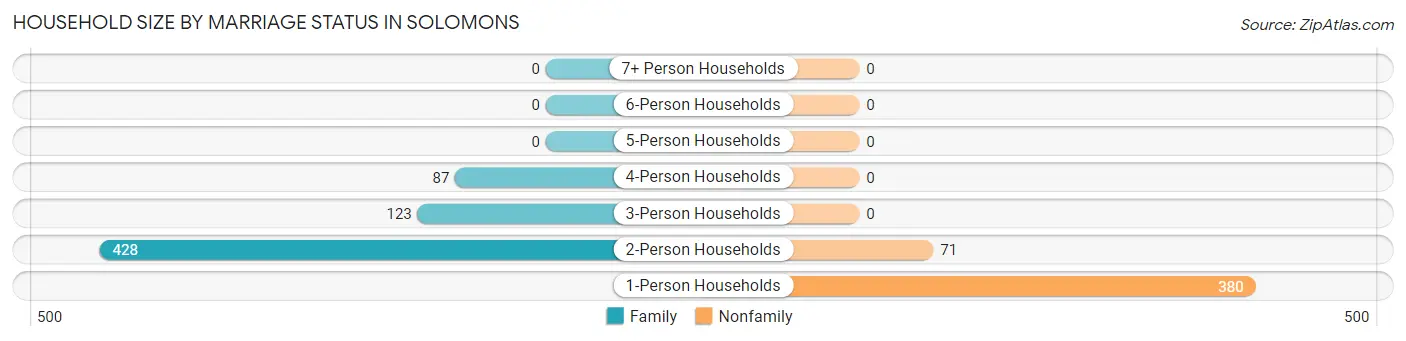
| Household Size | Family Households | Nonfamily Households |
| 1-Person Households | - | 380 (34.9%) |
| 2-Person Households | 428 (39.3%) | 71 (6.5%) |
| 3-Person Households | 123 (11.3%) | 0 (0.0%) |
| 4-Person Households | 87 (8.0%) | 0 (0.0%) |
| 5-Person Households | 0 (0.0%) | 0 (0.0%) |
| 6-Person Households | 0 (0.0%) | 0 (0.0%) |
| 7+ Person Households | 0 (0.0%) | 0 (0.0%) |
| Total | 638 (58.6%) | 451 (41.4%) |
Female Fertility in Solomons
Fertility by Age in Solomons
| Age Bracket | Women with Births | Births / 1,000 Women |
| 15 to 19 years | 0 (0.0%) | 0.0 |
| 20 to 34 years | 0 (0.0%) | 0.0 |
| 35 to 50 years | 0 (0.0%) | 0.0 |
| Total | 0 (0.0%) | 0.0 |
Fertility by Age by Marriage Status in Solomons
| Age Bracket | Married | Unmarried |
| 15 to 19 years | 0 (0.0%) | 0 (0.0%) |
| 20 to 34 years | 0 (0.0%) | 0 (0.0%) |
| 35 to 50 years | 0 (0.0%) | 0 (0.0%) |
| Total | 0 (0.0%) | 0 (0.0%) |
Fertility by Education in Solomons
| Educational Attainment | Women with Births | Births / 1,000 Women |
| Less than High School | 0 (0.0%) | 0.0 |
| High School Diploma | 0 (0.0%) | 0.0 |
| College or Associate's Degree | 0 (0.0%) | 0.0 |
| Bachelor's Degree | 0 (0.0%) | 0.0 |
| Graduate Degree | 0 (0.0%) | 0.0 |
| Total | 0 (0.0%) | 0.0 |
Fertility by Education by Marriage Status in Solomons
| Educational Attainment | Married | Unmarried |
| Less than High School | 0 (0.0%) | 0 (0.0%) |
| High School Diploma | 0 (0.0%) | 0 (0.0%) |
| College or Associate's Degree | 0 (0.0%) | 0 (0.0%) |
| Bachelor's Degree | 0 (0.0%) | 0 (0.0%) |
| Graduate Degree | 0 (0.0%) | 0 (0.0%) |
| Total | 0 (0.0%) | 0 (0.0%) |
Employment Characteristics in Solomons
Employment by Class of Employer in Solomons
Among the 683 employed individuals in Solomons, private company employees (288 | 42.2%), federal government employees (121 | 17.7%), and self-employed (not incorporated) (109 | 16.0%) make up the most common classes of employment.
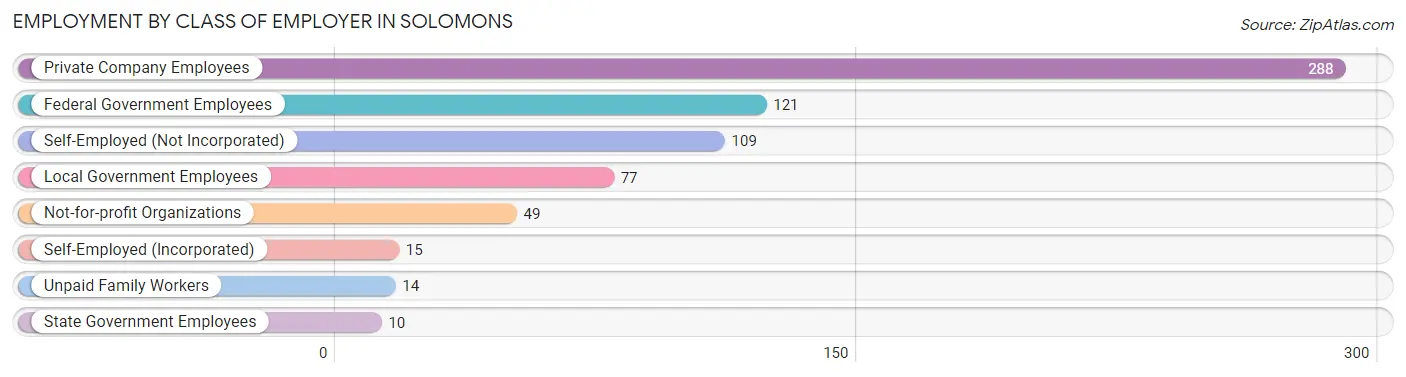
| Employer Class | # Employees | % Employees |
| Private Company Employees | 288 | 42.2% |
| Self-Employed (Incorporated) | 15 | 2.2% |
| Self-Employed (Not Incorporated) | 109 | 16.0% |
| Not-for-profit Organizations | 49 | 7.2% |
| Local Government Employees | 77 | 11.3% |
| State Government Employees | 10 | 1.5% |
| Federal Government Employees | 121 | 17.7% |
| Unpaid Family Workers | 14 | 2.1% |
| Total | 683 | 100.0% |
Employment Status by Age in Solomons
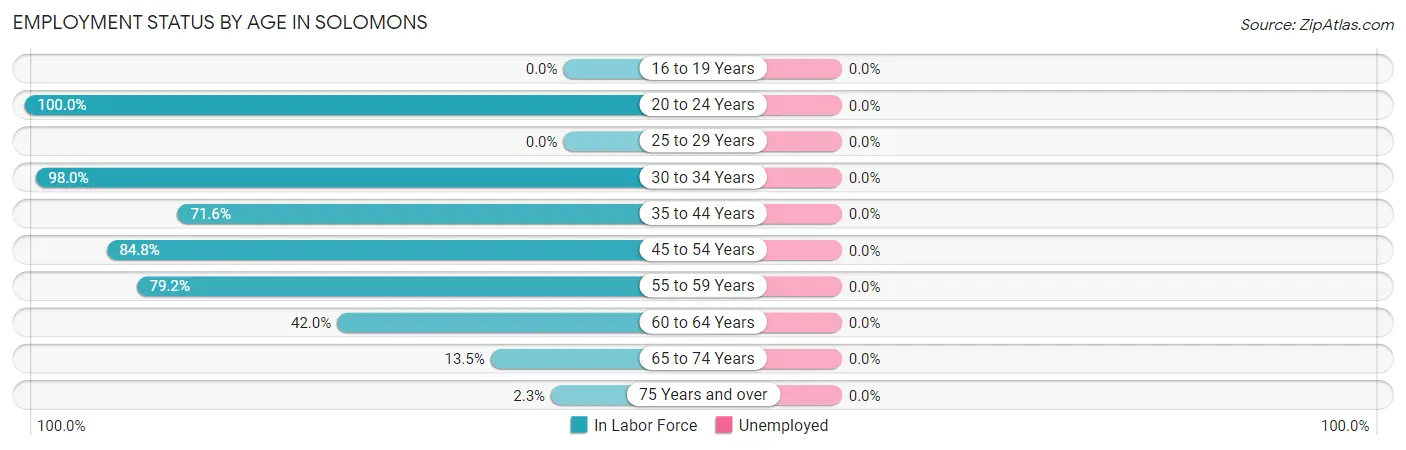
| Age Bracket | In Labor Force | Unemployed |
| 16 to 19 Years | 0 (0.0%) | 0 (0.0%) |
| 20 to 24 Years | 41 (100.0%) | 0 (0.0%) |
| 25 to 29 Years | 0 (0.0%) | 0 (0.0%) |
| 30 to 34 Years | 50 (98.0%) | 0 (0.0%) |
| 35 to 44 Years | 96 (71.6%) | 0 (0.0%) |
| 45 to 54 Years | 162 (84.8%) | 0 (0.0%) |
| 55 to 59 Years | 133 (79.2%) | 0 (0.0%) |
| 60 to 64 Years | 129 (42.0%) | 0 (0.0%) |
| 65 to 74 Years | 57 (13.5%) | 0 (0.0%) |
| 75 Years and over | 15 (2.3%) | 0 (0.0%) |
| Total | 684 (32.0%) | 0 (0.0%) |
Employment Status by Educational Attainment in Solomons
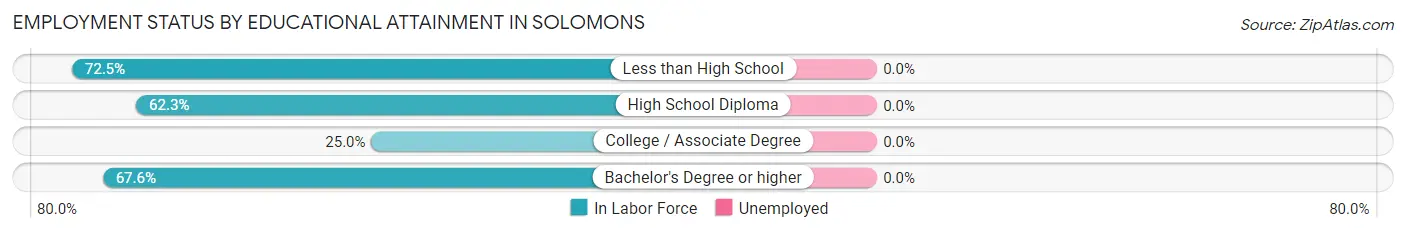
| Educational Attainment | In Labor Force | Unemployed |
| Less than High School | 29 (72.5%) | 0 (0.0%) |
| High School Diploma | 86 (62.3%) | 0 (0.0%) |
| College / Associate Degree | 63 (25.0%) | 0 (0.0%) |
| Bachelor's Degree or higher | 392 (67.6%) | 0 (0.0%) |
| Total | 570 (56.4%) | 0 (0.0%) |
Employment Occupations by Sex in Solomons
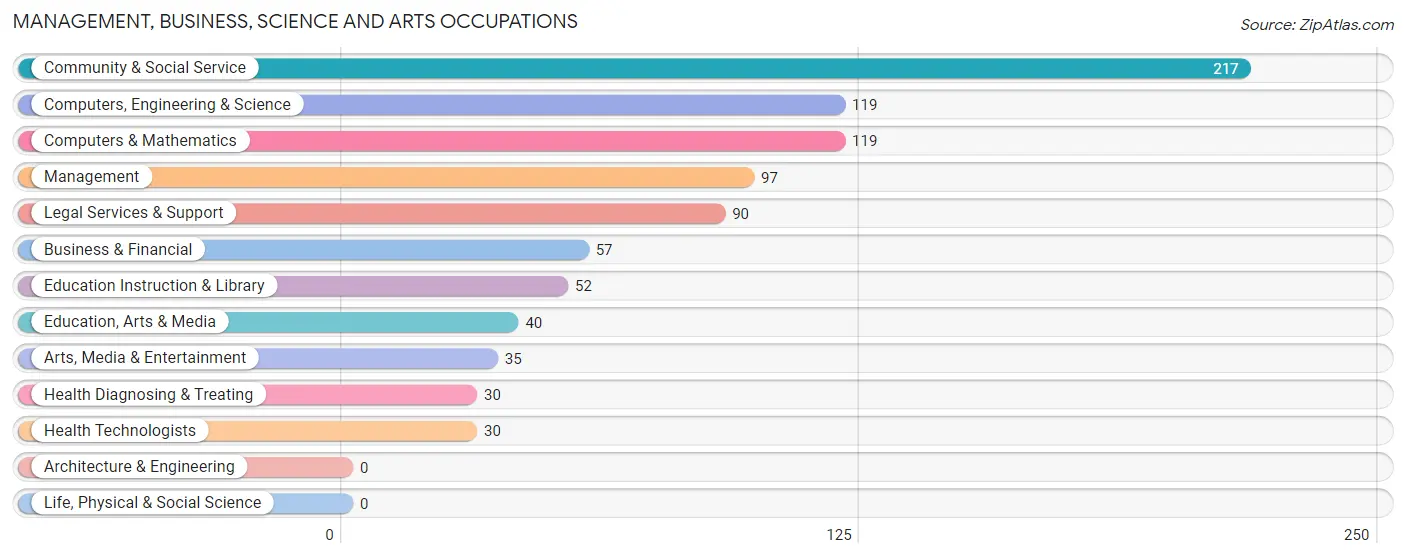
Management, Business, Science and Arts Occupations
The most common Management, Business, Science and Arts occupations in Solomons are Community & Social Service (217 | 33.2%), Computers, Engineering & Science (119 | 18.2%), Computers & Mathematics (119 | 18.2%), Management (97 | 14.8%), and Legal Services & Support (90 | 13.8%).
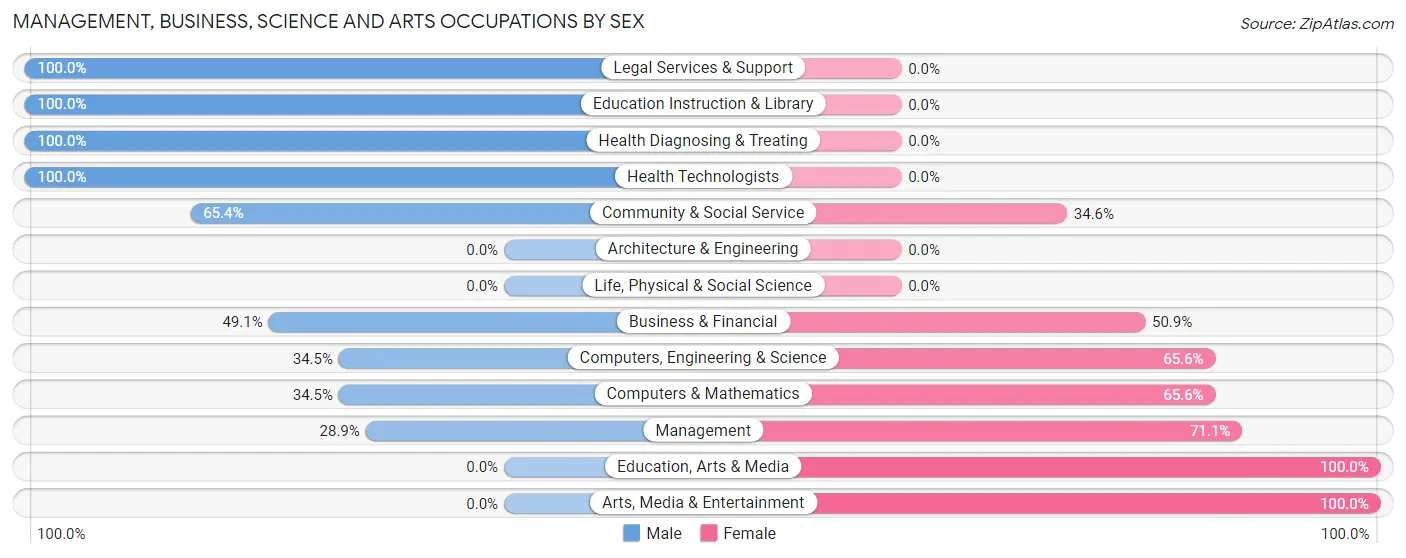
Management, Business, Science and Arts Occupations by Sex
Within the Management, Business, Science and Arts occupations in Solomons, the most male-oriented occupations are Legal Services & Support (100.0%), Education Instruction & Library (100.0%), and Health Diagnosing & Treating (100.0%), while the most female-oriented occupations are Education, Arts & Media (100.0%), Arts, Media & Entertainment (100.0%), and Management (71.1%).
| Occupation | Male | Female |
| Management | 28 (28.9%) | 69 (71.1%) |
| Business & Financial | 28 (49.1%) | 29 (50.9%) |
| Computers, Engineering & Science | 41 (34.4%) | 78 (65.5%) |
| Computers & Mathematics | 41 (34.4%) | 78 (65.5%) |
| Architecture & Engineering | 0 (0.0%) | 0 (0.0%) |
| Life, Physical & Social Science | 0 (0.0%) | 0 (0.0%) |
| Community & Social Service | 142 (65.4%) | 75 (34.6%) |
| Education, Arts & Media | 0 (0.0%) | 40 (100.0%) |
| Legal Services & Support | 90 (100.0%) | 0 (0.0%) |
| Education Instruction & Library | 52 (100.0%) | 0 (0.0%) |
| Arts, Media & Entertainment | 0 (0.0%) | 35 (100.0%) |
| Health Diagnosing & Treating | 30 (100.0%) | 0 (0.0%) |
| Health Technologists | 30 (100.0%) | 0 (0.0%) |
| Total (Category) | 269 (51.7%) | 251 (48.3%) |
| Total (Overall) | 360 (55.0%) | 294 (45.0%) |
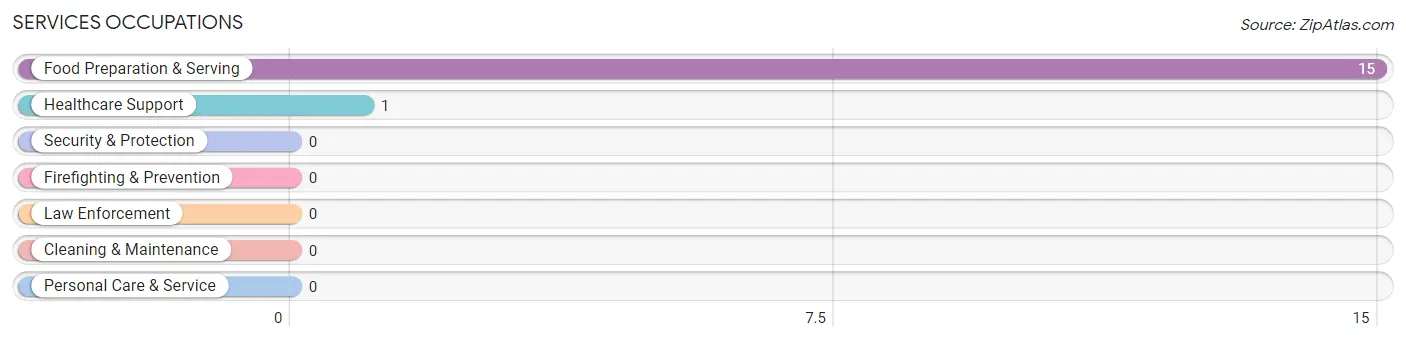
Services Occupations
The most common Services occupations in Solomons are Food Preparation & Serving (15 | 2.3%), and Healthcare Support (1 | 0.2%).
Services Occupations by Sex
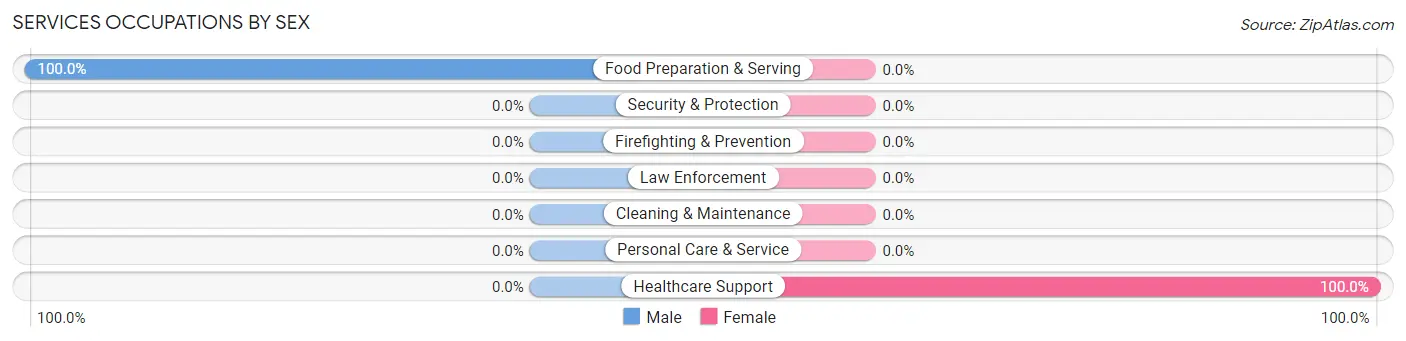
| Occupation | Male | Female |
| Healthcare Support | 0 (0.0%) | 1 (100.0%) |
| Security & Protection | 0 (0.0%) | 0 (0.0%) |
| Firefighting & Prevention | 0 (0.0%) | 0 (0.0%) |
| Law Enforcement | 0 (0.0%) | 0 (0.0%) |
| Food Preparation & Serving | 15 (100.0%) | 0 (0.0%) |
| Cleaning & Maintenance | 0 (0.0%) | 0 (0.0%) |
| Personal Care & Service | 0 (0.0%) | 0 (0.0%) |
| Total (Category) | 15 (93.8%) | 1 (6.2%) |
| Total (Overall) | 360 (55.0%) | 294 (45.0%) |
Sales and Office Occupations
The most common Sales and Office occupations in Solomons are , and Office & Administration (53 | 8.1%).
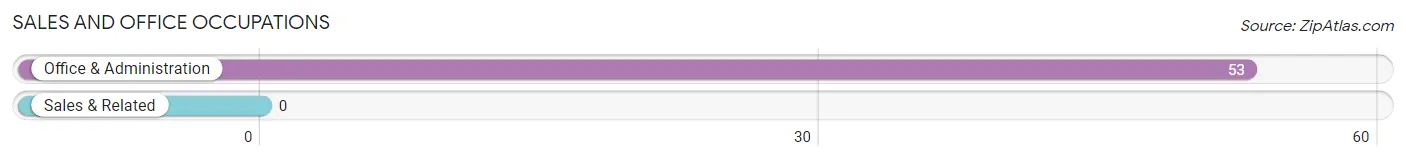
Sales and Office Occupations by Sex
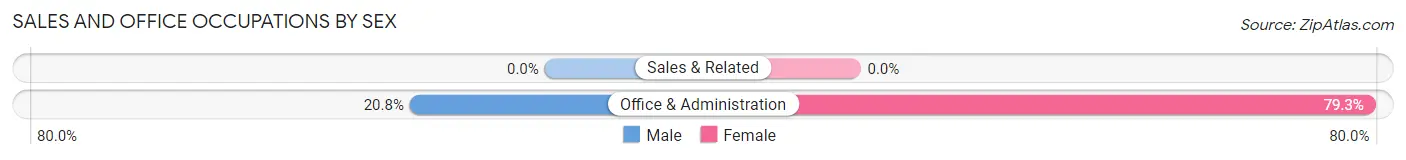
| Occupation | Male | Female |
| Sales & Related | 0 (0.0%) | 0 (0.0%) |
| Office & Administration | 11 (20.7%) | 42 (79.2%) |
| Total (Category) | 11 (20.7%) | 42 (79.2%) |
| Total (Overall) | 360 (55.0%) | 294 (45.0%) |
Natural Resources, Construction and Maintenance Occupations
The most common Natural Resources, Construction and Maintenance occupations in Solomons are Construction & Extraction (40 | 6.1%), and Installation, Maintenance & Repair (10 | 1.5%).
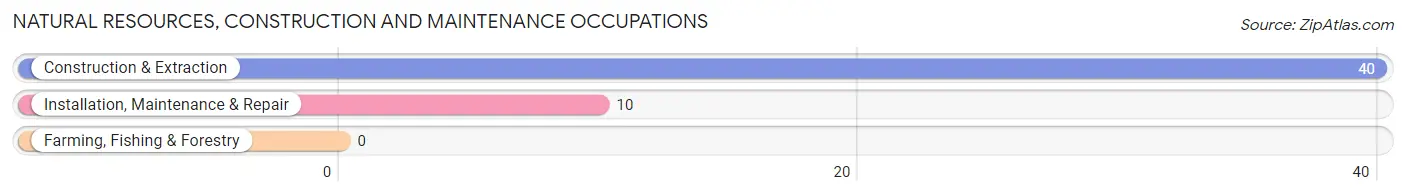
Natural Resources, Construction and Maintenance Occupations by Sex
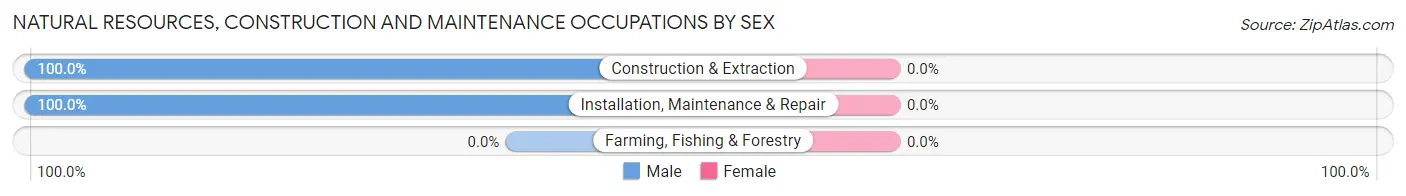
| Occupation | Male | Female |
| Farming, Fishing & Forestry | 0 (0.0%) | 0 (0.0%) |
| Construction & Extraction | 40 (100.0%) | 0 (0.0%) |
| Installation, Maintenance & Repair | 10 (100.0%) | 0 (0.0%) |
| Total (Category) | 50 (100.0%) | 0 (0.0%) |
| Total (Overall) | 360 (55.0%) | 294 (45.0%) |
Production, Transportation and Moving Occupations
The most common Production, Transportation and Moving occupations in Solomons are , and Transportation (15 | 2.3%).
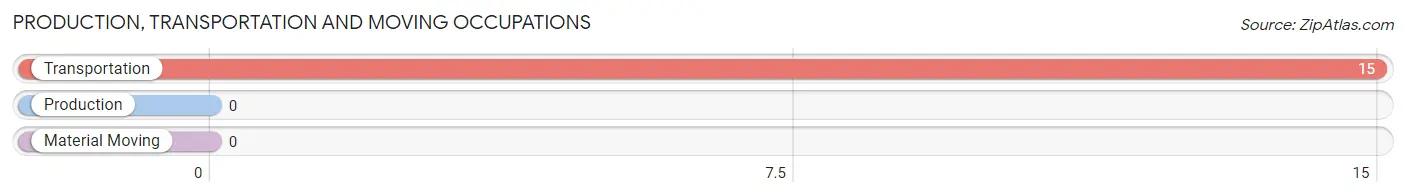
Production, Transportation and Moving Occupations by Sex
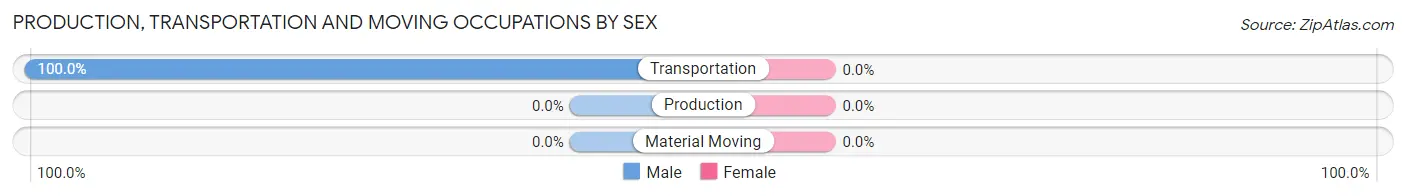
| Occupation | Male | Female |
| Production | 0 (0.0%) | 0 (0.0%) |
| Transportation | 15 (100.0%) | 0 (0.0%) |
| Material Moving | 0 (0.0%) | 0 (0.0%) |
| Total (Category) | 15 (100.0%) | 0 (0.0%) |
| Total (Overall) | 360 (55.0%) | 294 (45.0%) |
Employment Industries by Sex in Solomons
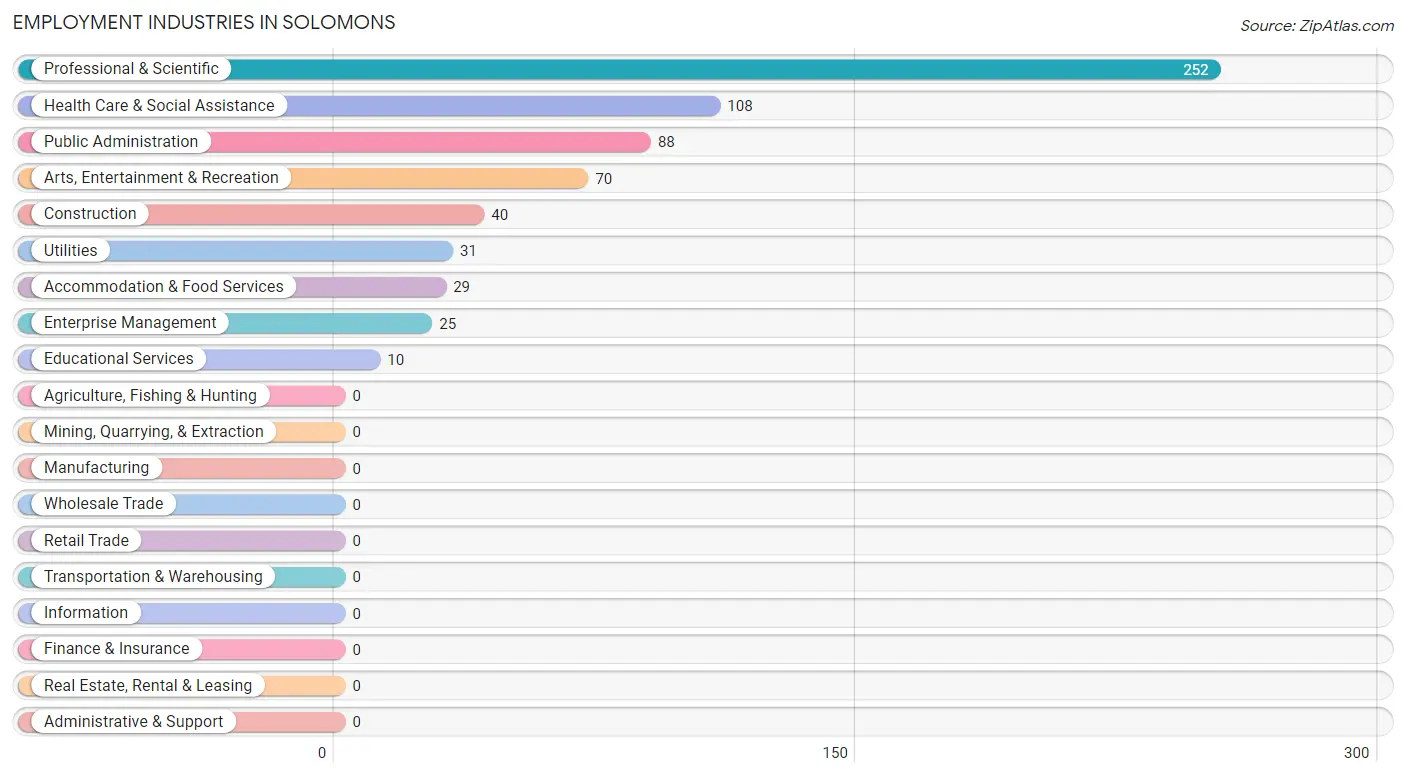
Employment Industries in Solomons
The major employment industries in Solomons include Professional & Scientific (252 | 38.5%), Health Care & Social Assistance (108 | 16.5%), Public Administration (88 | 13.5%), Arts, Entertainment & Recreation (70 | 10.7%), and Construction (40 | 6.1%).
Employment Industries by Sex in Solomons
The Solomons industries that see more men than women are Construction (100.0%), Utilities (100.0%), and Professional & Scientific (63.1%), whereas the industries that tend to have a higher number of women are Enterprise Management (100.0%), Educational Services (100.0%), and Health Care & Social Assistance (58.3%).
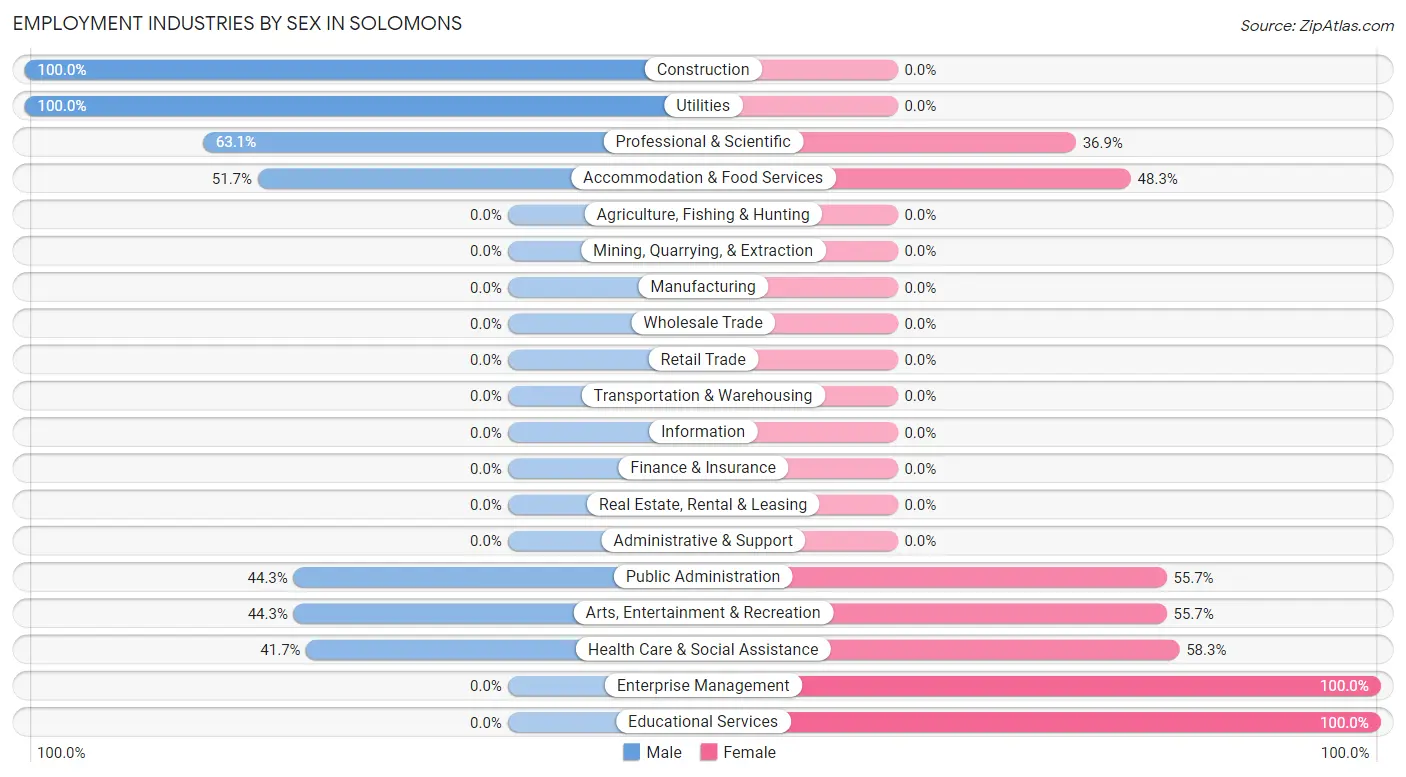
| Industry | Male | Female |
| Agriculture, Fishing & Hunting | 0 (0.0%) | 0 (0.0%) |
| Mining, Quarrying, & Extraction | 0 (0.0%) | 0 (0.0%) |
| Construction | 40 (100.0%) | 0 (0.0%) |
| Manufacturing | 0 (0.0%) | 0 (0.0%) |
| Wholesale Trade | 0 (0.0%) | 0 (0.0%) |
| Retail Trade | 0 (0.0%) | 0 (0.0%) |
| Transportation & Warehousing | 0 (0.0%) | 0 (0.0%) |
| Utilities | 31 (100.0%) | 0 (0.0%) |
| Information | 0 (0.0%) | 0 (0.0%) |
| Finance & Insurance | 0 (0.0%) | 0 (0.0%) |
| Real Estate, Rental & Leasing | 0 (0.0%) | 0 (0.0%) |
| Professional & Scientific | 159 (63.1%) | 93 (36.9%) |
| Enterprise Management | 0 (0.0%) | 25 (100.0%) |
| Administrative & Support | 0 (0.0%) | 0 (0.0%) |
| Educational Services | 0 (0.0%) | 10 (100.0%) |
| Health Care & Social Assistance | 45 (41.7%) | 63 (58.3%) |
| Arts, Entertainment & Recreation | 31 (44.3%) | 39 (55.7%) |
| Accommodation & Food Services | 15 (51.7%) | 14 (48.3%) |
| Public Administration | 39 (44.3%) | 49 (55.7%) |
| Total | 360 (55.0%) | 294 (45.0%) |
Education in Solomons
School Enrollment in Solomons
The most common levels of schooling among the 342 students in Solomons are college / undergraduate (164 | 47.9%), graduate / professional (73 | 21.3%), and elementary school (61 | 17.8%).
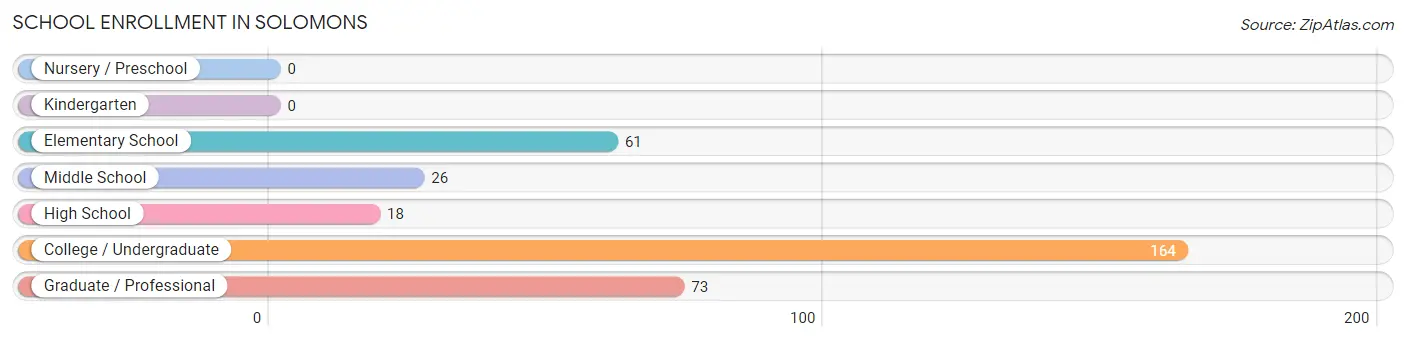
| School Level | # Students | % Students |
| Nursery / Preschool | 0 | 0.0% |
| Kindergarten | 0 | 0.0% |
| Elementary School | 61 | 17.8% |
| Middle School | 26 | 7.6% |
| High School | 18 | 5.3% |
| College / Undergraduate | 164 | 47.9% |
| Graduate / Professional | 73 | 21.3% |
| Total | 342 | 100.0% |
School Enrollment by Age by Funding Source in Solomons
Out of a total of 342 students who are enrolled in schools in Solomons, 122 (35.7%) attend a private institution, while the remaining 220 (64.3%) are enrolled in public schools. The age group of 35 years and over has the highest likelihood of being enrolled in private schools, with 73 (100.0% in the age bracket) enrolled. Conversely, the age group of 10 to 14 year olds has the lowest likelihood of being enrolled in a private school, with 26 (100.0% in the age bracket) attending a public institution.
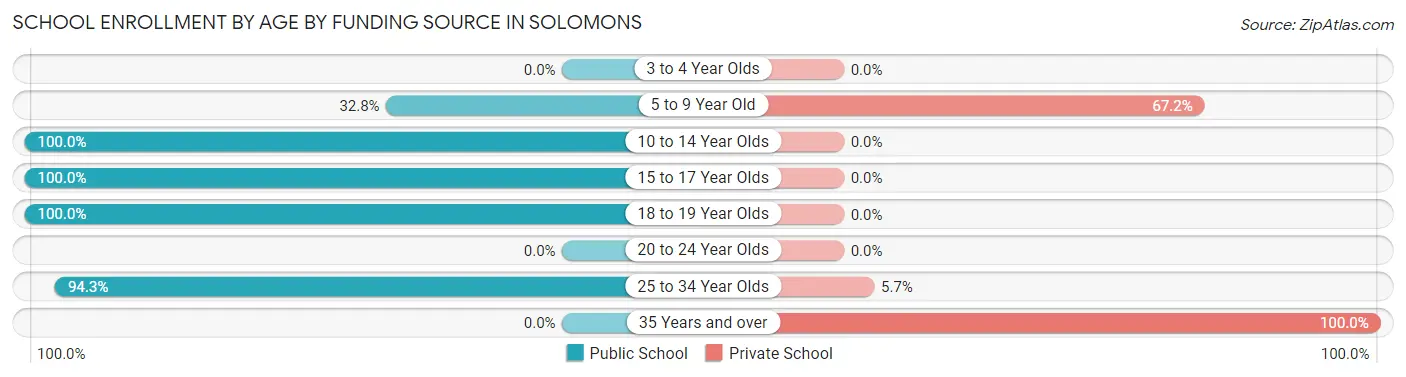
| Age Bracket | Public School | Private School |
| 3 to 4 Year Olds | 0 (0.0%) | 0 (0.0%) |
| 5 to 9 Year Old | 20 (32.8%) | 41 (67.2%) |
| 10 to 14 Year Olds | 26 (100.0%) | 0 (0.0%) |
| 15 to 17 Year Olds | 18 (100.0%) | 0 (0.0%) |
| 18 to 19 Year Olds | 23 (100.0%) | 0 (0.0%) |
| 20 to 24 Year Olds | 0 (0.0%) | 0 (0.0%) |
| 25 to 34 Year Olds | 133 (94.3%) | 8 (5.7%) |
| 35 Years and over | 0 (0.0%) | 73 (100.0%) |
| Total | 220 (64.3%) | 122 (35.7%) |
Educational Attainment by Field of Study in Solomons
Business (174 | 16.0%), visual & performing arts (169 | 15.5%), social sciences (141 | 13.0%), engineering (126 | 11.6%), and education (96 | 8.8%) are the most common fields of study among 1,089 individuals in Solomons who have obtained a bachelor's degree or higher.
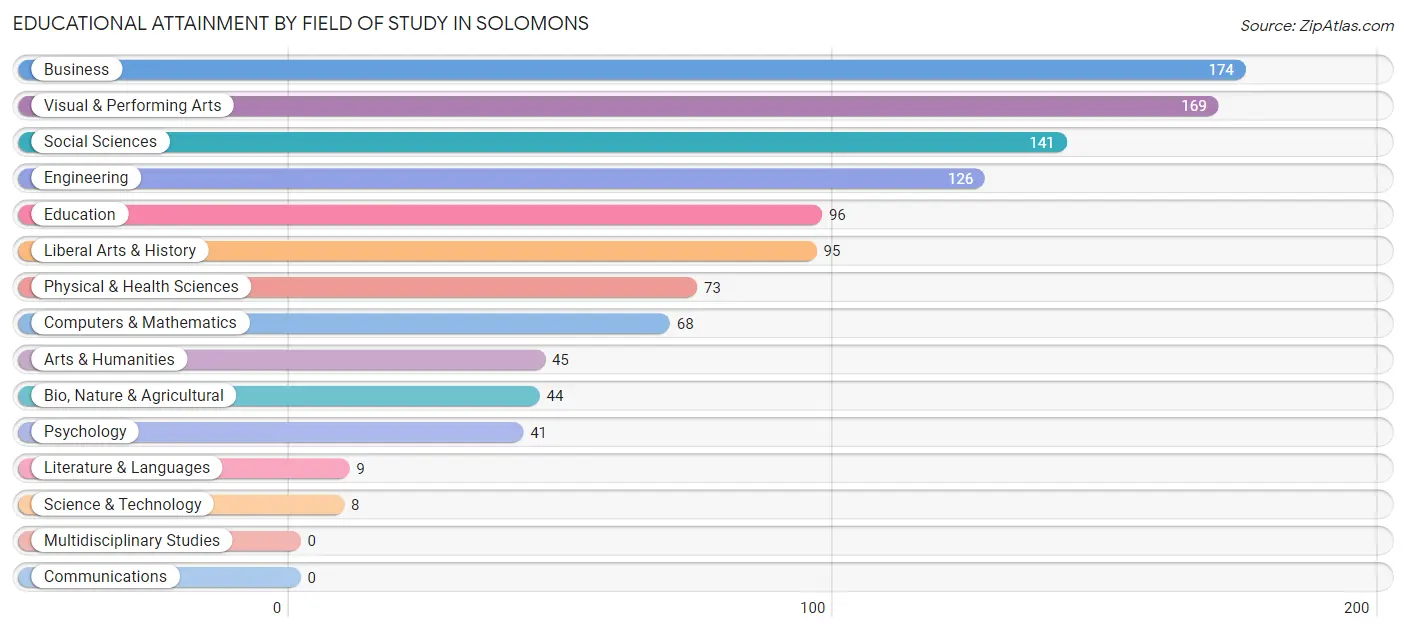
| Field of Study | # Graduates | % Graduates |
| Computers & Mathematics | 68 | 6.2% |
| Bio, Nature & Agricultural | 44 | 4.0% |
| Physical & Health Sciences | 73 | 6.7% |
| Psychology | 41 | 3.8% |
| Social Sciences | 141 | 13.0% |
| Engineering | 126 | 11.6% |
| Multidisciplinary Studies | 0 | 0.0% |
| Science & Technology | 8 | 0.7% |
| Business | 174 | 16.0% |
| Education | 96 | 8.8% |
| Literature & Languages | 9 | 0.8% |
| Liberal Arts & History | 95 | 8.7% |
| Visual & Performing Arts | 169 | 15.5% |
| Communications | 0 | 0.0% |
| Arts & Humanities | 45 | 4.1% |
| Total | 1,089 | 100.0% |
Transportation & Commute in Solomons
Vehicle Availability by Sex in Solomons
The most prevalent vehicle ownership categories in Solomons are males with 2 vehicles (183, accounting for 47.0%) and females with 2 vehicles (177, making up 62.5%).
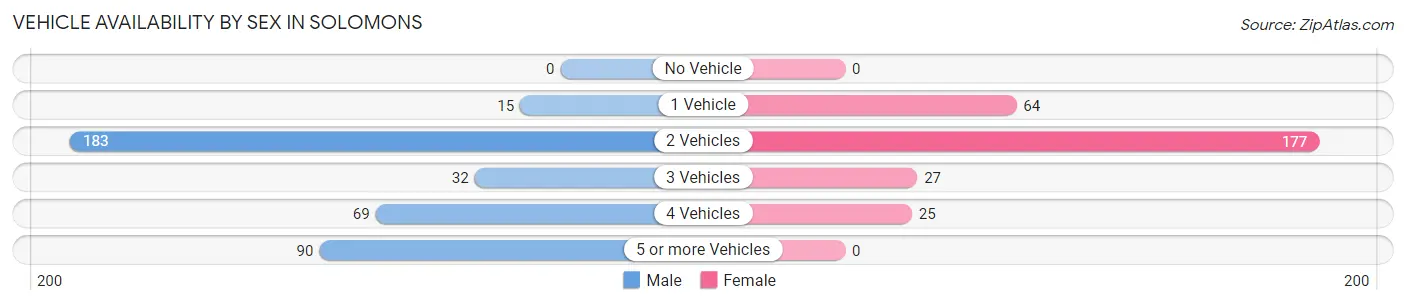
| Vehicles Available | Male | Female |
| No Vehicle | 0 (0.0%) | 0 (0.0%) |
| 1 Vehicle | 15 (3.9%) | 64 (21.8%) |
| 2 Vehicles | 183 (47.0%) | 177 (60.4%) |
| 3 Vehicles | 32 (8.2%) | 27 (9.2%) |
| 4 Vehicles | 69 (17.7%) | 25 (8.5%) |
| 5 or more Vehicles | 90 (23.1%) | 0 (0.0%) |
| Total | 389 (100.0%) | 293 (100.0%) |
Commute Time in Solomons
The most frequently occuring commute durations in Solomons are 30 to 34 minutes (81 commuters, 18.4%), 5 to 9 minutes (79 commuters, 17.9%), and 15 to 19 minutes (79 commuters, 17.9%).
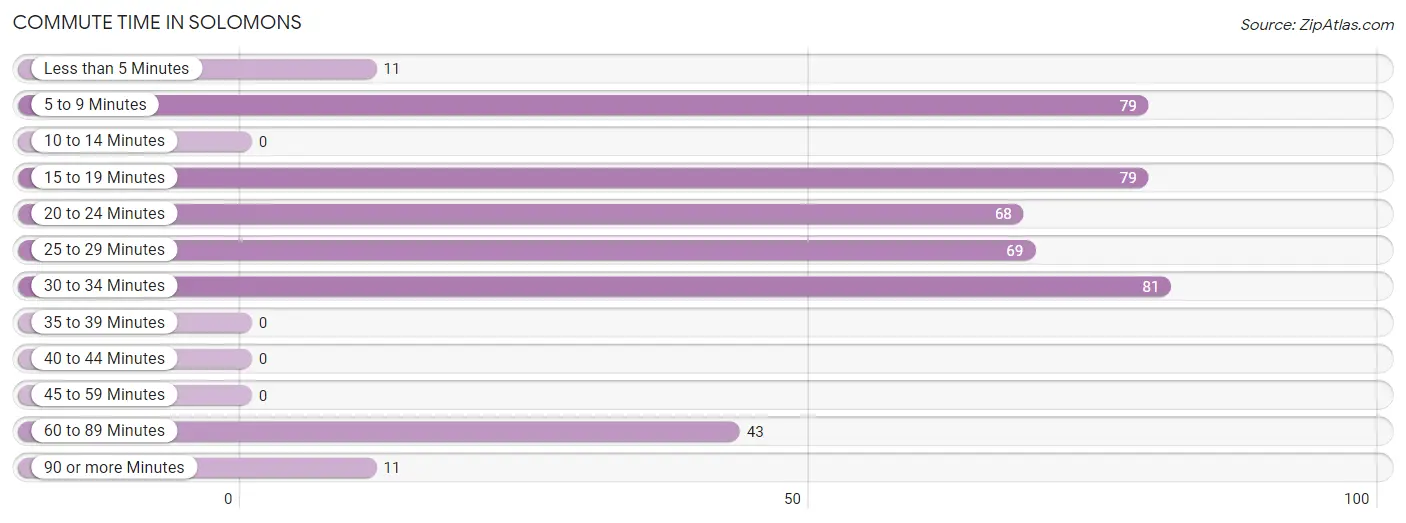
| Commute Time | # Commuters | % Commuters |
| Less than 5 Minutes | 11 | 2.5% |
| 5 to 9 Minutes | 79 | 17.9% |
| 10 to 14 Minutes | 0 | 0.0% |
| 15 to 19 Minutes | 79 | 17.9% |
| 20 to 24 Minutes | 68 | 15.4% |
| 25 to 29 Minutes | 69 | 15.7% |
| 30 to 34 Minutes | 81 | 18.4% |
| 35 to 39 Minutes | 0 | 0.0% |
| 40 to 44 Minutes | 0 | 0.0% |
| 45 to 59 Minutes | 0 | 0.0% |
| 60 to 89 Minutes | 43 | 9.8% |
| 90 or more Minutes | 11 | 2.5% |
Commute Time by Sex in Solomons
The most common commute times in Solomons are 30 to 34 minutes (81 commuters, 33.5%) for males and 5 to 9 minutes (49 commuters, 24.6%) for females.
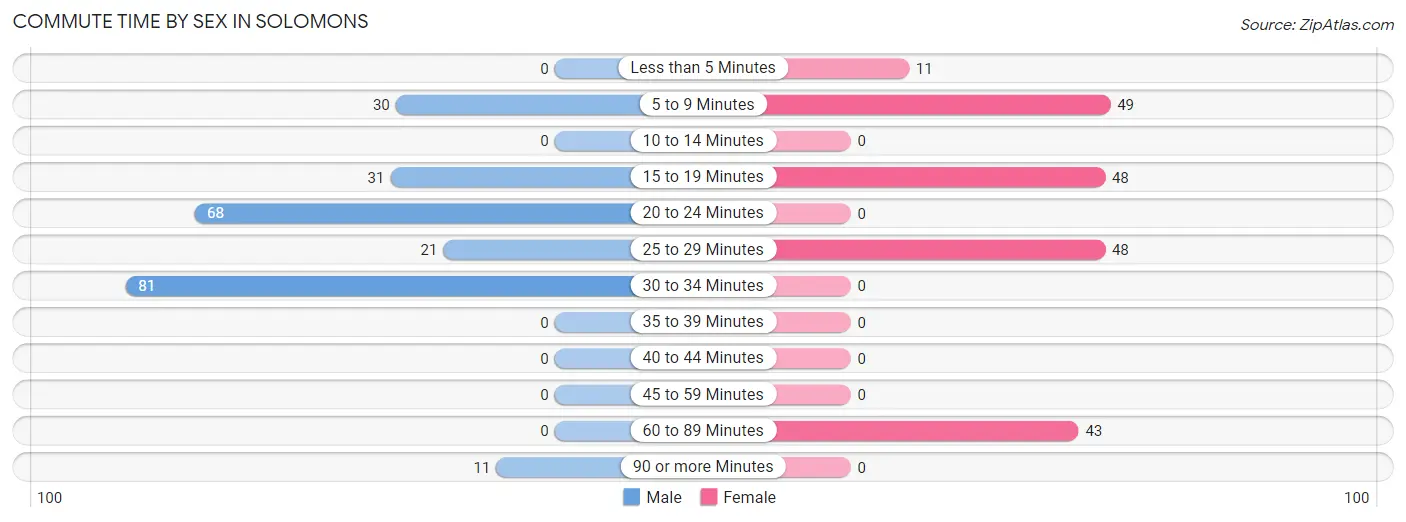
| Commute Time | Male | Female |
| Less than 5 Minutes | 0 (0.0%) | 11 (5.5%) |
| 5 to 9 Minutes | 30 (12.4%) | 49 (24.6%) |
| 10 to 14 Minutes | 0 (0.0%) | 0 (0.0%) |
| 15 to 19 Minutes | 31 (12.8%) | 48 (24.1%) |
| 20 to 24 Minutes | 68 (28.1%) | 0 (0.0%) |
| 25 to 29 Minutes | 21 (8.7%) | 48 (24.1%) |
| 30 to 34 Minutes | 81 (33.5%) | 0 (0.0%) |
| 35 to 39 Minutes | 0 (0.0%) | 0 (0.0%) |
| 40 to 44 Minutes | 0 (0.0%) | 0 (0.0%) |
| 45 to 59 Minutes | 0 (0.0%) | 0 (0.0%) |
| 60 to 89 Minutes | 0 (0.0%) | 43 (21.6%) |
| 90 or more Minutes | 11 (4.5%) | 0 (0.0%) |
Time of Departure to Work by Sex in Solomons
The most frequent times of departure to work in Solomons are 7:30 AM to 7:59 AM (121, 50.0%) for males and 7:30 AM to 7:59 AM (42, 21.1%) for females.
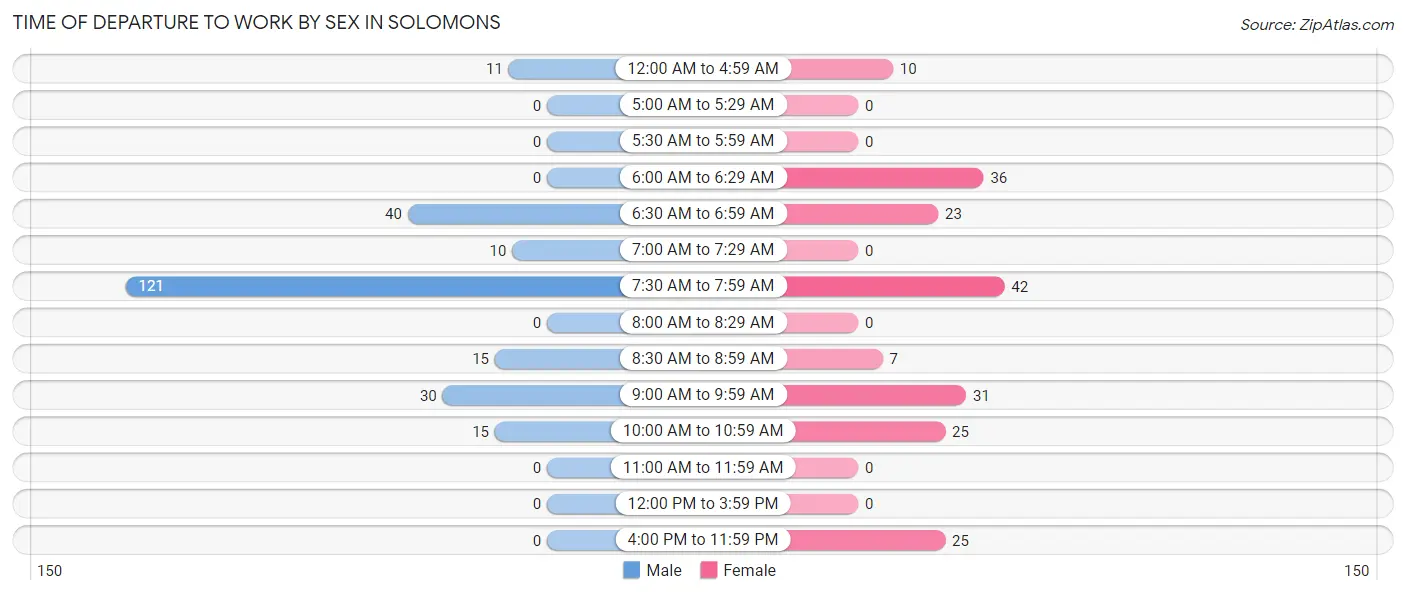
| Time of Departure | Male | Female |
| 12:00 AM to 4:59 AM | 11 (4.5%) | 10 (5.0%) |
| 5:00 AM to 5:29 AM | 0 (0.0%) | 0 (0.0%) |
| 5:30 AM to 5:59 AM | 0 (0.0%) | 0 (0.0%) |
| 6:00 AM to 6:29 AM | 0 (0.0%) | 36 (18.1%) |
| 6:30 AM to 6:59 AM | 40 (16.5%) | 23 (11.6%) |
| 7:00 AM to 7:29 AM | 10 (4.1%) | 0 (0.0%) |
| 7:30 AM to 7:59 AM | 121 (50.0%) | 42 (21.1%) |
| 8:00 AM to 8:29 AM | 0 (0.0%) | 0 (0.0%) |
| 8:30 AM to 8:59 AM | 15 (6.2%) | 7 (3.5%) |
| 9:00 AM to 9:59 AM | 30 (12.4%) | 31 (15.6%) |
| 10:00 AM to 10:59 AM | 15 (6.2%) | 25 (12.6%) |
| 11:00 AM to 11:59 AM | 0 (0.0%) | 0 (0.0%) |
| 12:00 PM to 3:59 PM | 0 (0.0%) | 0 (0.0%) |
| 4:00 PM to 11:59 PM | 0 (0.0%) | 25 (12.6%) |
| Total | 242 (100.0%) | 199 (100.0%) |
Housing Occupancy in Solomons
Occupancy by Ownership in Solomons
Of the total 1,089 dwellings in Solomons, owner-occupied units account for 757 (69.5%), while renter-occupied units make up 332 (30.5%).
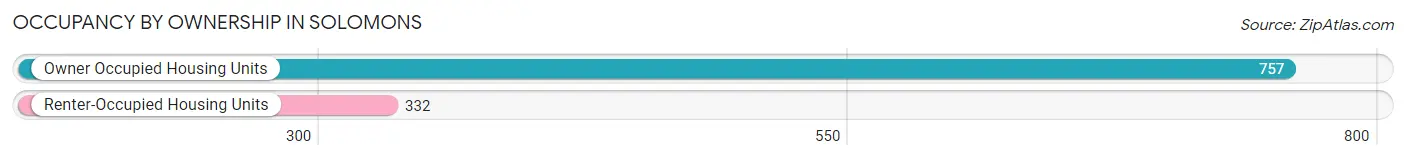
| Occupancy | # Housing Units | % Housing Units |
| Owner Occupied Housing Units | 757 | 69.5% |
| Renter-Occupied Housing Units | 332 | 30.5% |
| Total Occupied Housing Units | 1,089 | 100.0% |
Occupancy by Household Size in Solomons
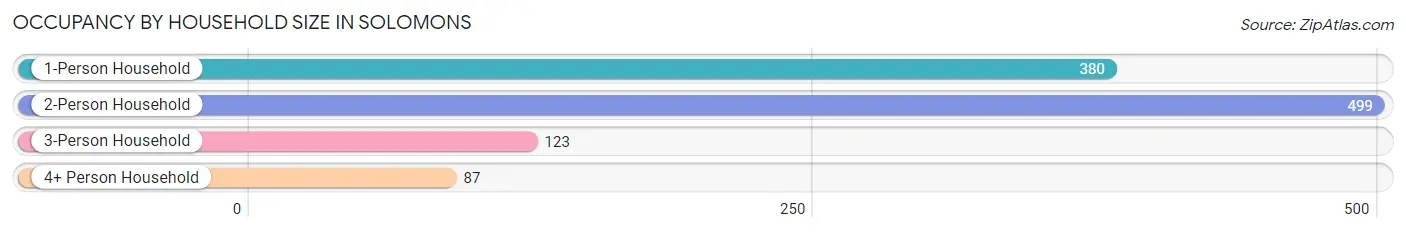
| Household Size | # Housing Units | % Housing Units |
| 1-Person Household | 380 | 34.9% |
| 2-Person Household | 499 | 45.8% |
| 3-Person Household | 123 | 11.3% |
| 4+ Person Household | 87 | 8.0% |
| Total Housing Units | 1,089 | 100.0% |
Occupancy by Ownership by Household Size in Solomons
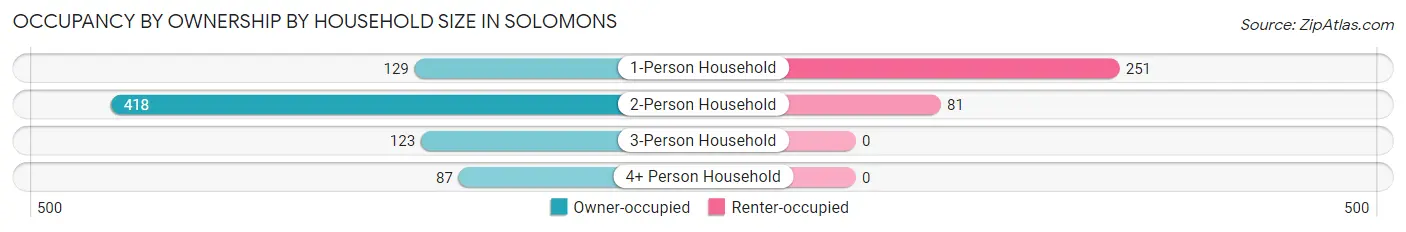
| Household Size | Owner-occupied | Renter-occupied |
| 1-Person Household | 129 (34.0%) | 251 (66.0%) |
| 2-Person Household | 418 (83.8%) | 81 (16.2%) |
| 3-Person Household | 123 (100.0%) | 0 (0.0%) |
| 4+ Person Household | 87 (100.0%) | 0 (0.0%) |
| Total Housing Units | 757 (69.5%) | 332 (30.5%) |
Occupancy by Educational Attainment in Solomons
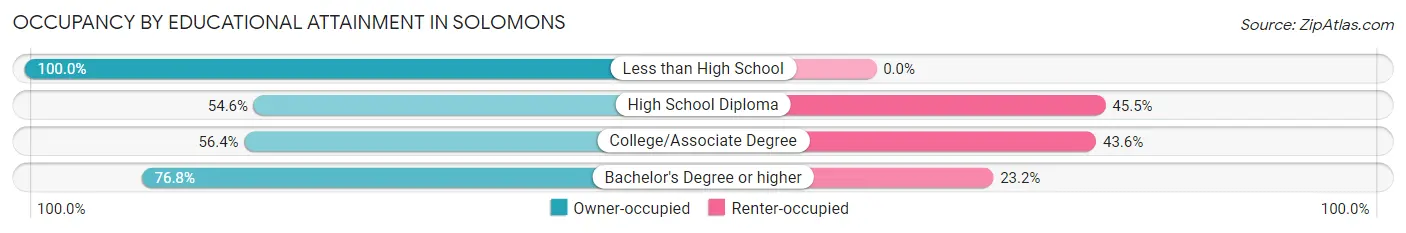
| Household Size | Owner-occupied | Renter-occupied |
| Less than High School | 14 (100.0%) | 0 (0.0%) |
| High School Diploma | 66 (54.5%) | 55 (45.5%) |
| College/Associate Degree | 154 (56.4%) | 119 (43.6%) |
| Bachelor's Degree or higher | 523 (76.8%) | 158 (23.2%) |
Occupancy by Age of Householder in Solomons
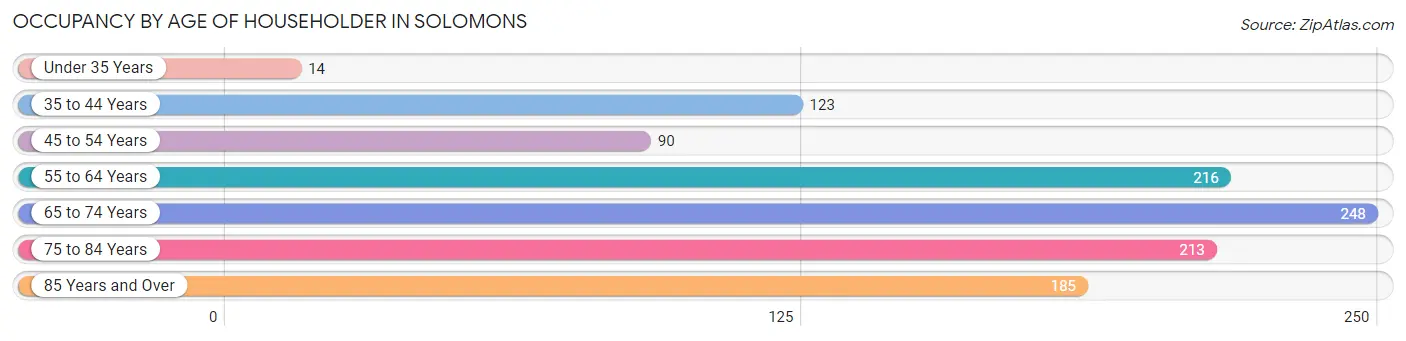
| Age Bracket | # Households | % Households |
| Under 35 Years | 14 | 1.3% |
| 35 to 44 Years | 123 | 11.3% |
| 45 to 54 Years | 90 | 8.3% |
| 55 to 64 Years | 216 | 19.8% |
| 65 to 74 Years | 248 | 22.8% |
| 75 to 84 Years | 213 | 19.6% |
| 85 Years and Over | 185 | 17.0% |
| Total | 1,089 | 100.0% |
Housing Finances in Solomons
Median Income by Occupancy in Solomons
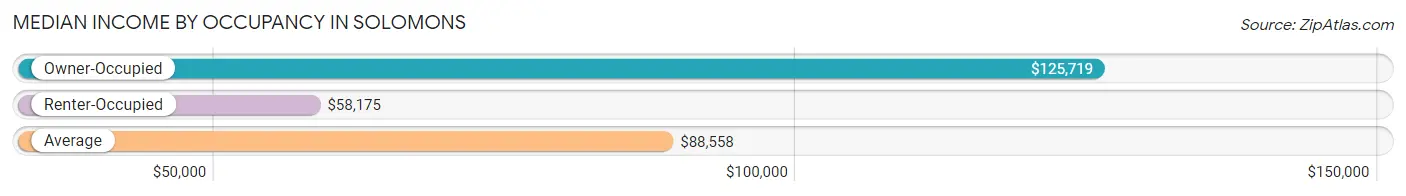
| Occupancy Type | # Households | Median Income |
| Owner-Occupied | 757 (69.5%) | $125,719 |
| Renter-Occupied | 332 (30.5%) | $58,175 |
| Average | 1,089 (100.0%) | $88,558 |
Occupancy by Householder Income Bracket in Solomons
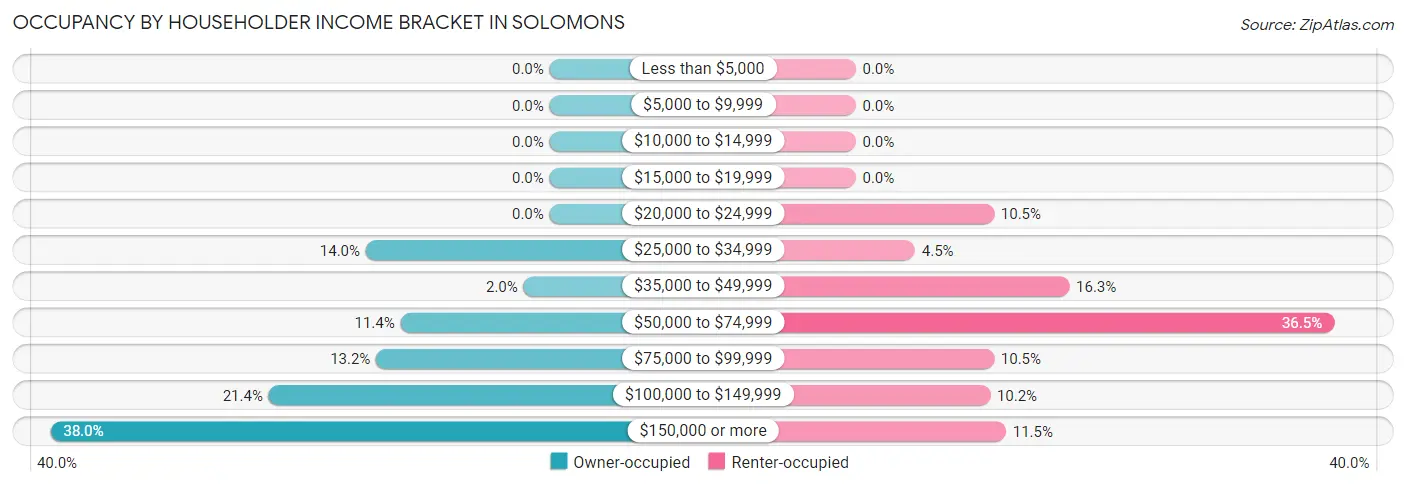
| Income Bracket | Owner-occupied | Renter-occupied |
| Less than $5,000 | 0 (0.0%) | 0 (0.0%) |
| $5,000 to $9,999 | 0 (0.0%) | 0 (0.0%) |
| $10,000 to $14,999 | 0 (0.0%) | 0 (0.0%) |
| $15,000 to $19,999 | 0 (0.0%) | 0 (0.0%) |
| $20,000 to $24,999 | 0 (0.0%) | 35 (10.5%) |
| $25,000 to $34,999 | 106 (14.0%) | 15 (4.5%) |
| $35,000 to $49,999 | 15 (2.0%) | 54 (16.3%) |
| $50,000 to $74,999 | 86 (11.4%) | 121 (36.4%) |
| $75,000 to $99,999 | 100 (13.2%) | 35 (10.5%) |
| $100,000 to $149,999 | 162 (21.4%) | 34 (10.2%) |
| $150,000 or more | 288 (38.0%) | 38 (11.5%) |
| Total | 757 (100.0%) | 332 (100.0%) |
Monthly Housing Cost Tiers in Solomons
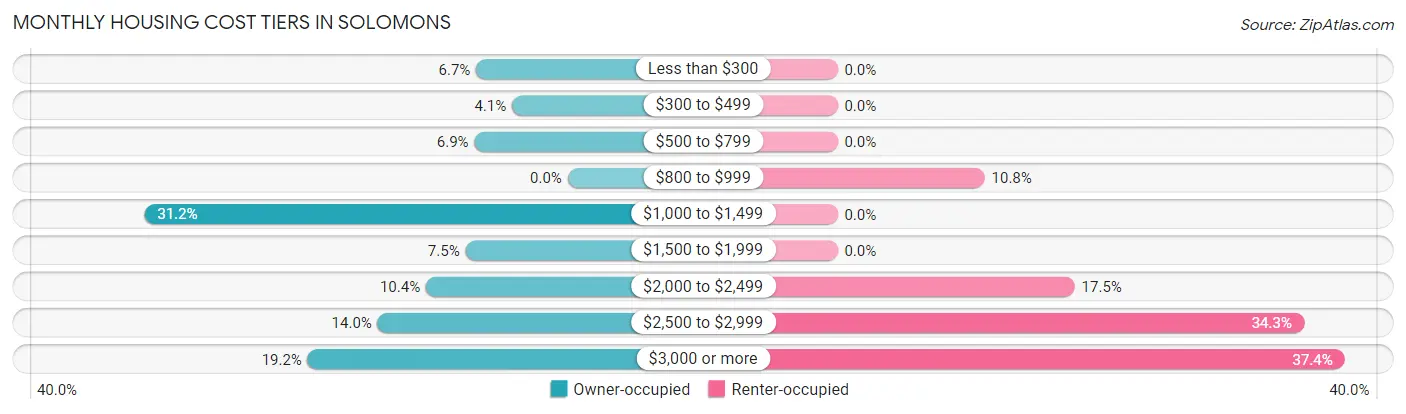
| Monthly Cost | Owner-occupied | Renter-occupied |
| Less than $300 | 51 (6.7%) | 0 (0.0%) |
| $300 to $499 | 31 (4.1%) | 0 (0.0%) |
| $500 to $799 | 52 (6.9%) | 0 (0.0%) |
| $800 to $999 | 0 (0.0%) | 36 (10.8%) |
| $1,000 to $1,499 | 236 (31.2%) | 0 (0.0%) |
| $1,500 to $1,999 | 57 (7.5%) | 0 (0.0%) |
| $2,000 to $2,499 | 79 (10.4%) | 58 (17.5%) |
| $2,500 to $2,999 | 106 (14.0%) | 114 (34.3%) |
| $3,000 or more | 145 (19.2%) | 124 (37.3%) |
| Total | 757 (100.0%) | 332 (100.0%) |
Physical Housing Characteristics in Solomons
Housing Structures in Solomons
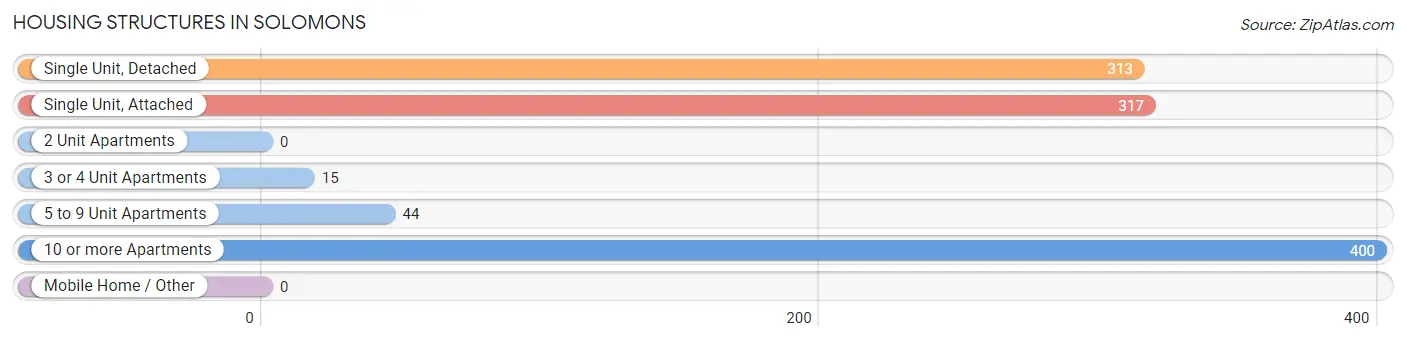
| Structure Type | # Housing Units | % Housing Units |
| Single Unit, Detached | 313 | 28.7% |
| Single Unit, Attached | 317 | 29.1% |
| 2 Unit Apartments | 0 | 0.0% |
| 3 or 4 Unit Apartments | 15 | 1.4% |
| 5 to 9 Unit Apartments | 44 | 4.0% |
| 10 or more Apartments | 400 | 36.7% |
| Mobile Home / Other | 0 | 0.0% |
| Total | 1,089 | 100.0% |
Housing Structures by Occupancy in Solomons
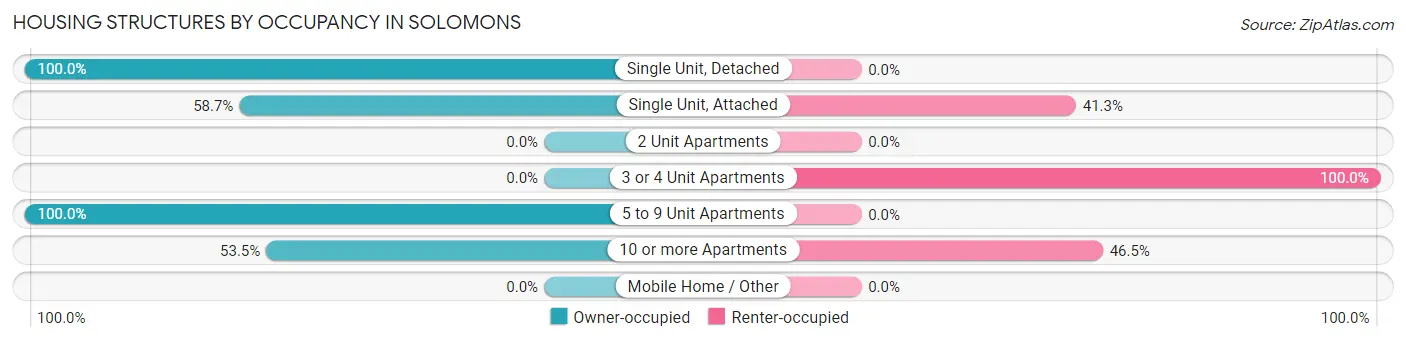
| Structure Type | Owner-occupied | Renter-occupied |
| Single Unit, Detached | 313 (100.0%) | 0 (0.0%) |
| Single Unit, Attached | 186 (58.7%) | 131 (41.3%) |
| 2 Unit Apartments | 0 (0.0%) | 0 (0.0%) |
| 3 or 4 Unit Apartments | 0 (0.0%) | 15 (100.0%) |
| 5 to 9 Unit Apartments | 44 (100.0%) | 0 (0.0%) |
| 10 or more Apartments | 214 (53.5%) | 186 (46.5%) |
| Mobile Home / Other | 0 (0.0%) | 0 (0.0%) |
| Total | 757 (69.5%) | 332 (30.5%) |
Housing Structures by Number of Rooms in Solomons
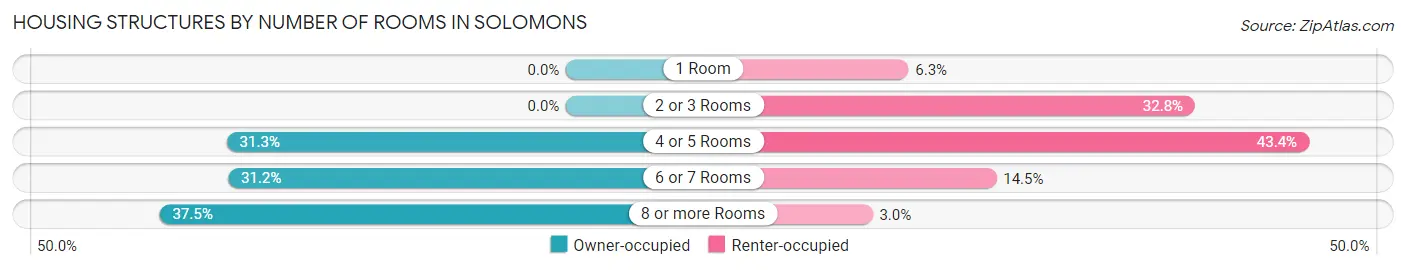
| Number of Rooms | Owner-occupied | Renter-occupied |
| 1 Room | 0 (0.0%) | 21 (6.3%) |
| 2 or 3 Rooms | 0 (0.0%) | 109 (32.8%) |
| 4 or 5 Rooms | 237 (31.3%) | 144 (43.4%) |
| 6 or 7 Rooms | 236 (31.2%) | 48 (14.5%) |
| 8 or more Rooms | 284 (37.5%) | 10 (3.0%) |
| Total | 757 (100.0%) | 332 (100.0%) |
Housing Structure by Heating Type in Solomons
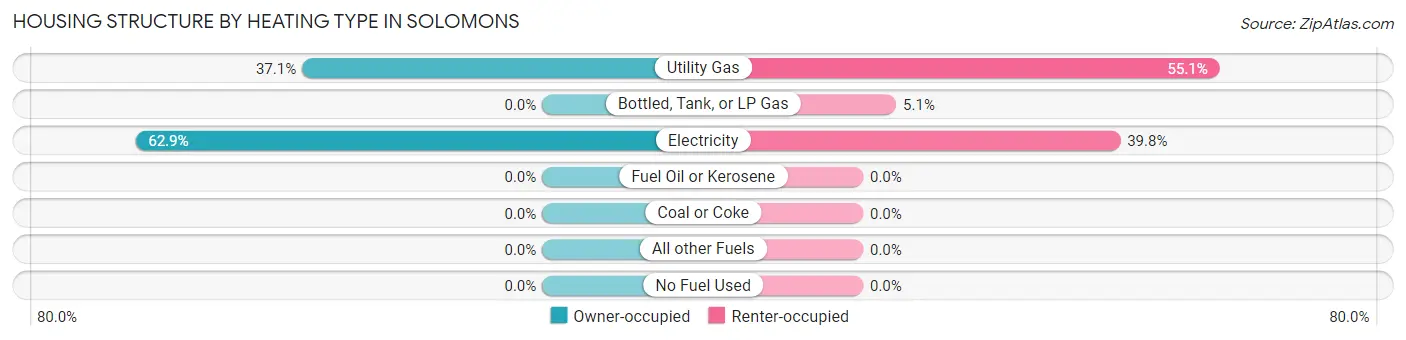
| Heating Type | Owner-occupied | Renter-occupied |
| Utility Gas | 281 (37.1%) | 183 (55.1%) |
| Bottled, Tank, or LP Gas | 0 (0.0%) | 17 (5.1%) |
| Electricity | 476 (62.9%) | 132 (39.8%) |
| Fuel Oil or Kerosene | 0 (0.0%) | 0 (0.0%) |
| Coal or Coke | 0 (0.0%) | 0 (0.0%) |
| All other Fuels | 0 (0.0%) | 0 (0.0%) |
| No Fuel Used | 0 (0.0%) | 0 (0.0%) |
| Total | 757 (100.0%) | 332 (100.0%) |
Household Vehicle Usage in Solomons
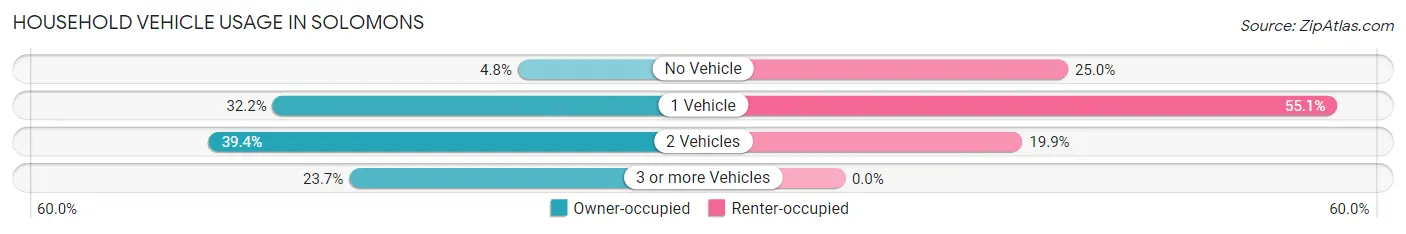
| Vehicles per Household | Owner-occupied | Renter-occupied |
| No Vehicle | 36 (4.8%) | 83 (25.0%) |
| 1 Vehicle | 244 (32.2%) | 183 (55.1%) |
| 2 Vehicles | 298 (39.4%) | 66 (19.9%) |
| 3 or more Vehicles | 179 (23.6%) | 0 (0.0%) |
| Total | 757 (100.0%) | 332 (100.0%) |
Real Estate & Mortgages in Solomons
Real Estate and Mortgage Overview in Solomons
| Characteristic | Without Mortgage | With Mortgage |
| Housing Units | 356 | 401 |
| Median Property Value | $561,000 | $445,400 |
| Median Household Income | - | - |
| Monthly Housing Costs | $1,204 | $145 |
| Real Estate Taxes | $4,736 | $0 |
Property Value by Mortgage Status in Solomons
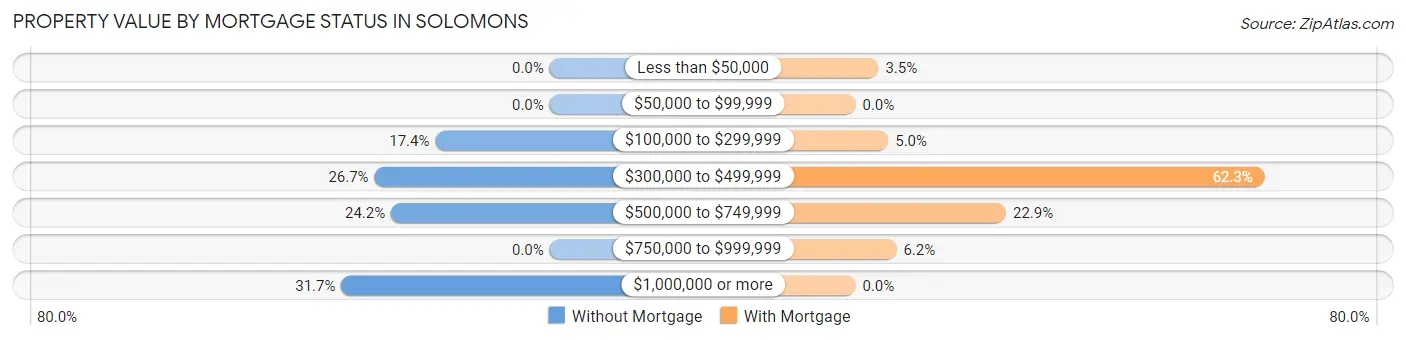
| Property Value | Without Mortgage | With Mortgage |
| Less than $50,000 | 0 (0.0%) | 14 (3.5%) |
| $50,000 to $99,999 | 0 (0.0%) | 0 (0.0%) |
| $100,000 to $299,999 | 62 (17.4%) | 20 (5.0%) |
| $300,000 to $499,999 | 95 (26.7%) | 250 (62.3%) |
| $500,000 to $749,999 | 86 (24.2%) | 92 (22.9%) |
| $750,000 to $999,999 | 0 (0.0%) | 25 (6.2%) |
| $1,000,000 or more | 113 (31.7%) | 0 (0.0%) |
| Total | 356 (100.0%) | 401 (100.0%) |
Household Income by Mortgage Status in Solomons
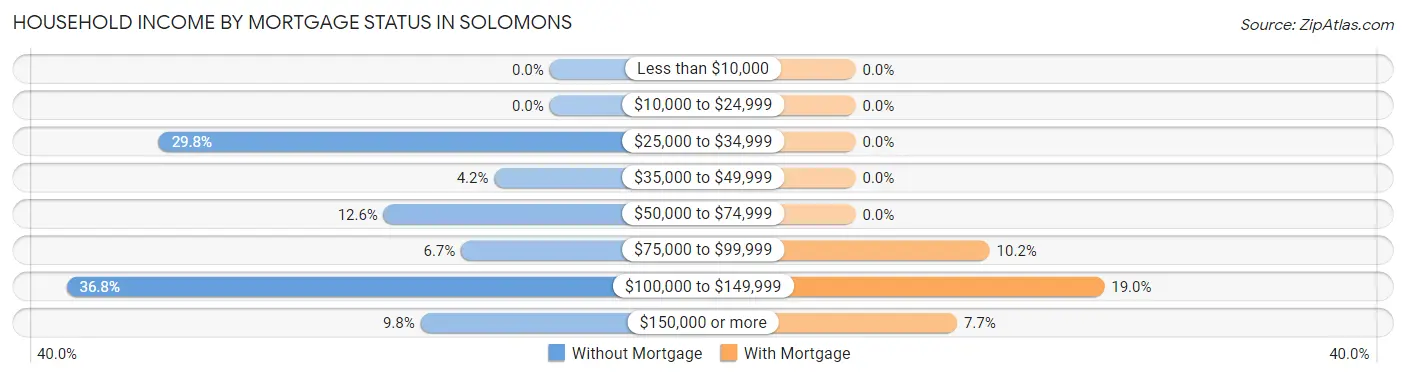
| Household Income | Without Mortgage | With Mortgage |
| Less than $10,000 | 0 (0.0%) | 0 (0.0%) |
| $10,000 to $24,999 | 0 (0.0%) | 0 (0.0%) |
| $25,000 to $34,999 | 106 (29.8%) | 0 (0.0%) |
| $35,000 to $49,999 | 15 (4.2%) | 0 (0.0%) |
| $50,000 to $74,999 | 45 (12.6%) | 0 (0.0%) |
| $75,000 to $99,999 | 24 (6.7%) | 41 (10.2%) |
| $100,000 to $149,999 | 131 (36.8%) | 76 (19.0%) |
| $150,000 or more | 35 (9.8%) | 31 (7.7%) |
| Total | 356 (100.0%) | 401 (100.0%) |
Property Value to Household Income Ratio in Solomons
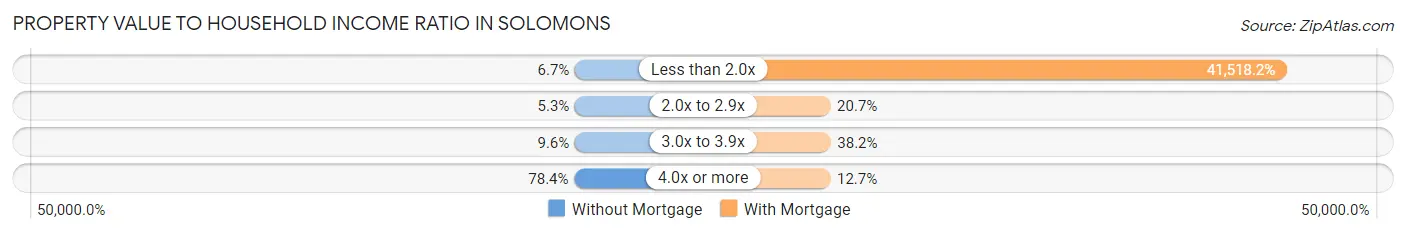
| Value-to-Income Ratio | Without Mortgage | With Mortgage |
| Less than 2.0x | 24 (6.7%) | 166,488 (41,518.2%) |
| 2.0x to 2.9x | 19 (5.3%) | 83 (20.7%) |
| 3.0x to 3.9x | 34 (9.6%) | 153 (38.2%) |
| 4.0x or more | 279 (78.4%) | 51 (12.7%) |
| Total | 356 (100.0%) | 401 (100.0%) |
Real Estate Taxes by Mortgage Status in Solomons
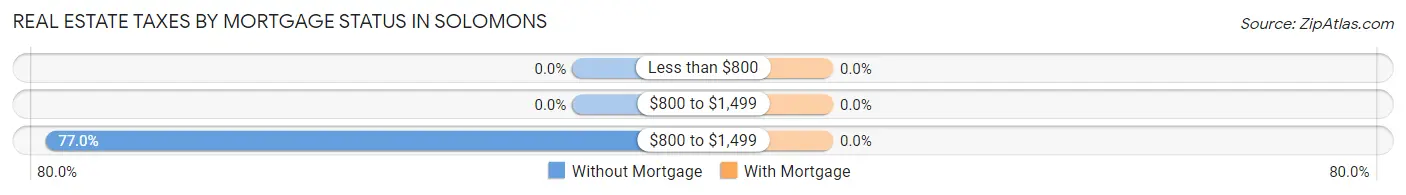
| Property Taxes | Without Mortgage | With Mortgage |
| Less than $800 | 0 (0.0%) | 0 (0.0%) |
| $800 to $1,499 | 0 (0.0%) | 0 (0.0%) |
| $800 to $1,499 | 274 (77.0%) | 0 (0.0%) |
| Total | 356 (100.0%) | 401 (100.0%) |
Health & Disability in Solomons
Health Insurance Coverage by Age in Solomons
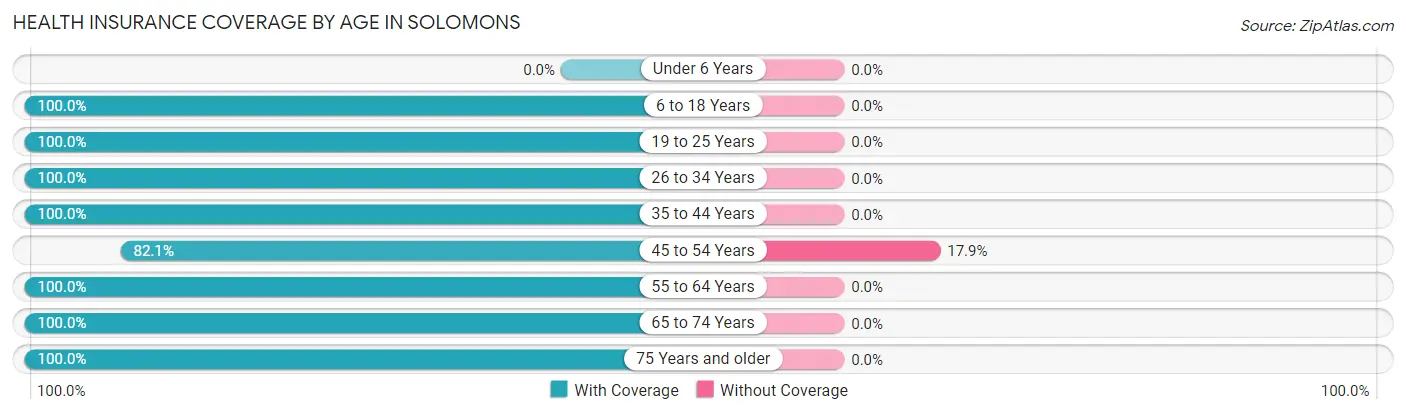
| Age Bracket | With Coverage | Without Coverage |
| Under 6 Years | 0 (0.0%) | 0 (0.0%) |
| 6 to 18 Years | 105 (100.0%) | 0 (0.0%) |
| 19 to 25 Years | 82 (100.0%) | 0 (0.0%) |
| 26 to 34 Years | 184 (100.0%) | 0 (0.0%) |
| 35 to 44 Years | 134 (100.0%) | 0 (0.0%) |
| 45 to 54 Years | 133 (82.1%) | 29 (17.9%) |
| 55 to 64 Years | 459 (100.0%) | 0 (0.0%) |
| 65 to 74 Years | 404 (100.0%) | 0 (0.0%) |
| 75 Years and older | 555 (100.0%) | 0 (0.0%) |
| Total | 2,056 (98.6%) | 29 (1.4%) |
Health Insurance Coverage by Citizenship Status in Solomons
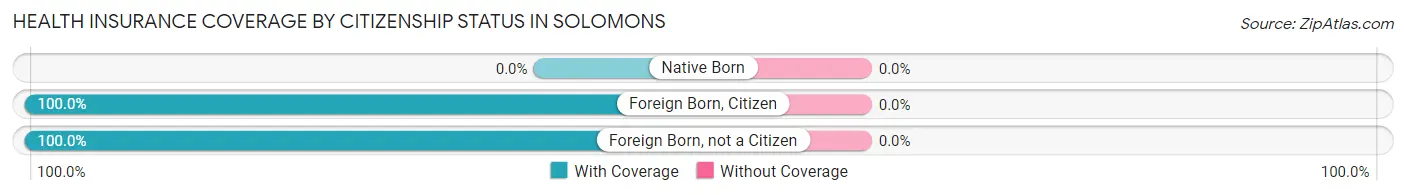
| Citizenship Status | With Coverage | Without Coverage |
| Native Born | 0 (0.0%) | 0 (0.0%) |
| Foreign Born, Citizen | 105 (100.0%) | 0 (0.0%) |
| Foreign Born, not a Citizen | 82 (100.0%) | 0 (0.0%) |
Health Insurance Coverage by Household Income in Solomons
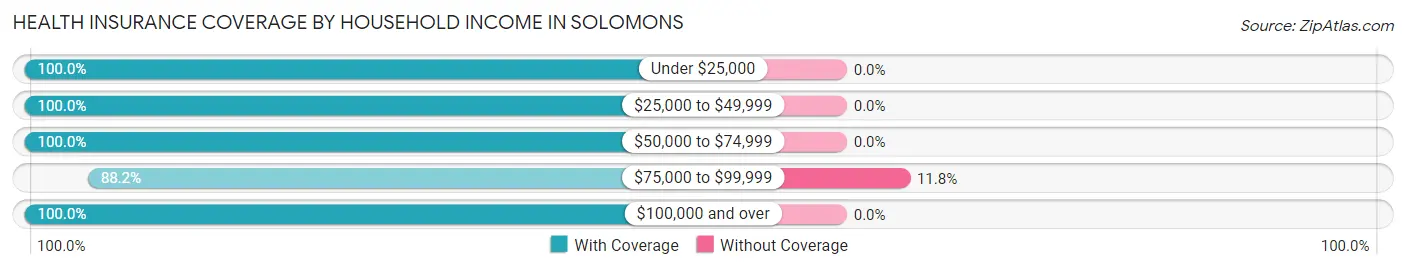
| Household Income | With Coverage | Without Coverage |
| Under $25,000 | 35 (100.0%) | 0 (0.0%) |
| $25,000 to $49,999 | 266 (100.0%) | 0 (0.0%) |
| $50,000 to $74,999 | 255 (100.0%) | 0 (0.0%) |
| $75,000 to $99,999 | 216 (88.2%) | 29 (11.8%) |
| $100,000 and over | 1,271 (100.0%) | 0 (0.0%) |
Public vs Private Health Insurance Coverage by Age in Solomons
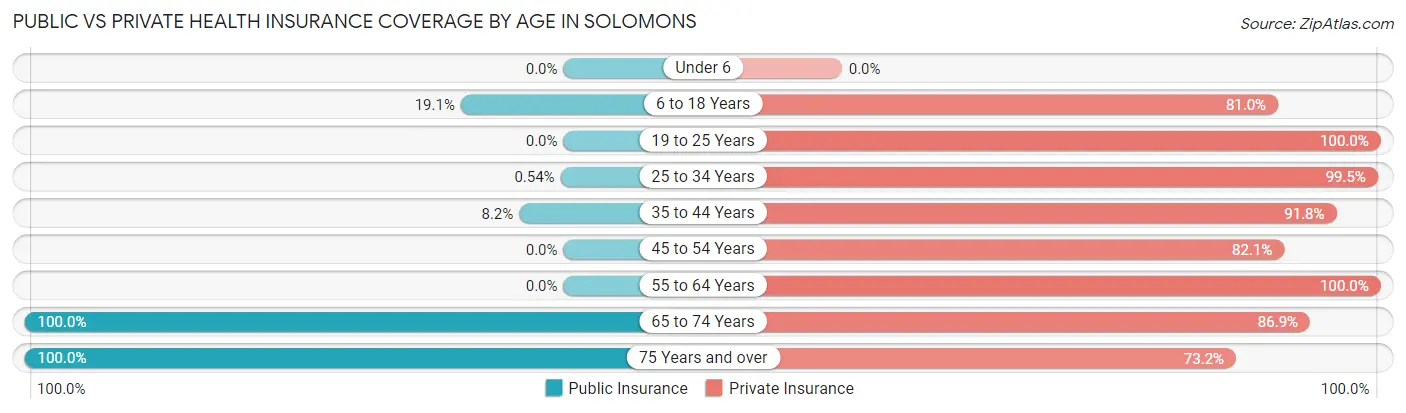
| Age Bracket | Public Insurance | Private Insurance |
| Under 6 | 0 (0.0%) | 0 (0.0%) |
| 6 to 18 Years | 20 (19.1%) | 85 (80.9%) |
| 19 to 25 Years | 0 (0.0%) | 82 (100.0%) |
| 25 to 34 Years | 1 (0.5%) | 183 (99.5%) |
| 35 to 44 Years | 11 (8.2%) | 123 (91.8%) |
| 45 to 54 Years | 0 (0.0%) | 133 (82.1%) |
| 55 to 64 Years | 0 (0.0%) | 459 (100.0%) |
| 65 to 74 Years | 404 (100.0%) | 351 (86.9%) |
| 75 Years and over | 555 (100.0%) | 406 (73.2%) |
| Total | 991 (47.5%) | 1,822 (87.4%) |
Disability Status by Sex by Age in Solomons
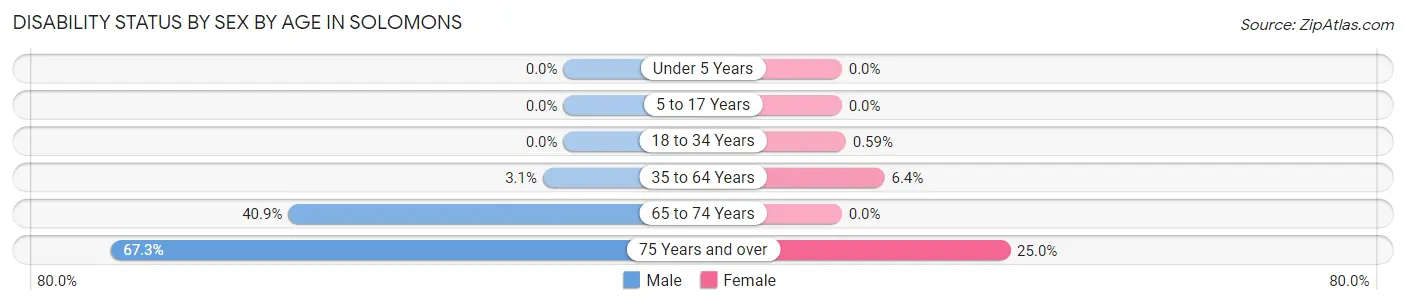
| Age Bracket | Male | Female |
| Under 5 Years | 0 (0.0%) | 0 (0.0%) |
| 5 to 17 Years | 0 (0.0%) | 0 (0.0%) |
| 18 to 34 Years | 0 (0.0%) | 1 (0.6%) |
| 35 to 64 Years | 11 (3.0%) | 25 (6.4%) |
| 65 to 74 Years | 67 (40.8%) | 0 (0.0%) |
| 75 Years and over | 185 (67.3%) | 70 (25.0%) |
Disability Class by Sex by Age in Solomons
Disability Class: Hearing Difficulty
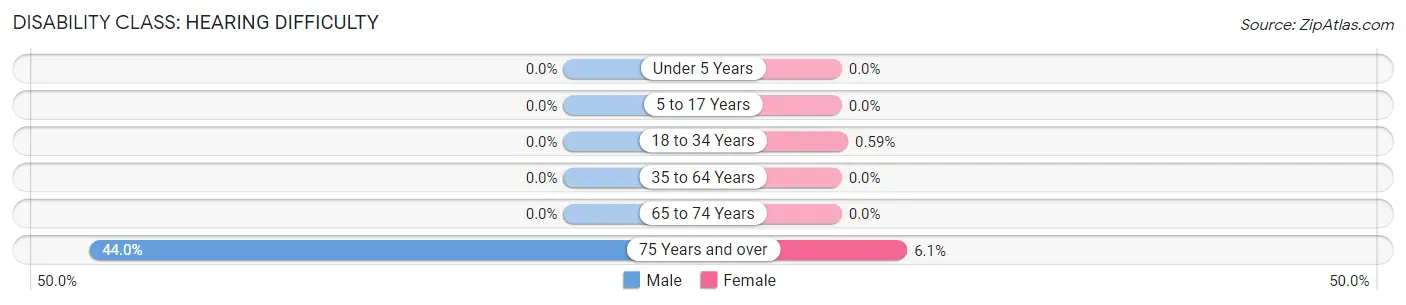
| Age Bracket | Male | Female |
| Under 5 Years | 0 (0.0%) | 0 (0.0%) |
| 5 to 17 Years | 0 (0.0%) | 0 (0.0%) |
| 18 to 34 Years | 0 (0.0%) | 1 (0.6%) |
| 35 to 64 Years | 0 (0.0%) | 0 (0.0%) |
| 65 to 74 Years | 0 (0.0%) | 0 (0.0%) |
| 75 Years and over | 121 (44.0%) | 17 (6.1%) |
Disability Class: Vision Difficulty
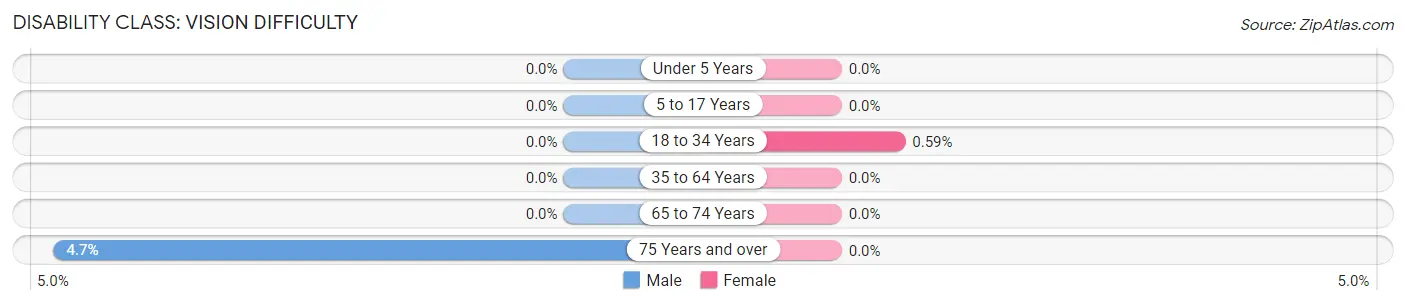
| Age Bracket | Male | Female |
| Under 5 Years | 0 (0.0%) | 0 (0.0%) |
| 5 to 17 Years | 0 (0.0%) | 0 (0.0%) |
| 18 to 34 Years | 0 (0.0%) | 1 (0.6%) |
| 35 to 64 Years | 0 (0.0%) | 0 (0.0%) |
| 65 to 74 Years | 0 (0.0%) | 0 (0.0%) |
| 75 Years and over | 13 (4.7%) | 0 (0.0%) |
Disability Class: Cognitive Difficulty
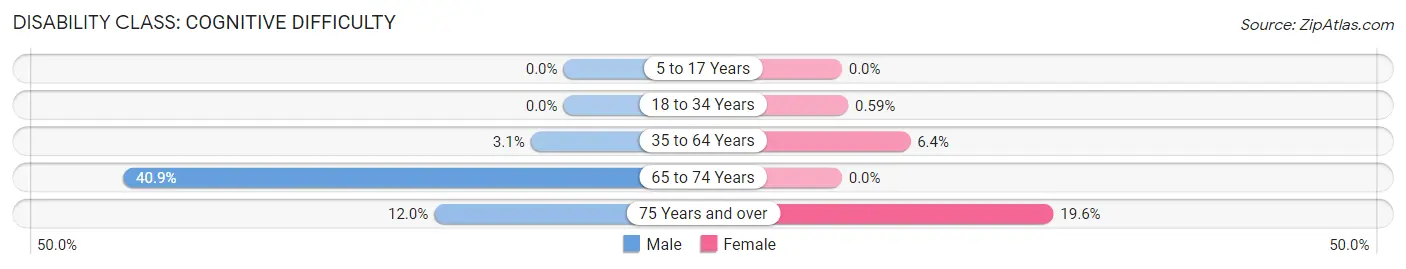
| Age Bracket | Male | Female |
| 5 to 17 Years | 0 (0.0%) | 0 (0.0%) |
| 18 to 34 Years | 0 (0.0%) | 1 (0.6%) |
| 35 to 64 Years | 11 (3.0%) | 25 (6.4%) |
| 65 to 74 Years | 67 (40.8%) | 0 (0.0%) |
| 75 Years and over | 33 (12.0%) | 55 (19.6%) |
Disability Class: Ambulatory Difficulty
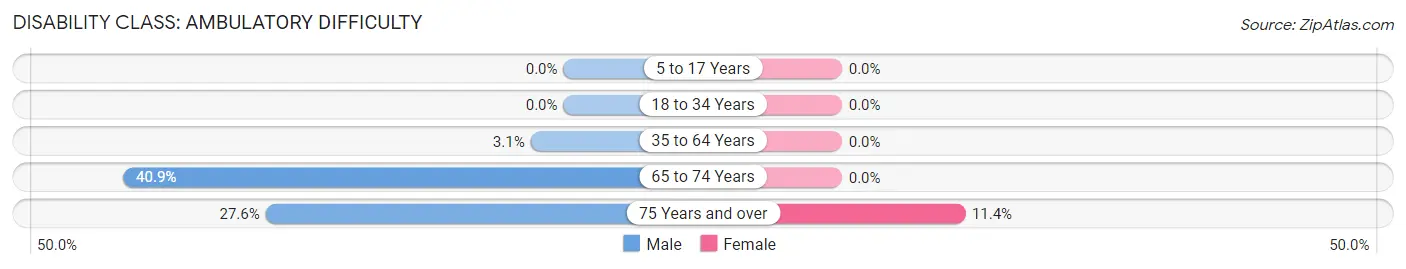
| Age Bracket | Male | Female |
| 5 to 17 Years | 0 (0.0%) | 0 (0.0%) |
| 18 to 34 Years | 0 (0.0%) | 0 (0.0%) |
| 35 to 64 Years | 11 (3.0%) | 0 (0.0%) |
| 65 to 74 Years | 67 (40.8%) | 0 (0.0%) |
| 75 Years and over | 76 (27.6%) | 32 (11.4%) |
Disability Class: Self-Care Difficulty
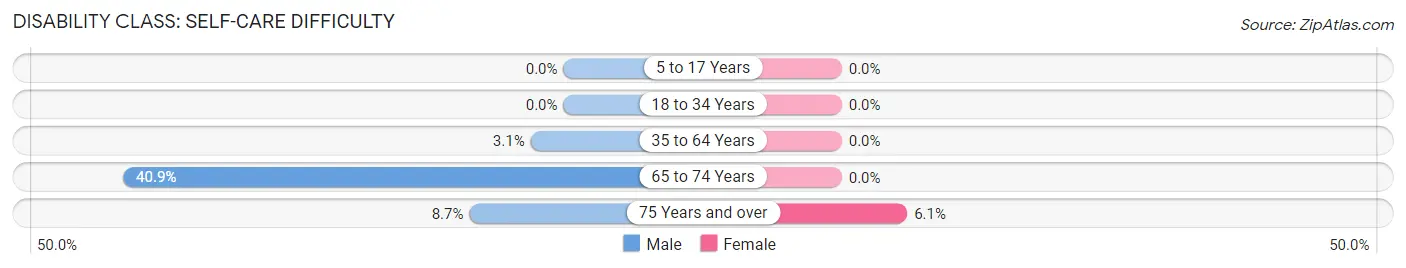
| Age Bracket | Male | Female |
| 5 to 17 Years | 0 (0.0%) | 0 (0.0%) |
| 18 to 34 Years | 0 (0.0%) | 0 (0.0%) |
| 35 to 64 Years | 11 (3.0%) | 0 (0.0%) |
| 65 to 74 Years | 67 (40.8%) | 0 (0.0%) |
| 75 Years and over | 24 (8.7%) | 17 (6.1%) |
Technology Access in Solomons
Computing Device Access in Solomons
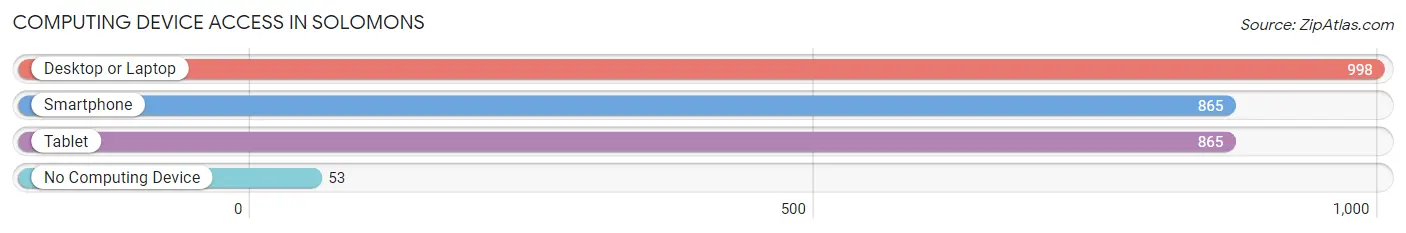
| Device Type | # Households | % Households |
| Desktop or Laptop | 998 | 91.6% |
| Smartphone | 865 | 79.4% |
| Tablet | 865 | 79.4% |
| No Computing Device | 53 | 4.9% |
| Total | 1,089 | 100.0% |
Internet Access in Solomons
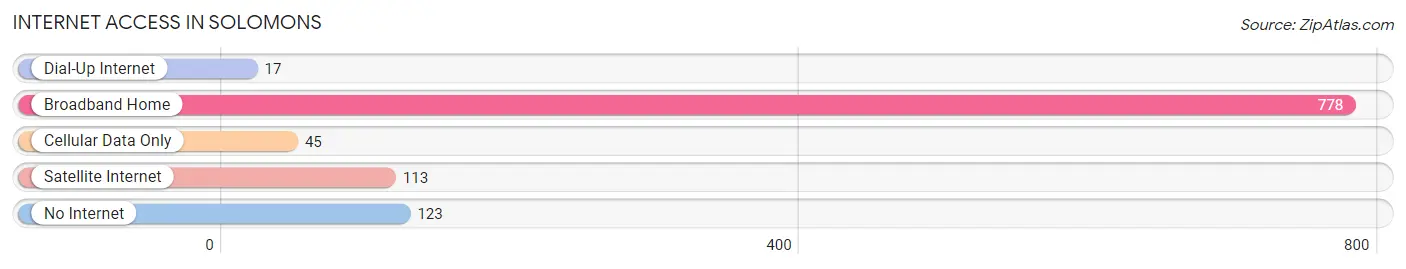
| Internet Type | # Households | % Households |
| Dial-Up Internet | 17 | 1.6% |
| Broadband Home | 778 | 71.4% |
| Cellular Data Only | 45 | 4.1% |
| Satellite Internet | 113 | 10.4% |
| No Internet | 123 | 11.3% |
| Total | 1,089 | 100.0% |
Solomons Summary
Solomons, Maryland is a small unincorporated community located in Calvert County, Maryland. It is situated on the Patuxent River, approximately 25 miles south of Washington, D.C. and is part of the larger metropolitan area of the same name. The community is known for its picturesque waterfront, historic sites, and recreational activities.
History
Solomons, Maryland was first settled in the early 1700s by English colonists. The area was named after the biblical King Solomon, who was said to have built a temple on the site. The area was originally part of Calvert County, but was annexed by St. Mary's County in 1791. In 1867, the area was returned to Calvert County.
The area was a popular destination for recreational activities, such as fishing and crabbing, and was home to several resorts. In the late 19th century, the area began to develop as a commercial fishing center. The first cannery was built in 1887, and the area soon became known for its oyster and crab harvesting.
In the early 20th century, the area began to develop as a tourist destination. The first bridge connecting Solomons to the mainland was built in 1921, and the area soon became a popular destination for weekend getaways. The area was also home to several military installations, including the Naval Air Station Patuxent River, which was established in 1943.
Geography
Solomons, Maryland is located in Calvert County, Maryland, on the Patuxent River. The area is approximately 25 miles south of Washington, D.C. and is part of the larger metropolitan area of the same name. The area is known for its picturesque waterfront, historic sites, and recreational activities.
The area is bordered by the Patuxent River to the east, the Chesapeake Bay to the south, and the Patuxent River Wildlife Refuge to the west. The area is home to several parks, including the Solomons Island State Park, which offers a variety of outdoor activities, such as fishing, boating, and hiking.
Economy
Solomons, Maryland is home to a variety of businesses, including restaurants, retail stores, and marinas. The area is also home to several military installations, including the Naval Air Station Patuxent River, which is the largest employer in the area.
The area is also home to several seafood processing plants, which process and package seafood for distribution throughout the region. The area is also home to several boatyards, which build and repair boats for recreational and commercial use.
Demographics
As of the 2010 census, the population of Solomons, Maryland was 2,368. The population is primarily white (90.2%), with a small percentage of African Americans (4.2%) and Hispanics (2.7%). The median household income is $68,958, and the median age is 44.
The area is home to a variety of religious denominations, including Catholic (25.3%), Protestant (21.2%), and other (3.2%). The area is also home to a variety of recreational activities, including fishing, boating, and hiking.
Conclusion
Solomons, Maryland is a small unincorporated community located in Calvert County, Maryland. It is situated on the Patuxent River, approximately 25 miles south of Washington, D.C. and is part of the larger metropolitan area of the same name. The area is known for its picturesque waterfront, historic sites, and recreational activities. The area is home to a variety of businesses, including restaurants, retail stores, and marinas. The area is also home to several military installations, including the Naval Air Station Patuxent River, which is the largest employer in the area. As of the 2010 census, the population of Solomons, Maryland was 2,368. The population is primarily white (90.2%), with a small percentage of African Americans (4.2%) and Hispanics (2.7%). The area is home to a variety of religious denominations, including Catholic (25.3%), Protestant (21.2%), and other (3.2%). The area is also home to a variety of recreational activities, including fishing, boating, and hiking.
Common Questions
What is Per Capita Income in Solomons?
Per Capita income in Solomons is $58,330.
What is the Median Family Income in Solomons?
Median Family Income in Solomons is $126,195.
What is the Median Household income in Solomons?
Median Household Income in Solomons is $88,558.
What is Income or Wage Gap in Solomons?
Income or Wage Gap in Solomons is 48.2%.
Women in Solomons earn 51.8 cents for every dollar earned by a man.
What is Inequality or Gini Index in Solomons?
Inequality or Gini Index in Solomons is 0.38.
What is the Total Population of Solomons?
Total Population of Solomons is 2,242.
What is the Total Male Population of Solomons?
Total Male Population of Solomons is 1,108.
What is the Total Female Population of Solomons?
Total Female Population of Solomons is 1,134.
What is the Ratio of Males per 100 Females in Solomons?
There are 97.71 Males per 100 Females in Solomons.
What is the Ratio of Females per 100 Males in Solomons?
There are 102.35 Females per 100 Males in Solomons.
What is the Median Population Age in Solomons?
Median Population Age in Solomons is 63.6 Years.
What is the Average Family Size in Solomons
Average Family Size in Solomons is 2.5 People.
What is the Average Household Size in Solomons
Average Household Size in Solomons is 1.9 People.
How Large is the Labor Force in Solomons?
There are 684 People in the Labor Forcein in Solomons.
What is the Percentage of People in the Labor Force in Solomons?
32.0% of People are in the Labor Force in Solomons.