Dawsonville, GA Map & Demographics
Dawsonville Map
Dawsonville Overview
$31,568
PER CAPITA INCOME
$94,542
AVG FAMILY INCOME
$79,479
AVG HOUSEHOLD INCOME
16.8%
WAGE / INCOME GAP [ % ]
83.2¢/ $1
WAGE / INCOME GAP [ $ ]
0.36
INEQUALITY / GINI INDEX
3,871
TOTAL POPULATION
2,109
MALE POPULATION
1,762
FEMALE POPULATION
119.69
MALES / 100 FEMALES
83.55
FEMALES / 100 MALES
35.5
MEDIAN AGE
3.4
AVG FAMILY SIZE
2.7
AVG HOUSEHOLD SIZE
1,946
LABOR FORCE [ PEOPLE ]
64.4%
PERCENT IN LABOR FORCE
4.4%
UNEMPLOYMENT RATE
Dawsonville Zip Codes
Dawsonville Area Codes
Income in Dawsonville
Income Overview in Dawsonville
Per Capita Income in Dawsonville is $31,568, while median incomes of families and households are $94,542 and $79,479 respectively.
| Characteristic | Number | Measure |
| Per Capita Income | 3,871 | $31,568 |
| Median Family Income | 937 | $94,542 |
| Mean Family Income | 937 | $101,027 |
| Median Household Income | 1,369 | $79,479 |
| Mean Household Income | 1,369 | $86,261 |
| Income Deficit | 937 | $0 |
| Wage / Income Gap (%) | 3,871 | 16.80% |
| Wage / Income Gap ($) | 3,871 | 83.20¢ per $1 |
| Gini / Inequality Index | 3,871 | 0.36 |
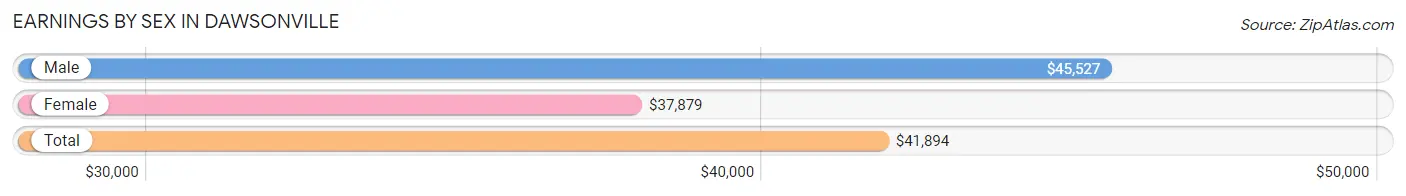
Earnings by Sex in Dawsonville
Average Earnings in Dawsonville are $41,894, $45,527 for men and $37,879 for women, a difference of 16.8%.
| Sex | Number | Average Earnings |
| Male | 1,121 (53.9%) | $45,527 |
| Female | 960 (46.1%) | $37,879 |
| Total | 2,081 (100.0%) | $41,894 |
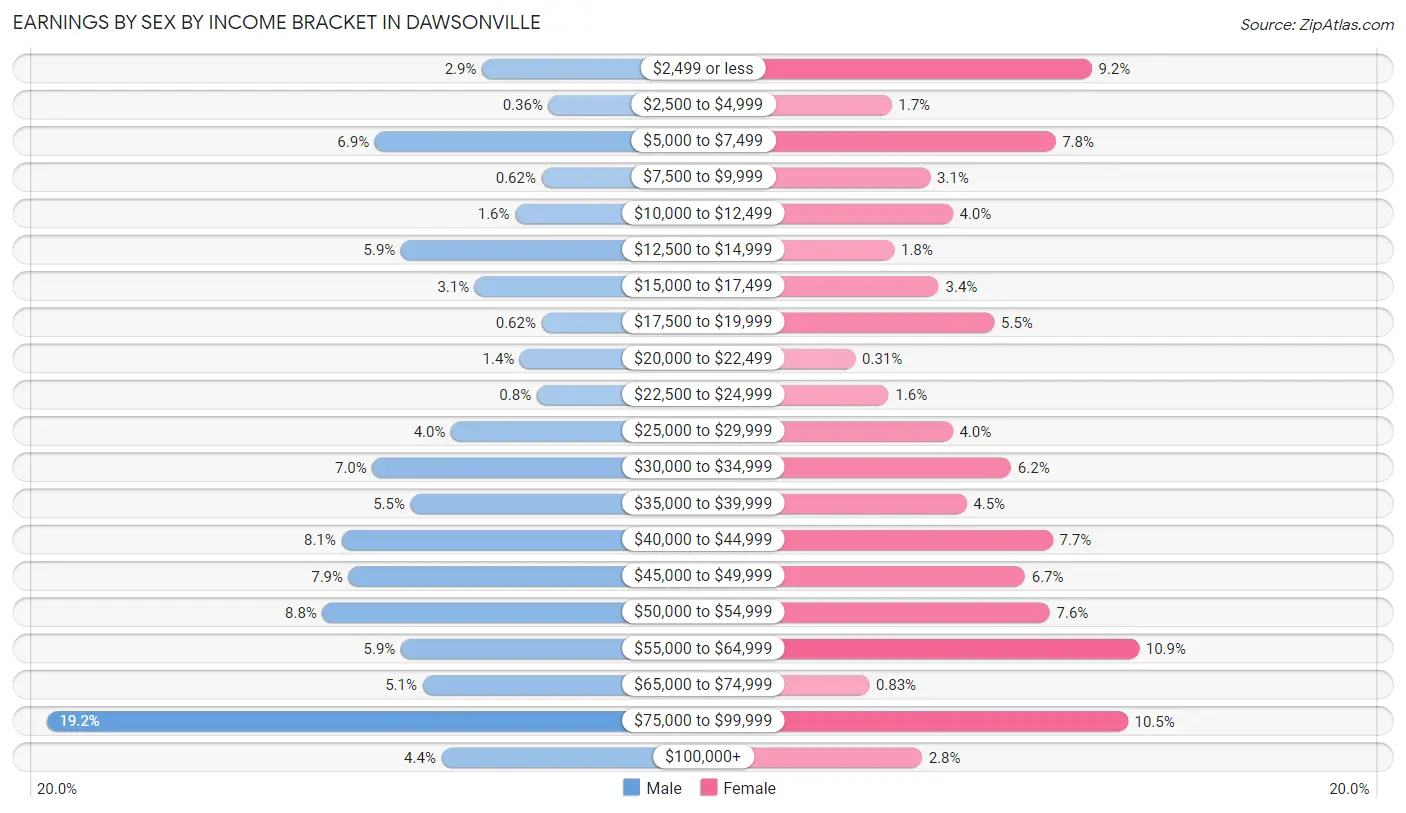
Earnings by Sex by Income Bracket in Dawsonville
The most common earnings brackets in Dawsonville are $75,000 to $99,999 for men (215 | 19.2%) and $55,000 to $64,999 for women (105 | 10.9%).
| Income | Male | Female |
| $2,499 or less | 32 (2.9%) | 88 (9.2%) |
| $2,500 to $4,999 | 4 (0.4%) | 16 (1.7%) |
| $5,000 to $7,499 | 77 (6.9%) | 75 (7.8%) |
| $7,500 to $9,999 | 7 (0.6%) | 30 (3.1%) |
| $10,000 to $12,499 | 18 (1.6%) | 38 (4.0%) |
| $12,500 to $14,999 | 66 (5.9%) | 17 (1.8%) |
| $15,000 to $17,499 | 35 (3.1%) | 33 (3.4%) |
| $17,500 to $19,999 | 7 (0.6%) | 53 (5.5%) |
| $20,000 to $22,499 | 16 (1.4%) | 3 (0.3%) |
| $22,500 to $24,999 | 9 (0.8%) | 15 (1.6%) |
| $25,000 to $29,999 | 45 (4.0%) | 38 (4.0%) |
| $30,000 to $34,999 | 78 (7.0%) | 59 (6.1%) |
| $35,000 to $39,999 | 62 (5.5%) | 43 (4.5%) |
| $40,000 to $44,999 | 91 (8.1%) | 74 (7.7%) |
| $45,000 to $49,999 | 88 (7.9%) | 64 (6.7%) |
| $50,000 to $54,999 | 99 (8.8%) | 73 (7.6%) |
| $55,000 to $64,999 | 66 (5.9%) | 105 (10.9%) |
| $65,000 to $74,999 | 57 (5.1%) | 8 (0.8%) |
| $75,000 to $99,999 | 215 (19.2%) | 101 (10.5%) |
| $100,000+ | 49 (4.4%) | 27 (2.8%) |
| Total | 1,121 (100.0%) | 960 (100.0%) |
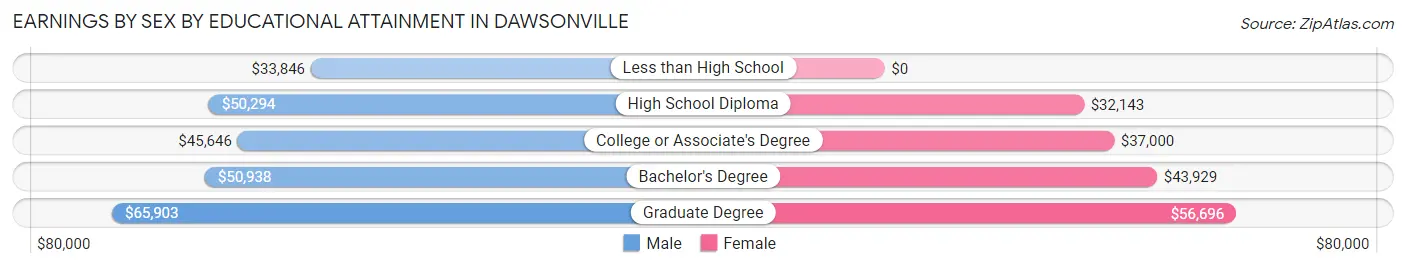
Earnings by Sex by Educational Attainment in Dawsonville
Average earnings in Dawsonville are $48,073 for men and $41,078 for women, a difference of 14.5%. Men with an educational attainment of graduate degree enjoy the highest average annual earnings of $65,903, while those with less than high school education earn the least with $33,846. Women with an educational attainment of graduate degree earn the most with the average annual earnings of $56,696, while those with high school diploma education have the smallest earnings of $32,143.
| Educational Attainment | Male Income | Female Income |
| Less than High School | $33,846 | $0 |
| High School Diploma | $50,294 | $32,143 |
| College or Associate's Degree | $45,646 | $37,000 |
| Bachelor's Degree | $50,938 | $43,929 |
| Graduate Degree | $65,903 | $56,696 |
| Total | $48,073 | $41,078 |
Family Income in Dawsonville
Family Income Brackets in Dawsonville
According to the Dawsonville family income data, there are 264 families falling into the $100,000 to $149,999 income range, which is the most common income bracket and makes up 28.2% of all families.
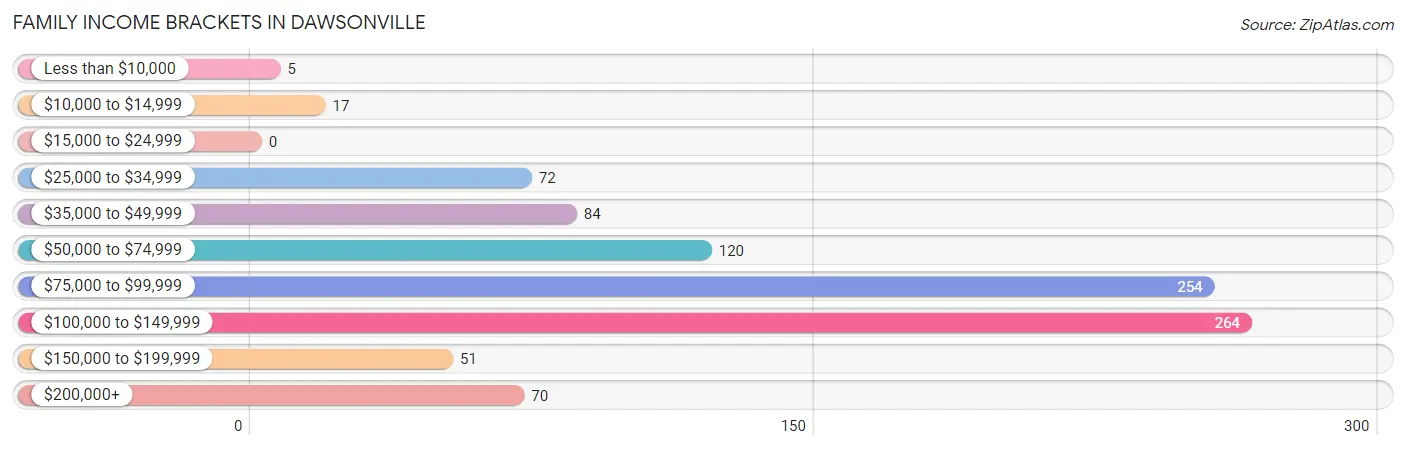
| Income Bracket | # Families | % Families |
| Less than $10,000 | 5 | 0.5% |
| $10,000 to $14,999 | 17 | 1.8% |
| $15,000 to $24,999 | 0 | 0.0% |
| $25,000 to $34,999 | 72 | 7.7% |
| $35,000 to $49,999 | 84 | 9.0% |
| $50,000 to $74,999 | 120 | 12.8% |
| $75,000 to $99,999 | 254 | 27.1% |
| $100,000 to $149,999 | 264 | 28.2% |
| $150,000 to $199,999 | 51 | 5.4% |
| $200,000+ | 70 | 7.5% |
Family Income by Famaliy Size in Dawsonville
6-person families (76 | 8.1%) account for the highest median family income in Dawsonville with $98,773 per family, while 2-person families (444 | 47.4%) have the highest median income of $47,590 per family member.
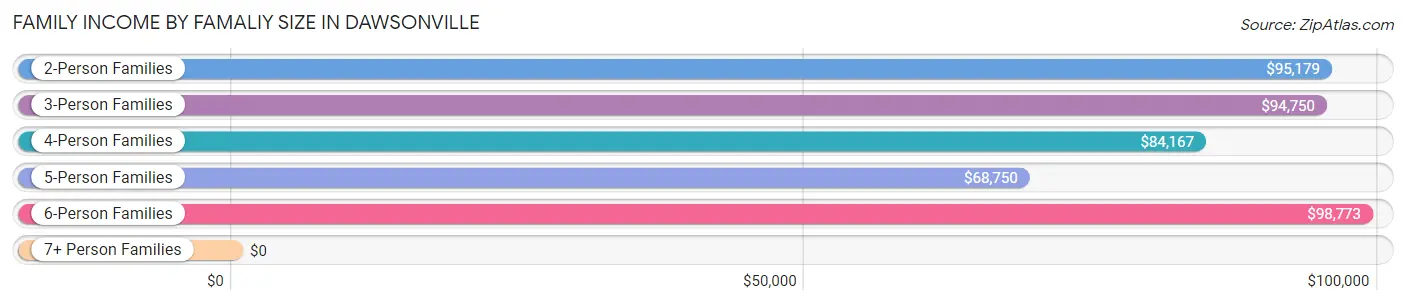
| Income Bracket | # Families | Median Income |
| 2-Person Families | 444 (47.4%) | $95,179 |
| 3-Person Families | 198 (21.1%) | $94,750 |
| 4-Person Families | 116 (12.4%) | $84,167 |
| 5-Person Families | 84 (9.0%) | $68,750 |
| 6-Person Families | 76 (8.1%) | $98,773 |
| 7+ Person Families | 19 (2.0%) | $0 |
| Total | 937 (100.0%) | $94,542 |
Family Income by Number of Earners in Dawsonville
The median family income in Dawsonville is $94,542, with families comprising 3+ earners (107) having the highest median family income of $137,679, while families with 1 earner (344) have the lowest median family income of $73,152, accounting for 11.4% and 36.7% of families, respectively.
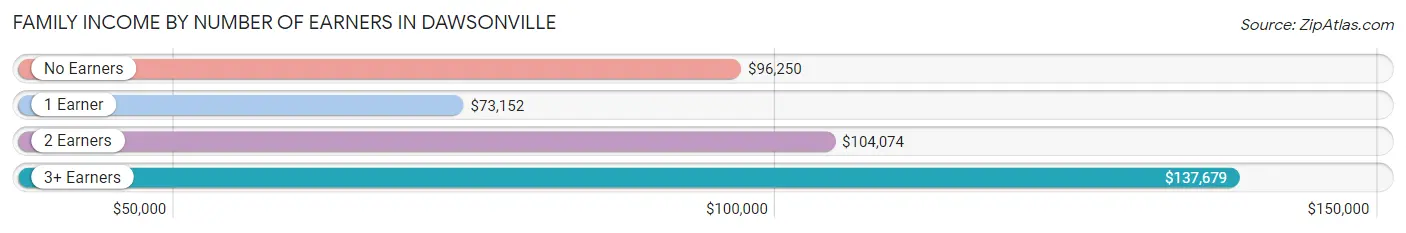
| Number of Earners | # Families | Median Income |
| No Earners | 102 (10.9%) | $96,250 |
| 1 Earner | 344 (36.7%) | $73,152 |
| 2 Earners | 384 (41.0%) | $104,074 |
| 3+ Earners | 107 (11.4%) | $137,679 |
| Total | 937 (100.0%) | $94,542 |
Household Income in Dawsonville
Household Income Brackets in Dawsonville
With 323 households falling in the category, the $75,000 to $99,999 income range is the most frequent in Dawsonville, accounting for 23.6% of all households. In contrast, only 19 households (1.4%) fall into the $15,000 to $24,999 income bracket, making it the least populous group.
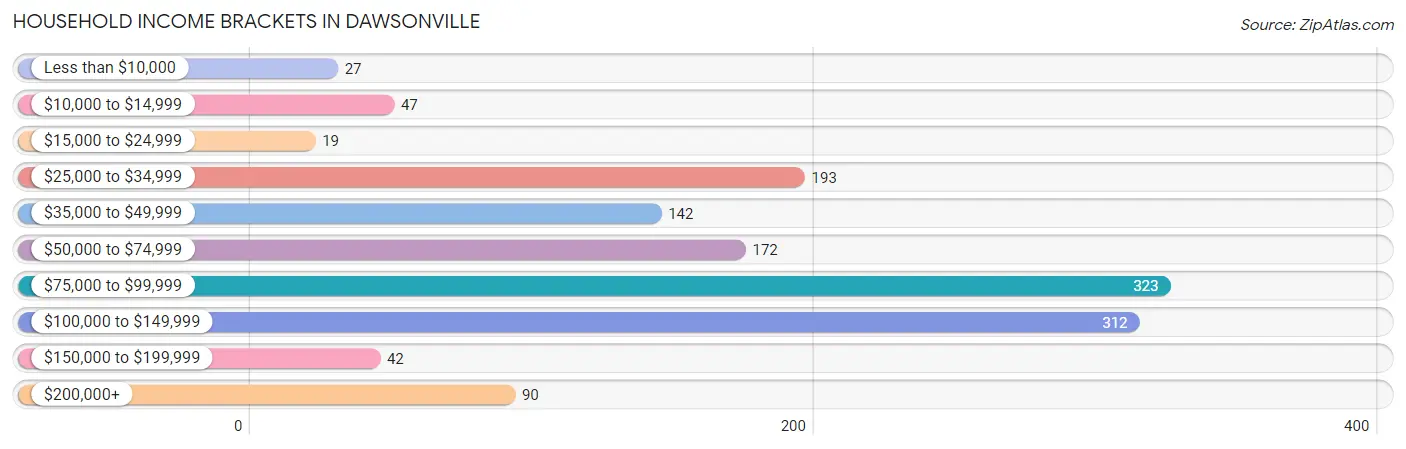
| Income Bracket | # Households | % Households |
| Less than $10,000 | 27 | 2.0% |
| $10,000 to $14,999 | 47 | 3.4% |
| $15,000 to $24,999 | 19 | 1.4% |
| $25,000 to $34,999 | 193 | 14.1% |
| $35,000 to $49,999 | 142 | 10.4% |
| $50,000 to $74,999 | 172 | 12.6% |
| $75,000 to $99,999 | 323 | 23.6% |
| $100,000 to $149,999 | 312 | 22.8% |
| $150,000 to $199,999 | 42 | 3.1% |
| $200,000+ | 90 | 6.6% |
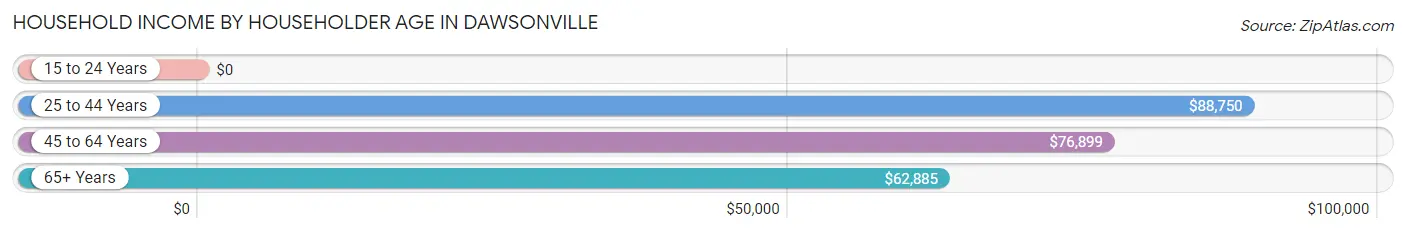
Household Income by Householder Age in Dawsonville
The median household income in Dawsonville is $79,479, with the highest median household income of $88,750 found in the 25 to 44 years age bracket for the primary householder. A total of 475 households (34.7%) fall into this category. Meanwhile, the 15 to 24 years age bracket for the primary householder has the lowest median household income of $0, with 25 households (1.8%) in this group.
| Income Bracket | # Households | Median Income |
| 15 to 24 Years | 25 (1.8%) | $0 |
| 25 to 44 Years | 475 (34.7%) | $88,750 |
| 45 to 64 Years | 499 (36.4%) | $76,899 |
| 65+ Years | 370 (27.0%) | $62,885 |
| Total | 1,369 (100.0%) | $79,479 |
Poverty in Dawsonville
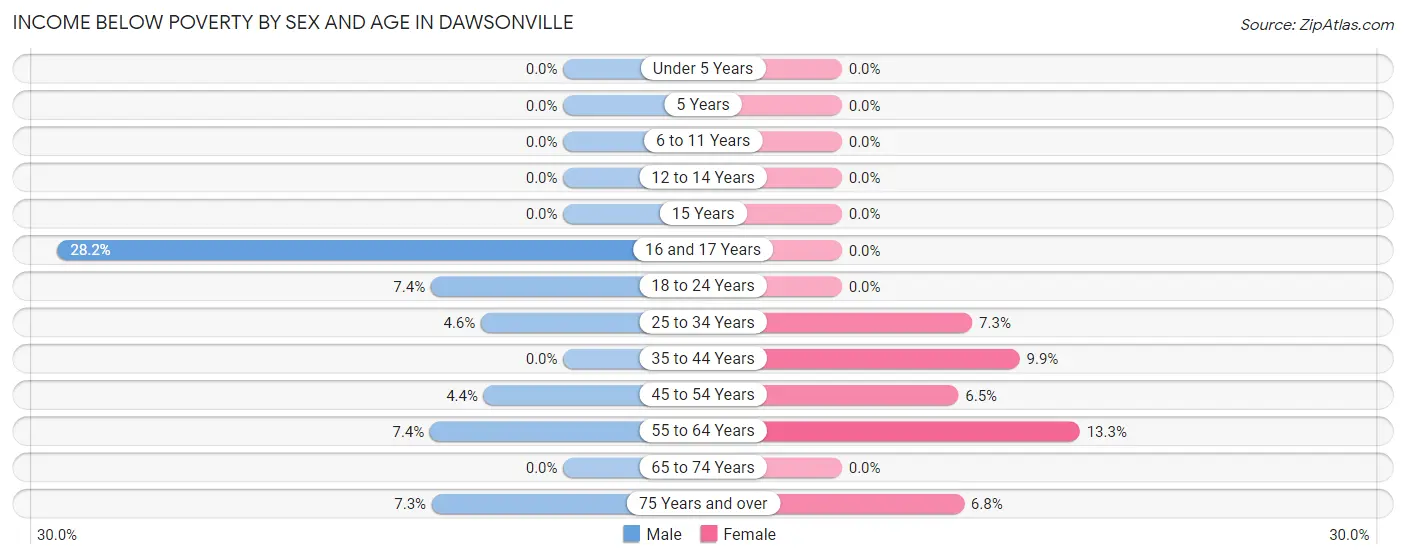
Income Below Poverty by Sex and Age in Dawsonville
With 3.8% poverty level for males and 5.6% for females among the residents of Dawsonville, 16 and 17 year old males and 55 to 64 year old females are the most vulnerable to poverty, with 20 males (28.2%) and 31 females (13.3%) in their respective age groups living below the poverty level.
| Age Bracket | Male | Female |
| Under 5 Years | 0 (0.0%) | 0 (0.0%) |
| 5 Years | 0 (0.0%) | 0 (0.0%) |
| 6 to 11 Years | 0 (0.0%) | 0 (0.0%) |
| 12 to 14 Years | 0 (0.0%) | 0 (0.0%) |
| 15 Years | 0 (0.0%) | 0 (0.0%) |
| 16 and 17 Years | 20 (28.2%) | 0 (0.0%) |
| 18 to 24 Years | 7 (7.4%) | 0 (0.0%) |
| 25 to 34 Years | 20 (4.6%) | 17 (7.3%) |
| 35 to 44 Years | 0 (0.0%) | 29 (9.9%) |
| 45 to 54 Years | 7 (4.4%) | 12 (6.5%) |
| 55 to 64 Years | 17 (7.4%) | 31 (13.3%) |
| 65 to 74 Years | 0 (0.0%) | 0 (0.0%) |
| 75 Years and over | 6 (7.3%) | 7 (6.8%) |
| Total | 77 (3.8%) | 96 (5.6%) |
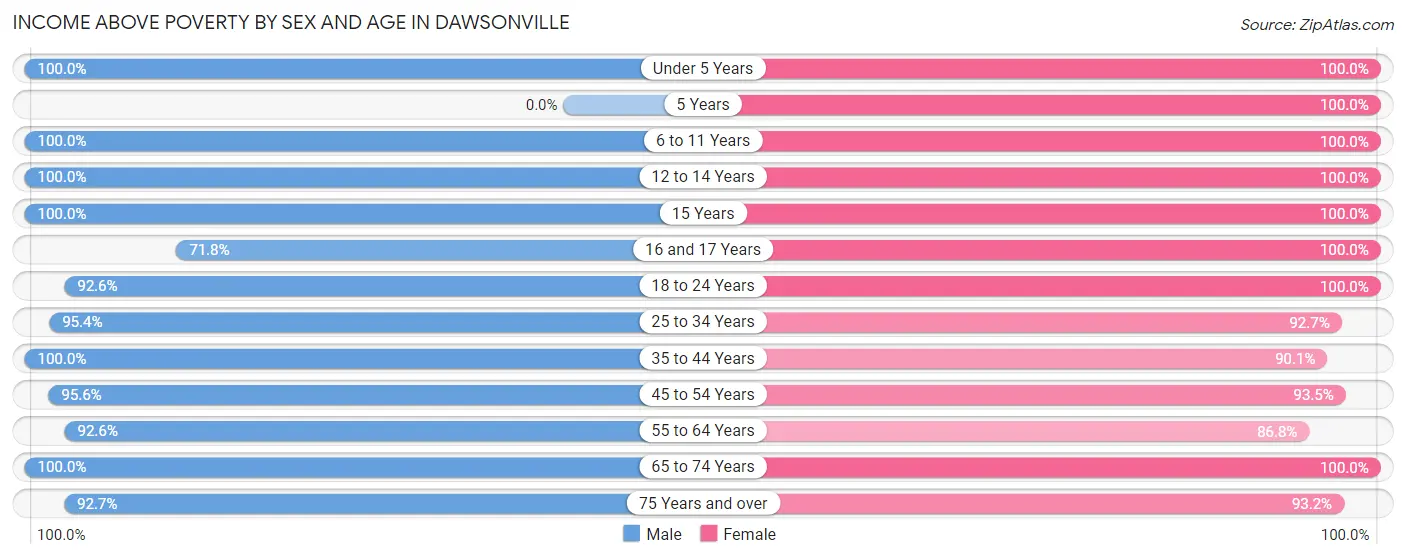
Income Above Poverty by Sex and Age in Dawsonville
According to the poverty statistics in Dawsonville, males aged under 5 years and females aged under 5 years are the age groups that are most secure financially, with 100.0% of males and 100.0% of females in these age groups living above the poverty line.
| Age Bracket | Male | Female |
| Under 5 Years | 176 (100.0%) | 124 (100.0%) |
| 5 Years | 0 (0.0%) | 79 (100.0%) |
| 6 to 11 Years | 284 (100.0%) | 68 (100.0%) |
| 12 to 14 Years | 24 (100.0%) | 60 (100.0%) |
| 15 Years | 22 (100.0%) | 4 (100.0%) |
| 16 and 17 Years | 51 (71.8%) | 64 (100.0%) |
| 18 to 24 Years | 88 (92.6%) | 109 (100.0%) |
| 25 to 34 Years | 417 (95.4%) | 217 (92.7%) |
| 35 to 44 Years | 245 (100.0%) | 264 (90.1%) |
| 45 to 54 Years | 151 (95.6%) | 173 (93.5%) |
| 55 to 64 Years | 212 (92.6%) | 203 (86.8%) |
| 65 to 74 Years | 191 (100.0%) | 173 (100.0%) |
| 75 Years and over | 76 (92.7%) | 96 (93.2%) |
| Total | 1,937 (96.2%) | 1,634 (94.5%) |
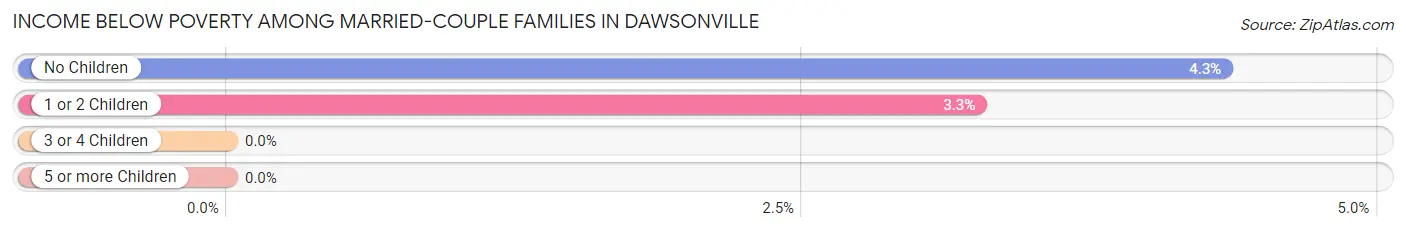
Income Below Poverty Among Married-Couple Families in Dawsonville
The poverty statistics for married-couple families in Dawsonville show that 3.2% or 24 of the total 741 families live below the poverty line. Families with no children have the highest poverty rate of 4.3%, comprising of 17 families. On the other hand, families with 3 or 4 children have the lowest poverty rate of 0.0%, which includes 0 families.
| Children | Above Poverty | Below Poverty |
| No Children | 376 (95.7%) | 17 (4.3%) |
| 1 or 2 Children | 208 (96.7%) | 7 (3.3%) |
| 3 or 4 Children | 133 (100.0%) | 0 (0.0%) |
| 5 or more Children | 0 (0.0%) | 0 (0.0%) |
| Total | 717 (96.8%) | 24 (3.2%) |
Income Below Poverty Among Single-Parent Households in Dawsonville
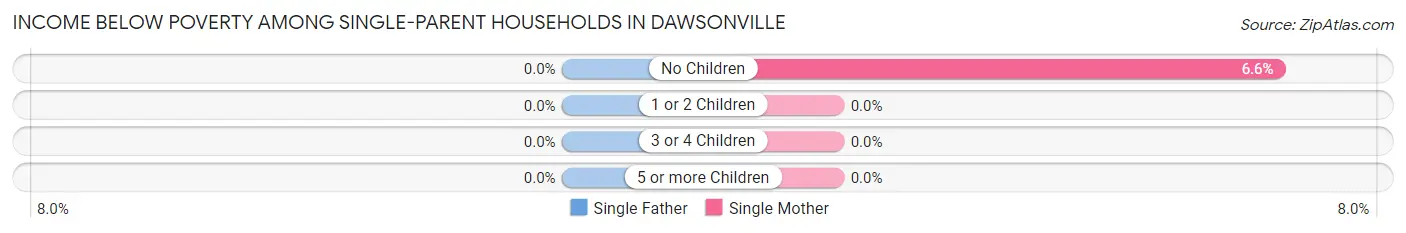
| Children | Single Father | Single Mother |
| No Children | 0 (0.0%) | 5 (6.6%) |
| 1 or 2 Children | 0 (0.0%) | 0 (0.0%) |
| 3 or 4 Children | 0 (0.0%) | 0 (0.0%) |
| 5 or more Children | 0 (0.0%) | 0 (0.0%) |
| Total | 0 (0.0%) | 5 (3.6%) |
Income Below Poverty Among Married-Couple vs Single-Parent Households in Dawsonville
The poverty data for Dawsonville shows that 24 of the married-couple family households (3.2%) and 5 of the single-parent households (2.5%) are living below the poverty level. Within the married-couple family households, those with no children have the highest poverty rate, with 17 households (4.3%) falling below the poverty line. Among the single-parent households, those with no children have the highest poverty rate, with 5 household (5.9%) living below poverty.
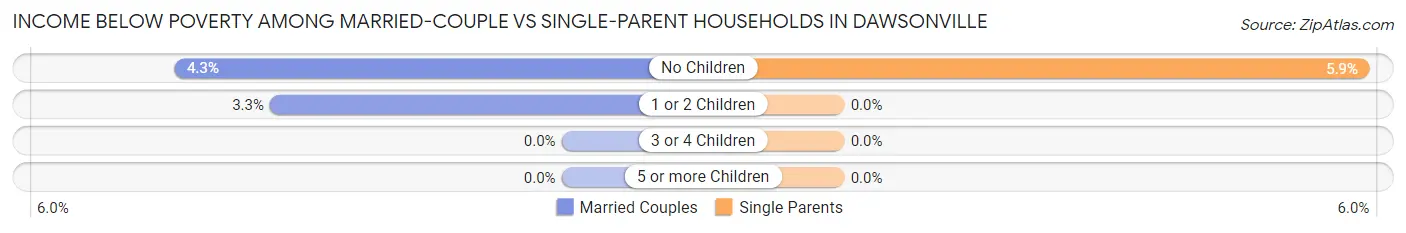
| Children | Married-Couple Families | Single-Parent Households |
| No Children | 17 (4.3%) | 5 (5.9%) |
| 1 or 2 Children | 7 (3.3%) | 0 (0.0%) |
| 3 or 4 Children | 0 (0.0%) | 0 (0.0%) |
| 5 or more Children | 0 (0.0%) | 0 (0.0%) |
| Total | 24 (3.2%) | 5 (2.5%) |
Race in Dawsonville
The most populous races in Dawsonville are White / Caucasian (3,465 | 89.5%), Asian (161 | 4.2%), and Two or more Races (127 | 3.3%).
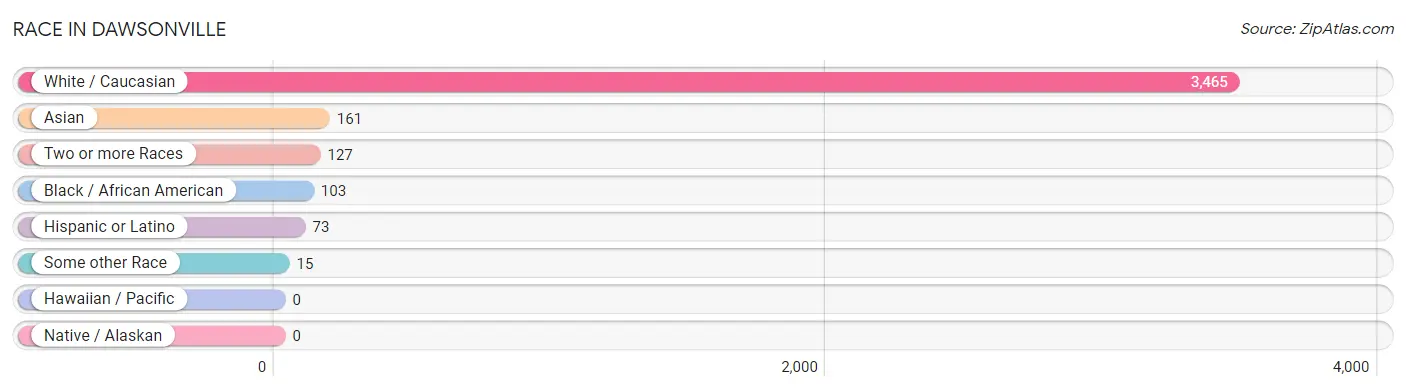
| Race | # Population | % Population |
| Asian | 161 | 4.2% |
| Black / African American | 103 | 2.7% |
| Hawaiian / Pacific | 0 | 0.0% |
| Hispanic or Latino | 73 | 1.9% |
| Native / Alaskan | 0 | 0.0% |
| White / Caucasian | 3,465 | 89.5% |
| Two or more Races | 127 | 3.3% |
| Some other Race | 15 | 0.4% |
| Total | 3,871 | 100.0% |
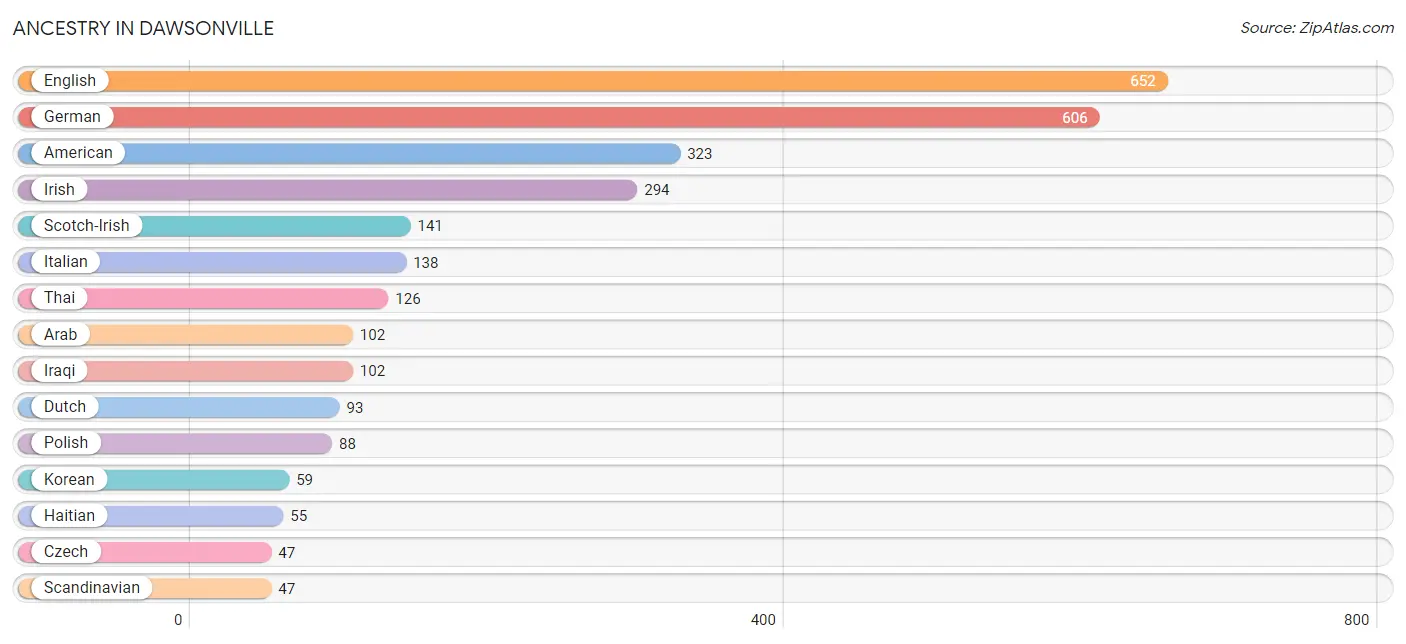
Ancestry in Dawsonville
The most populous ancestries reported in Dawsonville are English (652 | 16.8%), German (606 | 15.7%), American (323 | 8.3%), Irish (294 | 7.6%), and Scotch-Irish (141 | 3.6%), together accounting for 52.1% of all Dawsonville residents.
| Ancestry | # Population | % Population |
| American | 323 | 8.3% |
| Arab | 102 | 2.6% |
| Austrian | 7 | 0.2% |
| British | 46 | 1.2% |
| Burmese | 10 | 0.3% |
| Cherokee | 28 | 0.7% |
| Colombian | 2 | 0.1% |
| Cree | 1 | 0.0% |
| Cuban | 27 | 0.7% |
| Czech | 47 | 1.2% |
| Danish | 6 | 0.2% |
| Dutch | 93 | 2.4% |
| Eastern European | 32 | 0.8% |
| English | 652 | 16.8% |
| European | 40 | 1.0% |
| French | 12 | 0.3% |
| French Canadian | 9 | 0.2% |
| German | 606 | 15.7% |
| Haitian | 55 | 1.4% |
| Indian (Asian) | 2 | 0.1% |
| Iraqi | 102 | 2.6% |
| Irish | 294 | 7.6% |
| Italian | 138 | 3.6% |
| Korean | 59 | 1.5% |
| Luxembourger | 5 | 0.1% |
| Mexican | 13 | 0.3% |
| Northern European | 7 | 0.2% |
| Norwegian | 18 | 0.5% |
| Polish | 88 | 2.3% |
| Portuguese | 6 | 0.2% |
| Romanian | 11 | 0.3% |
| Russian | 12 | 0.3% |
| Scandinavian | 47 | 1.2% |
| Scotch-Irish | 141 | 3.6% |
| Scottish | 37 | 1.0% |
| South African | 6 | 0.2% |
| South American | 2 | 0.1% |
| Spanish | 28 | 0.7% |
| Subsaharan African | 6 | 0.2% |
| Swedish | 13 | 0.3% |
| Swiss | 9 | 0.2% |
| Thai | 126 | 3.3% |
| Welsh | 7 | 0.2% | View All 43 Rows |
Immigrants in Dawsonville
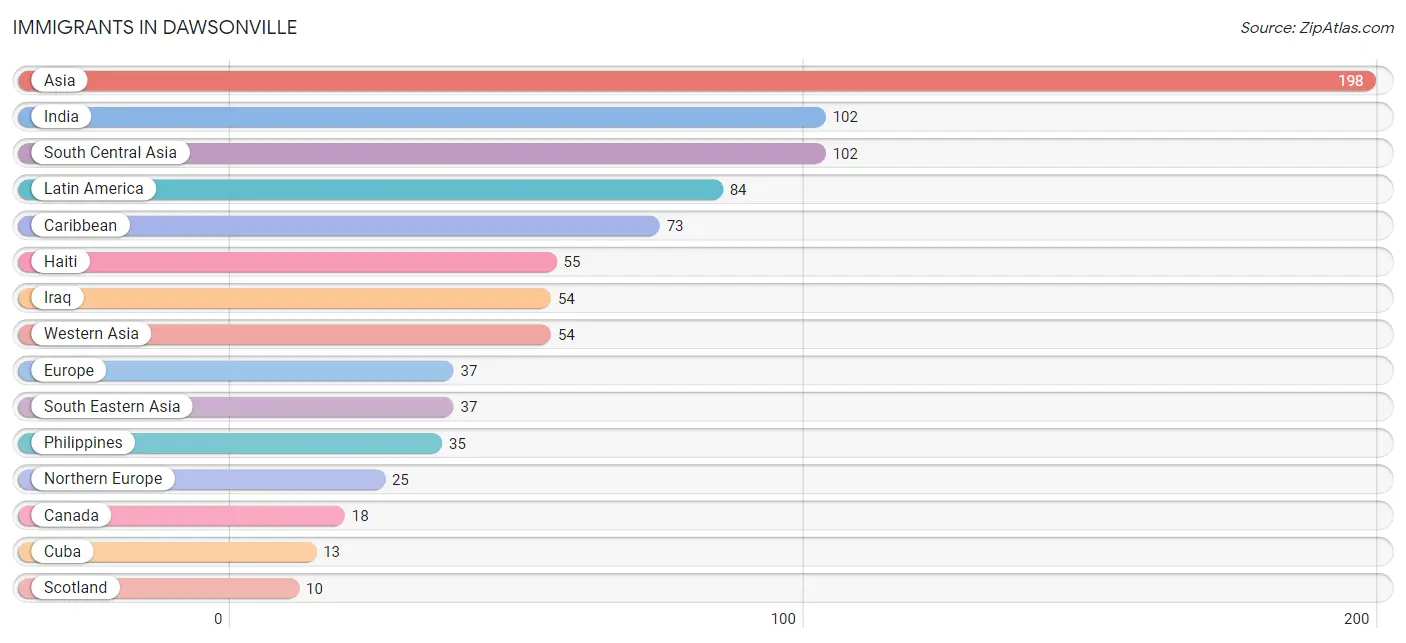
The most numerous immigrant groups reported in Dawsonville came from Asia (198 | 5.1%), India (102 | 2.6%), South Central Asia (102 | 2.6%), Latin America (84 | 2.2%), and Caribbean (73 | 1.9%), together accounting for 14.4% of all Dawsonville residents.
| Immigration Origin | # Population | % Population |
| Africa | 6 | 0.2% |
| Asia | 198 | 5.1% |
| Brazil | 6 | 0.2% |
| Canada | 18 | 0.5% |
| Caribbean | 73 | 1.9% |
| Central America | 3 | 0.1% |
| Colombia | 2 | 0.1% |
| Cuba | 13 | 0.3% |
| Denmark | 6 | 0.2% |
| Eastern Asia | 5 | 0.1% |
| Europe | 37 | 1.0% |
| Grenada | 5 | 0.1% |
| Haiti | 55 | 1.4% |
| India | 102 | 2.6% |
| Indonesia | 2 | 0.1% |
| Iraq | 54 | 1.4% |
| Italy | 7 | 0.2% |
| Korea | 5 | 0.1% |
| Latin America | 84 | 2.2% |
| Mexico | 3 | 0.1% |
| Netherlands | 5 | 0.1% |
| Northern Europe | 25 | 0.6% |
| Philippines | 35 | 0.9% |
| Scotland | 10 | 0.3% |
| South Africa | 6 | 0.2% |
| South America | 8 | 0.2% |
| South Central Asia | 102 | 2.6% |
| South Eastern Asia | 37 | 1.0% |
| Southern Europe | 7 | 0.2% |
| Western Asia | 54 | 1.4% |
| Western Europe | 5 | 0.1% | View All 31 Rows |
Sex and Age in Dawsonville
Sex and Age in Dawsonville
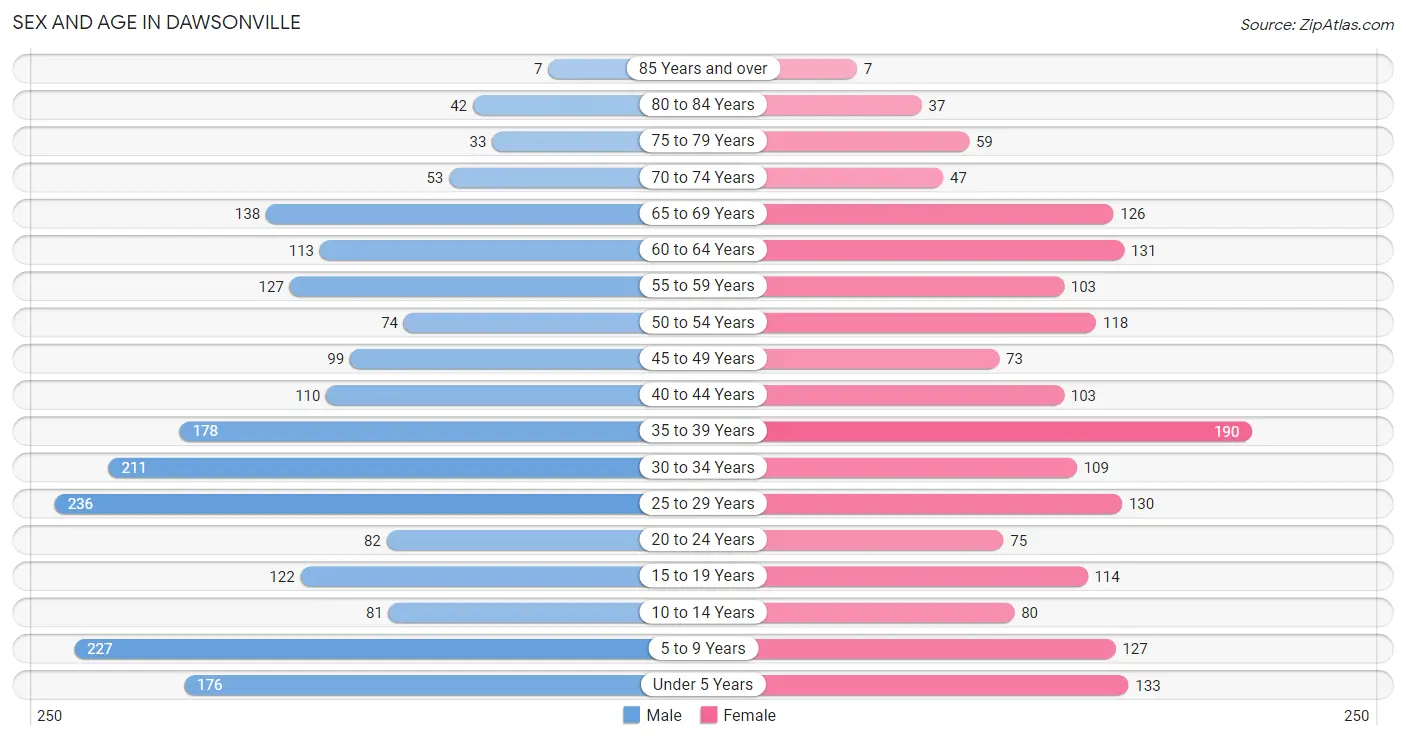
The most populous age groups in Dawsonville are 25 to 29 Years (236 | 11.2%) for men and 35 to 39 Years (190 | 10.8%) for women.
| Age Bracket | Male | Female |
| Under 5 Years | 176 (8.4%) | 133 (7.5%) |
| 5 to 9 Years | 227 (10.8%) | 127 (7.2%) |
| 10 to 14 Years | 81 (3.8%) | 80 (4.5%) |
| 15 to 19 Years | 122 (5.8%) | 114 (6.5%) |
| 20 to 24 Years | 82 (3.9%) | 75 (4.3%) |
| 25 to 29 Years | 236 (11.2%) | 130 (7.4%) |
| 30 to 34 Years | 211 (10.0%) | 109 (6.2%) |
| 35 to 39 Years | 178 (8.4%) | 190 (10.8%) |
| 40 to 44 Years | 110 (5.2%) | 103 (5.9%) |
| 45 to 49 Years | 99 (4.7%) | 73 (4.1%) |
| 50 to 54 Years | 74 (3.5%) | 118 (6.7%) |
| 55 to 59 Years | 127 (6.0%) | 103 (5.9%) |
| 60 to 64 Years | 113 (5.4%) | 131 (7.4%) |
| 65 to 69 Years | 138 (6.5%) | 126 (7.1%) |
| 70 to 74 Years | 53 (2.5%) | 47 (2.7%) |
| 75 to 79 Years | 33 (1.6%) | 59 (3.4%) |
| 80 to 84 Years | 42 (2.0%) | 37 (2.1%) |
| 85 Years and over | 7 (0.3%) | 7 (0.4%) |
| Total | 2,109 (100.0%) | 1,762 (100.0%) |
Families and Households in Dawsonville
Median Family Size in Dawsonville
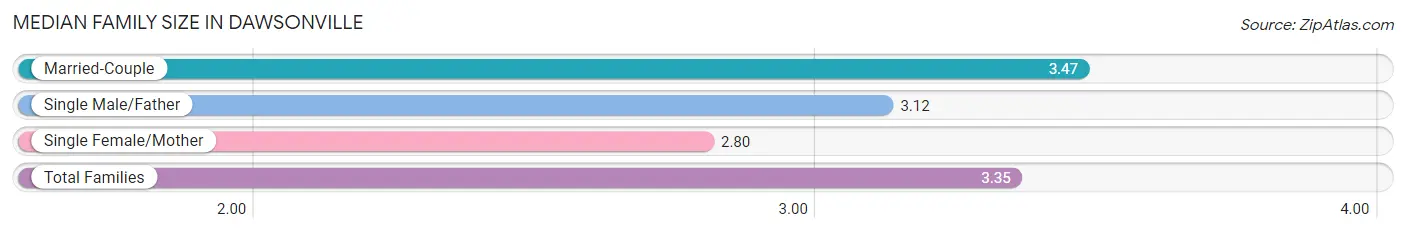
The median family size in Dawsonville is 3.35 persons per family, with married-couple families (741 | 79.1%) accounting for the largest median family size of 3.47 persons per family. On the other hand, single female/mother families (137 | 14.6%) represent the smallest median family size with 2.80 persons per family.
| Family Type | # Families | Family Size |
| Married-Couple | 741 (79.1%) | 3.47 |
| Single Male/Father | 59 (6.3%) | 3.12 |
| Single Female/Mother | 137 (14.6%) | 2.80 |
| Total Families | 937 (100.0%) | 3.35 |
Median Household Size in Dawsonville
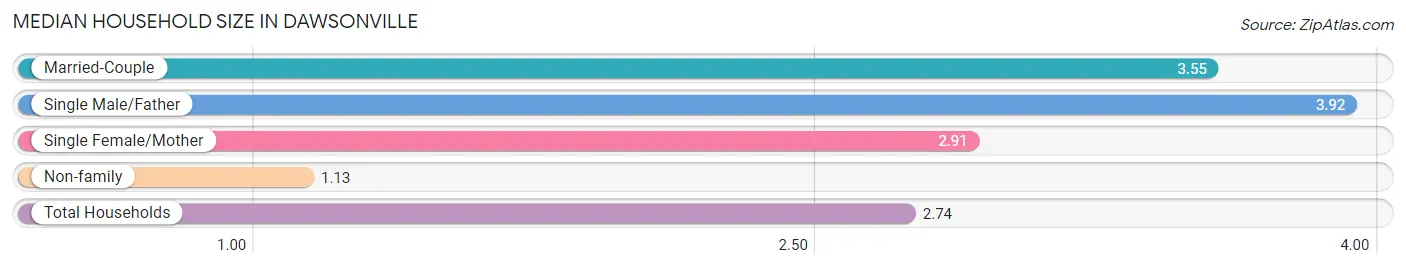
The median household size in Dawsonville is 2.74 persons per household, with single male/father households (59 | 4.3%) accounting for the largest median household size of 3.92 persons per household. non-family households (432 | 31.6%) represent the smallest median household size with 1.13 persons per household.
| Household Type | # Households | Household Size |
| Married-Couple | 741 (54.1%) | 3.55 |
| Single Male/Father | 59 (4.3%) | 3.92 |
| Single Female/Mother | 137 (10.0%) | 2.91 |
| Non-family | 432 (31.6%) | 1.13 |
| Total Households | 1,369 (100.0%) | 2.74 |
Household Size by Marriage Status in Dawsonville
Out of a total of 1,369 households in Dawsonville, 937 (68.4%) are family households, while 432 (31.6%) are nonfamily households. The most numerous type of family households are 2-person households, comprising 411, and the most common type of nonfamily households are 1-person households, comprising 396.
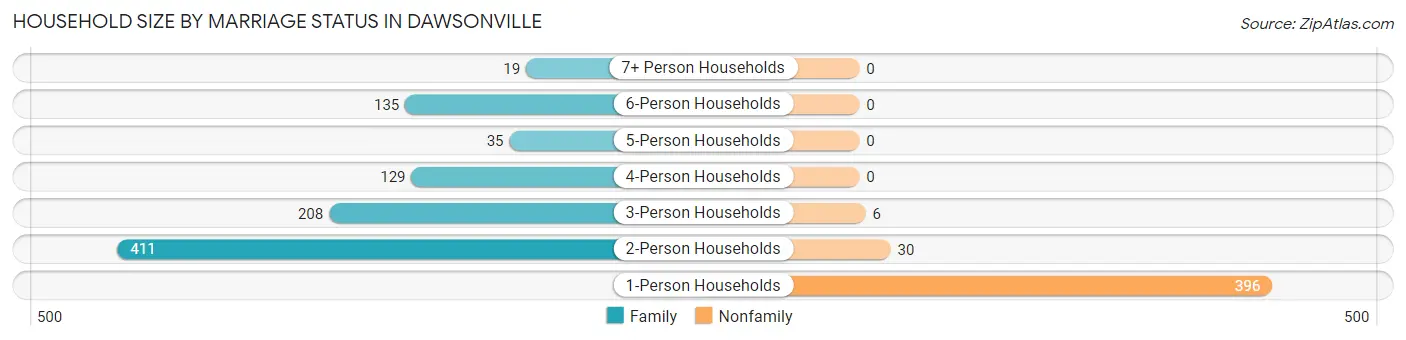
| Household Size | Family Households | Nonfamily Households |
| 1-Person Households | - | 396 (28.9%) |
| 2-Person Households | 411 (30.0%) | 30 (2.2%) |
| 3-Person Households | 208 (15.2%) | 6 (0.4%) |
| 4-Person Households | 129 (9.4%) | 0 (0.0%) |
| 5-Person Households | 35 (2.6%) | 0 (0.0%) |
| 6-Person Households | 135 (9.9%) | 0 (0.0%) |
| 7+ Person Households | 19 (1.4%) | 0 (0.0%) |
| Total | 937 (68.4%) | 432 (31.6%) |
Female Fertility in Dawsonville
Fertility by Age in Dawsonville
Average fertility rate in Dawsonville is 120.0 births per 1,000 women. Women in the age bracket of 20 to 34 years have the highest fertility rate with 252.0 births per 1,000 women. Women in the age bracket of 20 to 34 years acount for 82.3% of all women with births.
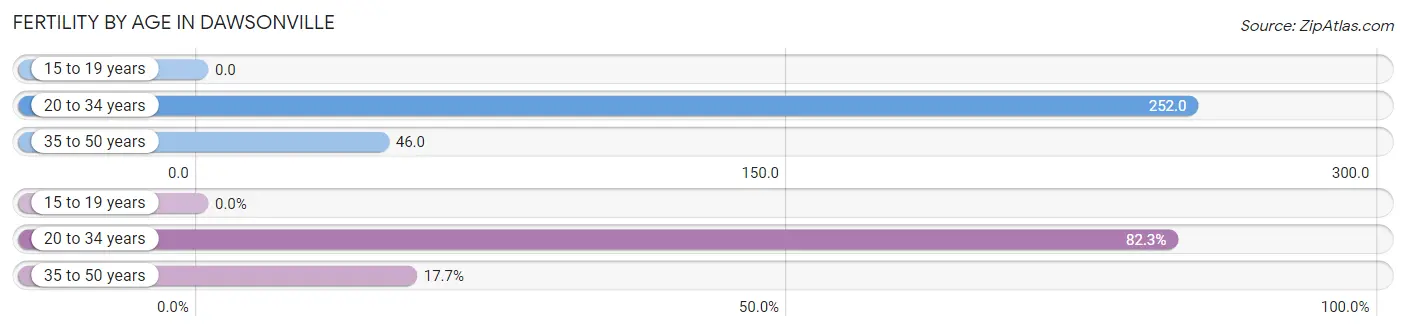
| Age Bracket | Women with Births | Births / 1,000 Women |
| 15 to 19 years | 0 (0.0%) | 0.0 |
| 20 to 34 years | 79 (82.3%) | 252.0 |
| 35 to 50 years | 17 (17.7%) | 46.0 |
| Total | 96 (100.0%) | 120.0 |
Fertility by Age by Marriage Status in Dawsonville
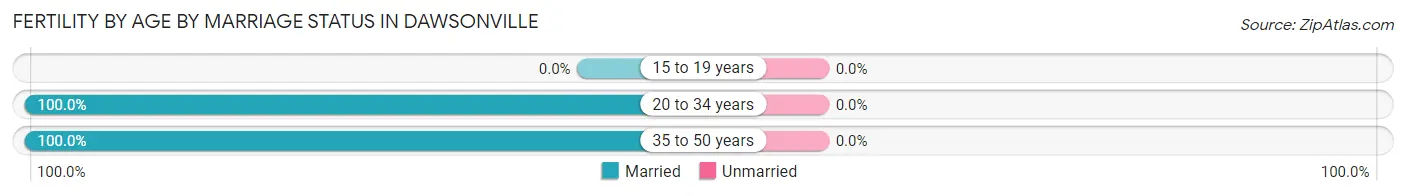
| Age Bracket | Married | Unmarried |
| 15 to 19 years | 0 (0.0%) | 0 (0.0%) |
| 20 to 34 years | 79 (100.0%) | 0 (0.0%) |
| 35 to 50 years | 17 (100.0%) | 0 (0.0%) |
| Total | 96 (100.0%) | 0 (0.0%) |
Fertility by Education in Dawsonville
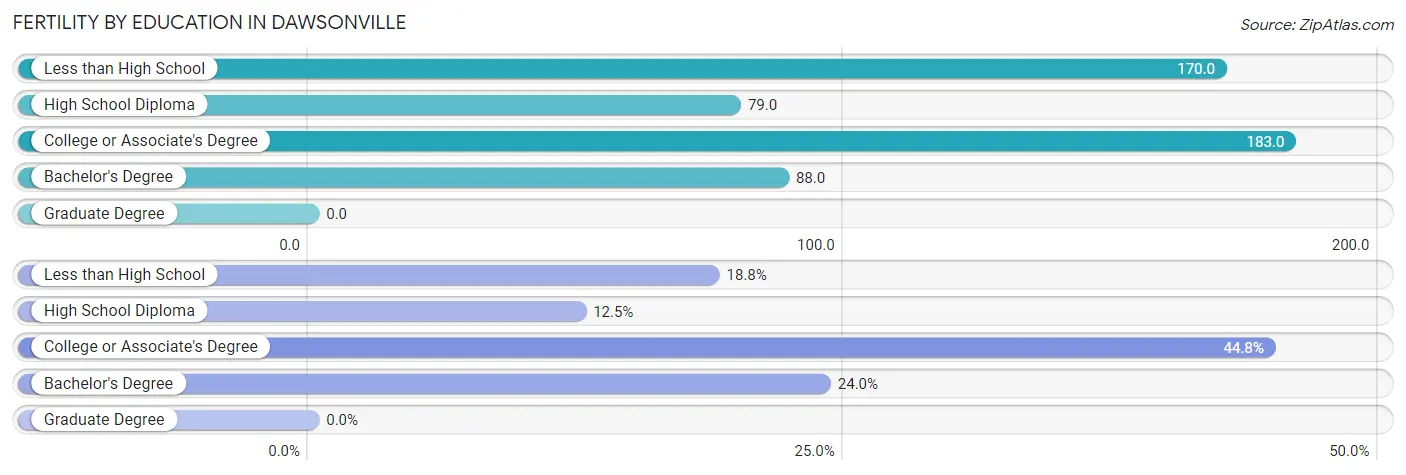
| Educational Attainment | Women with Births | Births / 1,000 Women |
| Less than High School | 18 (18.8%) | 170.0 |
| High School Diploma | 12 (12.5%) | 79.0 |
| College or Associate's Degree | 43 (44.8%) | 183.0 |
| Bachelor's Degree | 23 (24.0%) | 88.0 |
| Graduate Degree | 0 (0.0%) | 0.0 |
| Total | 96 (100.0%) | 120.0 |
Fertility by Education by Marriage Status in Dawsonville
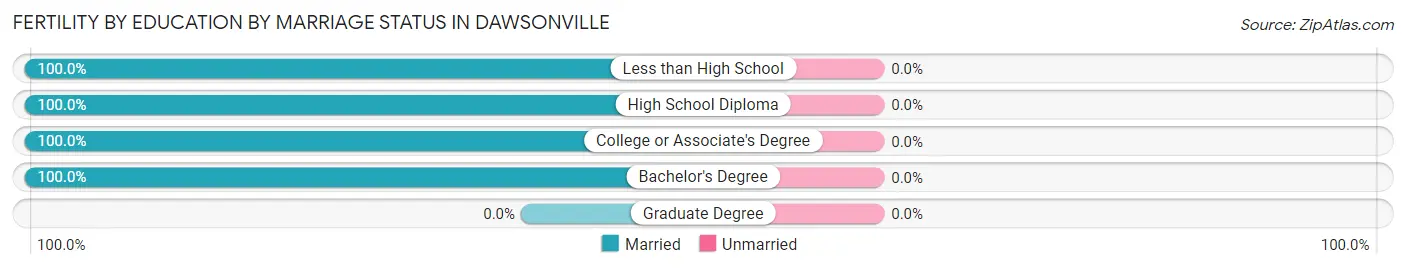
| Educational Attainment | Married | Unmarried |
| Less than High School | 18 (100.0%) | 0 (0.0%) |
| High School Diploma | 12 (100.0%) | 0 (0.0%) |
| College or Associate's Degree | 43 (100.0%) | 0 (0.0%) |
| Bachelor's Degree | 23 (100.0%) | 0 (0.0%) |
| Graduate Degree | 0 (0.0%) | 0 (0.0%) |
| Total | 96 (100.0%) | 0 (0.0%) |
Employment Characteristics in Dawsonville
Employment by Class of Employer in Dawsonville
Among the 1,729 employed individuals in Dawsonville, private company employees (1,137 | 65.8%), local government employees (309 | 17.9%), and self-employed (not incorporated) (95 | 5.5%) make up the most common classes of employment.
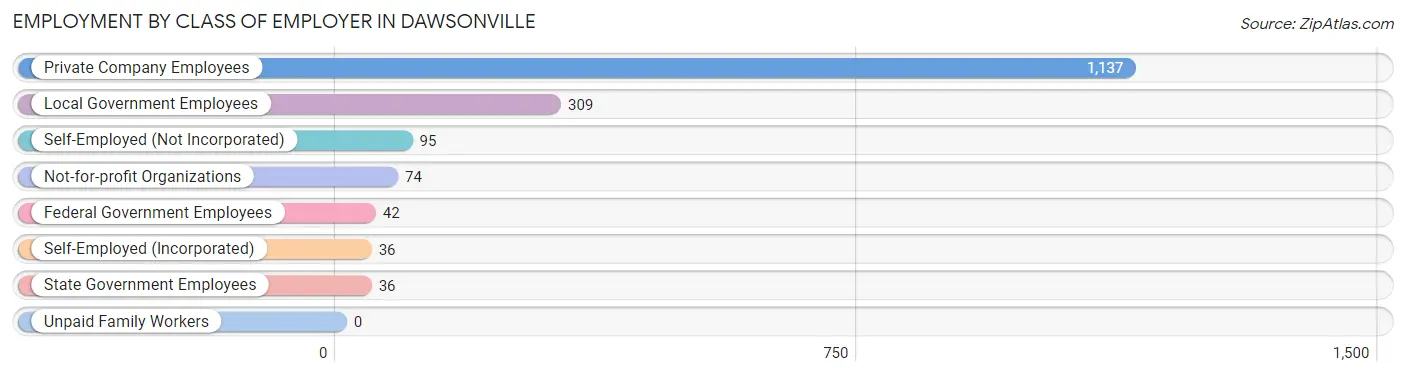
| Employer Class | # Employees | % Employees |
| Private Company Employees | 1,137 | 65.8% |
| Self-Employed (Incorporated) | 36 | 2.1% |
| Self-Employed (Not Incorporated) | 95 | 5.5% |
| Not-for-profit Organizations | 74 | 4.3% |
| Local Government Employees | 309 | 17.9% |
| State Government Employees | 36 | 2.1% |
| Federal Government Employees | 42 | 2.4% |
| Unpaid Family Workers | 0 | 0.0% |
| Total | 1,729 | 100.0% |
Employment Status by Age in Dawsonville
According to the labor force statistics for Dawsonville, out of the total population over 16 years of age (3,021), 64.4% or 1,946 individuals are in the labor force, with 4.4% or 86 of them unemployed. The age group with the highest labor force participation rate is 30 to 34 years, with 94.7% or 303 individuals in the labor force. Within the labor force, the 75 years and over age range has the highest percentage of unemployed individuals, with 100.0% or 8 of them being unemployed.
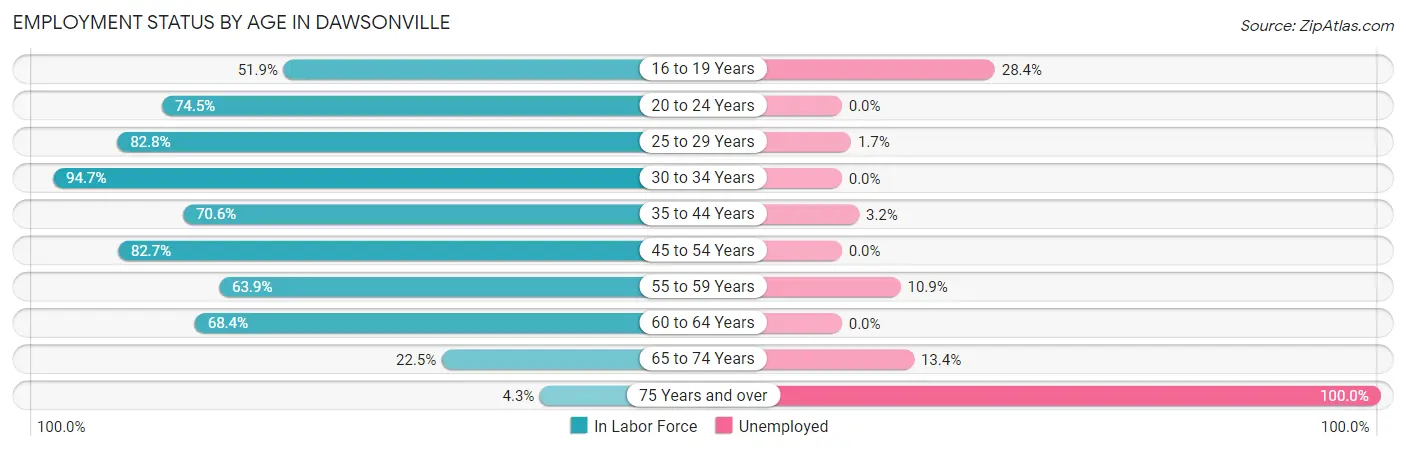
| Age Bracket | In Labor Force | Unemployed |
| 16 to 19 Years | 109 (51.9%) | 31 (28.4%) |
| 20 to 24 Years | 117 (74.5%) | 0 (0.0%) |
| 25 to 29 Years | 303 (82.8%) | 5 (1.7%) |
| 30 to 34 Years | 303 (94.7%) | 0 (0.0%) |
| 35 to 44 Years | 410 (70.6%) | 13 (3.2%) |
| 45 to 54 Years | 301 (82.7%) | 0 (0.0%) |
| 55 to 59 Years | 147 (63.9%) | 16 (10.9%) |
| 60 to 64 Years | 167 (68.4%) | 0 (0.0%) |
| 65 to 74 Years | 82 (22.5%) | 11 (13.4%) |
| 75 Years and over | 8 (4.3%) | 8 (100.0%) |
| Total | 1,946 (64.4%) | 86 (4.4%) |
Employment Status by Educational Attainment in Dawsonville
According to labor force statistics for Dawsonville, 77.5% of individuals (1,631) out of the total population between 25 and 64 years of age (2,105) are in the labor force, with 2.1% or 34 of them being unemployed. The group with the highest labor force participation rate are those with the educational attainment of college / associate degree, with 87.7% or 711 individuals in the labor force. Within the labor force, individuals with less than high school education have the highest percentage of unemployment, with 32.7% or 16 of them being unemployed.
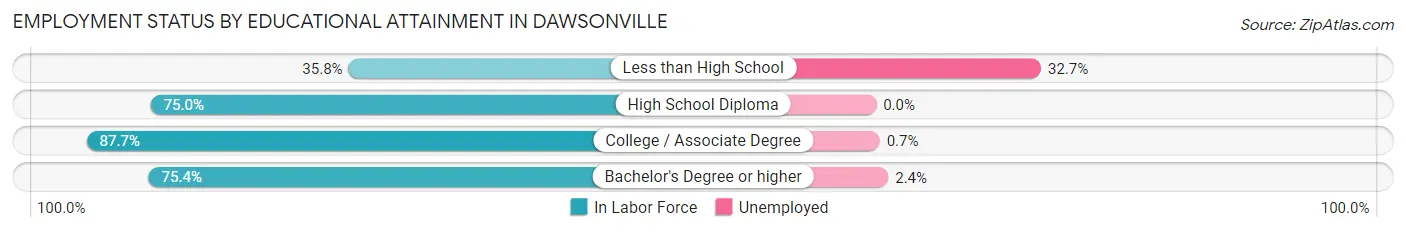
| Educational Attainment | In Labor Force | Unemployed |
| Less than High School | 49 (35.8%) | 45 (32.7%) |
| High School Diploma | 315 (75.0%) | 0 (0.0%) |
| College / Associate Degree | 711 (87.7%) | 6 (0.7%) |
| Bachelor's Degree or higher | 556 (75.4%) | 18 (2.4%) |
| Total | 1,631 (77.5%) | 44 (2.1%) |
Employment Occupations by Sex in Dawsonville
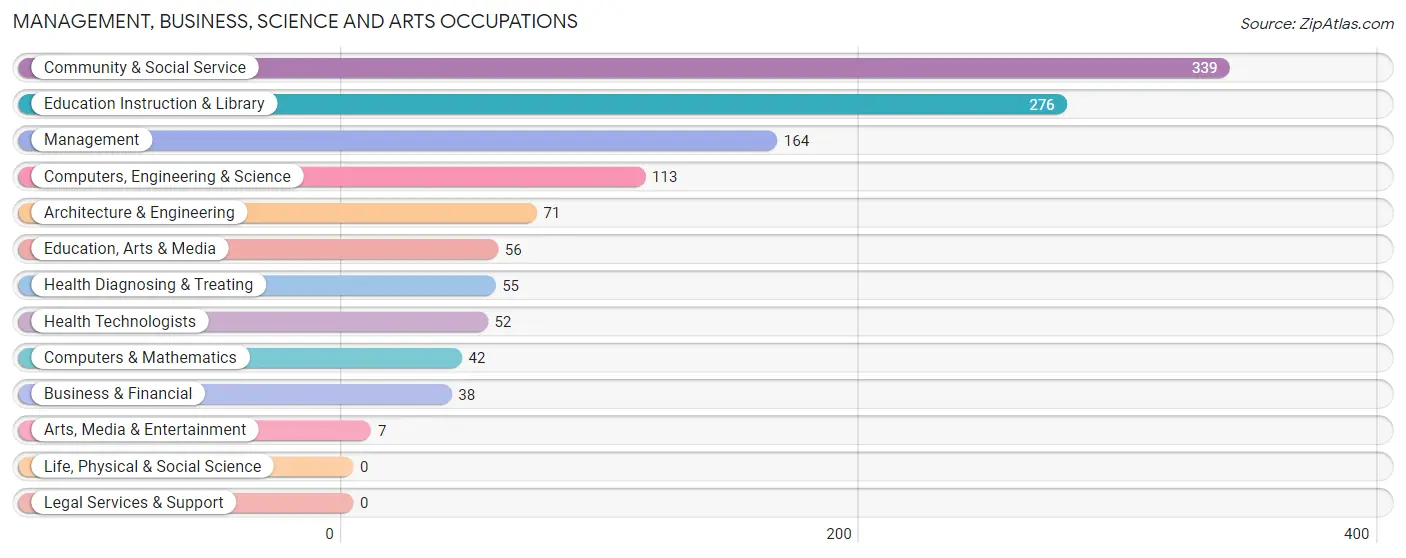
Management, Business, Science and Arts Occupations
The most common Management, Business, Science and Arts occupations in Dawsonville are Community & Social Service (339 | 18.5%), Education Instruction & Library (276 | 15.1%), Management (164 | 8.9%), Computers, Engineering & Science (113 | 6.2%), and Architecture & Engineering (71 | 3.9%).
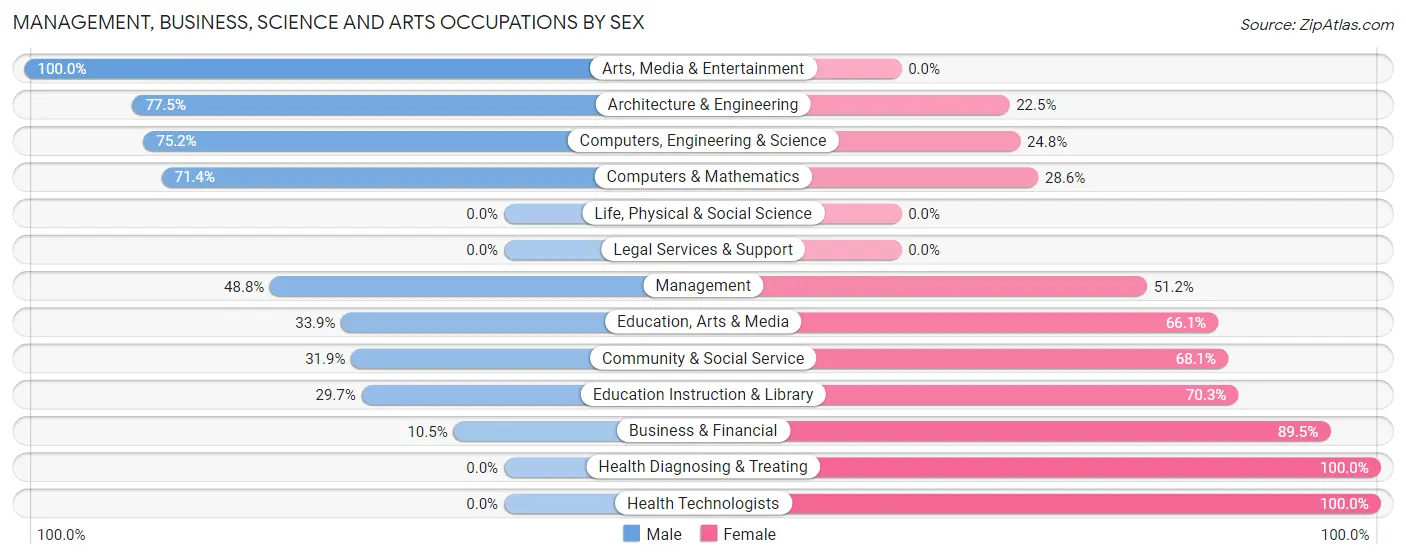
Management, Business, Science and Arts Occupations by Sex
Within the Management, Business, Science and Arts occupations in Dawsonville, the most male-oriented occupations are Arts, Media & Entertainment (100.0%), Architecture & Engineering (77.5%), and Computers, Engineering & Science (75.2%), while the most female-oriented occupations are Health Diagnosing & Treating (100.0%), Health Technologists (100.0%), and Business & Financial (89.5%).
| Occupation | Male | Female |
| Management | 80 (48.8%) | 84 (51.2%) |
| Business & Financial | 4 (10.5%) | 34 (89.5%) |
| Computers, Engineering & Science | 85 (75.2%) | 28 (24.8%) |
| Computers & Mathematics | 30 (71.4%) | 12 (28.6%) |
| Architecture & Engineering | 55 (77.5%) | 16 (22.5%) |
| Life, Physical & Social Science | 0 (0.0%) | 0 (0.0%) |
| Community & Social Service | 108 (31.9%) | 231 (68.1%) |
| Education, Arts & Media | 19 (33.9%) | 37 (66.1%) |
| Legal Services & Support | 0 (0.0%) | 0 (0.0%) |
| Education Instruction & Library | 82 (29.7%) | 194 (70.3%) |
| Arts, Media & Entertainment | 7 (100.0%) | 0 (0.0%) |
| Health Diagnosing & Treating | 0 (0.0%) | 55 (100.0%) |
| Health Technologists | 0 (0.0%) | 52 (100.0%) |
| Total (Category) | 277 (39.1%) | 432 (60.9%) |
| Total (Overall) | 990 (54.0%) | 842 (46.0%) |
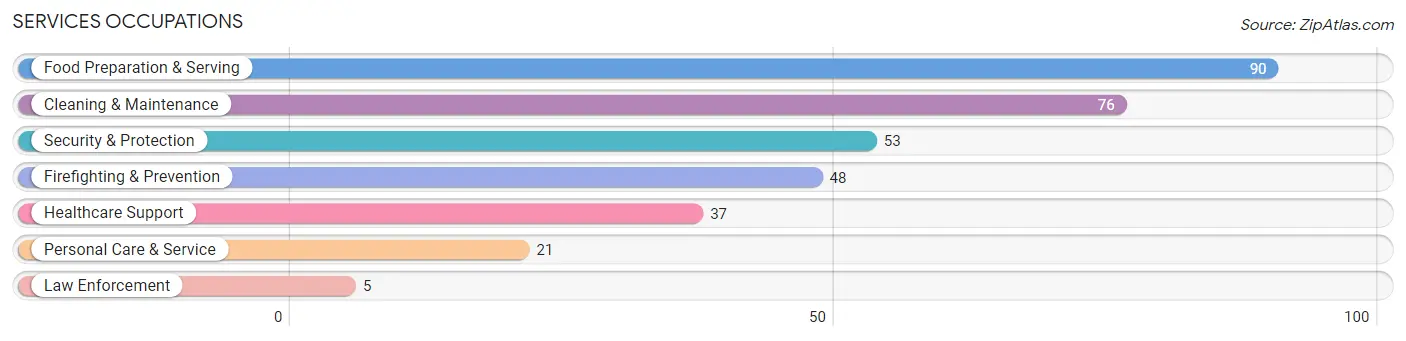
Services Occupations
The most common Services occupations in Dawsonville are Food Preparation & Serving (90 | 4.9%), Cleaning & Maintenance (76 | 4.2%), Security & Protection (53 | 2.9%), Firefighting & Prevention (48 | 2.6%), and Healthcare Support (37 | 2.0%).
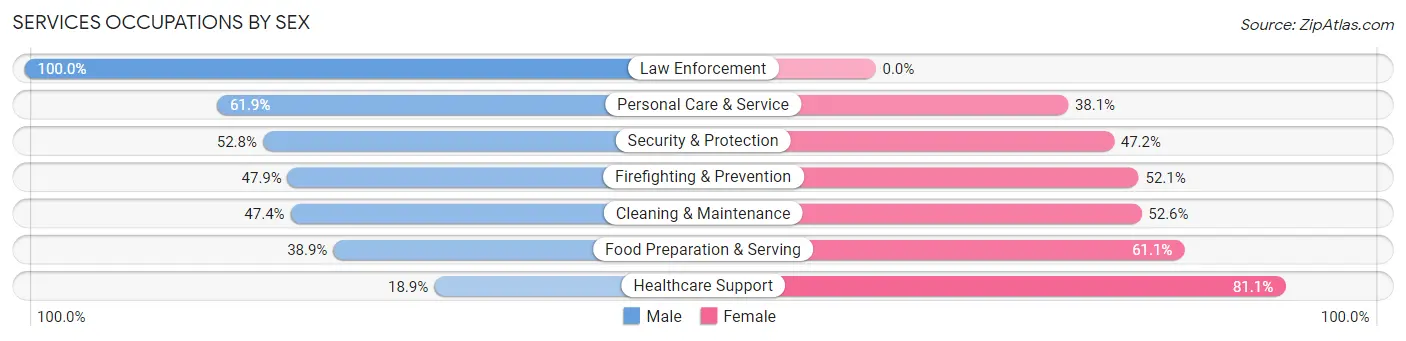
Services Occupations by Sex
Within the Services occupations in Dawsonville, the most male-oriented occupations are Law Enforcement (100.0%), Personal Care & Service (61.9%), and Security & Protection (52.8%), while the most female-oriented occupations are Healthcare Support (81.1%), Food Preparation & Serving (61.1%), and Cleaning & Maintenance (52.6%).
| Occupation | Male | Female |
| Healthcare Support | 7 (18.9%) | 30 (81.1%) |
| Security & Protection | 28 (52.8%) | 25 (47.2%) |
| Firefighting & Prevention | 23 (47.9%) | 25 (52.1%) |
| Law Enforcement | 5 (100.0%) | 0 (0.0%) |
| Food Preparation & Serving | 35 (38.9%) | 55 (61.1%) |
| Cleaning & Maintenance | 36 (47.4%) | 40 (52.6%) |
| Personal Care & Service | 13 (61.9%) | 8 (38.1%) |
| Total (Category) | 119 (43.0%) | 158 (57.0%) |
| Total (Overall) | 990 (54.0%) | 842 (46.0%) |
Sales and Office Occupations
The most common Sales and Office occupations in Dawsonville are Sales & Related (358 | 19.5%), and Office & Administration (160 | 8.7%).

Sales and Office Occupations by Sex
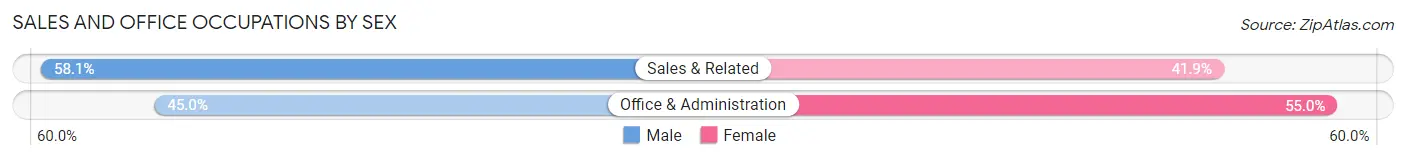
| Occupation | Male | Female |
| Sales & Related | 208 (58.1%) | 150 (41.9%) |
| Office & Administration | 72 (45.0%) | 88 (55.0%) |
| Total (Category) | 280 (54.0%) | 238 (46.0%) |
| Total (Overall) | 990 (54.0%) | 842 (46.0%) |
Natural Resources, Construction and Maintenance Occupations
The most common Natural Resources, Construction and Maintenance occupations in Dawsonville are Construction & Extraction (108 | 5.9%), Installation, Maintenance & Repair (60 | 3.3%), and Farming, Fishing & Forestry (3 | 0.2%).

Natural Resources, Construction and Maintenance Occupations by Sex
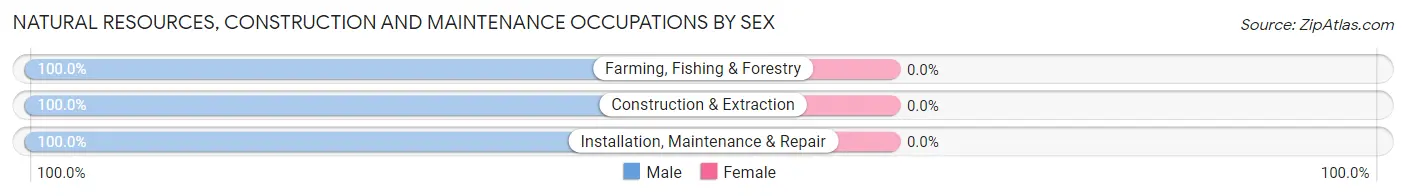
| Occupation | Male | Female |
| Farming, Fishing & Forestry | 3 (100.0%) | 0 (0.0%) |
| Construction & Extraction | 108 (100.0%) | 0 (0.0%) |
| Installation, Maintenance & Repair | 60 (100.0%) | 0 (0.0%) |
| Total (Category) | 171 (100.0%) | 0 (0.0%) |
| Total (Overall) | 990 (54.0%) | 842 (46.0%) |
Production, Transportation and Moving Occupations
The most common Production, Transportation and Moving occupations in Dawsonville are Production (100 | 5.5%), Transportation (47 | 2.6%), and Material Moving (10 | 0.5%).
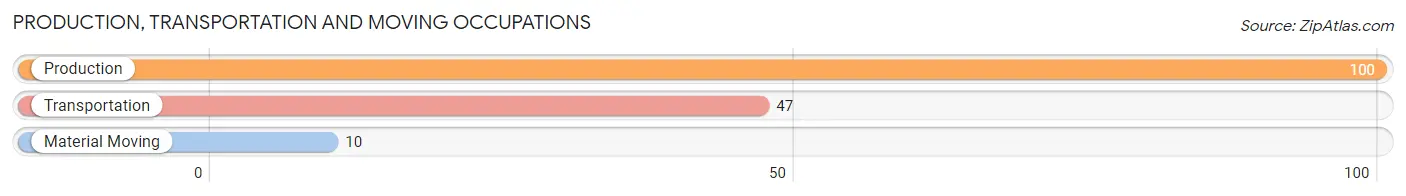
Production, Transportation and Moving Occupations by Sex
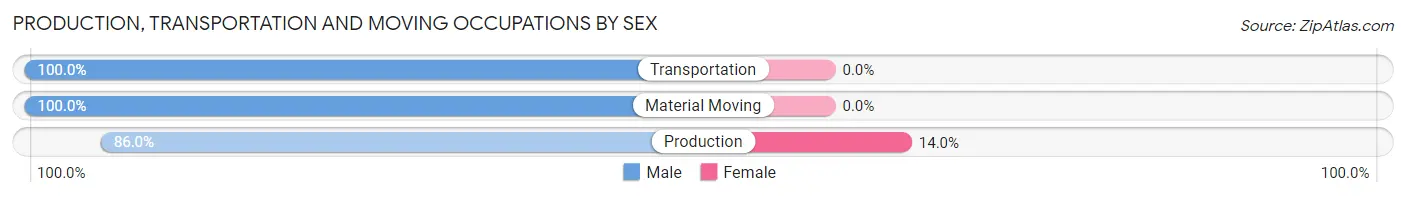
| Occupation | Male | Female |
| Production | 86 (86.0%) | 14 (14.0%) |
| Transportation | 47 (100.0%) | 0 (0.0%) |
| Material Moving | 10 (100.0%) | 0 (0.0%) |
| Total (Category) | 143 (91.1%) | 14 (8.9%) |
| Total (Overall) | 990 (54.0%) | 842 (46.0%) |
Employment Industries by Sex in Dawsonville
Employment Industries in Dawsonville
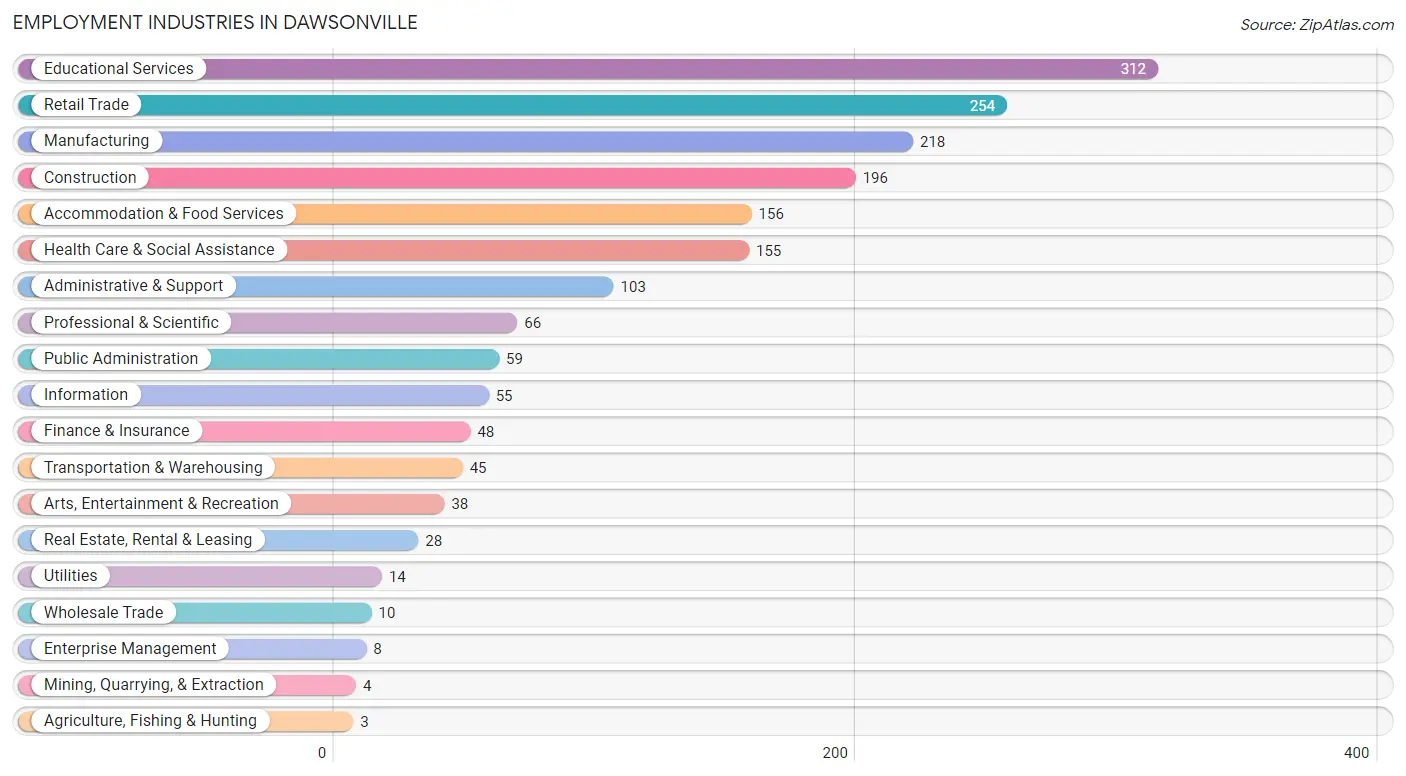
The major employment industries in Dawsonville include Educational Services (312 | 17.0%), Retail Trade (254 | 13.9%), Manufacturing (218 | 11.9%), Construction (196 | 10.7%), and Accommodation & Food Services (156 | 8.5%).
Employment Industries by Sex in Dawsonville
The Dawsonville industries that see more men than women are Agriculture, Fishing & Hunting (100.0%), Mining, Quarrying, & Extraction (100.0%), and Wholesale Trade (100.0%), whereas the industries that tend to have a higher number of women are Real Estate, Rental & Leasing (100.0%), Information (87.3%), and Health Care & Social Assistance (82.6%).
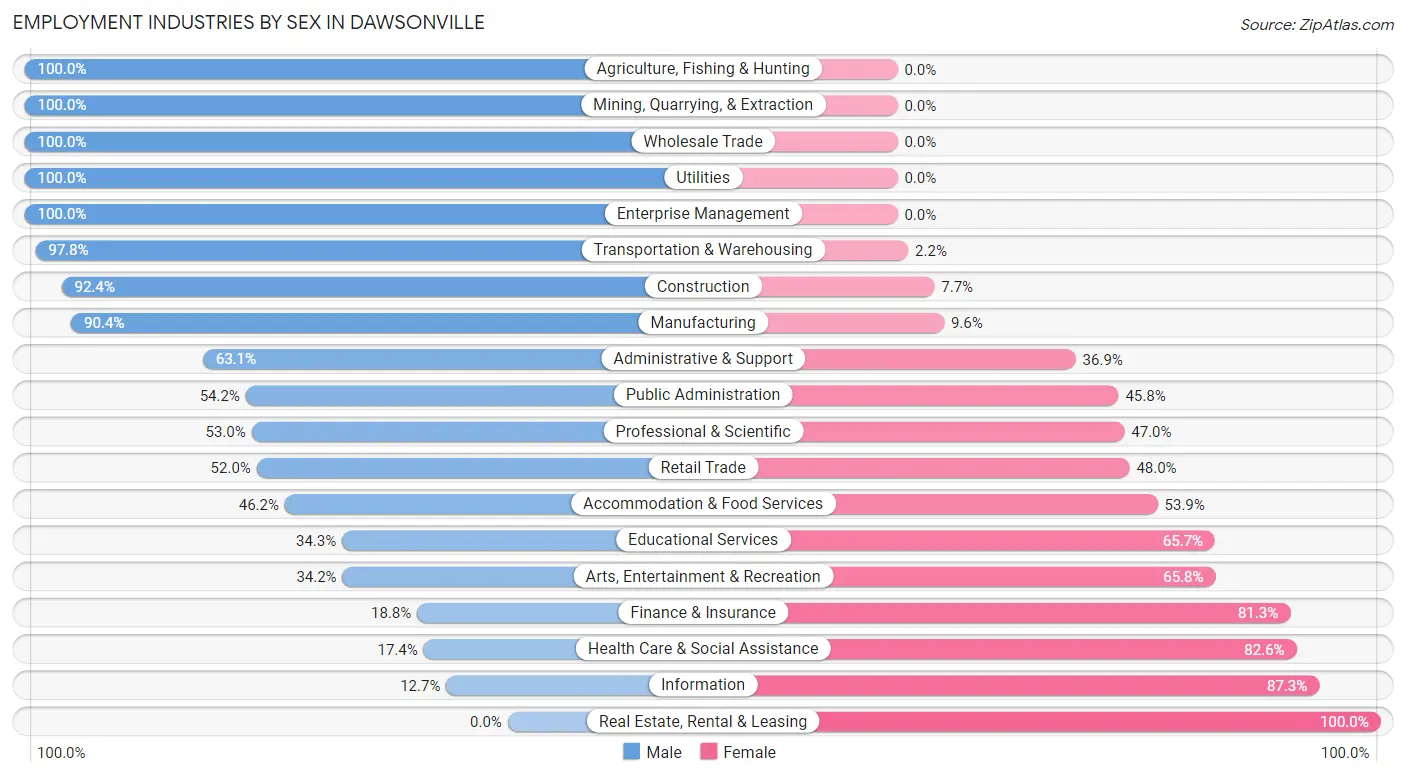
| Industry | Male | Female |
| Agriculture, Fishing & Hunting | 3 (100.0%) | 0 (0.0%) |
| Mining, Quarrying, & Extraction | 4 (100.0%) | 0 (0.0%) |
| Construction | 181 (92.3%) | 15 (7.6%) |
| Manufacturing | 197 (90.4%) | 21 (9.6%) |
| Wholesale Trade | 10 (100.0%) | 0 (0.0%) |
| Retail Trade | 132 (52.0%) | 122 (48.0%) |
| Transportation & Warehousing | 44 (97.8%) | 1 (2.2%) |
| Utilities | 14 (100.0%) | 0 (0.0%) |
| Information | 7 (12.7%) | 48 (87.3%) |
| Finance & Insurance | 9 (18.8%) | 39 (81.2%) |
| Real Estate, Rental & Leasing | 0 (0.0%) | 28 (100.0%) |
| Professional & Scientific | 35 (53.0%) | 31 (47.0%) |
| Enterprise Management | 8 (100.0%) | 0 (0.0%) |
| Administrative & Support | 65 (63.1%) | 38 (36.9%) |
| Educational Services | 107 (34.3%) | 205 (65.7%) |
| Health Care & Social Assistance | 27 (17.4%) | 128 (82.6%) |
| Arts, Entertainment & Recreation | 13 (34.2%) | 25 (65.8%) |
| Accommodation & Food Services | 72 (46.2%) | 84 (53.8%) |
| Public Administration | 32 (54.2%) | 27 (45.8%) |
| Total | 990 (54.0%) | 842 (46.0%) |
Education in Dawsonville
School Enrollment in Dawsonville
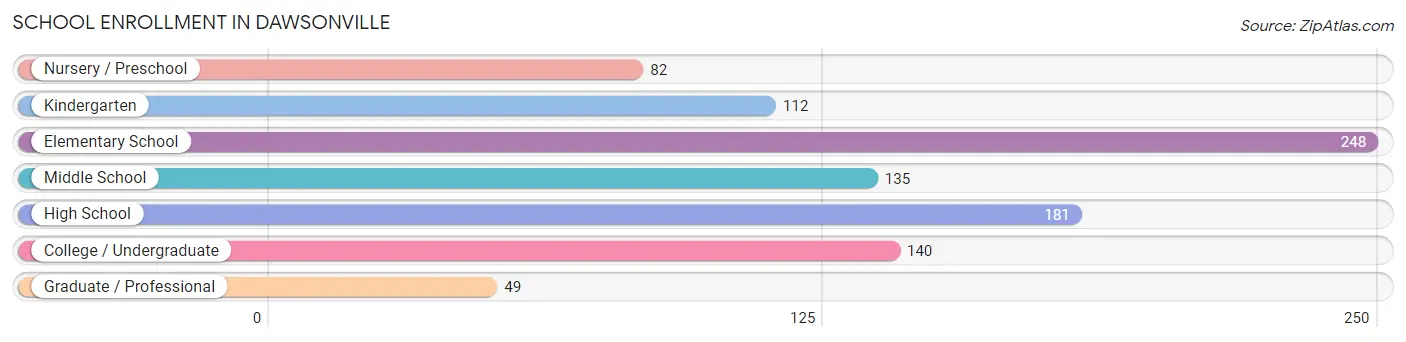
The most common levels of schooling among the 947 students in Dawsonville are elementary school (248 | 26.2%), high school (181 | 19.1%), and college / undergraduate (140 | 14.8%).
| School Level | # Students | % Students |
| Nursery / Preschool | 82 | 8.7% |
| Kindergarten | 112 | 11.8% |
| Elementary School | 248 | 26.2% |
| Middle School | 135 | 14.3% |
| High School | 181 | 19.1% |
| College / Undergraduate | 140 | 14.8% |
| Graduate / Professional | 49 | 5.2% |
| Total | 947 | 100.0% |
School Enrollment by Age by Funding Source in Dawsonville
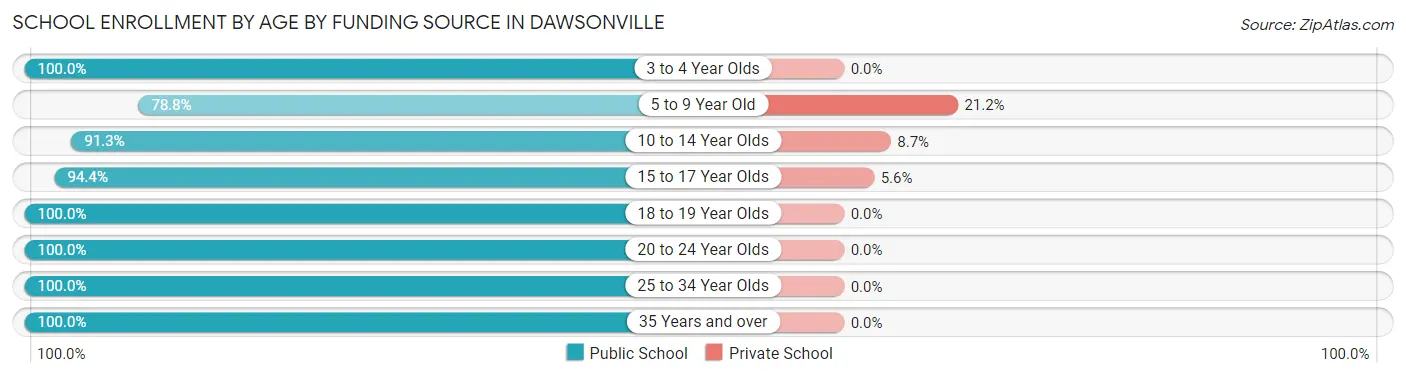
Out of a total of 947 students who are enrolled in schools in Dawsonville, 98 (10.3%) attend a private institution, while the remaining 849 (89.7%) are enrolled in public schools. The age group of 5 to 9 year old has the highest likelihood of being enrolled in private schools, with 75 (21.2% in the age bracket) enrolled. Conversely, the age group of 3 to 4 year olds has the lowest likelihood of being enrolled in a private school, with 82 (100.0% in the age bracket) attending a public institution.
| Age Bracket | Public School | Private School |
| 3 to 4 Year Olds | 82 (100.0%) | 0 (0.0%) |
| 5 to 9 Year Old | 279 (78.8%) | 75 (21.2%) |
| 10 to 14 Year Olds | 147 (91.3%) | 14 (8.7%) |
| 15 to 17 Year Olds | 152 (94.4%) | 9 (5.6%) |
| 18 to 19 Year Olds | 37 (100.0%) | 0 (0.0%) |
| 20 to 24 Year Olds | 40 (100.0%) | 0 (0.0%) |
| 25 to 34 Year Olds | 76 (100.0%) | 0 (0.0%) |
| 35 Years and over | 36 (100.0%) | 0 (0.0%) |
| Total | 849 (89.7%) | 98 (10.3%) |
Educational Attainment by Field of Study in Dawsonville
Education (189 | 20.3%), business (152 | 16.3%), psychology (97 | 10.4%), science & technology (96 | 10.3%), and arts & humanities (73 | 7.8%) are the most common fields of study among 933 individuals in Dawsonville who have obtained a bachelor's degree or higher.
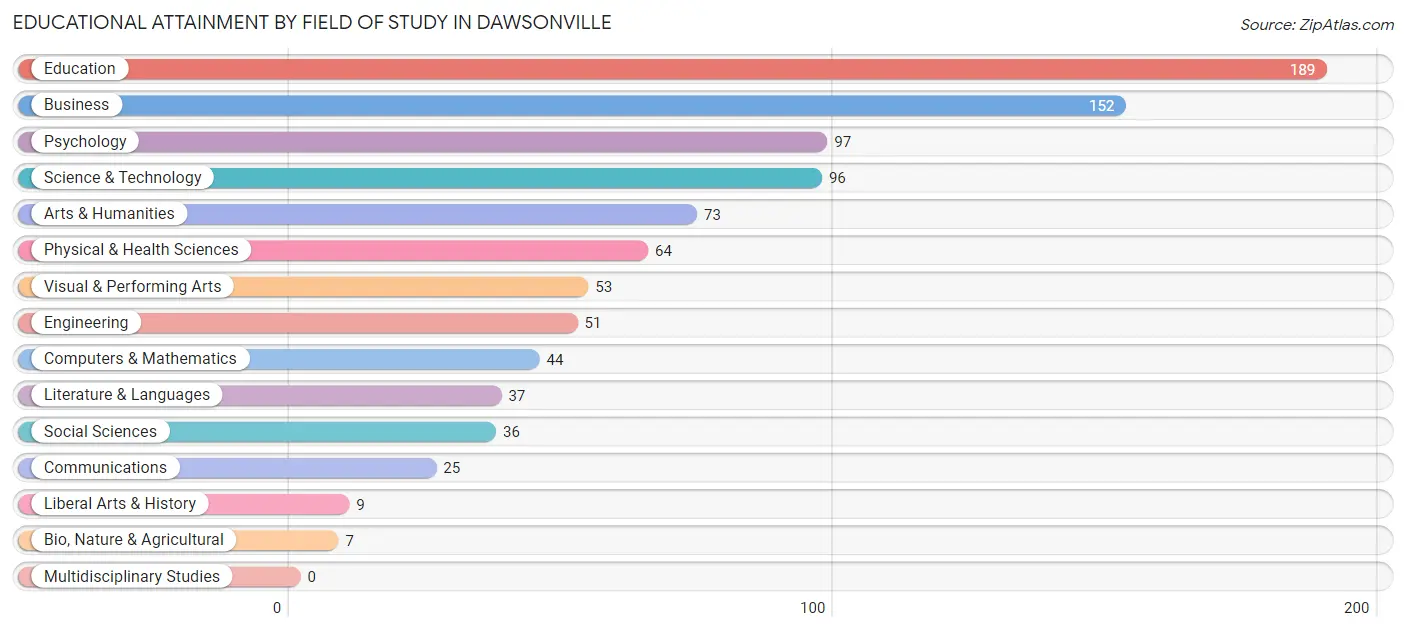
| Field of Study | # Graduates | % Graduates |
| Computers & Mathematics | 44 | 4.7% |
| Bio, Nature & Agricultural | 7 | 0.7% |
| Physical & Health Sciences | 64 | 6.9% |
| Psychology | 97 | 10.4% |
| Social Sciences | 36 | 3.9% |
| Engineering | 51 | 5.5% |
| Multidisciplinary Studies | 0 | 0.0% |
| Science & Technology | 96 | 10.3% |
| Business | 152 | 16.3% |
| Education | 189 | 20.3% |
| Literature & Languages | 37 | 4.0% |
| Liberal Arts & History | 9 | 1.0% |
| Visual & Performing Arts | 53 | 5.7% |
| Communications | 25 | 2.7% |
| Arts & Humanities | 73 | 7.8% |
| Total | 933 | 100.0% |
Transportation & Commute in Dawsonville
Vehicle Availability by Sex in Dawsonville
The most prevalent vehicle ownership categories in Dawsonville are males with 2 vehicles (531, accounting for 56.2%) and females with 2 vehicles (347, making up 67.9%).
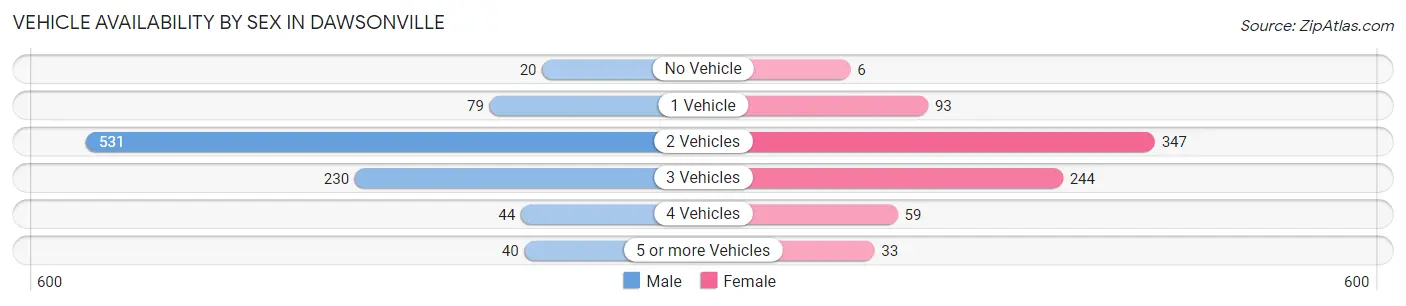
| Vehicles Available | Male | Female |
| No Vehicle | 20 (2.1%) | 6 (0.8%) |
| 1 Vehicle | 79 (8.4%) | 93 (11.9%) |
| 2 Vehicles | 531 (56.2%) | 347 (44.4%) |
| 3 Vehicles | 230 (24.4%) | 244 (31.2%) |
| 4 Vehicles | 44 (4.7%) | 59 (7.5%) |
| 5 or more Vehicles | 40 (4.2%) | 33 (4.2%) |
| Total | 944 (100.0%) | 782 (100.0%) |
Commute Time in Dawsonville
The most frequently occuring commute durations in Dawsonville are 45 to 59 minutes (230 commuters, 15.8%), 15 to 19 minutes (225 commuters, 15.5%), and 30 to 34 minutes (203 commuters, 14.0%).
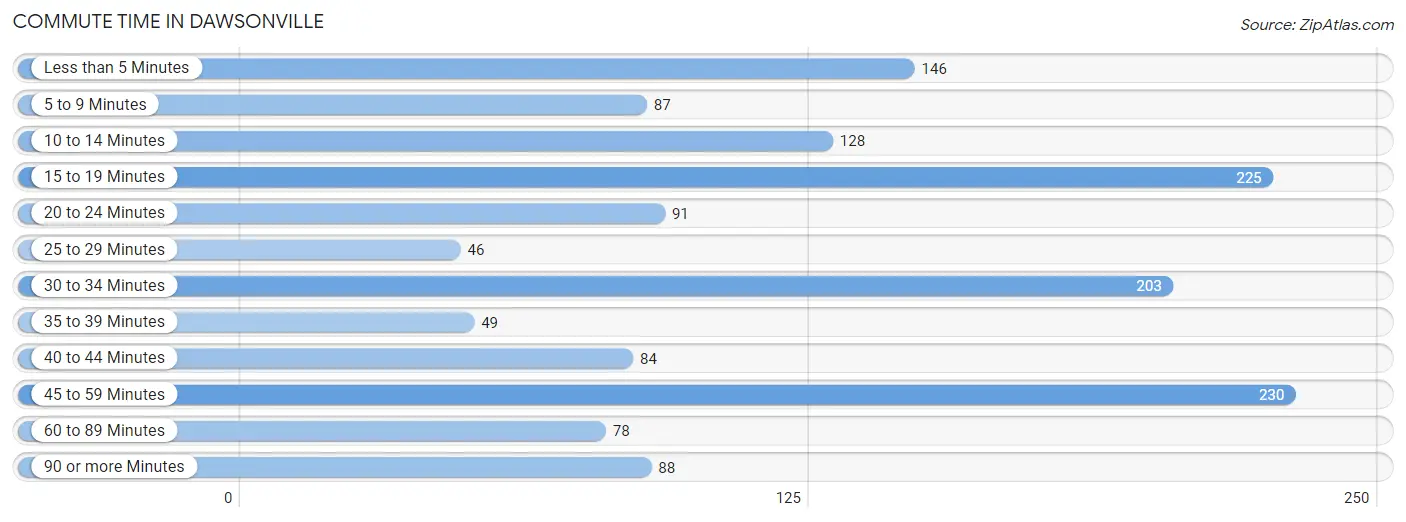
| Commute Time | # Commuters | % Commuters |
| Less than 5 Minutes | 146 | 10.0% |
| 5 to 9 Minutes | 87 | 6.0% |
| 10 to 14 Minutes | 128 | 8.8% |
| 15 to 19 Minutes | 225 | 15.5% |
| 20 to 24 Minutes | 91 | 6.2% |
| 25 to 29 Minutes | 46 | 3.2% |
| 30 to 34 Minutes | 203 | 14.0% |
| 35 to 39 Minutes | 49 | 3.4% |
| 40 to 44 Minutes | 84 | 5.8% |
| 45 to 59 Minutes | 230 | 15.8% |
| 60 to 89 Minutes | 78 | 5.4% |
| 90 or more Minutes | 88 | 6.0% |
Commute Time by Sex in Dawsonville
The most common commute times in Dawsonville are 45 to 59 minutes (133 commuters, 17.2%) for males and 15 to 19 minutes (164 commuters, 24.0%) for females.
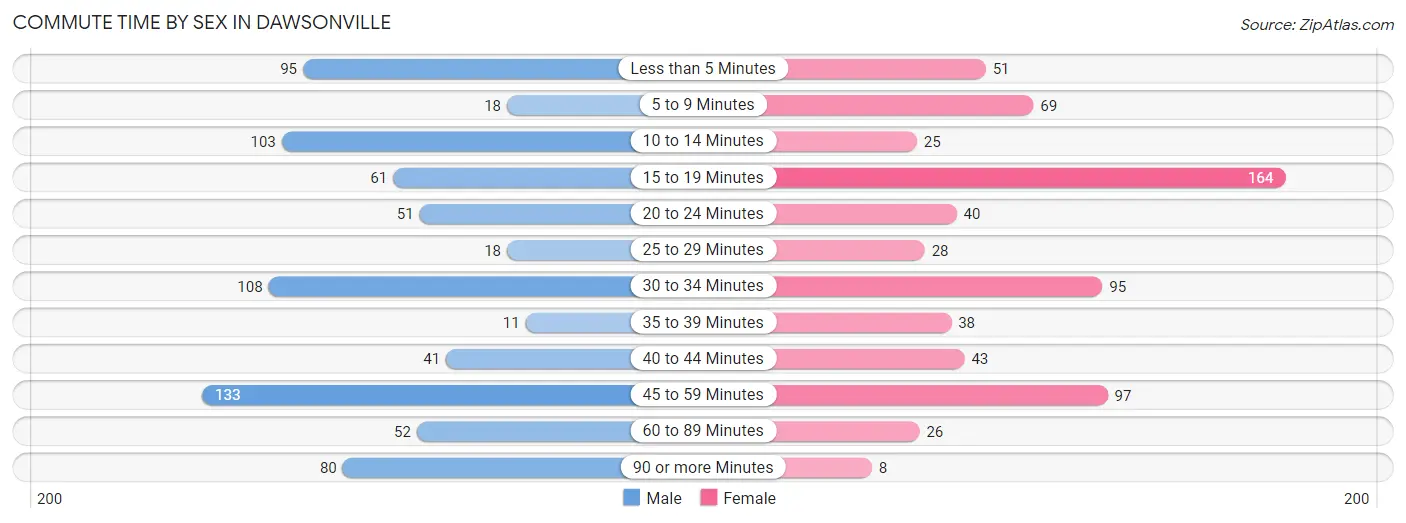
| Commute Time | Male | Female |
| Less than 5 Minutes | 95 (12.3%) | 51 (7.5%) |
| 5 to 9 Minutes | 18 (2.3%) | 69 (10.1%) |
| 10 to 14 Minutes | 103 (13.4%) | 25 (3.6%) |
| 15 to 19 Minutes | 61 (7.9%) | 164 (24.0%) |
| 20 to 24 Minutes | 51 (6.6%) | 40 (5.9%) |
| 25 to 29 Minutes | 18 (2.3%) | 28 (4.1%) |
| 30 to 34 Minutes | 108 (14.0%) | 95 (13.9%) |
| 35 to 39 Minutes | 11 (1.4%) | 38 (5.6%) |
| 40 to 44 Minutes | 41 (5.3%) | 43 (6.3%) |
| 45 to 59 Minutes | 133 (17.2%) | 97 (14.2%) |
| 60 to 89 Minutes | 52 (6.7%) | 26 (3.8%) |
| 90 or more Minutes | 80 (10.4%) | 8 (1.2%) |
Time of Departure to Work by Sex in Dawsonville
The most frequent times of departure to work in Dawsonville are 7:30 AM to 7:59 AM (130, 16.9%) for males and 6:30 AM to 6:59 AM (229, 33.5%) for females.
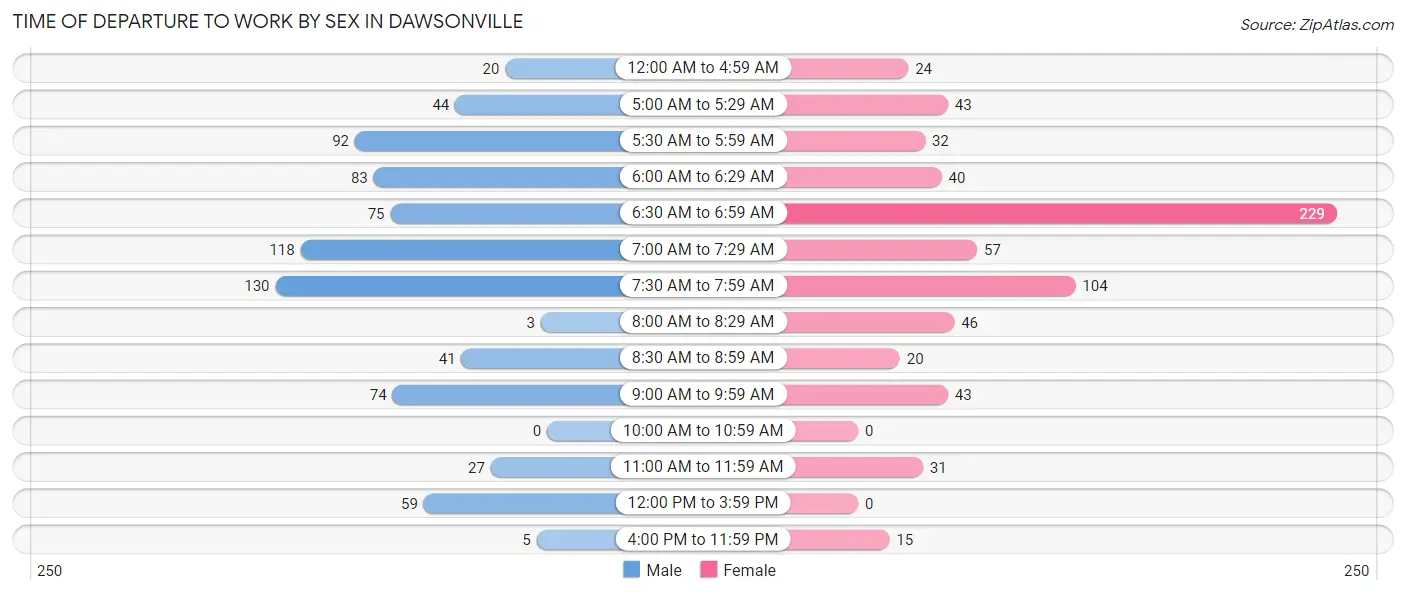
| Time of Departure | Male | Female |
| 12:00 AM to 4:59 AM | 20 (2.6%) | 24 (3.5%) |
| 5:00 AM to 5:29 AM | 44 (5.7%) | 43 (6.3%) |
| 5:30 AM to 5:59 AM | 92 (11.9%) | 32 (4.7%) |
| 6:00 AM to 6:29 AM | 83 (10.8%) | 40 (5.9%) |
| 6:30 AM to 6:59 AM | 75 (9.7%) | 229 (33.5%) |
| 7:00 AM to 7:29 AM | 118 (15.3%) | 57 (8.3%) |
| 7:30 AM to 7:59 AM | 130 (16.9%) | 104 (15.2%) |
| 8:00 AM to 8:29 AM | 3 (0.4%) | 46 (6.7%) |
| 8:30 AM to 8:59 AM | 41 (5.3%) | 20 (2.9%) |
| 9:00 AM to 9:59 AM | 74 (9.6%) | 43 (6.3%) |
| 10:00 AM to 10:59 AM | 0 (0.0%) | 0 (0.0%) |
| 11:00 AM to 11:59 AM | 27 (3.5%) | 31 (4.5%) |
| 12:00 PM to 3:59 PM | 59 (7.6%) | 0 (0.0%) |
| 4:00 PM to 11:59 PM | 5 (0.6%) | 15 (2.2%) |
| Total | 771 (100.0%) | 684 (100.0%) |
Housing Occupancy in Dawsonville
Occupancy by Ownership in Dawsonville
Of the total 1,369 dwellings in Dawsonville, owner-occupied units account for 1,003 (73.3%), while renter-occupied units make up 366 (26.7%).
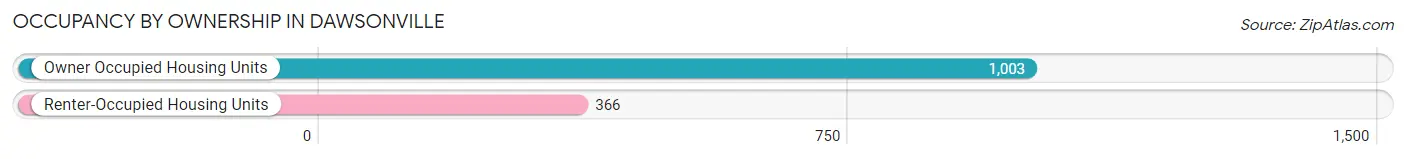
| Occupancy | # Housing Units | % Housing Units |
| Owner Occupied Housing Units | 1,003 | 73.3% |
| Renter-Occupied Housing Units | 366 | 26.7% |
| Total Occupied Housing Units | 1,369 | 100.0% |
Occupancy by Household Size in Dawsonville
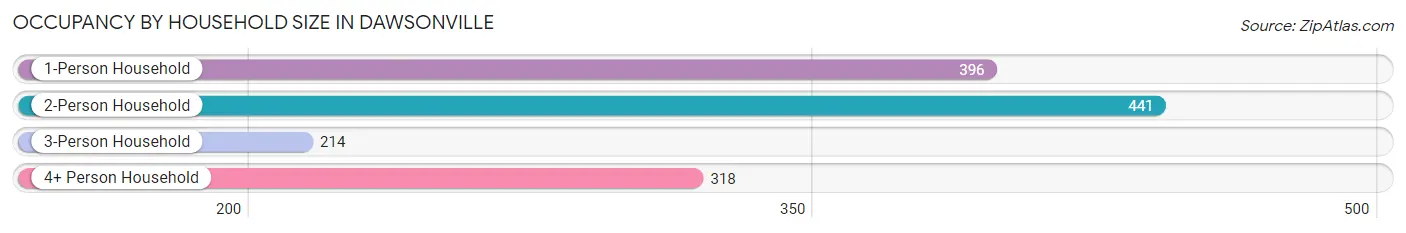
| Household Size | # Housing Units | % Housing Units |
| 1-Person Household | 396 | 28.9% |
| 2-Person Household | 441 | 32.2% |
| 3-Person Household | 214 | 15.6% |
| 4+ Person Household | 318 | 23.2% |
| Total Housing Units | 1,369 | 100.0% |
Occupancy by Ownership by Household Size in Dawsonville
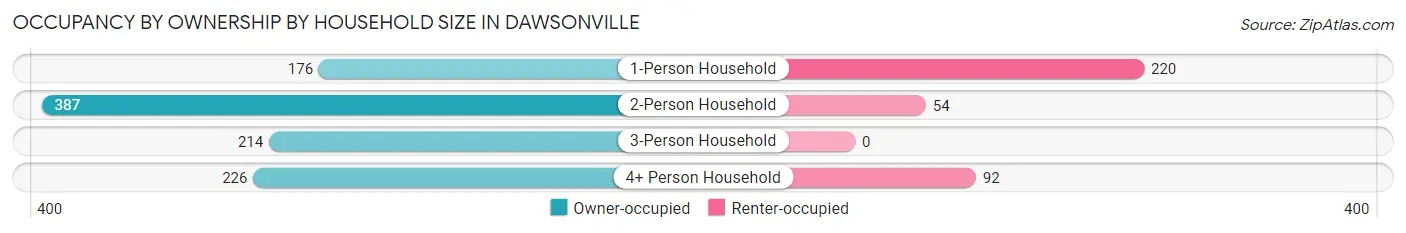
| Household Size | Owner-occupied | Renter-occupied |
| 1-Person Household | 176 (44.4%) | 220 (55.6%) |
| 2-Person Household | 387 (87.8%) | 54 (12.2%) |
| 3-Person Household | 214 (100.0%) | 0 (0.0%) |
| 4+ Person Household | 226 (71.1%) | 92 (28.9%) |
| Total Housing Units | 1,003 (73.3%) | 366 (26.7%) |
Occupancy by Educational Attainment in Dawsonville
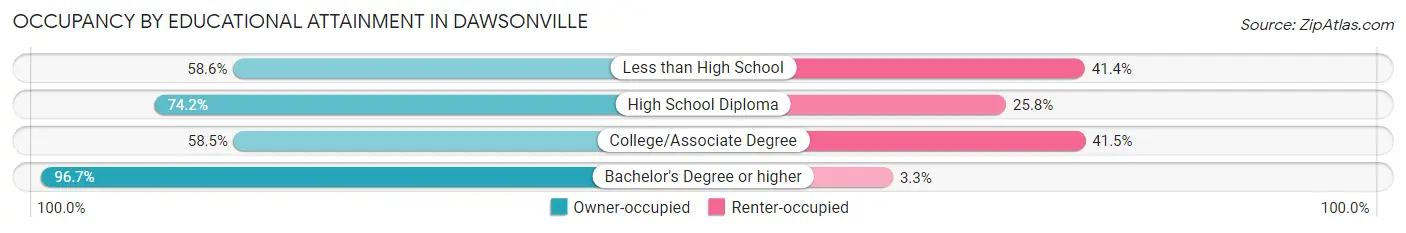
| Household Size | Owner-occupied | Renter-occupied |
| Less than High School | 51 (58.6%) | 36 (41.4%) |
| High School Diploma | 196 (74.2%) | 68 (25.8%) |
| College/Associate Degree | 350 (58.5%) | 248 (41.5%) |
| Bachelor's Degree or higher | 406 (96.7%) | 14 (3.3%) |
Occupancy by Age of Householder in Dawsonville
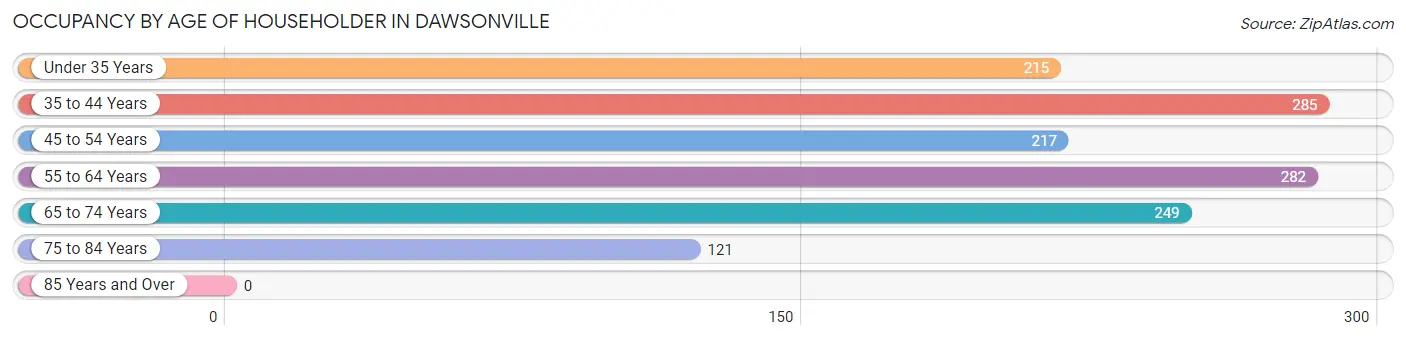
| Age Bracket | # Households | % Households |
| Under 35 Years | 215 | 15.7% |
| 35 to 44 Years | 285 | 20.8% |
| 45 to 54 Years | 217 | 15.9% |
| 55 to 64 Years | 282 | 20.6% |
| 65 to 74 Years | 249 | 18.2% |
| 75 to 84 Years | 121 | 8.8% |
| 85 Years and Over | 0 | 0.0% |
| Total | 1,369 | 100.0% |
Housing Finances in Dawsonville
Median Income by Occupancy in Dawsonville
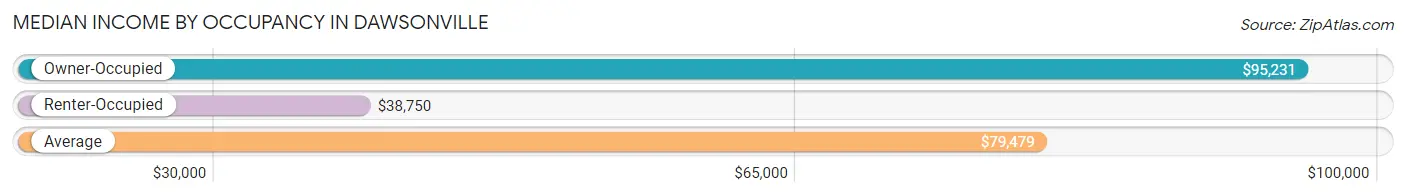
| Occupancy Type | # Households | Median Income |
| Owner-Occupied | 1,003 (73.3%) | $95,231 |
| Renter-Occupied | 366 (26.7%) | $38,750 |
| Average | 1,369 (100.0%) | $79,479 |
Occupancy by Householder Income Bracket in Dawsonville
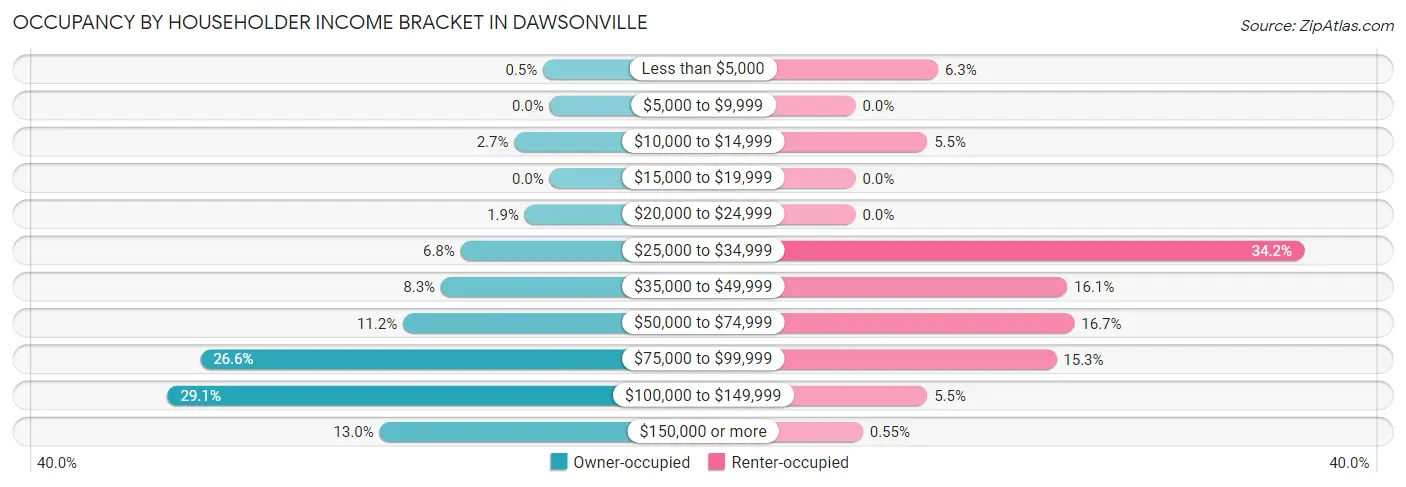
| Income Bracket | Owner-occupied | Renter-occupied |
| Less than $5,000 | 5 (0.5%) | 23 (6.3%) |
| $5,000 to $9,999 | 0 (0.0%) | 0 (0.0%) |
| $10,000 to $14,999 | 27 (2.7%) | 20 (5.5%) |
| $15,000 to $19,999 | 0 (0.0%) | 0 (0.0%) |
| $20,000 to $24,999 | 19 (1.9%) | 0 (0.0%) |
| $25,000 to $34,999 | 68 (6.8%) | 125 (34.2%) |
| $35,000 to $49,999 | 83 (8.3%) | 59 (16.1%) |
| $50,000 to $74,999 | 112 (11.2%) | 61 (16.7%) |
| $75,000 to $99,999 | 267 (26.6%) | 56 (15.3%) |
| $100,000 to $149,999 | 292 (29.1%) | 20 (5.5%) |
| $150,000 or more | 130 (13.0%) | 2 (0.5%) |
| Total | 1,003 (100.0%) | 366 (100.0%) |
Monthly Housing Cost Tiers in Dawsonville
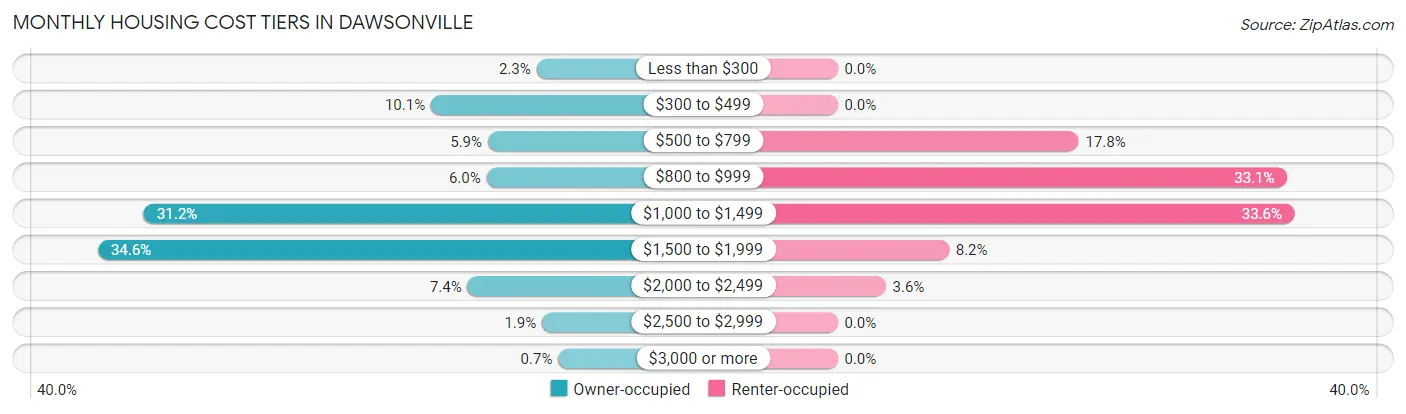
| Monthly Cost | Owner-occupied | Renter-occupied |
| Less than $300 | 23 (2.3%) | 0 (0.0%) |
| $300 to $499 | 101 (10.1%) | 0 (0.0%) |
| $500 to $799 | 59 (5.9%) | 65 (17.8%) |
| $800 to $999 | 60 (6.0%) | 121 (33.1%) |
| $1,000 to $1,499 | 313 (31.2%) | 123 (33.6%) |
| $1,500 to $1,999 | 347 (34.6%) | 30 (8.2%) |
| $2,000 to $2,499 | 74 (7.4%) | 13 (3.5%) |
| $2,500 to $2,999 | 19 (1.9%) | 0 (0.0%) |
| $3,000 or more | 7 (0.7%) | 0 (0.0%) |
| Total | 1,003 (100.0%) | 366 (100.0%) |
Physical Housing Characteristics in Dawsonville
Housing Structures in Dawsonville
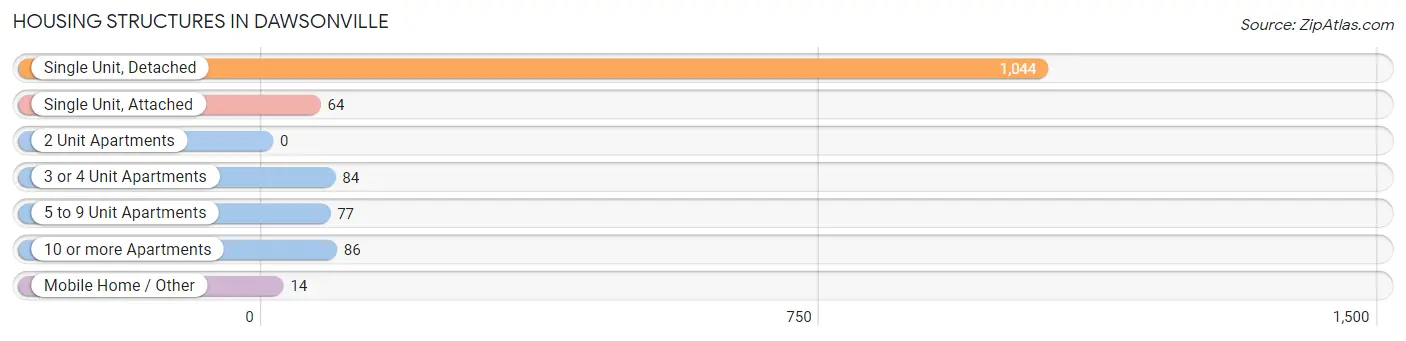
| Structure Type | # Housing Units | % Housing Units |
| Single Unit, Detached | 1,044 | 76.3% |
| Single Unit, Attached | 64 | 4.7% |
| 2 Unit Apartments | 0 | 0.0% |
| 3 or 4 Unit Apartments | 84 | 6.1% |
| 5 to 9 Unit Apartments | 77 | 5.6% |
| 10 or more Apartments | 86 | 6.3% |
| Mobile Home / Other | 14 | 1.0% |
| Total | 1,369 | 100.0% |
Housing Structures by Occupancy in Dawsonville
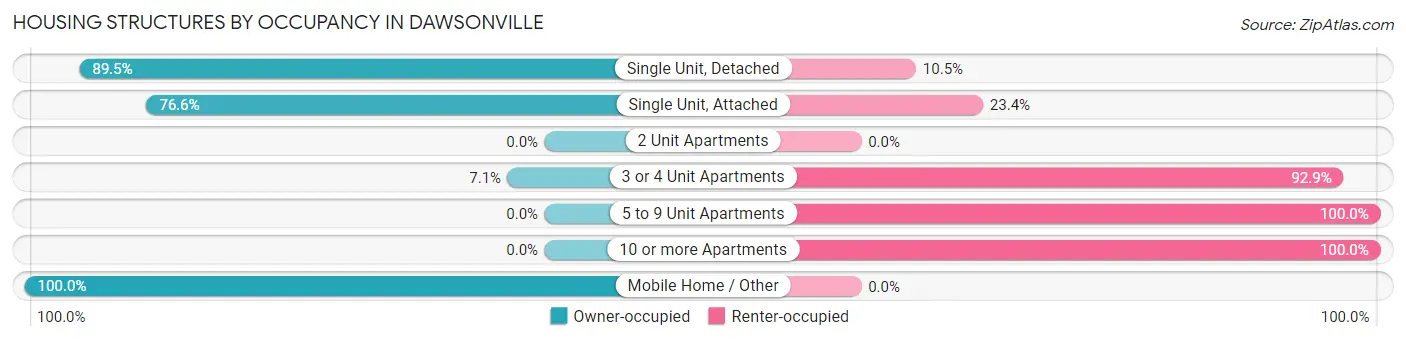
| Structure Type | Owner-occupied | Renter-occupied |
| Single Unit, Detached | 934 (89.5%) | 110 (10.5%) |
| Single Unit, Attached | 49 (76.6%) | 15 (23.4%) |
| 2 Unit Apartments | 0 (0.0%) | 0 (0.0%) |
| 3 or 4 Unit Apartments | 6 (7.1%) | 78 (92.9%) |
| 5 to 9 Unit Apartments | 0 (0.0%) | 77 (100.0%) |
| 10 or more Apartments | 0 (0.0%) | 86 (100.0%) |
| Mobile Home / Other | 14 (100.0%) | 0 (0.0%) |
| Total | 1,003 (73.3%) | 366 (26.7%) |
Housing Structures by Number of Rooms in Dawsonville
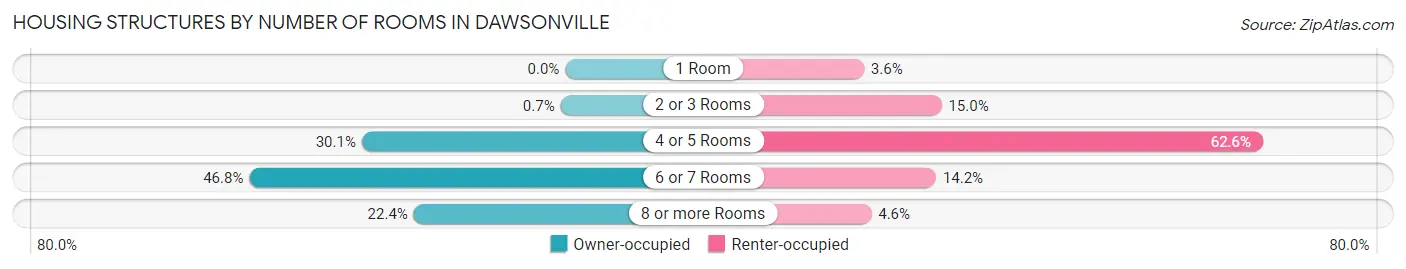
| Number of Rooms | Owner-occupied | Renter-occupied |
| 1 Room | 0 (0.0%) | 13 (3.5%) |
| 2 or 3 Rooms | 7 (0.7%) | 55 (15.0%) |
| 4 or 5 Rooms | 302 (30.1%) | 229 (62.6%) |
| 6 or 7 Rooms | 469 (46.8%) | 52 (14.2%) |
| 8 or more Rooms | 225 (22.4%) | 17 (4.6%) |
| Total | 1,003 (100.0%) | 366 (100.0%) |
Housing Structure by Heating Type in Dawsonville
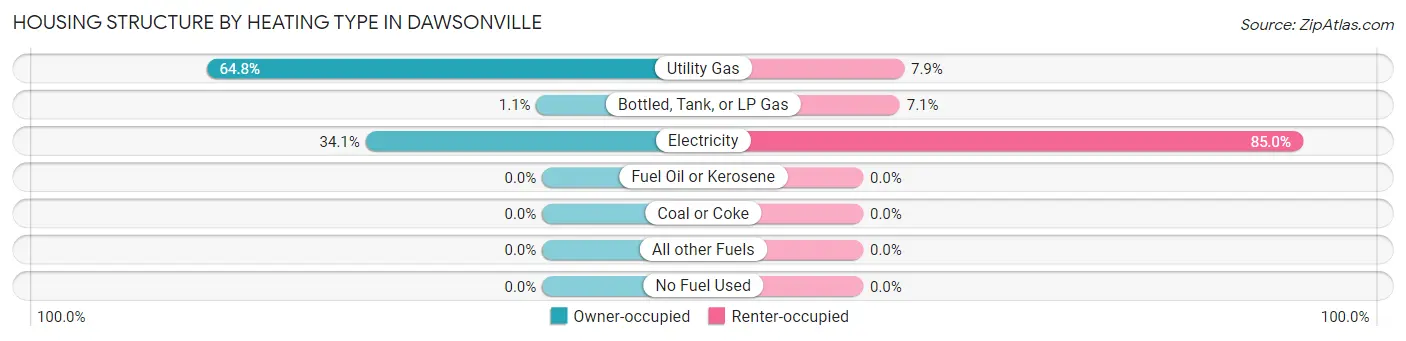
| Heating Type | Owner-occupied | Renter-occupied |
| Utility Gas | 650 (64.8%) | 29 (7.9%) |
| Bottled, Tank, or LP Gas | 11 (1.1%) | 26 (7.1%) |
| Electricity | 342 (34.1%) | 311 (85.0%) |
| Fuel Oil or Kerosene | 0 (0.0%) | 0 (0.0%) |
| Coal or Coke | 0 (0.0%) | 0 (0.0%) |
| All other Fuels | 0 (0.0%) | 0 (0.0%) |
| No Fuel Used | 0 (0.0%) | 0 (0.0%) |
| Total | 1,003 (100.0%) | 366 (100.0%) |
Household Vehicle Usage in Dawsonville
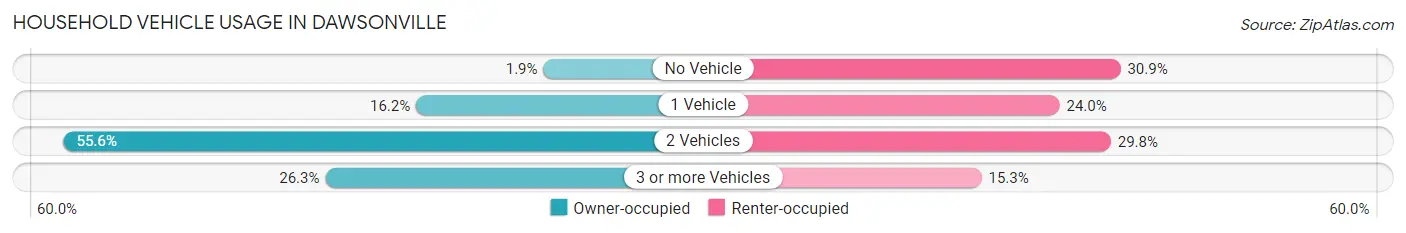
| Vehicles per Household | Owner-occupied | Renter-occupied |
| No Vehicle | 19 (1.9%) | 113 (30.9%) |
| 1 Vehicle | 162 (16.2%) | 88 (24.0%) |
| 2 Vehicles | 558 (55.6%) | 109 (29.8%) |
| 3 or more Vehicles | 264 (26.3%) | 56 (15.3%) |
| Total | 1,003 (100.0%) | 366 (100.0%) |
Real Estate & Mortgages in Dawsonville
Real Estate and Mortgage Overview in Dawsonville
| Characteristic | Without Mortgage | With Mortgage |
| Housing Units | 195 | 808 |
| Median Property Value | $299,500 | $273,000 |
| Median Household Income | $64,464 | $120 |
| Monthly Housing Costs | $466 | $7 |
| Real Estate Taxes | $2,032 | $43 |
Property Value by Mortgage Status in Dawsonville
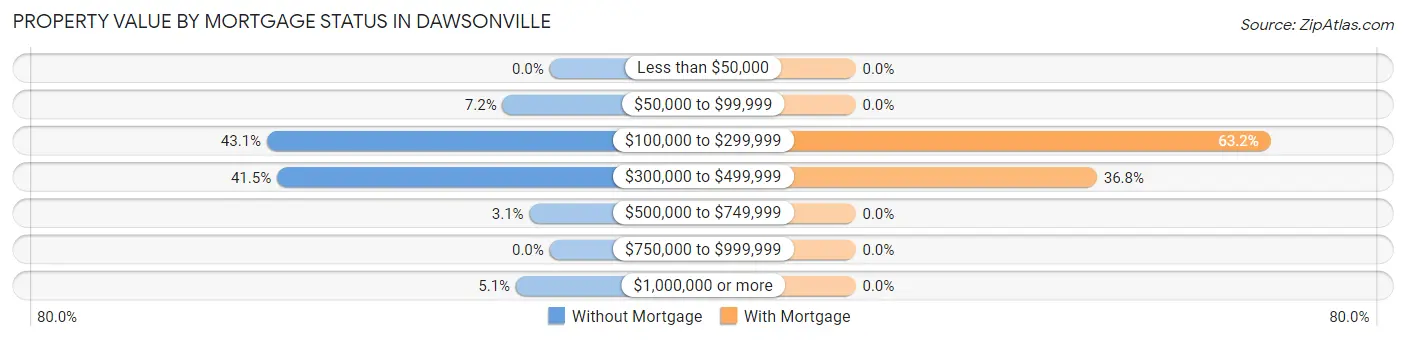
| Property Value | Without Mortgage | With Mortgage |
| Less than $50,000 | 0 (0.0%) | 0 (0.0%) |
| $50,000 to $99,999 | 14 (7.2%) | 0 (0.0%) |
| $100,000 to $299,999 | 84 (43.1%) | 511 (63.2%) |
| $300,000 to $499,999 | 81 (41.5%) | 297 (36.8%) |
| $500,000 to $749,999 | 6 (3.1%) | 0 (0.0%) |
| $750,000 to $999,999 | 0 (0.0%) | 0 (0.0%) |
| $1,000,000 or more | 10 (5.1%) | 0 (0.0%) |
| Total | 195 (100.0%) | 808 (100.0%) |
Household Income by Mortgage Status in Dawsonville
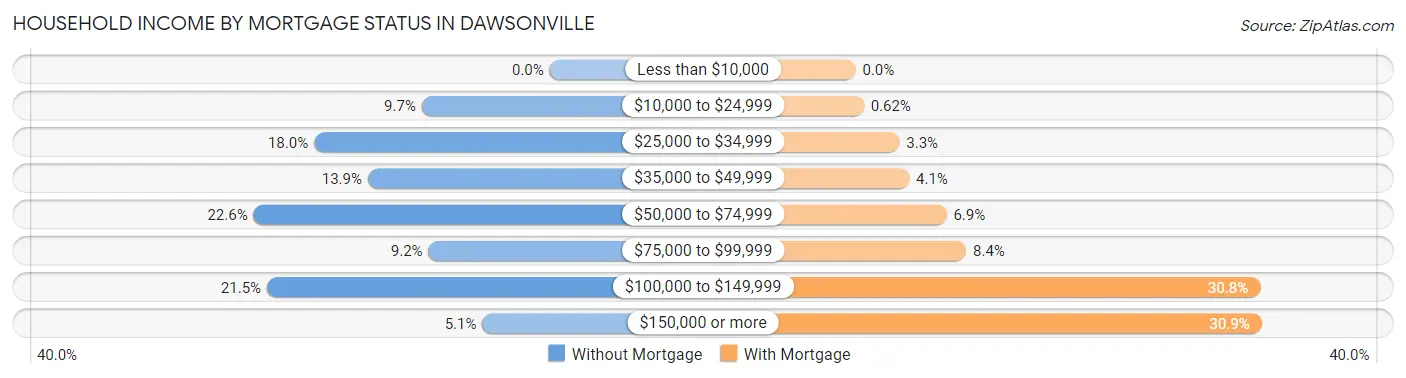
| Household Income | Without Mortgage | With Mortgage |
| Less than $10,000 | 0 (0.0%) | 0 (0.0%) |
| $10,000 to $24,999 | 19 (9.7%) | 5 (0.6%) |
| $25,000 to $34,999 | 35 (17.9%) | 27 (3.3%) |
| $35,000 to $49,999 | 27 (13.9%) | 33 (4.1%) |
| $50,000 to $74,999 | 44 (22.6%) | 56 (6.9%) |
| $75,000 to $99,999 | 18 (9.2%) | 68 (8.4%) |
| $100,000 to $149,999 | 42 (21.5%) | 249 (30.8%) |
| $150,000 or more | 10 (5.1%) | 250 (30.9%) |
| Total | 195 (100.0%) | 808 (100.0%) |
Property Value to Household Income Ratio in Dawsonville
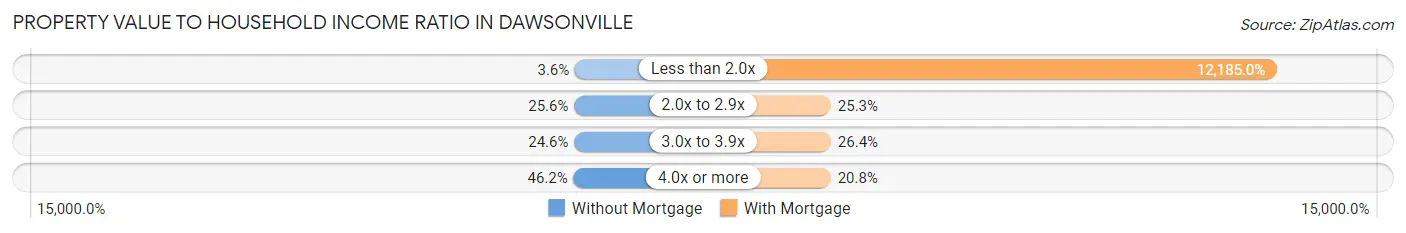
| Value-to-Income Ratio | Without Mortgage | With Mortgage |
| Less than 2.0x | 7 (3.6%) | 98,455 (12,185.0%) |
| 2.0x to 2.9x | 50 (25.6%) | 204 (25.3%) |
| 3.0x to 3.9x | 48 (24.6%) | 213 (26.4%) |
| 4.0x or more | 90 (46.2%) | 168 (20.8%) |
| Total | 195 (100.0%) | 808 (100.0%) |
Real Estate Taxes by Mortgage Status in Dawsonville
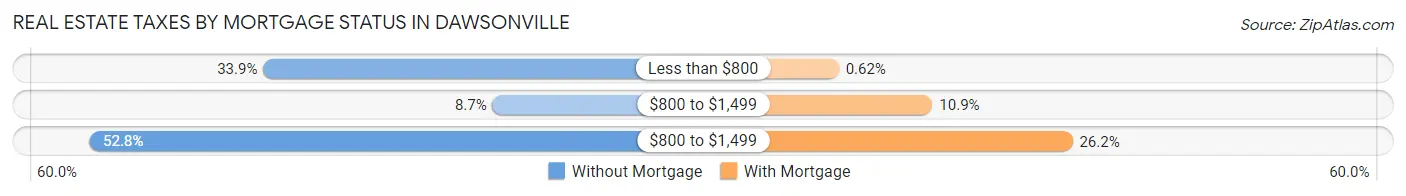
| Property Taxes | Without Mortgage | With Mortgage |
| Less than $800 | 66 (33.9%) | 5 (0.6%) |
| $800 to $1,499 | 17 (8.7%) | 88 (10.9%) |
| $800 to $1,499 | 103 (52.8%) | 212 (26.2%) |
| Total | 195 (100.0%) | 808 (100.0%) |
Health & Disability in Dawsonville
Health Insurance Coverage by Age in Dawsonville
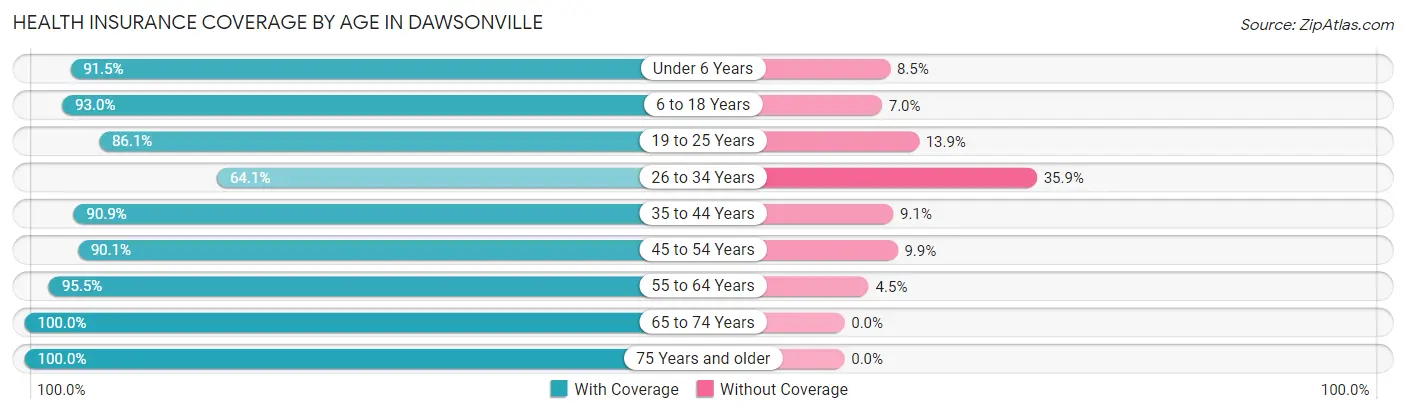
| Age Bracket | With Coverage | Without Coverage |
| Under 6 Years | 355 (91.5%) | 33 (8.5%) |
| 6 to 18 Years | 572 (93.0%) | 43 (7.0%) |
| 19 to 25 Years | 205 (86.1%) | 33 (13.9%) |
| 26 to 34 Years | 377 (64.1%) | 211 (35.9%) |
| 35 to 44 Years | 489 (90.9%) | 49 (9.1%) |
| 45 to 54 Years | 309 (90.1%) | 34 (9.9%) |
| 55 to 64 Years | 442 (95.5%) | 21 (4.5%) |
| 65 to 74 Years | 364 (100.0%) | 0 (0.0%) |
| 75 Years and older | 185 (100.0%) | 0 (0.0%) |
| Total | 3,298 (88.6%) | 424 (11.4%) |
Health Insurance Coverage by Citizenship Status in Dawsonville

| Citizenship Status | With Coverage | Without Coverage |
| Native Born | 355 (91.5%) | 33 (8.5%) |
| Foreign Born, Citizen | 572 (93.0%) | 43 (7.0%) |
| Foreign Born, not a Citizen | 205 (86.1%) | 33 (13.9%) |
Health Insurance Coverage by Household Income in Dawsonville
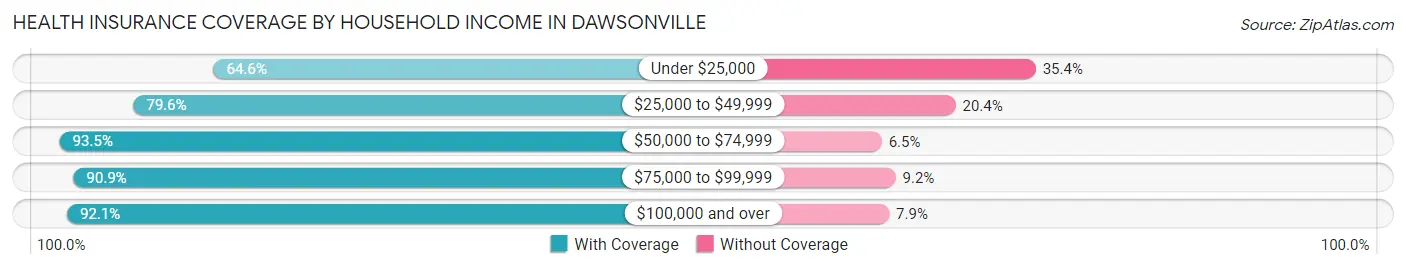
| Household Income | With Coverage | Without Coverage |
| Under $25,000 | 73 (64.6%) | 40 (35.4%) |
| $25,000 to $49,999 | 567 (79.6%) | 145 (20.4%) |
| $50,000 to $74,999 | 429 (93.5%) | 30 (6.5%) |
| $75,000 to $99,999 | 953 (90.8%) | 96 (9.1%) |
| $100,000 and over | 1,276 (92.1%) | 110 (7.9%) |
Public vs Private Health Insurance Coverage by Age in Dawsonville
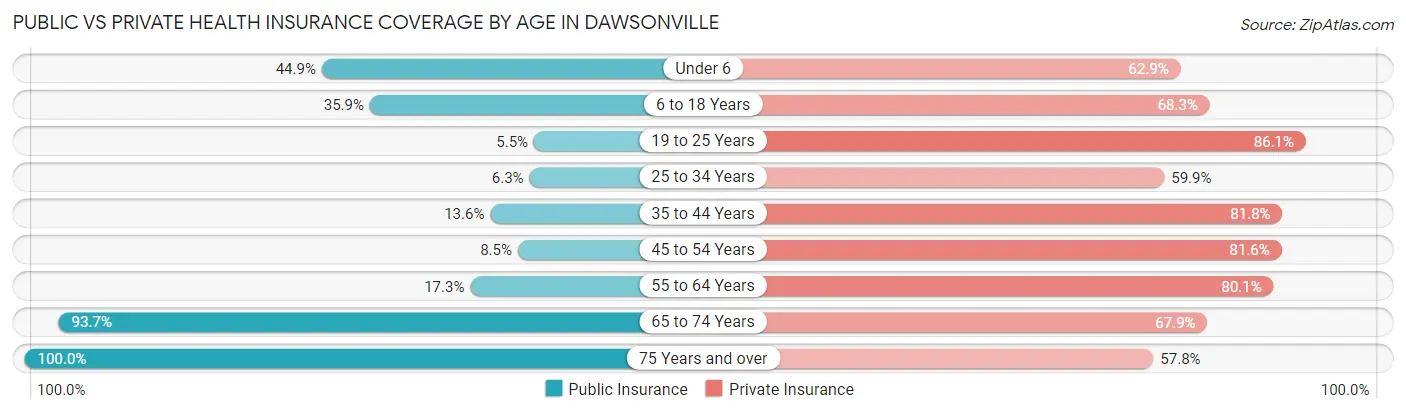
| Age Bracket | Public Insurance | Private Insurance |
| Under 6 | 174 (44.9%) | 244 (62.9%) |
| 6 to 18 Years | 221 (35.9%) | 420 (68.3%) |
| 19 to 25 Years | 13 (5.5%) | 205 (86.1%) |
| 25 to 34 Years | 37 (6.3%) | 352 (59.9%) |
| 35 to 44 Years | 73 (13.6%) | 440 (81.8%) |
| 45 to 54 Years | 29 (8.5%) | 280 (81.6%) |
| 55 to 64 Years | 80 (17.3%) | 371 (80.1%) |
| 65 to 74 Years | 341 (93.7%) | 247 (67.9%) |
| 75 Years and over | 185 (100.0%) | 107 (57.8%) |
| Total | 1,153 (31.0%) | 2,666 (71.6%) |
Disability Status by Sex by Age in Dawsonville
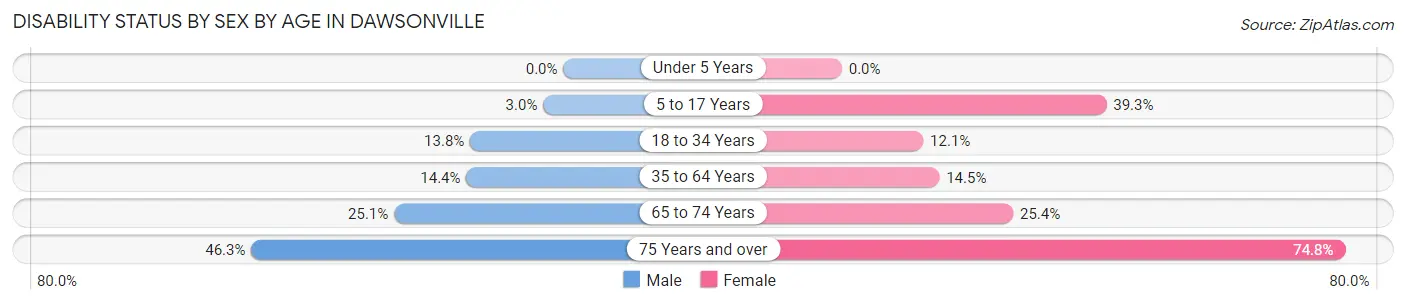
| Age Bracket | Male | Female |
| Under 5 Years | 0 (0.0%) | 0 (0.0%) |
| 5 to 17 Years | 12 (3.0%) | 108 (39.3%) |
| 18 to 34 Years | 71 (13.8%) | 40 (12.1%) |
| 35 to 64 Years | 91 (14.4%) | 103 (14.5%) |
| 65 to 74 Years | 48 (25.1%) | 44 (25.4%) |
| 75 Years and over | 38 (46.3%) | 77 (74.8%) |
Disability Class by Sex by Age in Dawsonville
Disability Class: Hearing Difficulty
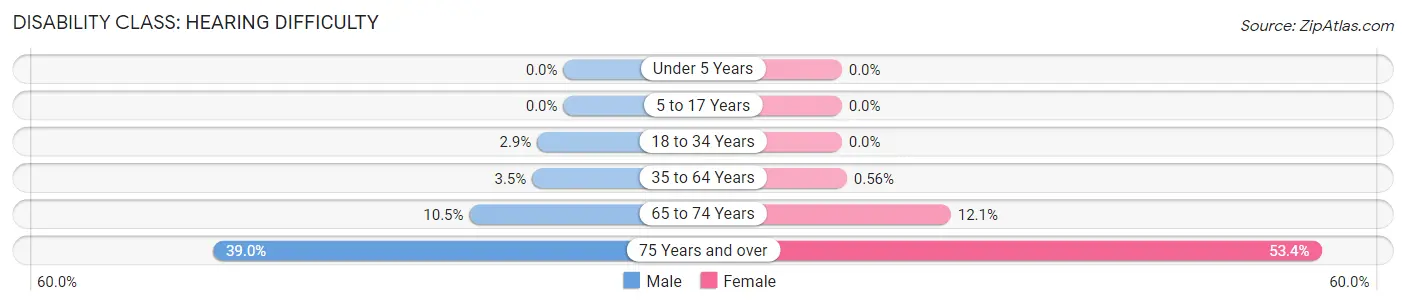
| Age Bracket | Male | Female |
| Under 5 Years | 0 (0.0%) | 0 (0.0%) |
| 5 to 17 Years | 0 (0.0%) | 0 (0.0%) |
| 18 to 34 Years | 15 (2.9%) | 0 (0.0%) |
| 35 to 64 Years | 22 (3.5%) | 4 (0.6%) |
| 65 to 74 Years | 20 (10.5%) | 21 (12.1%) |
| 75 Years and over | 32 (39.0%) | 55 (53.4%) |
Disability Class: Vision Difficulty
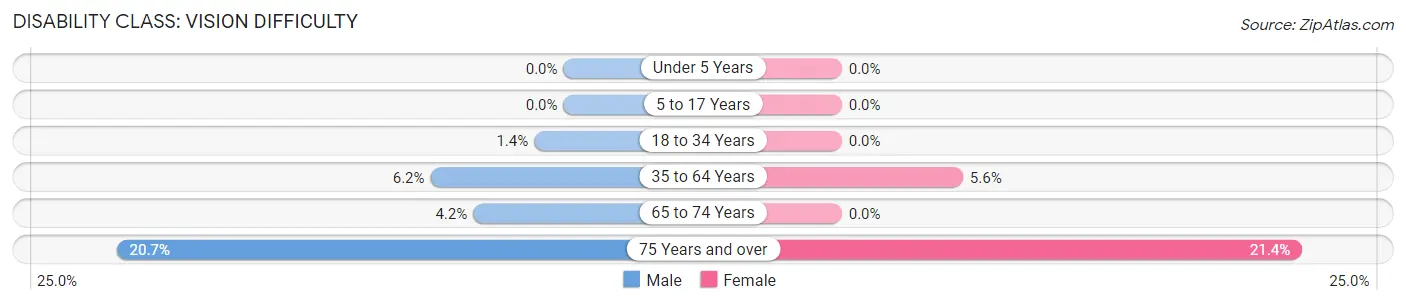
| Age Bracket | Male | Female |
| Under 5 Years | 0 (0.0%) | 0 (0.0%) |
| 5 to 17 Years | 0 (0.0%) | 0 (0.0%) |
| 18 to 34 Years | 7 (1.4%) | 0 (0.0%) |
| 35 to 64 Years | 39 (6.2%) | 40 (5.6%) |
| 65 to 74 Years | 8 (4.2%) | 0 (0.0%) |
| 75 Years and over | 17 (20.7%) | 22 (21.4%) |
Disability Class: Cognitive Difficulty
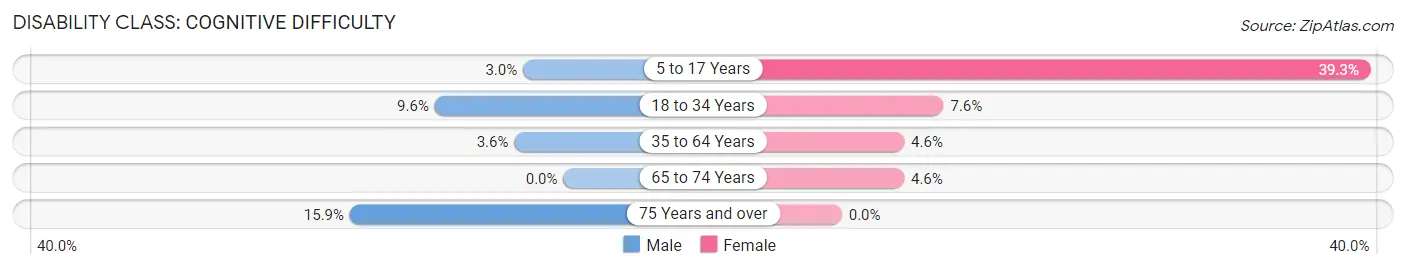
| Age Bracket | Male | Female |
| 5 to 17 Years | 12 (3.0%) | 108 (39.3%) |
| 18 to 34 Years | 49 (9.6%) | 25 (7.5%) |
| 35 to 64 Years | 23 (3.6%) | 33 (4.6%) |
| 65 to 74 Years | 0 (0.0%) | 8 (4.6%) |
| 75 Years and over | 13 (15.9%) | 0 (0.0%) |
Disability Class: Ambulatory Difficulty
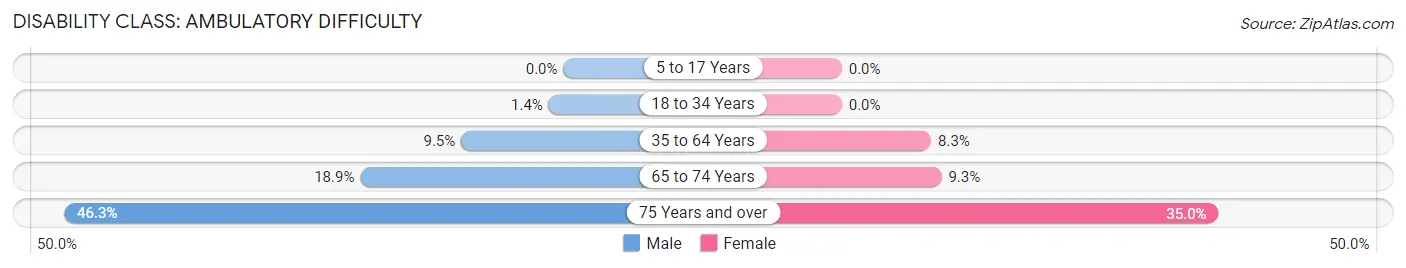
| Age Bracket | Male | Female |
| 5 to 17 Years | 0 (0.0%) | 0 (0.0%) |
| 18 to 34 Years | 7 (1.4%) | 0 (0.0%) |
| 35 to 64 Years | 60 (9.5%) | 59 (8.3%) |
| 65 to 74 Years | 36 (18.9%) | 16 (9.2%) |
| 75 Years and over | 38 (46.3%) | 36 (34.9%) |
Disability Class: Self-Care Difficulty
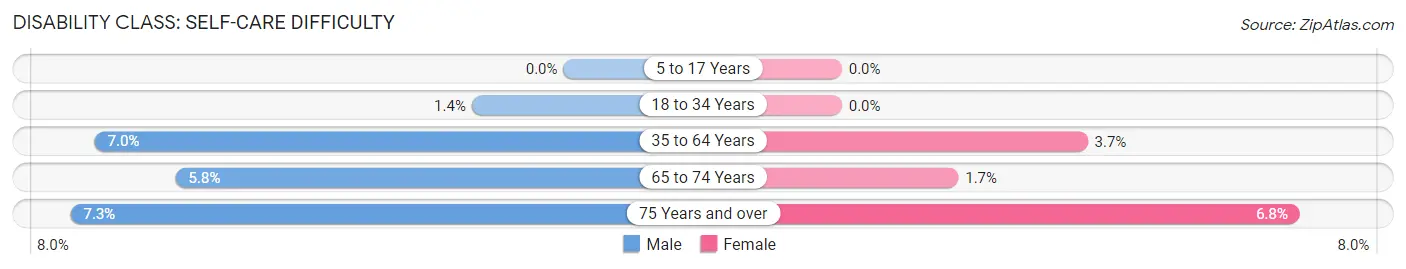
| Age Bracket | Male | Female |
| 5 to 17 Years | 0 (0.0%) | 0 (0.0%) |
| 18 to 34 Years | 7 (1.4%) | 0 (0.0%) |
| 35 to 64 Years | 44 (7.0%) | 26 (3.6%) |
| 65 to 74 Years | 11 (5.8%) | 3 (1.7%) |
| 75 Years and over | 6 (7.3%) | 7 (6.8%) |
Technology Access in Dawsonville
Computing Device Access in Dawsonville
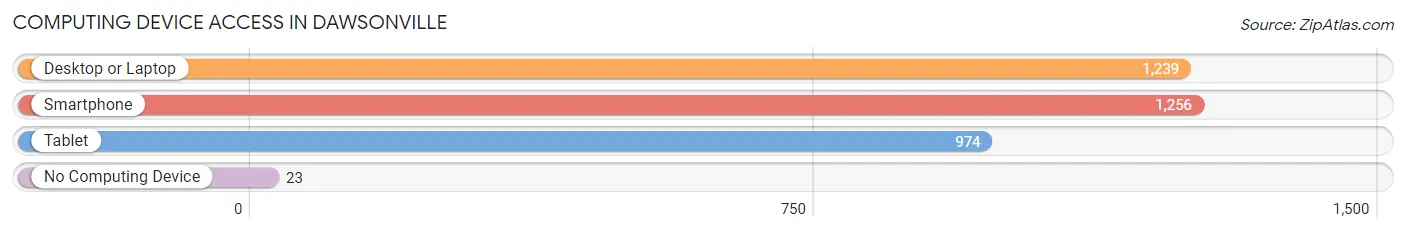
| Device Type | # Households | % Households |
| Desktop or Laptop | 1,239 | 90.5% |
| Smartphone | 1,256 | 91.7% |
| Tablet | 974 | 71.2% |
| No Computing Device | 23 | 1.7% |
| Total | 1,369 | 100.0% |
Internet Access in Dawsonville
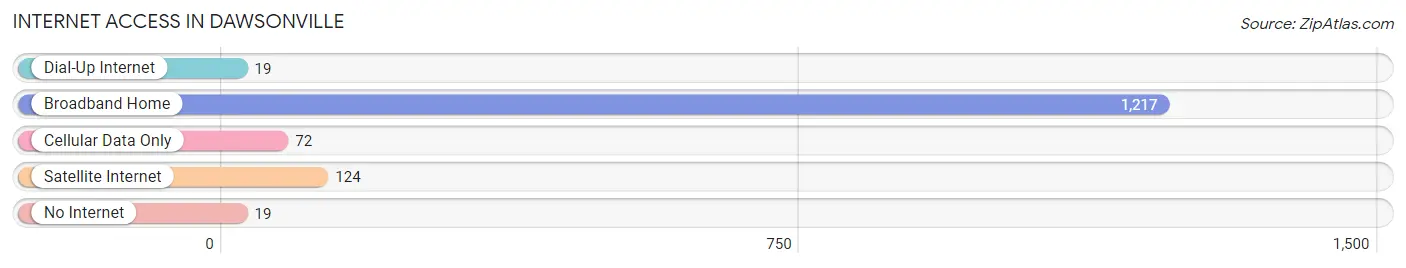
| Internet Type | # Households | % Households |
| Dial-Up Internet | 19 | 1.4% |
| Broadband Home | 1,217 | 88.9% |
| Cellular Data Only | 72 | 5.3% |
| Satellite Internet | 124 | 9.1% |
| No Internet | 19 | 1.4% |
| Total | 1,369 | 100.0% |
Dawsonville Summary
Dawsonville, Georgia is a small city located in Dawson County, Georgia, United States. It is the county seat of Dawson County and is part of the Atlanta metropolitan area. The population of Dawsonville was 2,536 at the 2010 census, up from 1,988 at the 2000 census.
History
Dawsonville was founded in 1857 by William C. Dawson, a former state senator and a veteran of the War of 1812. The city was named after him and was incorporated in 1859. The city was originally a farming community, but it soon became a center for gold mining. The city was also home to a number of moonshine stills during the Prohibition era.
Geography
Dawsonville is located in the foothills of the Blue Ridge Mountains in northern Georgia. It is situated at the intersection of Georgia State Route 9 and Georgia State Route 53. The city is located about 45 miles north of Atlanta and about 25 miles south of the North Carolina border.
The city has a total area of 4.2 square miles, all of which is land. The city is located in the Etowah River watershed.
Economy
Dawsonville's economy is largely based on tourism. The city is home to the Georgia Racing Hall of Fame, which celebrates the history of auto racing in the state. The city is also home to the Dawsonville Moonshine Distillery, which produces a variety of moonshine products.
The city is also home to a number of retail stores, restaurants, and other businesses. The city is also home to a number of manufacturing companies, including a carpet mill and a furniture factory.
Demographics
As of the 2010 census, there were 2,536 people, 1,039 households, and 690 families residing in the city. The population density was 605.3 people per square mile. The racial makeup of the city was 87.2% White, 8.2% African American, 0.4% Native American, 0.7% Asian, 0.1% Pacific Islander, 1.3% from other races, and 2.1% from two or more races. Hispanic or Latino of any race were 3.3% of the population.
The median income for a household in the city was $37,917, and the median income for a family was $45,000. The per capita income for the city was $20,845. About 11.2% of families and 14.2% of the population were below the poverty line, including 19.2% of those under age 18 and 8.2% of those age 65 or over.
Conclusion
Dawsonville, Georgia is a small city located in Dawson County, Georgia, United States. It is the county seat of Dawson County and is part of the Atlanta metropolitan area. The city has a long history, dating back to its founding in 1857. The city is located in the foothills of the Blue Ridge Mountains and is home to a number of tourist attractions, including the Georgia Racing Hall of Fame and the Dawsonville Moonshine Distillery. The city's economy is largely based on tourism, but it is also home to a number of retail stores, restaurants, and manufacturing companies. The population of Dawsonville was 2,536 at the 2010 census, up from 1,988 at the 2000 census.
Common Questions
What is Per Capita Income in Dawsonville?
Per Capita income in Dawsonville is $31,568.
What is the Median Family Income in Dawsonville?
Median Family Income in Dawsonville is $94,542.
What is the Median Household income in Dawsonville?
Median Household Income in Dawsonville is $79,479.
What is Income or Wage Gap in Dawsonville?
Income or Wage Gap in Dawsonville is 16.8%.
Women in Dawsonville earn 83.2 cents for every dollar earned by a man.
What is Inequality or Gini Index in Dawsonville?
Inequality or Gini Index in Dawsonville is 0.36.
What is the Total Population of Dawsonville?
Total Population of Dawsonville is 3,871.
What is the Total Male Population of Dawsonville?
Total Male Population of Dawsonville is 2,109.
What is the Total Female Population of Dawsonville?
Total Female Population of Dawsonville is 1,762.
What is the Ratio of Males per 100 Females in Dawsonville?
There are 119.69 Males per 100 Females in Dawsonville.
What is the Ratio of Females per 100 Males in Dawsonville?
There are 83.55 Females per 100 Males in Dawsonville.
What is the Median Population Age in Dawsonville?
Median Population Age in Dawsonville is 35.5 Years.
What is the Average Family Size in Dawsonville
Average Family Size in Dawsonville is 3.4 People.
What is the Average Household Size in Dawsonville
Average Household Size in Dawsonville is 2.7 People.
How Large is the Labor Force in Dawsonville?
There are 1,946 People in the Labor Forcein in Dawsonville.
What is the Percentage of People in the Labor Force in Dawsonville?
64.4% of People are in the Labor Force in Dawsonville.
What is the Unemployment Rate in Dawsonville?
Unemployment Rate in Dawsonville is 4.4%.