Freeland, WA Map & Demographics
Freeland Map
Freeland Overview
$50,773
PER CAPITA INCOME
$119,833
AVG FAMILY INCOME
$89,868
AVG HOUSEHOLD INCOME
60.9%
WAGE / INCOME GAP [ % ]
39.1¢/ $1
WAGE / INCOME GAP [ $ ]
0.38
INEQUALITY / GINI INDEX
1,894
TOTAL POPULATION
962
MALE POPULATION
932
FEMALE POPULATION
103.22
MALES / 100 FEMALES
96.88
FEMALES / 100 MALES
51.2
MEDIAN AGE
3.2
AVG FAMILY SIZE
2.2
AVG HOUSEHOLD SIZE
798
LABOR FORCE [ PEOPLE ]
50.0%
PERCENT IN LABOR FORCE
9.8%
UNEMPLOYMENT RATE
Freeland Zip Codes
Freeland Area Codes
Income in Freeland
Income Overview in Freeland
Per Capita Income in Freeland is $50,773, while median incomes of families and households are $119,833 and $89,868 respectively.
| Characteristic | Number | Measure |
| Per Capita Income | 1,894 | $50,773 |
| Median Family Income | 434 | $119,833 |
| Mean Family Income | 434 | $151,375 |
| Median Household Income | 844 | $89,868 |
| Mean Household Income | 844 | $112,713 |
| Income Deficit | 434 | $0 |
| Wage / Income Gap (%) | 1,894 | 60.94% |
| Wage / Income Gap ($) | 1,894 | 39.06¢ per $1 |
| Gini / Inequality Index | 1,894 | 0.38 |
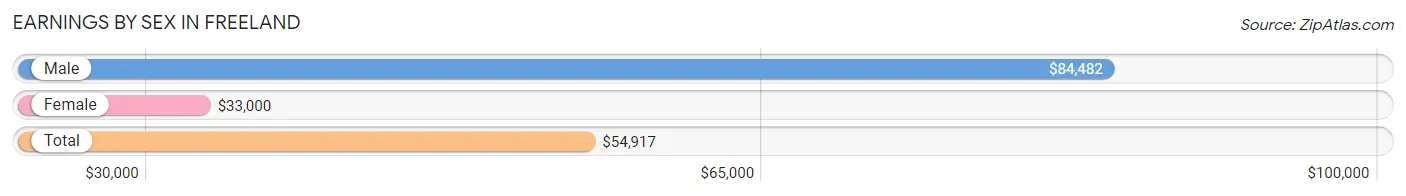
Earnings by Sex in Freeland
Average Earnings in Freeland are $54,917, $84,482 for men and $33,000 for women, a difference of 60.9%.
| Sex | Number | Average Earnings |
| Male | 483 (59.0%) | $84,482 |
| Female | 336 (41.0%) | $33,000 |
| Total | 819 (100.0%) | $54,917 |
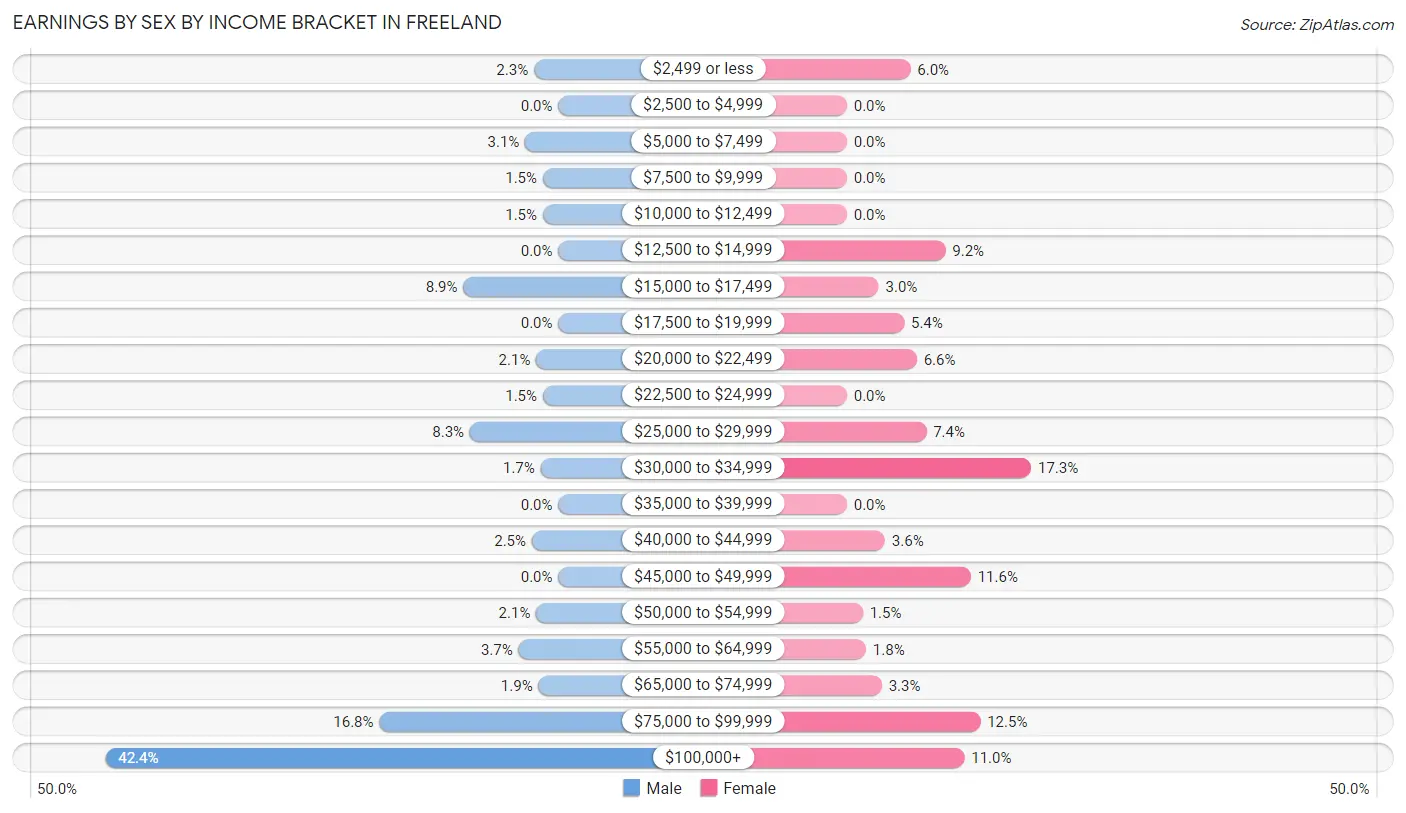
Earnings by Sex by Income Bracket in Freeland
The most common earnings brackets in Freeland are $100,000+ for men (205 | 42.4%) and $30,000 to $34,999 for women (58 | 17.3%).
| Income | Male | Female |
| $2,499 or less | 11 (2.3%) | 20 (5.9%) |
| $2,500 to $4,999 | 0 (0.0%) | 0 (0.0%) |
| $5,000 to $7,499 | 15 (3.1%) | 0 (0.0%) |
| $7,500 to $9,999 | 7 (1.5%) | 0 (0.0%) |
| $10,000 to $12,499 | 7 (1.5%) | 0 (0.0%) |
| $12,500 to $14,999 | 0 (0.0%) | 31 (9.2%) |
| $15,000 to $17,499 | 43 (8.9%) | 10 (3.0%) |
| $17,500 to $19,999 | 0 (0.0%) | 18 (5.4%) |
| $20,000 to $22,499 | 10 (2.1%) | 22 (6.6%) |
| $22,500 to $24,999 | 7 (1.5%) | 0 (0.0%) |
| $25,000 to $29,999 | 40 (8.3%) | 25 (7.4%) |
| $30,000 to $34,999 | 8 (1.7%) | 58 (17.3%) |
| $35,000 to $39,999 | 0 (0.0%) | 0 (0.0%) |
| $40,000 to $44,999 | 12 (2.5%) | 12 (3.6%) |
| $45,000 to $49,999 | 0 (0.0%) | 39 (11.6%) |
| $50,000 to $54,999 | 10 (2.1%) | 5 (1.5%) |
| $55,000 to $64,999 | 18 (3.7%) | 6 (1.8%) |
| $65,000 to $74,999 | 9 (1.9%) | 11 (3.3%) |
| $75,000 to $99,999 | 81 (16.8%) | 42 (12.5%) |
| $100,000+ | 205 (42.4%) | 37 (11.0%) |
| Total | 483 (100.0%) | 336 (100.0%) |
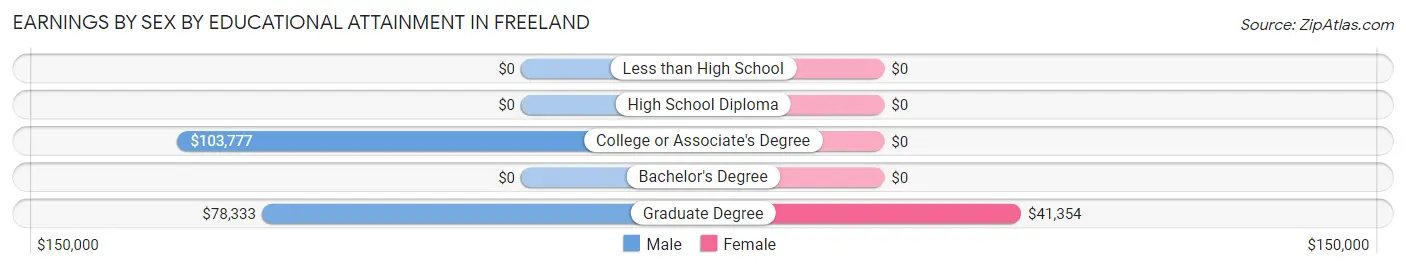
Earnings by Sex by Educational Attainment in Freeland
Average earnings in Freeland are $91,932 for men and $34,250 for women, a difference of 62.7%. Men with an educational attainment of college or associate's degree enjoy the highest average annual earnings of $103,777, while those with graduate degree education earn the least with $78,333. Women with an educational attainment of graduate degree earn the most with the average annual earnings of $41,354, while those with graduate degree education have the smallest earnings of $41,354.
| Educational Attainment | Male Income | Female Income |
| Less than High School | - | - |
| High School Diploma | - | - |
| College or Associate's Degree | $103,777 | $0 |
| Bachelor's Degree | - | - |
| Graduate Degree | $78,333 | $41,354 |
| Total | $91,932 | $34,250 |
Family Income in Freeland
Family Income Brackets in Freeland
According to the Freeland family income data, there are 110 families falling into the $100,000 to $149,999 income range, which is the most common income bracket and makes up 25.4% of all families.
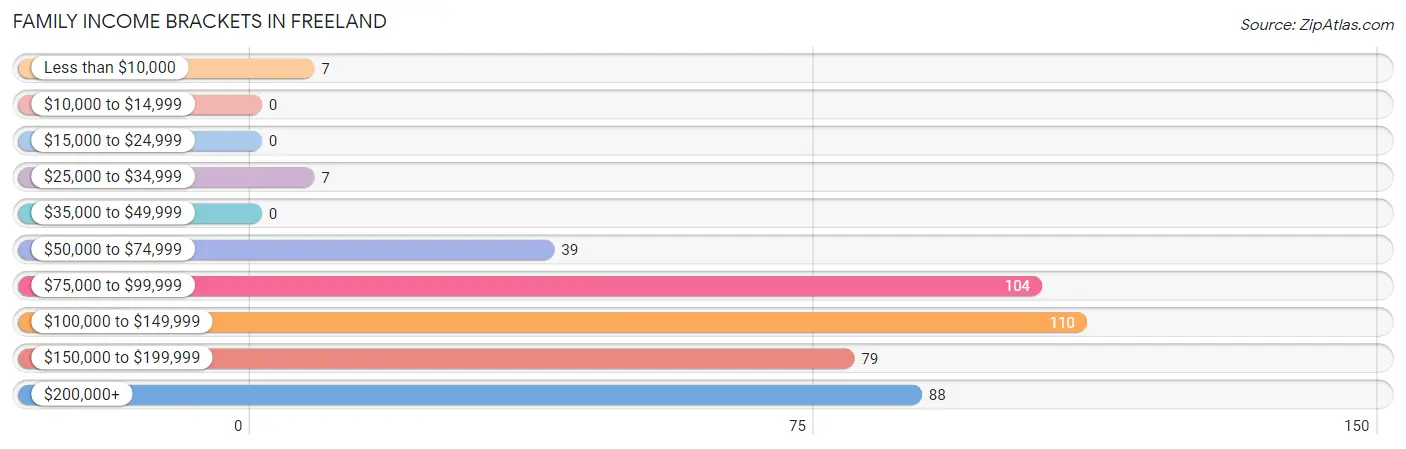
| Income Bracket | # Families | % Families |
| Less than $10,000 | 7 | 1.6% |
| $10,000 to $14,999 | 0 | 0.0% |
| $15,000 to $24,999 | 0 | 0.0% |
| $25,000 to $34,999 | 7 | 1.6% |
| $35,000 to $49,999 | 0 | 0.0% |
| $50,000 to $74,999 | 39 | 9.0% |
| $75,000 to $99,999 | 104 | 24.0% |
| $100,000 to $149,999 | 110 | 25.3% |
| $150,000 to $199,999 | 79 | 18.2% |
| $200,000+ | 88 | 20.3% |
Family Income by Famaliy Size in Freeland
3-person families (95 | 21.9%) account for the highest median family income in Freeland with $152,604 per family, while 2-person families (241 | 55.5%) have the highest median income of $56,719 per family member.
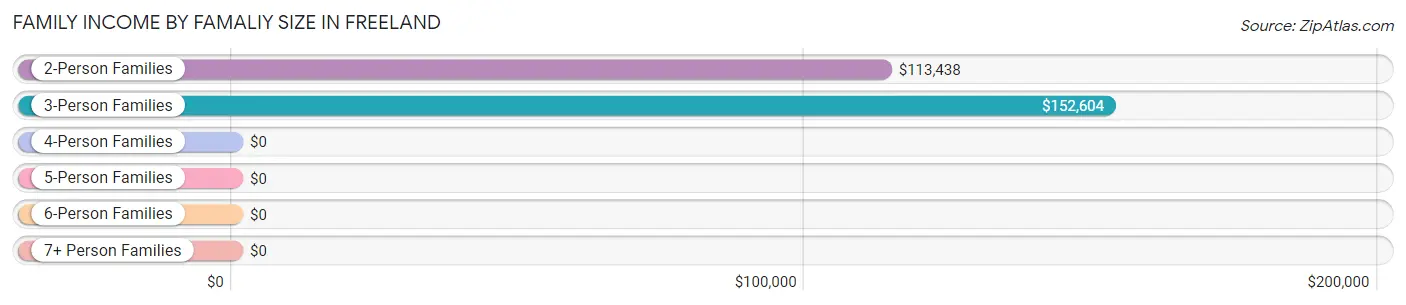
| Income Bracket | # Families | Median Income |
| 2-Person Families | 241 (55.5%) | $113,438 |
| 3-Person Families | 95 (21.9%) | $152,604 |
| 4-Person Families | 64 (14.7%) | $0 |
| 5-Person Families | 9 (2.1%) | $0 |
| 6-Person Families | 0 (0.0%) | $0 |
| 7+ Person Families | 25 (5.8%) | $0 |
| Total | 434 (100.0%) | $119,833 |
Family Income by Number of Earners in Freeland
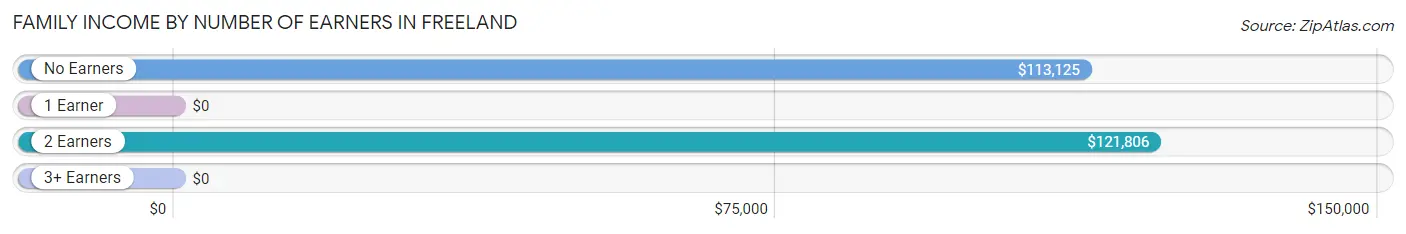
| Number of Earners | # Families | Median Income |
| No Earners | 110 (25.4%) | $113,125 |
| 1 Earner | 103 (23.7%) | $0 |
| 2 Earners | 182 (41.9%) | $121,806 |
| 3+ Earners | 39 (9.0%) | $0 |
| Total | 434 (100.0%) | $119,833 |
Household Income in Freeland
Household Income Brackets in Freeland
With 200 households falling in the category, the $100,000 to $149,999 income range is the most frequent in Freeland, accounting for 23.7% of all households. In contrast, only 18 households (2.1%) fall into the $10,000 to $14,999 income bracket, making it the least populous group.
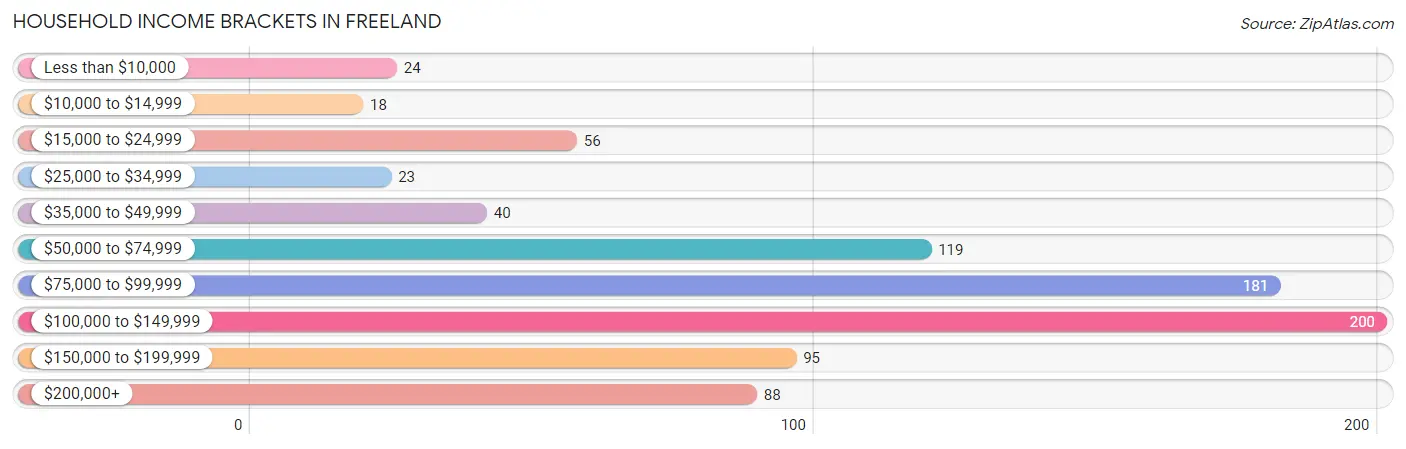
| Income Bracket | # Households | % Households |
| Less than $10,000 | 24 | 2.8% |
| $10,000 to $14,999 | 18 | 2.1% |
| $15,000 to $24,999 | 56 | 6.6% |
| $25,000 to $34,999 | 23 | 2.7% |
| $35,000 to $49,999 | 40 | 4.7% |
| $50,000 to $74,999 | 119 | 14.1% |
| $75,000 to $99,999 | 181 | 21.4% |
| $100,000 to $149,999 | 200 | 23.7% |
| $150,000 to $199,999 | 95 | 11.3% |
| $200,000+ | 88 | 10.4% |
Household Income by Householder Age in Freeland
The median household income in Freeland is $89,868, with the highest median household income of $120,903 found in the 45 to 64 years age bracket for the primary householder. A total of 319 households (37.8%) fall into this category.
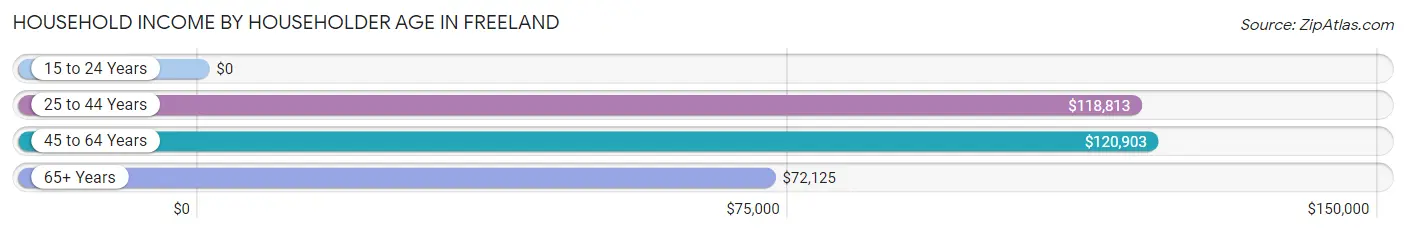
| Income Bracket | # Households | Median Income |
| 15 to 24 Years | 0 (0.0%) | $0 |
| 25 to 44 Years | 148 (17.5%) | $118,813 |
| 45 to 64 Years | 319 (37.8%) | $120,903 |
| 65+ Years | 377 (44.7%) | $72,125 |
| Total | 844 (100.0%) | $89,868 |
Poverty in Freeland
Income Below Poverty by Sex and Age in Freeland
With 1.7% poverty level for males and 9.3% for females among the residents of Freeland, 65 to 74 year old males and 35 to 44 year old females are the most vulnerable to poverty, with 9 males (5.2%) and 31 females (29.5%) in their respective age groups living below the poverty level.
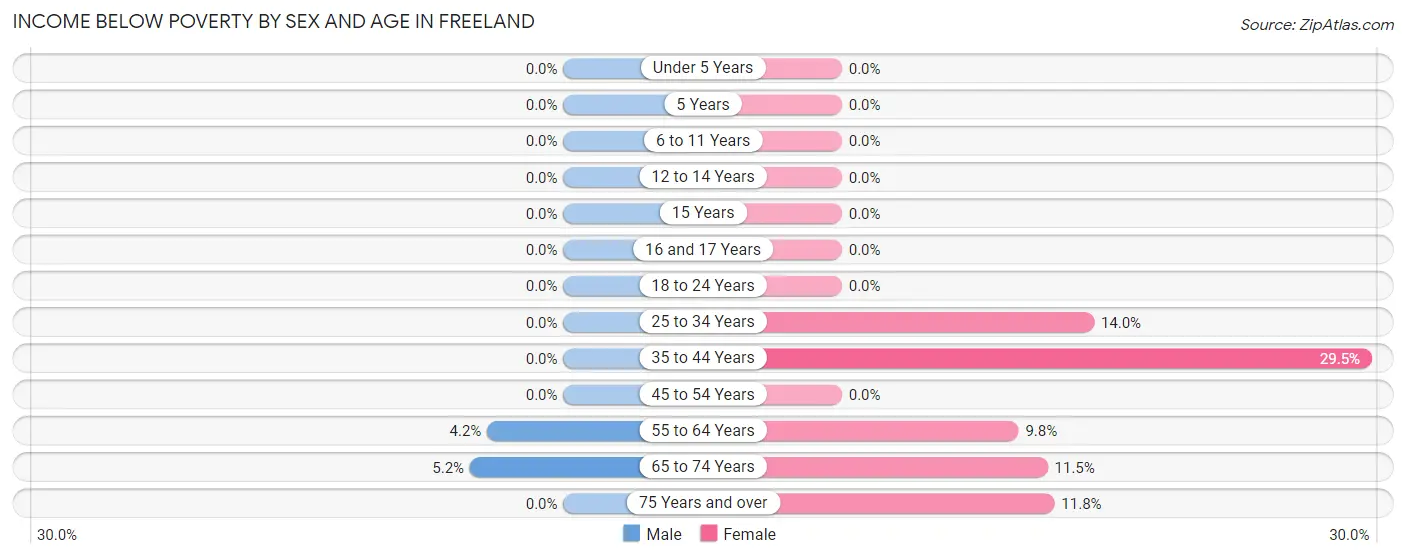
| Age Bracket | Male | Female |
| Under 5 Years | 0 (0.0%) | 0 (0.0%) |
| 5 Years | 0 (0.0%) | 0 (0.0%) |
| 6 to 11 Years | 0 (0.0%) | 0 (0.0%) |
| 12 to 14 Years | 0 (0.0%) | 0 (0.0%) |
| 15 Years | 0 (0.0%) | 0 (0.0%) |
| 16 and 17 Years | 0 (0.0%) | 0 (0.0%) |
| 18 to 24 Years | 0 (0.0%) | 0 (0.0%) |
| 25 to 34 Years | 0 (0.0%) | 8 (14.0%) |
| 35 to 44 Years | 0 (0.0%) | 31 (29.5%) |
| 45 to 54 Years | 0 (0.0%) | 0 (0.0%) |
| 55 to 64 Years | 7 (4.2%) | 12 (9.8%) |
| 65 to 74 Years | 9 (5.2%) | 18 (11.5%) |
| 75 Years and over | 0 (0.0%) | 18 (11.8%) |
| Total | 16 (1.7%) | 87 (9.3%) |
Income Above Poverty by Sex and Age in Freeland
According to the poverty statistics in Freeland, males aged under 5 years and females aged 6 to 11 years are the age groups that are most secure financially, with 100.0% of males and 100.0% of females in these age groups living above the poverty line.
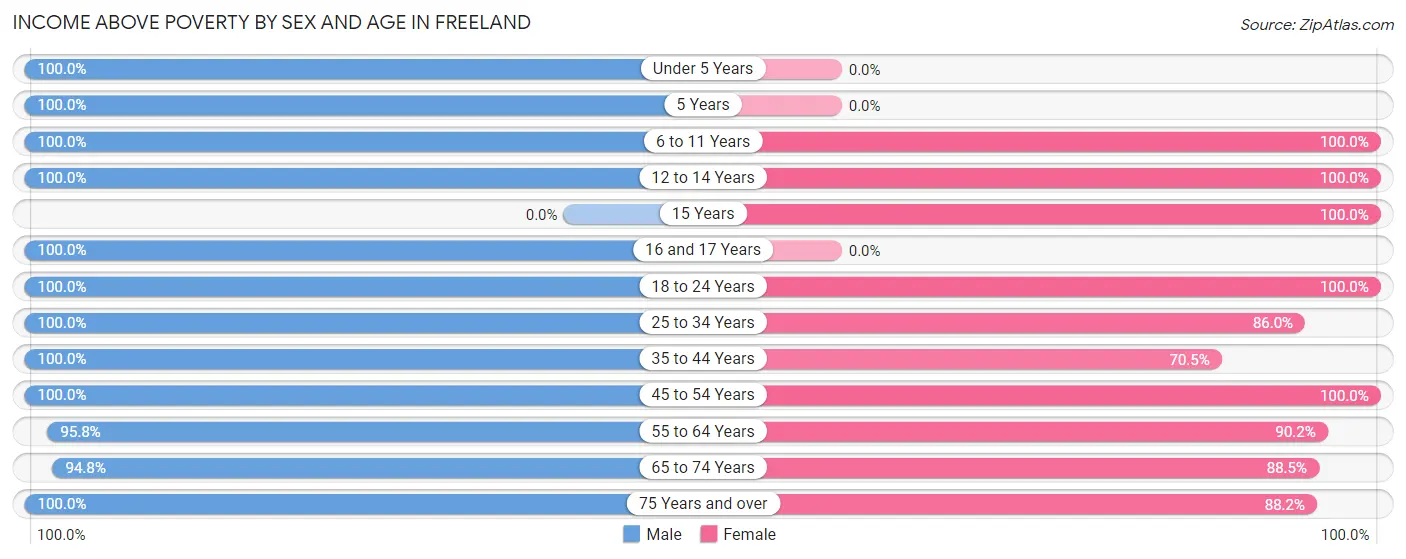
| Age Bracket | Male | Female |
| Under 5 Years | 49 (100.0%) | 0 (0.0%) |
| 5 Years | 12 (100.0%) | 0 (0.0%) |
| 6 to 11 Years | 37 (100.0%) | 93 (100.0%) |
| 12 to 14 Years | 40 (100.0%) | 31 (100.0%) |
| 15 Years | 0 (0.0%) | 37 (100.0%) |
| 16 and 17 Years | 52 (100.0%) | 0 (0.0%) |
| 18 to 24 Years | 104 (100.0%) | 20 (100.0%) |
| 25 to 34 Years | 46 (100.0%) | 49 (86.0%) |
| 35 to 44 Years | 149 (100.0%) | 74 (70.5%) |
| 45 to 54 Years | 69 (100.0%) | 158 (100.0%) |
| 55 to 64 Years | 158 (95.8%) | 110 (90.2%) |
| 65 to 74 Years | 164 (94.8%) | 139 (88.5%) |
| 75 Years and over | 66 (100.0%) | 134 (88.2%) |
| Total | 946 (98.3%) | 845 (90.7%) |
Income Below Poverty Among Married-Couple Families in Freeland
The poverty statistics for married-couple families in Freeland show that 1.8% or 7 of the total 387 families live below the poverty line. Families with no children have the highest poverty rate of 2.9%, comprising of 7 families. On the other hand, families with 1 or 2 children have the lowest poverty rate of 0.0%, which includes 0 families.
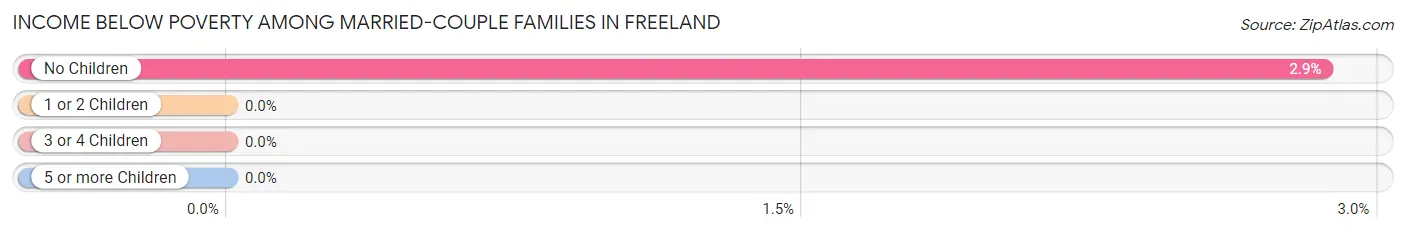
| Children | Above Poverty | Below Poverty |
| No Children | 238 (97.1%) | 7 (2.9%) |
| 1 or 2 Children | 108 (100.0%) | 0 (0.0%) |
| 3 or 4 Children | 9 (100.0%) | 0 (0.0%) |
| 5 or more Children | 25 (100.0%) | 0 (0.0%) |
| Total | 380 (98.2%) | 7 (1.8%) |
Income Below Poverty Among Single-Parent Households in Freeland
| Children | Single Father | Single Mother |
| No Children | 0 (0.0%) | 0 (0.0%) |
| 1 or 2 Children | 0 (0.0%) | 0 (0.0%) |
| 3 or 4 Children | 0 (0.0%) | 0 (0.0%) |
| 5 or more Children | 0 (0.0%) | 0 (0.0%) |
| Total | 0 (0.0%) | 0 (0.0%) |
Income Below Poverty Among Married-Couple vs Single-Parent Households in Freeland
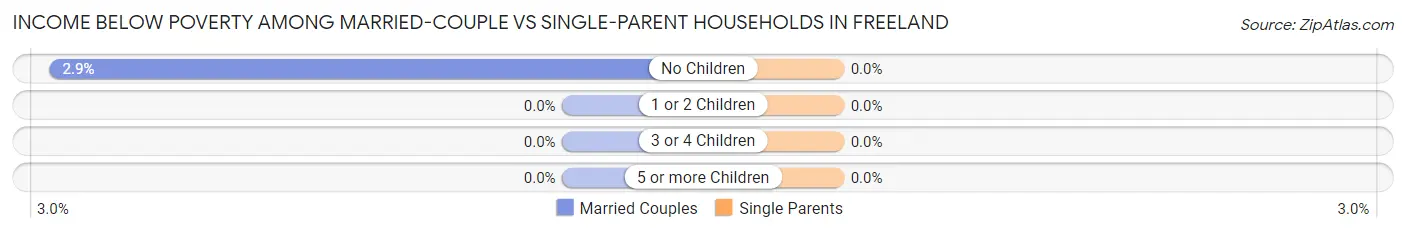
| Children | Married-Couple Families | Single-Parent Households |
| No Children | 7 (2.9%) | 0 (0.0%) |
| 1 or 2 Children | 0 (0.0%) | 0 (0.0%) |
| 3 or 4 Children | 0 (0.0%) | 0 (0.0%) |
| 5 or more Children | 0 (0.0%) | 0 (0.0%) |
| Total | 7 (1.8%) | 0 (0.0%) |
Race in Freeland
The most populous races in Freeland are White / Caucasian (1,671 | 88.2%), Two or more Races (120 | 6.3%), and Hispanic or Latino (56 | 3.0%).
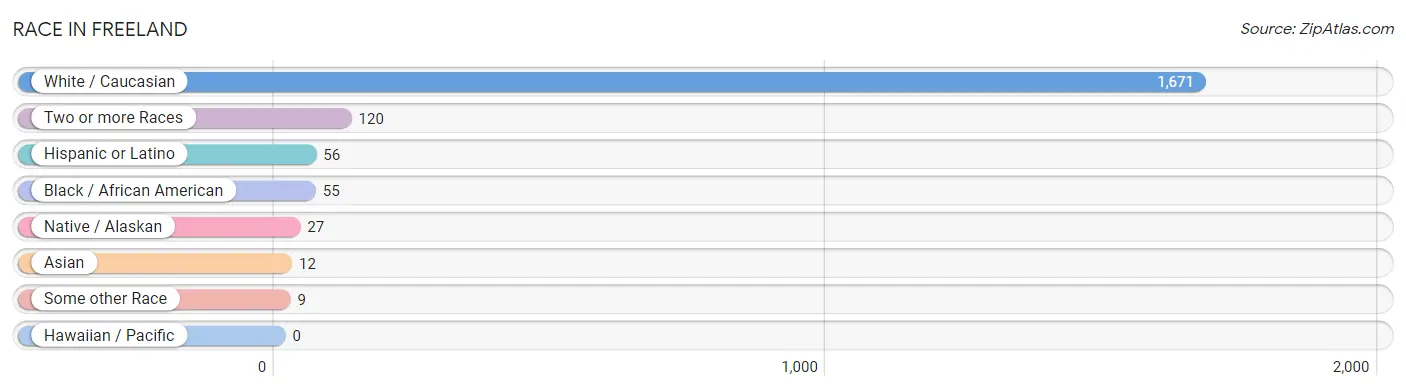
| Race | # Population | % Population |
| Asian | 12 | 0.6% |
| Black / African American | 55 | 2.9% |
| Hawaiian / Pacific | 0 | 0.0% |
| Hispanic or Latino | 56 | 3.0% |
| Native / Alaskan | 27 | 1.4% |
| White / Caucasian | 1,671 | 88.2% |
| Two or more Races | 120 | 6.3% |
| Some other Race | 9 | 0.5% |
| Total | 1,894 | 100.0% |
Ancestry in Freeland
The most populous ancestries reported in Freeland are German (408 | 21.5%), Irish (296 | 15.6%), English (272 | 14.4%), Swedish (94 | 5.0%), and Scottish (84 | 4.4%), together accounting for 60.9% of all Freeland residents.
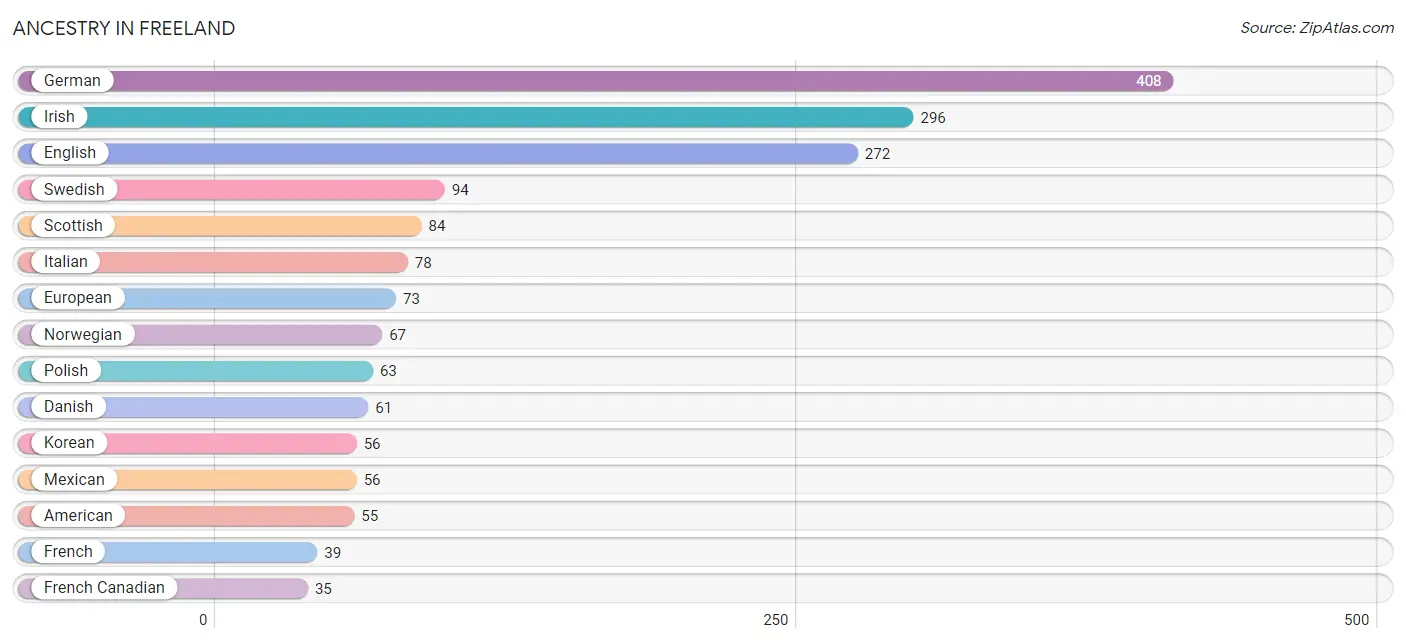
| Ancestry | # Population | % Population |
| American | 55 | 2.9% |
| Bhutanese | 30 | 1.6% |
| British | 27 | 1.4% |
| Burmese | 7 | 0.4% |
| Danish | 61 | 3.2% |
| Dutch | 28 | 1.5% |
| English | 272 | 14.4% |
| European | 73 | 3.8% |
| Finnish | 18 | 0.9% |
| French | 39 | 2.1% |
| French Canadian | 35 | 1.8% |
| German | 408 | 21.5% |
| Greek | 9 | 0.5% |
| Irish | 296 | 15.6% |
| Italian | 78 | 4.1% |
| Korean | 56 | 3.0% |
| Mexican | 56 | 3.0% |
| Northern European | 11 | 0.6% |
| Norwegian | 67 | 3.5% |
| Pennsylvania German | 8 | 0.4% |
| Polish | 63 | 3.3% |
| Portuguese | 13 | 0.7% |
| Puget Sound Salish | 27 | 1.4% |
| Scandinavian | 8 | 0.4% |
| Scotch-Irish | 25 | 1.3% |
| Scottish | 84 | 4.4% |
| Swedish | 94 | 5.0% |
| Ukrainian | 9 | 0.5% |
| Welsh | 4 | 0.2% | View All 29 Rows |
Immigrants in Freeland
The most numerous immigrant groups reported in Freeland came from Oceania (46 | 2.4%), Asia (39 | 2.1%), Iraq (27 | 1.4%), Western Asia (27 | 1.4%), and Europe (21 | 1.1%), together accounting for 8.5% of all Freeland residents.
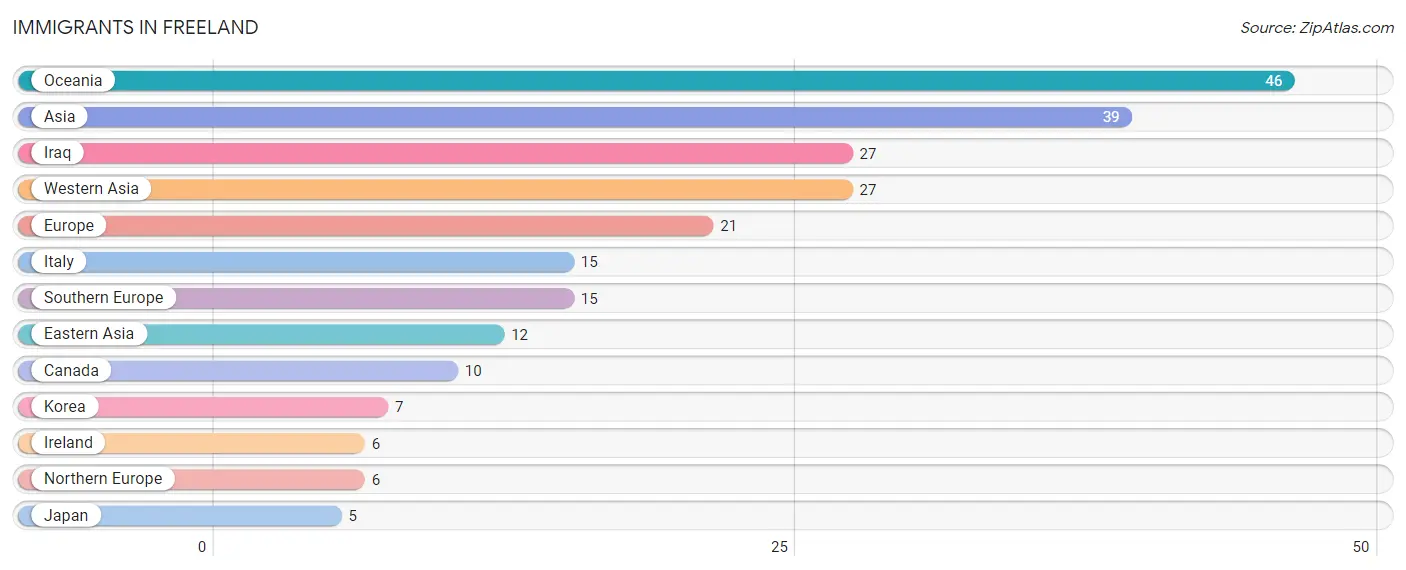
| Immigration Origin | # Population | % Population |
| Asia | 39 | 2.1% |
| Canada | 10 | 0.5% |
| Eastern Asia | 12 | 0.6% |
| Europe | 21 | 1.1% |
| Iraq | 27 | 1.4% |
| Ireland | 6 | 0.3% |
| Italy | 15 | 0.8% |
| Japan | 5 | 0.3% |
| Korea | 7 | 0.4% |
| Northern Europe | 6 | 0.3% |
| Oceania | 46 | 2.4% |
| Southern Europe | 15 | 0.8% |
| Western Asia | 27 | 1.4% | View All 13 Rows |
Sex and Age in Freeland
Sex and Age in Freeland
The most populous age groups in Freeland are 55 to 59 Years (119 | 12.4%) for men and 50 to 54 Years (119 | 12.8%) for women.
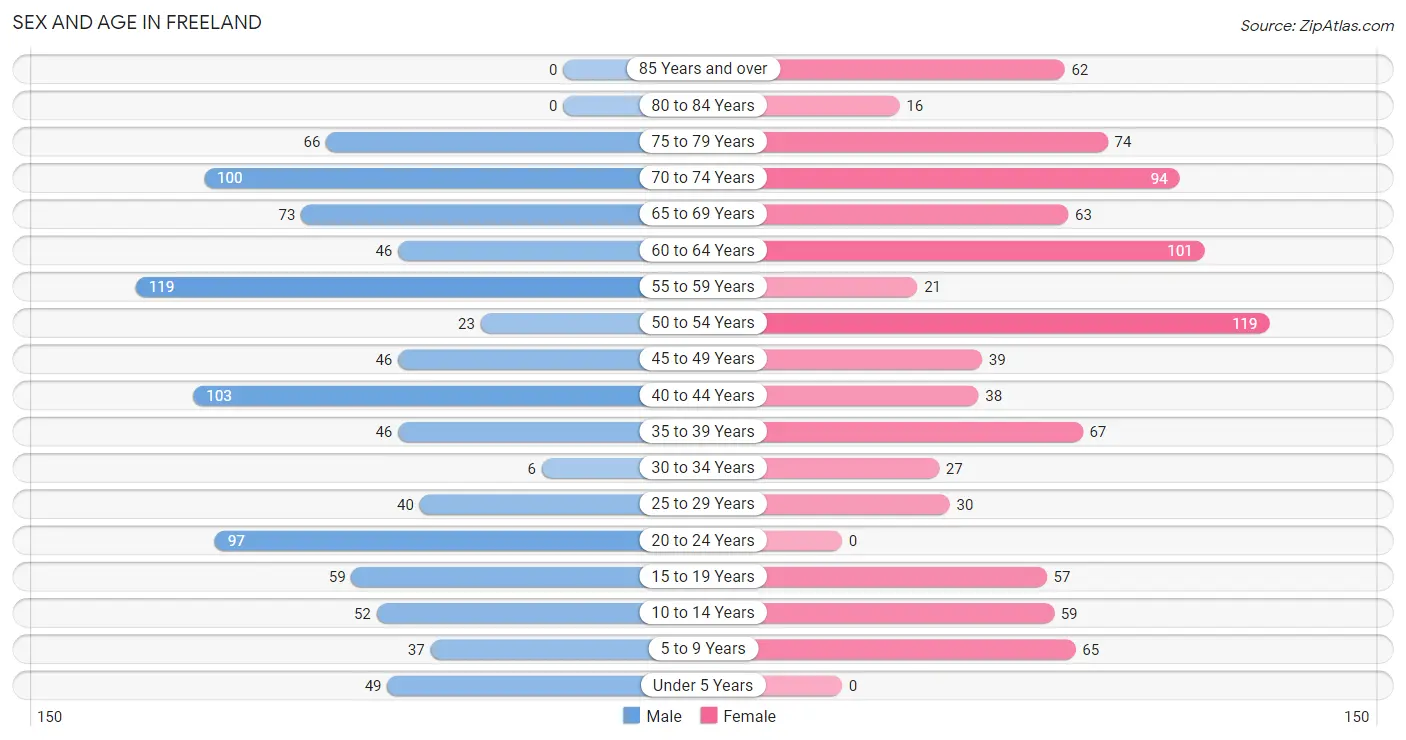
| Age Bracket | Male | Female |
| Under 5 Years | 49 (5.1%) | 0 (0.0%) |
| 5 to 9 Years | 37 (3.8%) | 65 (7.0%) |
| 10 to 14 Years | 52 (5.4%) | 59 (6.3%) |
| 15 to 19 Years | 59 (6.1%) | 57 (6.1%) |
| 20 to 24 Years | 97 (10.1%) | 0 (0.0%) |
| 25 to 29 Years | 40 (4.2%) | 30 (3.2%) |
| 30 to 34 Years | 6 (0.6%) | 27 (2.9%) |
| 35 to 39 Years | 46 (4.8%) | 67 (7.2%) |
| 40 to 44 Years | 103 (10.7%) | 38 (4.1%) |
| 45 to 49 Years | 46 (4.8%) | 39 (4.2%) |
| 50 to 54 Years | 23 (2.4%) | 119 (12.8%) |
| 55 to 59 Years | 119 (12.4%) | 21 (2.2%) |
| 60 to 64 Years | 46 (4.8%) | 101 (10.8%) |
| 65 to 69 Years | 73 (7.6%) | 63 (6.8%) |
| 70 to 74 Years | 100 (10.4%) | 94 (10.1%) |
| 75 to 79 Years | 66 (6.9%) | 74 (7.9%) |
| 80 to 84 Years | 0 (0.0%) | 16 (1.7%) |
| 85 Years and over | 0 (0.0%) | 62 (6.7%) |
| Total | 962 (100.0%) | 932 (100.0%) |
Families and Households in Freeland
Median Family Size in Freeland
The median family size in Freeland is 3.19 persons per family, with single male/father families (9 | 2.1%) accounting for the largest median family size of 4 persons per family. On the other hand, single female/mother families (38 | 8.8%) represent the smallest median family size with 2.26 persons per family.
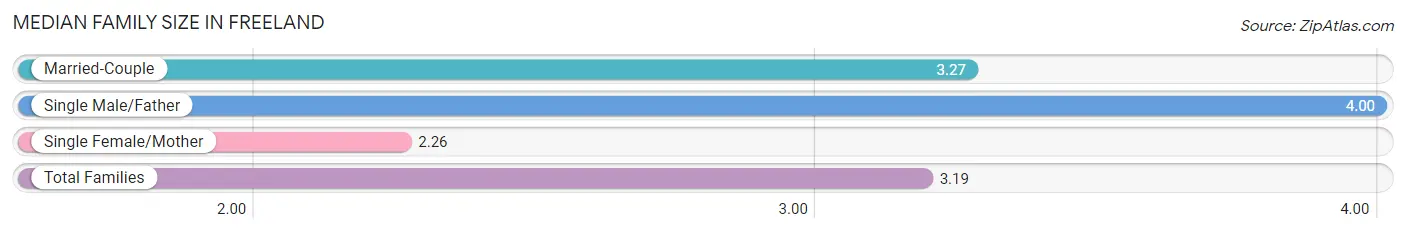
| Family Type | # Families | Family Size |
| Married-Couple | 387 (89.2%) | 3.27 |
| Single Male/Father | 9 (2.1%) | 4.00 |
| Single Female/Mother | 38 (8.8%) | 2.26 |
| Total Families | 434 (100.0%) | 3.19 |
Median Household Size in Freeland
The median household size in Freeland is 2.24 persons per household, with single male/father households (9 | 1.1%) accounting for the largest median household size of 4 persons per household. non-family households (410 | 48.6%) represent the smallest median household size with 1.24 persons per household.
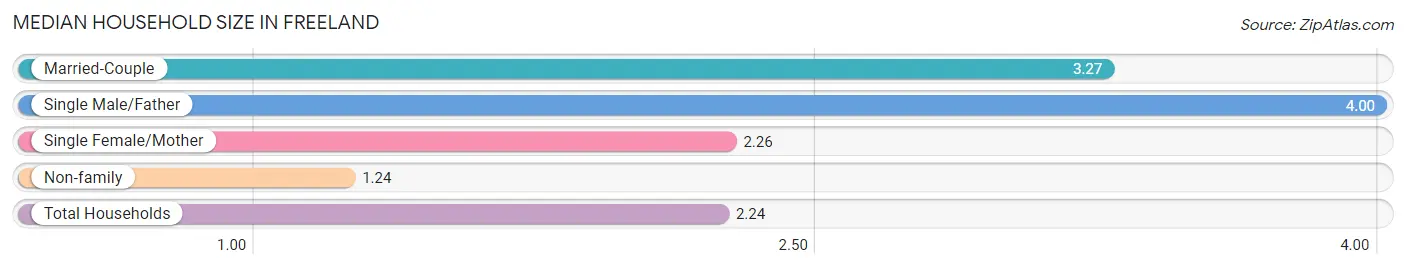
| Household Type | # Households | Household Size |
| Married-Couple | 387 (45.9%) | 3.27 |
| Single Male/Father | 9 (1.1%) | 4.00 |
| Single Female/Mother | 38 (4.5%) | 2.26 |
| Non-family | 410 (48.6%) | 1.24 |
| Total Households | 844 (100.0%) | 2.24 |
Household Size by Marriage Status in Freeland
Out of a total of 844 households in Freeland, 434 (51.4%) are family households, while 410 (48.6%) are nonfamily households. The most numerous type of family households are 2-person households, comprising 241, and the most common type of nonfamily households are 1-person households, comprising 309.
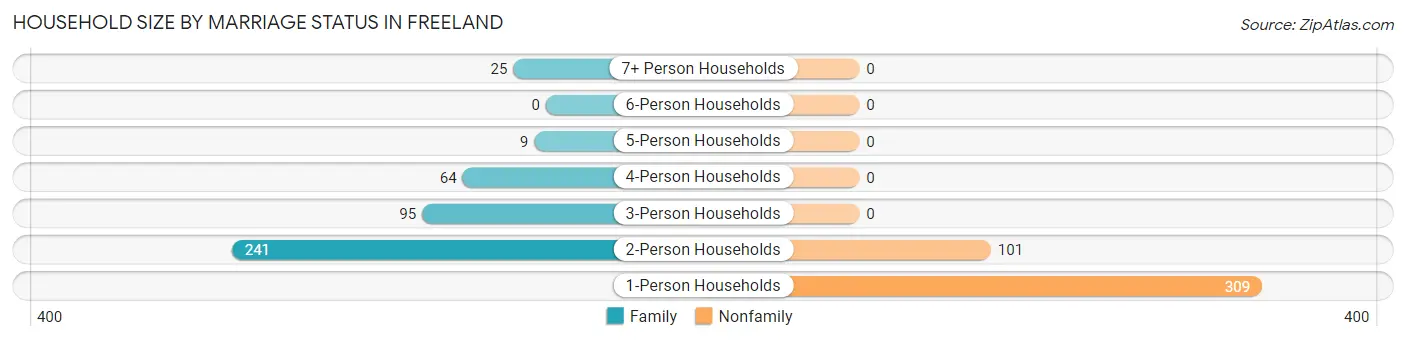
| Household Size | Family Households | Nonfamily Households |
| 1-Person Households | - | 309 (36.6%) |
| 2-Person Households | 241 (28.5%) | 101 (12.0%) |
| 3-Person Households | 95 (11.3%) | 0 (0.0%) |
| 4-Person Households | 64 (7.6%) | 0 (0.0%) |
| 5-Person Households | 9 (1.1%) | 0 (0.0%) |
| 6-Person Households | 0 (0.0%) | 0 (0.0%) |
| 7+ Person Households | 25 (3.0%) | 0 (0.0%) |
| Total | 434 (51.4%) | 410 (48.6%) |
Female Fertility in Freeland
Fertility by Age in Freeland
| Age Bracket | Women with Births | Births / 1,000 Women |
| 15 to 19 years | 0 (0.0%) | 0.0 |
| 20 to 34 years | 0 (0.0%) | 0.0 |
| 35 to 50 years | 0 (0.0%) | 0.0 |
| Total | 0 (0.0%) | 0.0 |
Fertility by Age by Marriage Status in Freeland
| Age Bracket | Married | Unmarried |
| 15 to 19 years | 0 (0.0%) | 0 (0.0%) |
| 20 to 34 years | 0 (0.0%) | 0 (0.0%) |
| 35 to 50 years | 0 (0.0%) | 0 (0.0%) |
| Total | 0 (0.0%) | 0 (0.0%) |
Fertility by Education in Freeland
| Educational Attainment | Women with Births | Births / 1,000 Women |
| Less than High School | 0 (0.0%) | 0.0 |
| High School Diploma | 0 (0.0%) | 0.0 |
| College or Associate's Degree | 0 (0.0%) | 0.0 |
| Bachelor's Degree | 0 (0.0%) | 0.0 |
| Graduate Degree | 0 (0.0%) | 0.0 |
| Total | 0 (0.0%) | 0.0 |
Fertility by Education by Marriage Status in Freeland
| Educational Attainment | Married | Unmarried |
| Less than High School | 0 (0.0%) | 0 (0.0%) |
| High School Diploma | 0 (0.0%) | 0 (0.0%) |
| College or Associate's Degree | 0 (0.0%) | 0 (0.0%) |
| Bachelor's Degree | 0 (0.0%) | 0 (0.0%) |
| Graduate Degree | 0 (0.0%) | 0 (0.0%) |
| Total | 0 (0.0%) | 0 (0.0%) |
Employment Characteristics in Freeland
Employment by Class of Employer in Freeland
Among the 720 employed individuals in Freeland, private company employees (360 | 50.0%), self-employed (not incorporated) (127 | 17.6%), and not-for-profit organizations (87 | 12.1%) make up the most common classes of employment.
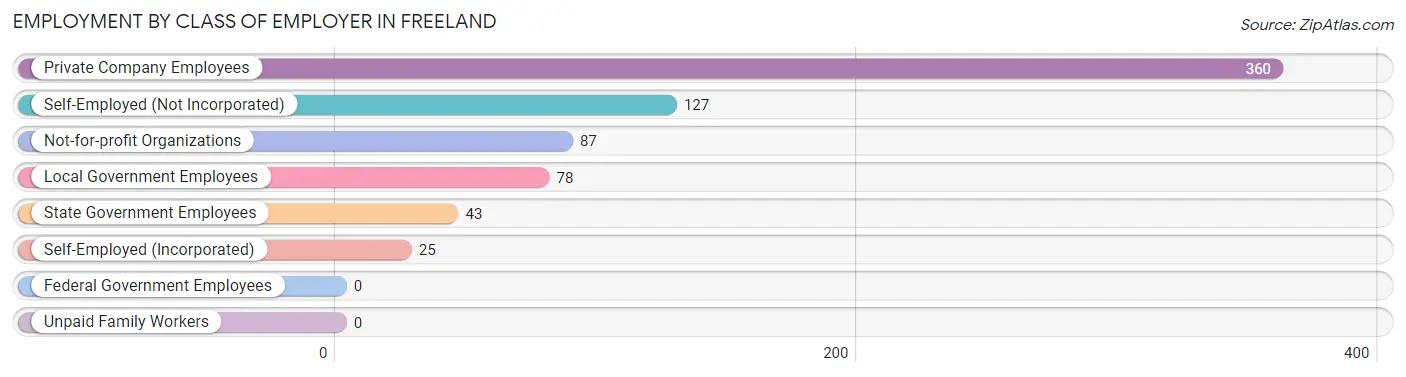
| Employer Class | # Employees | % Employees |
| Private Company Employees | 360 | 50.0% |
| Self-Employed (Incorporated) | 25 | 3.5% |
| Self-Employed (Not Incorporated) | 127 | 17.6% |
| Not-for-profit Organizations | 87 | 12.1% |
| Local Government Employees | 78 | 10.8% |
| State Government Employees | 43 | 6.0% |
| Federal Government Employees | 0 | 0.0% |
| Unpaid Family Workers | 0 | 0.0% |
| Total | 720 | 100.0% |
Employment Status by Age in Freeland
According to the labor force statistics for Freeland, out of the total population over 16 years of age (1,595), 50.0% or 798 individuals are in the labor force, with 9.8% or 78 of them unemployed. The age group with the highest labor force participation rate is 55 to 59 years, with 96.4% or 135 individuals in the labor force. Within the labor force, the 25 to 29 years age range has the highest percentage of unemployed individuals, with 36.4% or 20 of them being unemployed.
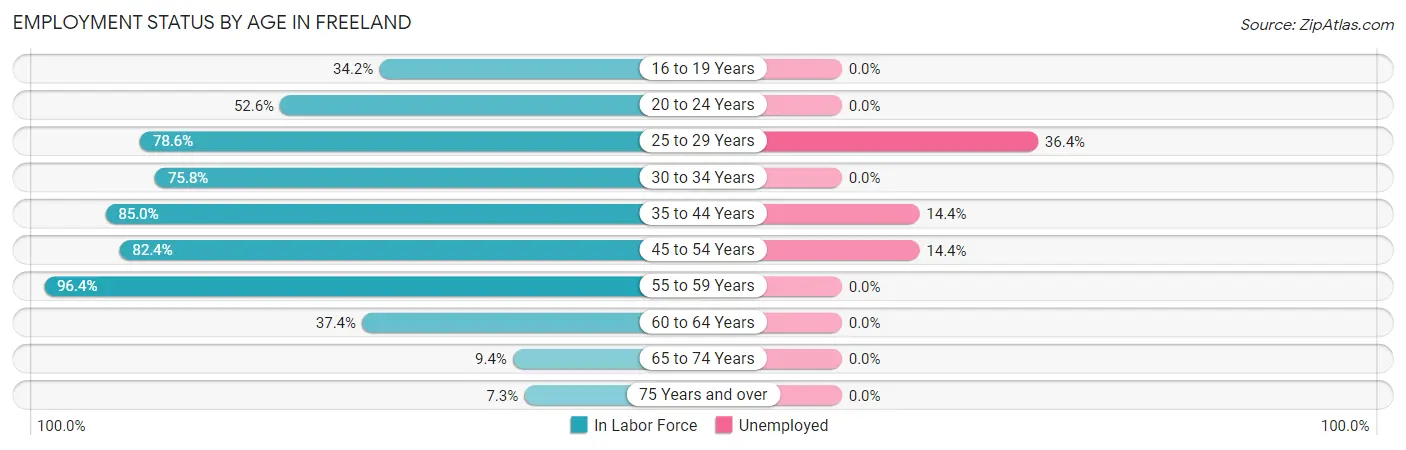
| Age Bracket | In Labor Force | Unemployed |
| 16 to 19 Years | 27 (34.2%) | 0 (0.0%) |
| 20 to 24 Years | 51 (52.6%) | 0 (0.0%) |
| 25 to 29 Years | 55 (78.6%) | 20 (36.4%) |
| 30 to 34 Years | 25 (75.8%) | 0 (0.0%) |
| 35 to 44 Years | 216 (85.0%) | 31 (14.4%) |
| 45 to 54 Years | 187 (82.4%) | 27 (14.4%) |
| 55 to 59 Years | 135 (96.4%) | 0 (0.0%) |
| 60 to 64 Years | 55 (37.4%) | 0 (0.0%) |
| 65 to 74 Years | 31 (9.4%) | 0 (0.0%) |
| 75 Years and over | 16 (7.3%) | 0 (0.0%) |
| Total | 798 (50.0%) | 78 (9.8%) |
Employment Status by Educational Attainment in Freeland
According to labor force statistics for Freeland, 77.3% of individuals (673) out of the total population between 25 and 64 years of age (871) are in the labor force, with 11.6% or 78 of them being unemployed. The group with the highest labor force participation rate are those with the educational attainment of bachelor's degree or higher, with 84.8% or 251 individuals in the labor force. Within the labor force, individuals with less than high school education have the highest percentage of unemployment, with 51.3% or 20 of them being unemployed.
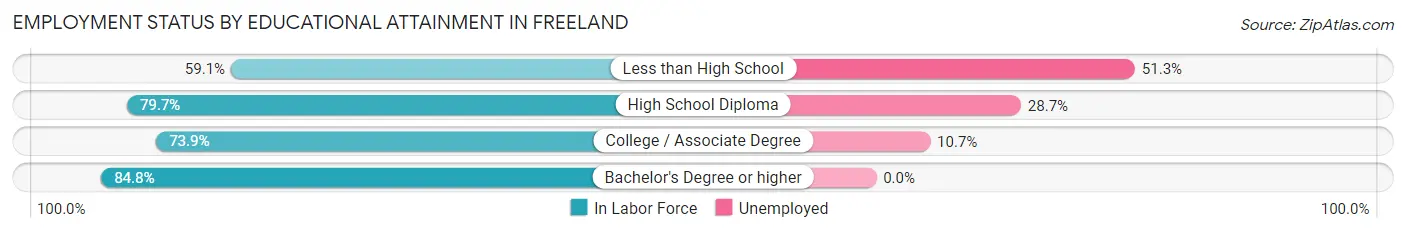
| Educational Attainment | In Labor Force | Unemployed |
| Less than High School | 39 (59.1%) | 34 (51.3%) |
| High School Diploma | 94 (79.7%) | 34 (28.7%) |
| College / Associate Degree | 289 (73.9%) | 42 (10.7%) |
| Bachelor's Degree or higher | 251 (84.8%) | 0 (0.0%) |
| Total | 673 (77.3%) | 101 (11.6%) |
Employment Occupations by Sex in Freeland
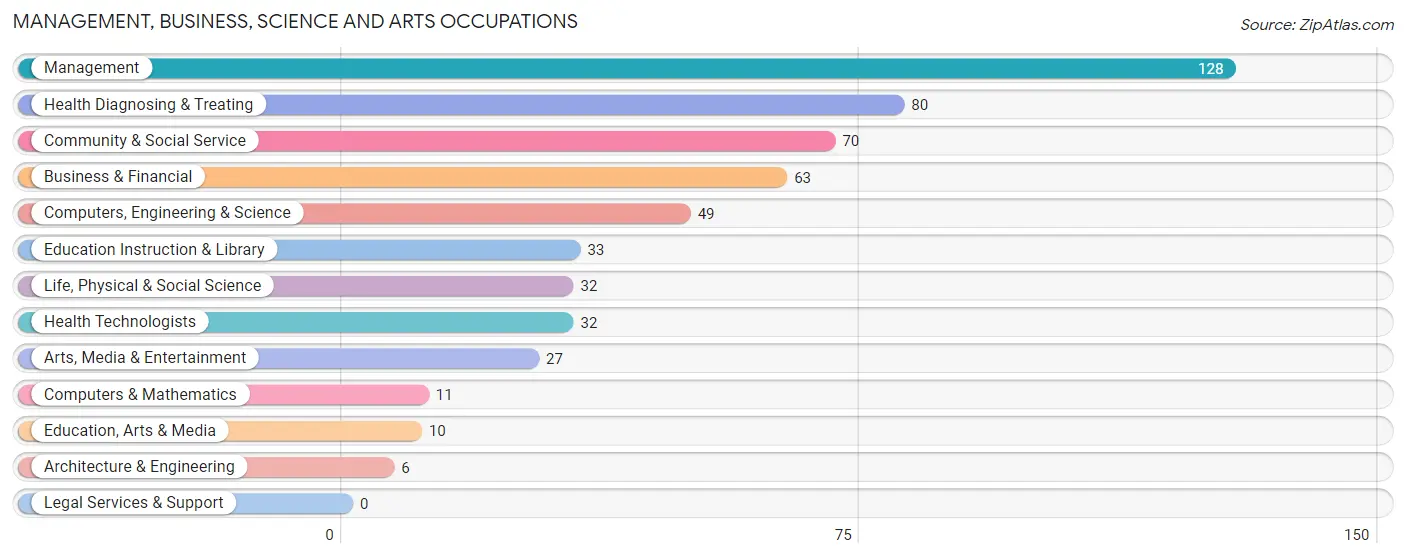
Management, Business, Science and Arts Occupations
The most common Management, Business, Science and Arts occupations in Freeland are Management (128 | 17.8%), Health Diagnosing & Treating (80 | 11.1%), Community & Social Service (70 | 9.7%), Business & Financial (63 | 8.7%), and Computers, Engineering & Science (49 | 6.8%).
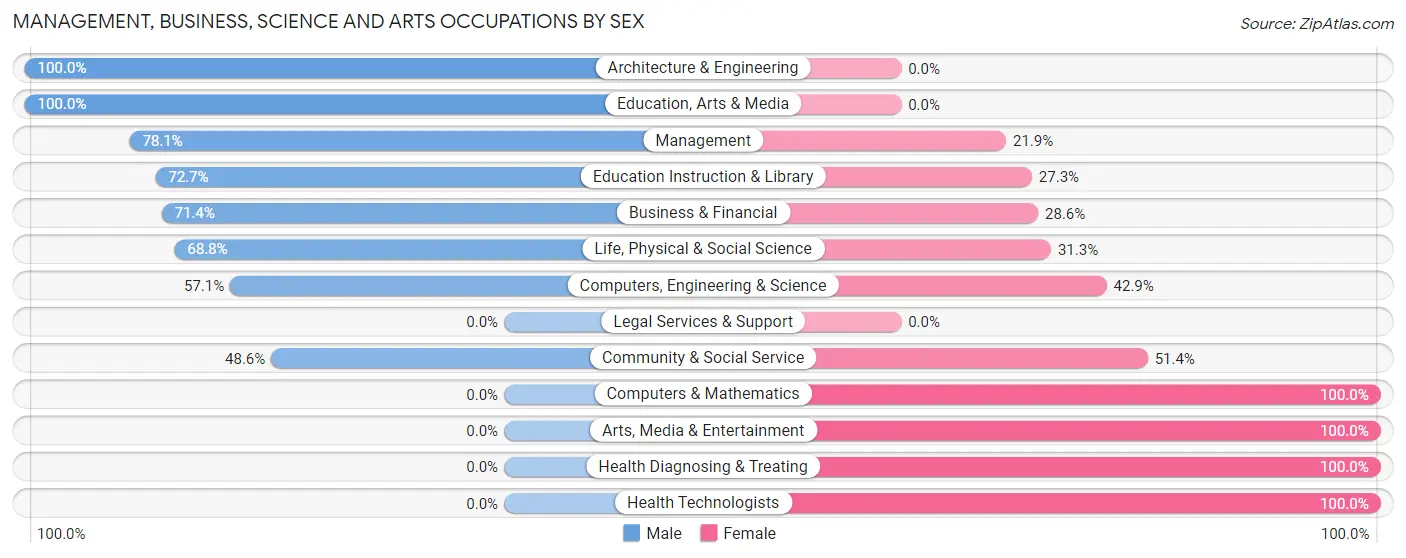
Management, Business, Science and Arts Occupations by Sex
Within the Management, Business, Science and Arts occupations in Freeland, the most male-oriented occupations are Architecture & Engineering (100.0%), Education, Arts & Media (100.0%), and Management (78.1%), while the most female-oriented occupations are Computers & Mathematics (100.0%), Arts, Media & Entertainment (100.0%), and Health Diagnosing & Treating (100.0%).
| Occupation | Male | Female |
| Management | 100 (78.1%) | 28 (21.9%) |
| Business & Financial | 45 (71.4%) | 18 (28.6%) |
| Computers, Engineering & Science | 28 (57.1%) | 21 (42.9%) |
| Computers & Mathematics | 0 (0.0%) | 11 (100.0%) |
| Architecture & Engineering | 6 (100.0%) | 0 (0.0%) |
| Life, Physical & Social Science | 22 (68.8%) | 10 (31.2%) |
| Community & Social Service | 34 (48.6%) | 36 (51.4%) |
| Education, Arts & Media | 10 (100.0%) | 0 (0.0%) |
| Legal Services & Support | 0 (0.0%) | 0 (0.0%) |
| Education Instruction & Library | 24 (72.7%) | 9 (27.3%) |
| Arts, Media & Entertainment | 0 (0.0%) | 27 (100.0%) |
| Health Diagnosing & Treating | 0 (0.0%) | 80 (100.0%) |
| Health Technologists | 0 (0.0%) | 32 (100.0%) |
| Total (Category) | 207 (53.1%) | 183 (46.9%) |
| Total (Overall) | 483 (67.1%) | 237 (32.9%) |
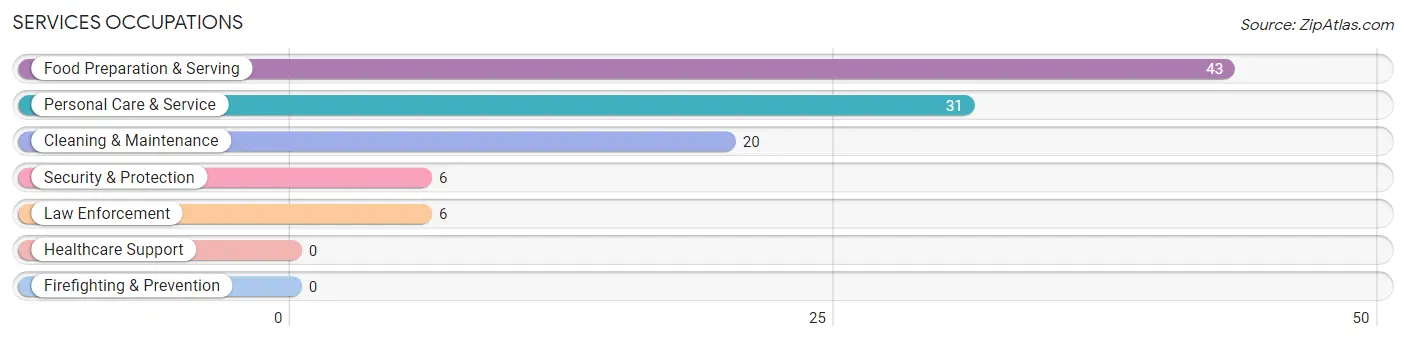
Services Occupations
The most common Services occupations in Freeland are Food Preparation & Serving (43 | 6.0%), Personal Care & Service (31 | 4.3%), Cleaning & Maintenance (20 | 2.8%), Security & Protection (6 | 0.8%), and Law Enforcement (6 | 0.8%).
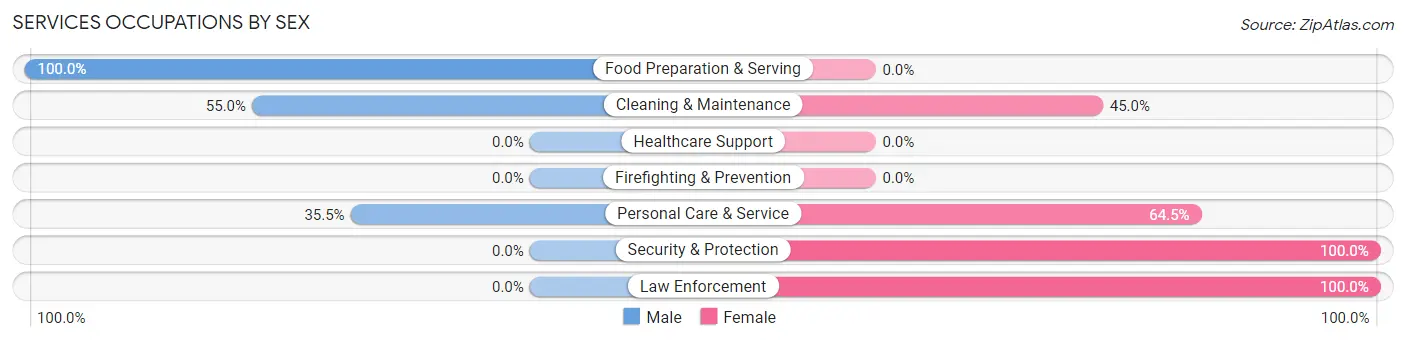
Services Occupations by Sex
Within the Services occupations in Freeland, the most male-oriented occupations are Food Preparation & Serving (100.0%), Cleaning & Maintenance (55.0%), and Personal Care & Service (35.5%), while the most female-oriented occupations are Security & Protection (100.0%), Law Enforcement (100.0%), and Personal Care & Service (64.5%).
| Occupation | Male | Female |
| Healthcare Support | 0 (0.0%) | 0 (0.0%) |
| Security & Protection | 0 (0.0%) | 6 (100.0%) |
| Firefighting & Prevention | 0 (0.0%) | 0 (0.0%) |
| Law Enforcement | 0 (0.0%) | 6 (100.0%) |
| Food Preparation & Serving | 43 (100.0%) | 0 (0.0%) |
| Cleaning & Maintenance | 11 (55.0%) | 9 (45.0%) |
| Personal Care & Service | 11 (35.5%) | 20 (64.5%) |
| Total (Category) | 65 (65.0%) | 35 (35.0%) |
| Total (Overall) | 483 (67.1%) | 237 (32.9%) |
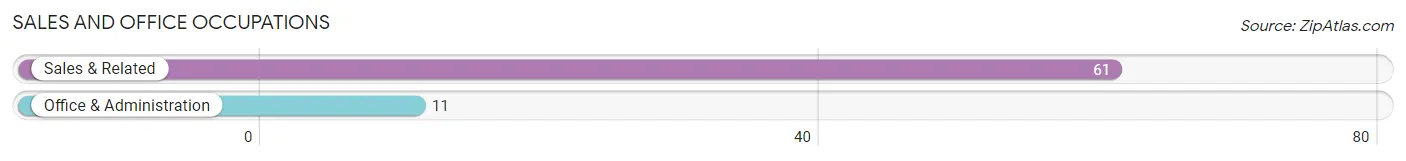
Sales and Office Occupations
The most common Sales and Office occupations in Freeland are Sales & Related (61 | 8.5%), and Office & Administration (11 | 1.5%).
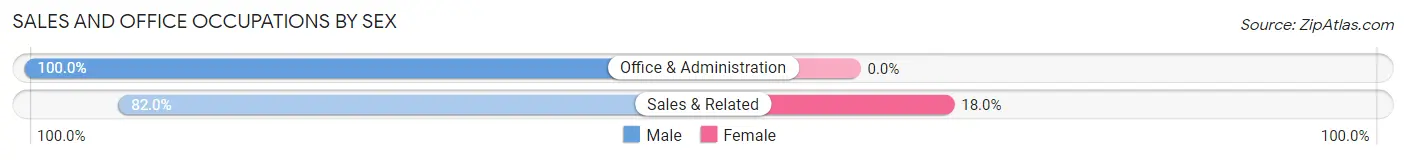
Sales and Office Occupations by Sex
| Occupation | Male | Female |
| Sales & Related | 50 (82.0%) | 11 (18.0%) |
| Office & Administration | 11 (100.0%) | 0 (0.0%) |
| Total (Category) | 61 (84.7%) | 11 (15.3%) |
| Total (Overall) | 483 (67.1%) | 237 (32.9%) |
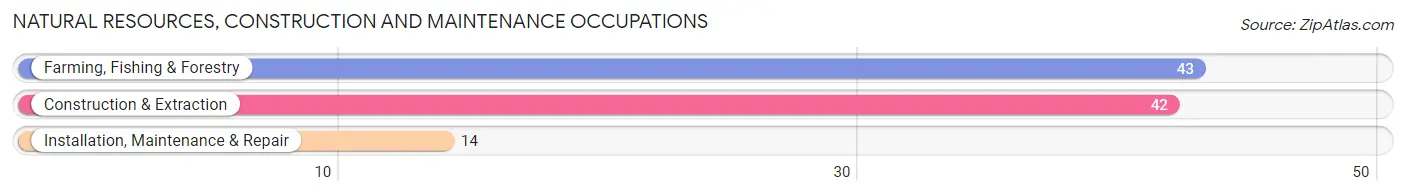
Natural Resources, Construction and Maintenance Occupations
The most common Natural Resources, Construction and Maintenance occupations in Freeland are Farming, Fishing & Forestry (43 | 6.0%), Construction & Extraction (42 | 5.8%), and Installation, Maintenance & Repair (14 | 1.9%).
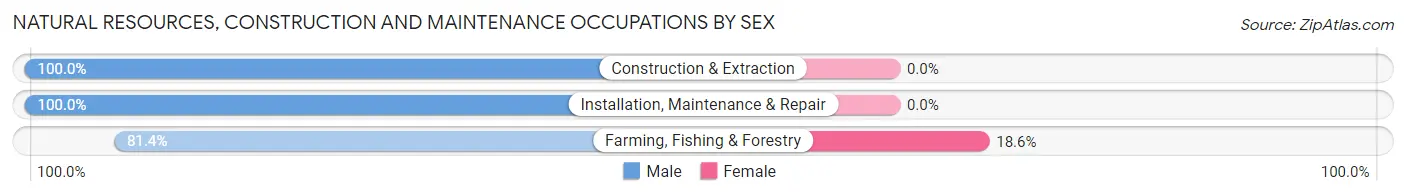
Natural Resources, Construction and Maintenance Occupations by Sex
| Occupation | Male | Female |
| Farming, Fishing & Forestry | 35 (81.4%) | 8 (18.6%) |
| Construction & Extraction | 42 (100.0%) | 0 (0.0%) |
| Installation, Maintenance & Repair | 14 (100.0%) | 0 (0.0%) |
| Total (Category) | 91 (91.9%) | 8 (8.1%) |
| Total (Overall) | 483 (67.1%) | 237 (32.9%) |
Production, Transportation and Moving Occupations
The most common Production, Transportation and Moving occupations in Freeland are , and Production (59 | 8.2%).
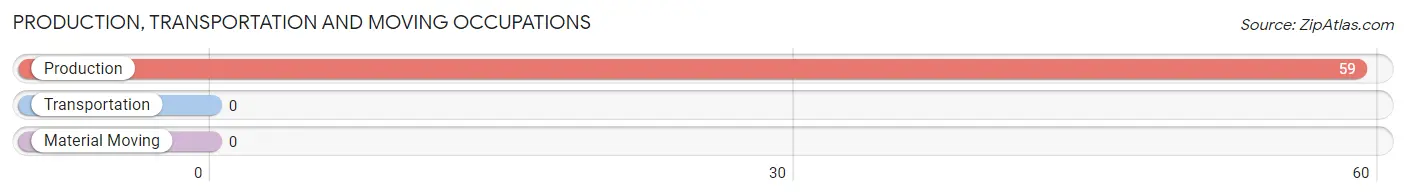
Production, Transportation and Moving Occupations by Sex
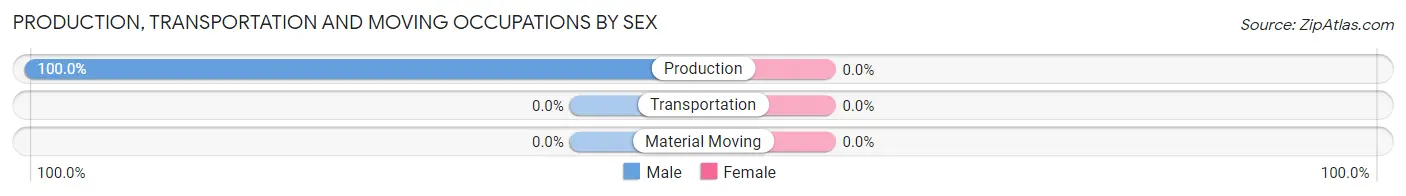
| Occupation | Male | Female |
| Production | 59 (100.0%) | 0 (0.0%) |
| Transportation | 0 (0.0%) | 0 (0.0%) |
| Material Moving | 0 (0.0%) | 0 (0.0%) |
| Total (Category) | 59 (100.0%) | 0 (0.0%) |
| Total (Overall) | 483 (67.1%) | 237 (32.9%) |
Employment Industries by Sex in Freeland
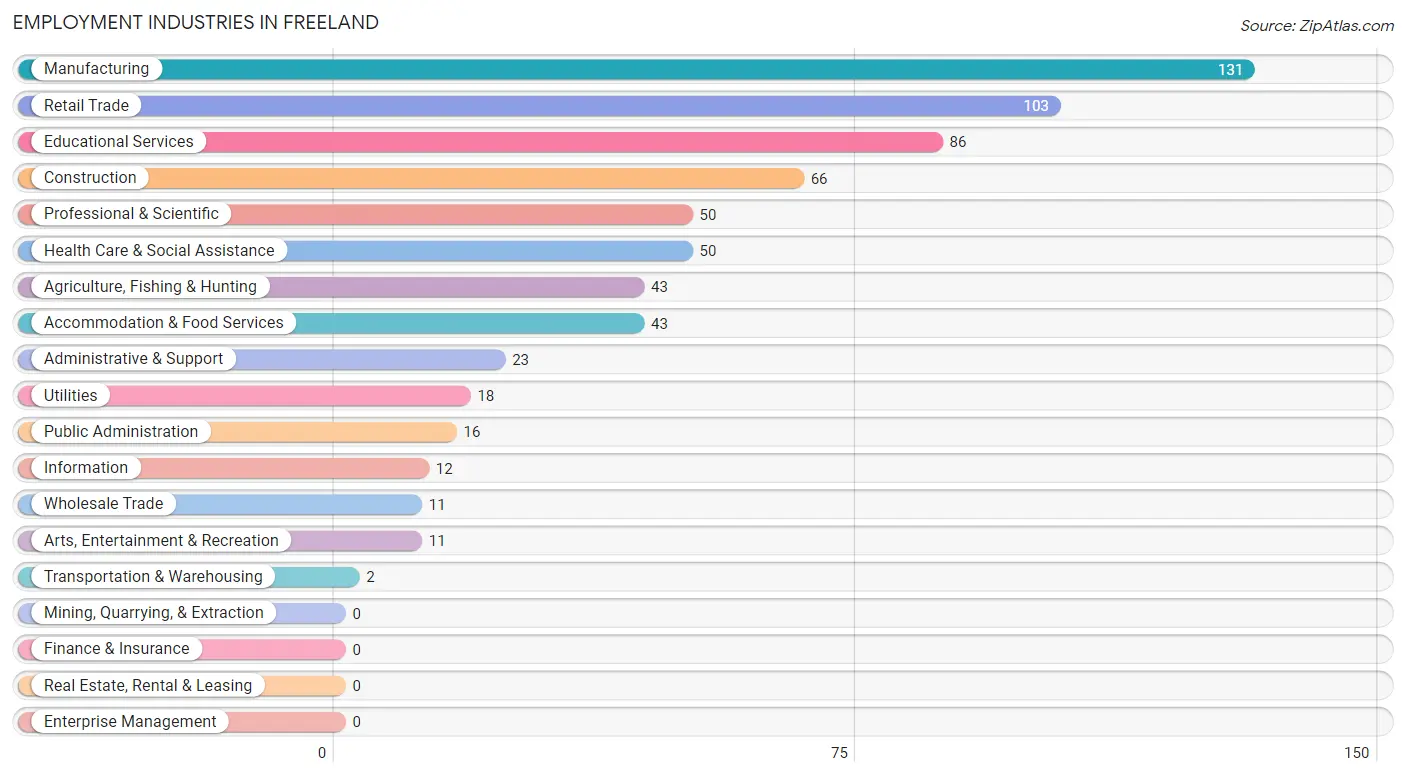
Employment Industries in Freeland
The major employment industries in Freeland include Manufacturing (131 | 18.2%), Retail Trade (103 | 14.3%), Educational Services (86 | 11.9%), Construction (66 | 9.2%), and Professional & Scientific (50 | 6.9%).
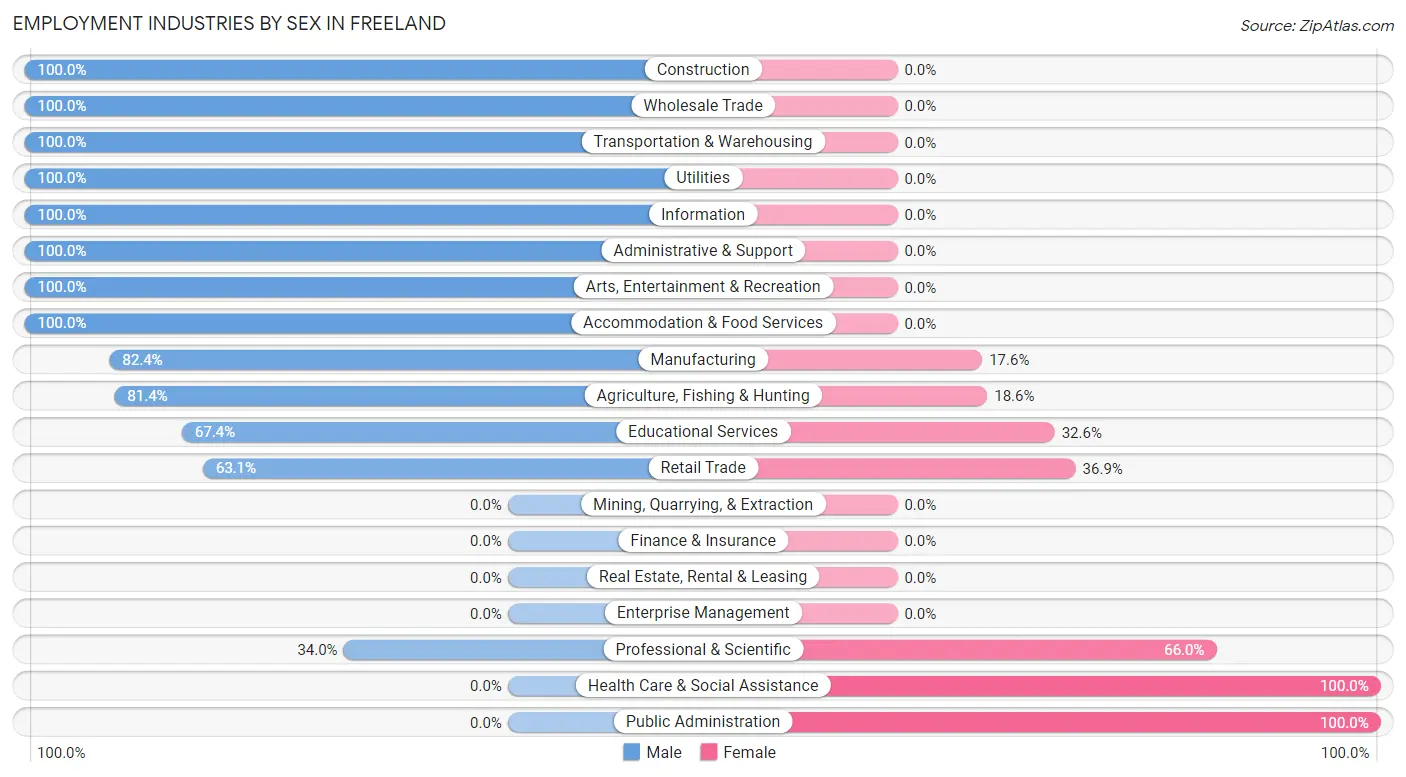
Employment Industries by Sex in Freeland
The Freeland industries that see more men than women are Construction (100.0%), Wholesale Trade (100.0%), and Transportation & Warehousing (100.0%), whereas the industries that tend to have a higher number of women are Health Care & Social Assistance (100.0%), Public Administration (100.0%), and Professional & Scientific (66.0%).
| Industry | Male | Female |
| Agriculture, Fishing & Hunting | 35 (81.4%) | 8 (18.6%) |
| Mining, Quarrying, & Extraction | 0 (0.0%) | 0 (0.0%) |
| Construction | 66 (100.0%) | 0 (0.0%) |
| Manufacturing | 108 (82.4%) | 23 (17.6%) |
| Wholesale Trade | 11 (100.0%) | 0 (0.0%) |
| Retail Trade | 65 (63.1%) | 38 (36.9%) |
| Transportation & Warehousing | 2 (100.0%) | 0 (0.0%) |
| Utilities | 18 (100.0%) | 0 (0.0%) |
| Information | 12 (100.0%) | 0 (0.0%) |
| Finance & Insurance | 0 (0.0%) | 0 (0.0%) |
| Real Estate, Rental & Leasing | 0 (0.0%) | 0 (0.0%) |
| Professional & Scientific | 17 (34.0%) | 33 (66.0%) |
| Enterprise Management | 0 (0.0%) | 0 (0.0%) |
| Administrative & Support | 23 (100.0%) | 0 (0.0%) |
| Educational Services | 58 (67.4%) | 28 (32.6%) |
| Health Care & Social Assistance | 0 (0.0%) | 50 (100.0%) |
| Arts, Entertainment & Recreation | 11 (100.0%) | 0 (0.0%) |
| Accommodation & Food Services | 43 (100.0%) | 0 (0.0%) |
| Public Administration | 0 (0.0%) | 16 (100.0%) |
| Total | 483 (67.1%) | 237 (32.9%) |
Education in Freeland
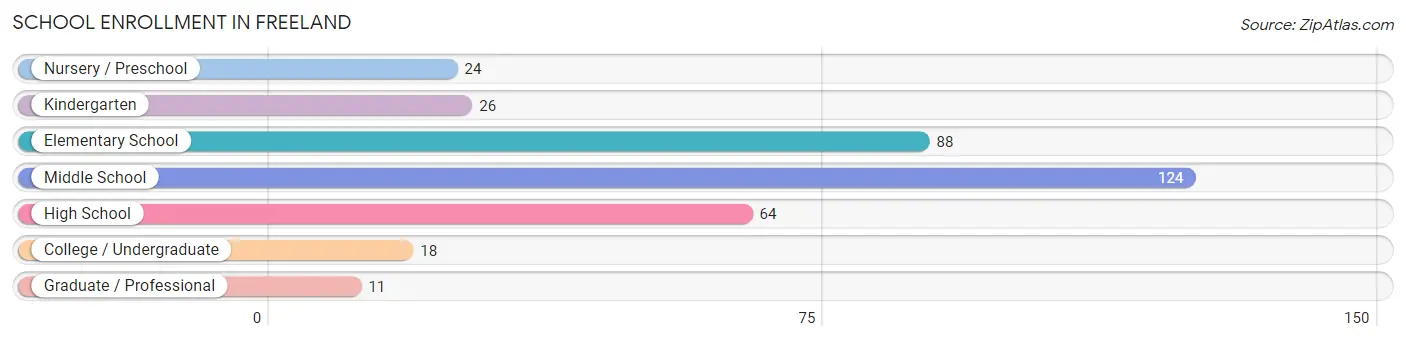
School Enrollment in Freeland
The most common levels of schooling among the 355 students in Freeland are middle school (124 | 34.9%), elementary school (88 | 24.8%), and high school (64 | 18.0%).
| School Level | # Students | % Students |
| Nursery / Preschool | 24 | 6.8% |
| Kindergarten | 26 | 7.3% |
| Elementary School | 88 | 24.8% |
| Middle School | 124 | 34.9% |
| High School | 64 | 18.0% |
| College / Undergraduate | 18 | 5.1% |
| Graduate / Professional | 11 | 3.1% |
| Total | 355 | 100.0% |
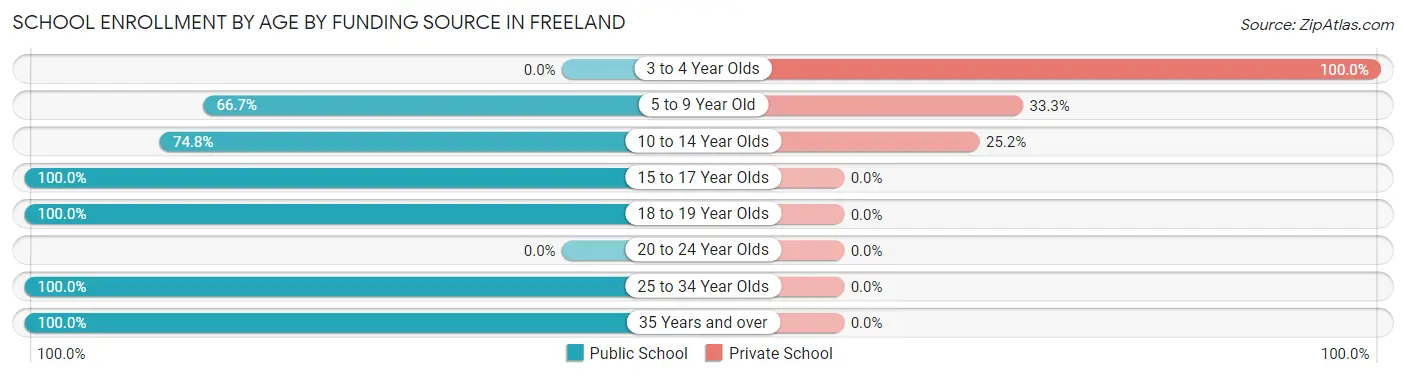
School Enrollment by Age by Funding Source in Freeland
Out of a total of 355 students who are enrolled in schools in Freeland, 86 (24.2%) attend a private institution, while the remaining 269 (75.8%) are enrolled in public schools. The age group of 3 to 4 year olds has the highest likelihood of being enrolled in private schools, with 24 (100.0% in the age bracket) enrolled. Conversely, the age group of 15 to 17 year olds has the lowest likelihood of being enrolled in a private school, with 89 (100.0% in the age bracket) attending a public institution.
| Age Bracket | Public School | Private School |
| 3 to 4 Year Olds | 0 (0.0%) | 24 (100.0%) |
| 5 to 9 Year Old | 68 (66.7%) | 34 (33.3%) |
| 10 to 14 Year Olds | 83 (74.8%) | 28 (25.2%) |
| 15 to 17 Year Olds | 89 (100.0%) | 0 (0.0%) |
| 18 to 19 Year Olds | 7 (100.0%) | 0 (0.0%) |
| 20 to 24 Year Olds | 0 (0.0%) | 0 (0.0%) |
| 25 to 34 Year Olds | 11 (100.0%) | 0 (0.0%) |
| 35 Years and over | 11 (100.0%) | 0 (0.0%) |
| Total | 269 (75.8%) | 86 (24.2%) |
Educational Attainment by Field of Study in Freeland
Business (83 | 13.1%), literature & languages (80 | 12.6%), education (79 | 12.4%), liberal arts & history (74 | 11.7%), and social sciences (64 | 10.1%) are the most common fields of study among 635 individuals in Freeland who have obtained a bachelor's degree or higher.
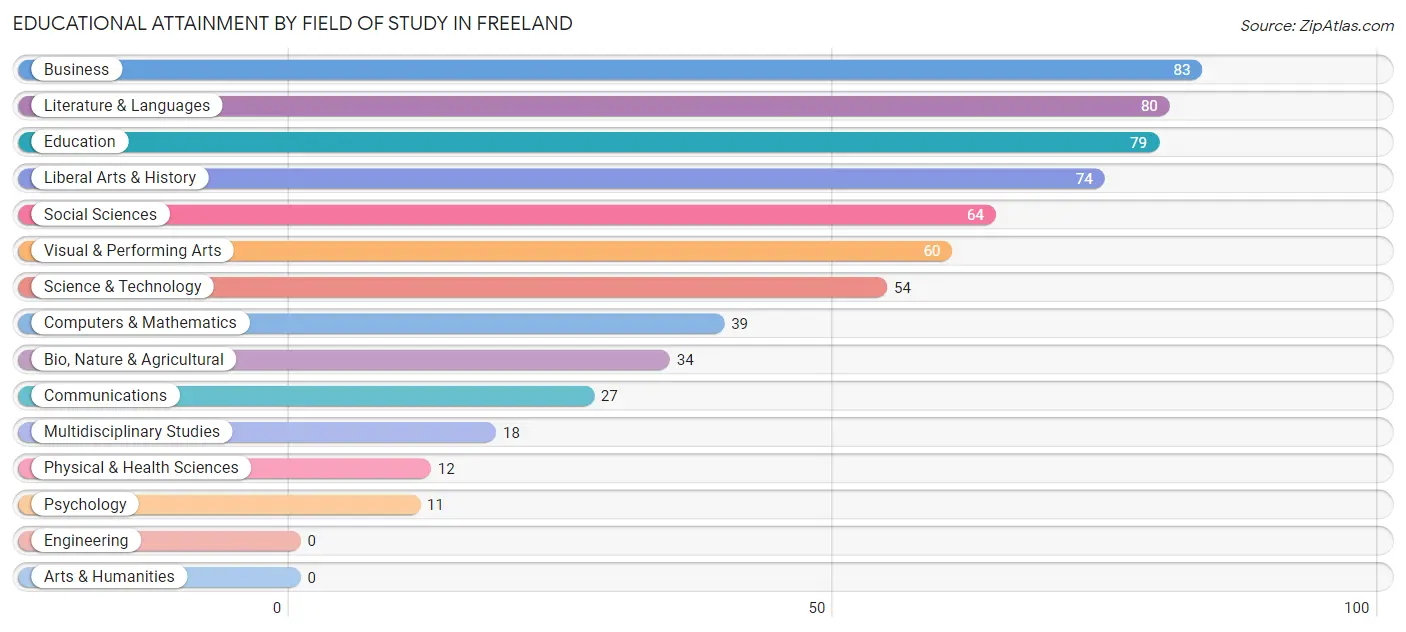
| Field of Study | # Graduates | % Graduates |
| Computers & Mathematics | 39 | 6.1% |
| Bio, Nature & Agricultural | 34 | 5.3% |
| Physical & Health Sciences | 12 | 1.9% |
| Psychology | 11 | 1.7% |
| Social Sciences | 64 | 10.1% |
| Engineering | 0 | 0.0% |
| Multidisciplinary Studies | 18 | 2.8% |
| Science & Technology | 54 | 8.5% |
| Business | 83 | 13.1% |
| Education | 79 | 12.4% |
| Literature & Languages | 80 | 12.6% |
| Liberal Arts & History | 74 | 11.7% |
| Visual & Performing Arts | 60 | 9.5% |
| Communications | 27 | 4.3% |
| Arts & Humanities | 0 | 0.0% |
| Total | 635 | 100.0% |
Transportation & Commute in Freeland
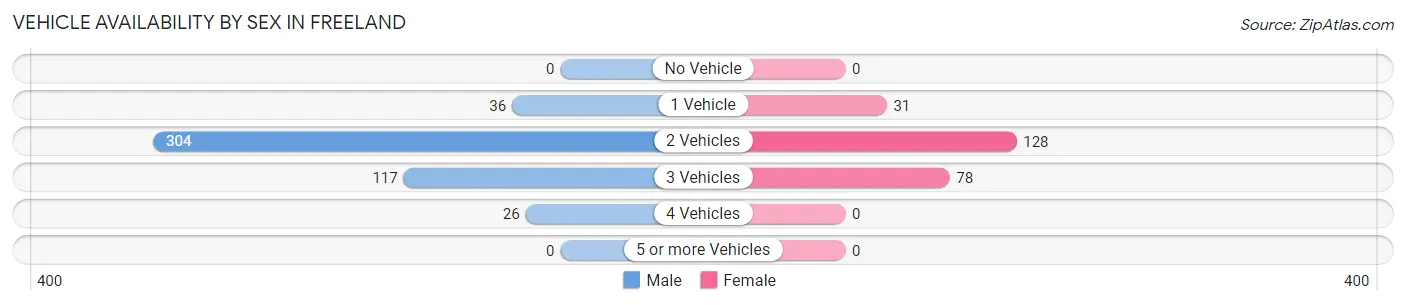
Vehicle Availability by Sex in Freeland
The most prevalent vehicle ownership categories in Freeland are males with 2 vehicles (304, accounting for 62.9%) and females with 2 vehicles (128, making up 128.3%).
| Vehicles Available | Male | Female |
| No Vehicle | 0 (0.0%) | 0 (0.0%) |
| 1 Vehicle | 36 (7.4%) | 31 (13.1%) |
| 2 Vehicles | 304 (62.9%) | 128 (54.0%) |
| 3 Vehicles | 117 (24.2%) | 78 (32.9%) |
| 4 Vehicles | 26 (5.4%) | 0 (0.0%) |
| 5 or more Vehicles | 0 (0.0%) | 0 (0.0%) |
| Total | 483 (100.0%) | 237 (100.0%) |
Commute Time in Freeland
The most frequently occuring commute durations in Freeland are 60 to 89 minutes (115 commuters, 21.1%), 90 or more minutes (76 commuters, 13.9%), and 20 to 24 minutes (73 commuters, 13.4%).
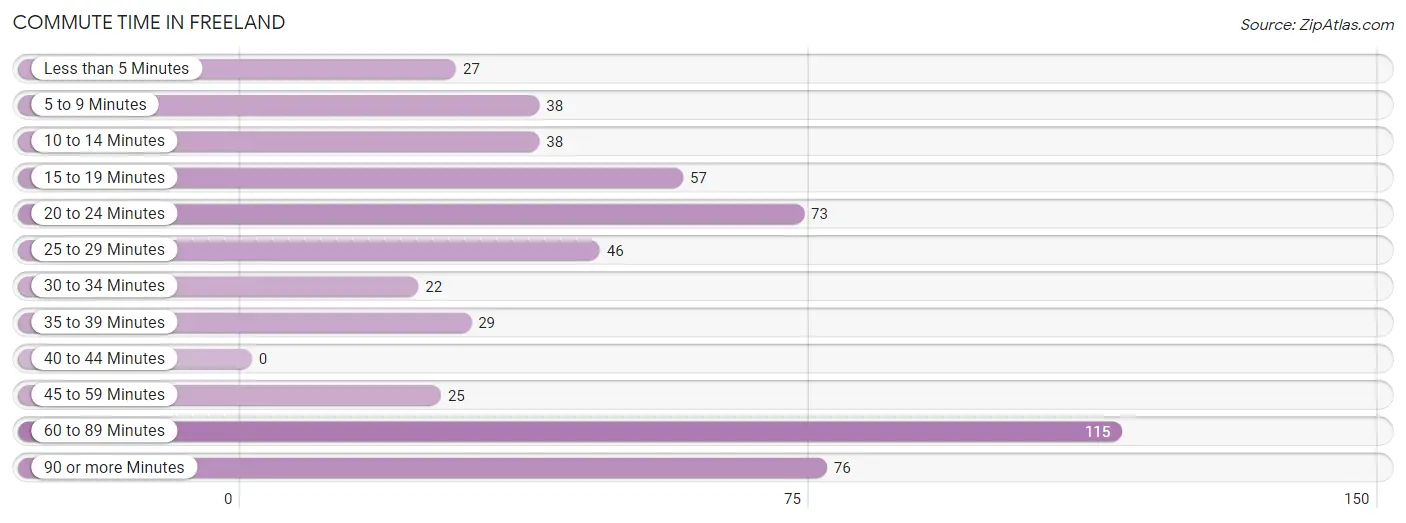
| Commute Time | # Commuters | % Commuters |
| Less than 5 Minutes | 27 | 5.0% |
| 5 to 9 Minutes | 38 | 7.0% |
| 10 to 14 Minutes | 38 | 7.0% |
| 15 to 19 Minutes | 57 | 10.4% |
| 20 to 24 Minutes | 73 | 13.4% |
| 25 to 29 Minutes | 46 | 8.4% |
| 30 to 34 Minutes | 22 | 4.0% |
| 35 to 39 Minutes | 29 | 5.3% |
| 40 to 44 Minutes | 0 | 0.0% |
| 45 to 59 Minutes | 25 | 4.6% |
| 60 to 89 Minutes | 115 | 21.1% |
| 90 or more Minutes | 76 | 13.9% |
Commute Time by Sex in Freeland
The most common commute times in Freeland are 60 to 89 minutes (77 commuters, 20.7%) for males and 10 to 14 minutes (38 commuters, 21.8%) for females.
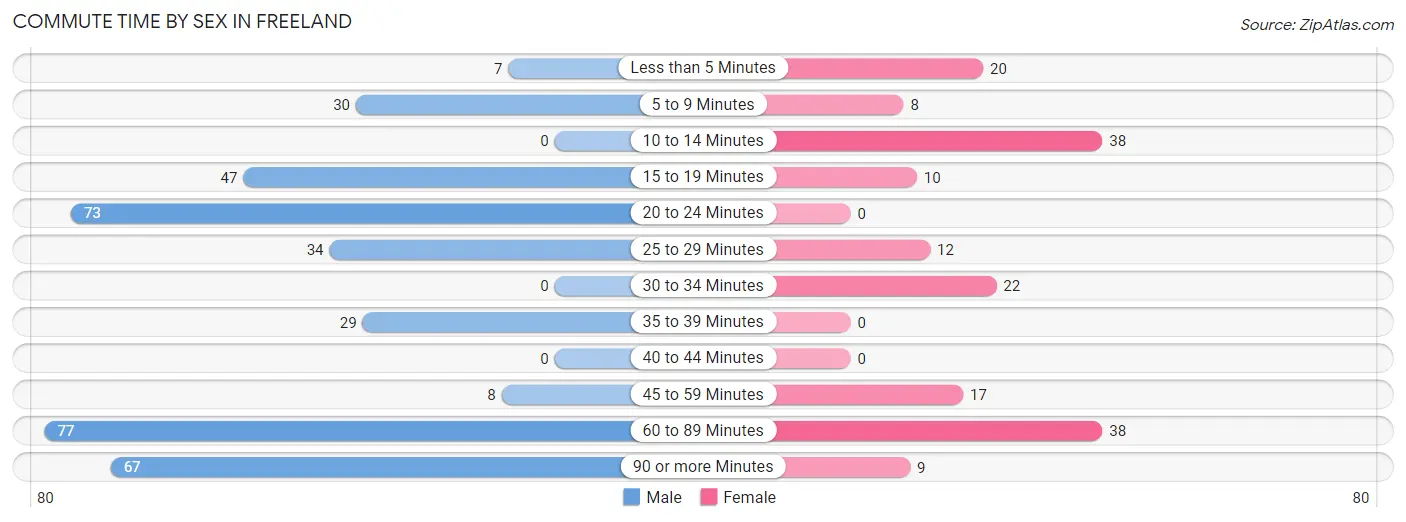
| Commute Time | Male | Female |
| Less than 5 Minutes | 7 (1.9%) | 20 (11.5%) |
| 5 to 9 Minutes | 30 (8.1%) | 8 (4.6%) |
| 10 to 14 Minutes | 0 (0.0%) | 38 (21.8%) |
| 15 to 19 Minutes | 47 (12.6%) | 10 (5.8%) |
| 20 to 24 Minutes | 73 (19.6%) | 0 (0.0%) |
| 25 to 29 Minutes | 34 (9.1%) | 12 (6.9%) |
| 30 to 34 Minutes | 0 (0.0%) | 22 (12.6%) |
| 35 to 39 Minutes | 29 (7.8%) | 0 (0.0%) |
| 40 to 44 Minutes | 0 (0.0%) | 0 (0.0%) |
| 45 to 59 Minutes | 8 (2.1%) | 17 (9.8%) |
| 60 to 89 Minutes | 77 (20.7%) | 38 (21.8%) |
| 90 or more Minutes | 67 (18.0%) | 9 (5.2%) |
Time of Departure to Work by Sex in Freeland
The most frequent times of departure to work in Freeland are 9:00 AM to 9:59 AM (71, 19.1%) for males and 7:30 AM to 7:59 AM (60, 34.5%) for females.
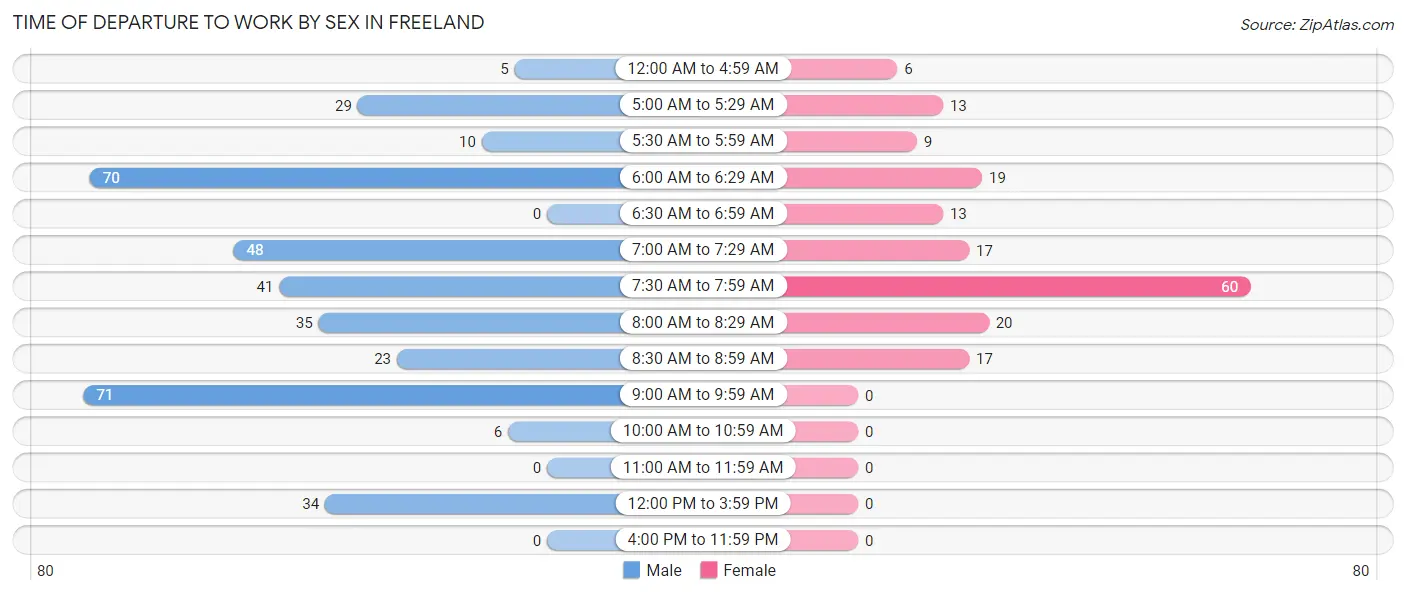
| Time of Departure | Male | Female |
| 12:00 AM to 4:59 AM | 5 (1.3%) | 6 (3.5%) |
| 5:00 AM to 5:29 AM | 29 (7.8%) | 13 (7.5%) |
| 5:30 AM to 5:59 AM | 10 (2.7%) | 9 (5.2%) |
| 6:00 AM to 6:29 AM | 70 (18.8%) | 19 (10.9%) |
| 6:30 AM to 6:59 AM | 0 (0.0%) | 13 (7.5%) |
| 7:00 AM to 7:29 AM | 48 (12.9%) | 17 (9.8%) |
| 7:30 AM to 7:59 AM | 41 (11.0%) | 60 (34.5%) |
| 8:00 AM to 8:29 AM | 35 (9.4%) | 20 (11.5%) |
| 8:30 AM to 8:59 AM | 23 (6.2%) | 17 (9.8%) |
| 9:00 AM to 9:59 AM | 71 (19.1%) | 0 (0.0%) |
| 10:00 AM to 10:59 AM | 6 (1.6%) | 0 (0.0%) |
| 11:00 AM to 11:59 AM | 0 (0.0%) | 0 (0.0%) |
| 12:00 PM to 3:59 PM | 34 (9.1%) | 0 (0.0%) |
| 4:00 PM to 11:59 PM | 0 (0.0%) | 0 (0.0%) |
| Total | 372 (100.0%) | 174 (100.0%) |
Housing Occupancy in Freeland
Occupancy by Ownership in Freeland
Of the total 844 dwellings in Freeland, owner-occupied units account for 732 (86.7%), while renter-occupied units make up 112 (13.3%).
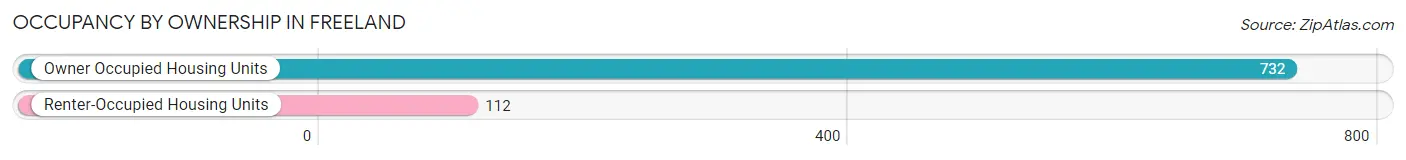
| Occupancy | # Housing Units | % Housing Units |
| Owner Occupied Housing Units | 732 | 86.7% |
| Renter-Occupied Housing Units | 112 | 13.3% |
| Total Occupied Housing Units | 844 | 100.0% |
Occupancy by Household Size in Freeland
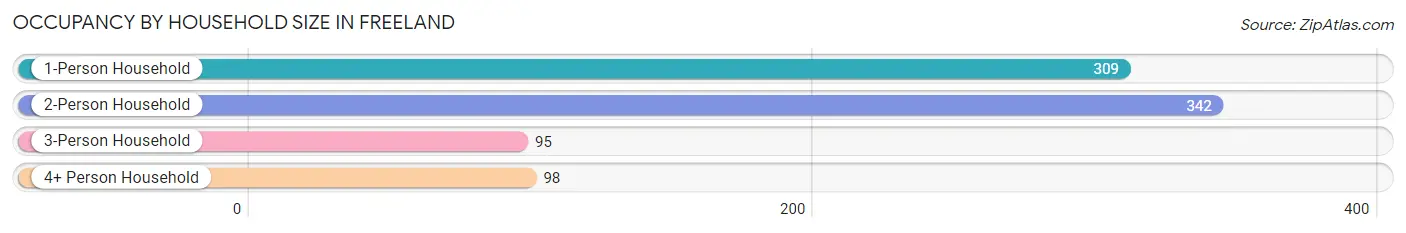
| Household Size | # Housing Units | % Housing Units |
| 1-Person Household | 309 | 36.6% |
| 2-Person Household | 342 | 40.5% |
| 3-Person Household | 95 | 11.3% |
| 4+ Person Household | 98 | 11.6% |
| Total Housing Units | 844 | 100.0% |
Occupancy by Ownership by Household Size in Freeland
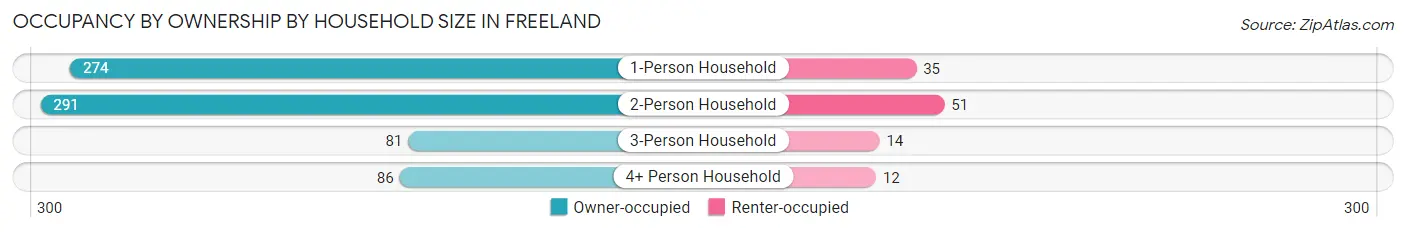
| Household Size | Owner-occupied | Renter-occupied |
| 1-Person Household | 274 (88.7%) | 35 (11.3%) |
| 2-Person Household | 291 (85.1%) | 51 (14.9%) |
| 3-Person Household | 81 (85.3%) | 14 (14.7%) |
| 4+ Person Household | 86 (87.8%) | 12 (12.2%) |
| Total Housing Units | 732 (86.7%) | 112 (13.3%) |
Occupancy by Educational Attainment in Freeland
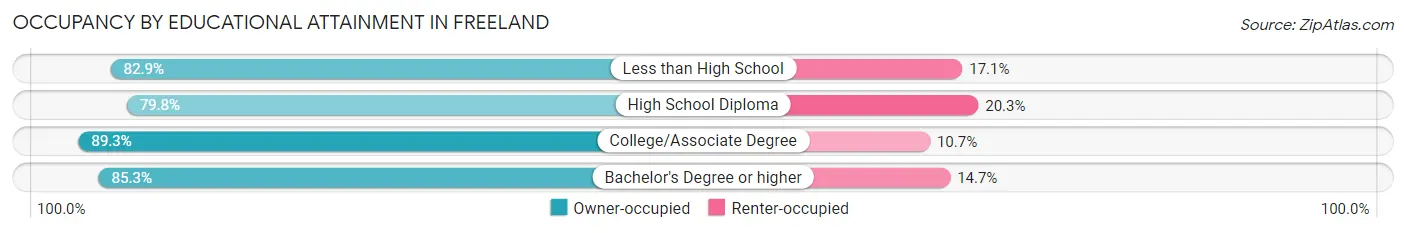
| Household Size | Owner-occupied | Renter-occupied |
| Less than High School | 34 (82.9%) | 7 (17.1%) |
| High School Diploma | 63 (79.7%) | 16 (20.3%) |
| College/Associate Degree | 385 (89.3%) | 46 (10.7%) |
| Bachelor's Degree or higher | 250 (85.3%) | 43 (14.7%) |
Occupancy by Age of Householder in Freeland
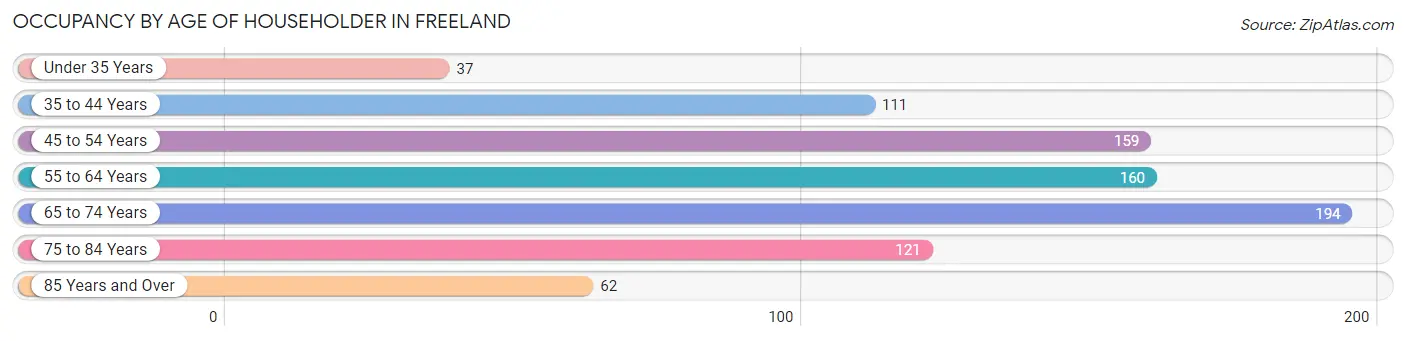
| Age Bracket | # Households | % Households |
| Under 35 Years | 37 | 4.4% |
| 35 to 44 Years | 111 | 13.2% |
| 45 to 54 Years | 159 | 18.8% |
| 55 to 64 Years | 160 | 19.0% |
| 65 to 74 Years | 194 | 23.0% |
| 75 to 84 Years | 121 | 14.3% |
| 85 Years and Over | 62 | 7.3% |
| Total | 844 | 100.0% |
Housing Finances in Freeland
Median Income by Occupancy in Freeland
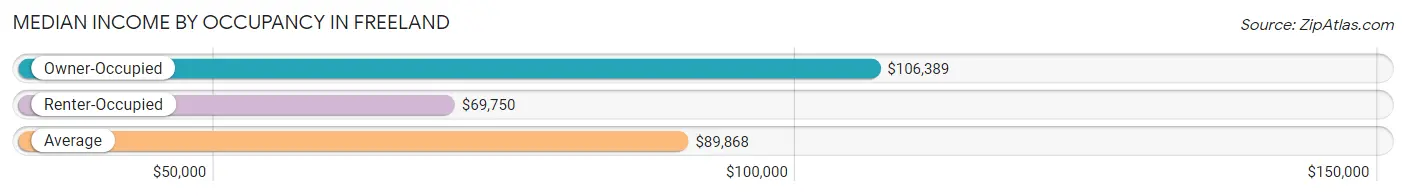
| Occupancy Type | # Households | Median Income |
| Owner-Occupied | 732 (86.7%) | $106,389 |
| Renter-Occupied | 112 (13.3%) | $69,750 |
| Average | 844 (100.0%) | $89,868 |
Occupancy by Householder Income Bracket in Freeland
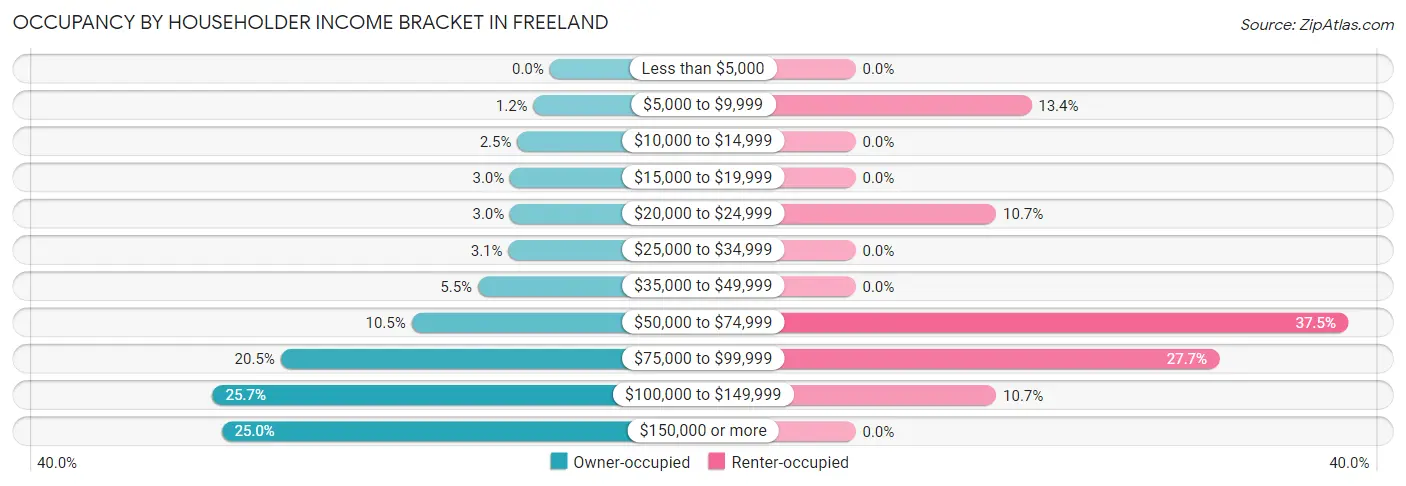
| Income Bracket | Owner-occupied | Renter-occupied |
| Less than $5,000 | 0 (0.0%) | 0 (0.0%) |
| $5,000 to $9,999 | 9 (1.2%) | 15 (13.4%) |
| $10,000 to $14,999 | 18 (2.5%) | 0 (0.0%) |
| $15,000 to $19,999 | 22 (3.0%) | 0 (0.0%) |
| $20,000 to $24,999 | 22 (3.0%) | 12 (10.7%) |
| $25,000 to $34,999 | 23 (3.1%) | 0 (0.0%) |
| $35,000 to $49,999 | 40 (5.5%) | 0 (0.0%) |
| $50,000 to $74,999 | 77 (10.5%) | 42 (37.5%) |
| $75,000 to $99,999 | 150 (20.5%) | 31 (27.7%) |
| $100,000 to $149,999 | 188 (25.7%) | 12 (10.7%) |
| $150,000 or more | 183 (25.0%) | 0 (0.0%) |
| Total | 732 (100.0%) | 112 (100.0%) |
Monthly Housing Cost Tiers in Freeland
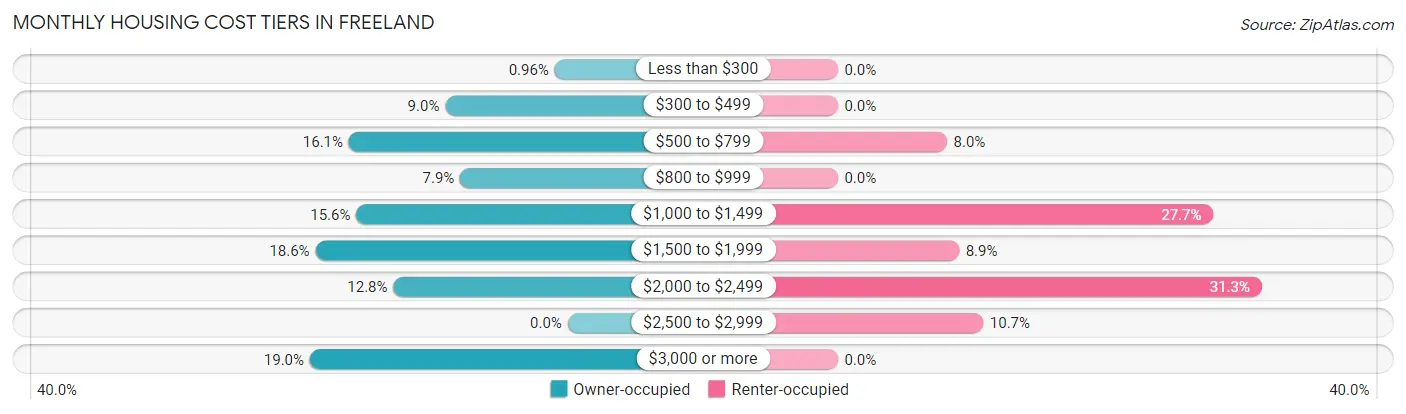
| Monthly Cost | Owner-occupied | Renter-occupied |
| Less than $300 | 7 (1.0%) | 0 (0.0%) |
| $300 to $499 | 66 (9.0%) | 0 (0.0%) |
| $500 to $799 | 118 (16.1%) | 9 (8.0%) |
| $800 to $999 | 58 (7.9%) | 0 (0.0%) |
| $1,000 to $1,499 | 114 (15.6%) | 31 (27.7%) |
| $1,500 to $1,999 | 136 (18.6%) | 10 (8.9%) |
| $2,000 to $2,499 | 94 (12.8%) | 35 (31.2%) |
| $2,500 to $2,999 | 0 (0.0%) | 12 (10.7%) |
| $3,000 or more | 139 (19.0%) | 0 (0.0%) |
| Total | 732 (100.0%) | 112 (100.0%) |
Physical Housing Characteristics in Freeland
Housing Structures in Freeland
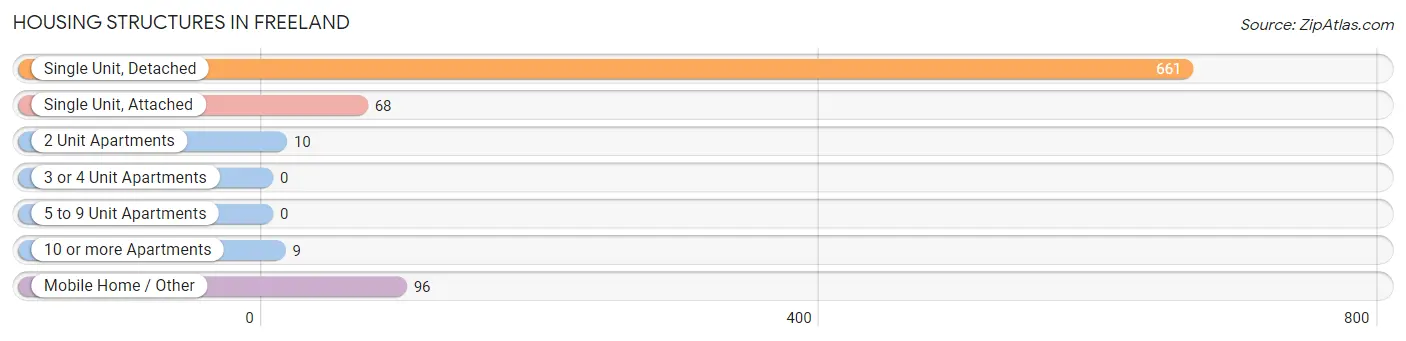
| Structure Type | # Housing Units | % Housing Units |
| Single Unit, Detached | 661 | 78.3% |
| Single Unit, Attached | 68 | 8.1% |
| 2 Unit Apartments | 10 | 1.2% |
| 3 or 4 Unit Apartments | 0 | 0.0% |
| 5 to 9 Unit Apartments | 0 | 0.0% |
| 10 or more Apartments | 9 | 1.1% |
| Mobile Home / Other | 96 | 11.4% |
| Total | 844 | 100.0% |
Housing Structures by Occupancy in Freeland
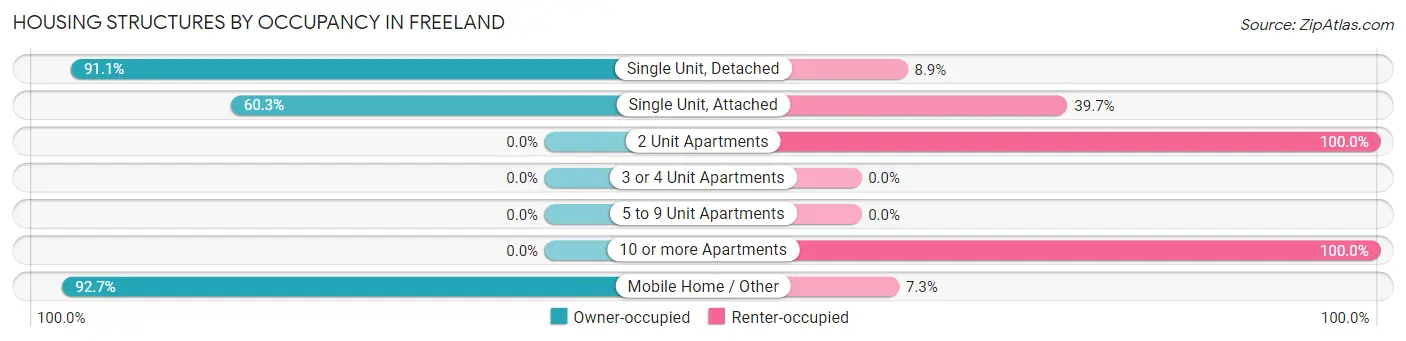
| Structure Type | Owner-occupied | Renter-occupied |
| Single Unit, Detached | 602 (91.1%) | 59 (8.9%) |
| Single Unit, Attached | 41 (60.3%) | 27 (39.7%) |
| 2 Unit Apartments | 0 (0.0%) | 10 (100.0%) |
| 3 or 4 Unit Apartments | 0 (0.0%) | 0 (0.0%) |
| 5 to 9 Unit Apartments | 0 (0.0%) | 0 (0.0%) |
| 10 or more Apartments | 0 (0.0%) | 9 (100.0%) |
| Mobile Home / Other | 89 (92.7%) | 7 (7.3%) |
| Total | 732 (86.7%) | 112 (13.3%) |
Housing Structures by Number of Rooms in Freeland
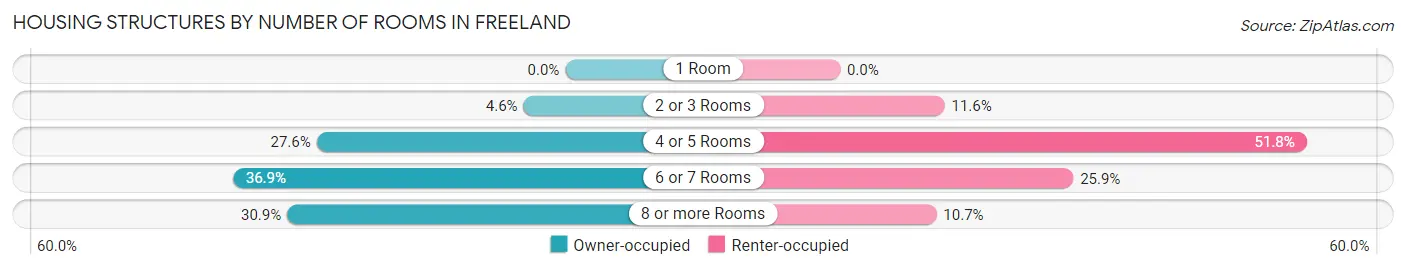
| Number of Rooms | Owner-occupied | Renter-occupied |
| 1 Room | 0 (0.0%) | 0 (0.0%) |
| 2 or 3 Rooms | 34 (4.6%) | 13 (11.6%) |
| 4 or 5 Rooms | 202 (27.6%) | 58 (51.8%) |
| 6 or 7 Rooms | 270 (36.9%) | 29 (25.9%) |
| 8 or more Rooms | 226 (30.9%) | 12 (10.7%) |
| Total | 732 (100.0%) | 112 (100.0%) |
Housing Structure by Heating Type in Freeland
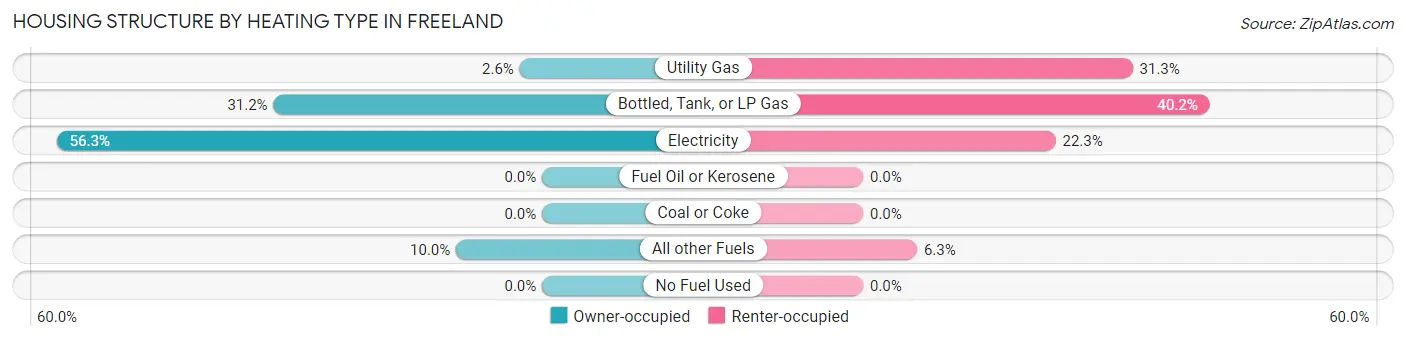
| Heating Type | Owner-occupied | Renter-occupied |
| Utility Gas | 19 (2.6%) | 35 (31.2%) |
| Bottled, Tank, or LP Gas | 228 (31.1%) | 45 (40.2%) |
| Electricity | 412 (56.3%) | 25 (22.3%) |
| Fuel Oil or Kerosene | 0 (0.0%) | 0 (0.0%) |
| Coal or Coke | 0 (0.0%) | 0 (0.0%) |
| All other Fuels | 73 (10.0%) | 7 (6.2%) |
| No Fuel Used | 0 (0.0%) | 0 (0.0%) |
| Total | 732 (100.0%) | 112 (100.0%) |
Household Vehicle Usage in Freeland
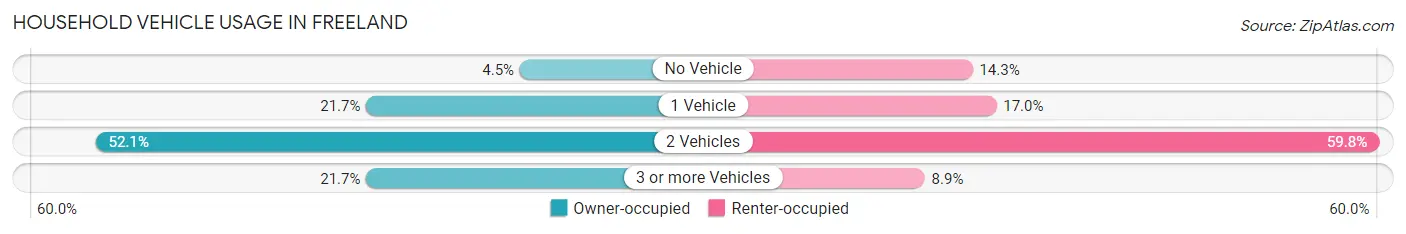
| Vehicles per Household | Owner-occupied | Renter-occupied |
| No Vehicle | 33 (4.5%) | 16 (14.3%) |
| 1 Vehicle | 159 (21.7%) | 19 (17.0%) |
| 2 Vehicles | 381 (52.0%) | 67 (59.8%) |
| 3 or more Vehicles | 159 (21.7%) | 10 (8.9%) |
| Total | 732 (100.0%) | 112 (100.0%) |
Real Estate & Mortgages in Freeland
Real Estate and Mortgage Overview in Freeland
| Characteristic | Without Mortgage | With Mortgage |
| Housing Units | 237 | 495 |
| Median Property Value | $523,900 | $440,500 |
| Median Household Income | $71,875 | $176 |
| Monthly Housing Costs | $643 | $139 |
| Real Estate Taxes | $3,021 | $0 |
Property Value by Mortgage Status in Freeland
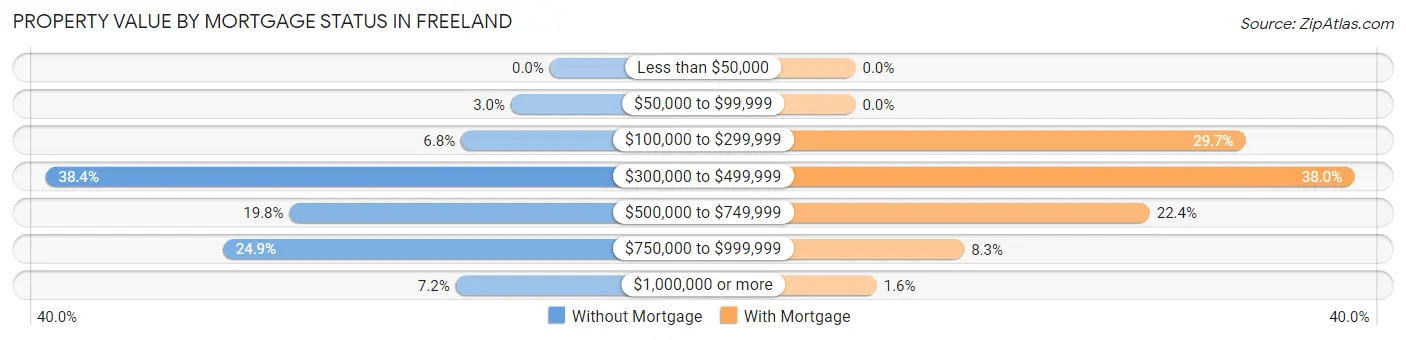
| Property Value | Without Mortgage | With Mortgage |
| Less than $50,000 | 0 (0.0%) | 0 (0.0%) |
| $50,000 to $99,999 | 7 (2.9%) | 0 (0.0%) |
| $100,000 to $299,999 | 16 (6.8%) | 147 (29.7%) |
| $300,000 to $499,999 | 91 (38.4%) | 188 (38.0%) |
| $500,000 to $749,999 | 47 (19.8%) | 111 (22.4%) |
| $750,000 to $999,999 | 59 (24.9%) | 41 (8.3%) |
| $1,000,000 or more | 17 (7.2%) | 8 (1.6%) |
| Total | 237 (100.0%) | 495 (100.0%) |
Household Income by Mortgage Status in Freeland
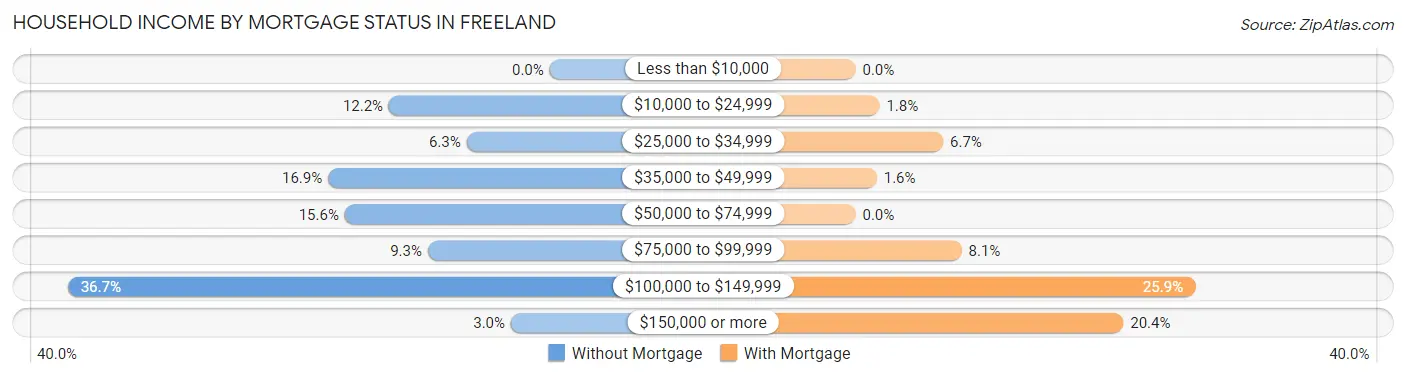
| Household Income | Without Mortgage | With Mortgage |
| Less than $10,000 | 0 (0.0%) | 0 (0.0%) |
| $10,000 to $24,999 | 29 (12.2%) | 9 (1.8%) |
| $25,000 to $34,999 | 15 (6.3%) | 33 (6.7%) |
| $35,000 to $49,999 | 40 (16.9%) | 8 (1.6%) |
| $50,000 to $74,999 | 37 (15.6%) | 0 (0.0%) |
| $75,000 to $99,999 | 22 (9.3%) | 40 (8.1%) |
| $100,000 to $149,999 | 87 (36.7%) | 128 (25.9%) |
| $150,000 or more | 7 (2.9%) | 101 (20.4%) |
| Total | 237 (100.0%) | 495 (100.0%) |
Property Value to Household Income Ratio in Freeland
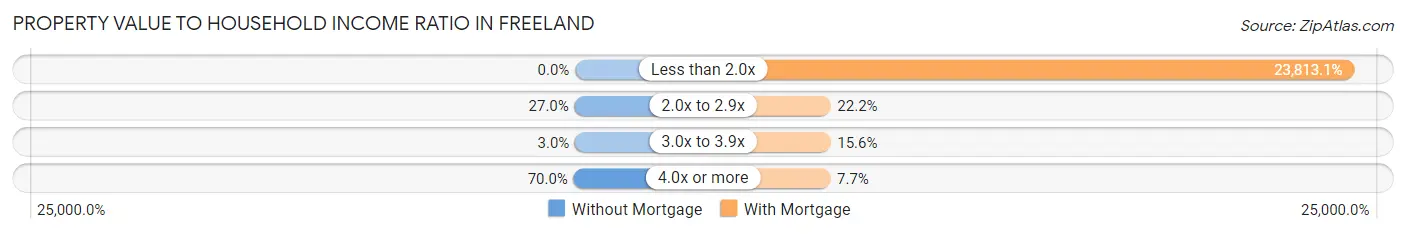
| Value-to-Income Ratio | Without Mortgage | With Mortgage |
| Less than 2.0x | 0 (0.0%) | 117,875 (23,813.1%) |
| 2.0x to 2.9x | 64 (27.0%) | 110 (22.2%) |
| 3.0x to 3.9x | 7 (2.9%) | 77 (15.6%) |
| 4.0x or more | 166 (70.0%) | 38 (7.7%) |
| Total | 237 (100.0%) | 495 (100.0%) |
Real Estate Taxes by Mortgage Status in Freeland
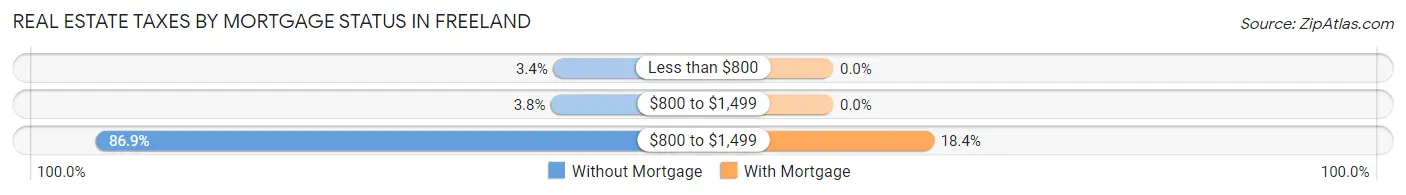
| Property Taxes | Without Mortgage | With Mortgage |
| Less than $800 | 8 (3.4%) | 0 (0.0%) |
| $800 to $1,499 | 9 (3.8%) | 0 (0.0%) |
| $800 to $1,499 | 206 (86.9%) | 91 (18.4%) |
| Total | 237 (100.0%) | 495 (100.0%) |
Health & Disability in Freeland
Health Insurance Coverage by Age in Freeland
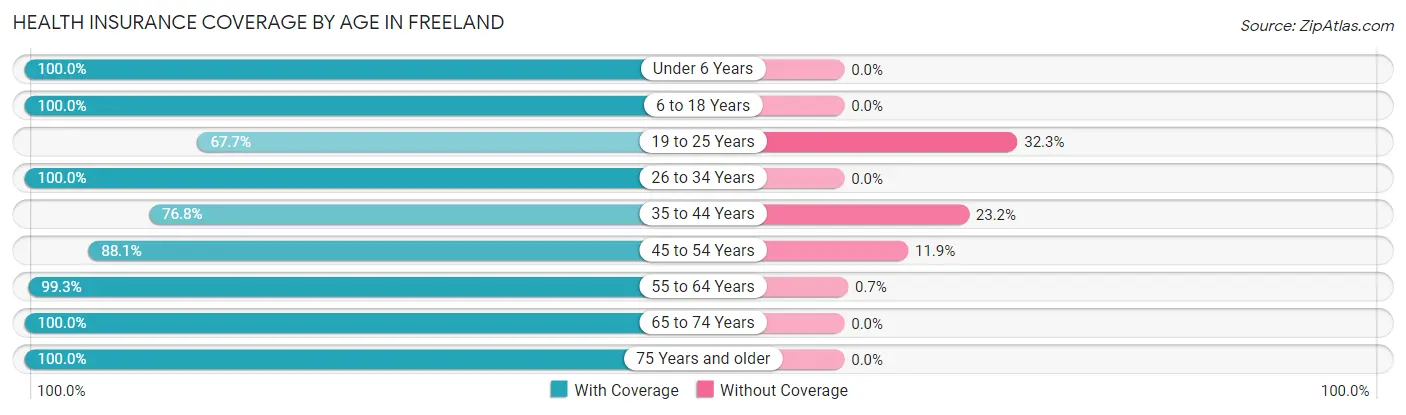
| Age Bracket | With Coverage | Without Coverage |
| Under 6 Years | 61 (100.0%) | 0 (0.0%) |
| 6 to 18 Years | 290 (100.0%) | 0 (0.0%) |
| 19 to 25 Years | 84 (67.7%) | 40 (32.3%) |
| 26 to 34 Years | 103 (100.0%) | 0 (0.0%) |
| 35 to 44 Years | 195 (76.8%) | 59 (23.2%) |
| 45 to 54 Years | 200 (88.1%) | 27 (11.9%) |
| 55 to 64 Years | 285 (99.3%) | 2 (0.7%) |
| 65 to 74 Years | 330 (100.0%) | 0 (0.0%) |
| 75 Years and older | 218 (100.0%) | 0 (0.0%) |
| Total | 1,766 (93.2%) | 128 (6.8%) |
Health Insurance Coverage by Citizenship Status in Freeland
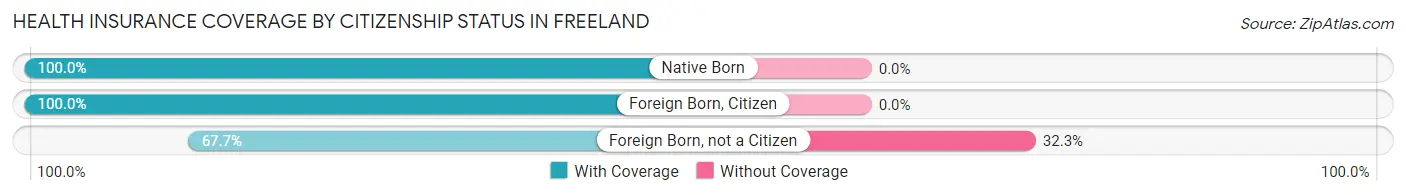
| Citizenship Status | With Coverage | Without Coverage |
| Native Born | 61 (100.0%) | 0 (0.0%) |
| Foreign Born, Citizen | 290 (100.0%) | 0 (0.0%) |
| Foreign Born, not a Citizen | 84 (67.7%) | 40 (32.3%) |
Health Insurance Coverage by Household Income in Freeland
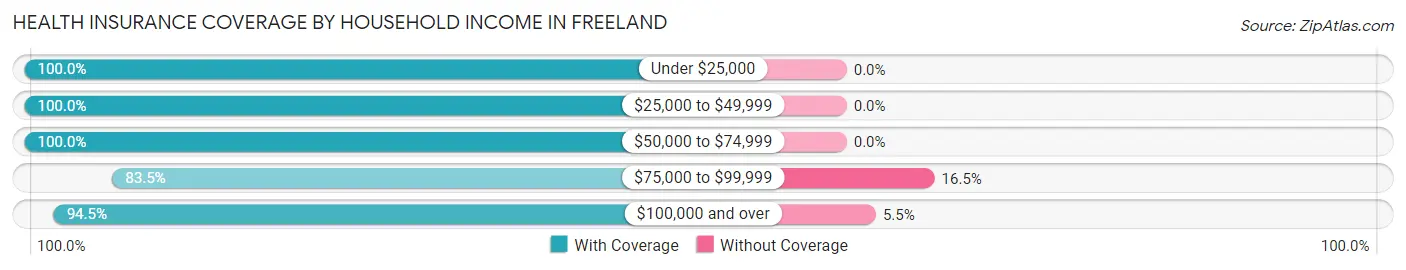
| Household Income | With Coverage | Without Coverage |
| Under $25,000 | 105 (100.0%) | 0 (0.0%) |
| $25,000 to $49,999 | 83 (100.0%) | 0 (0.0%) |
| $50,000 to $74,999 | 184 (100.0%) | 0 (0.0%) |
| $75,000 to $99,999 | 340 (83.5%) | 67 (16.5%) |
| $100,000 and over | 1,054 (94.5%) | 61 (5.5%) |
Public vs Private Health Insurance Coverage by Age in Freeland
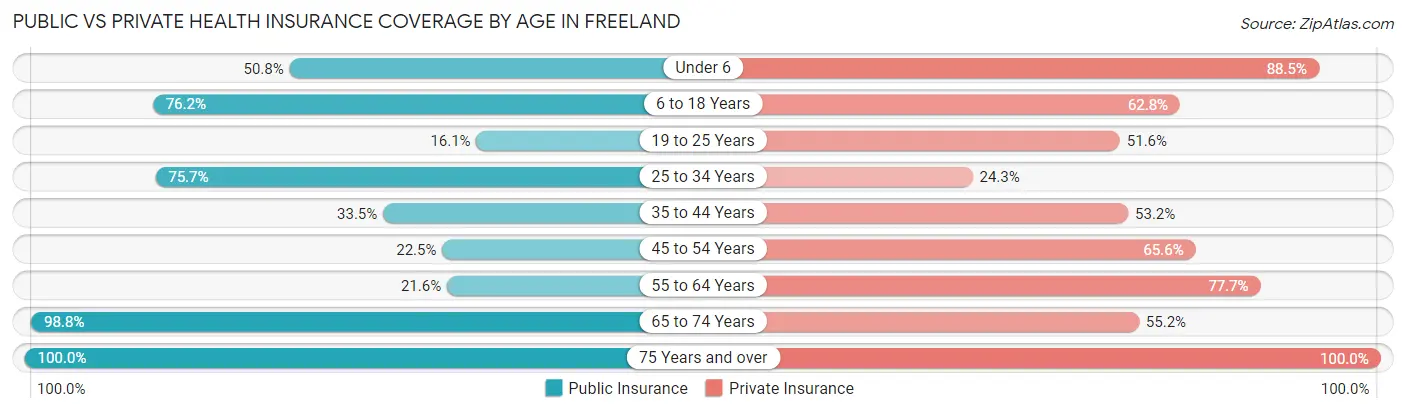
| Age Bracket | Public Insurance | Private Insurance |
| Under 6 | 31 (50.8%) | 54 (88.5%) |
| 6 to 18 Years | 221 (76.2%) | 182 (62.8%) |
| 19 to 25 Years | 20 (16.1%) | 64 (51.6%) |
| 25 to 34 Years | 78 (75.7%) | 25 (24.3%) |
| 35 to 44 Years | 85 (33.5%) | 135 (53.1%) |
| 45 to 54 Years | 51 (22.5%) | 149 (65.6%) |
| 55 to 64 Years | 62 (21.6%) | 223 (77.7%) |
| 65 to 74 Years | 326 (98.8%) | 182 (55.1%) |
| 75 Years and over | 218 (100.0%) | 218 (100.0%) |
| Total | 1,092 (57.7%) | 1,232 (65.0%) |
Disability Status by Sex by Age in Freeland
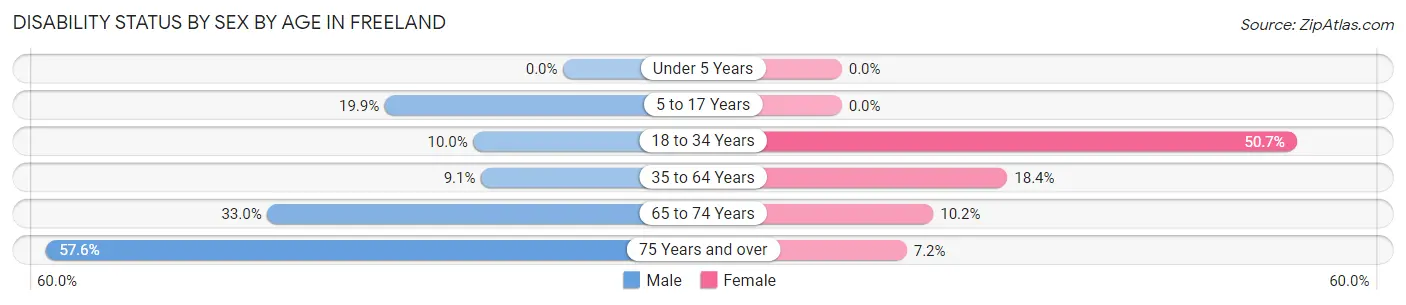
| Age Bracket | Male | Female |
| Under 5 Years | 0 (0.0%) | 0 (0.0%) |
| 5 to 17 Years | 28 (19.9%) | 0 (0.0%) |
| 18 to 34 Years | 15 (10.0%) | 39 (50.6%) |
| 35 to 64 Years | 35 (9.1%) | 71 (18.4%) |
| 65 to 74 Years | 57 (33.0%) | 16 (10.2%) |
| 75 Years and over | 38 (57.6%) | 11 (7.2%) |
Disability Class by Sex by Age in Freeland
Disability Class: Hearing Difficulty
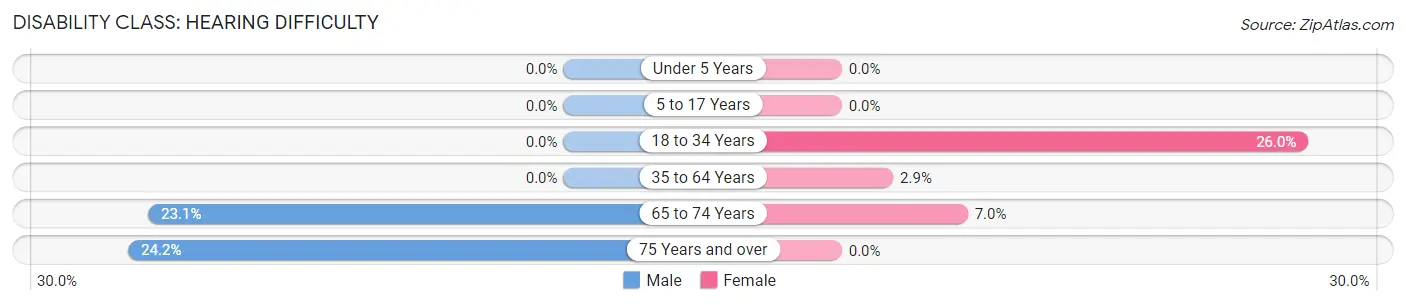
| Age Bracket | Male | Female |
| Under 5 Years | 0 (0.0%) | 0 (0.0%) |
| 5 to 17 Years | 0 (0.0%) | 0 (0.0%) |
| 18 to 34 Years | 0 (0.0%) | 20 (26.0%) |
| 35 to 64 Years | 0 (0.0%) | 11 (2.9%) |
| 65 to 74 Years | 40 (23.1%) | 11 (7.0%) |
| 75 Years and over | 16 (24.2%) | 0 (0.0%) |
Disability Class: Vision Difficulty
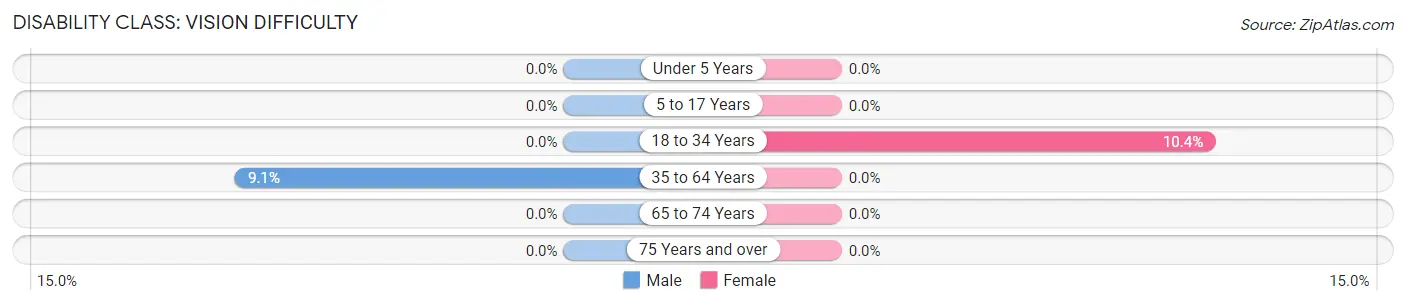
| Age Bracket | Male | Female |
| Under 5 Years | 0 (0.0%) | 0 (0.0%) |
| 5 to 17 Years | 0 (0.0%) | 0 (0.0%) |
| 18 to 34 Years | 0 (0.0%) | 8 (10.4%) |
| 35 to 64 Years | 35 (9.1%) | 0 (0.0%) |
| 65 to 74 Years | 0 (0.0%) | 0 (0.0%) |
| 75 Years and over | 0 (0.0%) | 0 (0.0%) |
Disability Class: Cognitive Difficulty
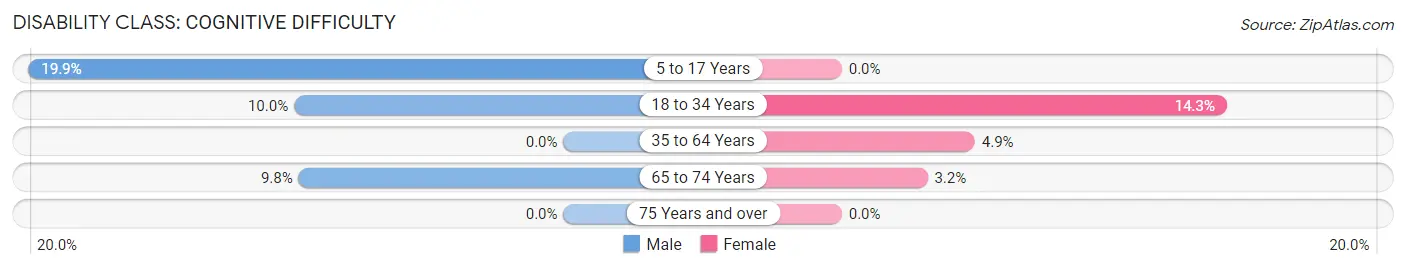
| Age Bracket | Male | Female |
| 5 to 17 Years | 28 (19.9%) | 0 (0.0%) |
| 18 to 34 Years | 15 (10.0%) | 11 (14.3%) |
| 35 to 64 Years | 0 (0.0%) | 19 (4.9%) |
| 65 to 74 Years | 17 (9.8%) | 5 (3.2%) |
| 75 Years and over | 0 (0.0%) | 0 (0.0%) |
Disability Class: Ambulatory Difficulty
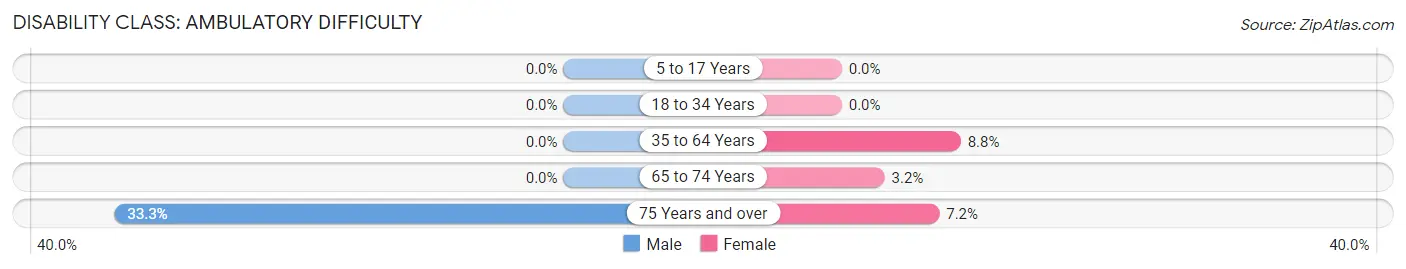
| Age Bracket | Male | Female |
| 5 to 17 Years | 0 (0.0%) | 0 (0.0%) |
| 18 to 34 Years | 0 (0.0%) | 0 (0.0%) |
| 35 to 64 Years | 0 (0.0%) | 34 (8.8%) |
| 65 to 74 Years | 0 (0.0%) | 5 (3.2%) |
| 75 Years and over | 22 (33.3%) | 11 (7.2%) |
Disability Class: Self-Care Difficulty
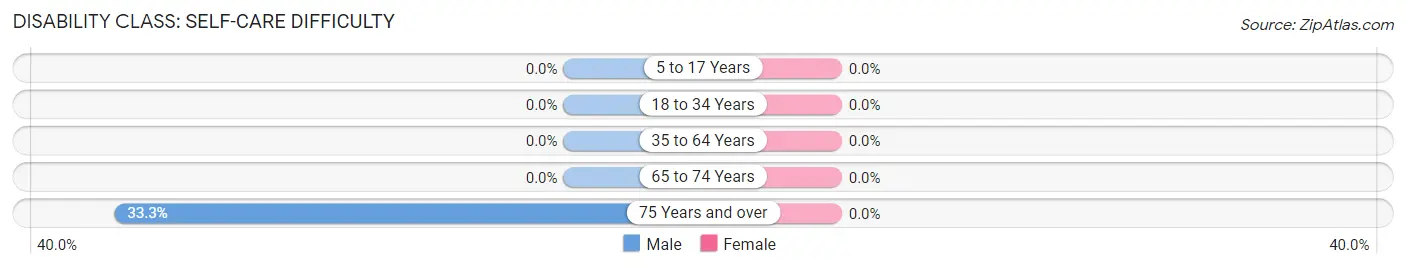
| Age Bracket | Male | Female |
| 5 to 17 Years | 0 (0.0%) | 0 (0.0%) |
| 18 to 34 Years | 0 (0.0%) | 0 (0.0%) |
| 35 to 64 Years | 0 (0.0%) | 0 (0.0%) |
| 65 to 74 Years | 0 (0.0%) | 0 (0.0%) |
| 75 Years and over | 22 (33.3%) | 0 (0.0%) |
Technology Access in Freeland
Computing Device Access in Freeland
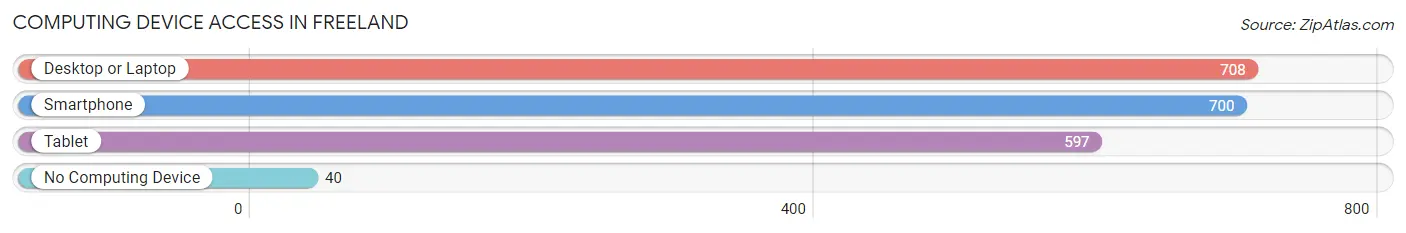
| Device Type | # Households | % Households |
| Desktop or Laptop | 708 | 83.9% |
| Smartphone | 700 | 82.9% |
| Tablet | 597 | 70.7% |
| No Computing Device | 40 | 4.7% |
| Total | 844 | 100.0% |
Internet Access in Freeland
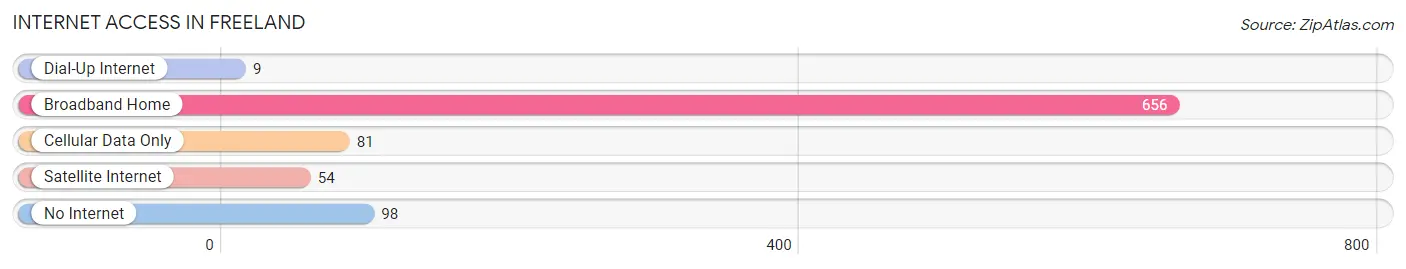
| Internet Type | # Households | % Households |
| Dial-Up Internet | 9 | 1.1% |
| Broadband Home | 656 | 77.7% |
| Cellular Data Only | 81 | 9.6% |
| Satellite Internet | 54 | 6.4% |
| No Internet | 98 | 11.6% |
| Total | 844 | 100.0% |
Freeland Summary
Freeland, WA is a small unincorporated community located on Whidbey Island in Island County, Washington. It is situated on the south end of the island, approximately 25 miles north of Seattle. The population of Freeland was 1,876 at the 2010 census.
History
The area now known as Freeland was first settled in the late 1800s by homesteaders. The first post office was established in 1891 and the town was officially incorporated in 1909. The name Freeland was chosen to reflect the area’s independent spirit and the freedom of its citizens.
In the early 1900s, Freeland was a thriving logging and fishing community. The town was home to several sawmills, a cannery, and a fish hatchery. The town also had a hotel, a general store, and a school.
In the 1950s, Freeland began to experience a decline in its economy. The sawmills and cannery closed, and the fish hatchery was relocated. The town’s population began to decline as well, and by the 1970s, Freeland had become a small, quiet community.
Geography
Freeland is located on the south end of Whidbey Island, approximately 25 miles north of Seattle. The town is situated on a small peninsula, surrounded by the waters of Holmes Harbor, Mutiny Bay, and Saratoga Passage.
The town is bordered by the cities of Clinton to the north and Langley to the south. The nearest major city is Everett, which is located approximately 30 miles to the east.
The terrain of Freeland is mostly flat, with some rolling hills. The area is heavily forested, with Douglas fir, western hemlock, and western red cedar trees dominating the landscape.
Economy
Freeland’s economy is largely based on tourism and the service industry. The town is home to several restaurants, cafes, and shops, as well as a marina and a public beach.
The town is also home to several small businesses, including a winery, a brewery, and a distillery. The town is also home to a number of art galleries and studios.
Demographics
As of the 2010 census, the population of Freeland was 1,876. The racial makeup of the town was 91.3% White, 2.2% Native American, 1.2% Asian, 0.7% African American, 0.2% Pacific Islander, and 4.6% from other races.
The median household income in Freeland was $50,938, and the median family income was $60,938. The per capita income was $25,938.
Conclusion
Freeland, WA is a small unincorporated community located on Whidbey Island in Island County, Washington. It is situated on the south end of the island, approximately 25 miles north of Seattle. The population of Freeland was 1,876 at the 2010 census. The town’s economy is largely based on tourism and the service industry, and the town is home to several restaurants, cafes, and shops, as well as a marina and a public beach. The racial makeup of the town was 91.3% White, 2.2% Native American, 1.2% Asian, 0.7% African American, 0.2% Pacific Islander, and 4.6% from other races. The median household income in Freeland was $50,938, and the median family income was $60,938. The per capita income was $25,938.
Common Questions
What is Per Capita Income in Freeland?
Per Capita income in Freeland is $50,773.
What is the Median Family Income in Freeland?
Median Family Income in Freeland is $119,833.
What is the Median Household income in Freeland?
Median Household Income in Freeland is $89,868.
What is Income or Wage Gap in Freeland?
Income or Wage Gap in Freeland is 60.9%.
Women in Freeland earn 39.1 cents for every dollar earned by a man.
What is Inequality or Gini Index in Freeland?
Inequality or Gini Index in Freeland is 0.38.
What is the Total Population of Freeland?
Total Population of Freeland is 1,894.
What is the Total Male Population of Freeland?
Total Male Population of Freeland is 962.
What is the Total Female Population of Freeland?
Total Female Population of Freeland is 932.
What is the Ratio of Males per 100 Females in Freeland?
There are 103.22 Males per 100 Females in Freeland.
What is the Ratio of Females per 100 Males in Freeland?
There are 96.88 Females per 100 Males in Freeland.
What is the Median Population Age in Freeland?
Median Population Age in Freeland is 51.2 Years.
What is the Average Family Size in Freeland
Average Family Size in Freeland is 3.2 People.
What is the Average Household Size in Freeland
Average Household Size in Freeland is 2.2 People.
How Large is the Labor Force in Freeland?
There are 798 People in the Labor Forcein in Freeland.
What is the Percentage of People in the Labor Force in Freeland?
50.0% of People are in the Labor Force in Freeland.
What is the Unemployment Rate in Freeland?
Unemployment Rate in Freeland is 9.8%.