Wellston, MI Map & Demographics
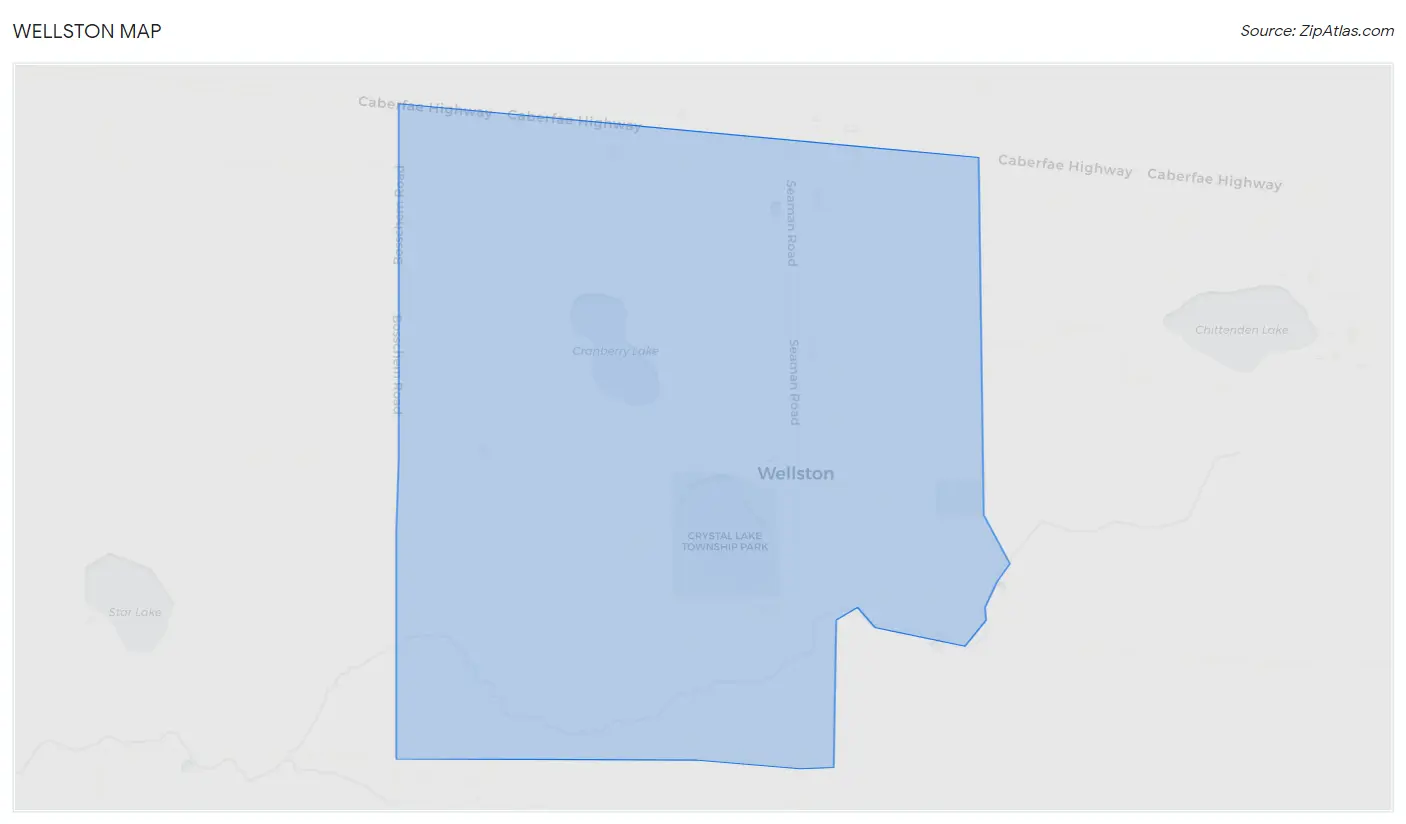
Wellston Map
Wellston Overview
$21,118
PER CAPITA INCOME
$57,500
AVG FAMILY INCOME
$35,156
AVG HOUSEHOLD INCOME
32.5%
WAGE / INCOME GAP [ % ]
67.5¢/ $1
WAGE / INCOME GAP [ $ ]
0.51
INEQUALITY / GINI INDEX
224
TOTAL POPULATION
117
MALE POPULATION
107
FEMALE POPULATION
109.35
MALES / 100 FEMALES
91.45
FEMALES / 100 MALES
48.0
MEDIAN AGE
3.2
AVG FAMILY SIZE
2.2
AVG HOUSEHOLD SIZE
75
LABOR FORCE [ PEOPLE ]
37.3%
PERCENT IN LABOR FORCE
Wellston Zip Codes
Wellston Area Codes
Income in Wellston
Income Overview in Wellston
Per Capita Income in Wellston is $21,118, while median incomes of families and households are $57,500 and $35,156 respectively.
| Characteristic | Number | Measure |
| Per Capita Income | 224 | $21,118 |
| Median Family Income | 42 | $57,500 |
| Mean Family Income | 42 | $65,007 |
| Median Household Income | 101 | $35,156 |
| Mean Household Income | 101 | $43,649 |
| Income Deficit | 42 | $0 |
| Wage / Income Gap (%) | 224 | 32.52% |
| Wage / Income Gap ($) | 224 | 67.48¢ per $1 |
| Gini / Inequality Index | 224 | 0.51 |
Earnings by Sex in Wellston
Average Earnings in Wellston are $31,875, $24,583 for men and $36,429 for women, a difference of 32.5%.
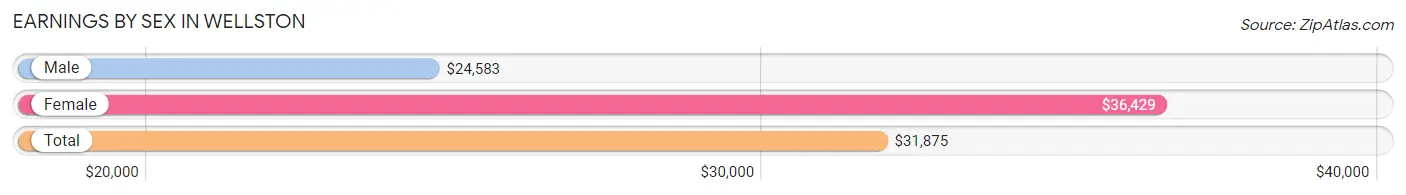
| Sex | Number | Average Earnings |
| Male | 47 (58.0%) | $24,583 |
| Female | 34 (42.0%) | $36,429 |
| Total | 81 (100.0%) | $31,875 |
Earnings by Sex by Income Bracket in Wellston
The most common earnings brackets in Wellston are $2,499 or less for men (12 | 25.5%) and $65,000 to $74,999 for women (11 | 32.4%).
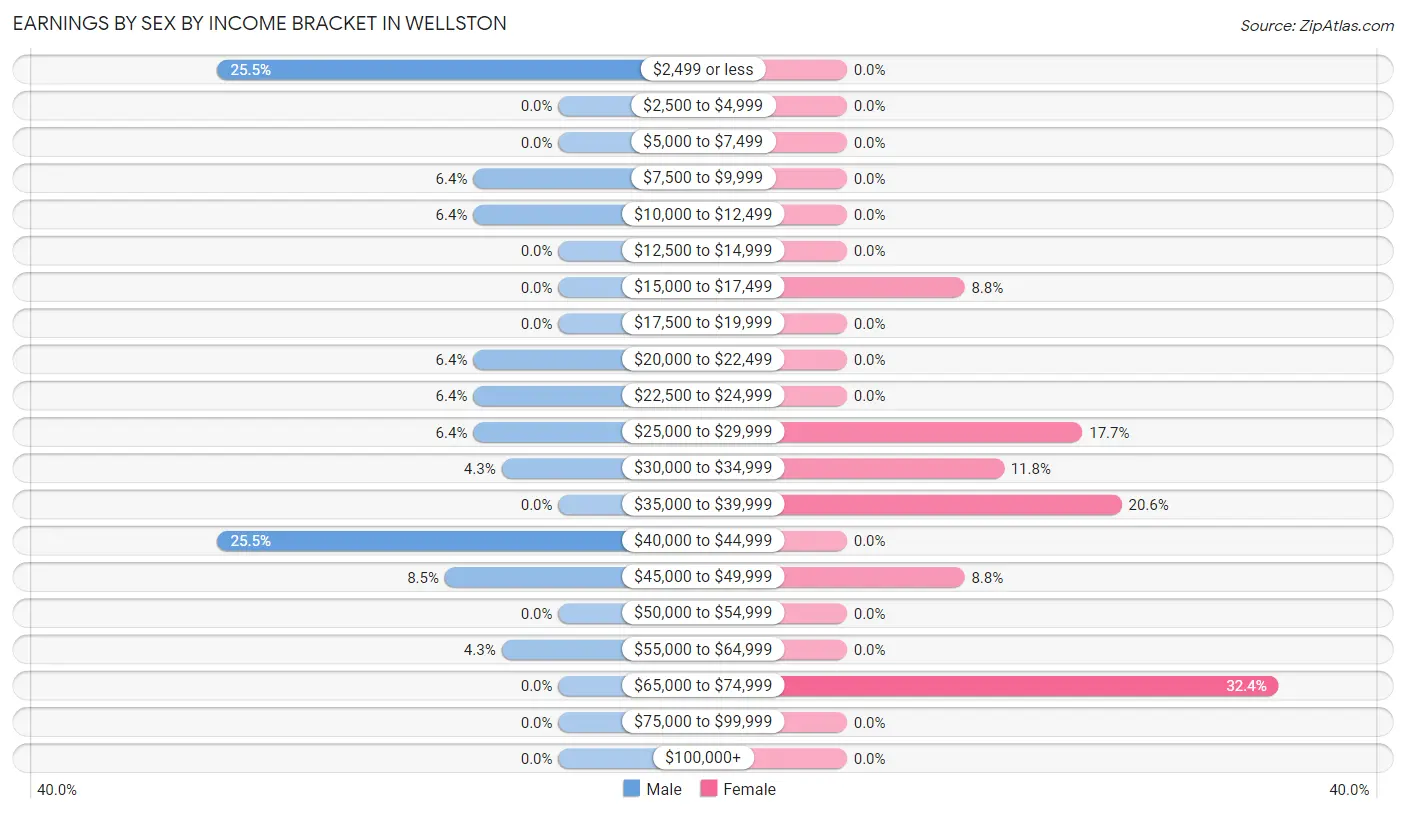
| Income | Male | Female |
| $2,499 or less | 12 (25.5%) | 0 (0.0%) |
| $2,500 to $4,999 | 0 (0.0%) | 0 (0.0%) |
| $5,000 to $7,499 | 0 (0.0%) | 0 (0.0%) |
| $7,500 to $9,999 | 3 (6.4%) | 0 (0.0%) |
| $10,000 to $12,499 | 3 (6.4%) | 0 (0.0%) |
| $12,500 to $14,999 | 0 (0.0%) | 0 (0.0%) |
| $15,000 to $17,499 | 0 (0.0%) | 3 (8.8%) |
| $17,500 to $19,999 | 0 (0.0%) | 0 (0.0%) |
| $20,000 to $22,499 | 3 (6.4%) | 0 (0.0%) |
| $22,500 to $24,999 | 3 (6.4%) | 0 (0.0%) |
| $25,000 to $29,999 | 3 (6.4%) | 6 (17.6%) |
| $30,000 to $34,999 | 2 (4.3%) | 4 (11.8%) |
| $35,000 to $39,999 | 0 (0.0%) | 7 (20.6%) |
| $40,000 to $44,999 | 12 (25.5%) | 0 (0.0%) |
| $45,000 to $49,999 | 4 (8.5%) | 3 (8.8%) |
| $50,000 to $54,999 | 0 (0.0%) | 0 (0.0%) |
| $55,000 to $64,999 | 2 (4.3%) | 0 (0.0%) |
| $65,000 to $74,999 | 0 (0.0%) | 11 (32.4%) |
| $75,000 to $99,999 | 0 (0.0%) | 0 (0.0%) |
| $100,000+ | 0 (0.0%) | 0 (0.0%) |
| Total | 47 (100.0%) | 34 (100.0%) |
Earnings by Sex by Educational Attainment in Wellston
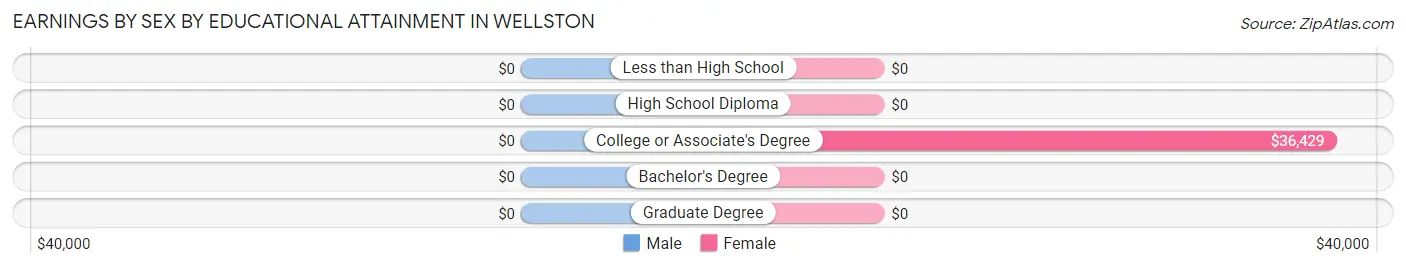
| Educational Attainment | Male Income | Female Income |
| Less than High School | - | - |
| High School Diploma | - | - |
| College or Associate's Degree | - | - |
| Bachelor's Degree | - | - |
| Graduate Degree | - | - |
| Total | - | - |
Family Income in Wellston
Family Income Brackets in Wellston
According to the Wellston family income data, there are 11 families falling into the $35,000 to $49,999 income range, which is the most common income bracket and makes up 26.2% of all families.
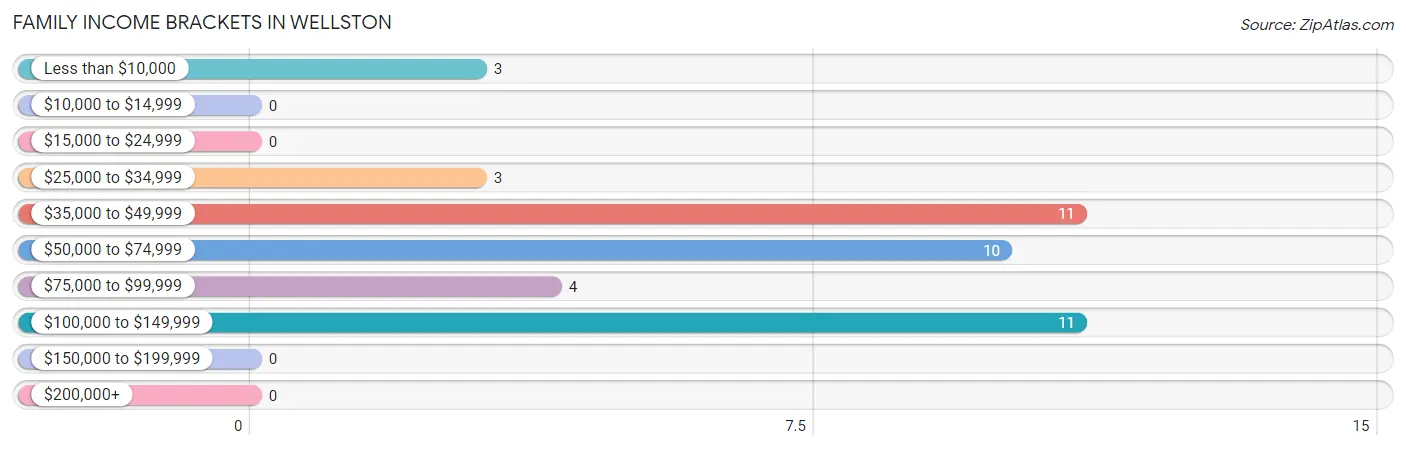
| Income Bracket | # Families | % Families |
| Less than $10,000 | 3 | 7.1% |
| $10,000 to $14,999 | 0 | 0.0% |
| $15,000 to $24,999 | 0 | 0.0% |
| $25,000 to $34,999 | 3 | 7.1% |
| $35,000 to $49,999 | 11 | 26.2% |
| $50,000 to $74,999 | 10 | 23.8% |
| $75,000 to $99,999 | 4 | 9.5% |
| $100,000 to $149,999 | 11 | 26.2% |
| $150,000 to $199,999 | 0 | 0.0% |
| $200,000+ | 0 | 0.0% |
Family Income by Famaliy Size in Wellston
4-person families (14 | 33.3%) account for the highest median family income in Wellston with $117,500 per family, while 4-person families (14 | 33.3%) have the highest median income of $29,375 per family member.
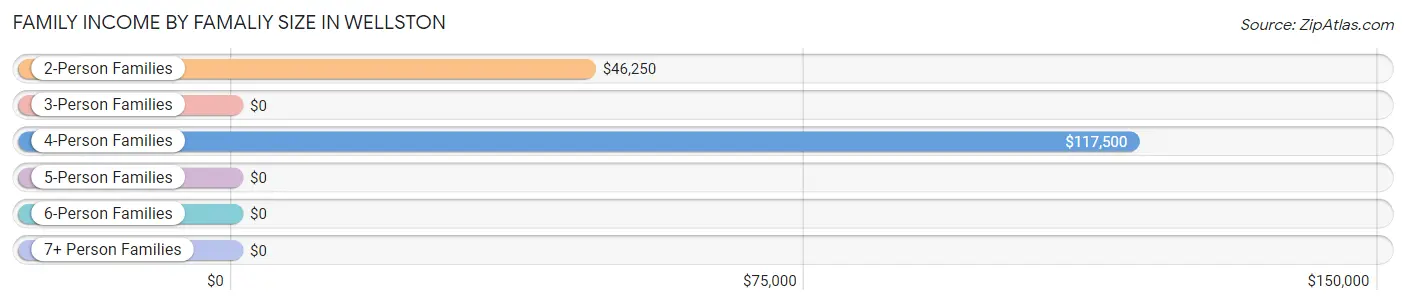
| Income Bracket | # Families | Median Income |
| 2-Person Families | 28 (66.7%) | $46,250 |
| 3-Person Families | 0 (0.0%) | $0 |
| 4-Person Families | 14 (33.3%) | $117,500 |
| 5-Person Families | 0 (0.0%) | $0 |
| 6-Person Families | 0 (0.0%) | $0 |
| 7+ Person Families | 0 (0.0%) | $0 |
| Total | 42 (100.0%) | $57,500 |
Family Income by Number of Earners in Wellston
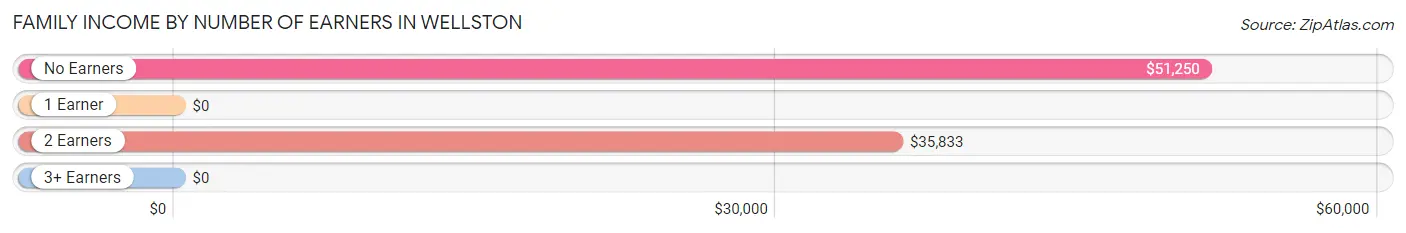
| Number of Earners | # Families | Median Income |
| No Earners | 16 (38.1%) | $51,250 |
| 1 Earner | 16 (38.1%) | $0 |
| 2 Earners | 10 (23.8%) | $35,833 |
| 3+ Earners | 0 (0.0%) | $0 |
| Total | 42 (100.0%) | $57,500 |
Household Income in Wellston
Household Income Brackets in Wellston
With 25 households falling in the category, the less than $10,000 income range is the most frequent in Wellston, accounting for 24.7% of all households.
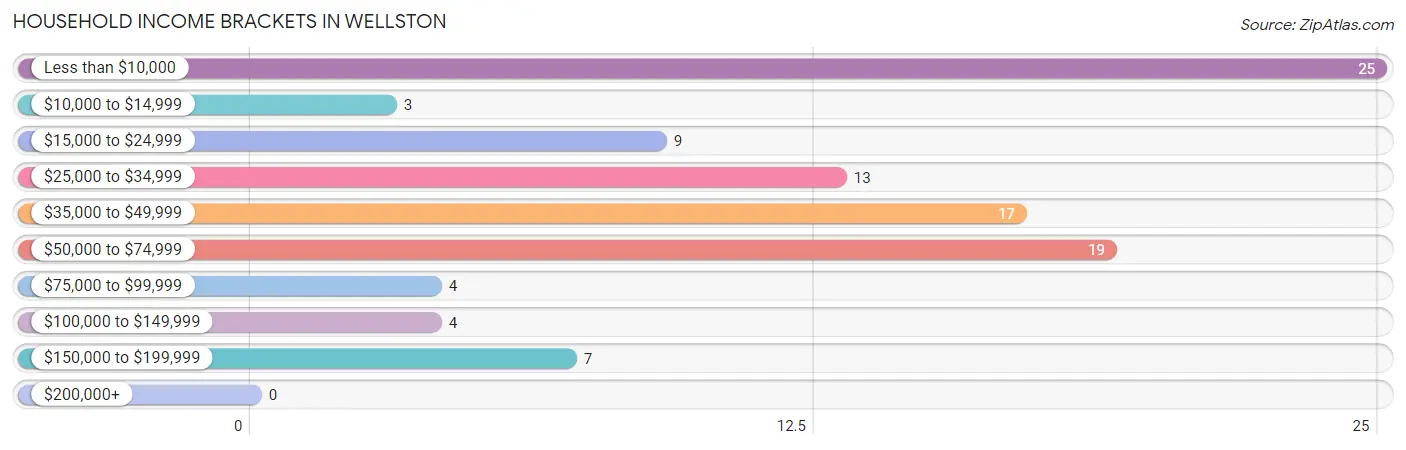
| Income Bracket | # Households | % Households |
| Less than $10,000 | 25 | 24.8% |
| $10,000 to $14,999 | 3 | 3.0% |
| $15,000 to $24,999 | 9 | 8.9% |
| $25,000 to $34,999 | 13 | 12.9% |
| $35,000 to $49,999 | 17 | 16.8% |
| $50,000 to $74,999 | 19 | 18.8% |
| $75,000 to $99,999 | 4 | 4.0% |
| $100,000 to $149,999 | 4 | 4.0% |
| $150,000 to $199,999 | 7 | 6.9% |
| $200,000+ | 0 | 0.0% |
Household Income by Householder Age in Wellston
The median household income in Wellston is $35,156, with the highest median household income of $36,250 found in the 45 to 64 years age bracket for the primary householder. A total of 54 households (53.5%) fall into this category.
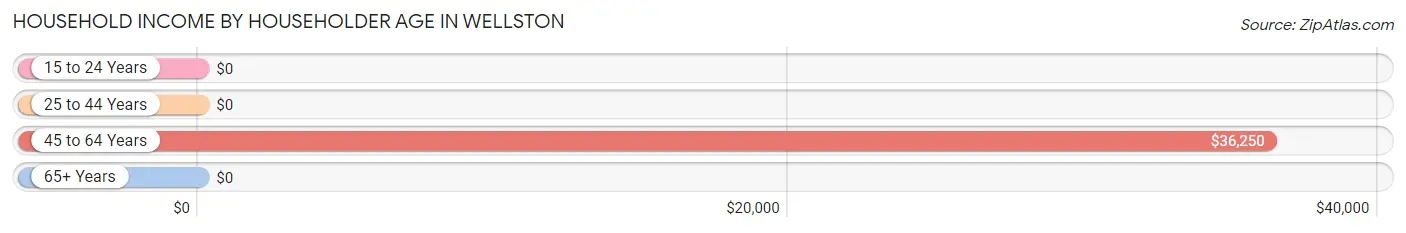
| Income Bracket | # Households | Median Income |
| 15 to 24 Years | 0 (0.0%) | $0 |
| 25 to 44 Years | 11 (10.9%) | $0 |
| 45 to 64 Years | 54 (53.5%) | $36,250 |
| 65+ Years | 36 (35.6%) | $0 |
| Total | 101 (100.0%) | $35,156 |
Poverty in Wellston
Income Below Poverty by Sex and Age in Wellston
With 23.9% poverty level for males and 15.9% for females among the residents of Wellston, 65 to 74 year old males and 25 to 34 year old females are the most vulnerable to poverty, with 11 males (57.9%) and 14 females (73.7%) in their respective age groups living below the poverty level.
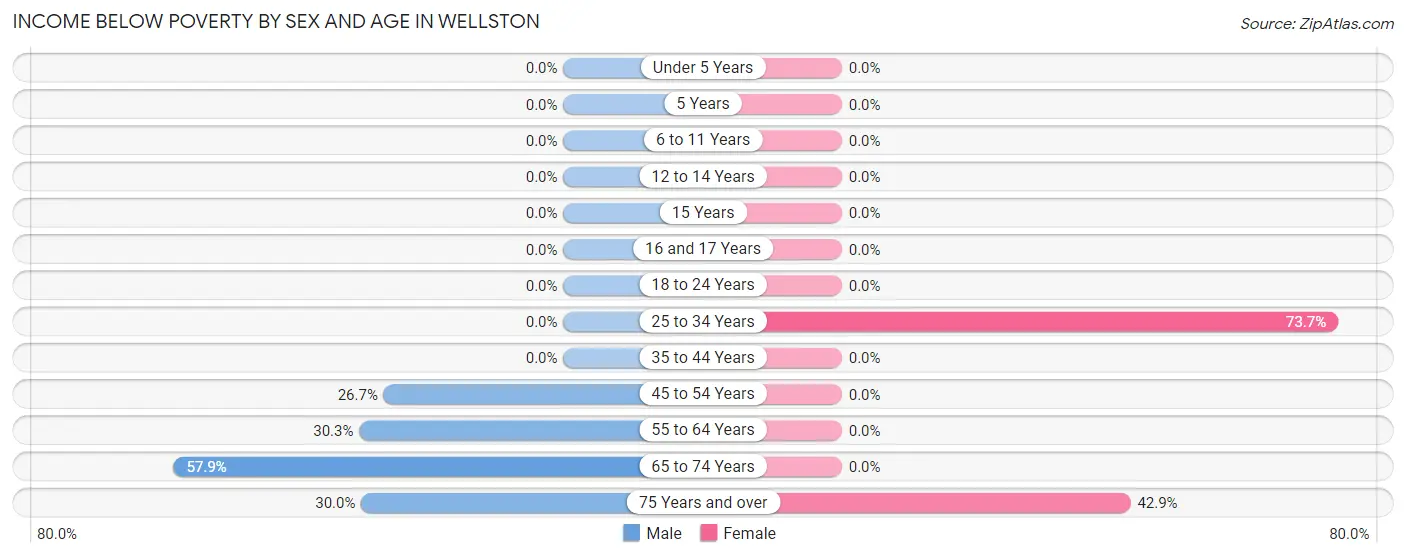
| Age Bracket | Male | Female |
| Under 5 Years | 0 (0.0%) | 0 (0.0%) |
| 5 Years | 0 (0.0%) | 0 (0.0%) |
| 6 to 11 Years | 0 (0.0%) | 0 (0.0%) |
| 12 to 14 Years | 0 (0.0%) | 0 (0.0%) |
| 15 Years | 0 (0.0%) | 0 (0.0%) |
| 16 and 17 Years | 0 (0.0%) | 0 (0.0%) |
| 18 to 24 Years | 0 (0.0%) | 0 (0.0%) |
| 25 to 34 Years | 0 (0.0%) | 14 (73.7%) |
| 35 to 44 Years | 0 (0.0%) | 0 (0.0%) |
| 45 to 54 Years | 4 (26.7%) | 0 (0.0%) |
| 55 to 64 Years | 10 (30.3%) | 0 (0.0%) |
| 65 to 74 Years | 11 (57.9%) | 0 (0.0%) |
| 75 Years and over | 3 (30.0%) | 3 (42.9%) |
| Total | 28 (23.9%) | 17 (15.9%) |
Income Above Poverty by Sex and Age in Wellston
According to the poverty statistics in Wellston, males aged 6 to 11 years and females aged 12 to 14 years are the age groups that are most secure financially, with 100.0% of males and 100.0% of females in these age groups living above the poverty line.
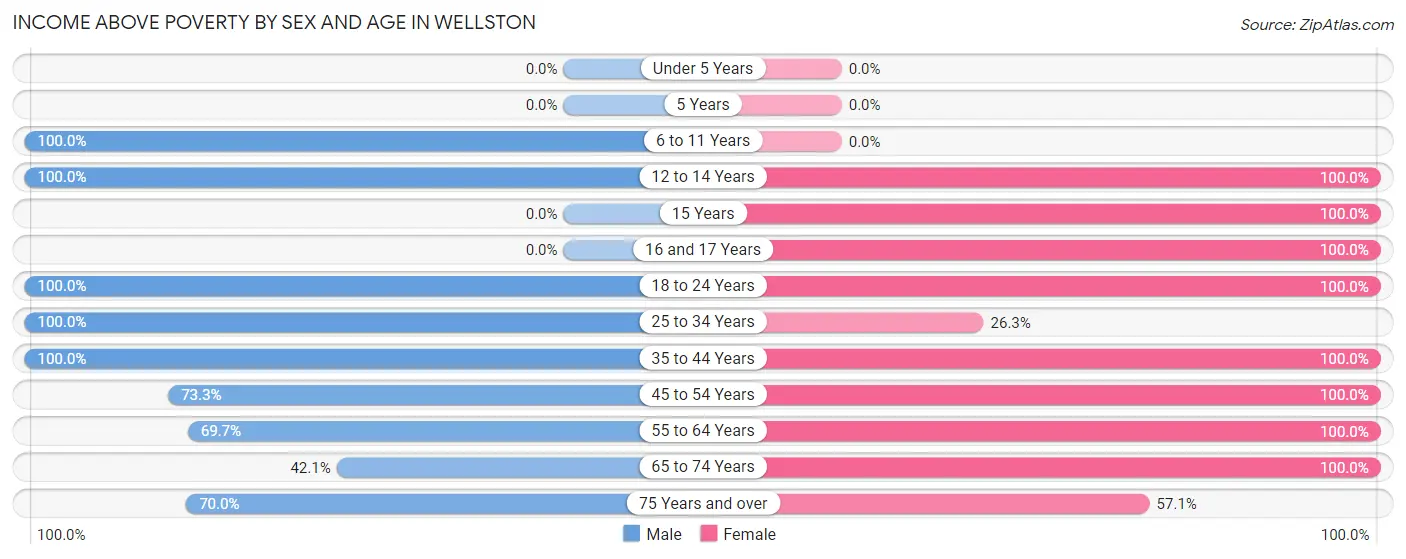
| Age Bracket | Male | Female |
| Under 5 Years | 0 (0.0%) | 0 (0.0%) |
| 5 Years | 0 (0.0%) | 0 (0.0%) |
| 6 to 11 Years | 3 (100.0%) | 0 (0.0%) |
| 12 to 14 Years | 4 (100.0%) | 13 (100.0%) |
| 15 Years | 0 (0.0%) | 3 (100.0%) |
| 16 and 17 Years | 0 (0.0%) | 7 (100.0%) |
| 18 to 24 Years | 15 (100.0%) | 10 (100.0%) |
| 25 to 34 Years | 15 (100.0%) | 5 (26.3%) |
| 35 to 44 Years | 3 (100.0%) | 5 (100.0%) |
| 45 to 54 Years | 11 (73.3%) | 7 (100.0%) |
| 55 to 64 Years | 23 (69.7%) | 19 (100.0%) |
| 65 to 74 Years | 8 (42.1%) | 17 (100.0%) |
| 75 Years and over | 7 (70.0%) | 4 (57.1%) |
| Total | 89 (76.1%) | 90 (84.1%) |
Income Below Poverty Among Married-Couple Families in Wellston
The poverty statistics for married-couple families in Wellston show that 8.3% or 3 of the total 36 families live below the poverty line. Families with no children have the highest poverty rate of 13.6%, comprising of 3 families. On the other hand, families with 1 or 2 children have the lowest poverty rate of 0.0%, which includes 0 families.
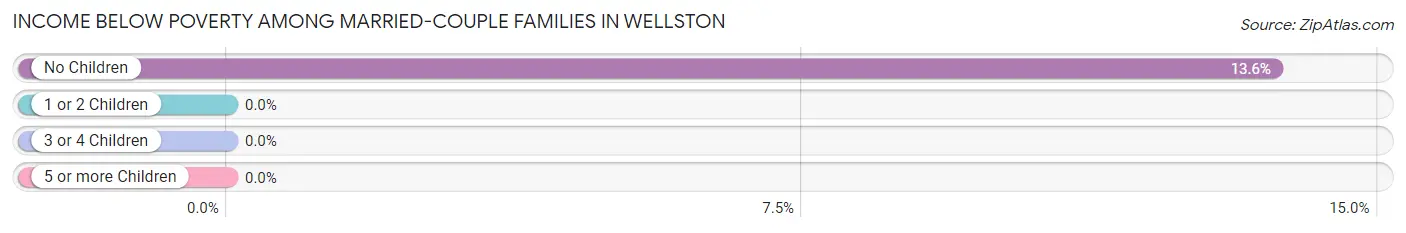
| Children | Above Poverty | Below Poverty |
| No Children | 19 (86.4%) | 3 (13.6%) |
| 1 or 2 Children | 14 (100.0%) | 0 (0.0%) |
| 3 or 4 Children | 0 (0.0%) | 0 (0.0%) |
| 5 or more Children | 0 (0.0%) | 0 (0.0%) |
| Total | 33 (91.7%) | 3 (8.3%) |
Income Below Poverty Among Single-Parent Households in Wellston
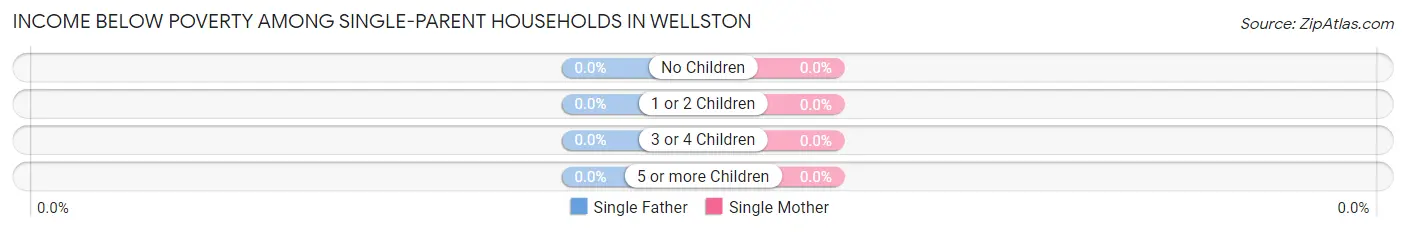
| Children | Single Father | Single Mother |
| No Children | 0 (0.0%) | 0 (0.0%) |
| 1 or 2 Children | 0 (0.0%) | 0 (0.0%) |
| 3 or 4 Children | 0 (0.0%) | 0 (0.0%) |
| 5 or more Children | 0 (0.0%) | 0 (0.0%) |
| Total | 0 (0.0%) | 0 (0.0%) |
Income Below Poverty Among Married-Couple vs Single-Parent Households in Wellston
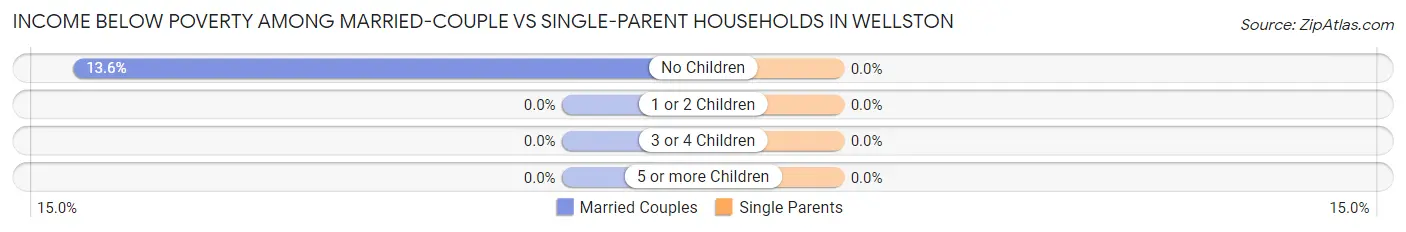
| Children | Married-Couple Families | Single-Parent Households |
| No Children | 3 (13.6%) | 0 (0.0%) |
| 1 or 2 Children | 0 (0.0%) | 0 (0.0%) |
| 3 or 4 Children | 0 (0.0%) | 0 (0.0%) |
| 5 or more Children | 0 (0.0%) | 0 (0.0%) |
| Total | 3 (8.3%) | 0 (0.0%) |
Race in Wellston
The most populous races in Wellston are White / Caucasian (204 | 91.1%), Black / African American (13 | 5.8%), and Two or more Races (7 | 3.1%).
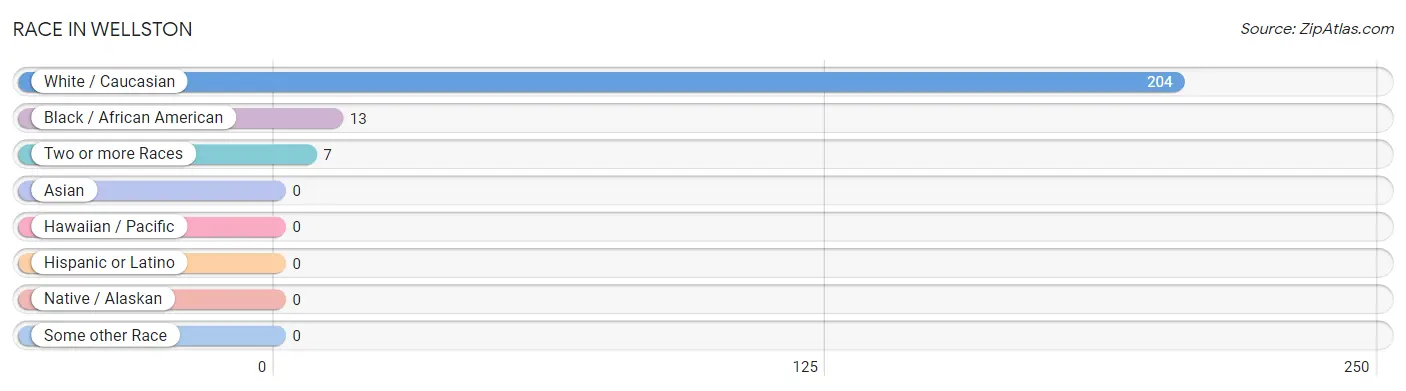
| Race | # Population | % Population |
| Asian | 0 | 0.0% |
| Black / African American | 13 | 5.8% |
| Hawaiian / Pacific | 0 | 0.0% |
| Hispanic or Latino | 0 | 0.0% |
| Native / Alaskan | 0 | 0.0% |
| White / Caucasian | 204 | 91.1% |
| Two or more Races | 7 | 3.1% |
| Some other Race | 0 | 0.0% |
| Total | 224 | 100.0% |
Ancestry in Wellston
The most populous ancestries reported in Wellston are German (66 | 29.5%), English (47 | 21.0%), Irish (44 | 19.6%), Danish (15 | 6.7%), and Polish (8 | 3.6%), together accounting for 80.3% of all Wellston residents.
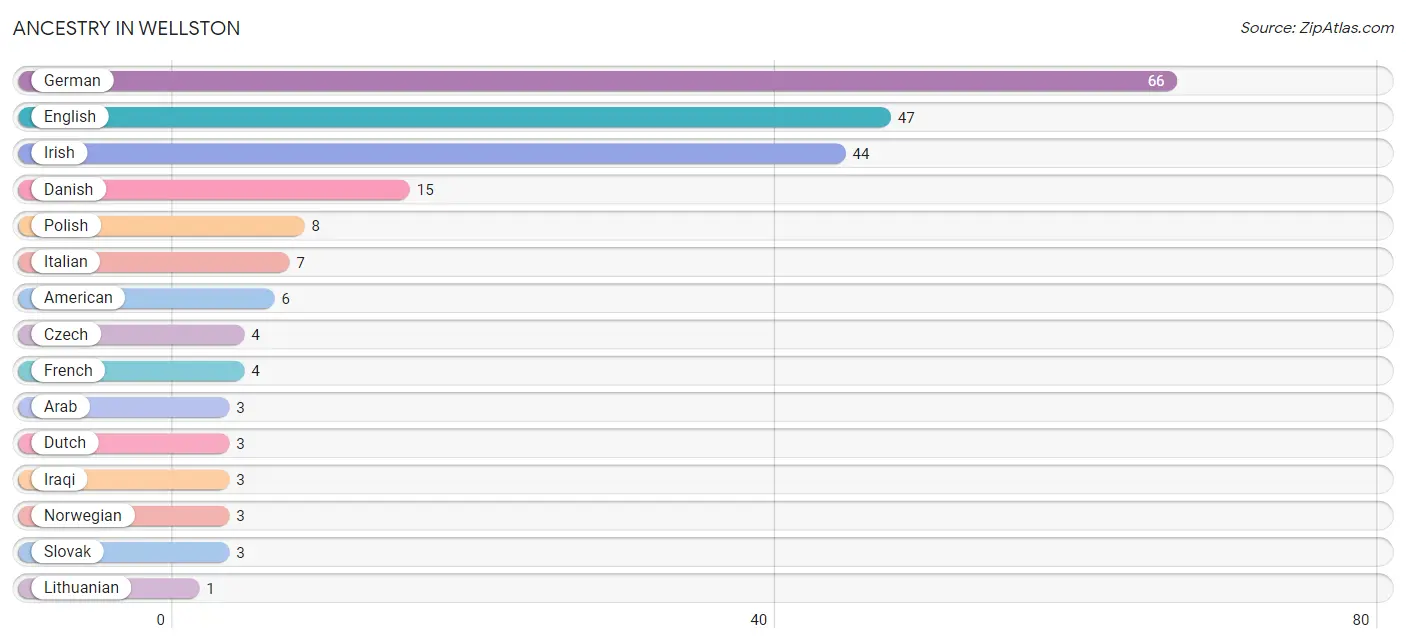
| Ancestry | # Population | % Population |
| American | 6 | 2.7% |
| Arab | 3 | 1.3% |
| Czech | 4 | 1.8% |
| Danish | 15 | 6.7% |
| Dutch | 3 | 1.3% |
| English | 47 | 21.0% |
| French | 4 | 1.8% |
| German | 66 | 29.5% |
| Iraqi | 3 | 1.3% |
| Irish | 44 | 19.6% |
| Italian | 7 | 3.1% |
| Lithuanian | 1 | 0.4% |
| Norwegian | 3 | 1.3% |
| Polish | 8 | 3.6% |
| Slovak | 3 | 1.3% | View All 15 Rows |
Immigrants in Wellston
The most numerous immigrant groups reported in Wellston came from Asia (3 | 1.3%), Iraq (3 | 1.3%), and Western Asia (3 | 1.3%), together accounting for 4.0% of all Wellston residents.
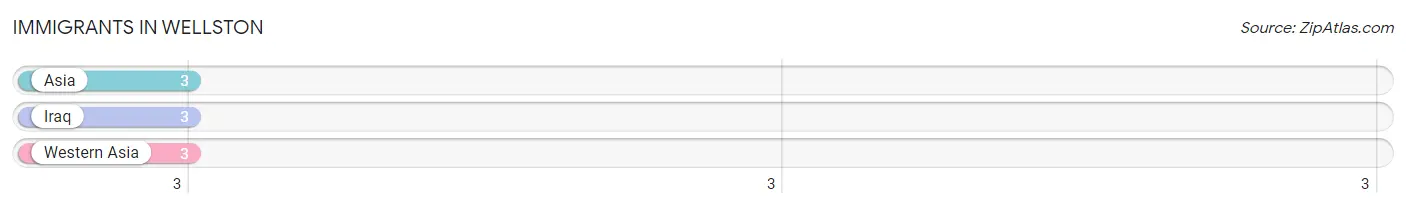
| Immigration Origin | # Population | % Population |
| Asia | 3 | 1.3% |
| Iraq | 3 | 1.3% |
| Western Asia | 3 | 1.3% | View All 3 Rows |
Sex and Age in Wellston
Sex and Age in Wellston
The most populous age groups in Wellston are 60 to 64 Years (30 | 25.6%) for men and 30 to 34 Years (19 | 17.8%) for women.
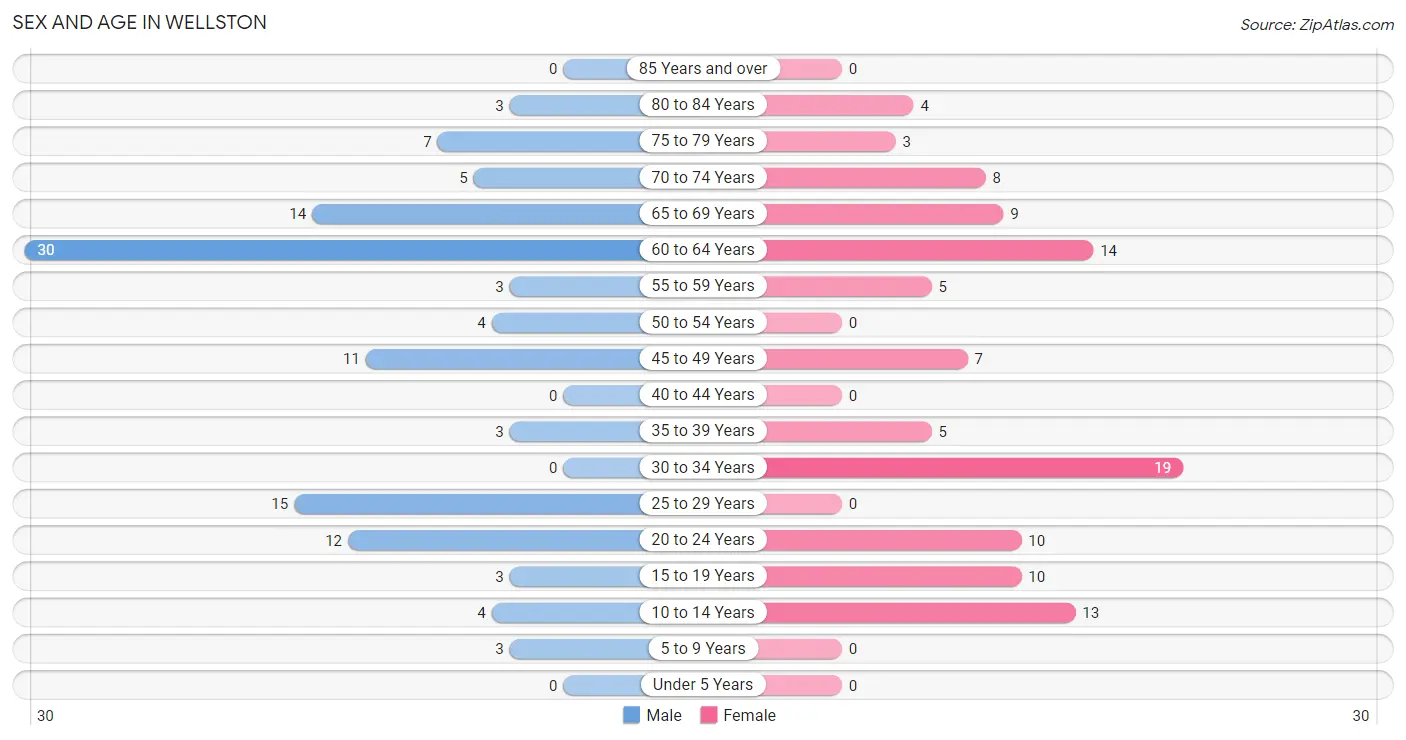
| Age Bracket | Male | Female |
| Under 5 Years | 0 (0.0%) | 0 (0.0%) |
| 5 to 9 Years | 3 (2.6%) | 0 (0.0%) |
| 10 to 14 Years | 4 (3.4%) | 13 (12.1%) |
| 15 to 19 Years | 3 (2.6%) | 10 (9.3%) |
| 20 to 24 Years | 12 (10.3%) | 10 (9.3%) |
| 25 to 29 Years | 15 (12.8%) | 0 (0.0%) |
| 30 to 34 Years | 0 (0.0%) | 19 (17.8%) |
| 35 to 39 Years | 3 (2.6%) | 5 (4.7%) |
| 40 to 44 Years | 0 (0.0%) | 0 (0.0%) |
| 45 to 49 Years | 11 (9.4%) | 7 (6.5%) |
| 50 to 54 Years | 4 (3.4%) | 0 (0.0%) |
| 55 to 59 Years | 3 (2.6%) | 5 (4.7%) |
| 60 to 64 Years | 30 (25.6%) | 14 (13.1%) |
| 65 to 69 Years | 14 (12.0%) | 9 (8.4%) |
| 70 to 74 Years | 5 (4.3%) | 8 (7.5%) |
| 75 to 79 Years | 7 (6.0%) | 3 (2.8%) |
| 80 to 84 Years | 3 (2.6%) | 4 (3.7%) |
| 85 Years and over | 0 (0.0%) | 0 (0.0%) |
| Total | 117 (100.0%) | 107 (100.0%) |
Families and Households in Wellston
Median Family Size in Wellston
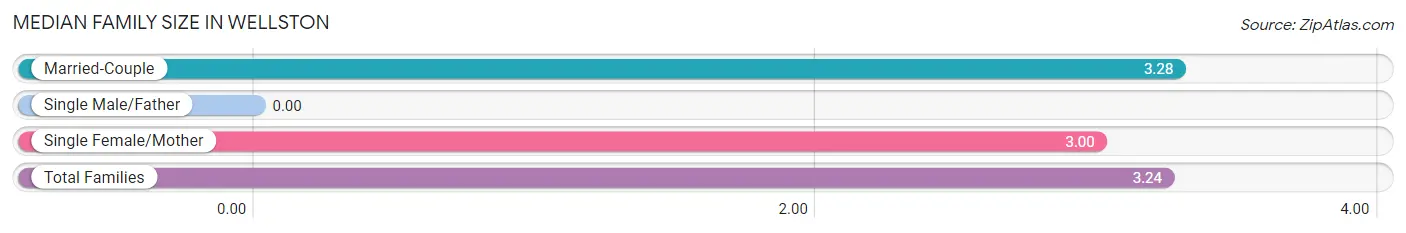
| Family Type | # Families | Family Size |
| Married-Couple | 36 (85.7%) | 3.28 |
| Single Male/Father | 0 (0.0%) | - |
| Single Female/Mother | 6 (14.3%) | 3.00 |
| Total Families | 42 (100.0%) | 3.24 |
Median Household Size in Wellston
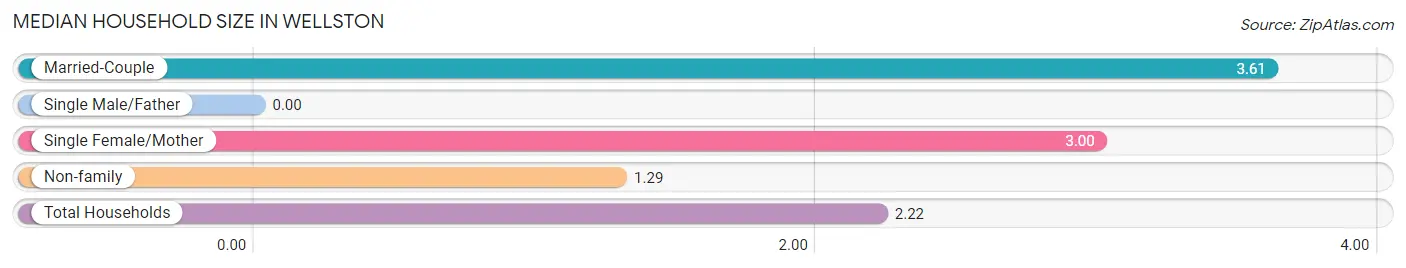
| Household Type | # Households | Household Size |
| Married-Couple | 36 (35.6%) | 3.61 |
| Single Male/Father | 0 (0.0%) | - |
| Single Female/Mother | 6 (5.9%) | 3.00 |
| Non-family | 59 (58.4%) | 1.29 |
| Total Households | 101 (100.0%) | 2.22 |
Household Size by Marriage Status in Wellston
Out of a total of 101 households in Wellston, 42 (41.6%) are family households, while 59 (58.4%) are nonfamily households. The most numerous type of family households are 2-person households, comprising 28, and the most common type of nonfamily households are 1-person households, comprising 47.
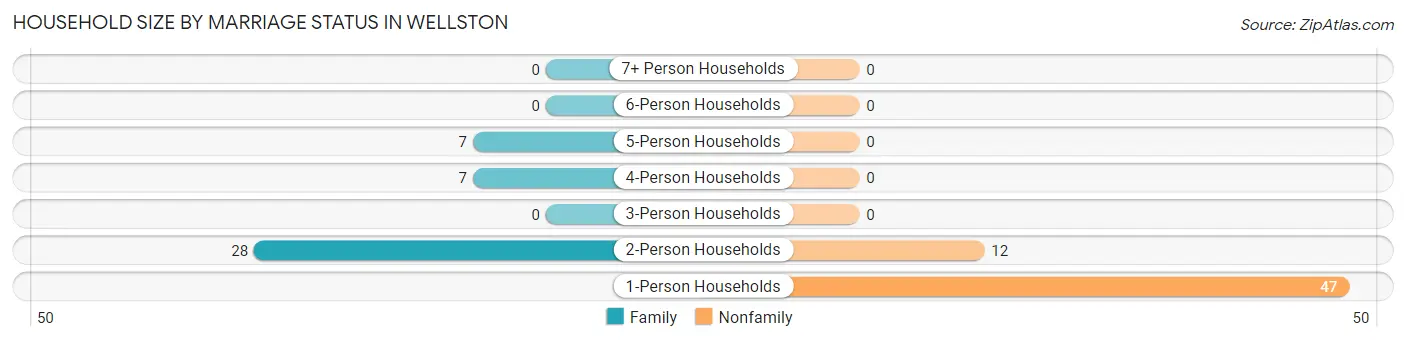
| Household Size | Family Households | Nonfamily Households |
| 1-Person Households | - | 47 (46.5%) |
| 2-Person Households | 28 (27.7%) | 12 (11.9%) |
| 3-Person Households | 0 (0.0%) | 0 (0.0%) |
| 4-Person Households | 7 (6.9%) | 0 (0.0%) |
| 5-Person Households | 7 (6.9%) | 0 (0.0%) |
| 6-Person Households | 0 (0.0%) | 0 (0.0%) |
| 7+ Person Households | 0 (0.0%) | 0 (0.0%) |
| Total | 42 (41.6%) | 59 (58.4%) |
Female Fertility in Wellston
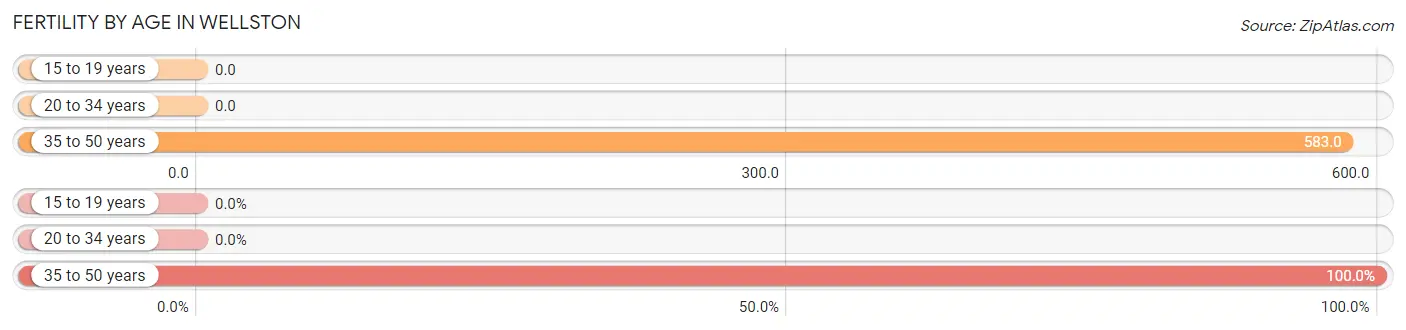
Fertility by Age in Wellston
Average fertility rate in Wellston is 137.0 births per 1,000 women. Women in the age bracket of 35 to 50 years have the highest fertility rate with 583.0 births per 1,000 women. Women in the age bracket of 35 to 50 years acount for 100.0% of all women with births.
| Age Bracket | Women with Births | Births / 1,000 Women |
| 15 to 19 years | 0 (0.0%) | 0.0 |
| 20 to 34 years | 0 (0.0%) | 0.0 |
| 35 to 50 years | 7 (100.0%) | 583.0 |
| Total | 7 (100.0%) | 137.0 |
Fertility by Age by Marriage Status in Wellston
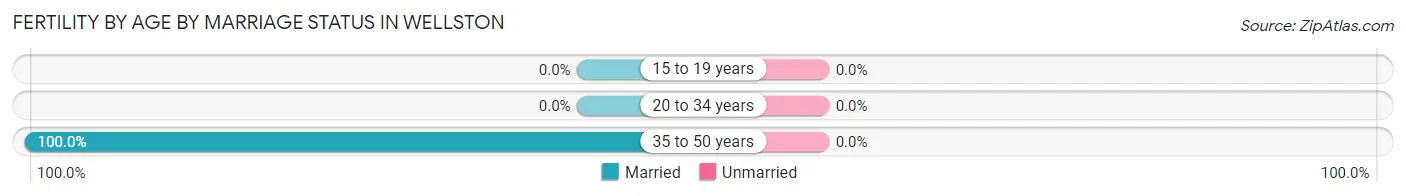
| Age Bracket | Married | Unmarried |
| 15 to 19 years | 0 (0.0%) | 0 (0.0%) |
| 20 to 34 years | 0 (0.0%) | 0 (0.0%) |
| 35 to 50 years | 7 (100.0%) | 0 (0.0%) |
| Total | 7 (100.0%) | 0 (0.0%) |
Fertility by Education in Wellston
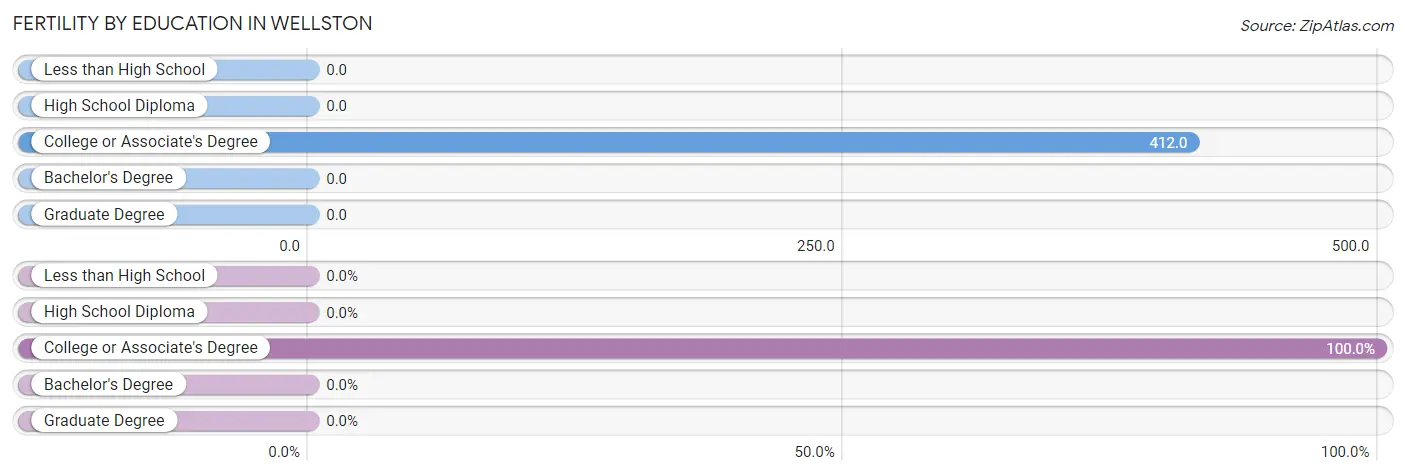
| Educational Attainment | Women with Births | Births / 1,000 Women |
| Less than High School | 0 (0.0%) | 0.0 |
| High School Diploma | 0 (0.0%) | 0.0 |
| College or Associate's Degree | 7 (100.0%) | 412.0 |
| Bachelor's Degree | 0 (0.0%) | 0.0 |
| Graduate Degree | 0 (0.0%) | 0.0 |
| Total | 7 (100.0%) | 137.0 |
Fertility by Education by Marriage Status in Wellston
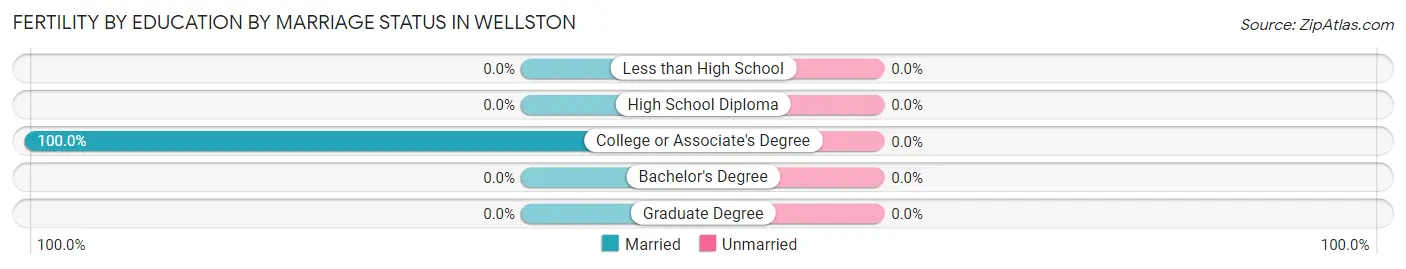
| Educational Attainment | Married | Unmarried |
| Less than High School | 0 (0.0%) | 0 (0.0%) |
| High School Diploma | 0 (0.0%) | 0 (0.0%) |
| College or Associate's Degree | 7 (100.0%) | 0 (0.0%) |
| Bachelor's Degree | 0 (0.0%) | 0 (0.0%) |
| Graduate Degree | 0 (0.0%) | 0 (0.0%) |
| Total | 7 (100.0%) | 0 (0.0%) |
Employment Characteristics in Wellston
Employment by Class of Employer in Wellston
Among the 63 employed individuals in Wellston, private company employees (43 | 68.2%), self-employed (not incorporated) (10 | 15.9%), and not-for-profit organizations (6 | 9.5%) make up the most common classes of employment.
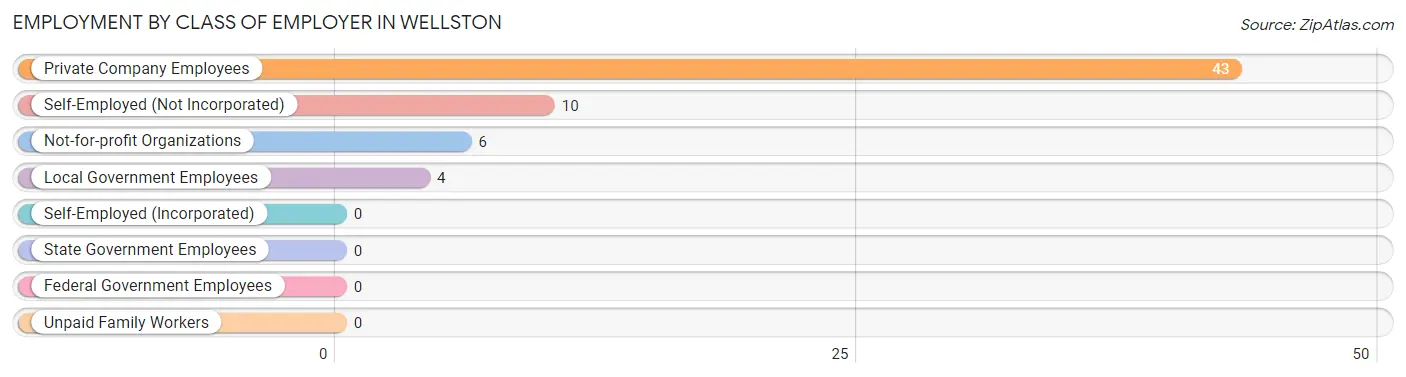
| Employer Class | # Employees | % Employees |
| Private Company Employees | 43 | 68.2% |
| Self-Employed (Incorporated) | 0 | 0.0% |
| Self-Employed (Not Incorporated) | 10 | 15.9% |
| Not-for-profit Organizations | 6 | 9.5% |
| Local Government Employees | 4 | 6.4% |
| State Government Employees | 0 | 0.0% |
| Federal Government Employees | 0 | 0.0% |
| Unpaid Family Workers | 0 | 0.0% |
| Total | 63 | 100.0% |
Employment Status by Age in Wellston
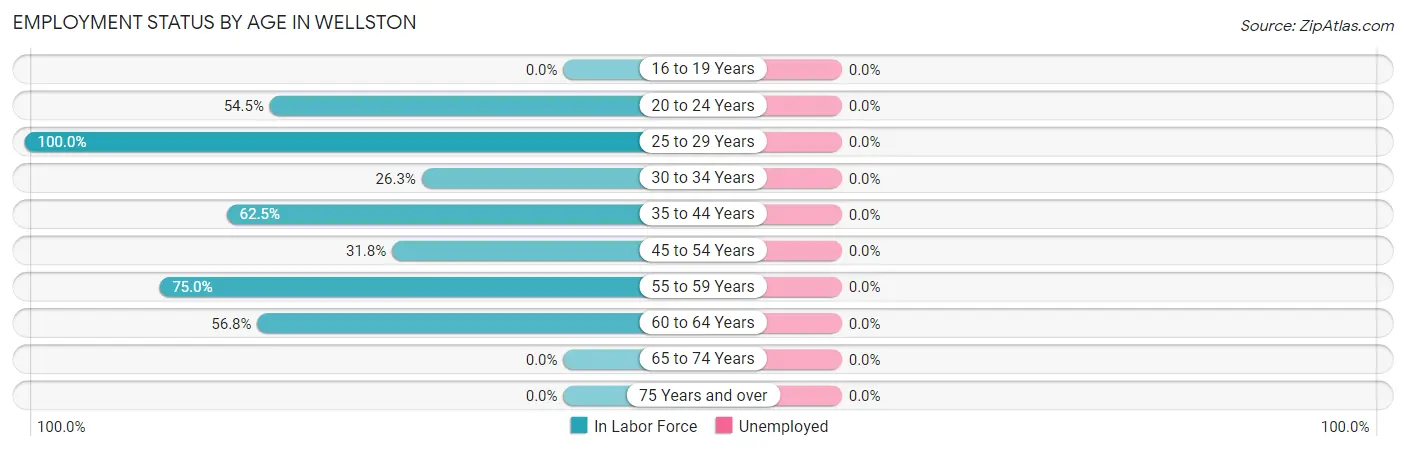
| Age Bracket | In Labor Force | Unemployed |
| 16 to 19 Years | 0 (0.0%) | 0 (0.0%) |
| 20 to 24 Years | 12 (54.5%) | 0 (0.0%) |
| 25 to 29 Years | 15 (100.0%) | 0 (0.0%) |
| 30 to 34 Years | 5 (26.3%) | 0 (0.0%) |
| 35 to 44 Years | 5 (62.5%) | 0 (0.0%) |
| 45 to 54 Years | 7 (31.8%) | 0 (0.0%) |
| 55 to 59 Years | 6 (75.0%) | 0 (0.0%) |
| 60 to 64 Years | 25 (56.8%) | 0 (0.0%) |
| 65 to 74 Years | 0 (0.0%) | 0 (0.0%) |
| 75 Years and over | 0 (0.0%) | 0 (0.0%) |
| Total | 75 (37.3%) | 0 (0.0%) |
Employment Status by Educational Attainment in Wellston
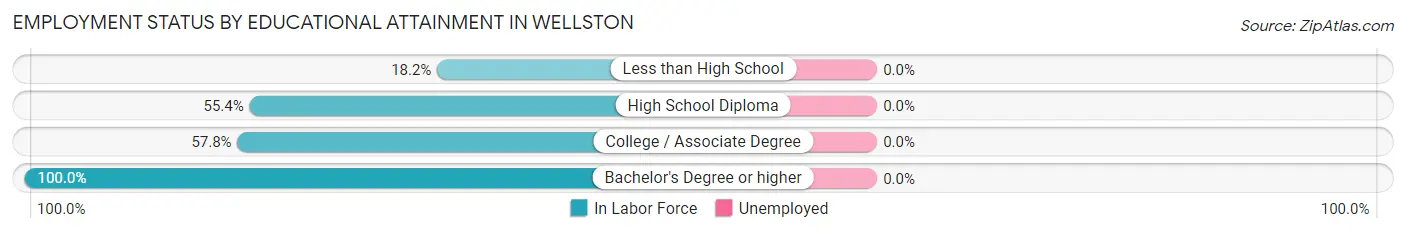
| Educational Attainment | In Labor Force | Unemployed |
| Less than High School | 2 (18.2%) | 0 (0.0%) |
| High School Diploma | 31 (55.4%) | 0 (0.0%) |
| College / Associate Degree | 26 (57.8%) | 0 (0.0%) |
| Bachelor's Degree or higher | 4 (100.0%) | 0 (0.0%) |
| Total | 63 (54.3%) | 0 (0.0%) |
Employment Occupations by Sex in Wellston
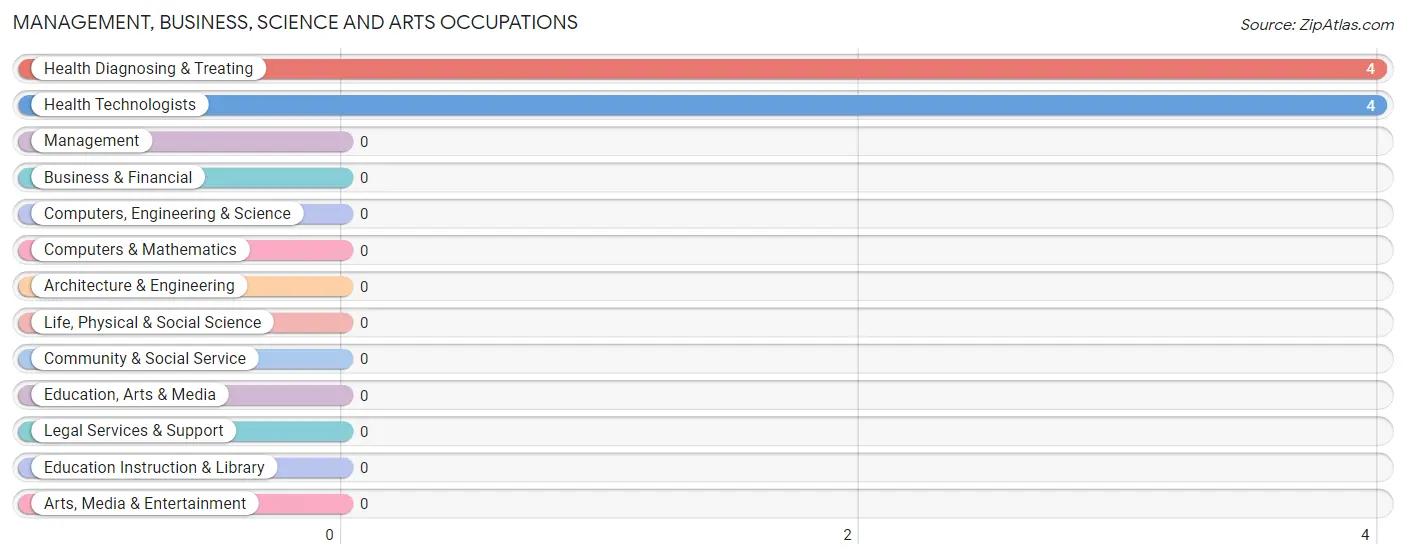
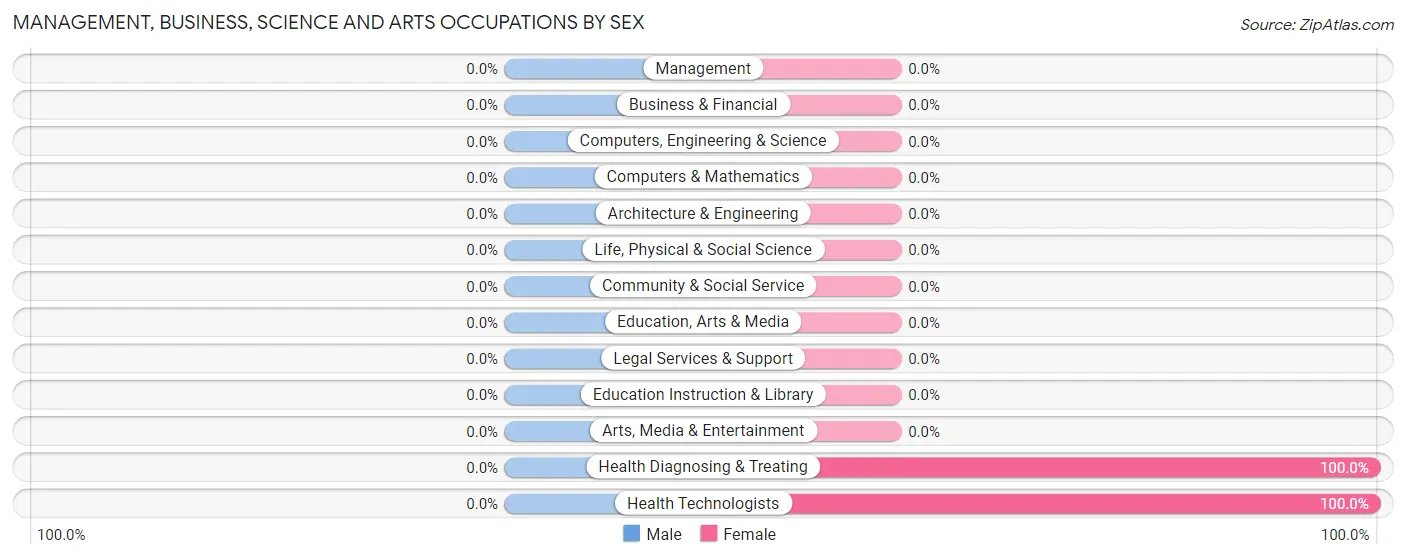
Management, Business, Science and Arts Occupations
The most common Management, Business, Science and Arts occupations in Wellston are Health Diagnosing & Treating (4 | 5.3%), and Health Technologists (4 | 5.3%).
Management, Business, Science and Arts Occupations by Sex
| Occupation | Male | Female |
| Management | 0 (0.0%) | 0 (0.0%) |
| Business & Financial | 0 (0.0%) | 0 (0.0%) |
| Computers, Engineering & Science | 0 (0.0%) | 0 (0.0%) |
| Computers & Mathematics | 0 (0.0%) | 0 (0.0%) |
| Architecture & Engineering | 0 (0.0%) | 0 (0.0%) |
| Life, Physical & Social Science | 0 (0.0%) | 0 (0.0%) |
| Community & Social Service | 0 (0.0%) | 0 (0.0%) |
| Education, Arts & Media | 0 (0.0%) | 0 (0.0%) |
| Legal Services & Support | 0 (0.0%) | 0 (0.0%) |
| Education Instruction & Library | 0 (0.0%) | 0 (0.0%) |
| Arts, Media & Entertainment | 0 (0.0%) | 0 (0.0%) |
| Health Diagnosing & Treating | 0 (0.0%) | 4 (100.0%) |
| Health Technologists | 0 (0.0%) | 4 (100.0%) |
| Total (Category) | 0 (0.0%) | 4 (100.0%) |
| Total (Overall) | 41 (54.7%) | 34 (45.3%) |
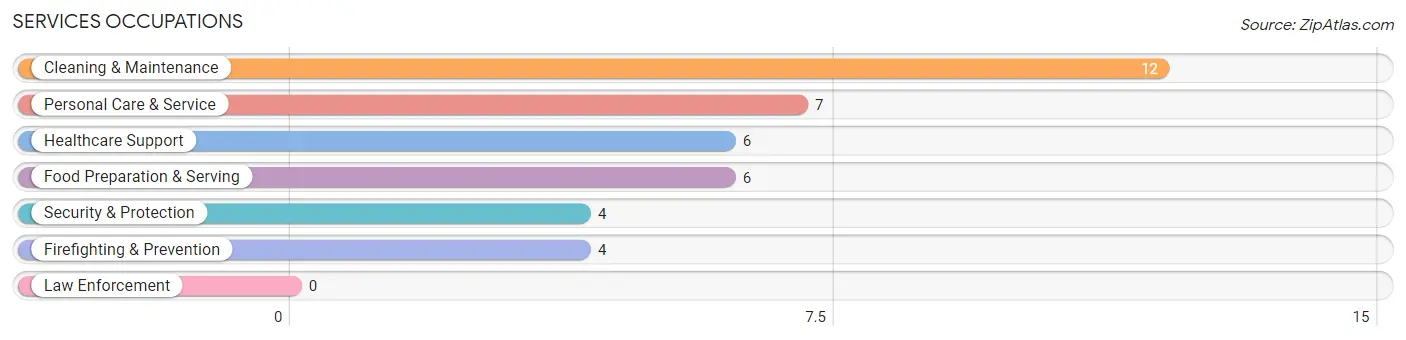
Services Occupations
The most common Services occupations in Wellston are Cleaning & Maintenance (12 | 16.0%), Personal Care & Service (7 | 9.3%), Healthcare Support (6 | 8.0%), Food Preparation & Serving (6 | 8.0%), and Security & Protection (4 | 5.3%).
Services Occupations by Sex
Within the Services occupations in Wellston, the most male-oriented occupations are Security & Protection (100.0%), Firefighting & Prevention (100.0%), and Cleaning & Maintenance (100.0%), while the most female-oriented occupations are Healthcare Support (100.0%), Food Preparation & Serving (100.0%), and Personal Care & Service (100.0%).
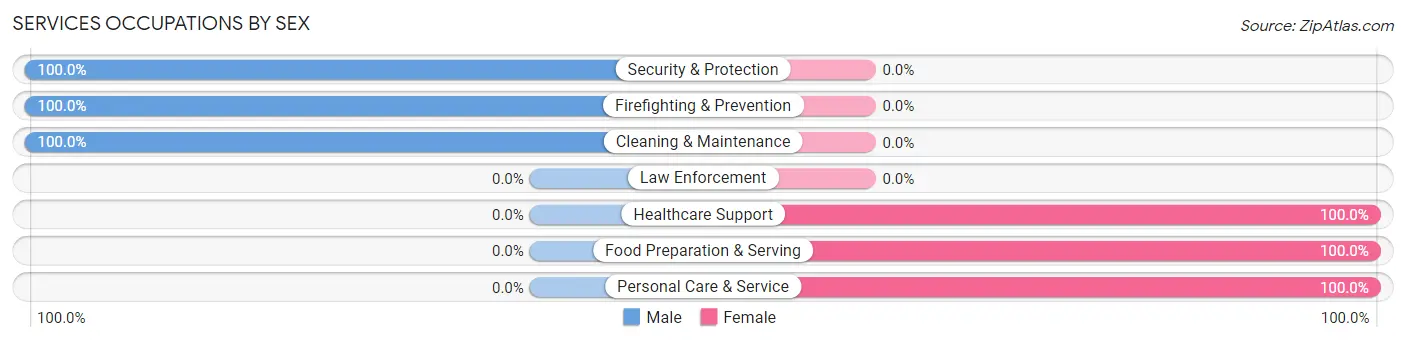
| Occupation | Male | Female |
| Healthcare Support | 0 (0.0%) | 6 (100.0%) |
| Security & Protection | 4 (100.0%) | 0 (0.0%) |
| Firefighting & Prevention | 4 (100.0%) | 0 (0.0%) |
| Law Enforcement | 0 (0.0%) | 0 (0.0%) |
| Food Preparation & Serving | 0 (0.0%) | 6 (100.0%) |
| Cleaning & Maintenance | 12 (100.0%) | 0 (0.0%) |
| Personal Care & Service | 0 (0.0%) | 7 (100.0%) |
| Total (Category) | 16 (45.7%) | 19 (54.3%) |
| Total (Overall) | 41 (54.7%) | 34 (45.3%) |
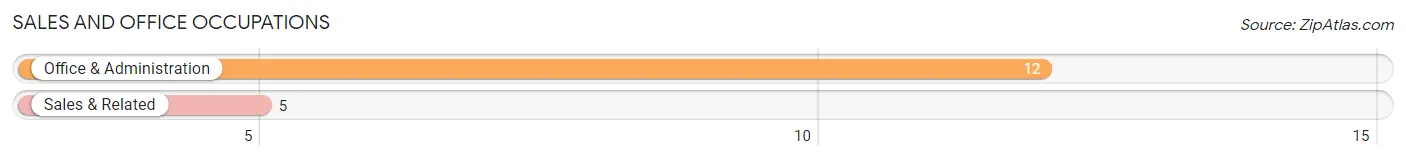
Sales and Office Occupations
The most common Sales and Office occupations in Wellston are Office & Administration (12 | 16.0%), and Sales & Related (5 | 6.7%).
Sales and Office Occupations by Sex
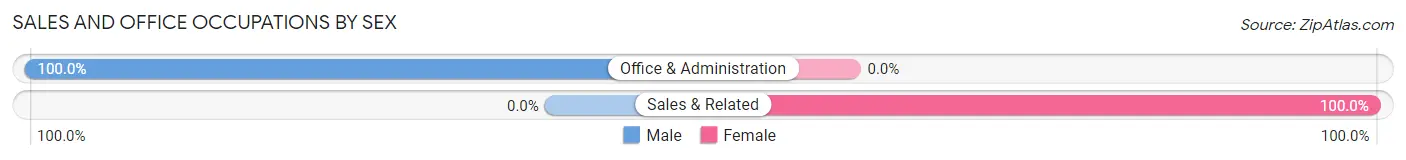
| Occupation | Male | Female |
| Sales & Related | 0 (0.0%) | 5 (100.0%) |
| Office & Administration | 12 (100.0%) | 0 (0.0%) |
| Total (Category) | 12 (70.6%) | 5 (29.4%) |
| Total (Overall) | 41 (54.7%) | 34 (45.3%) |
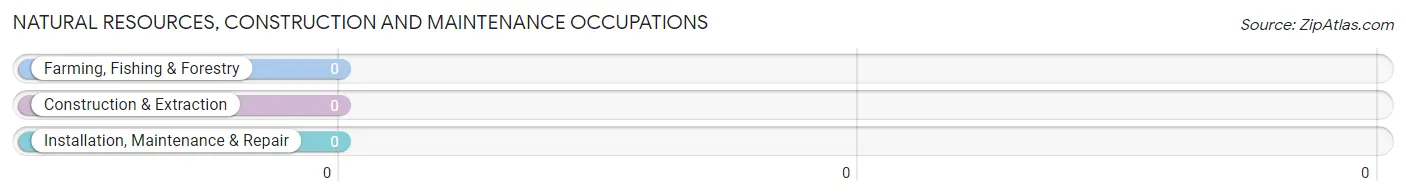
Natural Resources, Construction and Maintenance Occupations
Natural Resources, Construction and Maintenance Occupations by Sex
| Occupation | Male | Female |
| Farming, Fishing & Forestry | 0 (0.0%) | 0 (0.0%) |
| Construction & Extraction | 0 (0.0%) | 0 (0.0%) |
| Installation, Maintenance & Repair | 0 (0.0%) | 0 (0.0%) |
| Total (Category) | 0 (0.0%) | 0 (0.0%) |
| Total (Overall) | 41 (54.7%) | 34 (45.3%) |
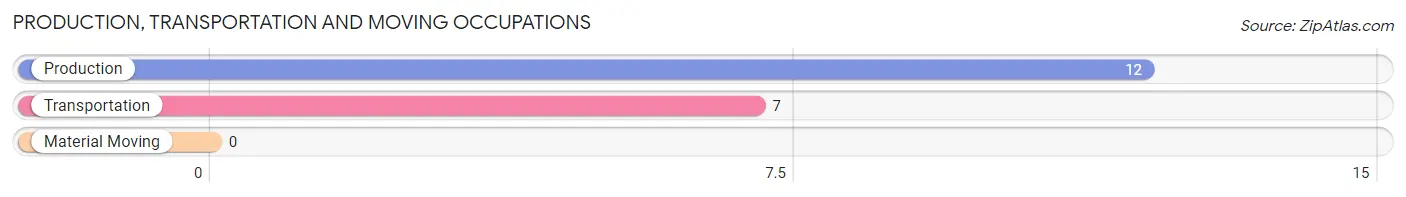
Production, Transportation and Moving Occupations
The most common Production, Transportation and Moving occupations in Wellston are Production (12 | 16.0%), and Transportation (7 | 9.3%).
Production, Transportation and Moving Occupations by Sex
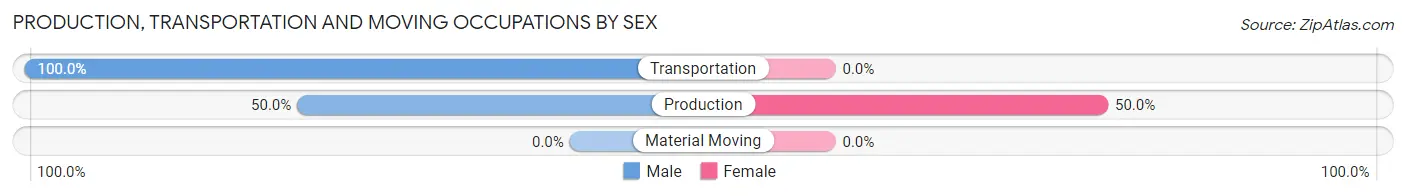
| Occupation | Male | Female |
| Production | 6 (50.0%) | 6 (50.0%) |
| Transportation | 7 (100.0%) | 0 (0.0%) |
| Material Moving | 0 (0.0%) | 0 (0.0%) |
| Total (Category) | 13 (68.4%) | 6 (31.6%) |
| Total (Overall) | 41 (54.7%) | 34 (45.3%) |
Employment Industries by Sex in Wellston
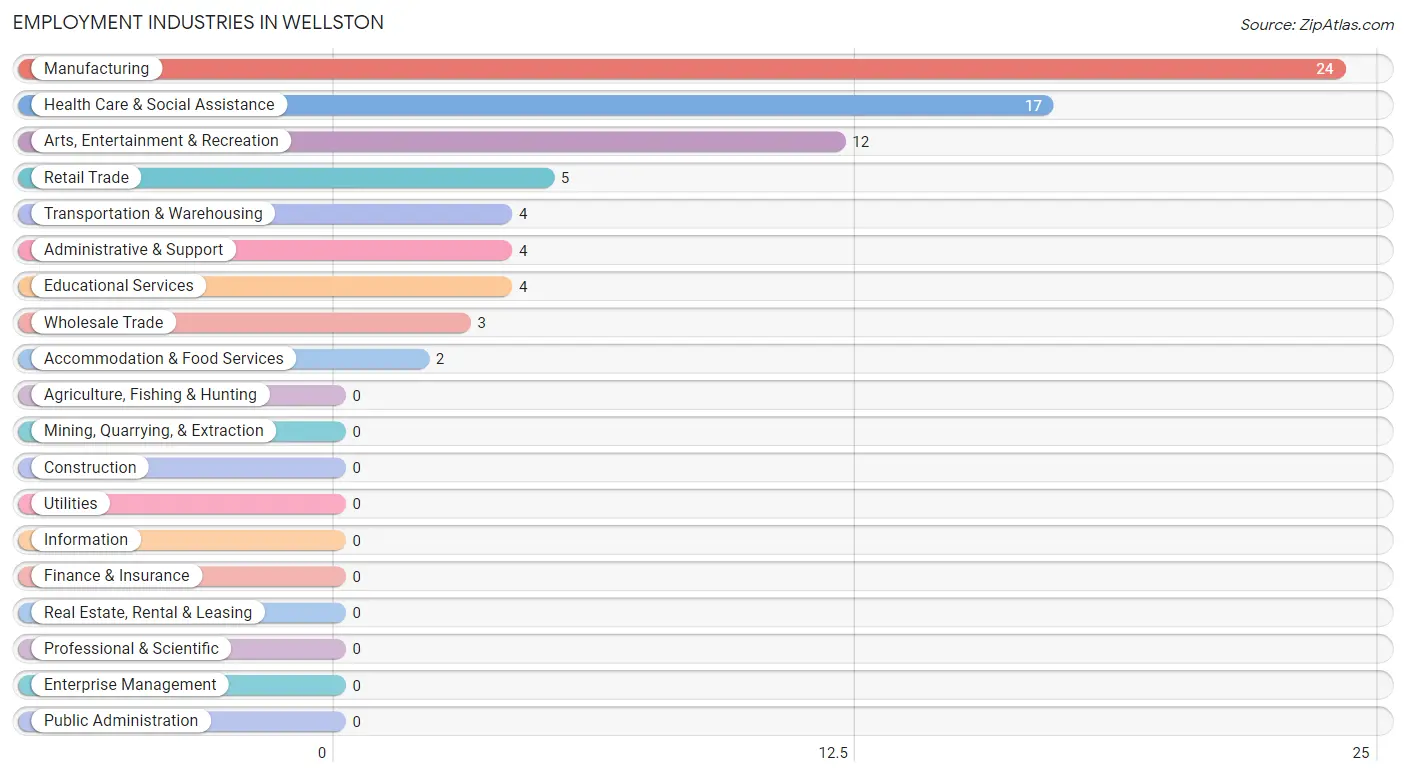
Employment Industries in Wellston
The major employment industries in Wellston include Manufacturing (24 | 32.0%), Health Care & Social Assistance (17 | 22.7%), Arts, Entertainment & Recreation (12 | 16.0%), Retail Trade (5 | 6.7%), and Transportation & Warehousing (4 | 5.3%).
Employment Industries by Sex in Wellston
The Wellston industries that see more men than women are Wholesale Trade (100.0%), Transportation & Warehousing (100.0%), and Administrative & Support (100.0%), whereas the industries that tend to have a higher number of women are Retail Trade (100.0%), Educational Services (100.0%), and Health Care & Social Assistance (100.0%).
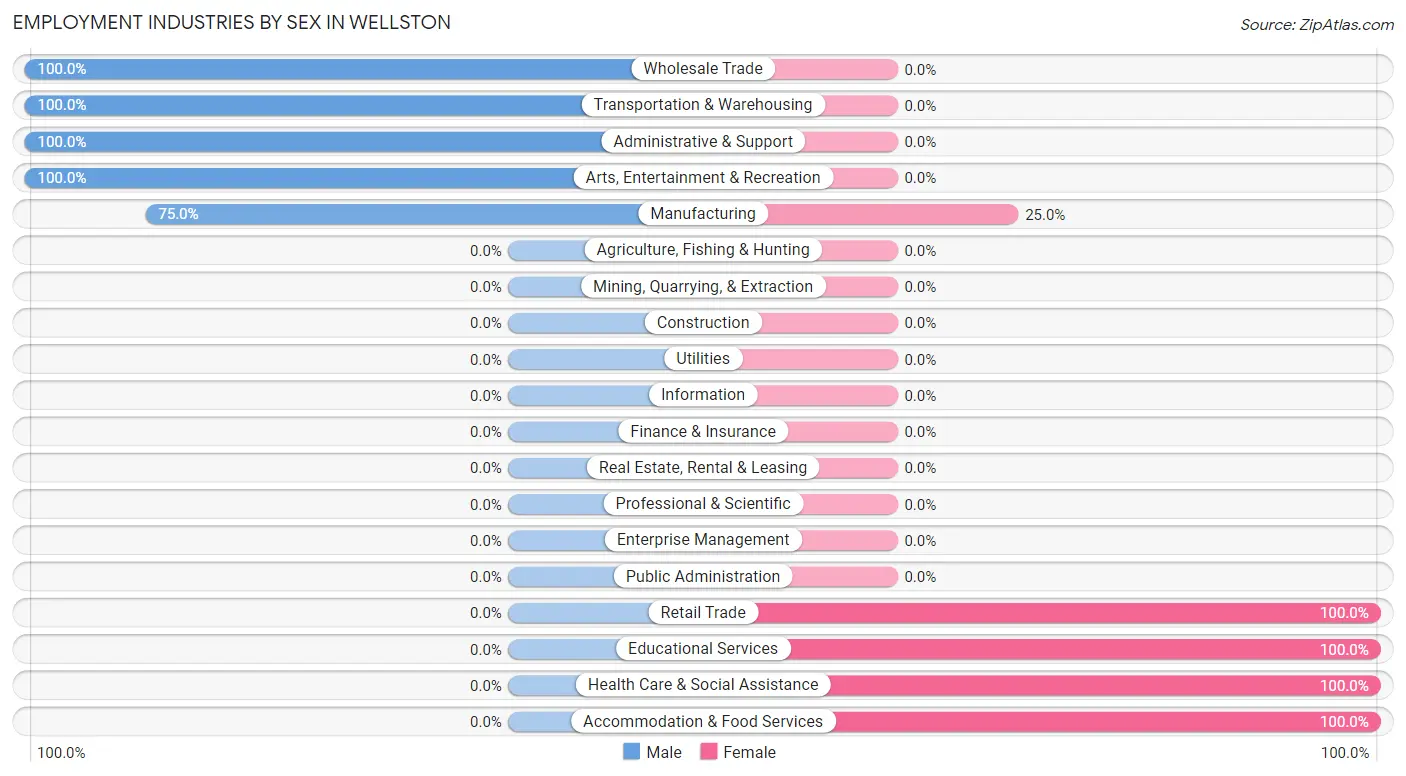
| Industry | Male | Female |
| Agriculture, Fishing & Hunting | 0 (0.0%) | 0 (0.0%) |
| Mining, Quarrying, & Extraction | 0 (0.0%) | 0 (0.0%) |
| Construction | 0 (0.0%) | 0 (0.0%) |
| Manufacturing | 18 (75.0%) | 6 (25.0%) |
| Wholesale Trade | 3 (100.0%) | 0 (0.0%) |
| Retail Trade | 0 (0.0%) | 5 (100.0%) |
| Transportation & Warehousing | 4 (100.0%) | 0 (0.0%) |
| Utilities | 0 (0.0%) | 0 (0.0%) |
| Information | 0 (0.0%) | 0 (0.0%) |
| Finance & Insurance | 0 (0.0%) | 0 (0.0%) |
| Real Estate, Rental & Leasing | 0 (0.0%) | 0 (0.0%) |
| Professional & Scientific | 0 (0.0%) | 0 (0.0%) |
| Enterprise Management | 0 (0.0%) | 0 (0.0%) |
| Administrative & Support | 4 (100.0%) | 0 (0.0%) |
| Educational Services | 0 (0.0%) | 4 (100.0%) |
| Health Care & Social Assistance | 0 (0.0%) | 17 (100.0%) |
| Arts, Entertainment & Recreation | 12 (100.0%) | 0 (0.0%) |
| Accommodation & Food Services | 0 (0.0%) | 2 (100.0%) |
| Public Administration | 0 (0.0%) | 0 (0.0%) |
| Total | 41 (54.7%) | 34 (45.3%) |
Education in Wellston
School Enrollment in Wellston
The most common levels of schooling among the 27 students in Wellston are middle school (17 | 63.0%), and high school (10 | 37.0%).
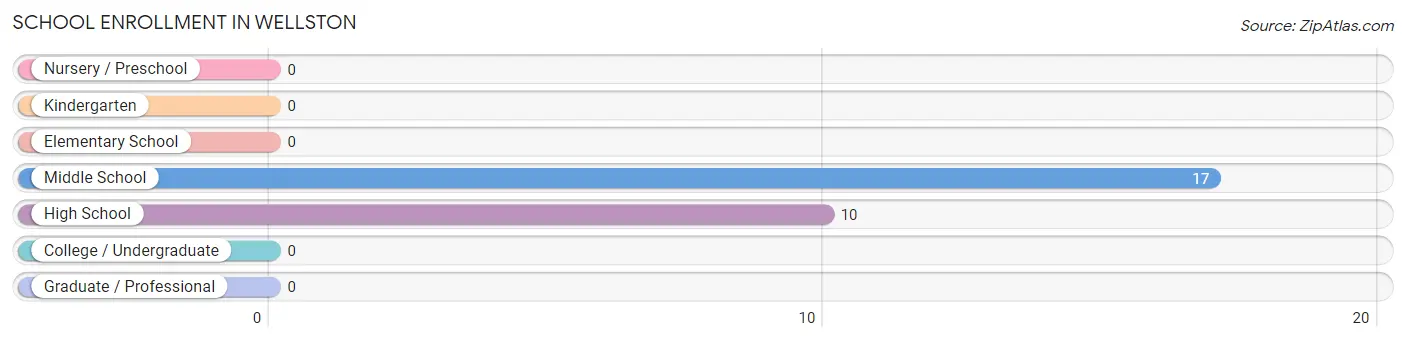
| School Level | # Students | % Students |
| Nursery / Preschool | 0 | 0.0% |
| Kindergarten | 0 | 0.0% |
| Elementary School | 0 | 0.0% |
| Middle School | 17 | 63.0% |
| High School | 10 | 37.0% |
| College / Undergraduate | 0 | 0.0% |
| Graduate / Professional | 0 | 0.0% |
| Total | 27 | 100.0% |
School Enrollment by Age by Funding Source in Wellston
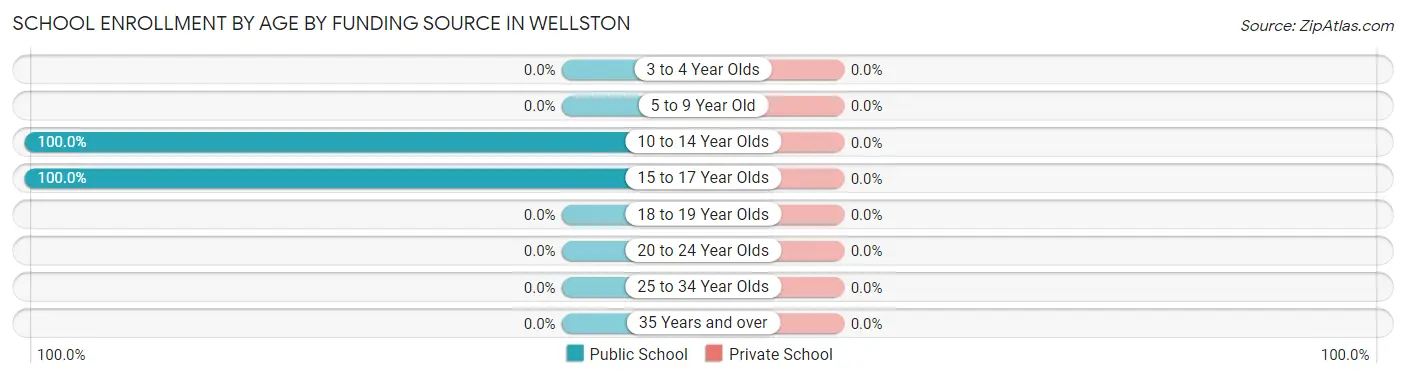
| Age Bracket | Public School | Private School |
| 3 to 4 Year Olds | 0 (0.0%) | 0 (0.0%) |
| 5 to 9 Year Old | 0 (0.0%) | 0 (0.0%) |
| 10 to 14 Year Olds | 17 (100.0%) | 0 (0.0%) |
| 15 to 17 Year Olds | 10 (100.0%) | 0 (0.0%) |
| 18 to 19 Year Olds | 0 (0.0%) | 0 (0.0%) |
| 20 to 24 Year Olds | 0 (0.0%) | 0 (0.0%) |
| 25 to 34 Year Olds | 0 (0.0%) | 0 (0.0%) |
| 35 Years and over | 0 (0.0%) | 0 (0.0%) |
| Total | 27 (100.0%) | 0 (0.0%) |
Educational Attainment by Field of Study in Wellston
Social sciences (6 | 46.2%), science & technology (4 | 30.8%), and bio, nature & agricultural (3 | 23.1%) are the most common fields of study among 13 individuals in Wellston who have obtained a bachelor's degree or higher.
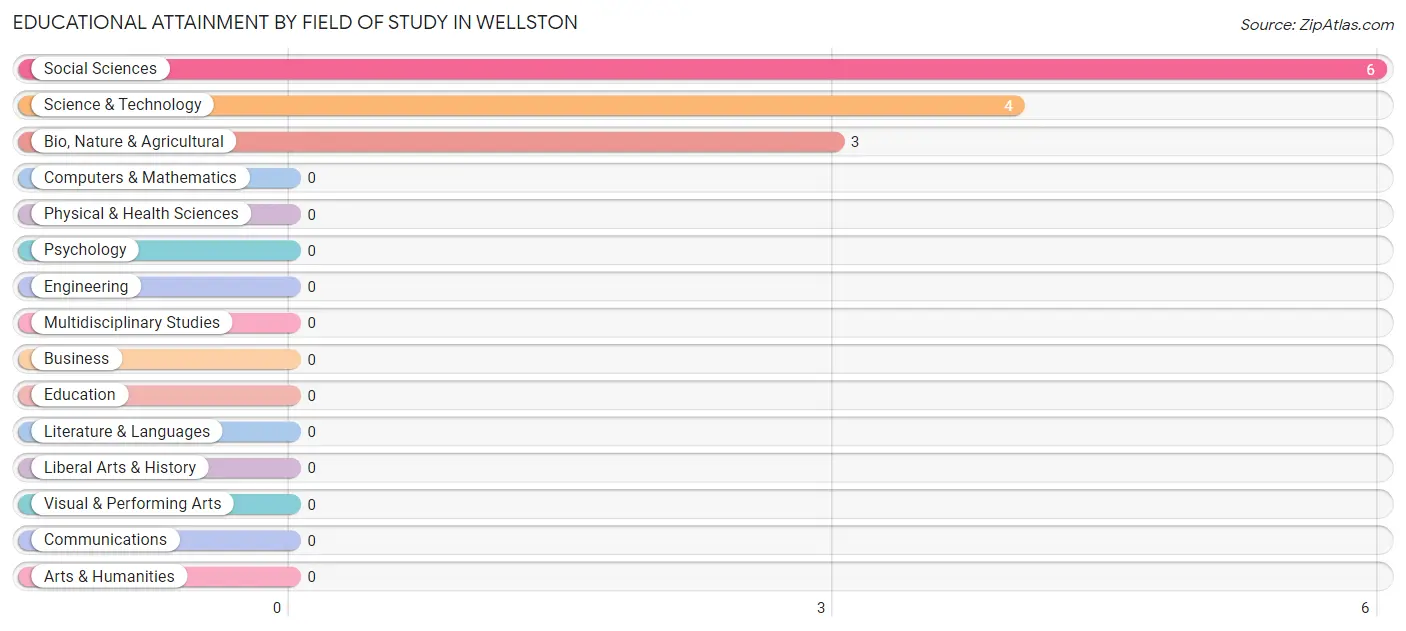
| Field of Study | # Graduates | % Graduates |
| Computers & Mathematics | 0 | 0.0% |
| Bio, Nature & Agricultural | 3 | 23.1% |
| Physical & Health Sciences | 0 | 0.0% |
| Psychology | 0 | 0.0% |
| Social Sciences | 6 | 46.2% |
| Engineering | 0 | 0.0% |
| Multidisciplinary Studies | 0 | 0.0% |
| Science & Technology | 4 | 30.8% |
| Business | 0 | 0.0% |
| Education | 0 | 0.0% |
| Literature & Languages | 0 | 0.0% |
| Liberal Arts & History | 0 | 0.0% |
| Visual & Performing Arts | 0 | 0.0% |
| Communications | 0 | 0.0% |
| Arts & Humanities | 0 | 0.0% |
| Total | 13 | 100.0% |
Transportation & Commute in Wellston
Vehicle Availability by Sex in Wellston
The most prevalent vehicle ownership categories in Wellston are males with 1 vehicle (13, accounting for 44.8%) and females with 1 vehicle (8, making up 38.2%).
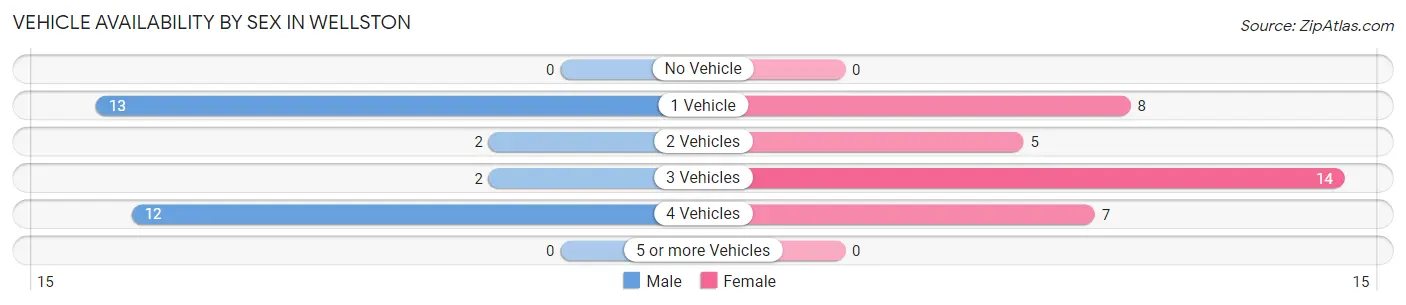
| Vehicles Available | Male | Female |
| No Vehicle | 0 (0.0%) | 0 (0.0%) |
| 1 Vehicle | 13 (44.8%) | 8 (23.5%) |
| 2 Vehicles | 2 (6.9%) | 5 (14.7%) |
| 3 Vehicles | 2 (6.9%) | 14 (41.2%) |
| 4 Vehicles | 12 (41.4%) | 7 (20.6%) |
| 5 or more Vehicles | 0 (0.0%) | 0 (0.0%) |
| Total | 29 (100.0%) | 34 (100.0%) |
Commute Time in Wellston
The most frequently occuring commute durations in Wellston are 20 to 24 minutes (14 commuters, 34.2%), 30 to 34 minutes (10 commuters, 24.4%), and 10 to 14 minutes (6 commuters, 14.6%).
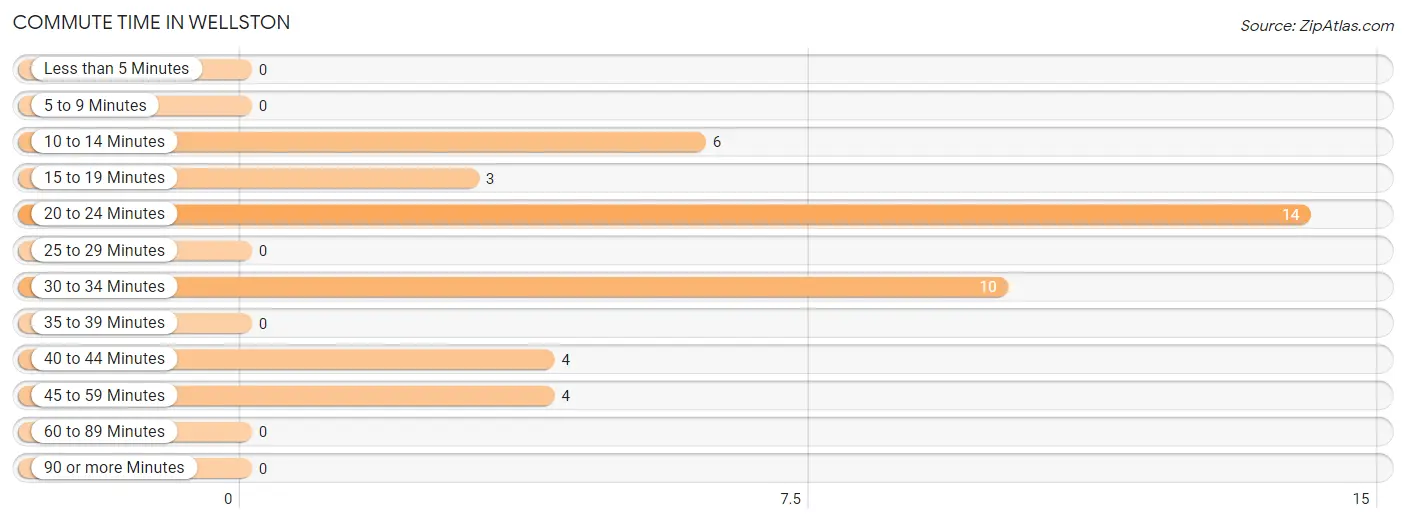
| Commute Time | # Commuters | % Commuters |
| Less than 5 Minutes | 0 | 0.0% |
| 5 to 9 Minutes | 0 | 0.0% |
| 10 to 14 Minutes | 6 | 14.6% |
| 15 to 19 Minutes | 3 | 7.3% |
| 20 to 24 Minutes | 14 | 34.2% |
| 25 to 29 Minutes | 0 | 0.0% |
| 30 to 34 Minutes | 10 | 24.4% |
| 35 to 39 Minutes | 0 | 0.0% |
| 40 to 44 Minutes | 4 | 9.8% |
| 45 to 59 Minutes | 4 | 9.8% |
| 60 to 89 Minutes | 0 | 0.0% |
| 90 or more Minutes | 0 | 0.0% |
Commute Time by Sex in Wellston
The most common commute times in Wellston are 20 to 24 minutes (6 commuters, 35.3%) for males and 20 to 24 minutes (8 commuters, 33.3%) for females.
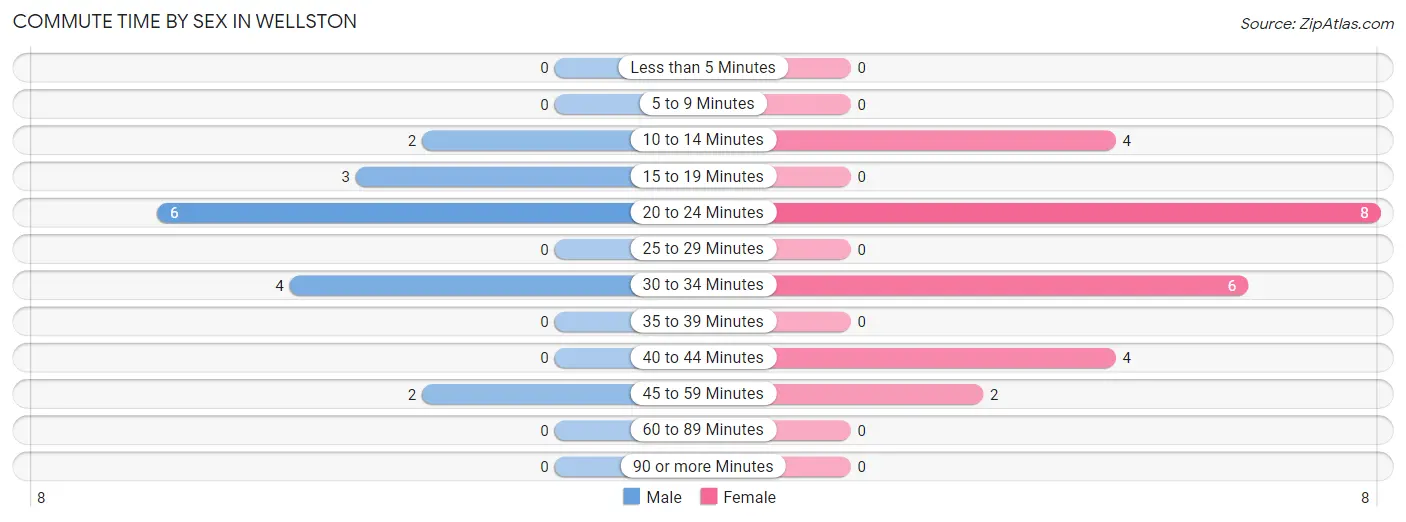
| Commute Time | Male | Female |
| Less than 5 Minutes | 0 (0.0%) | 0 (0.0%) |
| 5 to 9 Minutes | 0 (0.0%) | 0 (0.0%) |
| 10 to 14 Minutes | 2 (11.8%) | 4 (16.7%) |
| 15 to 19 Minutes | 3 (17.6%) | 0 (0.0%) |
| 20 to 24 Minutes | 6 (35.3%) | 8 (33.3%) |
| 25 to 29 Minutes | 0 (0.0%) | 0 (0.0%) |
| 30 to 34 Minutes | 4 (23.5%) | 6 (25.0%) |
| 35 to 39 Minutes | 0 (0.0%) | 0 (0.0%) |
| 40 to 44 Minutes | 0 (0.0%) | 4 (16.7%) |
| 45 to 59 Minutes | 2 (11.8%) | 2 (8.3%) |
| 60 to 89 Minutes | 0 (0.0%) | 0 (0.0%) |
| 90 or more Minutes | 0 (0.0%) | 0 (0.0%) |
Time of Departure to Work by Sex in Wellston
The most frequent times of departure to work in Wellston are 7:00 AM to 7:29 AM (12, 70.6%) for males and 7:00 AM to 7:29 AM (8, 33.3%) for females.
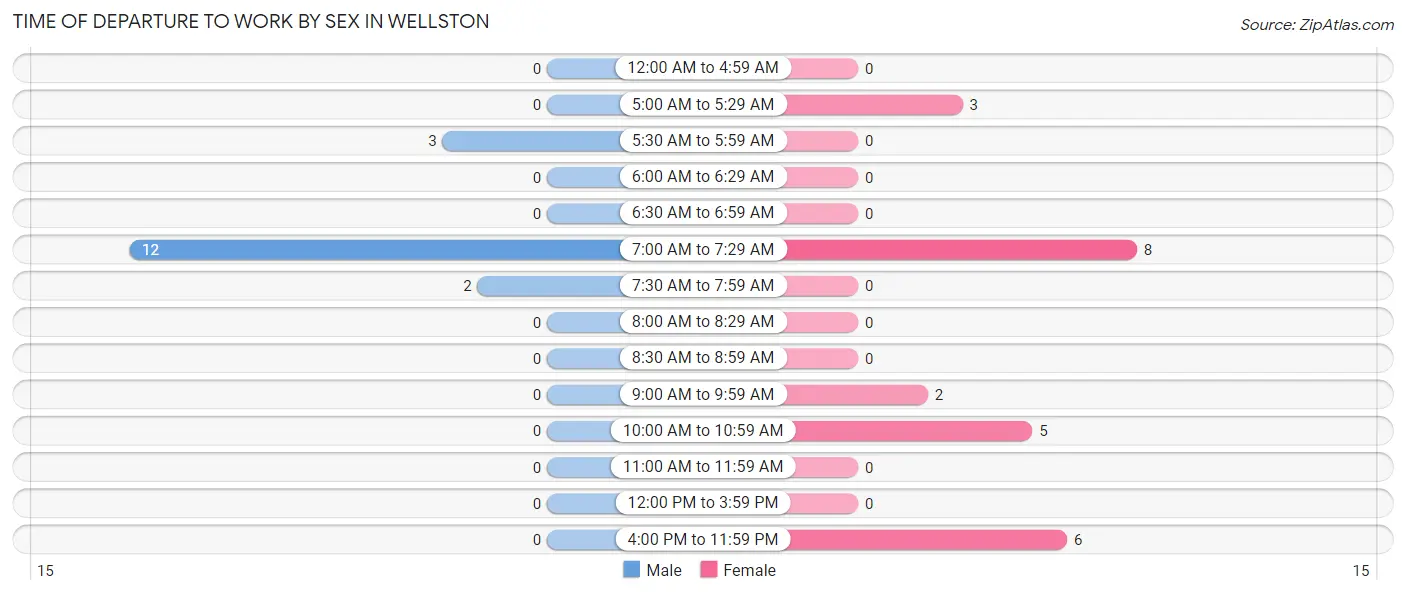
| Time of Departure | Male | Female |
| 12:00 AM to 4:59 AM | 0 (0.0%) | 0 (0.0%) |
| 5:00 AM to 5:29 AM | 0 (0.0%) | 3 (12.5%) |
| 5:30 AM to 5:59 AM | 3 (17.6%) | 0 (0.0%) |
| 6:00 AM to 6:29 AM | 0 (0.0%) | 0 (0.0%) |
| 6:30 AM to 6:59 AM | 0 (0.0%) | 0 (0.0%) |
| 7:00 AM to 7:29 AM | 12 (70.6%) | 8 (33.3%) |
| 7:30 AM to 7:59 AM | 2 (11.8%) | 0 (0.0%) |
| 8:00 AM to 8:29 AM | 0 (0.0%) | 0 (0.0%) |
| 8:30 AM to 8:59 AM | 0 (0.0%) | 0 (0.0%) |
| 9:00 AM to 9:59 AM | 0 (0.0%) | 2 (8.3%) |
| 10:00 AM to 10:59 AM | 0 (0.0%) | 5 (20.8%) |
| 11:00 AM to 11:59 AM | 0 (0.0%) | 0 (0.0%) |
| 12:00 PM to 3:59 PM | 0 (0.0%) | 0 (0.0%) |
| 4:00 PM to 11:59 PM | 0 (0.0%) | 6 (25.0%) |
| Total | 17 (100.0%) | 24 (100.0%) |
Housing Occupancy in Wellston
Occupancy by Ownership in Wellston
Of the total 101 dwellings in Wellston, owner-occupied units account for 81 (80.2%), while renter-occupied units make up 20 (19.8%).
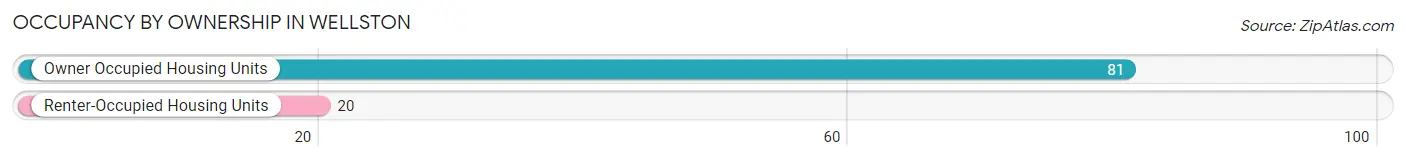
| Occupancy | # Housing Units | % Housing Units |
| Owner Occupied Housing Units | 81 | 80.2% |
| Renter-Occupied Housing Units | 20 | 19.8% |
| Total Occupied Housing Units | 101 | 100.0% |
Occupancy by Household Size in Wellston
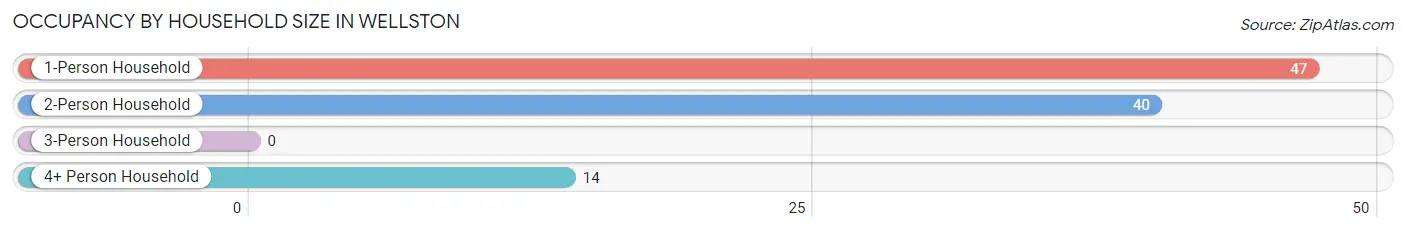
| Household Size | # Housing Units | % Housing Units |
| 1-Person Household | 47 | 46.5% |
| 2-Person Household | 40 | 39.6% |
| 3-Person Household | 0 | 0.0% |
| 4+ Person Household | 14 | 13.9% |
| Total Housing Units | 101 | 100.0% |
Occupancy by Ownership by Household Size in Wellston
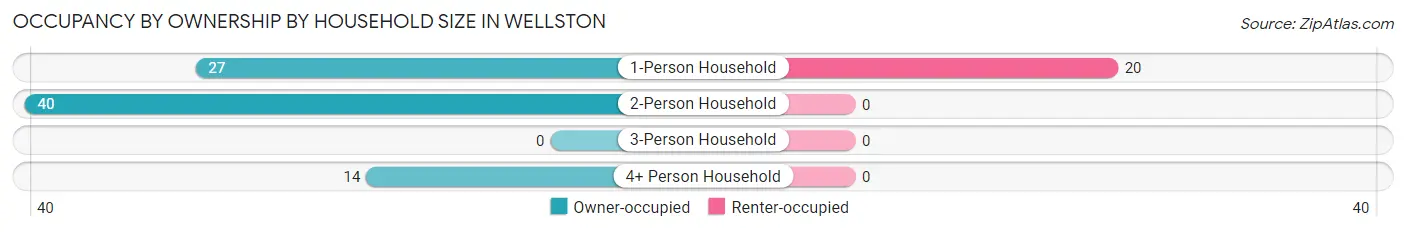
| Household Size | Owner-occupied | Renter-occupied |
| 1-Person Household | 27 (57.5%) | 20 (42.5%) |
| 2-Person Household | 40 (100.0%) | 0 (0.0%) |
| 3-Person Household | 0 (0.0%) | 0 (0.0%) |
| 4+ Person Household | 14 (100.0%) | 0 (0.0%) |
| Total Housing Units | 81 (80.2%) | 20 (19.8%) |
Occupancy by Educational Attainment in Wellston
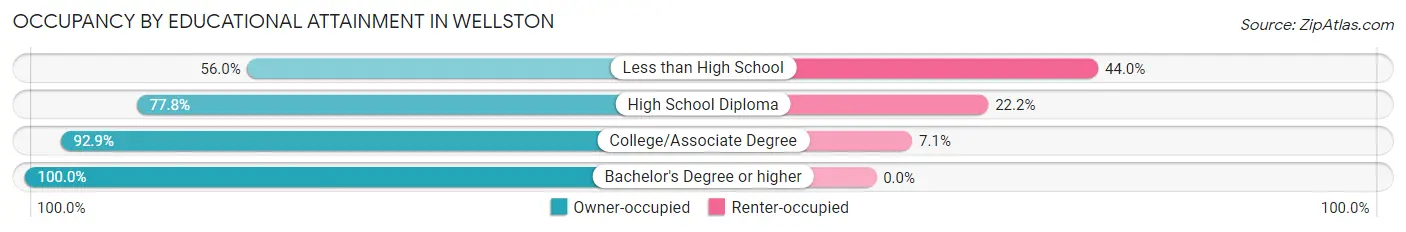
| Household Size | Owner-occupied | Renter-occupied |
| Less than High School | 14 (56.0%) | 11 (44.0%) |
| High School Diploma | 21 (77.8%) | 6 (22.2%) |
| College/Associate Degree | 39 (92.9%) | 3 (7.1%) |
| Bachelor's Degree or higher | 7 (100.0%) | 0 (0.0%) |
Occupancy by Age of Householder in Wellston
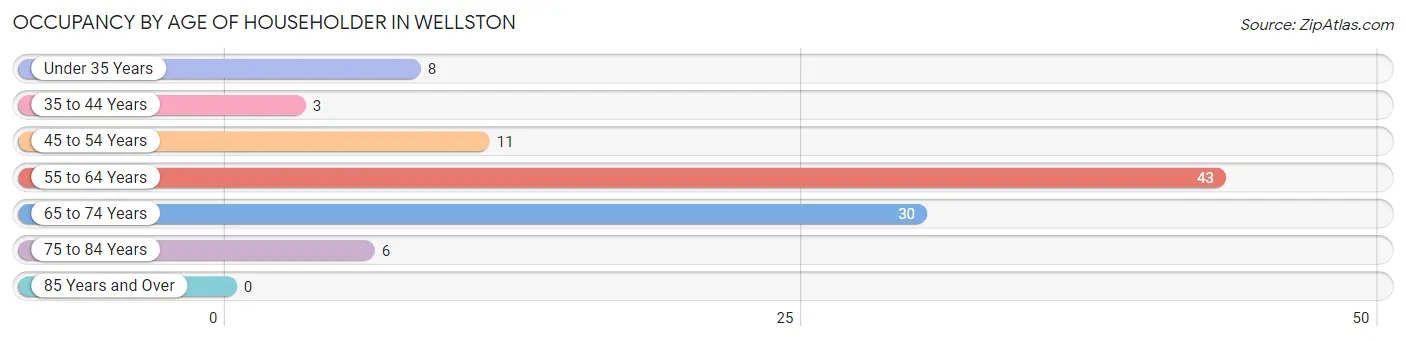
| Age Bracket | # Households | % Households |
| Under 35 Years | 8 | 7.9% |
| 35 to 44 Years | 3 | 3.0% |
| 45 to 54 Years | 11 | 10.9% |
| 55 to 64 Years | 43 | 42.6% |
| 65 to 74 Years | 30 | 29.7% |
| 75 to 84 Years | 6 | 5.9% |
| 85 Years and Over | 0 | 0.0% |
| Total | 101 | 100.0% |
Housing Finances in Wellston
Median Income by Occupancy in Wellston
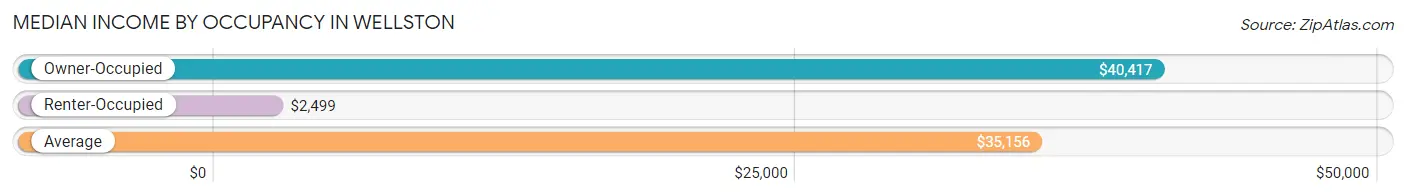
| Occupancy Type | # Households | Median Income |
| Owner-Occupied | 81 (80.2%) | $40,417 |
| Renter-Occupied | 20 (19.8%) | $2,499 |
| Average | 101 (100.0%) | $35,156 |
Occupancy by Householder Income Bracket in Wellston
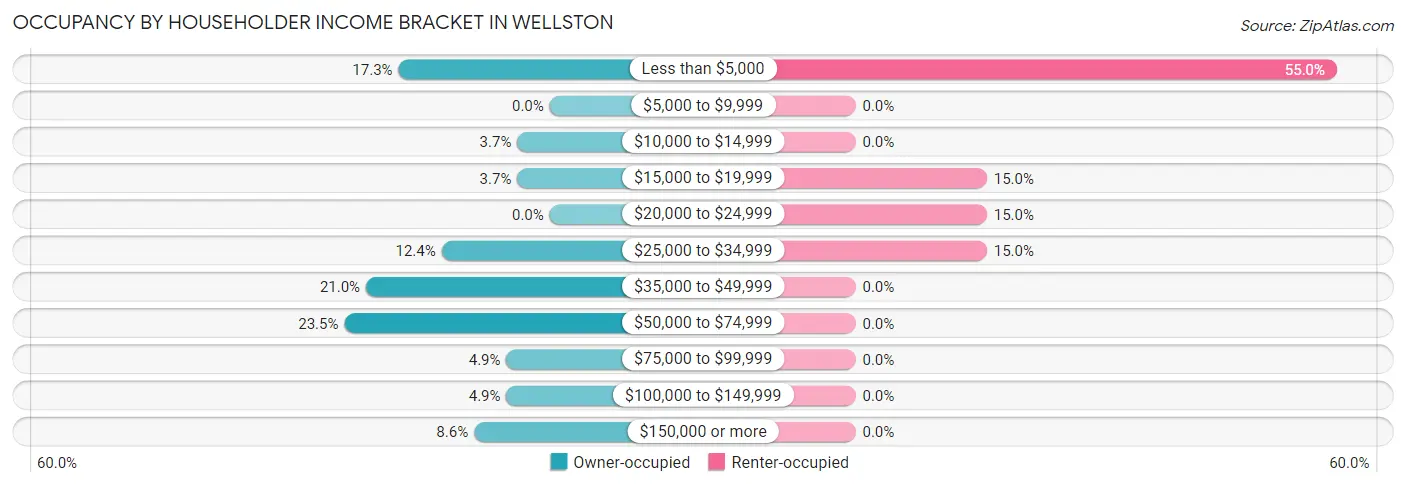
| Income Bracket | Owner-occupied | Renter-occupied |
| Less than $5,000 | 14 (17.3%) | 11 (55.0%) |
| $5,000 to $9,999 | 0 (0.0%) | 0 (0.0%) |
| $10,000 to $14,999 | 3 (3.7%) | 0 (0.0%) |
| $15,000 to $19,999 | 3 (3.7%) | 3 (15.0%) |
| $20,000 to $24,999 | 0 (0.0%) | 3 (15.0%) |
| $25,000 to $34,999 | 10 (12.3%) | 3 (15.0%) |
| $35,000 to $49,999 | 17 (21.0%) | 0 (0.0%) |
| $50,000 to $74,999 | 19 (23.5%) | 0 (0.0%) |
| $75,000 to $99,999 | 4 (4.9%) | 0 (0.0%) |
| $100,000 to $149,999 | 4 (4.9%) | 0 (0.0%) |
| $150,000 or more | 7 (8.6%) | 0 (0.0%) |
| Total | 81 (100.0%) | 20 (100.0%) |
Monthly Housing Cost Tiers in Wellston
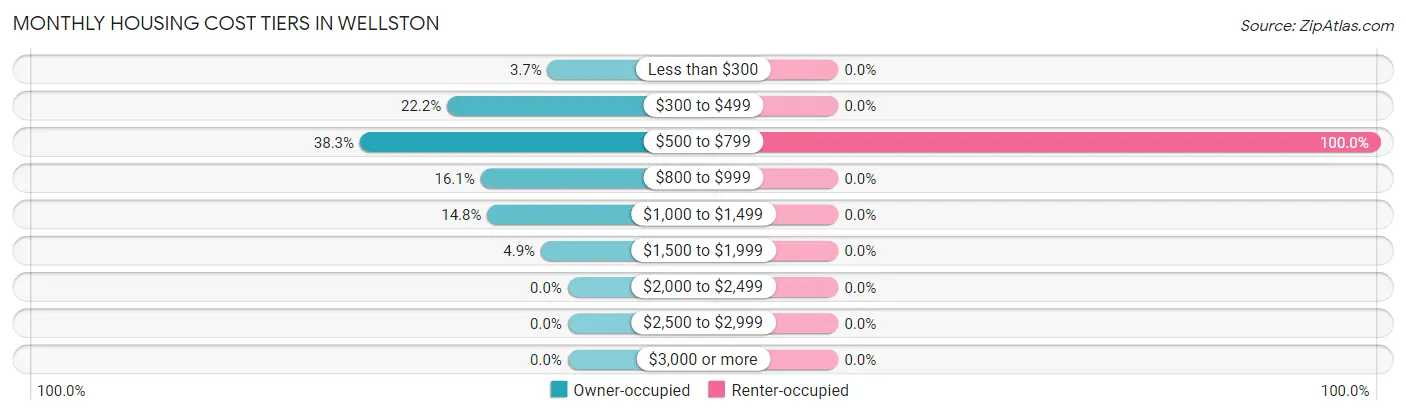
| Monthly Cost | Owner-occupied | Renter-occupied |
| Less than $300 | 3 (3.7%) | 0 (0.0%) |
| $300 to $499 | 18 (22.2%) | 0 (0.0%) |
| $500 to $799 | 31 (38.3%) | 20 (100.0%) |
| $800 to $999 | 13 (16.1%) | 0 (0.0%) |
| $1,000 to $1,499 | 12 (14.8%) | 0 (0.0%) |
| $1,500 to $1,999 | 4 (4.9%) | 0 (0.0%) |
| $2,000 to $2,499 | 0 (0.0%) | 0 (0.0%) |
| $2,500 to $2,999 | 0 (0.0%) | 0 (0.0%) |
| $3,000 or more | 0 (0.0%) | 0 (0.0%) |
| Total | 81 (100.0%) | 20 (100.0%) |
Physical Housing Characteristics in Wellston
Housing Structures in Wellston
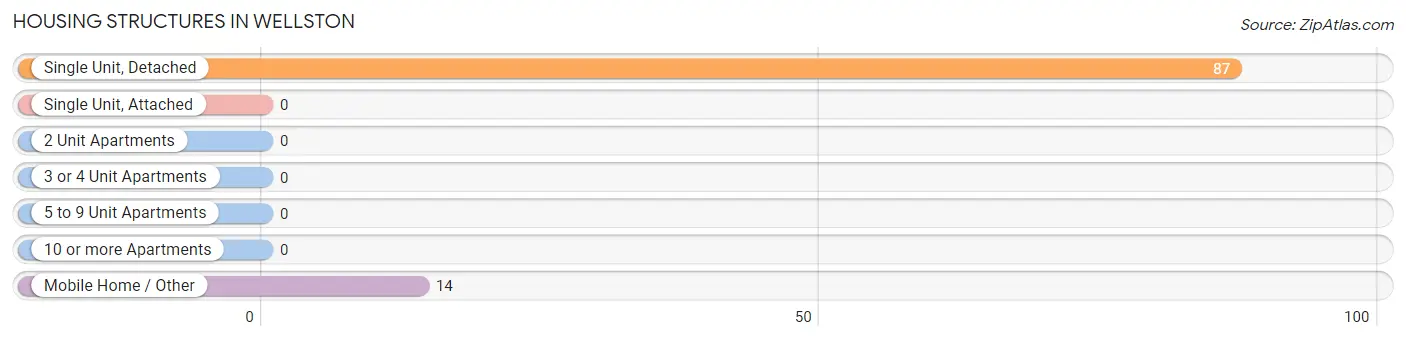
| Structure Type | # Housing Units | % Housing Units |
| Single Unit, Detached | 87 | 86.1% |
| Single Unit, Attached | 0 | 0.0% |
| 2 Unit Apartments | 0 | 0.0% |
| 3 or 4 Unit Apartments | 0 | 0.0% |
| 5 to 9 Unit Apartments | 0 | 0.0% |
| 10 or more Apartments | 0 | 0.0% |
| Mobile Home / Other | 14 | 13.9% |
| Total | 101 | 100.0% |
Housing Structures by Occupancy in Wellston
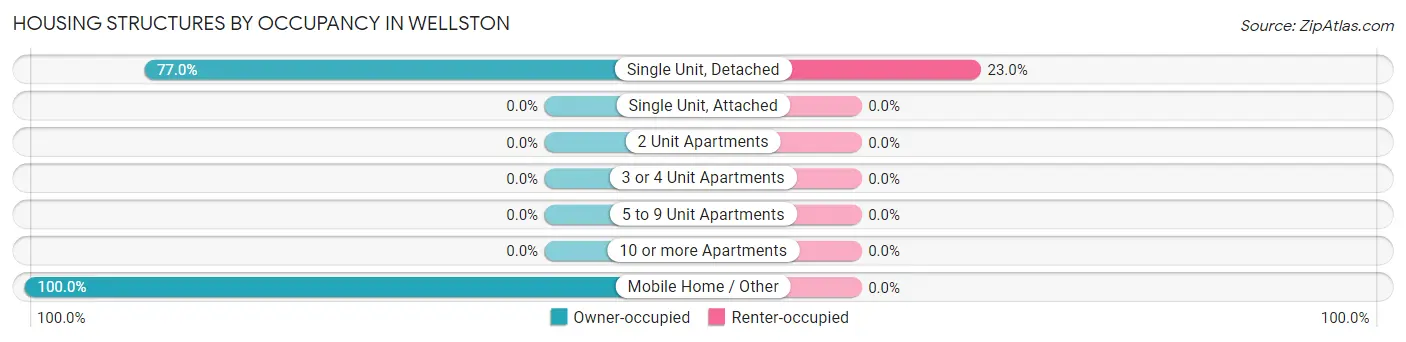
| Structure Type | Owner-occupied | Renter-occupied |
| Single Unit, Detached | 67 (77.0%) | 20 (23.0%) |
| Single Unit, Attached | 0 (0.0%) | 0 (0.0%) |
| 2 Unit Apartments | 0 (0.0%) | 0 (0.0%) |
| 3 or 4 Unit Apartments | 0 (0.0%) | 0 (0.0%) |
| 5 to 9 Unit Apartments | 0 (0.0%) | 0 (0.0%) |
| 10 or more Apartments | 0 (0.0%) | 0 (0.0%) |
| Mobile Home / Other | 14 (100.0%) | 0 (0.0%) |
| Total | 81 (80.2%) | 20 (19.8%) |
Housing Structures by Number of Rooms in Wellston
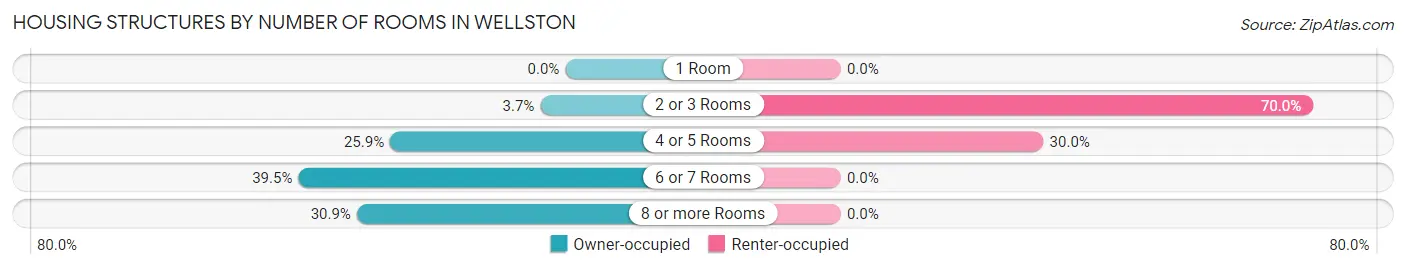
| Number of Rooms | Owner-occupied | Renter-occupied |
| 1 Room | 0 (0.0%) | 0 (0.0%) |
| 2 or 3 Rooms | 3 (3.7%) | 14 (70.0%) |
| 4 or 5 Rooms | 21 (25.9%) | 6 (30.0%) |
| 6 or 7 Rooms | 32 (39.5%) | 0 (0.0%) |
| 8 or more Rooms | 25 (30.9%) | 0 (0.0%) |
| Total | 81 (100.0%) | 20 (100.0%) |
Housing Structure by Heating Type in Wellston
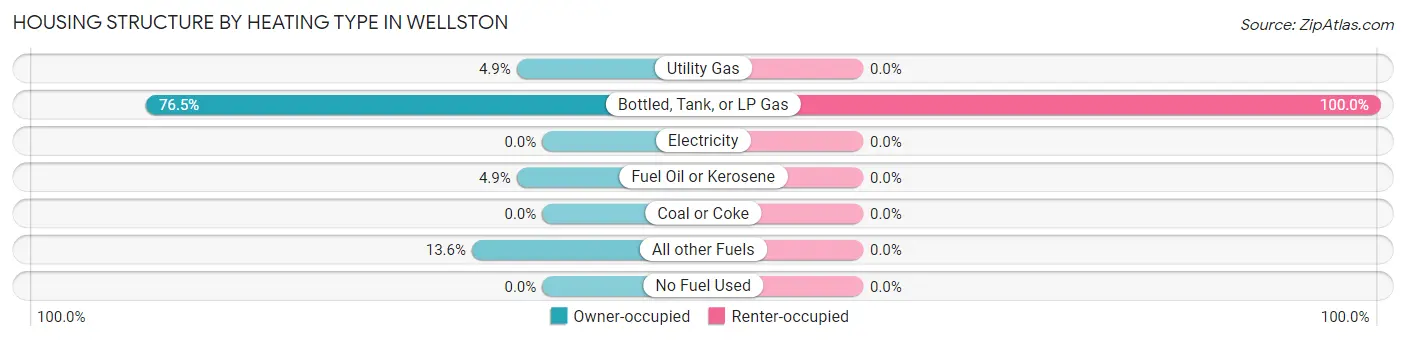
| Heating Type | Owner-occupied | Renter-occupied |
| Utility Gas | 4 (4.9%) | 0 (0.0%) |
| Bottled, Tank, or LP Gas | 62 (76.5%) | 20 (100.0%) |
| Electricity | 0 (0.0%) | 0 (0.0%) |
| Fuel Oil or Kerosene | 4 (4.9%) | 0 (0.0%) |
| Coal or Coke | 0 (0.0%) | 0 (0.0%) |
| All other Fuels | 11 (13.6%) | 0 (0.0%) |
| No Fuel Used | 0 (0.0%) | 0 (0.0%) |
| Total | 81 (100.0%) | 20 (100.0%) |
Household Vehicle Usage in Wellston
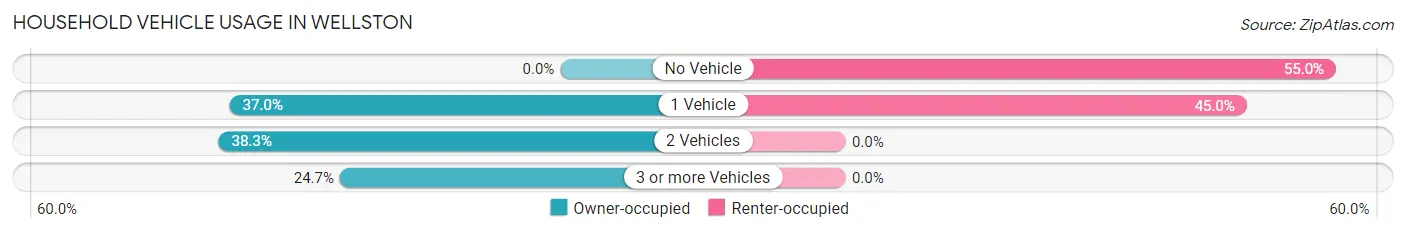
| Vehicles per Household | Owner-occupied | Renter-occupied |
| No Vehicle | 0 (0.0%) | 11 (55.0%) |
| 1 Vehicle | 30 (37.0%) | 9 (45.0%) |
| 2 Vehicles | 31 (38.3%) | 0 (0.0%) |
| 3 or more Vehicles | 20 (24.7%) | 0 (0.0%) |
| Total | 81 (100.0%) | 20 (100.0%) |
Real Estate & Mortgages in Wellston
Real Estate and Mortgage Overview in Wellston
| Characteristic | Without Mortgage | With Mortgage |
| Housing Units | 38 | 43 |
| Median Property Value | $55,000 | $109,400 |
| Median Household Income | $26,071 | $7 |
| Monthly Housing Costs | $471 | $0 |
| Real Estate Taxes | $850 | $0 |
Property Value by Mortgage Status in Wellston
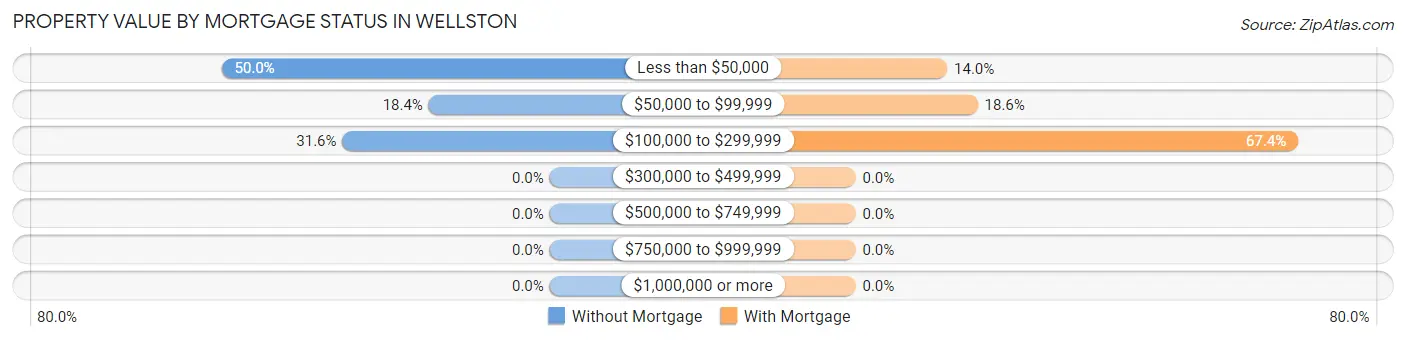
| Property Value | Without Mortgage | With Mortgage |
| Less than $50,000 | 19 (50.0%) | 6 (14.0%) |
| $50,000 to $99,999 | 7 (18.4%) | 8 (18.6%) |
| $100,000 to $299,999 | 12 (31.6%) | 29 (67.4%) |
| $300,000 to $499,999 | 0 (0.0%) | 0 (0.0%) |
| $500,000 to $749,999 | 0 (0.0%) | 0 (0.0%) |
| $750,000 to $999,999 | 0 (0.0%) | 0 (0.0%) |
| $1,000,000 or more | 0 (0.0%) | 0 (0.0%) |
| Total | 38 (100.0%) | 43 (100.0%) |
Household Income by Mortgage Status in Wellston
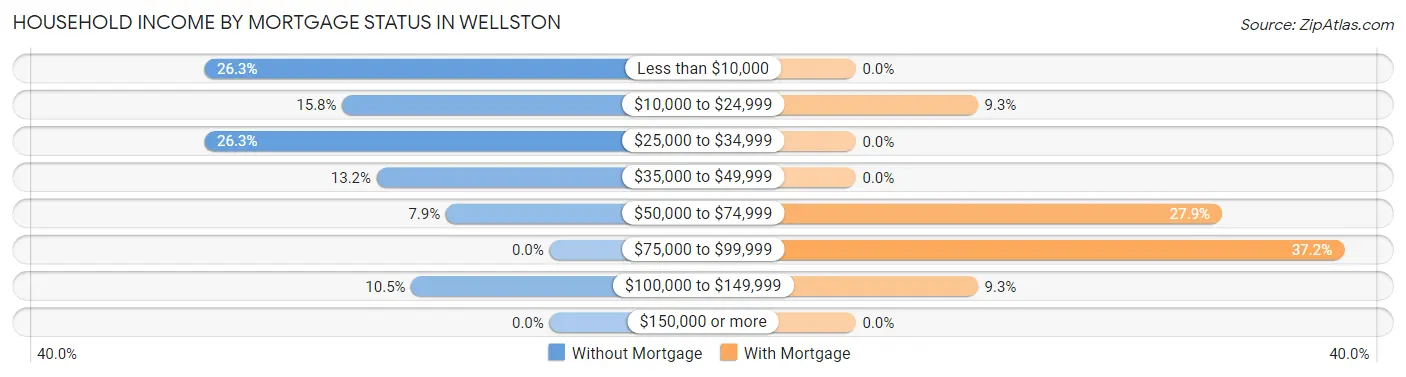
| Household Income | Without Mortgage | With Mortgage |
| Less than $10,000 | 10 (26.3%) | 0 (0.0%) |
| $10,000 to $24,999 | 6 (15.8%) | 4 (9.3%) |
| $25,000 to $34,999 | 10 (26.3%) | 0 (0.0%) |
| $35,000 to $49,999 | 5 (13.2%) | 0 (0.0%) |
| $50,000 to $74,999 | 3 (7.9%) | 12 (27.9%) |
| $75,000 to $99,999 | 0 (0.0%) | 16 (37.2%) |
| $100,000 to $149,999 | 4 (10.5%) | 4 (9.3%) |
| $150,000 or more | 0 (0.0%) | 0 (0.0%) |
| Total | 38 (100.0%) | 43 (100.0%) |
Property Value to Household Income Ratio in Wellston
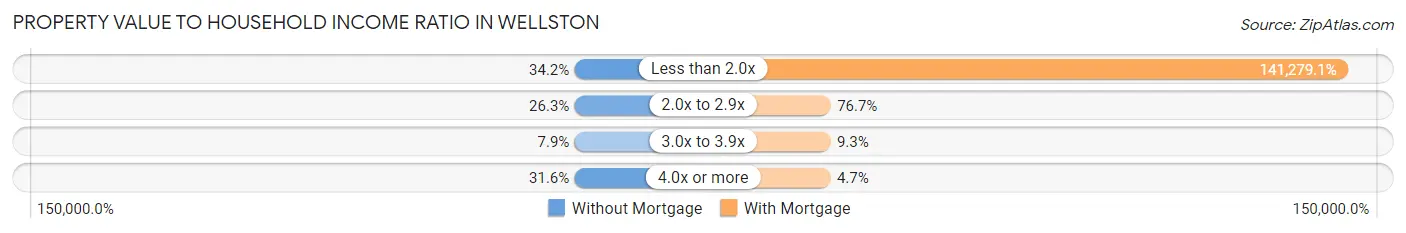
| Value-to-Income Ratio | Without Mortgage | With Mortgage |
| Less than 2.0x | 13 (34.2%) | 60,750 (141,279.1%) |
| 2.0x to 2.9x | 10 (26.3%) | 33 (76.7%) |
| 3.0x to 3.9x | 3 (7.9%) | 4 (9.3%) |
| 4.0x or more | 12 (31.6%) | 2 (4.6%) |
| Total | 38 (100.0%) | 43 (100.0%) |
Real Estate Taxes by Mortgage Status in Wellston
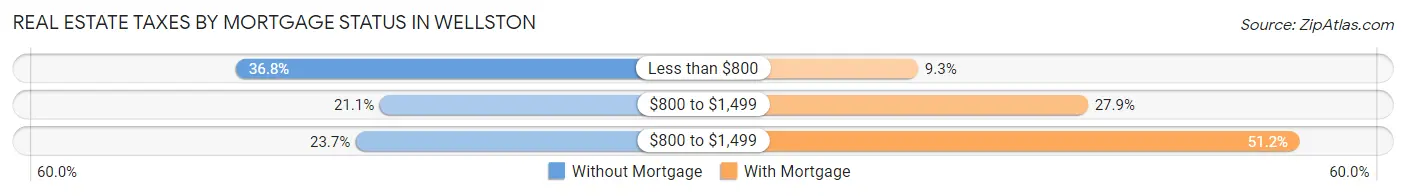
| Property Taxes | Without Mortgage | With Mortgage |
| Less than $800 | 14 (36.8%) | 4 (9.3%) |
| $800 to $1,499 | 8 (21.0%) | 12 (27.9%) |
| $800 to $1,499 | 9 (23.7%) | 22 (51.2%) |
| Total | 38 (100.0%) | 43 (100.0%) |
Health & Disability in Wellston
Health Insurance Coverage by Age in Wellston
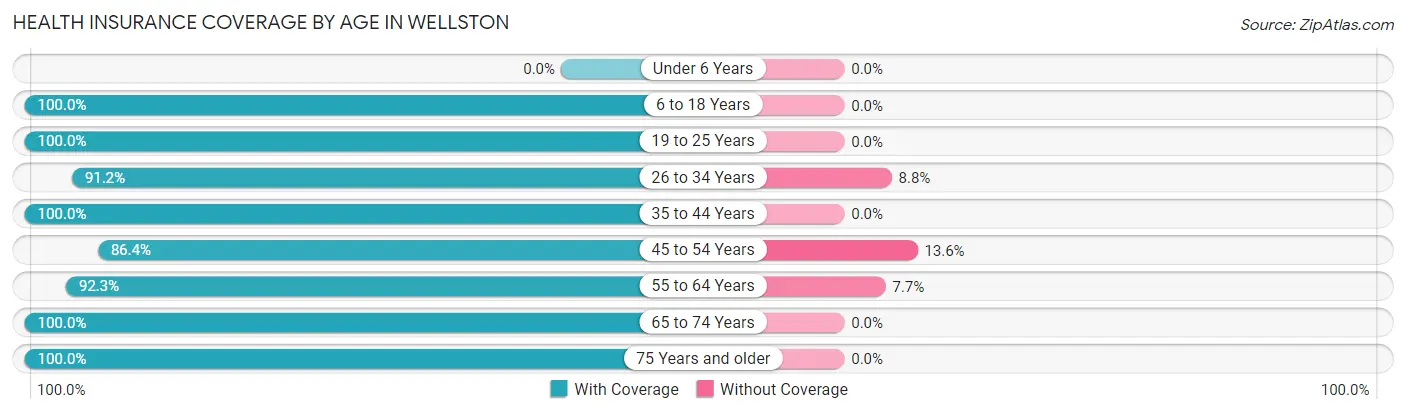
| Age Bracket | With Coverage | Without Coverage |
| Under 6 Years | 0 (0.0%) | 0 (0.0%) |
| 6 to 18 Years | 30 (100.0%) | 0 (0.0%) |
| 19 to 25 Years | 25 (100.0%) | 0 (0.0%) |
| 26 to 34 Years | 31 (91.2%) | 3 (8.8%) |
| 35 to 44 Years | 8 (100.0%) | 0 (0.0%) |
| 45 to 54 Years | 19 (86.4%) | 3 (13.6%) |
| 55 to 64 Years | 48 (92.3%) | 4 (7.7%) |
| 65 to 74 Years | 36 (100.0%) | 0 (0.0%) |
| 75 Years and older | 17 (100.0%) | 0 (0.0%) |
| Total | 214 (95.5%) | 10 (4.5%) |
Health Insurance Coverage by Citizenship Status in Wellston
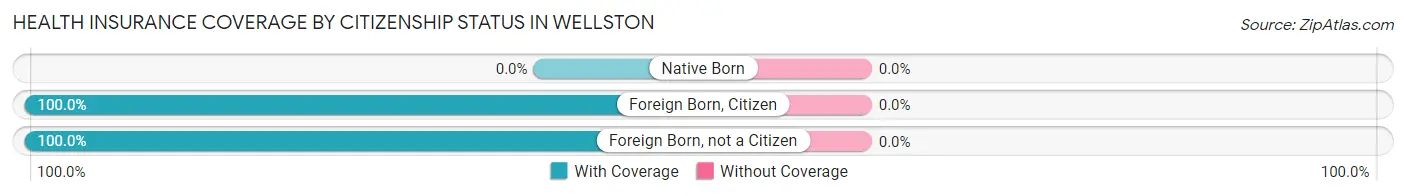
| Citizenship Status | With Coverage | Without Coverage |
| Native Born | 0 (0.0%) | 0 (0.0%) |
| Foreign Born, Citizen | 30 (100.0%) | 0 (0.0%) |
| Foreign Born, not a Citizen | 25 (100.0%) | 0 (0.0%) |
Health Insurance Coverage by Household Income in Wellston
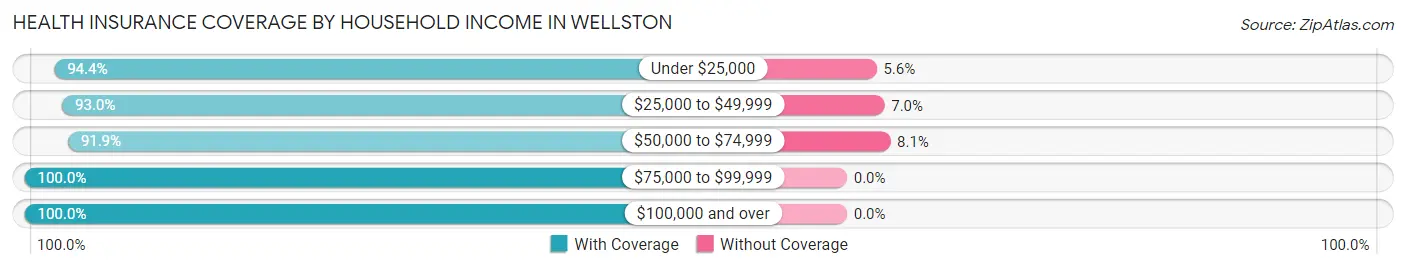
| Household Income | With Coverage | Without Coverage |
| Under $25,000 | 51 (94.4%) | 3 (5.6%) |
| $25,000 to $49,999 | 53 (93.0%) | 4 (7.0%) |
| $50,000 to $74,999 | 34 (91.9%) | 3 (8.1%) |
| $75,000 to $99,999 | 8 (100.0%) | 0 (0.0%) |
| $100,000 and over | 68 (100.0%) | 0 (0.0%) |
Public vs Private Health Insurance Coverage by Age in Wellston
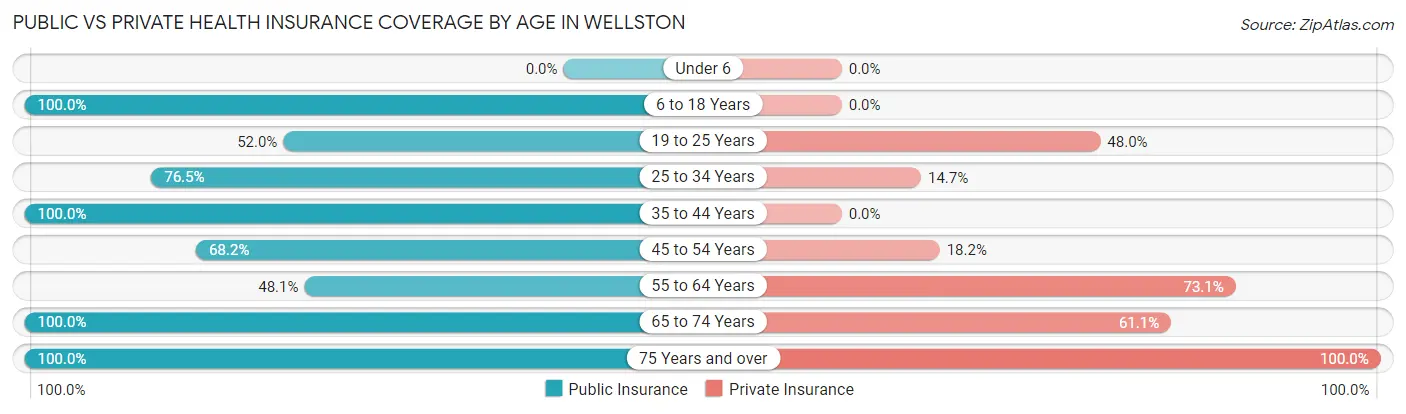
| Age Bracket | Public Insurance | Private Insurance |
| Under 6 | 0 (0.0%) | 0 (0.0%) |
| 6 to 18 Years | 30 (100.0%) | 0 (0.0%) |
| 19 to 25 Years | 13 (52.0%) | 12 (48.0%) |
| 25 to 34 Years | 26 (76.5%) | 5 (14.7%) |
| 35 to 44 Years | 8 (100.0%) | 0 (0.0%) |
| 45 to 54 Years | 15 (68.2%) | 4 (18.2%) |
| 55 to 64 Years | 25 (48.1%) | 38 (73.1%) |
| 65 to 74 Years | 36 (100.0%) | 22 (61.1%) |
| 75 Years and over | 17 (100.0%) | 17 (100.0%) |
| Total | 170 (75.9%) | 98 (43.8%) |
Disability Status by Sex by Age in Wellston
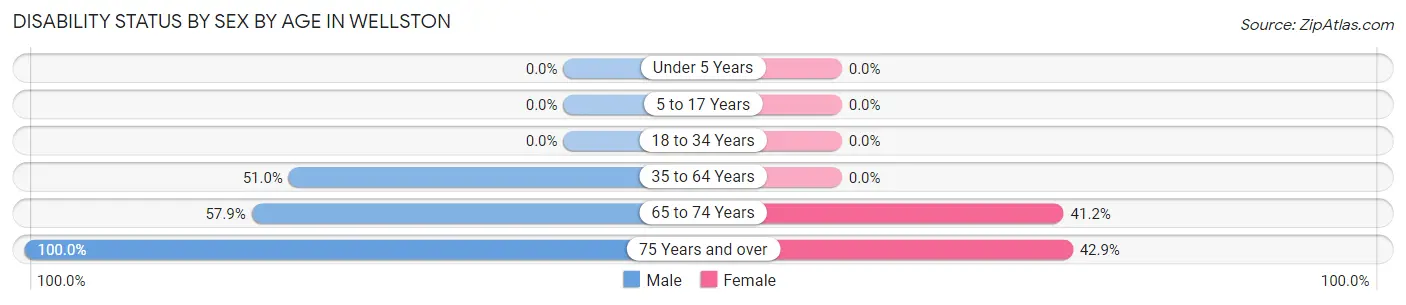
| Age Bracket | Male | Female |
| Under 5 Years | 0 (0.0%) | 0 (0.0%) |
| 5 to 17 Years | 0 (0.0%) | 0 (0.0%) |
| 18 to 34 Years | 0 (0.0%) | 0 (0.0%) |
| 35 to 64 Years | 26 (51.0%) | 0 (0.0%) |
| 65 to 74 Years | 11 (57.9%) | 7 (41.2%) |
| 75 Years and over | 10 (100.0%) | 3 (42.9%) |
Disability Class by Sex by Age in Wellston
Disability Class: Hearing Difficulty
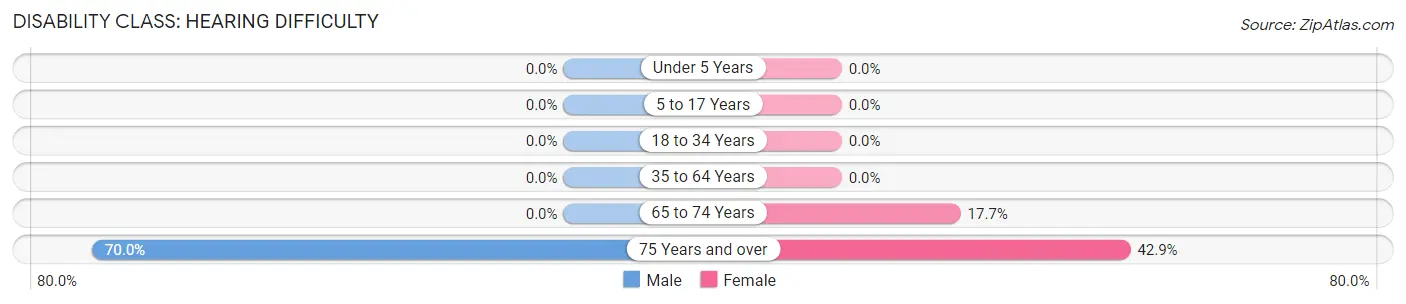
| Age Bracket | Male | Female |
| Under 5 Years | 0 (0.0%) | 0 (0.0%) |
| 5 to 17 Years | 0 (0.0%) | 0 (0.0%) |
| 18 to 34 Years | 0 (0.0%) | 0 (0.0%) |
| 35 to 64 Years | 0 (0.0%) | 0 (0.0%) |
| 65 to 74 Years | 0 (0.0%) | 3 (17.6%) |
| 75 Years and over | 7 (70.0%) | 3 (42.9%) |
Disability Class: Vision Difficulty
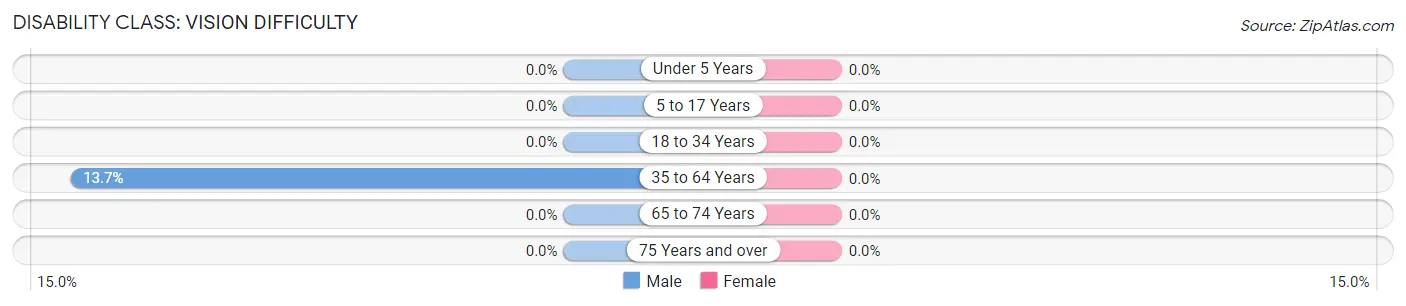
| Age Bracket | Male | Female |
| Under 5 Years | 0 (0.0%) | 0 (0.0%) |
| 5 to 17 Years | 0 (0.0%) | 0 (0.0%) |
| 18 to 34 Years | 0 (0.0%) | 0 (0.0%) |
| 35 to 64 Years | 7 (13.7%) | 0 (0.0%) |
| 65 to 74 Years | 0 (0.0%) | 0 (0.0%) |
| 75 Years and over | 0 (0.0%) | 0 (0.0%) |
Disability Class: Cognitive Difficulty
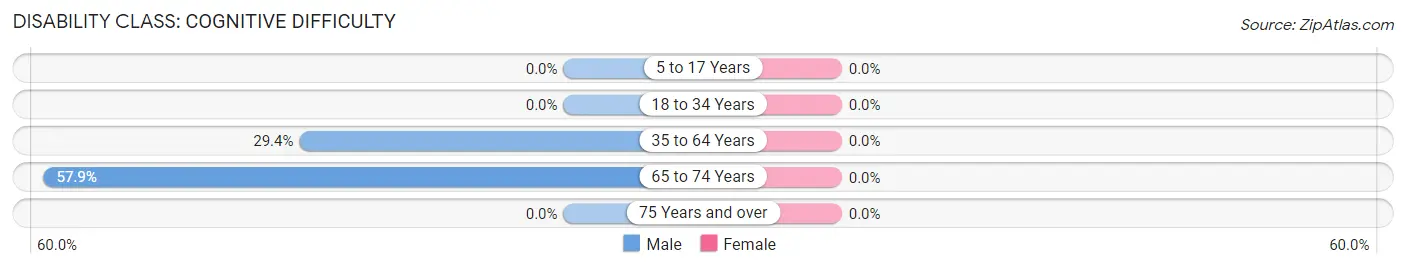
| Age Bracket | Male | Female |
| 5 to 17 Years | 0 (0.0%) | 0 (0.0%) |
| 18 to 34 Years | 0 (0.0%) | 0 (0.0%) |
| 35 to 64 Years | 15 (29.4%) | 0 (0.0%) |
| 65 to 74 Years | 11 (57.9%) | 0 (0.0%) |
| 75 Years and over | 0 (0.0%) | 0 (0.0%) |
Disability Class: Ambulatory Difficulty
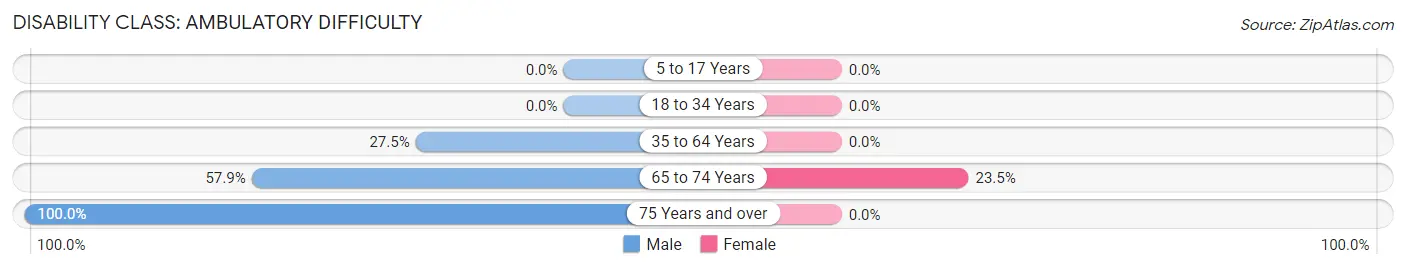
| Age Bracket | Male | Female |
| 5 to 17 Years | 0 (0.0%) | 0 (0.0%) |
| 18 to 34 Years | 0 (0.0%) | 0 (0.0%) |
| 35 to 64 Years | 14 (27.5%) | 0 (0.0%) |
| 65 to 74 Years | 11 (57.9%) | 4 (23.5%) |
| 75 Years and over | 10 (100.0%) | 0 (0.0%) |
Disability Class: Self-Care Difficulty
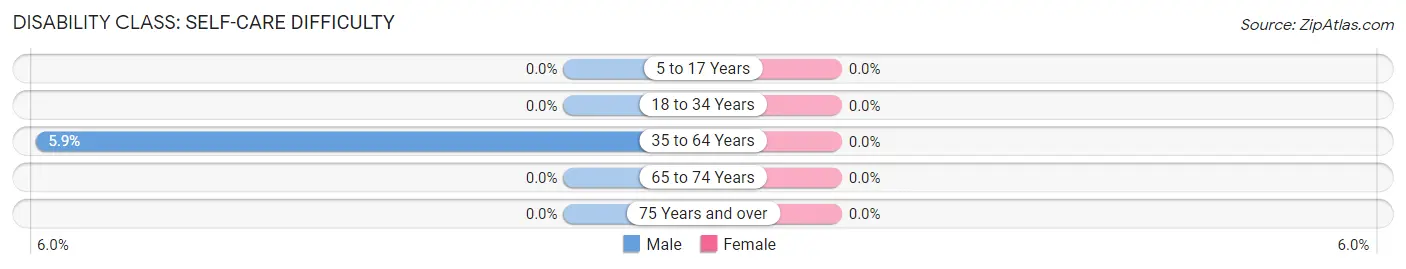
| Age Bracket | Male | Female |
| 5 to 17 Years | 0 (0.0%) | 0 (0.0%) |
| 18 to 34 Years | 0 (0.0%) | 0 (0.0%) |
| 35 to 64 Years | 3 (5.9%) | 0 (0.0%) |
| 65 to 74 Years | 0 (0.0%) | 0 (0.0%) |
| 75 Years and over | 0 (0.0%) | 0 (0.0%) |
Technology Access in Wellston
Computing Device Access in Wellston
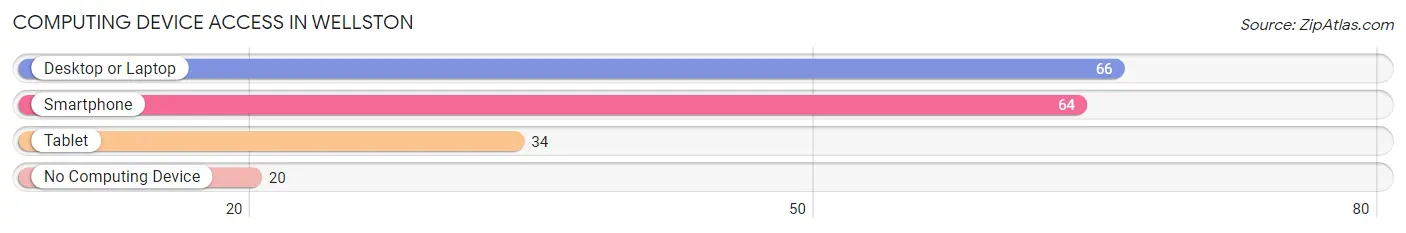
| Device Type | # Households | % Households |
| Desktop or Laptop | 66 | 65.3% |
| Smartphone | 64 | 63.4% |
| Tablet | 34 | 33.7% |
| No Computing Device | 20 | 19.8% |
| Total | 101 | 100.0% |
Internet Access in Wellston
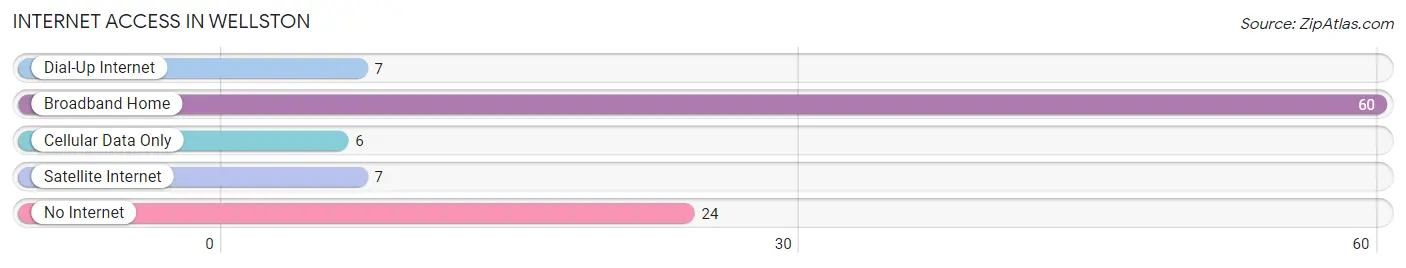
| Internet Type | # Households | % Households |
| Dial-Up Internet | 7 | 6.9% |
| Broadband Home | 60 | 59.4% |
| Cellular Data Only | 6 | 5.9% |
| Satellite Internet | 7 | 6.9% |
| No Internet | 24 | 23.8% |
| Total | 101 | 100.0% |
Wellston Summary
Wellston, Michigan is a small town located in Manistee County, Michigan. It is situated on the eastern shore of Lake Michigan, about 25 miles north of Manistee. The town was founded in 1871 and has a population of approximately 1,000 people.
History
Wellston was founded in 1871 by a group of settlers from the nearby town of Manistee. The settlers were looking for a place to settle and start a new life. The town was named after the first settler, William Wellston, who was a lumberman. The town was originally a logging and fishing community, but soon became a popular tourist destination.
The town was incorporated in 1891 and the first mayor was elected in 1892. The town grew steadily over the years and by the early 1900s, it had become a popular summer resort destination. The town was known for its beautiful beaches and its many resorts.
In the 1950s, the town began to decline as the logging industry declined and the tourist industry shifted to other areas. The town was hit hard by the Great Recession of 2008 and many businesses closed. However, the town has since recovered and is now a popular destination for tourists and retirees.
Geography
Wellston is located on the eastern shore of Lake Michigan, about 25 miles north of Manistee. The town is situated on a peninsula, surrounded by the lake on three sides. The town is bordered by the Manistee National Forest to the north and the Pere Marquette State Forest to the south.
The town is located in a temperate climate, with warm summers and cold winters. The average temperature in the summer is around 70 degrees Fahrenheit and the average temperature in the winter is around 30 degrees Fahrenheit.
Economy
The economy of Wellston is largely based on tourism and retirement. The town is a popular destination for tourists and retirees, who come to enjoy the beautiful beaches and the many resorts. The town also has a number of small businesses, including restaurants, shops, and other services.
The town is also home to a number of manufacturing companies, including a paper mill and a furniture factory. The town is also home to a number of farms, which produce a variety of crops, including apples, cherries, and other fruits and vegetables.
Demographics
As of the 2010 census, the population of Wellston was 1,000 people. The town is predominantly white, with about 95% of the population being white. The town also has a small Hispanic population, with about 4% of the population being Hispanic. The median household income in the town is $37,000, which is slightly lower than the national average.
Conclusion
Wellston, Michigan is a small town located on the eastern shore of Lake Michigan. The town was founded in 1871 and has a population of approximately 1,000 people. The town is a popular destination for tourists and retirees, and the economy is largely based on tourism and retirement. The town is predominantly white, with a small Hispanic population. The median household income in the town is slightly lower than the national average.
Common Questions
What is Per Capita Income in Wellston?
Per Capita income in Wellston is $21,118.
What is the Median Family Income in Wellston?
Median Family Income in Wellston is $57,500.
What is the Median Household income in Wellston?
Median Household Income in Wellston is $35,156.
What is Income or Wage Gap in Wellston?
Income or Wage Gap in Wellston is 32.5%.
Women in Wellston earn 67.5 cents for every dollar earned by a man.
What is Inequality or Gini Index in Wellston?
Inequality or Gini Index in Wellston is 0.51.
What is the Total Population of Wellston?
Total Population of Wellston is 224.
What is the Total Male Population of Wellston?
Total Male Population of Wellston is 117.
What is the Total Female Population of Wellston?
Total Female Population of Wellston is 107.
What is the Ratio of Males per 100 Females in Wellston?
There are 109.35 Males per 100 Females in Wellston.
What is the Ratio of Females per 100 Males in Wellston?
There are 91.45 Females per 100 Males in Wellston.
What is the Median Population Age in Wellston?
Median Population Age in Wellston is 48.0 Years.
What is the Average Family Size in Wellston
Average Family Size in Wellston is 3.2 People.
What is the Average Household Size in Wellston
Average Household Size in Wellston is 2.2 People.
How Large is the Labor Force in Wellston?
There are 75 People in the Labor Forcein in Wellston.
What is the Percentage of People in the Labor Force in Wellston?
37.3% of People are in the Labor Force in Wellston.