Luna Pier, MI Map & Demographics
Luna Pier Map
Luna Pier Overview
$33,101
PER CAPITA INCOME
$69,286
AVG FAMILY INCOME
$48,073
AVG HOUSEHOLD INCOME
37.8%
WAGE / INCOME GAP [ % ]
62.2¢/ $1
WAGE / INCOME GAP [ $ ]
0.45
INEQUALITY / GINI INDEX
1,225
TOTAL POPULATION
656
MALE POPULATION
569
FEMALE POPULATION
115.29
MALES / 100 FEMALES
86.74
FEMALES / 100 MALES
52.1
MEDIAN AGE
2.8
AVG FAMILY SIZE
2.0
AVG HOUSEHOLD SIZE
484
LABOR FORCE [ PEOPLE ]
45.9%
PERCENT IN LABOR FORCE
6.8%
UNEMPLOYMENT RATE
Luna Pier Zip Codes
Luna Pier Area Codes
Income in Luna Pier
Income Overview in Luna Pier
Per Capita Income in Luna Pier is $33,101, while median incomes of families and households are $69,286 and $48,073 respectively.
| Characteristic | Number | Measure |
| Per Capita Income | 1,225 | $33,101 |
| Median Family Income | 304 | $69,286 |
| Mean Family Income | 304 | $76,758 |
| Median Household Income | 621 | $48,073 |
| Mean Household Income | 621 | $64,081 |
| Income Deficit | 304 | $0 |
| Wage / Income Gap (%) | 1,225 | 37.78% |
| Wage / Income Gap ($) | 1,225 | 62.22¢ per $1 |
| Gini / Inequality Index | 1,225 | 0.45 |
Earnings by Sex in Luna Pier
Average Earnings in Luna Pier are $37,721, $42,692 for men and $26,563 for women, a difference of 37.8%.
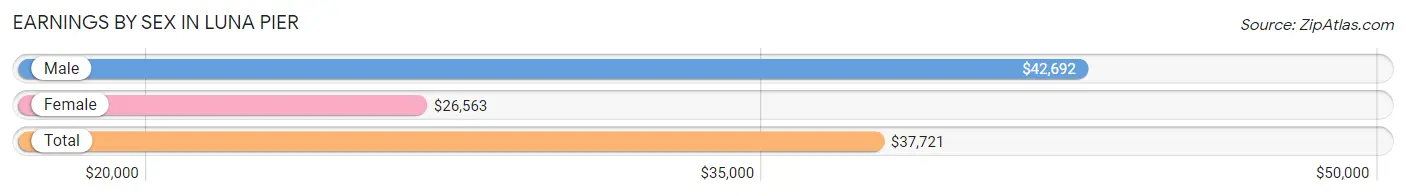
| Sex | Number | Average Earnings |
| Male | 274 (55.3%) | $42,692 |
| Female | 221 (44.7%) | $26,563 |
| Total | 495 (100.0%) | $37,721 |
Earnings by Sex by Income Bracket in Luna Pier
The most common earnings brackets in Luna Pier are $100,000+ for men (64 | 23.4%) and $40,000 to $44,999 for women (30 | 13.6%).
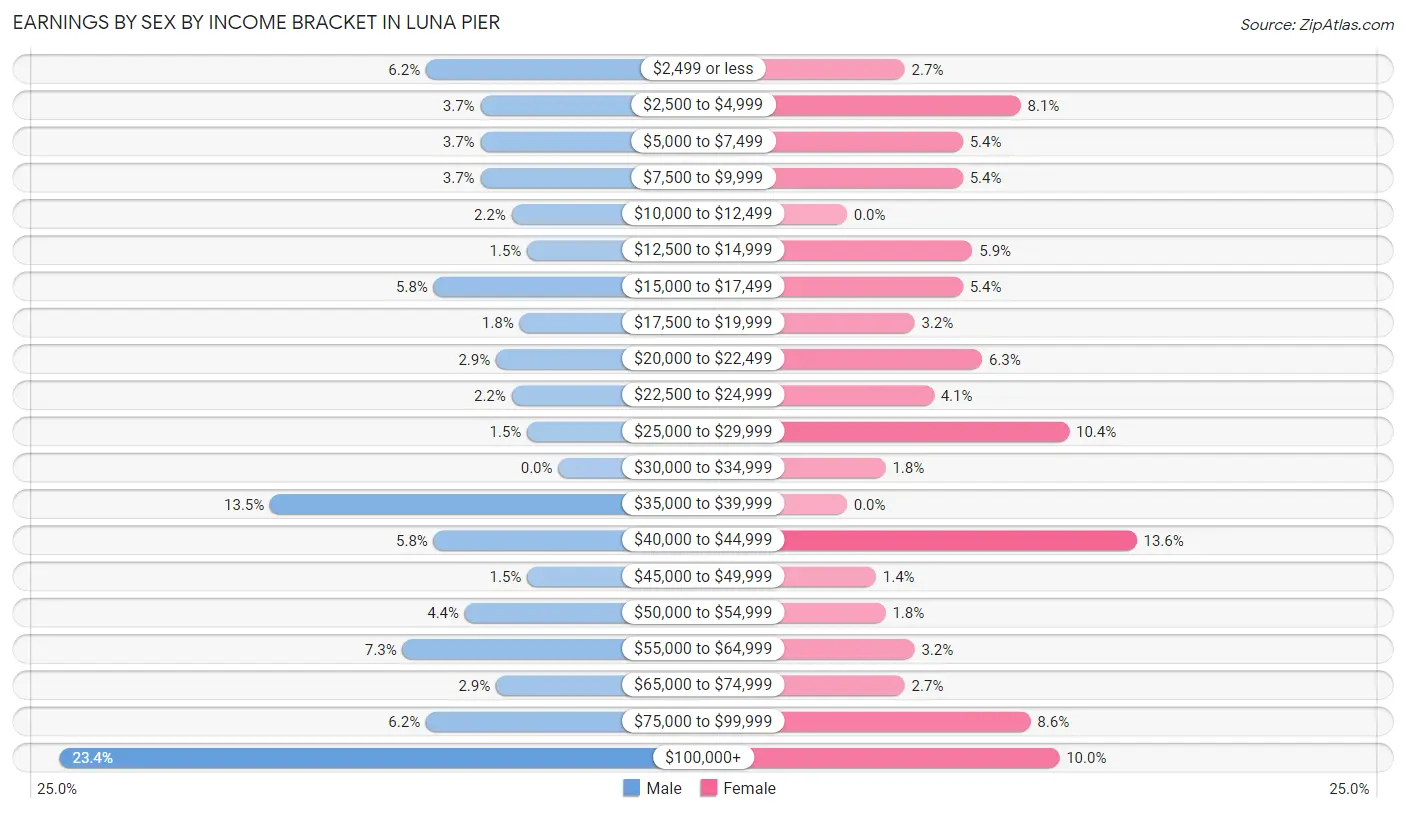
| Income | Male | Female |
| $2,499 or less | 17 (6.2%) | 6 (2.7%) |
| $2,500 to $4,999 | 10 (3.6%) | 18 (8.1%) |
| $5,000 to $7,499 | 10 (3.6%) | 12 (5.4%) |
| $7,500 to $9,999 | 10 (3.6%) | 12 (5.4%) |
| $10,000 to $12,499 | 6 (2.2%) | 0 (0.0%) |
| $12,500 to $14,999 | 4 (1.5%) | 13 (5.9%) |
| $15,000 to $17,499 | 16 (5.8%) | 12 (5.4%) |
| $17,500 to $19,999 | 5 (1.8%) | 7 (3.2%) |
| $20,000 to $22,499 | 8 (2.9%) | 14 (6.3%) |
| $22,500 to $24,999 | 6 (2.2%) | 9 (4.1%) |
| $25,000 to $29,999 | 4 (1.5%) | 23 (10.4%) |
| $30,000 to $34,999 | 0 (0.0%) | 4 (1.8%) |
| $35,000 to $39,999 | 37 (13.5%) | 0 (0.0%) |
| $40,000 to $44,999 | 16 (5.8%) | 30 (13.6%) |
| $45,000 to $49,999 | 4 (1.5%) | 3 (1.4%) |
| $50,000 to $54,999 | 12 (4.4%) | 4 (1.8%) |
| $55,000 to $64,999 | 20 (7.3%) | 7 (3.2%) |
| $65,000 to $74,999 | 8 (2.9%) | 6 (2.7%) |
| $75,000 to $99,999 | 17 (6.2%) | 19 (8.6%) |
| $100,000+ | 64 (23.4%) | 22 (10.0%) |
| Total | 274 (100.0%) | 221 (100.0%) |
Earnings by Sex by Educational Attainment in Luna Pier
Average earnings in Luna Pier are $43,654 for men and $27,614 for women, a difference of 36.7%. Men with an educational attainment of bachelor's degree enjoy the highest average annual earnings of $103,194, while those with college or associate's degree education earn the least with $42,500. Women with an educational attainment of graduate degree earn the most with the average annual earnings of $70,833, while those with college or associate's degree education have the smallest earnings of $25,278.
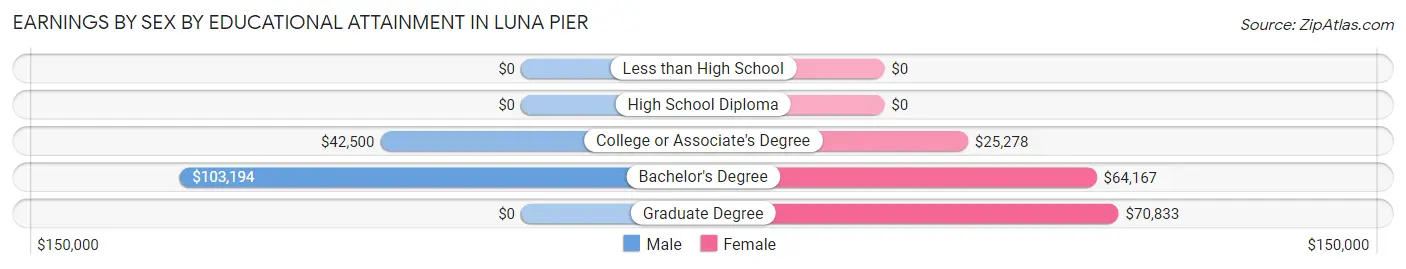
| Educational Attainment | Male Income | Female Income |
| Less than High School | - | - |
| High School Diploma | - | - |
| College or Associate's Degree | $42,500 | $25,278 |
| Bachelor's Degree | $103,194 | $64,167 |
| Graduate Degree | - | - |
| Total | $43,654 | $27,614 |
Family Income in Luna Pier
Family Income Brackets in Luna Pier
According to the Luna Pier family income data, there are 75 families falling into the $100,000 to $149,999 income range, which is the most common income bracket and makes up 24.7% of all families. Conversely, the $10,000 to $14,999 income bracket is the least frequent group with only 6 families (2.0%) belonging to this category.
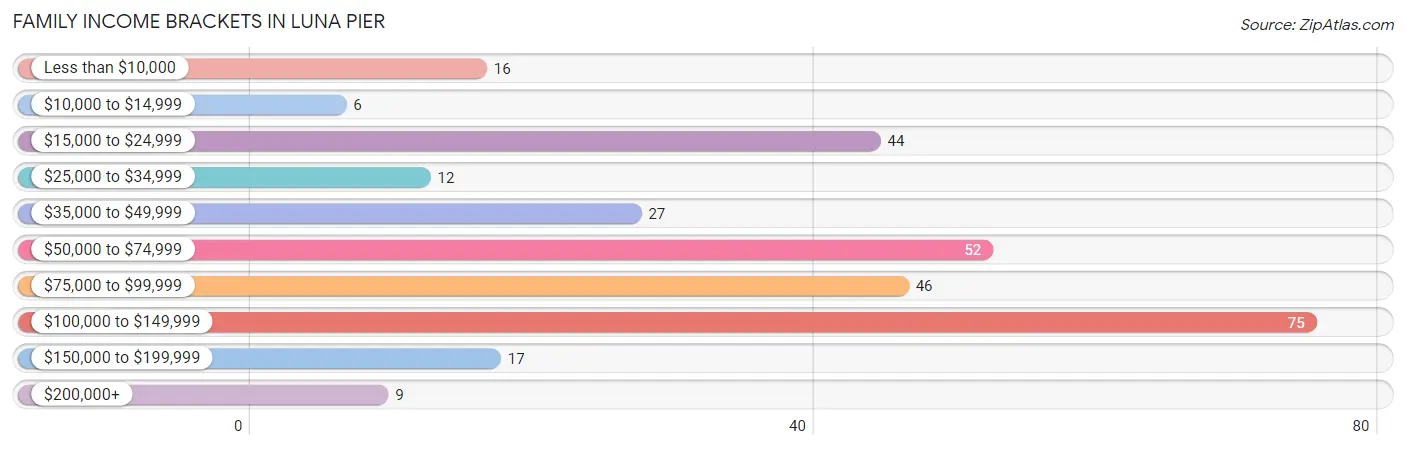
| Income Bracket | # Families | % Families |
| Less than $10,000 | 16 | 5.3% |
| $10,000 to $14,999 | 6 | 2.0% |
| $15,000 to $24,999 | 44 | 14.5% |
| $25,000 to $34,999 | 12 | 3.9% |
| $35,000 to $49,999 | 27 | 8.9% |
| $50,000 to $74,999 | 52 | 17.1% |
| $75,000 to $99,999 | 46 | 15.1% |
| $100,000 to $149,999 | 75 | 24.7% |
| $150,000 to $199,999 | 17 | 5.6% |
| $200,000+ | 9 | 3.0% |
Family Income by Famaliy Size in Luna Pier
2-person families (196 | 64.5%) account for the highest median family income in Luna Pier with $89,773 per family, while 2-person families (196 | 64.5%) have the highest median income of $44,886 per family member.
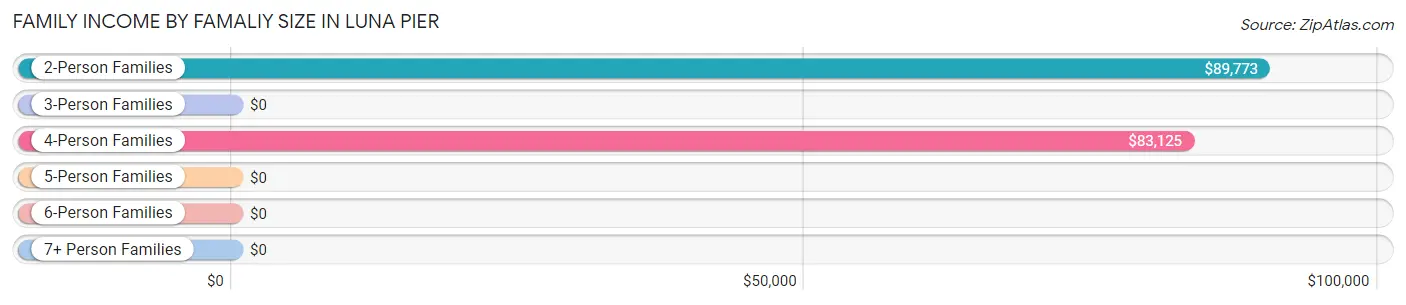
| Income Bracket | # Families | Median Income |
| 2-Person Families | 196 (64.5%) | $89,773 |
| 3-Person Families | 60 (19.7%) | $0 |
| 4-Person Families | 20 (6.6%) | $83,125 |
| 5-Person Families | 10 (3.3%) | $0 |
| 6-Person Families | 12 (4.0%) | $0 |
| 7+ Person Families | 6 (2.0%) | $0 |
| Total | 304 (100.0%) | $69,286 |
Family Income by Number of Earners in Luna Pier
The median family income in Luna Pier is $69,286, with families comprising 3+ earners (16) having the highest median family income of $115,000, while families with no earners (71) have the lowest median family income of $36,250, accounting for 5.3% and 23.4% of families, respectively.
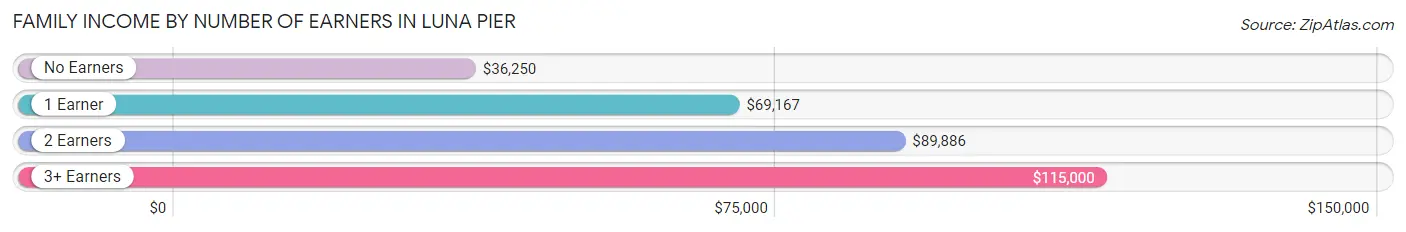
| Number of Earners | # Families | Median Income |
| No Earners | 71 (23.4%) | $36,250 |
| 1 Earner | 136 (44.7%) | $69,167 |
| 2 Earners | 81 (26.6%) | $89,886 |
| 3+ Earners | 16 (5.3%) | $115,000 |
| Total | 304 (100.0%) | $69,286 |
Household Income in Luna Pier
Household Income Brackets in Luna Pier
With 104 households falling in the category, the $100,000 to $149,999 income range is the most frequent in Luna Pier, accounting for 16.8% of all households. In contrast, only 14 households (2.2%) fall into the $200,000+ income bracket, making it the least populous group.
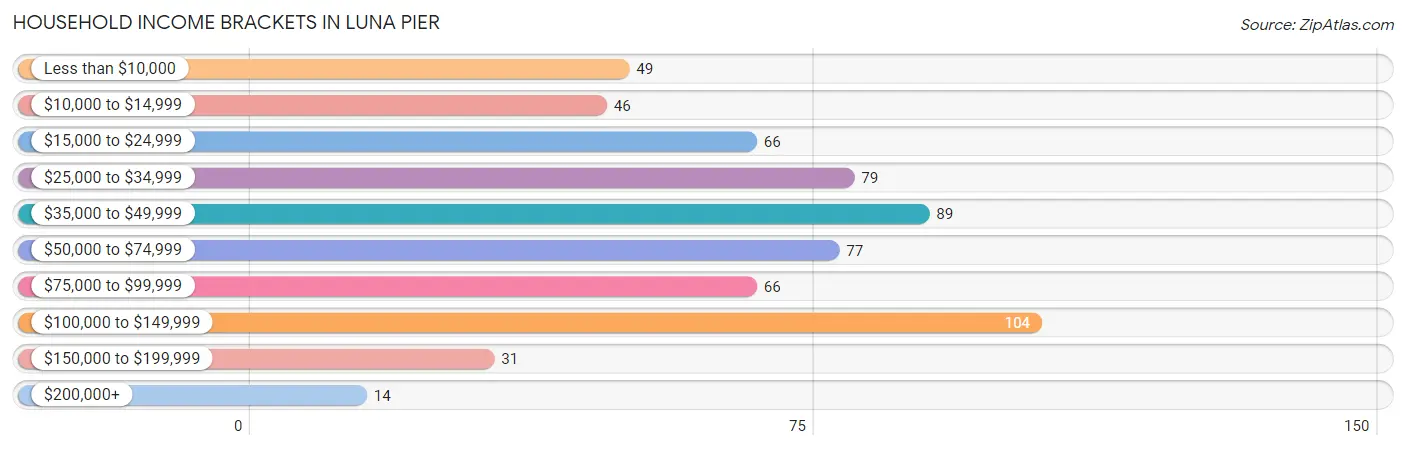
| Income Bracket | # Households | % Households |
| Less than $10,000 | 49 | 7.9% |
| $10,000 to $14,999 | 46 | 7.4% |
| $15,000 to $24,999 | 66 | 10.6% |
| $25,000 to $34,999 | 79 | 12.7% |
| $35,000 to $49,999 | 89 | 14.3% |
| $50,000 to $74,999 | 77 | 12.4% |
| $75,000 to $99,999 | 66 | 10.6% |
| $100,000 to $149,999 | 104 | 16.7% |
| $150,000 to $199,999 | 31 | 5.0% |
| $200,000+ | 14 | 2.3% |
Household Income by Householder Age in Luna Pier
The median household income in Luna Pier is $48,073, with the highest median household income of $91,250 found in the 45 to 64 years age bracket for the primary householder. A total of 193 households (31.1%) fall into this category. Meanwhile, the 65+ years age bracket for the primary householder has the lowest median household income of $35,197, with 297 households (47.8%) in this group.
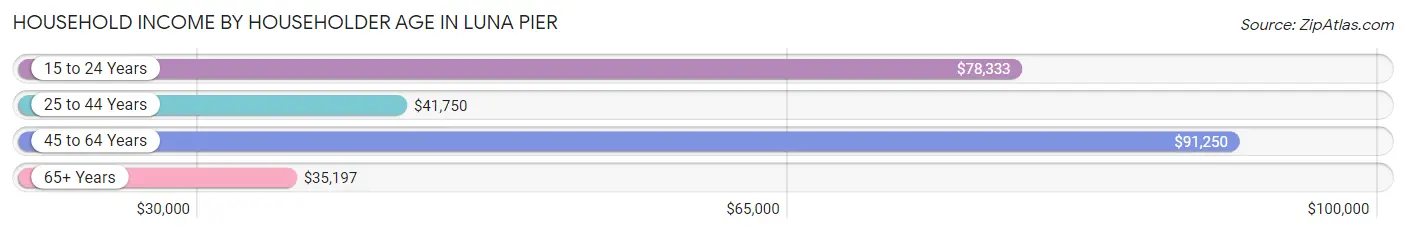
| Income Bracket | # Households | Median Income |
| 15 to 24 Years | 10 (1.6%) | $78,333 |
| 25 to 44 Years | 121 (19.5%) | $41,750 |
| 45 to 64 Years | 193 (31.1%) | $91,250 |
| 65+ Years | 297 (47.8%) | $35,197 |
| Total | 621 (100.0%) | $48,073 |
Poverty in Luna Pier
Income Below Poverty by Sex and Age in Luna Pier
With 28.2% poverty level for males and 27.3% for females among the residents of Luna Pier, 6 to 11 year old males and 12 to 14 year old females are the most vulnerable to poverty, with 50 males (80.6%) and 4 females (100.0%) in their respective age groups living below the poverty level.
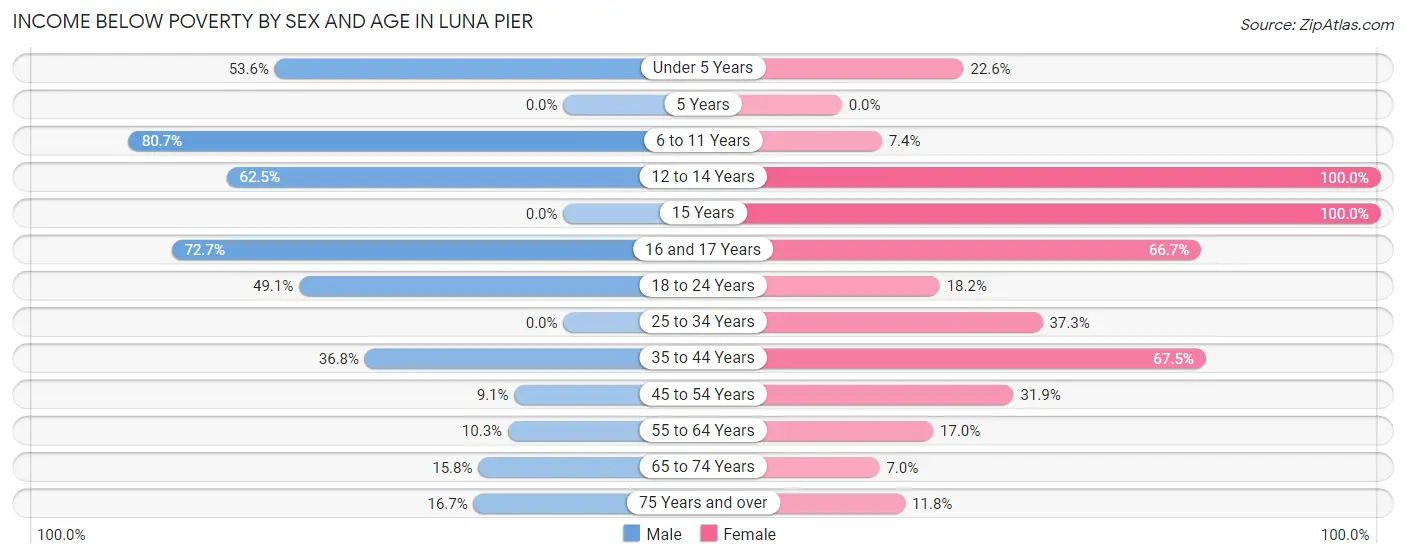
| Age Bracket | Male | Female |
| Under 5 Years | 15 (53.6%) | 7 (22.6%) |
| 5 Years | 0 (0.0%) | 0 (0.0%) |
| 6 to 11 Years | 50 (80.6%) | 2 (7.4%) |
| 12 to 14 Years | 5 (62.5%) | 4 (100.0%) |
| 15 Years | 0 (0.0%) | 3 (100.0%) |
| 16 and 17 Years | 8 (72.7%) | 8 (66.7%) |
| 18 to 24 Years | 26 (49.1%) | 4 (18.2%) |
| 25 to 34 Years | 0 (0.0%) | 19 (37.2%) |
| 35 to 44 Years | 28 (36.8%) | 52 (67.5%) |
| 45 to 54 Years | 6 (9.1%) | 22 (31.9%) |
| 55 to 64 Years | 7 (10.3%) | 20 (17.0%) |
| 65 to 74 Years | 30 (15.8%) | 7 (7.0%) |
| 75 Years and over | 10 (16.7%) | 6 (11.8%) |
| Total | 185 (28.2%) | 154 (27.3%) |
Income Above Poverty by Sex and Age in Luna Pier
According to the poverty statistics in Luna Pier, males aged 15 years and females aged 65 to 74 years are the age groups that are most secure financially, with 100.0% of males and 93.0% of females in these age groups living above the poverty line.
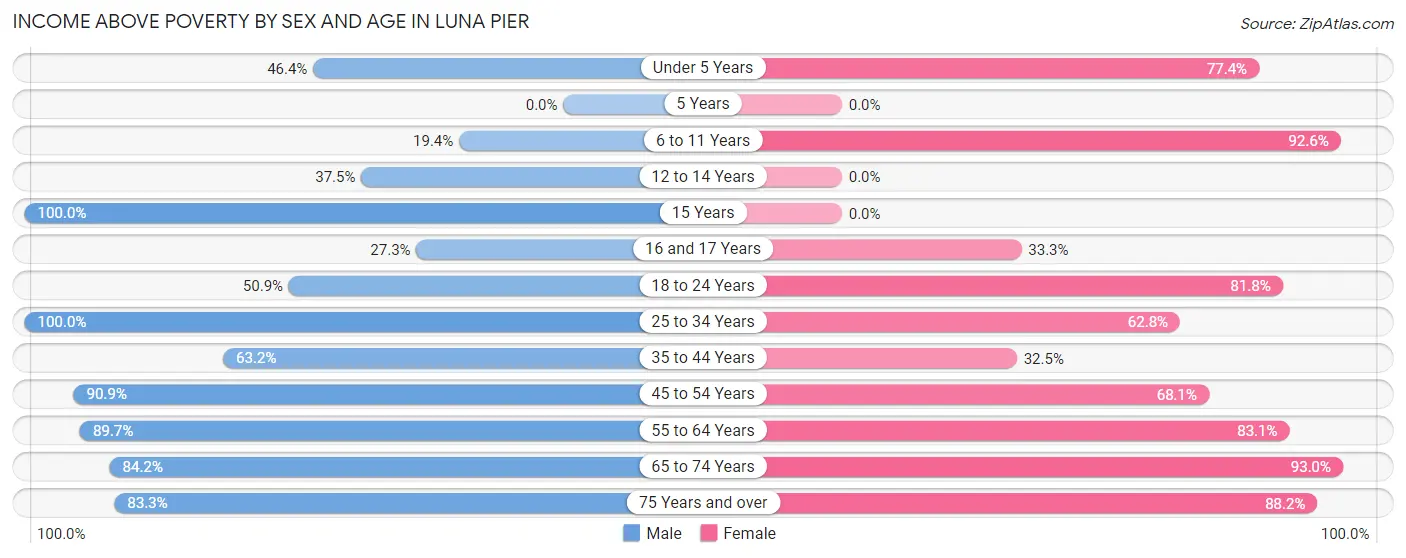
| Age Bracket | Male | Female |
| Under 5 Years | 13 (46.4%) | 24 (77.4%) |
| 5 Years | 0 (0.0%) | 0 (0.0%) |
| 6 to 11 Years | 12 (19.4%) | 25 (92.6%) |
| 12 to 14 Years | 3 (37.5%) | 0 (0.0%) |
| 15 Years | 4 (100.0%) | 0 (0.0%) |
| 16 and 17 Years | 3 (27.3%) | 4 (33.3%) |
| 18 to 24 Years | 27 (50.9%) | 18 (81.8%) |
| 25 to 34 Years | 30 (100.0%) | 32 (62.7%) |
| 35 to 44 Years | 48 (63.2%) | 25 (32.5%) |
| 45 to 54 Years | 60 (90.9%) | 47 (68.1%) |
| 55 to 64 Years | 61 (89.7%) | 98 (83.1%) |
| 65 to 74 Years | 160 (84.2%) | 93 (93.0%) |
| 75 Years and over | 50 (83.3%) | 45 (88.2%) |
| Total | 471 (71.8%) | 411 (72.7%) |
Income Below Poverty Among Married-Couple Families in Luna Pier
The poverty statistics for married-couple families in Luna Pier show that 15.3% or 35 of the total 228 families live below the poverty line. Families with 5 or more children have the highest poverty rate of 100.0%, comprising of 5 families. On the other hand, families with 1 or 2 children have the lowest poverty rate of 0.0%, which includes 0 families.
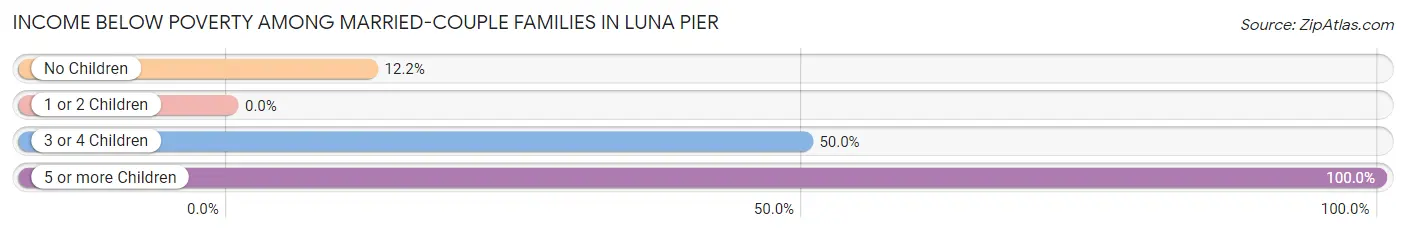
| Children | Above Poverty | Below Poverty |
| No Children | 159 (87.8%) | 22 (12.1%) |
| 1 or 2 Children | 26 (100.0%) | 0 (0.0%) |
| 3 or 4 Children | 8 (50.0%) | 8 (50.0%) |
| 5 or more Children | 0 (0.0%) | 5 (100.0%) |
| Total | 193 (84.7%) | 35 (15.3%) |
Income Below Poverty Among Single-Parent Households in Luna Pier
According to the poverty data in Luna Pier, 8.7% or 2 single-father households and 56.6% or 30 single-mother households are living below the poverty line. Among single-father households, those with 1 or 2 children have the highest poverty rate, with 2 households (16.7%) experiencing poverty. Likewise, among single-mother households, those with 3 or 4 children have the highest poverty rate, with 2 households (100.0%) falling below the poverty line.
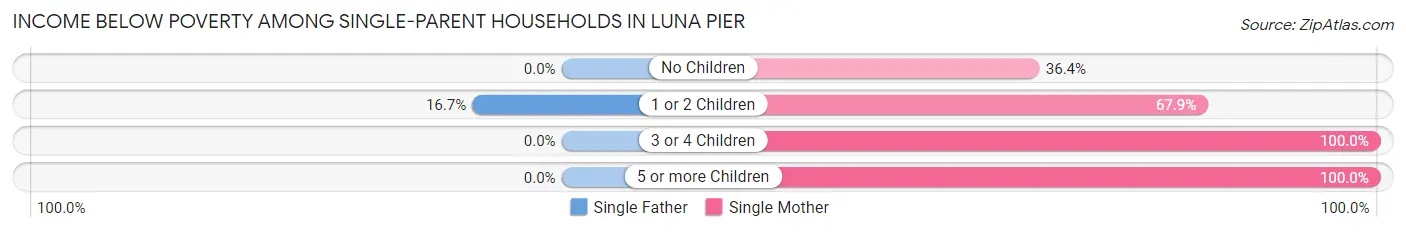
| Children | Single Father | Single Mother |
| No Children | 0 (0.0%) | 8 (36.4%) |
| 1 or 2 Children | 2 (16.7%) | 19 (67.9%) |
| 3 or 4 Children | 0 (0.0%) | 2 (100.0%) |
| 5 or more Children | 0 (0.0%) | 1 (100.0%) |
| Total | 2 (8.7%) | 30 (56.6%) |
Income Below Poverty Among Married-Couple vs Single-Parent Households in Luna Pier
The poverty data for Luna Pier shows that 35 of the married-couple family households (15.3%) and 32 of the single-parent households (42.1%) are living below the poverty level. Within the married-couple family households, those with 5 or more children have the highest poverty rate, with 5 households (100.0%) falling below the poverty line. Among the single-parent households, those with 3 or 4 children have the highest poverty rate, with 2 household (100.0%) living below poverty.
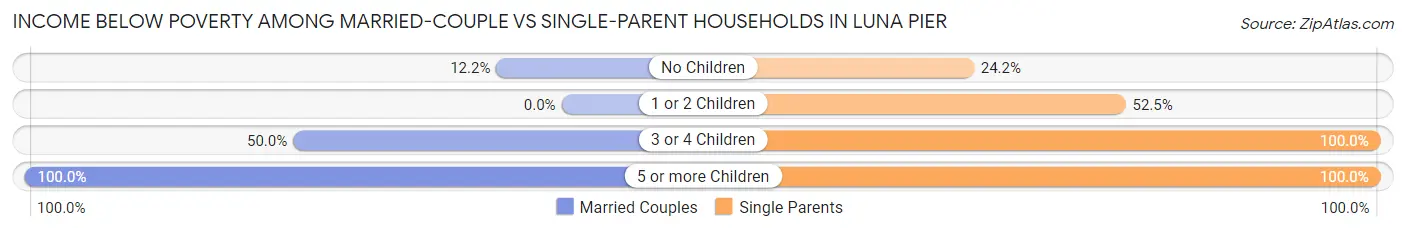
| Children | Married-Couple Families | Single-Parent Households |
| No Children | 22 (12.1%) | 8 (24.2%) |
| 1 or 2 Children | 0 (0.0%) | 21 (52.5%) |
| 3 or 4 Children | 8 (50.0%) | 2 (100.0%) |
| 5 or more Children | 5 (100.0%) | 1 (100.0%) |
| Total | 35 (15.3%) | 32 (42.1%) |
Race in Luna Pier
The most populous races in Luna Pier are White / Caucasian (1,130 | 92.2%), Two or more Races (69 | 5.6%), and Hispanic or Latino (15 | 1.2%).
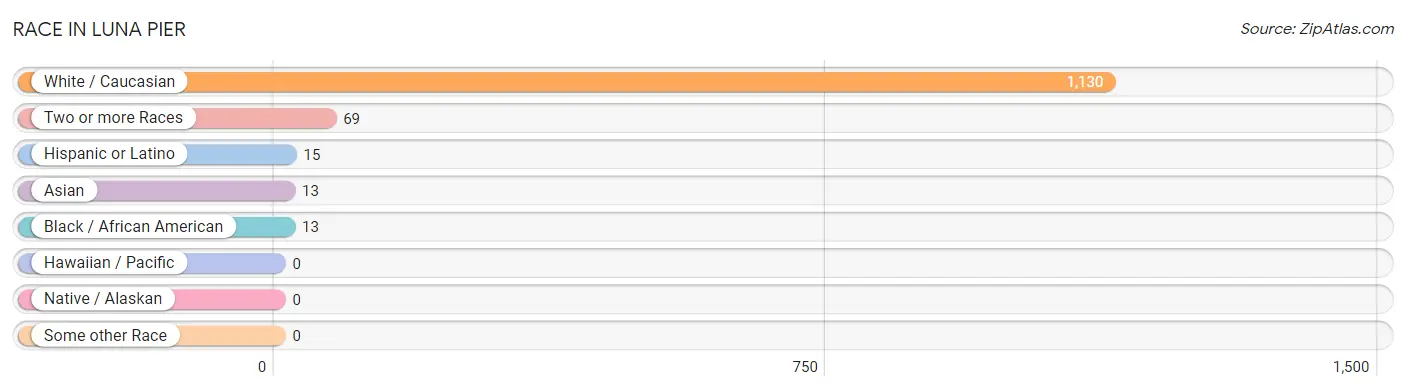
| Race | # Population | % Population |
| Asian | 13 | 1.1% |
| Black / African American | 13 | 1.1% |
| Hawaiian / Pacific | 0 | 0.0% |
| Hispanic or Latino | 15 | 1.2% |
| Native / Alaskan | 0 | 0.0% |
| White / Caucasian | 1,130 | 92.2% |
| Two or more Races | 69 | 5.6% |
| Some other Race | 0 | 0.0% |
| Total | 1,225 | 100.0% |
Ancestry in Luna Pier
The most populous ancestries reported in Luna Pier are German (385 | 31.4%), Polish (155 | 12.7%), Irish (154 | 12.6%), English (115 | 9.4%), and Scottish (74 | 6.0%), together accounting for 72.1% of all Luna Pier residents.
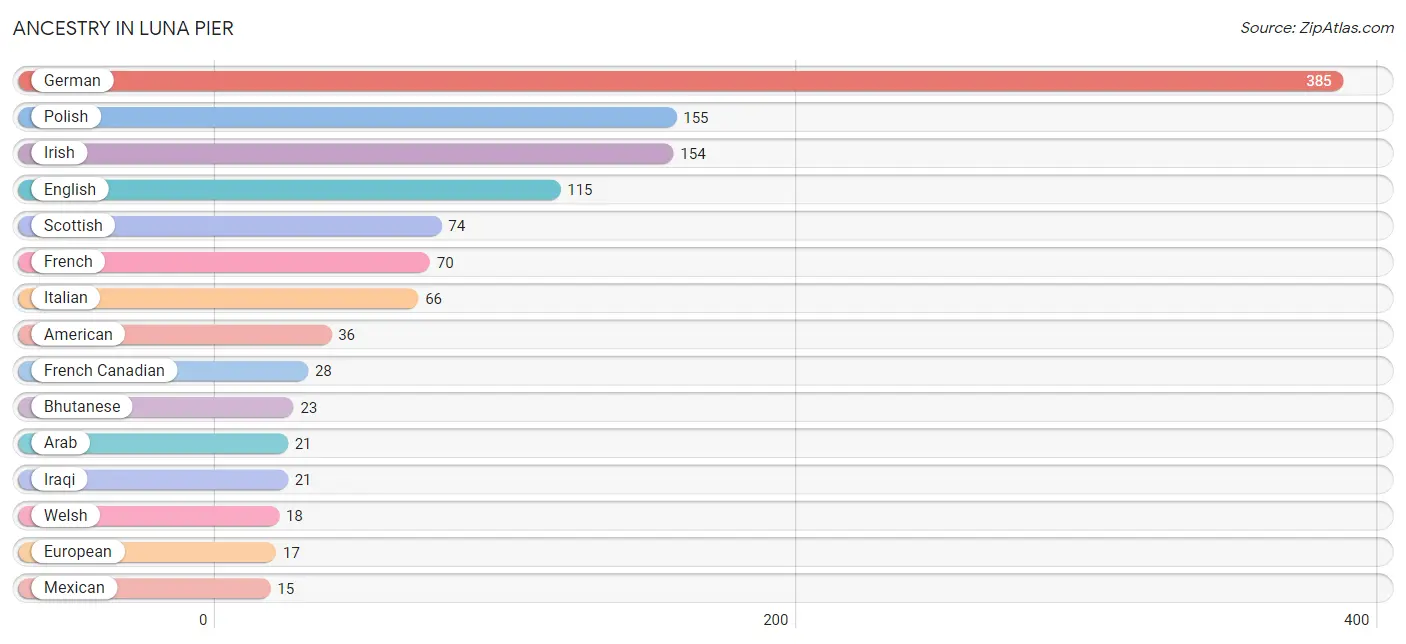
| Ancestry | # Population | % Population |
| Albanian | 4 | 0.3% |
| American | 36 | 2.9% |
| Arab | 21 | 1.7% |
| Armenian | 10 | 0.8% |
| Bhutanese | 23 | 1.9% |
| Chippewa | 6 | 0.5% |
| Dutch | 11 | 0.9% |
| English | 115 | 9.4% |
| European | 17 | 1.4% |
| Finnish | 4 | 0.3% |
| French | 70 | 5.7% |
| French Canadian | 28 | 2.3% |
| German | 385 | 31.4% |
| Hungarian | 14 | 1.1% |
| Indian (Asian) | 4 | 0.3% |
| Iraqi | 21 | 1.7% |
| Irish | 154 | 12.6% |
| Italian | 66 | 5.4% |
| Mexican | 15 | 1.2% |
| Norwegian | 9 | 0.7% |
| Polish | 155 | 12.7% |
| Portuguese | 4 | 0.3% |
| Russian | 10 | 0.8% |
| Scandinavian | 4 | 0.3% |
| Scottish | 74 | 6.0% |
| Slovak | 4 | 0.3% |
| Ukrainian | 4 | 0.3% |
| Welsh | 18 | 1.5% | View All 28 Rows |
Immigrants in Luna Pier
The most numerous immigrant groups reported in Luna Pier came from Asia (30 | 2.5%), Iraq (21 | 1.7%), Western Asia (21 | 1.7%), Eastern Europe (10 | 0.8%), and Europe (10 | 0.8%), together accounting for 7.5% of all Luna Pier residents.
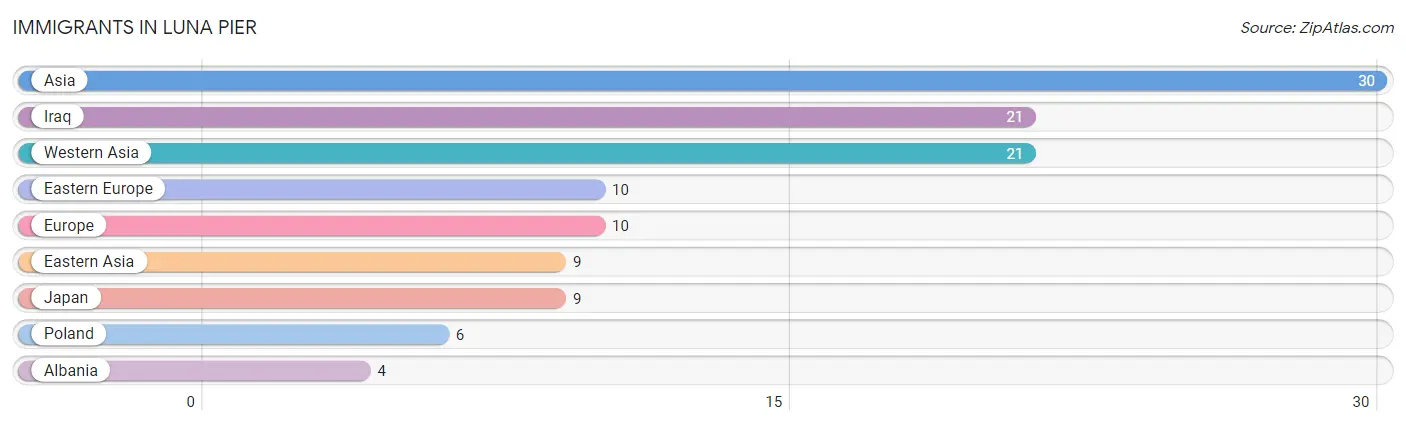
| Immigration Origin | # Population | % Population |
| Albania | 4 | 0.3% |
| Asia | 30 | 2.5% |
| Eastern Asia | 9 | 0.7% |
| Eastern Europe | 10 | 0.8% |
| Europe | 10 | 0.8% |
| Iraq | 21 | 1.7% |
| Japan | 9 | 0.7% |
| Poland | 6 | 0.5% |
| Western Asia | 21 | 1.7% | View All 9 Rows |
Sex and Age in Luna Pier
Sex and Age in Luna Pier
The most populous age groups in Luna Pier are 65 to 69 Years (96 | 14.6%) for men and 60 to 64 Years (65 | 11.4%) for women.
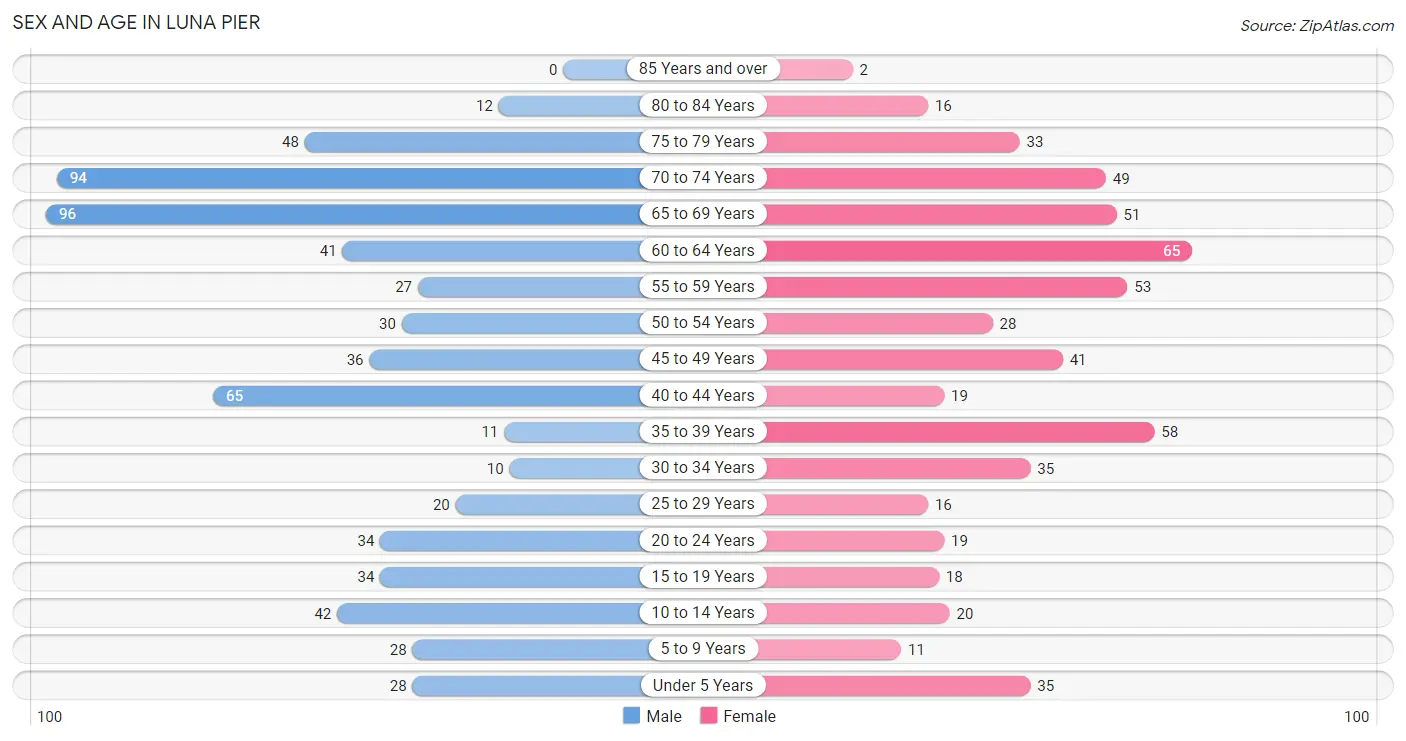
| Age Bracket | Male | Female |
| Under 5 Years | 28 (4.3%) | 35 (6.1%) |
| 5 to 9 Years | 28 (4.3%) | 11 (1.9%) |
| 10 to 14 Years | 42 (6.4%) | 20 (3.5%) |
| 15 to 19 Years | 34 (5.2%) | 18 (3.2%) |
| 20 to 24 Years | 34 (5.2%) | 19 (3.3%) |
| 25 to 29 Years | 20 (3.0%) | 16 (2.8%) |
| 30 to 34 Years | 10 (1.5%) | 35 (6.1%) |
| 35 to 39 Years | 11 (1.7%) | 58 (10.2%) |
| 40 to 44 Years | 65 (9.9%) | 19 (3.3%) |
| 45 to 49 Years | 36 (5.5%) | 41 (7.2%) |
| 50 to 54 Years | 30 (4.6%) | 28 (4.9%) |
| 55 to 59 Years | 27 (4.1%) | 53 (9.3%) |
| 60 to 64 Years | 41 (6.2%) | 65 (11.4%) |
| 65 to 69 Years | 96 (14.6%) | 51 (9.0%) |
| 70 to 74 Years | 94 (14.3%) | 49 (8.6%) |
| 75 to 79 Years | 48 (7.3%) | 33 (5.8%) |
| 80 to 84 Years | 12 (1.8%) | 16 (2.8%) |
| 85 Years and over | 0 (0.0%) | 2 (0.4%) |
| Total | 656 (100.0%) | 569 (100.0%) |
Families and Households in Luna Pier
Median Family Size in Luna Pier
The median family size in Luna Pier is 2.82 persons per family, with single female/mother families (53 | 17.4%) accounting for the largest median family size of 2.92 persons per family. On the other hand, single male/father families (23 | 7.6%) represent the smallest median family size with 2.35 persons per family.
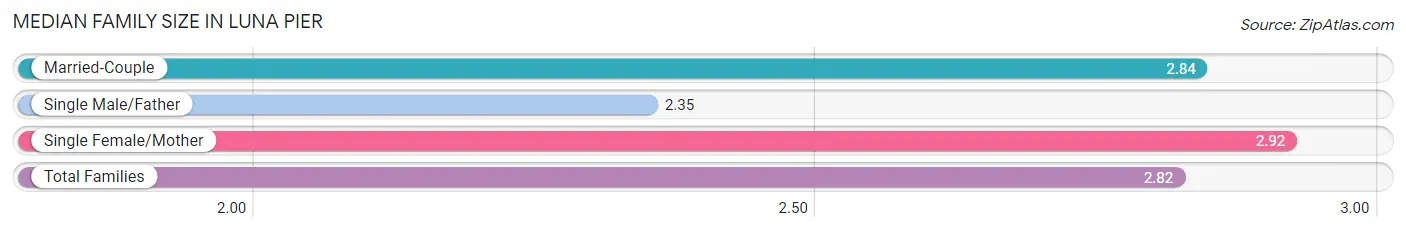
| Family Type | # Families | Family Size |
| Married-Couple | 228 (75.0%) | 2.84 |
| Single Male/Father | 23 (7.6%) | 2.35 |
| Single Female/Mother | 53 (17.4%) | 2.92 |
| Total Families | 304 (100.0%) | 2.82 |
Median Household Size in Luna Pier
The median household size in Luna Pier is 1.97 persons per household, with single female/mother households (53 | 8.5%) accounting for the largest median household size of 3.26 persons per household. non-family households (317 | 51.0%) represent the smallest median household size with 1.11 persons per household.
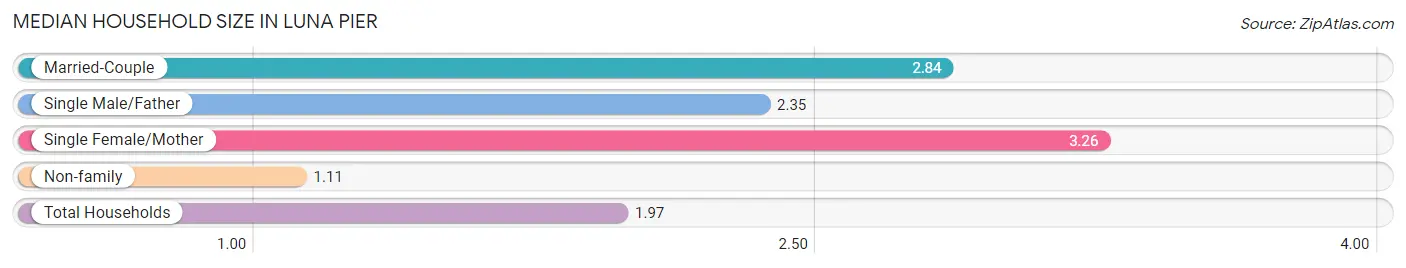
| Household Type | # Households | Household Size |
| Married-Couple | 228 (36.7%) | 2.84 |
| Single Male/Father | 23 (3.7%) | 2.35 |
| Single Female/Mother | 53 (8.5%) | 3.26 |
| Non-family | 317 (51.0%) | 1.11 |
| Total Households | 621 (100.0%) | 1.97 |
Household Size by Marriage Status in Luna Pier
Out of a total of 621 households in Luna Pier, 304 (48.9%) are family households, while 317 (51.0%) are nonfamily households. The most numerous type of family households are 2-person households, comprising 196, and the most common type of nonfamily households are 1-person households, comprising 288.
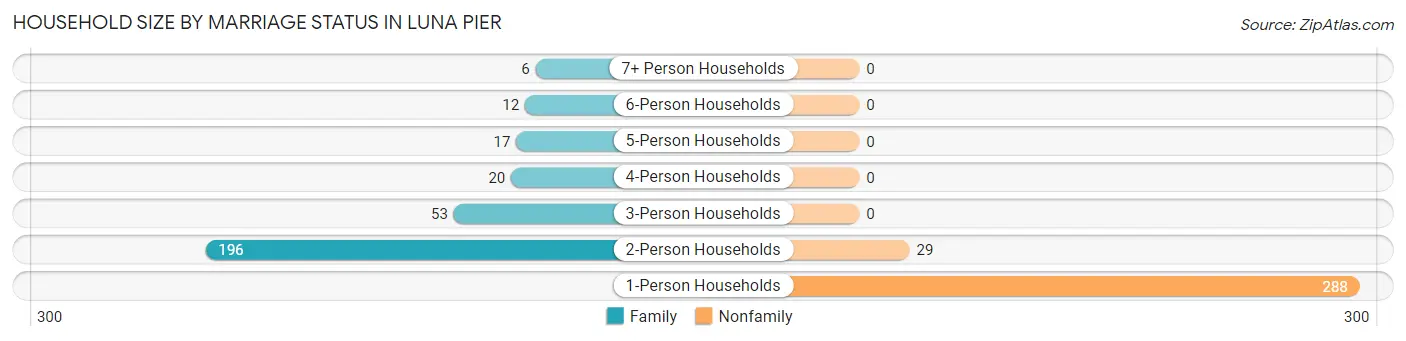
| Household Size | Family Households | Nonfamily Households |
| 1-Person Households | - | 288 (46.4%) |
| 2-Person Households | 196 (31.6%) | 29 (4.7%) |
| 3-Person Households | 53 (8.5%) | 0 (0.0%) |
| 4-Person Households | 20 (3.2%) | 0 (0.0%) |
| 5-Person Households | 17 (2.7%) | 0 (0.0%) |
| 6-Person Households | 12 (1.9%) | 0 (0.0%) |
| 7+ Person Households | 6 (1.0%) | 0 (0.0%) |
| Total | 304 (48.9%) | 317 (51.0%) |
Female Fertility in Luna Pier
Fertility by Age in Luna Pier
Average fertility rate in Luna Pier is 187.0 births per 1,000 women. Women in the age bracket of 20 to 34 years have the highest fertility rate with 243.0 births per 1,000 women. Women in the age bracket of 35 to 50 years acount for 56.4% of all women with births.
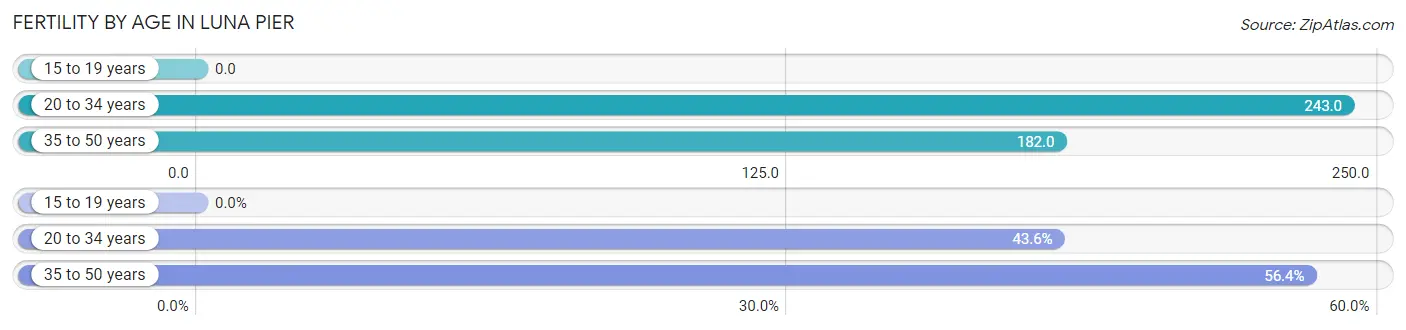
| Age Bracket | Women with Births | Births / 1,000 Women |
| 15 to 19 years | 0 (0.0%) | 0.0 |
| 20 to 34 years | 17 (43.6%) | 243.0 |
| 35 to 50 years | 22 (56.4%) | 182.0 |
| Total | 39 (100.0%) | 187.0 |
Fertility by Age by Marriage Status in Luna Pier
87.2% of women with births (39) in Luna Pier are married. The highest percentage of unmarried women with births falls into 20 to 34 years age bracket with 29.4% of them unmarried at the time of birth, while the lowest percentage of unmarried women with births belong to 35 to 50 years age bracket with 0.0% of them unmarried.
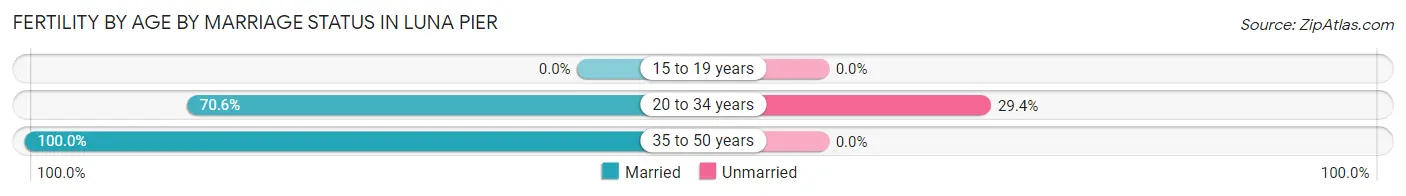
| Age Bracket | Married | Unmarried |
| 15 to 19 years | 0 (0.0%) | 0 (0.0%) |
| 20 to 34 years | 12 (70.6%) | 5 (29.4%) |
| 35 to 50 years | 22 (100.0%) | 0 (0.0%) |
| Total | 34 (87.2%) | 5 (12.8%) |
Fertility by Education in Luna Pier
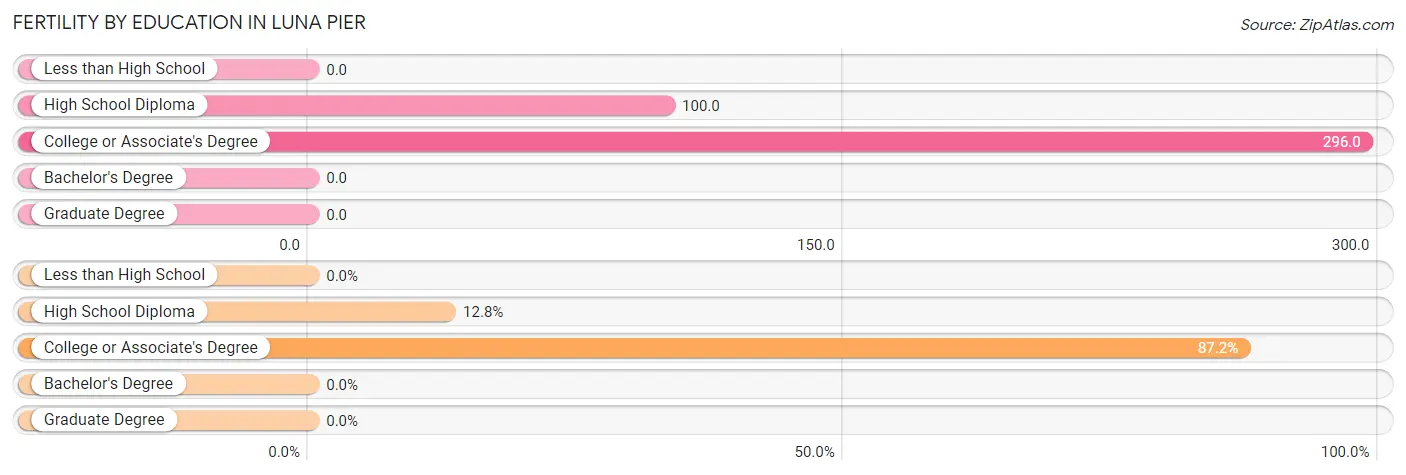
| Educational Attainment | Women with Births | Births / 1,000 Women |
| Less than High School | 0 (0.0%) | 0.0 |
| High School Diploma | 5 (12.8%) | 100.0 |
| College or Associate's Degree | 34 (87.2%) | 296.0 |
| Bachelor's Degree | 0 (0.0%) | 0.0 |
| Graduate Degree | 0 (0.0%) | 0.0 |
| Total | 39 (100.0%) | 187.0 |
Fertility by Education by Marriage Status in Luna Pier
12.8% of women with births in Luna Pier are unmarried. Women with the educational attainment of college or associate's degree are most likely to be married with 100.0% of them married at childbirth, while women with the educational attainment of high school diploma are least likely to be married with 100.0% of them unmarried at childbirth.
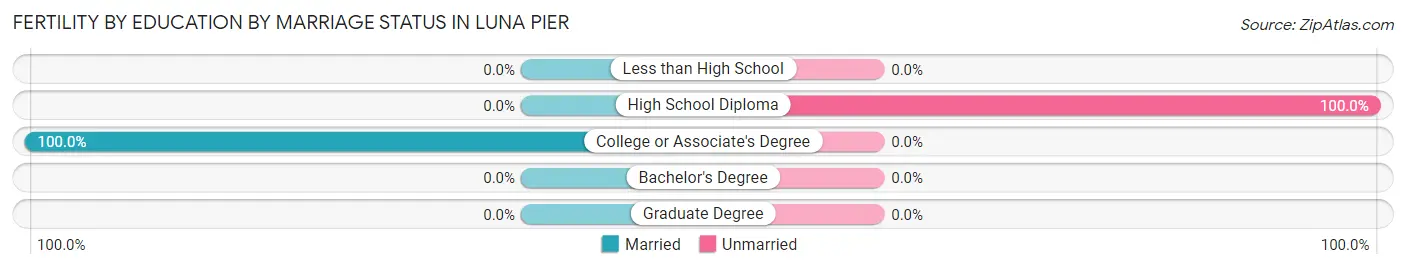
| Educational Attainment | Married | Unmarried |
| Less than High School | 0 (0.0%) | 0 (0.0%) |
| High School Diploma | 0 (0.0%) | 5 (100.0%) |
| College or Associate's Degree | 34 (100.0%) | 0 (0.0%) |
| Bachelor's Degree | 0 (0.0%) | 0 (0.0%) |
| Graduate Degree | 0 (0.0%) | 0 (0.0%) |
| Total | 34 (87.2%) | 5 (12.8%) |
Employment Characteristics in Luna Pier
Employment by Class of Employer in Luna Pier
Among the 437 employed individuals in Luna Pier, private company employees (328 | 75.1%), not-for-profit organizations (46 | 10.5%), and local government employees (24 | 5.5%) make up the most common classes of employment.
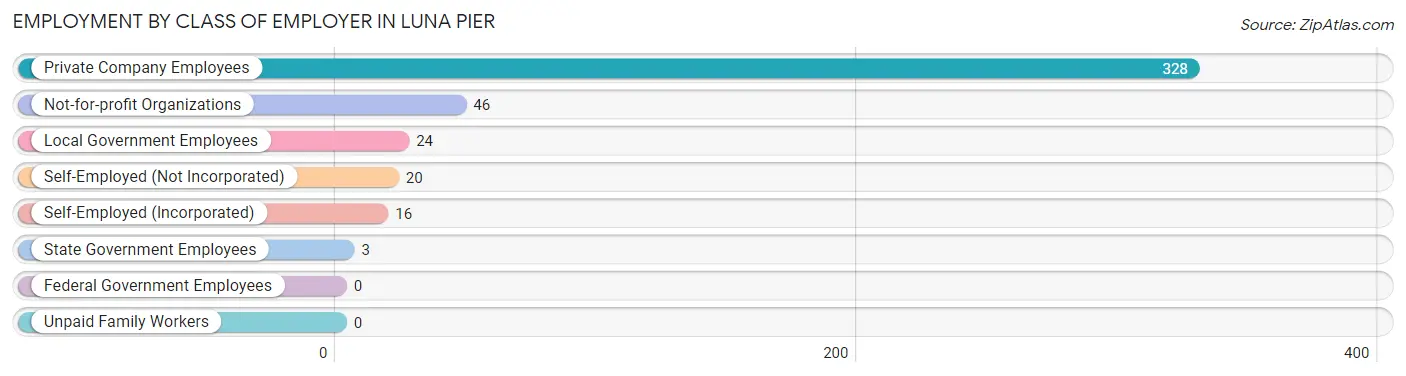
| Employer Class | # Employees | % Employees |
| Private Company Employees | 328 | 75.1% |
| Self-Employed (Incorporated) | 16 | 3.7% |
| Self-Employed (Not Incorporated) | 20 | 4.6% |
| Not-for-profit Organizations | 46 | 10.5% |
| Local Government Employees | 24 | 5.5% |
| State Government Employees | 3 | 0.7% |
| Federal Government Employees | 0 | 0.0% |
| Unpaid Family Workers | 0 | 0.0% |
| Total | 437 | 100.0% |
Employment Status by Age in Luna Pier
According to the labor force statistics for Luna Pier, out of the total population over 16 years of age (1,054), 45.9% or 484 individuals are in the labor force, with 6.8% or 33 of them unemployed. The age group with the highest labor force participation rate is 20 to 24 years, with 100.0% or 53 individuals in the labor force. Within the labor force, the 20 to 24 years age range has the highest percentage of unemployed individuals, with 28.3% or 15 of them being unemployed.
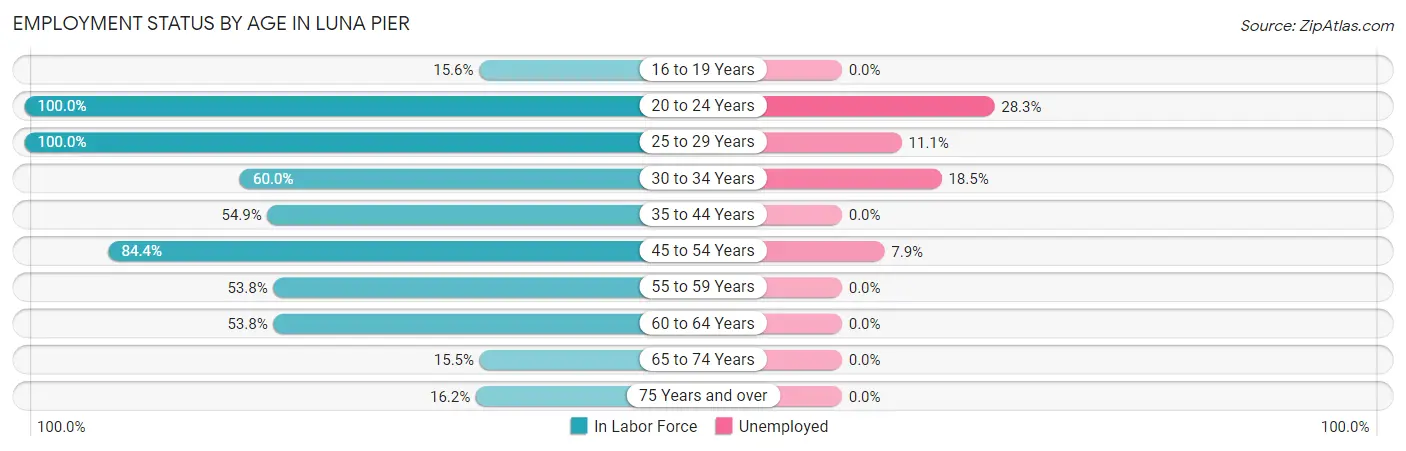
| Age Bracket | In Labor Force | Unemployed |
| 16 to 19 Years | 7 (15.6%) | 0 (0.0%) |
| 20 to 24 Years | 53 (100.0%) | 15 (28.3%) |
| 25 to 29 Years | 36 (100.0%) | 4 (11.1%) |
| 30 to 34 Years | 27 (60.0%) | 5 (18.5%) |
| 35 to 44 Years | 84 (54.9%) | 0 (0.0%) |
| 45 to 54 Years | 114 (84.4%) | 9 (7.9%) |
| 55 to 59 Years | 43 (53.8%) | 0 (0.0%) |
| 60 to 64 Years | 57 (53.8%) | 0 (0.0%) |
| 65 to 74 Years | 45 (15.5%) | 0 (0.0%) |
| 75 Years and over | 18 (16.2%) | 0 (0.0%) |
| Total | 484 (45.9%) | 33 (6.8%) |
Employment Status by Educational Attainment in Luna Pier
According to labor force statistics for Luna Pier, 65.0% of individuals (361) out of the total population between 25 and 64 years of age (555) are in the labor force, with 5.0% or 18 of them being unemployed. The group with the highest labor force participation rate are those with the educational attainment of bachelor's degree or higher, with 85.4% or 82 individuals in the labor force. Within the labor force, individuals with bachelor's degree or higher education have the highest percentage of unemployment, with 6.1% or 5 of them being unemployed.
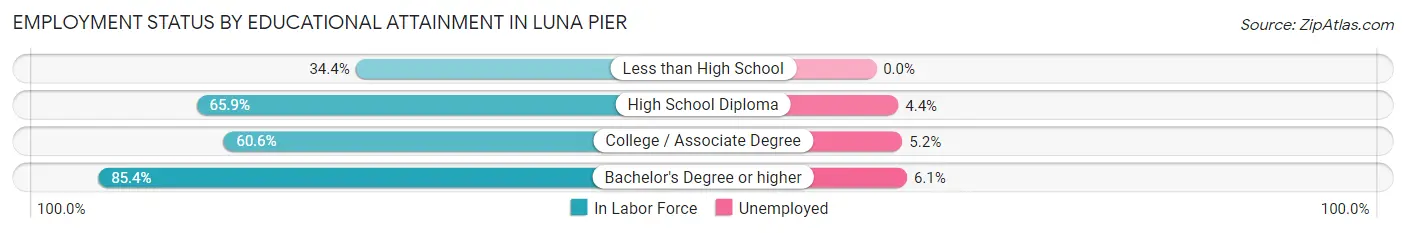
| Educational Attainment | In Labor Force | Unemployed |
| Less than High School | 11 (34.4%) | 0 (0.0%) |
| High School Diploma | 114 (65.9%) | 8 (4.4%) |
| College / Associate Degree | 154 (60.6%) | 13 (5.2%) |
| Bachelor's Degree or higher | 82 (85.4%) | 6 (6.1%) |
| Total | 361 (65.0%) | 28 (5.0%) |
Employment Occupations by Sex in Luna Pier
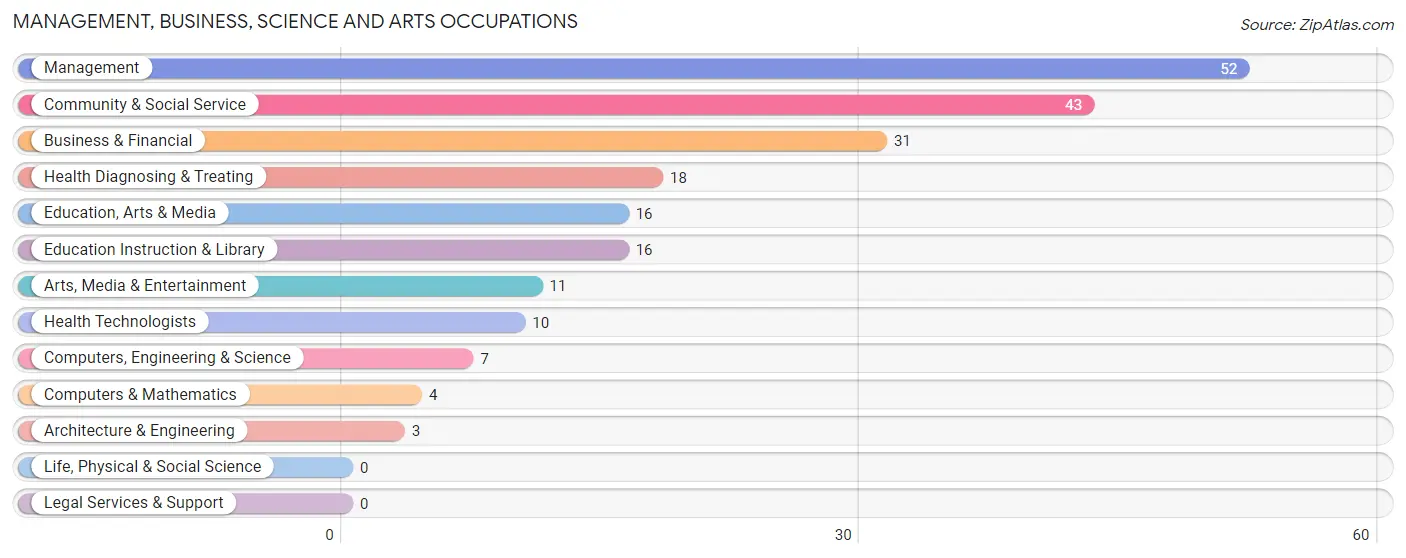
Management, Business, Science and Arts Occupations
The most common Management, Business, Science and Arts occupations in Luna Pier are Management (52 | 11.5%), Community & Social Service (43 | 9.5%), Business & Financial (31 | 6.9%), Health Diagnosing & Treating (18 | 4.0%), and Education, Arts & Media (16 | 3.5%).
Management, Business, Science and Arts Occupations by Sex
Within the Management, Business, Science and Arts occupations in Luna Pier, the most male-oriented occupations are Computers, Engineering & Science (100.0%), Computers & Mathematics (100.0%), and Architecture & Engineering (100.0%), while the most female-oriented occupations are Education, Arts & Media (75.0%), Education Instruction & Library (75.0%), and Community & Social Service (74.4%).
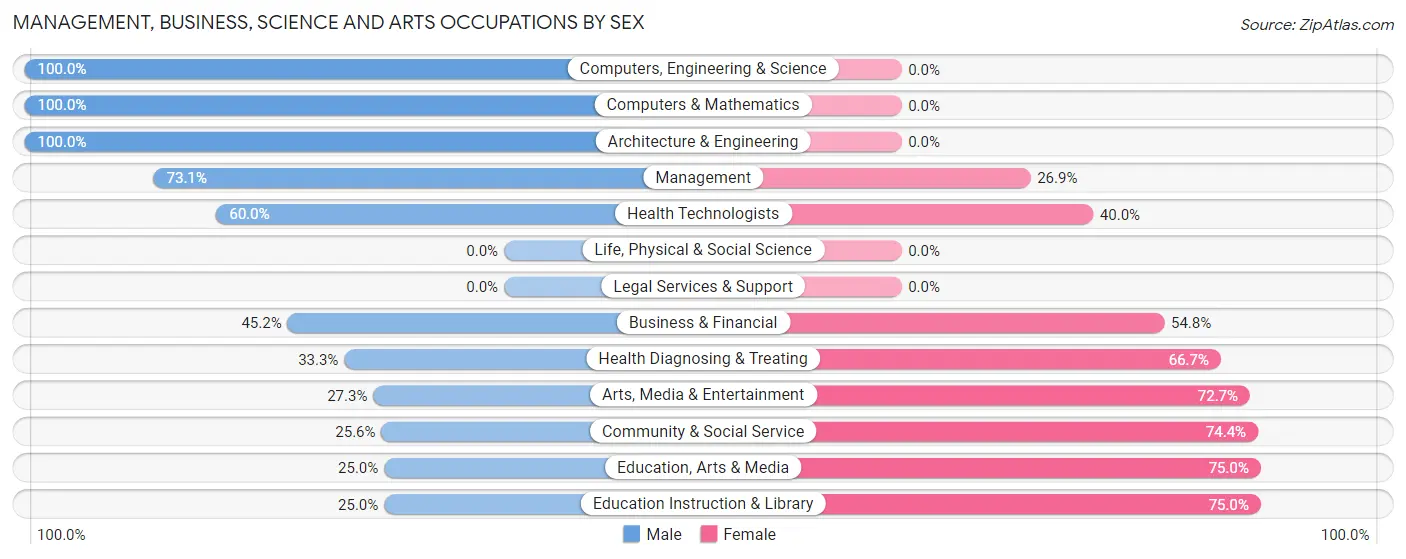
| Occupation | Male | Female |
| Management | 38 (73.1%) | 14 (26.9%) |
| Business & Financial | 14 (45.2%) | 17 (54.8%) |
| Computers, Engineering & Science | 7 (100.0%) | 0 (0.0%) |
| Computers & Mathematics | 4 (100.0%) | 0 (0.0%) |
| Architecture & Engineering | 3 (100.0%) | 0 (0.0%) |
| Life, Physical & Social Science | 0 (0.0%) | 0 (0.0%) |
| Community & Social Service | 11 (25.6%) | 32 (74.4%) |
| Education, Arts & Media | 4 (25.0%) | 12 (75.0%) |
| Legal Services & Support | 0 (0.0%) | 0 (0.0%) |
| Education Instruction & Library | 4 (25.0%) | 12 (75.0%) |
| Arts, Media & Entertainment | 3 (27.3%) | 8 (72.7%) |
| Health Diagnosing & Treating | 6 (33.3%) | 12 (66.7%) |
| Health Technologists | 6 (60.0%) | 4 (40.0%) |
| Total (Category) | 76 (50.3%) | 75 (49.7%) |
| Total (Overall) | 262 (58.1%) | 189 (41.9%) |
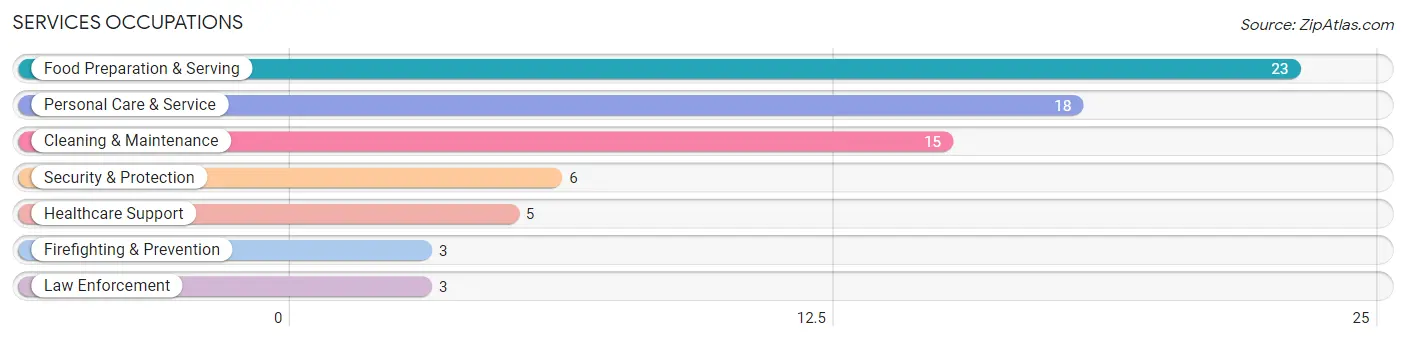
Services Occupations
The most common Services occupations in Luna Pier are Food Preparation & Serving (23 | 5.1%), Personal Care & Service (18 | 4.0%), Cleaning & Maintenance (15 | 3.3%), Security & Protection (6 | 1.3%), and Healthcare Support (5 | 1.1%).
Services Occupations by Sex
Within the Services occupations in Luna Pier, the most male-oriented occupations are Law Enforcement (100.0%), Cleaning & Maintenance (60.0%), and Security & Protection (50.0%), while the most female-oriented occupations are Healthcare Support (100.0%), Firefighting & Prevention (100.0%), and Personal Care & Service (88.9%).
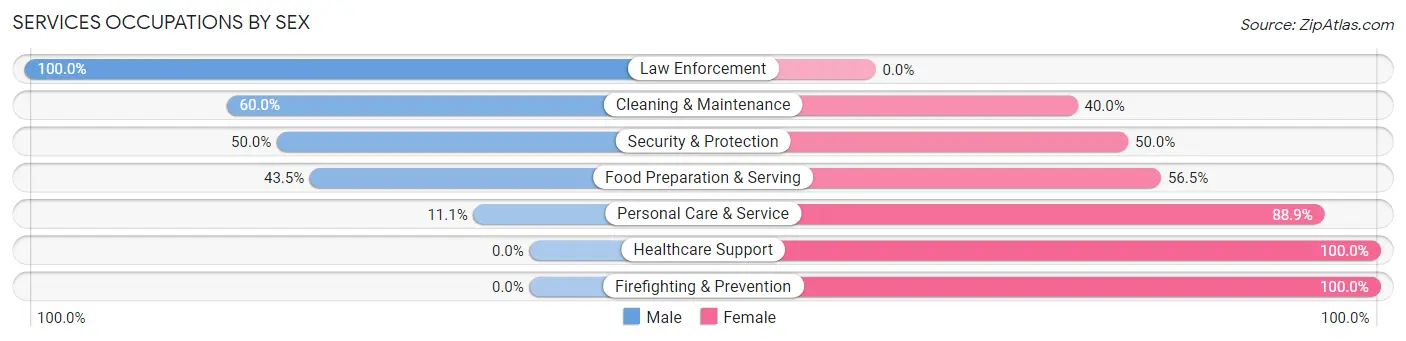
| Occupation | Male | Female |
| Healthcare Support | 0 (0.0%) | 5 (100.0%) |
| Security & Protection | 3 (50.0%) | 3 (50.0%) |
| Firefighting & Prevention | 0 (0.0%) | 3 (100.0%) |
| Law Enforcement | 3 (100.0%) | 0 (0.0%) |
| Food Preparation & Serving | 10 (43.5%) | 13 (56.5%) |
| Cleaning & Maintenance | 9 (60.0%) | 6 (40.0%) |
| Personal Care & Service | 2 (11.1%) | 16 (88.9%) |
| Total (Category) | 24 (35.8%) | 43 (64.2%) |
| Total (Overall) | 262 (58.1%) | 189 (41.9%) |
Sales and Office Occupations
The most common Sales and Office occupations in Luna Pier are Sales & Related (45 | 10.0%), and Office & Administration (36 | 8.0%).

Sales and Office Occupations by Sex

| Occupation | Male | Female |
| Sales & Related | 20 (44.4%) | 25 (55.6%) |
| Office & Administration | 15 (41.7%) | 21 (58.3%) |
| Total (Category) | 35 (43.2%) | 46 (56.8%) |
| Total (Overall) | 262 (58.1%) | 189 (41.9%) |
Natural Resources, Construction and Maintenance Occupations
The most common Natural Resources, Construction and Maintenance occupations in Luna Pier are Installation, Maintenance & Repair (27 | 6.0%), and Construction & Extraction (23 | 5.1%).
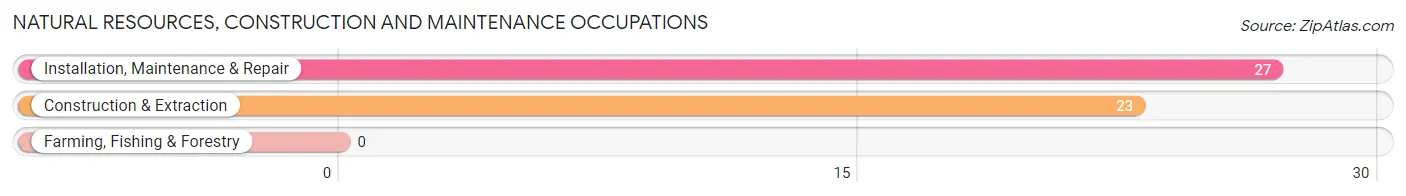
Natural Resources, Construction and Maintenance Occupations by Sex

| Occupation | Male | Female |
| Farming, Fishing & Forestry | 0 (0.0%) | 0 (0.0%) |
| Construction & Extraction | 23 (100.0%) | 0 (0.0%) |
| Installation, Maintenance & Repair | 27 (100.0%) | 0 (0.0%) |
| Total (Category) | 50 (100.0%) | 0 (0.0%) |
| Total (Overall) | 262 (58.1%) | 189 (41.9%) |
Production, Transportation and Moving Occupations
The most common Production, Transportation and Moving occupations in Luna Pier are Production (54 | 12.0%), Transportation (26 | 5.8%), and Material Moving (22 | 4.9%).
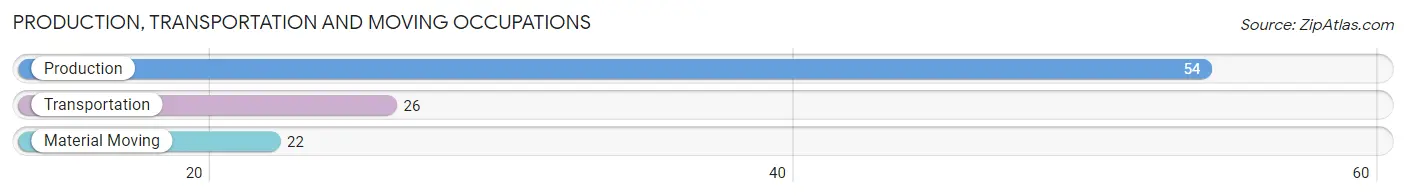
Production, Transportation and Moving Occupations by Sex
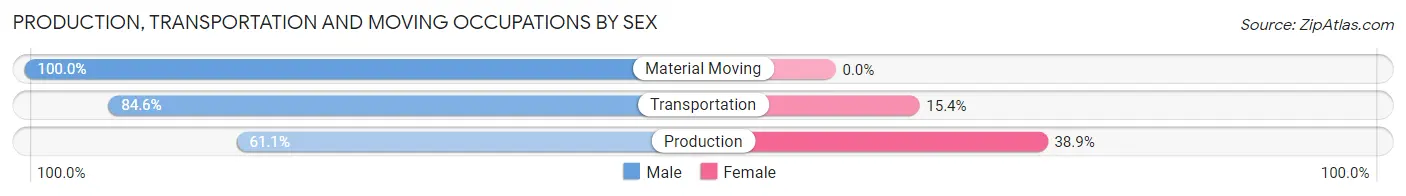
| Occupation | Male | Female |
| Production | 33 (61.1%) | 21 (38.9%) |
| Transportation | 22 (84.6%) | 4 (15.4%) |
| Material Moving | 22 (100.0%) | 0 (0.0%) |
| Total (Category) | 77 (75.5%) | 25 (24.5%) |
| Total (Overall) | 262 (58.1%) | 189 (41.9%) |
Employment Industries by Sex in Luna Pier
Employment Industries in Luna Pier
The major employment industries in Luna Pier include Manufacturing (88 | 19.5%), Health Care & Social Assistance (49 | 10.9%), Educational Services (40 | 8.9%), Professional & Scientific (37 | 8.2%), and Transportation & Warehousing (32 | 7.1%).
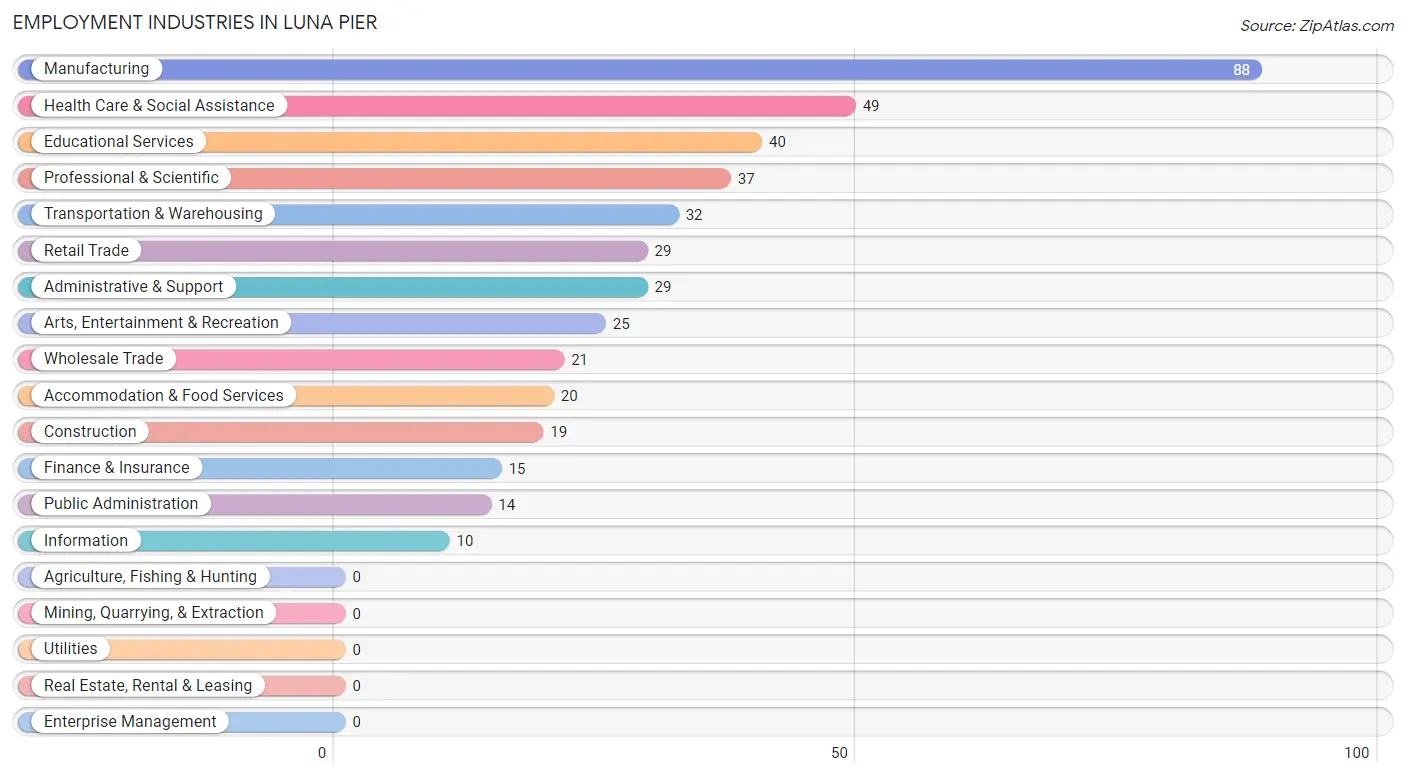
Employment Industries by Sex in Luna Pier
The Luna Pier industries that see more men than women are Construction (100.0%), Wholesale Trade (100.0%), and Transportation & Warehousing (100.0%), whereas the industries that tend to have a higher number of women are Finance & Insurance (100.0%), Accommodation & Food Services (100.0%), and Health Care & Social Assistance (85.7%).
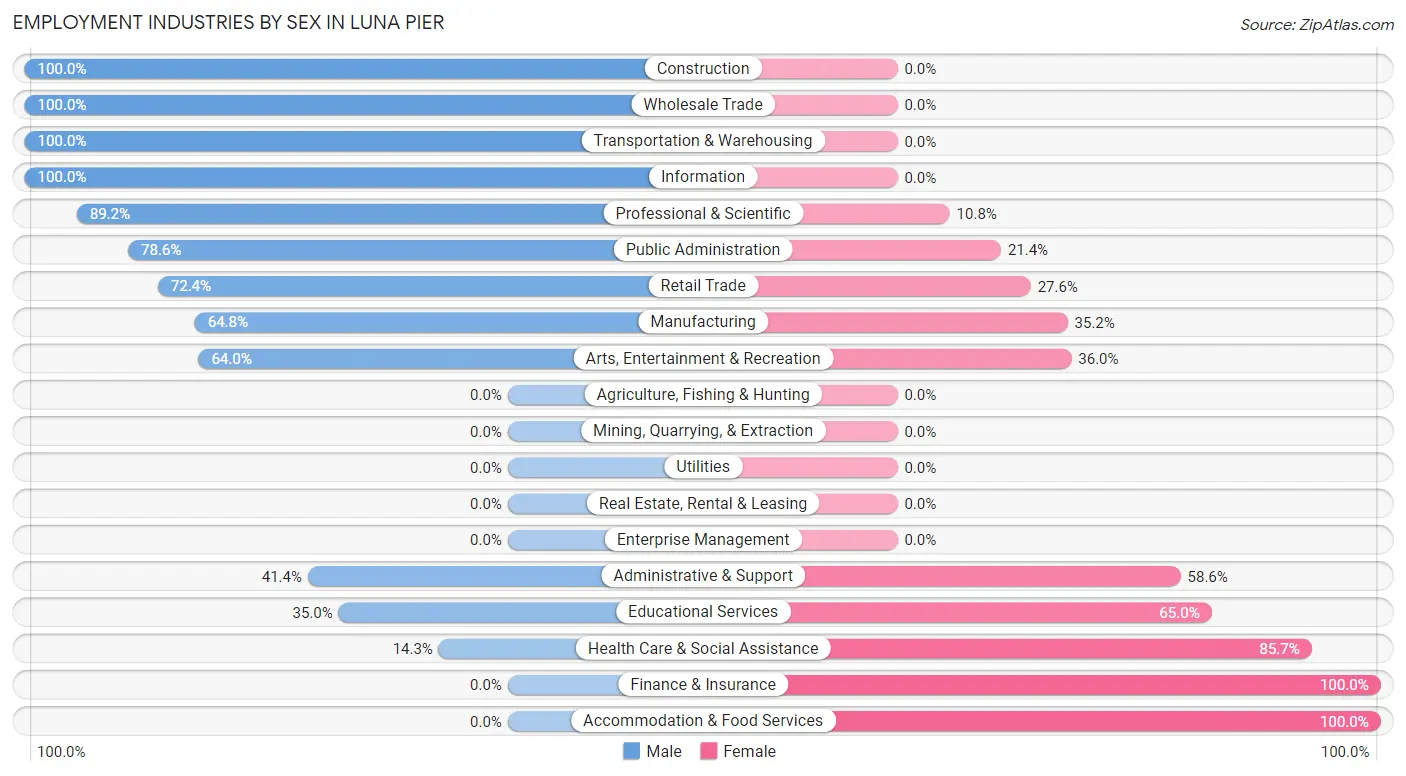
| Industry | Male | Female |
| Agriculture, Fishing & Hunting | 0 (0.0%) | 0 (0.0%) |
| Mining, Quarrying, & Extraction | 0 (0.0%) | 0 (0.0%) |
| Construction | 19 (100.0%) | 0 (0.0%) |
| Manufacturing | 57 (64.8%) | 31 (35.2%) |
| Wholesale Trade | 21 (100.0%) | 0 (0.0%) |
| Retail Trade | 21 (72.4%) | 8 (27.6%) |
| Transportation & Warehousing | 32 (100.0%) | 0 (0.0%) |
| Utilities | 0 (0.0%) | 0 (0.0%) |
| Information | 10 (100.0%) | 0 (0.0%) |
| Finance & Insurance | 0 (0.0%) | 15 (100.0%) |
| Real Estate, Rental & Leasing | 0 (0.0%) | 0 (0.0%) |
| Professional & Scientific | 33 (89.2%) | 4 (10.8%) |
| Enterprise Management | 0 (0.0%) | 0 (0.0%) |
| Administrative & Support | 12 (41.4%) | 17 (58.6%) |
| Educational Services | 14 (35.0%) | 26 (65.0%) |
| Health Care & Social Assistance | 7 (14.3%) | 42 (85.7%) |
| Arts, Entertainment & Recreation | 16 (64.0%) | 9 (36.0%) |
| Accommodation & Food Services | 0 (0.0%) | 20 (100.0%) |
| Public Administration | 11 (78.6%) | 3 (21.4%) |
| Total | 262 (58.1%) | 189 (41.9%) |
Education in Luna Pier
School Enrollment in Luna Pier
The most common levels of schooling among the 189 students in Luna Pier are elementary school (53 | 28.0%), middle school (51 | 27.0%), and high school (41 | 21.7%).
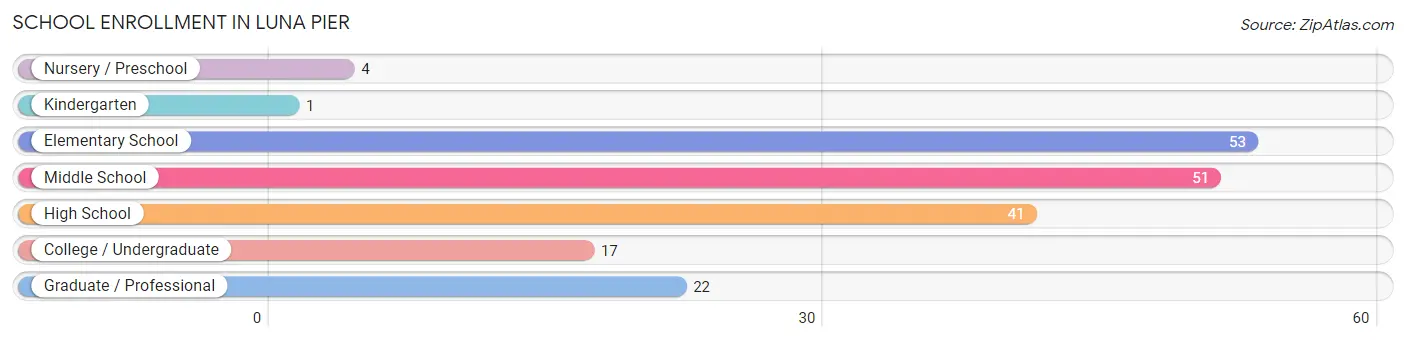
| School Level | # Students | % Students |
| Nursery / Preschool | 4 | 2.1% |
| Kindergarten | 1 | 0.5% |
| Elementary School | 53 | 28.0% |
| Middle School | 51 | 27.0% |
| High School | 41 | 21.7% |
| College / Undergraduate | 17 | 9.0% |
| Graduate / Professional | 22 | 11.6% |
| Total | 189 | 100.0% |
School Enrollment by Age by Funding Source in Luna Pier
Out of a total of 189 students who are enrolled in schools in Luna Pier, 11 (5.8%) attend a private institution, while the remaining 178 (94.2%) are enrolled in public schools. The age group of 35 years and over has the highest likelihood of being enrolled in private schools, with 11 (52.4% in the age bracket) enrolled. Conversely, the age group of 3 to 4 year olds has the lowest likelihood of being enrolled in a private school, with 4 (100.0% in the age bracket) attending a public institution.
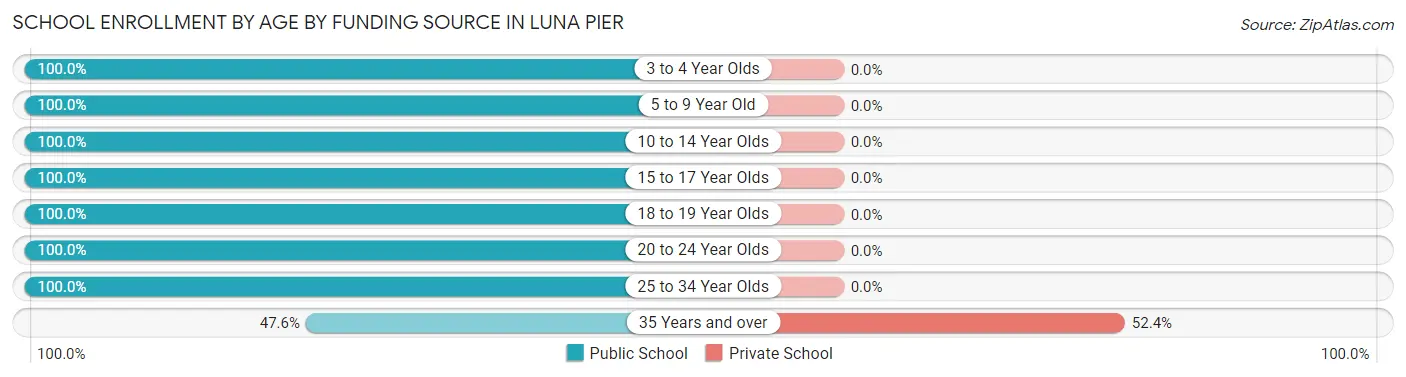
| Age Bracket | Public School | Private School |
| 3 to 4 Year Olds | 4 (100.0%) | 0 (0.0%) |
| 5 to 9 Year Old | 39 (100.0%) | 0 (0.0%) |
| 10 to 14 Year Olds | 62 (100.0%) | 0 (0.0%) |
| 15 to 17 Year Olds | 27 (100.0%) | 0 (0.0%) |
| 18 to 19 Year Olds | 21 (100.0%) | 0 (0.0%) |
| 20 to 24 Year Olds | 8 (100.0%) | 0 (0.0%) |
| 25 to 34 Year Olds | 7 (100.0%) | 0 (0.0%) |
| 35 Years and over | 10 (47.6%) | 11 (52.4%) |
| Total | 178 (94.2%) | 11 (5.8%) |
Educational Attainment by Field of Study in Luna Pier
Arts & humanities (32 | 17.5%), business (31 | 16.9%), education (31 | 16.9%), science & technology (17 | 9.3%), and physical & health sciences (12 | 6.6%) are the most common fields of study among 183 individuals in Luna Pier who have obtained a bachelor's degree or higher.
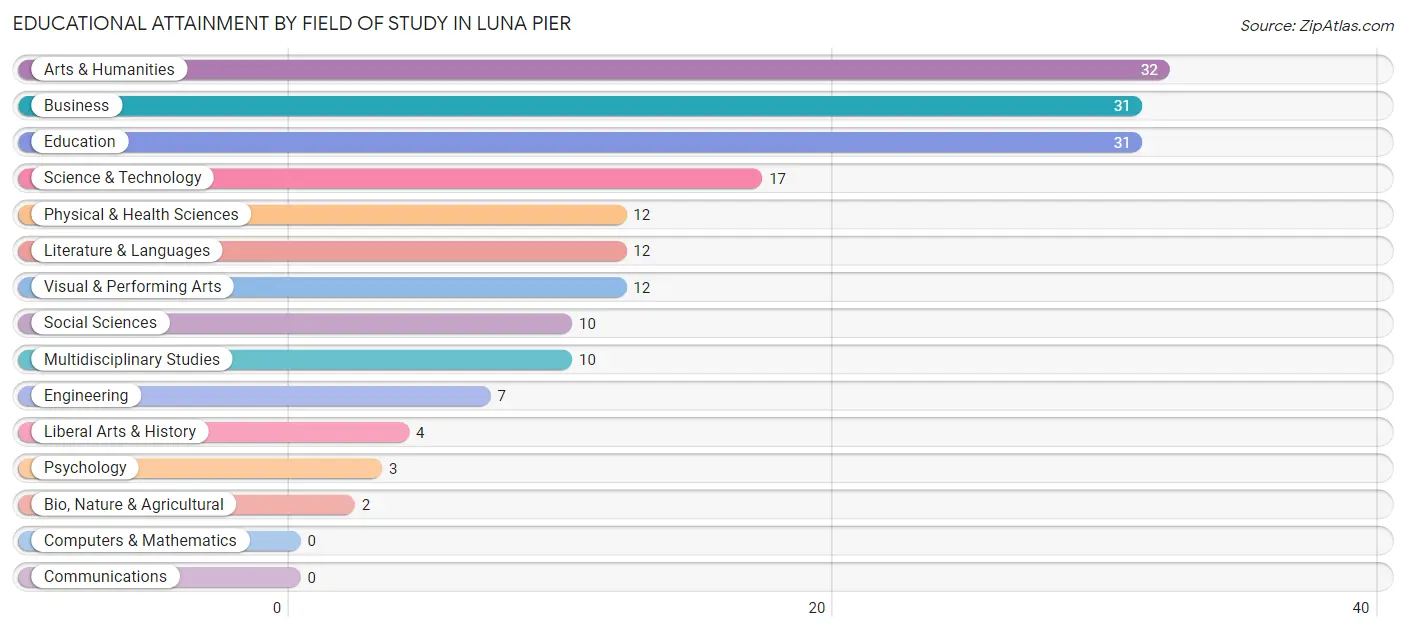
| Field of Study | # Graduates | % Graduates |
| Computers & Mathematics | 0 | 0.0% |
| Bio, Nature & Agricultural | 2 | 1.1% |
| Physical & Health Sciences | 12 | 6.6% |
| Psychology | 3 | 1.6% |
| Social Sciences | 10 | 5.5% |
| Engineering | 7 | 3.8% |
| Multidisciplinary Studies | 10 | 5.5% |
| Science & Technology | 17 | 9.3% |
| Business | 31 | 16.9% |
| Education | 31 | 16.9% |
| Literature & Languages | 12 | 6.6% |
| Liberal Arts & History | 4 | 2.2% |
| Visual & Performing Arts | 12 | 6.6% |
| Communications | 0 | 0.0% |
| Arts & Humanities | 32 | 17.5% |
| Total | 183 | 100.0% |
Transportation & Commute in Luna Pier
Vehicle Availability by Sex in Luna Pier
The most prevalent vehicle ownership categories in Luna Pier are males with 2 vehicles (130, accounting for 49.6%) and females with 2 vehicles (82, making up 74.3%).

| Vehicles Available | Male | Female |
| No Vehicle | 0 (0.0%) | 0 (0.0%) |
| 1 Vehicle | 53 (20.2%) | 42 (24.0%) |
| 2 Vehicles | 130 (49.6%) | 82 (46.9%) |
| 3 Vehicles | 51 (19.5%) | 34 (19.4%) |
| 4 Vehicles | 14 (5.3%) | 14 (8.0%) |
| 5 or more Vehicles | 14 (5.3%) | 3 (1.7%) |
| Total | 262 (100.0%) | 175 (100.0%) |
Commute Time in Luna Pier
The most frequently occuring commute durations in Luna Pier are 20 to 24 minutes (82 commuters, 19.9%), 15 to 19 minutes (71 commuters, 17.2%), and 30 to 34 minutes (52 commuters, 12.6%).
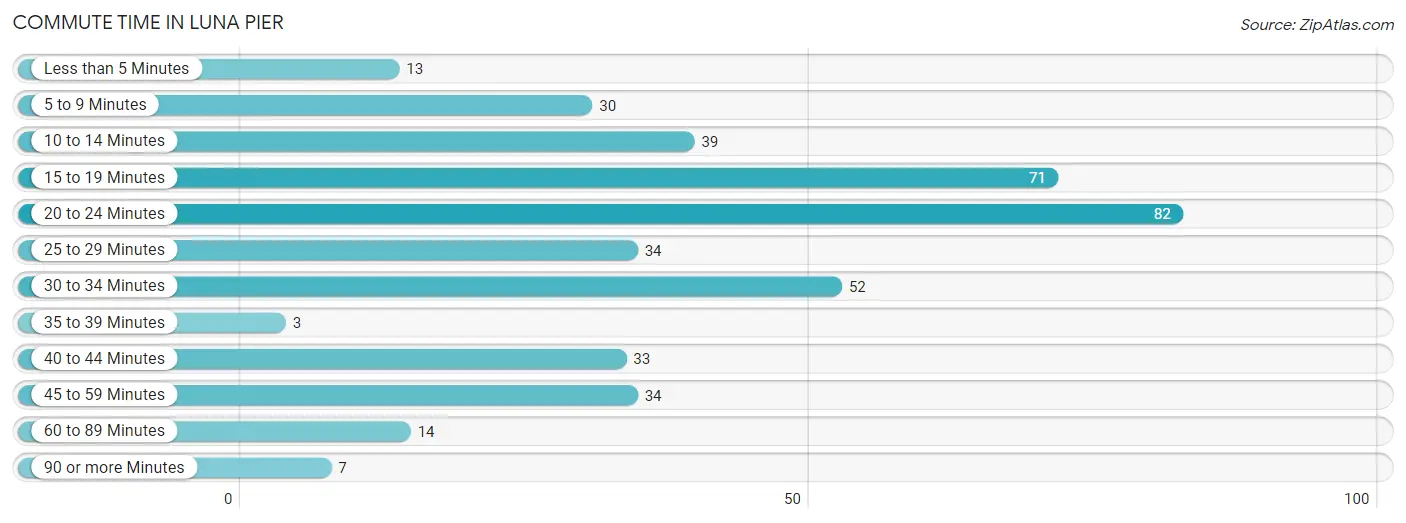
| Commute Time | # Commuters | % Commuters |
| Less than 5 Minutes | 13 | 3.2% |
| 5 to 9 Minutes | 30 | 7.3% |
| 10 to 14 Minutes | 39 | 9.5% |
| 15 to 19 Minutes | 71 | 17.2% |
| 20 to 24 Minutes | 82 | 19.9% |
| 25 to 29 Minutes | 34 | 8.3% |
| 30 to 34 Minutes | 52 | 12.6% |
| 35 to 39 Minutes | 3 | 0.7% |
| 40 to 44 Minutes | 33 | 8.0% |
| 45 to 59 Minutes | 34 | 8.3% |
| 60 to 89 Minutes | 14 | 3.4% |
| 90 or more Minutes | 7 | 1.7% |
Commute Time by Sex in Luna Pier
The most common commute times in Luna Pier are 20 to 24 minutes (53 commuters, 21.0%) for males and 15 to 19 minutes (35 commuters, 21.9%) for females.
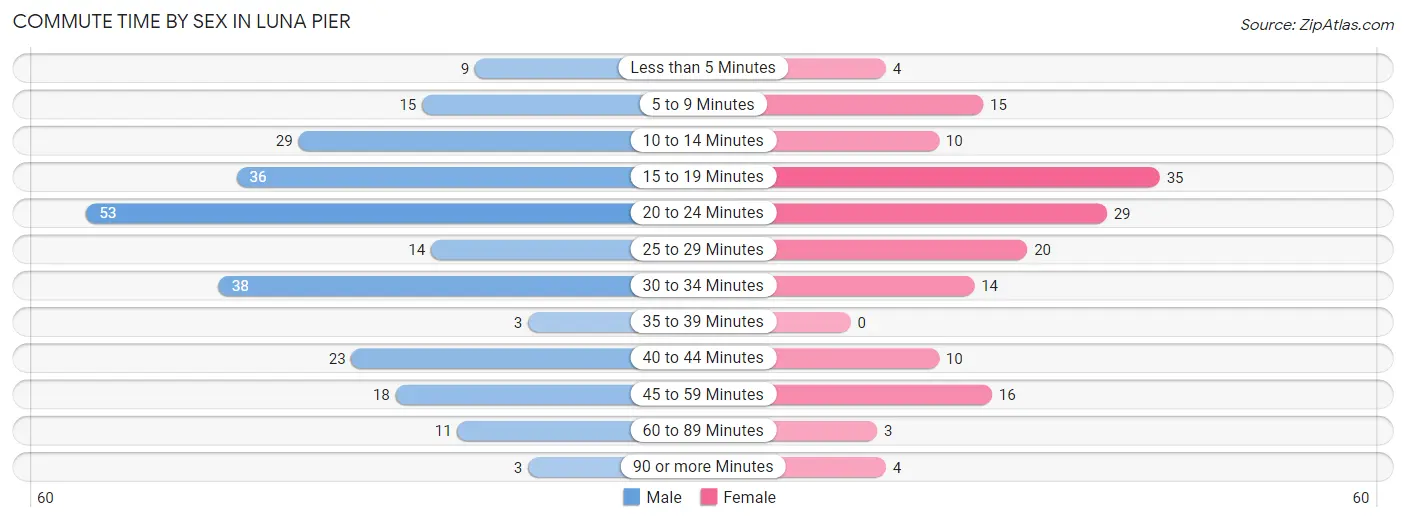
| Commute Time | Male | Female |
| Less than 5 Minutes | 9 (3.6%) | 4 (2.5%) |
| 5 to 9 Minutes | 15 (5.9%) | 15 (9.4%) |
| 10 to 14 Minutes | 29 (11.5%) | 10 (6.2%) |
| 15 to 19 Minutes | 36 (14.3%) | 35 (21.9%) |
| 20 to 24 Minutes | 53 (21.0%) | 29 (18.1%) |
| 25 to 29 Minutes | 14 (5.6%) | 20 (12.5%) |
| 30 to 34 Minutes | 38 (15.1%) | 14 (8.7%) |
| 35 to 39 Minutes | 3 (1.2%) | 0 (0.0%) |
| 40 to 44 Minutes | 23 (9.1%) | 10 (6.2%) |
| 45 to 59 Minutes | 18 (7.1%) | 16 (10.0%) |
| 60 to 89 Minutes | 11 (4.4%) | 3 (1.9%) |
| 90 or more Minutes | 3 (1.2%) | 4 (2.5%) |
Time of Departure to Work by Sex in Luna Pier
The most frequent times of departure to work in Luna Pier are 6:30 AM to 6:59 AM (46, 18.2%) for males and 7:00 AM to 7:29 AM (35, 21.9%) for females.
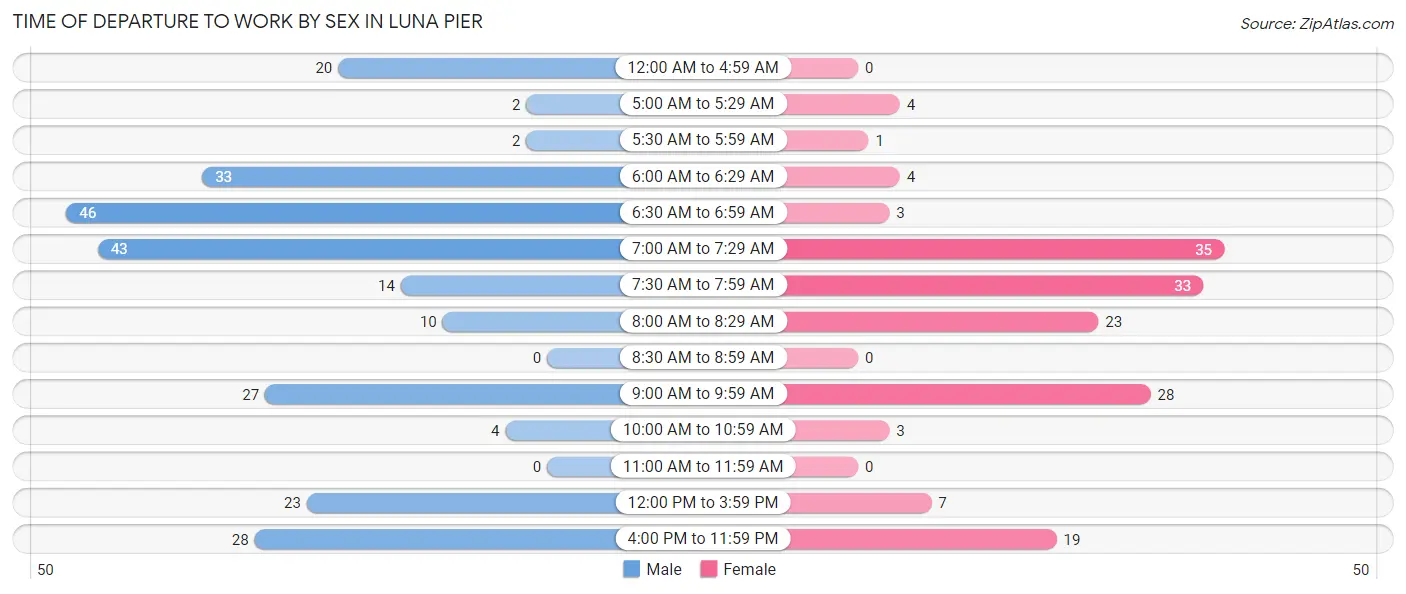
| Time of Departure | Male | Female |
| 12:00 AM to 4:59 AM | 20 (7.9%) | 0 (0.0%) |
| 5:00 AM to 5:29 AM | 2 (0.8%) | 4 (2.5%) |
| 5:30 AM to 5:59 AM | 2 (0.8%) | 1 (0.6%) |
| 6:00 AM to 6:29 AM | 33 (13.1%) | 4 (2.5%) |
| 6:30 AM to 6:59 AM | 46 (18.2%) | 3 (1.9%) |
| 7:00 AM to 7:29 AM | 43 (17.1%) | 35 (21.9%) |
| 7:30 AM to 7:59 AM | 14 (5.6%) | 33 (20.6%) |
| 8:00 AM to 8:29 AM | 10 (4.0%) | 23 (14.4%) |
| 8:30 AM to 8:59 AM | 0 (0.0%) | 0 (0.0%) |
| 9:00 AM to 9:59 AM | 27 (10.7%) | 28 (17.5%) |
| 10:00 AM to 10:59 AM | 4 (1.6%) | 3 (1.9%) |
| 11:00 AM to 11:59 AM | 0 (0.0%) | 0 (0.0%) |
| 12:00 PM to 3:59 PM | 23 (9.1%) | 7 (4.4%) |
| 4:00 PM to 11:59 PM | 28 (11.1%) | 19 (11.9%) |
| Total | 252 (100.0%) | 160 (100.0%) |
Housing Occupancy in Luna Pier
Occupancy by Ownership in Luna Pier
Of the total 621 dwellings in Luna Pier, owner-occupied units account for 478 (77.0%), while renter-occupied units make up 143 (23.0%).
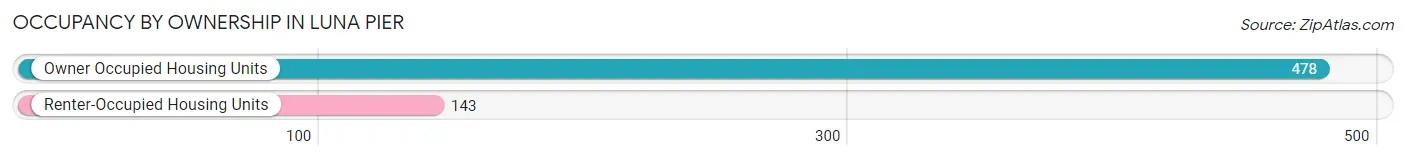
| Occupancy | # Housing Units | % Housing Units |
| Owner Occupied Housing Units | 478 | 77.0% |
| Renter-Occupied Housing Units | 143 | 23.0% |
| Total Occupied Housing Units | 621 | 100.0% |
Occupancy by Household Size in Luna Pier
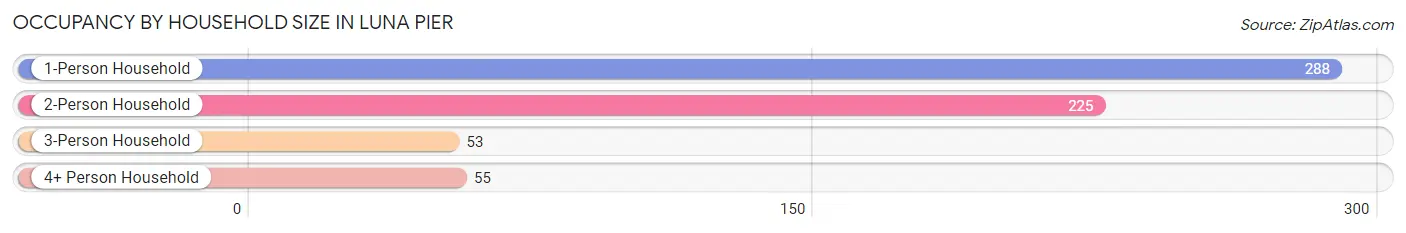
| Household Size | # Housing Units | % Housing Units |
| 1-Person Household | 288 | 46.4% |
| 2-Person Household | 225 | 36.2% |
| 3-Person Household | 53 | 8.5% |
| 4+ Person Household | 55 | 8.9% |
| Total Housing Units | 621 | 100.0% |
Occupancy by Ownership by Household Size in Luna Pier
| Household Size | Owner-occupied | Renter-occupied |
| 1-Person Household | 194 (67.4%) | 94 (32.6%) |
| 2-Person Household | 208 (92.4%) | 17 (7.6%) |
| 3-Person Household | 36 (67.9%) | 17 (32.1%) |
| 4+ Person Household | 40 (72.7%) | 15 (27.3%) |
| Total Housing Units | 478 (77.0%) | 143 (23.0%) |
Occupancy by Educational Attainment in Luna Pier
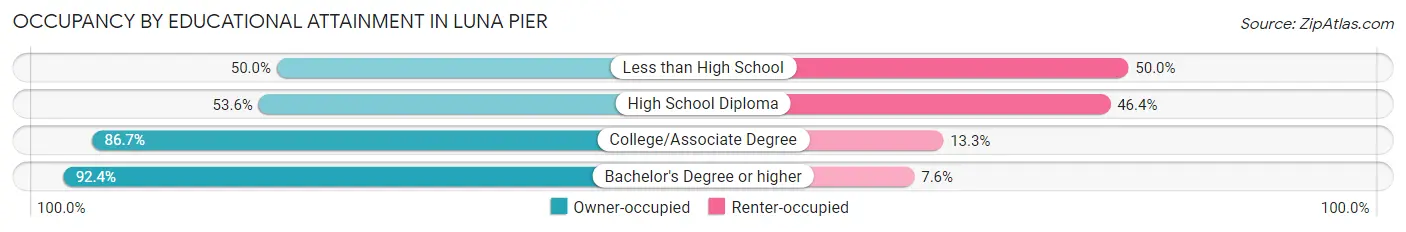
| Household Size | Owner-occupied | Renter-occupied |
| Less than High School | 10 (50.0%) | 10 (50.0%) |
| High School Diploma | 97 (53.6%) | 84 (46.4%) |
| College/Associate Degree | 261 (86.7%) | 40 (13.3%) |
| Bachelor's Degree or higher | 110 (92.4%) | 9 (7.6%) |
Occupancy by Age of Householder in Luna Pier
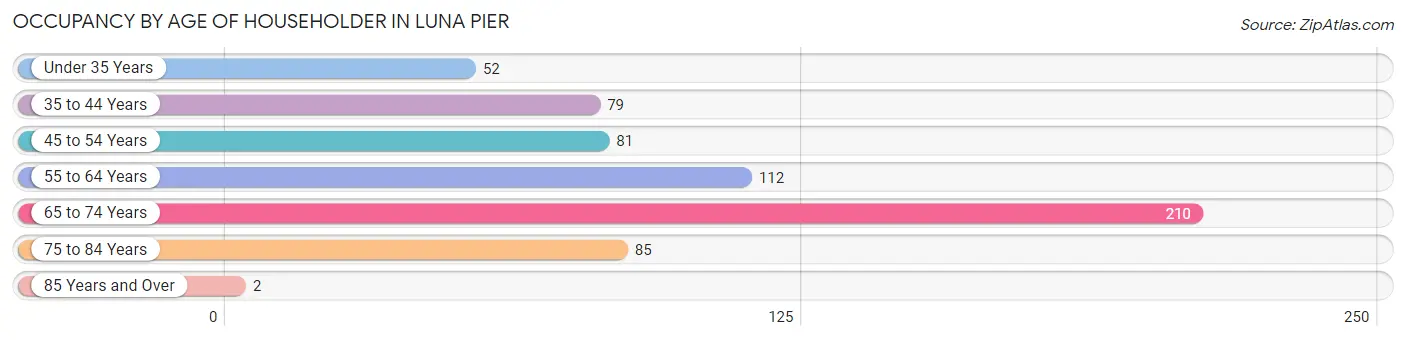
| Age Bracket | # Households | % Households |
| Under 35 Years | 52 | 8.4% |
| 35 to 44 Years | 79 | 12.7% |
| 45 to 54 Years | 81 | 13.0% |
| 55 to 64 Years | 112 | 18.0% |
| 65 to 74 Years | 210 | 33.8% |
| 75 to 84 Years | 85 | 13.7% |
| 85 Years and Over | 2 | 0.3% |
| Total | 621 | 100.0% |
Housing Finances in Luna Pier
Median Income by Occupancy in Luna Pier
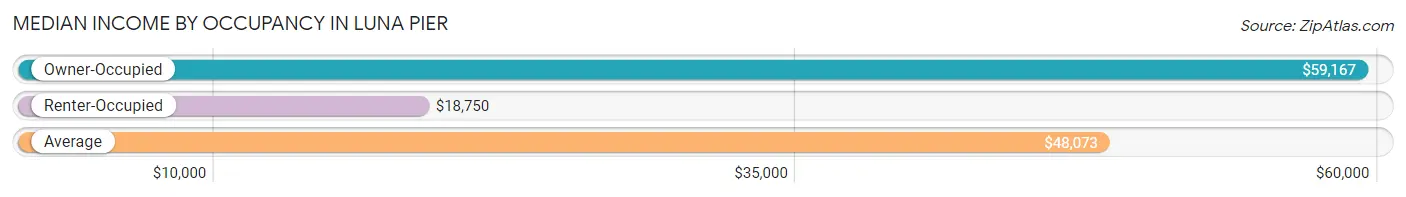
| Occupancy Type | # Households | Median Income |
| Owner-Occupied | 478 (77.0%) | $59,167 |
| Renter-Occupied | 143 (23.0%) | $18,750 |
| Average | 621 (100.0%) | $48,073 |
Occupancy by Householder Income Bracket in Luna Pier
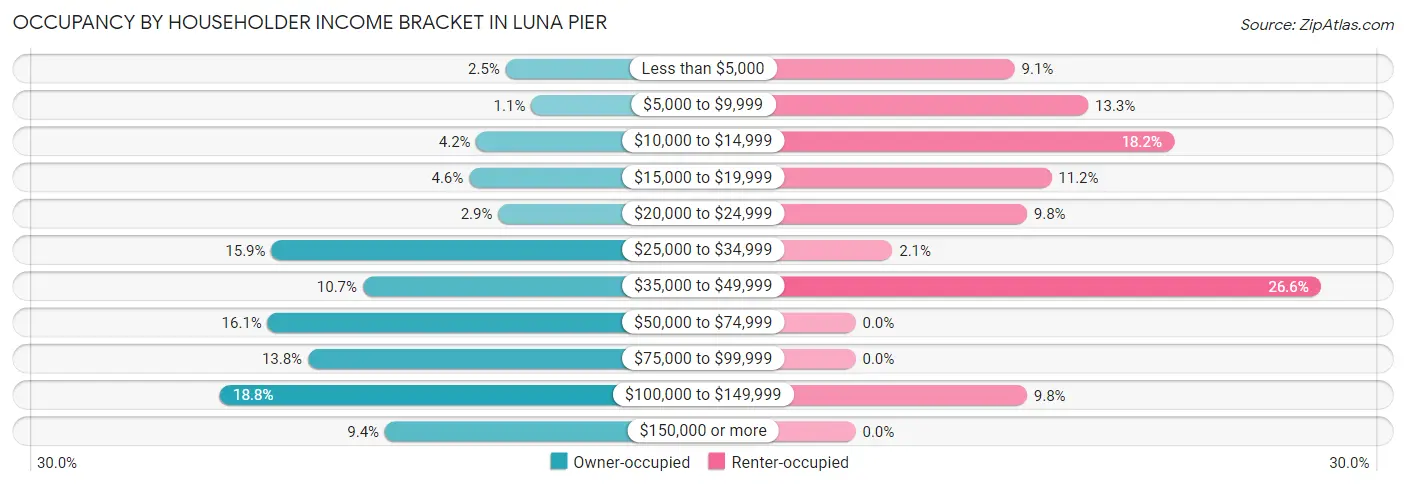
| Income Bracket | Owner-occupied | Renter-occupied |
| Less than $5,000 | 12 (2.5%) | 13 (9.1%) |
| $5,000 to $9,999 | 5 (1.1%) | 19 (13.3%) |
| $10,000 to $14,999 | 20 (4.2%) | 26 (18.2%) |
| $15,000 to $19,999 | 22 (4.6%) | 16 (11.2%) |
| $20,000 to $24,999 | 14 (2.9%) | 14 (9.8%) |
| $25,000 to $34,999 | 76 (15.9%) | 3 (2.1%) |
| $35,000 to $49,999 | 51 (10.7%) | 38 (26.6%) |
| $50,000 to $74,999 | 77 (16.1%) | 0 (0.0%) |
| $75,000 to $99,999 | 66 (13.8%) | 0 (0.0%) |
| $100,000 to $149,999 | 90 (18.8%) | 14 (9.8%) |
| $150,000 or more | 45 (9.4%) | 0 (0.0%) |
| Total | 478 (100.0%) | 143 (100.0%) |
Monthly Housing Cost Tiers in Luna Pier
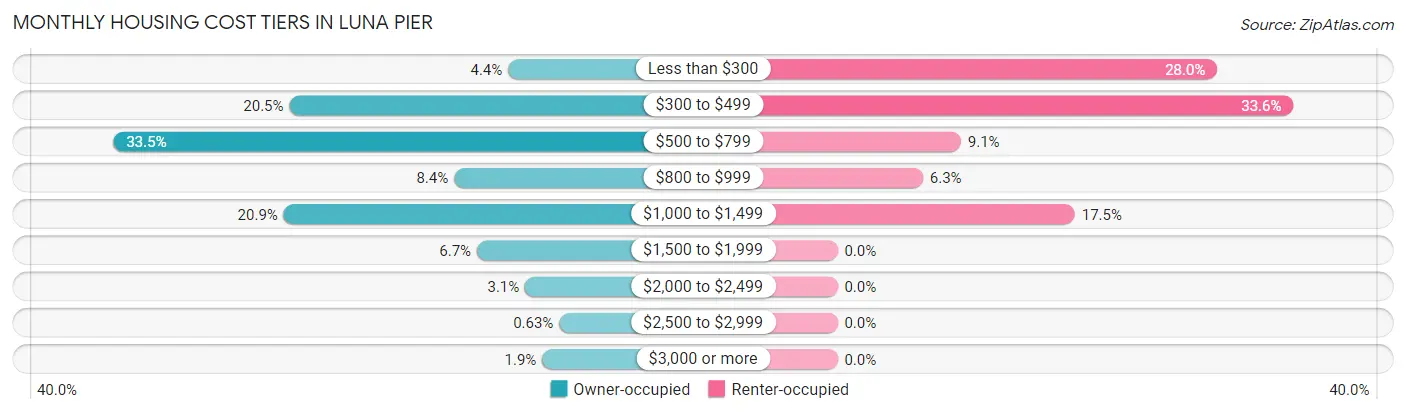
| Monthly Cost | Owner-occupied | Renter-occupied |
| Less than $300 | 21 (4.4%) | 40 (28.0%) |
| $300 to $499 | 98 (20.5%) | 48 (33.6%) |
| $500 to $799 | 160 (33.5%) | 13 (9.1%) |
| $800 to $999 | 40 (8.4%) | 9 (6.3%) |
| $1,000 to $1,499 | 100 (20.9%) | 25 (17.5%) |
| $1,500 to $1,999 | 32 (6.7%) | 0 (0.0%) |
| $2,000 to $2,499 | 15 (3.1%) | 0 (0.0%) |
| $2,500 to $2,999 | 3 (0.6%) | 0 (0.0%) |
| $3,000 or more | 9 (1.9%) | 0 (0.0%) |
| Total | 478 (100.0%) | 143 (100.0%) |
Physical Housing Characteristics in Luna Pier
Housing Structures in Luna Pier
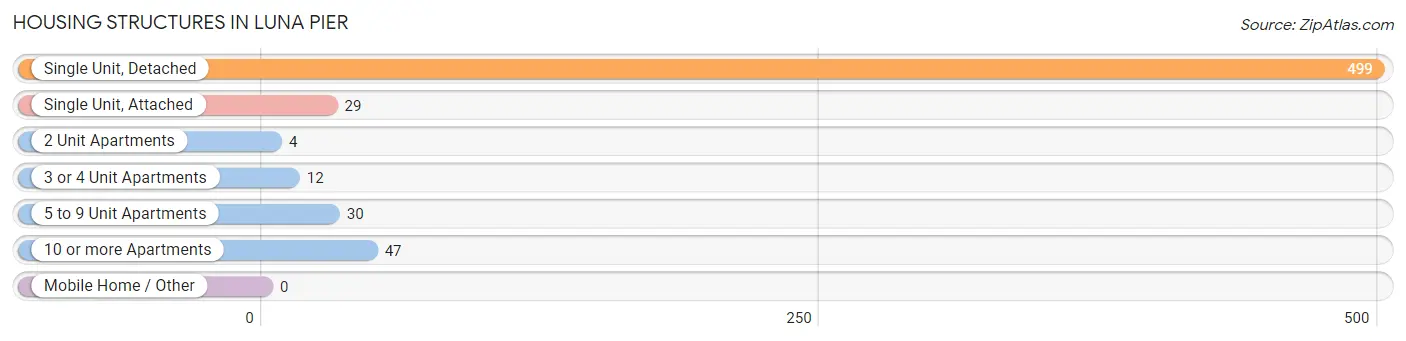
| Structure Type | # Housing Units | % Housing Units |
| Single Unit, Detached | 499 | 80.3% |
| Single Unit, Attached | 29 | 4.7% |
| 2 Unit Apartments | 4 | 0.6% |
| 3 or 4 Unit Apartments | 12 | 1.9% |
| 5 to 9 Unit Apartments | 30 | 4.8% |
| 10 or more Apartments | 47 | 7.6% |
| Mobile Home / Other | 0 | 0.0% |
| Total | 621 | 100.0% |
Housing Structures by Occupancy in Luna Pier
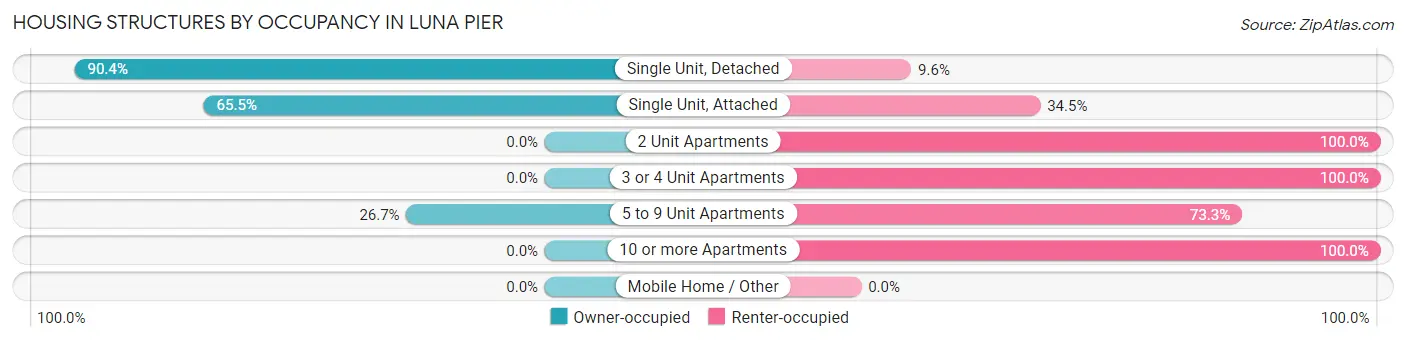
| Structure Type | Owner-occupied | Renter-occupied |
| Single Unit, Detached | 451 (90.4%) | 48 (9.6%) |
| Single Unit, Attached | 19 (65.5%) | 10 (34.5%) |
| 2 Unit Apartments | 0 (0.0%) | 4 (100.0%) |
| 3 or 4 Unit Apartments | 0 (0.0%) | 12 (100.0%) |
| 5 to 9 Unit Apartments | 8 (26.7%) | 22 (73.3%) |
| 10 or more Apartments | 0 (0.0%) | 47 (100.0%) |
| Mobile Home / Other | 0 (0.0%) | 0 (0.0%) |
| Total | 478 (77.0%) | 143 (23.0%) |
Housing Structures by Number of Rooms in Luna Pier
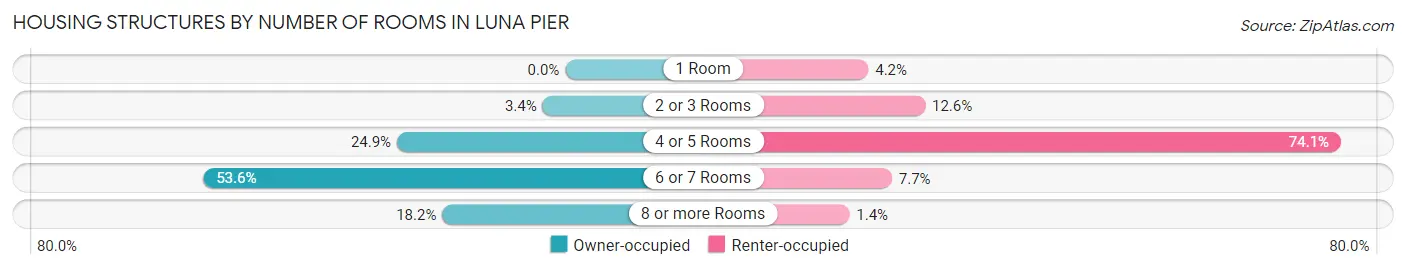
| Number of Rooms | Owner-occupied | Renter-occupied |
| 1 Room | 0 (0.0%) | 6 (4.2%) |
| 2 or 3 Rooms | 16 (3.4%) | 18 (12.6%) |
| 4 or 5 Rooms | 119 (24.9%) | 106 (74.1%) |
| 6 or 7 Rooms | 256 (53.6%) | 11 (7.7%) |
| 8 or more Rooms | 87 (18.2%) | 2 (1.4%) |
| Total | 478 (100.0%) | 143 (100.0%) |
Housing Structure by Heating Type in Luna Pier
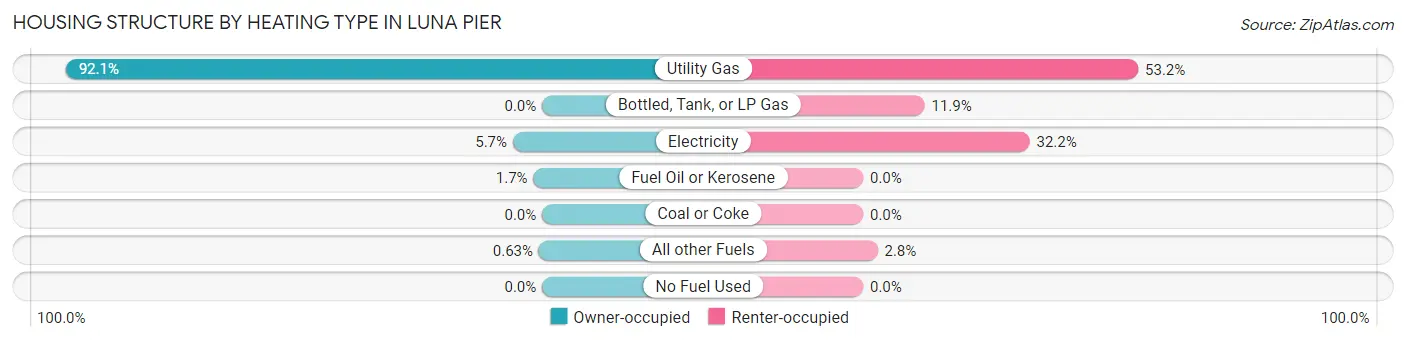
| Heating Type | Owner-occupied | Renter-occupied |
| Utility Gas | 440 (92.0%) | 76 (53.1%) |
| Bottled, Tank, or LP Gas | 0 (0.0%) | 17 (11.9%) |
| Electricity | 27 (5.7%) | 46 (32.2%) |
| Fuel Oil or Kerosene | 8 (1.7%) | 0 (0.0%) |
| Coal or Coke | 0 (0.0%) | 0 (0.0%) |
| All other Fuels | 3 (0.6%) | 4 (2.8%) |
| No Fuel Used | 0 (0.0%) | 0 (0.0%) |
| Total | 478 (100.0%) | 143 (100.0%) |
Household Vehicle Usage in Luna Pier
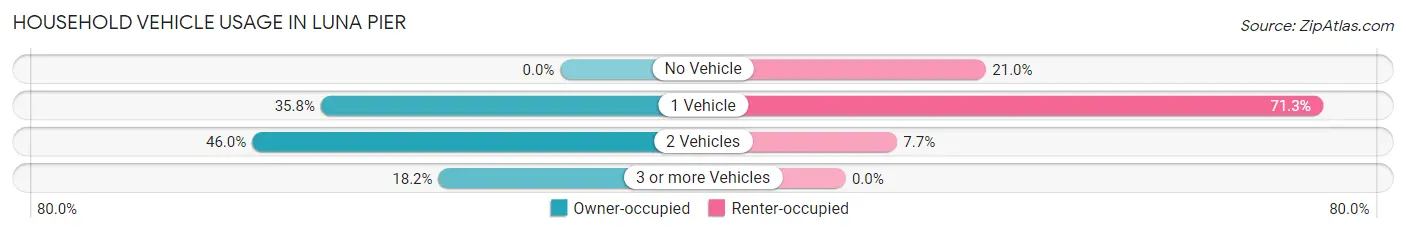
| Vehicles per Household | Owner-occupied | Renter-occupied |
| No Vehicle | 0 (0.0%) | 30 (21.0%) |
| 1 Vehicle | 171 (35.8%) | 102 (71.3%) |
| 2 Vehicles | 220 (46.0%) | 11 (7.7%) |
| 3 or more Vehicles | 87 (18.2%) | 0 (0.0%) |
| Total | 478 (100.0%) | 143 (100.0%) |
Real Estate & Mortgages in Luna Pier
Real Estate and Mortgage Overview in Luna Pier
| Characteristic | Without Mortgage | With Mortgage |
| Housing Units | 255 | 223 |
| Median Property Value | $202,900 | $147,300 |
| Median Household Income | $57,188 | $21 |
| Monthly Housing Costs | $519 | $5 |
| Real Estate Taxes | $1,957 | $10 |
Property Value by Mortgage Status in Luna Pier
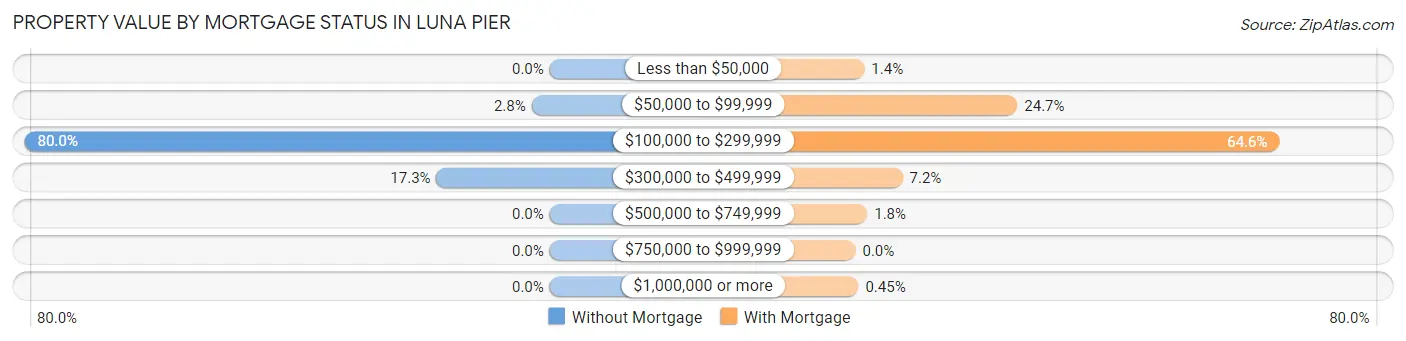
| Property Value | Without Mortgage | With Mortgage |
| Less than $50,000 | 0 (0.0%) | 3 (1.3%) |
| $50,000 to $99,999 | 7 (2.8%) | 55 (24.7%) |
| $100,000 to $299,999 | 204 (80.0%) | 144 (64.6%) |
| $300,000 to $499,999 | 44 (17.2%) | 16 (7.2%) |
| $500,000 to $749,999 | 0 (0.0%) | 4 (1.8%) |
| $750,000 to $999,999 | 0 (0.0%) | 0 (0.0%) |
| $1,000,000 or more | 0 (0.0%) | 1 (0.4%) |
| Total | 255 (100.0%) | 223 (100.0%) |
Household Income by Mortgage Status in Luna Pier
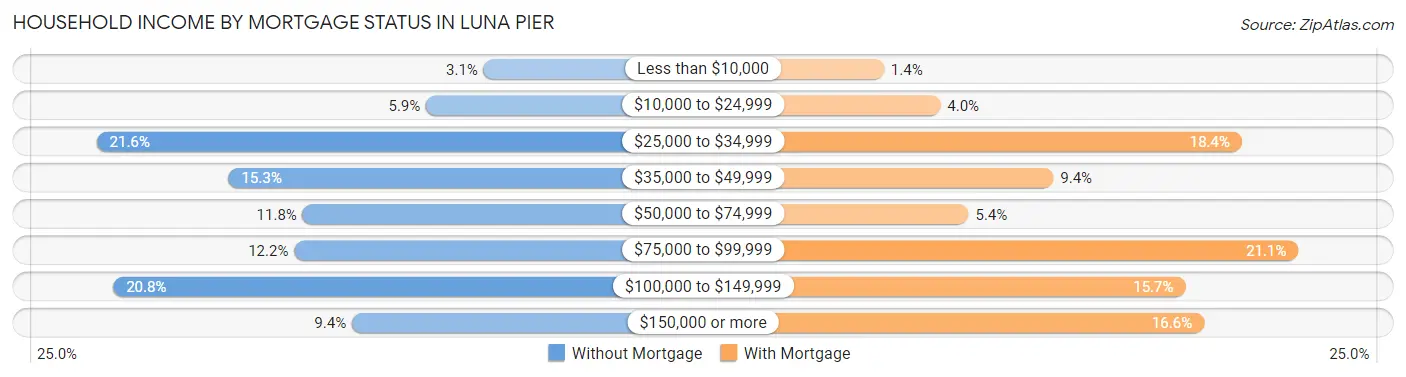
| Household Income | Without Mortgage | With Mortgage |
| Less than $10,000 | 8 (3.1%) | 3 (1.3%) |
| $10,000 to $24,999 | 15 (5.9%) | 9 (4.0%) |
| $25,000 to $34,999 | 55 (21.6%) | 41 (18.4%) |
| $35,000 to $49,999 | 39 (15.3%) | 21 (9.4%) |
| $50,000 to $74,999 | 30 (11.8%) | 12 (5.4%) |
| $75,000 to $99,999 | 31 (12.2%) | 47 (21.1%) |
| $100,000 to $149,999 | 53 (20.8%) | 35 (15.7%) |
| $150,000 or more | 24 (9.4%) | 37 (16.6%) |
| Total | 255 (100.0%) | 223 (100.0%) |
Property Value to Household Income Ratio in Luna Pier
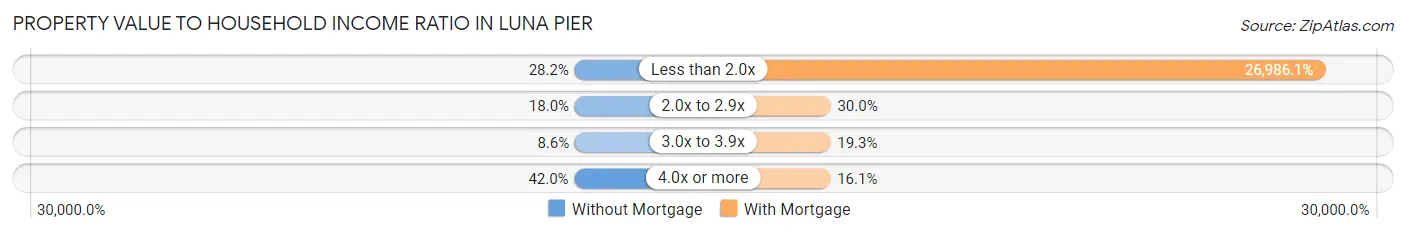
| Value-to-Income Ratio | Without Mortgage | With Mortgage |
| Less than 2.0x | 72 (28.2%) | 60,179 (26,986.1%) |
| 2.0x to 2.9x | 46 (18.0%) | 67 (30.0%) |
| 3.0x to 3.9x | 22 (8.6%) | 43 (19.3%) |
| 4.0x or more | 107 (42.0%) | 36 (16.1%) |
| Total | 255 (100.0%) | 223 (100.0%) |
Real Estate Taxes by Mortgage Status in Luna Pier

| Property Taxes | Without Mortgage | With Mortgage |
| Less than $800 | 18 (7.1%) | 4 (1.8%) |
| $800 to $1,499 | 29 (11.4%) | 7 (3.1%) |
| $800 to $1,499 | 208 (81.6%) | 88 (39.5%) |
| Total | 255 (100.0%) | 223 (100.0%) |
Health & Disability in Luna Pier
Health Insurance Coverage by Age in Luna Pier
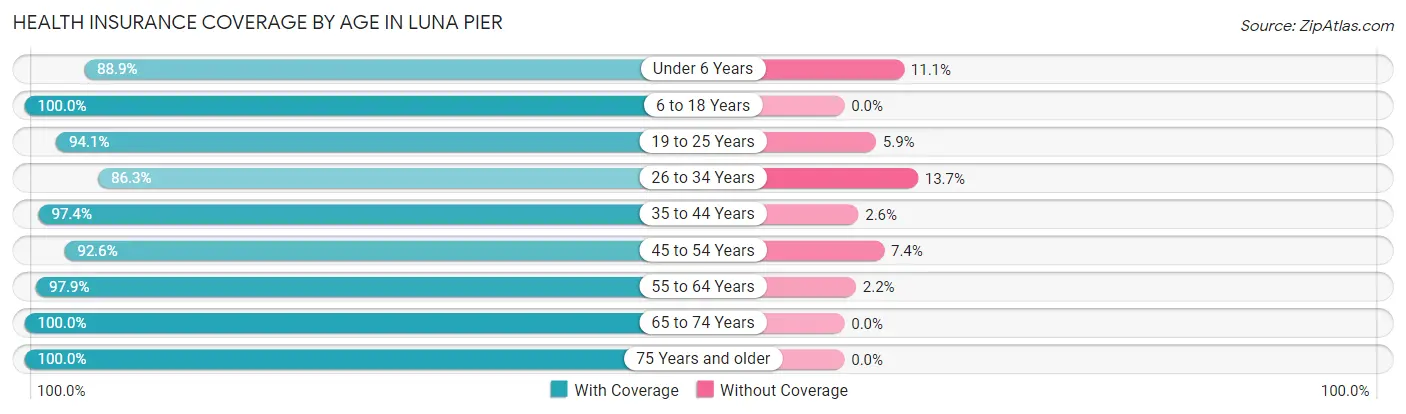
| Age Bracket | With Coverage | Without Coverage |
| Under 6 Years | 56 (88.9%) | 7 (11.1%) |
| 6 to 18 Years | 146 (100.0%) | 0 (0.0%) |
| 19 to 25 Years | 64 (94.1%) | 4 (5.9%) |
| 26 to 34 Years | 63 (86.3%) | 10 (13.7%) |
| 35 to 44 Years | 149 (97.4%) | 4 (2.6%) |
| 45 to 54 Years | 125 (92.6%) | 10 (7.4%) |
| 55 to 64 Years | 182 (97.9%) | 4 (2.1%) |
| 65 to 74 Years | 290 (100.0%) | 0 (0.0%) |
| 75 Years and older | 111 (100.0%) | 0 (0.0%) |
| Total | 1,186 (96.8%) | 39 (3.2%) |
Health Insurance Coverage by Citizenship Status in Luna Pier

| Citizenship Status | With Coverage | Without Coverage |
| Native Born | 56 (88.9%) | 7 (11.1%) |
| Foreign Born, Citizen | 146 (100.0%) | 0 (0.0%) |
| Foreign Born, not a Citizen | 64 (94.1%) | 4 (5.9%) |
Health Insurance Coverage by Household Income in Luna Pier
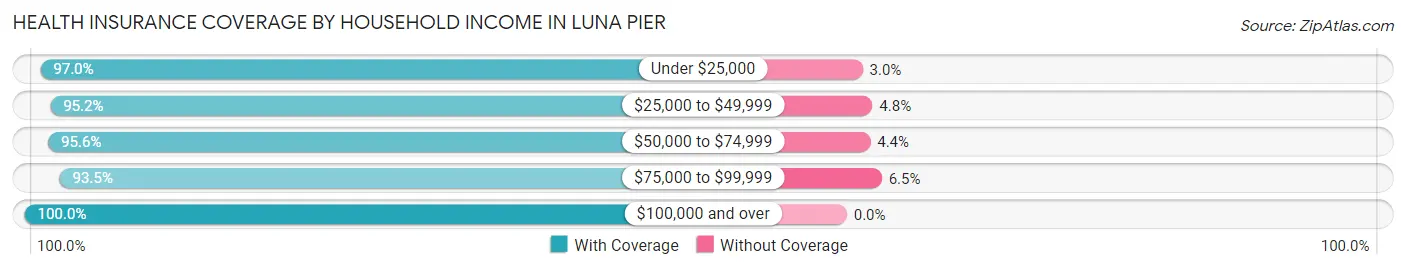
| Household Income | With Coverage | Without Coverage |
| Under $25,000 | 328 (97.0%) | 10 (3.0%) |
| $25,000 to $49,999 | 218 (95.2%) | 11 (4.8%) |
| $50,000 to $74,999 | 174 (95.6%) | 8 (4.4%) |
| $75,000 to $99,999 | 143 (93.5%) | 10 (6.5%) |
| $100,000 and over | 323 (100.0%) | 0 (0.0%) |
Public vs Private Health Insurance Coverage by Age in Luna Pier
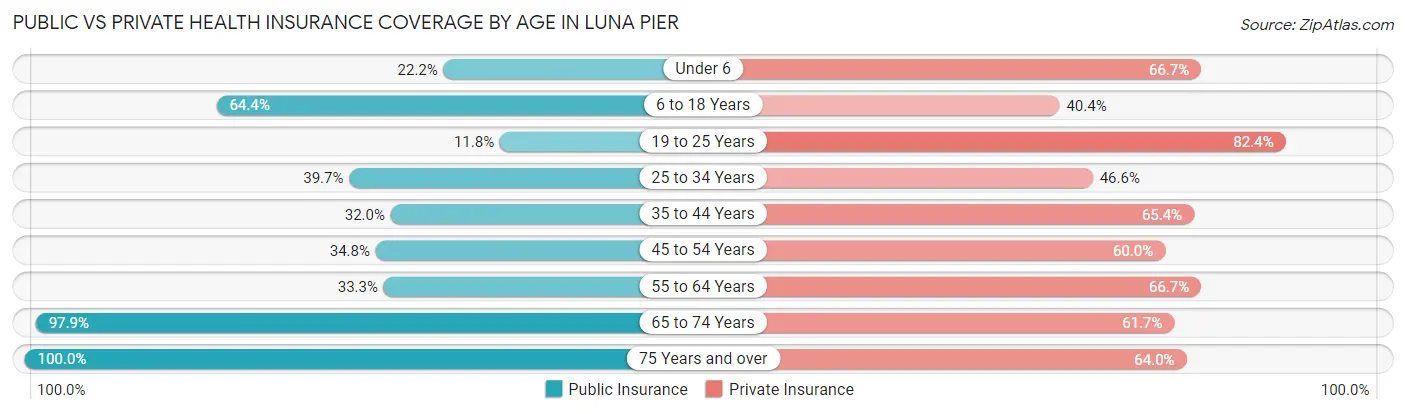
| Age Bracket | Public Insurance | Private Insurance |
| Under 6 | 14 (22.2%) | 42 (66.7%) |
| 6 to 18 Years | 94 (64.4%) | 59 (40.4%) |
| 19 to 25 Years | 8 (11.8%) | 56 (82.4%) |
| 25 to 34 Years | 29 (39.7%) | 34 (46.6%) |
| 35 to 44 Years | 49 (32.0%) | 100 (65.4%) |
| 45 to 54 Years | 47 (34.8%) | 81 (60.0%) |
| 55 to 64 Years | 62 (33.3%) | 124 (66.7%) |
| 65 to 74 Years | 284 (97.9%) | 179 (61.7%) |
| 75 Years and over | 111 (100.0%) | 71 (64.0%) |
| Total | 698 (57.0%) | 746 (60.9%) |
Disability Status by Sex by Age in Luna Pier
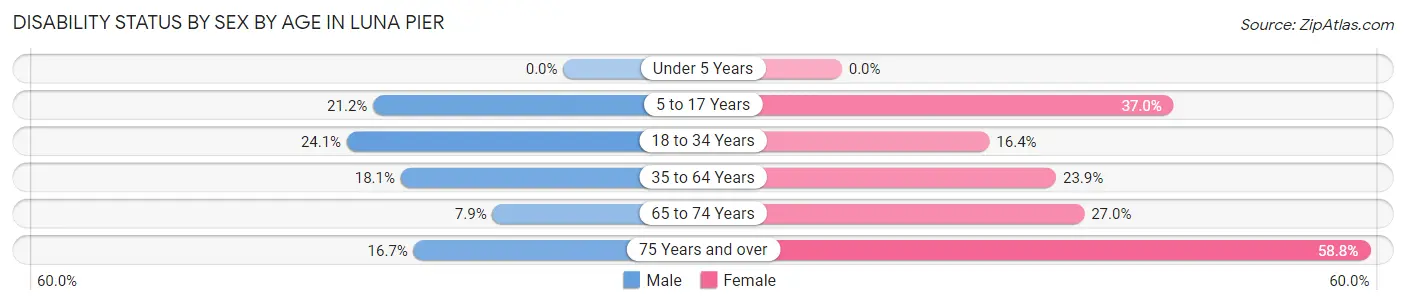
| Age Bracket | Male | Female |
| Under 5 Years | 0 (0.0%) | 0 (0.0%) |
| 5 to 17 Years | 18 (21.2%) | 17 (37.0%) |
| 18 to 34 Years | 20 (24.1%) | 12 (16.4%) |
| 35 to 64 Years | 38 (18.1%) | 63 (23.9%) |
| 65 to 74 Years | 15 (7.9%) | 27 (27.0%) |
| 75 Years and over | 10 (16.7%) | 30 (58.8%) |
Disability Class by Sex by Age in Luna Pier
Disability Class: Hearing Difficulty
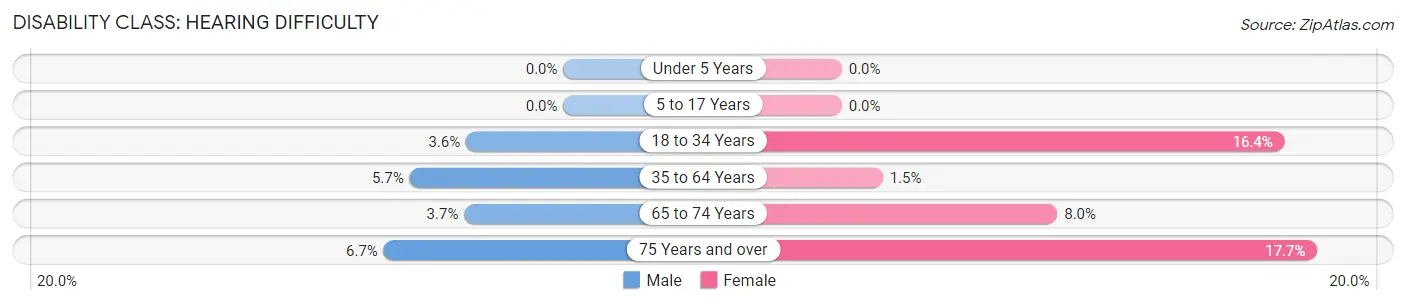
| Age Bracket | Male | Female |
| Under 5 Years | 0 (0.0%) | 0 (0.0%) |
| 5 to 17 Years | 0 (0.0%) | 0 (0.0%) |
| 18 to 34 Years | 3 (3.6%) | 12 (16.4%) |
| 35 to 64 Years | 12 (5.7%) | 4 (1.5%) |
| 65 to 74 Years | 7 (3.7%) | 8 (8.0%) |
| 75 Years and over | 4 (6.7%) | 9 (17.6%) |
Disability Class: Vision Difficulty
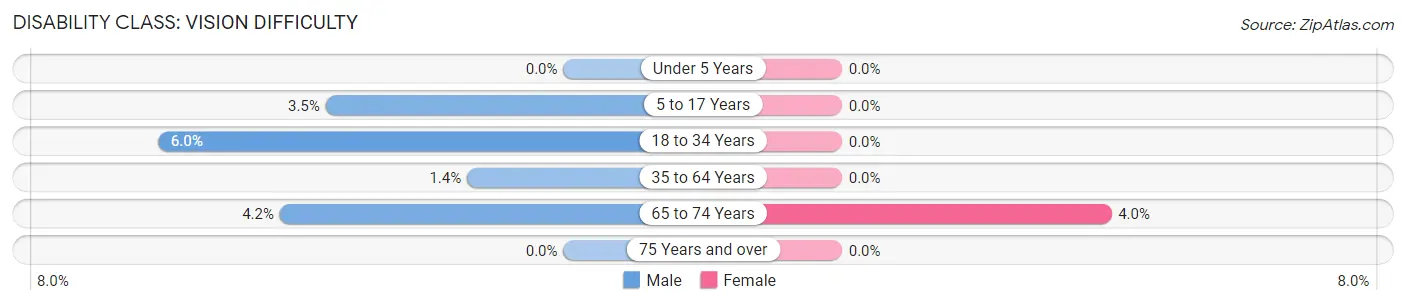
| Age Bracket | Male | Female |
| Under 5 Years | 0 (0.0%) | 0 (0.0%) |
| 5 to 17 Years | 3 (3.5%) | 0 (0.0%) |
| 18 to 34 Years | 5 (6.0%) | 0 (0.0%) |
| 35 to 64 Years | 3 (1.4%) | 0 (0.0%) |
| 65 to 74 Years | 8 (4.2%) | 4 (4.0%) |
| 75 Years and over | 0 (0.0%) | 0 (0.0%) |
Disability Class: Cognitive Difficulty
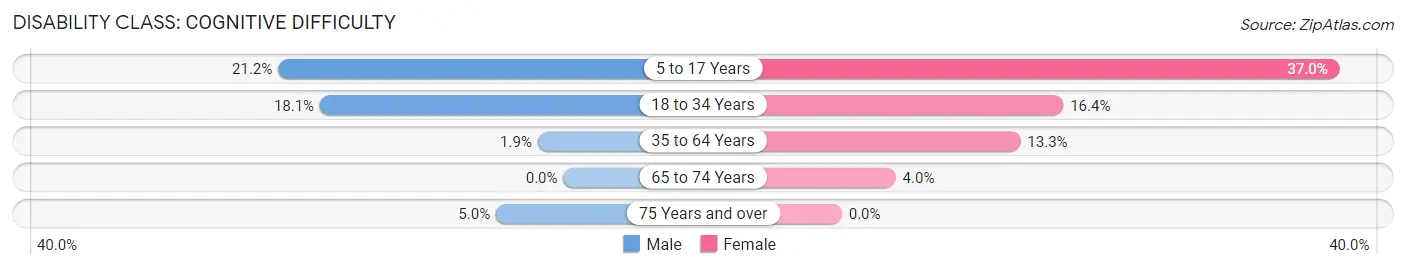
| Age Bracket | Male | Female |
| 5 to 17 Years | 18 (21.2%) | 17 (37.0%) |
| 18 to 34 Years | 15 (18.1%) | 12 (16.4%) |
| 35 to 64 Years | 4 (1.9%) | 35 (13.3%) |
| 65 to 74 Years | 0 (0.0%) | 4 (4.0%) |
| 75 Years and over | 3 (5.0%) | 0 (0.0%) |
Disability Class: Ambulatory Difficulty
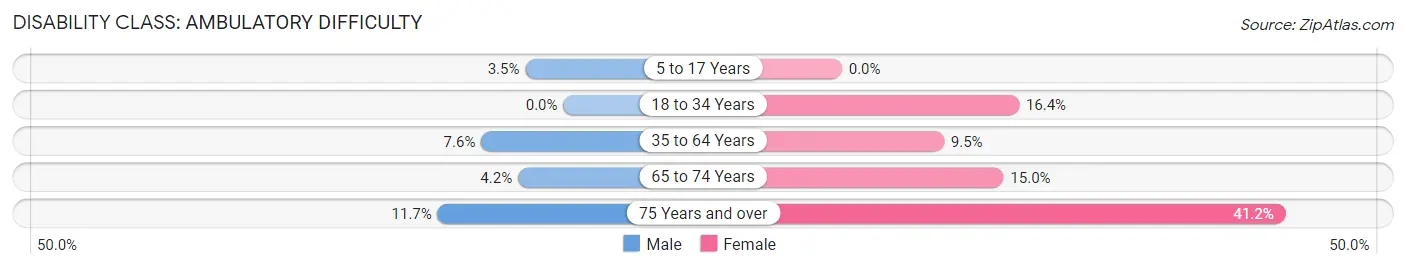
| Age Bracket | Male | Female |
| 5 to 17 Years | 3 (3.5%) | 0 (0.0%) |
| 18 to 34 Years | 0 (0.0%) | 12 (16.4%) |
| 35 to 64 Years | 16 (7.6%) | 25 (9.5%) |
| 65 to 74 Years | 8 (4.2%) | 15 (15.0%) |
| 75 Years and over | 7 (11.7%) | 21 (41.2%) |
Disability Class: Self-Care Difficulty
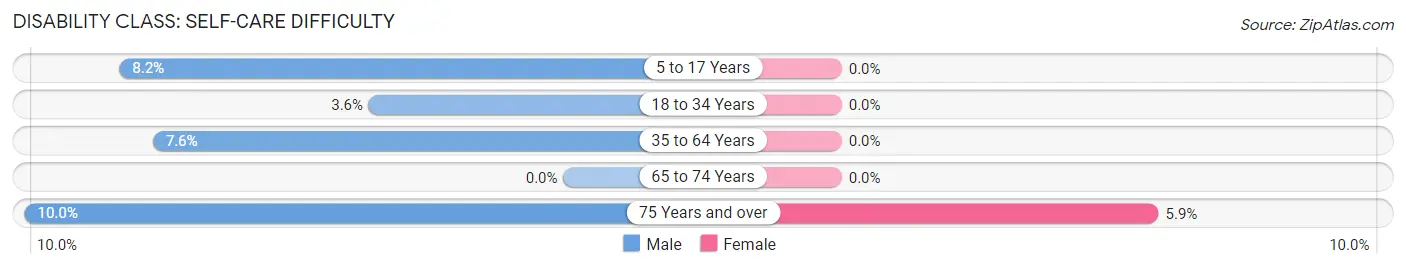
| Age Bracket | Male | Female |
| 5 to 17 Years | 7 (8.2%) | 0 (0.0%) |
| 18 to 34 Years | 3 (3.6%) | 0 (0.0%) |
| 35 to 64 Years | 16 (7.6%) | 0 (0.0%) |
| 65 to 74 Years | 0 (0.0%) | 0 (0.0%) |
| 75 Years and over | 6 (10.0%) | 3 (5.9%) |
Technology Access in Luna Pier
Computing Device Access in Luna Pier
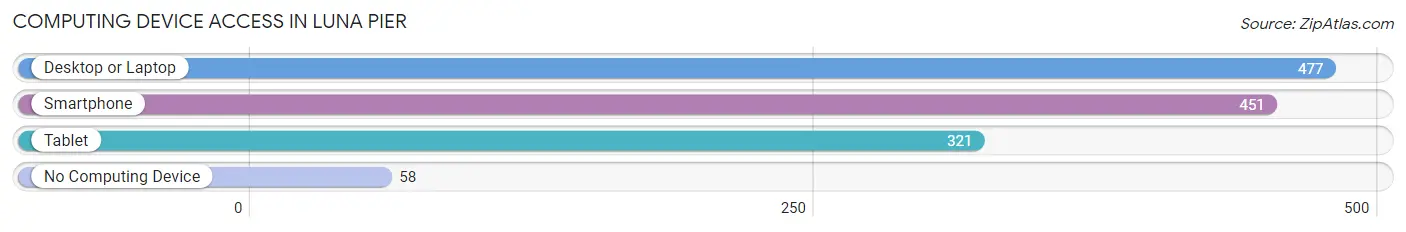
| Device Type | # Households | % Households |
| Desktop or Laptop | 477 | 76.8% |
| Smartphone | 451 | 72.6% |
| Tablet | 321 | 51.7% |
| No Computing Device | 58 | 9.3% |
| Total | 621 | 100.0% |
Internet Access in Luna Pier
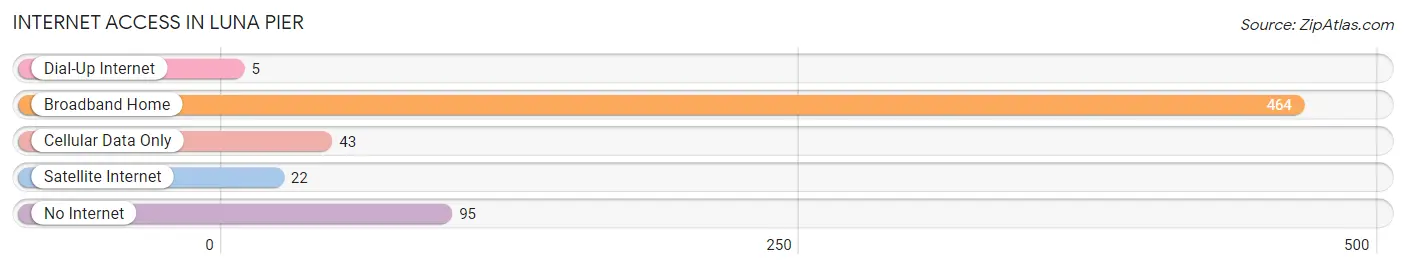
| Internet Type | # Households | % Households |
| Dial-Up Internet | 5 | 0.8% |
| Broadband Home | 464 | 74.7% |
| Cellular Data Only | 43 | 6.9% |
| Satellite Internet | 22 | 3.5% |
| No Internet | 95 | 15.3% |
| Total | 621 | 100.0% |
Luna Pier Summary
Luna Pier is a small city located in Monroe County, Michigan, United States. The city is situated on the western shore of Lake Erie, approximately 25 miles southeast of Toledo, Ohio. As of the 2010 census, the city had a population of 1,541.
History
The area that is now Luna Pier was first settled in the early 1800s by French-Canadian fur traders. The first permanent settlers arrived in the 1840s, and the area was known as “Luna” after the Latin word for moon. The name was changed to Luna Pier in 1875 when a pier was built on the lake.
The city was incorporated in 1945, and the first mayor was elected in 1947. The city has grown steadily since then, and today it is a popular tourist destination.
Geography
Luna Pier is located at 41°37′N 83°25′W (41.619, -83.417). According to the United States Census Bureau, the city has a total area of 1.2 square miles (3.1 km2), all land.
The city is situated on the western shore of Lake Erie, and is bordered by the cities of Erie and LaSalle to the north, and the townships of Berlin and Erie to the south.
Economy
Luna Pier’s economy is largely based on tourism. The city is home to several popular restaurants, hotels, and attractions, including the Luna Pier Marina, the Luna Pier Lighthouse, and the Luna Pier Beach.
The city is also home to several manufacturing companies, including the Luna Pier Manufacturing Company, which produces automotive parts, and the Luna Pier Tool and Die Company, which produces industrial tools and dies.
Demographics
As of the 2010 census, there were 1,541 people, 645 households, and 431 families residing in the city. The population density was 1,279.2 people per square mile (493.2/km2). There were 717 housing units at an average density of 598.3 per square mile (231.2/km2). The racial makeup of the city was 97.2% White, 0.7% African American, 0.2% Native American, 0.2% Asian, 0.2% from other races, and 1.7% from two or more races. Hispanic or Latino of any race were 1.3% of the population.
There were 645 households, out of which 28.2% had children under the age of 18 living with them, 48.2% were married couples living together, 11.7% had a female householder with no husband present, and 35.3% were non-families. 30.2% of all households were made up of individuals, and 11.7% had someone living alone who was 65 years of age or older. The average household size was 2.38 and the average family size was 2.94.
In the city, the population was spread out, with 24.2% under the age of 18, 7.2% from 18 to 24, 28.2% from 25 to 44, 25.2% from 45 to 64, and 15.2% who were 65 years of age or older. The median age was 38 years. For every 100 females, there were 95.2 males. For every 100 females age 18 and over, there were 91.2 males.
The median income for a household in the city was $41,250, and the median income for a family was $50,000. Males had a median income of $37,500 versus $25,000 for females. The per capita income for the city was $20,945. About 5.2% of families and 8.2% of the population were below the poverty line, including 10.2% of those under age 18 and 5.2% of those age 65 or over.
Common Questions
What is Per Capita Income in Luna Pier?
Per Capita income in Luna Pier is $33,101.
What is the Median Family Income in Luna Pier?
Median Family Income in Luna Pier is $69,286.
What is the Median Household income in Luna Pier?
Median Household Income in Luna Pier is $48,073.
What is Income or Wage Gap in Luna Pier?
Income or Wage Gap in Luna Pier is 37.8%.
Women in Luna Pier earn 62.2 cents for every dollar earned by a man.
What is Inequality or Gini Index in Luna Pier?
Inequality or Gini Index in Luna Pier is 0.45.
What is the Total Population of Luna Pier?
Total Population of Luna Pier is 1,225.
What is the Total Male Population of Luna Pier?
Total Male Population of Luna Pier is 656.
What is the Total Female Population of Luna Pier?
Total Female Population of Luna Pier is 569.
What is the Ratio of Males per 100 Females in Luna Pier?
There are 115.29 Males per 100 Females in Luna Pier.
What is the Ratio of Females per 100 Males in Luna Pier?
There are 86.74 Females per 100 Males in Luna Pier.
What is the Median Population Age in Luna Pier?
Median Population Age in Luna Pier is 52.1 Years.
What is the Average Family Size in Luna Pier
Average Family Size in Luna Pier is 2.8 People.
What is the Average Household Size in Luna Pier
Average Household Size in Luna Pier is 2.0 People.
How Large is the Labor Force in Luna Pier?
There are 484 People in the Labor Forcein in Luna Pier.
What is the Percentage of People in the Labor Force in Luna Pier?
45.9% of People are in the Labor Force in Luna Pier.
What is the Unemployment Rate in Luna Pier?
Unemployment Rate in Luna Pier is 6.8%.