Sunman, IN Map & Demographics
Sunman Map
Sunman Overview
$26,099
PER CAPITA INCOME
$84,018
AVG FAMILY INCOME
$69,493
AVG HOUSEHOLD INCOME
42.2%
WAGE / INCOME GAP [ % ]
57.8¢/ $1
WAGE / INCOME GAP [ $ ]
0.41
INEQUALITY / GINI INDEX
1,465
TOTAL POPULATION
601
MALE POPULATION
864
FEMALE POPULATION
69.56
MALES / 100 FEMALES
143.76
FEMALES / 100 MALES
30.5
MEDIAN AGE
3.6
AVG FAMILY SIZE
3.0
AVG HOUSEHOLD SIZE
702
LABOR FORCE [ PEOPLE ]
66.9%
PERCENT IN LABOR FORCE
2.4%
UNEMPLOYMENT RATE
Sunman Zip Codes
Sunman Area Codes
Income in Sunman
Income Overview in Sunman
Per Capita Income in Sunman is $26,099, while median incomes of families and households are $84,018 and $69,493 respectively.
| Characteristic | Number | Measure |
| Per Capita Income | 1,465 | $26,099 |
| Median Family Income | 353 | $84,018 |
| Mean Family Income | 353 | $101,074 |
| Median Household Income | 481 | $69,493 |
| Mean Household Income | 481 | $89,260 |
| Income Deficit | 353 | $0 |
| Wage / Income Gap (%) | 1,465 | 42.17% |
| Wage / Income Gap ($) | 1,465 | 57.83¢ per $1 |
| Gini / Inequality Index | 1,465 | 0.41 |
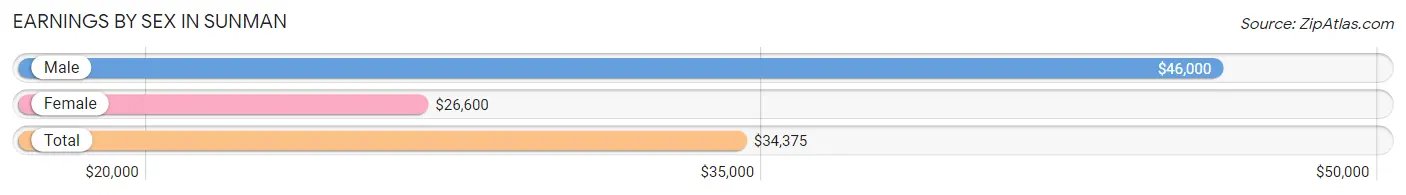
Earnings by Sex in Sunman
Average Earnings in Sunman are $34,375, $46,000 for men and $26,600 for women, a difference of 42.2%.
| Sex | Number | Average Earnings |
| Male | 322 (42.6%) | $46,000 |
| Female | 434 (57.4%) | $26,600 |
| Total | 756 (100.0%) | $34,375 |
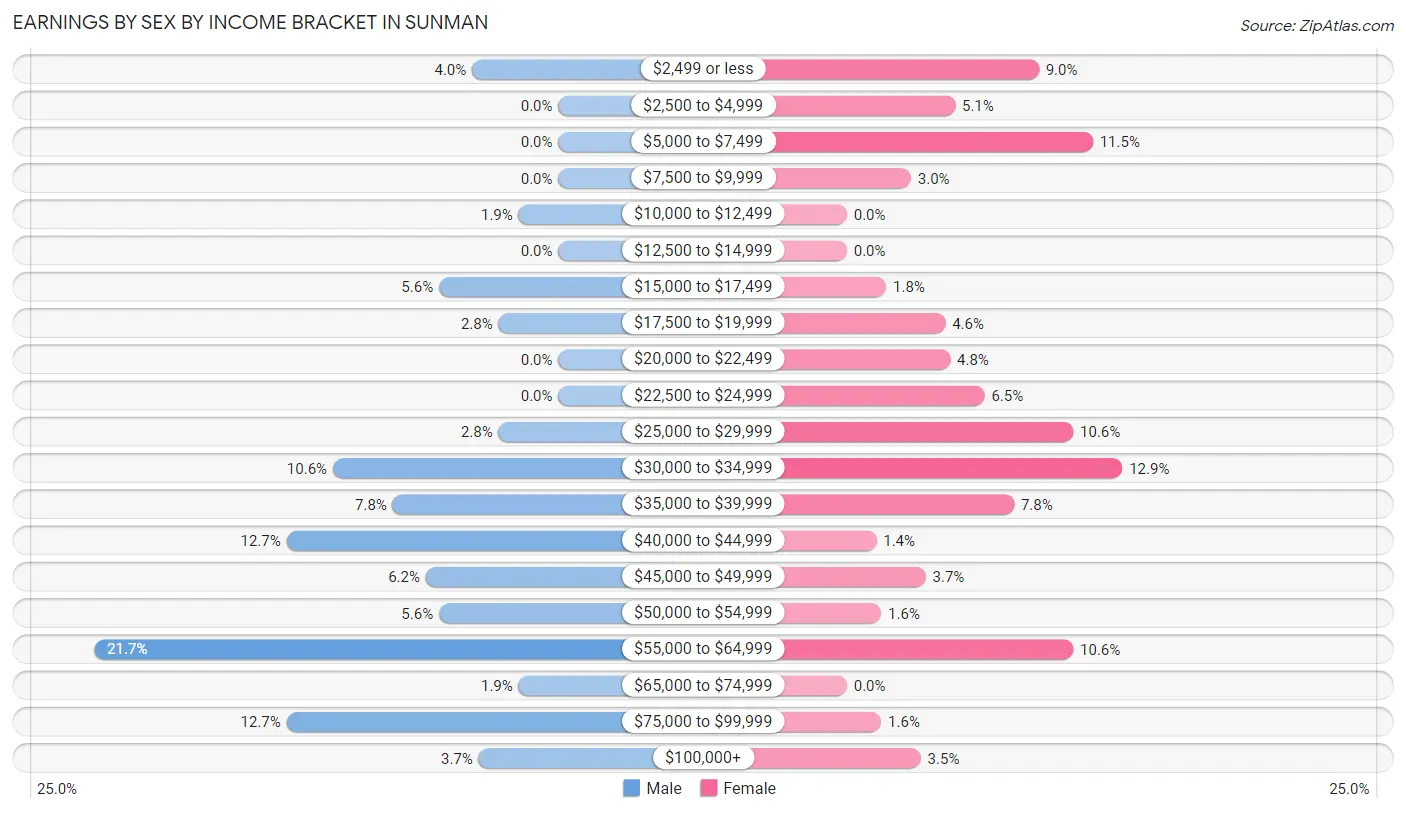
Earnings by Sex by Income Bracket in Sunman
The most common earnings brackets in Sunman are $55,000 to $64,999 for men (70 | 21.7%) and $30,000 to $34,999 for women (56 | 12.9%).
| Income | Male | Female |
| $2,499 or less | 13 (4.0%) | 39 (9.0%) |
| $2,500 to $4,999 | 0 (0.0%) | 22 (5.1%) |
| $5,000 to $7,499 | 0 (0.0%) | 50 (11.5%) |
| $7,500 to $9,999 | 0 (0.0%) | 13 (3.0%) |
| $10,000 to $12,499 | 6 (1.9%) | 0 (0.0%) |
| $12,500 to $14,999 | 0 (0.0%) | 0 (0.0%) |
| $15,000 to $17,499 | 18 (5.6%) | 8 (1.8%) |
| $17,500 to $19,999 | 9 (2.8%) | 20 (4.6%) |
| $20,000 to $22,499 | 0 (0.0%) | 21 (4.8%) |
| $22,500 to $24,999 | 0 (0.0%) | 28 (6.5%) |
| $25,000 to $29,999 | 9 (2.8%) | 46 (10.6%) |
| $30,000 to $34,999 | 34 (10.6%) | 56 (12.9%) |
| $35,000 to $39,999 | 25 (7.8%) | 34 (7.8%) |
| $40,000 to $44,999 | 41 (12.7%) | 6 (1.4%) |
| $45,000 to $49,999 | 20 (6.2%) | 16 (3.7%) |
| $50,000 to $54,999 | 18 (5.6%) | 7 (1.6%) |
| $55,000 to $64,999 | 70 (21.7%) | 46 (10.6%) |
| $65,000 to $74,999 | 6 (1.9%) | 0 (0.0%) |
| $75,000 to $99,999 | 41 (12.7%) | 7 (1.6%) |
| $100,000+ | 12 (3.7%) | 15 (3.5%) |
| Total | 322 (100.0%) | 434 (100.0%) |
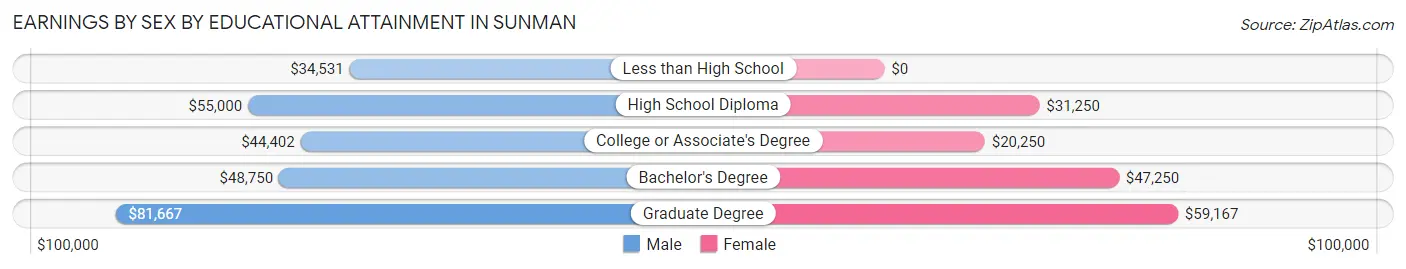
Earnings by Sex by Educational Attainment in Sunman
Average earnings in Sunman are $49,250 for men and $28,869 for women, a difference of 41.4%. Men with an educational attainment of graduate degree enjoy the highest average annual earnings of $81,667, while those with less than high school education earn the least with $34,531. Women with an educational attainment of graduate degree earn the most with the average annual earnings of $59,167, while those with college or associate's degree education have the smallest earnings of $20,250.
| Educational Attainment | Male Income | Female Income |
| Less than High School | $34,531 | $0 |
| High School Diploma | $55,000 | $31,250 |
| College or Associate's Degree | $44,402 | $20,250 |
| Bachelor's Degree | $48,750 | $47,250 |
| Graduate Degree | $81,667 | $59,167 |
| Total | $49,250 | $28,869 |
Family Income in Sunman
Family Income Brackets in Sunman
According to the Sunman family income data, there are 93 families falling into the $100,000 to $149,999 income range, which is the most common income bracket and makes up 26.4% of all families.
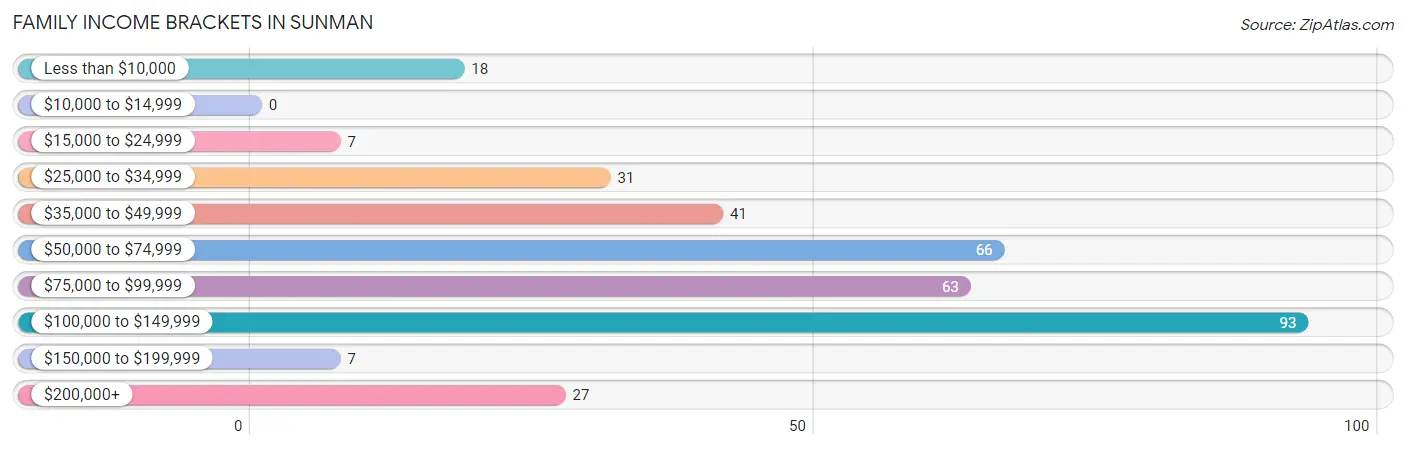
| Income Bracket | # Families | % Families |
| Less than $10,000 | 18 | 5.1% |
| $10,000 to $14,999 | 0 | 0.0% |
| $15,000 to $24,999 | 7 | 2.0% |
| $25,000 to $34,999 | 31 | 8.8% |
| $35,000 to $49,999 | 41 | 11.6% |
| $50,000 to $74,999 | 66 | 18.7% |
| $75,000 to $99,999 | 63 | 17.8% |
| $100,000 to $149,999 | 93 | 26.3% |
| $150,000 to $199,999 | 7 | 2.0% |
| $200,000+ | 27 | 7.6% |
Family Income by Famaliy Size in Sunman
3-person families (63 | 17.8%) account for the highest median family income in Sunman with $111,705 per family, while 3-person families (63 | 17.8%) have the highest median income of $37,235 per family member.
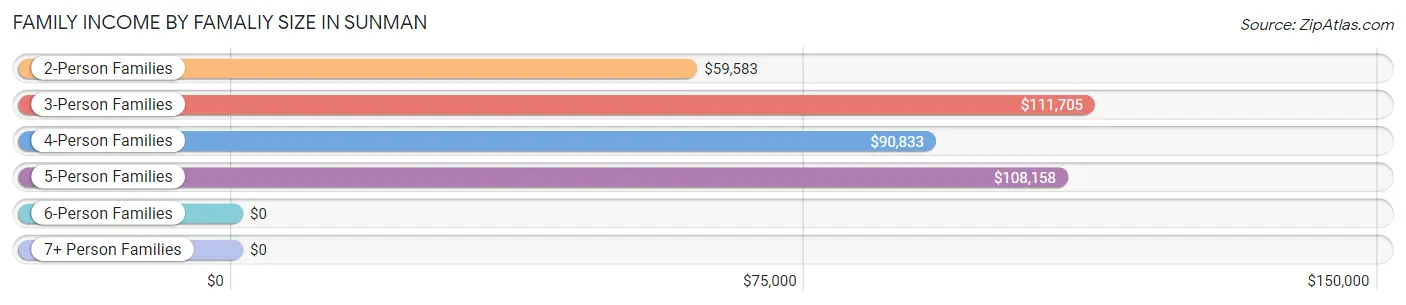
| Income Bracket | # Families | Median Income |
| 2-Person Families | 105 (29.7%) | $59,583 |
| 3-Person Families | 63 (17.8%) | $111,705 |
| 4-Person Families | 86 (24.4%) | $90,833 |
| 5-Person Families | 42 (11.9%) | $108,158 |
| 6-Person Families | 38 (10.8%) | $0 |
| 7+ Person Families | 19 (5.4%) | $0 |
| Total | 353 (100.0%) | $84,018 |
Family Income by Number of Earners in Sunman
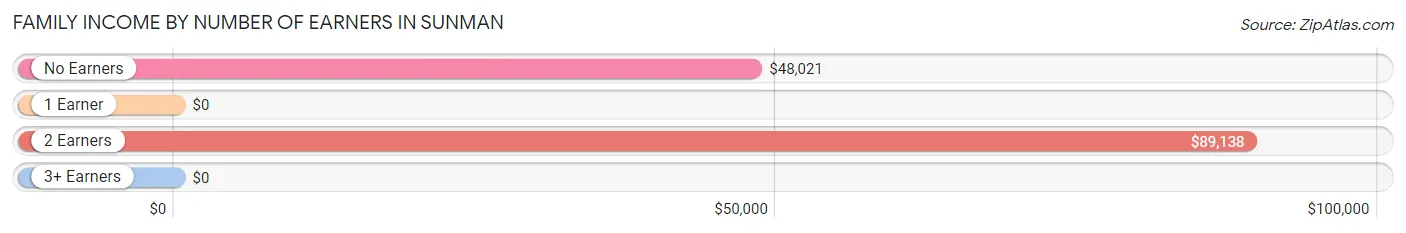
| Number of Earners | # Families | Median Income |
| No Earners | 43 (12.2%) | $48,021 |
| 1 Earner | 53 (15.0%) | $0 |
| 2 Earners | 206 (58.4%) | $89,138 |
| 3+ Earners | 51 (14.4%) | $0 |
| Total | 353 (100.0%) | $84,018 |
Household Income in Sunman
Household Income Brackets in Sunman
With 111 households falling in the category, the $50,000 to $74,999 income range is the most frequent in Sunman, accounting for 23.1% of all households. In contrast, only 5 households (1.0%) fall into the $10,000 to $14,999 income bracket, making it the least populous group.
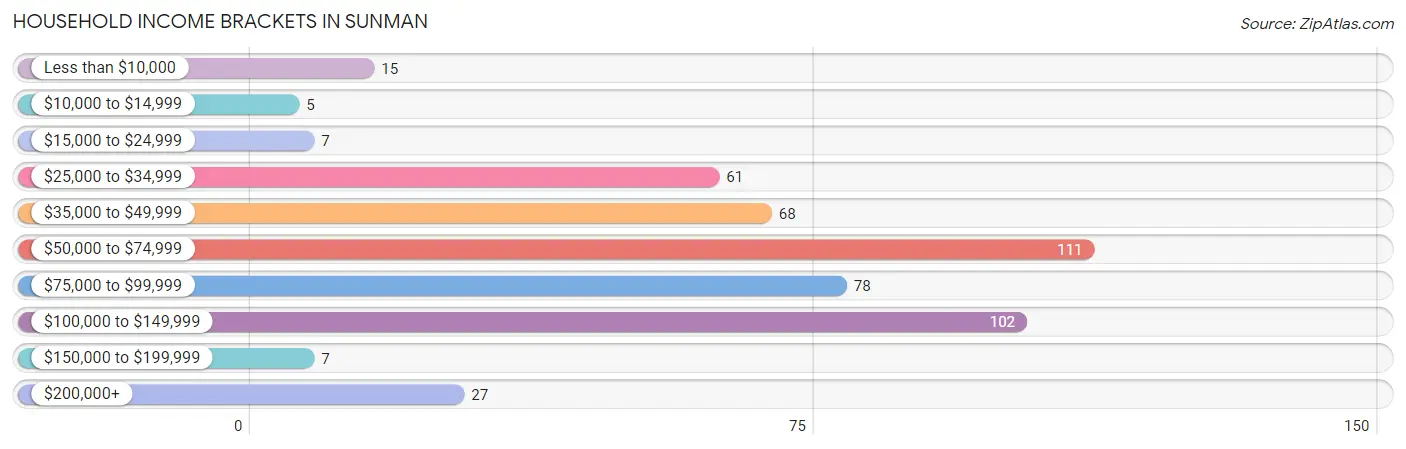
| Income Bracket | # Households | % Households |
| Less than $10,000 | 15 | 3.1% |
| $10,000 to $14,999 | 5 | 1.0% |
| $15,000 to $24,999 | 7 | 1.5% |
| $25,000 to $34,999 | 61 | 12.7% |
| $35,000 to $49,999 | 68 | 14.1% |
| $50,000 to $74,999 | 111 | 23.1% |
| $75,000 to $99,999 | 78 | 16.2% |
| $100,000 to $149,999 | 102 | 21.2% |
| $150,000 to $199,999 | 7 | 1.5% |
| $200,000+ | 27 | 5.6% |
Household Income by Householder Age in Sunman
The median household income in Sunman is $69,493, with the highest median household income of $80,417 found in the 45 to 64 years age bracket for the primary householder. A total of 133 households (27.7%) fall into this category. Meanwhile, the 15 to 24 years age bracket for the primary householder has the lowest median household income of $0, with 6 households (1.3%) in this group.
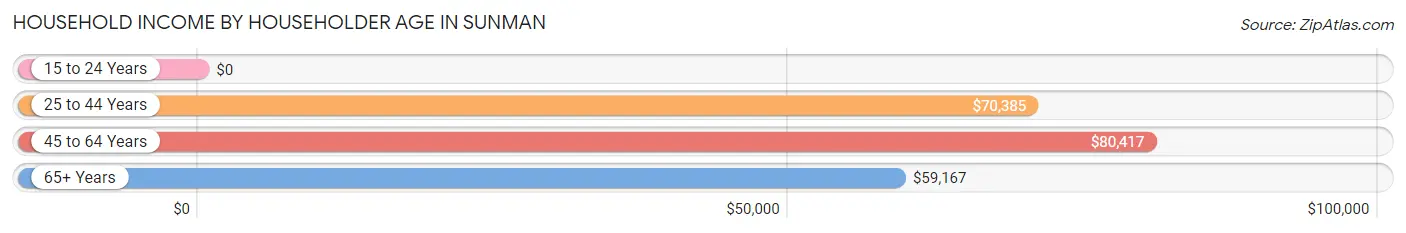
| Income Bracket | # Households | Median Income |
| 15 to 24 Years | 6 (1.3%) | $0 |
| 25 to 44 Years | 264 (54.9%) | $70,385 |
| 45 to 64 Years | 133 (27.7%) | $80,417 |
| 65+ Years | 78 (16.2%) | $59,167 |
| Total | 481 (100.0%) | $69,493 |
Poverty in Sunman
Income Below Poverty by Sex and Age in Sunman
With 7.2% poverty level for males and 8.8% for females among the residents of Sunman, 16 and 17 year old males and 15 year old females are the most vulnerable to poverty, with 10 males (62.5%) and 8 females (47.1%) in their respective age groups living below the poverty level.
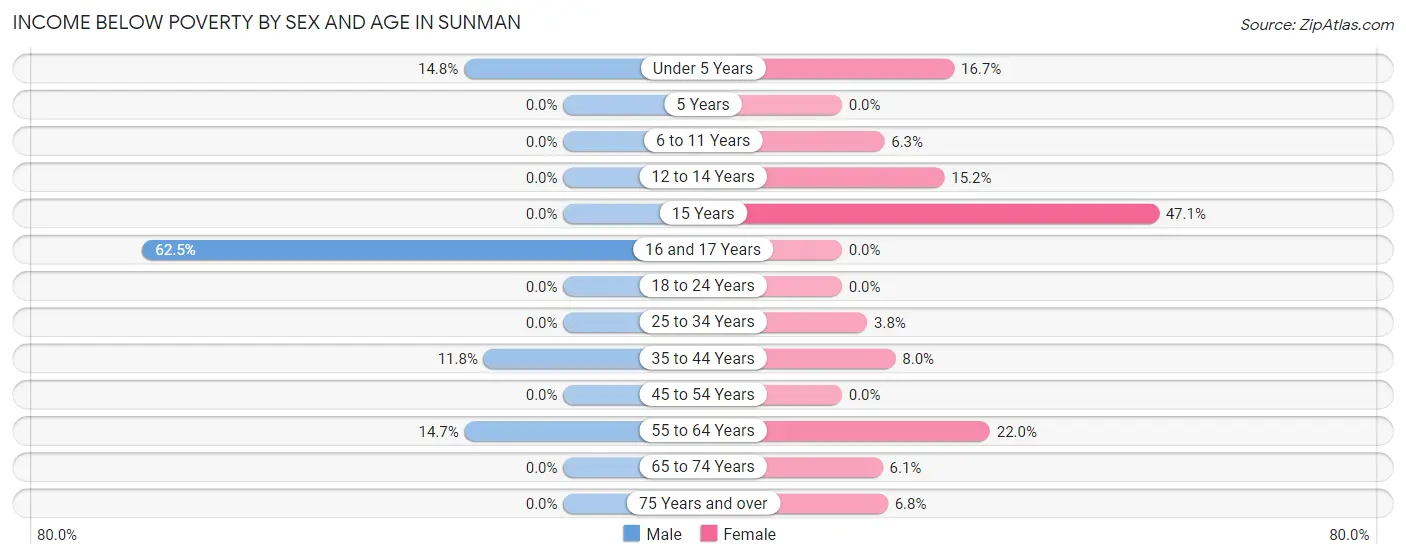
| Age Bracket | Male | Female |
| Under 5 Years | 9 (14.7%) | 15 (16.7%) |
| 5 Years | 0 (0.0%) | 0 (0.0%) |
| 6 to 11 Years | 0 (0.0%) | 7 (6.3%) |
| 12 to 14 Years | 0 (0.0%) | 7 (15.2%) |
| 15 Years | 0 (0.0%) | 8 (47.1%) |
| 16 and 17 Years | 10 (62.5%) | 0 (0.0%) |
| 18 to 24 Years | 0 (0.0%) | 0 (0.0%) |
| 25 to 34 Years | 0 (0.0%) | 7 (3.8%) |
| 35 to 44 Years | 13 (11.8%) | 7 (8.0%) |
| 45 to 54 Years | 0 (0.0%) | 0 (0.0%) |
| 55 to 64 Years | 11 (14.7%) | 20 (22.0%) |
| 65 to 74 Years | 0 (0.0%) | 2 (6.1%) |
| 75 Years and over | 0 (0.0%) | 3 (6.8%) |
| Total | 43 (7.2%) | 76 (8.8%) |
Income Above Poverty by Sex and Age in Sunman
According to the poverty statistics in Sunman, males aged 5 years and females aged 5 years are the age groups that are most secure financially, with 100.0% of males and 100.0% of females in these age groups living above the poverty line.
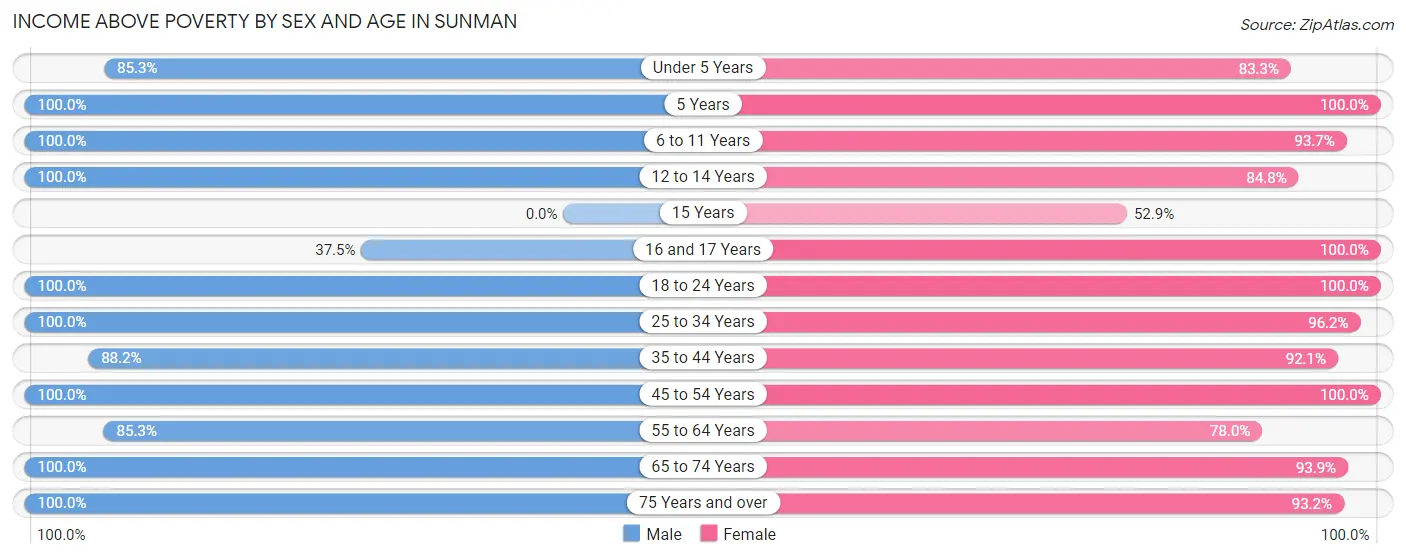
| Age Bracket | Male | Female |
| Under 5 Years | 52 (85.3%) | 75 (83.3%) |
| 5 Years | 12 (100.0%) | 13 (100.0%) |
| 6 to 11 Years | 48 (100.0%) | 104 (93.7%) |
| 12 to 14 Years | 11 (100.0%) | 39 (84.8%) |
| 15 Years | 0 (0.0%) | 9 (52.9%) |
| 16 and 17 Years | 6 (37.5%) | 21 (100.0%) |
| 18 to 24 Years | 83 (100.0%) | 35 (100.0%) |
| 25 to 34 Years | 86 (100.0%) | 179 (96.2%) |
| 35 to 44 Years | 97 (88.2%) | 81 (92.0%) |
| 45 to 54 Years | 47 (100.0%) | 85 (100.0%) |
| 55 to 64 Years | 64 (85.3%) | 71 (78.0%) |
| 65 to 74 Years | 14 (100.0%) | 31 (93.9%) |
| 75 Years and over | 35 (100.0%) | 41 (93.2%) |
| Total | 555 (92.8%) | 784 (91.2%) |
Income Below Poverty Among Married-Couple Families in Sunman
The poverty statistics for married-couple families in Sunman show that 3.7% or 11 of the total 294 families live below the poverty line. Families with no children have the highest poverty rate of 9.7%, comprising of 11 families. On the other hand, families with 1 or 2 children have the lowest poverty rate of 0.0%, which includes 0 families.
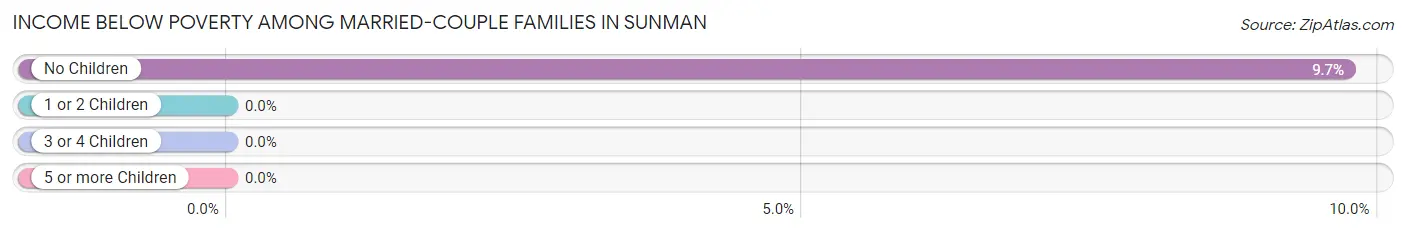
| Children | Above Poverty | Below Poverty |
| No Children | 102 (90.3%) | 11 (9.7%) |
| 1 or 2 Children | 96 (100.0%) | 0 (0.0%) |
| 3 or 4 Children | 85 (100.0%) | 0 (0.0%) |
| 5 or more Children | 0 (0.0%) | 0 (0.0%) |
| Total | 283 (96.3%) | 11 (3.7%) |
Income Below Poverty Among Single-Parent Households in Sunman
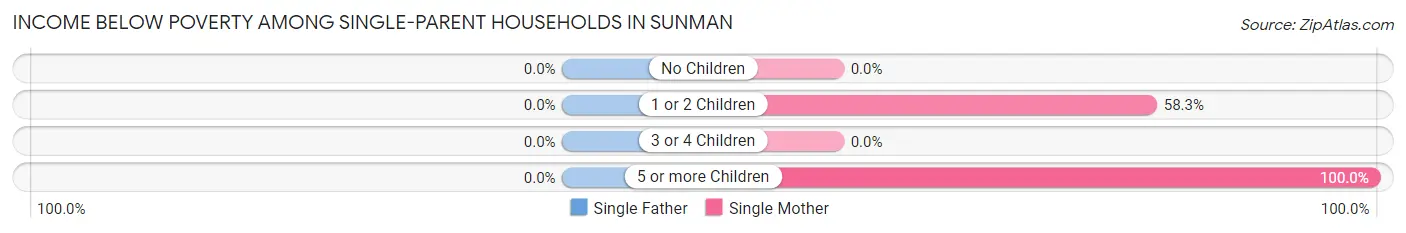
| Children | Single Father | Single Mother |
| No Children | 0 (0.0%) | 0 (0.0%) |
| 1 or 2 Children | 0 (0.0%) | 7 (58.3%) |
| 3 or 4 Children | 0 (0.0%) | 0 (0.0%) |
| 5 or more Children | 0 (0.0%) | 7 (100.0%) |
| Total | 0 (0.0%) | 14 (30.4%) |
Income Below Poverty Among Married-Couple vs Single-Parent Households in Sunman
The poverty data for Sunman shows that 11 of the married-couple family households (3.7%) and 14 of the single-parent households (23.7%) are living below the poverty level. Within the married-couple family households, those with no children have the highest poverty rate, with 11 households (9.7%) falling below the poverty line. Among the single-parent households, those with 5 or more children have the highest poverty rate, with 7 household (100.0%) living below poverty.
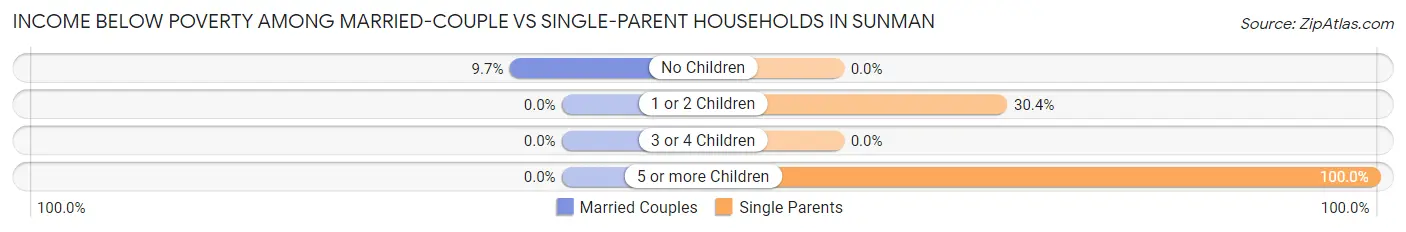
| Children | Married-Couple Families | Single-Parent Households |
| No Children | 11 (9.7%) | 0 (0.0%) |
| 1 or 2 Children | 0 (0.0%) | 7 (30.4%) |
| 3 or 4 Children | 0 (0.0%) | 0 (0.0%) |
| 5 or more Children | 0 (0.0%) | 7 (100.0%) |
| Total | 11 (3.7%) | 14 (23.7%) |
Race in Sunman
The most populous races in Sunman are White / Caucasian (1,354 | 92.4%), Two or more Races (106 | 7.2%), and Hispanic or Latino (26 | 1.8%).
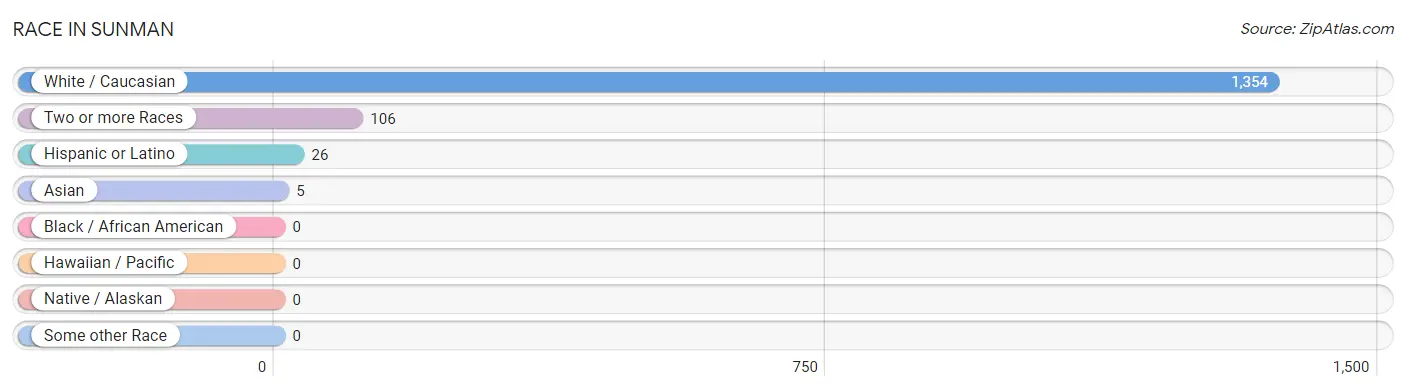
| Race | # Population | % Population |
| Asian | 5 | 0.3% |
| Black / African American | 0 | 0.0% |
| Hawaiian / Pacific | 0 | 0.0% |
| Hispanic or Latino | 26 | 1.8% |
| Native / Alaskan | 0 | 0.0% |
| White / Caucasian | 1,354 | 92.4% |
| Two or more Races | 106 | 7.2% |
| Some other Race | 0 | 0.0% |
| Total | 1,465 | 100.0% |
Ancestry in Sunman
The most populous ancestries reported in Sunman are German (312 | 21.3%), European (72 | 4.9%), Irish (69 | 4.7%), English (53 | 3.6%), and Burmese (43 | 2.9%), together accounting for 37.5% of all Sunman residents.
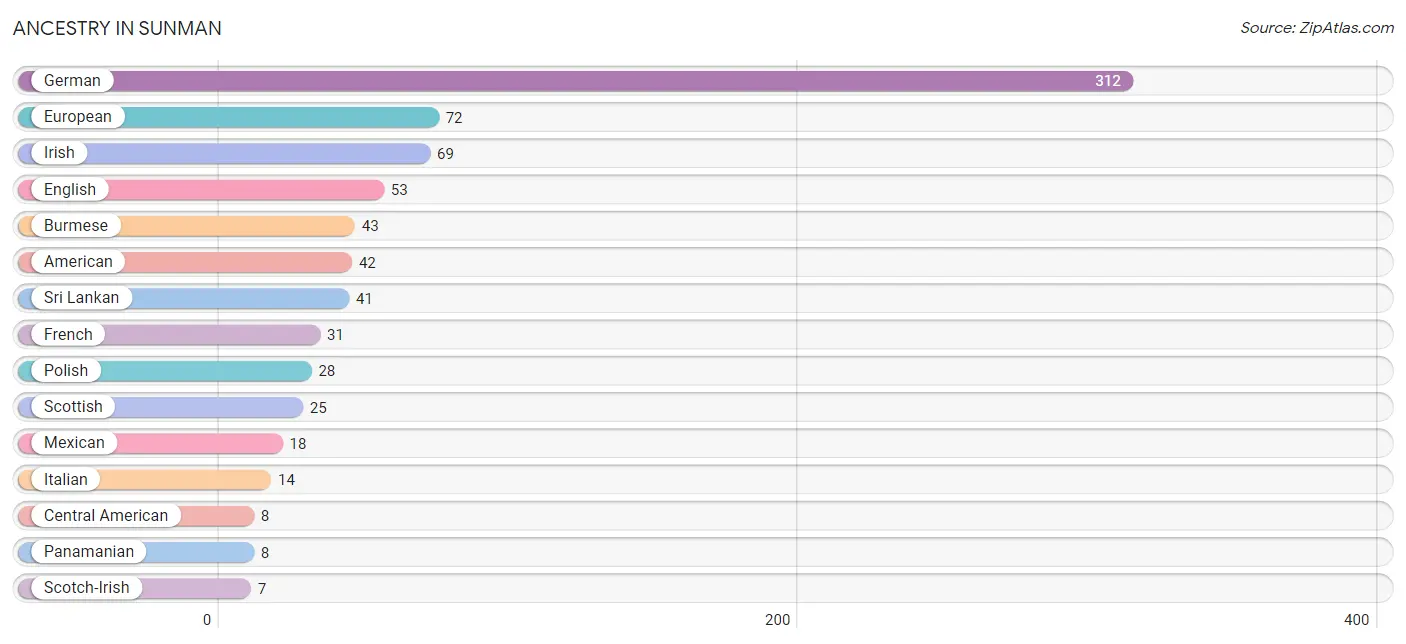
| Ancestry | # Population | % Population |
| American | 42 | 2.9% |
| Burmese | 43 | 2.9% |
| Central American | 8 | 0.5% |
| English | 53 | 3.6% |
| European | 72 | 4.9% |
| French | 31 | 2.1% |
| German | 312 | 21.3% |
| Irish | 69 | 4.7% |
| Italian | 14 | 1.0% |
| Mexican | 18 | 1.2% |
| Panamanian | 8 | 0.5% |
| Polish | 28 | 1.9% |
| Scotch-Irish | 7 | 0.5% |
| Scottish | 25 | 1.7% |
| Sri Lankan | 41 | 2.8% |
| Thai | 5 | 0.3% | View All 16 Rows |
Immigrants in Sunman
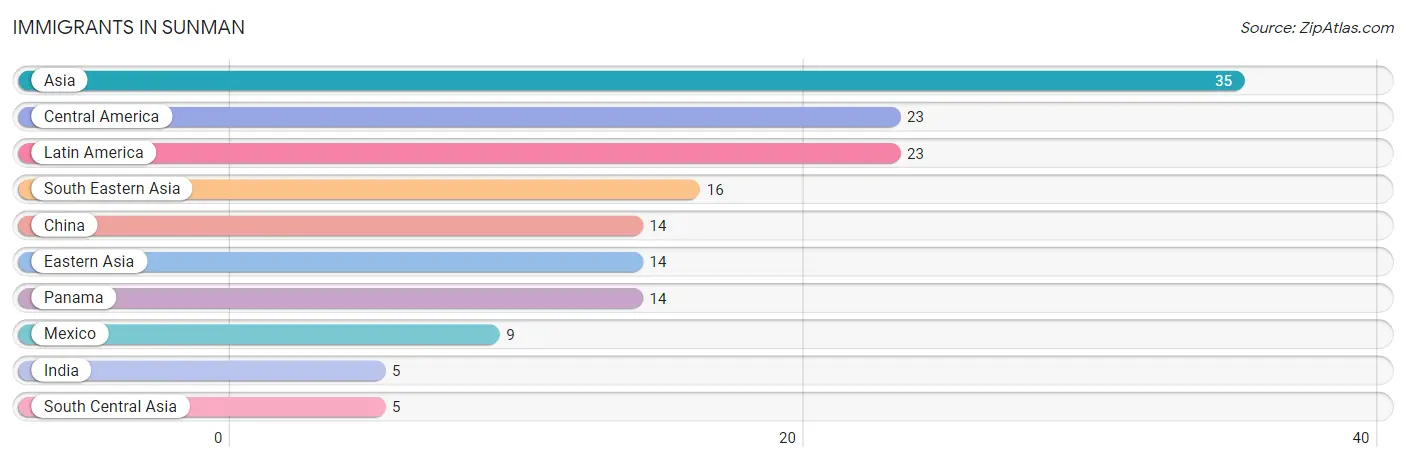
The most numerous immigrant groups reported in Sunman came from Asia (35 | 2.4%), Central America (23 | 1.6%), Latin America (23 | 1.6%), South Eastern Asia (16 | 1.1%), and China (14 | 1.0%), together accounting for 7.6% of all Sunman residents.
| Immigration Origin | # Population | % Population |
| Asia | 35 | 2.4% |
| Central America | 23 | 1.6% |
| China | 14 | 1.0% |
| Eastern Asia | 14 | 1.0% |
| India | 5 | 0.3% |
| Latin America | 23 | 1.6% |
| Mexico | 9 | 0.6% |
| Panama | 14 | 1.0% |
| South Central Asia | 5 | 0.3% |
| South Eastern Asia | 16 | 1.1% | View All 10 Rows |
Sex and Age in Sunman
Sex and Age in Sunman
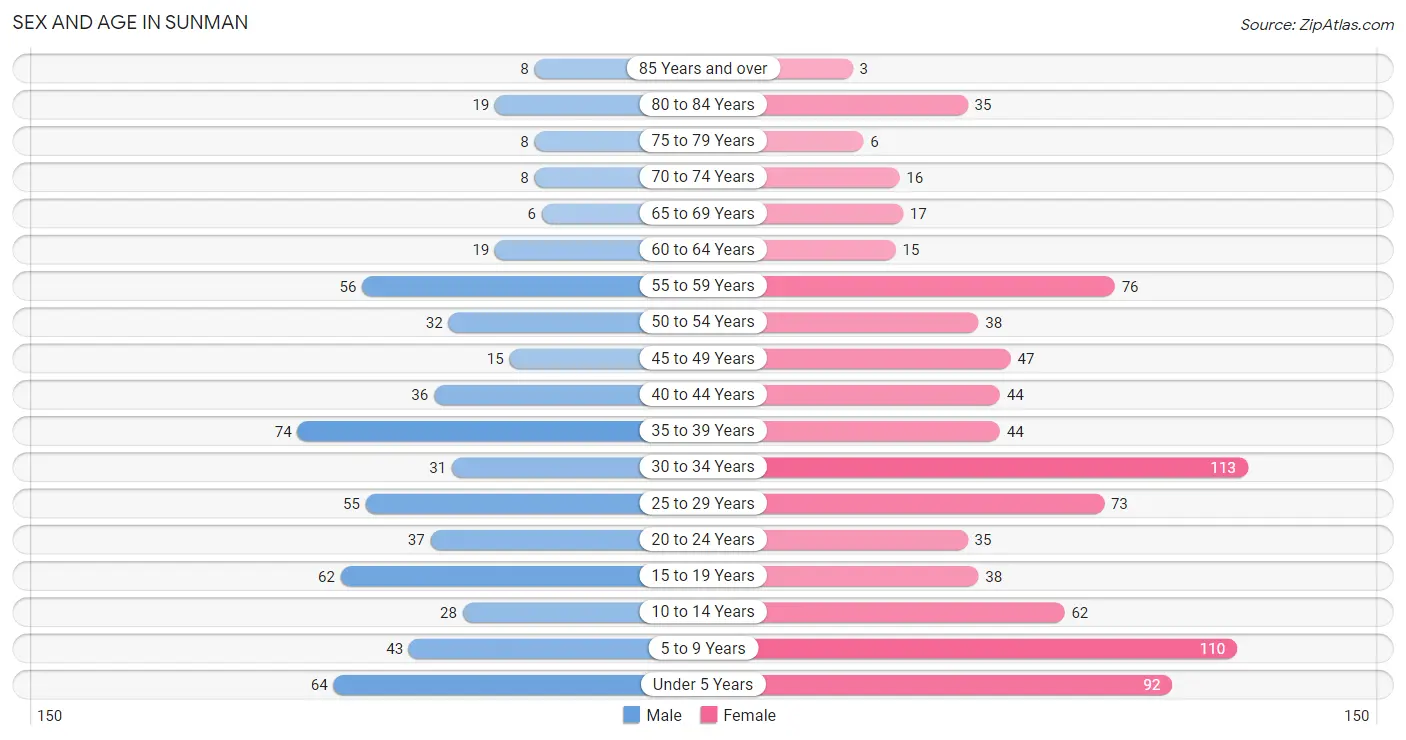
The most populous age groups in Sunman are 35 to 39 Years (74 | 12.3%) for men and 30 to 34 Years (113 | 13.1%) for women.
| Age Bracket | Male | Female |
| Under 5 Years | 64 (10.6%) | 92 (10.6%) |
| 5 to 9 Years | 43 (7.1%) | 110 (12.7%) |
| 10 to 14 Years | 28 (4.7%) | 62 (7.2%) |
| 15 to 19 Years | 62 (10.3%) | 38 (4.4%) |
| 20 to 24 Years | 37 (6.2%) | 35 (4.1%) |
| 25 to 29 Years | 55 (9.1%) | 73 (8.5%) |
| 30 to 34 Years | 31 (5.2%) | 113 (13.1%) |
| 35 to 39 Years | 74 (12.3%) | 44 (5.1%) |
| 40 to 44 Years | 36 (6.0%) | 44 (5.1%) |
| 45 to 49 Years | 15 (2.5%) | 47 (5.4%) |
| 50 to 54 Years | 32 (5.3%) | 38 (4.4%) |
| 55 to 59 Years | 56 (9.3%) | 76 (8.8%) |
| 60 to 64 Years | 19 (3.2%) | 15 (1.7%) |
| 65 to 69 Years | 6 (1.0%) | 17 (2.0%) |
| 70 to 74 Years | 8 (1.3%) | 16 (1.8%) |
| 75 to 79 Years | 8 (1.3%) | 6 (0.7%) |
| 80 to 84 Years | 19 (3.2%) | 35 (4.1%) |
| 85 Years and over | 8 (1.3%) | 3 (0.4%) |
| Total | 601 (100.0%) | 864 (100.0%) |
Families and Households in Sunman
Median Family Size in Sunman
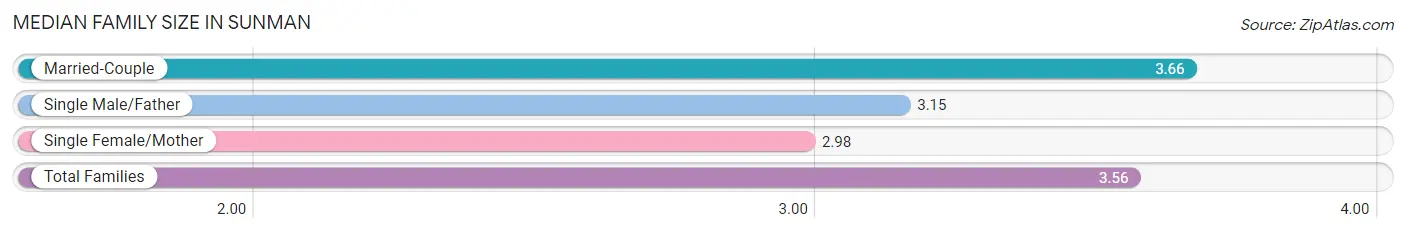
The median family size in Sunman is 3.56 persons per family, with married-couple families (294 | 83.3%) accounting for the largest median family size of 3.66 persons per family. On the other hand, single female/mother families (46 | 13.0%) represent the smallest median family size with 2.98 persons per family.
| Family Type | # Families | Family Size |
| Married-Couple | 294 (83.3%) | 3.66 |
| Single Male/Father | 13 (3.7%) | 3.15 |
| Single Female/Mother | 46 (13.0%) | 2.98 |
| Total Families | 353 (100.0%) | 3.56 |
Median Household Size in Sunman
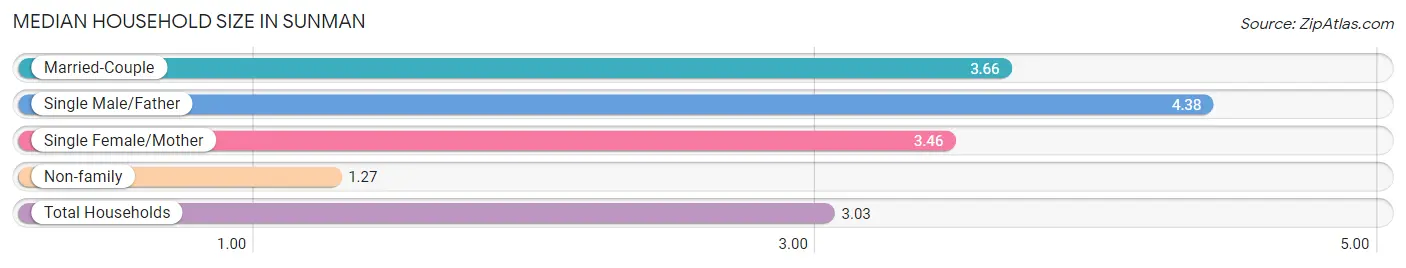
The median household size in Sunman is 3.03 persons per household, with single male/father households (13 | 2.7%) accounting for the largest median household size of 4.38 persons per household. non-family households (128 | 26.6%) represent the smallest median household size with 1.27 persons per household.
| Household Type | # Households | Household Size |
| Married-Couple | 294 (61.1%) | 3.66 |
| Single Male/Father | 13 (2.7%) | 4.38 |
| Single Female/Mother | 46 (9.6%) | 3.46 |
| Non-family | 128 (26.6%) | 1.27 |
| Total Households | 481 (100.0%) | 3.03 |
Household Size by Marriage Status in Sunman
Out of a total of 481 households in Sunman, 353 (73.4%) are family households, while 128 (26.6%) are nonfamily households. The most numerous type of family households are 4-person households, comprising 99, and the most common type of nonfamily households are 1-person households, comprising 94.
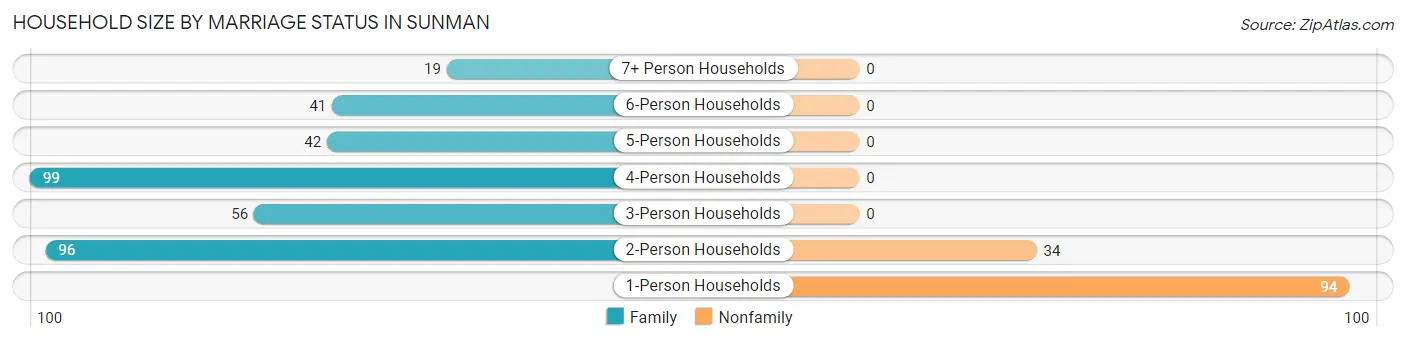
| Household Size | Family Households | Nonfamily Households |
| 1-Person Households | - | 94 (19.5%) |
| 2-Person Households | 96 (20.0%) | 34 (7.1%) |
| 3-Person Households | 56 (11.6%) | 0 (0.0%) |
| 4-Person Households | 99 (20.6%) | 0 (0.0%) |
| 5-Person Households | 42 (8.7%) | 0 (0.0%) |
| 6-Person Households | 41 (8.5%) | 0 (0.0%) |
| 7+ Person Households | 19 (4.0%) | 0 (0.0%) |
| Total | 353 (73.4%) | 128 (26.6%) |
Female Fertility in Sunman
Fertility by Age in Sunman
Average fertility rate in Sunman is 170.0 births per 1,000 women. Women in the age bracket of 20 to 34 years have the highest fertility rate with 276.0 births per 1,000 women. Women in the age bracket of 20 to 34 years acount for 89.7% of all women with births.
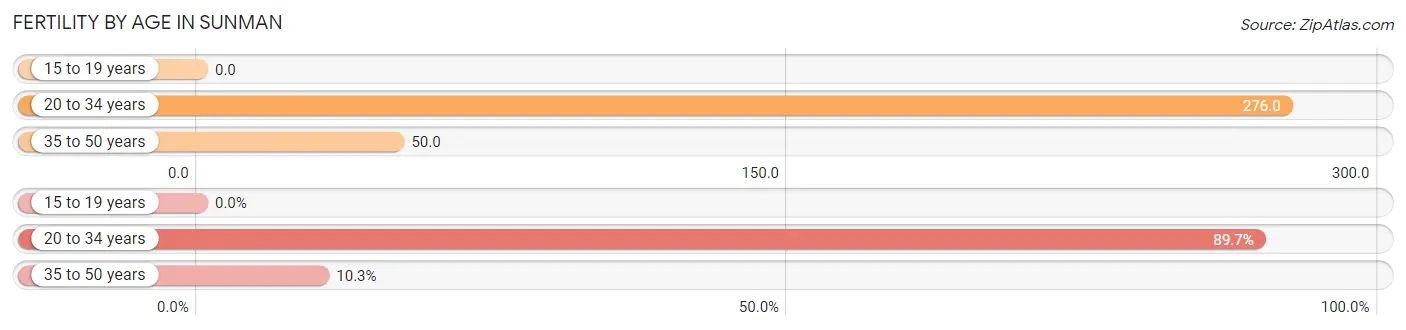
| Age Bracket | Women with Births | Births / 1,000 Women |
| 15 to 19 years | 0 (0.0%) | 0.0 |
| 20 to 34 years | 61 (89.7%) | 276.0 |
| 35 to 50 years | 7 (10.3%) | 50.0 |
| Total | 68 (100.0%) | 170.0 |
Fertility by Age by Marriage Status in Sunman
72.1% of women with births (68) in Sunman are married. The highest percentage of unmarried women with births falls into 35 to 50 years age bracket with 100.0% of them unmarried at the time of birth, while the lowest percentage of unmarried women with births belong to 20 to 34 years age bracket with 19.7% of them unmarried.
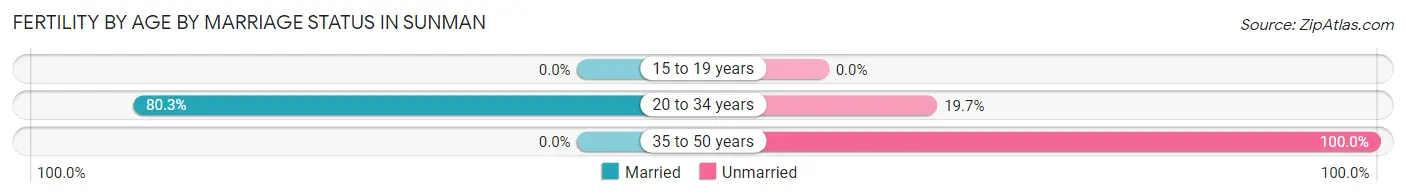
| Age Bracket | Married | Unmarried |
| 15 to 19 years | 0 (0.0%) | 0 (0.0%) |
| 20 to 34 years | 49 (80.3%) | 12 (19.7%) |
| 35 to 50 years | 0 (0.0%) | 7 (100.0%) |
| Total | 49 (72.1%) | 19 (27.9%) |
Fertility by Education in Sunman
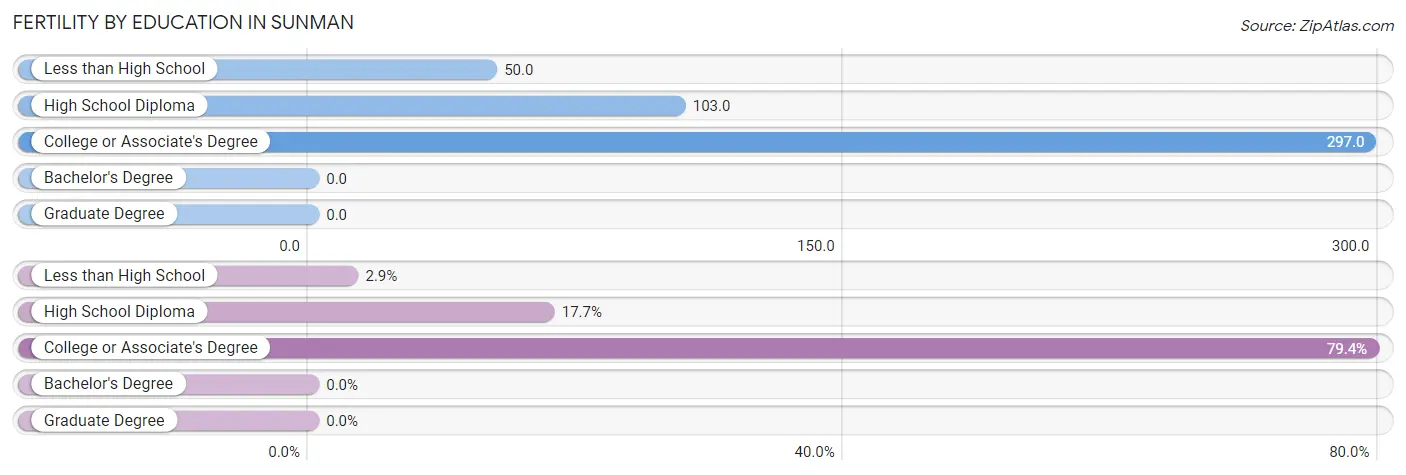
| Educational Attainment | Women with Births | Births / 1,000 Women |
| Less than High School | 2 (2.9%) | 50.0 |
| High School Diploma | 12 (17.6%) | 103.0 |
| College or Associate's Degree | 54 (79.4%) | 297.0 |
| Bachelor's Degree | 0 (0.0%) | 0.0 |
| Graduate Degree | 0 (0.0%) | 0.0 |
| Total | 68 (100.0%) | 170.0 |
Fertility by Education by Marriage Status in Sunman
27.9% of women with births in Sunman are unmarried. Women with the educational attainment of less than high school are most likely to be married with 100.0% of them married at childbirth, while women with the educational attainment of high school diploma are least likely to be married with 100.0% of them unmarried at childbirth.
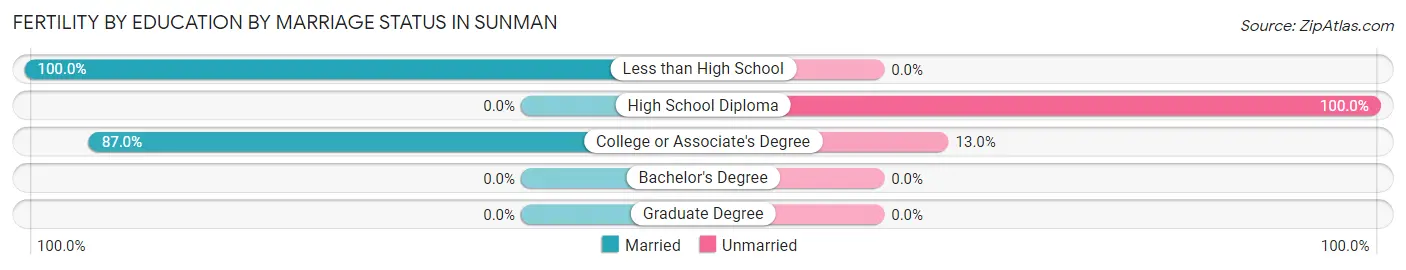
| Educational Attainment | Married | Unmarried |
| Less than High School | 2 (100.0%) | 0 (0.0%) |
| High School Diploma | 0 (0.0%) | 12 (100.0%) |
| College or Associate's Degree | 47 (87.0%) | 7 (13.0%) |
| Bachelor's Degree | 0 (0.0%) | 0 (0.0%) |
| Graduate Degree | 0 (0.0%) | 0 (0.0%) |
| Total | 49 (72.1%) | 19 (27.9%) |
Employment Characteristics in Sunman
Employment by Class of Employer in Sunman
Among the 680 employed individuals in Sunman, private company employees (494 | 72.7%), not-for-profit organizations (57 | 8.4%), and self-employed (not incorporated) (45 | 6.6%) make up the most common classes of employment.
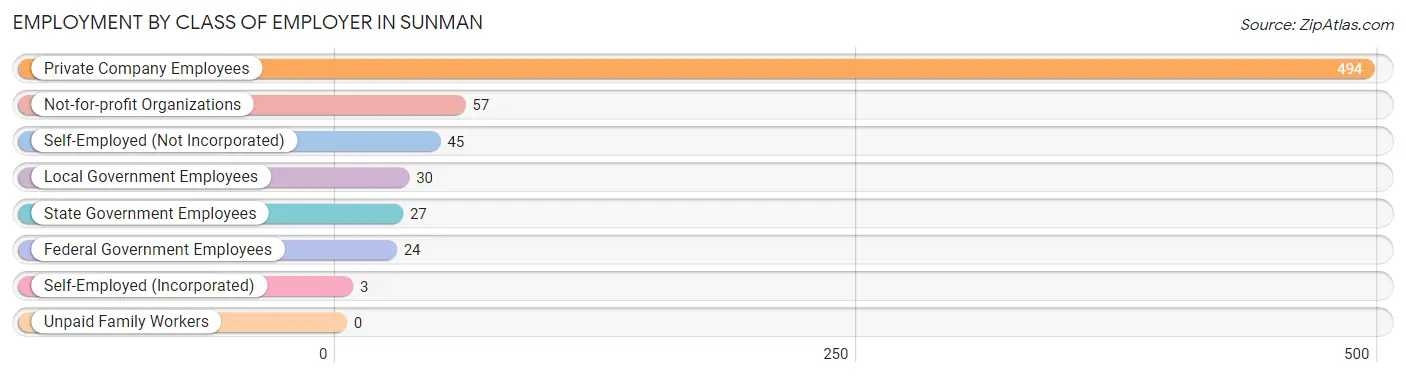
| Employer Class | # Employees | % Employees |
| Private Company Employees | 494 | 72.7% |
| Self-Employed (Incorporated) | 3 | 0.4% |
| Self-Employed (Not Incorporated) | 45 | 6.6% |
| Not-for-profit Organizations | 57 | 8.4% |
| Local Government Employees | 30 | 4.4% |
| State Government Employees | 27 | 4.0% |
| Federal Government Employees | 24 | 3.5% |
| Unpaid Family Workers | 0 | 0.0% |
| Total | 680 | 100.0% |
Employment Status by Age in Sunman
According to the labor force statistics for Sunman, out of the total population over 16 years of age (1,049), 66.9% or 702 individuals are in the labor force, with 2.4% or 17 of them unemployed. The age group with the highest labor force participation rate is 25 to 29 years, with 98.4% or 126 individuals in the labor force. Within the labor force, the 30 to 34 years age range has the highest percentage of unemployed individuals, with 13.8% or 13 of them being unemployed.
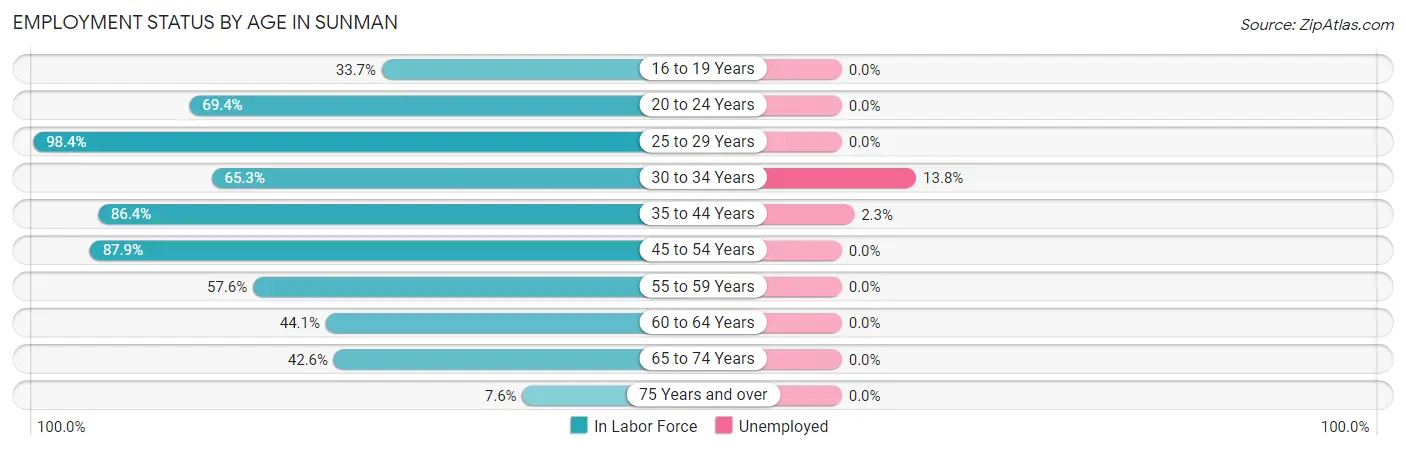
| Age Bracket | In Labor Force | Unemployed |
| 16 to 19 Years | 28 (33.7%) | 0 (0.0%) |
| 20 to 24 Years | 50 (69.4%) | 0 (0.0%) |
| 25 to 29 Years | 126 (98.4%) | 0 (0.0%) |
| 30 to 34 Years | 94 (65.3%) | 13 (13.8%) |
| 35 to 44 Years | 171 (86.4%) | 4 (2.3%) |
| 45 to 54 Years | 116 (87.9%) | 0 (0.0%) |
| 55 to 59 Years | 76 (57.6%) | 0 (0.0%) |
| 60 to 64 Years | 15 (44.1%) | 0 (0.0%) |
| 65 to 74 Years | 20 (42.6%) | 0 (0.0%) |
| 75 Years and over | 6 (7.6%) | 0 (0.0%) |
| Total | 702 (66.9%) | 17 (2.4%) |
Employment Status by Educational Attainment in Sunman
According to labor force statistics for Sunman, 77.9% of individuals (598) out of the total population between 25 and 64 years of age (768) are in the labor force, with 2.8% or 17 of them being unemployed. The group with the highest labor force participation rate are those with the educational attainment of bachelor's degree or higher, with 100.0% or 137 individuals in the labor force. Within the labor force, individuals with college / associate degree education have the highest percentage of unemployment, with 8.3% or 17 of them being unemployed.
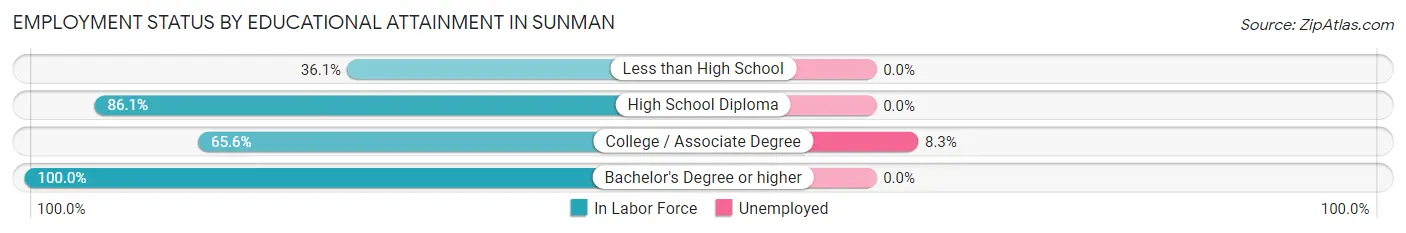
| Educational Attainment | In Labor Force | Unemployed |
| Less than High School | 13 (36.1%) | 0 (0.0%) |
| High School Diploma | 242 (86.1%) | 0 (0.0%) |
| College / Associate Degree | 206 (65.6%) | 26 (8.3%) |
| Bachelor's Degree or higher | 137 (100.0%) | 0 (0.0%) |
| Total | 598 (77.9%) | 22 (2.8%) |
Employment Occupations by Sex in Sunman
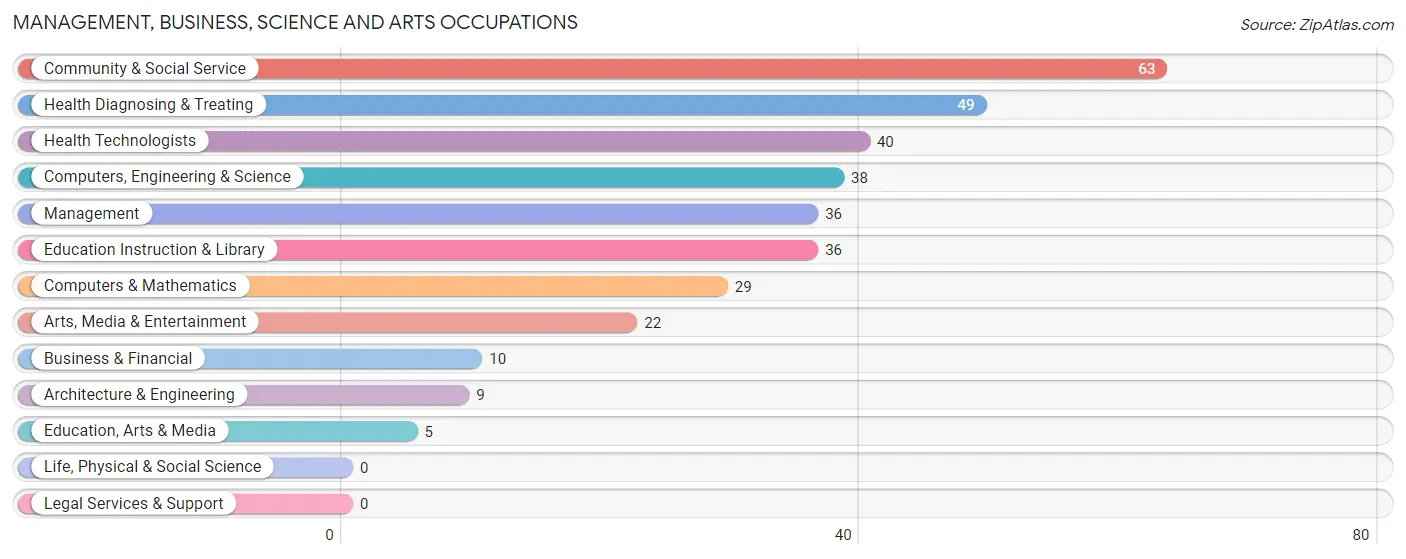
Management, Business, Science and Arts Occupations
The most common Management, Business, Science and Arts occupations in Sunman are Community & Social Service (63 | 9.2%), Health Diagnosing & Treating (49 | 7.1%), Health Technologists (40 | 5.8%), Computers, Engineering & Science (38 | 5.6%), and Management (36 | 5.3%).
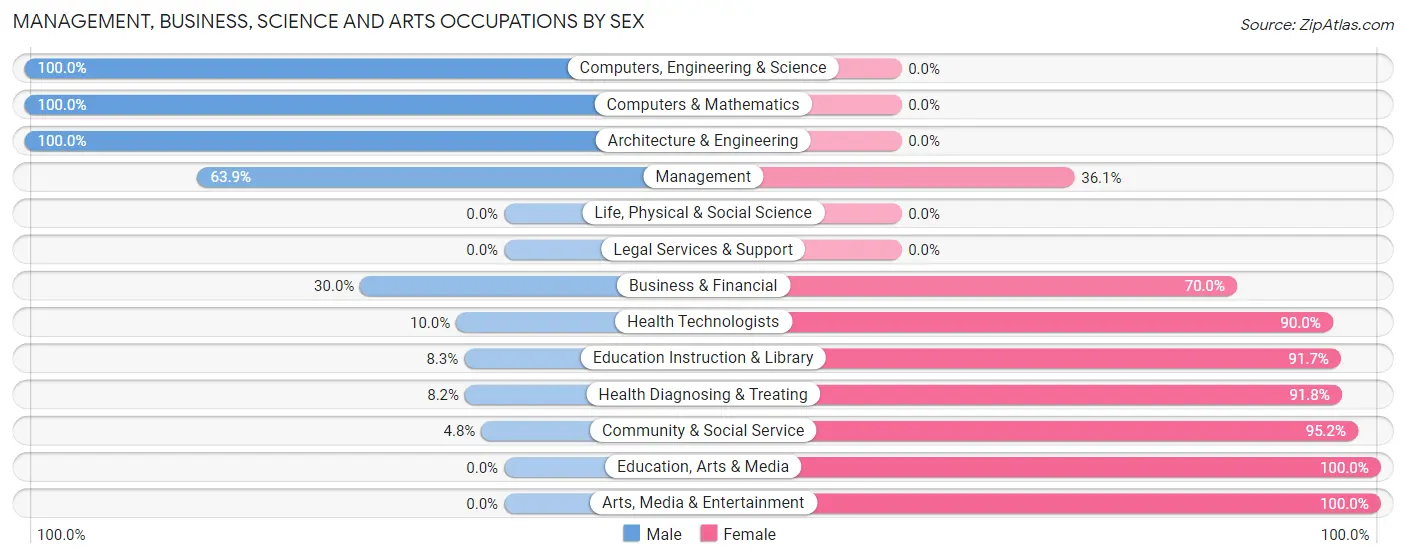
Management, Business, Science and Arts Occupations by Sex
Within the Management, Business, Science and Arts occupations in Sunman, the most male-oriented occupations are Computers, Engineering & Science (100.0%), Computers & Mathematics (100.0%), and Architecture & Engineering (100.0%), while the most female-oriented occupations are Education, Arts & Media (100.0%), Arts, Media & Entertainment (100.0%), and Community & Social Service (95.2%).
| Occupation | Male | Female |
| Management | 23 (63.9%) | 13 (36.1%) |
| Business & Financial | 3 (30.0%) | 7 (70.0%) |
| Computers, Engineering & Science | 38 (100.0%) | 0 (0.0%) |
| Computers & Mathematics | 29 (100.0%) | 0 (0.0%) |
| Architecture & Engineering | 9 (100.0%) | 0 (0.0%) |
| Life, Physical & Social Science | 0 (0.0%) | 0 (0.0%) |
| Community & Social Service | 3 (4.8%) | 60 (95.2%) |
| Education, Arts & Media | 0 (0.0%) | 5 (100.0%) |
| Legal Services & Support | 0 (0.0%) | 0 (0.0%) |
| Education Instruction & Library | 3 (8.3%) | 33 (91.7%) |
| Arts, Media & Entertainment | 0 (0.0%) | 22 (100.0%) |
| Health Diagnosing & Treating | 4 (8.2%) | 45 (91.8%) |
| Health Technologists | 4 (10.0%) | 36 (90.0%) |
| Total (Category) | 71 (36.2%) | 125 (63.8%) |
| Total (Overall) | 315 (46.0%) | 370 (54.0%) |
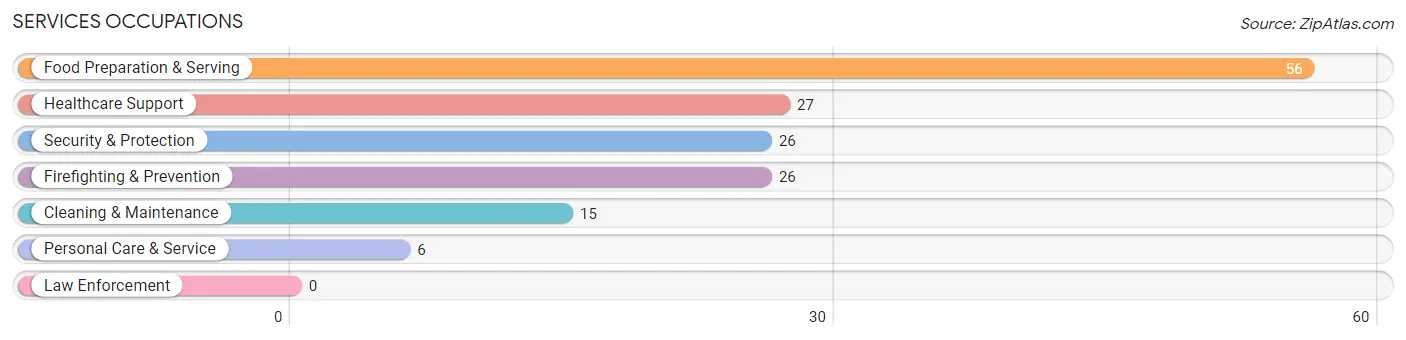
Services Occupations
The most common Services occupations in Sunman are Food Preparation & Serving (56 | 8.2%), Healthcare Support (27 | 3.9%), Security & Protection (26 | 3.8%), Firefighting & Prevention (26 | 3.8%), and Cleaning & Maintenance (15 | 2.2%).
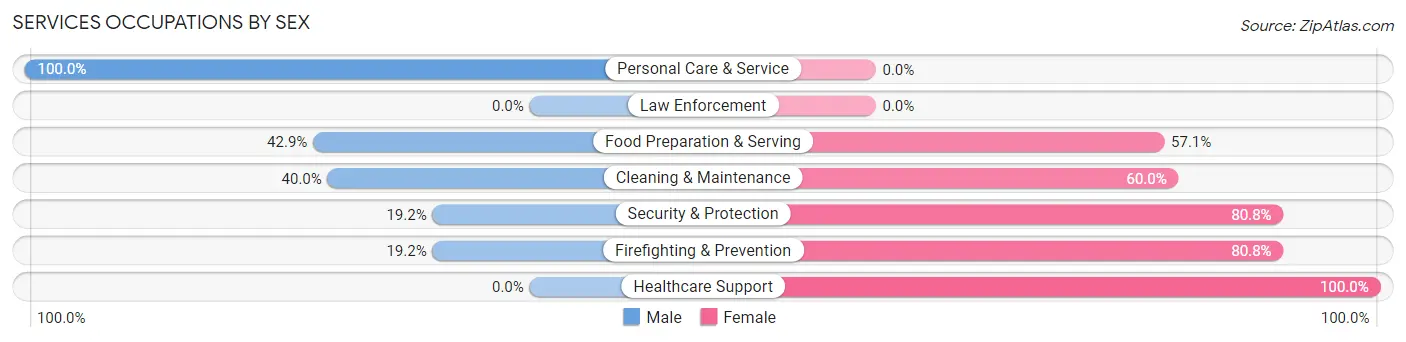
Services Occupations by Sex
Within the Services occupations in Sunman, the most male-oriented occupations are Personal Care & Service (100.0%), Food Preparation & Serving (42.9%), and Cleaning & Maintenance (40.0%), while the most female-oriented occupations are Healthcare Support (100.0%), Security & Protection (80.8%), and Firefighting & Prevention (80.8%).
| Occupation | Male | Female |
| Healthcare Support | 0 (0.0%) | 27 (100.0%) |
| Security & Protection | 5 (19.2%) | 21 (80.8%) |
| Firefighting & Prevention | 5 (19.2%) | 21 (80.8%) |
| Law Enforcement | 0 (0.0%) | 0 (0.0%) |
| Food Preparation & Serving | 24 (42.9%) | 32 (57.1%) |
| Cleaning & Maintenance | 6 (40.0%) | 9 (60.0%) |
| Personal Care & Service | 6 (100.0%) | 0 (0.0%) |
| Total (Category) | 41 (31.5%) | 89 (68.5%) |
| Total (Overall) | 315 (46.0%) | 370 (54.0%) |
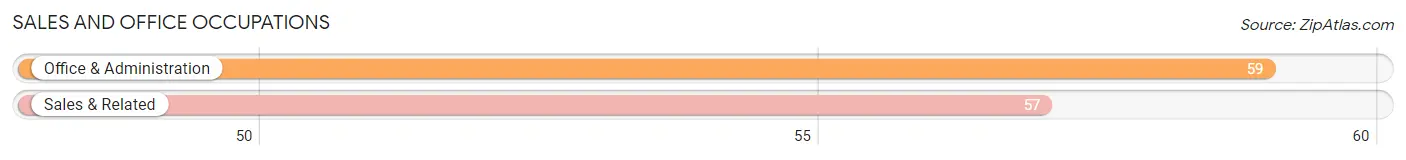
Sales and Office Occupations
The most common Sales and Office occupations in Sunman are Office & Administration (59 | 8.6%), and Sales & Related (57 | 8.3%).
Sales and Office Occupations by Sex
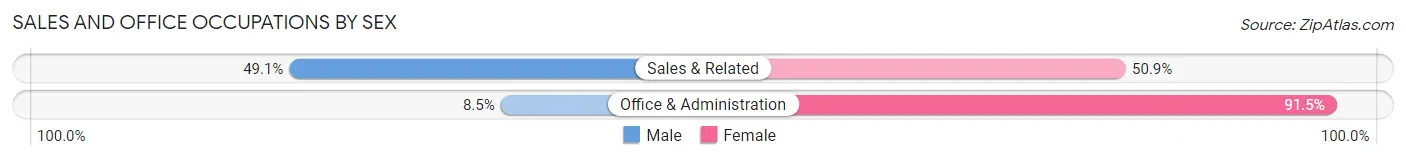
| Occupation | Male | Female |
| Sales & Related | 28 (49.1%) | 29 (50.9%) |
| Office & Administration | 5 (8.5%) | 54 (91.5%) |
| Total (Category) | 33 (28.4%) | 83 (71.6%) |
| Total (Overall) | 315 (46.0%) | 370 (54.0%) |
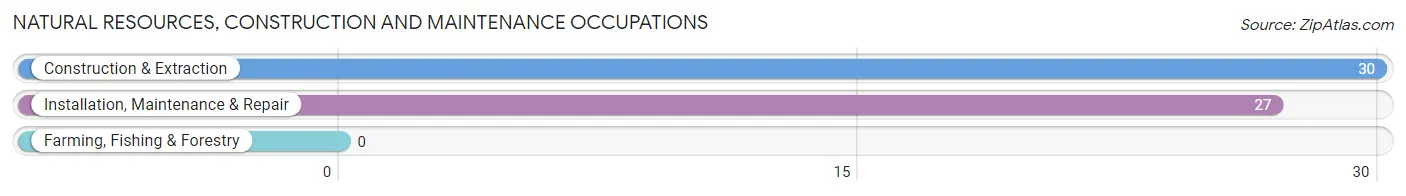
Natural Resources, Construction and Maintenance Occupations
The most common Natural Resources, Construction and Maintenance occupations in Sunman are Construction & Extraction (30 | 4.4%), and Installation, Maintenance & Repair (27 | 3.9%).
Natural Resources, Construction and Maintenance Occupations by Sex
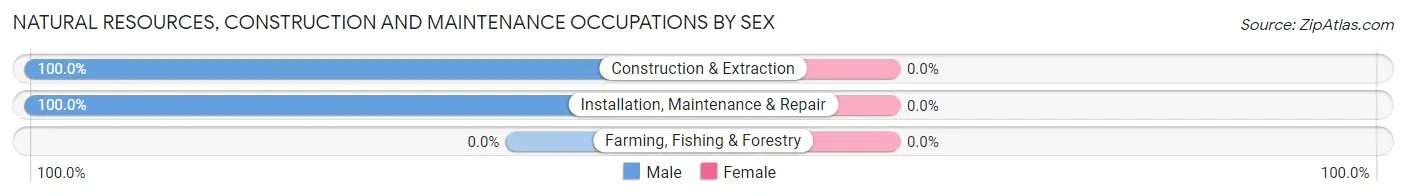
| Occupation | Male | Female |
| Farming, Fishing & Forestry | 0 (0.0%) | 0 (0.0%) |
| Construction & Extraction | 30 (100.0%) | 0 (0.0%) |
| Installation, Maintenance & Repair | 27 (100.0%) | 0 (0.0%) |
| Total (Category) | 57 (100.0%) | 0 (0.0%) |
| Total (Overall) | 315 (46.0%) | 370 (54.0%) |
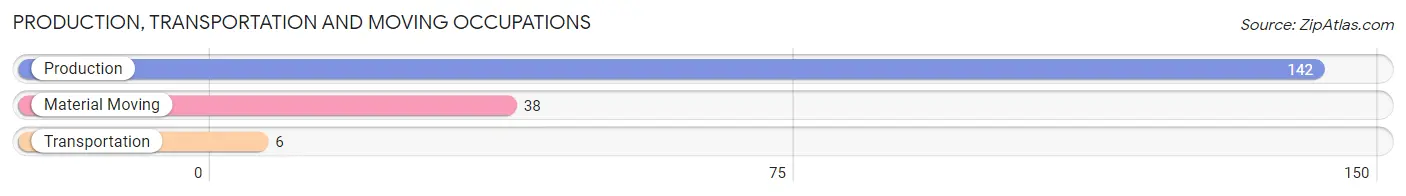
Production, Transportation and Moving Occupations
The most common Production, Transportation and Moving occupations in Sunman are Production (142 | 20.7%), Material Moving (38 | 5.6%), and Transportation (6 | 0.9%).
Production, Transportation and Moving Occupations by Sex
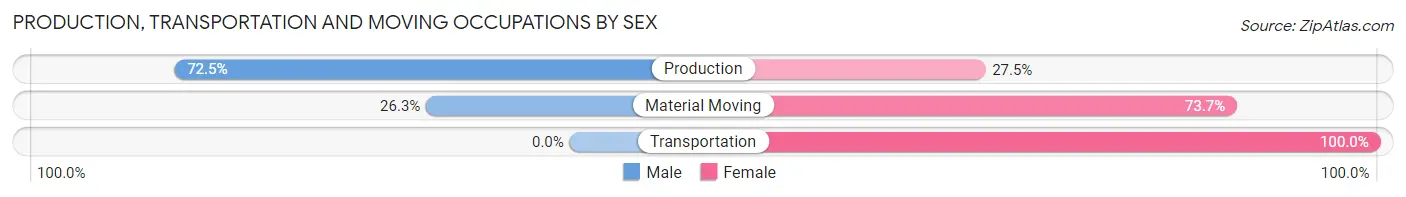
| Occupation | Male | Female |
| Production | 103 (72.5%) | 39 (27.5%) |
| Transportation | 0 (0.0%) | 6 (100.0%) |
| Material Moving | 10 (26.3%) | 28 (73.7%) |
| Total (Category) | 113 (60.8%) | 73 (39.3%) |
| Total (Overall) | 315 (46.0%) | 370 (54.0%) |
Employment Industries by Sex in Sunman
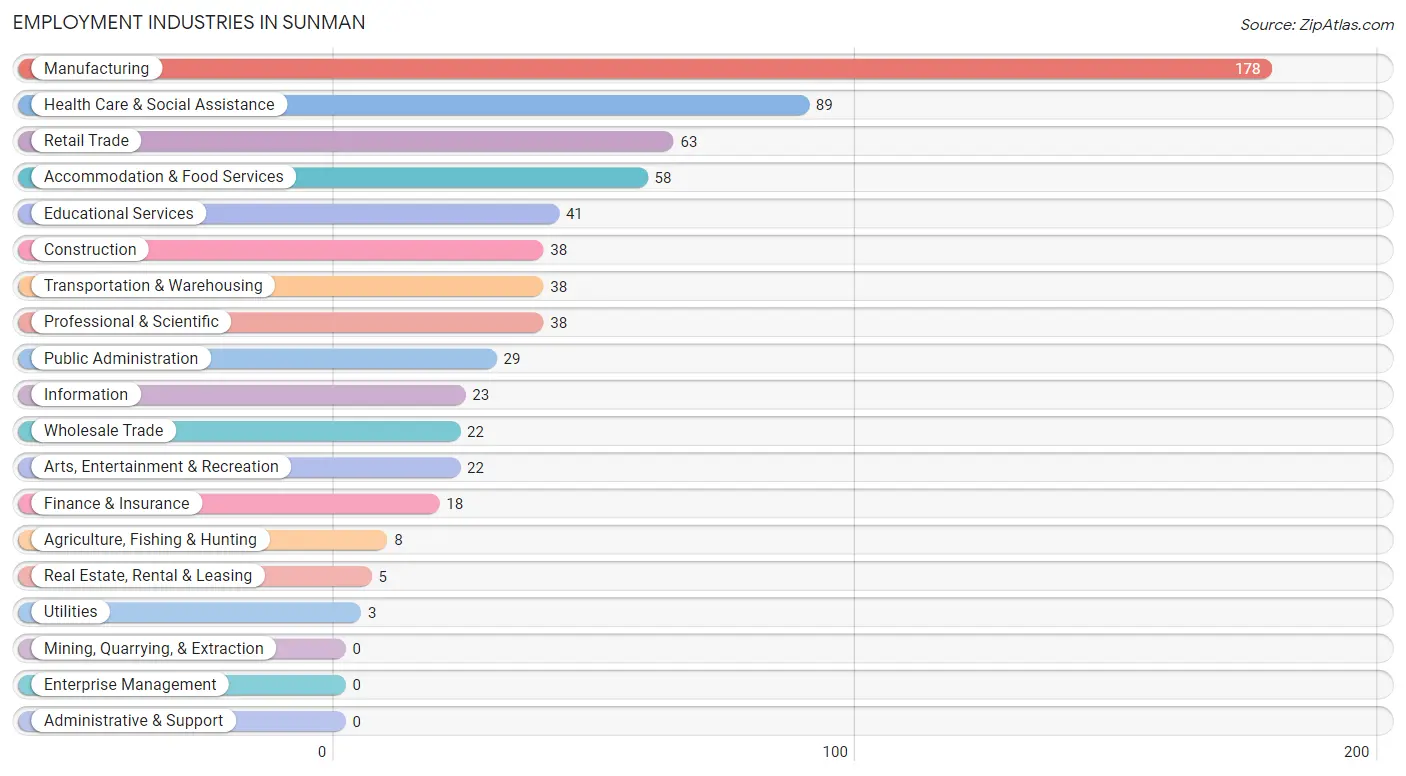
Employment Industries in Sunman
The major employment industries in Sunman include Manufacturing (178 | 26.0%), Health Care & Social Assistance (89 | 13.0%), Retail Trade (63 | 9.2%), Accommodation & Food Services (58 | 8.5%), and Educational Services (41 | 6.0%).
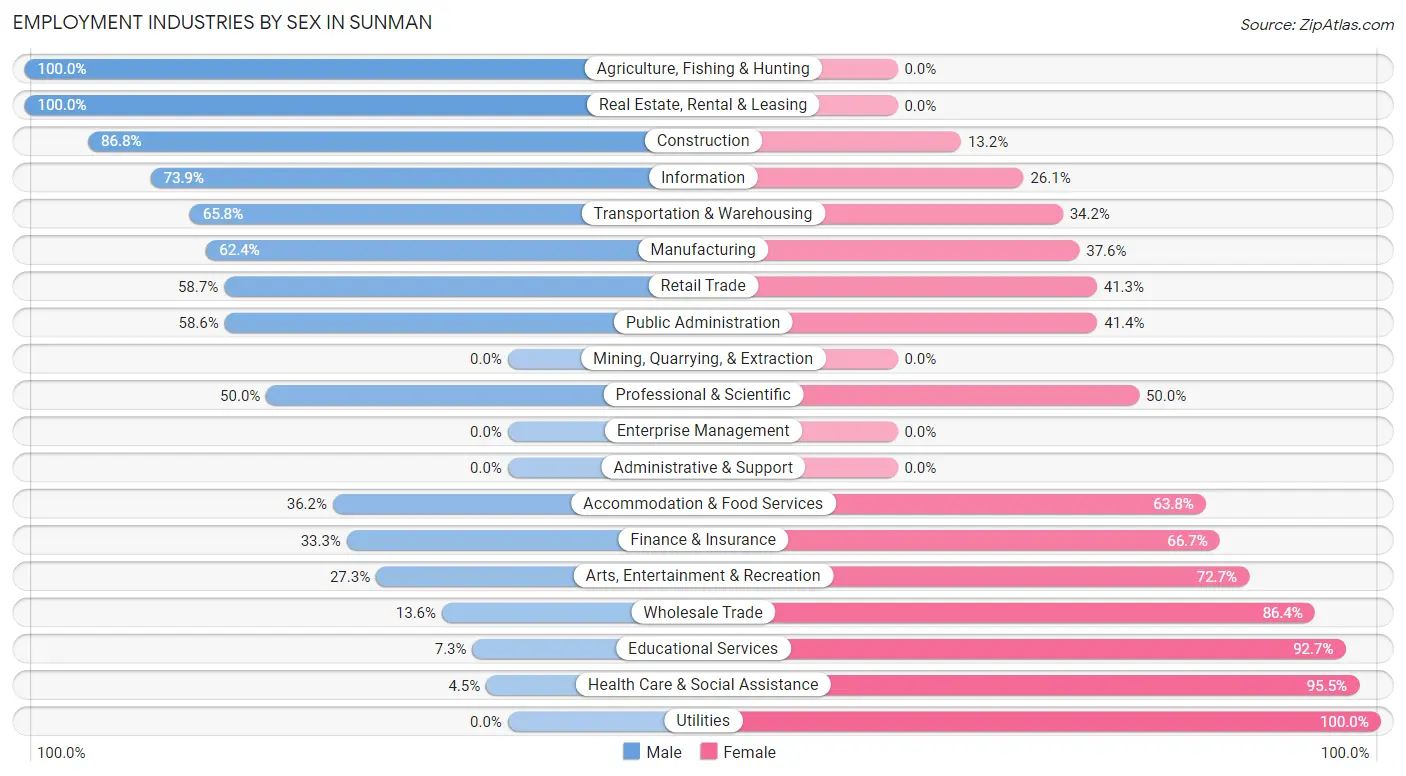
Employment Industries by Sex in Sunman
The Sunman industries that see more men than women are Agriculture, Fishing & Hunting (100.0%), Real Estate, Rental & Leasing (100.0%), and Construction (86.8%), whereas the industries that tend to have a higher number of women are Utilities (100.0%), Health Care & Social Assistance (95.5%), and Educational Services (92.7%).
| Industry | Male | Female |
| Agriculture, Fishing & Hunting | 8 (100.0%) | 0 (0.0%) |
| Mining, Quarrying, & Extraction | 0 (0.0%) | 0 (0.0%) |
| Construction | 33 (86.8%) | 5 (13.2%) |
| Manufacturing | 111 (62.4%) | 67 (37.6%) |
| Wholesale Trade | 3 (13.6%) | 19 (86.4%) |
| Retail Trade | 37 (58.7%) | 26 (41.3%) |
| Transportation & Warehousing | 25 (65.8%) | 13 (34.2%) |
| Utilities | 0 (0.0%) | 3 (100.0%) |
| Information | 17 (73.9%) | 6 (26.1%) |
| Finance & Insurance | 6 (33.3%) | 12 (66.7%) |
| Real Estate, Rental & Leasing | 5 (100.0%) | 0 (0.0%) |
| Professional & Scientific | 19 (50.0%) | 19 (50.0%) |
| Enterprise Management | 0 (0.0%) | 0 (0.0%) |
| Administrative & Support | 0 (0.0%) | 0 (0.0%) |
| Educational Services | 3 (7.3%) | 38 (92.7%) |
| Health Care & Social Assistance | 4 (4.5%) | 85 (95.5%) |
| Arts, Entertainment & Recreation | 6 (27.3%) | 16 (72.7%) |
| Accommodation & Food Services | 21 (36.2%) | 37 (63.8%) |
| Public Administration | 17 (58.6%) | 12 (41.4%) |
| Total | 315 (46.0%) | 370 (54.0%) |
Education in Sunman
School Enrollment in Sunman
The most common levels of schooling among the 432 students in Sunman are elementary school (122 | 28.2%), high school (92 | 21.3%), and college / undergraduate (88 | 20.4%).
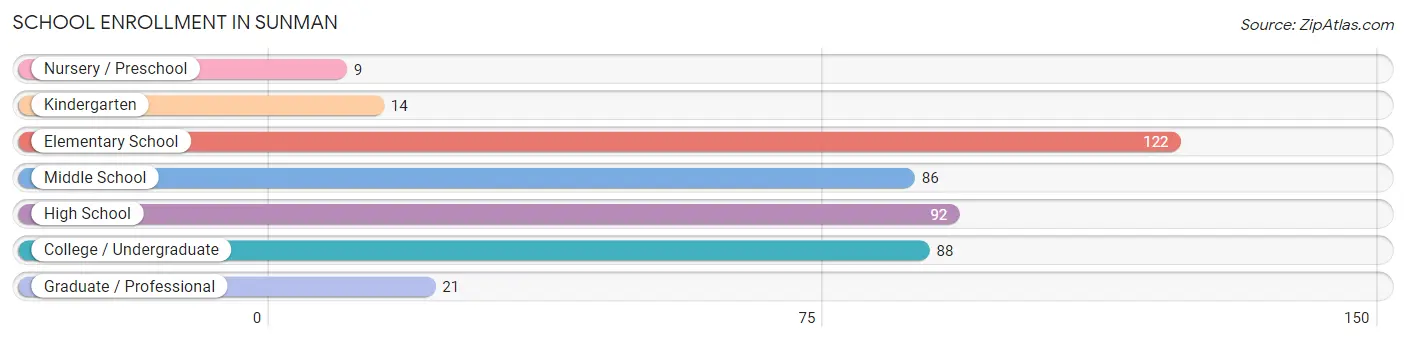
| School Level | # Students | % Students |
| Nursery / Preschool | 9 | 2.1% |
| Kindergarten | 14 | 3.2% |
| Elementary School | 122 | 28.2% |
| Middle School | 86 | 19.9% |
| High School | 92 | 21.3% |
| College / Undergraduate | 88 | 20.4% |
| Graduate / Professional | 21 | 4.9% |
| Total | 432 | 100.0% |
School Enrollment by Age by Funding Source in Sunman
Out of a total of 432 students who are enrolled in schools in Sunman, 28 (6.5%) attend a private institution, while the remaining 404 (93.5%) are enrolled in public schools. The age group of 20 to 24 year olds has the highest likelihood of being enrolled in private schools, with 10 (66.7% in the age bracket) enrolled. Conversely, the age group of 3 to 4 year olds has the lowest likelihood of being enrolled in a private school, with 2 (100.0% in the age bracket) attending a public institution.
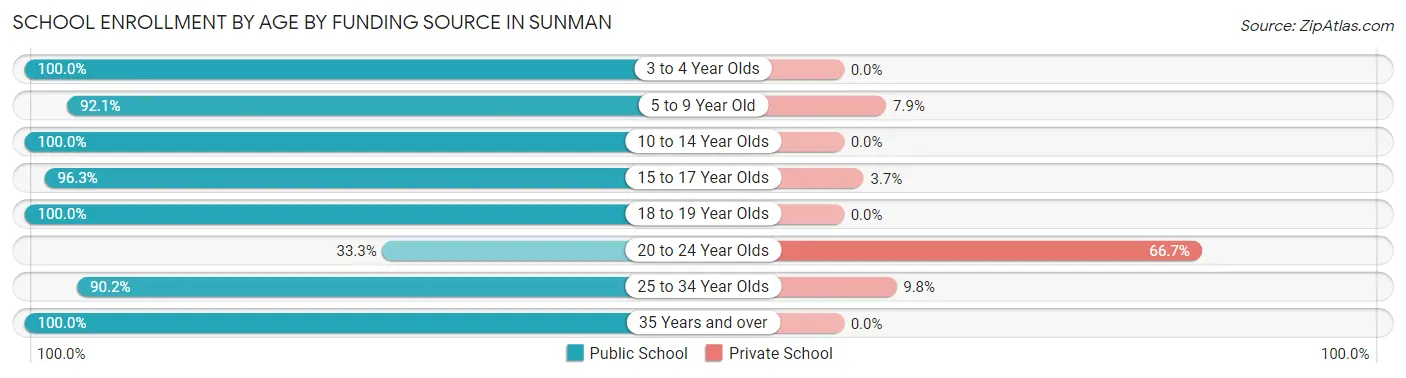
| Age Bracket | Public School | Private School |
| 3 to 4 Year Olds | 2 (100.0%) | 0 (0.0%) |
| 5 to 9 Year Old | 128 (92.1%) | 11 (7.9%) |
| 10 to 14 Year Olds | 90 (100.0%) | 0 (0.0%) |
| 15 to 17 Year Olds | 52 (96.3%) | 2 (3.7%) |
| 18 to 19 Year Olds | 42 (100.0%) | 0 (0.0%) |
| 20 to 24 Year Olds | 5 (33.3%) | 10 (66.7%) |
| 25 to 34 Year Olds | 46 (90.2%) | 5 (9.8%) |
| 35 Years and over | 39 (100.0%) | 0 (0.0%) |
| Total | 404 (93.5%) | 28 (6.5%) |
Educational Attainment by Field of Study in Sunman
Business (38 | 27.1%), science & technology (32 | 22.9%), education (23 | 16.4%), psychology (12 | 8.6%), and bio, nature & agricultural (10 | 7.1%) are the most common fields of study among 140 individuals in Sunman who have obtained a bachelor's degree or higher.
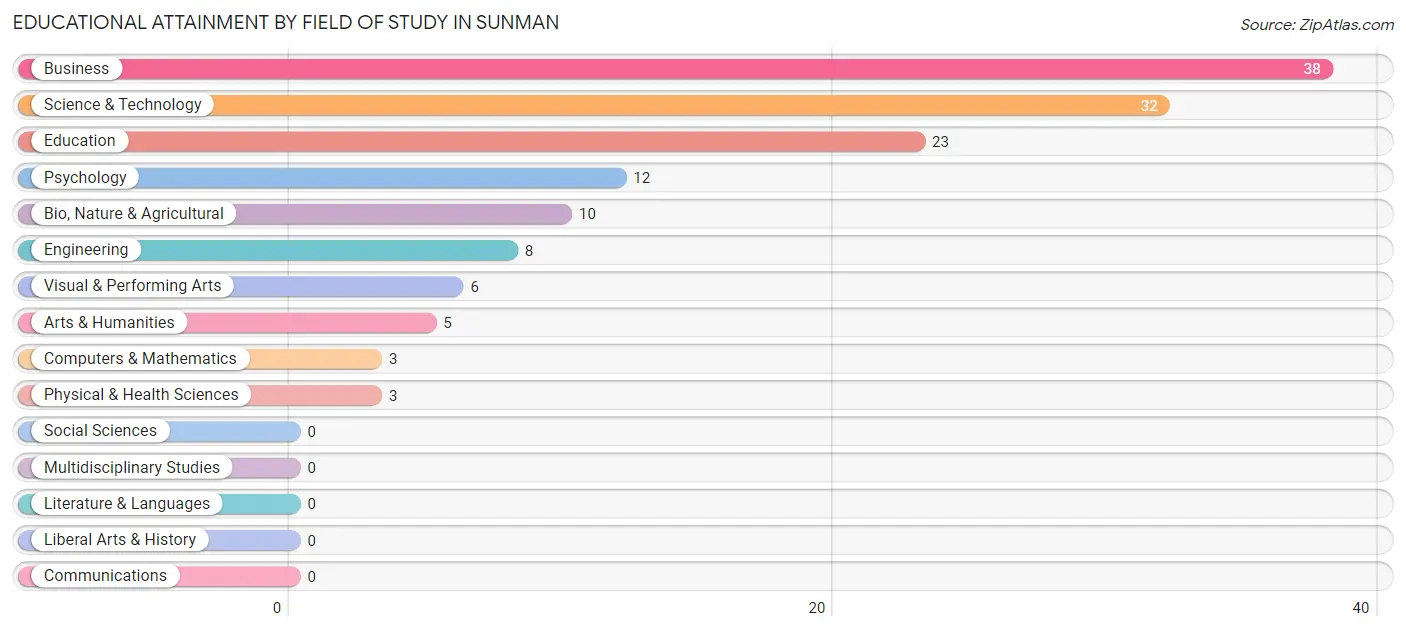
| Field of Study | # Graduates | % Graduates |
| Computers & Mathematics | 3 | 2.1% |
| Bio, Nature & Agricultural | 10 | 7.1% |
| Physical & Health Sciences | 3 | 2.1% |
| Psychology | 12 | 8.6% |
| Social Sciences | 0 | 0.0% |
| Engineering | 8 | 5.7% |
| Multidisciplinary Studies | 0 | 0.0% |
| Science & Technology | 32 | 22.9% |
| Business | 38 | 27.1% |
| Education | 23 | 16.4% |
| Literature & Languages | 0 | 0.0% |
| Liberal Arts & History | 0 | 0.0% |
| Visual & Performing Arts | 6 | 4.3% |
| Communications | 0 | 0.0% |
| Arts & Humanities | 5 | 3.6% |
| Total | 140 | 100.0% |
Transportation & Commute in Sunman
Vehicle Availability by Sex in Sunman
The most prevalent vehicle ownership categories in Sunman are males with 2 vehicles (124, accounting for 40.0%) and females with 2 vehicles (91, making up 33.5%).
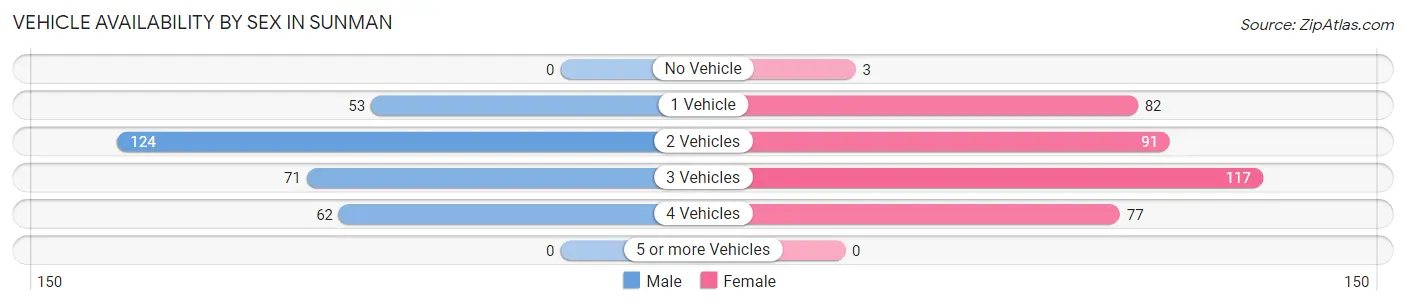
| Vehicles Available | Male | Female |
| No Vehicle | 0 (0.0%) | 3 (0.8%) |
| 1 Vehicle | 53 (17.1%) | 82 (22.2%) |
| 2 Vehicles | 124 (40.0%) | 91 (24.6%) |
| 3 Vehicles | 71 (22.9%) | 117 (31.6%) |
| 4 Vehicles | 62 (20.0%) | 77 (20.8%) |
| 5 or more Vehicles | 0 (0.0%) | 0 (0.0%) |
| Total | 310 (100.0%) | 370 (100.0%) |
Commute Time in Sunman
The most frequently occuring commute durations in Sunman are 10 to 14 minutes (140 commuters, 22.4%), 45 to 59 minutes (88 commuters, 14.1%), and 40 to 44 minutes (74 commuters, 11.8%).
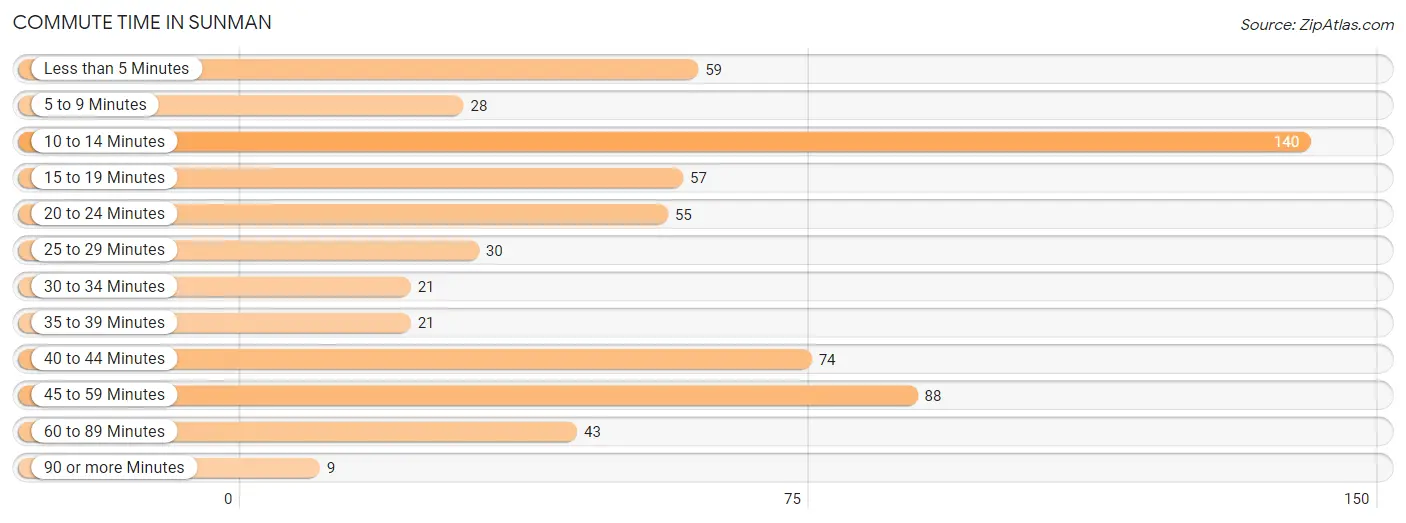
| Commute Time | # Commuters | % Commuters |
| Less than 5 Minutes | 59 | 9.4% |
| 5 to 9 Minutes | 28 | 4.5% |
| 10 to 14 Minutes | 140 | 22.4% |
| 15 to 19 Minutes | 57 | 9.1% |
| 20 to 24 Minutes | 55 | 8.8% |
| 25 to 29 Minutes | 30 | 4.8% |
| 30 to 34 Minutes | 21 | 3.4% |
| 35 to 39 Minutes | 21 | 3.4% |
| 40 to 44 Minutes | 74 | 11.8% |
| 45 to 59 Minutes | 88 | 14.1% |
| 60 to 89 Minutes | 43 | 6.9% |
| 90 or more Minutes | 9 | 1.4% |
Commute Time by Sex in Sunman
The most common commute times in Sunman are 45 to 59 minutes (68 commuters, 23.4%) for males and 10 to 14 minutes (90 commuters, 26.9%) for females.
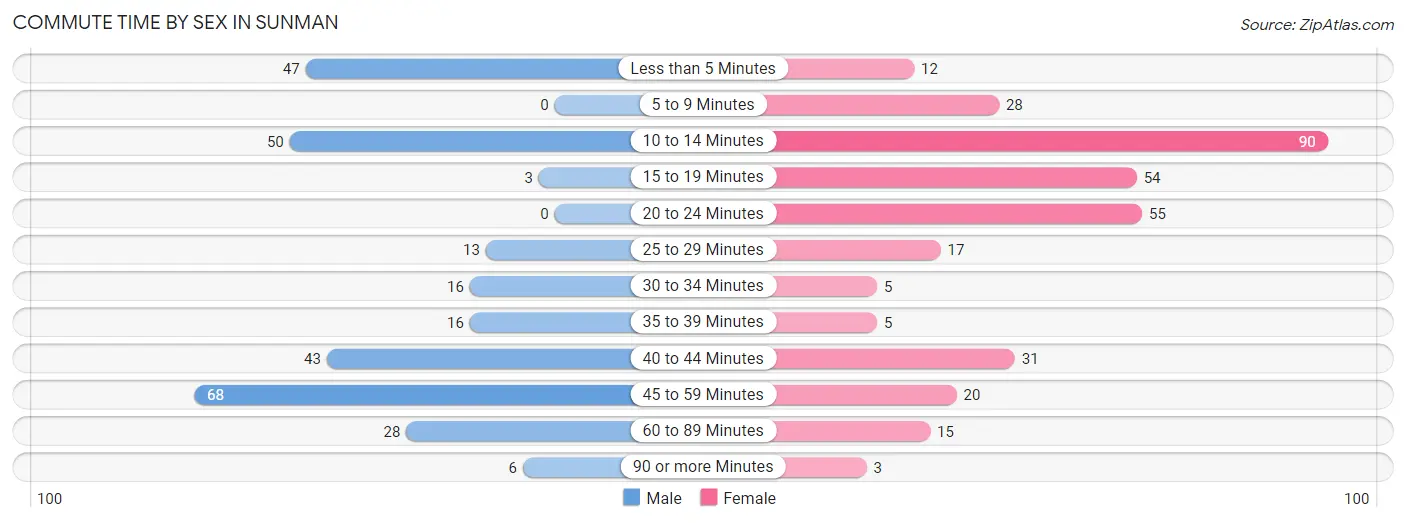
| Commute Time | Male | Female |
| Less than 5 Minutes | 47 (16.2%) | 12 (3.6%) |
| 5 to 9 Minutes | 0 (0.0%) | 28 (8.4%) |
| 10 to 14 Minutes | 50 (17.2%) | 90 (26.9%) |
| 15 to 19 Minutes | 3 (1.0%) | 54 (16.1%) |
| 20 to 24 Minutes | 0 (0.0%) | 55 (16.4%) |
| 25 to 29 Minutes | 13 (4.5%) | 17 (5.1%) |
| 30 to 34 Minutes | 16 (5.5%) | 5 (1.5%) |
| 35 to 39 Minutes | 16 (5.5%) | 5 (1.5%) |
| 40 to 44 Minutes | 43 (14.8%) | 31 (9.2%) |
| 45 to 59 Minutes | 68 (23.4%) | 20 (6.0%) |
| 60 to 89 Minutes | 28 (9.7%) | 15 (4.5%) |
| 90 or more Minutes | 6 (2.1%) | 3 (0.9%) |
Time of Departure to Work by Sex in Sunman
The most frequent times of departure to work in Sunman are 12:00 PM to 3:59 PM (71, 24.5%) for males and 7:00 AM to 7:29 AM (71, 21.2%) for females.
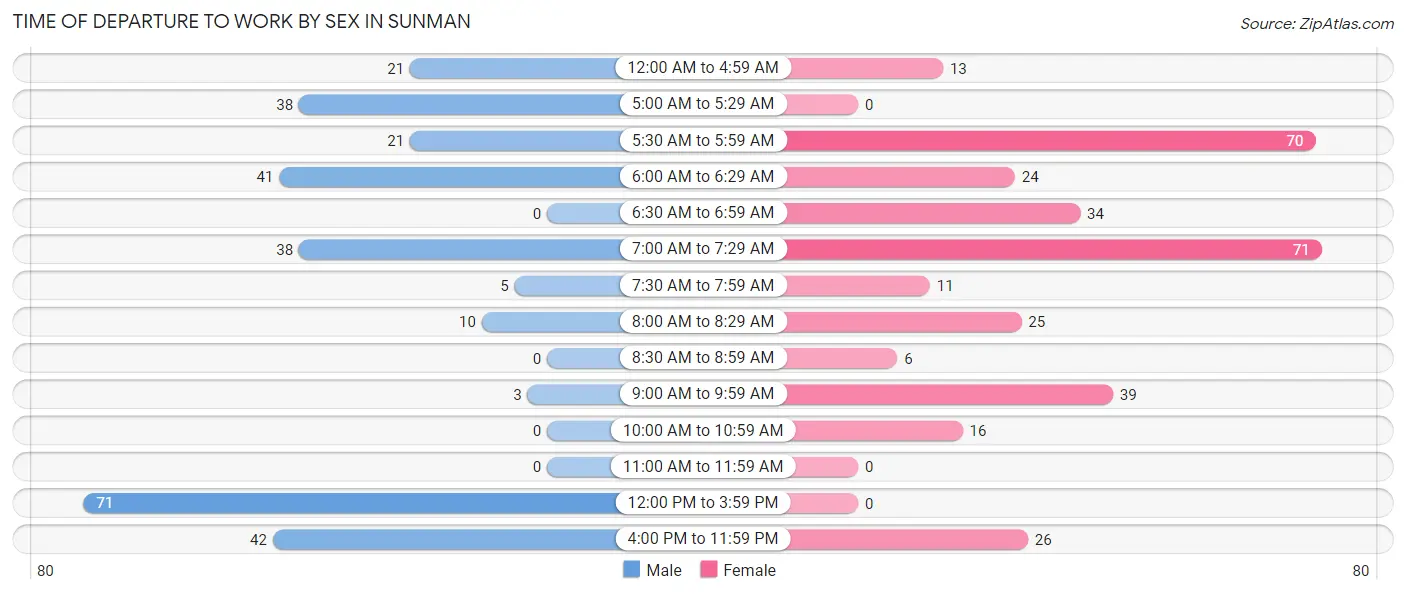
| Time of Departure | Male | Female |
| 12:00 AM to 4:59 AM | 21 (7.2%) | 13 (3.9%) |
| 5:00 AM to 5:29 AM | 38 (13.1%) | 0 (0.0%) |
| 5:30 AM to 5:59 AM | 21 (7.2%) | 70 (20.9%) |
| 6:00 AM to 6:29 AM | 41 (14.1%) | 24 (7.2%) |
| 6:30 AM to 6:59 AM | 0 (0.0%) | 34 (10.2%) |
| 7:00 AM to 7:29 AM | 38 (13.1%) | 71 (21.2%) |
| 7:30 AM to 7:59 AM | 5 (1.7%) | 11 (3.3%) |
| 8:00 AM to 8:29 AM | 10 (3.5%) | 25 (7.5%) |
| 8:30 AM to 8:59 AM | 0 (0.0%) | 6 (1.8%) |
| 9:00 AM to 9:59 AM | 3 (1.0%) | 39 (11.6%) |
| 10:00 AM to 10:59 AM | 0 (0.0%) | 16 (4.8%) |
| 11:00 AM to 11:59 AM | 0 (0.0%) | 0 (0.0%) |
| 12:00 PM to 3:59 PM | 71 (24.5%) | 0 (0.0%) |
| 4:00 PM to 11:59 PM | 42 (14.5%) | 26 (7.8%) |
| Total | 290 (100.0%) | 335 (100.0%) |
Housing Occupancy in Sunman
Occupancy by Ownership in Sunman
Of the total 481 dwellings in Sunman, owner-occupied units account for 331 (68.8%), while renter-occupied units make up 150 (31.2%).
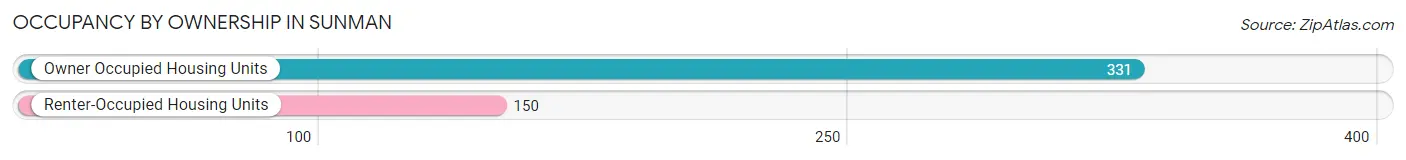
| Occupancy | # Housing Units | % Housing Units |
| Owner Occupied Housing Units | 331 | 68.8% |
| Renter-Occupied Housing Units | 150 | 31.2% |
| Total Occupied Housing Units | 481 | 100.0% |
Occupancy by Household Size in Sunman
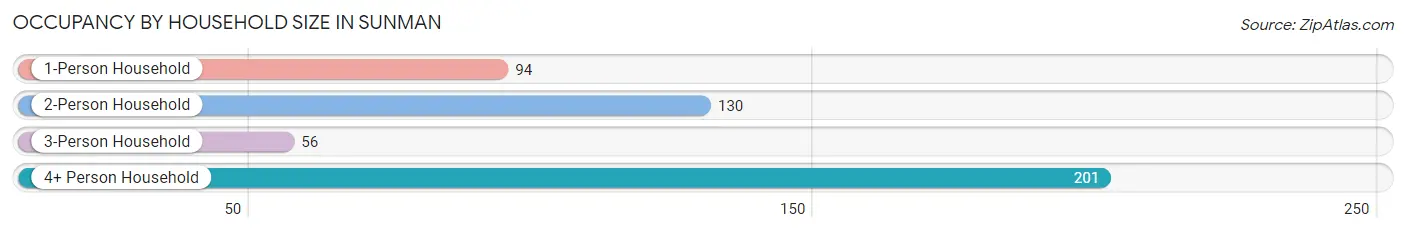
| Household Size | # Housing Units | % Housing Units |
| 1-Person Household | 94 | 19.5% |
| 2-Person Household | 130 | 27.0% |
| 3-Person Household | 56 | 11.6% |
| 4+ Person Household | 201 | 41.8% |
| Total Housing Units | 481 | 100.0% |
Occupancy by Ownership by Household Size in Sunman
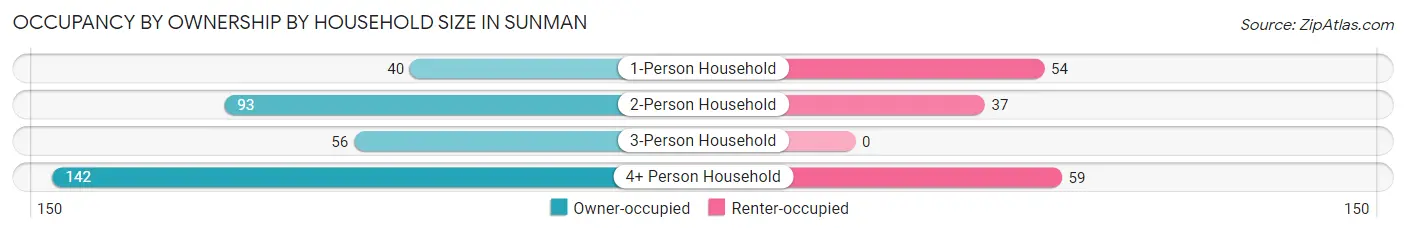
| Household Size | Owner-occupied | Renter-occupied |
| 1-Person Household | 40 (42.5%) | 54 (57.5%) |
| 2-Person Household | 93 (71.5%) | 37 (28.5%) |
| 3-Person Household | 56 (100.0%) | 0 (0.0%) |
| 4+ Person Household | 142 (70.7%) | 59 (29.3%) |
| Total Housing Units | 331 (68.8%) | 150 (31.2%) |
Occupancy by Educational Attainment in Sunman
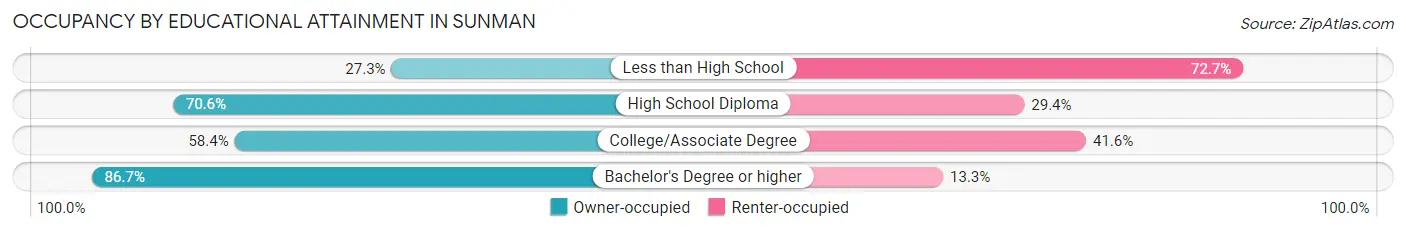
| Household Size | Owner-occupied | Renter-occupied |
| Less than High School | 3 (27.3%) | 8 (72.7%) |
| High School Diploma | 149 (70.6%) | 62 (29.4%) |
| College/Associate Degree | 94 (58.4%) | 67 (41.6%) |
| Bachelor's Degree or higher | 85 (86.7%) | 13 (13.3%) |
Occupancy by Age of Householder in Sunman
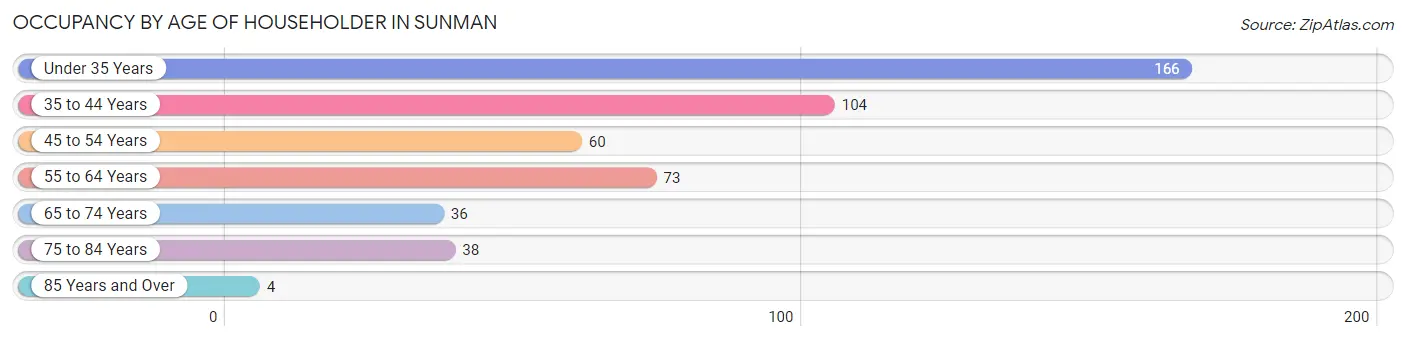
| Age Bracket | # Households | % Households |
| Under 35 Years | 166 | 34.5% |
| 35 to 44 Years | 104 | 21.6% |
| 45 to 54 Years | 60 | 12.5% |
| 55 to 64 Years | 73 | 15.2% |
| 65 to 74 Years | 36 | 7.5% |
| 75 to 84 Years | 38 | 7.9% |
| 85 Years and Over | 4 | 0.8% |
| Total | 481 | 100.0% |
Housing Finances in Sunman
Median Income by Occupancy in Sunman
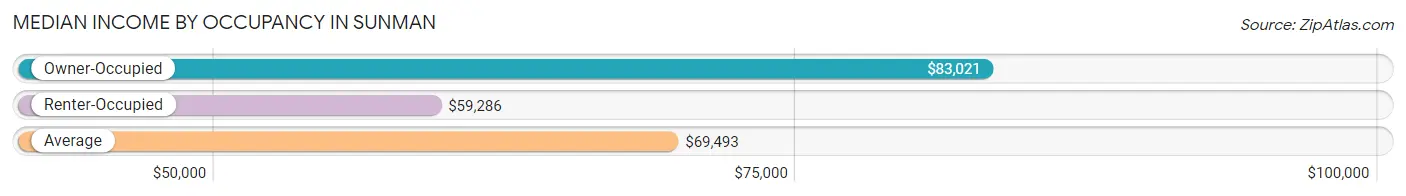
| Occupancy Type | # Households | Median Income |
| Owner-Occupied | 331 (68.8%) | $83,021 |
| Renter-Occupied | 150 (31.2%) | $59,286 |
| Average | 481 (100.0%) | $69,493 |
Occupancy by Householder Income Bracket in Sunman
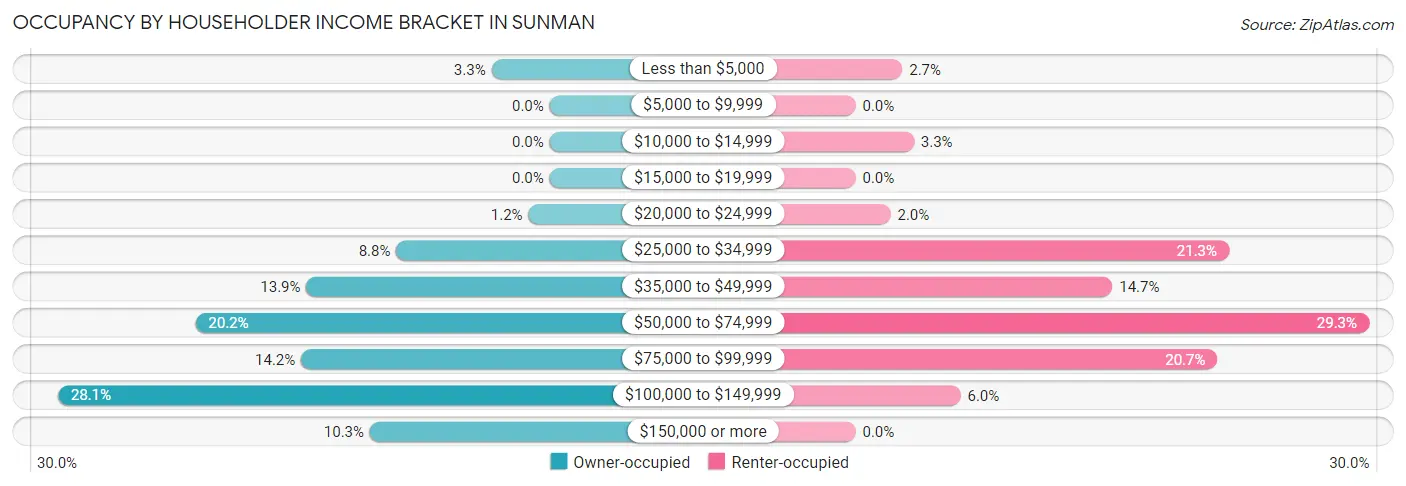
| Income Bracket | Owner-occupied | Renter-occupied |
| Less than $5,000 | 11 (3.3%) | 4 (2.7%) |
| $5,000 to $9,999 | 0 (0.0%) | 0 (0.0%) |
| $10,000 to $14,999 | 0 (0.0%) | 5 (3.3%) |
| $15,000 to $19,999 | 0 (0.0%) | 0 (0.0%) |
| $20,000 to $24,999 | 4 (1.2%) | 3 (2.0%) |
| $25,000 to $34,999 | 29 (8.8%) | 32 (21.3%) |
| $35,000 to $49,999 | 46 (13.9%) | 22 (14.7%) |
| $50,000 to $74,999 | 67 (20.2%) | 44 (29.3%) |
| $75,000 to $99,999 | 47 (14.2%) | 31 (20.7%) |
| $100,000 to $149,999 | 93 (28.1%) | 9 (6.0%) |
| $150,000 or more | 34 (10.3%) | 0 (0.0%) |
| Total | 331 (100.0%) | 150 (100.0%) |
Monthly Housing Cost Tiers in Sunman
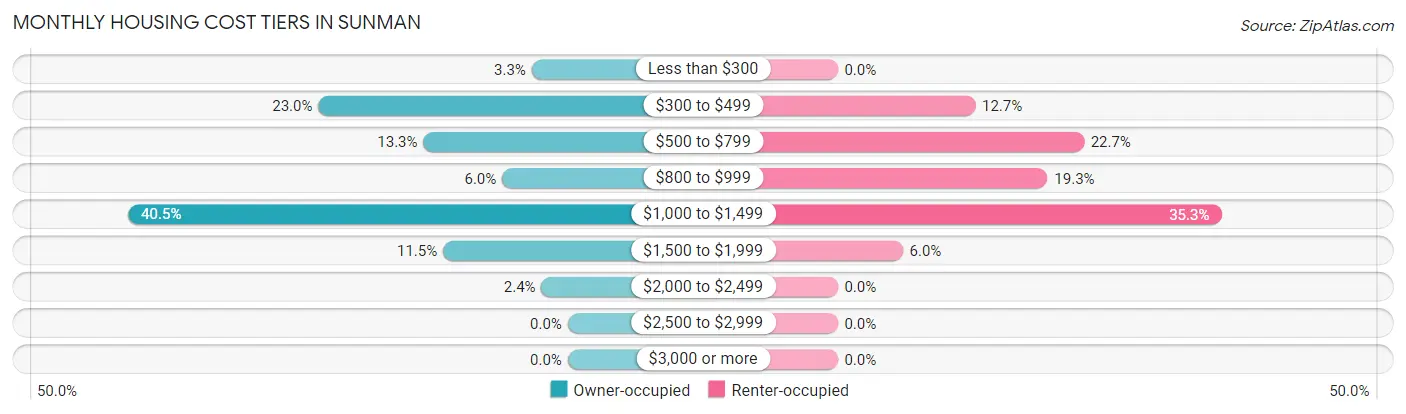
| Monthly Cost | Owner-occupied | Renter-occupied |
| Less than $300 | 11 (3.3%) | 0 (0.0%) |
| $300 to $499 | 76 (23.0%) | 19 (12.7%) |
| $500 to $799 | 44 (13.3%) | 34 (22.7%) |
| $800 to $999 | 20 (6.0%) | 29 (19.3%) |
| $1,000 to $1,499 | 134 (40.5%) | 53 (35.3%) |
| $1,500 to $1,999 | 38 (11.5%) | 9 (6.0%) |
| $2,000 to $2,499 | 8 (2.4%) | 0 (0.0%) |
| $2,500 to $2,999 | 0 (0.0%) | 0 (0.0%) |
| $3,000 or more | 0 (0.0%) | 0 (0.0%) |
| Total | 331 (100.0%) | 150 (100.0%) |
Physical Housing Characteristics in Sunman
Housing Structures in Sunman
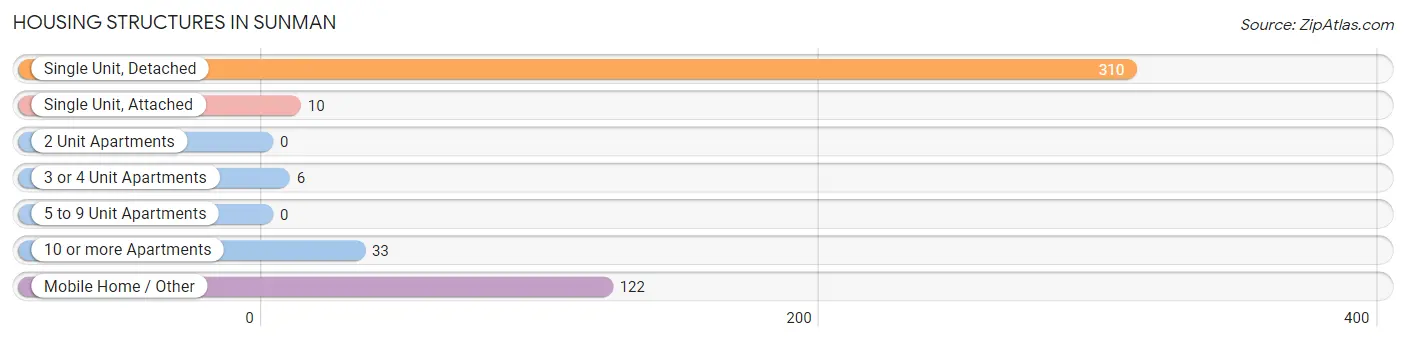
| Structure Type | # Housing Units | % Housing Units |
| Single Unit, Detached | 310 | 64.4% |
| Single Unit, Attached | 10 | 2.1% |
| 2 Unit Apartments | 0 | 0.0% |
| 3 or 4 Unit Apartments | 6 | 1.3% |
| 5 to 9 Unit Apartments | 0 | 0.0% |
| 10 or more Apartments | 33 | 6.9% |
| Mobile Home / Other | 122 | 25.4% |
| Total | 481 | 100.0% |
Housing Structures by Occupancy in Sunman
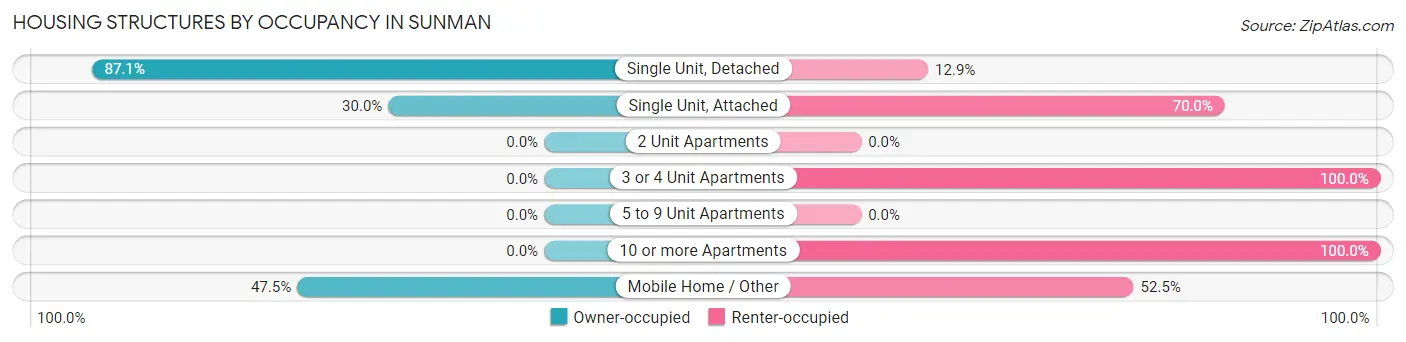
| Structure Type | Owner-occupied | Renter-occupied |
| Single Unit, Detached | 270 (87.1%) | 40 (12.9%) |
| Single Unit, Attached | 3 (30.0%) | 7 (70.0%) |
| 2 Unit Apartments | 0 (0.0%) | 0 (0.0%) |
| 3 or 4 Unit Apartments | 0 (0.0%) | 6 (100.0%) |
| 5 to 9 Unit Apartments | 0 (0.0%) | 0 (0.0%) |
| 10 or more Apartments | 0 (0.0%) | 33 (100.0%) |
| Mobile Home / Other | 58 (47.5%) | 64 (52.5%) |
| Total | 331 (68.8%) | 150 (31.2%) |
Housing Structures by Number of Rooms in Sunman
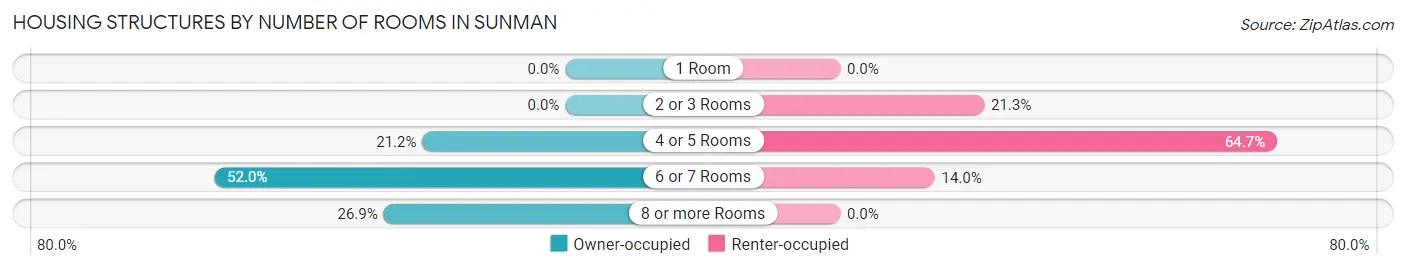
| Number of Rooms | Owner-occupied | Renter-occupied |
| 1 Room | 0 (0.0%) | 0 (0.0%) |
| 2 or 3 Rooms | 0 (0.0%) | 32 (21.3%) |
| 4 or 5 Rooms | 70 (21.1%) | 97 (64.7%) |
| 6 or 7 Rooms | 172 (52.0%) | 21 (14.0%) |
| 8 or more Rooms | 89 (26.9%) | 0 (0.0%) |
| Total | 331 (100.0%) | 150 (100.0%) |
Housing Structure by Heating Type in Sunman
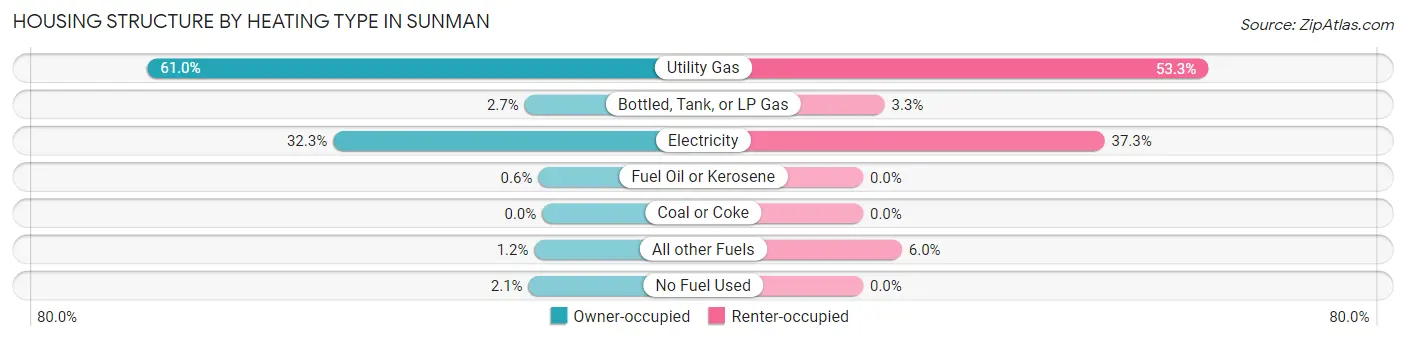
| Heating Type | Owner-occupied | Renter-occupied |
| Utility Gas | 202 (61.0%) | 80 (53.3%) |
| Bottled, Tank, or LP Gas | 9 (2.7%) | 5 (3.3%) |
| Electricity | 107 (32.3%) | 56 (37.3%) |
| Fuel Oil or Kerosene | 2 (0.6%) | 0 (0.0%) |
| Coal or Coke | 0 (0.0%) | 0 (0.0%) |
| All other Fuels | 4 (1.2%) | 9 (6.0%) |
| No Fuel Used | 7 (2.1%) | 0 (0.0%) |
| Total | 331 (100.0%) | 150 (100.0%) |
Household Vehicle Usage in Sunman
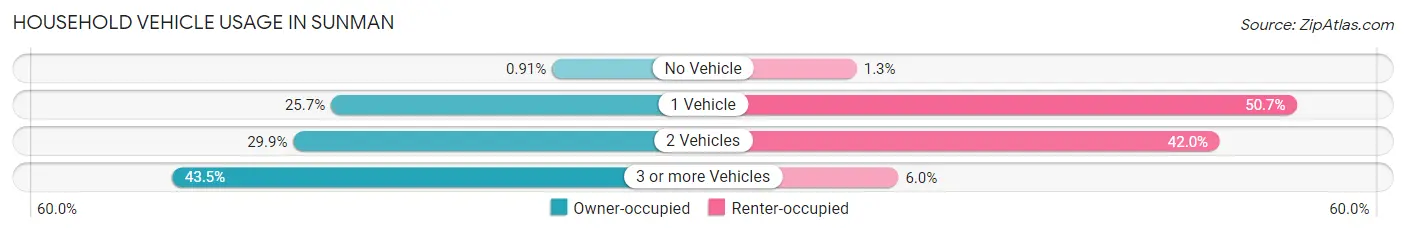
| Vehicles per Household | Owner-occupied | Renter-occupied |
| No Vehicle | 3 (0.9%) | 2 (1.3%) |
| 1 Vehicle | 85 (25.7%) | 76 (50.7%) |
| 2 Vehicles | 99 (29.9%) | 63 (42.0%) |
| 3 or more Vehicles | 144 (43.5%) | 9 (6.0%) |
| Total | 331 (100.0%) | 150 (100.0%) |
Real Estate & Mortgages in Sunman
Real Estate and Mortgage Overview in Sunman
| Characteristic | Without Mortgage | With Mortgage |
| Housing Units | 133 | 198 |
| Median Property Value | $115,100 | $195,600 |
| Median Household Income | $57,917 | $22 |
| Monthly Housing Costs | $441 | $0 |
| Real Estate Taxes | $676 | $0 |
Property Value by Mortgage Status in Sunman
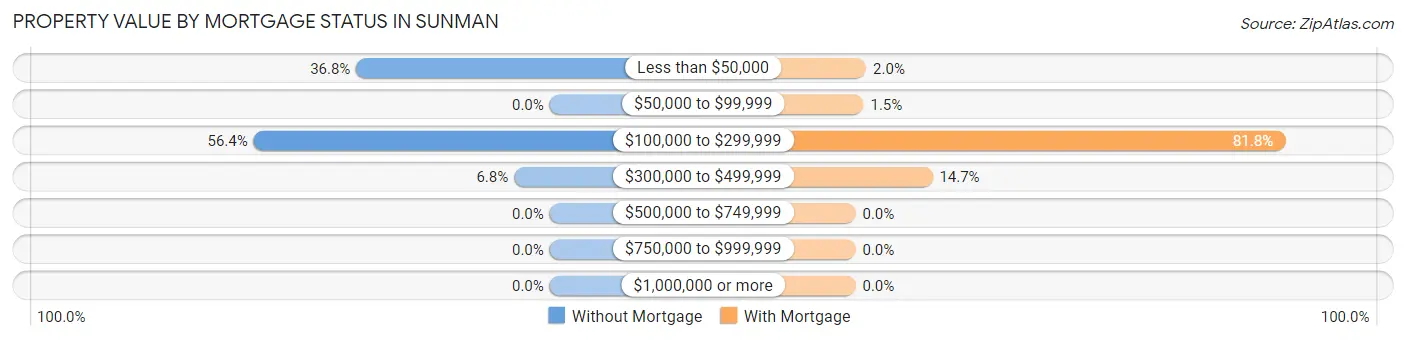
| Property Value | Without Mortgage | With Mortgage |
| Less than $50,000 | 49 (36.8%) | 4 (2.0%) |
| $50,000 to $99,999 | 0 (0.0%) | 3 (1.5%) |
| $100,000 to $299,999 | 75 (56.4%) | 162 (81.8%) |
| $300,000 to $499,999 | 9 (6.8%) | 29 (14.6%) |
| $500,000 to $749,999 | 0 (0.0%) | 0 (0.0%) |
| $750,000 to $999,999 | 0 (0.0%) | 0 (0.0%) |
| $1,000,000 or more | 0 (0.0%) | 0 (0.0%) |
| Total | 133 (100.0%) | 198 (100.0%) |
Household Income by Mortgage Status in Sunman
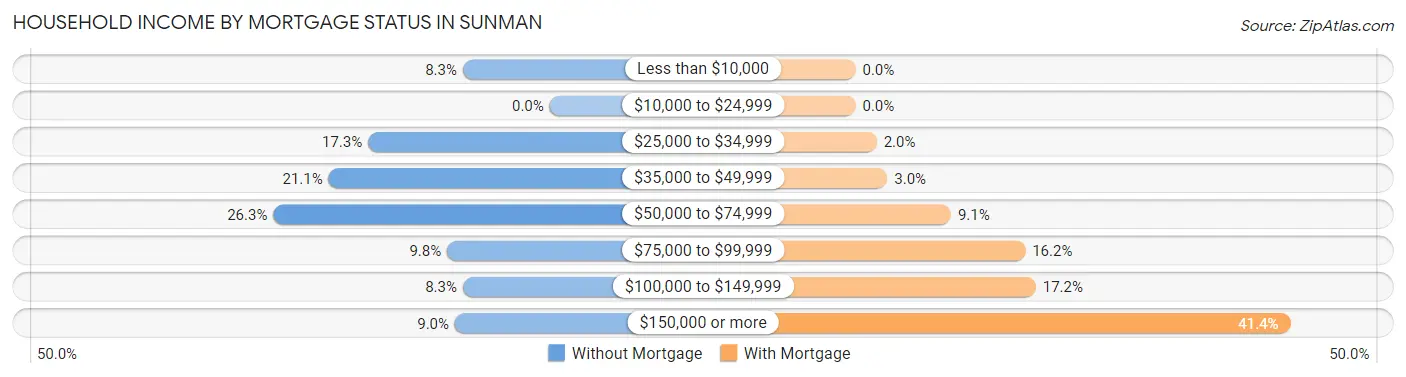
| Household Income | Without Mortgage | With Mortgage |
| Less than $10,000 | 11 (8.3%) | 0 (0.0%) |
| $10,000 to $24,999 | 0 (0.0%) | 0 (0.0%) |
| $25,000 to $34,999 | 23 (17.3%) | 4 (2.0%) |
| $35,000 to $49,999 | 28 (21.0%) | 6 (3.0%) |
| $50,000 to $74,999 | 35 (26.3%) | 18 (9.1%) |
| $75,000 to $99,999 | 13 (9.8%) | 32 (16.2%) |
| $100,000 to $149,999 | 11 (8.3%) | 34 (17.2%) |
| $150,000 or more | 12 (9.0%) | 82 (41.4%) |
| Total | 133 (100.0%) | 198 (100.0%) |
Property Value to Household Income Ratio in Sunman
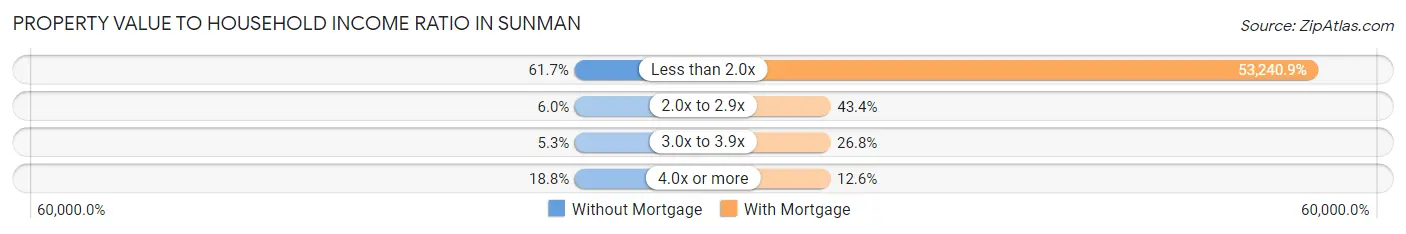
| Value-to-Income Ratio | Without Mortgage | With Mortgage |
| Less than 2.0x | 82 (61.7%) | 105,417 (53,240.9%) |
| 2.0x to 2.9x | 8 (6.0%) | 86 (43.4%) |
| 3.0x to 3.9x | 7 (5.3%) | 53 (26.8%) |
| 4.0x or more | 25 (18.8%) | 25 (12.6%) |
| Total | 133 (100.0%) | 198 (100.0%) |
Real Estate Taxes by Mortgage Status in Sunman
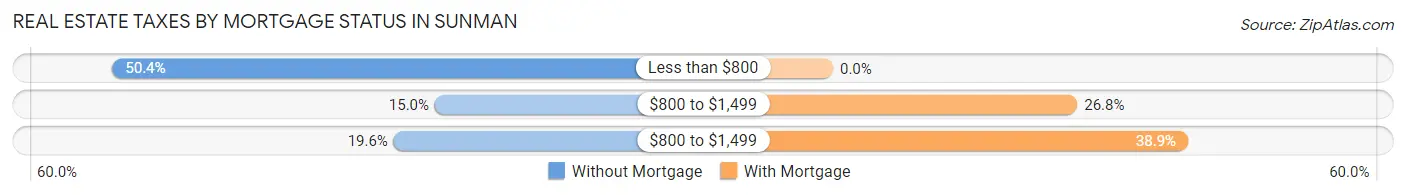
| Property Taxes | Without Mortgage | With Mortgage |
| Less than $800 | 67 (50.4%) | 0 (0.0%) |
| $800 to $1,499 | 20 (15.0%) | 53 (26.8%) |
| $800 to $1,499 | 26 (19.6%) | 77 (38.9%) |
| Total | 133 (100.0%) | 198 (100.0%) |
Health & Disability in Sunman
Health Insurance Coverage by Age in Sunman
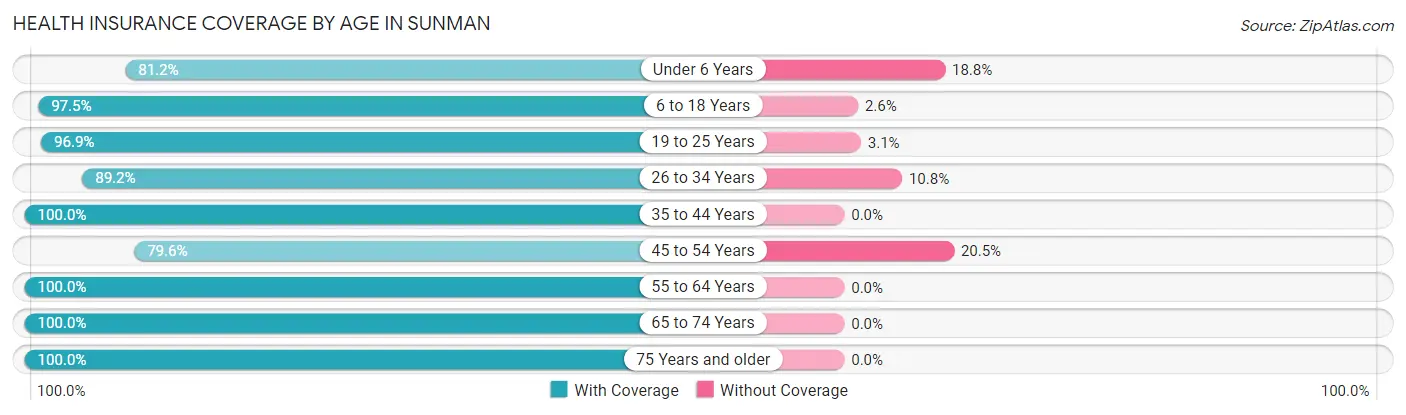
| Age Bracket | With Coverage | Without Coverage |
| Under 6 Years | 147 (81.2%) | 34 (18.8%) |
| 6 to 18 Years | 306 (97.5%) | 8 (2.5%) |
| 19 to 25 Years | 94 (96.9%) | 3 (3.1%) |
| 26 to 34 Years | 224 (89.2%) | 27 (10.8%) |
| 35 to 44 Years | 198 (100.0%) | 0 (0.0%) |
| 45 to 54 Years | 105 (79.5%) | 27 (20.4%) |
| 55 to 64 Years | 166 (100.0%) | 0 (0.0%) |
| 65 to 74 Years | 47 (100.0%) | 0 (0.0%) |
| 75 Years and older | 79 (100.0%) | 0 (0.0%) |
| Total | 1,366 (93.2%) | 99 (6.8%) |
Health Insurance Coverage by Citizenship Status in Sunman
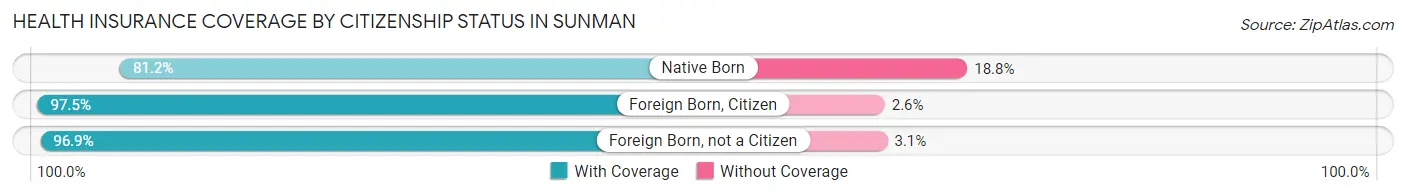
| Citizenship Status | With Coverage | Without Coverage |
| Native Born | 147 (81.2%) | 34 (18.8%) |
| Foreign Born, Citizen | 306 (97.5%) | 8 (2.5%) |
| Foreign Born, not a Citizen | 94 (96.9%) | 3 (3.1%) |
Health Insurance Coverage by Household Income in Sunman
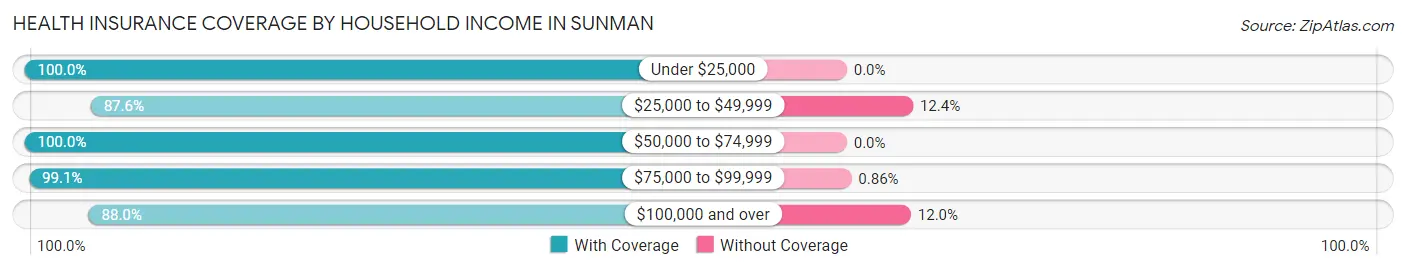
| Household Income | With Coverage | Without Coverage |
| Under $25,000 | 38 (100.0%) | 0 (0.0%) |
| $25,000 to $49,999 | 219 (87.6%) | 31 (12.4%) |
| $50,000 to $74,999 | 385 (100.0%) | 0 (0.0%) |
| $75,000 to $99,999 | 231 (99.1%) | 2 (0.9%) |
| $100,000 and over | 484 (88.0%) | 66 (12.0%) |
Public vs Private Health Insurance Coverage by Age in Sunman
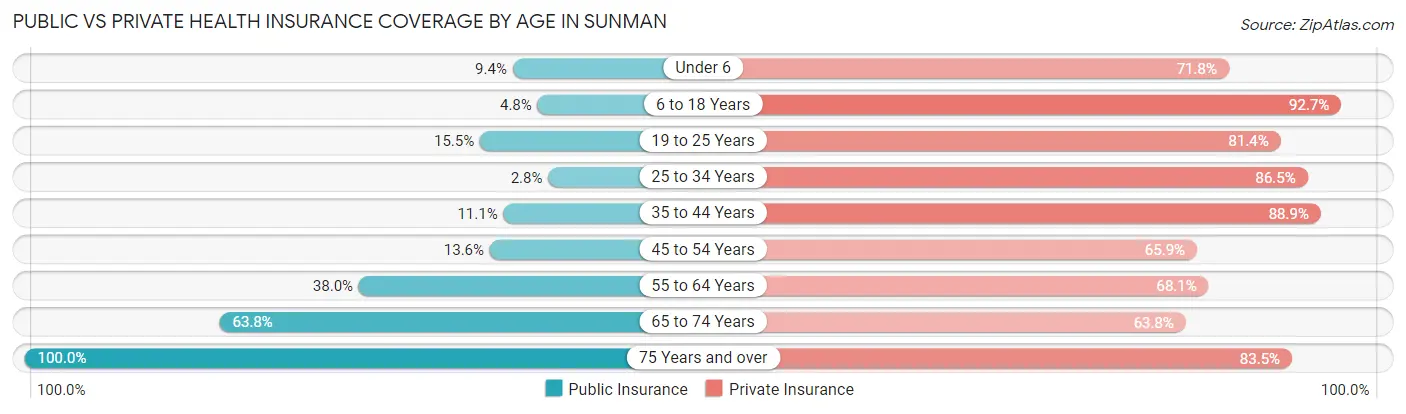
| Age Bracket | Public Insurance | Private Insurance |
| Under 6 | 17 (9.4%) | 130 (71.8%) |
| 6 to 18 Years | 15 (4.8%) | 291 (92.7%) |
| 19 to 25 Years | 15 (15.5%) | 79 (81.4%) |
| 25 to 34 Years | 7 (2.8%) | 217 (86.5%) |
| 35 to 44 Years | 22 (11.1%) | 176 (88.9%) |
| 45 to 54 Years | 18 (13.6%) | 87 (65.9%) |
| 55 to 64 Years | 63 (38.0%) | 113 (68.1%) |
| 65 to 74 Years | 30 (63.8%) | 30 (63.8%) |
| 75 Years and over | 79 (100.0%) | 66 (83.5%) |
| Total | 266 (18.2%) | 1,189 (81.2%) |
Disability Status by Sex by Age in Sunman
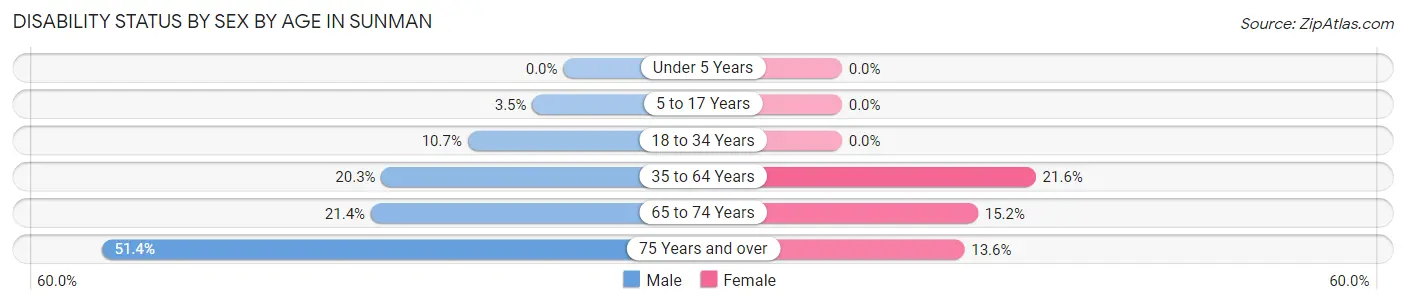
| Age Bracket | Male | Female |
| Under 5 Years | 0 (0.0%) | 0 (0.0%) |
| 5 to 17 Years | 3 (3.5%) | 0 (0.0%) |
| 18 to 34 Years | 18 (10.6%) | 0 (0.0%) |
| 35 to 64 Years | 47 (20.3%) | 57 (21.6%) |
| 65 to 74 Years | 3 (21.4%) | 5 (15.1%) |
| 75 Years and over | 18 (51.4%) | 6 (13.6%) |
Disability Class by Sex by Age in Sunman
Disability Class: Hearing Difficulty
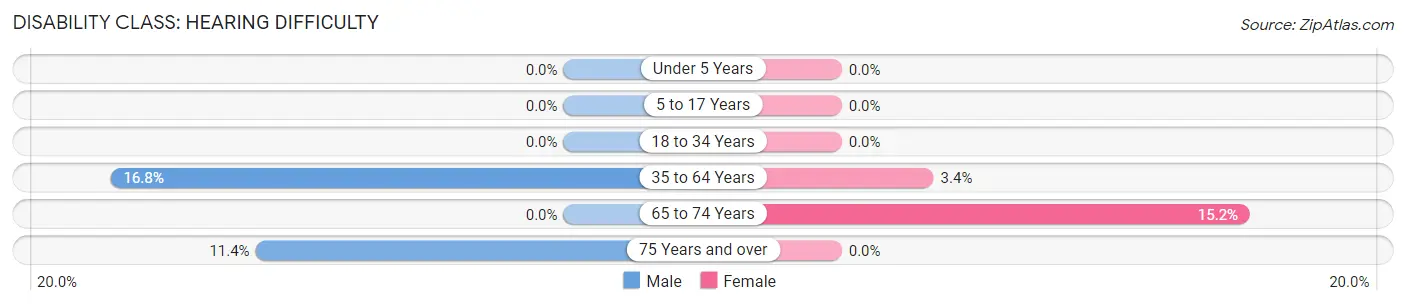
| Age Bracket | Male | Female |
| Under 5 Years | 0 (0.0%) | 0 (0.0%) |
| 5 to 17 Years | 0 (0.0%) | 0 (0.0%) |
| 18 to 34 Years | 0 (0.0%) | 0 (0.0%) |
| 35 to 64 Years | 39 (16.8%) | 9 (3.4%) |
| 65 to 74 Years | 0 (0.0%) | 5 (15.1%) |
| 75 Years and over | 4 (11.4%) | 0 (0.0%) |
Disability Class: Vision Difficulty
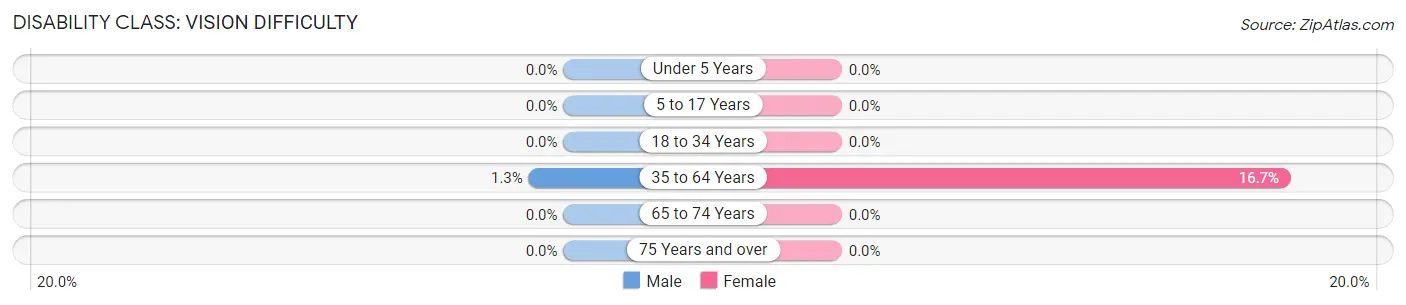
| Age Bracket | Male | Female |
| Under 5 Years | 0 (0.0%) | 0 (0.0%) |
| 5 to 17 Years | 0 (0.0%) | 0 (0.0%) |
| 18 to 34 Years | 0 (0.0%) | 0 (0.0%) |
| 35 to 64 Years | 3 (1.3%) | 44 (16.7%) |
| 65 to 74 Years | 0 (0.0%) | 0 (0.0%) |
| 75 Years and over | 0 (0.0%) | 0 (0.0%) |
Disability Class: Cognitive Difficulty
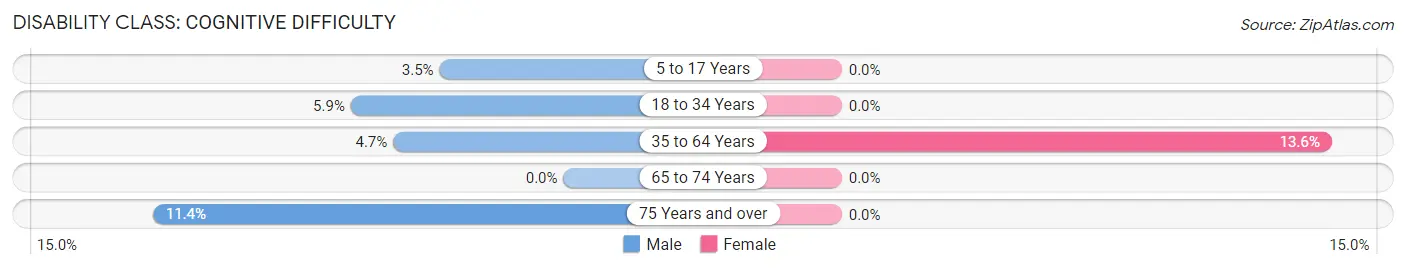
| Age Bracket | Male | Female |
| 5 to 17 Years | 3 (3.5%) | 0 (0.0%) |
| 18 to 34 Years | 10 (5.9%) | 0 (0.0%) |
| 35 to 64 Years | 11 (4.7%) | 36 (13.6%) |
| 65 to 74 Years | 0 (0.0%) | 0 (0.0%) |
| 75 Years and over | 4 (11.4%) | 0 (0.0%) |
Disability Class: Ambulatory Difficulty
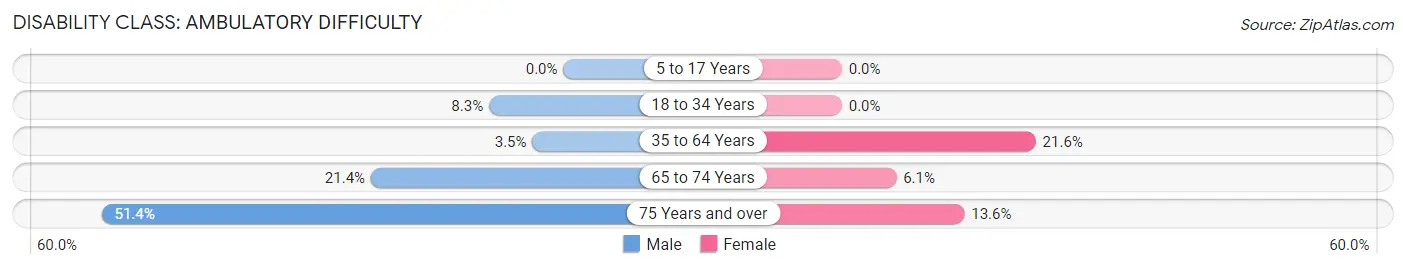
| Age Bracket | Male | Female |
| 5 to 17 Years | 0 (0.0%) | 0 (0.0%) |
| 18 to 34 Years | 14 (8.3%) | 0 (0.0%) |
| 35 to 64 Years | 8 (3.5%) | 57 (21.6%) |
| 65 to 74 Years | 3 (21.4%) | 2 (6.1%) |
| 75 Years and over | 18 (51.4%) | 6 (13.6%) |
Disability Class: Self-Care Difficulty
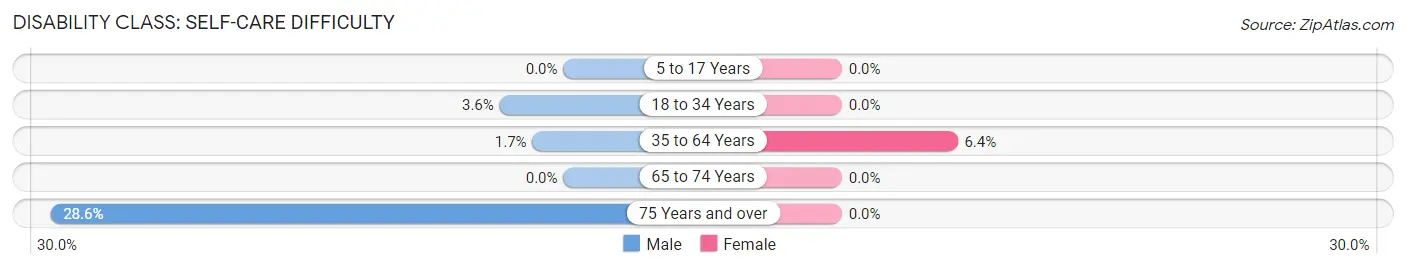
| Age Bracket | Male | Female |
| 5 to 17 Years | 0 (0.0%) | 0 (0.0%) |
| 18 to 34 Years | 6 (3.5%) | 0 (0.0%) |
| 35 to 64 Years | 4 (1.7%) | 17 (6.4%) |
| 65 to 74 Years | 0 (0.0%) | 0 (0.0%) |
| 75 Years and over | 10 (28.6%) | 0 (0.0%) |
Technology Access in Sunman
Computing Device Access in Sunman
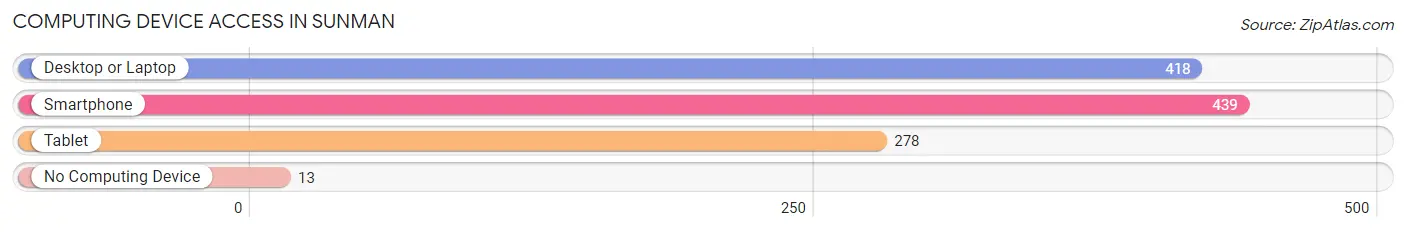
| Device Type | # Households | % Households |
| Desktop or Laptop | 418 | 86.9% |
| Smartphone | 439 | 91.3% |
| Tablet | 278 | 57.8% |
| No Computing Device | 13 | 2.7% |
| Total | 481 | 100.0% |
Internet Access in Sunman
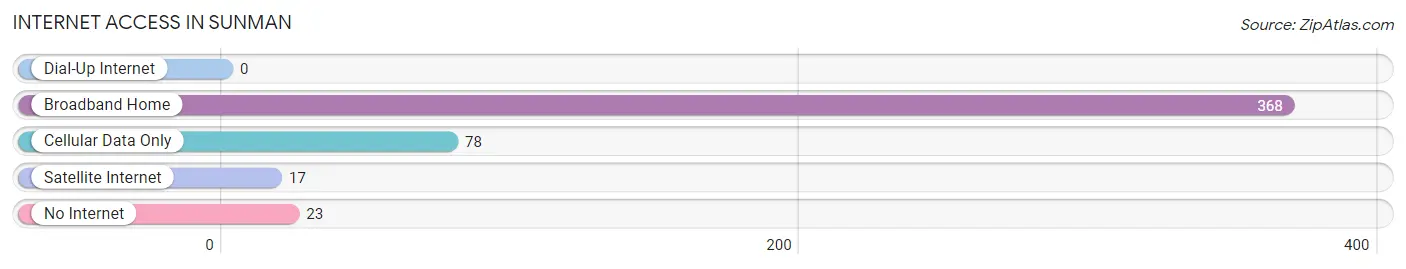
| Internet Type | # Households | % Households |
| Dial-Up Internet | 0 | 0.0% |
| Broadband Home | 368 | 76.5% |
| Cellular Data Only | 78 | 16.2% |
| Satellite Internet | 17 | 3.5% |
| No Internet | 23 | 4.8% |
| Total | 481 | 100.0% |
Sunman Summary
Sunman, Indiana is a small town located in Dearborn County, Indiana. It is situated along the Ohio River, approximately 30 miles west of Cincinnati, Ohio. The town was founded in 1818 and has a population of approximately 1,500 people.
Geography
Sunman is located in the southeastern corner of Dearborn County, Indiana. It is situated along the Ohio River, approximately 30 miles west of Cincinnati, Ohio. The town is located in the Central Till Plains region of Indiana, which is characterized by flat terrain and fertile soils. The town is surrounded by agricultural land, with corn and soybeans being the primary crops. The town is also located near the Big Oaks National Wildlife Refuge, which is a popular destination for birdwatchers and nature enthusiasts.
Economy
Sunman’s economy is largely based on agriculture and manufacturing. The town is home to several small businesses, including a feed mill, a grain elevator, and a lumber yard. The town also has a few restaurants and retail stores. The town is also home to a few small manufacturing companies, including a plastics manufacturer and a metal fabrication shop.
Demographics
As of the 2010 census, Sunman had a population of 1,500 people. The racial makeup of the town was 97.3% White, 0.7% African American, 0.3% Native American, 0.3% Asian, and 1.3% from other races. The median household income was $41,250, and the median family income was $50,000. The per capita income was $20,000.
History
Sunman was founded in 1818 by a group of settlers from Pennsylvania. The town was named after the Sunman family, who were among the first settlers. The town was originally a farming community, and the main crops were corn and wheat. In the late 19th century, the town began to industrialize, and several factories were built in the area. The town was also home to a large brickyard, which supplied bricks for many of the buildings in the area.
In the early 20th century, Sunman experienced a period of growth and prosperity. The town was home to several banks, a movie theater, and a variety of other businesses. The town also had a thriving agricultural industry, with corn and soybeans being the primary crops.
In the late 20th century, Sunman experienced a period of decline. Many of the factories and businesses closed, and the population began to decline. However, the town has experienced a resurgence in recent years, and the population has begun to grow again. The town is now home to several small businesses, and the economy is largely based on agriculture and manufacturing.
Common Questions
What is Per Capita Income in Sunman?
Per Capita income in Sunman is $26,099.
What is the Median Family Income in Sunman?
Median Family Income in Sunman is $84,018.
What is the Median Household income in Sunman?
Median Household Income in Sunman is $69,493.
What is Income or Wage Gap in Sunman?
Income or Wage Gap in Sunman is 42.2%.
Women in Sunman earn 57.8 cents for every dollar earned by a man.
What is Inequality or Gini Index in Sunman?
Inequality or Gini Index in Sunman is 0.41.
What is the Total Population of Sunman?
Total Population of Sunman is 1,465.
What is the Total Male Population of Sunman?
Total Male Population of Sunman is 601.
What is the Total Female Population of Sunman?
Total Female Population of Sunman is 864.
What is the Ratio of Males per 100 Females in Sunman?
There are 69.56 Males per 100 Females in Sunman.
What is the Ratio of Females per 100 Males in Sunman?
There are 143.76 Females per 100 Males in Sunman.
What is the Median Population Age in Sunman?
Median Population Age in Sunman is 30.5 Years.
What is the Average Family Size in Sunman
Average Family Size in Sunman is 3.6 People.
What is the Average Household Size in Sunman
Average Household Size in Sunman is 3.0 People.
How Large is the Labor Force in Sunman?
There are 702 People in the Labor Forcein in Sunman.
What is the Percentage of People in the Labor Force in Sunman?
66.9% of People are in the Labor Force in Sunman.
What is the Unemployment Rate in Sunman?
Unemployment Rate in Sunman is 2.4%.