Savage, MD Map & Demographics
Savage Map
Savage Overview
$49,430
PER CAPITA INCOME
$139,884
AVG FAMILY INCOME
$109,657
AVG HOUSEHOLD INCOME
28.4%
WAGE / INCOME GAP [ % ]
71.6¢/ $1
WAGE / INCOME GAP [ $ ]
0.37
INEQUALITY / GINI INDEX
7,528
TOTAL POPULATION
4,077
MALE POPULATION
3,451
FEMALE POPULATION
118.14
MALES / 100 FEMALES
84.65
FEMALES / 100 MALES
39.2
MEDIAN AGE
3.3
AVG FAMILY SIZE
2.7
AVG HOUSEHOLD SIZE
4,535
LABOR FORCE [ PEOPLE ]
77.8%
PERCENT IN LABOR FORCE
4.9%
UNEMPLOYMENT RATE
Savage Zip Codes
Income in Savage
Income Overview in Savage
Per Capita Income in Savage is $49,430, while median incomes of families and households are $139,884 and $109,657 respectively.
| Characteristic | Number | Measure |
| Per Capita Income | 7,528 | $49,430 |
| Median Family Income | 1,912 | $139,884 |
| Mean Family Income | 1,912 | $152,926 |
| Median Household Income | 2,761 | $109,657 |
| Mean Household Income | 2,761 | $127,642 |
| Income Deficit | 1,912 | $0 |
| Wage / Income Gap (%) | 7,528 | 28.36% |
| Wage / Income Gap ($) | 7,528 | 71.64¢ per $1 |
| Gini / Inequality Index | 7,528 | 0.37 |
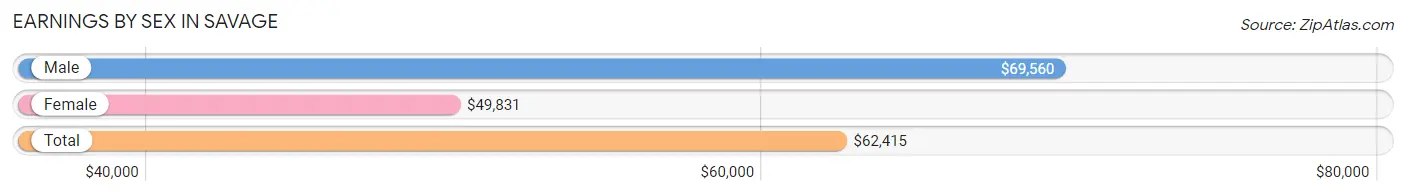
Earnings by Sex in Savage
Average Earnings in Savage are $62,415, $69,560 for men and $49,831 for women, a difference of 28.4%.
| Sex | Number | Average Earnings |
| Male | 2,532 (57.2%) | $69,560 |
| Female | 1,893 (42.8%) | $49,831 |
| Total | 4,425 (100.0%) | $62,415 |
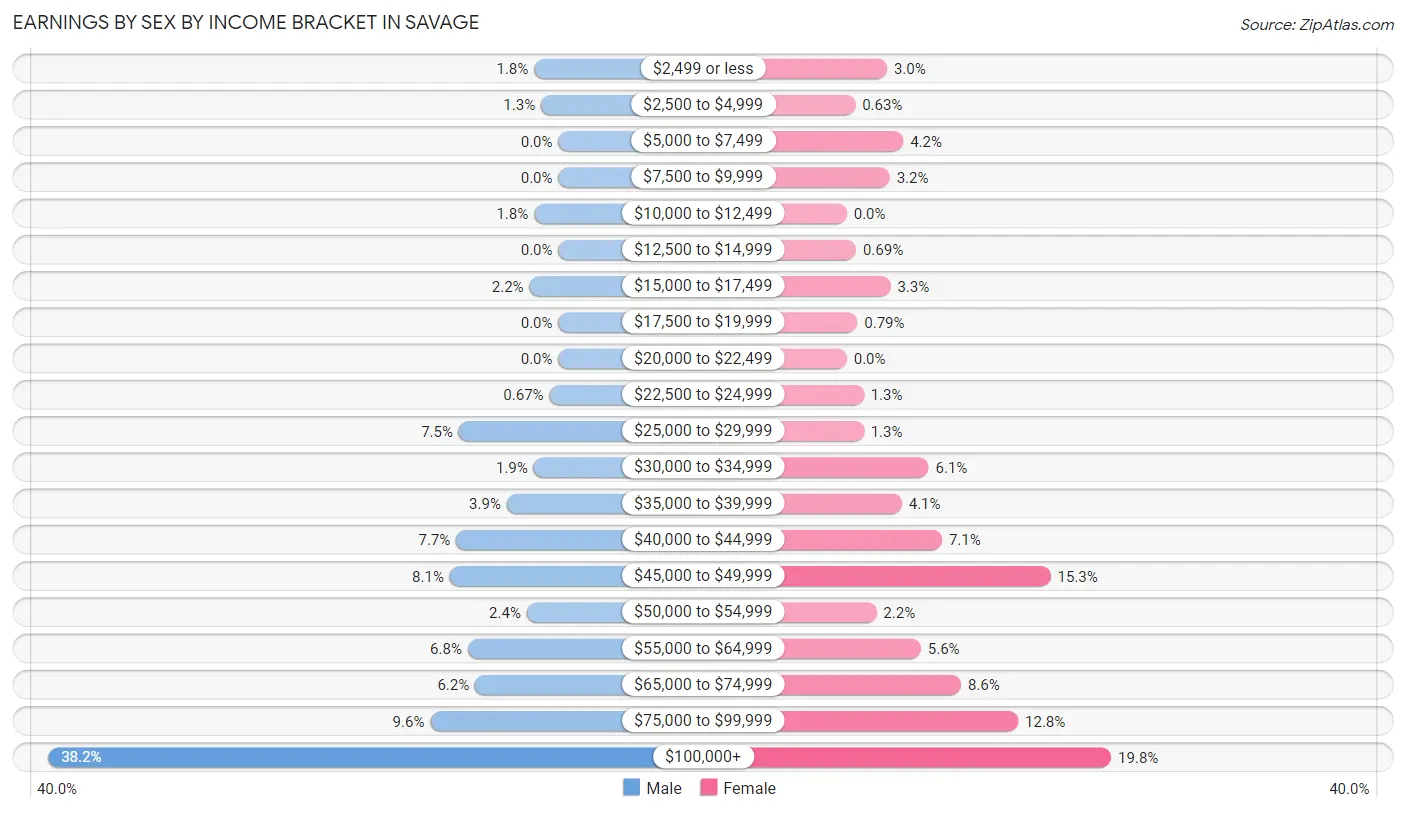
Earnings by Sex by Income Bracket in Savage
The most common earnings brackets in Savage are $100,000+ for men (968 | 38.2%) and $100,000+ for women (375 | 19.8%).
| Income | Male | Female |
| $2,499 or less | 46 (1.8%) | 57 (3.0%) |
| $2,500 to $4,999 | 33 (1.3%) | 12 (0.6%) |
| $5,000 to $7,499 | 0 (0.0%) | 80 (4.2%) |
| $7,500 to $9,999 | 0 (0.0%) | 61 (3.2%) |
| $10,000 to $12,499 | 46 (1.8%) | 0 (0.0%) |
| $12,500 to $14,999 | 0 (0.0%) | 13 (0.7%) |
| $15,000 to $17,499 | 55 (2.2%) | 62 (3.3%) |
| $17,500 to $19,999 | 0 (0.0%) | 15 (0.8%) |
| $20,000 to $22,499 | 0 (0.0%) | 0 (0.0%) |
| $22,500 to $24,999 | 17 (0.7%) | 24 (1.3%) |
| $25,000 to $29,999 | 189 (7.5%) | 24 (1.3%) |
| $30,000 to $34,999 | 47 (1.9%) | 116 (6.1%) |
| $35,000 to $39,999 | 98 (3.9%) | 78 (4.1%) |
| $40,000 to $44,999 | 194 (7.7%) | 135 (7.1%) |
| $45,000 to $49,999 | 206 (8.1%) | 289 (15.3%) |
| $50,000 to $54,999 | 60 (2.4%) | 42 (2.2%) |
| $55,000 to $64,999 | 172 (6.8%) | 105 (5.6%) |
| $65,000 to $74,999 | 158 (6.2%) | 162 (8.6%) |
| $75,000 to $99,999 | 243 (9.6%) | 243 (12.8%) |
| $100,000+ | 968 (38.2%) | 375 (19.8%) |
| Total | 2,532 (100.0%) | 1,893 (100.0%) |
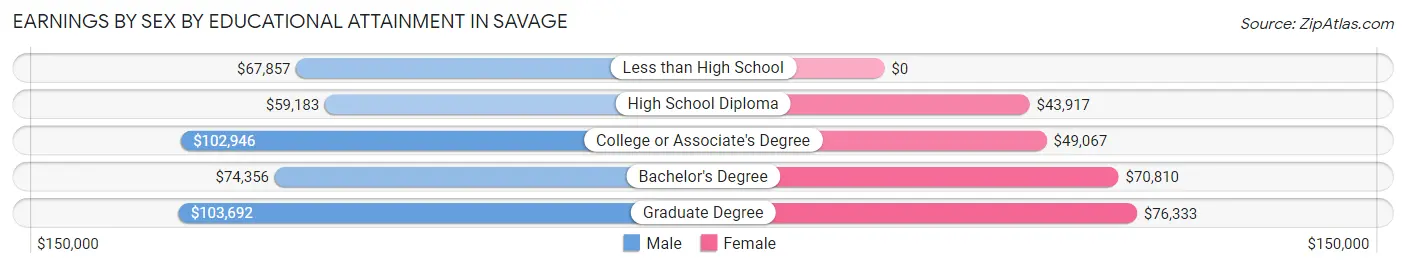
Earnings by Sex by Educational Attainment in Savage
Average earnings in Savage are $74,318 for men and $55,000 for women, a difference of 26.0%. Men with an educational attainment of graduate degree enjoy the highest average annual earnings of $103,692, while those with high school diploma education earn the least with $59,183. Women with an educational attainment of graduate degree earn the most with the average annual earnings of $76,333, while those with high school diploma education have the smallest earnings of $43,917.
| Educational Attainment | Male Income | Female Income |
| Less than High School | $67,857 | $0 |
| High School Diploma | $59,183 | $43,917 |
| College or Associate's Degree | $102,946 | $49,067 |
| Bachelor's Degree | $74,356 | $70,810 |
| Graduate Degree | $103,692 | $76,333 |
| Total | $74,318 | $55,000 |
Family Income in Savage
Family Income Brackets in Savage
According to the Savage family income data, there are 455 families falling into the $200,000+ income range, which is the most common income bracket and makes up 23.8% of all families.
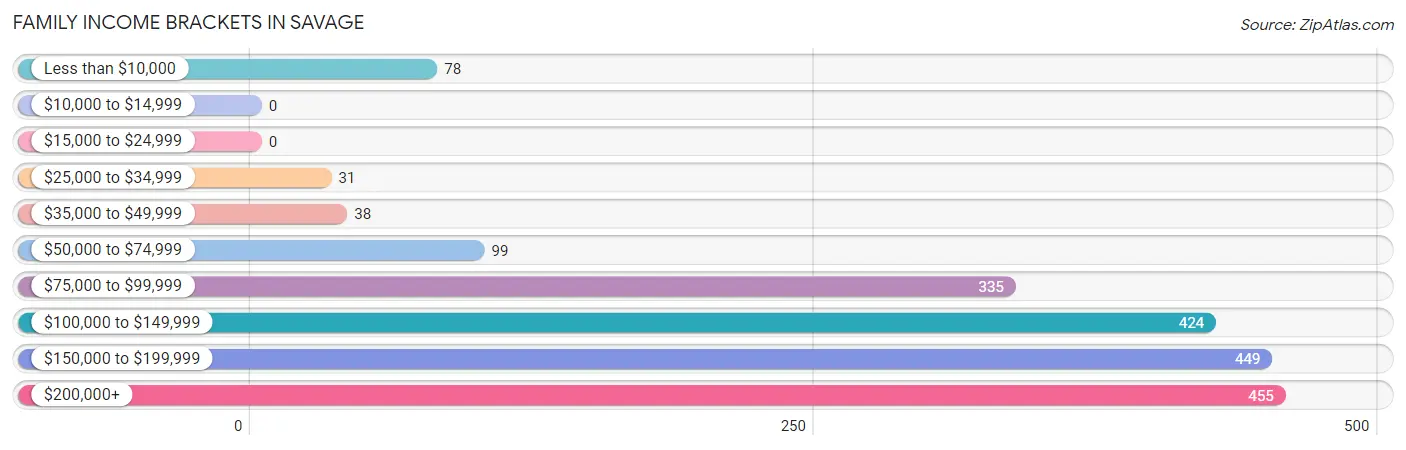
| Income Bracket | # Families | % Families |
| Less than $10,000 | 78 | 4.1% |
| $10,000 to $14,999 | 0 | 0.0% |
| $15,000 to $24,999 | 0 | 0.0% |
| $25,000 to $34,999 | 31 | 1.6% |
| $35,000 to $49,999 | 38 | 2.0% |
| $50,000 to $74,999 | 99 | 5.2% |
| $75,000 to $99,999 | 335 | 17.5% |
| $100,000 to $149,999 | 424 | 22.2% |
| $150,000 to $199,999 | 449 | 23.5% |
| $200,000+ | 455 | 23.8% |
Family Income by Famaliy Size in Savage
4-person families (453 | 23.7%) account for the highest median family income in Savage with $162,902 per family, while 2-person families (766 | 40.1%) have the highest median income of $54,153 per family member.
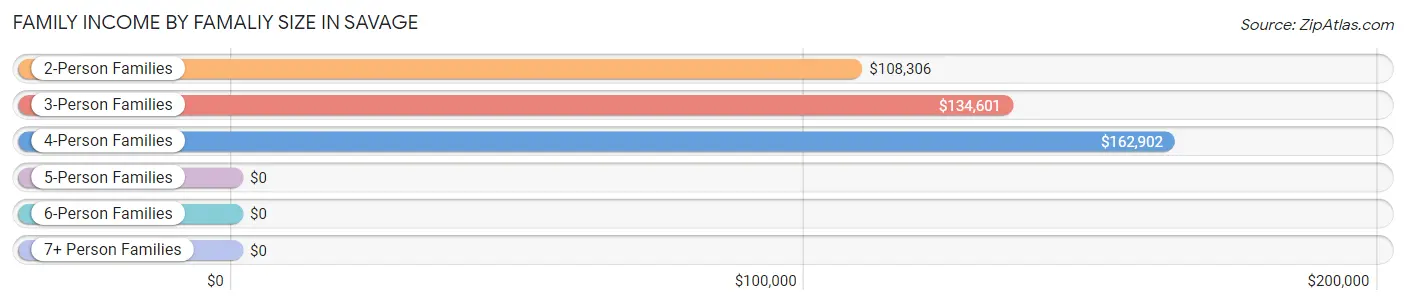
| Income Bracket | # Families | Median Income |
| 2-Person Families | 766 (40.1%) | $108,306 |
| 3-Person Families | 421 (22.0%) | $134,601 |
| 4-Person Families | 453 (23.7%) | $162,902 |
| 5-Person Families | 161 (8.4%) | $0 |
| 6-Person Families | 27 (1.4%) | $0 |
| 7+ Person Families | 84 (4.4%) | $0 |
| Total | 1,912 (100.0%) | $139,884 |
Family Income by Number of Earners in Savage
The median family income in Savage is $139,884, with families comprising 3+ earners (287) having the highest median family income of $179,263, while families with no earners (123) have the lowest median family income of $2,499, accounting for 15.0% and 6.4% of families, respectively.
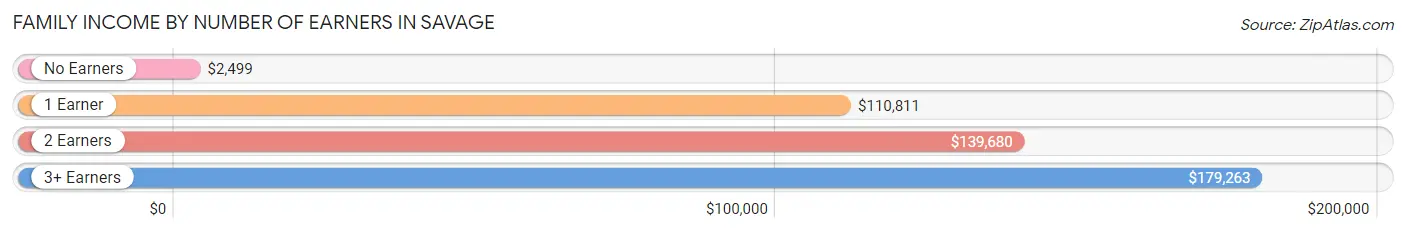
| Number of Earners | # Families | Median Income |
| No Earners | 123 (6.4%) | $2,499 |
| 1 Earner | 403 (21.1%) | $110,811 |
| 2 Earners | 1,099 (57.5%) | $139,680 |
| 3+ Earners | 287 (15.0%) | $179,263 |
| Total | 1,912 (100.0%) | $139,884 |
Household Income in Savage
Household Income Brackets in Savage
With 530 households falling in the category, the $75,000 to $99,999 income range is the most frequent in Savage, accounting for 19.2% of all households. In contrast, only 66 households (2.4%) fall into the less than $10,000 income bracket, making it the least populous group.
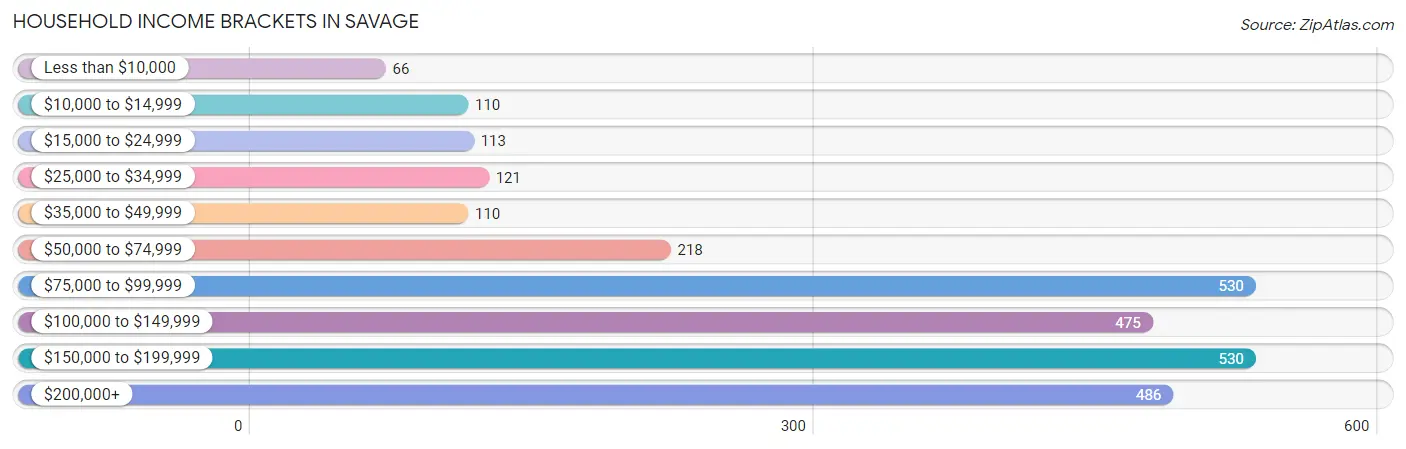
| Income Bracket | # Households | % Households |
| Less than $10,000 | 66 | 2.4% |
| $10,000 to $14,999 | 110 | 4.0% |
| $15,000 to $24,999 | 113 | 4.1% |
| $25,000 to $34,999 | 121 | 4.4% |
| $35,000 to $49,999 | 110 | 4.0% |
| $50,000 to $74,999 | 218 | 7.9% |
| $75,000 to $99,999 | 530 | 19.2% |
| $100,000 to $149,999 | 475 | 17.2% |
| $150,000 to $199,999 | 530 | 19.2% |
| $200,000+ | 486 | 17.6% |
Household Income by Householder Age in Savage
The median household income in Savage is $109,657, with the highest median household income of $132,795 found in the 25 to 44 years age bracket for the primary householder. A total of 1,177 households (42.6%) fall into this category. Meanwhile, the 15 to 24 years age bracket for the primary householder has the lowest median household income of $0, with 58 households (2.1%) in this group.
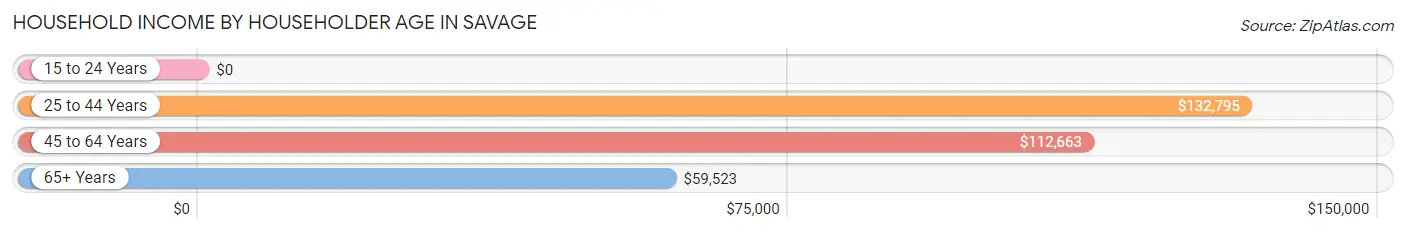
| Income Bracket | # Households | Median Income |
| 15 to 24 Years | 58 (2.1%) | $0 |
| 25 to 44 Years | 1,177 (42.6%) | $132,795 |
| 45 to 64 Years | 1,139 (41.2%) | $112,663 |
| 65+ Years | 387 (14.0%) | $59,523 |
| Total | 2,761 (100.0%) | $109,657 |
Poverty in Savage
Income Below Poverty by Sex and Age in Savage
With 9.3% poverty level for males and 5.2% for females among the residents of Savage, 12 to 14 year old males and 75 year old and over females are the most vulnerable to poverty, with 101 males (41.7%) and 44 females (25.4%) in their respective age groups living below the poverty level.
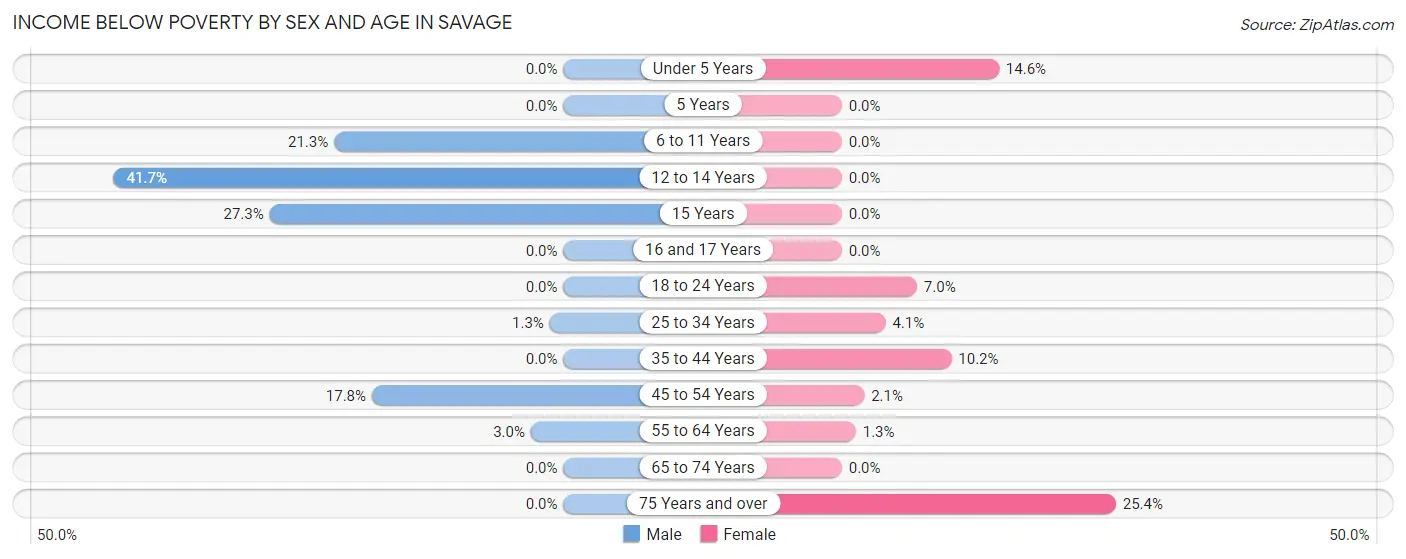
| Age Bracket | Male | Female |
| Under 5 Years | 0 (0.0%) | 14 (14.6%) |
| 5 Years | 0 (0.0%) | 0 (0.0%) |
| 6 to 11 Years | 120 (21.3%) | 0 (0.0%) |
| 12 to 14 Years | 101 (41.7%) | 0 (0.0%) |
| 15 Years | 21 (27.3%) | 0 (0.0%) |
| 16 and 17 Years | 0 (0.0%) | 0 (0.0%) |
| 18 to 24 Years | 0 (0.0%) | 14 (7.0%) |
| 25 to 34 Years | 11 (1.3%) | 13 (4.1%) |
| 35 to 44 Years | 0 (0.0%) | 79 (10.2%) |
| 45 to 54 Years | 113 (17.8%) | 8 (2.1%) |
| 55 to 64 Years | 13 (3.0%) | 6 (1.3%) |
| 65 to 74 Years | 0 (0.0%) | 0 (0.0%) |
| 75 Years and over | 0 (0.0%) | 44 (25.4%) |
| Total | 379 (9.3%) | 178 (5.2%) |
Income Above Poverty by Sex and Age in Savage
According to the poverty statistics in Savage, males aged under 5 years and females aged 5 years are the age groups that are most secure financially, with 100.0% of males and 100.0% of females in these age groups living above the poverty line.
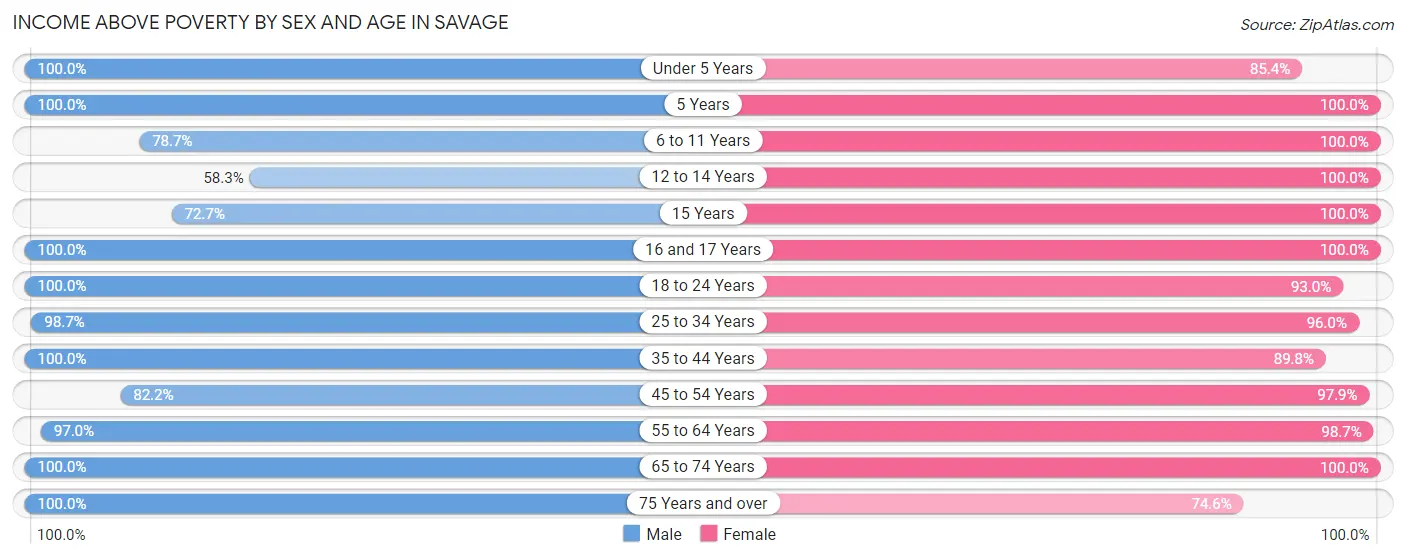
| Age Bracket | Male | Female |
| Under 5 Years | 151 (100.0%) | 82 (85.4%) |
| 5 Years | 44 (100.0%) | 58 (100.0%) |
| 6 to 11 Years | 444 (78.7%) | 216 (100.0%) |
| 12 to 14 Years | 141 (58.3%) | 197 (100.0%) |
| 15 Years | 56 (72.7%) | 44 (100.0%) |
| 16 and 17 Years | 60 (100.0%) | 164 (100.0%) |
| 18 to 24 Years | 88 (100.0%) | 187 (93.0%) |
| 25 to 34 Years | 858 (98.7%) | 308 (96.0%) |
| 35 to 44 Years | 754 (100.0%) | 698 (89.8%) |
| 45 to 54 Years | 523 (82.2%) | 377 (97.9%) |
| 55 to 64 Years | 418 (97.0%) | 457 (98.7%) |
| 65 to 74 Years | 84 (100.0%) | 356 (100.0%) |
| 75 Years and over | 67 (100.0%) | 129 (74.6%) |
| Total | 3,688 (90.7%) | 3,273 (94.8%) |
Income Below Poverty Among Married-Couple Families in Savage
The poverty statistics for married-couple families in Savage show that 4.5% or 65 of the total 1,454 families live below the poverty line. Families with 1 or 2 children have the highest poverty rate of 8.4%, comprising of 65 families. On the other hand, families with no children have the lowest poverty rate of 0.0%, which includes 0 families.
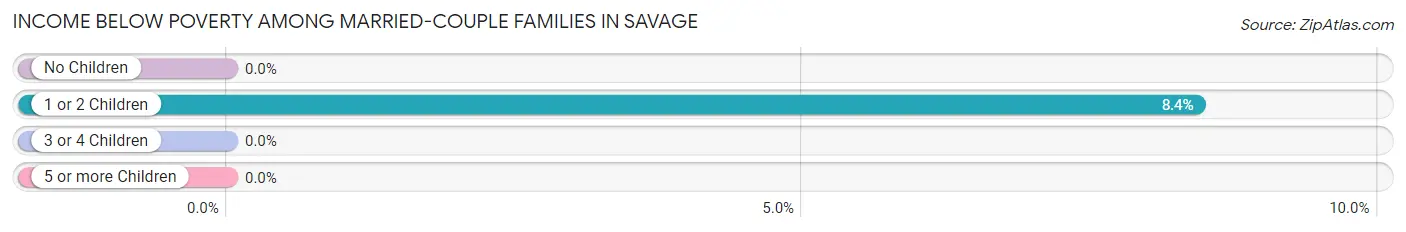
| Children | Above Poverty | Below Poverty |
| No Children | 527 (100.0%) | 0 (0.0%) |
| 1 or 2 Children | 707 (91.6%) | 65 (8.4%) |
| 3 or 4 Children | 112 (100.0%) | 0 (0.0%) |
| 5 or more Children | 43 (100.0%) | 0 (0.0%) |
| Total | 1,389 (95.5%) | 65 (4.5%) |
Income Below Poverty Among Single-Parent Households in Savage
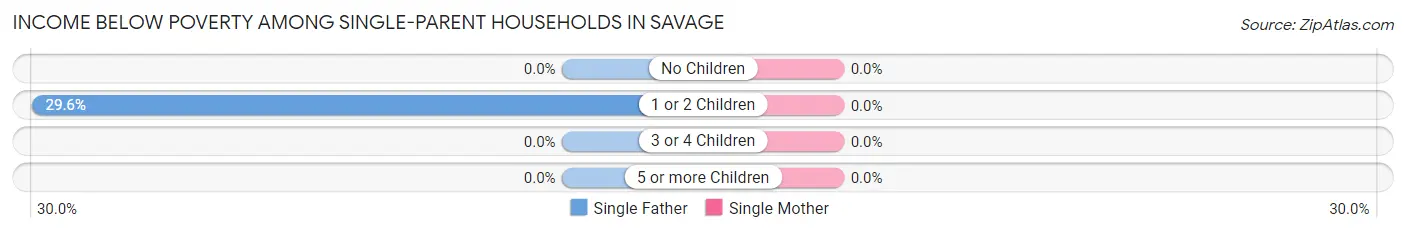
| Children | Single Father | Single Mother |
| No Children | 0 (0.0%) | 0 (0.0%) |
| 1 or 2 Children | 13 (29.5%) | 0 (0.0%) |
| 3 or 4 Children | 0 (0.0%) | 0 (0.0%) |
| 5 or more Children | 0 (0.0%) | 0 (0.0%) |
| Total | 13 (10.2%) | 0 (0.0%) |
Income Below Poverty Among Married-Couple vs Single-Parent Households in Savage
The poverty data for Savage shows that 65 of the married-couple family households (4.5%) and 13 of the single-parent households (2.8%) are living below the poverty level. Within the married-couple family households, those with 1 or 2 children have the highest poverty rate, with 65 households (8.4%) falling below the poverty line. Among the single-parent households, those with 1 or 2 children have the highest poverty rate, with 13 household (11.3%) living below poverty.
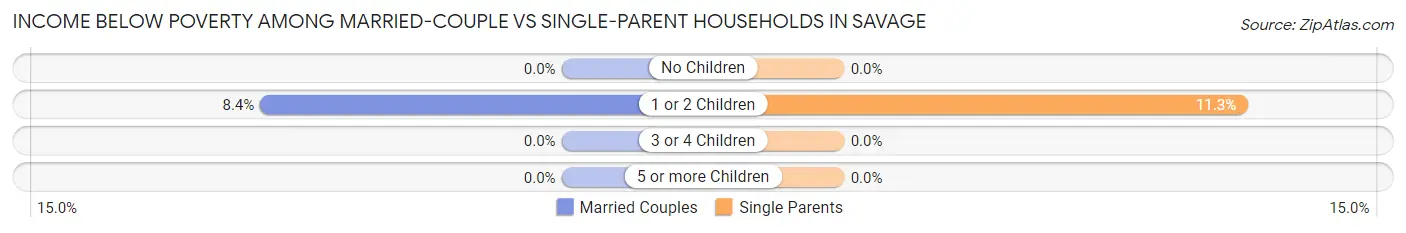
| Children | Married-Couple Families | Single-Parent Households |
| No Children | 0 (0.0%) | 0 (0.0%) |
| 1 or 2 Children | 65 (8.4%) | 13 (11.3%) |
| 3 or 4 Children | 0 (0.0%) | 0 (0.0%) |
| 5 or more Children | 0 (0.0%) | 0 (0.0%) |
| Total | 65 (4.5%) | 13 (2.8%) |
Race in Savage
The most populous races in Savage are White / Caucasian (3,613 | 48.0%), Black / African American (2,357 | 31.3%), and Hispanic or Latino (1,038 | 13.8%).
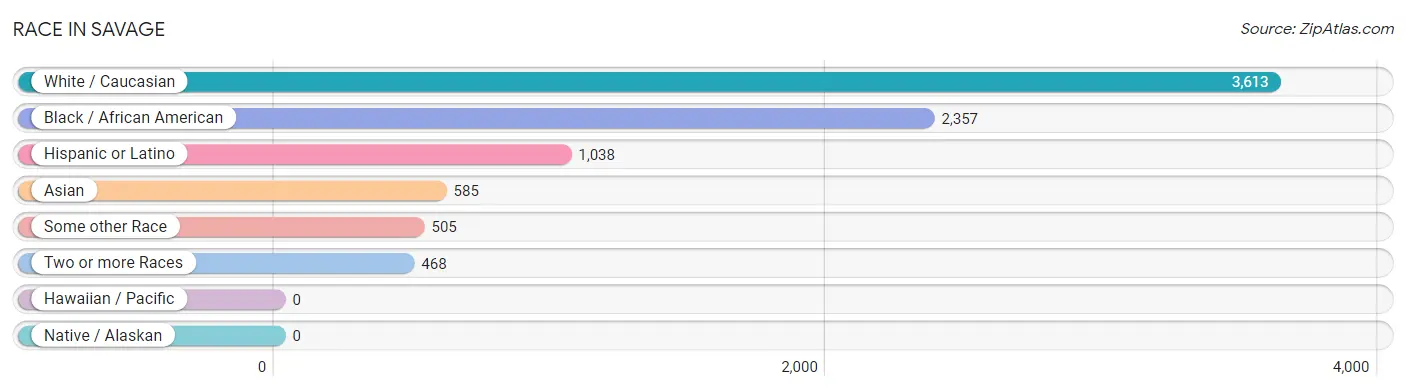
| Race | # Population | % Population |
| Asian | 585 | 7.8% |
| Black / African American | 2,357 | 31.3% |
| Hawaiian / Pacific | 0 | 0.0% |
| Hispanic or Latino | 1,038 | 13.8% |
| Native / Alaskan | 0 | 0.0% |
| White / Caucasian | 3,613 | 48.0% |
| Two or more Races | 468 | 6.2% |
| Some other Race | 505 | 6.7% |
| Total | 7,528 | 100.0% |
Ancestry in Savage
The most populous ancestries reported in Savage are Irish (1,059 | 14.1%), English (942 | 12.5%), German (936 | 12.4%), Mexican (475 | 6.3%), and Italian (251 | 3.3%), together accounting for 48.6% of all Savage residents.
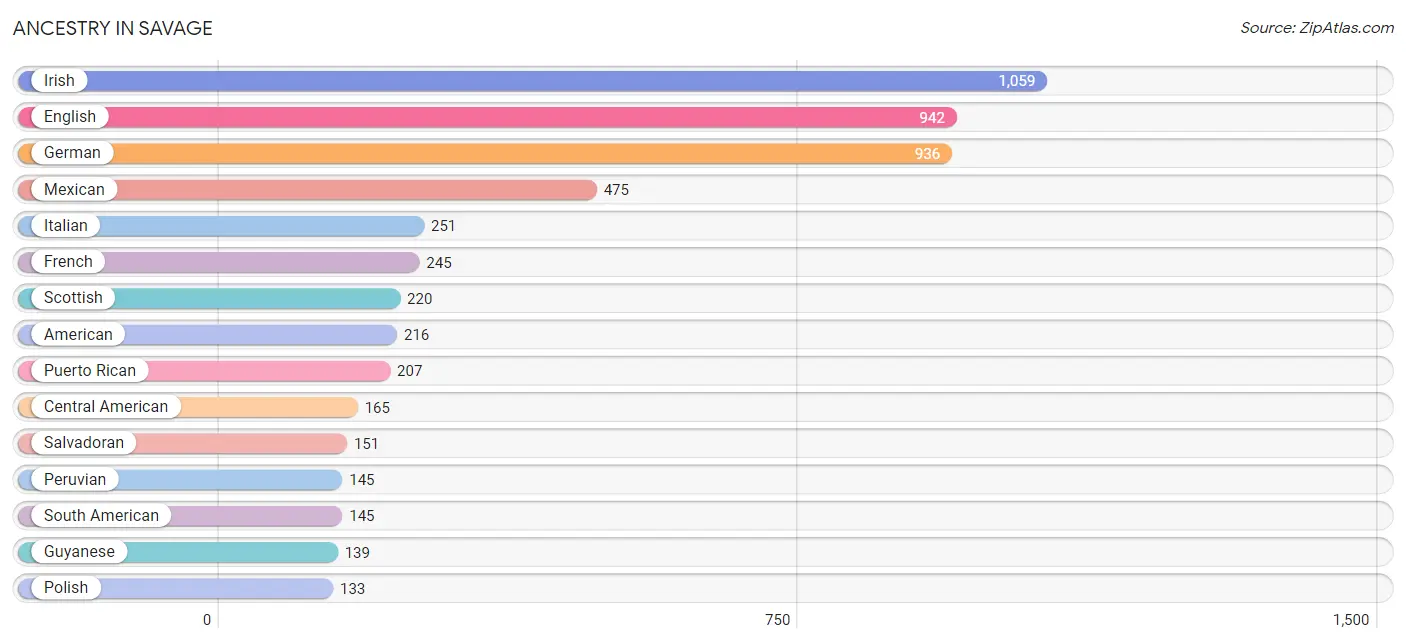
| Ancestry | # Population | % Population |
| African | 17 | 0.2% |
| American | 216 | 2.9% |
| Arab | 39 | 0.5% |
| Austrian | 17 | 0.2% |
| Bhutanese | 21 | 0.3% |
| British | 45 | 0.6% |
| Burmese | 33 | 0.4% |
| Central American | 165 | 2.2% |
| Central American Indian | 40 | 0.5% |
| Cherokee | 29 | 0.4% |
| Czech | 30 | 0.4% |
| Danish | 29 | 0.4% |
| Dominican | 6 | 0.1% |
| Dutch | 87 | 1.2% |
| Eastern European | 9 | 0.1% |
| English | 942 | 12.5% |
| European | 74 | 1.0% |
| French | 245 | 3.3% |
| French Canadian | 16 | 0.2% |
| German | 936 | 12.4% |
| Greek | 30 | 0.4% |
| Guyanese | 139 | 1.8% |
| Honduran | 14 | 0.2% |
| Indian (Asian) | 17 | 0.2% |
| Indonesian | 106 | 1.4% |
| Irish | 1,059 | 14.1% |
| Italian | 251 | 3.3% |
| Korean | 82 | 1.1% |
| Latvian | 17 | 0.2% |
| Lithuanian | 16 | 0.2% |
| Mexican | 475 | 6.3% |
| Norwegian | 16 | 0.2% |
| Peruvian | 145 | 1.9% |
| Polish | 133 | 1.8% |
| Puerto Rican | 207 | 2.8% |
| Salvadoran | 151 | 2.0% |
| Scotch-Irish | 104 | 1.4% |
| Scottish | 220 | 2.9% |
| Sierra Leonean | 25 | 0.3% |
| Slovak | 35 | 0.5% |
| South American | 145 | 1.9% |
| Sri Lankan | 44 | 0.6% |
| Subsaharan African | 42 | 0.6% |
| Swiss | 62 | 0.8% |
| Thai | 39 | 0.5% |
| Turkish | 32 | 0.4% |
| Ukrainian | 31 | 0.4% | View All 47 Rows |
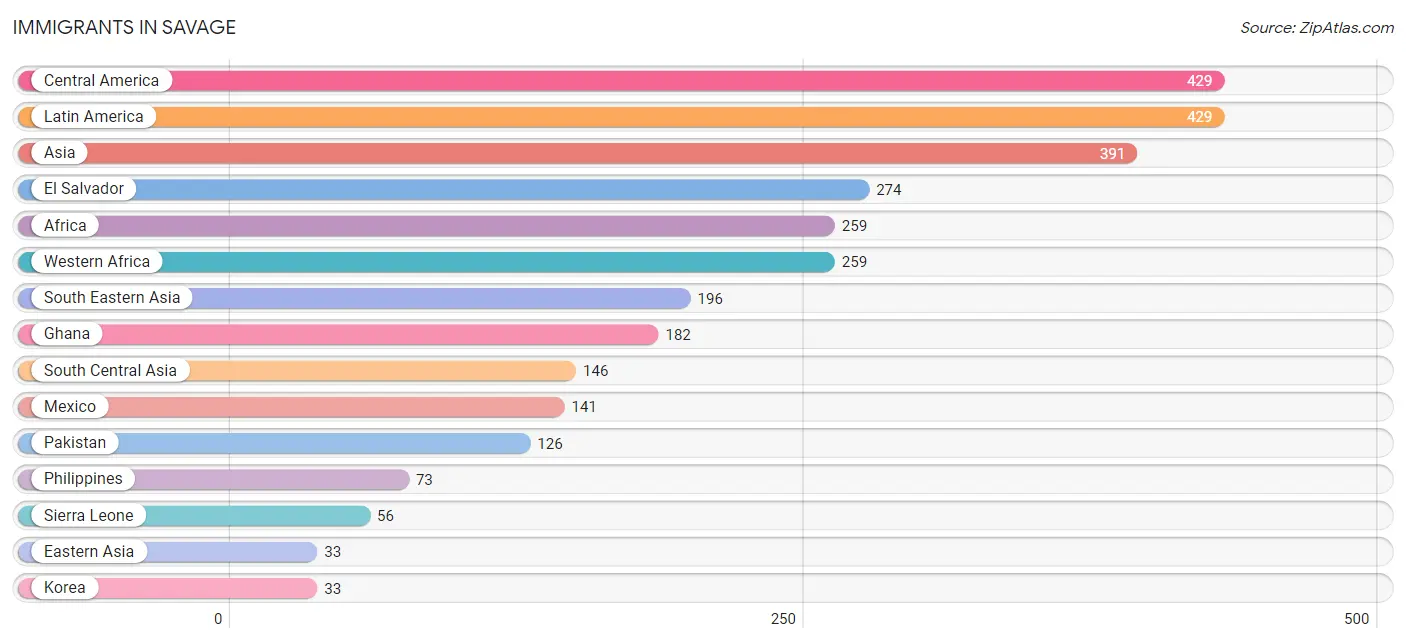
Immigrants in Savage
The most numerous immigrant groups reported in Savage came from Central America (429 | 5.7%), Latin America (429 | 5.7%), Asia (391 | 5.2%), El Salvador (274 | 3.6%), and Africa (259 | 3.4%), together accounting for 23.7% of all Savage residents.
| Immigration Origin | # Population | % Population |
| Africa | 259 | 3.4% |
| Asia | 391 | 5.2% |
| Central America | 429 | 5.7% |
| Denmark | 14 | 0.2% |
| Eastern Asia | 33 | 0.4% |
| El Salvador | 274 | 3.6% |
| Europe | 14 | 0.2% |
| Ghana | 182 | 2.4% |
| Honduras | 14 | 0.2% |
| India | 10 | 0.1% |
| Korea | 33 | 0.4% |
| Latin America | 429 | 5.7% |
| Mexico | 141 | 1.9% |
| Nigeria | 21 | 0.3% |
| Northern Europe | 14 | 0.2% |
| Pakistan | 126 | 1.7% |
| Philippines | 73 | 1.0% |
| Sierra Leone | 56 | 0.7% |
| South Central Asia | 146 | 1.9% |
| South Eastern Asia | 196 | 2.6% |
| Sri Lanka | 10 | 0.1% |
| Turkey | 16 | 0.2% |
| Vietnam | 17 | 0.2% |
| Western Africa | 259 | 3.4% |
| Western Asia | 16 | 0.2% | View All 25 Rows |
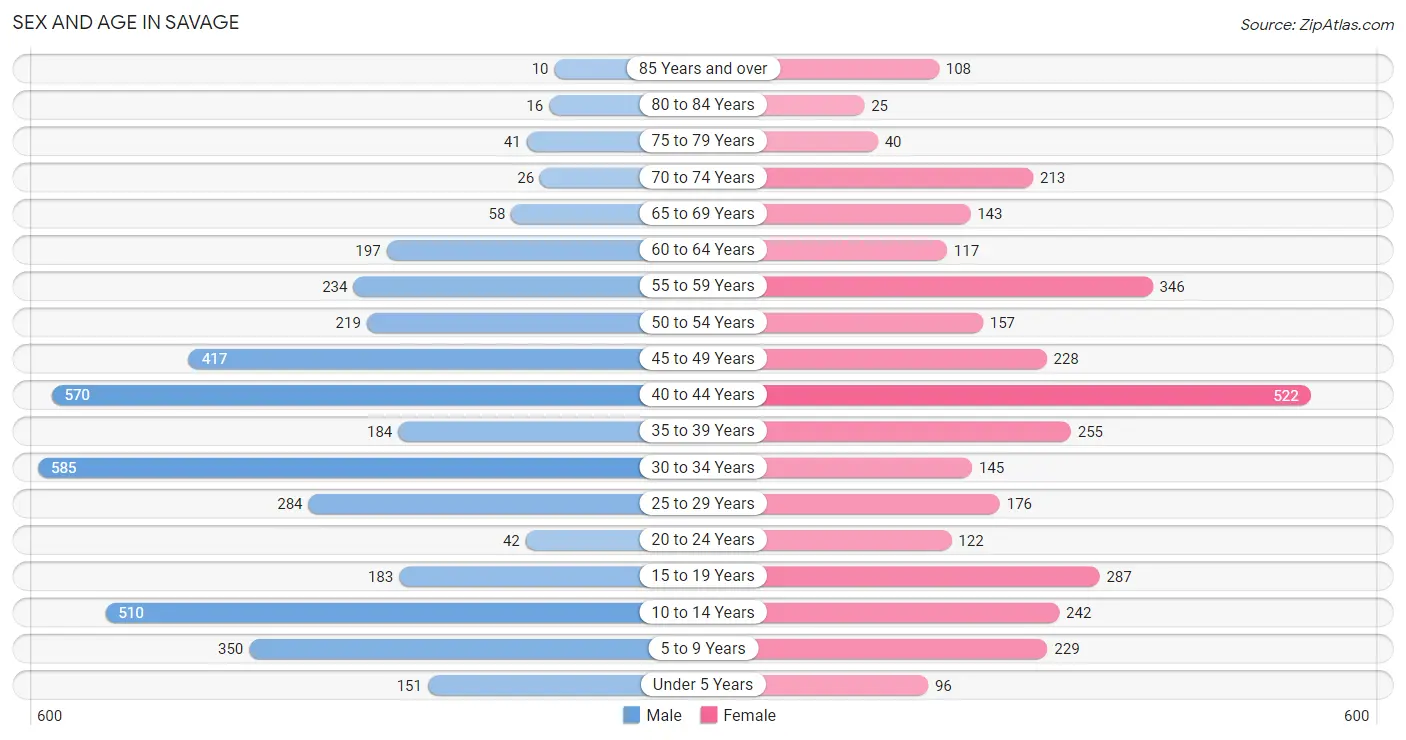
Sex and Age in Savage
Sex and Age in Savage
The most populous age groups in Savage are 30 to 34 Years (585 | 14.3%) for men and 40 to 44 Years (522 | 15.1%) for women.
| Age Bracket | Male | Female |
| Under 5 Years | 151 (3.7%) | 96 (2.8%) |
| 5 to 9 Years | 350 (8.6%) | 229 (6.6%) |
| 10 to 14 Years | 510 (12.5%) | 242 (7.0%) |
| 15 to 19 Years | 183 (4.5%) | 287 (8.3%) |
| 20 to 24 Years | 42 (1.0%) | 122 (3.5%) |
| 25 to 29 Years | 284 (7.0%) | 176 (5.1%) |
| 30 to 34 Years | 585 (14.3%) | 145 (4.2%) |
| 35 to 39 Years | 184 (4.5%) | 255 (7.4%) |
| 40 to 44 Years | 570 (14.0%) | 522 (15.1%) |
| 45 to 49 Years | 417 (10.2%) | 228 (6.6%) |
| 50 to 54 Years | 219 (5.4%) | 157 (4.5%) |
| 55 to 59 Years | 234 (5.7%) | 346 (10.0%) |
| 60 to 64 Years | 197 (4.8%) | 117 (3.4%) |
| 65 to 69 Years | 58 (1.4%) | 143 (4.1%) |
| 70 to 74 Years | 26 (0.6%) | 213 (6.2%) |
| 75 to 79 Years | 41 (1.0%) | 40 (1.2%) |
| 80 to 84 Years | 16 (0.4%) | 25 (0.7%) |
| 85 Years and over | 10 (0.3%) | 108 (3.1%) |
| Total | 4,077 (100.0%) | 3,451 (100.0%) |
Families and Households in Savage
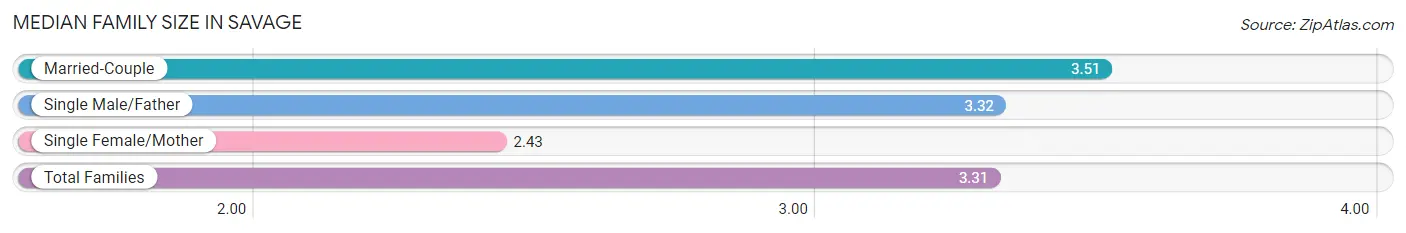
Median Family Size in Savage
The median family size in Savage is 3.31 persons per family, with married-couple families (1,454 | 76.0%) accounting for the largest median family size of 3.51 persons per family. On the other hand, single female/mother families (330 | 17.3%) represent the smallest median family size with 2.43 persons per family.
| Family Type | # Families | Family Size |
| Married-Couple | 1,454 (76.0%) | 3.51 |
| Single Male/Father | 128 (6.7%) | 3.32 |
| Single Female/Mother | 330 (17.3%) | 2.43 |
| Total Families | 1,912 (100.0%) | 3.31 |
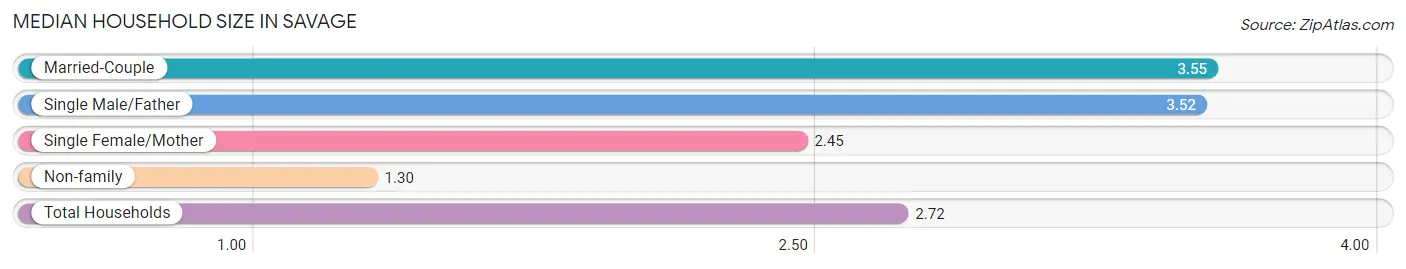
Median Household Size in Savage
The median household size in Savage is 2.72 persons per household, with married-couple households (1,454 | 52.7%) accounting for the largest median household size of 3.55 persons per household. non-family households (849 | 30.7%) represent the smallest median household size with 1.30 persons per household.
| Household Type | # Households | Household Size |
| Married-Couple | 1,454 (52.7%) | 3.55 |
| Single Male/Father | 128 (4.6%) | 3.52 |
| Single Female/Mother | 330 (11.9%) | 2.45 |
| Non-family | 849 (30.7%) | 1.30 |
| Total Households | 2,761 (100.0%) | 2.72 |
Household Size by Marriage Status in Savage
Out of a total of 2,761 households in Savage, 1,912 (69.3%) are family households, while 849 (30.7%) are nonfamily households. The most numerous type of family households are 2-person households, comprising 730, and the most common type of nonfamily households are 1-person households, comprising 706.
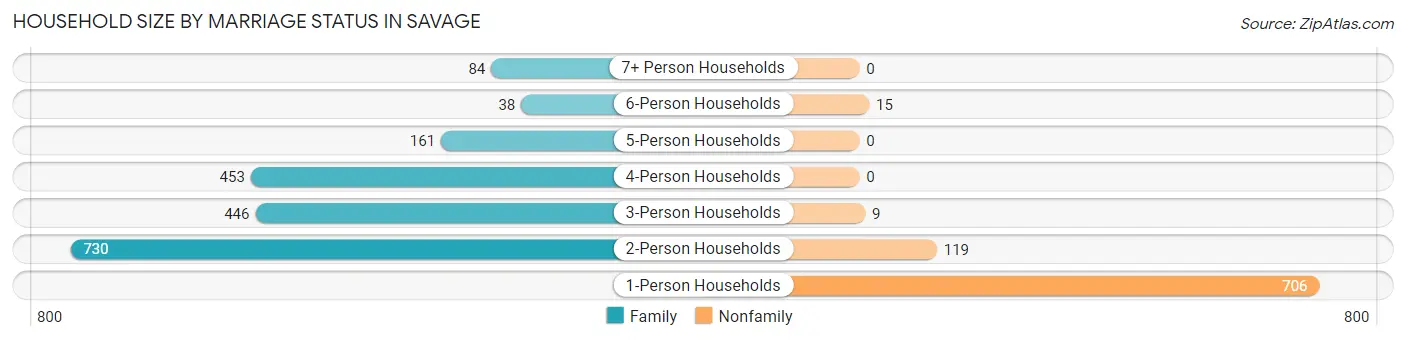
| Household Size | Family Households | Nonfamily Households |
| 1-Person Households | - | 706 (25.6%) |
| 2-Person Households | 730 (26.4%) | 119 (4.3%) |
| 3-Person Households | 446 (16.2%) | 9 (0.3%) |
| 4-Person Households | 453 (16.4%) | 0 (0.0%) |
| 5-Person Households | 161 (5.8%) | 0 (0.0%) |
| 6-Person Households | 38 (1.4%) | 15 (0.5%) |
| 7+ Person Households | 84 (3.0%) | 0 (0.0%) |
| Total | 1,912 (69.3%) | 849 (30.7%) |
Female Fertility in Savage
Fertility by Age in Savage
Average fertility rate in Savage is 35.0 births per 1,000 women. Women in the age bracket of 20 to 34 years have the highest fertility rate with 138.0 births per 1,000 women. Women in the age bracket of 20 to 34 years acount for 100.0% of all women with births.
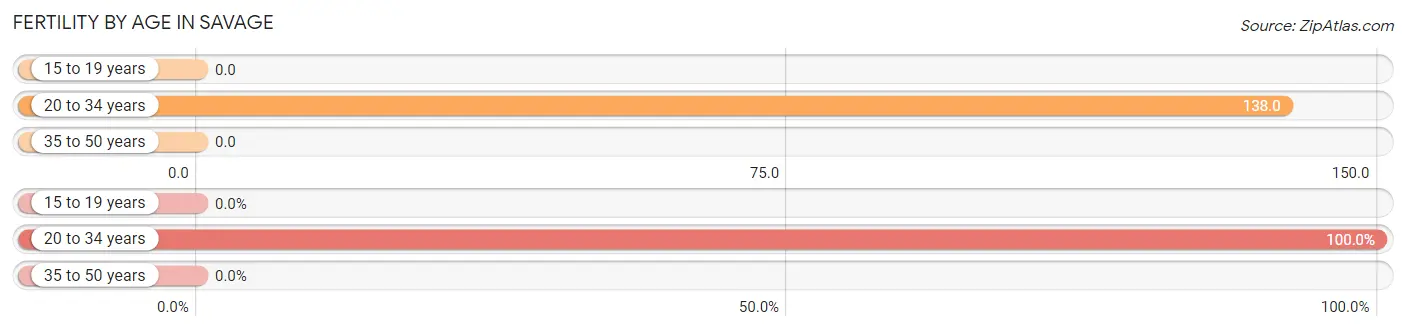
| Age Bracket | Women with Births | Births / 1,000 Women |
| 15 to 19 years | 0 (0.0%) | 0.0 |
| 20 to 34 years | 61 (100.0%) | 138.0 |
| 35 to 50 years | 0 (0.0%) | 0.0 |
| Total | 61 (100.0%) | 35.0 |
Fertility by Age by Marriage Status in Savage
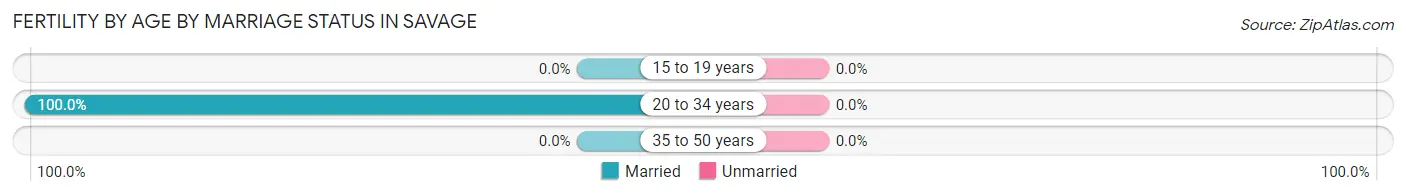
| Age Bracket | Married | Unmarried |
| 15 to 19 years | 0 (0.0%) | 0 (0.0%) |
| 20 to 34 years | 61 (100.0%) | 0 (0.0%) |
| 35 to 50 years | 0 (0.0%) | 0 (0.0%) |
| Total | 61 (100.0%) | 0 (0.0%) |
Fertility by Education in Savage
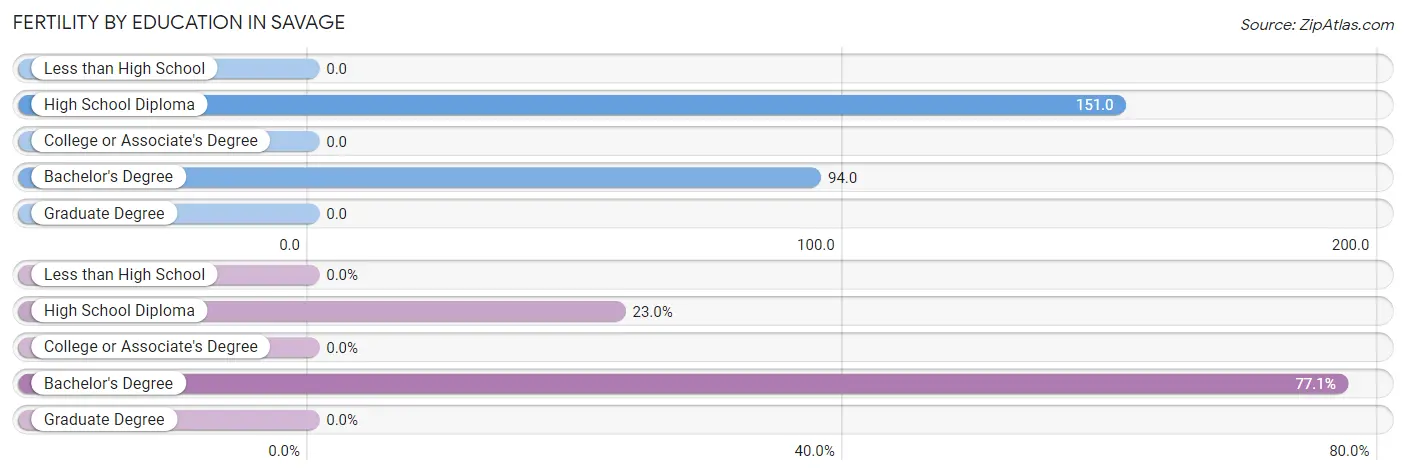
| Educational Attainment | Women with Births | Births / 1,000 Women |
| Less than High School | 0 (0.0%) | 0.0 |
| High School Diploma | 14 (23.0%) | 151.0 |
| College or Associate's Degree | 0 (0.0%) | 0.0 |
| Bachelor's Degree | 47 (77.0%) | 94.0 |
| Graduate Degree | 0 (0.0%) | 0.0 |
| Total | 61 (100.0%) | 35.0 |
Fertility by Education by Marriage Status in Savage
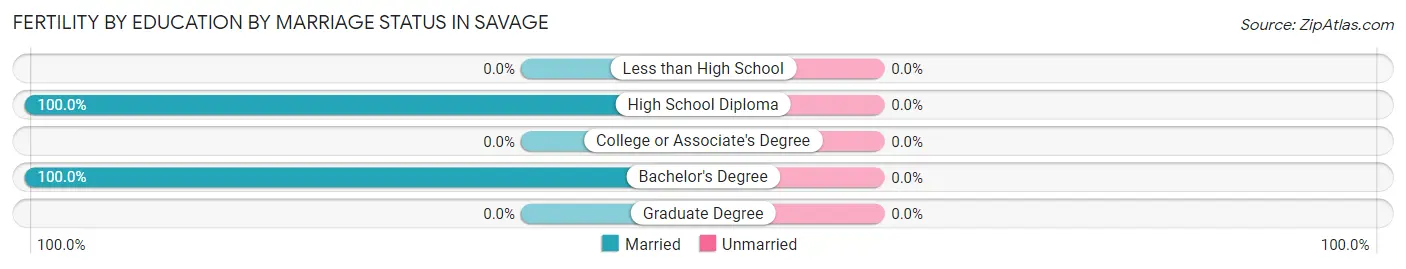
| Educational Attainment | Married | Unmarried |
| Less than High School | 0 (0.0%) | 0 (0.0%) |
| High School Diploma | 14 (100.0%) | 0 (0.0%) |
| College or Associate's Degree | 0 (0.0%) | 0 (0.0%) |
| Bachelor's Degree | 47 (100.0%) | 0 (0.0%) |
| Graduate Degree | 0 (0.0%) | 0 (0.0%) |
| Total | 61 (100.0%) | 0 (0.0%) |
Employment Characteristics in Savage
Employment by Class of Employer in Savage
Among the 4,265 employed individuals in Savage, private company employees (2,072 | 48.6%), federal government employees (790 | 18.5%), and not-for-profit organizations (571 | 13.4%) make up the most common classes of employment.
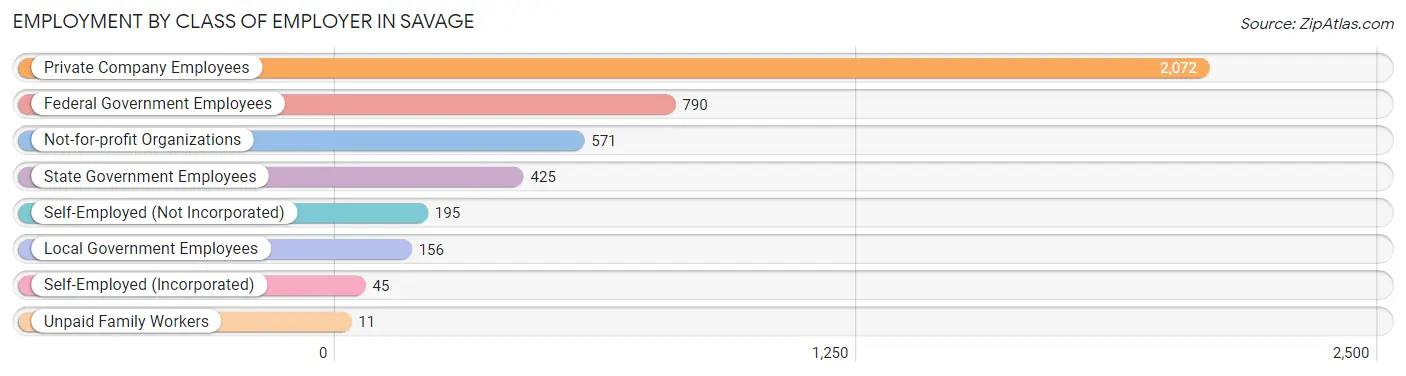
| Employer Class | # Employees | % Employees |
| Private Company Employees | 2,072 | 48.6% |
| Self-Employed (Incorporated) | 45 | 1.1% |
| Self-Employed (Not Incorporated) | 195 | 4.6% |
| Not-for-profit Organizations | 571 | 13.4% |
| Local Government Employees | 156 | 3.7% |
| State Government Employees | 425 | 10.0% |
| Federal Government Employees | 790 | 18.5% |
| Unpaid Family Workers | 11 | 0.3% |
| Total | 4,265 | 100.0% |
Employment Status by Age in Savage
According to the labor force statistics for Savage, out of the total population over 16 years of age (5,829), 77.8% or 4,535 individuals are in the labor force, with 4.9% or 222 of them unemployed. The age group with the highest labor force participation rate is 25 to 29 years, with 100.0% or 460 individuals in the labor force. Within the labor force, the 20 to 24 years age range has the highest percentage of unemployed individuals, with 42.9% or 43 of them being unemployed.
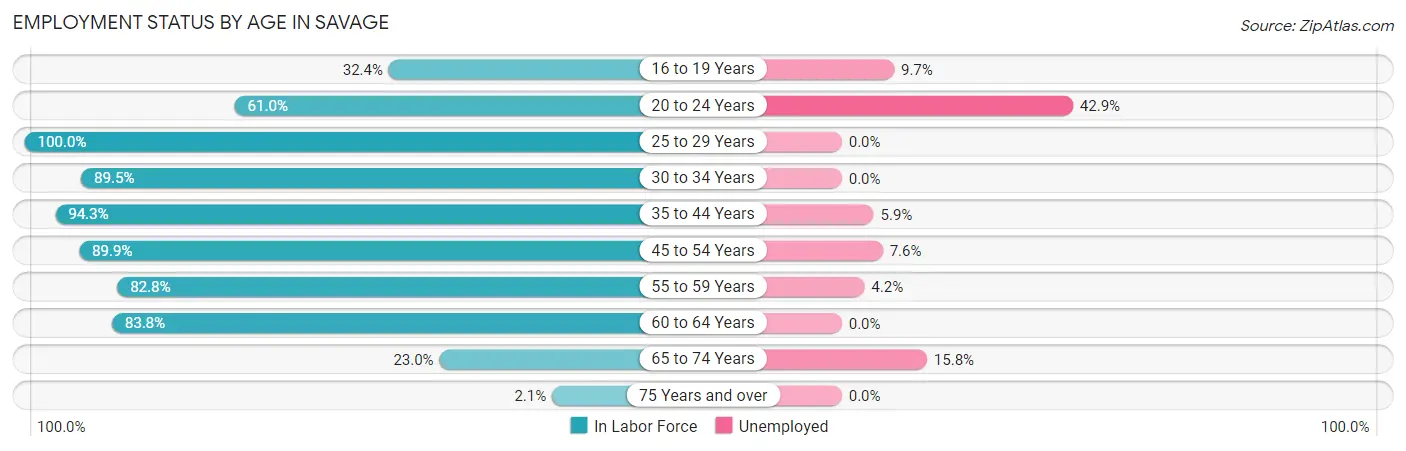
| Age Bracket | In Labor Force | Unemployed |
| 16 to 19 Years | 113 (32.4%) | 11 (9.7%) |
| 20 to 24 Years | 100 (61.0%) | 43 (42.9%) |
| 25 to 29 Years | 460 (100.0%) | 0 (0.0%) |
| 30 to 34 Years | 653 (89.5%) | 0 (0.0%) |
| 35 to 44 Years | 1,444 (94.3%) | 85 (5.9%) |
| 45 to 54 Years | 918 (89.9%) | 70 (7.6%) |
| 55 to 59 Years | 480 (82.8%) | 20 (4.2%) |
| 60 to 64 Years | 263 (83.8%) | 0 (0.0%) |
| 65 to 74 Years | 101 (23.0%) | 16 (15.8%) |
| 75 Years and over | 5 (2.1%) | 0 (0.0%) |
| Total | 4,535 (77.8%) | 222 (4.9%) |
Employment Status by Educational Attainment in Savage
According to labor force statistics for Savage, 91.0% of individuals (4,219) out of the total population between 25 and 64 years of age (4,636) are in the labor force, with 4.1% or 173 of them being unemployed. The group with the highest labor force participation rate are those with the educational attainment of bachelor's degree or higher, with 93.2% or 2,347 individuals in the labor force. Within the labor force, individuals with high school diploma education have the highest percentage of unemployment, with 8.8% or 64 of them being unemployed.
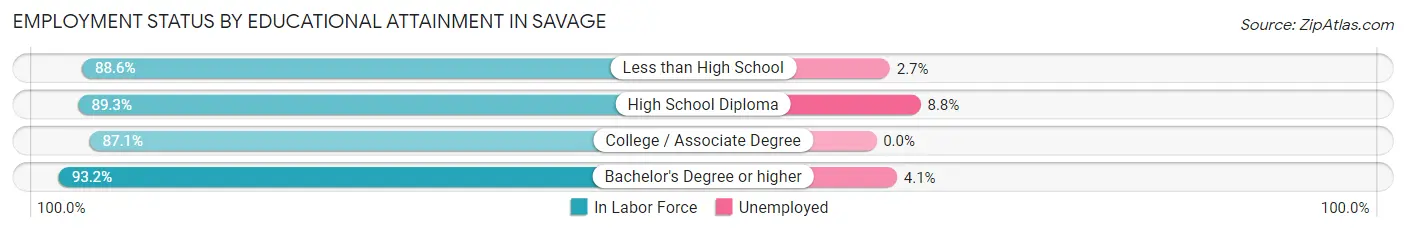
| Educational Attainment | In Labor Force | Unemployed |
| Less than High School | 374 (88.6%) | 11 (2.7%) |
| High School Diploma | 728 (89.3%) | 72 (8.8%) |
| College / Associate Degree | 767 (87.1%) | 0 (0.0%) |
| Bachelor's Degree or higher | 2,347 (93.2%) | 103 (4.1%) |
| Total | 4,219 (91.0%) | 190 (4.1%) |
Employment Occupations by Sex in Savage
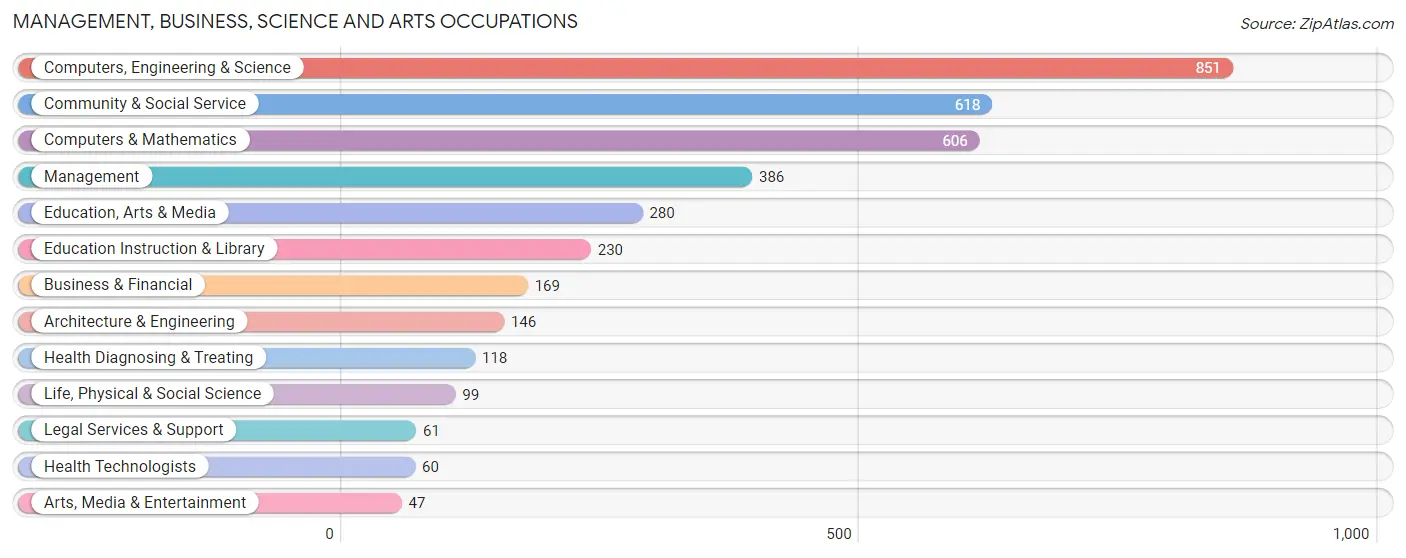
Management, Business, Science and Arts Occupations
The most common Management, Business, Science and Arts occupations in Savage are Computers, Engineering & Science (851 | 21.0%), Community & Social Service (618 | 15.3%), Computers & Mathematics (606 | 15.0%), Management (386 | 9.5%), and Education, Arts & Media (280 | 6.9%).
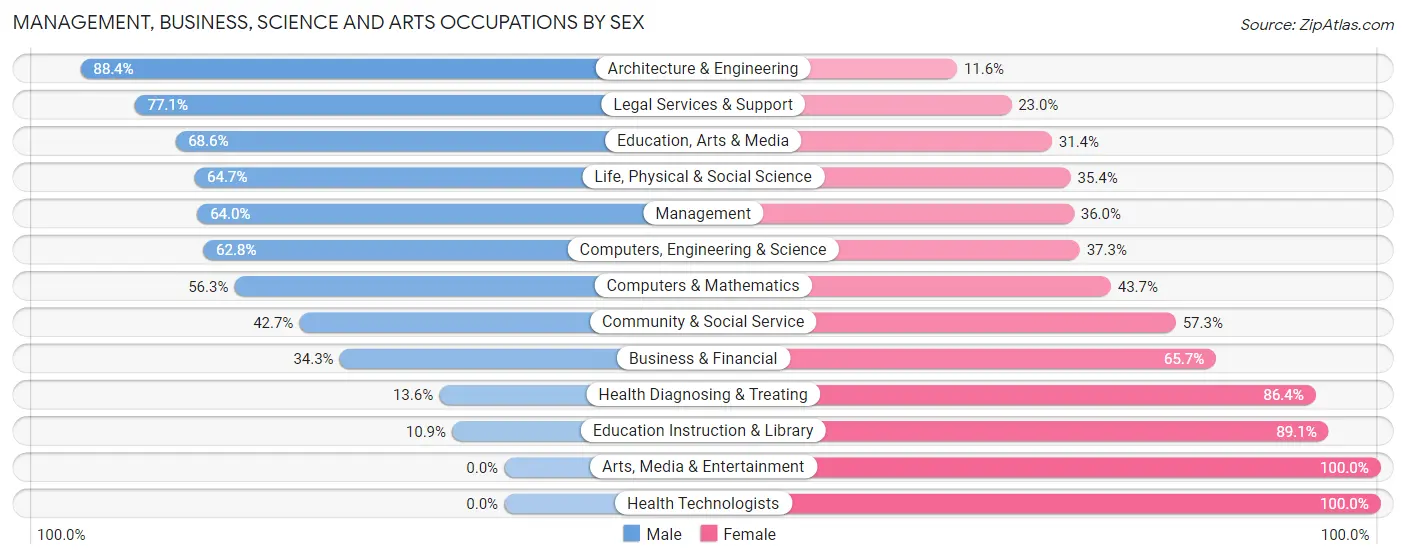
Management, Business, Science and Arts Occupations by Sex
Within the Management, Business, Science and Arts occupations in Savage, the most male-oriented occupations are Architecture & Engineering (88.4%), Legal Services & Support (77.0%), and Education, Arts & Media (68.6%), while the most female-oriented occupations are Arts, Media & Entertainment (100.0%), Health Technologists (100.0%), and Education Instruction & Library (89.1%).
| Occupation | Male | Female |
| Management | 247 (64.0%) | 139 (36.0%) |
| Business & Financial | 58 (34.3%) | 111 (65.7%) |
| Computers, Engineering & Science | 534 (62.7%) | 317 (37.2%) |
| Computers & Mathematics | 341 (56.3%) | 265 (43.7%) |
| Architecture & Engineering | 129 (88.4%) | 17 (11.6%) |
| Life, Physical & Social Science | 64 (64.6%) | 35 (35.3%) |
| Community & Social Service | 264 (42.7%) | 354 (57.3%) |
| Education, Arts & Media | 192 (68.6%) | 88 (31.4%) |
| Legal Services & Support | 47 (77.0%) | 14 (23.0%) |
| Education Instruction & Library | 25 (10.9%) | 205 (89.1%) |
| Arts, Media & Entertainment | 0 (0.0%) | 47 (100.0%) |
| Health Diagnosing & Treating | 16 (13.6%) | 102 (86.4%) |
| Health Technologists | 0 (0.0%) | 60 (100.0%) |
| Total (Category) | 1,119 (52.2%) | 1,023 (47.8%) |
| Total (Overall) | 2,275 (56.2%) | 1,773 (43.8%) |
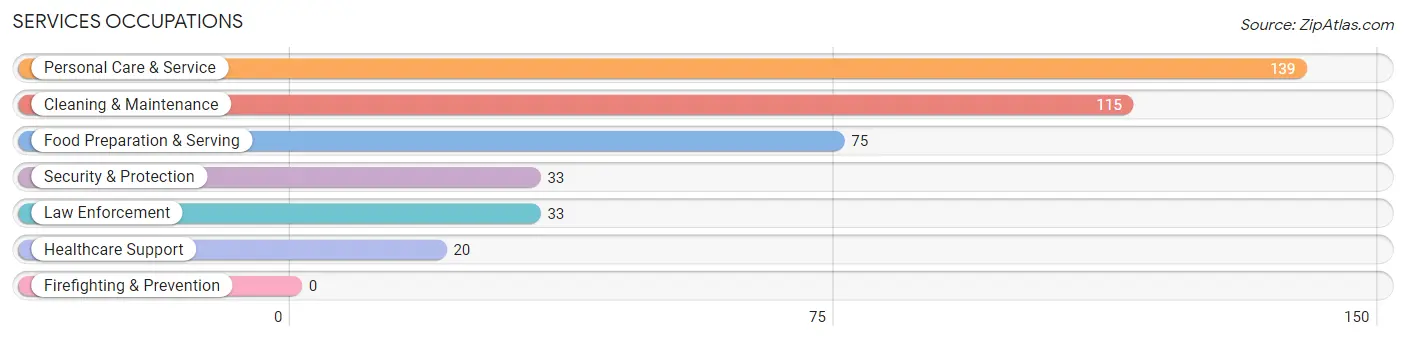
Services Occupations
The most common Services occupations in Savage are Personal Care & Service (139 | 3.4%), Cleaning & Maintenance (115 | 2.8%), Food Preparation & Serving (75 | 1.8%), Security & Protection (33 | 0.8%), and Law Enforcement (33 | 0.8%).
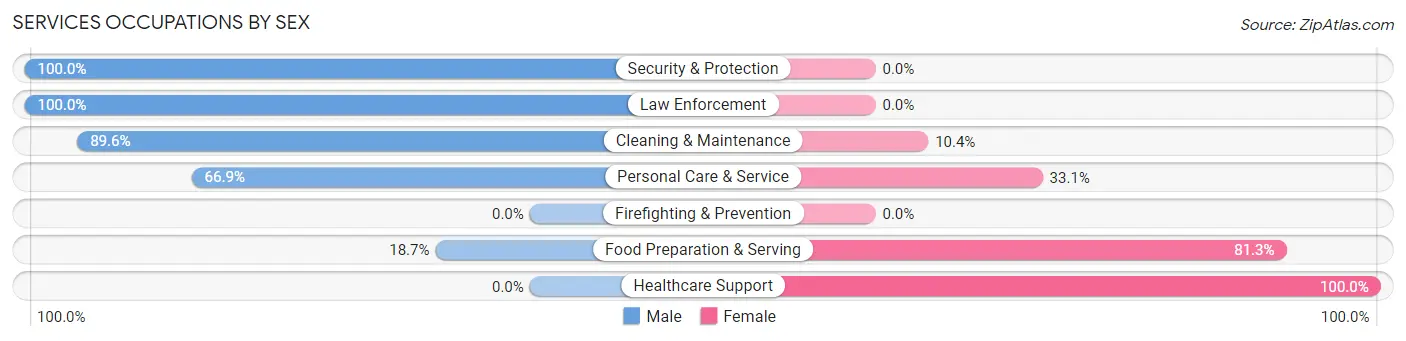
Services Occupations by Sex
Within the Services occupations in Savage, the most male-oriented occupations are Security & Protection (100.0%), Law Enforcement (100.0%), and Cleaning & Maintenance (89.6%), while the most female-oriented occupations are Healthcare Support (100.0%), Food Preparation & Serving (81.3%), and Personal Care & Service (33.1%).
| Occupation | Male | Female |
| Healthcare Support | 0 (0.0%) | 20 (100.0%) |
| Security & Protection | 33 (100.0%) | 0 (0.0%) |
| Firefighting & Prevention | 0 (0.0%) | 0 (0.0%) |
| Law Enforcement | 33 (100.0%) | 0 (0.0%) |
| Food Preparation & Serving | 14 (18.7%) | 61 (81.3%) |
| Cleaning & Maintenance | 103 (89.6%) | 12 (10.4%) |
| Personal Care & Service | 93 (66.9%) | 46 (33.1%) |
| Total (Category) | 243 (63.6%) | 139 (36.4%) |
| Total (Overall) | 2,275 (56.2%) | 1,773 (43.8%) |
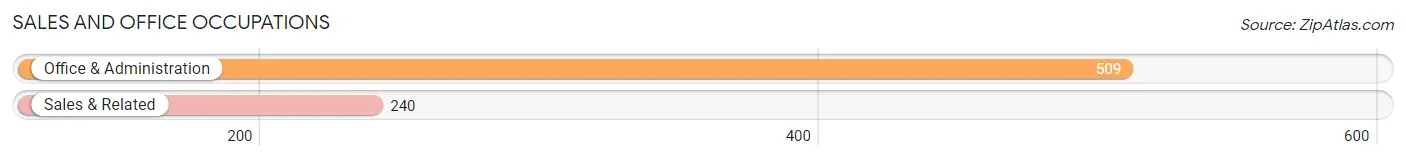
Sales and Office Occupations
The most common Sales and Office occupations in Savage are Office & Administration (509 | 12.6%), and Sales & Related (240 | 5.9%).
Sales and Office Occupations by Sex
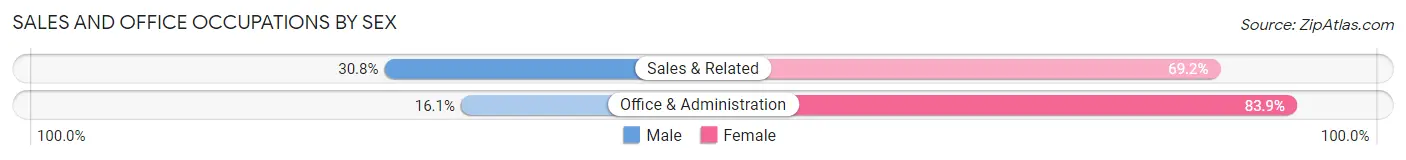
| Occupation | Male | Female |
| Sales & Related | 74 (30.8%) | 166 (69.2%) |
| Office & Administration | 82 (16.1%) | 427 (83.9%) |
| Total (Category) | 156 (20.8%) | 593 (79.2%) |
| Total (Overall) | 2,275 (56.2%) | 1,773 (43.8%) |
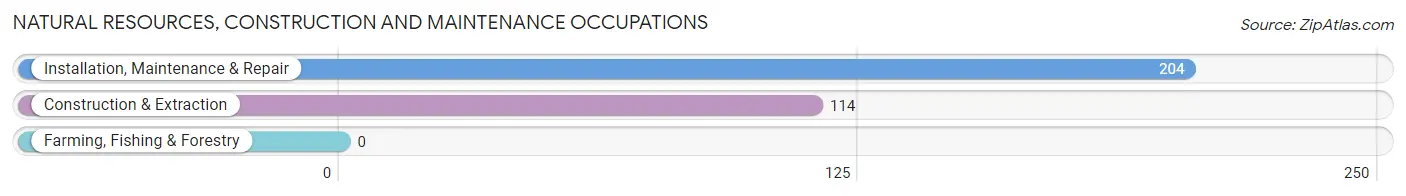
Natural Resources, Construction and Maintenance Occupations
The most common Natural Resources, Construction and Maintenance occupations in Savage are Installation, Maintenance & Repair (204 | 5.0%), and Construction & Extraction (114 | 2.8%).
Natural Resources, Construction and Maintenance Occupations by Sex
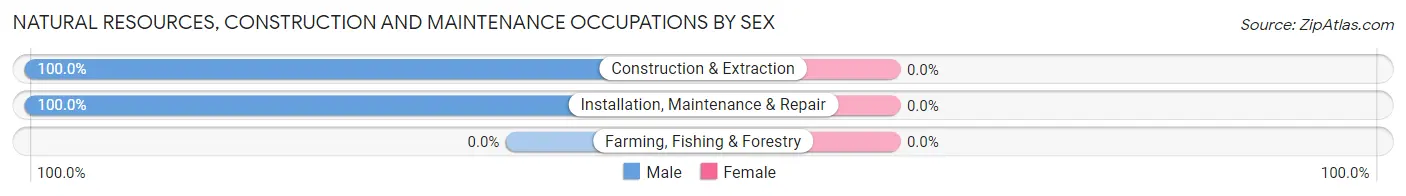
| Occupation | Male | Female |
| Farming, Fishing & Forestry | 0 (0.0%) | 0 (0.0%) |
| Construction & Extraction | 114 (100.0%) | 0 (0.0%) |
| Installation, Maintenance & Repair | 204 (100.0%) | 0 (0.0%) |
| Total (Category) | 318 (100.0%) | 0 (0.0%) |
| Total (Overall) | 2,275 (56.2%) | 1,773 (43.8%) |
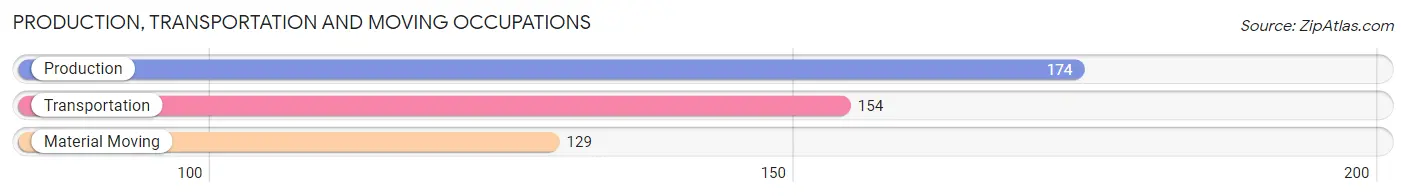
Production, Transportation and Moving Occupations
The most common Production, Transportation and Moving occupations in Savage are Production (174 | 4.3%), Transportation (154 | 3.8%), and Material Moving (129 | 3.2%).
Production, Transportation and Moving Occupations by Sex
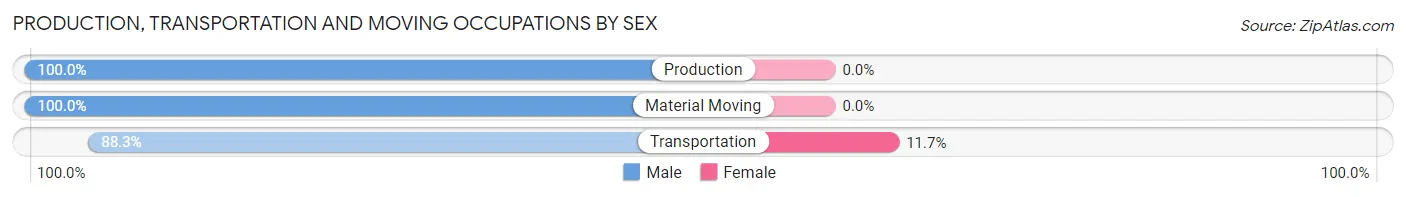
| Occupation | Male | Female |
| Production | 174 (100.0%) | 0 (0.0%) |
| Transportation | 136 (88.3%) | 18 (11.7%) |
| Material Moving | 129 (100.0%) | 0 (0.0%) |
| Total (Category) | 439 (96.1%) | 18 (3.9%) |
| Total (Overall) | 2,275 (56.2%) | 1,773 (43.8%) |
Employment Industries by Sex in Savage
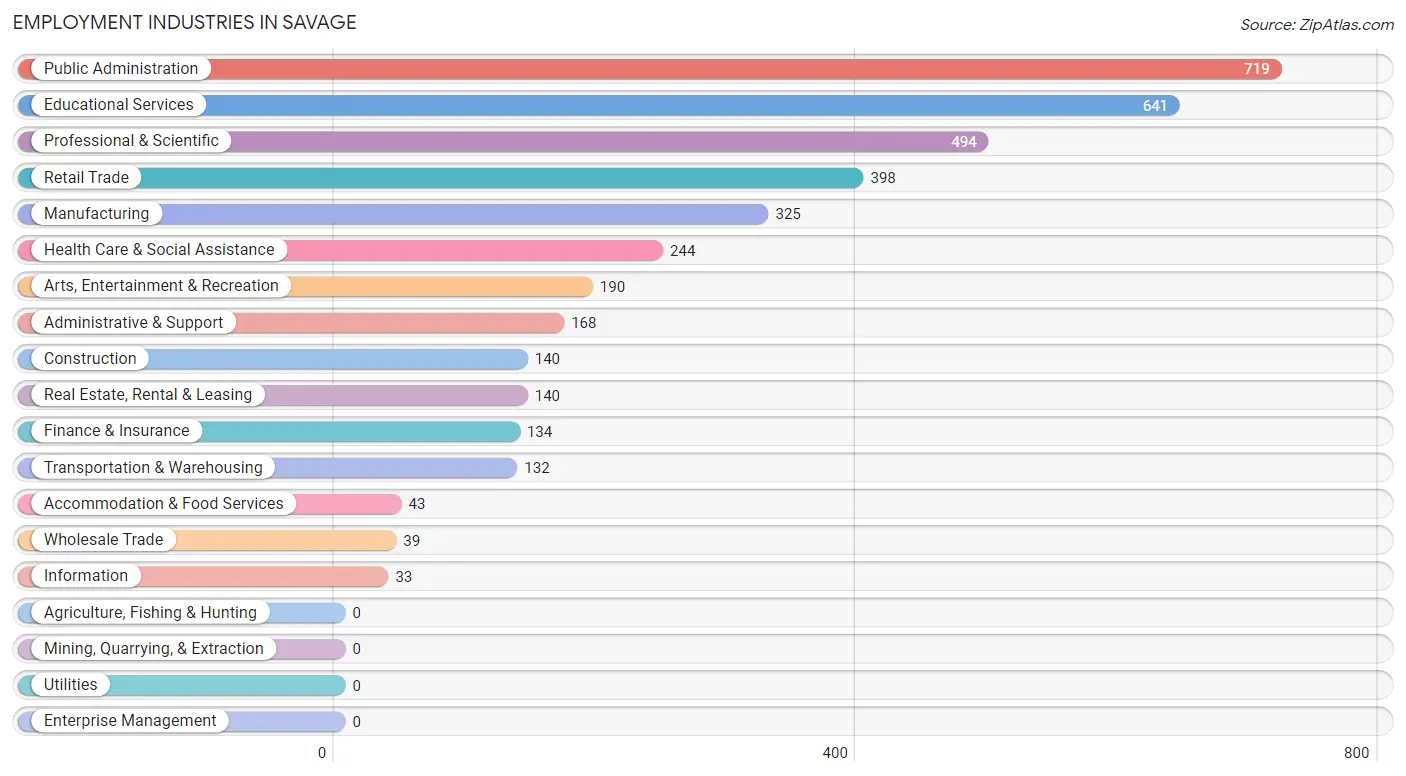
Employment Industries in Savage
The major employment industries in Savage include Public Administration (719 | 17.8%), Educational Services (641 | 15.8%), Professional & Scientific (494 | 12.2%), Retail Trade (398 | 9.8%), and Manufacturing (325 | 8.0%).
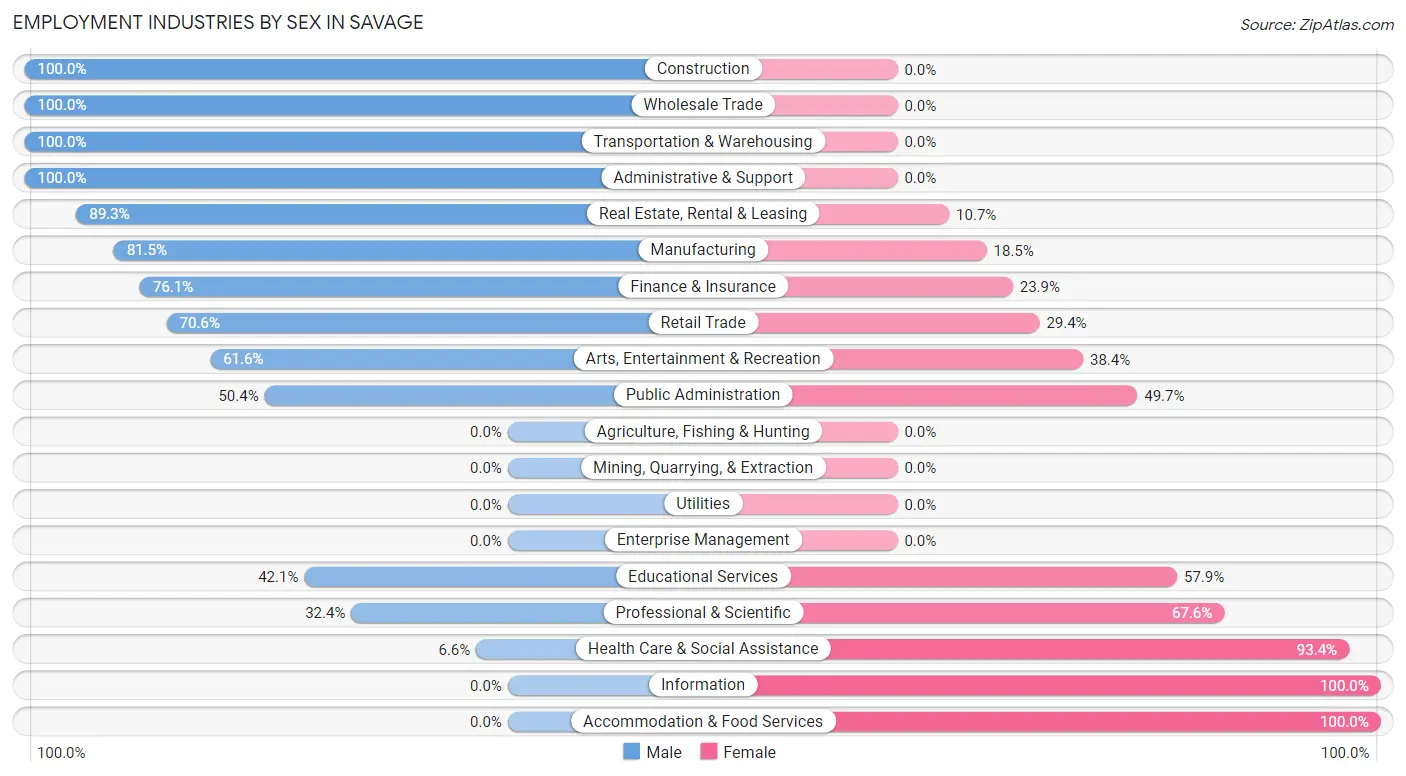
Employment Industries by Sex in Savage
The Savage industries that see more men than women are Construction (100.0%), Wholesale Trade (100.0%), and Transportation & Warehousing (100.0%), whereas the industries that tend to have a higher number of women are Information (100.0%), Accommodation & Food Services (100.0%), and Health Care & Social Assistance (93.4%).
| Industry | Male | Female |
| Agriculture, Fishing & Hunting | 0 (0.0%) | 0 (0.0%) |
| Mining, Quarrying, & Extraction | 0 (0.0%) | 0 (0.0%) |
| Construction | 140 (100.0%) | 0 (0.0%) |
| Manufacturing | 265 (81.5%) | 60 (18.5%) |
| Wholesale Trade | 39 (100.0%) | 0 (0.0%) |
| Retail Trade | 281 (70.6%) | 117 (29.4%) |
| Transportation & Warehousing | 132 (100.0%) | 0 (0.0%) |
| Utilities | 0 (0.0%) | 0 (0.0%) |
| Information | 0 (0.0%) | 33 (100.0%) |
| Finance & Insurance | 102 (76.1%) | 32 (23.9%) |
| Real Estate, Rental & Leasing | 125 (89.3%) | 15 (10.7%) |
| Professional & Scientific | 160 (32.4%) | 334 (67.6%) |
| Enterprise Management | 0 (0.0%) | 0 (0.0%) |
| Administrative & Support | 168 (100.0%) | 0 (0.0%) |
| Educational Services | 270 (42.1%) | 371 (57.9%) |
| Health Care & Social Assistance | 16 (6.6%) | 228 (93.4%) |
| Arts, Entertainment & Recreation | 117 (61.6%) | 73 (38.4%) |
| Accommodation & Food Services | 0 (0.0%) | 43 (100.0%) |
| Public Administration | 362 (50.3%) | 357 (49.6%) |
| Total | 2,275 (56.2%) | 1,773 (43.8%) |
Education in Savage
School Enrollment in Savage
The most common levels of schooling among the 2,120 students in Savage are middle school (682 | 32.2%), elementary school (449 | 21.2%), and high school (425 | 20.1%).
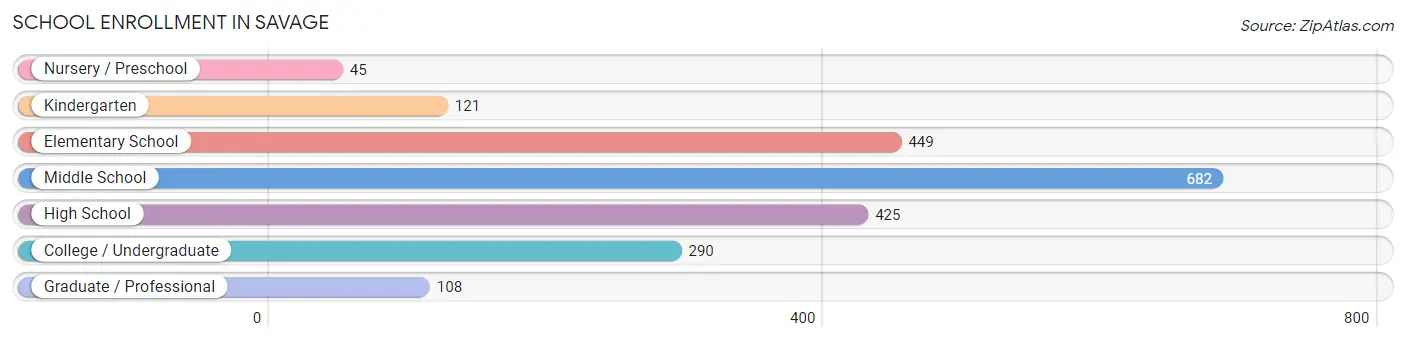
| School Level | # Students | % Students |
| Nursery / Preschool | 45 | 2.1% |
| Kindergarten | 121 | 5.7% |
| Elementary School | 449 | 21.2% |
| Middle School | 682 | 32.2% |
| High School | 425 | 20.1% |
| College / Undergraduate | 290 | 13.7% |
| Graduate / Professional | 108 | 5.1% |
| Total | 2,120 | 100.0% |
School Enrollment by Age by Funding Source in Savage
Out of a total of 2,120 students who are enrolled in schools in Savage, 178 (8.4%) attend a private institution, while the remaining 1,942 (91.6%) are enrolled in public schools. The age group of 3 to 4 year olds has the highest likelihood of being enrolled in private schools, with 20 (100.0% in the age bracket) enrolled. Conversely, the age group of 15 to 17 year olds has the lowest likelihood of being enrolled in a private school, with 345 (100.0% in the age bracket) attending a public institution.
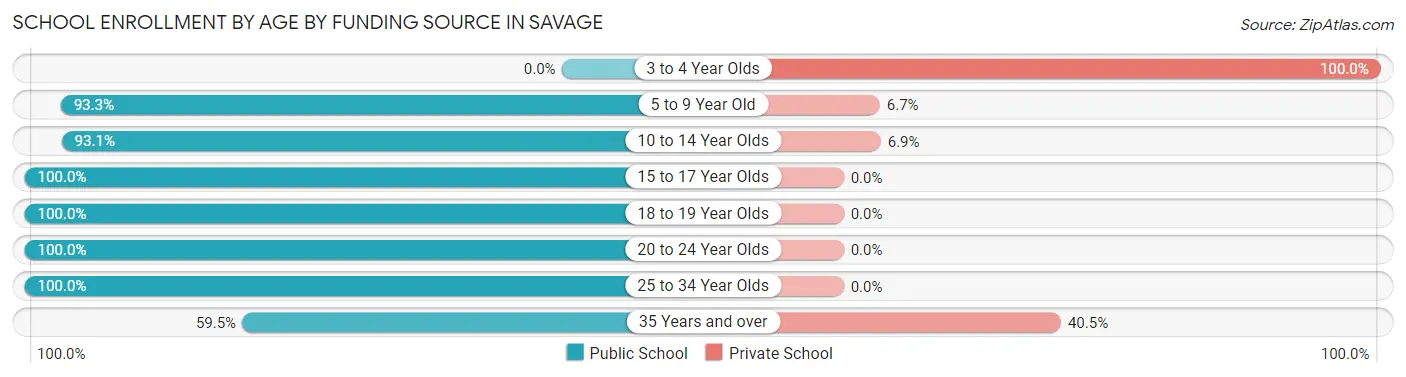
| Age Bracket | Public School | Private School |
| 3 to 4 Year Olds | 0 (0.0%) | 20 (100.0%) |
| 5 to 9 Year Old | 540 (93.3%) | 39 (6.7%) |
| 10 to 14 Year Olds | 700 (93.1%) | 52 (6.9%) |
| 15 to 17 Year Olds | 345 (100.0%) | 0 (0.0%) |
| 18 to 19 Year Olds | 125 (100.0%) | 0 (0.0%) |
| 20 to 24 Year Olds | 50 (100.0%) | 0 (0.0%) |
| 25 to 34 Year Olds | 81 (100.0%) | 0 (0.0%) |
| 35 Years and over | 100 (59.5%) | 68 (40.5%) |
| Total | 1,942 (91.6%) | 178 (8.4%) |
Educational Attainment by Field of Study in Savage
Business (556 | 19.1%), education (362 | 12.4%), arts & humanities (303 | 10.4%), social sciences (297 | 10.2%), and psychology (229 | 7.9%) are the most common fields of study among 2,913 individuals in Savage who have obtained a bachelor's degree or higher.
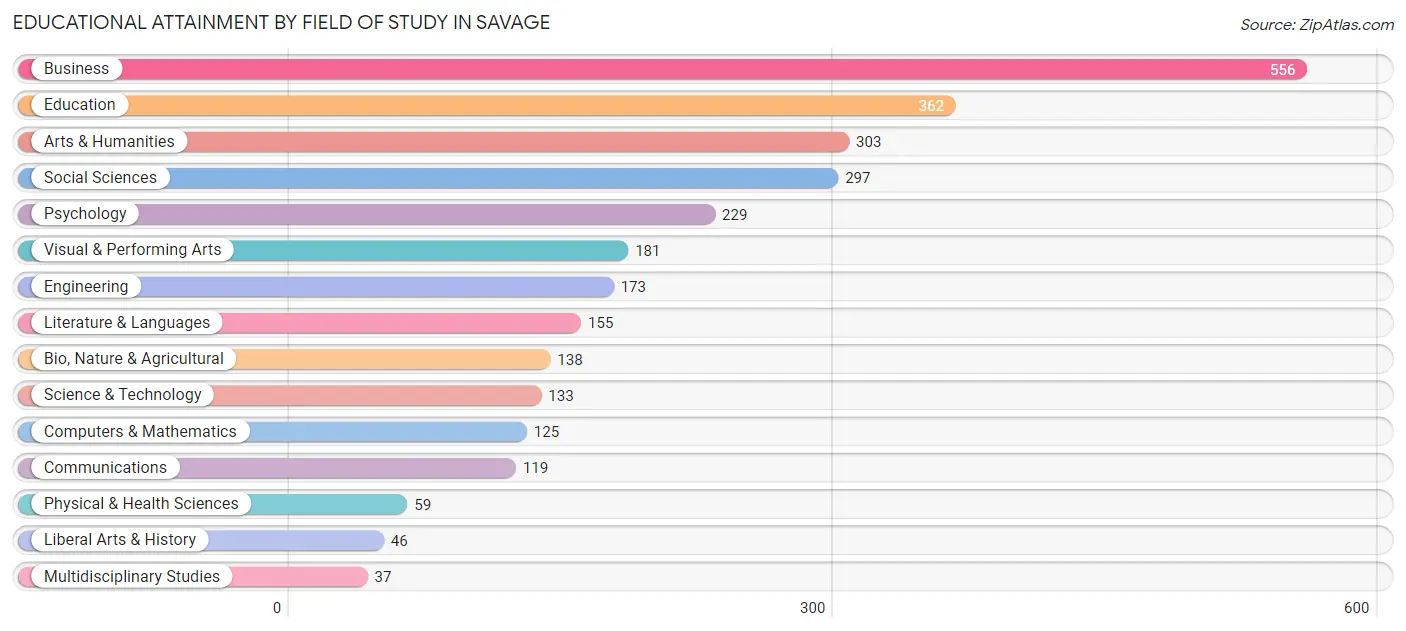
| Field of Study | # Graduates | % Graduates |
| Computers & Mathematics | 125 | 4.3% |
| Bio, Nature & Agricultural | 138 | 4.7% |
| Physical & Health Sciences | 59 | 2.0% |
| Psychology | 229 | 7.9% |
| Social Sciences | 297 | 10.2% |
| Engineering | 173 | 5.9% |
| Multidisciplinary Studies | 37 | 1.3% |
| Science & Technology | 133 | 4.6% |
| Business | 556 | 19.1% |
| Education | 362 | 12.4% |
| Literature & Languages | 155 | 5.3% |
| Liberal Arts & History | 46 | 1.6% |
| Visual & Performing Arts | 181 | 6.2% |
| Communications | 119 | 4.1% |
| Arts & Humanities | 303 | 10.4% |
| Total | 2,913 | 100.0% |
Transportation & Commute in Savage
Vehicle Availability by Sex in Savage
The most prevalent vehicle ownership categories in Savage are males with 2 vehicles (1,078, accounting for 43.6%) and females with 2 vehicles (834, making up 60.2%).
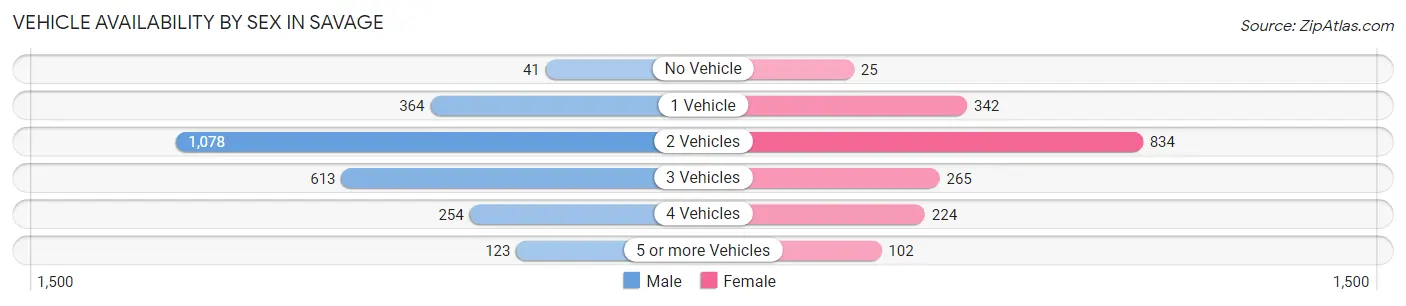
| Vehicles Available | Male | Female |
| No Vehicle | 41 (1.7%) | 25 (1.4%) |
| 1 Vehicle | 364 (14.7%) | 342 (19.1%) |
| 2 Vehicles | 1,078 (43.6%) | 834 (46.5%) |
| 3 Vehicles | 613 (24.8%) | 265 (14.8%) |
| 4 Vehicles | 254 (10.3%) | 224 (12.5%) |
| 5 or more Vehicles | 123 (5.0%) | 102 (5.7%) |
| Total | 2,473 (100.0%) | 1,792 (100.0%) |
Commute Time in Savage
The most frequently occuring commute durations in Savage are 15 to 19 minutes (626 commuters, 18.0%), 20 to 24 minutes (602 commuters, 17.3%), and 10 to 14 minutes (488 commuters, 14.0%).
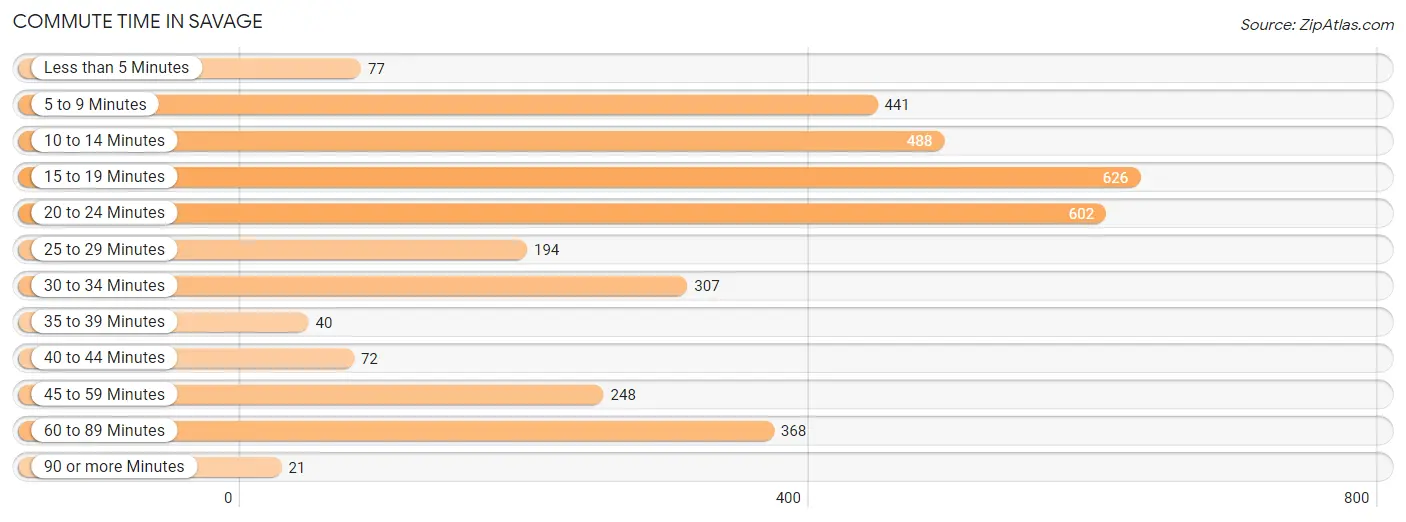
| Commute Time | # Commuters | % Commuters |
| Less than 5 Minutes | 77 | 2.2% |
| 5 to 9 Minutes | 441 | 12.7% |
| 10 to 14 Minutes | 488 | 14.0% |
| 15 to 19 Minutes | 626 | 18.0% |
| 20 to 24 Minutes | 602 | 17.3% |
| 25 to 29 Minutes | 194 | 5.6% |
| 30 to 34 Minutes | 307 | 8.8% |
| 35 to 39 Minutes | 40 | 1.1% |
| 40 to 44 Minutes | 72 | 2.1% |
| 45 to 59 Minutes | 248 | 7.1% |
| 60 to 89 Minutes | 368 | 10.6% |
| 90 or more Minutes | 21 | 0.6% |
Commute Time by Sex in Savage
The most common commute times in Savage are 5 to 9 minutes (374 commuters, 18.1%) for males and 15 to 19 minutes (374 commuters, 26.4%) for females.
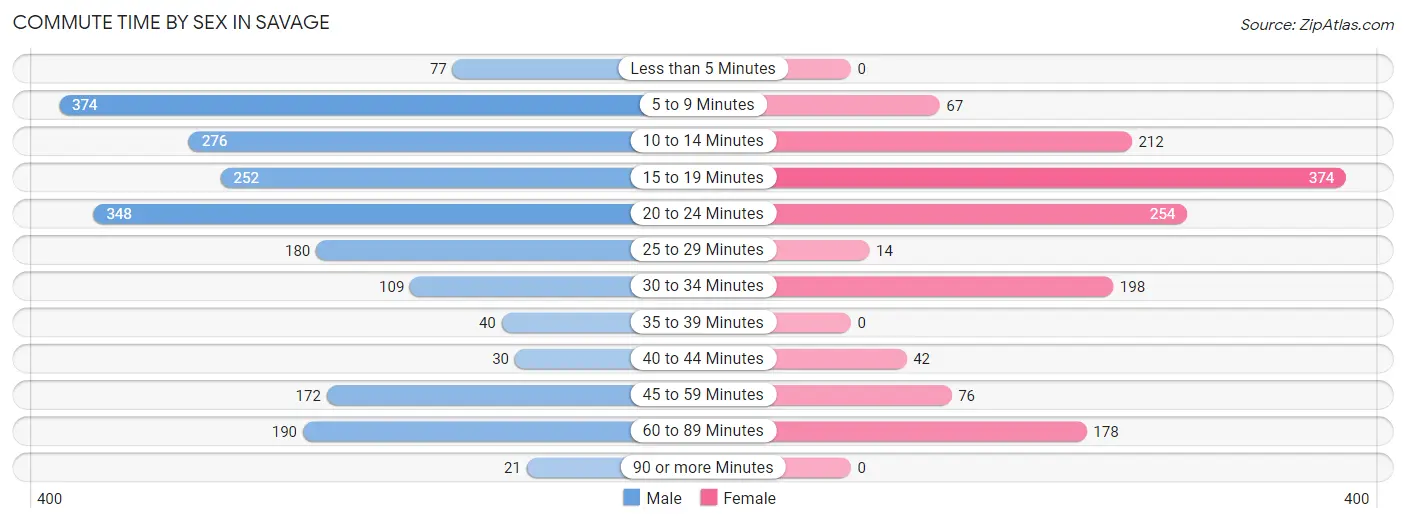
| Commute Time | Male | Female |
| Less than 5 Minutes | 77 (3.7%) | 0 (0.0%) |
| 5 to 9 Minutes | 374 (18.1%) | 67 (4.7%) |
| 10 to 14 Minutes | 276 (13.3%) | 212 (15.0%) |
| 15 to 19 Minutes | 252 (12.2%) | 374 (26.4%) |
| 20 to 24 Minutes | 348 (16.8%) | 254 (17.9%) |
| 25 to 29 Minutes | 180 (8.7%) | 14 (1.0%) |
| 30 to 34 Minutes | 109 (5.3%) | 198 (14.0%) |
| 35 to 39 Minutes | 40 (1.9%) | 0 (0.0%) |
| 40 to 44 Minutes | 30 (1.5%) | 42 (3.0%) |
| 45 to 59 Minutes | 172 (8.3%) | 76 (5.4%) |
| 60 to 89 Minutes | 190 (9.2%) | 178 (12.6%) |
| 90 or more Minutes | 21 (1.0%) | 0 (0.0%) |
Time of Departure to Work by Sex in Savage
The most frequent times of departure to work in Savage are 7:00 AM to 7:29 AM (593, 28.7%) for males and 5:30 AM to 5:59 AM (244, 17.2%) for females.
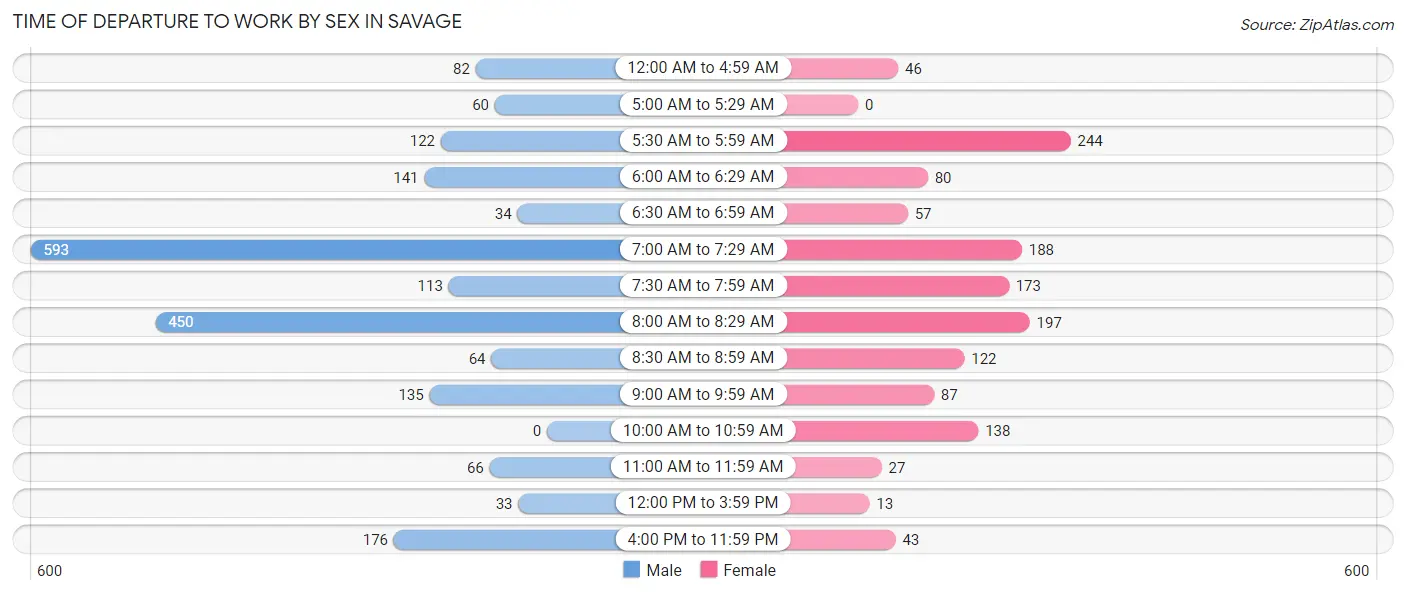
| Time of Departure | Male | Female |
| 12:00 AM to 4:59 AM | 82 (4.0%) | 46 (3.3%) |
| 5:00 AM to 5:29 AM | 60 (2.9%) | 0 (0.0%) |
| 5:30 AM to 5:59 AM | 122 (5.9%) | 244 (17.2%) |
| 6:00 AM to 6:29 AM | 141 (6.8%) | 80 (5.7%) |
| 6:30 AM to 6:59 AM | 34 (1.6%) | 57 (4.0%) |
| 7:00 AM to 7:29 AM | 593 (28.7%) | 188 (13.3%) |
| 7:30 AM to 7:59 AM | 113 (5.5%) | 173 (12.2%) |
| 8:00 AM to 8:29 AM | 450 (21.7%) | 197 (13.9%) |
| 8:30 AM to 8:59 AM | 64 (3.1%) | 122 (8.6%) |
| 9:00 AM to 9:59 AM | 135 (6.5%) | 87 (6.1%) |
| 10:00 AM to 10:59 AM | 0 (0.0%) | 138 (9.8%) |
| 11:00 AM to 11:59 AM | 66 (3.2%) | 27 (1.9%) |
| 12:00 PM to 3:59 PM | 33 (1.6%) | 13 (0.9%) |
| 4:00 PM to 11:59 PM | 176 (8.5%) | 43 (3.0%) |
| Total | 2,069 (100.0%) | 1,415 (100.0%) |
Housing Occupancy in Savage
Occupancy by Ownership in Savage
Of the total 2,761 dwellings in Savage, owner-occupied units account for 1,704 (61.7%), while renter-occupied units make up 1,057 (38.3%).
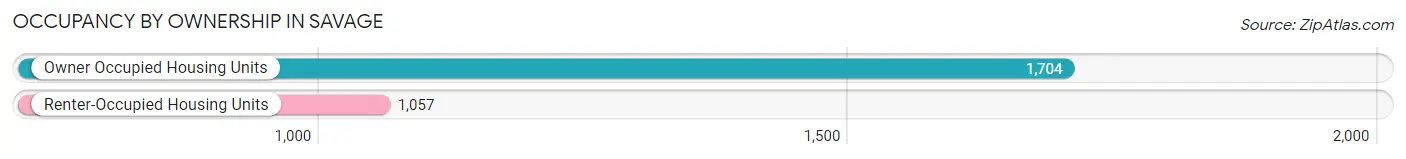
| Occupancy | # Housing Units | % Housing Units |
| Owner Occupied Housing Units | 1,704 | 61.7% |
| Renter-Occupied Housing Units | 1,057 | 38.3% |
| Total Occupied Housing Units | 2,761 | 100.0% |
Occupancy by Household Size in Savage
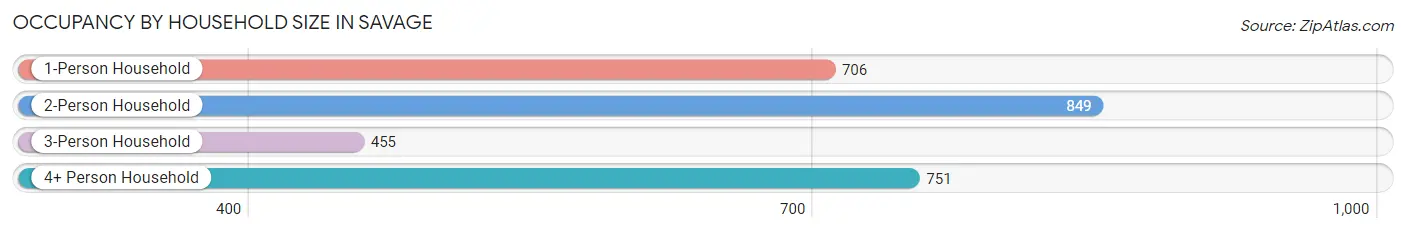
| Household Size | # Housing Units | % Housing Units |
| 1-Person Household | 706 | 25.6% |
| 2-Person Household | 849 | 30.7% |
| 3-Person Household | 455 | 16.5% |
| 4+ Person Household | 751 | 27.2% |
| Total Housing Units | 2,761 | 100.0% |
Occupancy by Ownership by Household Size in Savage
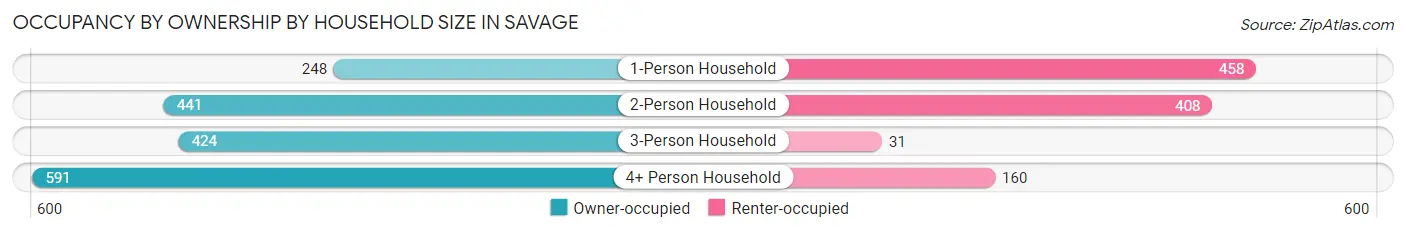
| Household Size | Owner-occupied | Renter-occupied |
| 1-Person Household | 248 (35.1%) | 458 (64.9%) |
| 2-Person Household | 441 (51.9%) | 408 (48.1%) |
| 3-Person Household | 424 (93.2%) | 31 (6.8%) |
| 4+ Person Household | 591 (78.7%) | 160 (21.3%) |
| Total Housing Units | 1,704 (61.7%) | 1,057 (38.3%) |
Occupancy by Educational Attainment in Savage
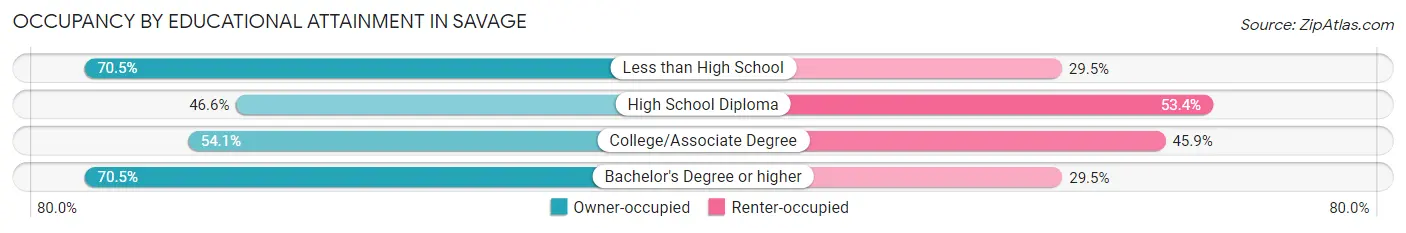
| Household Size | Owner-occupied | Renter-occupied |
| Less than High School | 158 (70.5%) | 66 (29.5%) |
| High School Diploma | 212 (46.6%) | 243 (53.4%) |
| College/Associate Degree | 441 (54.1%) | 374 (45.9%) |
| Bachelor's Degree or higher | 893 (70.5%) | 374 (29.5%) |
Occupancy by Age of Householder in Savage
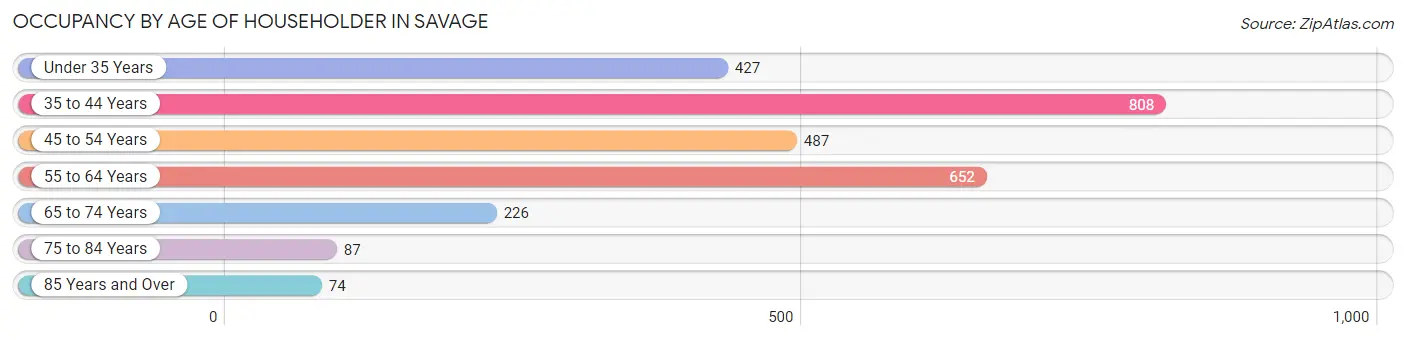
| Age Bracket | # Households | % Households |
| Under 35 Years | 427 | 15.5% |
| 35 to 44 Years | 808 | 29.3% |
| 45 to 54 Years | 487 | 17.6% |
| 55 to 64 Years | 652 | 23.6% |
| 65 to 74 Years | 226 | 8.2% |
| 75 to 84 Years | 87 | 3.2% |
| 85 Years and Over | 74 | 2.7% |
| Total | 2,761 | 100.0% |
Housing Finances in Savage
Median Income by Occupancy in Savage
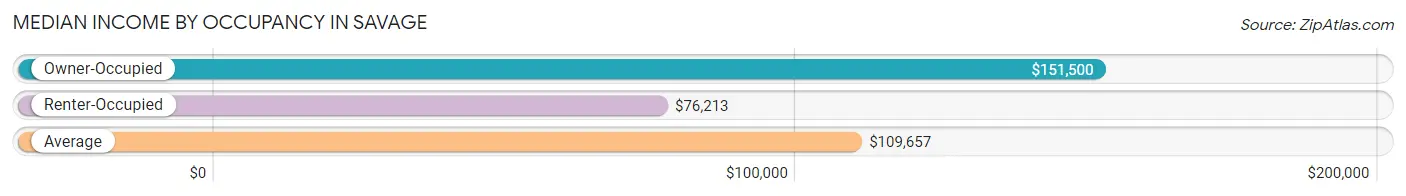
| Occupancy Type | # Households | Median Income |
| Owner-Occupied | 1,704 (61.7%) | $151,500 |
| Renter-Occupied | 1,057 (38.3%) | $76,213 |
| Average | 2,761 (100.0%) | $109,657 |
Occupancy by Householder Income Bracket in Savage
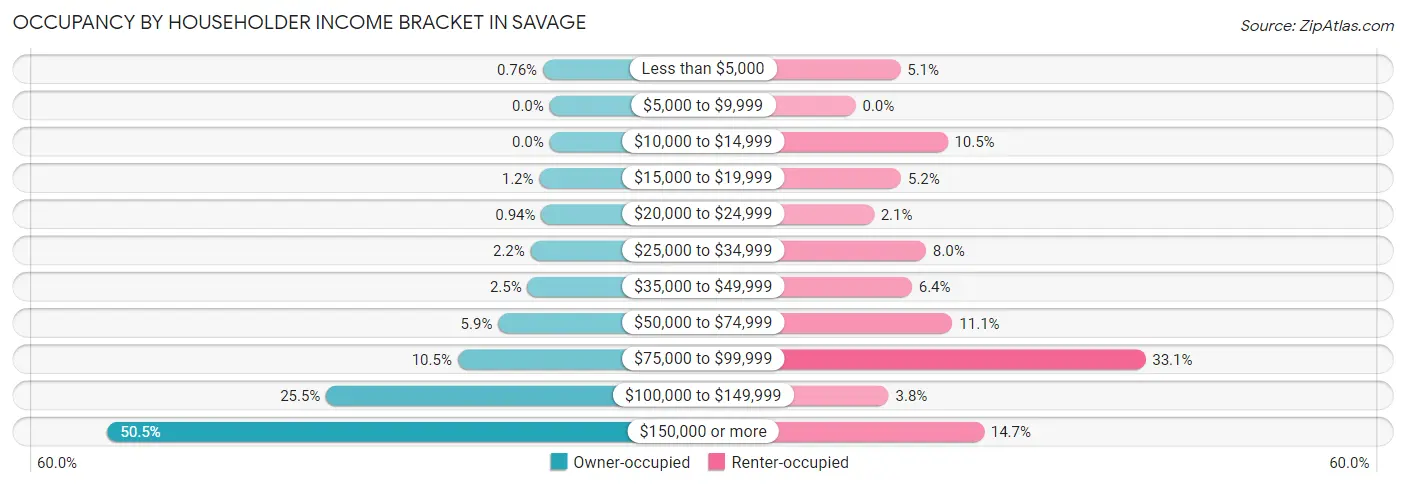
| Income Bracket | Owner-occupied | Renter-occupied |
| Less than $5,000 | 13 (0.8%) | 54 (5.1%) |
| $5,000 to $9,999 | 0 (0.0%) | 0 (0.0%) |
| $10,000 to $14,999 | 0 (0.0%) | 111 (10.5%) |
| $15,000 to $19,999 | 20 (1.2%) | 55 (5.2%) |
| $20,000 to $24,999 | 16 (0.9%) | 22 (2.1%) |
| $25,000 to $34,999 | 37 (2.2%) | 85 (8.0%) |
| $35,000 to $49,999 | 43 (2.5%) | 68 (6.4%) |
| $50,000 to $74,999 | 100 (5.9%) | 117 (11.1%) |
| $75,000 to $99,999 | 179 (10.5%) | 350 (33.1%) |
| $100,000 to $149,999 | 435 (25.5%) | 40 (3.8%) |
| $150,000 or more | 861 (50.5%) | 155 (14.7%) |
| Total | 1,704 (100.0%) | 1,057 (100.0%) |
Monthly Housing Cost Tiers in Savage
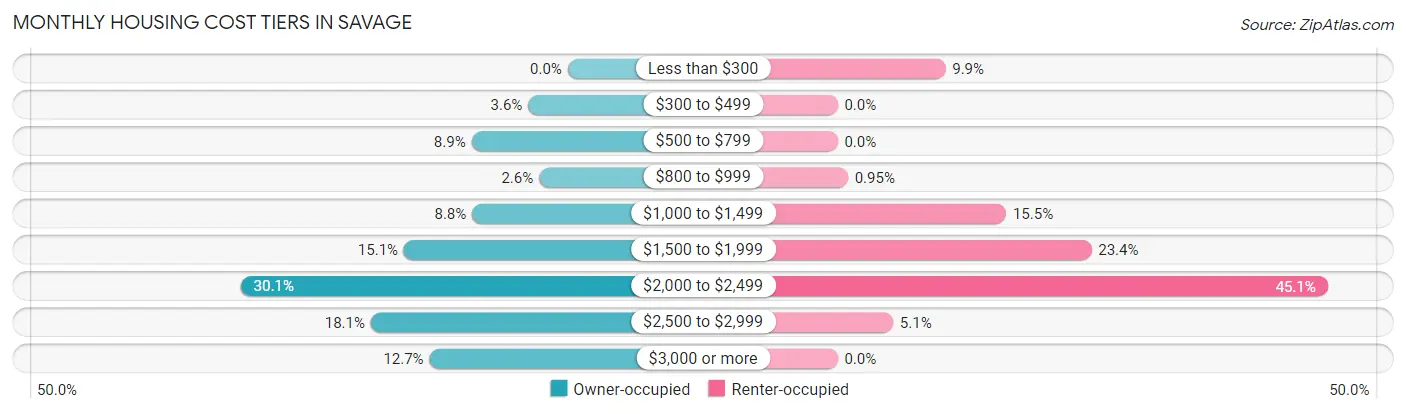
| Monthly Cost | Owner-occupied | Renter-occupied |
| Less than $300 | 0 (0.0%) | 105 (9.9%) |
| $300 to $499 | 62 (3.6%) | 0 (0.0%) |
| $500 to $799 | 151 (8.9%) | 0 (0.0%) |
| $800 to $999 | 45 (2.6%) | 10 (0.9%) |
| $1,000 to $1,499 | 150 (8.8%) | 164 (15.5%) |
| $1,500 to $1,999 | 257 (15.1%) | 247 (23.4%) |
| $2,000 to $2,499 | 513 (30.1%) | 477 (45.1%) |
| $2,500 to $2,999 | 309 (18.1%) | 54 (5.1%) |
| $3,000 or more | 217 (12.7%) | 0 (0.0%) |
| Total | 1,704 (100.0%) | 1,057 (100.0%) |
Physical Housing Characteristics in Savage
Housing Structures in Savage
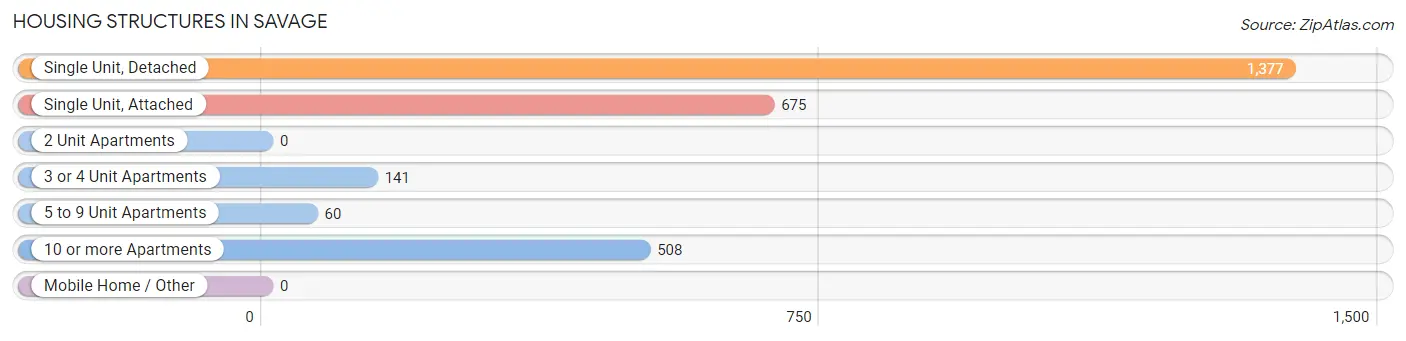
| Structure Type | # Housing Units | % Housing Units |
| Single Unit, Detached | 1,377 | 49.9% |
| Single Unit, Attached | 675 | 24.4% |
| 2 Unit Apartments | 0 | 0.0% |
| 3 or 4 Unit Apartments | 141 | 5.1% |
| 5 to 9 Unit Apartments | 60 | 2.2% |
| 10 or more Apartments | 508 | 18.4% |
| Mobile Home / Other | 0 | 0.0% |
| Total | 2,761 | 100.0% |
Housing Structures by Occupancy in Savage
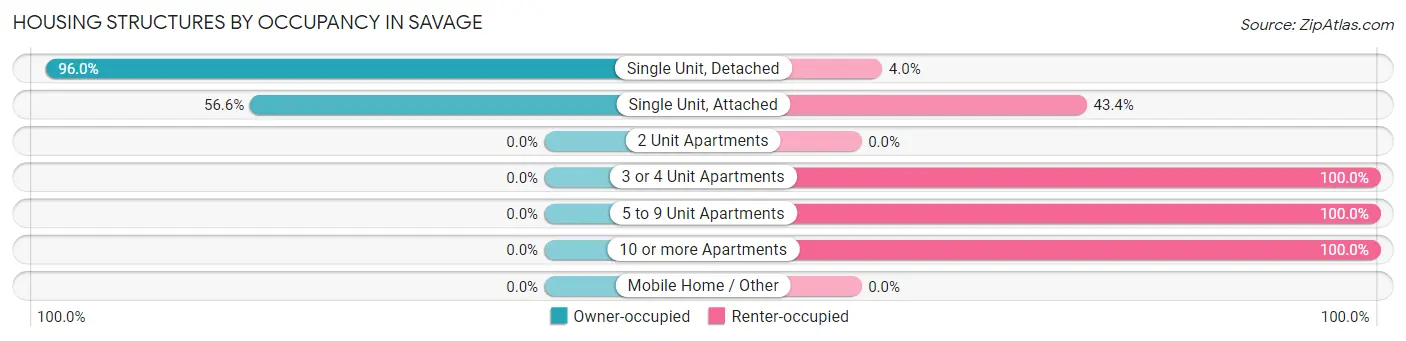
| Structure Type | Owner-occupied | Renter-occupied |
| Single Unit, Detached | 1,322 (96.0%) | 55 (4.0%) |
| Single Unit, Attached | 382 (56.6%) | 293 (43.4%) |
| 2 Unit Apartments | 0 (0.0%) | 0 (0.0%) |
| 3 or 4 Unit Apartments | 0 (0.0%) | 141 (100.0%) |
| 5 to 9 Unit Apartments | 0 (0.0%) | 60 (100.0%) |
| 10 or more Apartments | 0 (0.0%) | 508 (100.0%) |
| Mobile Home / Other | 0 (0.0%) | 0 (0.0%) |
| Total | 1,704 (61.7%) | 1,057 (38.3%) |
Housing Structures by Number of Rooms in Savage
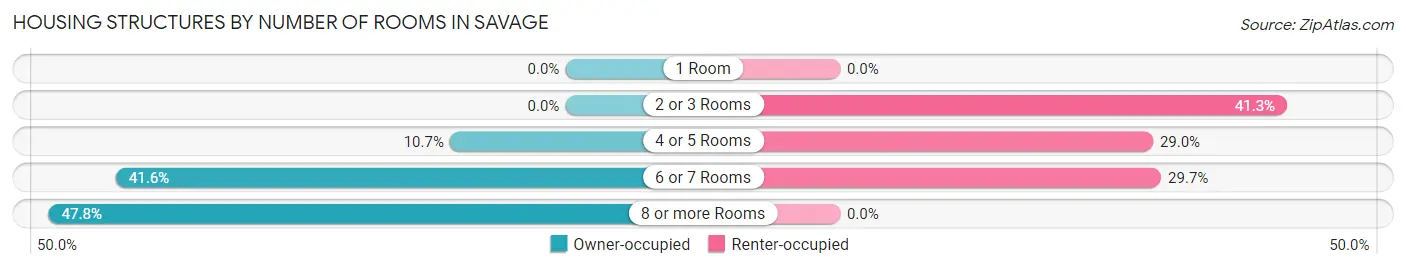
| Number of Rooms | Owner-occupied | Renter-occupied |
| 1 Room | 0 (0.0%) | 0 (0.0%) |
| 2 or 3 Rooms | 0 (0.0%) | 437 (41.3%) |
| 4 or 5 Rooms | 182 (10.7%) | 306 (28.9%) |
| 6 or 7 Rooms | 708 (41.5%) | 314 (29.7%) |
| 8 or more Rooms | 814 (47.8%) | 0 (0.0%) |
| Total | 1,704 (100.0%) | 1,057 (100.0%) |
Housing Structure by Heating Type in Savage
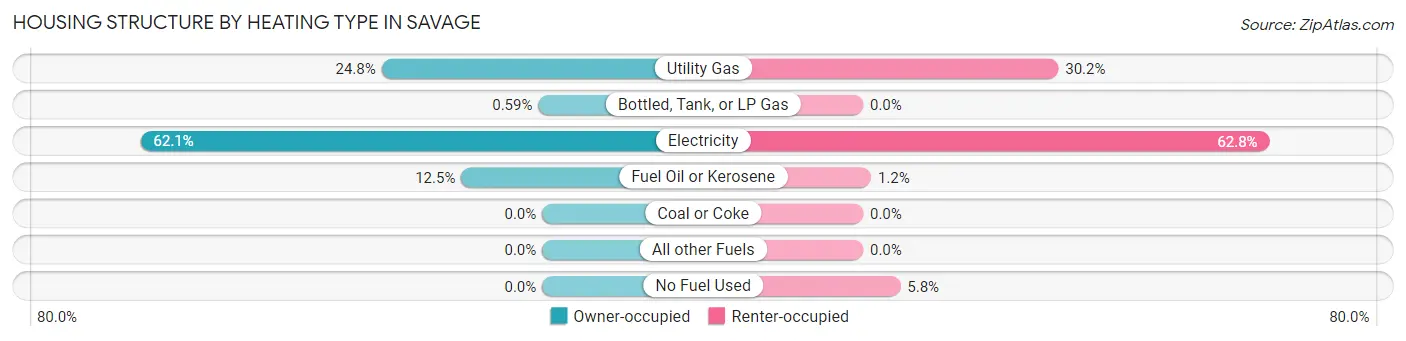
| Heating Type | Owner-occupied | Renter-occupied |
| Utility Gas | 423 (24.8%) | 319 (30.2%) |
| Bottled, Tank, or LP Gas | 10 (0.6%) | 0 (0.0%) |
| Electricity | 1,058 (62.1%) | 664 (62.8%) |
| Fuel Oil or Kerosene | 213 (12.5%) | 13 (1.2%) |
| Coal or Coke | 0 (0.0%) | 0 (0.0%) |
| All other Fuels | 0 (0.0%) | 0 (0.0%) |
| No Fuel Used | 0 (0.0%) | 61 (5.8%) |
| Total | 1,704 (100.0%) | 1,057 (100.0%) |
Household Vehicle Usage in Savage
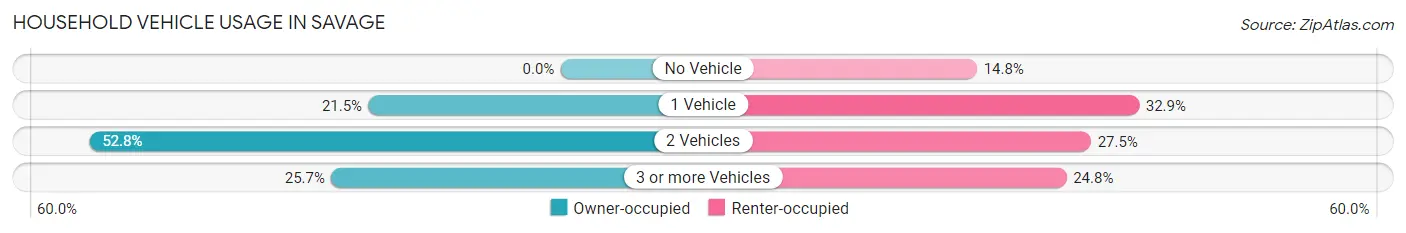
| Vehicles per Household | Owner-occupied | Renter-occupied |
| No Vehicle | 0 (0.0%) | 156 (14.8%) |
| 1 Vehicle | 367 (21.5%) | 348 (32.9%) |
| 2 Vehicles | 899 (52.8%) | 291 (27.5%) |
| 3 or more Vehicles | 438 (25.7%) | 262 (24.8%) |
| Total | 1,704 (100.0%) | 1,057 (100.0%) |
Real Estate & Mortgages in Savage
Real Estate and Mortgage Overview in Savage
| Characteristic | Without Mortgage | With Mortgage |
| Housing Units | 275 | 1,429 |
| Median Property Value | $370,000 | $402,800 |
| Median Household Income | $75,859 | $784 |
| Monthly Housing Costs | $694 | $217 |
| Real Estate Taxes | $4,905 | $15 |
Property Value by Mortgage Status in Savage
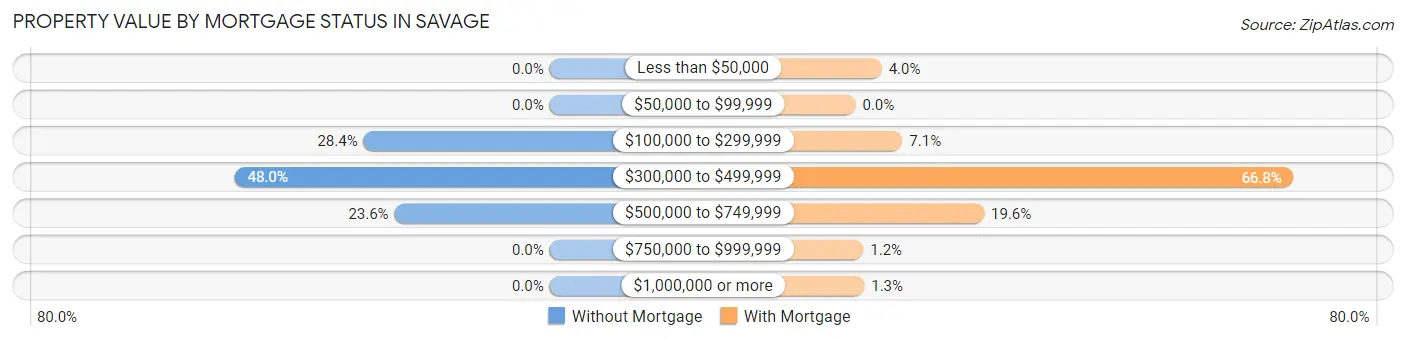
| Property Value | Without Mortgage | With Mortgage |
| Less than $50,000 | 0 (0.0%) | 57 (4.0%) |
| $50,000 to $99,999 | 0 (0.0%) | 0 (0.0%) |
| $100,000 to $299,999 | 78 (28.4%) | 102 (7.1%) |
| $300,000 to $499,999 | 132 (48.0%) | 954 (66.8%) |
| $500,000 to $749,999 | 65 (23.6%) | 280 (19.6%) |
| $750,000 to $999,999 | 0 (0.0%) | 17 (1.2%) |
| $1,000,000 or more | 0 (0.0%) | 19 (1.3%) |
| Total | 275 (100.0%) | 1,429 (100.0%) |
Household Income by Mortgage Status in Savage
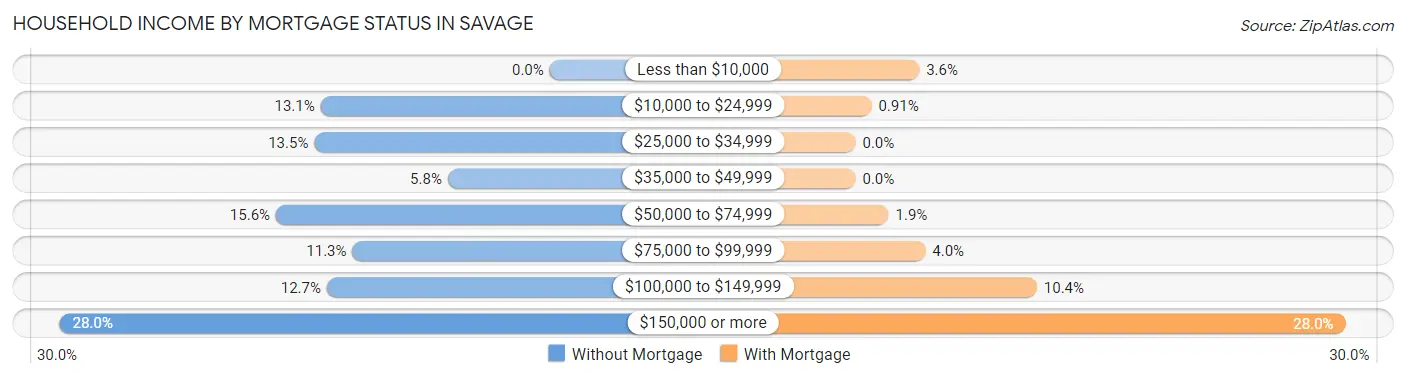
| Household Income | Without Mortgage | With Mortgage |
| Less than $10,000 | 0 (0.0%) | 52 (3.6%) |
| $10,000 to $24,999 | 36 (13.1%) | 13 (0.9%) |
| $25,000 to $34,999 | 37 (13.5%) | 0 (0.0%) |
| $35,000 to $49,999 | 16 (5.8%) | 0 (0.0%) |
| $50,000 to $74,999 | 43 (15.6%) | 27 (1.9%) |
| $75,000 to $99,999 | 31 (11.3%) | 57 (4.0%) |
| $100,000 to $149,999 | 35 (12.7%) | 148 (10.4%) |
| $150,000 or more | 77 (28.0%) | 400 (28.0%) |
| Total | 275 (100.0%) | 1,429 (100.0%) |
Property Value to Household Income Ratio in Savage
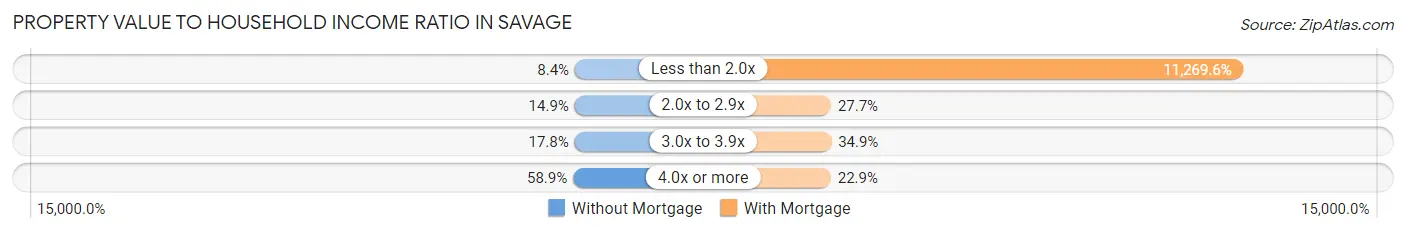
| Value-to-Income Ratio | Without Mortgage | With Mortgage |
| Less than 2.0x | 23 (8.4%) | 161,042 (11,269.6%) |
| 2.0x to 2.9x | 41 (14.9%) | 396 (27.7%) |
| 3.0x to 3.9x | 49 (17.8%) | 498 (34.8%) |
| 4.0x or more | 162 (58.9%) | 327 (22.9%) |
| Total | 275 (100.0%) | 1,429 (100.0%) |
Real Estate Taxes by Mortgage Status in Savage
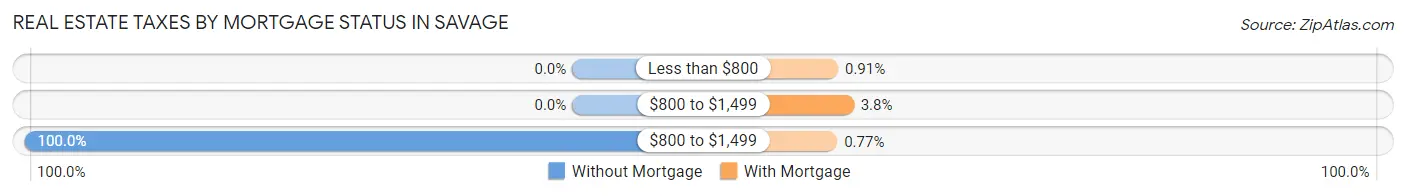
| Property Taxes | Without Mortgage | With Mortgage |
| Less than $800 | 0 (0.0%) | 13 (0.9%) |
| $800 to $1,499 | 0 (0.0%) | 54 (3.8%) |
| $800 to $1,499 | 275 (100.0%) | 11 (0.8%) |
| Total | 275 (100.0%) | 1,429 (100.0%) |
Health & Disability in Savage
Health Insurance Coverage by Age in Savage
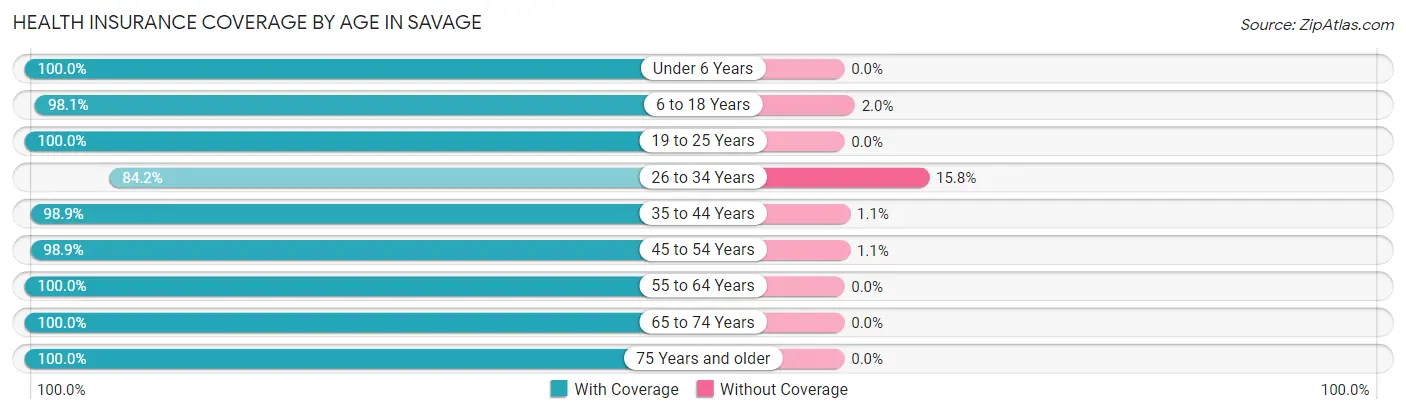
| Age Bracket | With Coverage | Without Coverage |
| Under 6 Years | 349 (100.0%) | 0 (0.0%) |
| 6 to 18 Years | 1,561 (98.1%) | 31 (1.9%) |
| 19 to 25 Years | 213 (100.0%) | 0 (0.0%) |
| 26 to 34 Years | 932 (84.2%) | 175 (15.8%) |
| 35 to 44 Years | 1,455 (98.9%) | 16 (1.1%) |
| 45 to 54 Years | 934 (98.9%) | 10 (1.1%) |
| 55 to 64 Years | 894 (100.0%) | 0 (0.0%) |
| 65 to 74 Years | 440 (100.0%) | 0 (0.0%) |
| 75 Years and older | 240 (100.0%) | 0 (0.0%) |
| Total | 7,018 (96.8%) | 232 (3.2%) |
Health Insurance Coverage by Citizenship Status in Savage
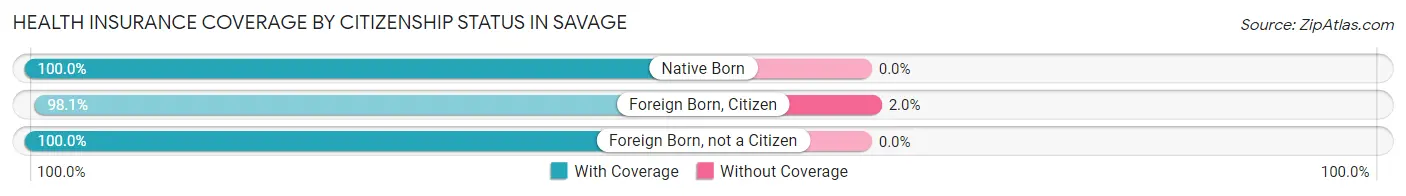
| Citizenship Status | With Coverage | Without Coverage |
| Native Born | 349 (100.0%) | 0 (0.0%) |
| Foreign Born, Citizen | 1,561 (98.1%) | 31 (1.9%) |
| Foreign Born, not a Citizen | 213 (100.0%) | 0 (0.0%) |
Health Insurance Coverage by Household Income in Savage
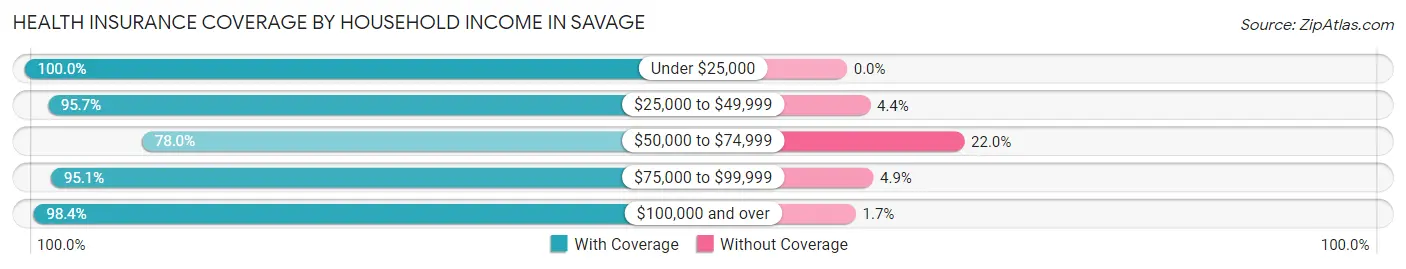
| Household Income | With Coverage | Without Coverage |
| Under $25,000 | 564 (100.0%) | 0 (0.0%) |
| $25,000 to $49,999 | 220 (95.7%) | 10 (4.3%) |
| $50,000 to $74,999 | 291 (78.0%) | 82 (22.0%) |
| $75,000 to $99,999 | 1,158 (95.1%) | 60 (4.9%) |
| $100,000 and over | 4,777 (98.4%) | 80 (1.7%) |
Public vs Private Health Insurance Coverage by Age in Savage
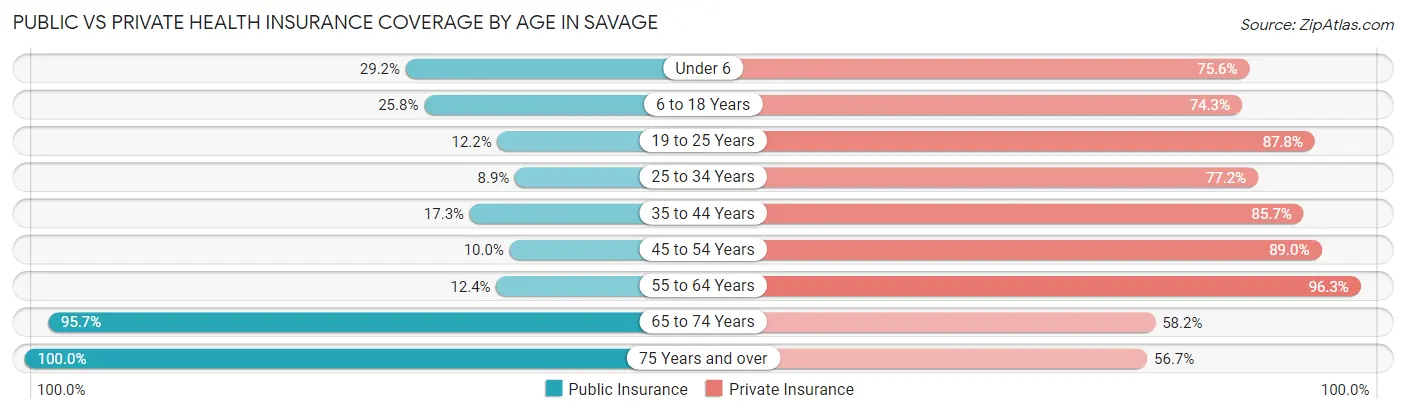
| Age Bracket | Public Insurance | Private Insurance |
| Under 6 | 102 (29.2%) | 264 (75.6%) |
| 6 to 18 Years | 411 (25.8%) | 1,182 (74.3%) |
| 19 to 25 Years | 26 (12.2%) | 187 (87.8%) |
| 25 to 34 Years | 99 (8.9%) | 855 (77.2%) |
| 35 to 44 Years | 255 (17.3%) | 1,261 (85.7%) |
| 45 to 54 Years | 94 (10.0%) | 840 (89.0%) |
| 55 to 64 Years | 111 (12.4%) | 861 (96.3%) |
| 65 to 74 Years | 421 (95.7%) | 256 (58.2%) |
| 75 Years and over | 240 (100.0%) | 136 (56.7%) |
| Total | 1,759 (24.3%) | 5,842 (80.6%) |
Disability Status by Sex by Age in Savage
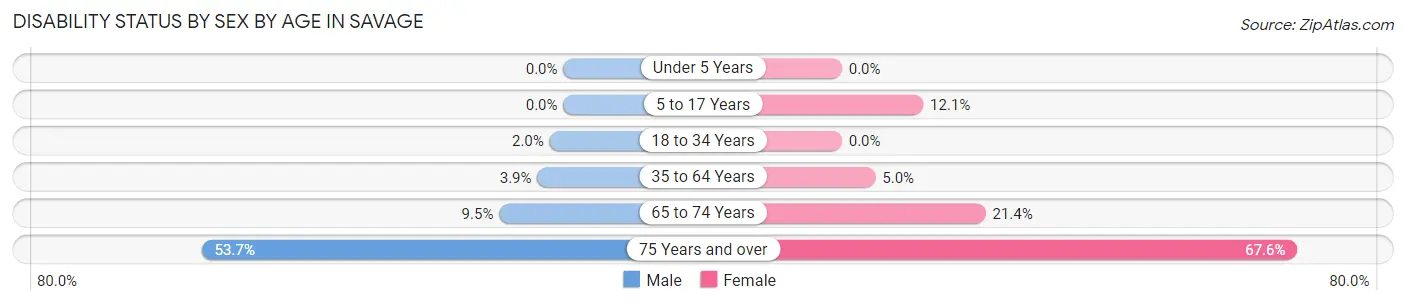
| Age Bracket | Male | Female |
| Under 5 Years | 0 (0.0%) | 0 (0.0%) |
| 5 to 17 Years | 0 (0.0%) | 82 (12.1%) |
| 18 to 34 Years | 18 (2.0%) | 0 (0.0%) |
| 35 to 64 Years | 65 (3.9%) | 81 (5.0%) |
| 65 to 74 Years | 8 (9.5%) | 76 (21.3%) |
| 75 Years and over | 36 (53.7%) | 117 (67.6%) |
Disability Class by Sex by Age in Savage
Disability Class: Hearing Difficulty
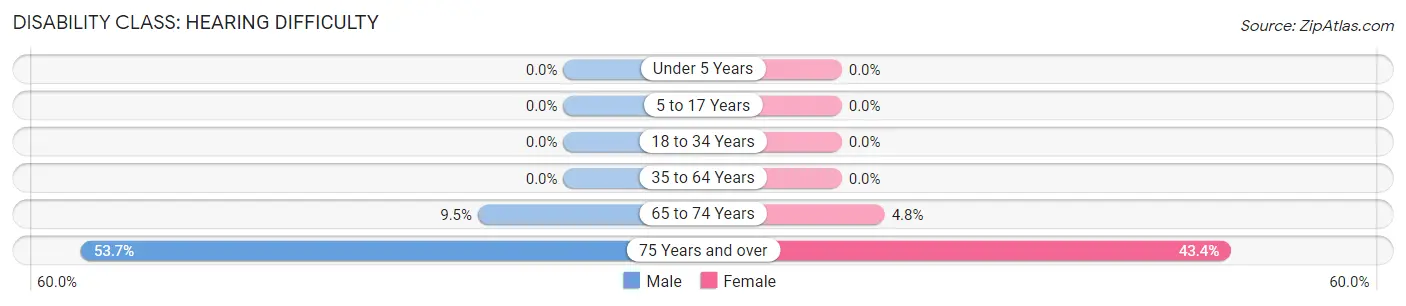
| Age Bracket | Male | Female |
| Under 5 Years | 0 (0.0%) | 0 (0.0%) |
| 5 to 17 Years | 0 (0.0%) | 0 (0.0%) |
| 18 to 34 Years | 0 (0.0%) | 0 (0.0%) |
| 35 to 64 Years | 0 (0.0%) | 0 (0.0%) |
| 65 to 74 Years | 8 (9.5%) | 17 (4.8%) |
| 75 Years and over | 36 (53.7%) | 75 (43.3%) |
Disability Class: Vision Difficulty
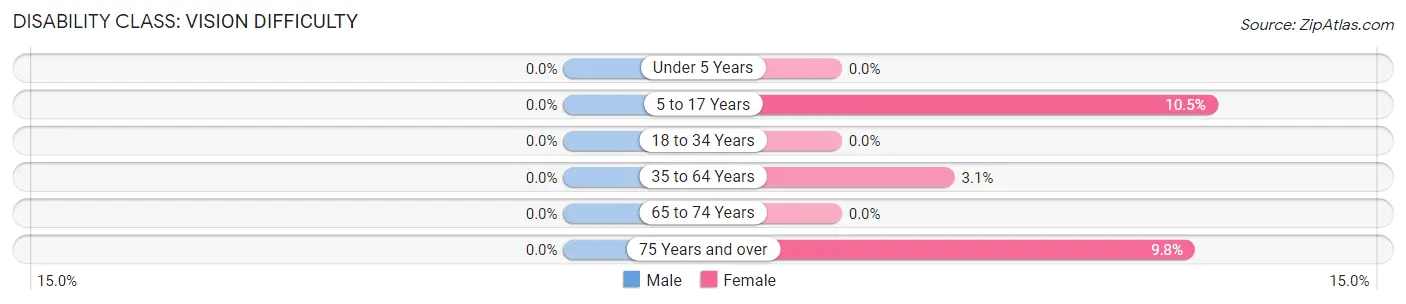
| Age Bracket | Male | Female |
| Under 5 Years | 0 (0.0%) | 0 (0.0%) |
| 5 to 17 Years | 0 (0.0%) | 71 (10.5%) |
| 18 to 34 Years | 0 (0.0%) | 0 (0.0%) |
| 35 to 64 Years | 0 (0.0%) | 51 (3.1%) |
| 65 to 74 Years | 0 (0.0%) | 0 (0.0%) |
| 75 Years and over | 0 (0.0%) | 17 (9.8%) |
Disability Class: Cognitive Difficulty
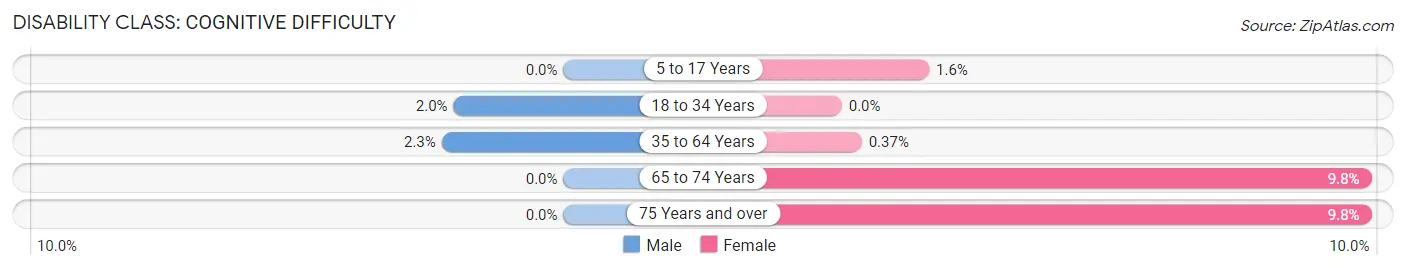
| Age Bracket | Male | Female |
| 5 to 17 Years | 0 (0.0%) | 11 (1.6%) |
| 18 to 34 Years | 18 (2.0%) | 0 (0.0%) |
| 35 to 64 Years | 38 (2.3%) | 6 (0.4%) |
| 65 to 74 Years | 0 (0.0%) | 35 (9.8%) |
| 75 Years and over | 0 (0.0%) | 17 (9.8%) |
Disability Class: Ambulatory Difficulty
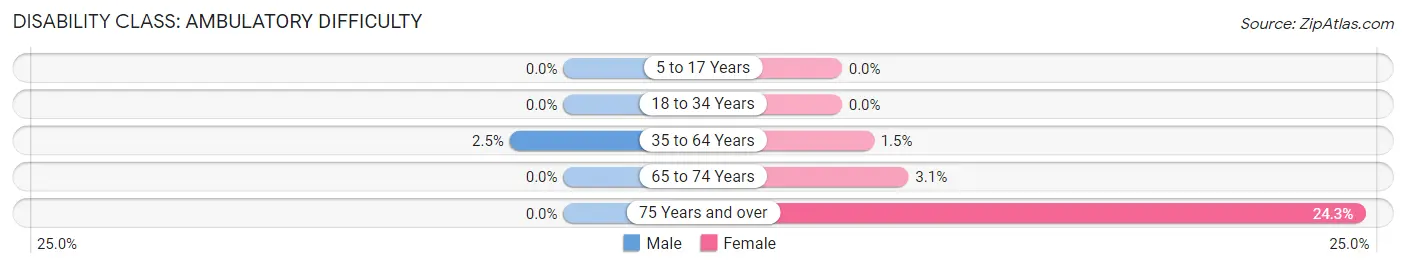
| Age Bracket | Male | Female |
| 5 to 17 Years | 0 (0.0%) | 0 (0.0%) |
| 18 to 34 Years | 0 (0.0%) | 0 (0.0%) |
| 35 to 64 Years | 42 (2.5%) | 24 (1.5%) |
| 65 to 74 Years | 0 (0.0%) | 11 (3.1%) |
| 75 Years and over | 0 (0.0%) | 42 (24.3%) |
Disability Class: Self-Care Difficulty
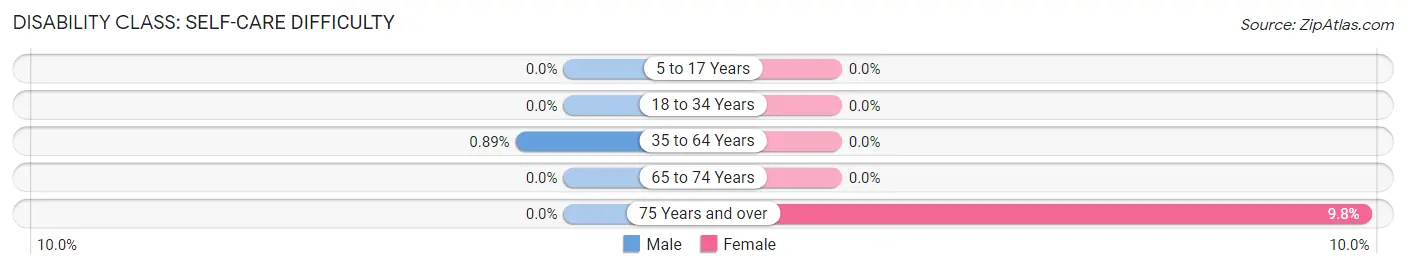
| Age Bracket | Male | Female |
| 5 to 17 Years | 0 (0.0%) | 0 (0.0%) |
| 18 to 34 Years | 0 (0.0%) | 0 (0.0%) |
| 35 to 64 Years | 15 (0.9%) | 0 (0.0%) |
| 65 to 74 Years | 0 (0.0%) | 0 (0.0%) |
| 75 Years and over | 0 (0.0%) | 17 (9.8%) |
Technology Access in Savage
Computing Device Access in Savage
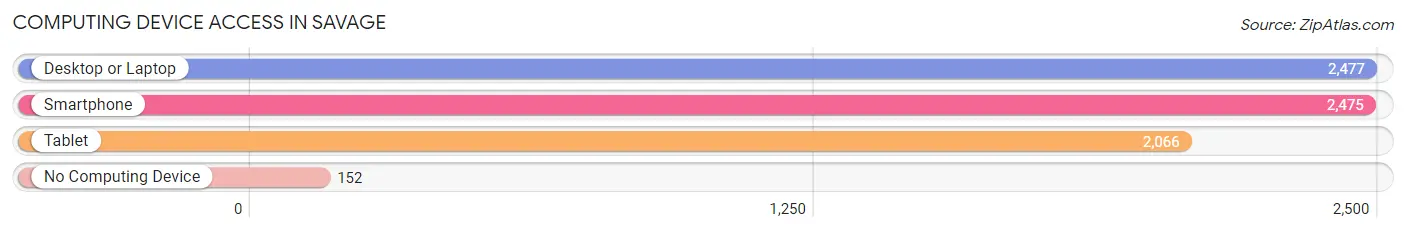
| Device Type | # Households | % Households |
| Desktop or Laptop | 2,477 | 89.7% |
| Smartphone | 2,475 | 89.6% |
| Tablet | 2,066 | 74.8% |
| No Computing Device | 152 | 5.5% |
| Total | 2,761 | 100.0% |
Internet Access in Savage
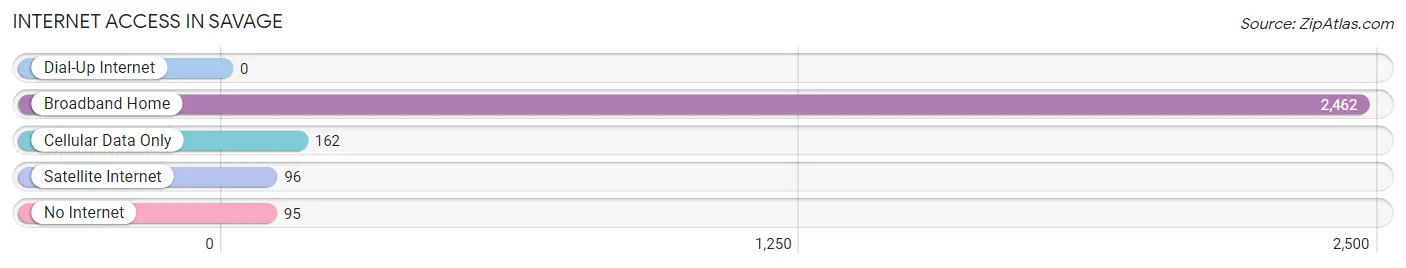
| Internet Type | # Households | % Households |
| Dial-Up Internet | 0 | 0.0% |
| Broadband Home | 2,462 | 89.2% |
| Cellular Data Only | 162 | 5.9% |
| Satellite Internet | 96 | 3.5% |
| No Internet | 95 | 3.4% |
| Total | 2,761 | 100.0% |
Savage Summary
Savage, Maryland is a small town located in Howard County, Maryland, about 20 miles northwest of Baltimore. The town is situated along the Patuxent River and is home to approximately 8,000 people. The town is known for its historic buildings, quaint downtown area, and its proximity to Washington, D.C. and Baltimore.
History
Savage was founded in 1822 by John Savage, a Quaker from Pennsylvania. He purchased the land from the local Native Americans and named the town after himself. The town was originally a farming community, but it soon became a hub for the local iron industry. The Savage Mill, built in 1822, was the first cotton mill in the United States to be powered by a steam engine. The mill was a major employer in the area and helped to spur the growth of the town.
In the late 19th century, Savage became a popular summer resort destination for wealthy Baltimoreans. The town was home to several large estates, including the Savage Mansion, which was built in 1845. The town also had a number of hotels, including the Savage Hotel, which was built in 1887.
Geography
Savage is located in Howard County, Maryland, about 20 miles northwest of Baltimore. The town is situated along the Patuxent River and is bordered by the towns of Laurel, Columbia, and Jessup. The town is located in a rural area and is surrounded by farmland and wooded areas.
Economy
Savage is a small town with a limited economy. The town is home to several small businesses, including restaurants, retail stores, and professional services. The town is also home to the Savage Mill, which is now a shopping center and office complex. The town is also home to a number of industrial and manufacturing businesses.
Demographics
As of the 2010 census, Savage had a population of 8,037 people. The racial makeup of the town was 79.3% White, 11.2% African American, 0.3% Native American, 4.2% Asian, 0.1% Pacific Islander, and 4.9% from other races. The median household income was $90,945, and the median family income was $103,945.
Savage is a small town with a rich history and a diverse population. The town is home to a number of historic buildings and is a popular destination for tourists. The town is also home to a number of businesses and is a great place to live for those looking for a quiet, rural lifestyle.
Common Questions
What is Per Capita Income in Savage?
Per Capita income in Savage is $49,430.
What is the Median Family Income in Savage?
Median Family Income in Savage is $139,884.
What is the Median Household income in Savage?
Median Household Income in Savage is $109,657.
What is Income or Wage Gap in Savage?
Income or Wage Gap in Savage is 28.4%.
Women in Savage earn 71.6 cents for every dollar earned by a man.
What is Inequality or Gini Index in Savage?
Inequality or Gini Index in Savage is 0.37.
What is the Total Population of Savage?
Total Population of Savage is 7,528.
What is the Total Male Population of Savage?
Total Male Population of Savage is 4,077.
What is the Total Female Population of Savage?
Total Female Population of Savage is 3,451.
What is the Ratio of Males per 100 Females in Savage?
There are 118.14 Males per 100 Females in Savage.
What is the Ratio of Females per 100 Males in Savage?
There are 84.65 Females per 100 Males in Savage.
What is the Median Population Age in Savage?
Median Population Age in Savage is 39.2 Years.
What is the Average Family Size in Savage
Average Family Size in Savage is 3.3 People.
What is the Average Household Size in Savage
Average Household Size in Savage is 2.7 People.
How Large is the Labor Force in Savage?
There are 4,535 People in the Labor Forcein in Savage.
What is the Percentage of People in the Labor Force in Savage?
77.8% of People are in the Labor Force in Savage.
What is the Unemployment Rate in Savage?
Unemployment Rate in Savage is 4.9%.