Mayflower Village, CA Map & Demographics
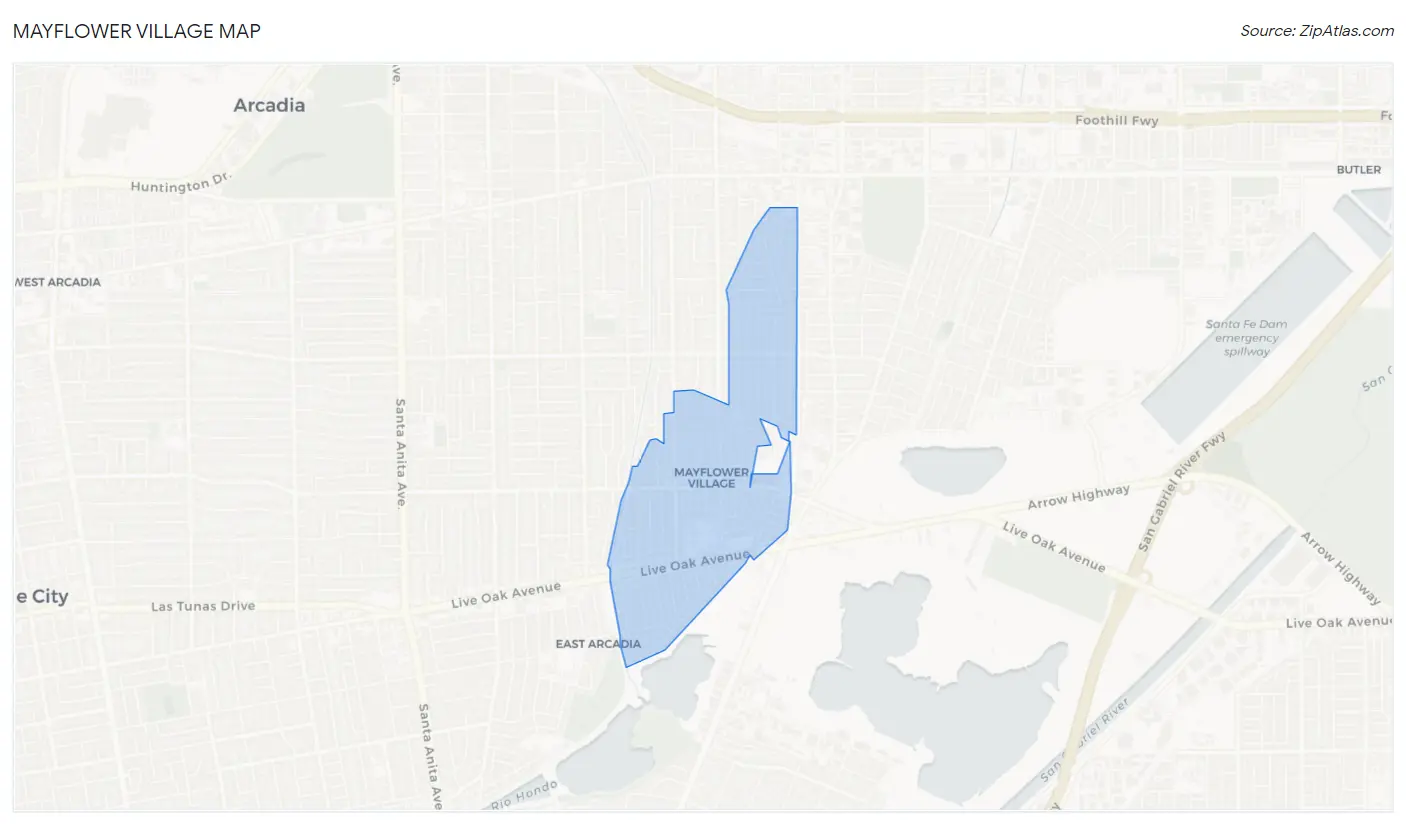
Mayflower Village Map
Mayflower Village Overview
$37,745
PER CAPITA INCOME
$125,429
AVG FAMILY INCOME
$98,250
AVG HOUSEHOLD INCOME
42.0%
WAGE / INCOME GAP [ % ]
58.0¢/ $1
WAGE / INCOME GAP [ $ ]
0.40
INEQUALITY / GINI INDEX
5,209
TOTAL POPULATION
2,448
MALE POPULATION
2,761
FEMALE POPULATION
88.66
MALES / 100 FEMALES
112.79
FEMALES / 100 MALES
49.6
MEDIAN AGE
3.8
AVG FAMILY SIZE
2.9
AVG HOUSEHOLD SIZE
2,660
LABOR FORCE [ PEOPLE ]
61.9%
PERCENT IN LABOR FORCE
3.2%
UNEMPLOYMENT RATE
Income in Mayflower Village
Income Overview in Mayflower Village
Per Capita Income in Mayflower Village is $37,745, while median incomes of families and households are $125,429 and $98,250 respectively.
| Characteristic | Number | Measure |
| Per Capita Income | 5,209 | $37,745 |
| Median Family Income | 1,140 | $125,429 |
| Mean Family Income | 1,140 | $126,842 |
| Median Household Income | 1,786 | $98,250 |
| Mean Household Income | 1,786 | $105,989 |
| Income Deficit | 1,140 | $0 |
| Wage / Income Gap (%) | 5,209 | 41.95% |
| Wage / Income Gap ($) | 5,209 | 58.05¢ per $1 |
| Gini / Inequality Index | 5,209 | 0.40 |
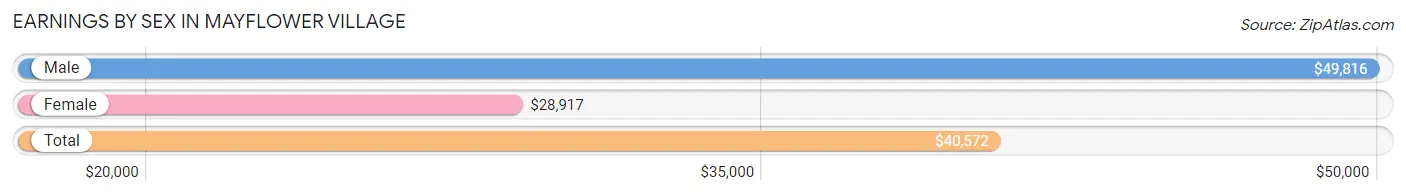
Earnings by Sex in Mayflower Village
Average Earnings in Mayflower Village are $40,572, $49,816 for men and $28,917 for women, a difference of 41.9%.
| Sex | Number | Average Earnings |
| Male | 1,335 (48.5%) | $49,816 |
| Female | 1,420 (51.5%) | $28,917 |
| Total | 2,755 (100.0%) | $40,572 |
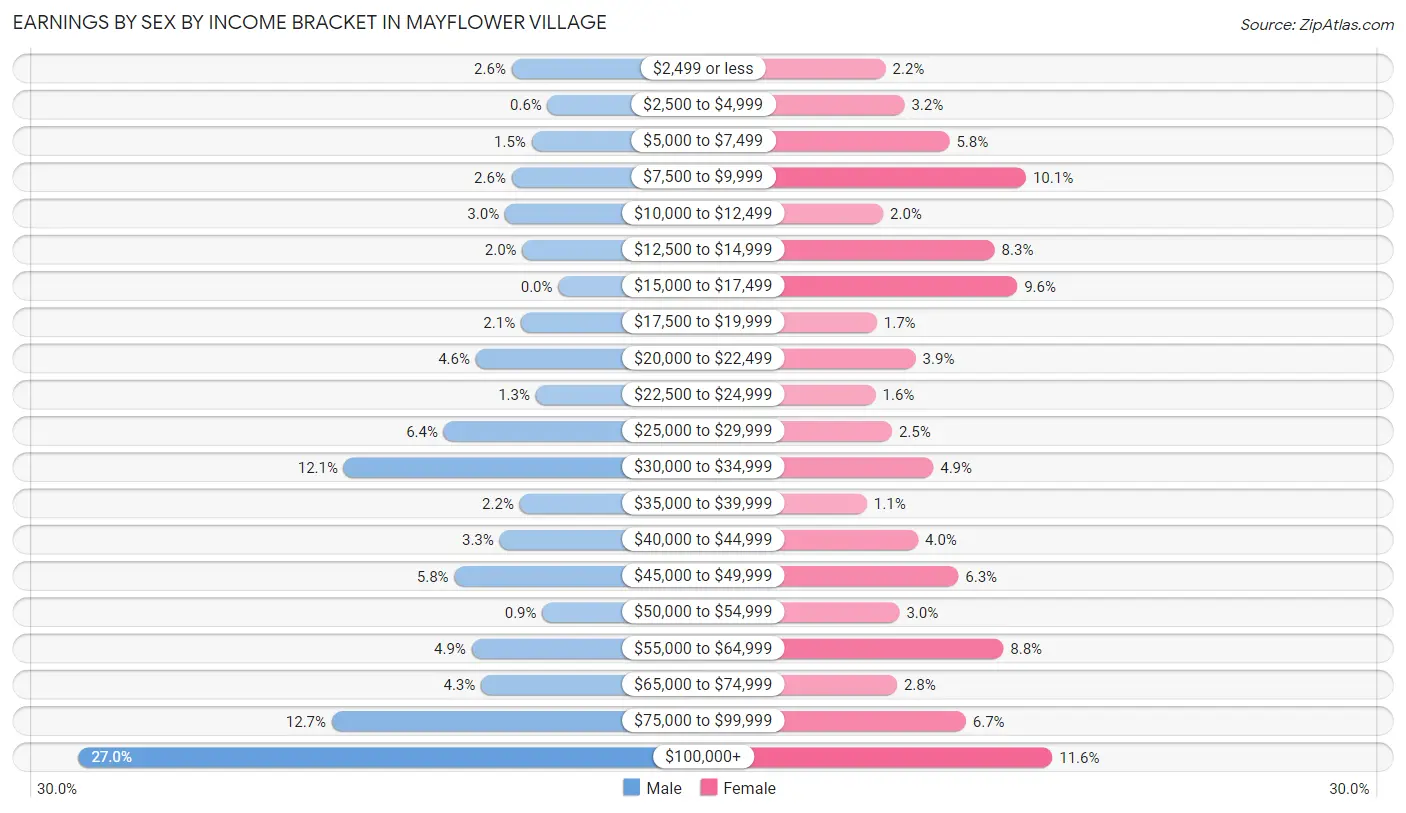
Earnings by Sex by Income Bracket in Mayflower Village
The most common earnings brackets in Mayflower Village are $100,000+ for men (360 | 27.0%) and $100,000+ for women (164 | 11.6%).
| Income | Male | Female |
| $2,499 or less | 35 (2.6%) | 31 (2.2%) |
| $2,500 to $4,999 | 8 (0.6%) | 46 (3.2%) |
| $5,000 to $7,499 | 20 (1.5%) | 82 (5.8%) |
| $7,500 to $9,999 | 35 (2.6%) | 143 (10.1%) |
| $10,000 to $12,499 | 40 (3.0%) | 29 (2.0%) |
| $12,500 to $14,999 | 27 (2.0%) | 118 (8.3%) |
| $15,000 to $17,499 | 0 (0.0%) | 136 (9.6%) |
| $17,500 to $19,999 | 28 (2.1%) | 24 (1.7%) |
| $20,000 to $22,499 | 62 (4.6%) | 55 (3.9%) |
| $22,500 to $24,999 | 17 (1.3%) | 23 (1.6%) |
| $25,000 to $29,999 | 86 (6.4%) | 36 (2.5%) |
| $30,000 to $34,999 | 161 (12.1%) | 69 (4.9%) |
| $35,000 to $39,999 | 29 (2.2%) | 16 (1.1%) |
| $40,000 to $44,999 | 44 (3.3%) | 57 (4.0%) |
| $45,000 to $49,999 | 78 (5.8%) | 89 (6.3%) |
| $50,000 to $54,999 | 12 (0.9%) | 42 (3.0%) |
| $55,000 to $64,999 | 65 (4.9%) | 125 (8.8%) |
| $65,000 to $74,999 | 58 (4.3%) | 40 (2.8%) |
| $75,000 to $99,999 | 170 (12.7%) | 95 (6.7%) |
| $100,000+ | 360 (27.0%) | 164 (11.6%) |
| Total | 1,335 (100.0%) | 1,420 (100.0%) |
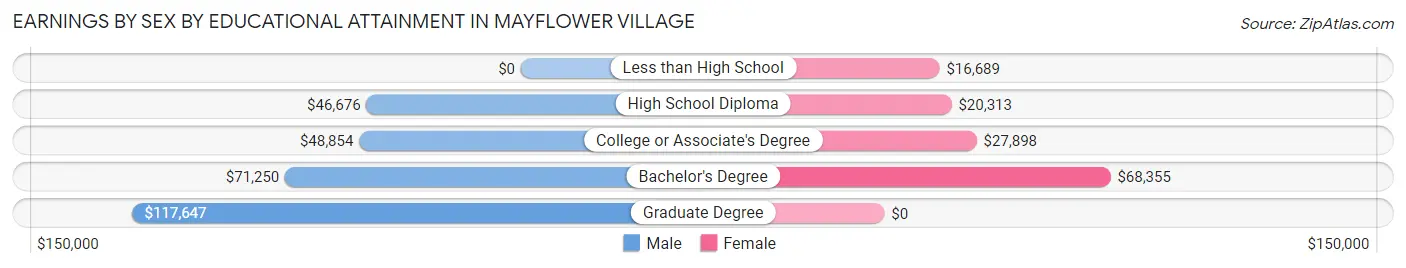
Earnings by Sex by Educational Attainment in Mayflower Village
Average earnings in Mayflower Village are $58,456 for men and $33,065 for women, a difference of 43.4%. Men with an educational attainment of graduate degree enjoy the highest average annual earnings of $117,647, while those with high school diploma education earn the least with $46,676. Women with an educational attainment of bachelor's degree earn the most with the average annual earnings of $68,355, while those with less than high school education have the smallest earnings of $16,689.
| Educational Attainment | Male Income | Female Income |
| Less than High School | - | - |
| High School Diploma | $46,676 | $20,313 |
| College or Associate's Degree | $48,854 | $27,898 |
| Bachelor's Degree | $71,250 | $68,355 |
| Graduate Degree | $117,647 | $0 |
| Total | $58,456 | $33,065 |
Family Income in Mayflower Village
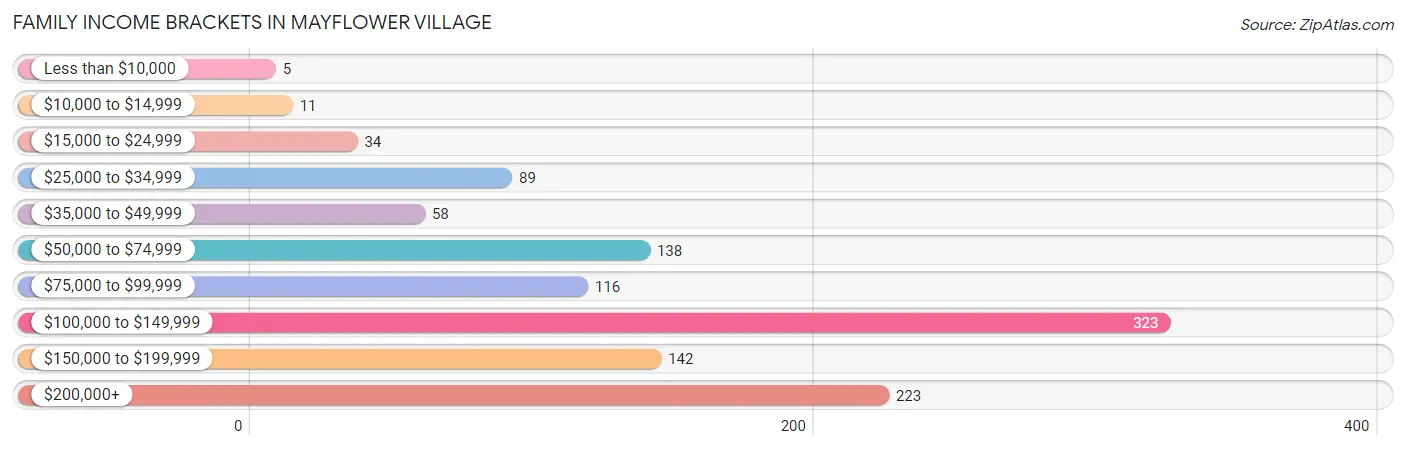
Family Income Brackets in Mayflower Village
According to the Mayflower Village family income data, there are 323 families falling into the $100,000 to $149,999 income range, which is the most common income bracket and makes up 28.3% of all families. Conversely, the less than $10,000 income bracket is the least frequent group with only 5 families (0.4%) belonging to this category.
| Income Bracket | # Families | % Families |
| Less than $10,000 | 5 | 0.4% |
| $10,000 to $14,999 | 11 | 1.0% |
| $15,000 to $24,999 | 34 | 3.0% |
| $25,000 to $34,999 | 89 | 7.8% |
| $35,000 to $49,999 | 58 | 5.1% |
| $50,000 to $74,999 | 138 | 12.1% |
| $75,000 to $99,999 | 116 | 10.2% |
| $100,000 to $149,999 | 323 | 28.3% |
| $150,000 to $199,999 | 142 | 12.5% |
| $200,000+ | 223 | 19.6% |
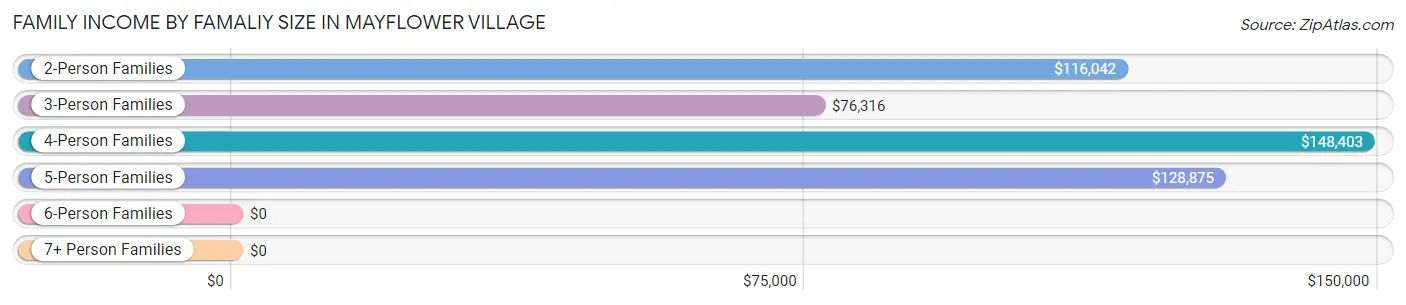
Family Income by Famaliy Size in Mayflower Village
4-person families (328 | 28.8%) account for the highest median family income in Mayflower Village with $148,403 per family, while 2-person families (350 | 30.7%) have the highest median income of $58,021 per family member.
| Income Bracket | # Families | Median Income |
| 2-Person Families | 350 (30.7%) | $116,042 |
| 3-Person Families | 270 (23.7%) | $76,316 |
| 4-Person Families | 328 (28.8%) | $148,403 |
| 5-Person Families | 84 (7.4%) | $128,875 |
| 6-Person Families | 61 (5.3%) | $0 |
| 7+ Person Families | 47 (4.1%) | $0 |
| Total | 1,140 (100.0%) | $125,429 |
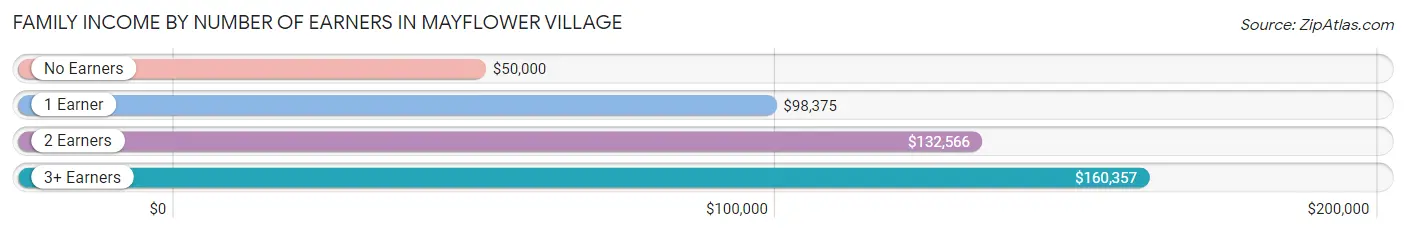
Family Income by Number of Earners in Mayflower Village
The median family income in Mayflower Village is $125,429, with families comprising 3+ earners (272) having the highest median family income of $160,357, while families with no earners (158) have the lowest median family income of $50,000, accounting for 23.9% and 13.9% of families, respectively.
| Number of Earners | # Families | Median Income |
| No Earners | 158 (13.9%) | $50,000 |
| 1 Earner | 235 (20.6%) | $98,375 |
| 2 Earners | 475 (41.7%) | $132,566 |
| 3+ Earners | 272 (23.9%) | $160,357 |
| Total | 1,140 (100.0%) | $125,429 |
Household Income in Mayflower Village
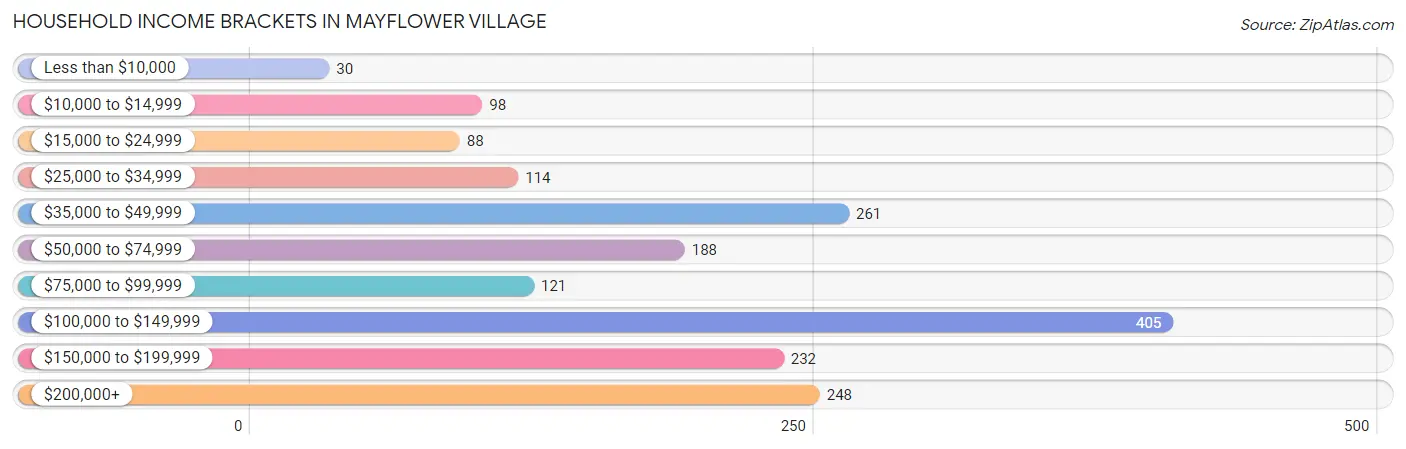
Household Income Brackets in Mayflower Village
With 405 households falling in the category, the $100,000 to $149,999 income range is the most frequent in Mayflower Village, accounting for 22.7% of all households. In contrast, only 30 households (1.7%) fall into the less than $10,000 income bracket, making it the least populous group.
| Income Bracket | # Households | % Households |
| Less than $10,000 | 30 | 1.7% |
| $10,000 to $14,999 | 98 | 5.5% |
| $15,000 to $24,999 | 88 | 4.9% |
| $25,000 to $34,999 | 114 | 6.4% |
| $35,000 to $49,999 | 261 | 14.6% |
| $50,000 to $74,999 | 188 | 10.5% |
| $75,000 to $99,999 | 121 | 6.8% |
| $100,000 to $149,999 | 405 | 22.7% |
| $150,000 to $199,999 | 232 | 13.0% |
| $200,000+ | 248 | 13.9% |
Household Income by Householder Age in Mayflower Village
The median household income in Mayflower Village is $98,250, with the highest median household income of $134,167 found in the 45 to 64 years age bracket for the primary householder. A total of 684 households (38.3%) fall into this category. Meanwhile, the 15 to 24 years age bracket for the primary householder has the lowest median household income of $0, with 11 households (0.6%) in this group.
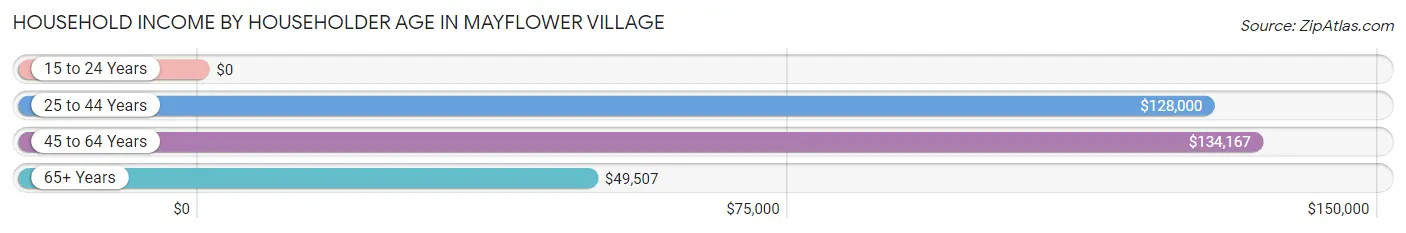
| Income Bracket | # Households | Median Income |
| 15 to 24 Years | 11 (0.6%) | $0 |
| 25 to 44 Years | 242 (13.6%) | $128,000 |
| 45 to 64 Years | 684 (38.3%) | $134,167 |
| 65+ Years | 849 (47.5%) | $49,507 |
| Total | 1,786 (100.0%) | $98,250 |
Poverty in Mayflower Village
Income Below Poverty by Sex and Age in Mayflower Village
With 6.4% poverty level for males and 10.4% for females among the residents of Mayflower Village, 75 year old and over males and 5 year old females are the most vulnerable to poverty, with 31 males (15.1%) and 28 females (73.7%) in their respective age groups living below the poverty level.
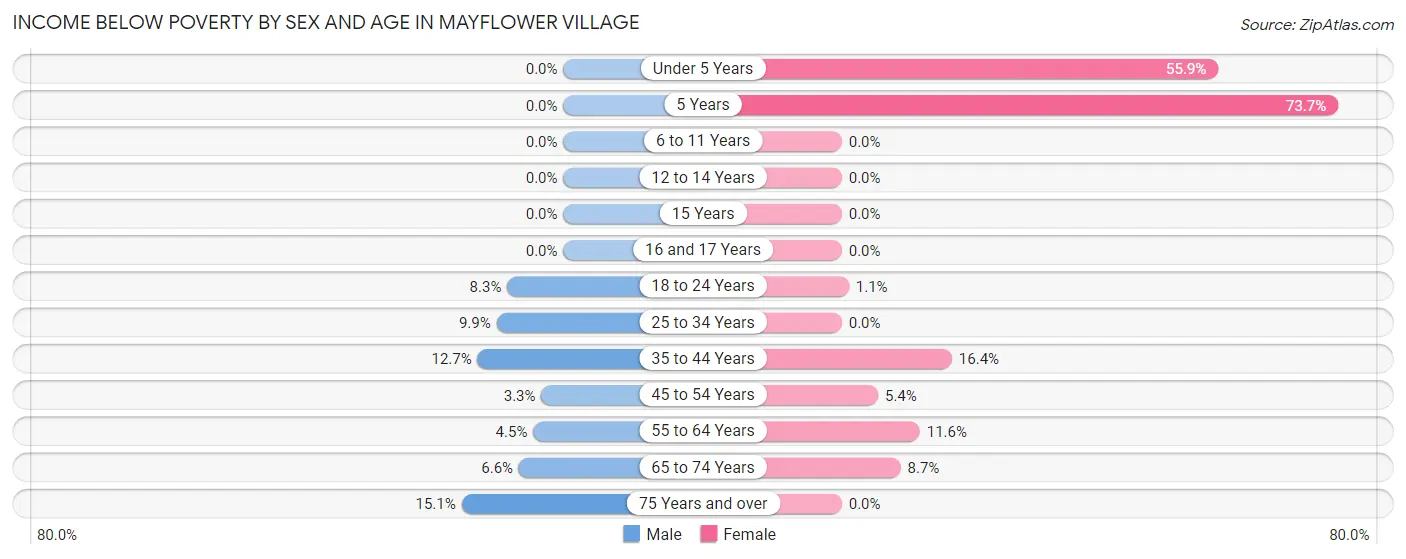
| Age Bracket | Male | Female |
| Under 5 Years | 0 (0.0%) | 95 (55.9%) |
| 5 Years | 0 (0.0%) | 28 (73.7%) |
| 6 to 11 Years | 0 (0.0%) | 0 (0.0%) |
| 12 to 14 Years | 0 (0.0%) | 0 (0.0%) |
| 15 Years | 0 (0.0%) | 0 (0.0%) |
| 16 and 17 Years | 0 (0.0%) | 0 (0.0%) |
| 18 to 24 Years | 10 (8.3%) | 2 (1.1%) |
| 25 to 34 Years | 13 (9.9%) | 0 (0.0%) |
| 35 to 44 Years | 46 (12.7%) | 51 (16.4%) |
| 45 to 54 Years | 12 (3.3%) | 21 (5.4%) |
| 55 to 64 Years | 16 (4.5%) | 41 (11.6%) |
| 65 to 74 Years | 28 (6.6%) | 50 (8.7%) |
| 75 Years and over | 31 (15.1%) | 0 (0.0%) |
| Total | 156 (6.4%) | 288 (10.4%) |
Income Above Poverty by Sex and Age in Mayflower Village
According to the poverty statistics in Mayflower Village, males aged under 5 years and females aged 6 to 11 years are the age groups that are most secure financially, with 100.0% of males and 100.0% of females in these age groups living above the poverty line.
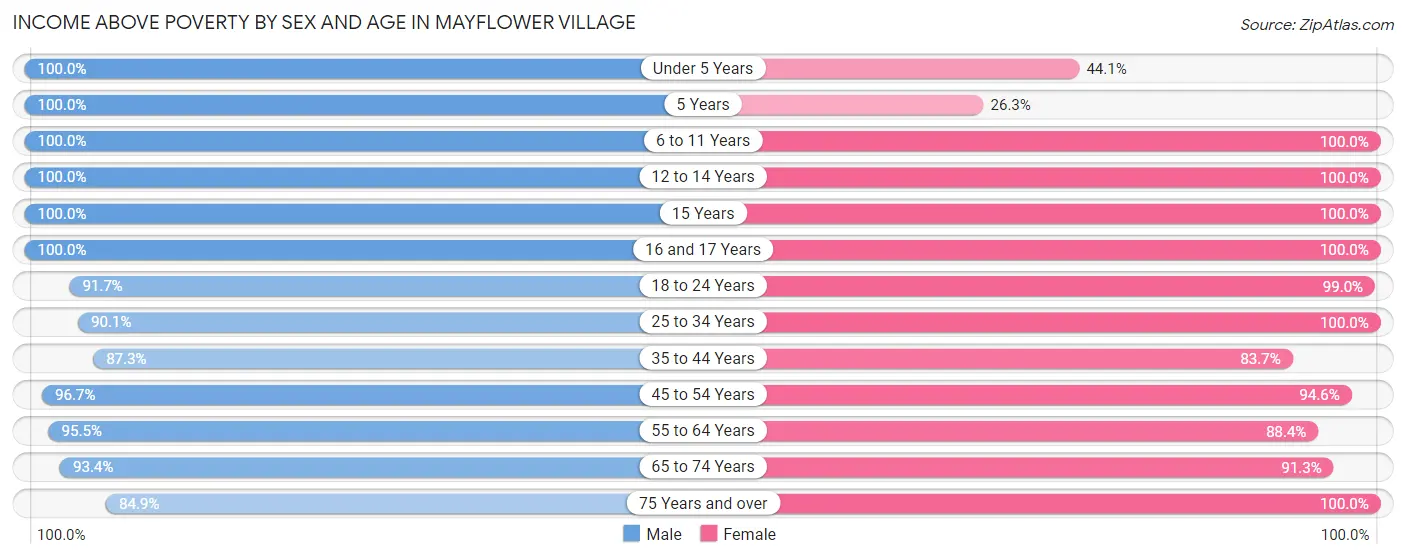
| Age Bracket | Male | Female |
| Under 5 Years | 26 (100.0%) | 75 (44.1%) |
| 5 Years | 76 (100.0%) | 10 (26.3%) |
| 6 to 11 Years | 302 (100.0%) | 97 (100.0%) |
| 12 to 14 Years | 34 (100.0%) | 137 (100.0%) |
| 15 Years | 18 (100.0%) | 14 (100.0%) |
| 16 and 17 Years | 25 (100.0%) | 42 (100.0%) |
| 18 to 24 Years | 110 (91.7%) | 189 (99.0%) |
| 25 to 34 Years | 118 (90.1%) | 196 (100.0%) |
| 35 to 44 Years | 315 (87.3%) | 261 (83.7%) |
| 45 to 54 Years | 356 (96.7%) | 369 (94.6%) |
| 55 to 64 Years | 342 (95.5%) | 313 (88.4%) |
| 65 to 74 Years | 396 (93.4%) | 523 (91.3%) |
| 75 Years and over | 174 (84.9%) | 247 (100.0%) |
| Total | 2,292 (93.6%) | 2,473 (89.6%) |
Income Below Poverty Among Married-Couple Families in Mayflower Village
The poverty statistics for married-couple families in Mayflower Village show that 2.6% or 23 of the total 873 families live below the poverty line. Families with 3 or 4 children have the highest poverty rate of 41.9%, comprising of 18 families. On the other hand, families with 1 or 2 children have the lowest poverty rate of 0.0%, which includes 0 families.
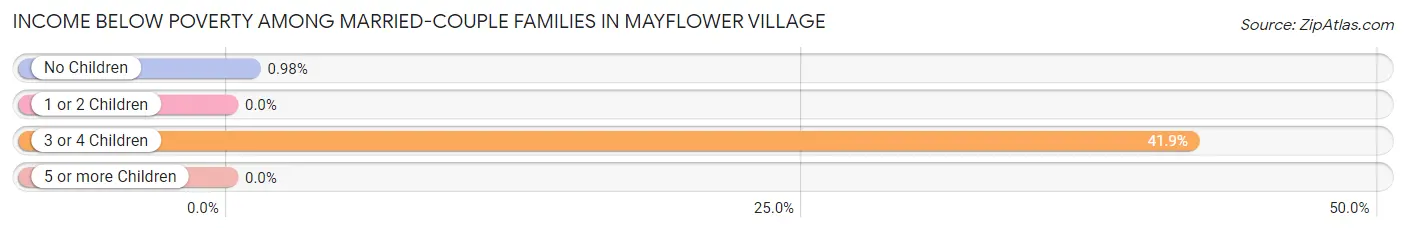
| Children | Above Poverty | Below Poverty |
| No Children | 507 (99.0%) | 5 (1.0%) |
| 1 or 2 Children | 318 (100.0%) | 0 (0.0%) |
| 3 or 4 Children | 25 (58.1%) | 18 (41.9%) |
| 5 or more Children | 0 (0.0%) | 0 (0.0%) |
| Total | 850 (97.4%) | 23 (2.6%) |
Income Below Poverty Among Single-Parent Households in Mayflower Village
According to the poverty data in Mayflower Village, 15.4% or 16 single-father households and 6.8% or 11 single-mother households are living below the poverty line. Among single-father households, those with no children have the highest poverty rate, with 16 households (28.6%) experiencing poverty. Likewise, among single-mother households, those with no children have the highest poverty rate, with 11 households (9.5%) falling below the poverty line.
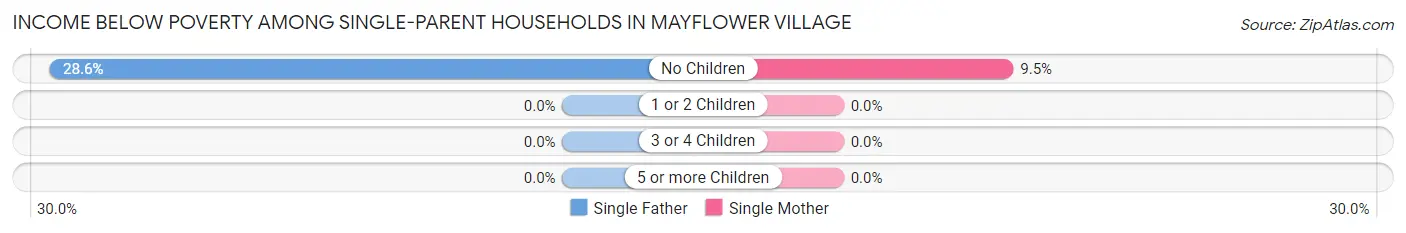
| Children | Single Father | Single Mother |
| No Children | 16 (28.6%) | 11 (9.5%) |
| 1 or 2 Children | 0 (0.0%) | 0 (0.0%) |
| 3 or 4 Children | 0 (0.0%) | 0 (0.0%) |
| 5 or more Children | 0 (0.0%) | 0 (0.0%) |
| Total | 16 (15.4%) | 11 (6.8%) |
Income Below Poverty Among Married-Couple vs Single-Parent Households in Mayflower Village
The poverty data for Mayflower Village shows that 23 of the married-couple family households (2.6%) and 27 of the single-parent households (10.1%) are living below the poverty level. Within the married-couple family households, those with 3 or 4 children have the highest poverty rate, with 18 households (41.9%) falling below the poverty line. Among the single-parent households, those with no children have the highest poverty rate, with 27 household (15.7%) living below poverty.
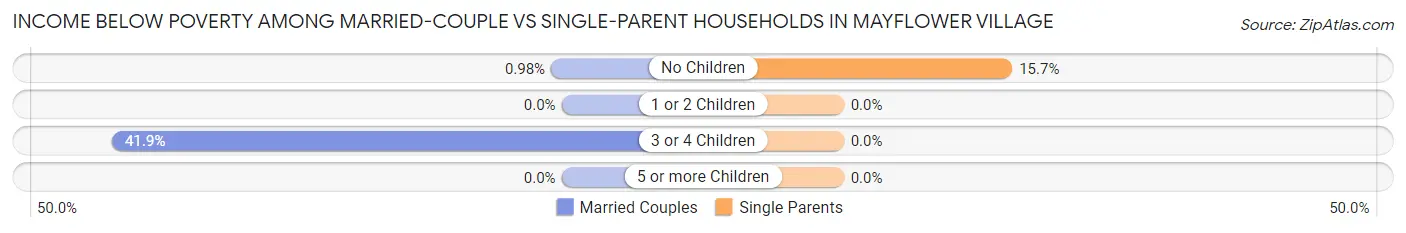
| Children | Married-Couple Families | Single-Parent Households |
| No Children | 5 (1.0%) | 27 (15.7%) |
| 1 or 2 Children | 0 (0.0%) | 0 (0.0%) |
| 3 or 4 Children | 18 (41.9%) | 0 (0.0%) |
| 5 or more Children | 0 (0.0%) | 0 (0.0%) |
| Total | 23 (2.6%) | 27 (10.1%) |
Race in Mayflower Village
The most populous races in Mayflower Village are Hispanic or Latino (2,246 | 43.1%), White / Caucasian (1,939 | 37.2%), and Asian (1,338 | 25.7%).
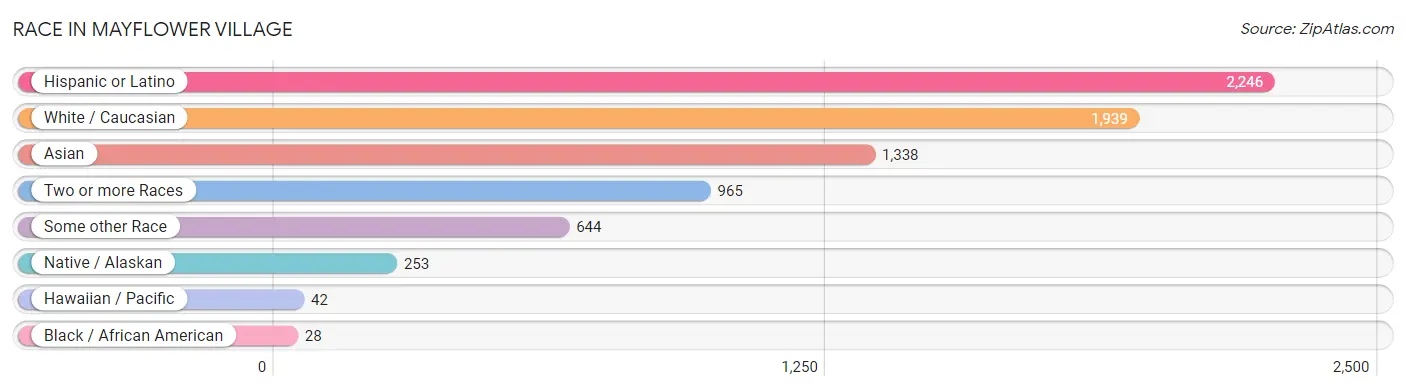
| Race | # Population | % Population |
| Asian | 1,338 | 25.7% |
| Black / African American | 28 | 0.5% |
| Hawaiian / Pacific | 42 | 0.8% |
| Hispanic or Latino | 2,246 | 43.1% |
| Native / Alaskan | 253 | 4.9% |
| White / Caucasian | 1,939 | 37.2% |
| Two or more Races | 965 | 18.5% |
| Some other Race | 644 | 12.4% |
| Total | 5,209 | 100.0% |
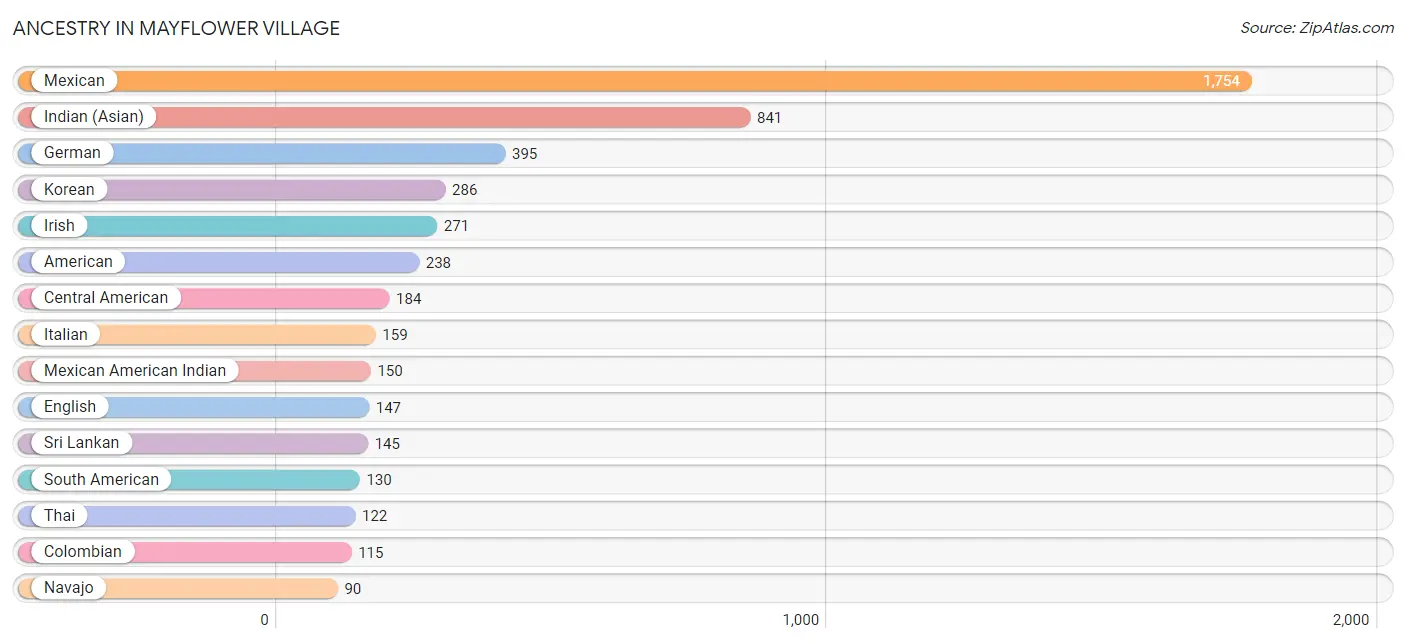
Ancestry in Mayflower Village
The most populous ancestries reported in Mayflower Village are Mexican (1,754 | 33.7%), Indian (Asian) (841 | 16.2%), German (395 | 7.6%), Korean (286 | 5.5%), and Irish (271 | 5.2%), together accounting for 68.1% of all Mayflower Village residents.
| Ancestry | # Population | % Population |
| American | 238 | 4.6% |
| Arab | 86 | 1.7% |
| Armenian | 9 | 0.2% |
| Austrian | 50 | 1.0% |
| Bhutanese | 17 | 0.3% |
| British | 43 | 0.8% |
| Burmese | 27 | 0.5% |
| Central American | 184 | 3.5% |
| Central American Indian | 31 | 0.6% |
| Colombian | 115 | 2.2% |
| Costa Rican | 13 | 0.3% |
| Cuban | 66 | 1.3% |
| Czechoslovakian | 7 | 0.1% |
| Danish | 5 | 0.1% |
| Dutch | 7 | 0.1% |
| Eastern European | 12 | 0.2% |
| Ecuadorian | 15 | 0.3% |
| Egyptian | 29 | 0.6% |
| English | 147 | 2.8% |
| Estonian | 22 | 0.4% |
| European | 8 | 0.2% |
| Filipino | 14 | 0.3% |
| French | 21 | 0.4% |
| German | 395 | 7.6% |
| Greek | 8 | 0.2% |
| Guatemalan | 84 | 1.6% |
| Hopi | 10 | 0.2% |
| Hungarian | 6 | 0.1% |
| Indian (Asian) | 841 | 16.2% |
| Indonesian | 53 | 1.0% |
| Iranian | 46 | 0.9% |
| Irish | 271 | 5.2% |
| Italian | 159 | 3.0% |
| Japanese | 16 | 0.3% |
| Korean | 286 | 5.5% |
| Laotian | 4 | 0.1% |
| Lebanese | 18 | 0.4% |
| Lithuanian | 4 | 0.1% |
| Malaysian | 28 | 0.5% |
| Maltese | 5 | 0.1% |
| Mexican | 1,754 | 33.7% |
| Mexican American Indian | 150 | 2.9% |
| Native Hawaiian | 73 | 1.4% |
| Navajo | 90 | 1.7% |
| Nicaraguan | 11 | 0.2% |
| Norwegian | 8 | 0.2% |
| Polish | 19 | 0.4% |
| Portuguese | 1 | 0.0% |
| Puerto Rican | 15 | 0.3% |
| Russian | 34 | 0.6% |
| Salvadoran | 76 | 1.5% |
| Scandinavian | 14 | 0.3% |
| Scotch-Irish | 39 | 0.7% |
| Scottish | 8 | 0.2% |
| South American | 130 | 2.5% |
| Spaniard | 1 | 0.0% |
| Spanish | 28 | 0.5% |
| Sri Lankan | 145 | 2.8% |
| Swedish | 30 | 0.6% |
| Swiss | 8 | 0.2% |
| Syrian | 8 | 0.2% |
| Thai | 122 | 2.3% |
| Ukrainian | 7 | 0.1% |
| West Indian | 31 | 0.6% | View All 64 Rows |
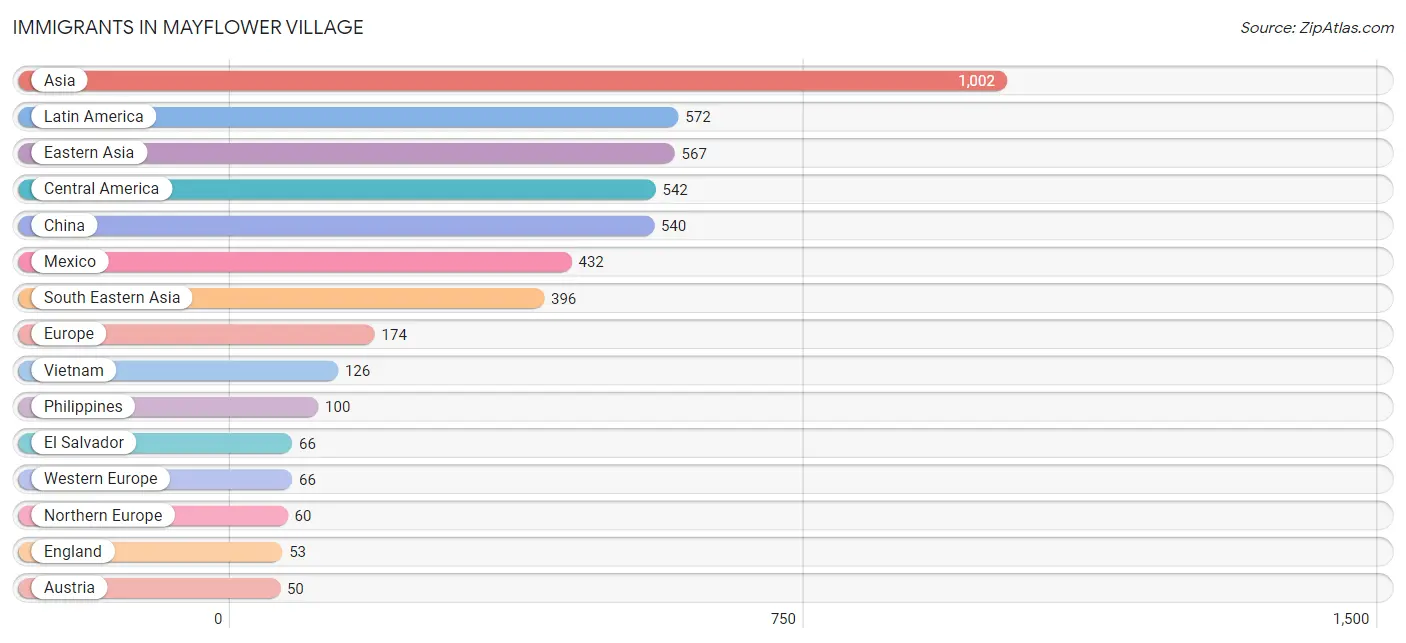
Immigrants in Mayflower Village
The most numerous immigrant groups reported in Mayflower Village came from Asia (1,002 | 19.2%), Latin America (572 | 11.0%), Eastern Asia (567 | 10.9%), Central America (542 | 10.4%), and China (540 | 10.4%), together accounting for 61.9% of all Mayflower Village residents.
| Immigration Origin | # Population | % Population |
| Africa | 9 | 0.2% |
| Asia | 1,002 | 19.2% |
| Austria | 50 | 1.0% |
| Caribbean | 30 | 0.6% |
| Central America | 542 | 10.4% |
| China | 540 | 10.4% |
| Cuba | 30 | 0.6% |
| Eastern Asia | 567 | 10.9% |
| Eastern Europe | 48 | 0.9% |
| Egypt | 9 | 0.2% |
| El Salvador | 66 | 1.3% |
| England | 53 | 1.0% |
| Europe | 174 | 3.3% |
| France | 1 | 0.0% |
| Germany | 15 | 0.3% |
| Guatemala | 23 | 0.4% |
| Honduras | 10 | 0.2% |
| Hong Kong | 48 | 0.9% |
| Indonesia | 13 | 0.3% |
| Korea | 27 | 0.5% |
| Laos | 28 | 0.5% |
| Latin America | 572 | 11.0% |
| Lebanon | 31 | 0.6% |
| Malaysia | 2 | 0.0% |
| Mexico | 432 | 8.3% |
| Nicaragua | 11 | 0.2% |
| Northern Africa | 9 | 0.2% |
| Northern Europe | 60 | 1.1% |
| Philippines | 100 | 1.9% |
| Poland | 12 | 0.2% |
| Scotland | 1 | 0.0% |
| Singapore | 10 | 0.2% |
| South Eastern Asia | 396 | 7.6% |
| Taiwan | 43 | 0.8% |
| Ukraine | 13 | 0.3% |
| Vietnam | 126 | 2.4% |
| Western Asia | 31 | 0.6% |
| Western Europe | 66 | 1.3% | View All 38 Rows |
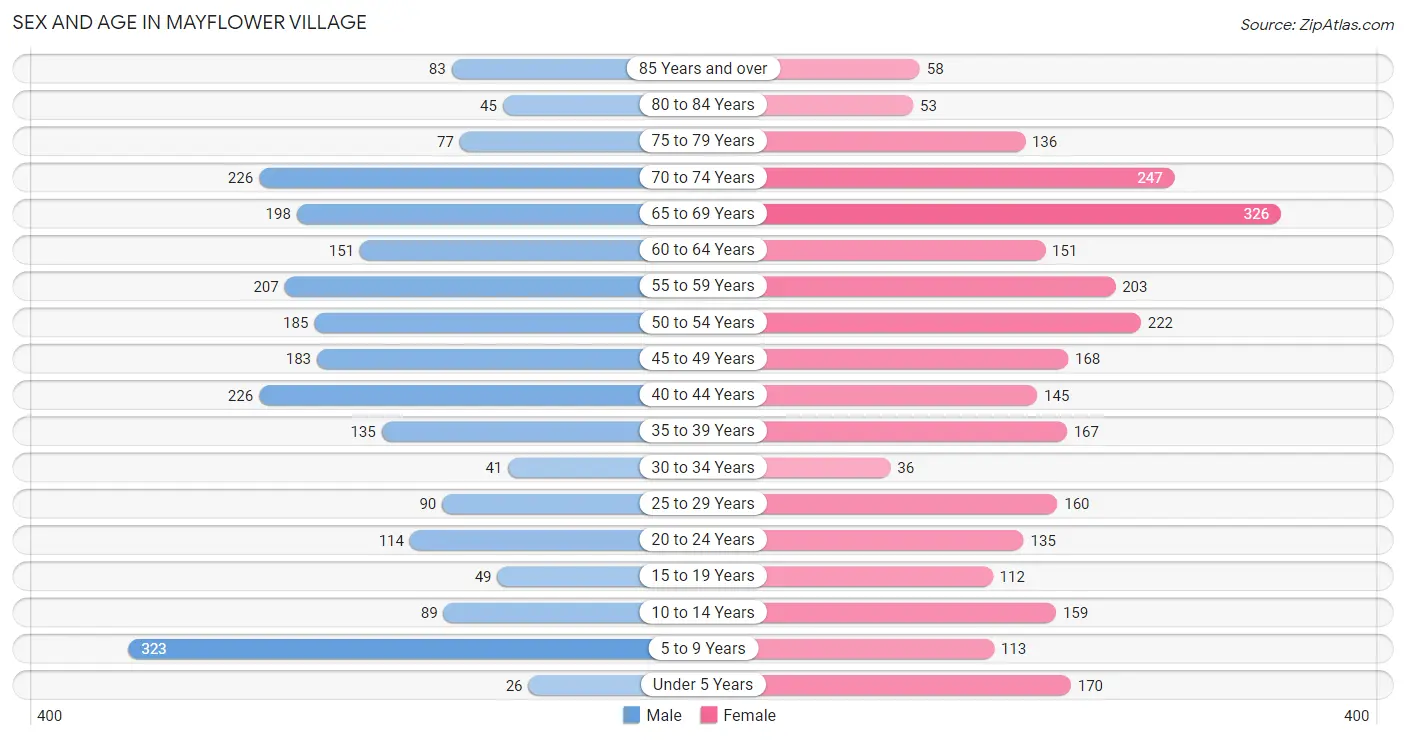
Sex and Age in Mayflower Village
Sex and Age in Mayflower Village
The most populous age groups in Mayflower Village are 5 to 9 Years (323 | 13.2%) for men and 65 to 69 Years (326 | 11.8%) for women.
| Age Bracket | Male | Female |
| Under 5 Years | 26 (1.1%) | 170 (6.2%) |
| 5 to 9 Years | 323 (13.2%) | 113 (4.1%) |
| 10 to 14 Years | 89 (3.6%) | 159 (5.8%) |
| 15 to 19 Years | 49 (2.0%) | 112 (4.1%) |
| 20 to 24 Years | 114 (4.7%) | 135 (4.9%) |
| 25 to 29 Years | 90 (3.7%) | 160 (5.8%) |
| 30 to 34 Years | 41 (1.7%) | 36 (1.3%) |
| 35 to 39 Years | 135 (5.5%) | 167 (6.0%) |
| 40 to 44 Years | 226 (9.2%) | 145 (5.2%) |
| 45 to 49 Years | 183 (7.5%) | 168 (6.1%) |
| 50 to 54 Years | 185 (7.6%) | 222 (8.0%) |
| 55 to 59 Years | 207 (8.5%) | 203 (7.3%) |
| 60 to 64 Years | 151 (6.2%) | 151 (5.5%) |
| 65 to 69 Years | 198 (8.1%) | 326 (11.8%) |
| 70 to 74 Years | 226 (9.2%) | 247 (8.9%) |
| 75 to 79 Years | 77 (3.2%) | 136 (4.9%) |
| 80 to 84 Years | 45 (1.8%) | 53 (1.9%) |
| 85 Years and over | 83 (3.4%) | 58 (2.1%) |
| Total | 2,448 (100.0%) | 2,761 (100.0%) |
Families and Households in Mayflower Village
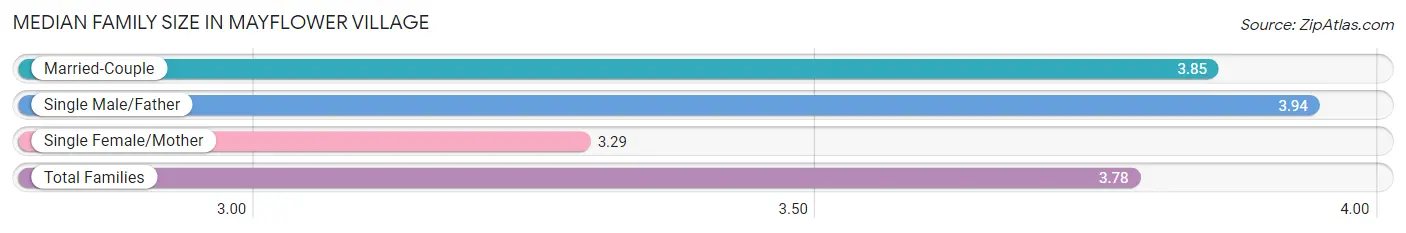
Median Family Size in Mayflower Village
The median family size in Mayflower Village is 3.78 persons per family, with single male/father families (104 | 9.1%) accounting for the largest median family size of 3.94 persons per family. On the other hand, single female/mother families (163 | 14.3%) represent the smallest median family size with 3.29 persons per family.
| Family Type | # Families | Family Size |
| Married-Couple | 873 (76.6%) | 3.85 |
| Single Male/Father | 104 (9.1%) | 3.94 |
| Single Female/Mother | 163 (14.3%) | 3.29 |
| Total Families | 1,140 (100.0%) | 3.78 |
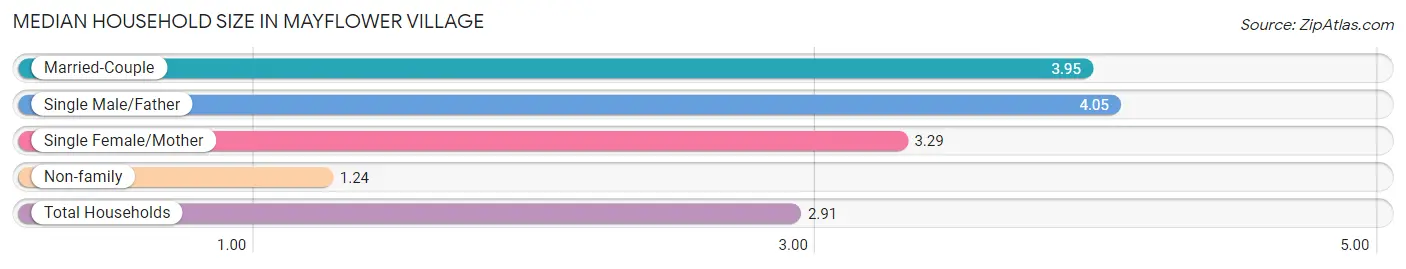
Median Household Size in Mayflower Village
The median household size in Mayflower Village is 2.91 persons per household, with single male/father households (104 | 5.8%) accounting for the largest median household size of 4.05 persons per household. non-family households (646 | 36.2%) represent the smallest median household size with 1.24 persons per household.
| Household Type | # Households | Household Size |
| Married-Couple | 873 (48.9%) | 3.95 |
| Single Male/Father | 104 (5.8%) | 4.05 |
| Single Female/Mother | 163 (9.1%) | 3.29 |
| Non-family | 646 (36.2%) | 1.24 |
| Total Households | 1,786 (100.0%) | 2.91 |
Household Size by Marriage Status in Mayflower Village
Out of a total of 1,786 households in Mayflower Village, 1,140 (63.8%) are family households, while 646 (36.2%) are nonfamily households. The most numerous type of family households are 2-person households, comprising 348, and the most common type of nonfamily households are 1-person households, comprising 508.
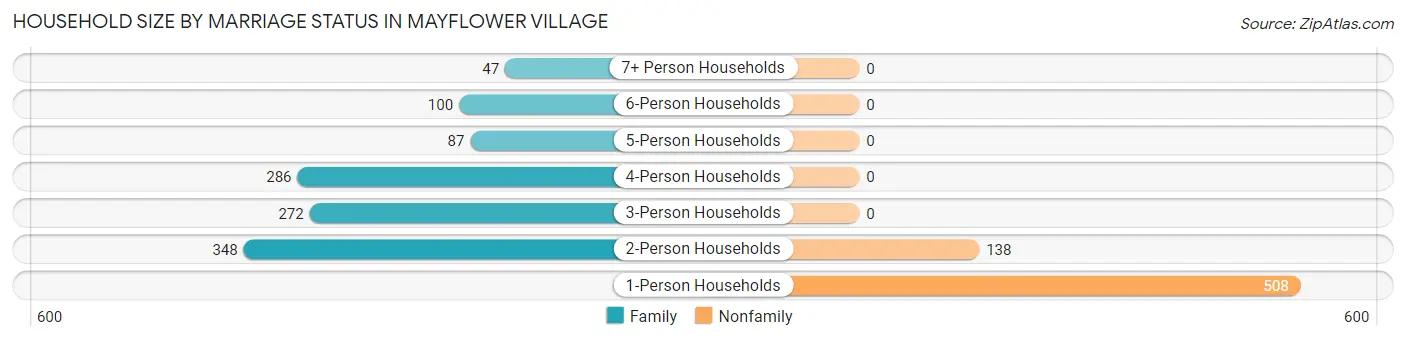
| Household Size | Family Households | Nonfamily Households |
| 1-Person Households | - | 508 (28.4%) |
| 2-Person Households | 348 (19.5%) | 138 (7.7%) |
| 3-Person Households | 272 (15.2%) | 0 (0.0%) |
| 4-Person Households | 286 (16.0%) | 0 (0.0%) |
| 5-Person Households | 87 (4.9%) | 0 (0.0%) |
| 6-Person Households | 100 (5.6%) | 0 (0.0%) |
| 7+ Person Households | 47 (2.6%) | 0 (0.0%) |
| Total | 1,140 (63.8%) | 646 (36.2%) |
Female Fertility in Mayflower Village
Fertility by Age in Mayflower Village
Average fertility rate in Mayflower Village is 26.0 births per 1,000 women. Women in the age bracket of 35 to 50 years have the highest fertility rate with 36.0 births per 1,000 women. Women in the age bracket of 35 to 50 years acount for 76.0% of all women with births.
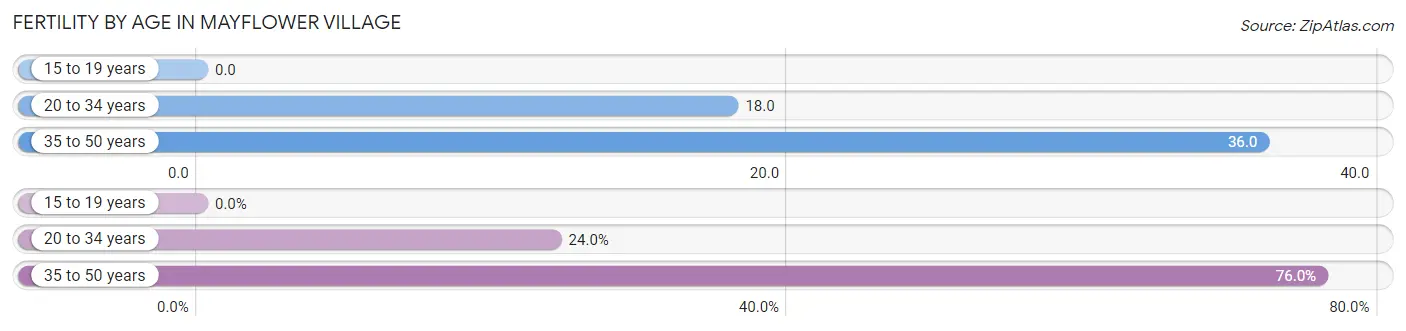
| Age Bracket | Women with Births | Births / 1,000 Women |
| 15 to 19 years | 0 (0.0%) | 0.0 |
| 20 to 34 years | 6 (24.0%) | 18.0 |
| 35 to 50 years | 19 (76.0%) | 36.0 |
| Total | 25 (100.0%) | 26.0 |
Fertility by Age by Marriage Status in Mayflower Village
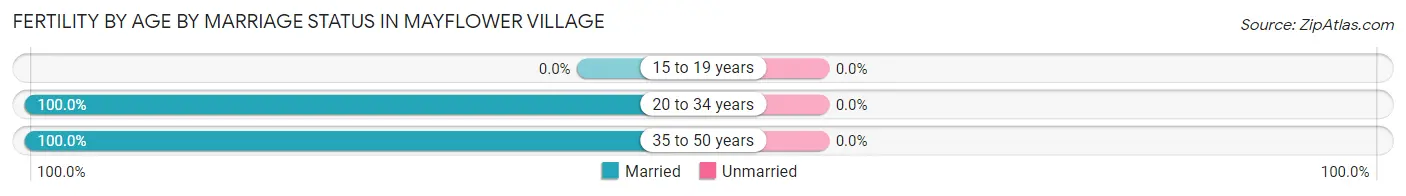
| Age Bracket | Married | Unmarried |
| 15 to 19 years | 0 (0.0%) | 0 (0.0%) |
| 20 to 34 years | 6 (100.0%) | 0 (0.0%) |
| 35 to 50 years | 19 (100.0%) | 0 (0.0%) |
| Total | 25 (100.0%) | 0 (0.0%) |
Fertility by Education in Mayflower Village
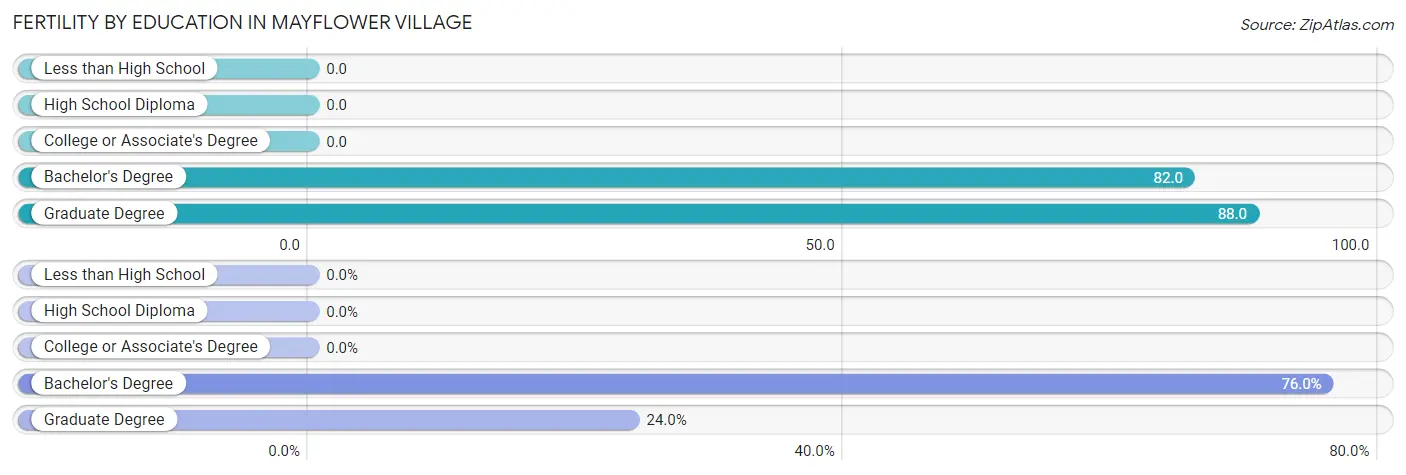
| Educational Attainment | Women with Births | Births / 1,000 Women |
| Less than High School | 0 (0.0%) | 0.0 |
| High School Diploma | 0 (0.0%) | 0.0 |
| College or Associate's Degree | 0 (0.0%) | 0.0 |
| Bachelor's Degree | 19 (76.0%) | 82.0 |
| Graduate Degree | 6 (24.0%) | 88.0 |
| Total | 25 (100.0%) | 26.0 |
Fertility by Education by Marriage Status in Mayflower Village
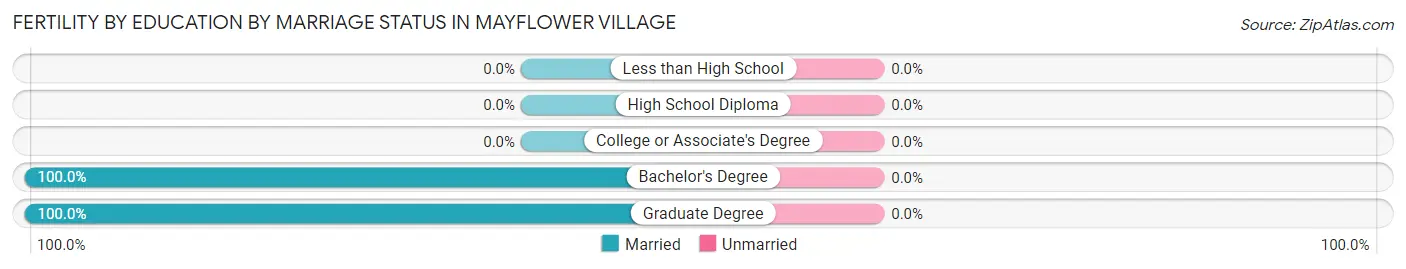
| Educational Attainment | Married | Unmarried |
| Less than High School | 0 (0.0%) | 0 (0.0%) |
| High School Diploma | 0 (0.0%) | 0 (0.0%) |
| College or Associate's Degree | 0 (0.0%) | 0 (0.0%) |
| Bachelor's Degree | 19 (100.0%) | 0 (0.0%) |
| Graduate Degree | 6 (100.0%) | 0 (0.0%) |
| Total | 25 (100.0%) | 0 (0.0%) |
Employment Characteristics in Mayflower Village
Employment by Class of Employer in Mayflower Village
Among the 2,519 employed individuals in Mayflower Village, private company employees (1,536 | 61.0%), local government employees (370 | 14.7%), and not-for-profit organizations (165 | 6.6%) make up the most common classes of employment.
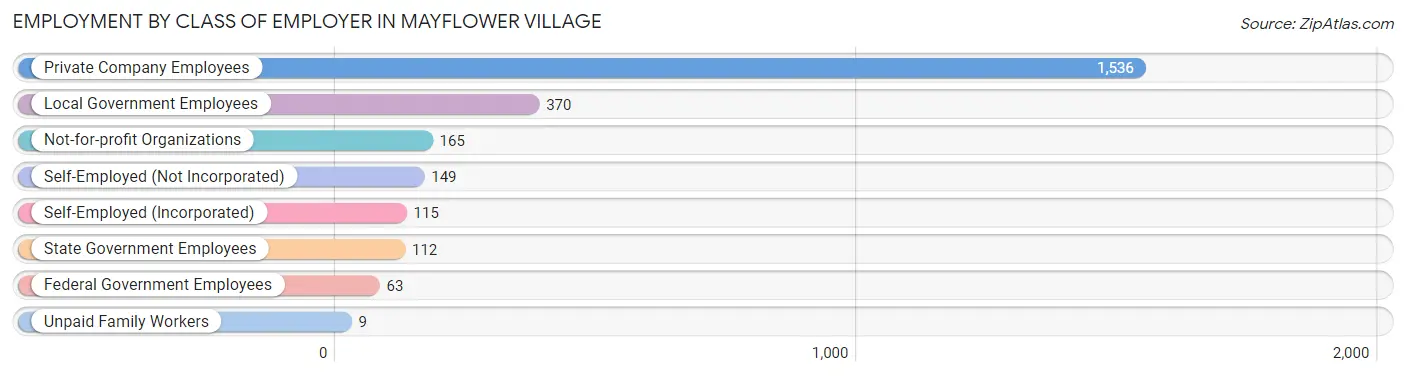
| Employer Class | # Employees | % Employees |
| Private Company Employees | 1,536 | 61.0% |
| Self-Employed (Incorporated) | 115 | 4.6% |
| Self-Employed (Not Incorporated) | 149 | 5.9% |
| Not-for-profit Organizations | 165 | 6.6% |
| Local Government Employees | 370 | 14.7% |
| State Government Employees | 112 | 4.4% |
| Federal Government Employees | 63 | 2.5% |
| Unpaid Family Workers | 9 | 0.4% |
| Total | 2,519 | 100.0% |
Employment Status by Age in Mayflower Village
According to the labor force statistics for Mayflower Village, out of the total population over 16 years of age (4,297), 61.9% or 2,660 individuals are in the labor force, with 3.2% or 85 of them unemployed. The age group with the highest labor force participation rate is 30 to 34 years, with 100.0% or 77 individuals in the labor force. Within the labor force, the 25 to 29 years age range has the highest percentage of unemployed individuals, with 28.6% or 50 of them being unemployed.
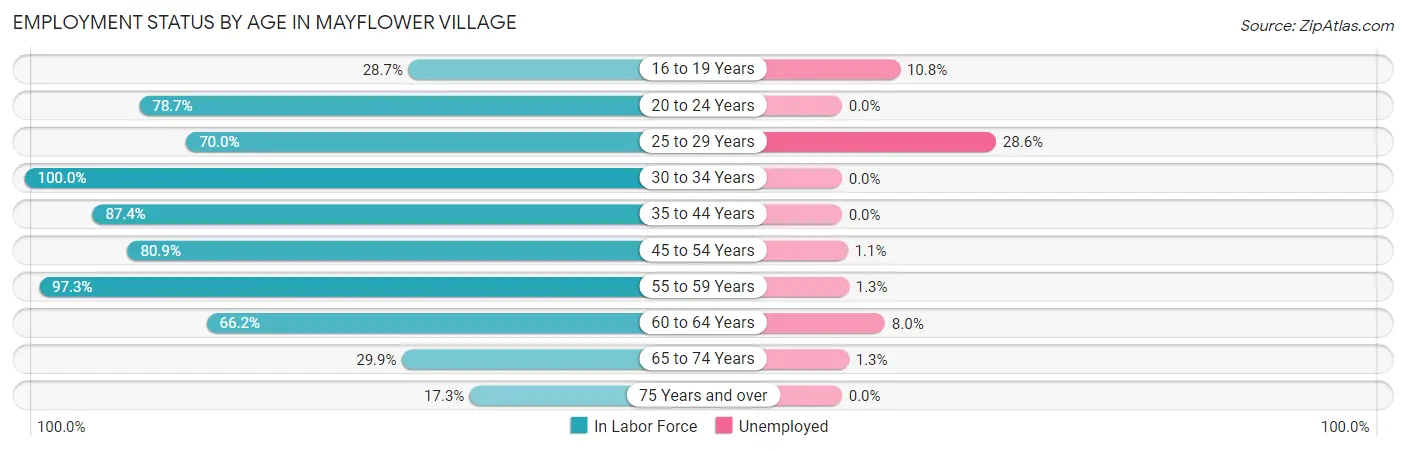
| Age Bracket | In Labor Force | Unemployed |
| 16 to 19 Years | 37 (28.7%) | 4 (10.8%) |
| 20 to 24 Years | 196 (78.7%) | 0 (0.0%) |
| 25 to 29 Years | 175 (70.0%) | 50 (28.6%) |
| 30 to 34 Years | 77 (100.0%) | 0 (0.0%) |
| 35 to 44 Years | 588 (87.4%) | 0 (0.0%) |
| 45 to 54 Years | 613 (80.9%) | 7 (1.1%) |
| 55 to 59 Years | 399 (97.3%) | 5 (1.3%) |
| 60 to 64 Years | 200 (66.2%) | 16 (8.0%) |
| 65 to 74 Years | 298 (29.9%) | 4 (1.3%) |
| 75 Years and over | 78 (17.3%) | 0 (0.0%) |
| Total | 2,660 (61.9%) | 85 (3.2%) |
Employment Status by Educational Attainment in Mayflower Village
According to labor force statistics for Mayflower Village, 83.1% of individuals (2,053) out of the total population between 25 and 64 years of age (2,470) are in the labor force, with 3.8% or 78 of them being unemployed. The group with the highest labor force participation rate are those with the educational attainment of college / associate degree, with 90.3% or 615 individuals in the labor force. Within the labor force, individuals with college / associate degree education have the highest percentage of unemployment, with 8.5% or 52 of them being unemployed.
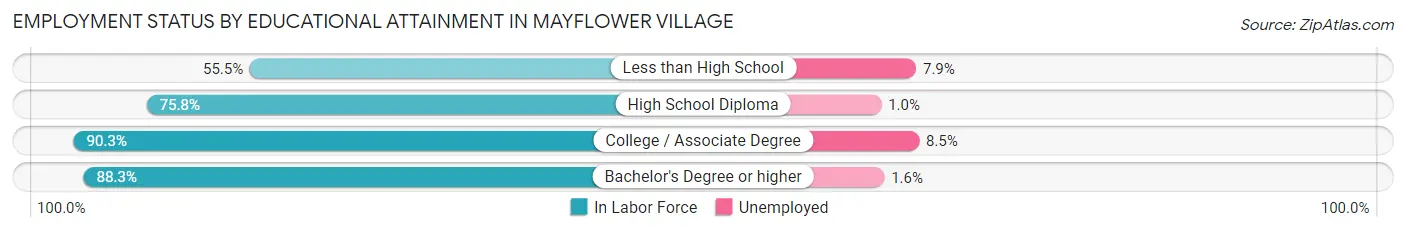
| Educational Attainment | In Labor Force | Unemployed |
| Less than High School | 101 (55.5%) | 14 (7.9%) |
| High School Diploma | 501 (75.8%) | 7 (1.0%) |
| College / Associate Degree | 615 (90.3%) | 58 (8.5%) |
| Bachelor's Degree or higher | 835 (88.3%) | 15 (1.6%) |
| Total | 2,053 (83.1%) | 94 (3.8%) |
Employment Occupations by Sex in Mayflower Village
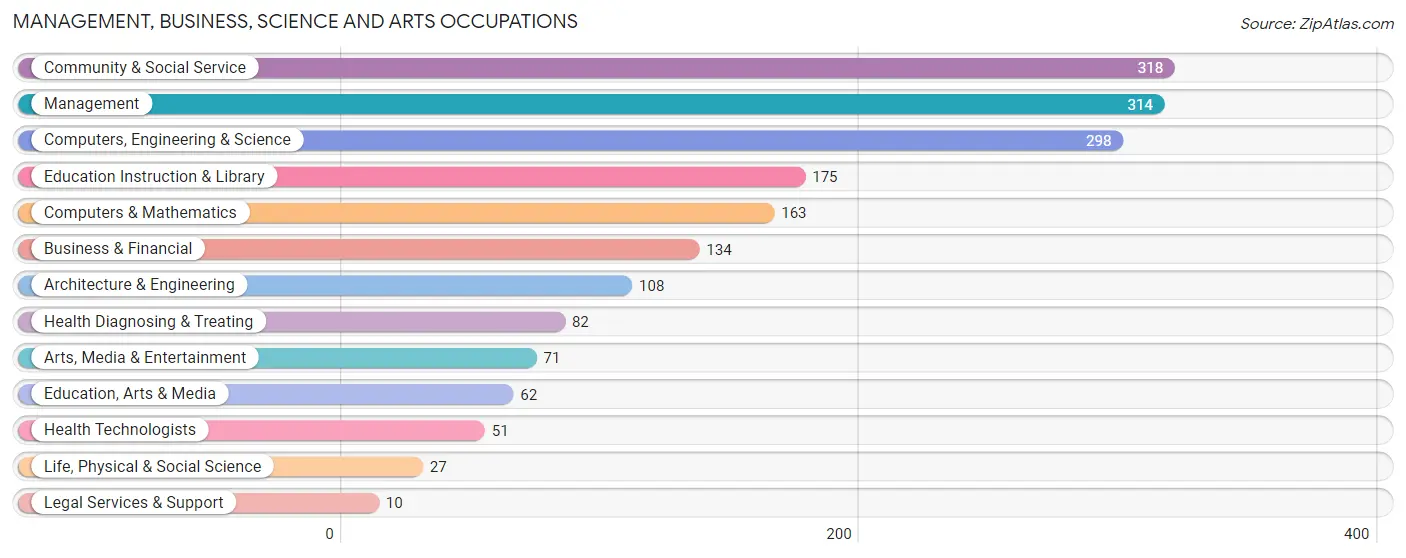
Management, Business, Science and Arts Occupations
The most common Management, Business, Science and Arts occupations in Mayflower Village are Community & Social Service (318 | 12.3%), Management (314 | 12.2%), Computers, Engineering & Science (298 | 11.6%), Education Instruction & Library (175 | 6.8%), and Computers & Mathematics (163 | 6.3%).
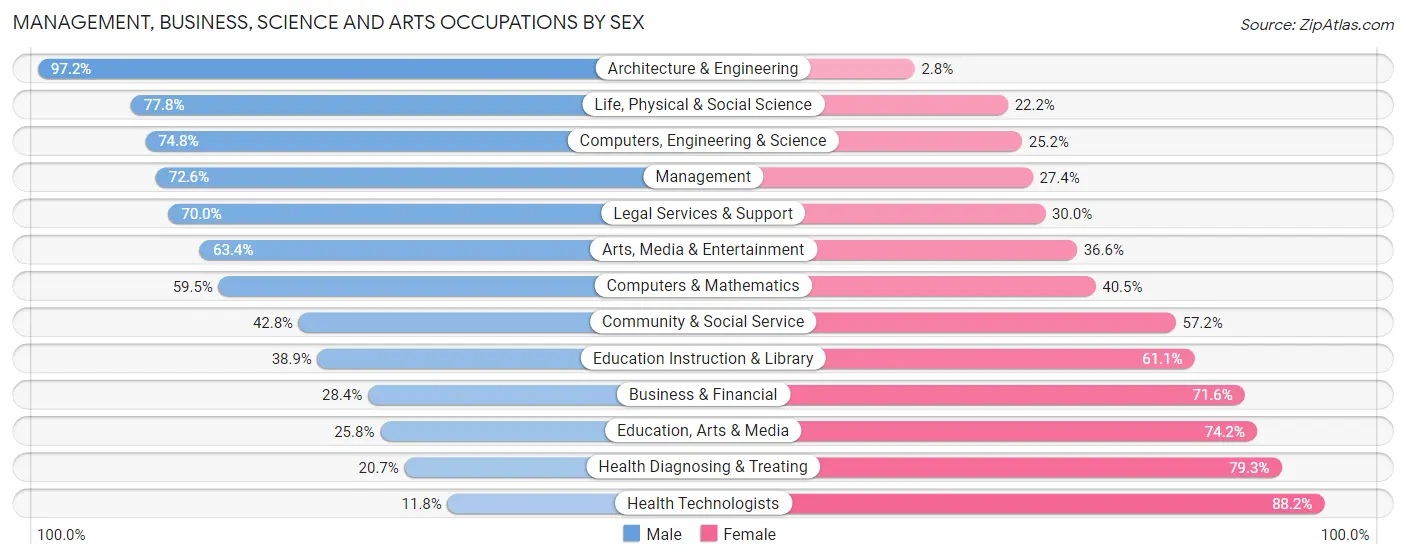
Management, Business, Science and Arts Occupations by Sex
Within the Management, Business, Science and Arts occupations in Mayflower Village, the most male-oriented occupations are Architecture & Engineering (97.2%), Life, Physical & Social Science (77.8%), and Computers, Engineering & Science (74.8%), while the most female-oriented occupations are Health Technologists (88.2%), Health Diagnosing & Treating (79.3%), and Education, Arts & Media (74.2%).
| Occupation | Male | Female |
| Management | 228 (72.6%) | 86 (27.4%) |
| Business & Financial | 38 (28.4%) | 96 (71.6%) |
| Computers, Engineering & Science | 223 (74.8%) | 75 (25.2%) |
| Computers & Mathematics | 97 (59.5%) | 66 (40.5%) |
| Architecture & Engineering | 105 (97.2%) | 3 (2.8%) |
| Life, Physical & Social Science | 21 (77.8%) | 6 (22.2%) |
| Community & Social Service | 136 (42.8%) | 182 (57.2%) |
| Education, Arts & Media | 16 (25.8%) | 46 (74.2%) |
| Legal Services & Support | 7 (70.0%) | 3 (30.0%) |
| Education Instruction & Library | 68 (38.9%) | 107 (61.1%) |
| Arts, Media & Entertainment | 45 (63.4%) | 26 (36.6%) |
| Health Diagnosing & Treating | 17 (20.7%) | 65 (79.3%) |
| Health Technologists | 6 (11.8%) | 45 (88.2%) |
| Total (Category) | 642 (56.0%) | 504 (44.0%) |
| Total (Overall) | 1,282 (49.8%) | 1,293 (50.2%) |
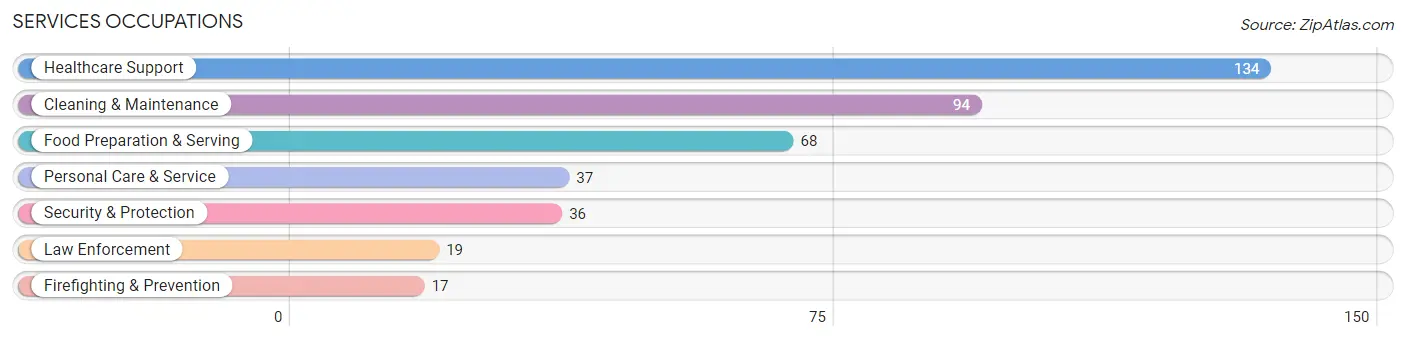
Services Occupations
The most common Services occupations in Mayflower Village are Healthcare Support (134 | 5.2%), Cleaning & Maintenance (94 | 3.6%), Food Preparation & Serving (68 | 2.6%), Personal Care & Service (37 | 1.4%), and Security & Protection (36 | 1.4%).
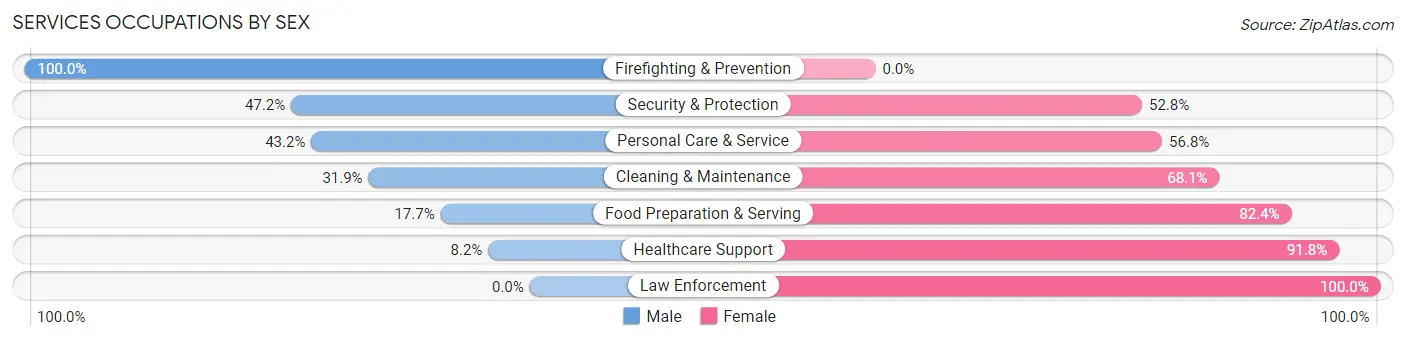
Services Occupations by Sex
Within the Services occupations in Mayflower Village, the most male-oriented occupations are Firefighting & Prevention (100.0%), Security & Protection (47.2%), and Personal Care & Service (43.2%), while the most female-oriented occupations are Law Enforcement (100.0%), Healthcare Support (91.8%), and Food Preparation & Serving (82.4%).
| Occupation | Male | Female |
| Healthcare Support | 11 (8.2%) | 123 (91.8%) |
| Security & Protection | 17 (47.2%) | 19 (52.8%) |
| Firefighting & Prevention | 17 (100.0%) | 0 (0.0%) |
| Law Enforcement | 0 (0.0%) | 19 (100.0%) |
| Food Preparation & Serving | 12 (17.6%) | 56 (82.4%) |
| Cleaning & Maintenance | 30 (31.9%) | 64 (68.1%) |
| Personal Care & Service | 16 (43.2%) | 21 (56.8%) |
| Total (Category) | 86 (23.3%) | 283 (76.7%) |
| Total (Overall) | 1,282 (49.8%) | 1,293 (50.2%) |
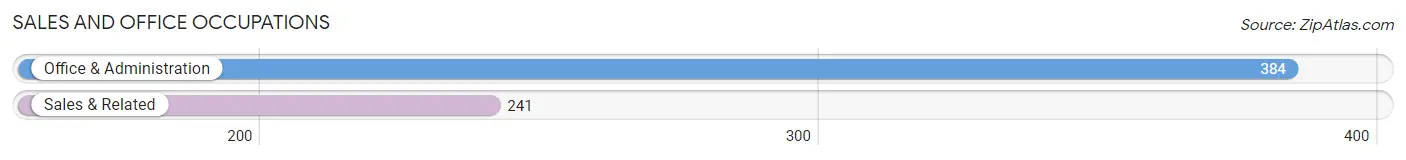
Sales and Office Occupations
The most common Sales and Office occupations in Mayflower Village are Office & Administration (384 | 14.9%), and Sales & Related (241 | 9.4%).
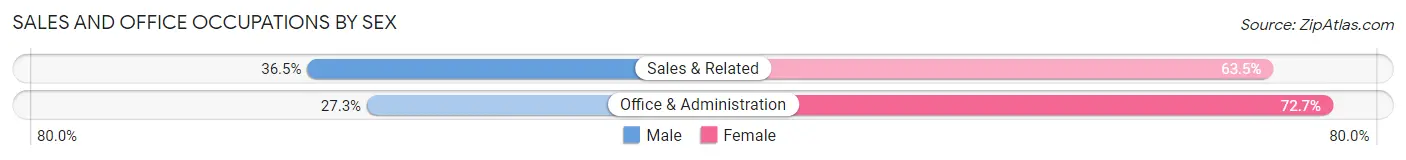
Sales and Office Occupations by Sex
| Occupation | Male | Female |
| Sales & Related | 88 (36.5%) | 153 (63.5%) |
| Office & Administration | 105 (27.3%) | 279 (72.7%) |
| Total (Category) | 193 (30.9%) | 432 (69.1%) |
| Total (Overall) | 1,282 (49.8%) | 1,293 (50.2%) |
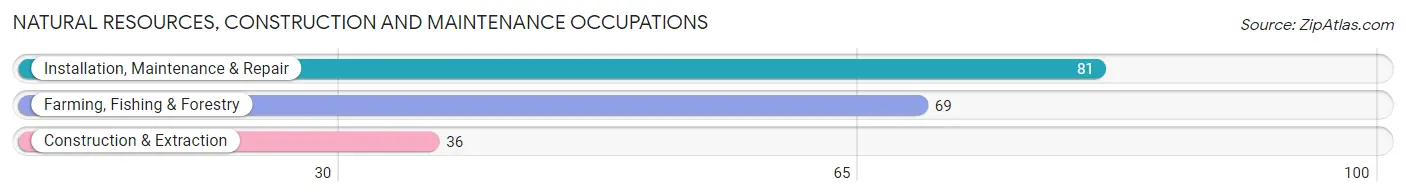
Natural Resources, Construction and Maintenance Occupations
The most common Natural Resources, Construction and Maintenance occupations in Mayflower Village are Installation, Maintenance & Repair (81 | 3.2%), Farming, Fishing & Forestry (69 | 2.7%), and Construction & Extraction (36 | 1.4%).
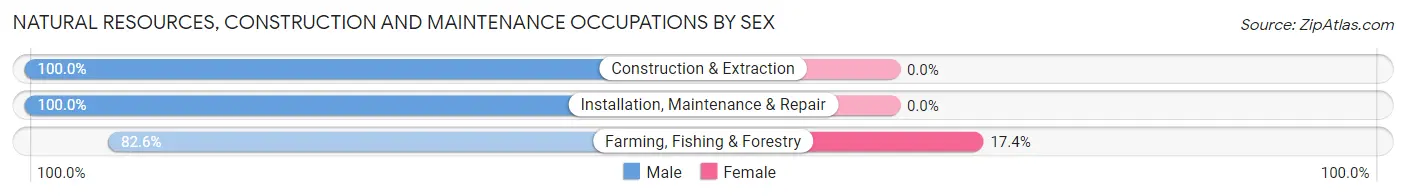
Natural Resources, Construction and Maintenance Occupations by Sex
| Occupation | Male | Female |
| Farming, Fishing & Forestry | 57 (82.6%) | 12 (17.4%) |
| Construction & Extraction | 36 (100.0%) | 0 (0.0%) |
| Installation, Maintenance & Repair | 81 (100.0%) | 0 (0.0%) |
| Total (Category) | 174 (93.5%) | 12 (6.5%) |
| Total (Overall) | 1,282 (49.8%) | 1,293 (50.2%) |
Production, Transportation and Moving Occupations
The most common Production, Transportation and Moving occupations in Mayflower Village are Production (93 | 3.6%), Material Moving (91 | 3.5%), and Transportation (65 | 2.5%).
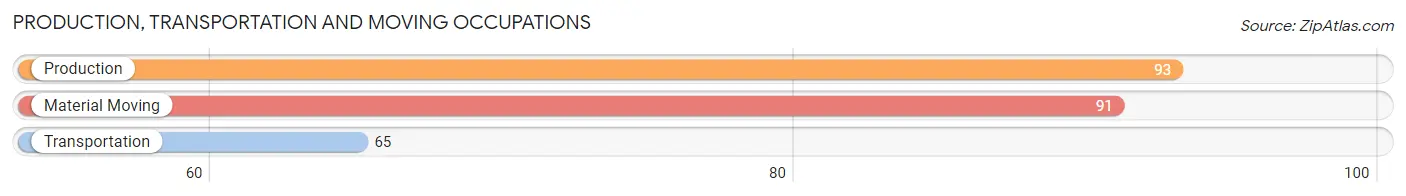
Production, Transportation and Moving Occupations by Sex
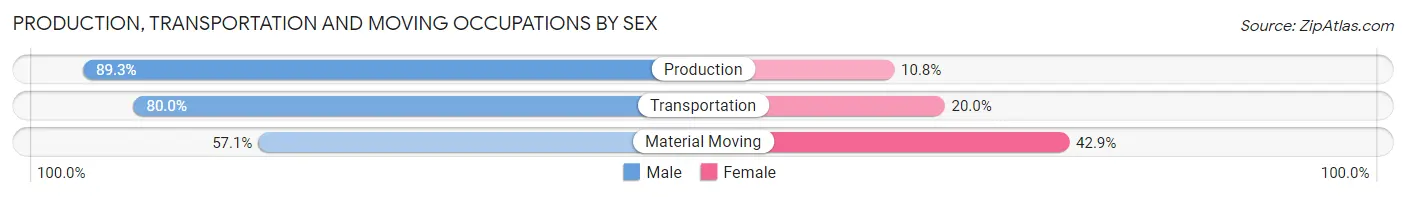
| Occupation | Male | Female |
| Production | 83 (89.2%) | 10 (10.7%) |
| Transportation | 52 (80.0%) | 13 (20.0%) |
| Material Moving | 52 (57.1%) | 39 (42.9%) |
| Total (Category) | 187 (75.1%) | 62 (24.9%) |
| Total (Overall) | 1,282 (49.8%) | 1,293 (50.2%) |
Employment Industries by Sex in Mayflower Village
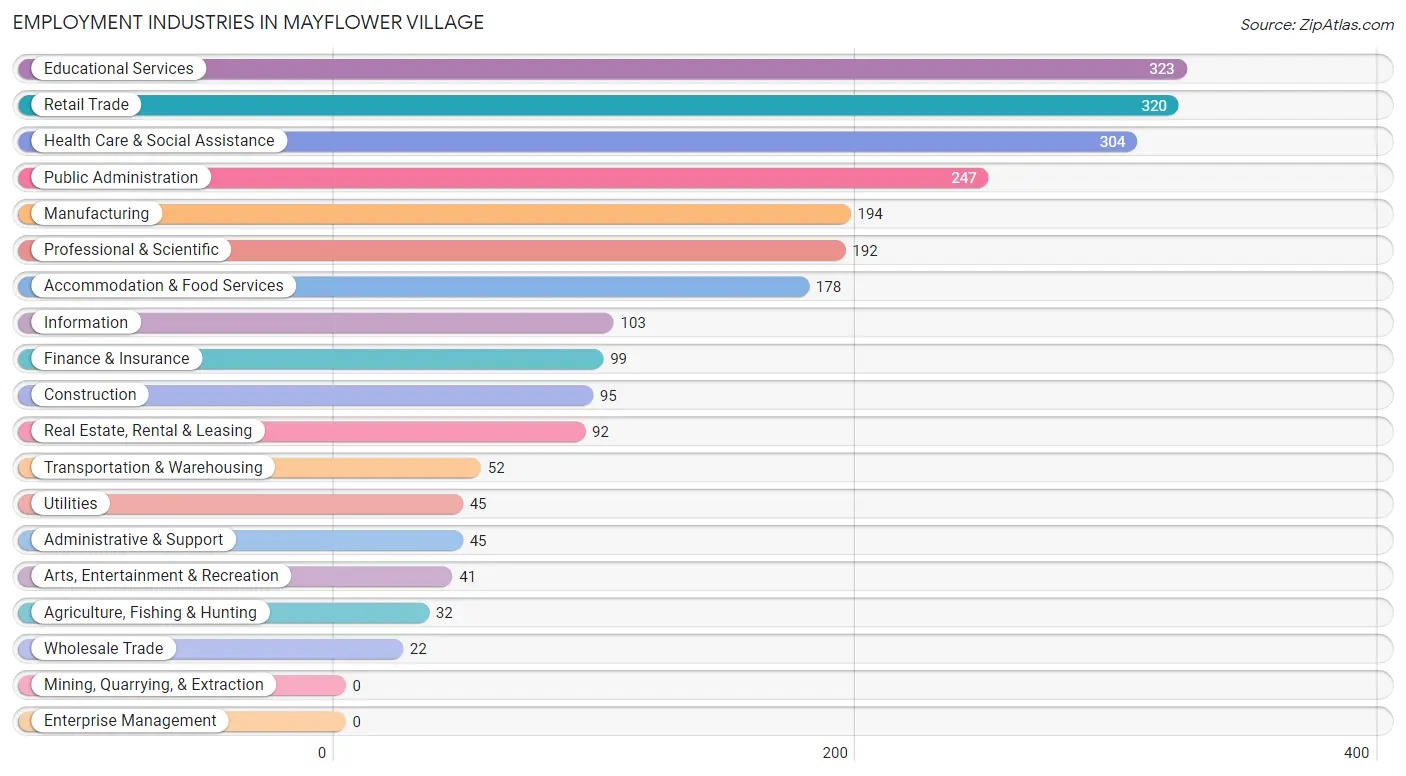
Employment Industries in Mayflower Village
The major employment industries in Mayflower Village include Educational Services (323 | 12.5%), Retail Trade (320 | 12.4%), Health Care & Social Assistance (304 | 11.8%), Public Administration (247 | 9.6%), and Manufacturing (194 | 7.5%).
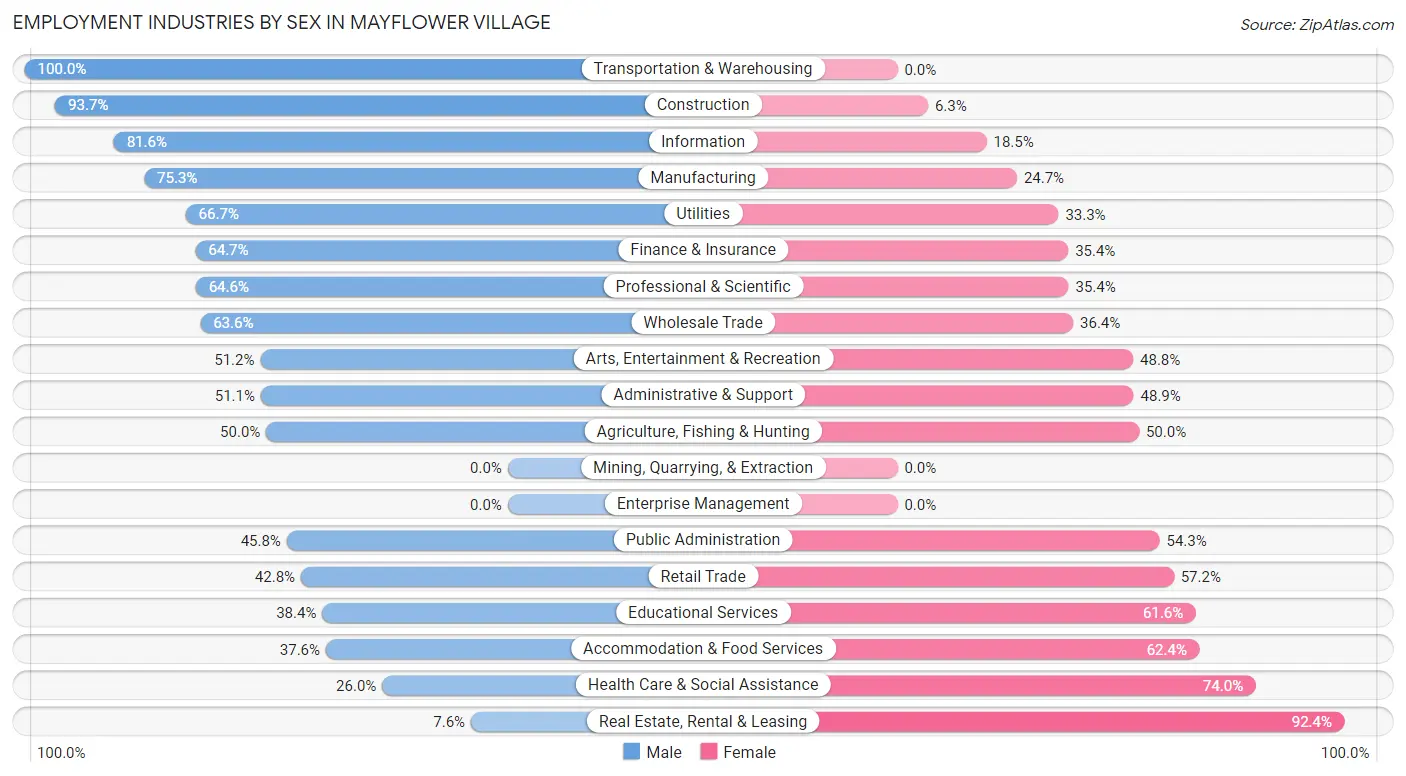
Employment Industries by Sex in Mayflower Village
The Mayflower Village industries that see more men than women are Transportation & Warehousing (100.0%), Construction (93.7%), and Information (81.6%), whereas the industries that tend to have a higher number of women are Real Estate, Rental & Leasing (92.4%), Health Care & Social Assistance (74.0%), and Accommodation & Food Services (62.4%).
| Industry | Male | Female |
| Agriculture, Fishing & Hunting | 16 (50.0%) | 16 (50.0%) |
| Mining, Quarrying, & Extraction | 0 (0.0%) | 0 (0.0%) |
| Construction | 89 (93.7%) | 6 (6.3%) |
| Manufacturing | 146 (75.3%) | 48 (24.7%) |
| Wholesale Trade | 14 (63.6%) | 8 (36.4%) |
| Retail Trade | 137 (42.8%) | 183 (57.2%) |
| Transportation & Warehousing | 52 (100.0%) | 0 (0.0%) |
| Utilities | 30 (66.7%) | 15 (33.3%) |
| Information | 84 (81.6%) | 19 (18.4%) |
| Finance & Insurance | 64 (64.6%) | 35 (35.3%) |
| Real Estate, Rental & Leasing | 7 (7.6%) | 85 (92.4%) |
| Professional & Scientific | 124 (64.6%) | 68 (35.4%) |
| Enterprise Management | 0 (0.0%) | 0 (0.0%) |
| Administrative & Support | 23 (51.1%) | 22 (48.9%) |
| Educational Services | 124 (38.4%) | 199 (61.6%) |
| Health Care & Social Assistance | 79 (26.0%) | 225 (74.0%) |
| Arts, Entertainment & Recreation | 21 (51.2%) | 20 (48.8%) |
| Accommodation & Food Services | 67 (37.6%) | 111 (62.4%) |
| Public Administration | 113 (45.8%) | 134 (54.2%) |
| Total | 1,282 (49.8%) | 1,293 (50.2%) |
Education in Mayflower Village
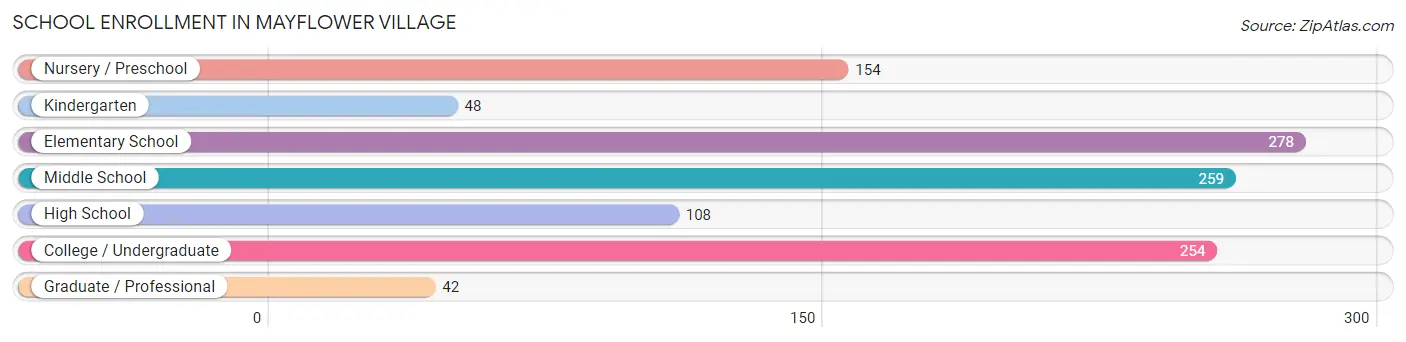
School Enrollment in Mayflower Village
The most common levels of schooling among the 1,143 students in Mayflower Village are elementary school (278 | 24.3%), middle school (259 | 22.7%), and college / undergraduate (254 | 22.2%).
| School Level | # Students | % Students |
| Nursery / Preschool | 154 | 13.5% |
| Kindergarten | 48 | 4.2% |
| Elementary School | 278 | 24.3% |
| Middle School | 259 | 22.7% |
| High School | 108 | 9.5% |
| College / Undergraduate | 254 | 22.2% |
| Graduate / Professional | 42 | 3.7% |
| Total | 1,143 | 100.0% |
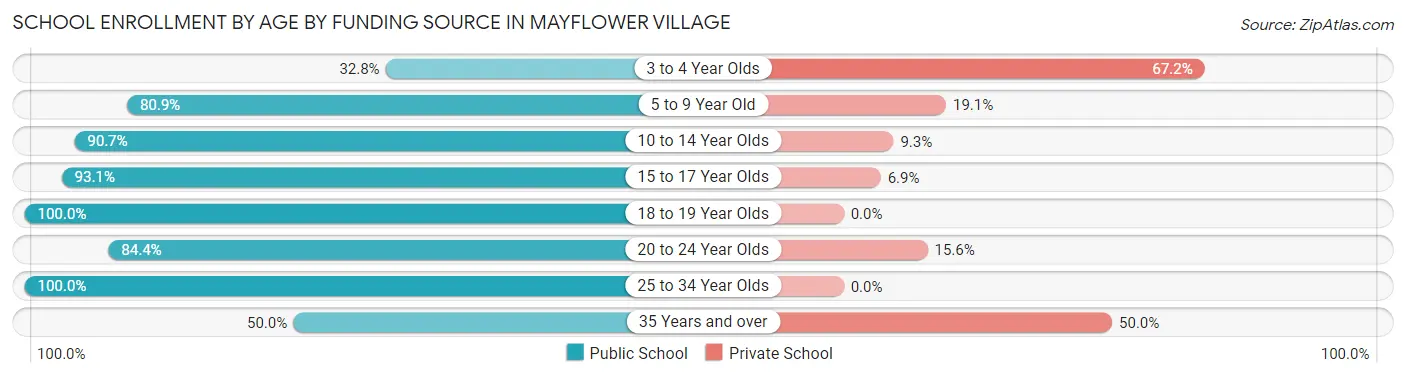
School Enrollment by Age by Funding Source in Mayflower Village
Out of a total of 1,143 students who are enrolled in schools in Mayflower Village, 202 (17.7%) attend a private institution, while the remaining 941 (82.3%) are enrolled in public schools. The age group of 3 to 4 year olds has the highest likelihood of being enrolled in private schools, with 41 (67.2% in the age bracket) enrolled. Conversely, the age group of 18 to 19 year olds has the lowest likelihood of being enrolled in a private school, with 57 (100.0% in the age bracket) attending a public institution.
| Age Bracket | Public School | Private School |
| 3 to 4 Year Olds | 20 (32.8%) | 41 (67.2%) |
| 5 to 9 Year Old | 348 (80.9%) | 82 (19.1%) |
| 10 to 14 Year Olds | 225 (90.7%) | 23 (9.3%) |
| 15 to 17 Year Olds | 81 (93.1%) | 6 (6.9%) |
| 18 to 19 Year Olds | 57 (100.0%) | 0 (0.0%) |
| 20 to 24 Year Olds | 108 (84.4%) | 20 (15.6%) |
| 25 to 34 Year Olds | 72 (100.0%) | 0 (0.0%) |
| 35 Years and over | 30 (50.0%) | 30 (50.0%) |
| Total | 941 (82.3%) | 202 (17.7%) |
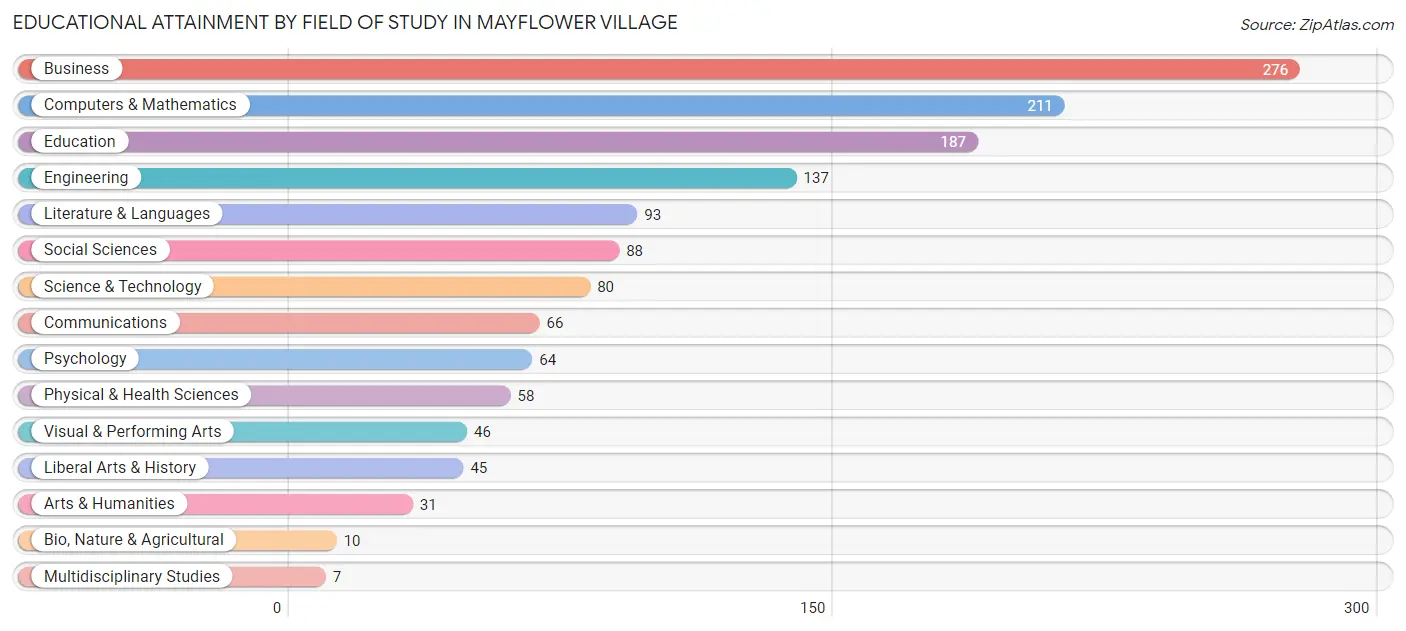
Educational Attainment by Field of Study in Mayflower Village
Business (276 | 19.7%), computers & mathematics (211 | 15.1%), education (187 | 13.4%), engineering (137 | 9.8%), and literature & languages (93 | 6.7%) are the most common fields of study among 1,399 individuals in Mayflower Village who have obtained a bachelor's degree or higher.
| Field of Study | # Graduates | % Graduates |
| Computers & Mathematics | 211 | 15.1% |
| Bio, Nature & Agricultural | 10 | 0.7% |
| Physical & Health Sciences | 58 | 4.2% |
| Psychology | 64 | 4.6% |
| Social Sciences | 88 | 6.3% |
| Engineering | 137 | 9.8% |
| Multidisciplinary Studies | 7 | 0.5% |
| Science & Technology | 80 | 5.7% |
| Business | 276 | 19.7% |
| Education | 187 | 13.4% |
| Literature & Languages | 93 | 6.7% |
| Liberal Arts & History | 45 | 3.2% |
| Visual & Performing Arts | 46 | 3.3% |
| Communications | 66 | 4.7% |
| Arts & Humanities | 31 | 2.2% |
| Total | 1,399 | 100.0% |
Transportation & Commute in Mayflower Village
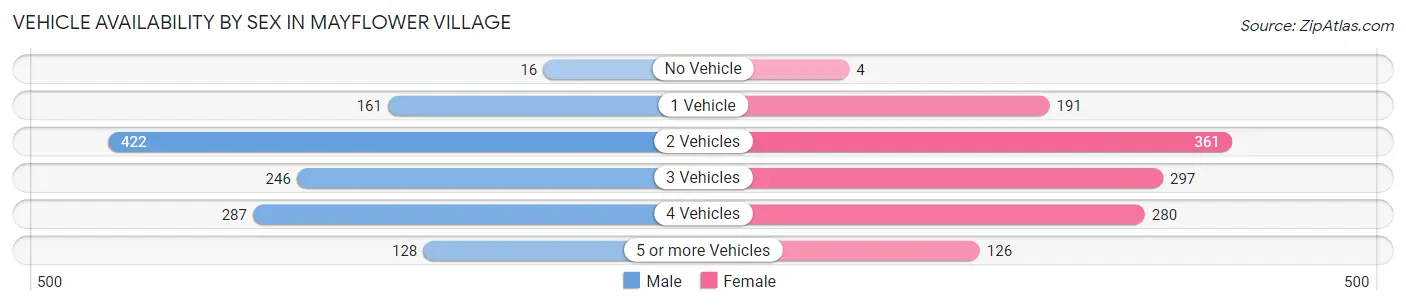
Vehicle Availability by Sex in Mayflower Village
The most prevalent vehicle ownership categories in Mayflower Village are males with 2 vehicles (422, accounting for 33.5%) and females with 2 vehicles (361, making up 33.5%).
| Vehicles Available | Male | Female |
| No Vehicle | 16 (1.3%) | 4 (0.3%) |
| 1 Vehicle | 161 (12.8%) | 191 (15.2%) |
| 2 Vehicles | 422 (33.5%) | 361 (28.7%) |
| 3 Vehicles | 246 (19.5%) | 297 (23.6%) |
| 4 Vehicles | 287 (22.8%) | 280 (22.2%) |
| 5 or more Vehicles | 128 (10.2%) | 126 (10.0%) |
| Total | 1,260 (100.0%) | 1,259 (100.0%) |
Commute Time in Mayflower Village
The most frequently occuring commute durations in Mayflower Village are 30 to 34 minutes (420 commuters, 18.6%), 10 to 14 minutes (338 commuters, 15.0%), and 15 to 19 minutes (337 commuters, 14.9%).
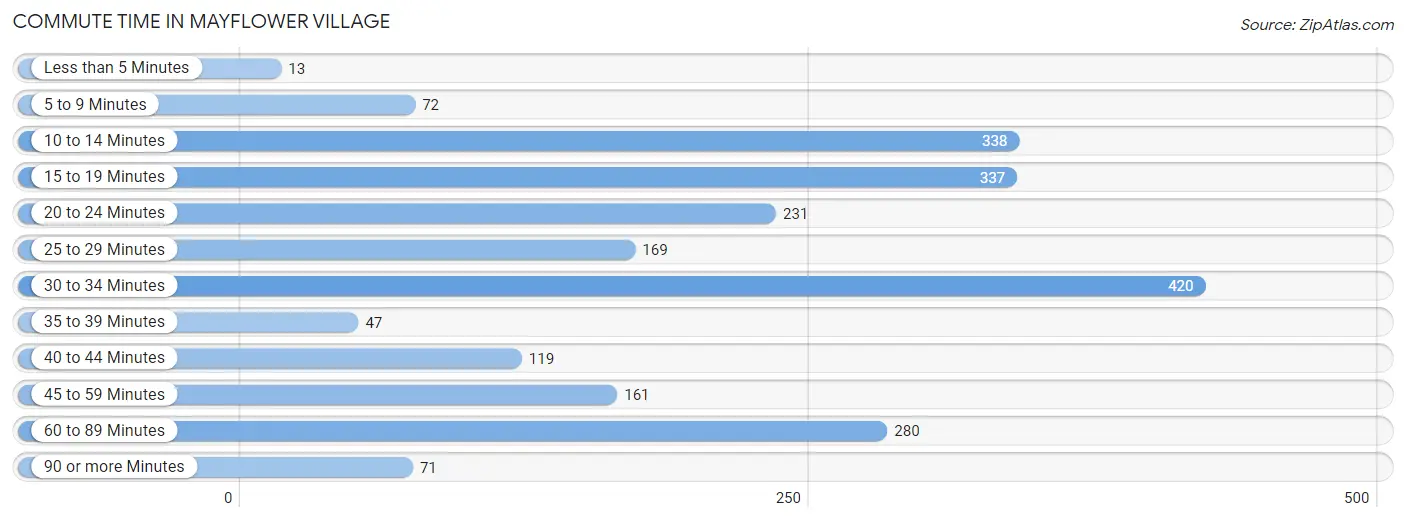
| Commute Time | # Commuters | % Commuters |
| Less than 5 Minutes | 13 | 0.6% |
| 5 to 9 Minutes | 72 | 3.2% |
| 10 to 14 Minutes | 338 | 15.0% |
| 15 to 19 Minutes | 337 | 14.9% |
| 20 to 24 Minutes | 231 | 10.2% |
| 25 to 29 Minutes | 169 | 7.5% |
| 30 to 34 Minutes | 420 | 18.6% |
| 35 to 39 Minutes | 47 | 2.1% |
| 40 to 44 Minutes | 119 | 5.3% |
| 45 to 59 Minutes | 161 | 7.1% |
| 60 to 89 Minutes | 280 | 12.4% |
| 90 or more Minutes | 71 | 3.1% |
Commute Time by Sex in Mayflower Village
The most common commute times in Mayflower Village are 30 to 34 minutes (253 commuters, 22.5%) for males and 10 to 14 minutes (246 commuters, 21.7%) for females.
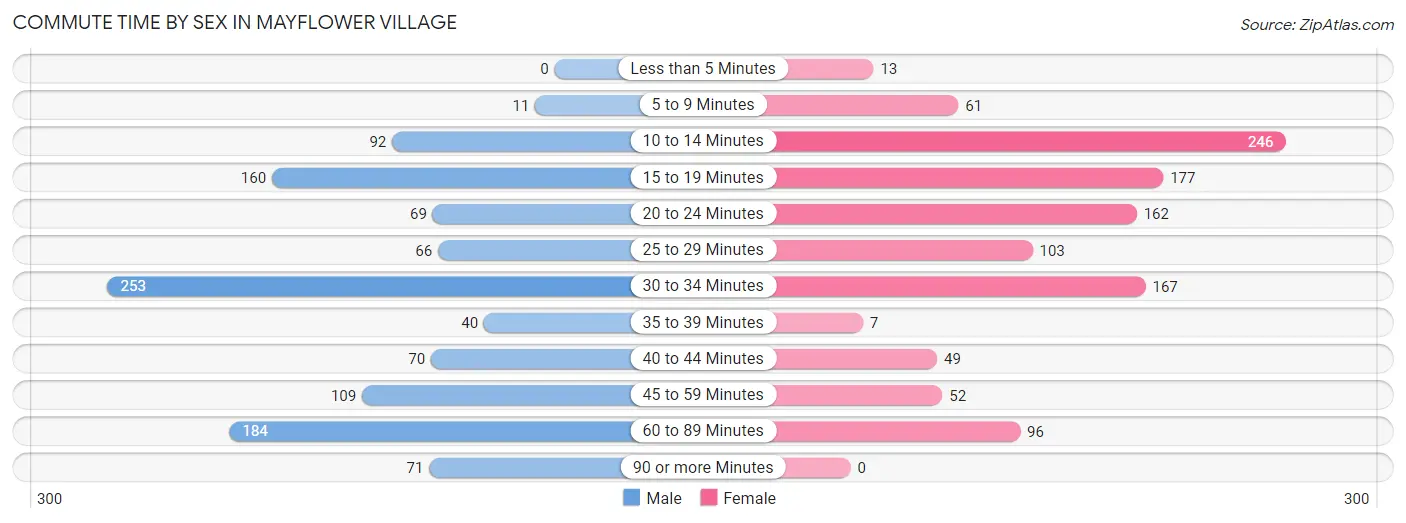
| Commute Time | Male | Female |
| Less than 5 Minutes | 0 (0.0%) | 13 (1.1%) |
| 5 to 9 Minutes | 11 (1.0%) | 61 (5.4%) |
| 10 to 14 Minutes | 92 (8.2%) | 246 (21.7%) |
| 15 to 19 Minutes | 160 (14.2%) | 177 (15.6%) |
| 20 to 24 Minutes | 69 (6.1%) | 162 (14.3%) |
| 25 to 29 Minutes | 66 (5.9%) | 103 (9.1%) |
| 30 to 34 Minutes | 253 (22.5%) | 167 (14.7%) |
| 35 to 39 Minutes | 40 (3.6%) | 7 (0.6%) |
| 40 to 44 Minutes | 70 (6.2%) | 49 (4.3%) |
| 45 to 59 Minutes | 109 (9.7%) | 52 (4.6%) |
| 60 to 89 Minutes | 184 (16.4%) | 96 (8.5%) |
| 90 or more Minutes | 71 (6.3%) | 0 (0.0%) |
Time of Departure to Work by Sex in Mayflower Village
The most frequent times of departure to work in Mayflower Village are 8:00 AM to 8:29 AM (159, 14.1%) for males and 7:00 AM to 7:29 AM (222, 19.6%) for females.
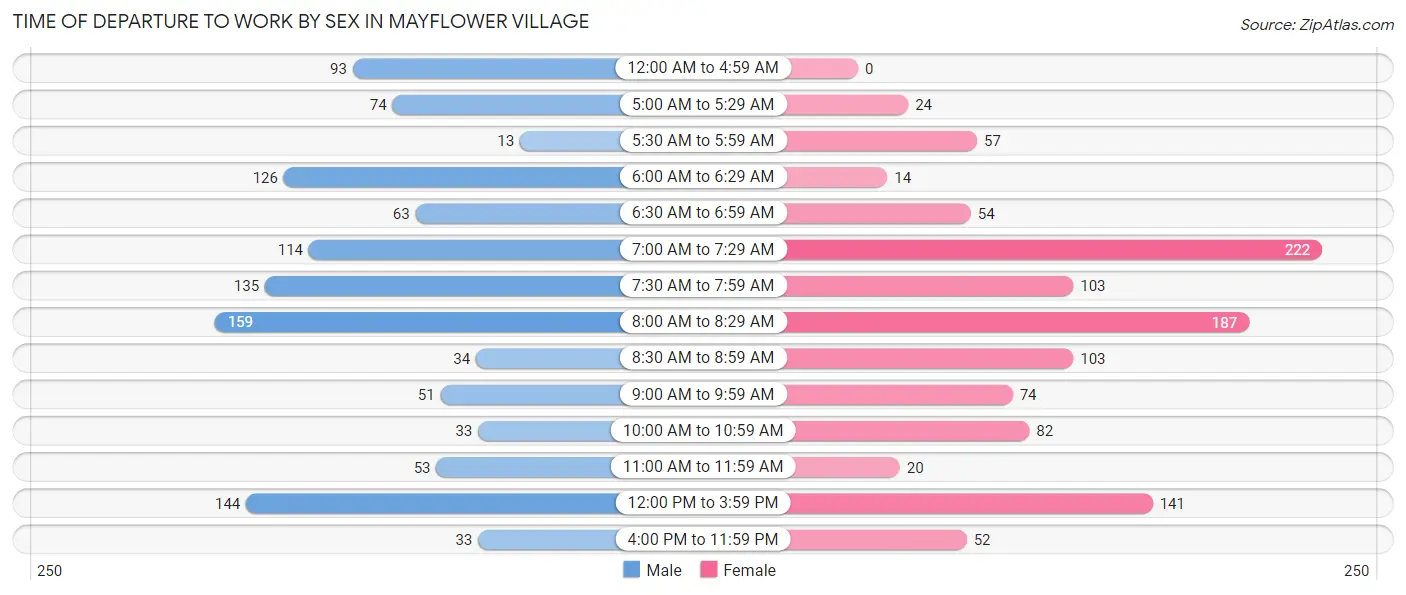
| Time of Departure | Male | Female |
| 12:00 AM to 4:59 AM | 93 (8.3%) | 0 (0.0%) |
| 5:00 AM to 5:29 AM | 74 (6.6%) | 24 (2.1%) |
| 5:30 AM to 5:59 AM | 13 (1.2%) | 57 (5.0%) |
| 6:00 AM to 6:29 AM | 126 (11.2%) | 14 (1.2%) |
| 6:30 AM to 6:59 AM | 63 (5.6%) | 54 (4.8%) |
| 7:00 AM to 7:29 AM | 114 (10.1%) | 222 (19.6%) |
| 7:30 AM to 7:59 AM | 135 (12.0%) | 103 (9.1%) |
| 8:00 AM to 8:29 AM | 159 (14.1%) | 187 (16.5%) |
| 8:30 AM to 8:59 AM | 34 (3.0%) | 103 (9.1%) |
| 9:00 AM to 9:59 AM | 51 (4.5%) | 74 (6.5%) |
| 10:00 AM to 10:59 AM | 33 (2.9%) | 82 (7.2%) |
| 11:00 AM to 11:59 AM | 53 (4.7%) | 20 (1.8%) |
| 12:00 PM to 3:59 PM | 144 (12.8%) | 141 (12.4%) |
| 4:00 PM to 11:59 PM | 33 (2.9%) | 52 (4.6%) |
| Total | 1,125 (100.0%) | 1,133 (100.0%) |
Housing Occupancy in Mayflower Village
Occupancy by Ownership in Mayflower Village
Of the total 1,786 dwellings in Mayflower Village, owner-occupied units account for 1,354 (75.8%), while renter-occupied units make up 432 (24.2%).
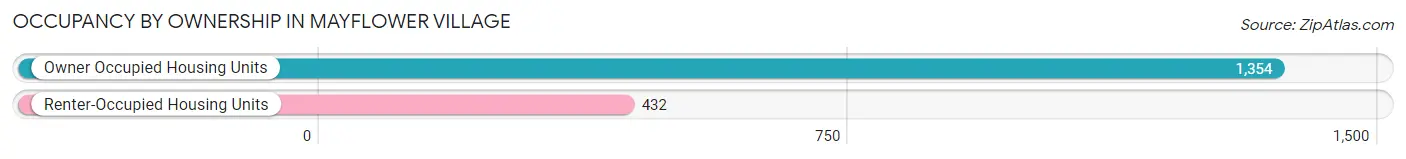
| Occupancy | # Housing Units | % Housing Units |
| Owner Occupied Housing Units | 1,354 | 75.8% |
| Renter-Occupied Housing Units | 432 | 24.2% |
| Total Occupied Housing Units | 1,786 | 100.0% |
Occupancy by Household Size in Mayflower Village
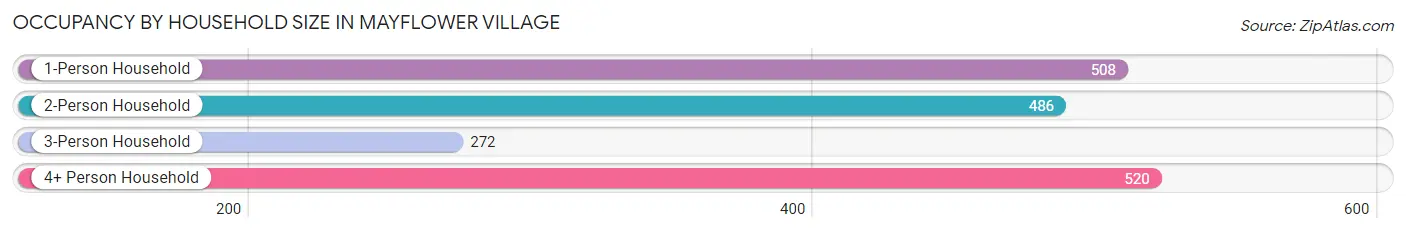
| Household Size | # Housing Units | % Housing Units |
| 1-Person Household | 508 | 28.4% |
| 2-Person Household | 486 | 27.2% |
| 3-Person Household | 272 | 15.2% |
| 4+ Person Household | 520 | 29.1% |
| Total Housing Units | 1,786 | 100.0% |
Occupancy by Ownership by Household Size in Mayflower Village
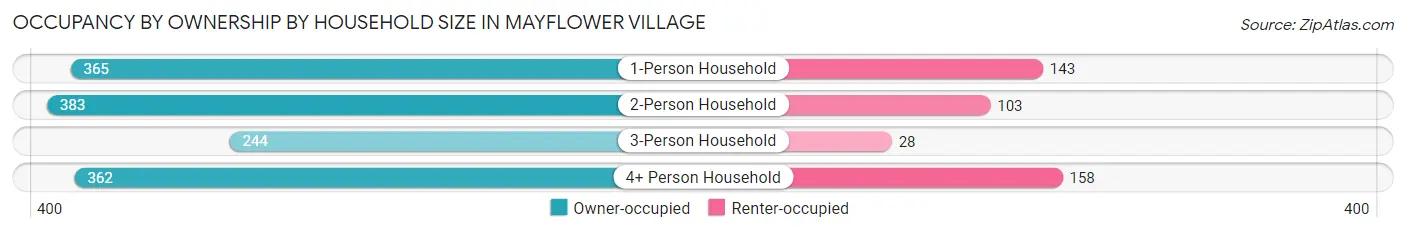
| Household Size | Owner-occupied | Renter-occupied |
| 1-Person Household | 365 (71.9%) | 143 (28.1%) |
| 2-Person Household | 383 (78.8%) | 103 (21.2%) |
| 3-Person Household | 244 (89.7%) | 28 (10.3%) |
| 4+ Person Household | 362 (69.6%) | 158 (30.4%) |
| Total Housing Units | 1,354 (75.8%) | 432 (24.2%) |
Occupancy by Educational Attainment in Mayflower Village
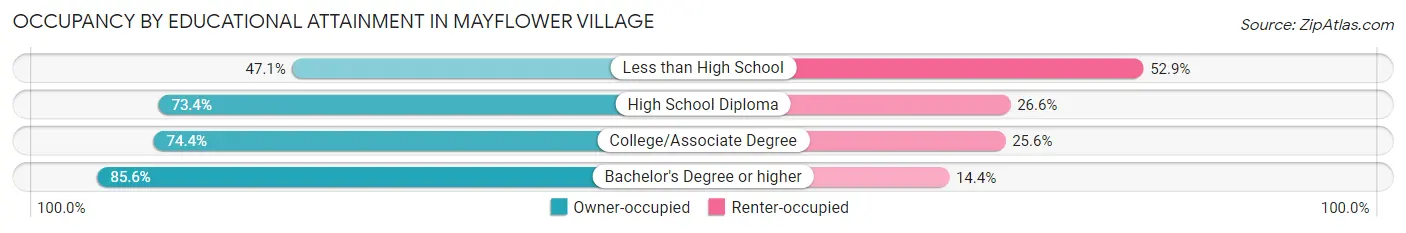
| Household Size | Owner-occupied | Renter-occupied |
| Less than High School | 88 (47.1%) | 99 (52.9%) |
| High School Diploma | 304 (73.4%) | 110 (26.6%) |
| College/Associate Degree | 346 (74.4%) | 119 (25.6%) |
| Bachelor's Degree or higher | 616 (85.6%) | 104 (14.4%) |
Occupancy by Age of Householder in Mayflower Village
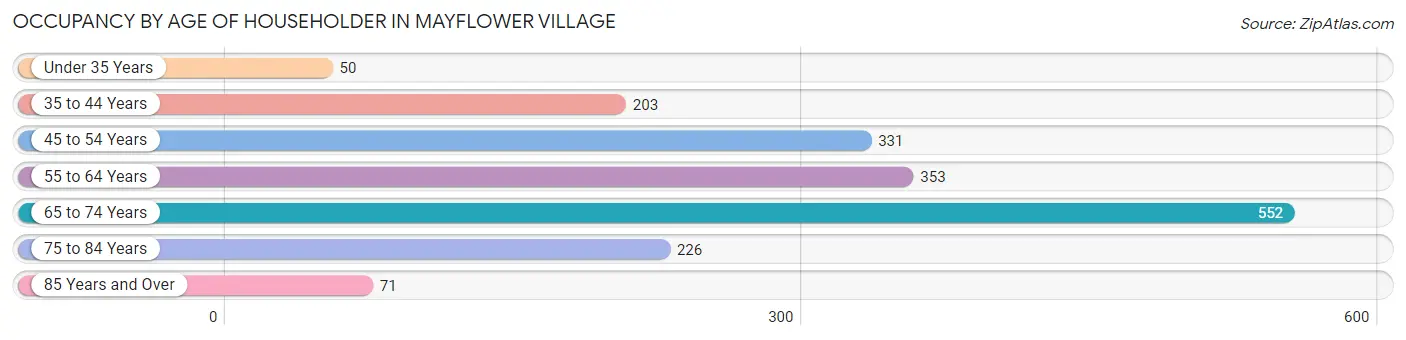
| Age Bracket | # Households | % Households |
| Under 35 Years | 50 | 2.8% |
| 35 to 44 Years | 203 | 11.4% |
| 45 to 54 Years | 331 | 18.5% |
| 55 to 64 Years | 353 | 19.8% |
| 65 to 74 Years | 552 | 30.9% |
| 75 to 84 Years | 226 | 12.7% |
| 85 Years and Over | 71 | 4.0% |
| Total | 1,786 | 100.0% |
Housing Finances in Mayflower Village
Median Income by Occupancy in Mayflower Village
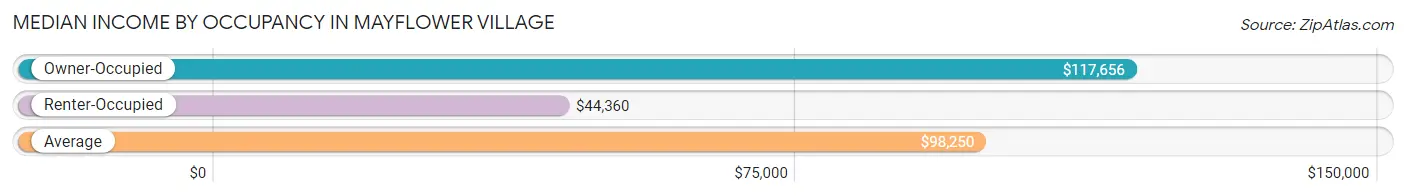
| Occupancy Type | # Households | Median Income |
| Owner-Occupied | 1,354 (75.8%) | $117,656 |
| Renter-Occupied | 432 (24.2%) | $44,360 |
| Average | 1,786 (100.0%) | $98,250 |
Occupancy by Householder Income Bracket in Mayflower Village
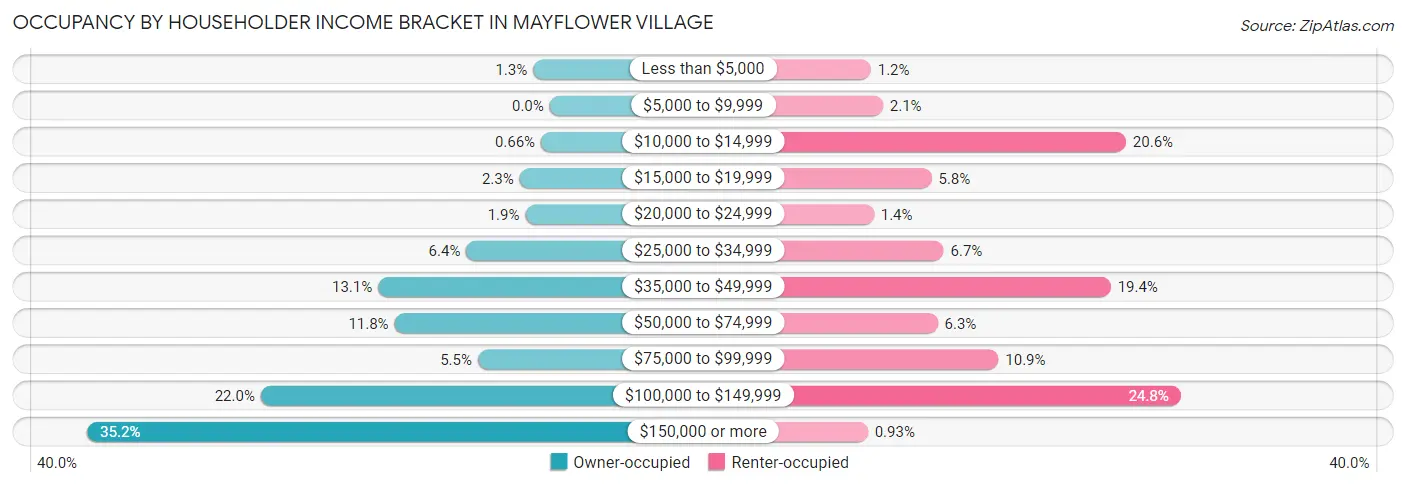
| Income Bracket | Owner-occupied | Renter-occupied |
| Less than $5,000 | 17 (1.3%) | 5 (1.2%) |
| $5,000 to $9,999 | 0 (0.0%) | 9 (2.1%) |
| $10,000 to $14,999 | 9 (0.7%) | 89 (20.6%) |
| $15,000 to $19,999 | 31 (2.3%) | 25 (5.8%) |
| $20,000 to $24,999 | 25 (1.8%) | 6 (1.4%) |
| $25,000 to $34,999 | 86 (6.4%) | 29 (6.7%) |
| $35,000 to $49,999 | 177 (13.1%) | 84 (19.4%) |
| $50,000 to $74,999 | 160 (11.8%) | 27 (6.2%) |
| $75,000 to $99,999 | 74 (5.5%) | 47 (10.9%) |
| $100,000 to $149,999 | 298 (22.0%) | 107 (24.8%) |
| $150,000 or more | 477 (35.2%) | 4 (0.9%) |
| Total | 1,354 (100.0%) | 432 (100.0%) |
Monthly Housing Cost Tiers in Mayflower Village
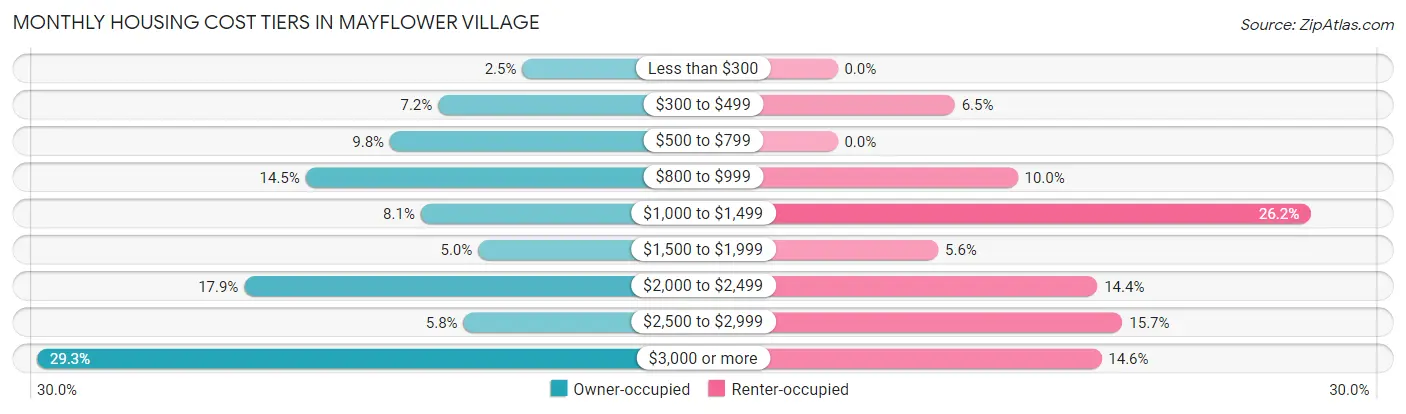
| Monthly Cost | Owner-occupied | Renter-occupied |
| Less than $300 | 34 (2.5%) | 0 (0.0%) |
| $300 to $499 | 97 (7.2%) | 28 (6.5%) |
| $500 to $799 | 133 (9.8%) | 0 (0.0%) |
| $800 to $999 | 196 (14.5%) | 43 (10.0%) |
| $1,000 to $1,499 | 110 (8.1%) | 113 (26.2%) |
| $1,500 to $1,999 | 67 (5.0%) | 24 (5.6%) |
| $2,000 to $2,499 | 242 (17.9%) | 62 (14.3%) |
| $2,500 to $2,999 | 78 (5.8%) | 68 (15.7%) |
| $3,000 or more | 397 (29.3%) | 63 (14.6%) |
| Total | 1,354 (100.0%) | 432 (100.0%) |
Physical Housing Characteristics in Mayflower Village
Housing Structures in Mayflower Village
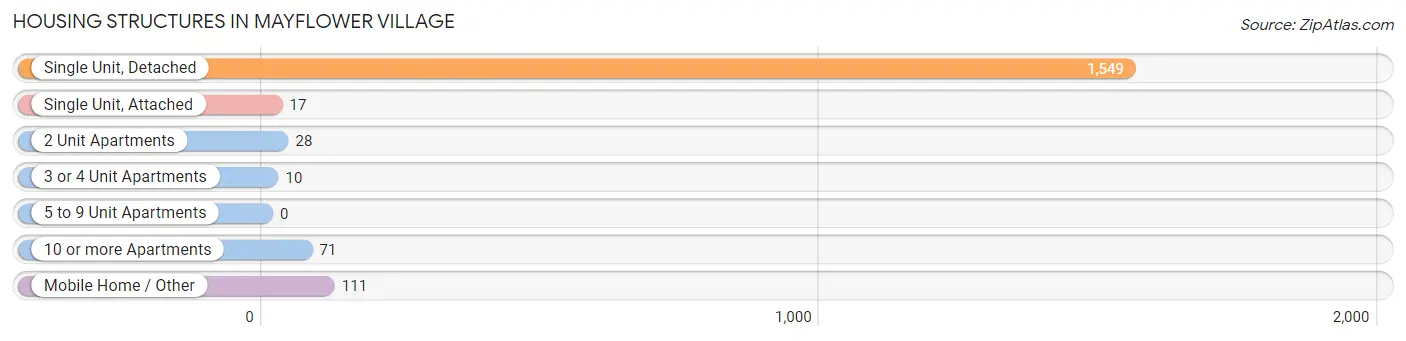
| Structure Type | # Housing Units | % Housing Units |
| Single Unit, Detached | 1,549 | 86.7% |
| Single Unit, Attached | 17 | 0.9% |
| 2 Unit Apartments | 28 | 1.6% |
| 3 or 4 Unit Apartments | 10 | 0.6% |
| 5 to 9 Unit Apartments | 0 | 0.0% |
| 10 or more Apartments | 71 | 4.0% |
| Mobile Home / Other | 111 | 6.2% |
| Total | 1,786 | 100.0% |
Housing Structures by Occupancy in Mayflower Village
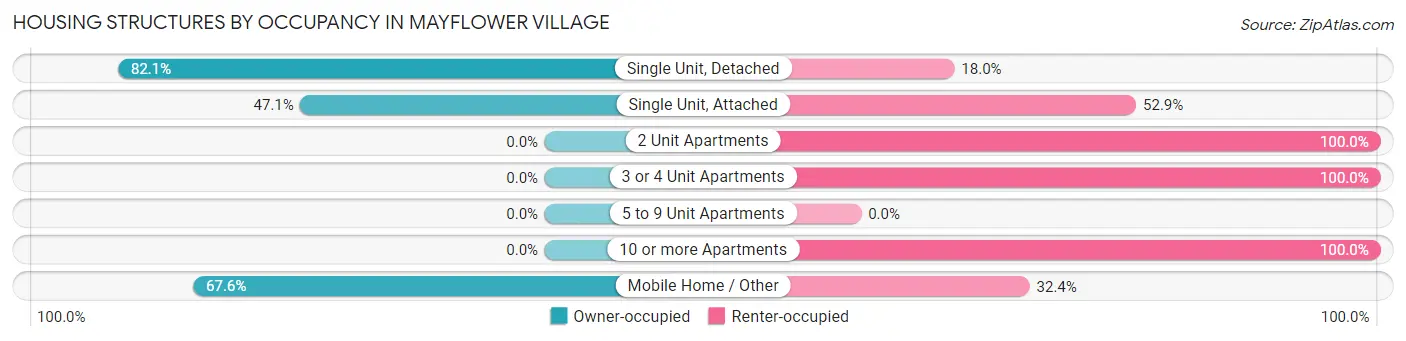
| Structure Type | Owner-occupied | Renter-occupied |
| Single Unit, Detached | 1,271 (82.1%) | 278 (17.9%) |
| Single Unit, Attached | 8 (47.1%) | 9 (52.9%) |
| 2 Unit Apartments | 0 (0.0%) | 28 (100.0%) |
| 3 or 4 Unit Apartments | 0 (0.0%) | 10 (100.0%) |
| 5 to 9 Unit Apartments | 0 (0.0%) | 0 (0.0%) |
| 10 or more Apartments | 0 (0.0%) | 71 (100.0%) |
| Mobile Home / Other | 75 (67.6%) | 36 (32.4%) |
| Total | 1,354 (75.8%) | 432 (24.2%) |
Housing Structures by Number of Rooms in Mayflower Village
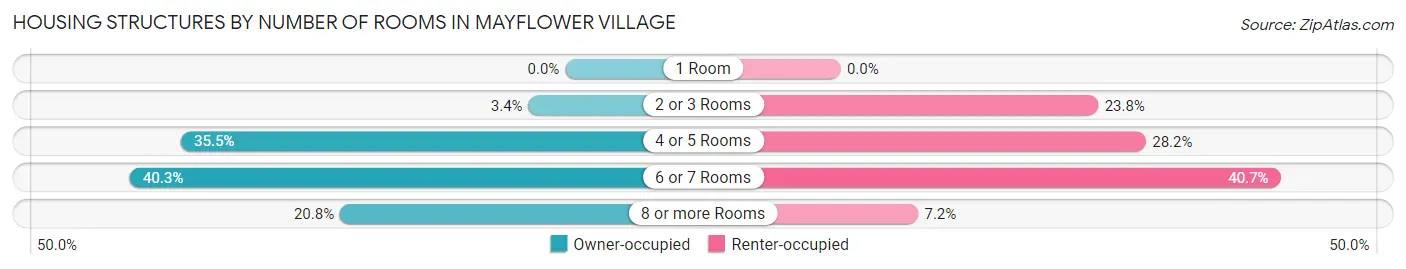
| Number of Rooms | Owner-occupied | Renter-occupied |
| 1 Room | 0 (0.0%) | 0 (0.0%) |
| 2 or 3 Rooms | 46 (3.4%) | 103 (23.8%) |
| 4 or 5 Rooms | 481 (35.5%) | 122 (28.2%) |
| 6 or 7 Rooms | 545 (40.3%) | 176 (40.7%) |
| 8 or more Rooms | 282 (20.8%) | 31 (7.2%) |
| Total | 1,354 (100.0%) | 432 (100.0%) |
Housing Structure by Heating Type in Mayflower Village
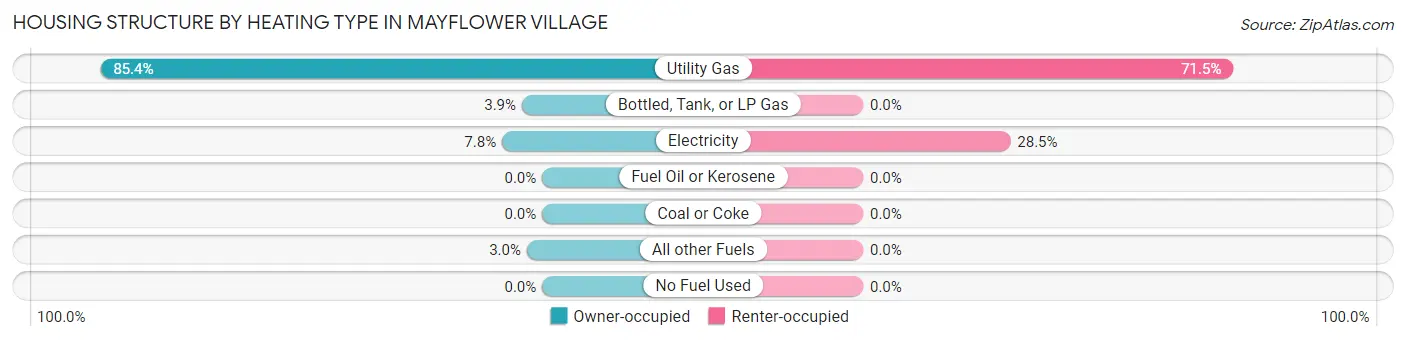
| Heating Type | Owner-occupied | Renter-occupied |
| Utility Gas | 1,156 (85.4%) | 309 (71.5%) |
| Bottled, Tank, or LP Gas | 53 (3.9%) | 0 (0.0%) |
| Electricity | 105 (7.7%) | 123 (28.5%) |
| Fuel Oil or Kerosene | 0 (0.0%) | 0 (0.0%) |
| Coal or Coke | 0 (0.0%) | 0 (0.0%) |
| All other Fuels | 40 (2.9%) | 0 (0.0%) |
| No Fuel Used | 0 (0.0%) | 0 (0.0%) |
| Total | 1,354 (100.0%) | 432 (100.0%) |
Household Vehicle Usage in Mayflower Village
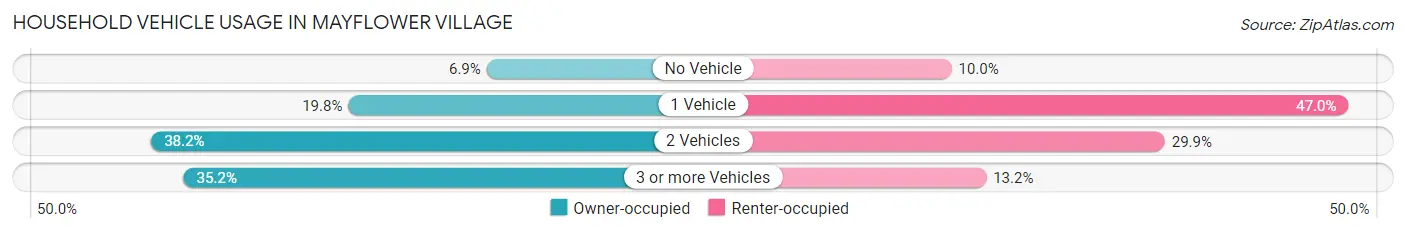
| Vehicles per Household | Owner-occupied | Renter-occupied |
| No Vehicle | 93 (6.9%) | 43 (10.0%) |
| 1 Vehicle | 268 (19.8%) | 203 (47.0%) |
| 2 Vehicles | 517 (38.2%) | 129 (29.9%) |
| 3 or more Vehicles | 476 (35.2%) | 57 (13.2%) |
| Total | 1,354 (100.0%) | 432 (100.0%) |
Real Estate & Mortgages in Mayflower Village
Real Estate and Mortgage Overview in Mayflower Village
| Characteristic | Without Mortgage | With Mortgage |
| Housing Units | 485 | 869 |
| Median Property Value | $784,000 | $834,800 |
| Median Household Income | $56,518 | $423 |
| Monthly Housing Costs | $815 | $397 |
| Real Estate Taxes | $3,570 | $9 |
Property Value by Mortgage Status in Mayflower Village
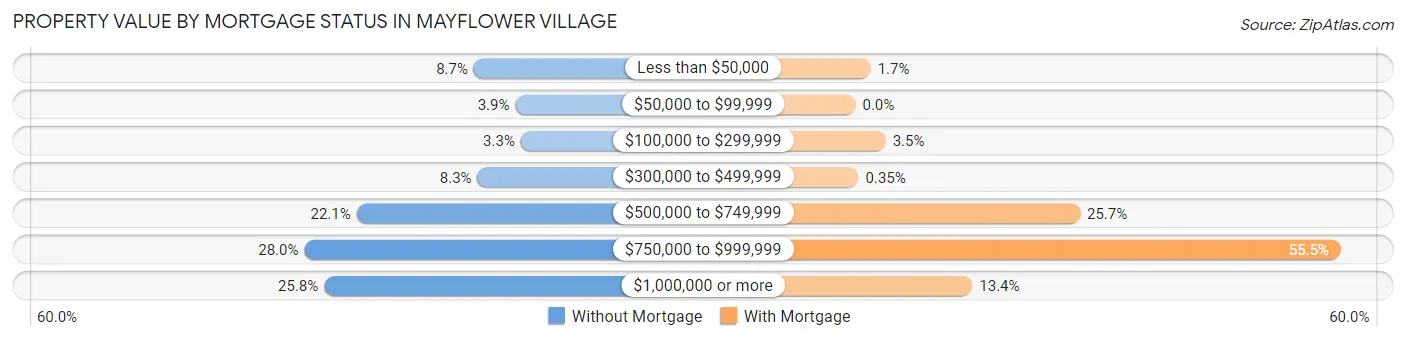
| Property Value | Without Mortgage | With Mortgage |
| Less than $50,000 | 42 (8.7%) | 15 (1.7%) |
| $50,000 to $99,999 | 19 (3.9%) | 0 (0.0%) |
| $100,000 to $299,999 | 16 (3.3%) | 30 (3.5%) |
| $300,000 to $499,999 | 40 (8.3%) | 3 (0.4%) |
| $500,000 to $749,999 | 107 (22.1%) | 223 (25.7%) |
| $750,000 to $999,999 | 136 (28.0%) | 482 (55.5%) |
| $1,000,000 or more | 125 (25.8%) | 116 (13.4%) |
| Total | 485 (100.0%) | 869 (100.0%) |
Household Income by Mortgage Status in Mayflower Village
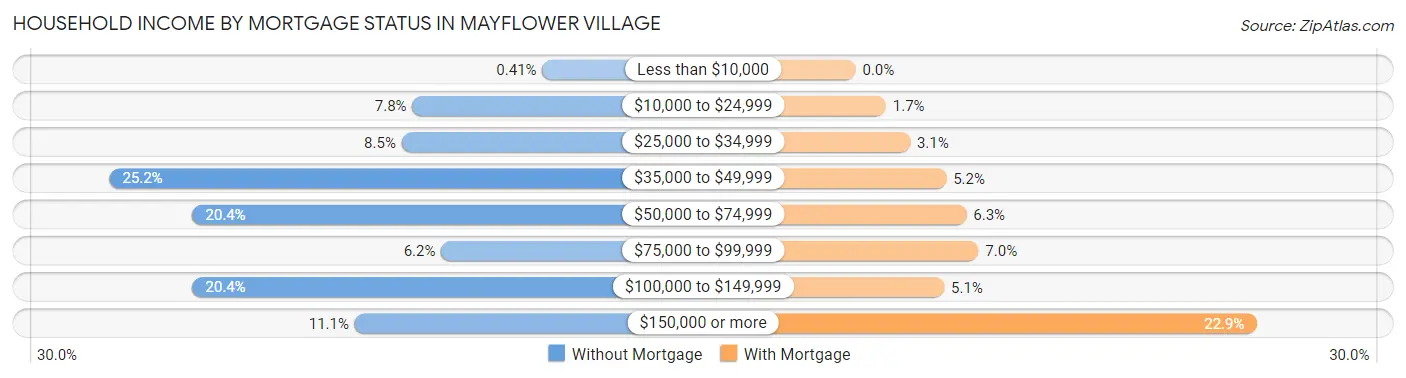
| Household Income | Without Mortgage | With Mortgage |
| Less than $10,000 | 2 (0.4%) | 0 (0.0%) |
| $10,000 to $24,999 | 38 (7.8%) | 15 (1.7%) |
| $25,000 to $34,999 | 41 (8.5%) | 27 (3.1%) |
| $35,000 to $49,999 | 122 (25.2%) | 45 (5.2%) |
| $50,000 to $74,999 | 99 (20.4%) | 55 (6.3%) |
| $75,000 to $99,999 | 30 (6.2%) | 61 (7.0%) |
| $100,000 to $149,999 | 99 (20.4%) | 44 (5.1%) |
| $150,000 or more | 54 (11.1%) | 199 (22.9%) |
| Total | 485 (100.0%) | 869 (100.0%) |
Property Value to Household Income Ratio in Mayflower Village
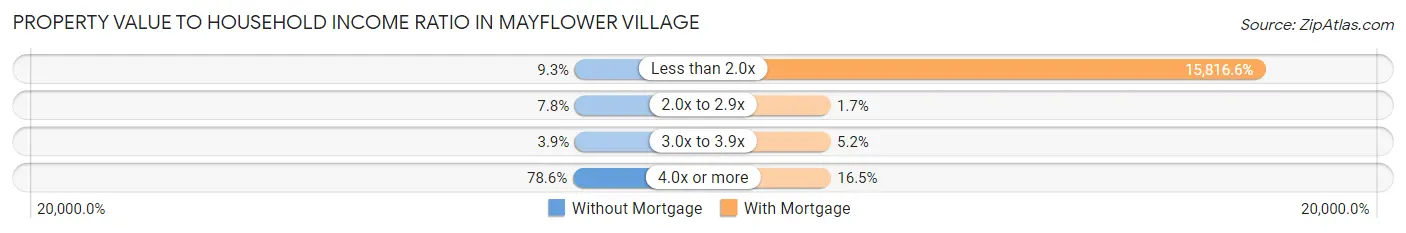
| Value-to-Income Ratio | Without Mortgage | With Mortgage |
| Less than 2.0x | 45 (9.3%) | 137,446 (15,816.6%) |
| 2.0x to 2.9x | 38 (7.8%) | 15 (1.7%) |
| 3.0x to 3.9x | 19 (3.9%) | 45 (5.2%) |
| 4.0x or more | 381 (78.6%) | 143 (16.5%) |
| Total | 485 (100.0%) | 869 (100.0%) |
Real Estate Taxes by Mortgage Status in Mayflower Village
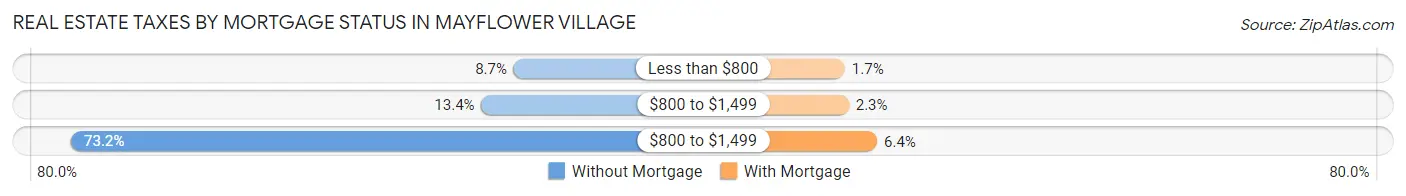
| Property Taxes | Without Mortgage | With Mortgage |
| Less than $800 | 42 (8.7%) | 15 (1.7%) |
| $800 to $1,499 | 65 (13.4%) | 20 (2.3%) |
| $800 to $1,499 | 355 (73.2%) | 56 (6.4%) |
| Total | 485 (100.0%) | 869 (100.0%) |
Health & Disability in Mayflower Village
Health Insurance Coverage by Age in Mayflower Village
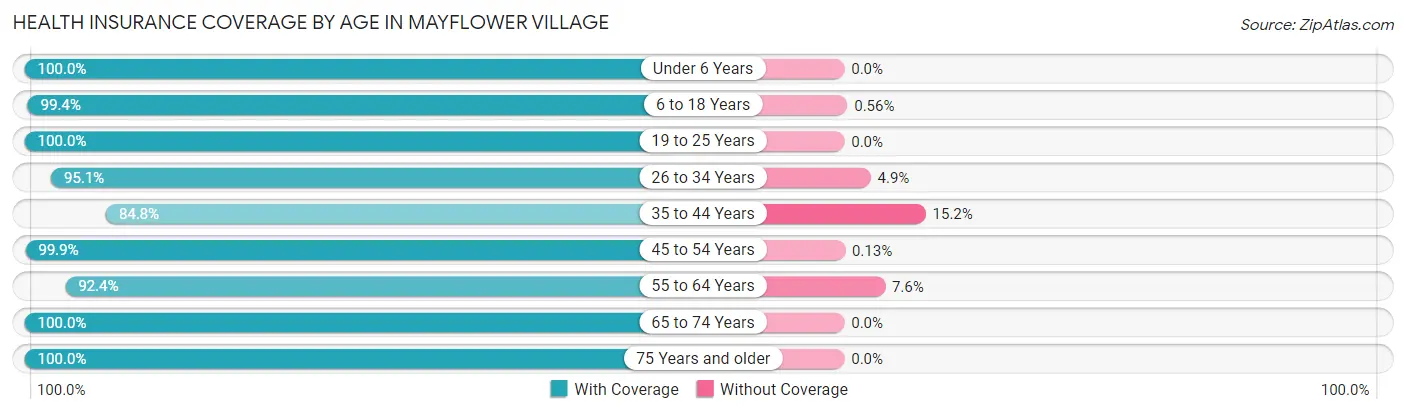
| Age Bracket | With Coverage | Without Coverage |
| Under 6 Years | 310 (100.0%) | 0 (0.0%) |
| 6 to 18 Years | 708 (99.4%) | 4 (0.6%) |
| 19 to 25 Years | 310 (100.0%) | 0 (0.0%) |
| 26 to 34 Years | 271 (95.1%) | 14 (4.9%) |
| 35 to 44 Years | 571 (84.8%) | 102 (15.2%) |
| 45 to 54 Years | 757 (99.9%) | 1 (0.1%) |
| 55 to 64 Years | 658 (92.4%) | 54 (7.6%) |
| 65 to 74 Years | 997 (100.0%) | 0 (0.0%) |
| 75 Years and older | 452 (100.0%) | 0 (0.0%) |
| Total | 5,034 (96.6%) | 175 (3.4%) |
Health Insurance Coverage by Citizenship Status in Mayflower Village
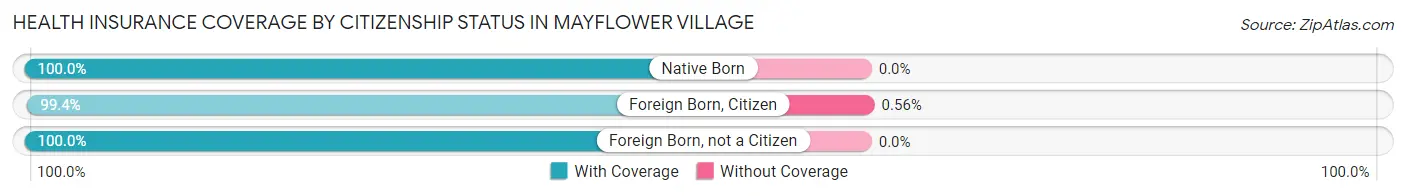
| Citizenship Status | With Coverage | Without Coverage |
| Native Born | 310 (100.0%) | 0 (0.0%) |
| Foreign Born, Citizen | 708 (99.4%) | 4 (0.6%) |
| Foreign Born, not a Citizen | 310 (100.0%) | 0 (0.0%) |
Health Insurance Coverage by Household Income in Mayflower Village
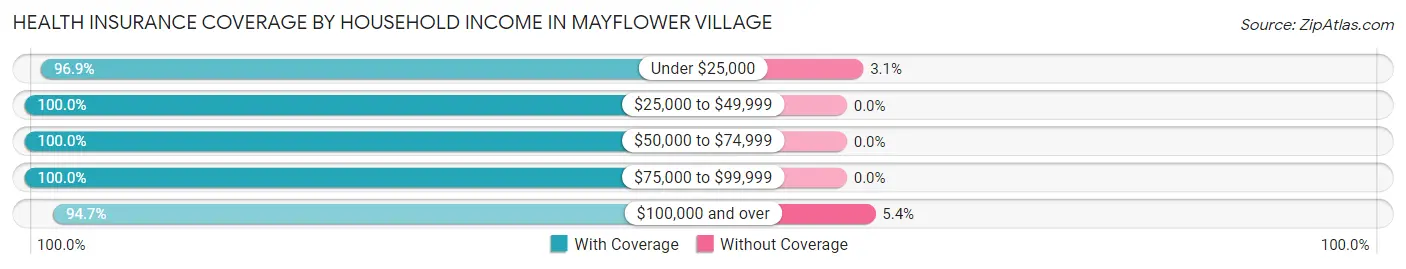
| Household Income | With Coverage | Without Coverage |
| Under $25,000 | 283 (96.9%) | 9 (3.1%) |
| $25,000 to $49,999 | 936 (100.0%) | 0 (0.0%) |
| $50,000 to $74,999 | 477 (100.0%) | 0 (0.0%) |
| $75,000 to $99,999 | 415 (100.0%) | 0 (0.0%) |
| $100,000 and over | 2,918 (94.7%) | 165 (5.3%) |
Public vs Private Health Insurance Coverage by Age in Mayflower Village
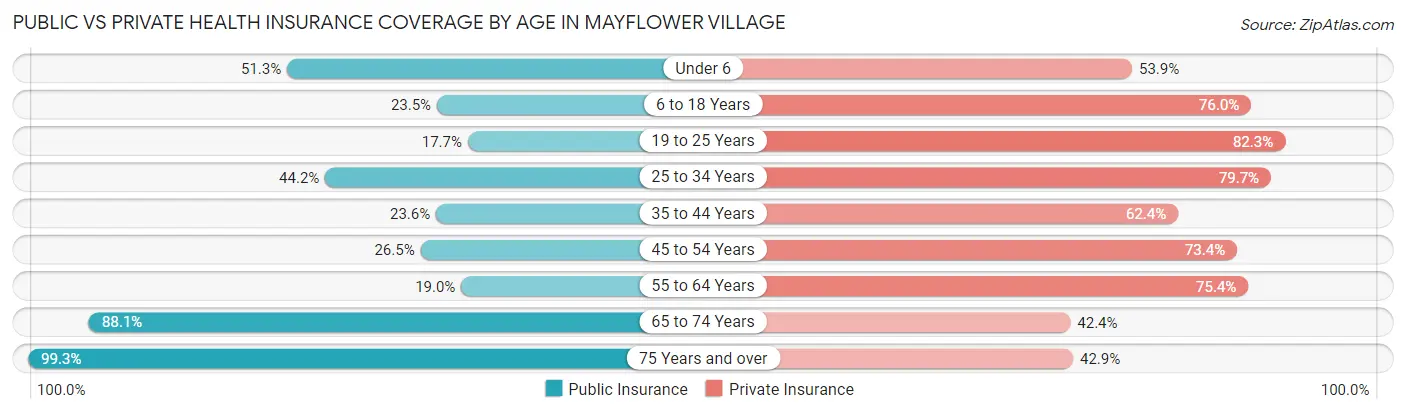
| Age Bracket | Public Insurance | Private Insurance |
| Under 6 | 159 (51.3%) | 167 (53.9%) |
| 6 to 18 Years | 167 (23.5%) | 541 (76.0%) |
| 19 to 25 Years | 55 (17.7%) | 255 (82.3%) |
| 25 to 34 Years | 126 (44.2%) | 227 (79.6%) |
| 35 to 44 Years | 159 (23.6%) | 420 (62.4%) |
| 45 to 54 Years | 201 (26.5%) | 556 (73.4%) |
| 55 to 64 Years | 135 (19.0%) | 537 (75.4%) |
| 65 to 74 Years | 878 (88.1%) | 423 (42.4%) |
| 75 Years and over | 449 (99.3%) | 194 (42.9%) |
| Total | 2,329 (44.7%) | 3,320 (63.7%) |
Disability Status by Sex by Age in Mayflower Village
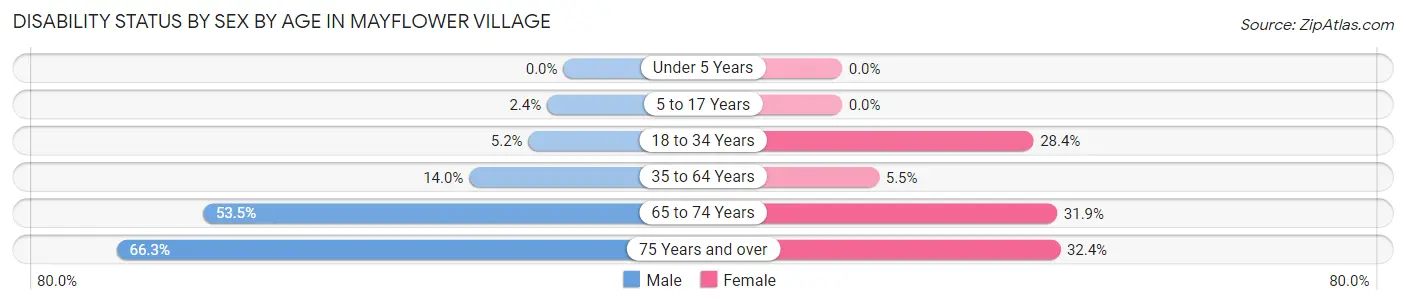
| Age Bracket | Male | Female |
| Under 5 Years | 0 (0.0%) | 0 (0.0%) |
| 5 to 17 Years | 11 (2.4%) | 0 (0.0%) |
| 18 to 34 Years | 13 (5.2%) | 110 (28.4%) |
| 35 to 64 Years | 152 (14.0%) | 58 (5.5%) |
| 65 to 74 Years | 227 (53.5%) | 183 (31.9%) |
| 75 Years and over | 136 (66.3%) | 80 (32.4%) |
Disability Class by Sex by Age in Mayflower Village
Disability Class: Hearing Difficulty
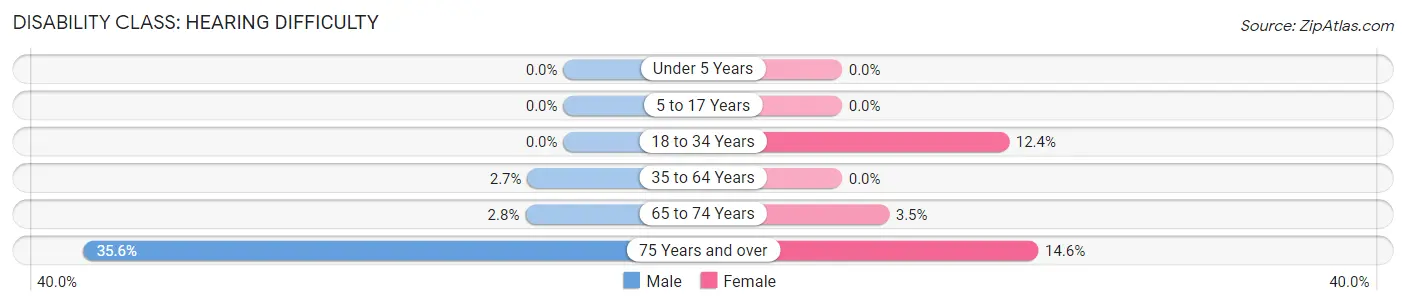
| Age Bracket | Male | Female |
| Under 5 Years | 0 (0.0%) | 0 (0.0%) |
| 5 to 17 Years | 0 (0.0%) | 0 (0.0%) |
| 18 to 34 Years | 0 (0.0%) | 48 (12.4%) |
| 35 to 64 Years | 29 (2.7%) | 0 (0.0%) |
| 65 to 74 Years | 12 (2.8%) | 20 (3.5%) |
| 75 Years and over | 73 (35.6%) | 36 (14.6%) |
Disability Class: Vision Difficulty
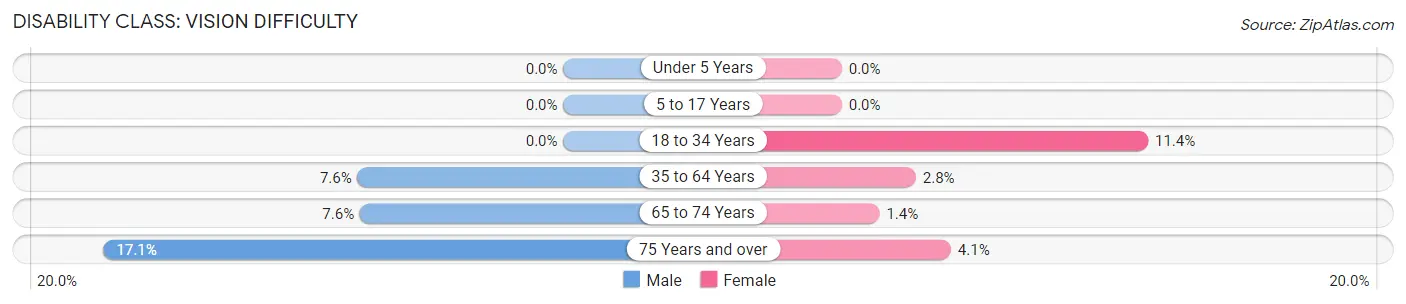
| Age Bracket | Male | Female |
| Under 5 Years | 0 (0.0%) | 0 (0.0%) |
| 5 to 17 Years | 0 (0.0%) | 0 (0.0%) |
| 18 to 34 Years | 0 (0.0%) | 44 (11.4%) |
| 35 to 64 Years | 83 (7.6%) | 29 (2.8%) |
| 65 to 74 Years | 32 (7.5%) | 8 (1.4%) |
| 75 Years and over | 35 (17.1%) | 10 (4.1%) |
Disability Class: Cognitive Difficulty
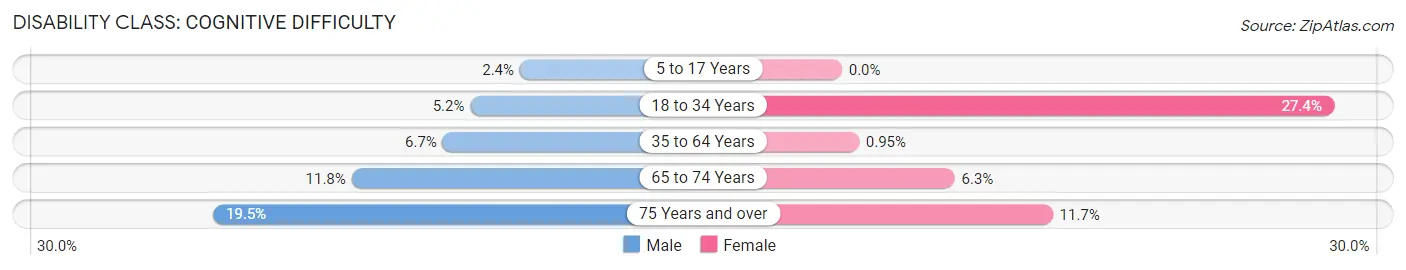
| Age Bracket | Male | Female |
| 5 to 17 Years | 11 (2.4%) | 0 (0.0%) |
| 18 to 34 Years | 13 (5.2%) | 106 (27.4%) |
| 35 to 64 Years | 73 (6.7%) | 10 (0.9%) |
| 65 to 74 Years | 50 (11.8%) | 36 (6.3%) |
| 75 Years and over | 40 (19.5%) | 29 (11.7%) |
Disability Class: Ambulatory Difficulty
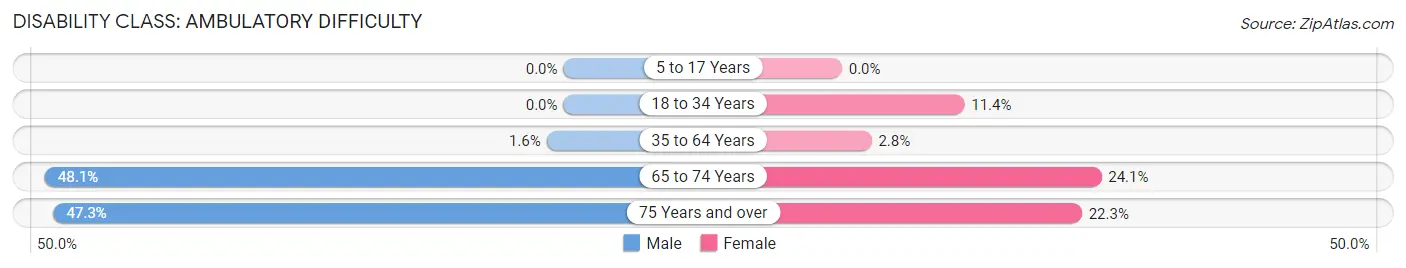
| Age Bracket | Male | Female |
| 5 to 17 Years | 0 (0.0%) | 0 (0.0%) |
| 18 to 34 Years | 0 (0.0%) | 44 (11.4%) |
| 35 to 64 Years | 17 (1.6%) | 29 (2.8%) |
| 65 to 74 Years | 204 (48.1%) | 138 (24.1%) |
| 75 Years and over | 97 (47.3%) | 55 (22.3%) |
Disability Class: Self-Care Difficulty
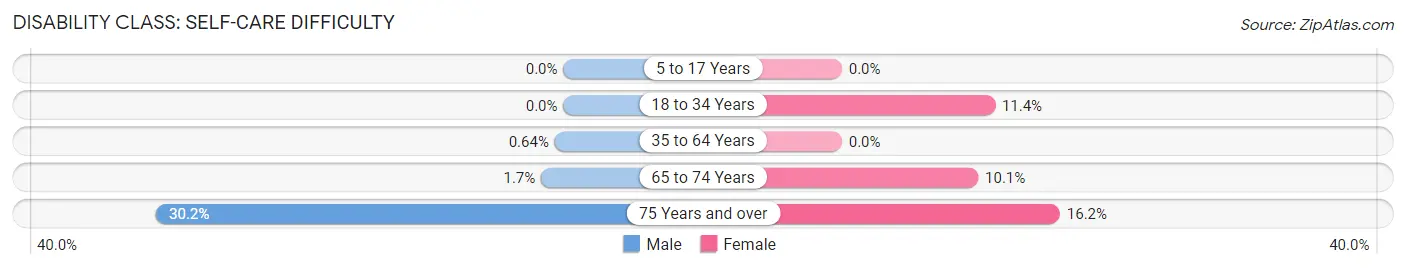
| Age Bracket | Male | Female |
| 5 to 17 Years | 0 (0.0%) | 0 (0.0%) |
| 18 to 34 Years | 0 (0.0%) | 44 (11.4%) |
| 35 to 64 Years | 7 (0.6%) | 0 (0.0%) |
| 65 to 74 Years | 7 (1.7%) | 58 (10.1%) |
| 75 Years and over | 62 (30.2%) | 40 (16.2%) |
Technology Access in Mayflower Village
Computing Device Access in Mayflower Village
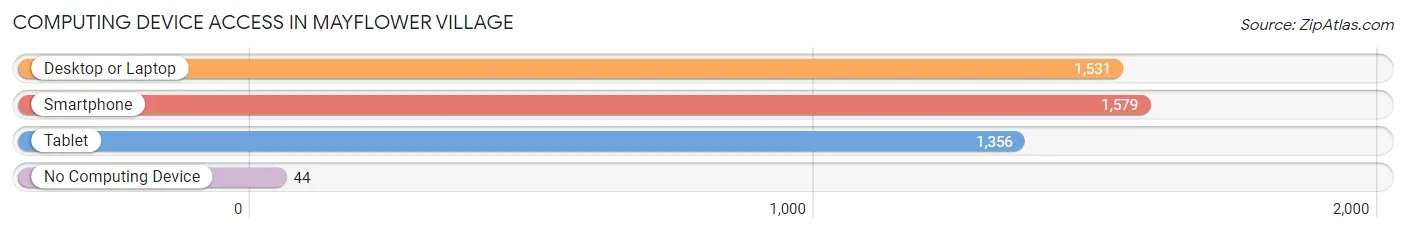
| Device Type | # Households | % Households |
| Desktop or Laptop | 1,531 | 85.7% |
| Smartphone | 1,579 | 88.4% |
| Tablet | 1,356 | 75.9% |
| No Computing Device | 44 | 2.5% |
| Total | 1,786 | 100.0% |
Internet Access in Mayflower Village
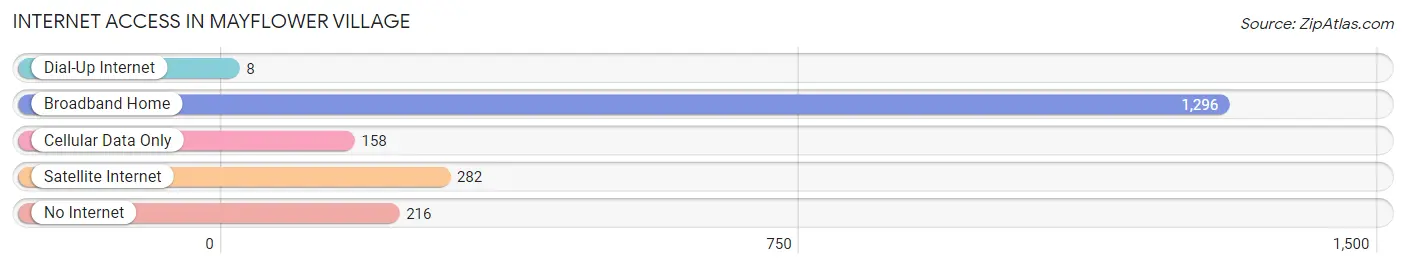
| Internet Type | # Households | % Households |
| Dial-Up Internet | 8 | 0.4% |
| Broadband Home | 1,296 | 72.6% |
| Cellular Data Only | 158 | 8.8% |
| Satellite Internet | 282 | 15.8% |
| No Internet | 216 | 12.1% |
| Total | 1,786 | 100.0% |
Mayflower Village Summary
Mayflower Village is a census-designated place located in Los Angeles County, California. It is located in the San Gabriel Valley, just east of the city of Pasadena. The population was 8,531 at the 2010 census, up from 8,287 at the 2000 census.
History
Mayflower Village was originally part of the Rancho San Pasqual, which was granted to Ygnacio Palomares and Ricardo Vejar in 1837. The area was later subdivided and sold to settlers in the late 19th century. The area was known as Mayflower Village in the early 20th century, and the name was officially adopted in the 1950s.
Geography
Mayflower Village is located at 34°9'25" North, 118°3'25" West (34.156944, -118.056944). It is bordered by the cities of Pasadena and South Pasadena to the west, San Marino to the north, and Arcadia to the east.
The total area of Mayflower Village is 1.7 square miles, all of which is land. The terrain is mostly flat, with some hills in the northern part of the village.
Economy
The economy of Mayflower Village is largely based on retail and services. The village is home to several shopping centers, including the Mayflower Village Shopping Center, the Mayflower Village Plaza, and the Mayflower Village Marketplace. There are also several restaurants and other businesses in the area.
Demographics
As of the 2010 census, there were 8,531 people, 2,945 households, and 2,092 families residing in Mayflower Village. The population density was 4,976.3 people per square mile. The racial makeup of the village was 57.2% White, 1.3% African American, 0.4% Native American, 24.2% Asian, 0.2% Pacific Islander, 11.7% from other races, and 5.2% from two or more races. Hispanic or Latino of any race were 24.7% of the population.
There were 2,945 households, out of which 33.2% had children under the age of 18 living with them, 51.2% were married couples living together, 12.7% had a female householder with no husband present, and 30.2% were non-families. 24.2% of all households were made up of individuals, and 8.2% had someone living alone who was 65 years of age or older. The average household size was 2.89 and the average family size was 3.45.
In Mayflower Village, the population was spread out, with 24.7% under the age of 18, 8.3% from 18 to 24, 28.2% from 25 to 44, 25.3% from 45 to 64, and 13.5% who were 65 years of age or older. The median age was 38 years. For every 100 females, there were 94.2 males. For every 100 females age 18 and over, there were 91.2 males.
The median income for a household in Mayflower Village was $50,945, and the median income for a family was $58,945. Males had a median income of $41,945 versus $35,945 for females. The per capita income for the village was $23,945. About 6.2% of families and 8.2% of the population were below the poverty line, including 10.2% of those under age 18 and 5.2% of those age 65 or over.
Common Questions
What is Per Capita Income in Mayflower Village?
Per Capita income in Mayflower Village is $37,745.
What is the Median Family Income in Mayflower Village?
Median Family Income in Mayflower Village is $125,429.
What is the Median Household income in Mayflower Village?
Median Household Income in Mayflower Village is $98,250.
What is Income or Wage Gap in Mayflower Village?
Income or Wage Gap in Mayflower Village is 42.0%.
Women in Mayflower Village earn 58.0 cents for every dollar earned by a man.
What is Inequality or Gini Index in Mayflower Village?
Inequality or Gini Index in Mayflower Village is 0.40.
What is the Total Population of Mayflower Village?
Total Population of Mayflower Village is 5,209.
What is the Total Male Population of Mayflower Village?
Total Male Population of Mayflower Village is 2,448.
What is the Total Female Population of Mayflower Village?
Total Female Population of Mayflower Village is 2,761.
What is the Ratio of Males per 100 Females in Mayflower Village?
There are 88.66 Males per 100 Females in Mayflower Village.
What is the Ratio of Females per 100 Males in Mayflower Village?
There are 112.79 Females per 100 Males in Mayflower Village.
What is the Median Population Age in Mayflower Village?
Median Population Age in Mayflower Village is 49.6 Years.
What is the Average Family Size in Mayflower Village
Average Family Size in Mayflower Village is 3.8 People.
What is the Average Household Size in Mayflower Village
Average Household Size in Mayflower Village is 2.9 People.
How Large is the Labor Force in Mayflower Village?
There are 2,660 People in the Labor Forcein in Mayflower Village.
What is the Percentage of People in the Labor Force in Mayflower Village?
61.9% of People are in the Labor Force in Mayflower Village.
What is the Unemployment Rate in Mayflower Village?
Unemployment Rate in Mayflower Village is 3.2%.