Electric City, WA Map & Demographics
Electric City Map
Electric City Overview
$41,187
PER CAPITA INCOME
$83,295
AVG FAMILY INCOME
$61,435
AVG HOUSEHOLD INCOME
52.3%
WAGE / INCOME GAP [ % ]
47.7¢/ $1
WAGE / INCOME GAP [ $ ]
0.41
INEQUALITY / GINI INDEX
732
TOTAL POPULATION
364
MALE POPULATION
368
FEMALE POPULATION
98.91
MALES / 100 FEMALES
101.10
FEMALES / 100 MALES
61.6
MEDIAN AGE
2.4
AVG FAMILY SIZE
2.1
AVG HOUSEHOLD SIZE
241
LABOR FORCE [ PEOPLE ]
38.0%
PERCENT IN LABOR FORCE
Electric City Zip Codes
Electric City Area Codes
Income in Electric City
Income Overview in Electric City
Per Capita Income in Electric City is $41,187, while median incomes of families and households are $83,295 and $61,435 respectively.
| Characteristic | Number | Measure |
| Per Capita Income | 732 | $41,187 |
| Median Family Income | 237 | $83,295 |
| Mean Family Income | 237 | $96,214 |
| Median Household Income | 349 | $61,435 |
| Mean Household Income | 349 | $85,515 |
| Income Deficit | 237 | $0 |
| Wage / Income Gap (%) | 732 | 52.32% |
| Wage / Income Gap ($) | 732 | 47.68¢ per $1 |
| Gini / Inequality Index | 732 | 0.41 |
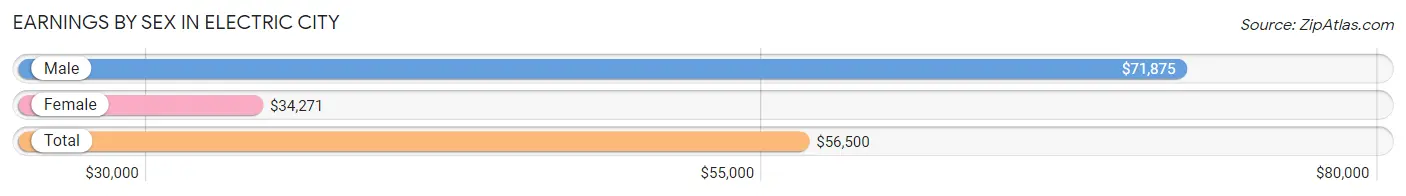
Earnings by Sex in Electric City
Average Earnings in Electric City are $56,500, $71,875 for men and $34,271 for women, a difference of 52.3%.
| Sex | Number | Average Earnings |
| Male | 133 (52.8%) | $71,875 |
| Female | 119 (47.2%) | $34,271 |
| Total | 252 (100.0%) | $56,500 |
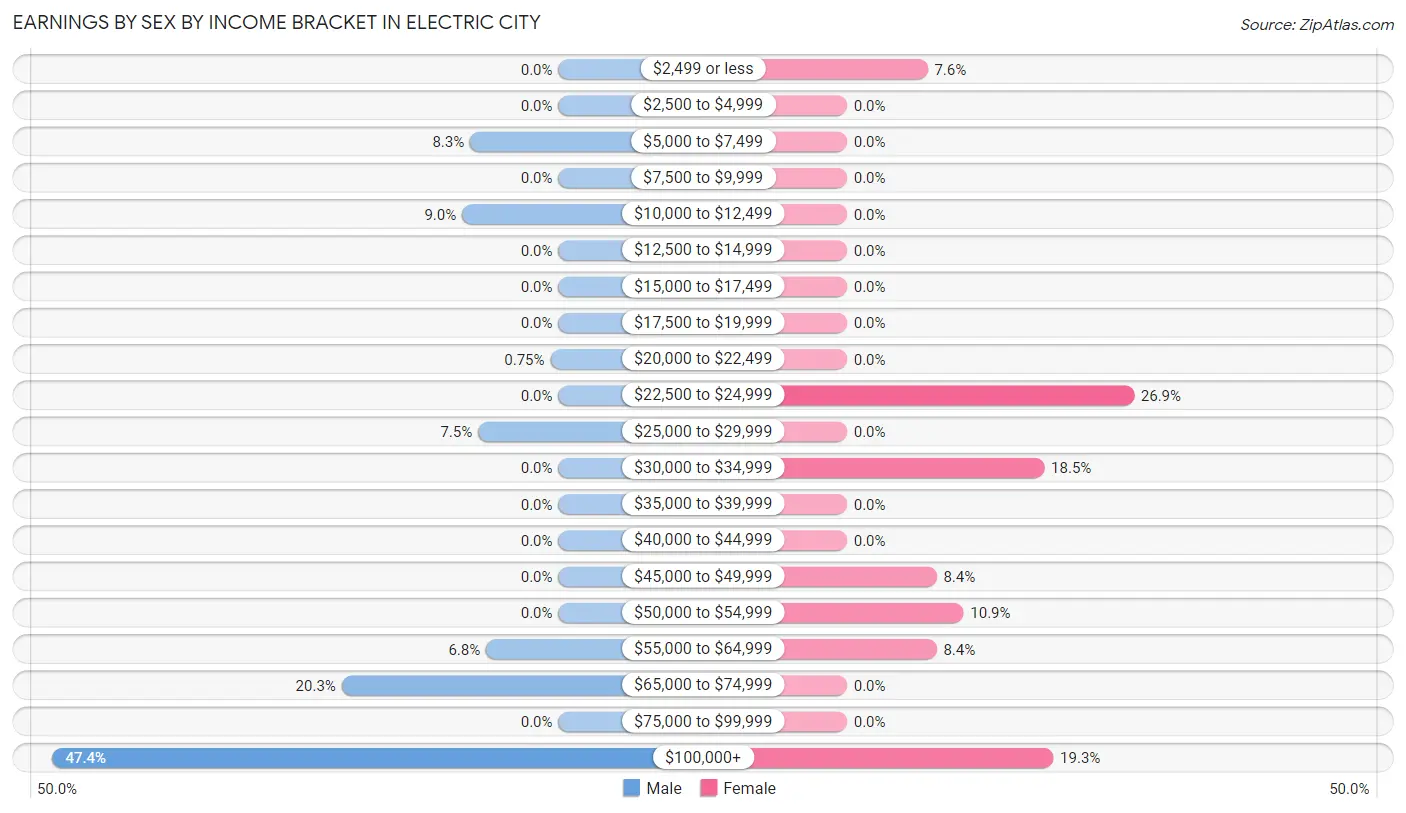
Earnings by Sex by Income Bracket in Electric City
The most common earnings brackets in Electric City are $100,000+ for men (63 | 47.4%) and $22,500 to $24,999 for women (32 | 26.9%).
| Income | Male | Female |
| $2,499 or less | 0 (0.0%) | 9 (7.6%) |
| $2,500 to $4,999 | 0 (0.0%) | 0 (0.0%) |
| $5,000 to $7,499 | 11 (8.3%) | 0 (0.0%) |
| $7,500 to $9,999 | 0 (0.0%) | 0 (0.0%) |
| $10,000 to $12,499 | 12 (9.0%) | 0 (0.0%) |
| $12,500 to $14,999 | 0 (0.0%) | 0 (0.0%) |
| $15,000 to $17,499 | 0 (0.0%) | 0 (0.0%) |
| $17,500 to $19,999 | 0 (0.0%) | 0 (0.0%) |
| $20,000 to $22,499 | 1 (0.7%) | 0 (0.0%) |
| $22,500 to $24,999 | 0 (0.0%) | 32 (26.9%) |
| $25,000 to $29,999 | 10 (7.5%) | 0 (0.0%) |
| $30,000 to $34,999 | 0 (0.0%) | 22 (18.5%) |
| $35,000 to $39,999 | 0 (0.0%) | 0 (0.0%) |
| $40,000 to $44,999 | 0 (0.0%) | 0 (0.0%) |
| $45,000 to $49,999 | 0 (0.0%) | 10 (8.4%) |
| $50,000 to $54,999 | 0 (0.0%) | 13 (10.9%) |
| $55,000 to $64,999 | 9 (6.8%) | 10 (8.4%) |
| $65,000 to $74,999 | 27 (20.3%) | 0 (0.0%) |
| $75,000 to $99,999 | 0 (0.0%) | 0 (0.0%) |
| $100,000+ | 63 (47.4%) | 23 (19.3%) |
| Total | 133 (100.0%) | 119 (100.0%) |
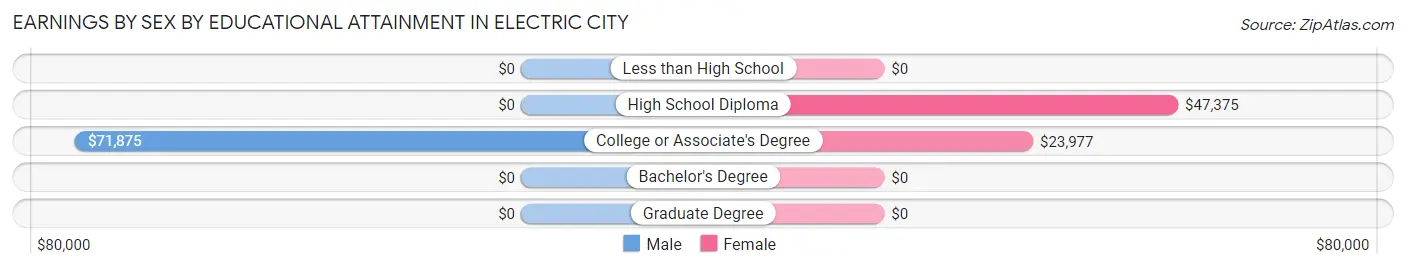
Earnings by Sex by Educational Attainment in Electric City
Average earnings in Electric City are $71,875 for men and $34,271 for women, a difference of 52.3%. Men with an educational attainment of college or associate's degree enjoy the highest average annual earnings of $71,875, while those with college or associate's degree education earn the least with $71,875. Women with an educational attainment of high school diploma earn the most with the average annual earnings of $47,375, while those with college or associate's degree education have the smallest earnings of $23,977.
| Educational Attainment | Male Income | Female Income |
| Less than High School | - | - |
| High School Diploma | - | - |
| College or Associate's Degree | $71,875 | $23,977 |
| Bachelor's Degree | - | - |
| Graduate Degree | - | - |
| Total | $71,875 | $34,271 |
Family Income in Electric City
Family Income Brackets in Electric City
According to the Electric City family income data, there are 57 families falling into the $75,000 to $99,999 income range, which is the most common income bracket and makes up 24.0% of all families.
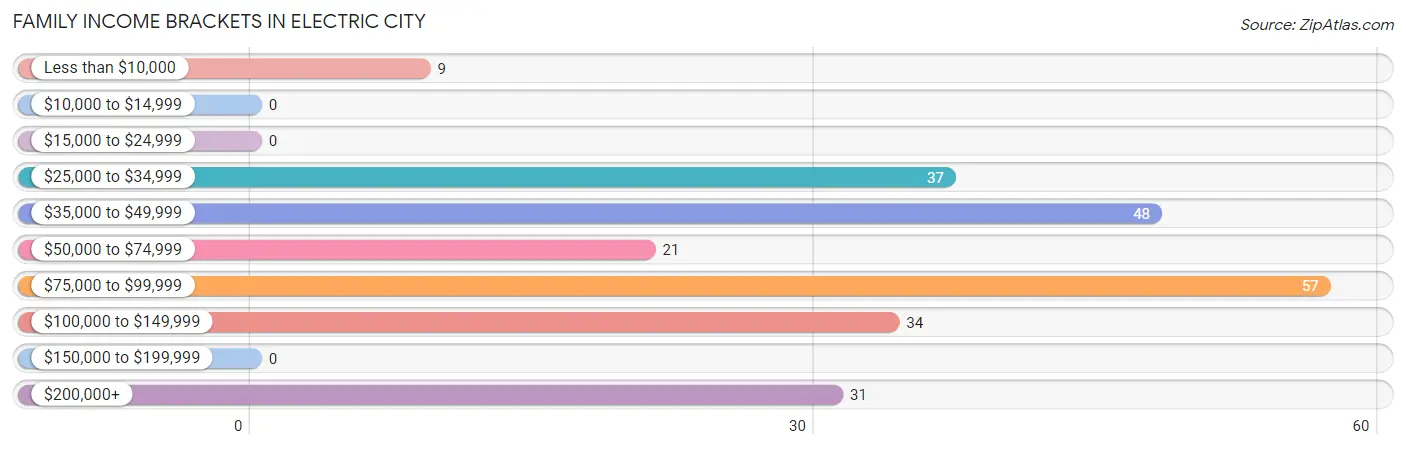
| Income Bracket | # Families | % Families |
| Less than $10,000 | 9 | 3.8% |
| $10,000 to $14,999 | 0 | 0.0% |
| $15,000 to $24,999 | 0 | 0.0% |
| $25,000 to $34,999 | 37 | 15.6% |
| $35,000 to $49,999 | 48 | 20.3% |
| $50,000 to $74,999 | 21 | 8.9% |
| $75,000 to $99,999 | 57 | 24.1% |
| $100,000 to $149,999 | 34 | 14.3% |
| $150,000 to $199,999 | 0 | 0.0% |
| $200,000+ | 31 | 13.1% |
Family Income by Famaliy Size in Electric City
2-person families (164 | 69.2%) account for the highest median family income in Electric City with $83,636 per family, while 2-person families (164 | 69.2%) have the highest median income of $41,818 per family member.
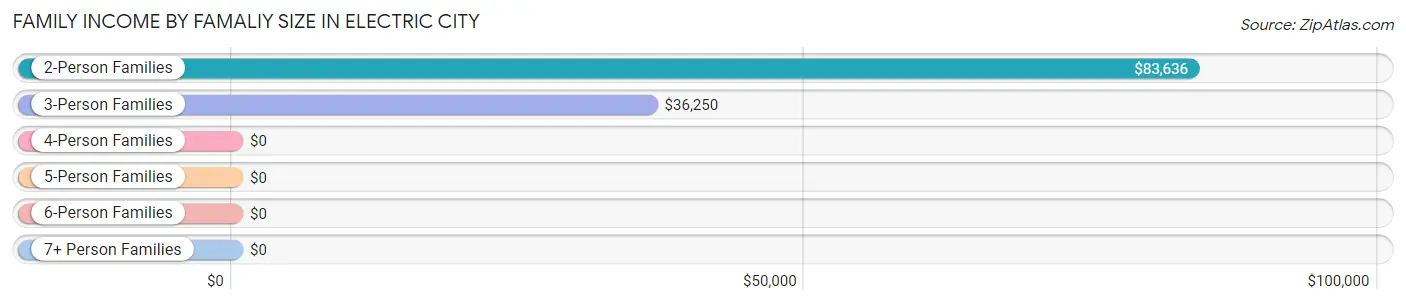
| Income Bracket | # Families | Median Income |
| 2-Person Families | 164 (69.2%) | $83,636 |
| 3-Person Families | 38 (16.0%) | $36,250 |
| 4-Person Families | 23 (9.7%) | $0 |
| 5-Person Families | 12 (5.1%) | $0 |
| 6-Person Families | 0 (0.0%) | $0 |
| 7+ Person Families | 0 (0.0%) | $0 |
| Total | 237 (100.0%) | $83,295 |
Family Income by Number of Earners in Electric City
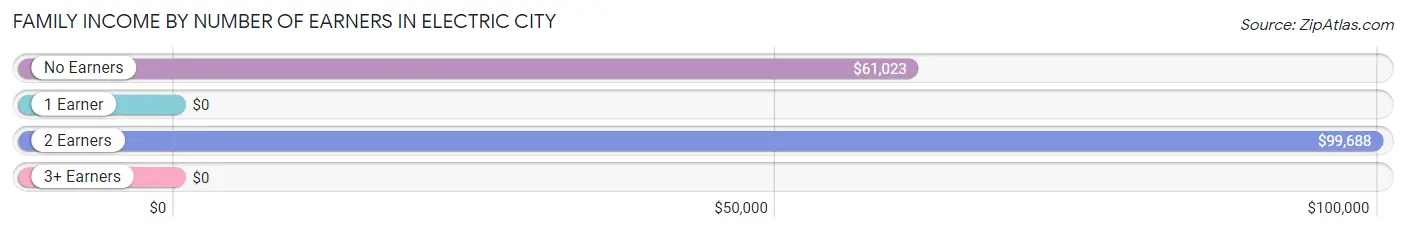
| Number of Earners | # Families | Median Income |
| No Earners | 97 (40.9%) | $61,023 |
| 1 Earner | 71 (30.0%) | $0 |
| 2 Earners | 69 (29.1%) | $99,688 |
| 3+ Earners | 0 (0.0%) | $0 |
| Total | 237 (100.0%) | $83,295 |
Household Income in Electric City
Household Income Brackets in Electric City
With 68 households falling in the category, the $50,000 to $74,999 income range is the most frequent in Electric City, accounting for 19.5% of all households.
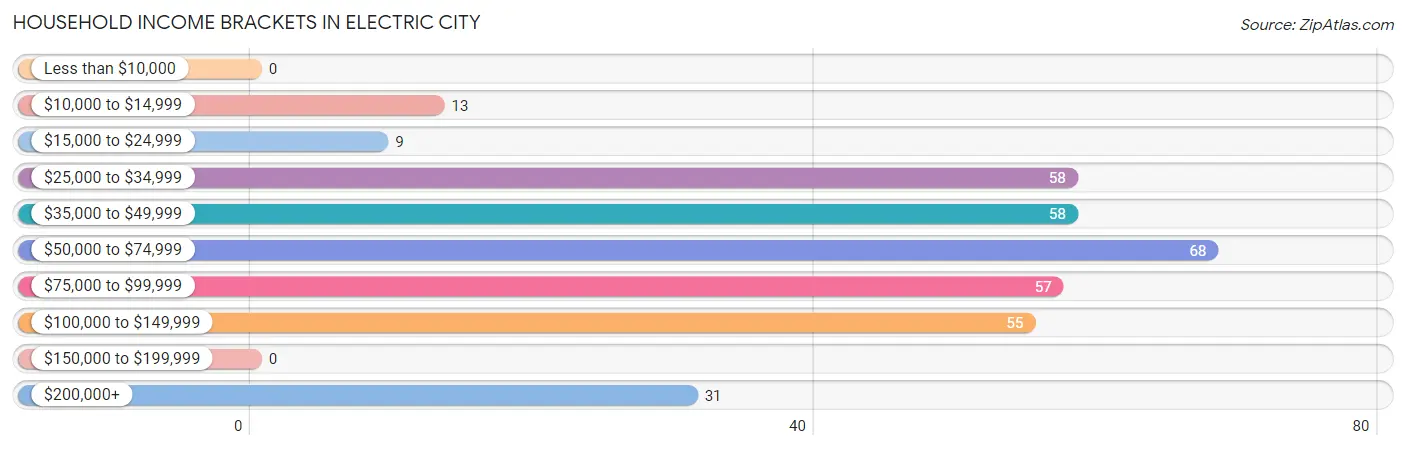
| Income Bracket | # Households | % Households |
| Less than $10,000 | 0 | 0.0% |
| $10,000 to $14,999 | 13 | 3.7% |
| $15,000 to $24,999 | 9 | 2.6% |
| $25,000 to $34,999 | 58 | 16.6% |
| $35,000 to $49,999 | 58 | 16.6% |
| $50,000 to $74,999 | 68 | 19.5% |
| $75,000 to $99,999 | 57 | 16.3% |
| $100,000 to $149,999 | 55 | 15.8% |
| $150,000 to $199,999 | 0 | 0.0% |
| $200,000+ | 31 | 8.9% |
Household Income by Householder Age in Electric City
The median household income in Electric City is $61,435, with the highest median household income of $126,818 found in the 45 to 64 years age bracket for the primary householder. A total of 70 households (20.1%) fall into this category.
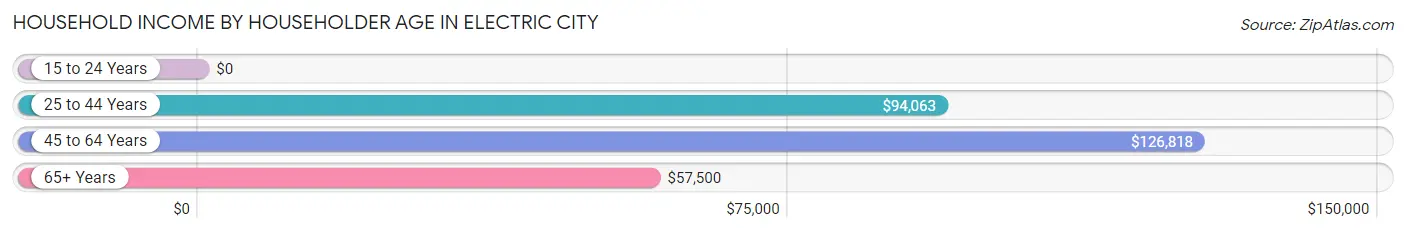
| Income Bracket | # Households | Median Income |
| 15 to 24 Years | 0 (0.0%) | $0 |
| 25 to 44 Years | 77 (22.1%) | $94,063 |
| 45 to 64 Years | 70 (20.1%) | $126,818 |
| 65+ Years | 202 (57.9%) | $57,500 |
| Total | 349 (100.0%) | $61,435 |
Poverty in Electric City
Income Below Poverty by Sex and Age in Electric City
With 5.5% poverty level for males and 4.9% for females among the residents of Electric City, 6 to 11 year old males and under 5 year old females are the most vulnerable to poverty, with 8 males (30.8%) and 9 females (100.0%) in their respective age groups living below the poverty level.
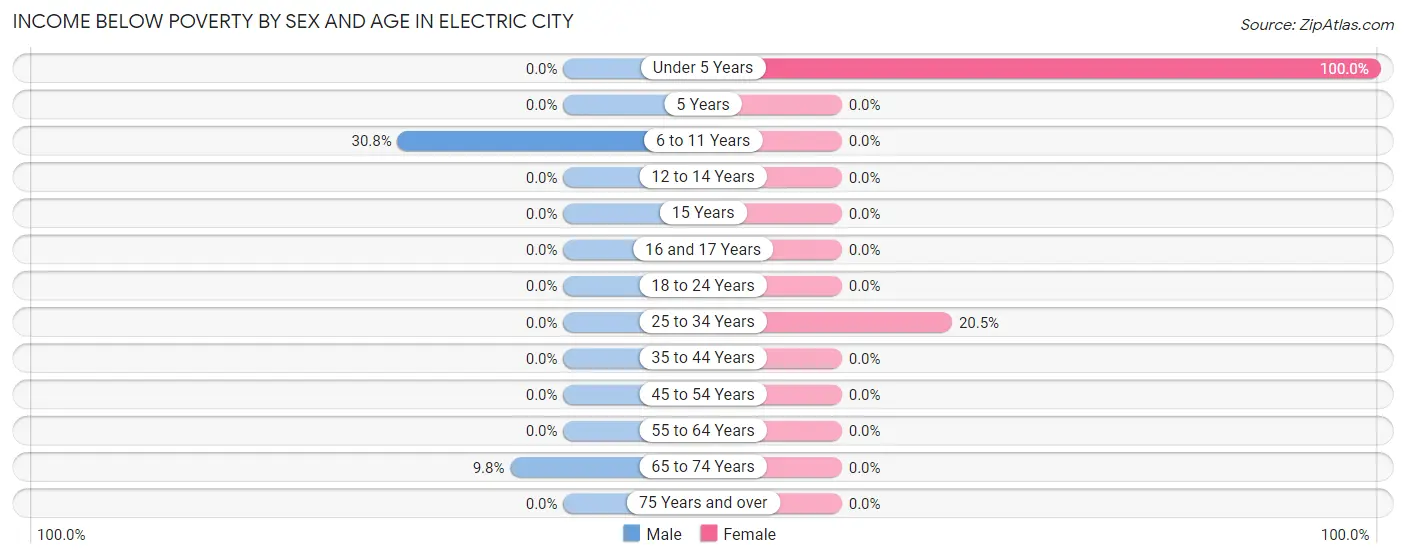
| Age Bracket | Male | Female |
| Under 5 Years | 0 (0.0%) | 9 (100.0%) |
| 5 Years | 0 (0.0%) | 0 (0.0%) |
| 6 to 11 Years | 8 (30.8%) | 0 (0.0%) |
| 12 to 14 Years | 0 (0.0%) | 0 (0.0%) |
| 15 Years | 0 (0.0%) | 0 (0.0%) |
| 16 and 17 Years | 0 (0.0%) | 0 (0.0%) |
| 18 to 24 Years | 0 (0.0%) | 0 (0.0%) |
| 25 to 34 Years | 0 (0.0%) | 9 (20.4%) |
| 35 to 44 Years | 0 (0.0%) | 0 (0.0%) |
| 45 to 54 Years | 0 (0.0%) | 0 (0.0%) |
| 55 to 64 Years | 0 (0.0%) | 0 (0.0%) |
| 65 to 74 Years | 12 (9.8%) | 0 (0.0%) |
| 75 Years and over | 0 (0.0%) | 0 (0.0%) |
| Total | 20 (5.5%) | 18 (4.9%) |
Income Above Poverty by Sex and Age in Electric City
According to the poverty statistics in Electric City, males aged under 5 years and females aged 5 years are the age groups that are most secure financially, with 100.0% of males and 100.0% of females in these age groups living above the poverty line.
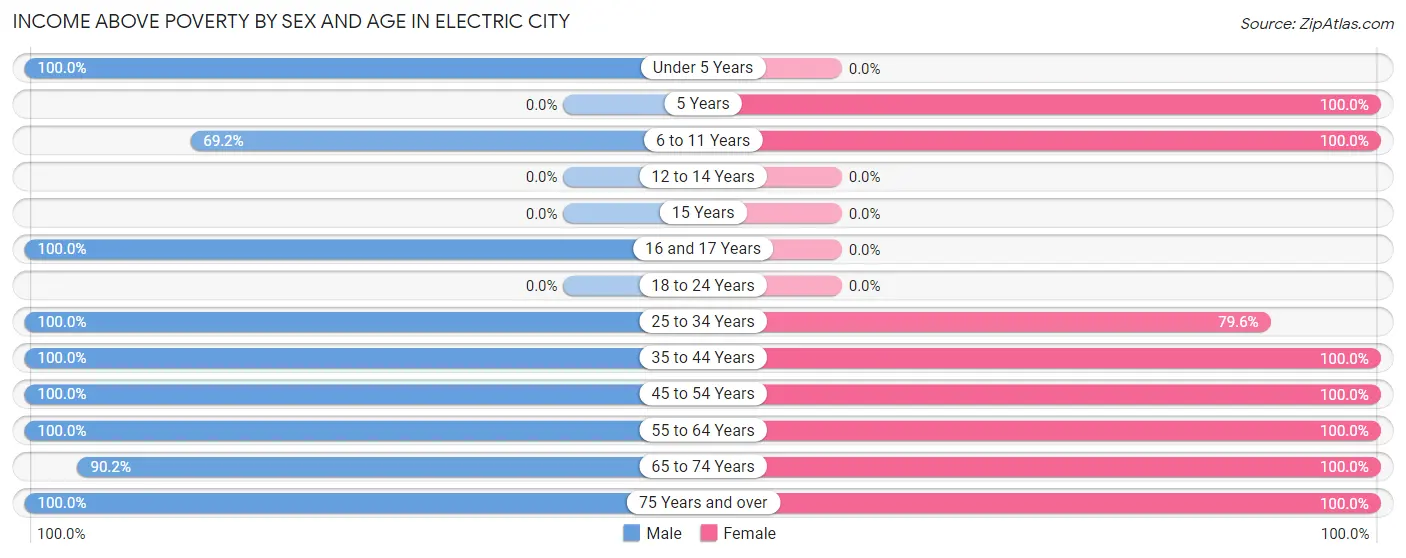
| Age Bracket | Male | Female |
| Under 5 Years | 33 (100.0%) | 0 (0.0%) |
| 5 Years | 0 (0.0%) | 8 (100.0%) |
| 6 to 11 Years | 18 (69.2%) | 22 (100.0%) |
| 12 to 14 Years | 0 (0.0%) | 0 (0.0%) |
| 15 Years | 0 (0.0%) | 0 (0.0%) |
| 16 and 17 Years | 14 (100.0%) | 0 (0.0%) |
| 18 to 24 Years | 0 (0.0%) | 0 (0.0%) |
| 25 to 34 Years | 39 (100.0%) | 35 (79.5%) |
| 35 to 44 Years | 9 (100.0%) | 21 (100.0%) |
| 45 to 54 Years | 42 (100.0%) | 45 (100.0%) |
| 55 to 64 Years | 22 (100.0%) | 66 (100.0%) |
| 65 to 74 Years | 110 (90.2%) | 106 (100.0%) |
| 75 Years and over | 57 (100.0%) | 47 (100.0%) |
| Total | 344 (94.5%) | 350 (95.1%) |
Income Below Poverty Among Married-Couple Families in Electric City
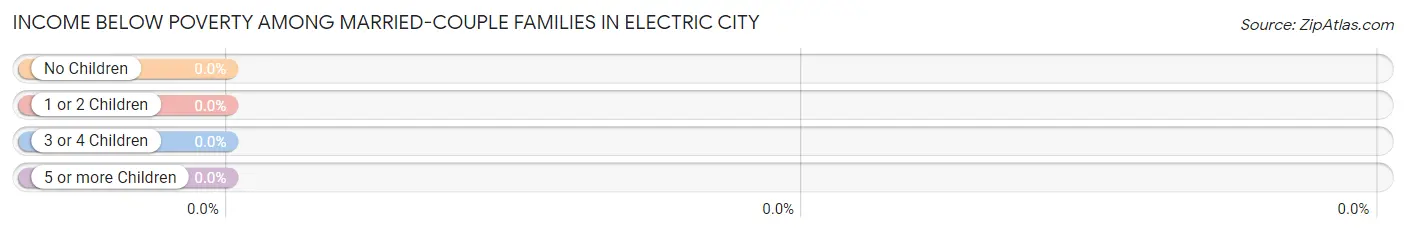
| Children | Above Poverty | Below Poverty |
| No Children | 139 (100.0%) | 0 (0.0%) |
| 1 or 2 Children | 23 (100.0%) | 0 (0.0%) |
| 3 or 4 Children | 12 (100.0%) | 0 (0.0%) |
| 5 or more Children | 0 (0.0%) | 0 (0.0%) |
| Total | 174 (100.0%) | 0 (0.0%) |
Income Below Poverty Among Single-Parent Households in Electric City
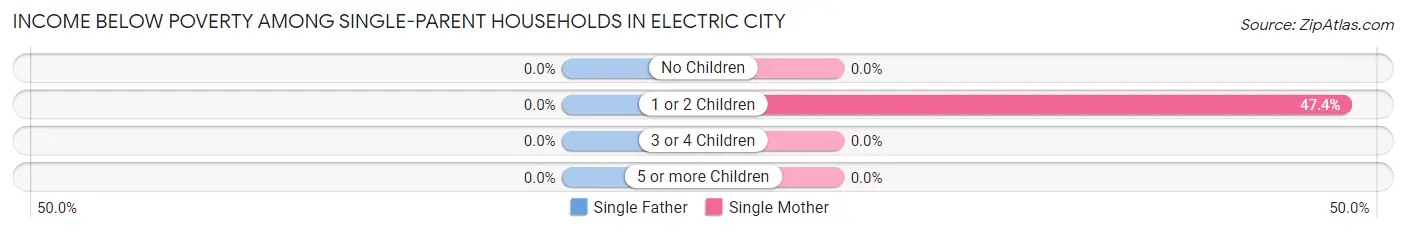
| Children | Single Father | Single Mother |
| No Children | 0 (0.0%) | 0 (0.0%) |
| 1 or 2 Children | 0 (0.0%) | 9 (47.4%) |
| 3 or 4 Children | 0 (0.0%) | 0 (0.0%) |
| 5 or more Children | 0 (0.0%) | 0 (0.0%) |
| Total | 0 (0.0%) | 9 (23.7%) |
Income Below Poverty Among Married-Couple vs Single-Parent Households in Electric City
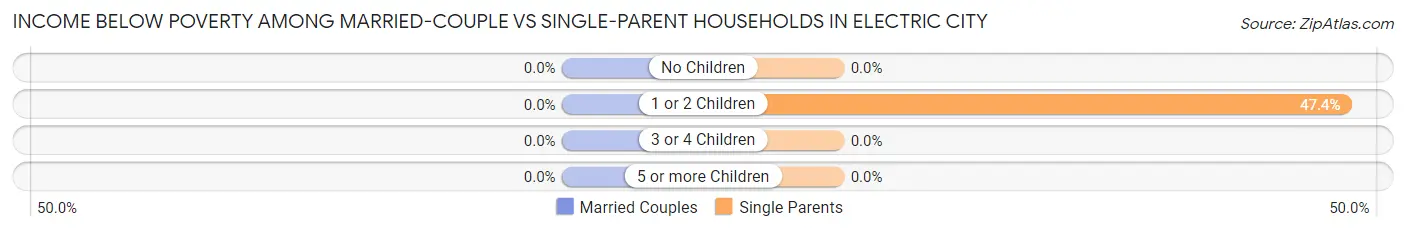
| Children | Married-Couple Families | Single-Parent Households |
| No Children | 0 (0.0%) | 0 (0.0%) |
| 1 or 2 Children | 0 (0.0%) | 9 (47.4%) |
| 3 or 4 Children | 0 (0.0%) | 0 (0.0%) |
| 5 or more Children | 0 (0.0%) | 0 (0.0%) |
| Total | 0 (0.0%) | 9 (14.3%) |
Race in Electric City
The most populous races in Electric City are White / Caucasian (668 | 91.3%), Native / Alaskan (46 | 6.3%), and Two or more Races (18 | 2.5%).
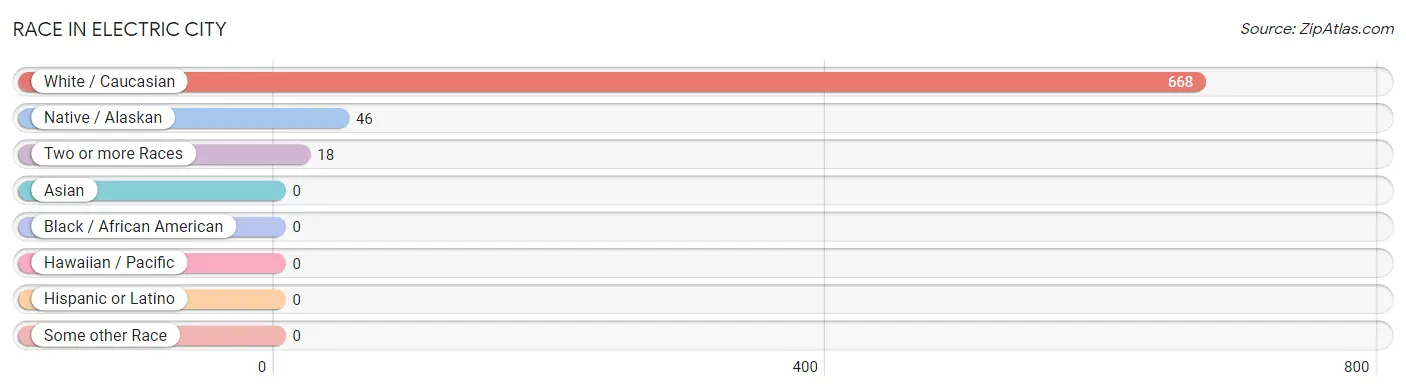
| Race | # Population | % Population |
| Asian | 0 | 0.0% |
| Black / African American | 0 | 0.0% |
| Hawaiian / Pacific | 0 | 0.0% |
| Hispanic or Latino | 0 | 0.0% |
| Native / Alaskan | 46 | 6.3% |
| White / Caucasian | 668 | 91.3% |
| Two or more Races | 18 | 2.5% |
| Some other Race | 0 | 0.0% |
| Total | 732 | 100.0% |
Ancestry in Electric City
The most populous ancestries reported in Electric City are American (217 | 29.6%), German (135 | 18.4%), English (109 | 14.9%), French (76 | 10.4%), and Norwegian (50 | 6.8%), together accounting for 80.2% of all Electric City residents.
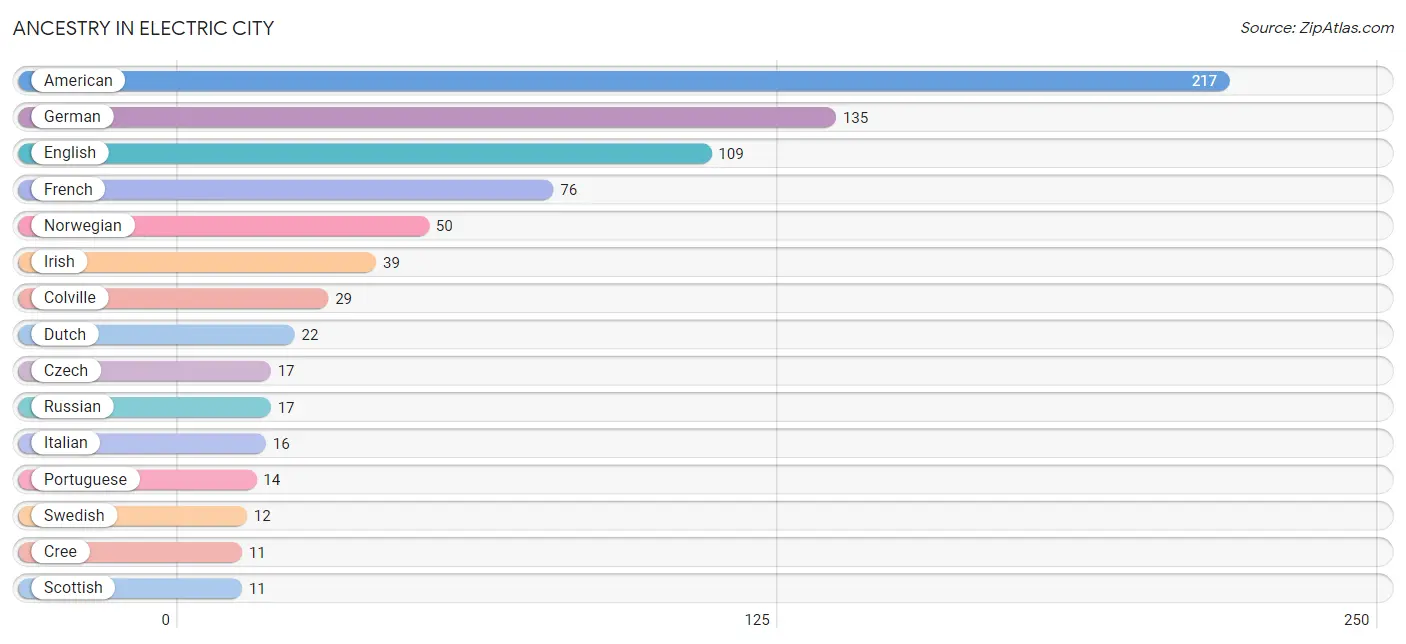
| Ancestry | # Population | % Population |
| American | 217 | 29.6% |
| Cherokee | 10 | 1.4% |
| Colville | 29 | 4.0% |
| Cree | 11 | 1.5% |
| Czech | 17 | 2.3% |
| Dutch | 22 | 3.0% |
| English | 109 | 14.9% |
| European | 9 | 1.2% |
| French | 76 | 10.4% |
| German | 135 | 18.4% |
| Hungarian | 10 | 1.4% |
| Irish | 39 | 5.3% |
| Italian | 16 | 2.2% |
| Norwegian | 50 | 6.8% |
| Portuguese | 14 | 1.9% |
| Russian | 17 | 2.3% |
| Scottish | 11 | 1.5% |
| Swedish | 12 | 1.6% | View All 18 Rows |
Immigrants in Electric City
The most numerous immigrant groups reported in Electric City came from , and Canada (24 | 3.3%), together accounting for 3.3% of all Electric City residents.

| Immigration Origin | # Population | % Population |
| Canada | 24 | 3.3% | View All 1 Rows |
Sex and Age in Electric City
Sex and Age in Electric City
The most populous age groups in Electric City are 65 to 69 Years (62 | 17.0%) for men and 65 to 69 Years (54 | 14.7%) for women.
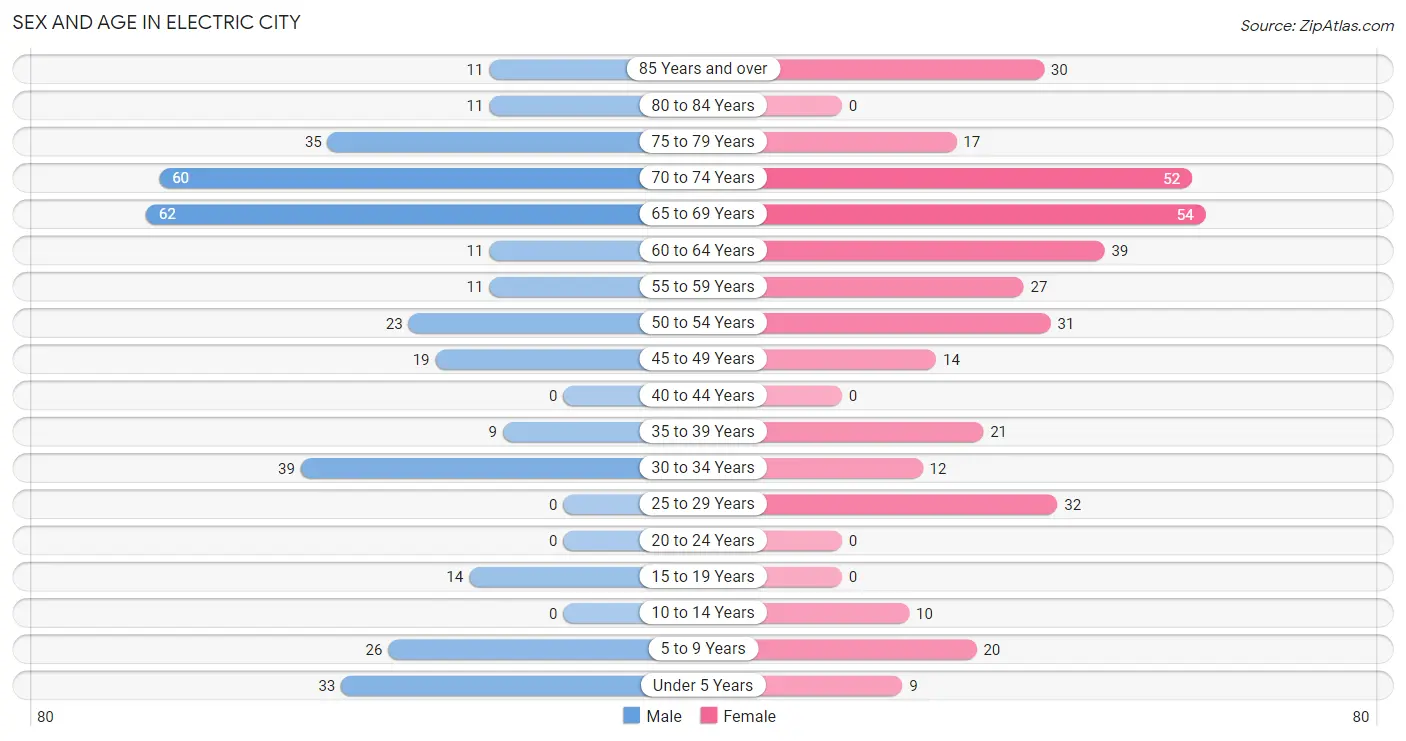
| Age Bracket | Male | Female |
| Under 5 Years | 33 (9.1%) | 9 (2.5%) |
| 5 to 9 Years | 26 (7.1%) | 20 (5.4%) |
| 10 to 14 Years | 0 (0.0%) | 10 (2.7%) |
| 15 to 19 Years | 14 (3.8%) | 0 (0.0%) |
| 20 to 24 Years | 0 (0.0%) | 0 (0.0%) |
| 25 to 29 Years | 0 (0.0%) | 32 (8.7%) |
| 30 to 34 Years | 39 (10.7%) | 12 (3.3%) |
| 35 to 39 Years | 9 (2.5%) | 21 (5.7%) |
| 40 to 44 Years | 0 (0.0%) | 0 (0.0%) |
| 45 to 49 Years | 19 (5.2%) | 14 (3.8%) |
| 50 to 54 Years | 23 (6.3%) | 31 (8.4%) |
| 55 to 59 Years | 11 (3.0%) | 27 (7.3%) |
| 60 to 64 Years | 11 (3.0%) | 39 (10.6%) |
| 65 to 69 Years | 62 (17.0%) | 54 (14.7%) |
| 70 to 74 Years | 60 (16.5%) | 52 (14.1%) |
| 75 to 79 Years | 35 (9.6%) | 17 (4.6%) |
| 80 to 84 Years | 11 (3.0%) | 0 (0.0%) |
| 85 Years and over | 11 (3.0%) | 30 (8.2%) |
| Total | 364 (100.0%) | 368 (100.0%) |
Families and Households in Electric City
Median Family Size in Electric City
The median family size in Electric City is 2.41 persons per family, with married-couple families (174 | 73.4%) accounting for the largest median family size of 2.57 persons per family. On the other hand, single male/father families (25 | 10.5%) represent the smallest median family size with 1.92 persons per family.
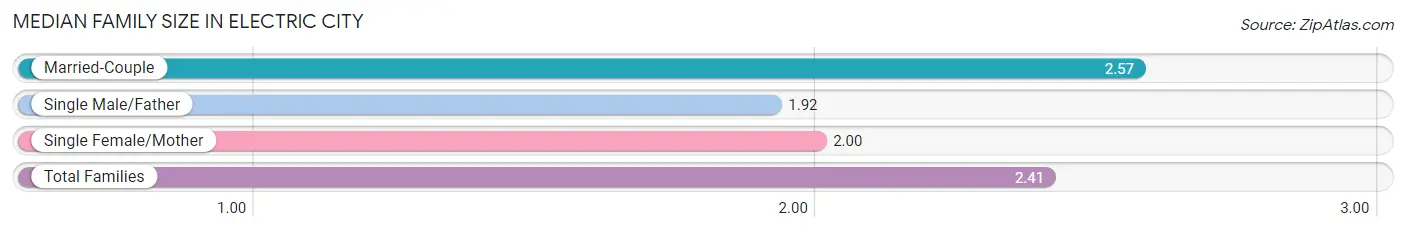
| Family Type | # Families | Family Size |
| Married-Couple | 174 (73.4%) | 2.57 |
| Single Male/Father | 25 (10.5%) | 1.92 |
| Single Female/Mother | 38 (16.0%) | 2.00 |
| Total Families | 237 (100.0%) | 2.41 |
Median Household Size in Electric City
The median household size in Electric City is 2.10 persons per household, with married-couple households (174 | 49.9%) accounting for the largest median household size of 2.57 persons per household. non-family households (112 | 32.1%) represent the smallest median household size with 1.34 persons per household.
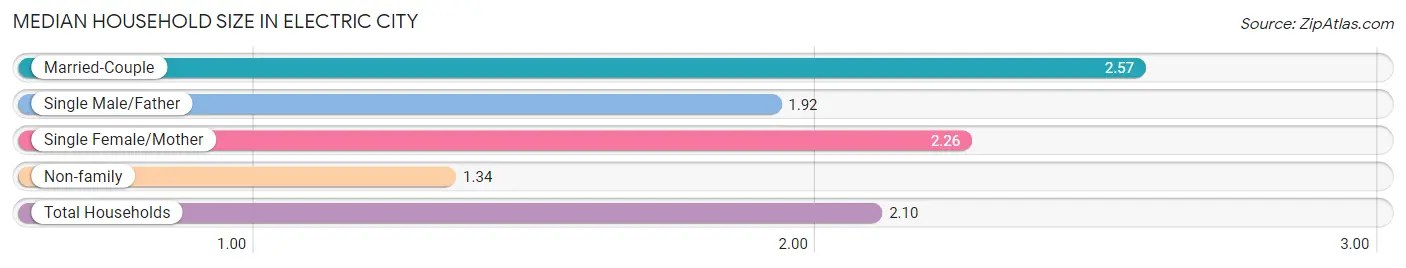
| Household Type | # Households | Household Size |
| Married-Couple | 174 (49.9%) | 2.57 |
| Single Male/Father | 25 (7.2%) | 1.92 |
| Single Female/Mother | 38 (10.9%) | 2.26 |
| Non-family | 112 (32.1%) | 1.34 |
| Total Households | 349 (100.0%) | 2.10 |
Household Size by Marriage Status in Electric City
Out of a total of 349 households in Electric City, 237 (67.9%) are family households, while 112 (32.1%) are nonfamily households. The most numerous type of family households are 2-person households, comprising 164, and the most common type of nonfamily households are 1-person households, comprising 74.
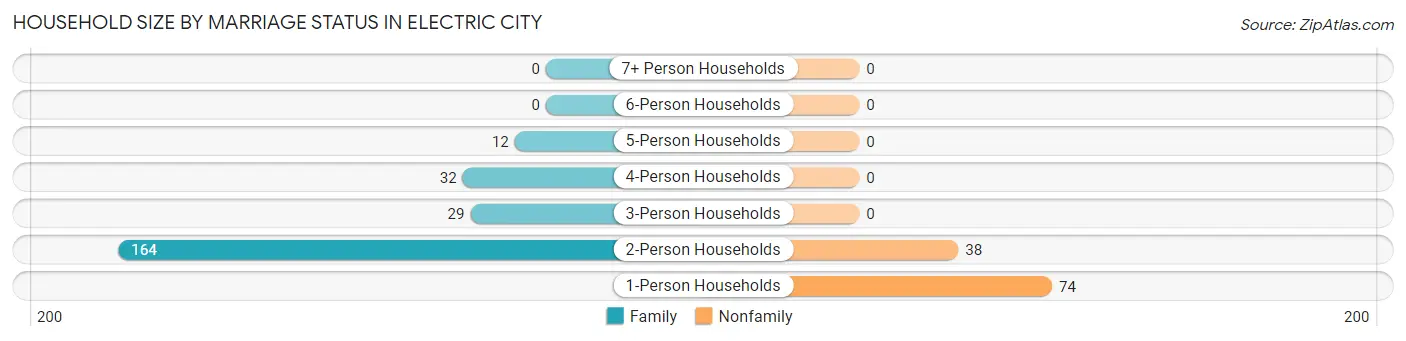
| Household Size | Family Households | Nonfamily Households |
| 1-Person Households | - | 74 (21.2%) |
| 2-Person Households | 164 (47.0%) | 38 (10.9%) |
| 3-Person Households | 29 (8.3%) | 0 (0.0%) |
| 4-Person Households | 32 (9.2%) | 0 (0.0%) |
| 5-Person Households | 12 (3.4%) | 0 (0.0%) |
| 6-Person Households | 0 (0.0%) | 0 (0.0%) |
| 7+ Person Households | 0 (0.0%) | 0 (0.0%) |
| Total | 237 (67.9%) | 112 (32.1%) |
Female Fertility in Electric City
Fertility by Age in Electric City
| Age Bracket | Women with Births | Births / 1,000 Women |
| 15 to 19 years | 0 (0.0%) | 0.0 |
| 20 to 34 years | 0 (0.0%) | 0.0 |
| 35 to 50 years | 0 (0.0%) | 0.0 |
| Total | 0 (0.0%) | 0.0 |
Fertility by Age by Marriage Status in Electric City
| Age Bracket | Married | Unmarried |
| 15 to 19 years | 0 (0.0%) | 0 (0.0%) |
| 20 to 34 years | 0 (0.0%) | 0 (0.0%) |
| 35 to 50 years | 0 (0.0%) | 0 (0.0%) |
| Total | 0 (0.0%) | 0 (0.0%) |
Fertility by Education in Electric City
| Educational Attainment | Women with Births | Births / 1,000 Women |
| Less than High School | 0 (0.0%) | 0.0 |
| High School Diploma | 0 (0.0%) | 0.0 |
| College or Associate's Degree | 0 (0.0%) | 0.0 |
| Bachelor's Degree | 0 (0.0%) | 0.0 |
| Graduate Degree | 0 (0.0%) | 0.0 |
| Total | 0 (0.0%) | 0.0 |
Fertility by Education by Marriage Status in Electric City
| Educational Attainment | Married | Unmarried |
| Less than High School | 0 (0.0%) | 0 (0.0%) |
| High School Diploma | 0 (0.0%) | 0 (0.0%) |
| College or Associate's Degree | 0 (0.0%) | 0 (0.0%) |
| Bachelor's Degree | 0 (0.0%) | 0 (0.0%) |
| Graduate Degree | 0 (0.0%) | 0 (0.0%) |
| Total | 0 (0.0%) | 0 (0.0%) |
Employment Characteristics in Electric City
Employment by Class of Employer in Electric City
Among the 241 employed individuals in Electric City, private company employees (72 | 29.9%), local government employees (60 | 24.9%), and federal government employees (43 | 17.8%) make up the most common classes of employment.
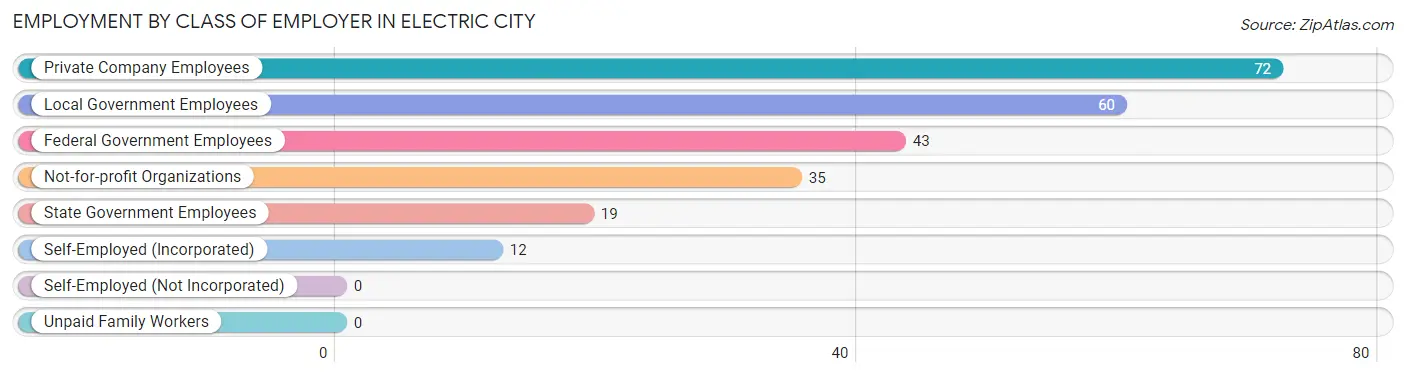
| Employer Class | # Employees | % Employees |
| Private Company Employees | 72 | 29.9% |
| Self-Employed (Incorporated) | 12 | 5.0% |
| Self-Employed (Not Incorporated) | 0 | 0.0% |
| Not-for-profit Organizations | 35 | 14.5% |
| Local Government Employees | 60 | 24.9% |
| State Government Employees | 19 | 7.9% |
| Federal Government Employees | 43 | 17.8% |
| Unpaid Family Workers | 0 | 0.0% |
| Total | 241 | 100.0% |
Employment Status by Age in Electric City
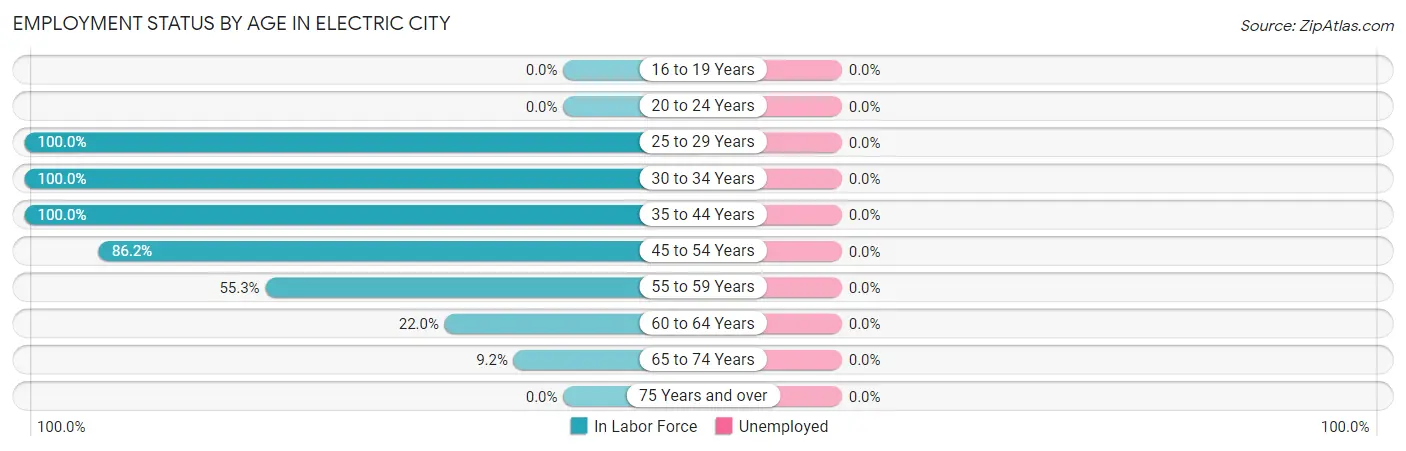
| Age Bracket | In Labor Force | Unemployed |
| 16 to 19 Years | 0 (0.0%) | 0 (0.0%) |
| 20 to 24 Years | 0 (0.0%) | 0 (0.0%) |
| 25 to 29 Years | 32 (100.0%) | 0 (0.0%) |
| 30 to 34 Years | 51 (100.0%) | 0 (0.0%) |
| 35 to 44 Years | 30 (100.0%) | 0 (0.0%) |
| 45 to 54 Years | 75 (86.2%) | 0 (0.0%) |
| 55 to 59 Years | 21 (55.3%) | 0 (0.0%) |
| 60 to 64 Years | 11 (22.0%) | 0 (0.0%) |
| 65 to 74 Years | 21 (9.2%) | 0 (0.0%) |
| 75 Years and over | 0 (0.0%) | 0 (0.0%) |
| Total | 241 (38.0%) | 0 (0.0%) |
Employment Status by Educational Attainment in Electric City
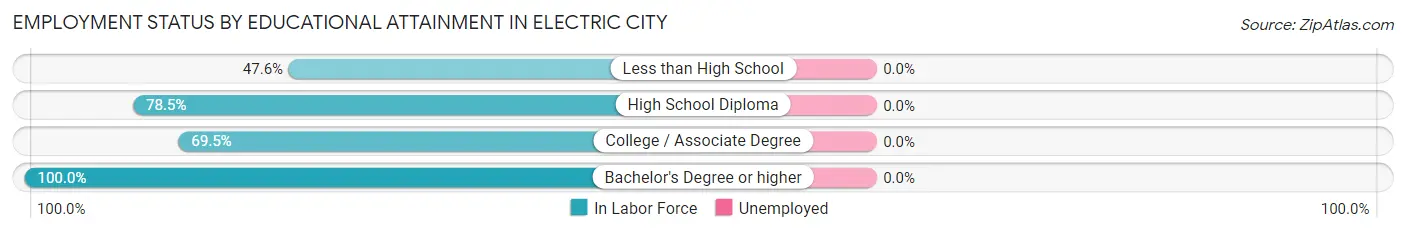
| Educational Attainment | In Labor Force | Unemployed |
| Less than High School | 10 (47.6%) | 0 (0.0%) |
| High School Diploma | 62 (78.5%) | 0 (0.0%) |
| College / Associate Degree | 91 (69.5%) | 0 (0.0%) |
| Bachelor's Degree or higher | 57 (100.0%) | 0 (0.0%) |
| Total | 220 (76.4%) | 0 (0.0%) |
Employment Occupations by Sex in Electric City
Management, Business, Science and Arts Occupations
The most common Management, Business, Science and Arts occupations in Electric City are Management (44 | 18.3%), Health Diagnosing & Treating (25 | 10.4%), Health Technologists (25 | 10.4%), Business & Financial (11 | 4.6%), and Community & Social Service (9 | 3.7%).
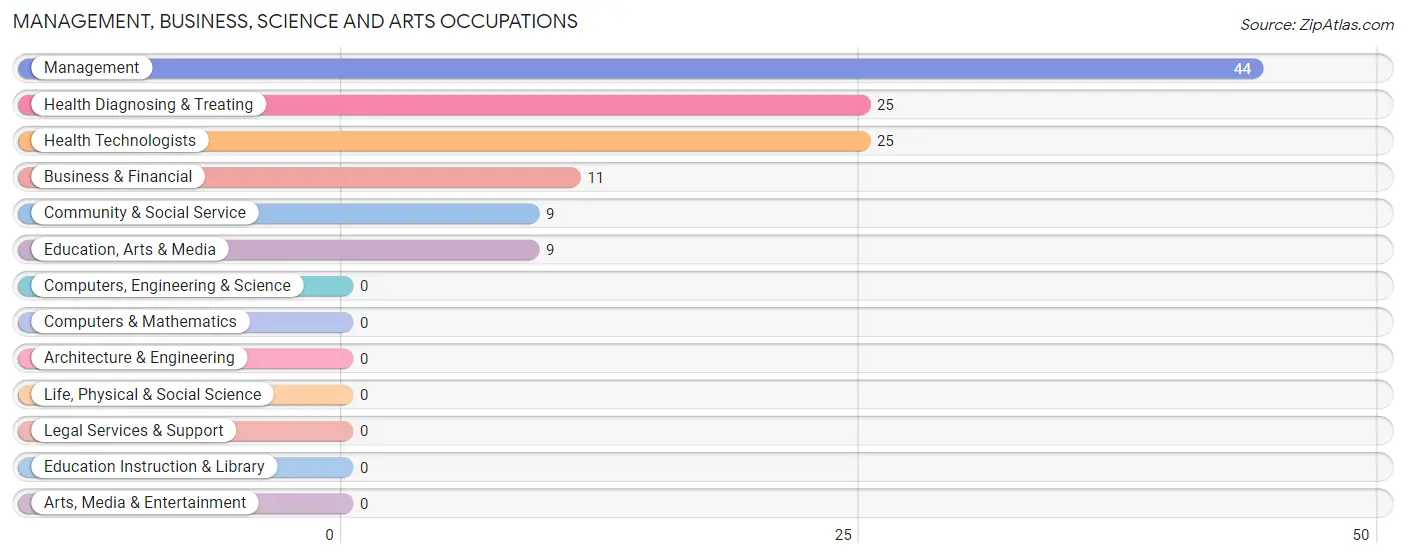
Management, Business, Science and Arts Occupations by Sex
Within the Management, Business, Science and Arts occupations in Electric City, the most male-oriented occupations are Business & Financial (100.0%), Community & Social Service (100.0%), and Education, Arts & Media (100.0%), while the most female-oriented occupations are Health Diagnosing & Treating (56.0%), Health Technologists (56.0%), and Management (43.2%).
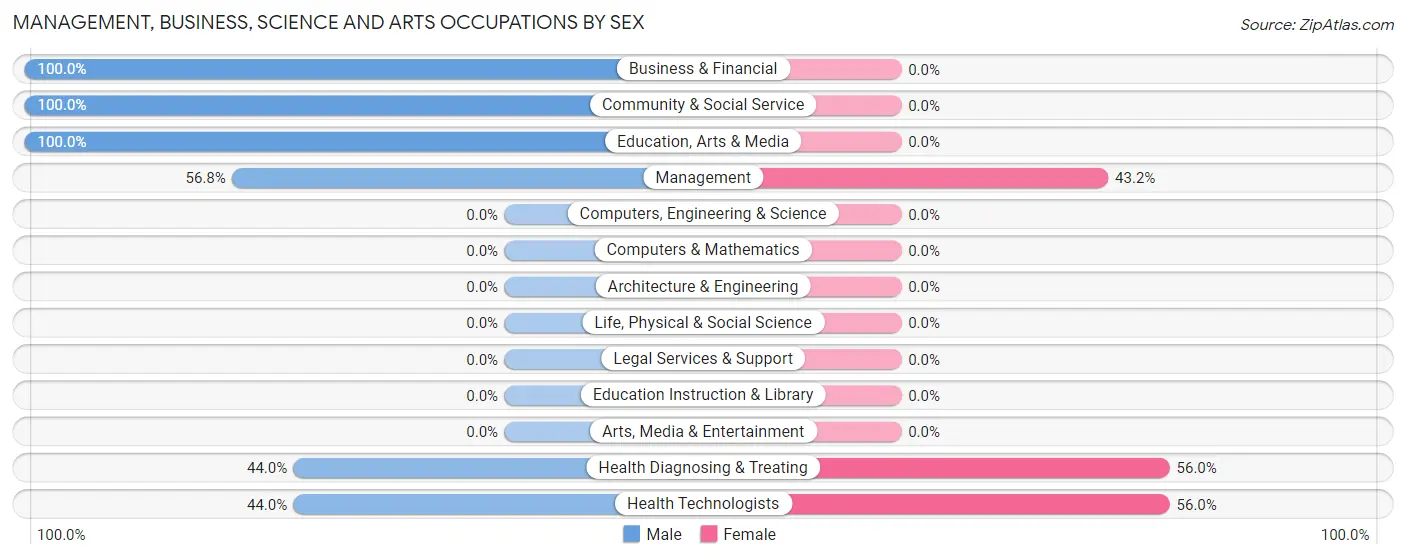
| Occupation | Male | Female |
| Management | 25 (56.8%) | 19 (43.2%) |
| Business & Financial | 11 (100.0%) | 0 (0.0%) |
| Computers, Engineering & Science | 0 (0.0%) | 0 (0.0%) |
| Computers & Mathematics | 0 (0.0%) | 0 (0.0%) |
| Architecture & Engineering | 0 (0.0%) | 0 (0.0%) |
| Life, Physical & Social Science | 0 (0.0%) | 0 (0.0%) |
| Community & Social Service | 9 (100.0%) | 0 (0.0%) |
| Education, Arts & Media | 9 (100.0%) | 0 (0.0%) |
| Legal Services & Support | 0 (0.0%) | 0 (0.0%) |
| Education Instruction & Library | 0 (0.0%) | 0 (0.0%) |
| Arts, Media & Entertainment | 0 (0.0%) | 0 (0.0%) |
| Health Diagnosing & Treating | 11 (44.0%) | 14 (56.0%) |
| Health Technologists | 11 (44.0%) | 14 (56.0%) |
| Total (Category) | 56 (62.9%) | 33 (37.1%) |
| Total (Overall) | 122 (50.6%) | 119 (49.4%) |
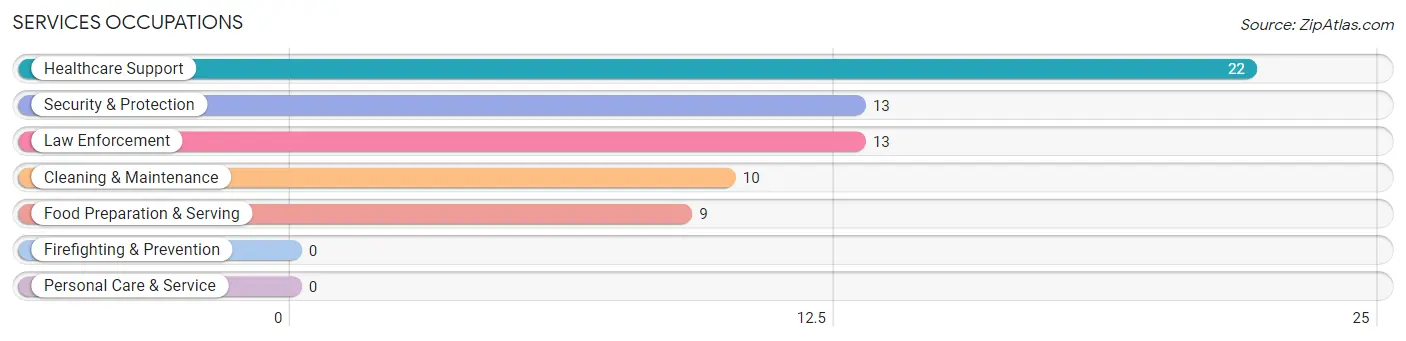
Services Occupations
The most common Services occupations in Electric City are Healthcare Support (22 | 9.1%), Security & Protection (13 | 5.4%), Law Enforcement (13 | 5.4%), Cleaning & Maintenance (10 | 4.2%), and Food Preparation & Serving (9 | 3.7%).
Services Occupations by Sex
Within the Services occupations in Electric City, the most male-oriented occupations are Security & Protection (100.0%), and Law Enforcement (100.0%), while the most female-oriented occupations are Healthcare Support (100.0%), Food Preparation & Serving (100.0%), and Cleaning & Maintenance (100.0%).
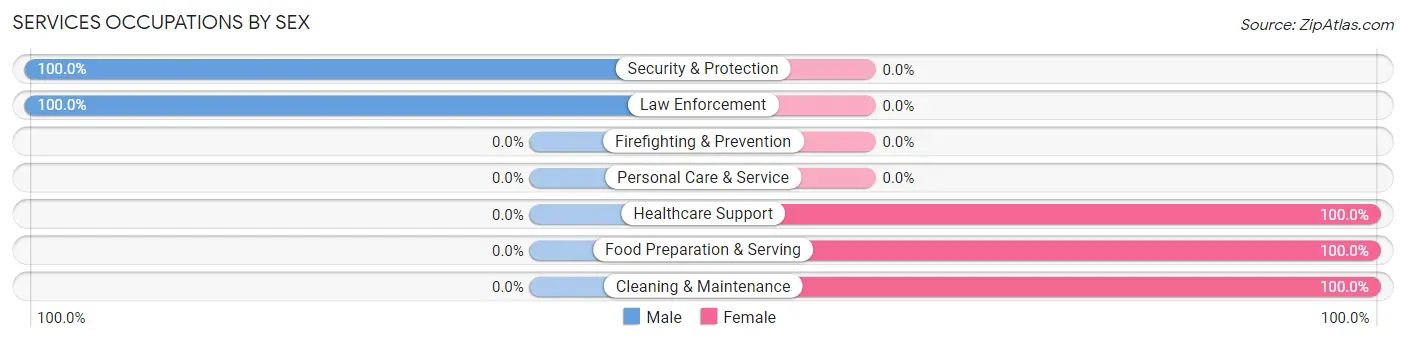
| Occupation | Male | Female |
| Healthcare Support | 0 (0.0%) | 22 (100.0%) |
| Security & Protection | 13 (100.0%) | 0 (0.0%) |
| Firefighting & Prevention | 0 (0.0%) | 0 (0.0%) |
| Law Enforcement | 13 (100.0%) | 0 (0.0%) |
| Food Preparation & Serving | 0 (0.0%) | 9 (100.0%) |
| Cleaning & Maintenance | 0 (0.0%) | 10 (100.0%) |
| Personal Care & Service | 0 (0.0%) | 0 (0.0%) |
| Total (Category) | 13 (24.1%) | 41 (75.9%) |
| Total (Overall) | 122 (50.6%) | 119 (49.4%) |
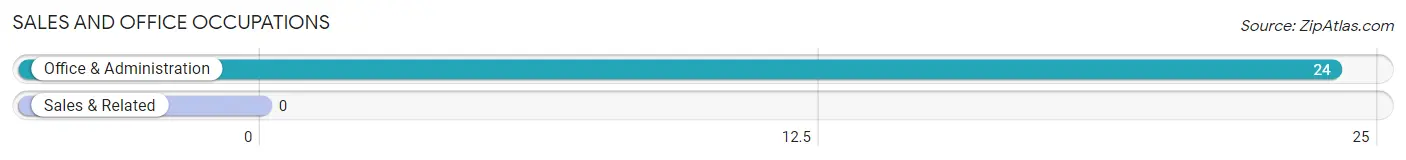
Sales and Office Occupations
The most common Sales and Office occupations in Electric City are , and Office & Administration (24 | 10.0%).
Sales and Office Occupations by Sex
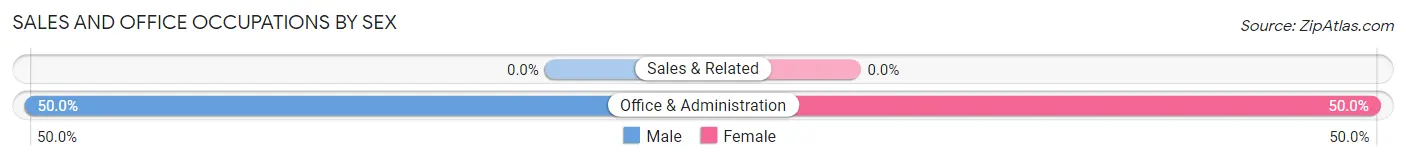
| Occupation | Male | Female |
| Sales & Related | 0 (0.0%) | 0 (0.0%) |
| Office & Administration | 12 (50.0%) | 12 (50.0%) |
| Total (Category) | 12 (50.0%) | 12 (50.0%) |
| Total (Overall) | 122 (50.6%) | 119 (49.4%) |
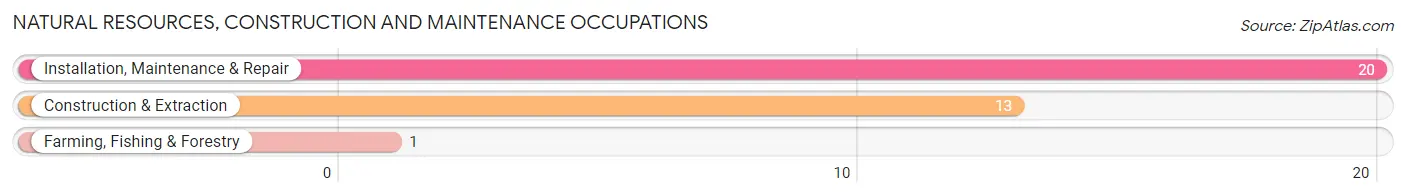
Natural Resources, Construction and Maintenance Occupations
The most common Natural Resources, Construction and Maintenance occupations in Electric City are Installation, Maintenance & Repair (20 | 8.3%), Construction & Extraction (13 | 5.4%), and Farming, Fishing & Forestry (1 | 0.4%).
Natural Resources, Construction and Maintenance Occupations by Sex
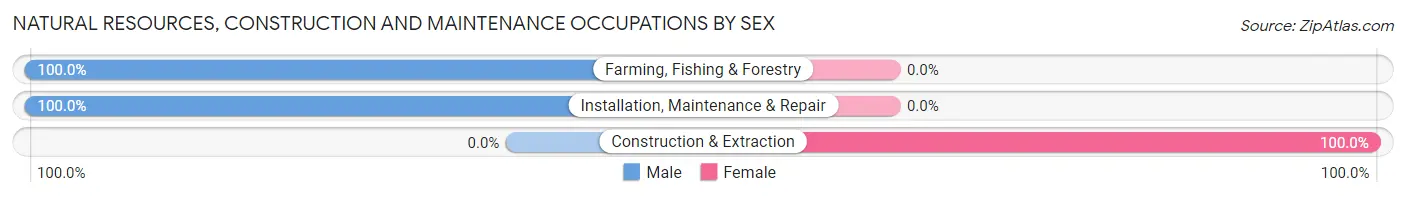
| Occupation | Male | Female |
| Farming, Fishing & Forestry | 1 (100.0%) | 0 (0.0%) |
| Construction & Extraction | 0 (0.0%) | 13 (100.0%) |
| Installation, Maintenance & Repair | 20 (100.0%) | 0 (0.0%) |
| Total (Category) | 21 (61.8%) | 13 (38.2%) |
| Total (Overall) | 122 (50.6%) | 119 (49.4%) |
Production, Transportation and Moving Occupations
The most common Production, Transportation and Moving occupations in Electric City are Production (20 | 8.3%), and Material Moving (20 | 8.3%).
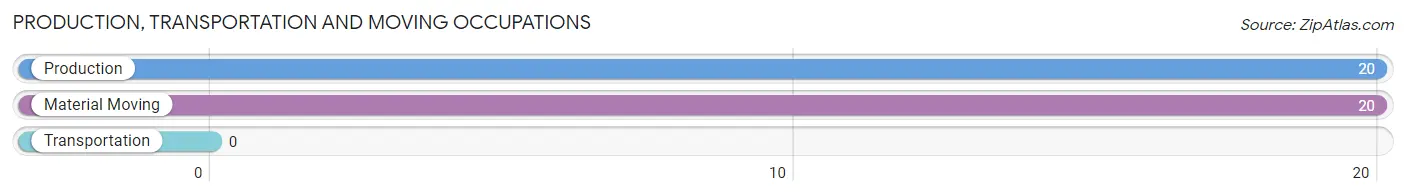
Production, Transportation and Moving Occupations by Sex
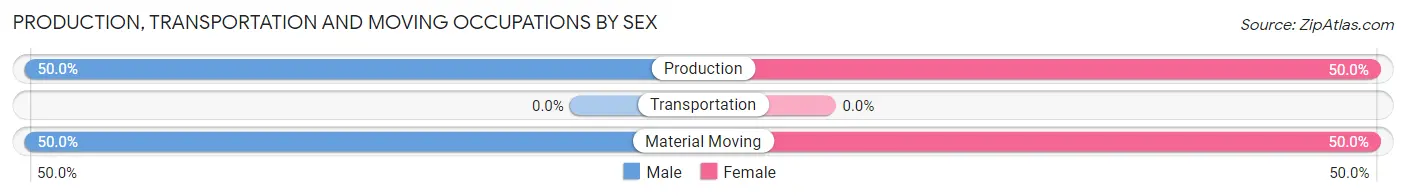
| Occupation | Male | Female |
| Production | 10 (50.0%) | 10 (50.0%) |
| Transportation | 0 (0.0%) | 0 (0.0%) |
| Material Moving | 10 (50.0%) | 10 (50.0%) |
| Total (Category) | 20 (50.0%) | 20 (50.0%) |
| Total (Overall) | 122 (50.6%) | 119 (49.4%) |
Employment Industries by Sex in Electric City
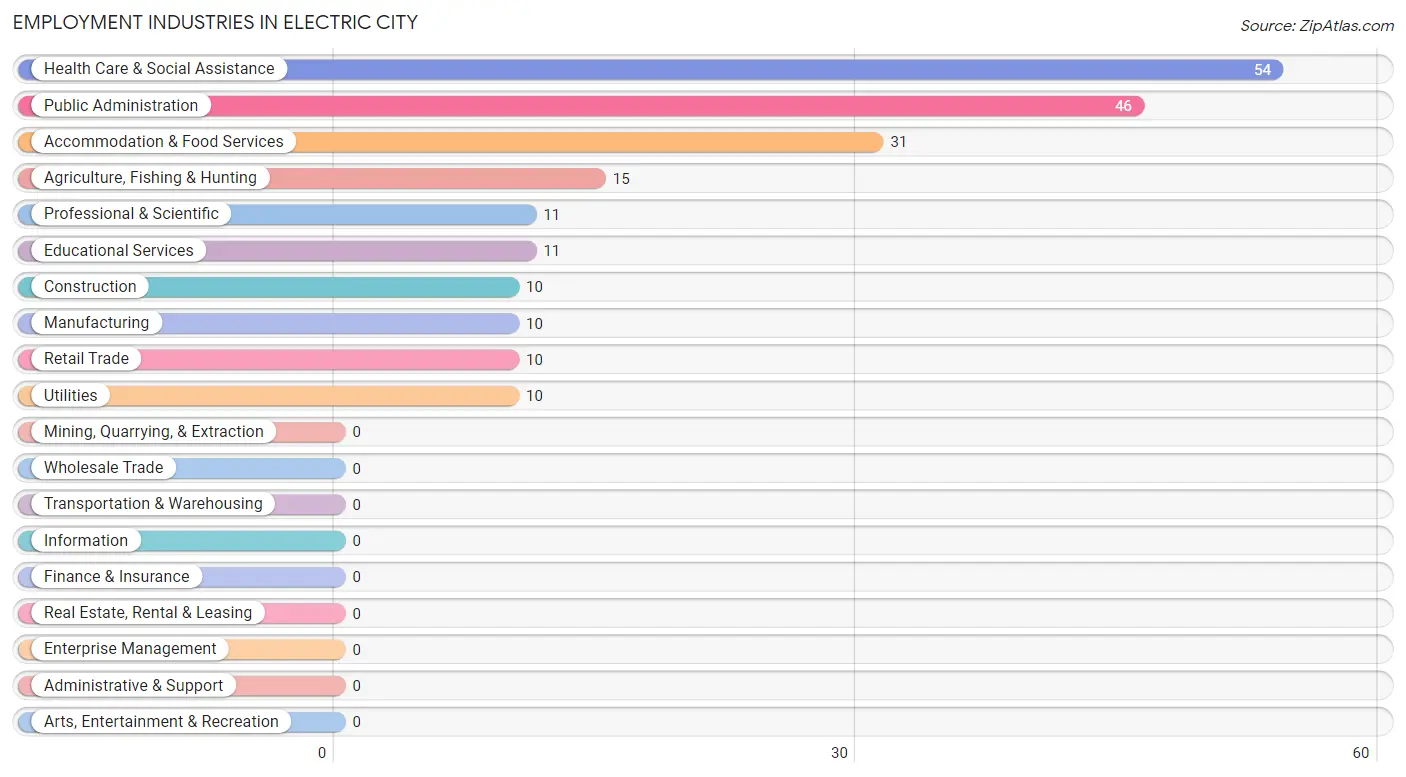
Employment Industries in Electric City
The major employment industries in Electric City include Health Care & Social Assistance (54 | 22.4%), Public Administration (46 | 19.1%), Accommodation & Food Services (31 | 12.9%), Agriculture, Fishing & Hunting (15 | 6.2%), and Professional & Scientific (11 | 4.6%).
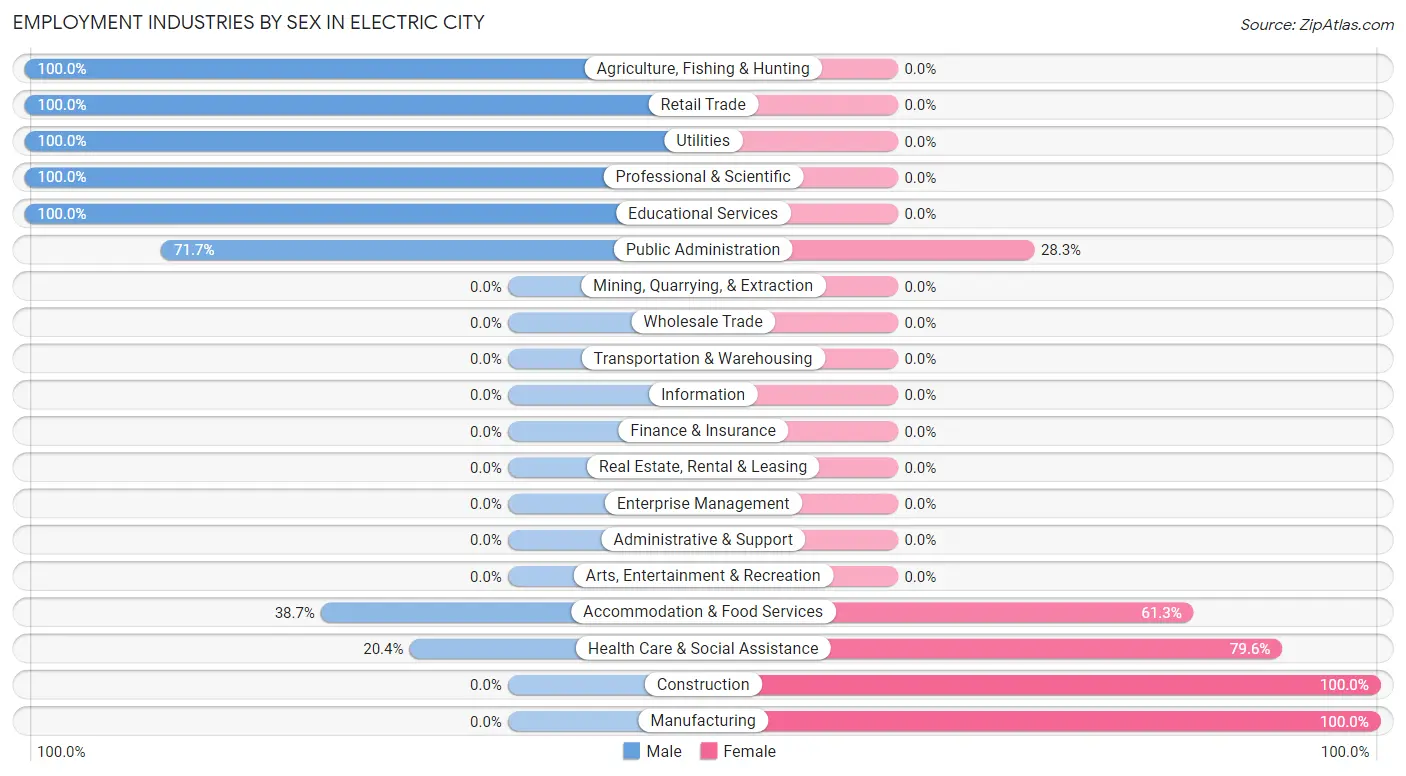
Employment Industries by Sex in Electric City
The Electric City industries that see more men than women are Agriculture, Fishing & Hunting (100.0%), Retail Trade (100.0%), and Utilities (100.0%), whereas the industries that tend to have a higher number of women are Construction (100.0%), Manufacturing (100.0%), and Health Care & Social Assistance (79.6%).
| Industry | Male | Female |
| Agriculture, Fishing & Hunting | 15 (100.0%) | 0 (0.0%) |
| Mining, Quarrying, & Extraction | 0 (0.0%) | 0 (0.0%) |
| Construction | 0 (0.0%) | 10 (100.0%) |
| Manufacturing | 0 (0.0%) | 10 (100.0%) |
| Wholesale Trade | 0 (0.0%) | 0 (0.0%) |
| Retail Trade | 10 (100.0%) | 0 (0.0%) |
| Transportation & Warehousing | 0 (0.0%) | 0 (0.0%) |
| Utilities | 10 (100.0%) | 0 (0.0%) |
| Information | 0 (0.0%) | 0 (0.0%) |
| Finance & Insurance | 0 (0.0%) | 0 (0.0%) |
| Real Estate, Rental & Leasing | 0 (0.0%) | 0 (0.0%) |
| Professional & Scientific | 11 (100.0%) | 0 (0.0%) |
| Enterprise Management | 0 (0.0%) | 0 (0.0%) |
| Administrative & Support | 0 (0.0%) | 0 (0.0%) |
| Educational Services | 11 (100.0%) | 0 (0.0%) |
| Health Care & Social Assistance | 11 (20.4%) | 43 (79.6%) |
| Arts, Entertainment & Recreation | 0 (0.0%) | 0 (0.0%) |
| Accommodation & Food Services | 12 (38.7%) | 19 (61.3%) |
| Public Administration | 33 (71.7%) | 13 (28.3%) |
| Total | 122 (50.6%) | 119 (49.4%) |
Education in Electric City
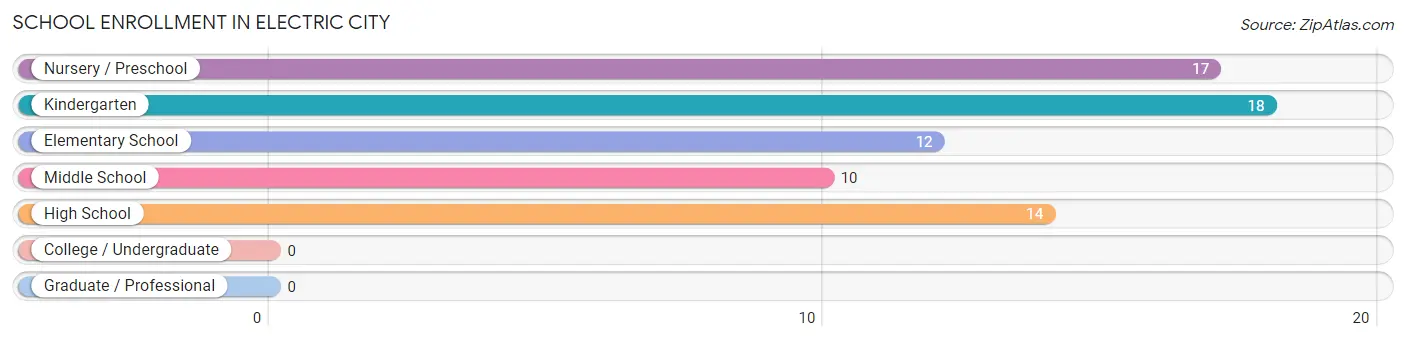
School Enrollment in Electric City
The most common levels of schooling among the 71 students in Electric City are kindergarten (18 | 25.4%), nursery / preschool (17 | 23.9%), and high school (14 | 19.7%).
| School Level | # Students | % Students |
| Nursery / Preschool | 17 | 23.9% |
| Kindergarten | 18 | 25.4% |
| Elementary School | 12 | 16.9% |
| Middle School | 10 | 14.1% |
| High School | 14 | 19.7% |
| College / Undergraduate | 0 | 0.0% |
| Graduate / Professional | 0 | 0.0% |
| Total | 71 | 100.0% |
School Enrollment by Age by Funding Source in Electric City
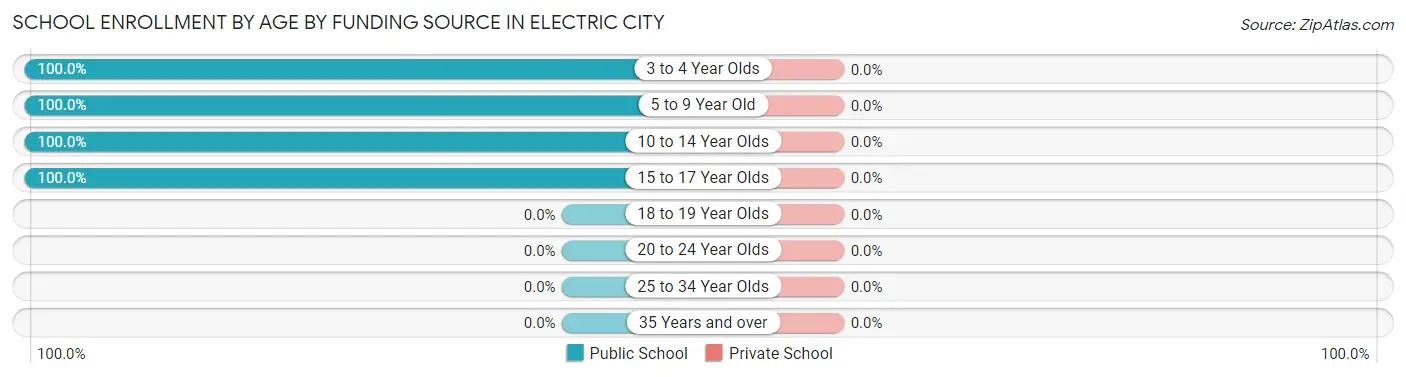
| Age Bracket | Public School | Private School |
| 3 to 4 Year Olds | 9 (100.0%) | 0 (0.0%) |
| 5 to 9 Year Old | 38 (100.0%) | 0 (0.0%) |
| 10 to 14 Year Olds | 10 (100.0%) | 0 (0.0%) |
| 15 to 17 Year Olds | 14 (100.0%) | 0 (0.0%) |
| 18 to 19 Year Olds | 0 (0.0%) | 0 (0.0%) |
| 20 to 24 Year Olds | 0 (0.0%) | 0 (0.0%) |
| 25 to 34 Year Olds | 0 (0.0%) | 0 (0.0%) |
| 35 Years and over | 0 (0.0%) | 0 (0.0%) |
| Total | 71 (100.0%) | 0 (0.0%) |
Educational Attainment by Field of Study in Electric City
Science & technology (36 | 37.1%), arts & humanities (32 | 33.0%), education (19 | 19.6%), and engineering (10 | 10.3%) are the most common fields of study among 97 individuals in Electric City who have obtained a bachelor's degree or higher.
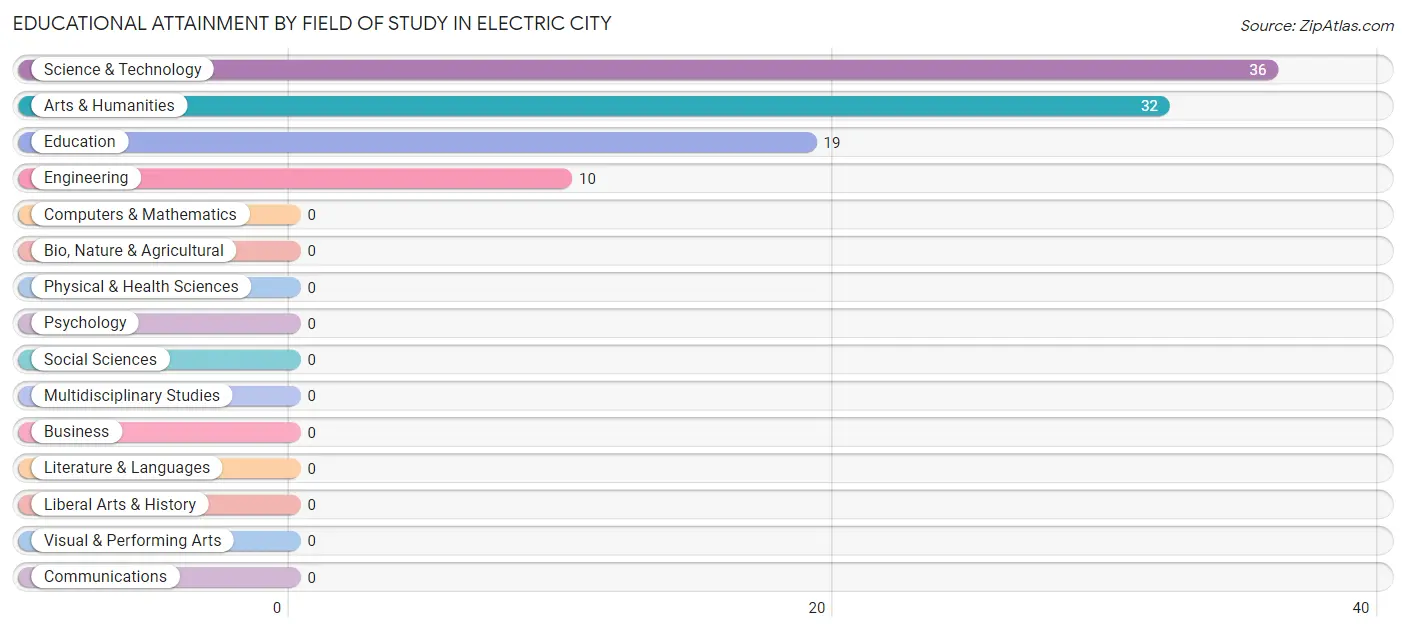
| Field of Study | # Graduates | % Graduates |
| Computers & Mathematics | 0 | 0.0% |
| Bio, Nature & Agricultural | 0 | 0.0% |
| Physical & Health Sciences | 0 | 0.0% |
| Psychology | 0 | 0.0% |
| Social Sciences | 0 | 0.0% |
| Engineering | 10 | 10.3% |
| Multidisciplinary Studies | 0 | 0.0% |
| Science & Technology | 36 | 37.1% |
| Business | 0 | 0.0% |
| Education | 19 | 19.6% |
| Literature & Languages | 0 | 0.0% |
| Liberal Arts & History | 0 | 0.0% |
| Visual & Performing Arts | 0 | 0.0% |
| Communications | 0 | 0.0% |
| Arts & Humanities | 32 | 33.0% |
| Total | 97 | 100.0% |
Transportation & Commute in Electric City
Vehicle Availability by Sex in Electric City
The most prevalent vehicle ownership categories in Electric City are males with 3 vehicles (67, accounting for 54.9%) and females with 3 vehicles (60, making up 56.3%).
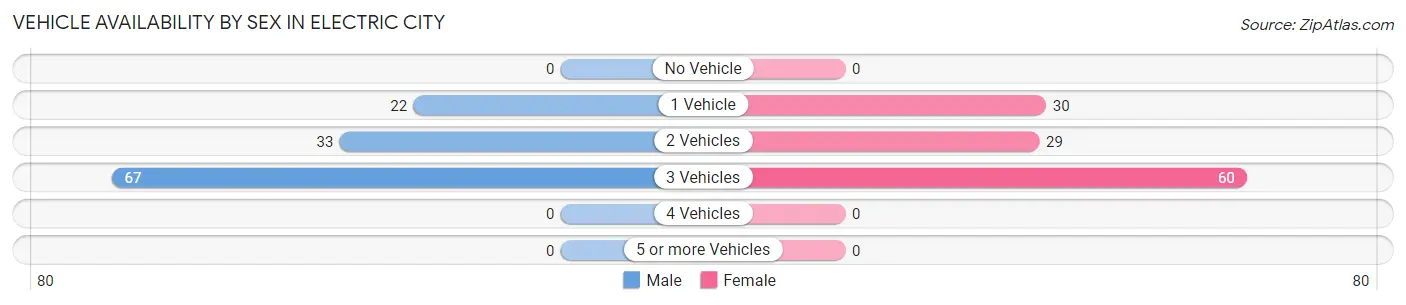
| Vehicles Available | Male | Female |
| No Vehicle | 0 (0.0%) | 0 (0.0%) |
| 1 Vehicle | 22 (18.0%) | 30 (25.2%) |
| 2 Vehicles | 33 (27.1%) | 29 (24.4%) |
| 3 Vehicles | 67 (54.9%) | 60 (50.4%) |
| 4 Vehicles | 0 (0.0%) | 0 (0.0%) |
| 5 or more Vehicles | 0 (0.0%) | 0 (0.0%) |
| Total | 122 (100.0%) | 119 (100.0%) |
Commute Time in Electric City
The most frequently occuring commute durations in Electric City are 10 to 14 minutes (110 commuters, 45.6%), 5 to 9 minutes (60 commuters, 24.9%), and less than 5 minutes (35 commuters, 14.5%).
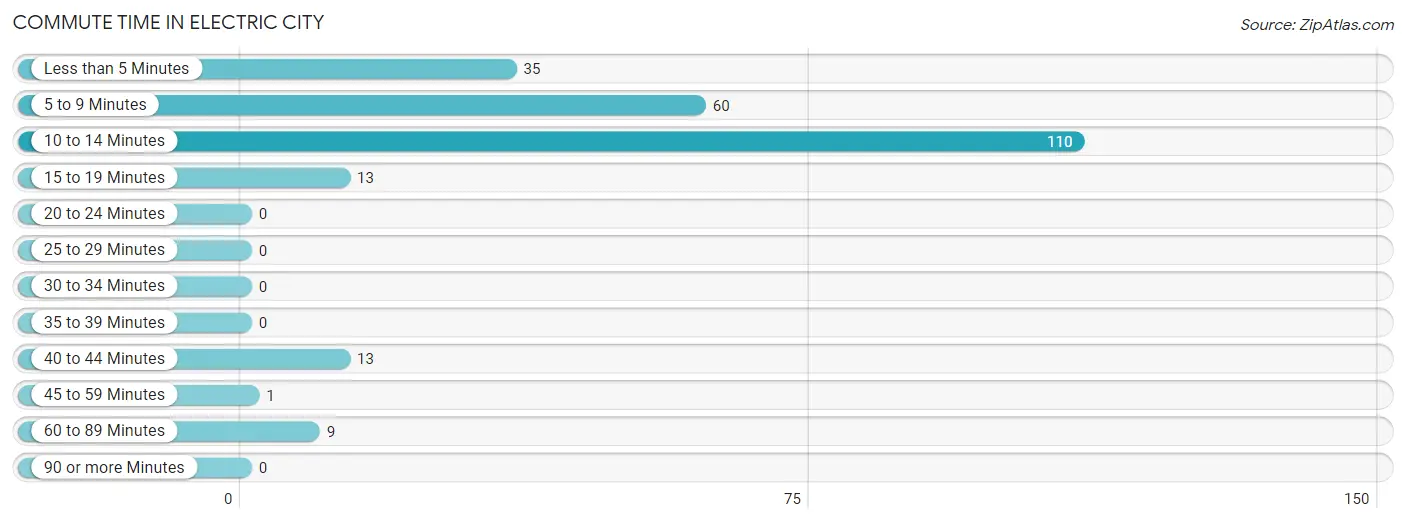
| Commute Time | # Commuters | % Commuters |
| Less than 5 Minutes | 35 | 14.5% |
| 5 to 9 Minutes | 60 | 24.9% |
| 10 to 14 Minutes | 110 | 45.6% |
| 15 to 19 Minutes | 13 | 5.4% |
| 20 to 24 Minutes | 0 | 0.0% |
| 25 to 29 Minutes | 0 | 0.0% |
| 30 to 34 Minutes | 0 | 0.0% |
| 35 to 39 Minutes | 0 | 0.0% |
| 40 to 44 Minutes | 13 | 5.4% |
| 45 to 59 Minutes | 1 | 0.4% |
| 60 to 89 Minutes | 9 | 3.7% |
| 90 or more Minutes | 0 | 0.0% |
Commute Time by Sex in Electric City
The most common commute times in Electric City are 10 to 14 minutes (68 commuters, 55.7%) for males and 10 to 14 minutes (42 commuters, 35.3%) for females.
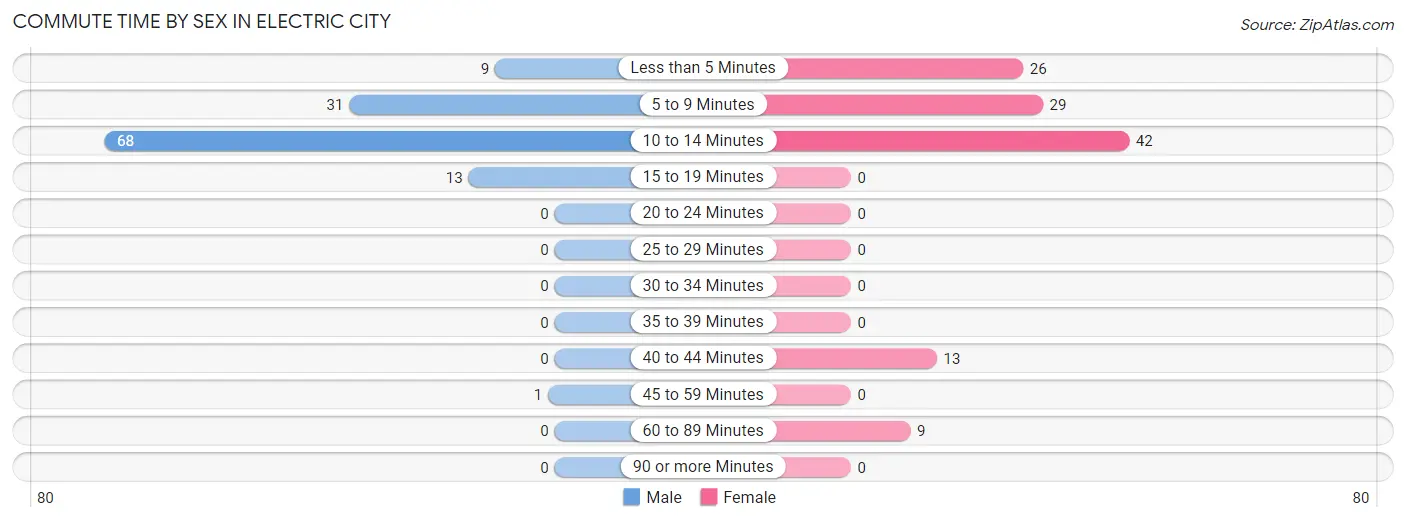
| Commute Time | Male | Female |
| Less than 5 Minutes | 9 (7.4%) | 26 (21.8%) |
| 5 to 9 Minutes | 31 (25.4%) | 29 (24.4%) |
| 10 to 14 Minutes | 68 (55.7%) | 42 (35.3%) |
| 15 to 19 Minutes | 13 (10.7%) | 0 (0.0%) |
| 20 to 24 Minutes | 0 (0.0%) | 0 (0.0%) |
| 25 to 29 Minutes | 0 (0.0%) | 0 (0.0%) |
| 30 to 34 Minutes | 0 (0.0%) | 0 (0.0%) |
| 35 to 39 Minutes | 0 (0.0%) | 0 (0.0%) |
| 40 to 44 Minutes | 0 (0.0%) | 13 (10.9%) |
| 45 to 59 Minutes | 1 (0.8%) | 0 (0.0%) |
| 60 to 89 Minutes | 0 (0.0%) | 9 (7.6%) |
| 90 or more Minutes | 0 (0.0%) | 0 (0.0%) |
Time of Departure to Work by Sex in Electric City
The most frequent times of departure to work in Electric City are 7:00 AM to 7:29 AM (31, 25.4%) for males and 7:00 AM to 7:29 AM (34, 28.6%) for females.
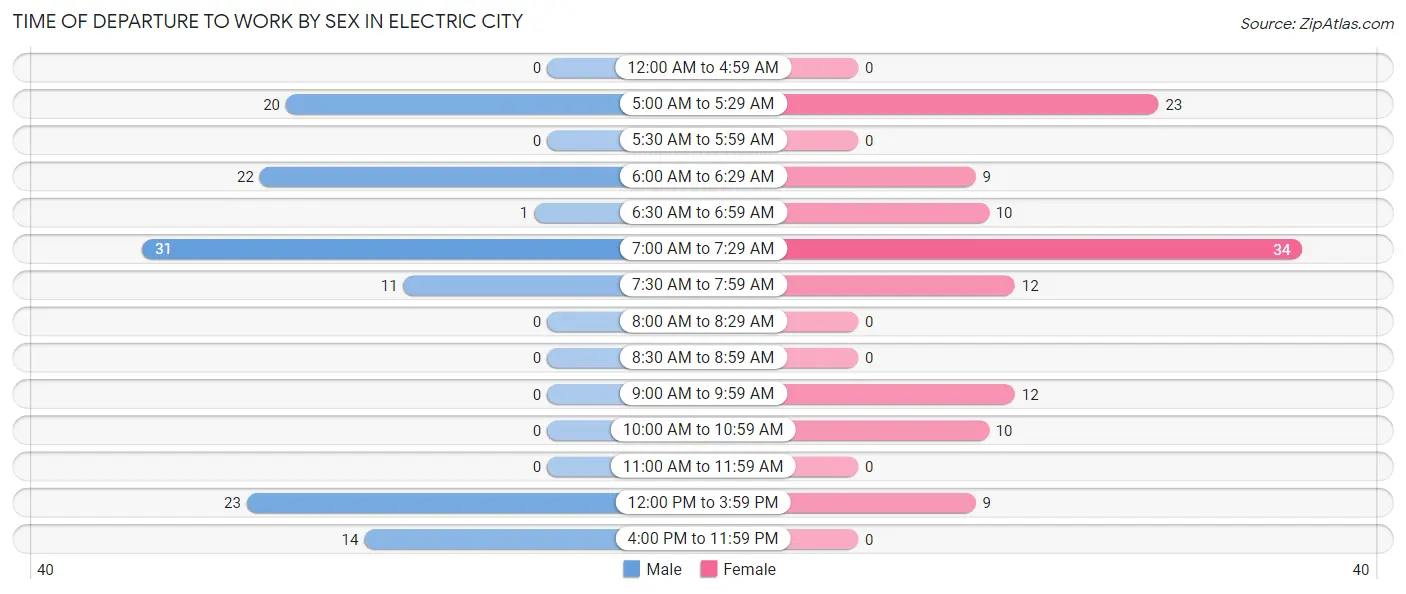
| Time of Departure | Male | Female |
| 12:00 AM to 4:59 AM | 0 (0.0%) | 0 (0.0%) |
| 5:00 AM to 5:29 AM | 20 (16.4%) | 23 (19.3%) |
| 5:30 AM to 5:59 AM | 0 (0.0%) | 0 (0.0%) |
| 6:00 AM to 6:29 AM | 22 (18.0%) | 9 (7.6%) |
| 6:30 AM to 6:59 AM | 1 (0.8%) | 10 (8.4%) |
| 7:00 AM to 7:29 AM | 31 (25.4%) | 34 (28.6%) |
| 7:30 AM to 7:59 AM | 11 (9.0%) | 12 (10.1%) |
| 8:00 AM to 8:29 AM | 0 (0.0%) | 0 (0.0%) |
| 8:30 AM to 8:59 AM | 0 (0.0%) | 0 (0.0%) |
| 9:00 AM to 9:59 AM | 0 (0.0%) | 12 (10.1%) |
| 10:00 AM to 10:59 AM | 0 (0.0%) | 10 (8.4%) |
| 11:00 AM to 11:59 AM | 0 (0.0%) | 0 (0.0%) |
| 12:00 PM to 3:59 PM | 23 (18.9%) | 9 (7.6%) |
| 4:00 PM to 11:59 PM | 14 (11.5%) | 0 (0.0%) |
| Total | 122 (100.0%) | 119 (100.0%) |
Housing Occupancy in Electric City
Occupancy by Ownership in Electric City
Of the total 349 dwellings in Electric City, owner-occupied units account for 289 (82.8%), while renter-occupied units make up 60 (17.2%).
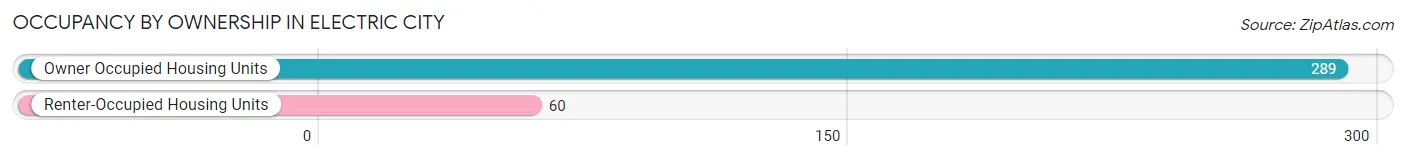
| Occupancy | # Housing Units | % Housing Units |
| Owner Occupied Housing Units | 289 | 82.8% |
| Renter-Occupied Housing Units | 60 | 17.2% |
| Total Occupied Housing Units | 349 | 100.0% |
Occupancy by Household Size in Electric City
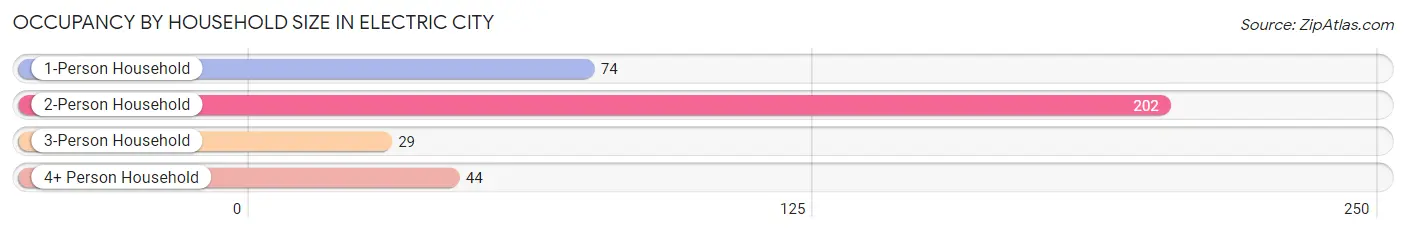
| Household Size | # Housing Units | % Housing Units |
| 1-Person Household | 74 | 21.2% |
| 2-Person Household | 202 | 57.9% |
| 3-Person Household | 29 | 8.3% |
| 4+ Person Household | 44 | 12.6% |
| Total Housing Units | 349 | 100.0% |
Occupancy by Ownership by Household Size in Electric City
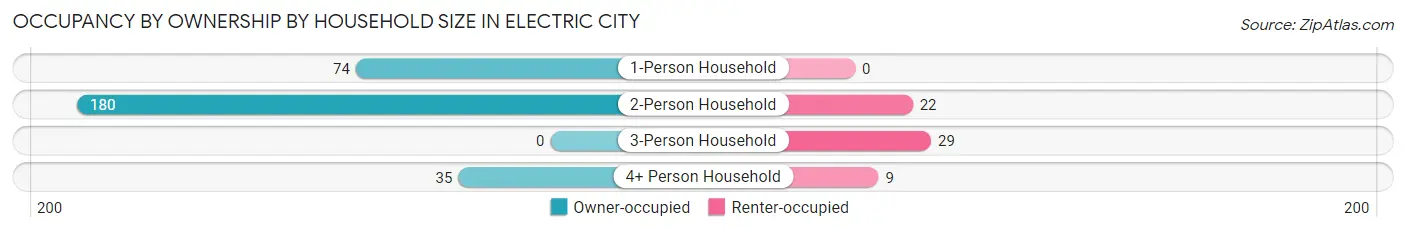
| Household Size | Owner-occupied | Renter-occupied |
| 1-Person Household | 74 (100.0%) | 0 (0.0%) |
| 2-Person Household | 180 (89.1%) | 22 (10.9%) |
| 3-Person Household | 0 (0.0%) | 29 (100.0%) |
| 4+ Person Household | 35 (79.5%) | 9 (20.4%) |
| Total Housing Units | 289 (82.8%) | 60 (17.2%) |
Occupancy by Educational Attainment in Electric City
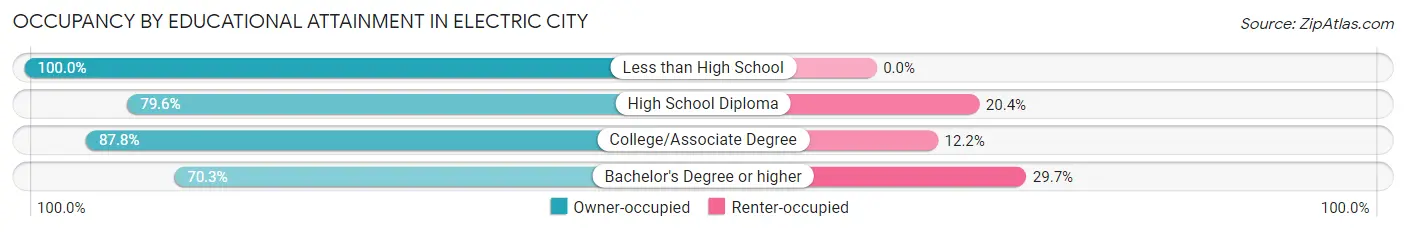
| Household Size | Owner-occupied | Renter-occupied |
| Less than High School | 21 (100.0%) | 0 (0.0%) |
| High School Diploma | 86 (79.6%) | 22 (20.4%) |
| College/Associate Degree | 137 (87.8%) | 19 (12.2%) |
| Bachelor's Degree or higher | 45 (70.3%) | 19 (29.7%) |
Occupancy by Age of Householder in Electric City
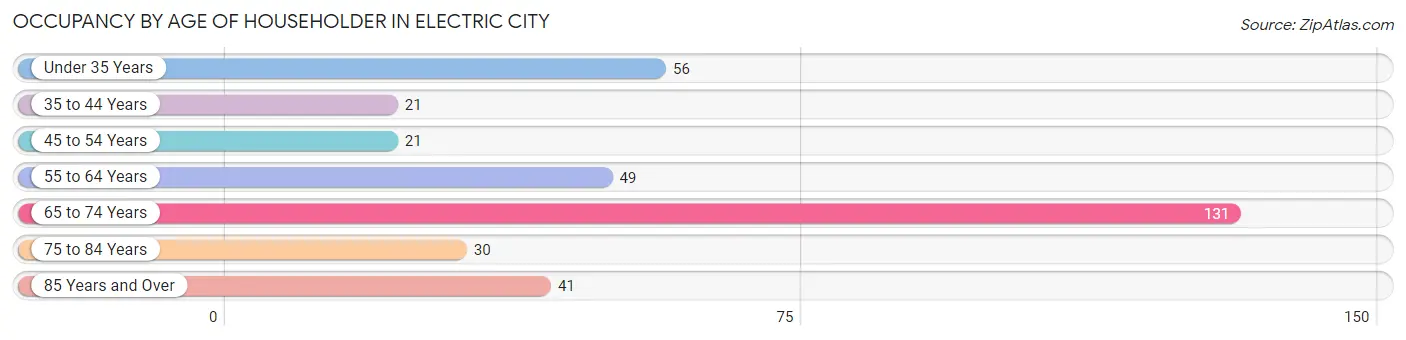
| Age Bracket | # Households | % Households |
| Under 35 Years | 56 | 16.1% |
| 35 to 44 Years | 21 | 6.0% |
| 45 to 54 Years | 21 | 6.0% |
| 55 to 64 Years | 49 | 14.0% |
| 65 to 74 Years | 131 | 37.5% |
| 75 to 84 Years | 30 | 8.6% |
| 85 Years and Over | 41 | 11.7% |
| Total | 349 | 100.0% |
Housing Finances in Electric City
Median Income by Occupancy in Electric City
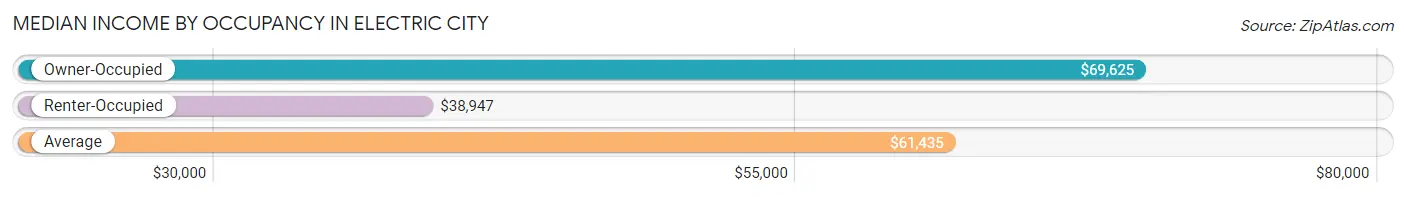
| Occupancy Type | # Households | Median Income |
| Owner-Occupied | 289 (82.8%) | $69,625 |
| Renter-Occupied | 60 (17.2%) | $38,947 |
| Average | 349 (100.0%) | $61,435 |
Occupancy by Householder Income Bracket in Electric City
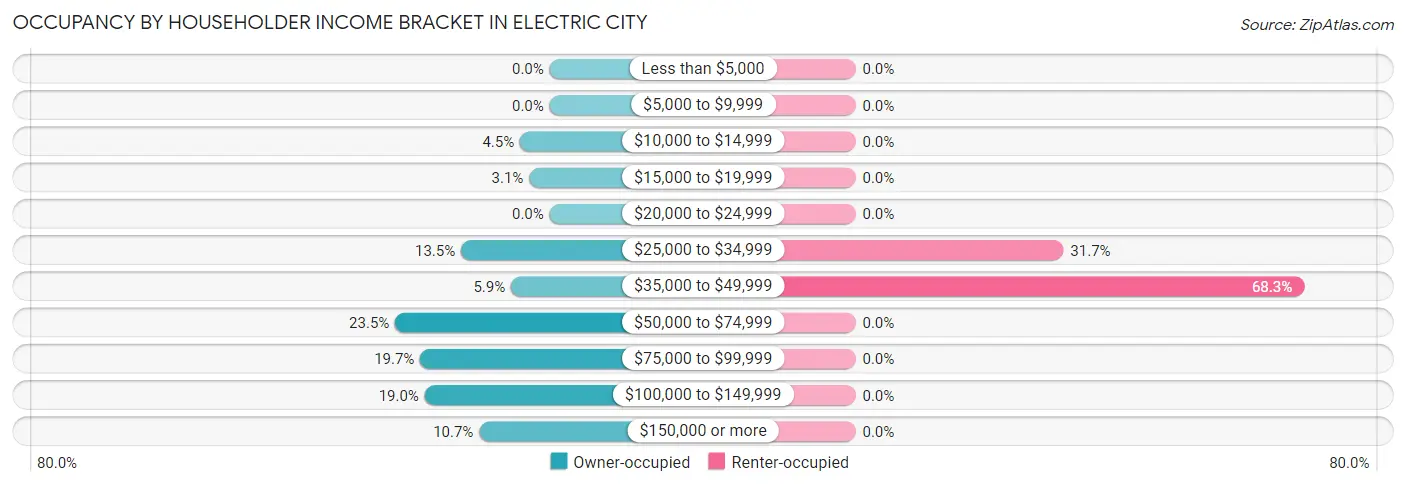
| Income Bracket | Owner-occupied | Renter-occupied |
| Less than $5,000 | 0 (0.0%) | 0 (0.0%) |
| $5,000 to $9,999 | 0 (0.0%) | 0 (0.0%) |
| $10,000 to $14,999 | 13 (4.5%) | 0 (0.0%) |
| $15,000 to $19,999 | 9 (3.1%) | 0 (0.0%) |
| $20,000 to $24,999 | 0 (0.0%) | 0 (0.0%) |
| $25,000 to $34,999 | 39 (13.5%) | 19 (31.7%) |
| $35,000 to $49,999 | 17 (5.9%) | 41 (68.3%) |
| $50,000 to $74,999 | 68 (23.5%) | 0 (0.0%) |
| $75,000 to $99,999 | 57 (19.7%) | 0 (0.0%) |
| $100,000 to $149,999 | 55 (19.0%) | 0 (0.0%) |
| $150,000 or more | 31 (10.7%) | 0 (0.0%) |
| Total | 289 (100.0%) | 60 (100.0%) |
Monthly Housing Cost Tiers in Electric City
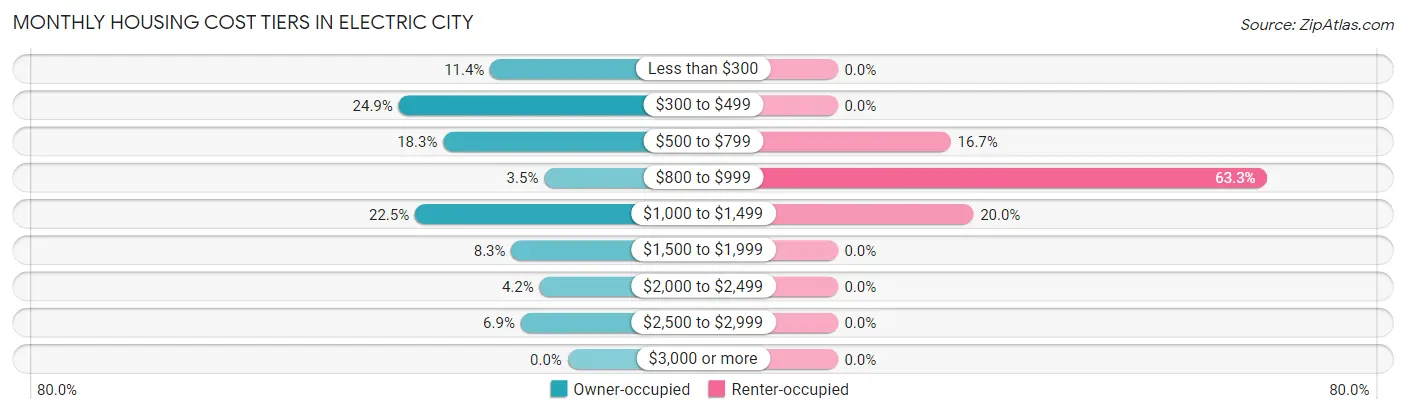
| Monthly Cost | Owner-occupied | Renter-occupied |
| Less than $300 | 33 (11.4%) | 0 (0.0%) |
| $300 to $499 | 72 (24.9%) | 0 (0.0%) |
| $500 to $799 | 53 (18.3%) | 10 (16.7%) |
| $800 to $999 | 10 (3.5%) | 38 (63.3%) |
| $1,000 to $1,499 | 65 (22.5%) | 12 (20.0%) |
| $1,500 to $1,999 | 24 (8.3%) | 0 (0.0%) |
| $2,000 to $2,499 | 12 (4.2%) | 0 (0.0%) |
| $2,500 to $2,999 | 20 (6.9%) | 0 (0.0%) |
| $3,000 or more | 0 (0.0%) | 0 (0.0%) |
| Total | 289 (100.0%) | 60 (100.0%) |
Physical Housing Characteristics in Electric City
Housing Structures in Electric City
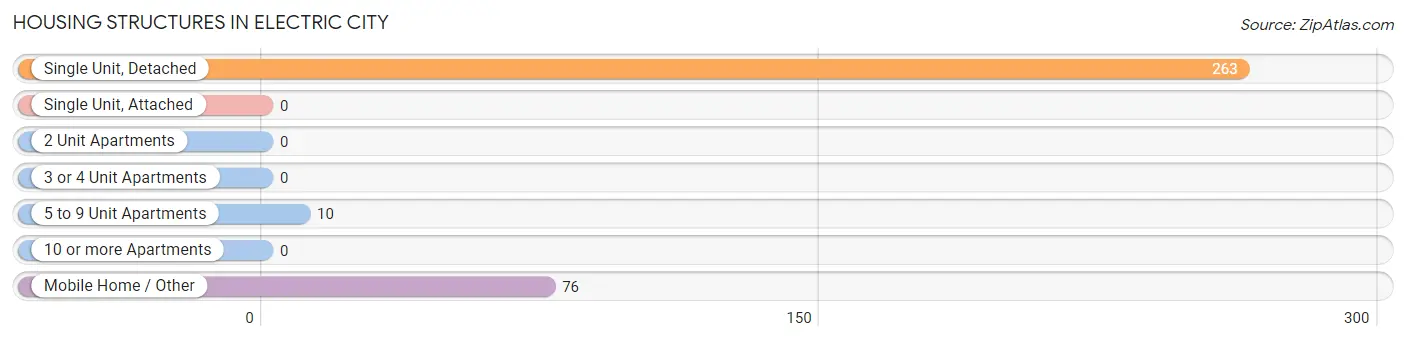
| Structure Type | # Housing Units | % Housing Units |
| Single Unit, Detached | 263 | 75.4% |
| Single Unit, Attached | 0 | 0.0% |
| 2 Unit Apartments | 0 | 0.0% |
| 3 or 4 Unit Apartments | 0 | 0.0% |
| 5 to 9 Unit Apartments | 10 | 2.9% |
| 10 or more Apartments | 0 | 0.0% |
| Mobile Home / Other | 76 | 21.8% |
| Total | 349 | 100.0% |
Housing Structures by Occupancy in Electric City
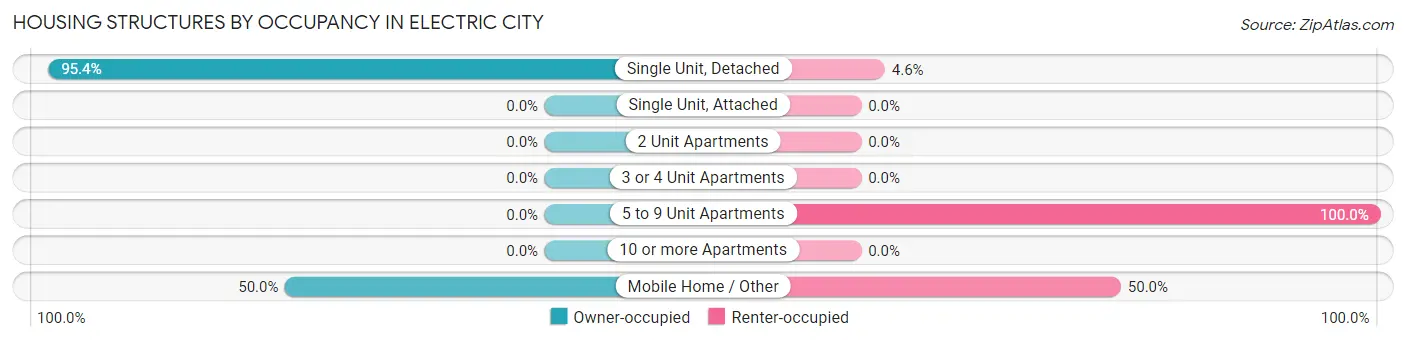
| Structure Type | Owner-occupied | Renter-occupied |
| Single Unit, Detached | 251 (95.4%) | 12 (4.6%) |
| Single Unit, Attached | 0 (0.0%) | 0 (0.0%) |
| 2 Unit Apartments | 0 (0.0%) | 0 (0.0%) |
| 3 or 4 Unit Apartments | 0 (0.0%) | 0 (0.0%) |
| 5 to 9 Unit Apartments | 0 (0.0%) | 10 (100.0%) |
| 10 or more Apartments | 0 (0.0%) | 0 (0.0%) |
| Mobile Home / Other | 38 (50.0%) | 38 (50.0%) |
| Total | 289 (82.8%) | 60 (17.2%) |
Housing Structures by Number of Rooms in Electric City
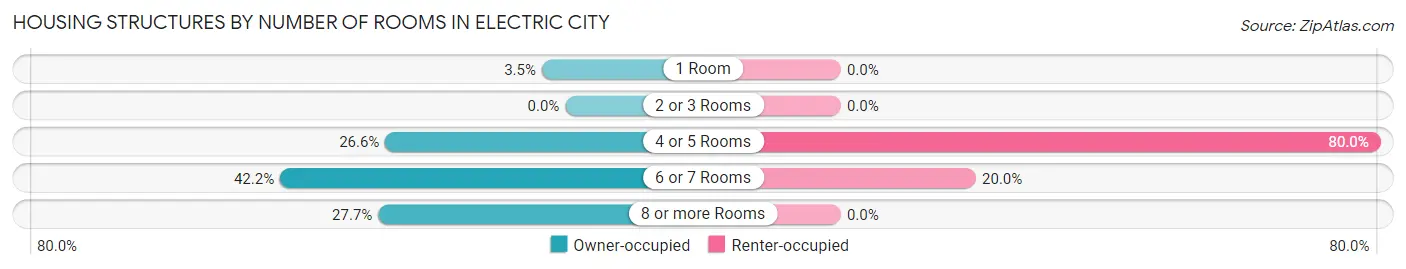
| Number of Rooms | Owner-occupied | Renter-occupied |
| 1 Room | 10 (3.5%) | 0 (0.0%) |
| 2 or 3 Rooms | 0 (0.0%) | 0 (0.0%) |
| 4 or 5 Rooms | 77 (26.6%) | 48 (80.0%) |
| 6 or 7 Rooms | 122 (42.2%) | 12 (20.0%) |
| 8 or more Rooms | 80 (27.7%) | 0 (0.0%) |
| Total | 289 (100.0%) | 60 (100.0%) |
Housing Structure by Heating Type in Electric City
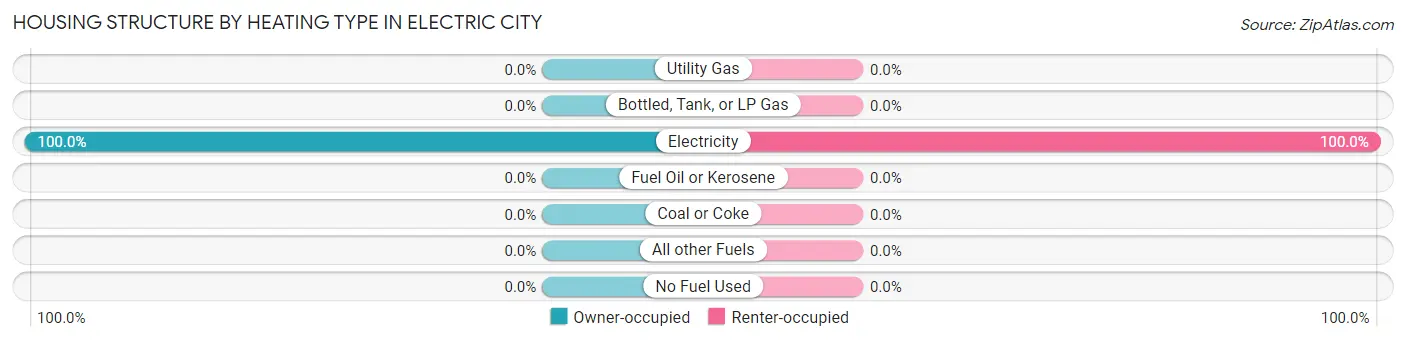
| Heating Type | Owner-occupied | Renter-occupied |
| Utility Gas | 0 (0.0%) | 0 (0.0%) |
| Bottled, Tank, or LP Gas | 0 (0.0%) | 0 (0.0%) |
| Electricity | 289 (100.0%) | 60 (100.0%) |
| Fuel Oil or Kerosene | 0 (0.0%) | 0 (0.0%) |
| Coal or Coke | 0 (0.0%) | 0 (0.0%) |
| All other Fuels | 0 (0.0%) | 0 (0.0%) |
| No Fuel Used | 0 (0.0%) | 0 (0.0%) |
| Total | 289 (100.0%) | 60 (100.0%) |
Household Vehicle Usage in Electric City
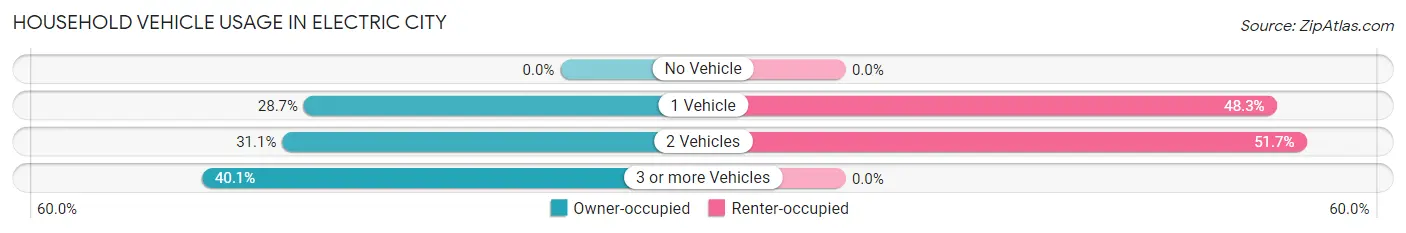
| Vehicles per Household | Owner-occupied | Renter-occupied |
| No Vehicle | 0 (0.0%) | 0 (0.0%) |
| 1 Vehicle | 83 (28.7%) | 29 (48.3%) |
| 2 Vehicles | 90 (31.1%) | 31 (51.7%) |
| 3 or more Vehicles | 116 (40.1%) | 0 (0.0%) |
| Total | 289 (100.0%) | 60 (100.0%) |
Real Estate & Mortgages in Electric City
Real Estate and Mortgage Overview in Electric City
| Characteristic | Without Mortgage | With Mortgage |
| Housing Units | 158 | 131 |
| Median Property Value | $170,700 | $229,500 |
| Median Household Income | $52,727 | $20 |
| Monthly Housing Costs | $449 | $0 |
| Real Estate Taxes | $1,550 | $0 |
Property Value by Mortgage Status in Electric City
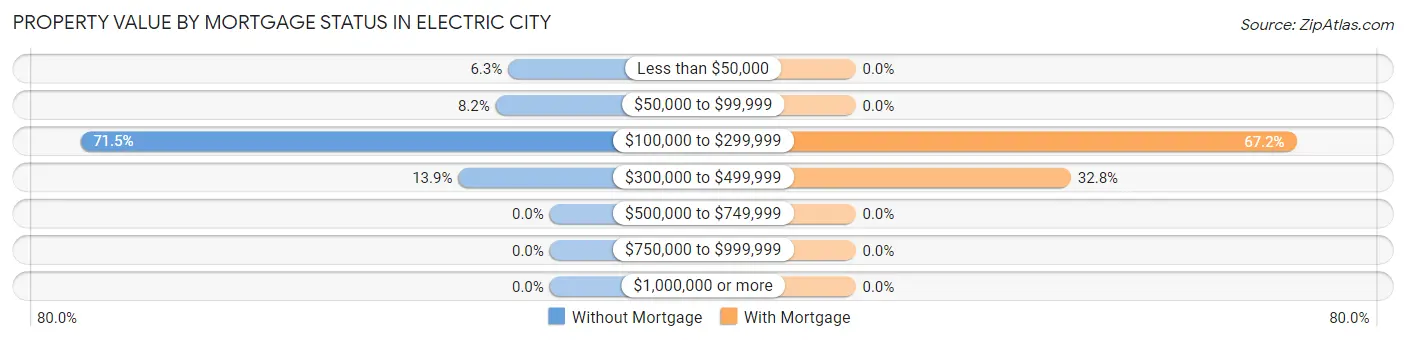
| Property Value | Without Mortgage | With Mortgage |
| Less than $50,000 | 10 (6.3%) | 0 (0.0%) |
| $50,000 to $99,999 | 13 (8.2%) | 0 (0.0%) |
| $100,000 to $299,999 | 113 (71.5%) | 88 (67.2%) |
| $300,000 to $499,999 | 22 (13.9%) | 43 (32.8%) |
| $500,000 to $749,999 | 0 (0.0%) | 0 (0.0%) |
| $750,000 to $999,999 | 0 (0.0%) | 0 (0.0%) |
| $1,000,000 or more | 0 (0.0%) | 0 (0.0%) |
| Total | 158 (100.0%) | 131 (100.0%) |
Household Income by Mortgage Status in Electric City
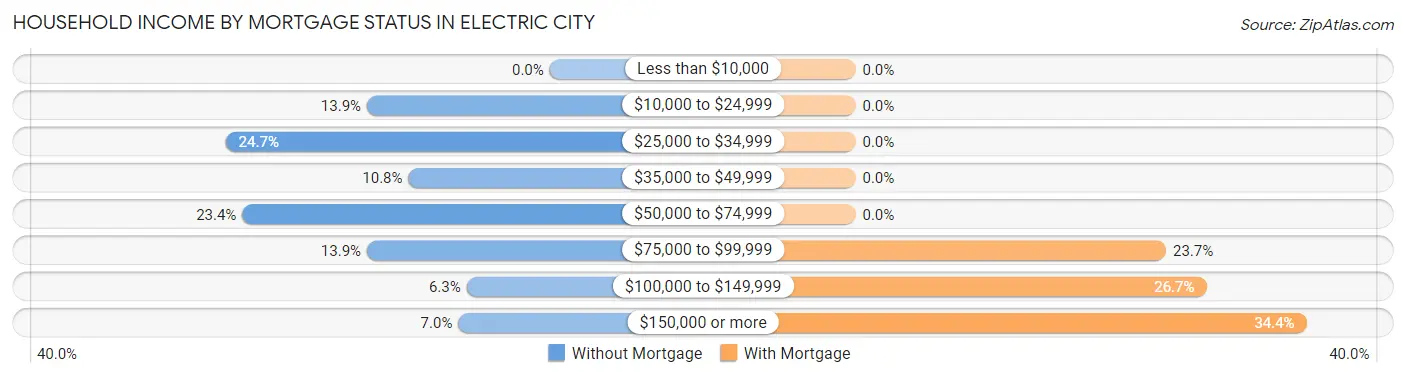
| Household Income | Without Mortgage | With Mortgage |
| Less than $10,000 | 0 (0.0%) | 0 (0.0%) |
| $10,000 to $24,999 | 22 (13.9%) | 0 (0.0%) |
| $25,000 to $34,999 | 39 (24.7%) | 0 (0.0%) |
| $35,000 to $49,999 | 17 (10.8%) | 0 (0.0%) |
| $50,000 to $74,999 | 37 (23.4%) | 0 (0.0%) |
| $75,000 to $99,999 | 22 (13.9%) | 31 (23.7%) |
| $100,000 to $149,999 | 10 (6.3%) | 35 (26.7%) |
| $150,000 or more | 11 (7.0%) | 45 (34.4%) |
| Total | 158 (100.0%) | 131 (100.0%) |
Property Value to Household Income Ratio in Electric City
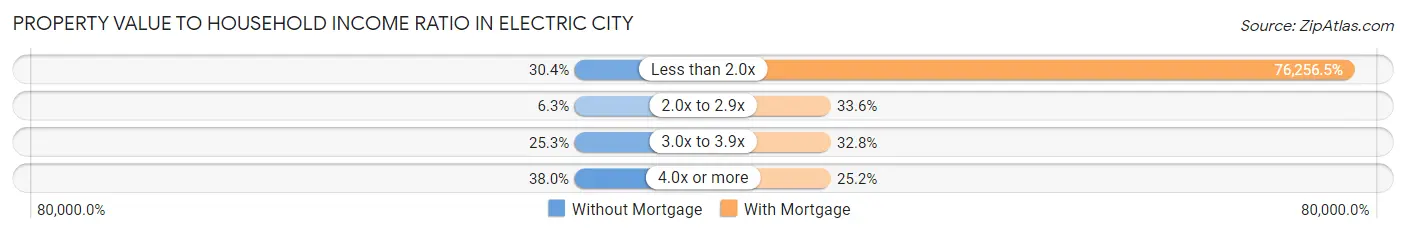
| Value-to-Income Ratio | Without Mortgage | With Mortgage |
| Less than 2.0x | 48 (30.4%) | 99,896 (76,256.5%) |
| 2.0x to 2.9x | 10 (6.3%) | 44 (33.6%) |
| 3.0x to 3.9x | 40 (25.3%) | 43 (32.8%) |
| 4.0x or more | 60 (38.0%) | 33 (25.2%) |
| Total | 158 (100.0%) | 131 (100.0%) |
Real Estate Taxes by Mortgage Status in Electric City
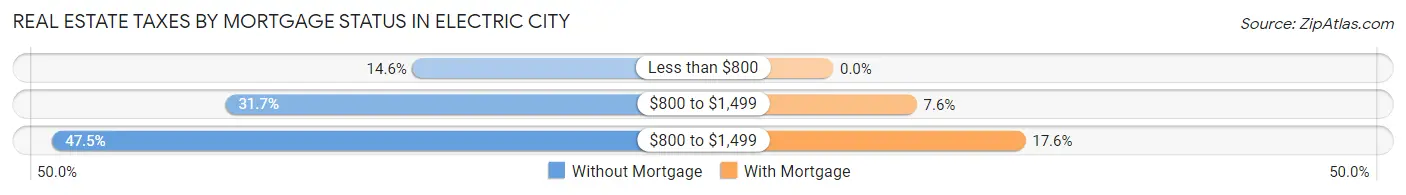
| Property Taxes | Without Mortgage | With Mortgage |
| Less than $800 | 23 (14.6%) | 0 (0.0%) |
| $800 to $1,499 | 50 (31.7%) | 10 (7.6%) |
| $800 to $1,499 | 75 (47.5%) | 23 (17.6%) |
| Total | 158 (100.0%) | 131 (100.0%) |
Health & Disability in Electric City
Health Insurance Coverage by Age in Electric City
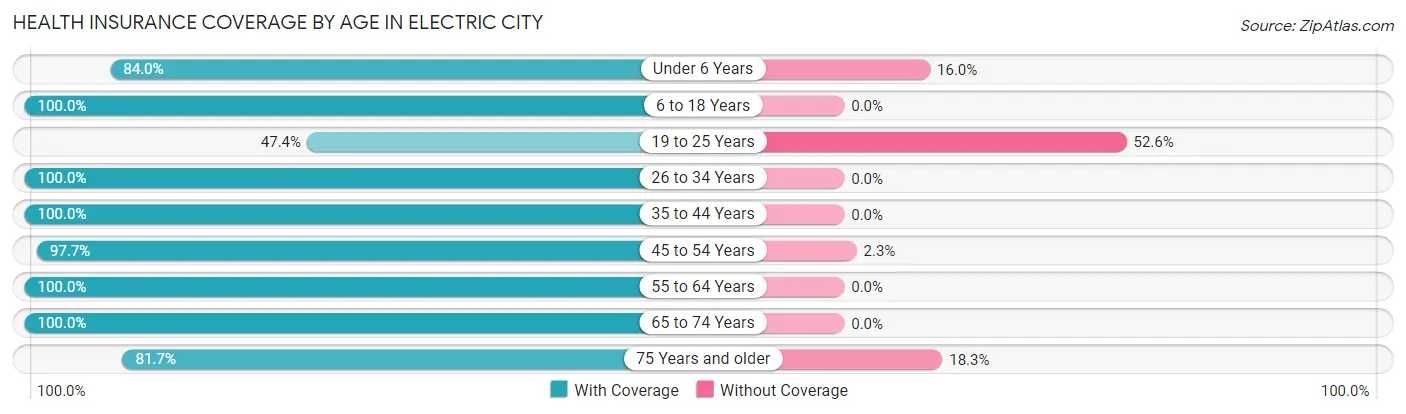
| Age Bracket | With Coverage | Without Coverage |
| Under 6 Years | 42 (84.0%) | 8 (16.0%) |
| 6 to 18 Years | 62 (100.0%) | 0 (0.0%) |
| 19 to 25 Years | 9 (47.4%) | 10 (52.6%) |
| 26 to 34 Years | 64 (100.0%) | 0 (0.0%) |
| 35 to 44 Years | 30 (100.0%) | 0 (0.0%) |
| 45 to 54 Years | 85 (97.7%) | 2 (2.3%) |
| 55 to 64 Years | 88 (100.0%) | 0 (0.0%) |
| 65 to 74 Years | 228 (100.0%) | 0 (0.0%) |
| 75 Years and older | 85 (81.7%) | 19 (18.3%) |
| Total | 693 (94.7%) | 39 (5.3%) |
Health Insurance Coverage by Citizenship Status in Electric City
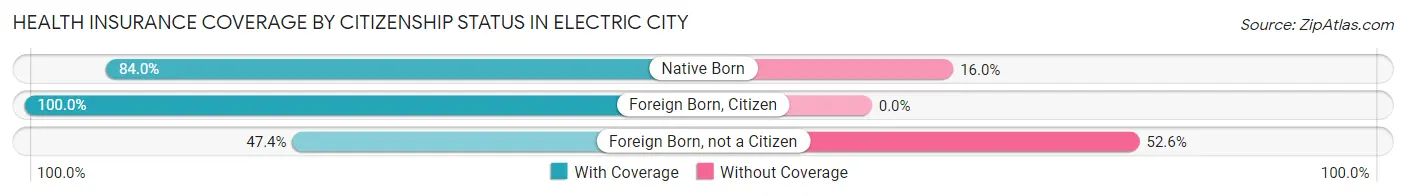
| Citizenship Status | With Coverage | Without Coverage |
| Native Born | 42 (84.0%) | 8 (16.0%) |
| Foreign Born, Citizen | 62 (100.0%) | 0 (0.0%) |
| Foreign Born, not a Citizen | 9 (47.4%) | 10 (52.6%) |
Health Insurance Coverage by Household Income in Electric City
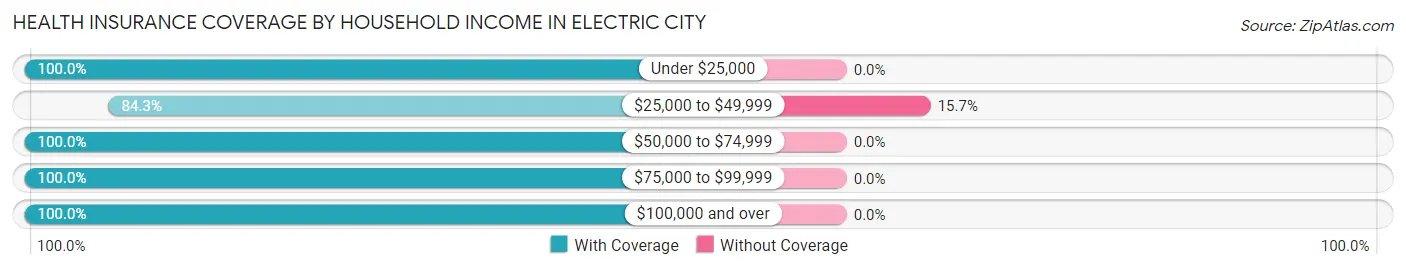
| Household Income | With Coverage | Without Coverage |
| Under $25,000 | 22 (100.0%) | 0 (0.0%) |
| $25,000 to $49,999 | 209 (84.3%) | 39 (15.7%) |
| $50,000 to $74,999 | 107 (100.0%) | 0 (0.0%) |
| $75,000 to $99,999 | 175 (100.0%) | 0 (0.0%) |
| $100,000 and over | 180 (100.0%) | 0 (0.0%) |
Public vs Private Health Insurance Coverage by Age in Electric City
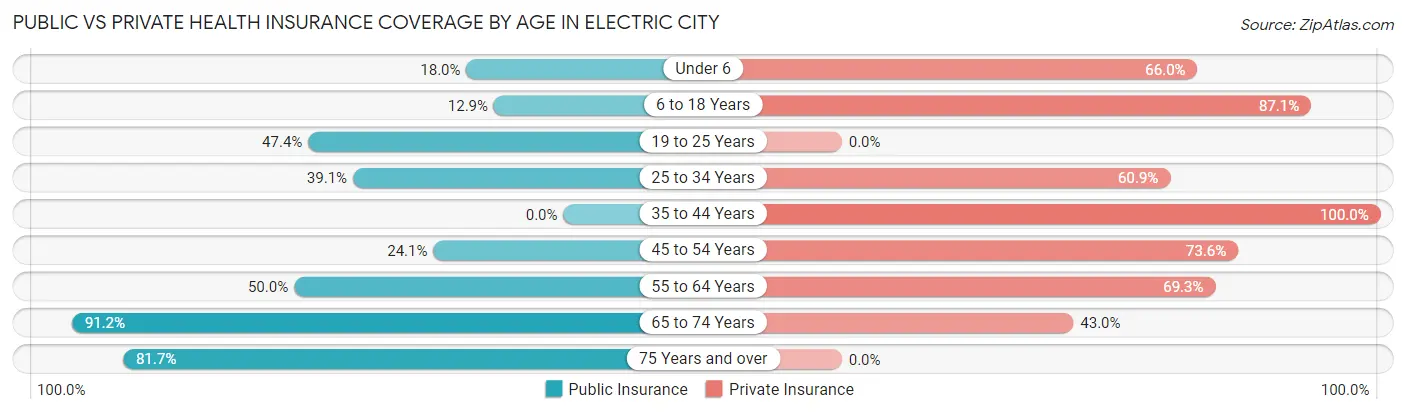
| Age Bracket | Public Insurance | Private Insurance |
| Under 6 | 9 (18.0%) | 33 (66.0%) |
| 6 to 18 Years | 8 (12.9%) | 54 (87.1%) |
| 19 to 25 Years | 9 (47.4%) | 0 (0.0%) |
| 25 to 34 Years | 25 (39.1%) | 39 (60.9%) |
| 35 to 44 Years | 0 (0.0%) | 30 (100.0%) |
| 45 to 54 Years | 21 (24.1%) | 64 (73.6%) |
| 55 to 64 Years | 44 (50.0%) | 61 (69.3%) |
| 65 to 74 Years | 208 (91.2%) | 98 (43.0%) |
| 75 Years and over | 85 (81.7%) | 0 (0.0%) |
| Total | 409 (55.9%) | 379 (51.8%) |
Disability Status by Sex by Age in Electric City
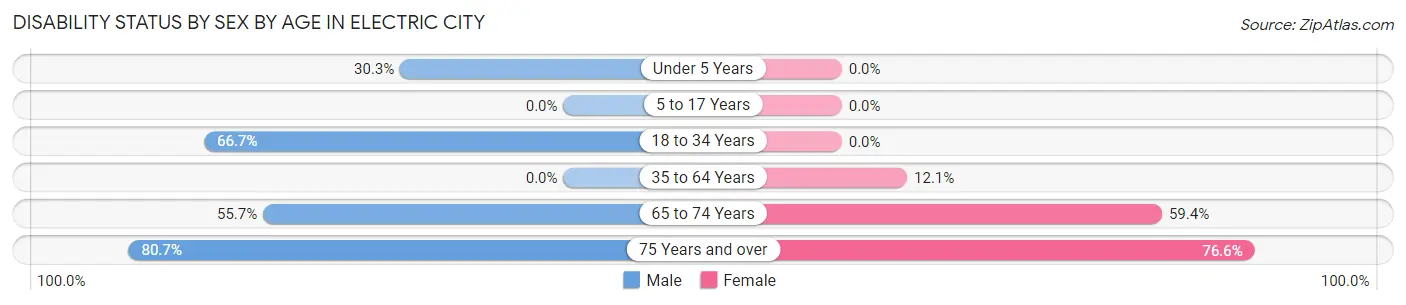
| Age Bracket | Male | Female |
| Under 5 Years | 10 (30.3%) | 0 (0.0%) |
| 5 to 17 Years | 0 (0.0%) | 0 (0.0%) |
| 18 to 34 Years | 26 (66.7%) | 0 (0.0%) |
| 35 to 64 Years | 0 (0.0%) | 16 (12.1%) |
| 65 to 74 Years | 68 (55.7%) | 63 (59.4%) |
| 75 Years and over | 46 (80.7%) | 36 (76.6%) |
Disability Class by Sex by Age in Electric City
Disability Class: Hearing Difficulty
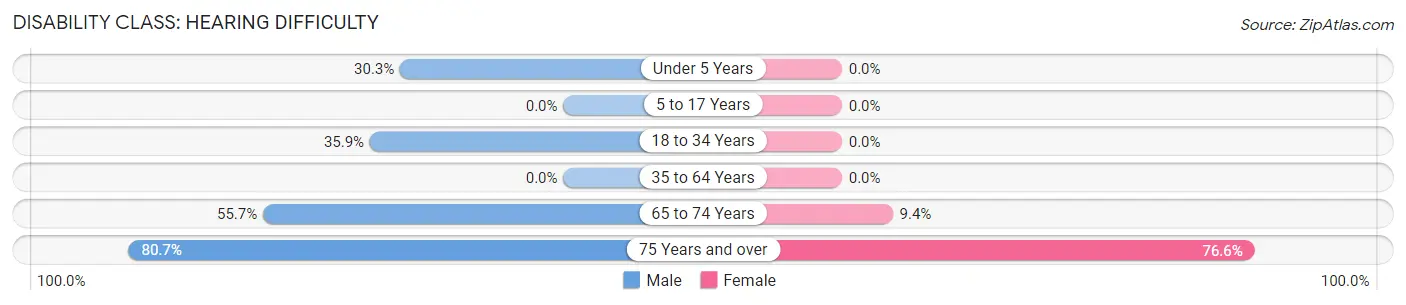
| Age Bracket | Male | Female |
| Under 5 Years | 10 (30.3%) | 0 (0.0%) |
| 5 to 17 Years | 0 (0.0%) | 0 (0.0%) |
| 18 to 34 Years | 14 (35.9%) | 0 (0.0%) |
| 35 to 64 Years | 0 (0.0%) | 0 (0.0%) |
| 65 to 74 Years | 68 (55.7%) | 10 (9.4%) |
| 75 Years and over | 46 (80.7%) | 36 (76.6%) |
Disability Class: Vision Difficulty
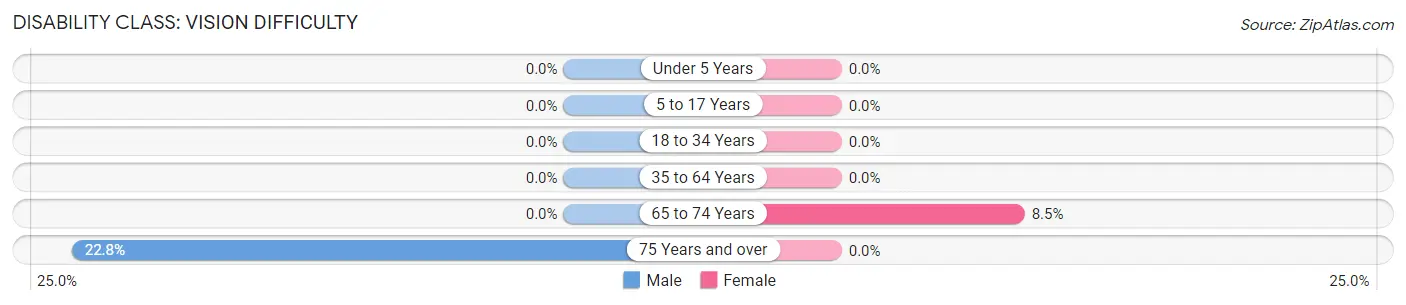
| Age Bracket | Male | Female |
| Under 5 Years | 0 (0.0%) | 0 (0.0%) |
| 5 to 17 Years | 0 (0.0%) | 0 (0.0%) |
| 18 to 34 Years | 0 (0.0%) | 0 (0.0%) |
| 35 to 64 Years | 0 (0.0%) | 0 (0.0%) |
| 65 to 74 Years | 0 (0.0%) | 9 (8.5%) |
| 75 Years and over | 13 (22.8%) | 0 (0.0%) |
Disability Class: Cognitive Difficulty
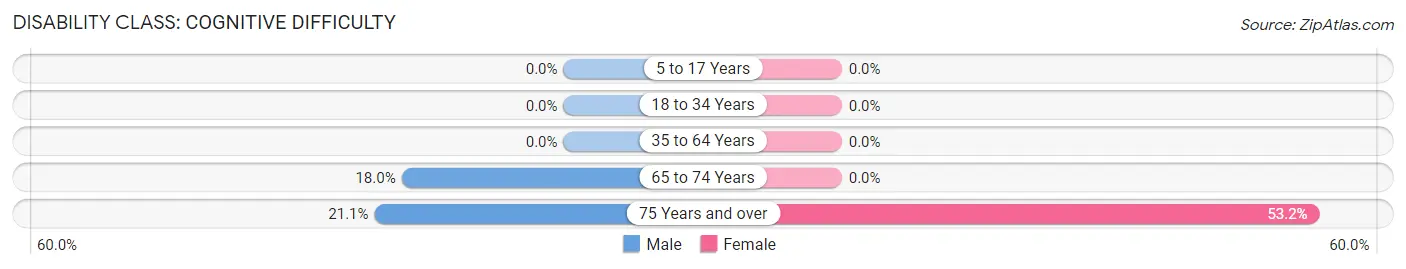
| Age Bracket | Male | Female |
| 5 to 17 Years | 0 (0.0%) | 0 (0.0%) |
| 18 to 34 Years | 0 (0.0%) | 0 (0.0%) |
| 35 to 64 Years | 0 (0.0%) | 0 (0.0%) |
| 65 to 74 Years | 22 (18.0%) | 0 (0.0%) |
| 75 Years and over | 12 (21.0%) | 25 (53.2%) |
Disability Class: Ambulatory Difficulty
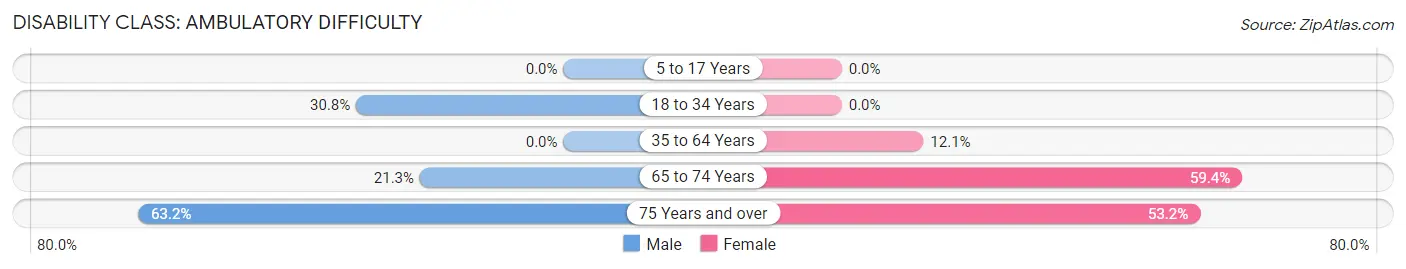
| Age Bracket | Male | Female |
| 5 to 17 Years | 0 (0.0%) | 0 (0.0%) |
| 18 to 34 Years | 12 (30.8%) | 0 (0.0%) |
| 35 to 64 Years | 0 (0.0%) | 16 (12.1%) |
| 65 to 74 Years | 26 (21.3%) | 63 (59.4%) |
| 75 Years and over | 36 (63.2%) | 25 (53.2%) |
Disability Class: Self-Care Difficulty
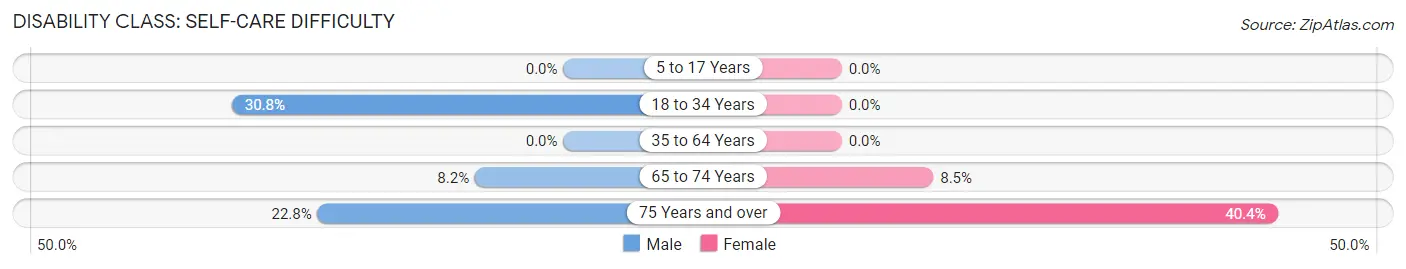
| Age Bracket | Male | Female |
| 5 to 17 Years | 0 (0.0%) | 0 (0.0%) |
| 18 to 34 Years | 12 (30.8%) | 0 (0.0%) |
| 35 to 64 Years | 0 (0.0%) | 0 (0.0%) |
| 65 to 74 Years | 10 (8.2%) | 9 (8.5%) |
| 75 Years and over | 13 (22.8%) | 19 (40.4%) |
Technology Access in Electric City
Computing Device Access in Electric City
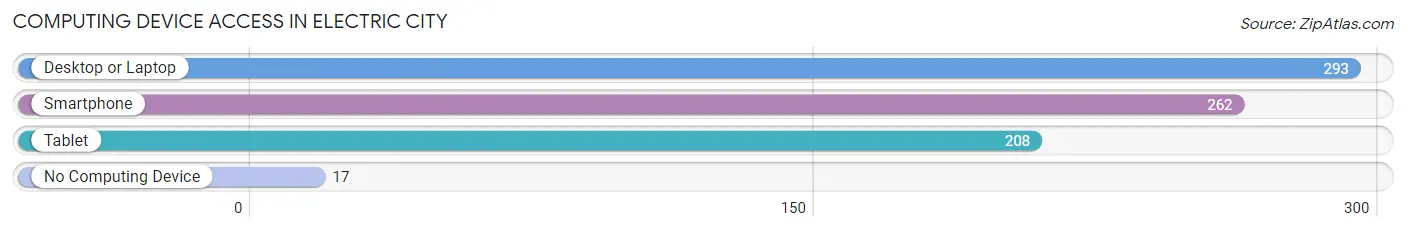
| Device Type | # Households | % Households |
| Desktop or Laptop | 293 | 84.0% |
| Smartphone | 262 | 75.1% |
| Tablet | 208 | 59.6% |
| No Computing Device | 17 | 4.9% |
| Total | 349 | 100.0% |
Internet Access in Electric City
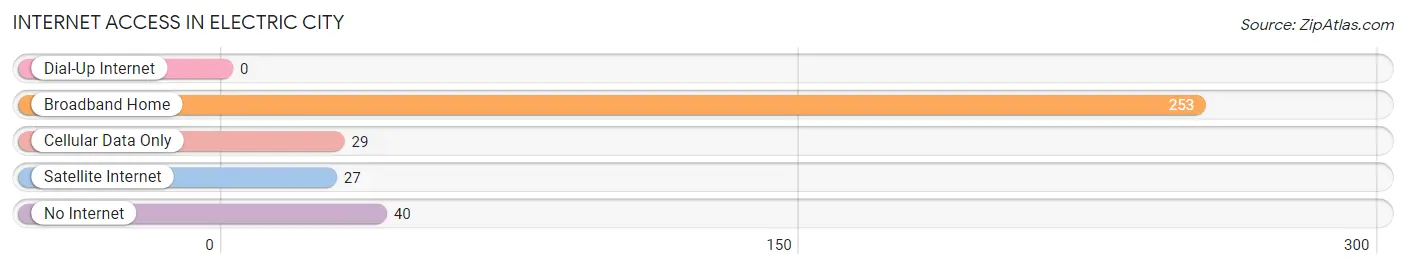
| Internet Type | # Households | % Households |
| Dial-Up Internet | 0 | 0.0% |
| Broadband Home | 253 | 72.5% |
| Cellular Data Only | 29 | 8.3% |
| Satellite Internet | 27 | 7.7% |
| No Internet | 40 | 11.5% |
| Total | 349 | 100.0% |
Electric City Summary
City of Electric City Washington
Electric City is a small city located in Grant County, Washington, United States. It is situated on the banks of the Columbia River, just south of the Grand Coulee Dam. The city was incorporated in 1945 and has a population of 1,717 as of the 2010 census.
History
Electric City was founded in 1945 by the Grand Coulee Dam Construction Company, which was owned by the United States Bureau of Reclamation. The company was responsible for the construction of the Grand Coulee Dam, which was completed in 1941. The dam was built to provide hydroelectric power to the region and to irrigate the surrounding area. The city was named after the dam, which was the first large-scale hydroelectric power plant in the United States.
The city was originally a company town, with the majority of the population employed by the dam. The city was incorporated in 1945 and the first mayor was elected in 1946. The city was initially a small, rural community, but it began to grow in the 1950s and 1960s as the dam and the surrounding area developed.
Geography
Electric City is located in Grant County, Washington, on the banks of the Columbia River. It is situated just south of the Grand Coulee Dam, which is the largest hydroelectric power plant in the United States. The city is located in a semi-arid region, with an average annual precipitation of just 8.5 inches. The city has a total area of 1.2 square miles, all of which is land.
Economy
Electric City’s economy is largely based on the Grand Coulee Dam and the surrounding area. The dam provides hydroelectric power to the region and is a major source of employment for the city. The city is also home to several other businesses, including a lumber mill, a sawmill, and a grain elevator.
Demographics
As of the 2010 census, Electric City had a population of 1,717. The racial makeup of the city was 94.2% White, 0.7% African American, 0.7% Native American, 0.3% Asian, 0.1% Pacific Islander, 1.2% from other races, and 2.9% from two or more races. Hispanic or Latino of any race were 4.2% of the population.
The median income for a household in the city was $35,938, and the median income for a family was $41,250. The per capita income for the city was $17,845. About 11.2% of families and 14.2% of the population were below the poverty line, including 19.2% of those under age 18 and 8.3% of those age 65 or over.
Electric City is a small city with a rich history and a bright future. The city is home to the Grand Coulee Dam, which provides hydroelectric power to the region and is a major source of employment for the city. The city has a diverse population and a strong economy, and is a great place to live and work.
Common Questions
What is Per Capita Income in Electric City?
Per Capita income in Electric City is $41,187.
What is the Median Family Income in Electric City?
Median Family Income in Electric City is $83,295.
What is the Median Household income in Electric City?
Median Household Income in Electric City is $61,435.
What is Income or Wage Gap in Electric City?
Income or Wage Gap in Electric City is 52.3%.
Women in Electric City earn 47.7 cents for every dollar earned by a man.
What is Inequality or Gini Index in Electric City?
Inequality or Gini Index in Electric City is 0.41.
What is the Total Population of Electric City?
Total Population of Electric City is 732.
What is the Total Male Population of Electric City?
Total Male Population of Electric City is 364.
What is the Total Female Population of Electric City?
Total Female Population of Electric City is 368.
What is the Ratio of Males per 100 Females in Electric City?
There are 98.91 Males per 100 Females in Electric City.
What is the Ratio of Females per 100 Males in Electric City?
There are 101.10 Females per 100 Males in Electric City.
What is the Median Population Age in Electric City?
Median Population Age in Electric City is 61.6 Years.
What is the Average Family Size in Electric City
Average Family Size in Electric City is 2.4 People.
What is the Average Household Size in Electric City
Average Household Size in Electric City is 2.1 People.
How Large is the Labor Force in Electric City?
There are 241 People in the Labor Forcein in Electric City.
What is the Percentage of People in the Labor Force in Electric City?
38.0% of People are in the Labor Force in Electric City.