Whitehall, MT Map & Demographics
Whitehall Map
Whitehall Overview
$23,864
PER CAPITA INCOME
$48,750
AVG FAMILY INCOME
$41,477
AVG HOUSEHOLD INCOME
18.7%
WAGE / INCOME GAP [ % ]
81.3¢/ $1
WAGE / INCOME GAP [ $ ]
0.44
INEQUALITY / GINI INDEX
1,129
TOTAL POPULATION
564
MALE POPULATION
565
FEMALE POPULATION
99.82
MALES / 100 FEMALES
100.18
FEMALES / 100 MALES
49.7
MEDIAN AGE
2.9
AVG FAMILY SIZE
2.4
AVG HOUSEHOLD SIZE
467
LABOR FORCE [ PEOPLE ]
49.2%
PERCENT IN LABOR FORCE
9.6%
UNEMPLOYMENT RATE
Whitehall Zip Codes
Whitehall Area Codes
Income in Whitehall
Income Overview in Whitehall
Per Capita Income in Whitehall is $23,864, while median incomes of families and households are $48,750 and $41,477 respectively.
| Characteristic | Number | Measure |
| Per Capita Income | 1,129 | $23,864 |
| Median Family Income | 293 | $48,750 |
| Mean Family Income | 293 | $64,356 |
| Median Household Income | 463 | $41,477 |
| Mean Household Income | 463 | $54,134 |
| Income Deficit | 293 | $0 |
| Wage / Income Gap (%) | 1,129 | 18.75% |
| Wage / Income Gap ($) | 1,129 | 81.25¢ per $1 |
| Gini / Inequality Index | 1,129 | 0.44 |
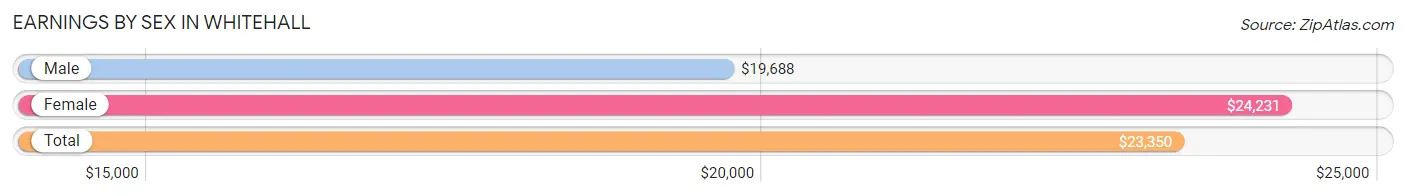
Earnings by Sex in Whitehall
Average Earnings in Whitehall are $23,350, $19,688 for men and $24,231 for women, a difference of 18.8%.
| Sex | Number | Average Earnings |
| Male | 280 (56.0%) | $19,688 |
| Female | 220 (44.0%) | $24,231 |
| Total | 500 (100.0%) | $23,350 |
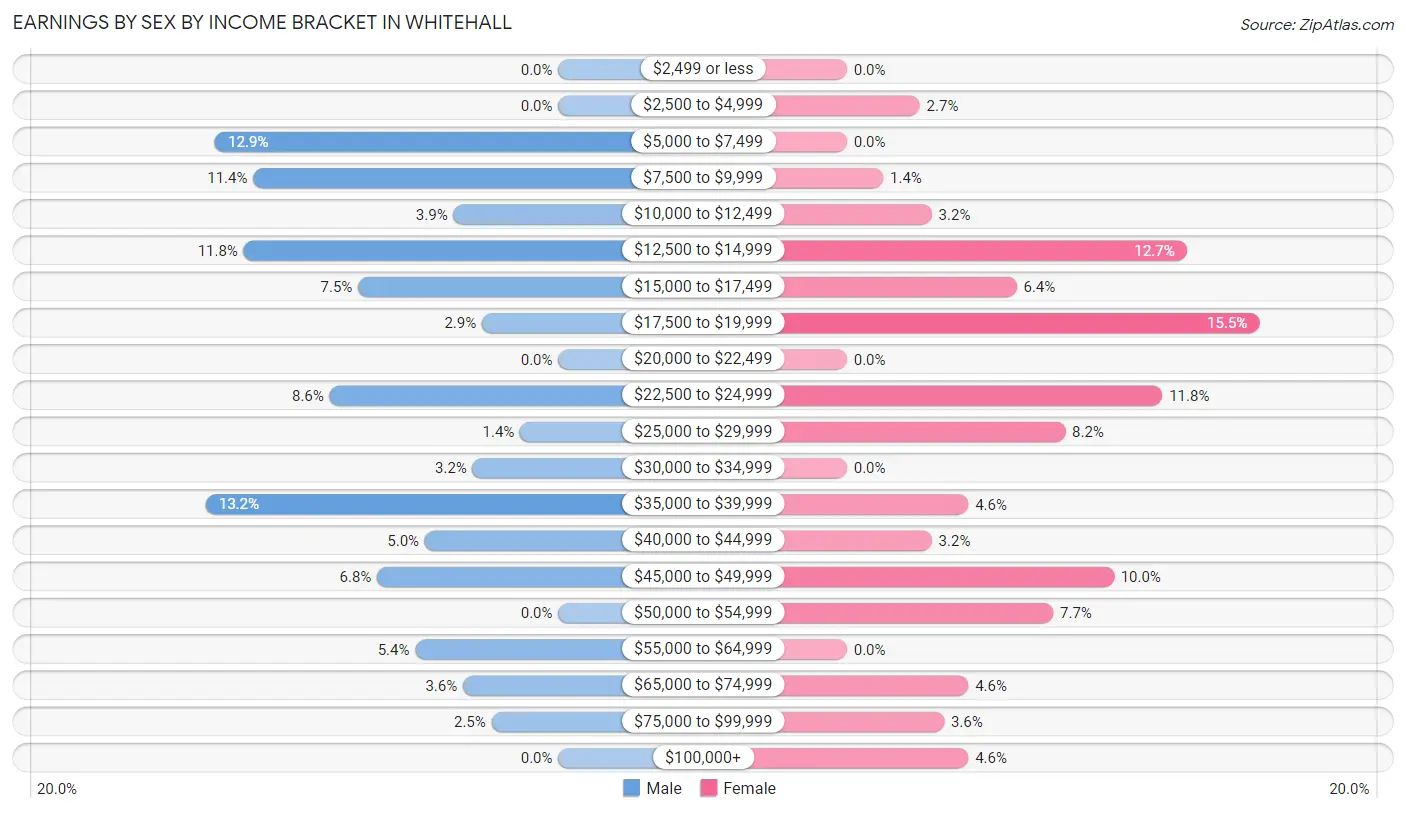
Earnings by Sex by Income Bracket in Whitehall
The most common earnings brackets in Whitehall are $35,000 to $39,999 for men (37 | 13.2%) and $17,500 to $19,999 for women (34 | 15.4%).
| Income | Male | Female |
| $2,499 or less | 0 (0.0%) | 0 (0.0%) |
| $2,500 to $4,999 | 0 (0.0%) | 6 (2.7%) |
| $5,000 to $7,499 | 36 (12.9%) | 0 (0.0%) |
| $7,500 to $9,999 | 32 (11.4%) | 3 (1.4%) |
| $10,000 to $12,499 | 11 (3.9%) | 7 (3.2%) |
| $12,500 to $14,999 | 33 (11.8%) | 28 (12.7%) |
| $15,000 to $17,499 | 21 (7.5%) | 14 (6.4%) |
| $17,500 to $19,999 | 8 (2.9%) | 34 (15.4%) |
| $20,000 to $22,499 | 0 (0.0%) | 0 (0.0%) |
| $22,500 to $24,999 | 24 (8.6%) | 26 (11.8%) |
| $25,000 to $29,999 | 4 (1.4%) | 18 (8.2%) |
| $30,000 to $34,999 | 9 (3.2%) | 0 (0.0%) |
| $35,000 to $39,999 | 37 (13.2%) | 10 (4.5%) |
| $40,000 to $44,999 | 14 (5.0%) | 7 (3.2%) |
| $45,000 to $49,999 | 19 (6.8%) | 22 (10.0%) |
| $50,000 to $54,999 | 0 (0.0%) | 17 (7.7%) |
| $55,000 to $64,999 | 15 (5.4%) | 0 (0.0%) |
| $65,000 to $74,999 | 10 (3.6%) | 10 (4.5%) |
| $75,000 to $99,999 | 7 (2.5%) | 8 (3.6%) |
| $100,000+ | 0 (0.0%) | 10 (4.5%) |
| Total | 280 (100.0%) | 220 (100.0%) |
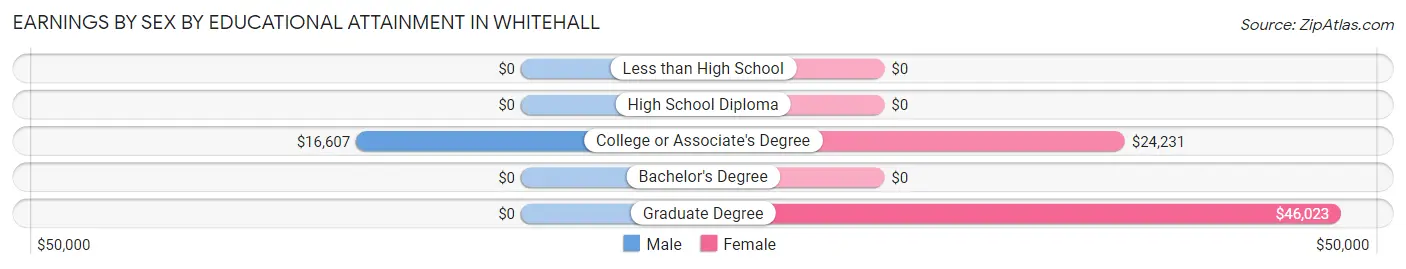
Earnings by Sex by Educational Attainment in Whitehall
Average earnings in Whitehall are $24,063 for men and $24,904 for women, a difference of 3.4%. Men with an educational attainment of college or associate's degree enjoy the highest average annual earnings of $16,607, while those with college or associate's degree education earn the least with $16,607. Women with an educational attainment of graduate degree earn the most with the average annual earnings of $46,023, while those with college or associate's degree education have the smallest earnings of $24,231.
| Educational Attainment | Male Income | Female Income |
| Less than High School | - | - |
| High School Diploma | - | - |
| College or Associate's Degree | $16,607 | $24,231 |
| Bachelor's Degree | - | - |
| Graduate Degree | - | - |
| Total | $24,063 | $24,904 |
Family Income in Whitehall
Family Income Brackets in Whitehall
According to the Whitehall family income data, there are 63 families falling into the $50,000 to $74,999 income range, which is the most common income bracket and makes up 21.5% of all families. Conversely, the $200,000+ income bracket is the least frequent group with only 10 families (3.4%) belonging to this category.
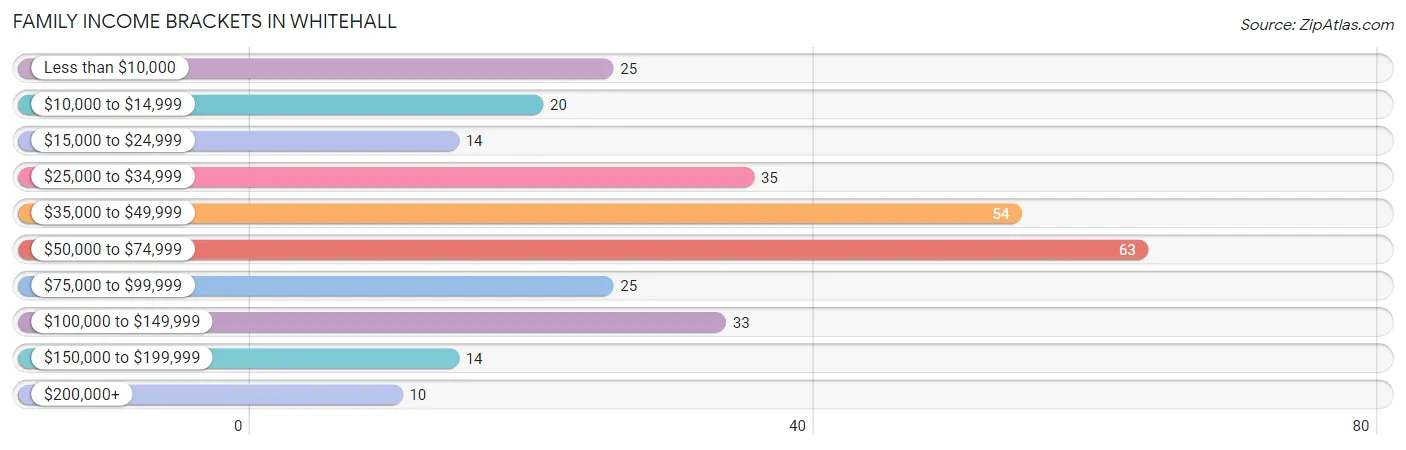
| Income Bracket | # Families | % Families |
| Less than $10,000 | 25 | 8.5% |
| $10,000 to $14,999 | 20 | 6.8% |
| $15,000 to $24,999 | 14 | 4.8% |
| $25,000 to $34,999 | 35 | 11.9% |
| $35,000 to $49,999 | 54 | 18.4% |
| $50,000 to $74,999 | 63 | 21.5% |
| $75,000 to $99,999 | 25 | 8.5% |
| $100,000 to $149,999 | 33 | 11.3% |
| $150,000 to $199,999 | 14 | 4.8% |
| $200,000+ | 10 | 3.4% |
Family Income by Famaliy Size in Whitehall
4-person families (34 | 11.6%) account for the highest median family income in Whitehall with $100,568 per family, while 4-person families (34 | 11.6%) have the highest median income of $25,142 per family member.
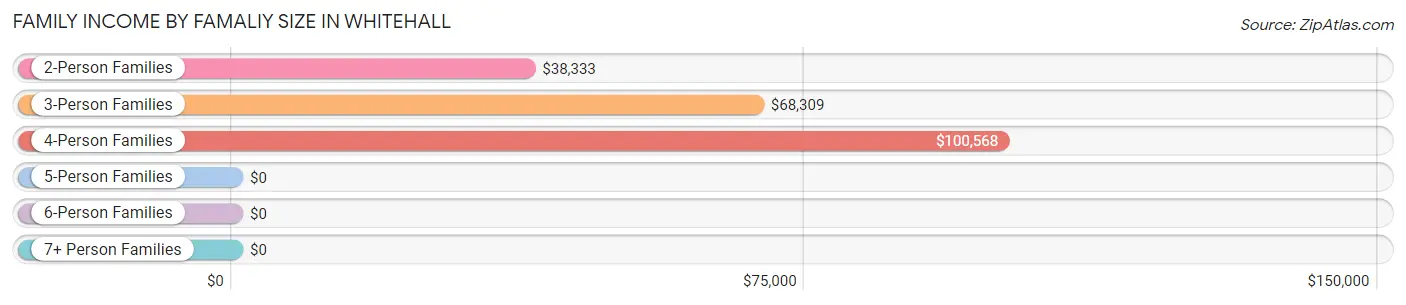
| Income Bracket | # Families | Median Income |
| 2-Person Families | 154 (52.6%) | $38,333 |
| 3-Person Families | 105 (35.8%) | $68,309 |
| 4-Person Families | 34 (11.6%) | $100,568 |
| 5-Person Families | 0 (0.0%) | $0 |
| 6-Person Families | 0 (0.0%) | $0 |
| 7+ Person Families | 0 (0.0%) | $0 |
| Total | 293 (100.0%) | $48,750 |
Family Income by Number of Earners in Whitehall
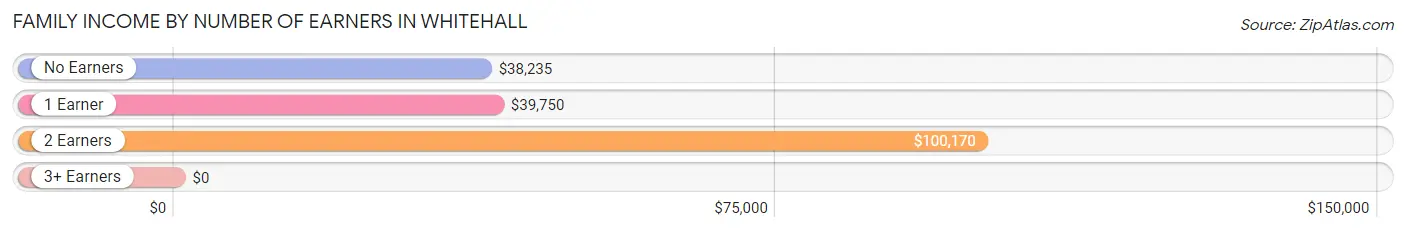
| Number of Earners | # Families | Median Income |
| No Earners | 70 (23.9%) | $38,235 |
| 1 Earner | 130 (44.4%) | $39,750 |
| 2 Earners | 77 (26.3%) | $100,170 |
| 3+ Earners | 16 (5.5%) | $0 |
| Total | 293 (100.0%) | $48,750 |
Household Income in Whitehall
Household Income Brackets in Whitehall
With 76 households falling in the category, the $15,000 to $24,999 income range is the most frequent in Whitehall, accounting for 16.4% of all households. In contrast, only 10 households (2.2%) fall into the $200,000+ income bracket, making it the least populous group.
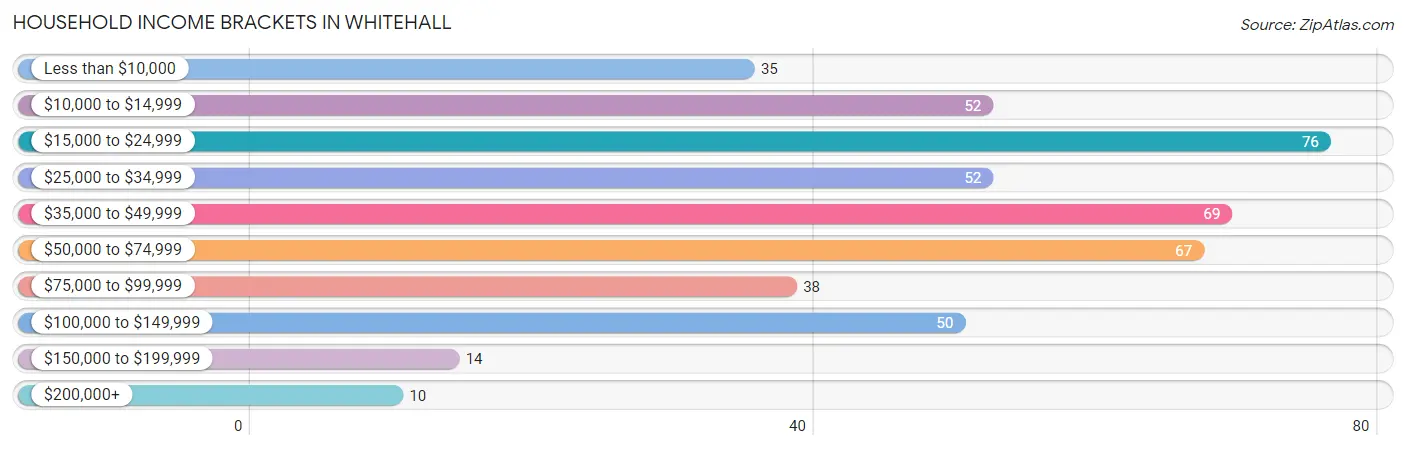
| Income Bracket | # Households | % Households |
| Less than $10,000 | 35 | 7.6% |
| $10,000 to $14,999 | 52 | 11.2% |
| $15,000 to $24,999 | 76 | 16.4% |
| $25,000 to $34,999 | 52 | 11.2% |
| $35,000 to $49,999 | 69 | 14.9% |
| $50,000 to $74,999 | 67 | 14.5% |
| $75,000 to $99,999 | 38 | 8.2% |
| $100,000 to $149,999 | 50 | 10.8% |
| $150,000 to $199,999 | 14 | 3.0% |
| $200,000+ | 10 | 2.2% |
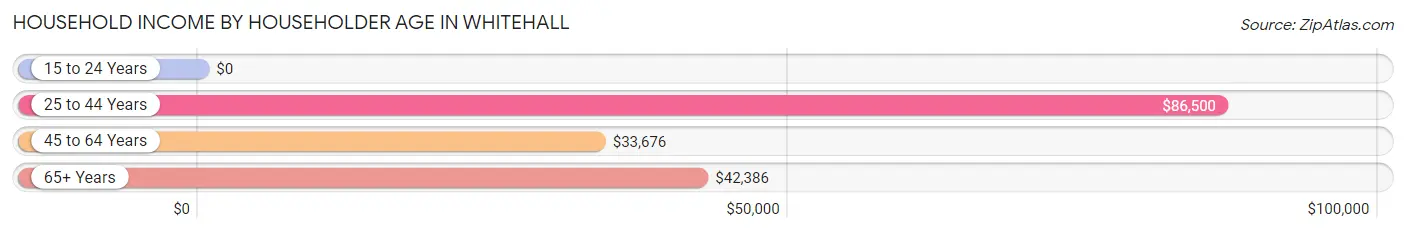
Household Income by Householder Age in Whitehall
The median household income in Whitehall is $41,477, with the highest median household income of $86,500 found in the 25 to 44 years age bracket for the primary householder. A total of 94 households (20.3%) fall into this category.
| Income Bracket | # Households | Median Income |
| 15 to 24 Years | 0 (0.0%) | $0 |
| 25 to 44 Years | 94 (20.3%) | $86,500 |
| 45 to 64 Years | 152 (32.8%) | $33,676 |
| 65+ Years | 217 (46.9%) | $42,386 |
| Total | 463 (100.0%) | $41,477 |
Poverty in Whitehall
Income Below Poverty by Sex and Age in Whitehall
With 15.0% poverty level for males and 26.9% for females among the residents of Whitehall, 15 year old males and 15 year old females are the most vulnerable to poverty, with 5 males (100.0%) and 19 females (100.0%) in their respective age groups living below the poverty level.
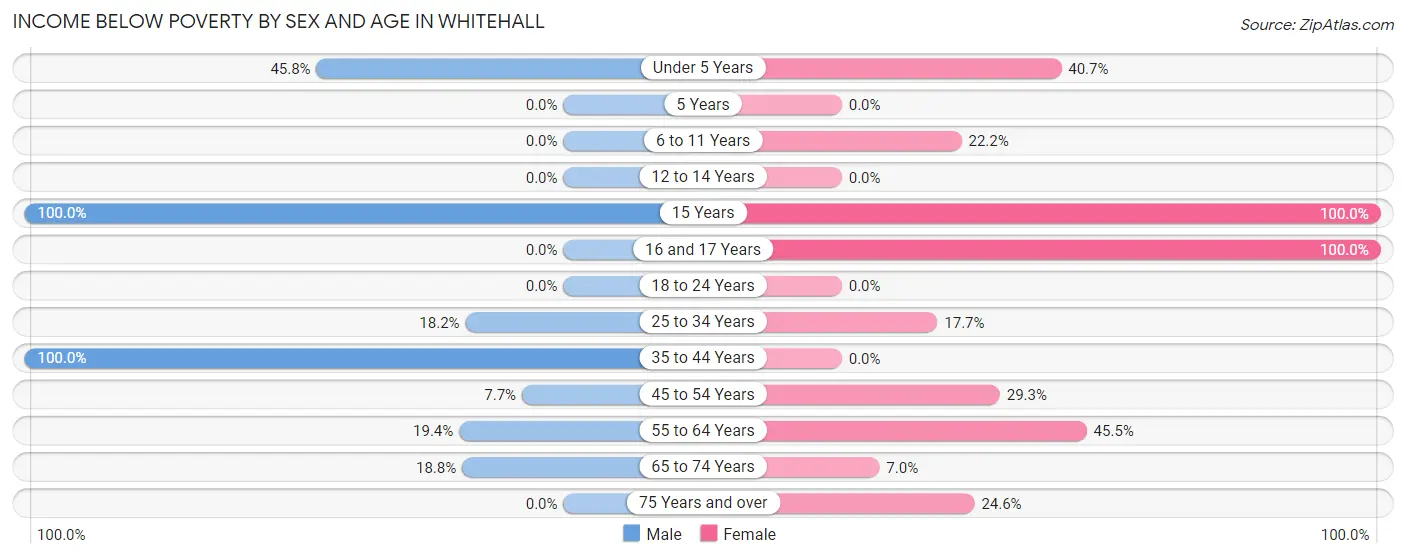
| Age Bracket | Male | Female |
| Under 5 Years | 11 (45.8%) | 11 (40.7%) |
| 5 Years | 0 (0.0%) | 0 (0.0%) |
| 6 to 11 Years | 0 (0.0%) | 12 (22.2%) |
| 12 to 14 Years | 0 (0.0%) | 0 (0.0%) |
| 15 Years | 5 (100.0%) | 19 (100.0%) |
| 16 and 17 Years | 0 (0.0%) | 10 (100.0%) |
| 18 to 24 Years | 0 (0.0%) | 0 (0.0%) |
| 25 to 34 Years | 20 (18.2%) | 11 (17.7%) |
| 35 to 44 Years | 12 (100.0%) | 0 (0.0%) |
| 45 to 54 Years | 7 (7.7%) | 22 (29.3%) |
| 55 to 64 Years | 6 (19.4%) | 45 (45.5%) |
| 65 to 74 Years | 22 (18.8%) | 6 (7.0%) |
| 75 Years and over | 0 (0.0%) | 16 (24.6%) |
| Total | 83 (15.0%) | 152 (26.9%) |
Income Above Poverty by Sex and Age in Whitehall
According to the poverty statistics in Whitehall, males aged 6 to 11 years and females aged 18 to 24 years are the age groups that are most secure financially, with 100.0% of males and 100.0% of females in these age groups living above the poverty line.
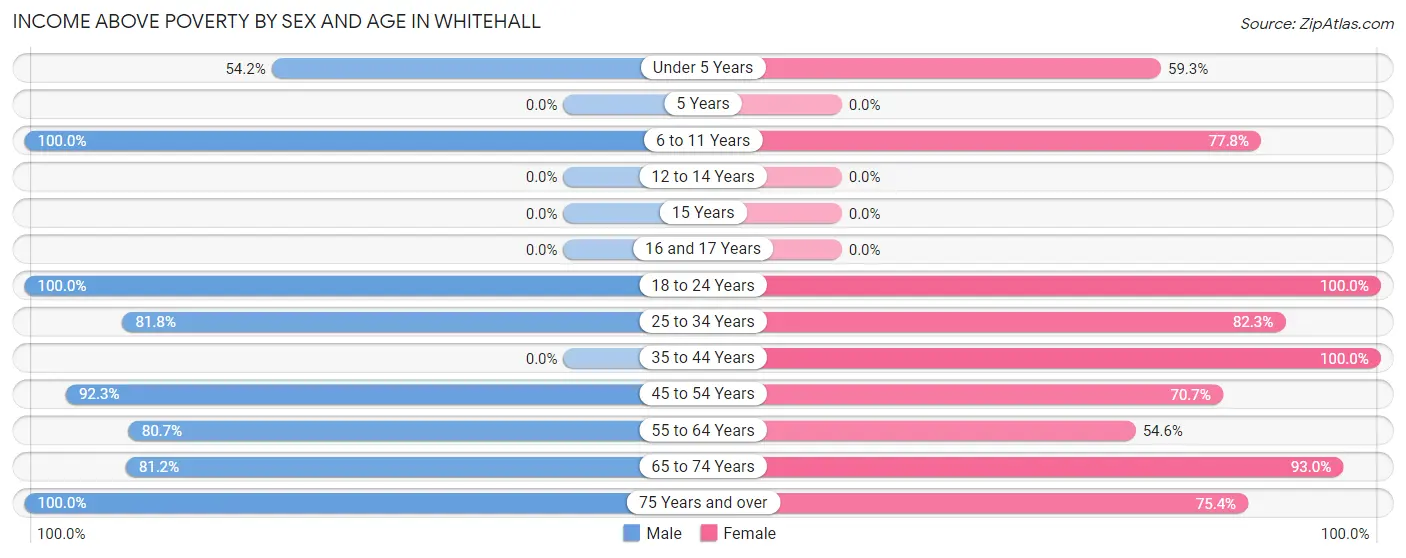
| Age Bracket | Male | Female |
| Under 5 Years | 13 (54.2%) | 16 (59.3%) |
| 5 Years | 0 (0.0%) | 0 (0.0%) |
| 6 to 11 Years | 39 (100.0%) | 42 (77.8%) |
| 12 to 14 Years | 0 (0.0%) | 0 (0.0%) |
| 15 Years | 0 (0.0%) | 0 (0.0%) |
| 16 and 17 Years | 0 (0.0%) | 0 (0.0%) |
| 18 to 24 Years | 32 (100.0%) | 38 (100.0%) |
| 25 to 34 Years | 90 (81.8%) | 51 (82.3%) |
| 35 to 44 Years | 0 (0.0%) | 30 (100.0%) |
| 45 to 54 Years | 84 (92.3%) | 53 (70.7%) |
| 55 to 64 Years | 25 (80.6%) | 54 (54.5%) |
| 65 to 74 Years | 95 (81.2%) | 80 (93.0%) |
| 75 Years and over | 92 (100.0%) | 49 (75.4%) |
| Total | 470 (85.0%) | 413 (73.1%) |
Income Below Poverty Among Married-Couple Families in Whitehall
The poverty statistics for married-couple families in Whitehall show that 8.5% or 15 of the total 176 families live below the poverty line. Families with no children have the highest poverty rate of 11.2%, comprising of 15 families. On the other hand, families with 1 or 2 children have the lowest poverty rate of 0.0%, which includes 0 families.
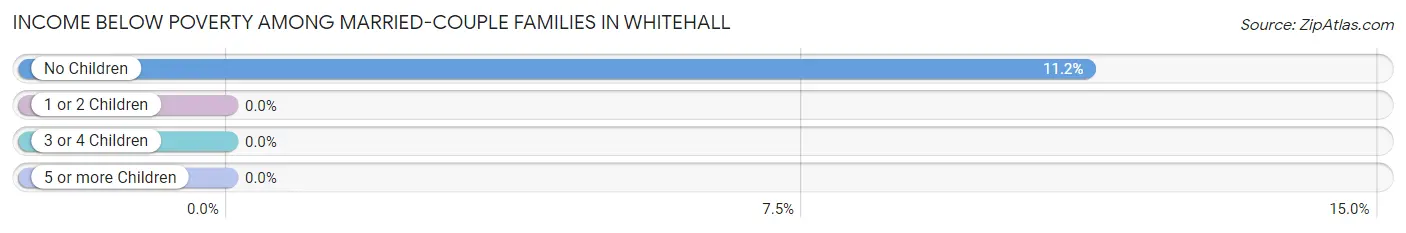
| Children | Above Poverty | Below Poverty |
| No Children | 119 (88.8%) | 15 (11.2%) |
| 1 or 2 Children | 42 (100.0%) | 0 (0.0%) |
| 3 or 4 Children | 0 (0.0%) | 0 (0.0%) |
| 5 or more Children | 0 (0.0%) | 0 (0.0%) |
| Total | 161 (91.5%) | 15 (8.5%) |
Income Below Poverty Among Single-Parent Households in Whitehall
According to the poverty data in Whitehall, 35.2% or 19 single-father households and 39.7% or 25 single-mother households are living below the poverty line. Among single-father households, those with 1 or 2 children have the highest poverty rate, with 19 households (43.2%) experiencing poverty. Likewise, among single-mother households, those with 1 or 2 children have the highest poverty rate, with 25 households (48.1%) falling below the poverty line.
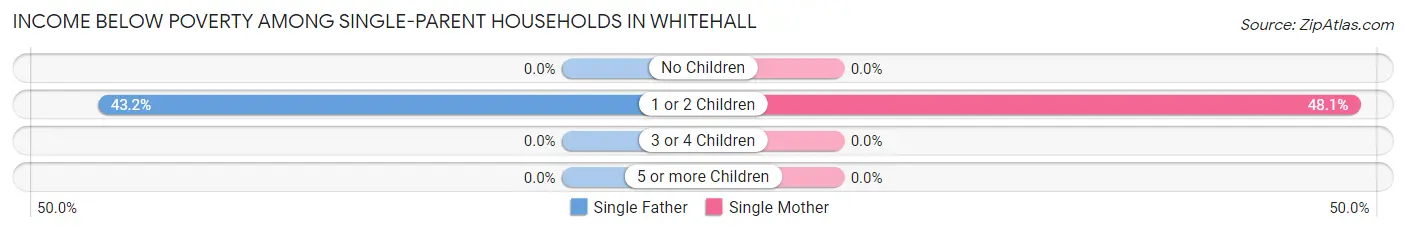
| Children | Single Father | Single Mother |
| No Children | 0 (0.0%) | 0 (0.0%) |
| 1 or 2 Children | 19 (43.2%) | 25 (48.1%) |
| 3 or 4 Children | 0 (0.0%) | 0 (0.0%) |
| 5 or more Children | 0 (0.0%) | 0 (0.0%) |
| Total | 19 (35.2%) | 25 (39.7%) |
Income Below Poverty Among Married-Couple vs Single-Parent Households in Whitehall
The poverty data for Whitehall shows that 15 of the married-couple family households (8.5%) and 44 of the single-parent households (37.6%) are living below the poverty level. Within the married-couple family households, those with no children have the highest poverty rate, with 15 households (11.2%) falling below the poverty line. Among the single-parent households, those with 1 or 2 children have the highest poverty rate, with 44 household (45.8%) living below poverty.
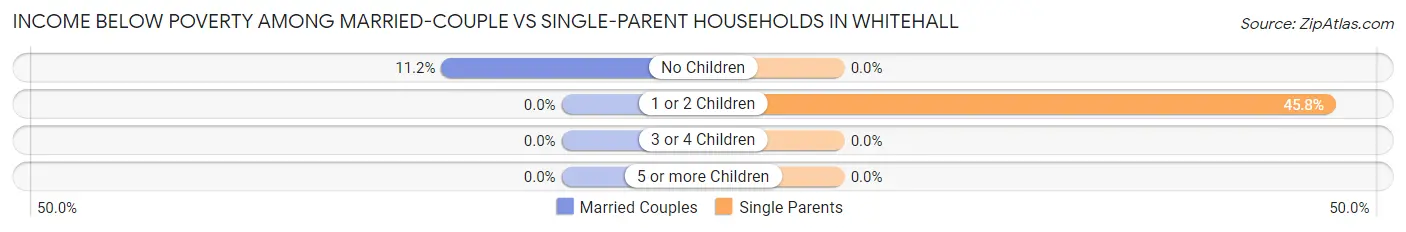
| Children | Married-Couple Families | Single-Parent Households |
| No Children | 15 (11.2%) | 0 (0.0%) |
| 1 or 2 Children | 0 (0.0%) | 44 (45.8%) |
| 3 or 4 Children | 0 (0.0%) | 0 (0.0%) |
| 5 or more Children | 0 (0.0%) | 0 (0.0%) |
| Total | 15 (8.5%) | 44 (37.6%) |
Race in Whitehall
The most populous races in Whitehall are White / Caucasian (1,069 | 94.7%), Two or more Races (57 | 5.1%), and Native / Alaskan (3 | 0.3%).
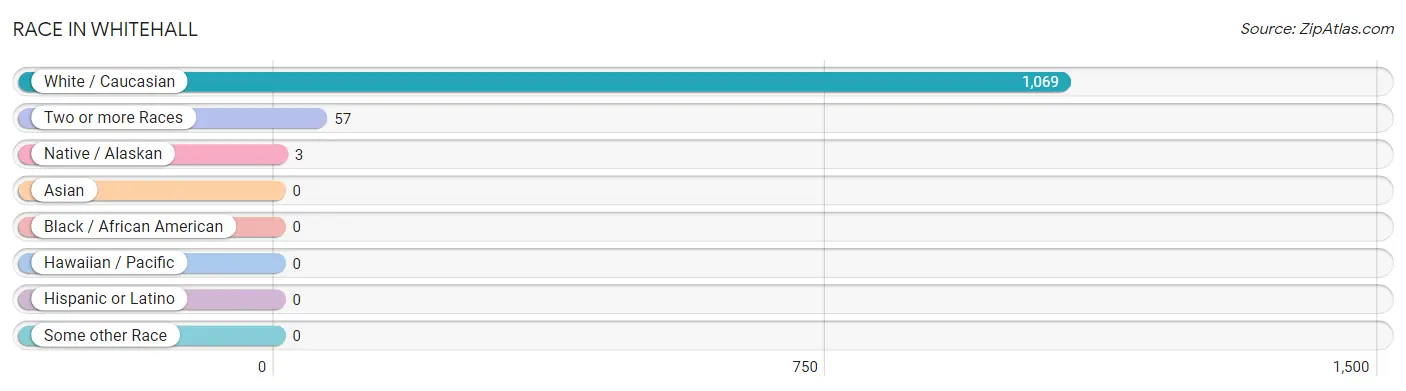
| Race | # Population | % Population |
| Asian | 0 | 0.0% |
| Black / African American | 0 | 0.0% |
| Hawaiian / Pacific | 0 | 0.0% |
| Hispanic or Latino | 0 | 0.0% |
| Native / Alaskan | 3 | 0.3% |
| White / Caucasian | 1,069 | 94.7% |
| Two or more Races | 57 | 5.1% |
| Some other Race | 0 | 0.0% |
| Total | 1,129 | 100.0% |
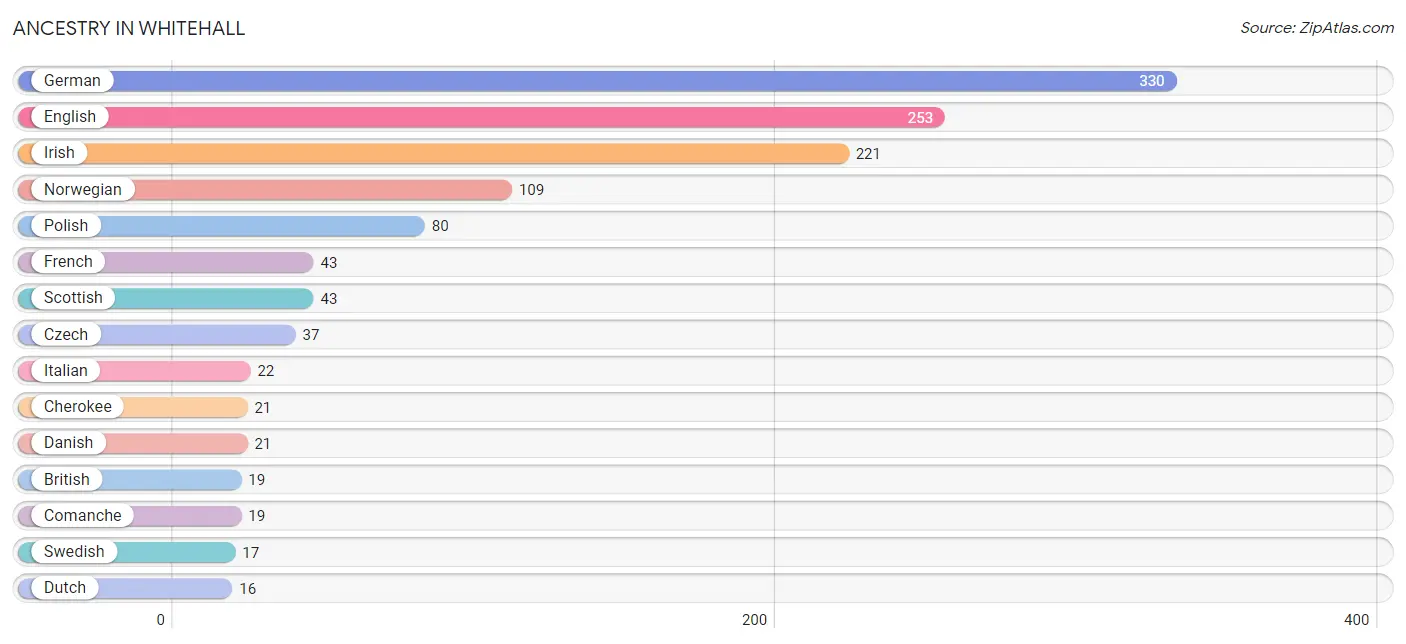
Ancestry in Whitehall
The most populous ancestries reported in Whitehall are German (330 | 29.2%), English (253 | 22.4%), Irish (221 | 19.6%), Norwegian (109 | 9.7%), and Polish (80 | 7.1%), together accounting for 87.9% of all Whitehall residents.
| Ancestry | # Population | % Population |
| British | 19 | 1.7% |
| Cherokee | 21 | 1.9% |
| Chippewa | 3 | 0.3% |
| Comanche | 19 | 1.7% |
| Cree | 5 | 0.4% |
| Czech | 37 | 3.3% |
| Danish | 21 | 1.9% |
| Dutch | 16 | 1.4% |
| English | 253 | 22.4% |
| Finnish | 16 | 1.4% |
| French | 43 | 3.8% |
| French Canadian | 4 | 0.4% |
| German | 330 | 29.2% |
| Irish | 221 | 19.6% |
| Italian | 22 | 1.9% |
| Norwegian | 109 | 9.7% |
| Polish | 80 | 7.1% |
| Scandinavian | 14 | 1.2% |
| Scotch-Irish | 6 | 0.5% |
| Scottish | 43 | 3.8% |
| Sioux | 6 | 0.5% |
| Swedish | 17 | 1.5% |
| Swiss | 4 | 0.4% |
| Ukrainian | 10 | 0.9% |
| Welsh | 4 | 0.4% | View All 25 Rows |
Immigrants in Whitehall

| Immigration Origin | # Population | % Population | View All 0 Rows |
Sex and Age in Whitehall
Sex and Age in Whitehall
The most populous age groups in Whitehall are 65 to 69 Years (79 | 14.0%) for men and 60 to 64 Years (67 | 11.9%) for women.
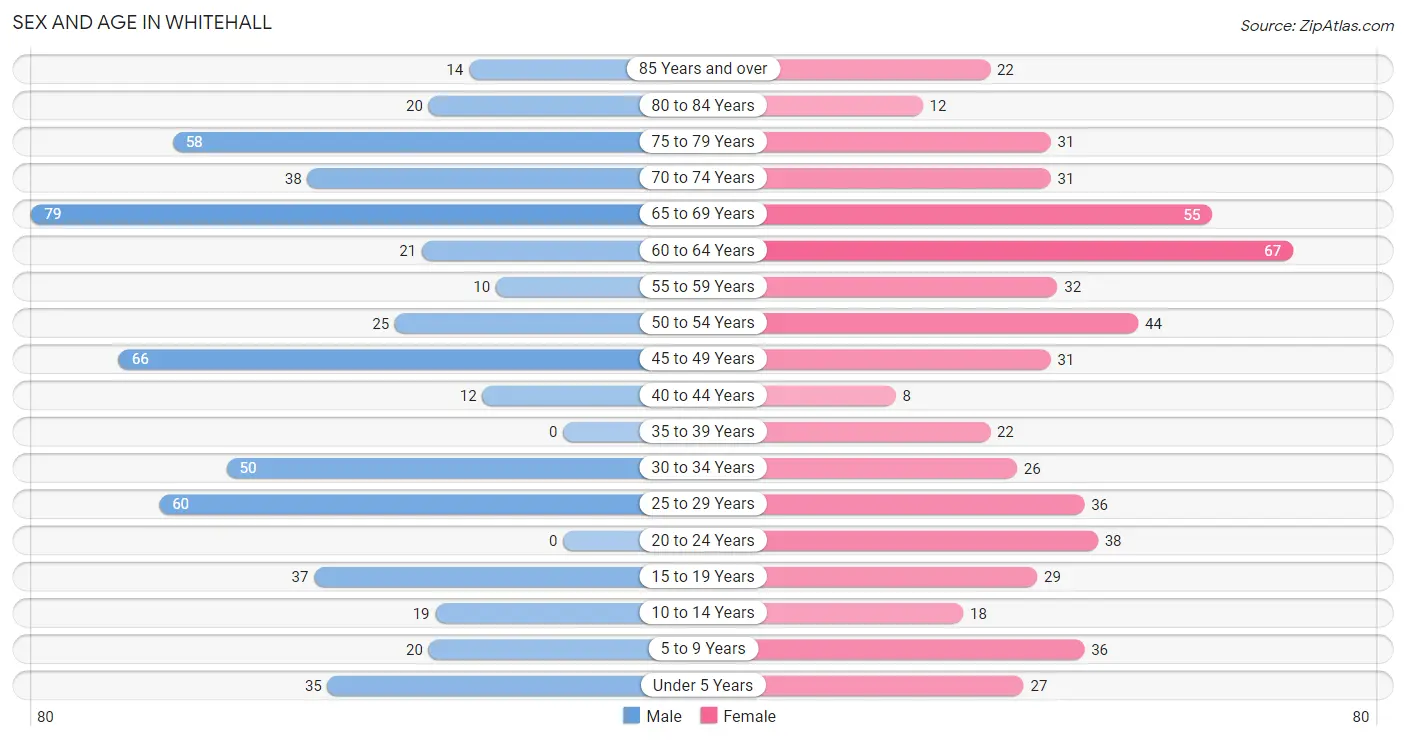
| Age Bracket | Male | Female |
| Under 5 Years | 35 (6.2%) | 27 (4.8%) |
| 5 to 9 Years | 20 (3.5%) | 36 (6.4%) |
| 10 to 14 Years | 19 (3.4%) | 18 (3.2%) |
| 15 to 19 Years | 37 (6.6%) | 29 (5.1%) |
| 20 to 24 Years | 0 (0.0%) | 38 (6.7%) |
| 25 to 29 Years | 60 (10.6%) | 36 (6.4%) |
| 30 to 34 Years | 50 (8.9%) | 26 (4.6%) |
| 35 to 39 Years | 0 (0.0%) | 22 (3.9%) |
| 40 to 44 Years | 12 (2.1%) | 8 (1.4%) |
| 45 to 49 Years | 66 (11.7%) | 31 (5.5%) |
| 50 to 54 Years | 25 (4.4%) | 44 (7.8%) |
| 55 to 59 Years | 10 (1.8%) | 32 (5.7%) |
| 60 to 64 Years | 21 (3.7%) | 67 (11.9%) |
| 65 to 69 Years | 79 (14.0%) | 55 (9.7%) |
| 70 to 74 Years | 38 (6.7%) | 31 (5.5%) |
| 75 to 79 Years | 58 (10.3%) | 31 (5.5%) |
| 80 to 84 Years | 20 (3.5%) | 12 (2.1%) |
| 85 Years and over | 14 (2.5%) | 22 (3.9%) |
| Total | 564 (100.0%) | 565 (100.0%) |
Families and Households in Whitehall
Median Family Size in Whitehall
The median family size in Whitehall is 2.92 persons per family, with single female/mother families (63 | 21.5%) accounting for the largest median family size of 3.89 persons per family. On the other hand, single male/father families (54 | 18.4%) represent the smallest median family size with 2.17 persons per family.
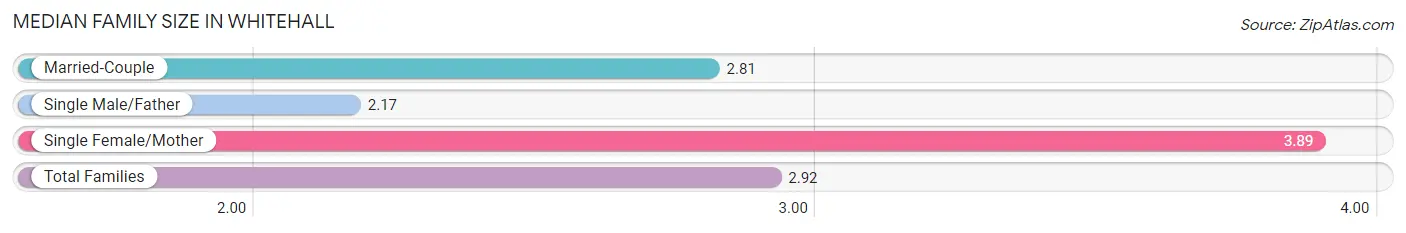
| Family Type | # Families | Family Size |
| Married-Couple | 176 (60.1%) | 2.81 |
| Single Male/Father | 54 (18.4%) | 2.17 |
| Single Female/Mother | 63 (21.5%) | 3.89 |
| Total Families | 293 (100.0%) | 2.92 |
Median Household Size in Whitehall
The median household size in Whitehall is 2.42 persons per household, with single female/mother households (63 | 13.6%) accounting for the largest median household size of 4.14 persons per household. non-family households (170 | 36.7%) represent the smallest median household size with 1.22 persons per household.
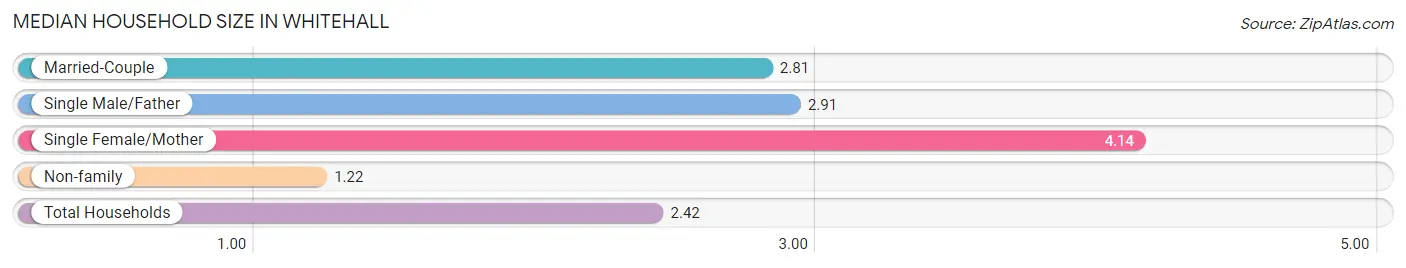
| Household Type | # Households | Household Size |
| Married-Couple | 176 (38.0%) | 2.81 |
| Single Male/Father | 54 (11.7%) | 2.91 |
| Single Female/Mother | 63 (13.6%) | 4.14 |
| Non-family | 170 (36.7%) | 1.22 |
| Total Households | 463 (100.0%) | 2.42 |
Household Size by Marriage Status in Whitehall
Out of a total of 463 households in Whitehall, 293 (63.3%) are family households, while 170 (36.7%) are nonfamily households. The most numerous type of family households are 2-person households, comprising 129, and the most common type of nonfamily households are 1-person households, comprising 156.
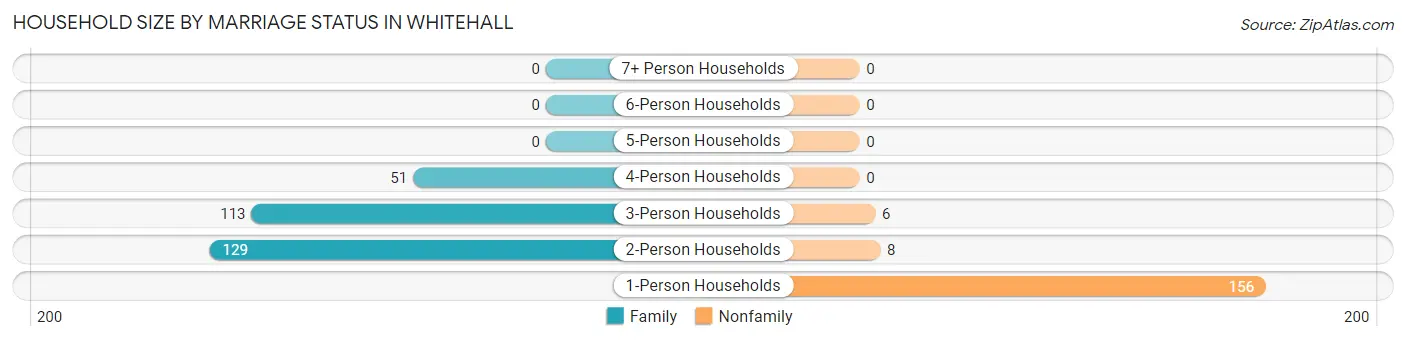
| Household Size | Family Households | Nonfamily Households |
| 1-Person Households | - | 156 (33.7%) |
| 2-Person Households | 129 (27.9%) | 8 (1.7%) |
| 3-Person Households | 113 (24.4%) | 6 (1.3%) |
| 4-Person Households | 51 (11.0%) | 0 (0.0%) |
| 5-Person Households | 0 (0.0%) | 0 (0.0%) |
| 6-Person Households | 0 (0.0%) | 0 (0.0%) |
| 7+ Person Households | 0 (0.0%) | 0 (0.0%) |
| Total | 293 (63.3%) | 170 (36.7%) |
Female Fertility in Whitehall
Fertility by Age in Whitehall
Average fertility rate in Whitehall is 68.0 births per 1,000 women. Women in the age bracket of 20 to 34 years have the highest fertility rate with 140.0 births per 1,000 women. Women in the age bracket of 20 to 34 years acount for 100.0% of all women with births.
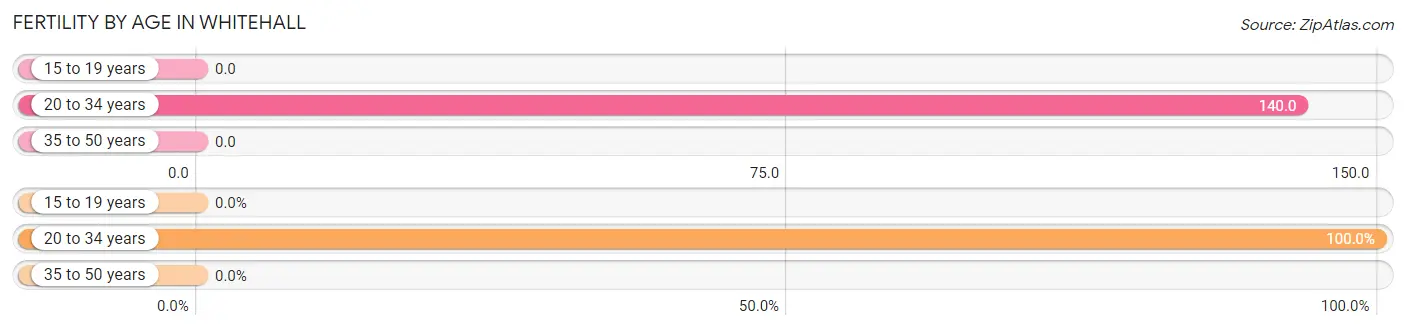
| Age Bracket | Women with Births | Births / 1,000 Women |
| 15 to 19 years | 0 (0.0%) | 0.0 |
| 20 to 34 years | 14 (100.0%) | 140.0 |
| 35 to 50 years | 0 (0.0%) | 0.0 |
| Total | 14 (100.0%) | 68.0 |
Fertility by Age by Marriage Status in Whitehall
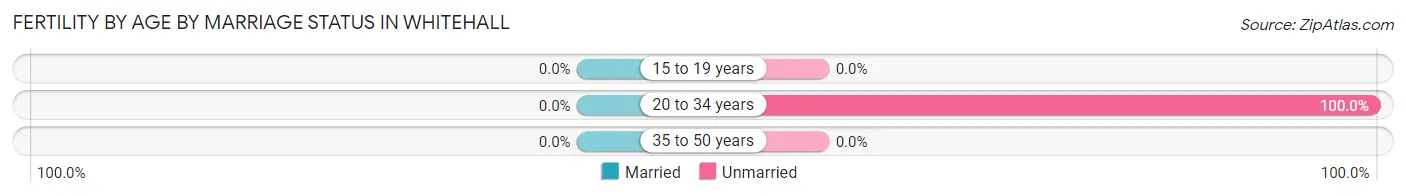
| Age Bracket | Married | Unmarried |
| 15 to 19 years | 0 (0.0%) | 0 (0.0%) |
| 20 to 34 years | 0 (0.0%) | 14 (100.0%) |
| 35 to 50 years | 0 (0.0%) | 0 (0.0%) |
| Total | 0 (0.0%) | 14 (100.0%) |
Fertility by Education in Whitehall
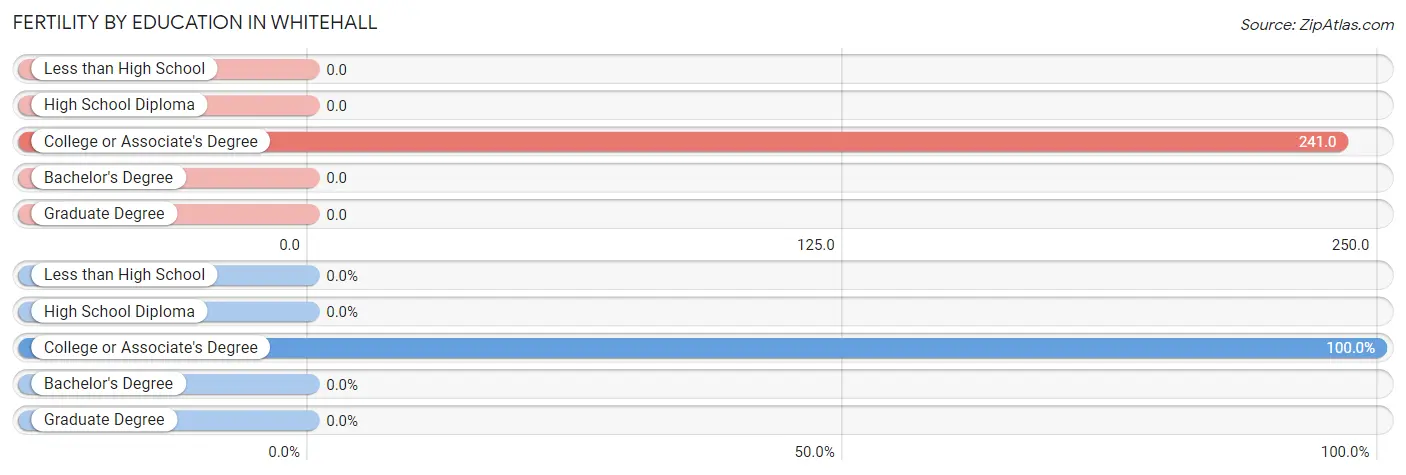
| Educational Attainment | Women with Births | Births / 1,000 Women |
| Less than High School | 0 (0.0%) | 0.0 |
| High School Diploma | 0 (0.0%) | 0.0 |
| College or Associate's Degree | 14 (100.0%) | 241.0 |
| Bachelor's Degree | 0 (0.0%) | 0.0 |
| Graduate Degree | 0 (0.0%) | 0.0 |
| Total | 14 (100.0%) | 68.0 |
Fertility by Education by Marriage Status in Whitehall
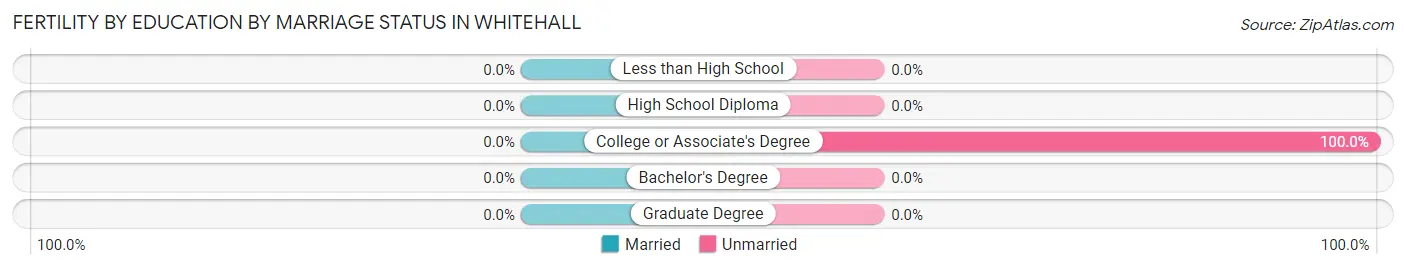
| Educational Attainment | Married | Unmarried |
| Less than High School | 0 (0.0%) | 0 (0.0%) |
| High School Diploma | 0 (0.0%) | 0 (0.0%) |
| College or Associate's Degree | 0 (0.0%) | 14 (100.0%) |
| Bachelor's Degree | 0 (0.0%) | 0 (0.0%) |
| Graduate Degree | 0 (0.0%) | 0 (0.0%) |
| Total | 0 (0.0%) | 14 (100.0%) |
Employment Characteristics in Whitehall
Employment by Class of Employer in Whitehall
Among the 413 employed individuals in Whitehall, private company employees (274 | 66.3%), state government employees (45 | 10.9%), and local government employees (26 | 6.3%) make up the most common classes of employment.
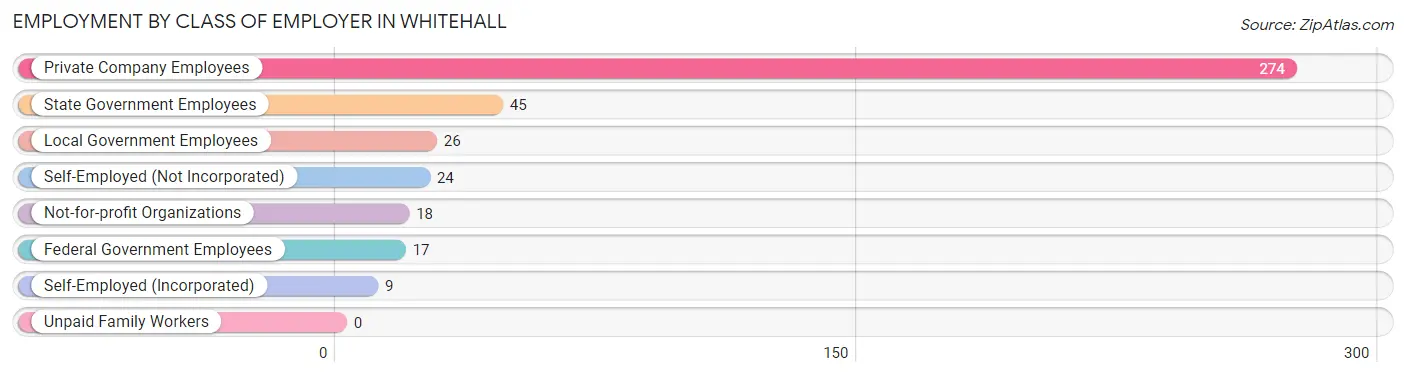
| Employer Class | # Employees | % Employees |
| Private Company Employees | 274 | 66.3% |
| Self-Employed (Incorporated) | 9 | 2.2% |
| Self-Employed (Not Incorporated) | 24 | 5.8% |
| Not-for-profit Organizations | 18 | 4.4% |
| Local Government Employees | 26 | 6.3% |
| State Government Employees | 45 | 10.9% |
| Federal Government Employees | 17 | 4.1% |
| Unpaid Family Workers | 0 | 0.0% |
| Total | 413 | 100.0% |
Employment Status by Age in Whitehall
According to the labor force statistics for Whitehall, out of the total population over 16 years of age (950), 49.2% or 467 individuals are in the labor force, with 9.6% or 45 of them unemployed. The age group with the highest labor force participation rate is 25 to 29 years, with 100.0% or 96 individuals in the labor force. Within the labor force, the 16 to 19 years age range has the highest percentage of unemployed individuals, with 100.0% or 32 of them being unemployed.
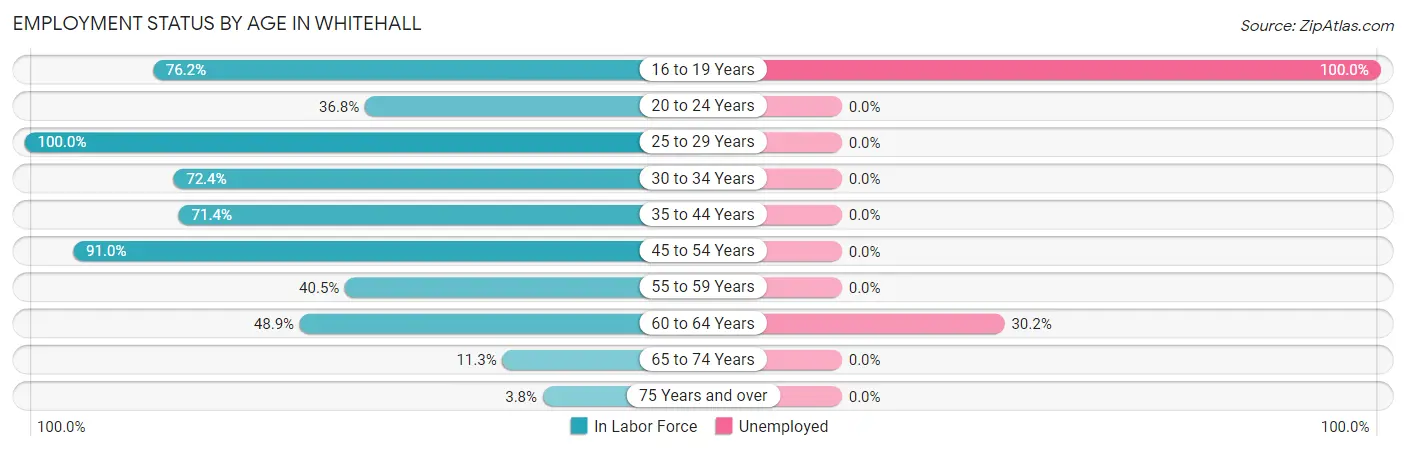
| Age Bracket | In Labor Force | Unemployed |
| 16 to 19 Years | 32 (76.2%) | 32 (100.0%) |
| 20 to 24 Years | 14 (36.8%) | 0 (0.0%) |
| 25 to 29 Years | 96 (100.0%) | 0 (0.0%) |
| 30 to 34 Years | 55 (72.4%) | 0 (0.0%) |
| 35 to 44 Years | 30 (71.4%) | 0 (0.0%) |
| 45 to 54 Years | 151 (91.0%) | 0 (0.0%) |
| 55 to 59 Years | 17 (40.5%) | 0 (0.0%) |
| 60 to 64 Years | 43 (48.9%) | 13 (30.2%) |
| 65 to 74 Years | 23 (11.3%) | 0 (0.0%) |
| 75 Years and over | 6 (3.8%) | 0 (0.0%) |
| Total | 467 (49.2%) | 45 (9.6%) |
Employment Status by Educational Attainment in Whitehall
According to labor force statistics for Whitehall, 76.9% of individuals (392) out of the total population between 25 and 64 years of age (510) are in the labor force, with 3.3% or 13 of them being unemployed. The group with the highest labor force participation rate are those with the educational attainment of bachelor's degree or higher, with 84.7% or 83 individuals in the labor force. Within the labor force, individuals with high school diploma education have the highest percentage of unemployment, with 6.8% or 13 of them being unemployed.
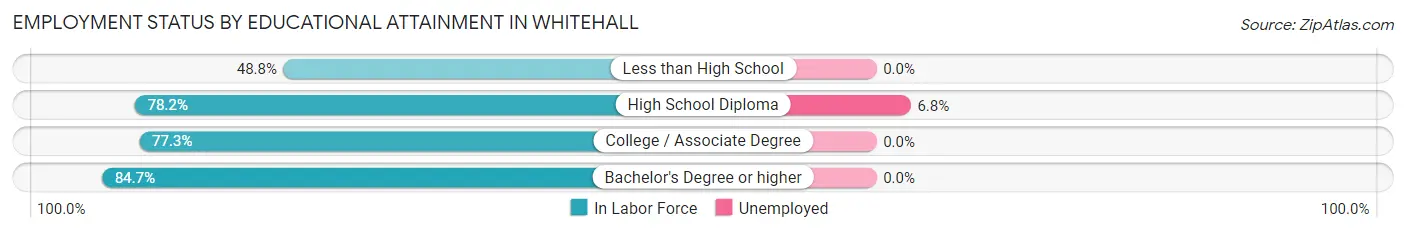
| Educational Attainment | In Labor Force | Unemployed |
| Less than High School | 20 (48.8%) | 0 (0.0%) |
| High School Diploma | 190 (78.2%) | 17 (6.8%) |
| College / Associate Degree | 99 (77.3%) | 0 (0.0%) |
| Bachelor's Degree or higher | 83 (84.7%) | 0 (0.0%) |
| Total | 392 (76.9%) | 17 (3.3%) |
Employment Occupations by Sex in Whitehall
Management, Business, Science and Arts Occupations
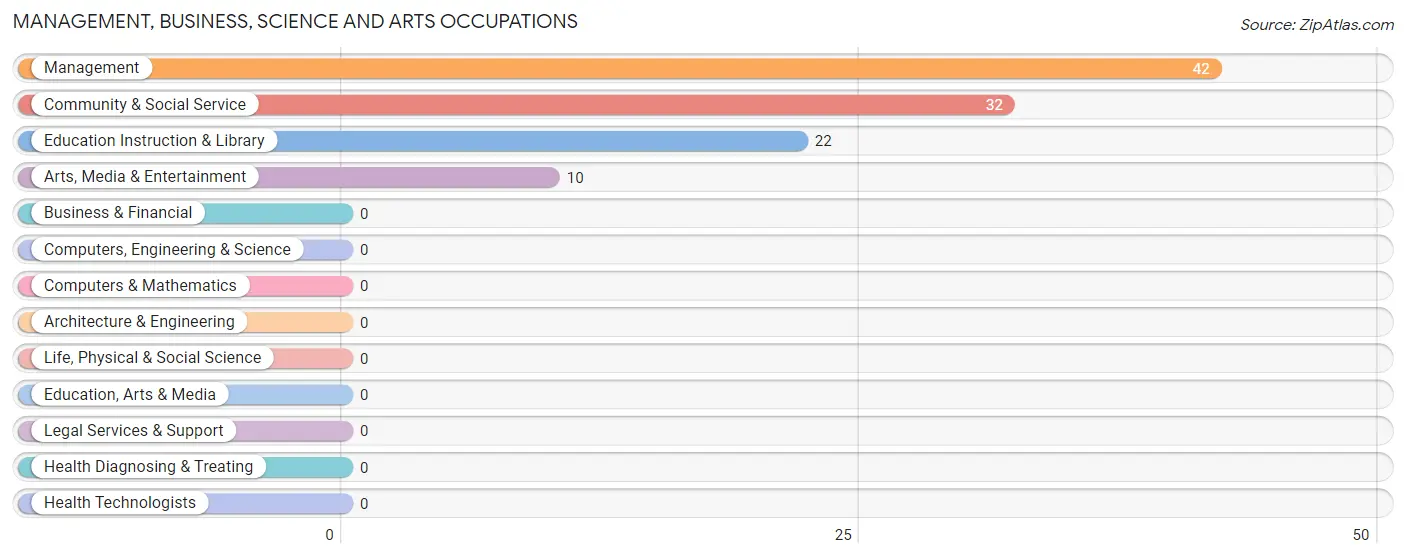
The most common Management, Business, Science and Arts occupations in Whitehall are Management (42 | 10.0%), Community & Social Service (32 | 7.6%), Education Instruction & Library (22 | 5.2%), and Arts, Media & Entertainment (10 | 2.4%).
Management, Business, Science and Arts Occupations by Sex
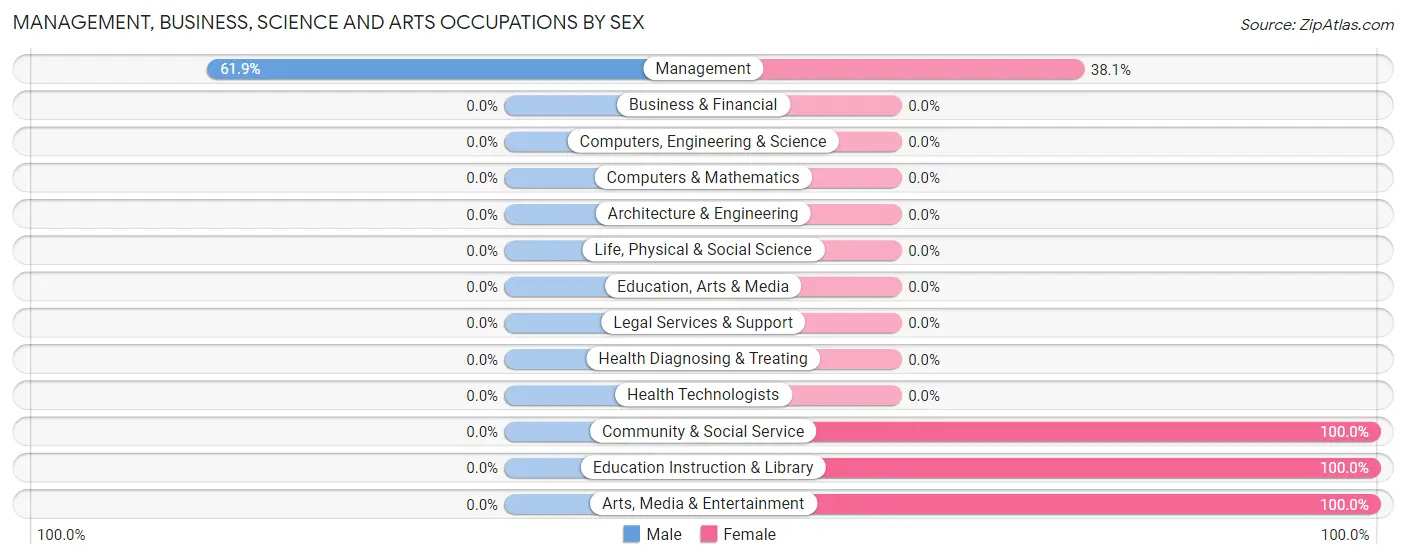
| Occupation | Male | Female |
| Management | 26 (61.9%) | 16 (38.1%) |
| Business & Financial | 0 (0.0%) | 0 (0.0%) |
| Computers, Engineering & Science | 0 (0.0%) | 0 (0.0%) |
| Computers & Mathematics | 0 (0.0%) | 0 (0.0%) |
| Architecture & Engineering | 0 (0.0%) | 0 (0.0%) |
| Life, Physical & Social Science | 0 (0.0%) | 0 (0.0%) |
| Community & Social Service | 0 (0.0%) | 32 (100.0%) |
| Education, Arts & Media | 0 (0.0%) | 0 (0.0%) |
| Legal Services & Support | 0 (0.0%) | 0 (0.0%) |
| Education Instruction & Library | 0 (0.0%) | 22 (100.0%) |
| Arts, Media & Entertainment | 0 (0.0%) | 10 (100.0%) |
| Health Diagnosing & Treating | 0 (0.0%) | 0 (0.0%) |
| Health Technologists | 0 (0.0%) | 0 (0.0%) |
| Total (Category) | 26 (35.1%) | 48 (64.9%) |
| Total (Overall) | 208 (49.3%) | 214 (50.7%) |
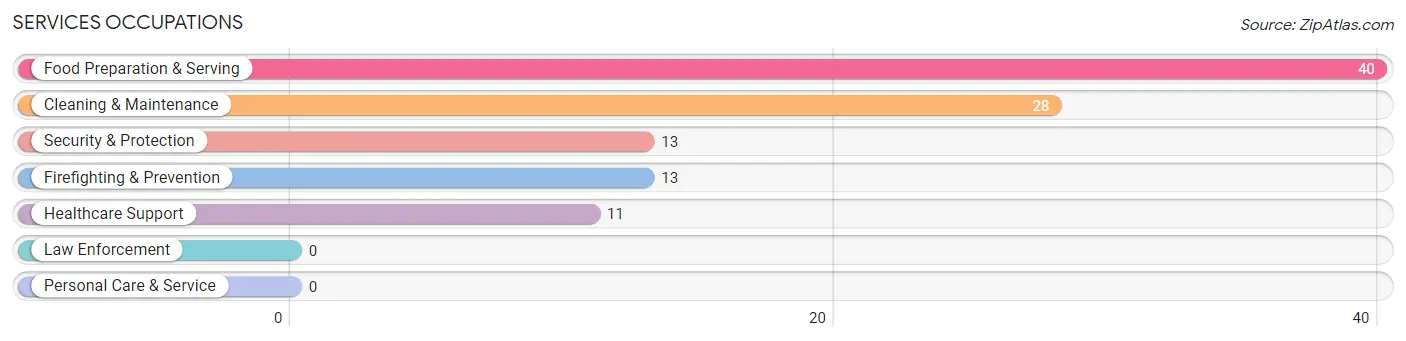
Services Occupations
The most common Services occupations in Whitehall are Food Preparation & Serving (40 | 9.5%), Cleaning & Maintenance (28 | 6.6%), Security & Protection (13 | 3.1%), Firefighting & Prevention (13 | 3.1%), and Healthcare Support (11 | 2.6%).
Services Occupations by Sex
Within the Services occupations in Whitehall, the most male-oriented occupations are Security & Protection (100.0%), Firefighting & Prevention (100.0%), and Cleaning & Maintenance (85.7%), while the most female-oriented occupations are Healthcare Support (100.0%), Food Preparation & Serving (45.0%), and Cleaning & Maintenance (14.3%).
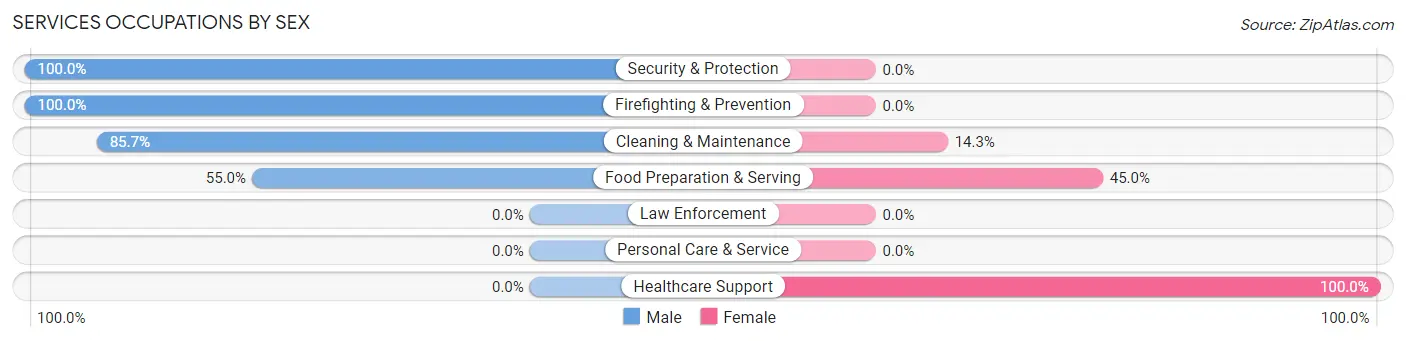
| Occupation | Male | Female |
| Healthcare Support | 0 (0.0%) | 11 (100.0%) |
| Security & Protection | 13 (100.0%) | 0 (0.0%) |
| Firefighting & Prevention | 13 (100.0%) | 0 (0.0%) |
| Law Enforcement | 0 (0.0%) | 0 (0.0%) |
| Food Preparation & Serving | 22 (55.0%) | 18 (45.0%) |
| Cleaning & Maintenance | 24 (85.7%) | 4 (14.3%) |
| Personal Care & Service | 0 (0.0%) | 0 (0.0%) |
| Total (Category) | 59 (64.1%) | 33 (35.9%) |
| Total (Overall) | 208 (49.3%) | 214 (50.7%) |
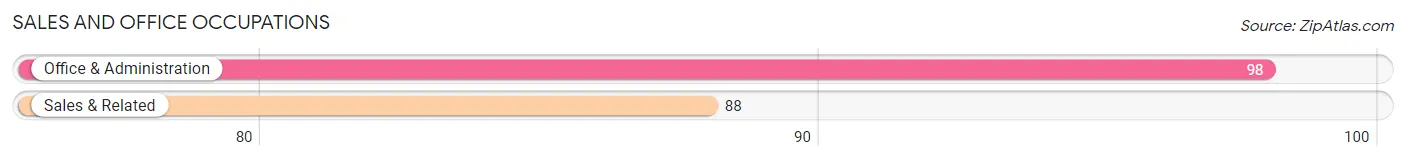
Sales and Office Occupations
The most common Sales and Office occupations in Whitehall are Office & Administration (98 | 23.2%), and Sales & Related (88 | 20.8%).
Sales and Office Occupations by Sex
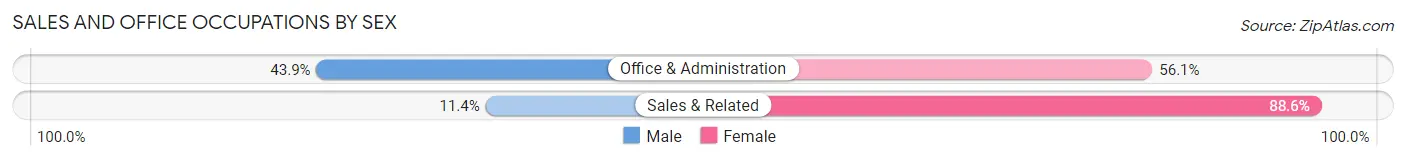
| Occupation | Male | Female |
| Sales & Related | 10 (11.4%) | 78 (88.6%) |
| Office & Administration | 43 (43.9%) | 55 (56.1%) |
| Total (Category) | 53 (28.5%) | 133 (71.5%) |
| Total (Overall) | 208 (49.3%) | 214 (50.7%) |
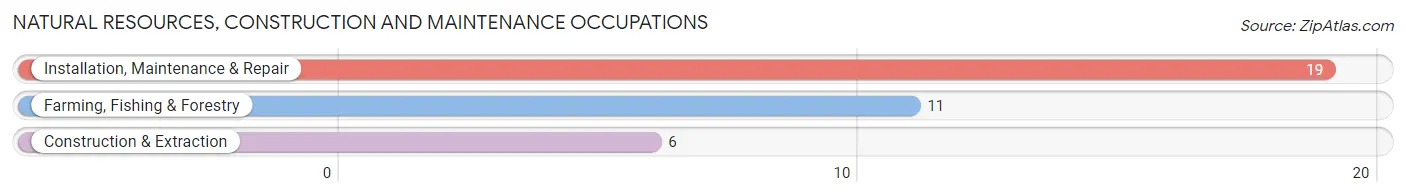
Natural Resources, Construction and Maintenance Occupations
The most common Natural Resources, Construction and Maintenance occupations in Whitehall are Installation, Maintenance & Repair (19 | 4.5%), Farming, Fishing & Forestry (11 | 2.6%), and Construction & Extraction (6 | 1.4%).
Natural Resources, Construction and Maintenance Occupations by Sex
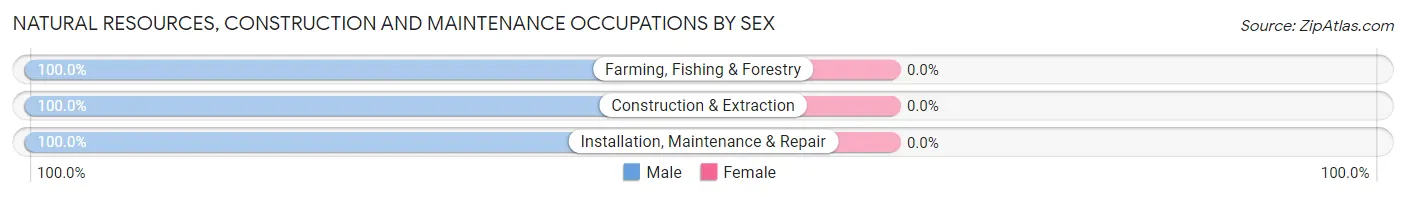
| Occupation | Male | Female |
| Farming, Fishing & Forestry | 11 (100.0%) | 0 (0.0%) |
| Construction & Extraction | 6 (100.0%) | 0 (0.0%) |
| Installation, Maintenance & Repair | 19 (100.0%) | 0 (0.0%) |
| Total (Category) | 36 (100.0%) | 0 (0.0%) |
| Total (Overall) | 208 (49.3%) | 214 (50.7%) |
Production, Transportation and Moving Occupations
The most common Production, Transportation and Moving occupations in Whitehall are Production (25 | 5.9%), and Transportation (9 | 2.1%).
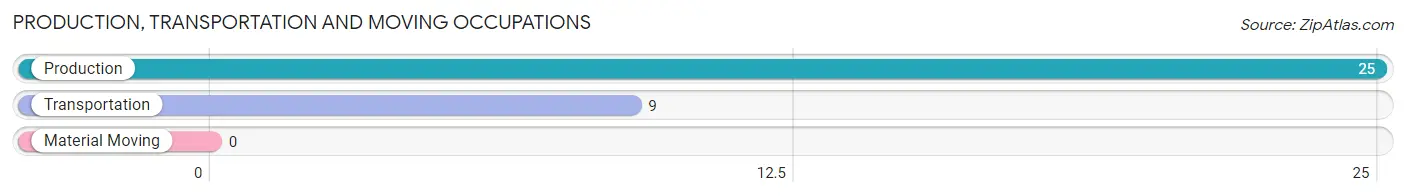
Production, Transportation and Moving Occupations by Sex
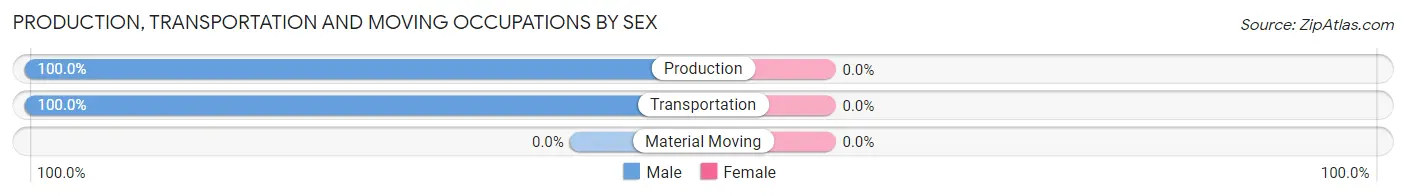
| Occupation | Male | Female |
| Production | 25 (100.0%) | 0 (0.0%) |
| Transportation | 9 (100.0%) | 0 (0.0%) |
| Material Moving | 0 (0.0%) | 0 (0.0%) |
| Total (Category) | 34 (100.0%) | 0 (0.0%) |
| Total (Overall) | 208 (49.3%) | 214 (50.7%) |
Employment Industries by Sex in Whitehall
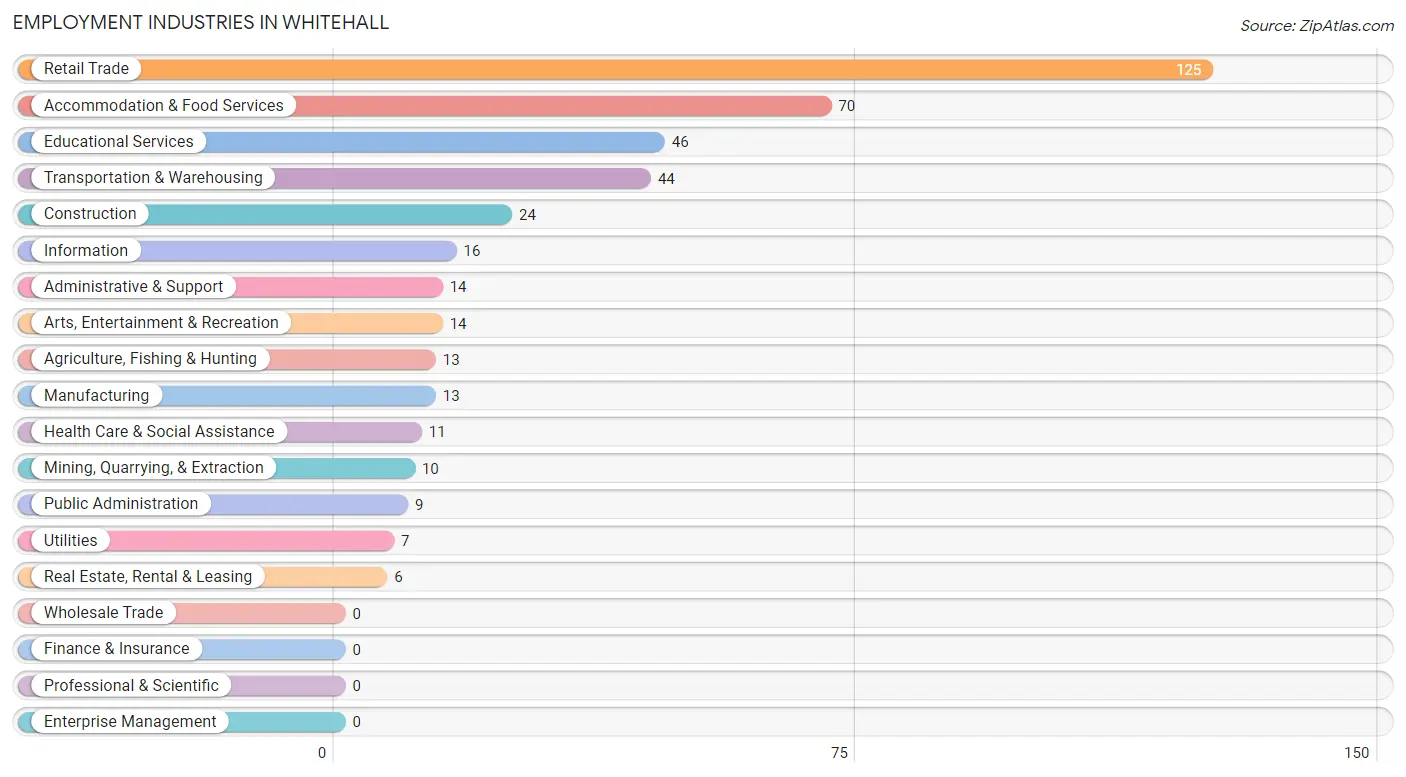
Employment Industries in Whitehall
The major employment industries in Whitehall include Retail Trade (125 | 29.6%), Accommodation & Food Services (70 | 16.6%), Educational Services (46 | 10.9%), Transportation & Warehousing (44 | 10.4%), and Construction (24 | 5.7%).
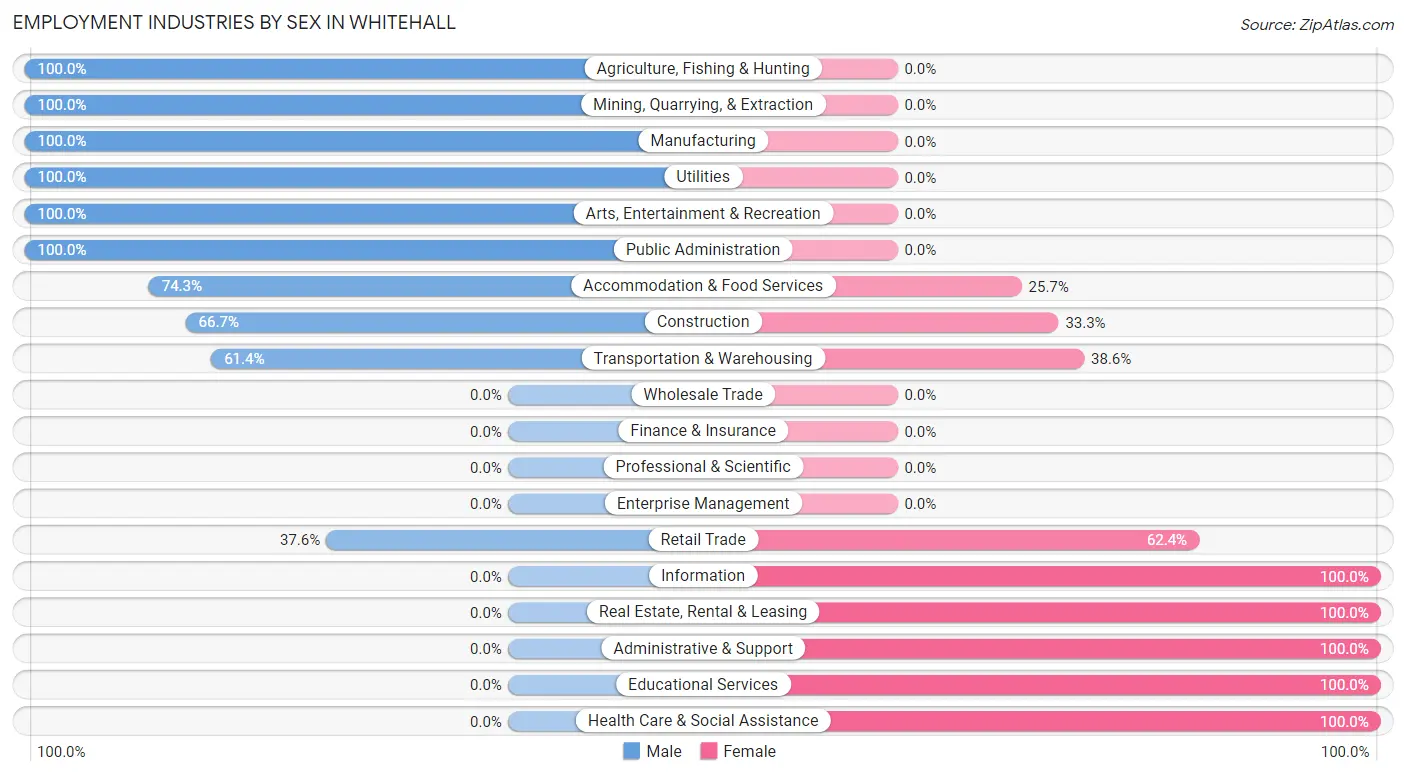
Employment Industries by Sex in Whitehall
The Whitehall industries that see more men than women are Agriculture, Fishing & Hunting (100.0%), Mining, Quarrying, & Extraction (100.0%), and Manufacturing (100.0%), whereas the industries that tend to have a higher number of women are Information (100.0%), Real Estate, Rental & Leasing (100.0%), and Administrative & Support (100.0%).
| Industry | Male | Female |
| Agriculture, Fishing & Hunting | 13 (100.0%) | 0 (0.0%) |
| Mining, Quarrying, & Extraction | 10 (100.0%) | 0 (0.0%) |
| Construction | 16 (66.7%) | 8 (33.3%) |
| Manufacturing | 13 (100.0%) | 0 (0.0%) |
| Wholesale Trade | 0 (0.0%) | 0 (0.0%) |
| Retail Trade | 47 (37.6%) | 78 (62.4%) |
| Transportation & Warehousing | 27 (61.4%) | 17 (38.6%) |
| Utilities | 7 (100.0%) | 0 (0.0%) |
| Information | 0 (0.0%) | 16 (100.0%) |
| Finance & Insurance | 0 (0.0%) | 0 (0.0%) |
| Real Estate, Rental & Leasing | 0 (0.0%) | 6 (100.0%) |
| Professional & Scientific | 0 (0.0%) | 0 (0.0%) |
| Enterprise Management | 0 (0.0%) | 0 (0.0%) |
| Administrative & Support | 0 (0.0%) | 14 (100.0%) |
| Educational Services | 0 (0.0%) | 46 (100.0%) |
| Health Care & Social Assistance | 0 (0.0%) | 11 (100.0%) |
| Arts, Entertainment & Recreation | 14 (100.0%) | 0 (0.0%) |
| Accommodation & Food Services | 52 (74.3%) | 18 (25.7%) |
| Public Administration | 9 (100.0%) | 0 (0.0%) |
| Total | 208 (49.3%) | 214 (50.7%) |
Education in Whitehall
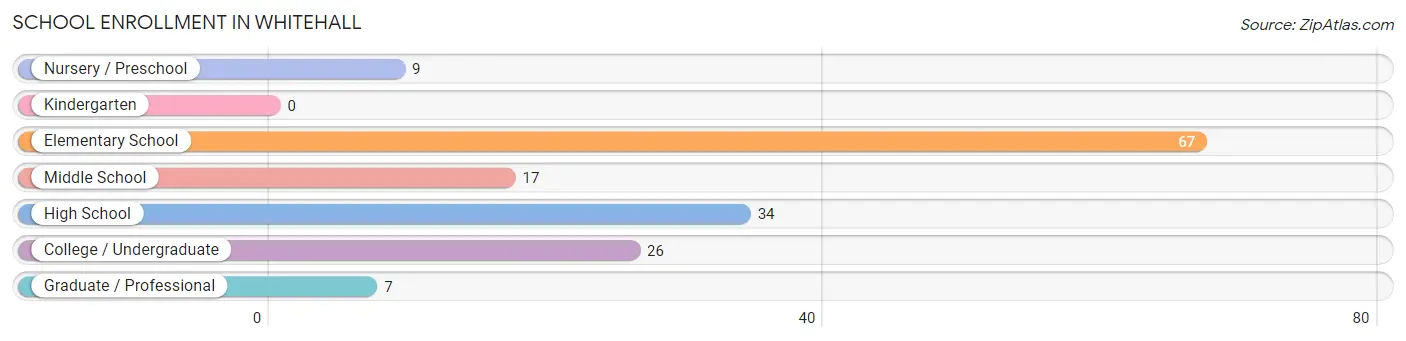
School Enrollment in Whitehall
The most common levels of schooling among the 160 students in Whitehall are elementary school (67 | 41.9%), high school (34 | 21.2%), and college / undergraduate (26 | 16.3%).
| School Level | # Students | % Students |
| Nursery / Preschool | 9 | 5.6% |
| Kindergarten | 0 | 0.0% |
| Elementary School | 67 | 41.9% |
| Middle School | 17 | 10.6% |
| High School | 34 | 21.2% |
| College / Undergraduate | 26 | 16.3% |
| Graduate / Professional | 7 | 4.4% |
| Total | 160 | 100.0% |
School Enrollment by Age by Funding Source in Whitehall
Out of a total of 160 students who are enrolled in schools in Whitehall, 24 (15.0%) attend a private institution, while the remaining 136 (85.0%) are enrolled in public schools. The age group of 5 to 9 year old has the highest likelihood of being enrolled in private schools, with 24 (42.9% in the age bracket) enrolled. Conversely, the age group of 10 to 14 year olds has the lowest likelihood of being enrolled in a private school, with 37 (100.0% in the age bracket) attending a public institution.
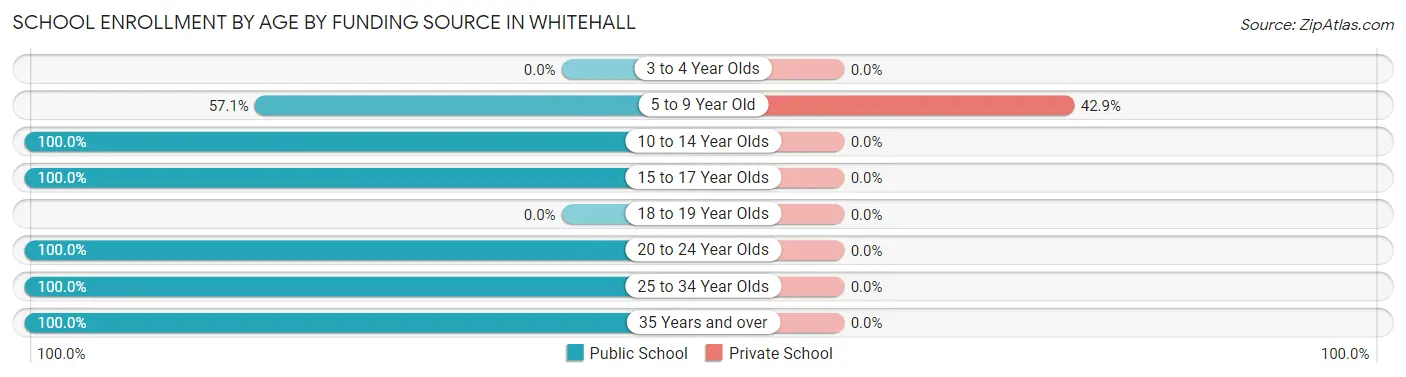
| Age Bracket | Public School | Private School |
| 3 to 4 Year Olds | 0 (0.0%) | 0 (0.0%) |
| 5 to 9 Year Old | 32 (57.1%) | 24 (42.9%) |
| 10 to 14 Year Olds | 37 (100.0%) | 0 (0.0%) |
| 15 to 17 Year Olds | 34 (100.0%) | 0 (0.0%) |
| 18 to 19 Year Olds | 0 (0.0%) | 0 (0.0%) |
| 20 to 24 Year Olds | 14 (100.0%) | 0 (0.0%) |
| 25 to 34 Year Olds | 7 (100.0%) | 0 (0.0%) |
| 35 Years and over | 12 (100.0%) | 0 (0.0%) |
| Total | 136 (85.0%) | 24 (15.0%) |
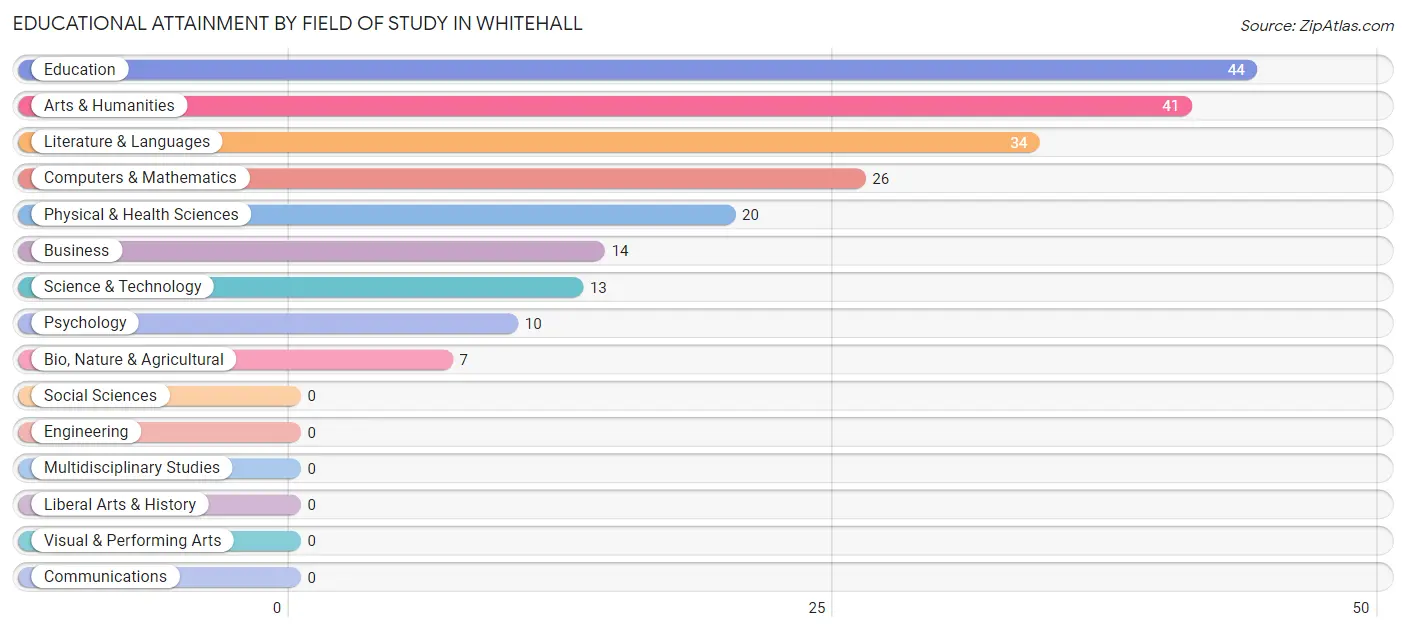
Educational Attainment by Field of Study in Whitehall
Education (44 | 21.0%), arts & humanities (41 | 19.6%), literature & languages (34 | 16.3%), computers & mathematics (26 | 12.4%), and physical & health sciences (20 | 9.6%) are the most common fields of study among 209 individuals in Whitehall who have obtained a bachelor's degree or higher.
| Field of Study | # Graduates | % Graduates |
| Computers & Mathematics | 26 | 12.4% |
| Bio, Nature & Agricultural | 7 | 3.4% |
| Physical & Health Sciences | 20 | 9.6% |
| Psychology | 10 | 4.8% |
| Social Sciences | 0 | 0.0% |
| Engineering | 0 | 0.0% |
| Multidisciplinary Studies | 0 | 0.0% |
| Science & Technology | 13 | 6.2% |
| Business | 14 | 6.7% |
| Education | 44 | 21.0% |
| Literature & Languages | 34 | 16.3% |
| Liberal Arts & History | 0 | 0.0% |
| Visual & Performing Arts | 0 | 0.0% |
| Communications | 0 | 0.0% |
| Arts & Humanities | 41 | 19.6% |
| Total | 209 | 100.0% |
Transportation & Commute in Whitehall
Vehicle Availability by Sex in Whitehall
The most prevalent vehicle ownership categories in Whitehall are males with 2 vehicles (85, accounting for 42.7%) and females with 2 vehicles (105, making up 39.7%).
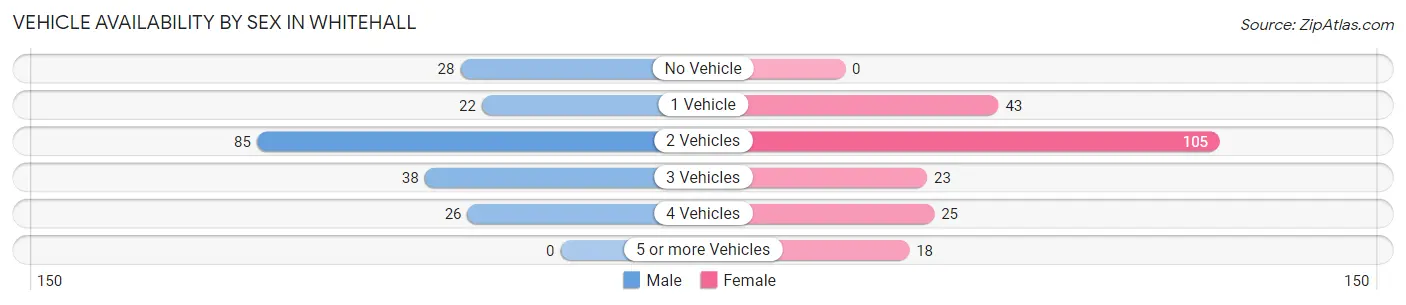
| Vehicles Available | Male | Female |
| No Vehicle | 28 (14.1%) | 0 (0.0%) |
| 1 Vehicle | 22 (11.1%) | 43 (20.1%) |
| 2 Vehicles | 85 (42.7%) | 105 (49.1%) |
| 3 Vehicles | 38 (19.1%) | 23 (10.7%) |
| 4 Vehicles | 26 (13.1%) | 25 (11.7%) |
| 5 or more Vehicles | 0 (0.0%) | 18 (8.4%) |
| Total | 199 (100.0%) | 214 (100.0%) |
Commute Time in Whitehall
The most frequently occuring commute durations in Whitehall are less than 5 minutes (114 commuters, 29.5%), 5 to 9 minutes (63 commuters, 16.3%), and 60 to 89 minutes (39 commuters, 10.1%).
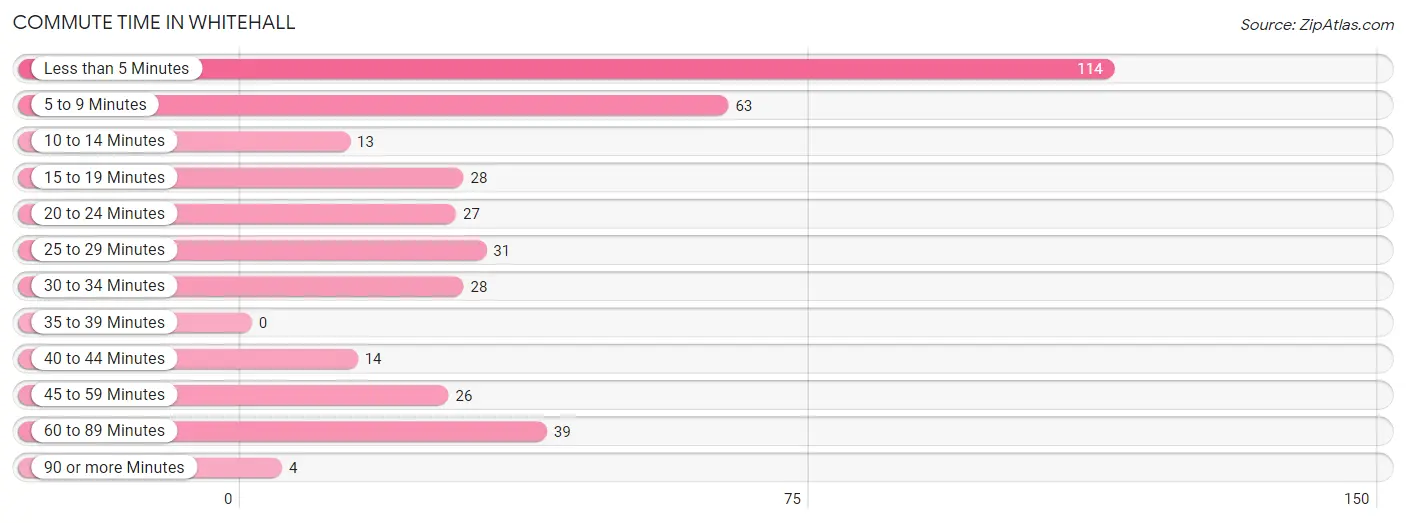
| Commute Time | # Commuters | % Commuters |
| Less than 5 Minutes | 114 | 29.5% |
| 5 to 9 Minutes | 63 | 16.3% |
| 10 to 14 Minutes | 13 | 3.4% |
| 15 to 19 Minutes | 28 | 7.2% |
| 20 to 24 Minutes | 27 | 7.0% |
| 25 to 29 Minutes | 31 | 8.0% |
| 30 to 34 Minutes | 28 | 7.2% |
| 35 to 39 Minutes | 0 | 0.0% |
| 40 to 44 Minutes | 14 | 3.6% |
| 45 to 59 Minutes | 26 | 6.7% |
| 60 to 89 Minutes | 39 | 10.1% |
| 90 or more Minutes | 4 | 1.0% |
Commute Time by Sex in Whitehall
The most common commute times in Whitehall are 5 to 9 minutes (33 commuters, 17.4%) for males and less than 5 minutes (98 commuters, 49.7%) for females.
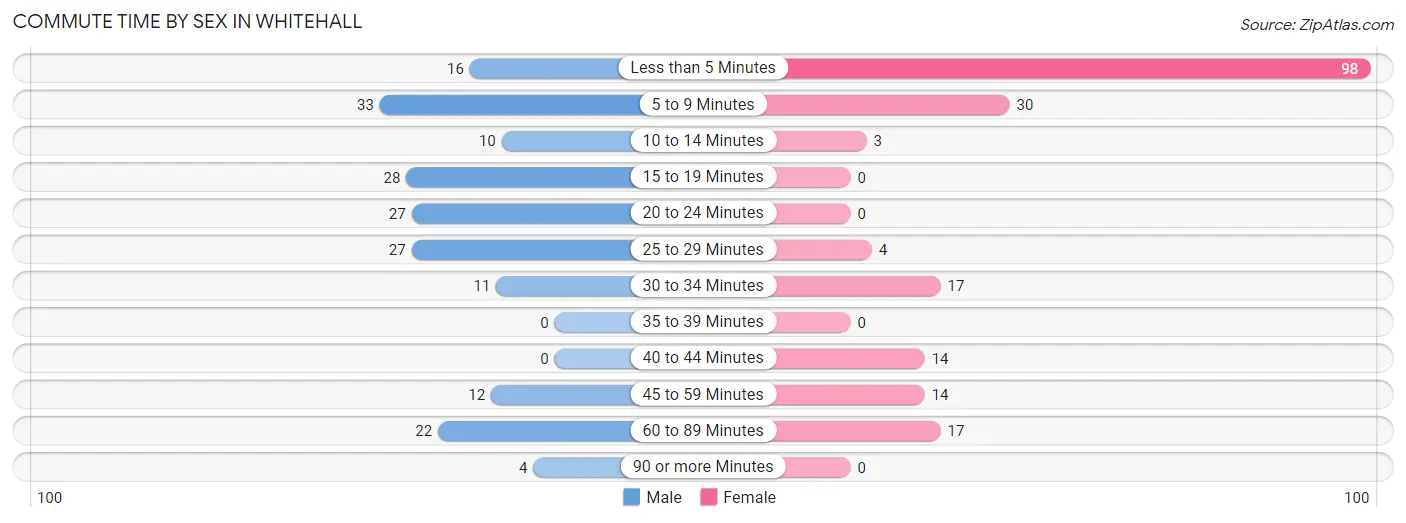
| Commute Time | Male | Female |
| Less than 5 Minutes | 16 (8.4%) | 98 (49.7%) |
| 5 to 9 Minutes | 33 (17.4%) | 30 (15.2%) |
| 10 to 14 Minutes | 10 (5.3%) | 3 (1.5%) |
| 15 to 19 Minutes | 28 (14.7%) | 0 (0.0%) |
| 20 to 24 Minutes | 27 (14.2%) | 0 (0.0%) |
| 25 to 29 Minutes | 27 (14.2%) | 4 (2.0%) |
| 30 to 34 Minutes | 11 (5.8%) | 17 (8.6%) |
| 35 to 39 Minutes | 0 (0.0%) | 0 (0.0%) |
| 40 to 44 Minutes | 0 (0.0%) | 14 (7.1%) |
| 45 to 59 Minutes | 12 (6.3%) | 14 (7.1%) |
| 60 to 89 Minutes | 22 (11.6%) | 17 (8.6%) |
| 90 or more Minutes | 4 (2.1%) | 0 (0.0%) |
Time of Departure to Work by Sex in Whitehall
The most frequent times of departure to work in Whitehall are 8:00 AM to 8:29 AM (44, 23.2%) for males and 7:30 AM to 7:59 AM (47, 23.9%) for females.
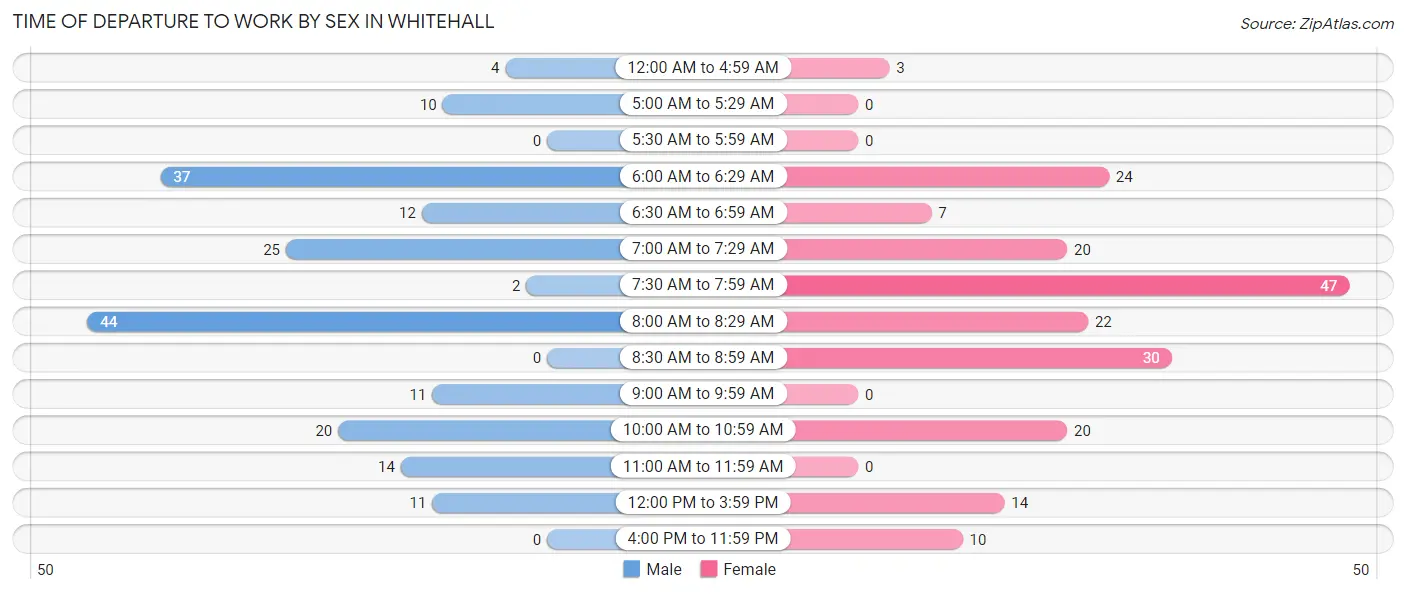
| Time of Departure | Male | Female |
| 12:00 AM to 4:59 AM | 4 (2.1%) | 3 (1.5%) |
| 5:00 AM to 5:29 AM | 10 (5.3%) | 0 (0.0%) |
| 5:30 AM to 5:59 AM | 0 (0.0%) | 0 (0.0%) |
| 6:00 AM to 6:29 AM | 37 (19.5%) | 24 (12.2%) |
| 6:30 AM to 6:59 AM | 12 (6.3%) | 7 (3.5%) |
| 7:00 AM to 7:29 AM | 25 (13.2%) | 20 (10.2%) |
| 7:30 AM to 7:59 AM | 2 (1.1%) | 47 (23.9%) |
| 8:00 AM to 8:29 AM | 44 (23.2%) | 22 (11.2%) |
| 8:30 AM to 8:59 AM | 0 (0.0%) | 30 (15.2%) |
| 9:00 AM to 9:59 AM | 11 (5.8%) | 0 (0.0%) |
| 10:00 AM to 10:59 AM | 20 (10.5%) | 20 (10.2%) |
| 11:00 AM to 11:59 AM | 14 (7.4%) | 0 (0.0%) |
| 12:00 PM to 3:59 PM | 11 (5.8%) | 14 (7.1%) |
| 4:00 PM to 11:59 PM | 0 (0.0%) | 10 (5.1%) |
| Total | 190 (100.0%) | 197 (100.0%) |
Housing Occupancy in Whitehall
Occupancy by Ownership in Whitehall
Of the total 463 dwellings in Whitehall, owner-occupied units account for 303 (65.4%), while renter-occupied units make up 160 (34.6%).
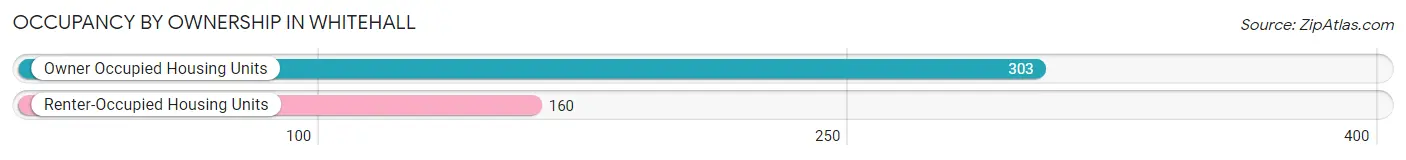
| Occupancy | # Housing Units | % Housing Units |
| Owner Occupied Housing Units | 303 | 65.4% |
| Renter-Occupied Housing Units | 160 | 34.6% |
| Total Occupied Housing Units | 463 | 100.0% |
Occupancy by Household Size in Whitehall
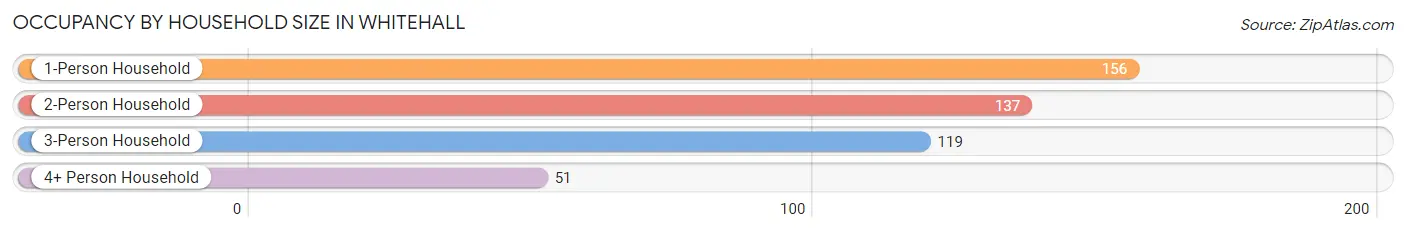
| Household Size | # Housing Units | % Housing Units |
| 1-Person Household | 156 | 33.7% |
| 2-Person Household | 137 | 29.6% |
| 3-Person Household | 119 | 25.7% |
| 4+ Person Household | 51 | 11.0% |
| Total Housing Units | 463 | 100.0% |
Occupancy by Ownership by Household Size in Whitehall
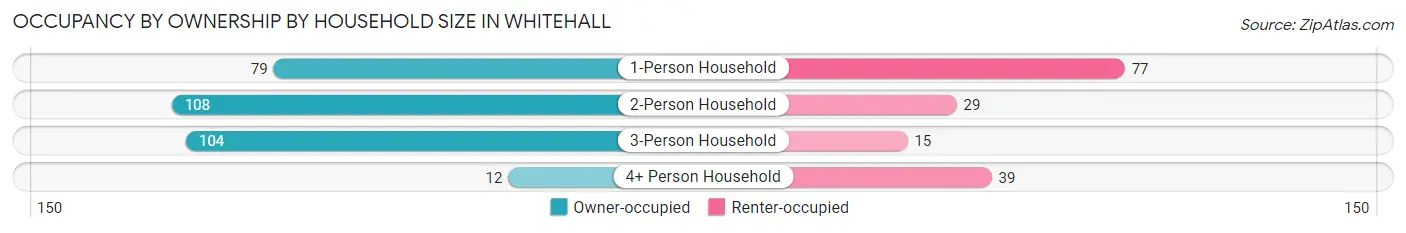
| Household Size | Owner-occupied | Renter-occupied |
| 1-Person Household | 79 (50.6%) | 77 (49.4%) |
| 2-Person Household | 108 (78.8%) | 29 (21.2%) |
| 3-Person Household | 104 (87.4%) | 15 (12.6%) |
| 4+ Person Household | 12 (23.5%) | 39 (76.5%) |
| Total Housing Units | 303 (65.4%) | 160 (34.6%) |
Occupancy by Educational Attainment in Whitehall
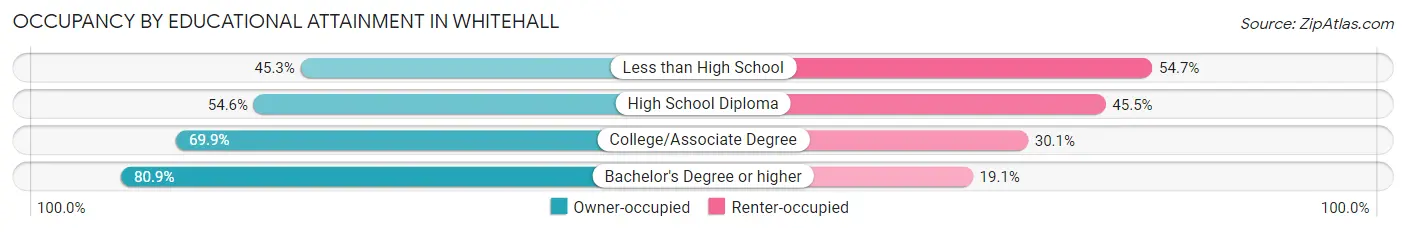
| Household Size | Owner-occupied | Renter-occupied |
| Less than High School | 24 (45.3%) | 29 (54.7%) |
| High School Diploma | 72 (54.5%) | 60 (45.5%) |
| College/Associate Degree | 114 (69.9%) | 49 (30.1%) |
| Bachelor's Degree or higher | 93 (80.9%) | 22 (19.1%) |
Occupancy by Age of Householder in Whitehall
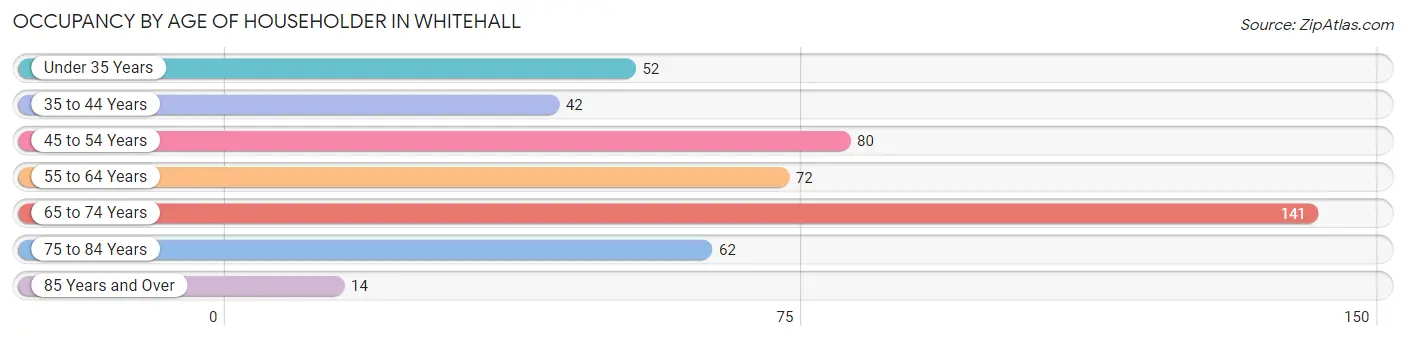
| Age Bracket | # Households | % Households |
| Under 35 Years | 52 | 11.2% |
| 35 to 44 Years | 42 | 9.1% |
| 45 to 54 Years | 80 | 17.3% |
| 55 to 64 Years | 72 | 15.5% |
| 65 to 74 Years | 141 | 30.4% |
| 75 to 84 Years | 62 | 13.4% |
| 85 Years and Over | 14 | 3.0% |
| Total | 463 | 100.0% |
Housing Finances in Whitehall
Median Income by Occupancy in Whitehall
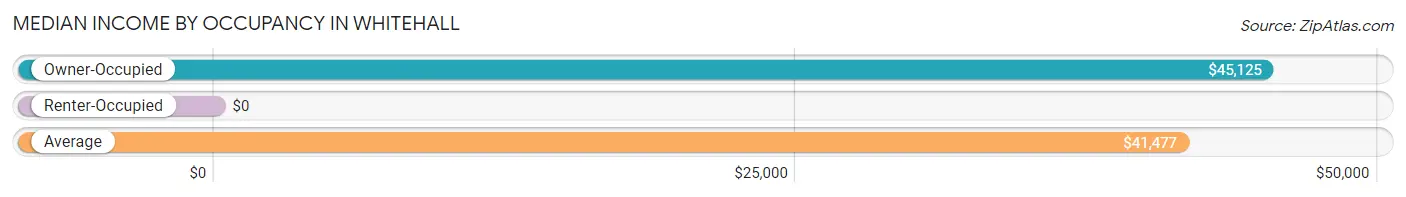
| Occupancy Type | # Households | Median Income |
| Owner-Occupied | 303 (65.4%) | $45,125 |
| Renter-Occupied | 160 (34.6%) | $0 |
| Average | 463 (100.0%) | $41,477 |
Occupancy by Householder Income Bracket in Whitehall
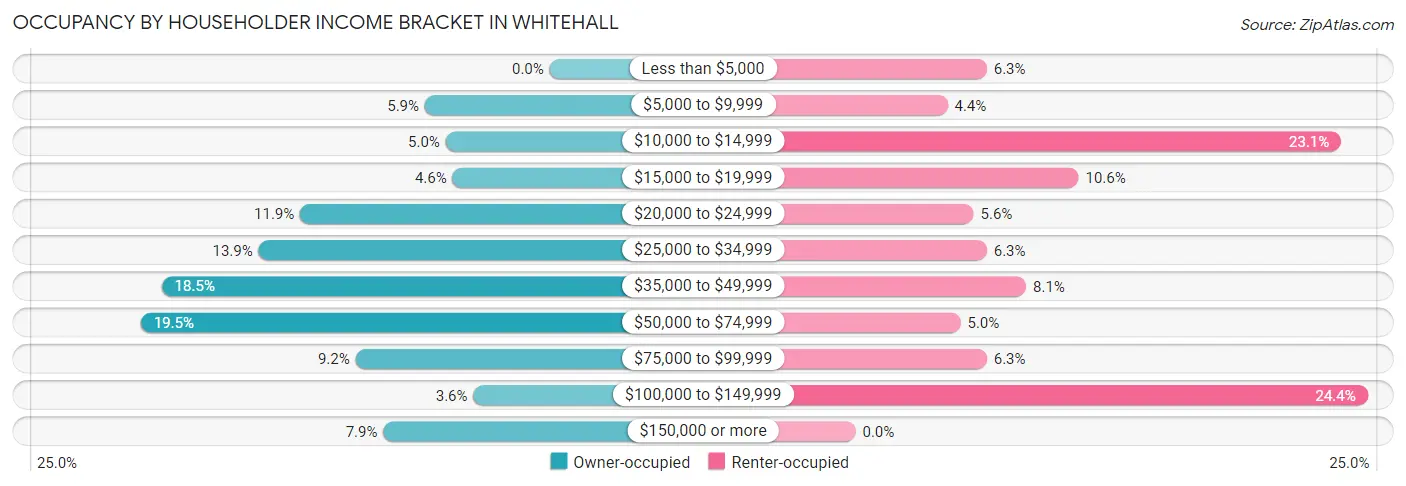
| Income Bracket | Owner-occupied | Renter-occupied |
| Less than $5,000 | 0 (0.0%) | 10 (6.2%) |
| $5,000 to $9,999 | 18 (5.9%) | 7 (4.4%) |
| $10,000 to $14,999 | 15 (5.0%) | 37 (23.1%) |
| $15,000 to $19,999 | 14 (4.6%) | 17 (10.6%) |
| $20,000 to $24,999 | 36 (11.9%) | 9 (5.6%) |
| $25,000 to $34,999 | 42 (13.9%) | 10 (6.2%) |
| $35,000 to $49,999 | 56 (18.5%) | 13 (8.1%) |
| $50,000 to $74,999 | 59 (19.5%) | 8 (5.0%) |
| $75,000 to $99,999 | 28 (9.2%) | 10 (6.2%) |
| $100,000 to $149,999 | 11 (3.6%) | 39 (24.4%) |
| $150,000 or more | 24 (7.9%) | 0 (0.0%) |
| Total | 303 (100.0%) | 160 (100.0%) |
Monthly Housing Cost Tiers in Whitehall
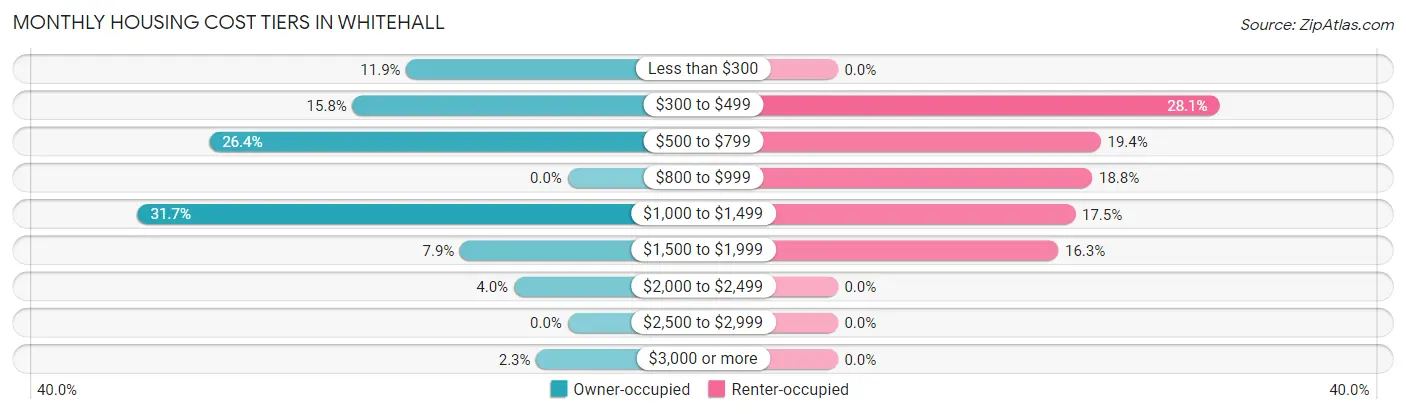
| Monthly Cost | Owner-occupied | Renter-occupied |
| Less than $300 | 36 (11.9%) | 0 (0.0%) |
| $300 to $499 | 48 (15.8%) | 45 (28.1%) |
| $500 to $799 | 80 (26.4%) | 31 (19.4%) |
| $800 to $999 | 0 (0.0%) | 30 (18.8%) |
| $1,000 to $1,499 | 96 (31.7%) | 28 (17.5%) |
| $1,500 to $1,999 | 24 (7.9%) | 26 (16.3%) |
| $2,000 to $2,499 | 12 (4.0%) | 0 (0.0%) |
| $2,500 to $2,999 | 0 (0.0%) | 0 (0.0%) |
| $3,000 or more | 7 (2.3%) | 0 (0.0%) |
| Total | 303 (100.0%) | 160 (100.0%) |
Physical Housing Characteristics in Whitehall
Housing Structures in Whitehall
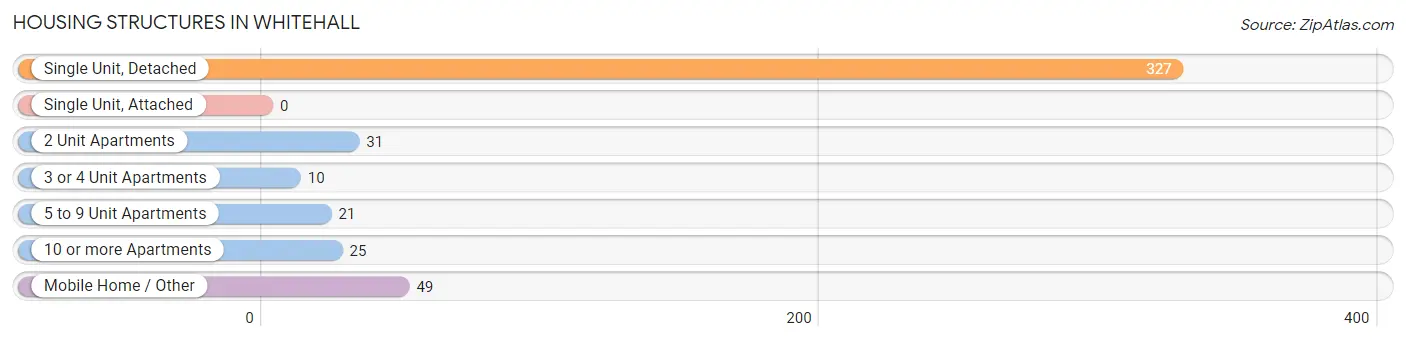
| Structure Type | # Housing Units | % Housing Units |
| Single Unit, Detached | 327 | 70.6% |
| Single Unit, Attached | 0 | 0.0% |
| 2 Unit Apartments | 31 | 6.7% |
| 3 or 4 Unit Apartments | 10 | 2.2% |
| 5 to 9 Unit Apartments | 21 | 4.5% |
| 10 or more Apartments | 25 | 5.4% |
| Mobile Home / Other | 49 | 10.6% |
| Total | 463 | 100.0% |
Housing Structures by Occupancy in Whitehall
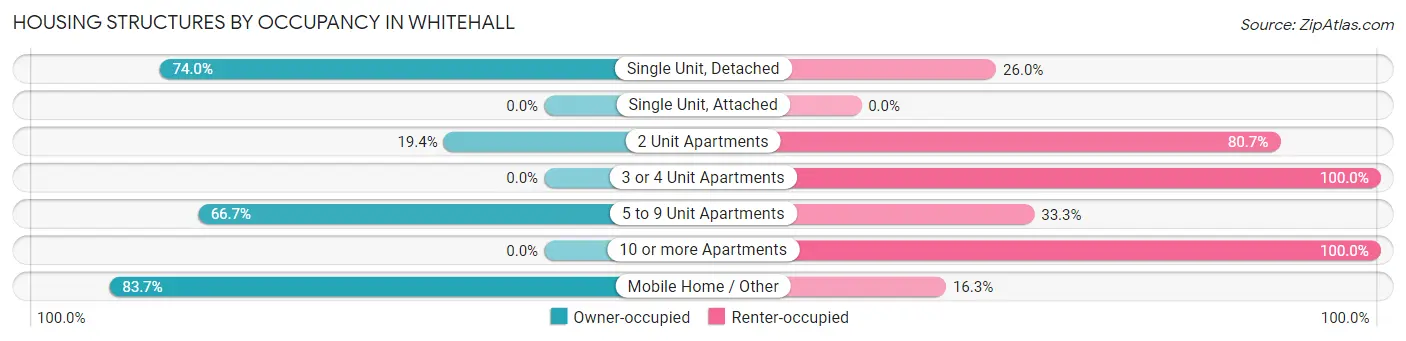
| Structure Type | Owner-occupied | Renter-occupied |
| Single Unit, Detached | 242 (74.0%) | 85 (26.0%) |
| Single Unit, Attached | 0 (0.0%) | 0 (0.0%) |
| 2 Unit Apartments | 6 (19.4%) | 25 (80.6%) |
| 3 or 4 Unit Apartments | 0 (0.0%) | 10 (100.0%) |
| 5 to 9 Unit Apartments | 14 (66.7%) | 7 (33.3%) |
| 10 or more Apartments | 0 (0.0%) | 25 (100.0%) |
| Mobile Home / Other | 41 (83.7%) | 8 (16.3%) |
| Total | 303 (65.4%) | 160 (34.6%) |
Housing Structures by Number of Rooms in Whitehall
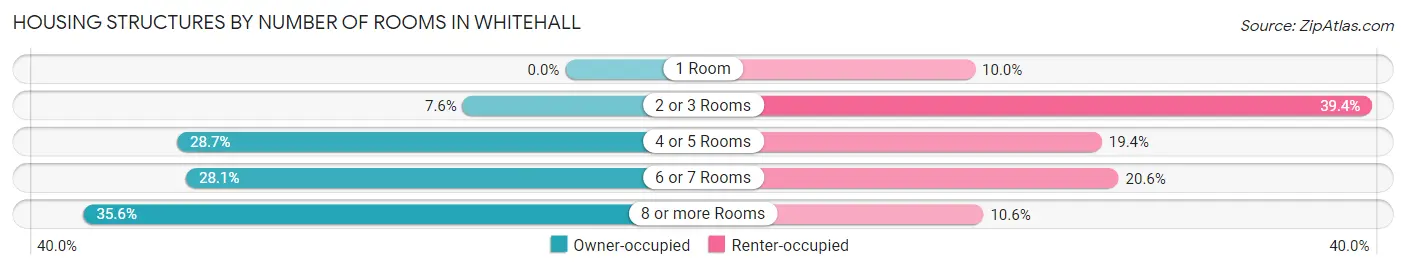
| Number of Rooms | Owner-occupied | Renter-occupied |
| 1 Room | 0 (0.0%) | 16 (10.0%) |
| 2 or 3 Rooms | 23 (7.6%) | 63 (39.4%) |
| 4 or 5 Rooms | 87 (28.7%) | 31 (19.4%) |
| 6 or 7 Rooms | 85 (28.1%) | 33 (20.6%) |
| 8 or more Rooms | 108 (35.6%) | 17 (10.6%) |
| Total | 303 (100.0%) | 160 (100.0%) |
Housing Structure by Heating Type in Whitehall
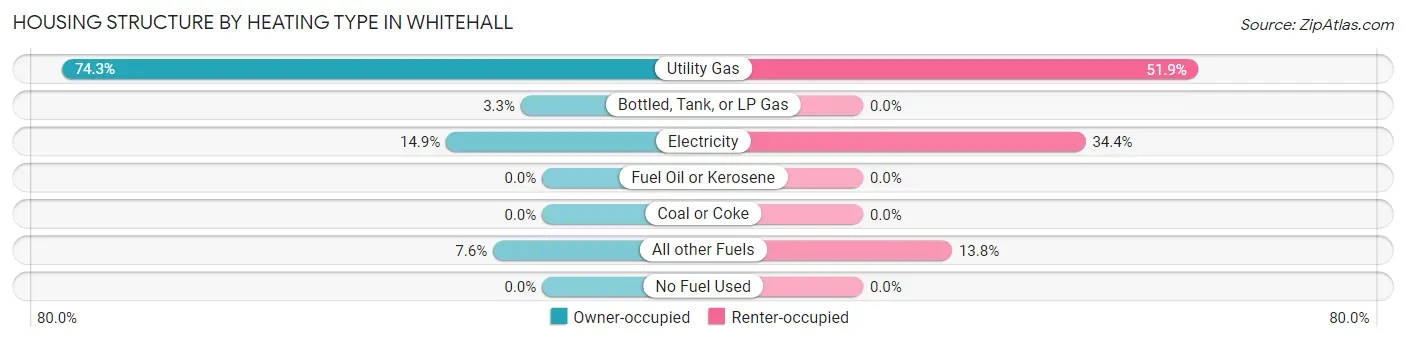
| Heating Type | Owner-occupied | Renter-occupied |
| Utility Gas | 225 (74.3%) | 83 (51.9%) |
| Bottled, Tank, or LP Gas | 10 (3.3%) | 0 (0.0%) |
| Electricity | 45 (14.8%) | 55 (34.4%) |
| Fuel Oil or Kerosene | 0 (0.0%) | 0 (0.0%) |
| Coal or Coke | 0 (0.0%) | 0 (0.0%) |
| All other Fuels | 23 (7.6%) | 22 (13.8%) |
| No Fuel Used | 0 (0.0%) | 0 (0.0%) |
| Total | 303 (100.0%) | 160 (100.0%) |
Household Vehicle Usage in Whitehall
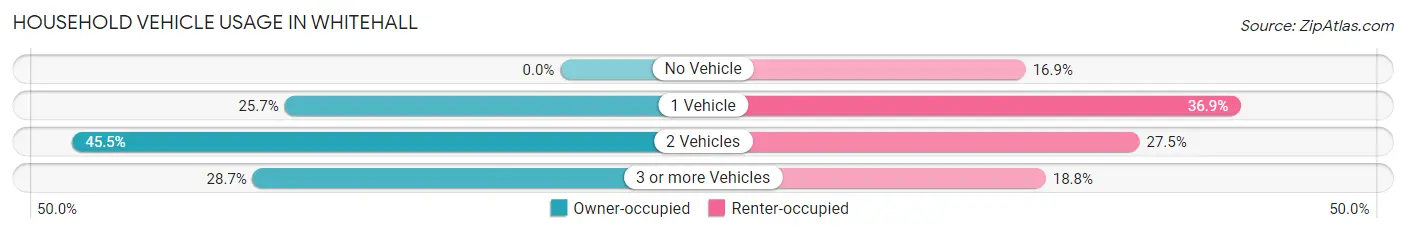
| Vehicles per Household | Owner-occupied | Renter-occupied |
| No Vehicle | 0 (0.0%) | 27 (16.9%) |
| 1 Vehicle | 78 (25.7%) | 59 (36.9%) |
| 2 Vehicles | 138 (45.5%) | 44 (27.5%) |
| 3 or more Vehicles | 87 (28.7%) | 30 (18.8%) |
| Total | 303 (100.0%) | 160 (100.0%) |
Real Estate & Mortgages in Whitehall
Real Estate and Mortgage Overview in Whitehall
| Characteristic | Without Mortgage | With Mortgage |
| Housing Units | 164 | 139 |
| Median Property Value | $178,100 | $170,500 |
| Median Household Income | $38,500 | $0 |
| Monthly Housing Costs | $493 | $7 |
| Real Estate Taxes | $1,265 | $6 |
Property Value by Mortgage Status in Whitehall
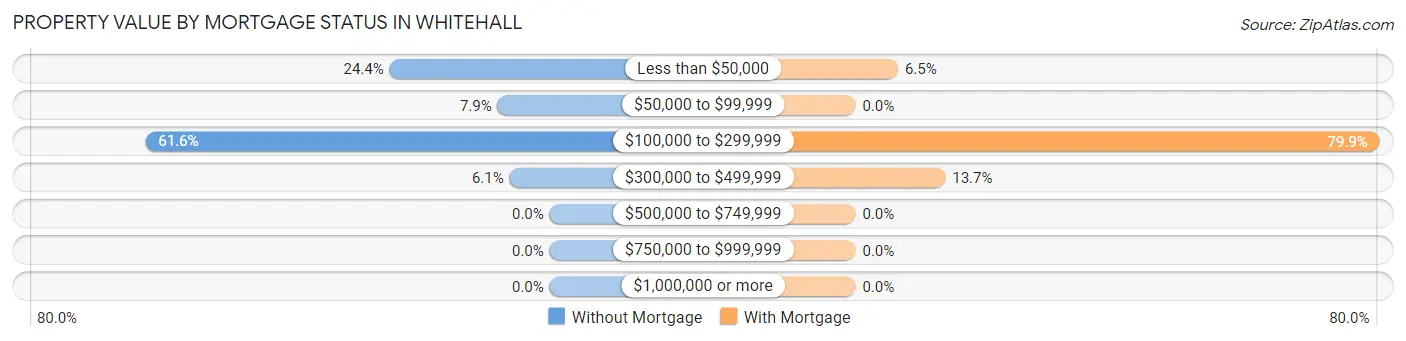
| Property Value | Without Mortgage | With Mortgage |
| Less than $50,000 | 40 (24.4%) | 9 (6.5%) |
| $50,000 to $99,999 | 13 (7.9%) | 0 (0.0%) |
| $100,000 to $299,999 | 101 (61.6%) | 111 (79.9%) |
| $300,000 to $499,999 | 10 (6.1%) | 19 (13.7%) |
| $500,000 to $749,999 | 0 (0.0%) | 0 (0.0%) |
| $750,000 to $999,999 | 0 (0.0%) | 0 (0.0%) |
| $1,000,000 or more | 0 (0.0%) | 0 (0.0%) |
| Total | 164 (100.0%) | 139 (100.0%) |
Household Income by Mortgage Status in Whitehall
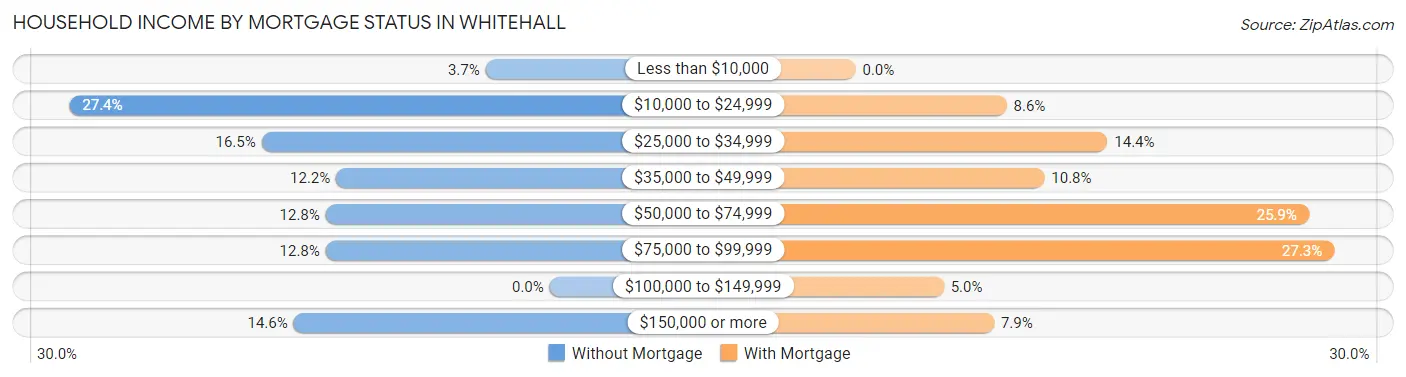
| Household Income | Without Mortgage | With Mortgage |
| Less than $10,000 | 6 (3.7%) | 0 (0.0%) |
| $10,000 to $24,999 | 45 (27.4%) | 12 (8.6%) |
| $25,000 to $34,999 | 27 (16.5%) | 20 (14.4%) |
| $35,000 to $49,999 | 20 (12.2%) | 15 (10.8%) |
| $50,000 to $74,999 | 21 (12.8%) | 36 (25.9%) |
| $75,000 to $99,999 | 21 (12.8%) | 38 (27.3%) |
| $100,000 to $149,999 | 0 (0.0%) | 7 (5.0%) |
| $150,000 or more | 24 (14.6%) | 11 (7.9%) |
| Total | 164 (100.0%) | 139 (100.0%) |
Property Value to Household Income Ratio in Whitehall
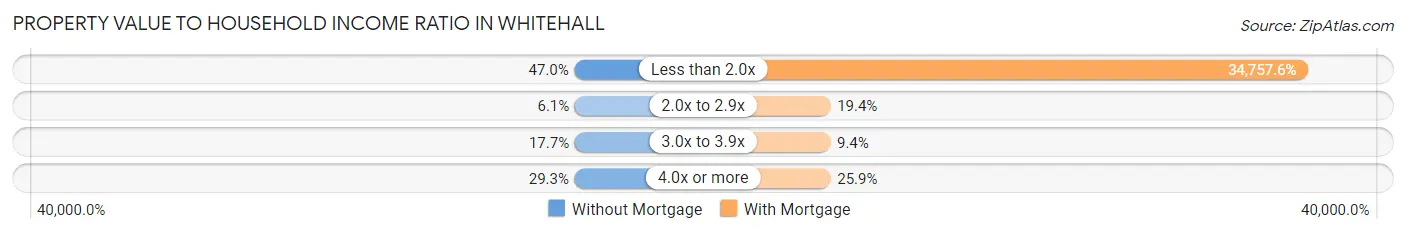
| Value-to-Income Ratio | Without Mortgage | With Mortgage |
| Less than 2.0x | 77 (46.9%) | 48,313 (34,757.5%) |
| 2.0x to 2.9x | 10 (6.1%) | 27 (19.4%) |
| 3.0x to 3.9x | 29 (17.7%) | 13 (9.3%) |
| 4.0x or more | 48 (29.3%) | 36 (25.9%) |
| Total | 164 (100.0%) | 139 (100.0%) |
Real Estate Taxes by Mortgage Status in Whitehall
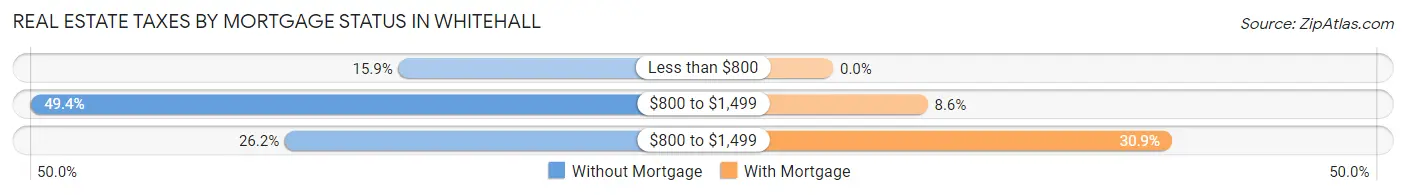
| Property Taxes | Without Mortgage | With Mortgage |
| Less than $800 | 26 (15.9%) | 0 (0.0%) |
| $800 to $1,499 | 81 (49.4%) | 12 (8.6%) |
| $800 to $1,499 | 43 (26.2%) | 43 (30.9%) |
| Total | 164 (100.0%) | 139 (100.0%) |
Health & Disability in Whitehall
Health Insurance Coverage by Age in Whitehall
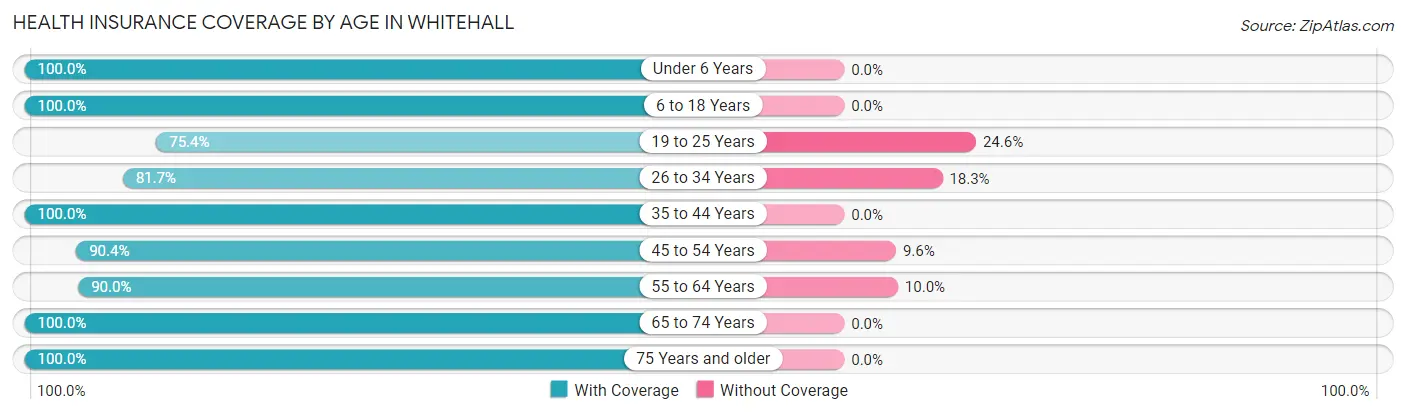
| Age Bracket | With Coverage | Without Coverage |
| Under 6 Years | 62 (100.0%) | 0 (0.0%) |
| 6 to 18 Years | 159 (100.0%) | 0 (0.0%) |
| 19 to 25 Years | 43 (75.4%) | 14 (24.6%) |
| 26 to 34 Years | 125 (81.7%) | 28 (18.3%) |
| 35 to 44 Years | 42 (100.0%) | 0 (0.0%) |
| 45 to 54 Years | 150 (90.4%) | 16 (9.6%) |
| 55 to 64 Years | 117 (90.0%) | 13 (10.0%) |
| 65 to 74 Years | 203 (100.0%) | 0 (0.0%) |
| 75 Years and older | 157 (100.0%) | 0 (0.0%) |
| Total | 1,058 (93.7%) | 71 (6.3%) |
Health Insurance Coverage by Citizenship Status in Whitehall
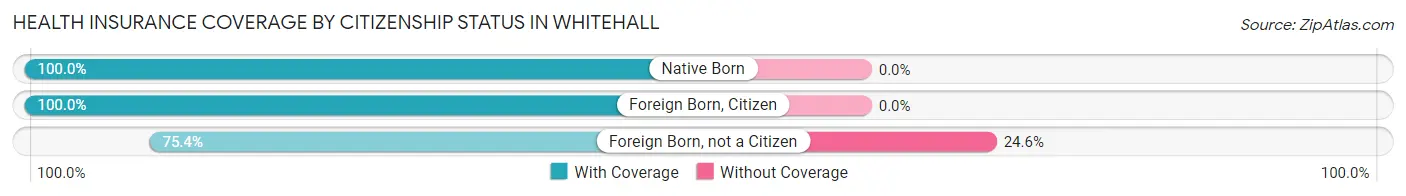
| Citizenship Status | With Coverage | Without Coverage |
| Native Born | 62 (100.0%) | 0 (0.0%) |
| Foreign Born, Citizen | 159 (100.0%) | 0 (0.0%) |
| Foreign Born, not a Citizen | 43 (75.4%) | 14 (24.6%) |
Health Insurance Coverage by Household Income in Whitehall
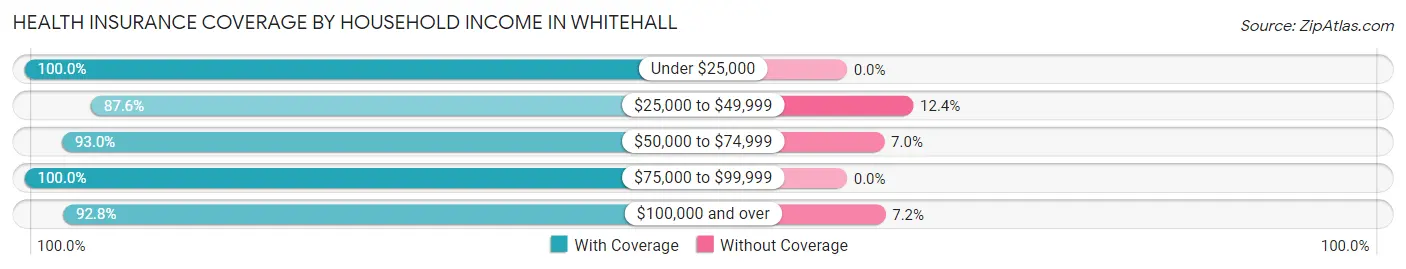
| Household Income | With Coverage | Without Coverage |
| Under $25,000 | 253 (100.0%) | 0 (0.0%) |
| $25,000 to $49,999 | 289 (87.6%) | 41 (12.4%) |
| $50,000 to $74,999 | 186 (93.0%) | 14 (7.0%) |
| $75,000 to $99,999 | 116 (100.0%) | 0 (0.0%) |
| $100,000 and over | 206 (92.8%) | 16 (7.2%) |
Public vs Private Health Insurance Coverage by Age in Whitehall
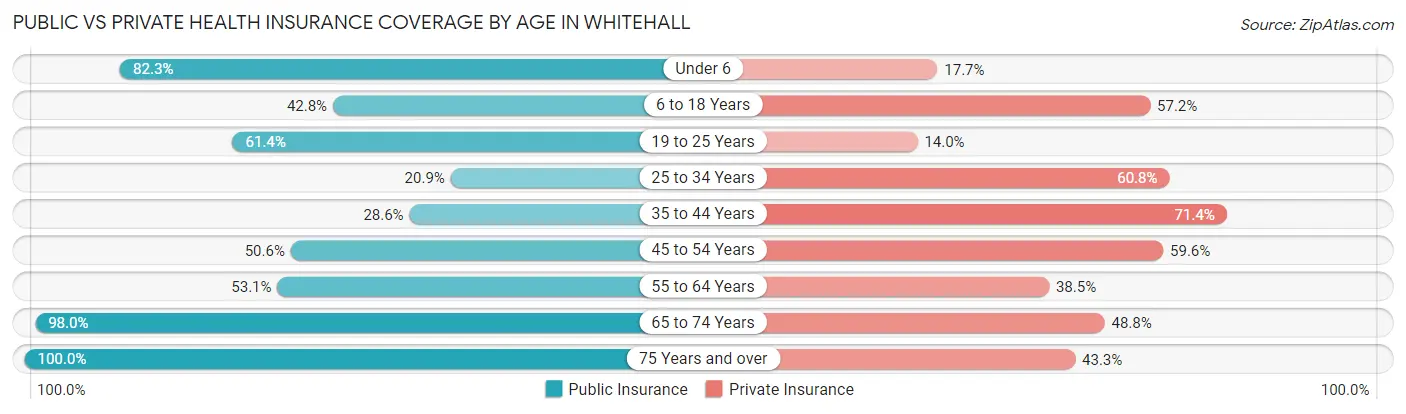
| Age Bracket | Public Insurance | Private Insurance |
| Under 6 | 51 (82.3%) | 11 (17.7%) |
| 6 to 18 Years | 68 (42.8%) | 91 (57.2%) |
| 19 to 25 Years | 35 (61.4%) | 8 (14.0%) |
| 25 to 34 Years | 32 (20.9%) | 93 (60.8%) |
| 35 to 44 Years | 12 (28.6%) | 30 (71.4%) |
| 45 to 54 Years | 84 (50.6%) | 99 (59.6%) |
| 55 to 64 Years | 69 (53.1%) | 50 (38.5%) |
| 65 to 74 Years | 199 (98.0%) | 99 (48.8%) |
| 75 Years and over | 157 (100.0%) | 68 (43.3%) |
| Total | 707 (62.6%) | 549 (48.6%) |
Disability Status by Sex by Age in Whitehall
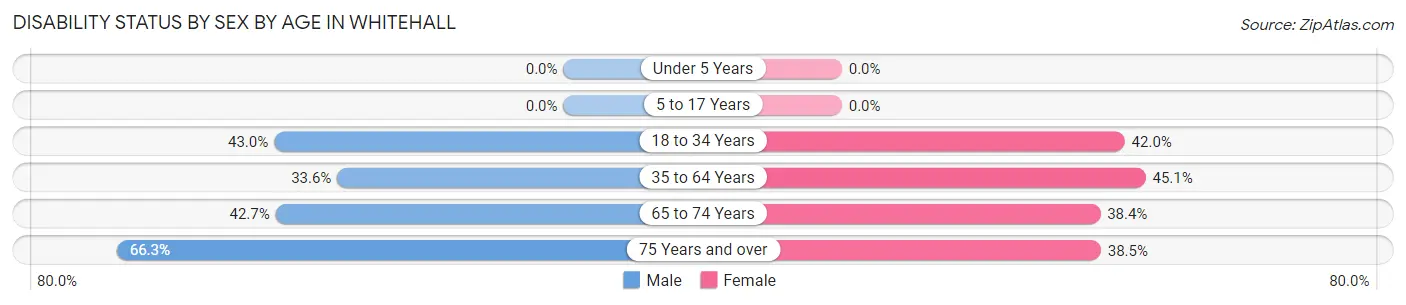
| Age Bracket | Male | Female |
| Under 5 Years | 0 (0.0%) | 0 (0.0%) |
| 5 to 17 Years | 0 (0.0%) | 0 (0.0%) |
| 18 to 34 Years | 61 (43.0%) | 42 (42.0%) |
| 35 to 64 Years | 45 (33.6%) | 92 (45.1%) |
| 65 to 74 Years | 50 (42.7%) | 33 (38.4%) |
| 75 Years and over | 61 (66.3%) | 25 (38.5%) |
Disability Class by Sex by Age in Whitehall
Disability Class: Hearing Difficulty
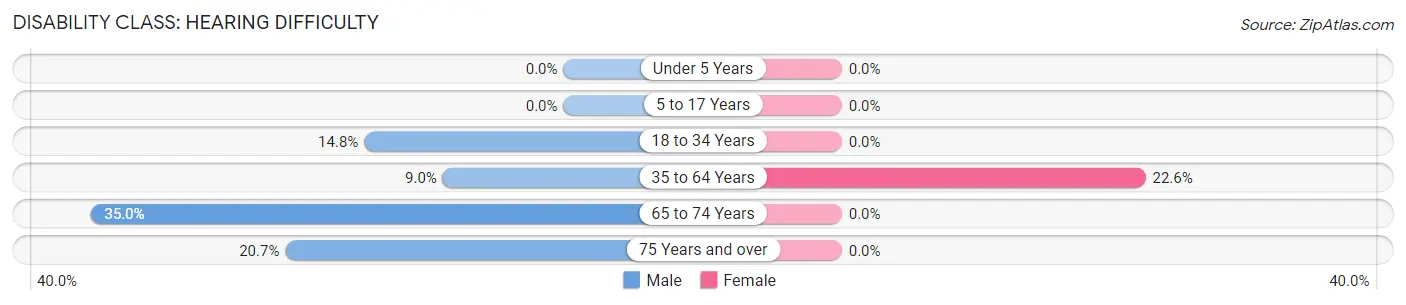
| Age Bracket | Male | Female |
| Under 5 Years | 0 (0.0%) | 0 (0.0%) |
| 5 to 17 Years | 0 (0.0%) | 0 (0.0%) |
| 18 to 34 Years | 21 (14.8%) | 0 (0.0%) |
| 35 to 64 Years | 12 (9.0%) | 46 (22.6%) |
| 65 to 74 Years | 41 (35.0%) | 0 (0.0%) |
| 75 Years and over | 19 (20.6%) | 0 (0.0%) |
Disability Class: Vision Difficulty
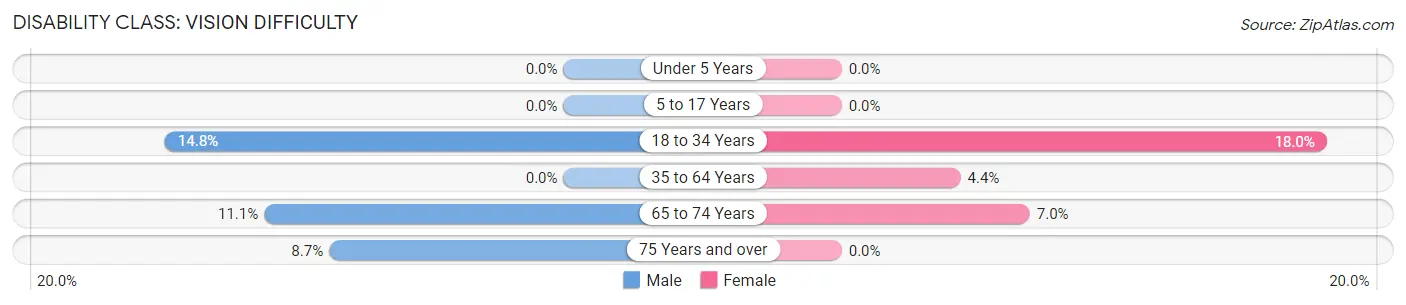
| Age Bracket | Male | Female |
| Under 5 Years | 0 (0.0%) | 0 (0.0%) |
| 5 to 17 Years | 0 (0.0%) | 0 (0.0%) |
| 18 to 34 Years | 21 (14.8%) | 18 (18.0%) |
| 35 to 64 Years | 0 (0.0%) | 9 (4.4%) |
| 65 to 74 Years | 13 (11.1%) | 6 (7.0%) |
| 75 Years and over | 8 (8.7%) | 0 (0.0%) |
Disability Class: Cognitive Difficulty
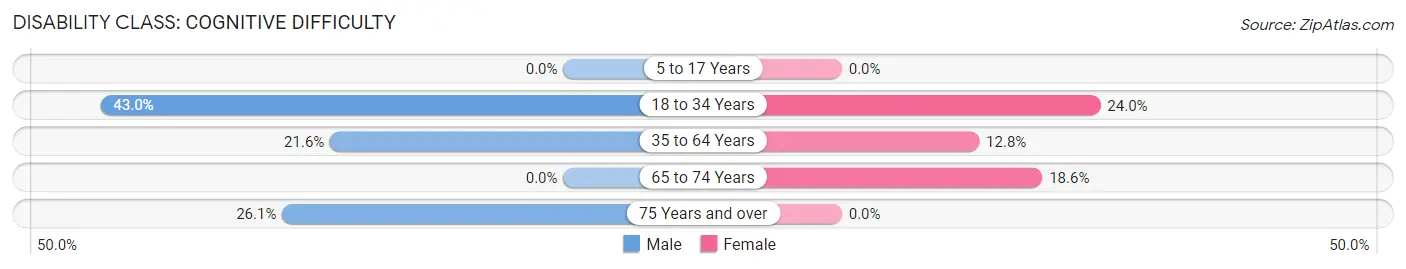
| Age Bracket | Male | Female |
| 5 to 17 Years | 0 (0.0%) | 0 (0.0%) |
| 18 to 34 Years | 61 (43.0%) | 24 (24.0%) |
| 35 to 64 Years | 29 (21.6%) | 26 (12.8%) |
| 65 to 74 Years | 0 (0.0%) | 16 (18.6%) |
| 75 Years and over | 24 (26.1%) | 0 (0.0%) |
Disability Class: Ambulatory Difficulty
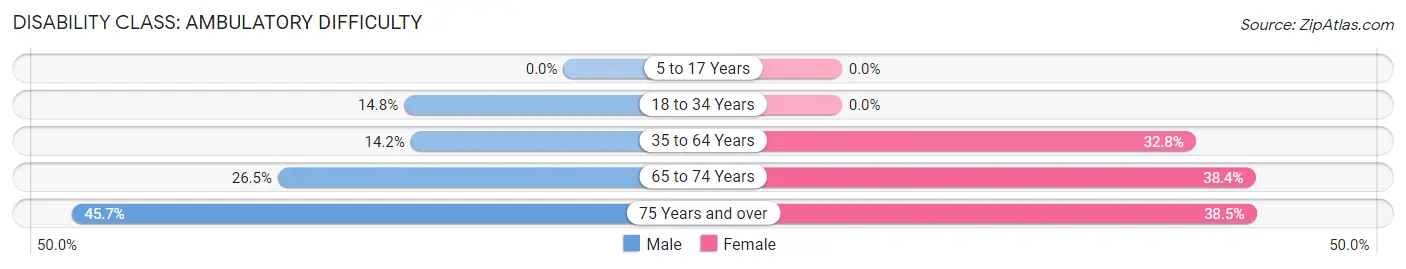
| Age Bracket | Male | Female |
| 5 to 17 Years | 0 (0.0%) | 0 (0.0%) |
| 18 to 34 Years | 21 (14.8%) | 0 (0.0%) |
| 35 to 64 Years | 19 (14.2%) | 67 (32.8%) |
| 65 to 74 Years | 31 (26.5%) | 33 (38.4%) |
| 75 Years and over | 42 (45.7%) | 25 (38.5%) |
Disability Class: Self-Care Difficulty
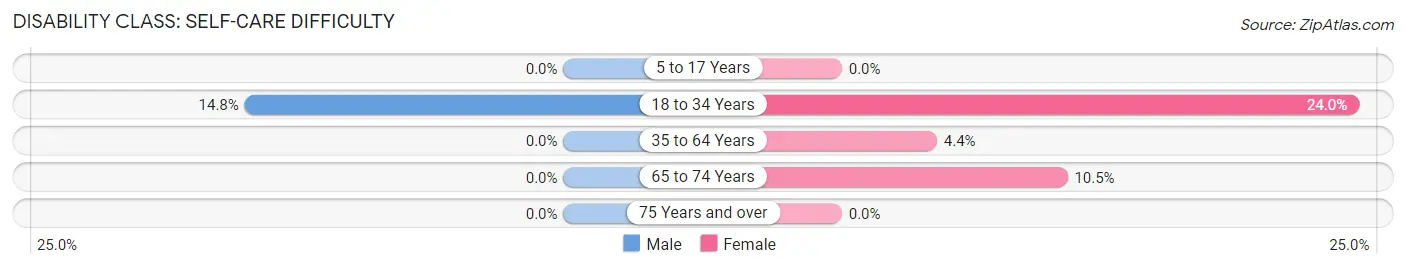
| Age Bracket | Male | Female |
| 5 to 17 Years | 0 (0.0%) | 0 (0.0%) |
| 18 to 34 Years | 21 (14.8%) | 24 (24.0%) |
| 35 to 64 Years | 0 (0.0%) | 9 (4.4%) |
| 65 to 74 Years | 0 (0.0%) | 9 (10.5%) |
| 75 Years and over | 0 (0.0%) | 0 (0.0%) |
Technology Access in Whitehall
Computing Device Access in Whitehall
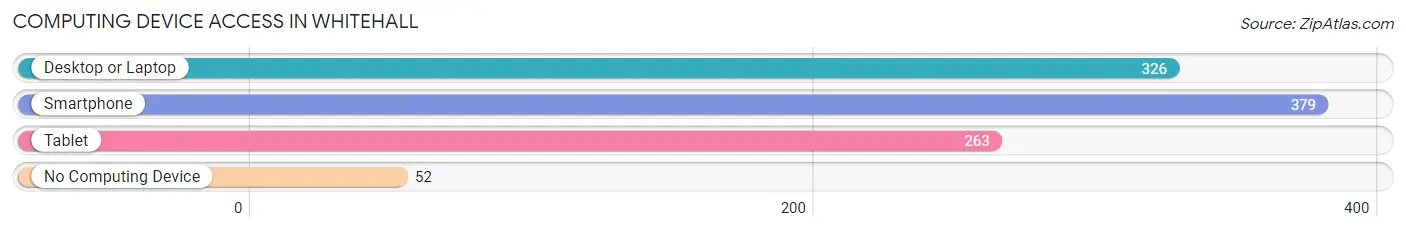
| Device Type | # Households | % Households |
| Desktop or Laptop | 326 | 70.4% |
| Smartphone | 379 | 81.9% |
| Tablet | 263 | 56.8% |
| No Computing Device | 52 | 11.2% |
| Total | 463 | 100.0% |
Internet Access in Whitehall
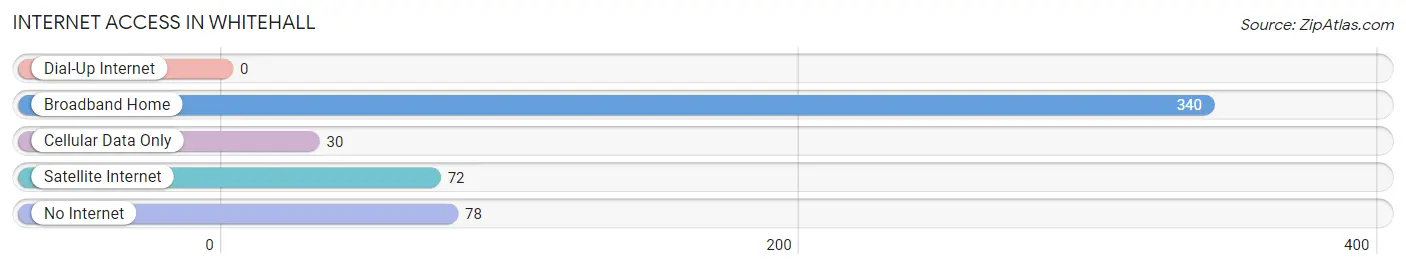
| Internet Type | # Households | % Households |
| Dial-Up Internet | 0 | 0.0% |
| Broadband Home | 340 | 73.4% |
| Cellular Data Only | 30 | 6.5% |
| Satellite Internet | 72 | 15.5% |
| No Internet | 78 | 16.9% |
| Total | 463 | 100.0% |
Whitehall Summary
History
Whitehall is a small town located in the southwestern corner of Montana, in Jefferson County. It is situated at the base of the Tobacco Root Mountains, and is the gateway to the Big Hole Valley. The town was founded in 1864, when gold was discovered in the area. The gold rush brought many miners to the area, and the town quickly grew. The town was named after the Whitehall Mining Company, which was one of the first to mine in the area.
The town was incorporated in 1883, and the first mayor was elected in 1884. The town quickly grew, and by the turn of the century, it had a population of over 1,000. The town was a bustling center of commerce, with several stores, hotels, saloons, and other businesses.
The town was also home to several large ranches, and the area was known for its cattle and sheep. The town was also home to several large mines, including the Whitehall Mine, which was one of the largest in the area.
The town was also home to several schools, including the Whitehall High School, which was established in 1891. The school was the first high school in the area, and it served the students of Whitehall and the surrounding area.
The town was also home to several churches, including the First Presbyterian Church, which was established in 1885. The church was the first in the area, and it served the religious needs of the town.
The town was also home to several fraternal organizations, including the Masonic Lodge, which was established in 1887. The lodge was the first in the area, and it served the social needs of the town.
The town was also home to several newspapers, including the Whitehall Times, which was established in 1887. The newspaper was the first in the area, and it served the news needs of the town.
The town was also home to several banks, including the Whitehall Bank, which was established in 1891. The bank was the first in the area, and it served the financial needs of the town.
The town was also home to several hotels, including the Whitehall Hotel, which was established in 1891. The hotel was the first in the area, and it served the lodging needs of the town.
The town was also home to several theaters, including the Whitehall Theater, which was established in 1891. The theater was the first in the area, and it served the entertainment needs of the town.
The town was also home to several businesses, including the Whitehall Mercantile Company, which was established in 1891. The company was the first in the area, and it served the retail needs of the town.
The town was also home to several industries, including the Whitehall Manufacturing Company, which was established in 1891. The company was the first in the area, and it served the industrial needs of the town.
The town was also home to several railroads, including the Whitehall and Butte Railroad, which was established in 1891. The railroad was the first in the area, and it served the transportation needs of the town.
The town was also home to several parks, including the Whitehall Park, which was established in 1891. The park was the first in the area, and it served the recreational needs of the town.
The town was also home to several cemeteries, including the Whitehall Cemetery, which was established in 1891. The cemetery was the first in the area, and it served the burial needs of the town.
Geography
Whitehall is located in the southwestern corner of Montana, in Jefferson County. It is situated at the base of the Tobacco Root Mountains, and is the gateway to the Big Hole Valley. The town is located at an elevation of 4,890 feet, and has a total area of 1.2 square miles. The town is located on the banks of the Jefferson River, and is surrounded by rolling hills and mountains.
The climate in Whitehall is semi-arid, with hot summers and cold winters. The average temperature in the summer is around 80 degrees Fahrenheit, and the average temperature in the winter is around 20 degrees Fahrenheit. The town receives an average of 16 inches of precipitation per year.
Economy
The economy of Whitehall is largely based on tourism and agriculture. The town is home to several tourist attractions, including the Whitehall Museum, which is dedicated to the history of the town. The town is also home to several wineries, and is a popular destination for wine tasting.
The town is also home to several farms, and is a major producer of hay, wheat, and barley. The town is also home to several ranches, and is a major producer of beef and lamb.
Demographics
As of the 2010 census, the population of Whitehall was 1,092. The racial makeup of the town was 97.3% White, 0.7% Native American, 0.3% Asian, 0.2% from other races, and 1.5% from two or more races. The median age of the town was 44.2 years, and the median household income was $41,250. The per capita income of the town was $20,945.
Common Questions
What is Per Capita Income in Whitehall?
Per Capita income in Whitehall is $23,864.
What is the Median Family Income in Whitehall?
Median Family Income in Whitehall is $48,750.
What is the Median Household income in Whitehall?
Median Household Income in Whitehall is $41,477.
What is Income or Wage Gap in Whitehall?
Income or Wage Gap in Whitehall is 18.7%.
Women in Whitehall earn 81.3 cents for every dollar earned by a man.
What is Inequality or Gini Index in Whitehall?
Inequality or Gini Index in Whitehall is 0.44.
What is the Total Population of Whitehall?
Total Population of Whitehall is 1,129.
What is the Total Male Population of Whitehall?
Total Male Population of Whitehall is 564.
What is the Total Female Population of Whitehall?
Total Female Population of Whitehall is 565.
What is the Ratio of Males per 100 Females in Whitehall?
There are 99.82 Males per 100 Females in Whitehall.
What is the Ratio of Females per 100 Males in Whitehall?
There are 100.18 Females per 100 Males in Whitehall.
What is the Median Population Age in Whitehall?
Median Population Age in Whitehall is 49.7 Years.
What is the Average Family Size in Whitehall
Average Family Size in Whitehall is 2.9 People.
What is the Average Household Size in Whitehall
Average Household Size in Whitehall is 2.4 People.
How Large is the Labor Force in Whitehall?
There are 467 People in the Labor Forcein in Whitehall.
What is the Percentage of People in the Labor Force in Whitehall?
49.2% of People are in the Labor Force in Whitehall.
What is the Unemployment Rate in Whitehall?
Unemployment Rate in Whitehall is 9.6%.