Hays, MT Map & Demographics
Hays Map
Hays Overview
$17,043
PER CAPITA INCOME
$66,719
AVG FAMILY INCOME
$49,423
AVG HOUSEHOLD INCOME
0.42
INEQUALITY / GINI INDEX
1,095
TOTAL POPULATION
545
MALE POPULATION
550
FEMALE POPULATION
99.09
MALES / 100 FEMALES
100.92
FEMALES / 100 MALES
33.5
MEDIAN AGE
5.8
AVG FAMILY SIZE
4.5
AVG HOUSEHOLD SIZE
488
LABOR FORCE [ PEOPLE ]
57.1%
PERCENT IN LABOR FORCE
27.5%
UNEMPLOYMENT RATE
Hays Zip Codes
Hays Area Codes
Income in Hays
Income Overview in Hays
Per Capita Income in Hays is $17,043, while median incomes of families and households are $66,719 and $49,423 respectively.
| Characteristic | Number | Measure |
| Per Capita Income | 1,095 | $17,043 |
| Median Family Income | 165 | $66,719 |
| Mean Family Income | 165 | $71,226 |
| Median Household Income | 242 | $49,423 |
| Mean Household Income | 242 | $57,802 |
| Income Deficit | 165 | $0 |
| Wage / Income Gap (%) | 1,095 | 0.00% |
| Wage / Income Gap ($) | 1,095 | 100.00¢ per $1 |
| Gini / Inequality Index | 1,095 | 0.42 |
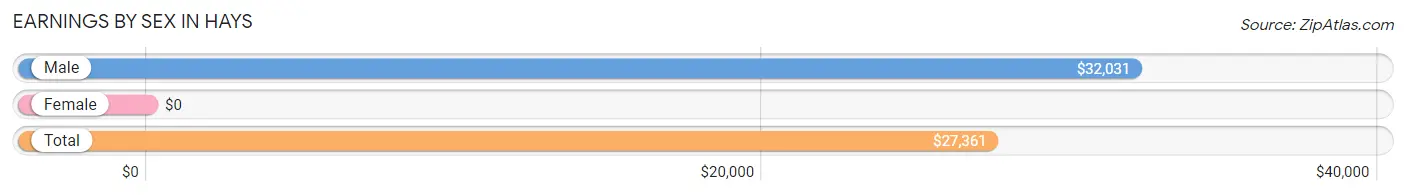
Earnings by Sex in Hays
| Sex | Number | Average Earnings |
| Male | 279 (57.8%) | $32,031 |
| Female | 204 (42.2%) | $0 |
| Total | 483 (100.0%) | $27,361 |
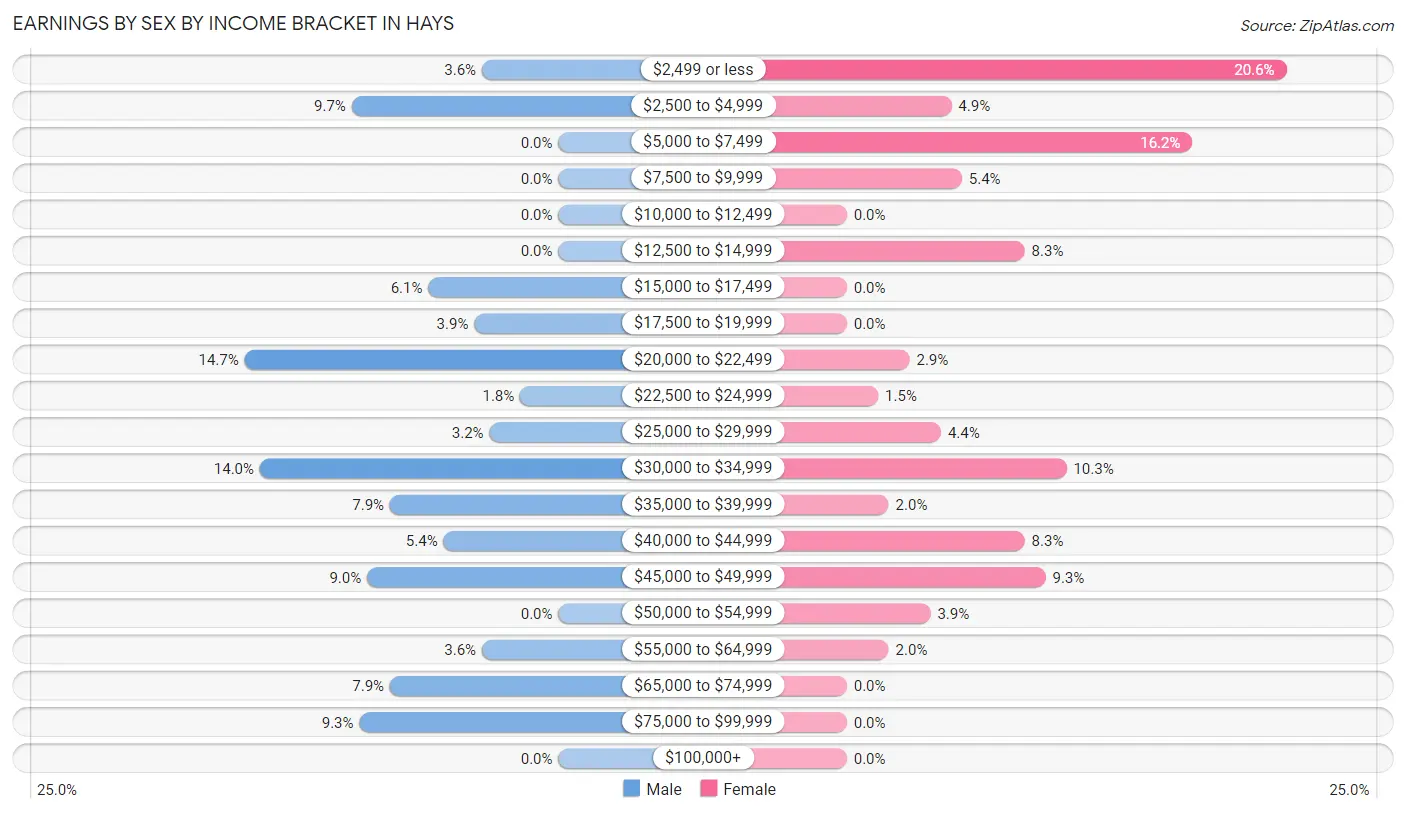
Earnings by Sex by Income Bracket in Hays
The most common earnings brackets in Hays are $20,000 to $22,499 for men (41 | 14.7%) and $2,499 or less for women (42 | 20.6%).
| Income | Male | Female |
| $2,499 or less | 10 (3.6%) | 42 (20.6%) |
| $2,500 to $4,999 | 27 (9.7%) | 10 (4.9%) |
| $5,000 to $7,499 | 0 (0.0%) | 33 (16.2%) |
| $7,500 to $9,999 | 0 (0.0%) | 11 (5.4%) |
| $10,000 to $12,499 | 0 (0.0%) | 0 (0.0%) |
| $12,500 to $14,999 | 0 (0.0%) | 17 (8.3%) |
| $15,000 to $17,499 | 17 (6.1%) | 0 (0.0%) |
| $17,500 to $19,999 | 11 (3.9%) | 0 (0.0%) |
| $20,000 to $22,499 | 41 (14.7%) | 6 (2.9%) |
| $22,500 to $24,999 | 5 (1.8%) | 3 (1.5%) |
| $25,000 to $29,999 | 9 (3.2%) | 9 (4.4%) |
| $30,000 to $34,999 | 39 (14.0%) | 21 (10.3%) |
| $35,000 to $39,999 | 22 (7.9%) | 4 (2.0%) |
| $40,000 to $44,999 | 15 (5.4%) | 17 (8.3%) |
| $45,000 to $49,999 | 25 (9.0%) | 19 (9.3%) |
| $50,000 to $54,999 | 0 (0.0%) | 8 (3.9%) |
| $55,000 to $64,999 | 10 (3.6%) | 4 (2.0%) |
| $65,000 to $74,999 | 22 (7.9%) | 0 (0.0%) |
| $75,000 to $99,999 | 26 (9.3%) | 0 (0.0%) |
| $100,000+ | 0 (0.0%) | 0 (0.0%) |
| Total | 279 (100.0%) | 204 (100.0%) |
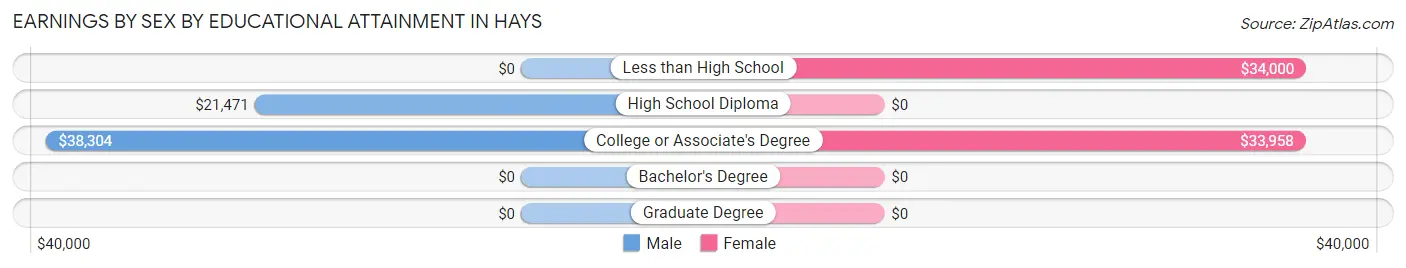
Earnings by Sex by Educational Attainment in Hays
Average earnings in Hays are $34,333 for men and $28,889 for women, a difference of 15.9%. Men with an educational attainment of college or associate's degree enjoy the highest average annual earnings of $38,304, while those with high school diploma education earn the least with $21,471. Women with an educational attainment of less than high school earn the most with the average annual earnings of $34,000, while those with college or associate's degree education have the smallest earnings of $33,958.
| Educational Attainment | Male Income | Female Income |
| Less than High School | - | - |
| High School Diploma | $21,471 | $0 |
| College or Associate's Degree | $38,304 | $33,958 |
| Bachelor's Degree | - | - |
| Graduate Degree | - | - |
| Total | $34,333 | $28,889 |
Family Income in Hays
Family Income Brackets in Hays
According to the Hays family income data, there are 37 families falling into the $35,000 to $49,999 income range, which is the most common income bracket and makes up 22.4% of all families.
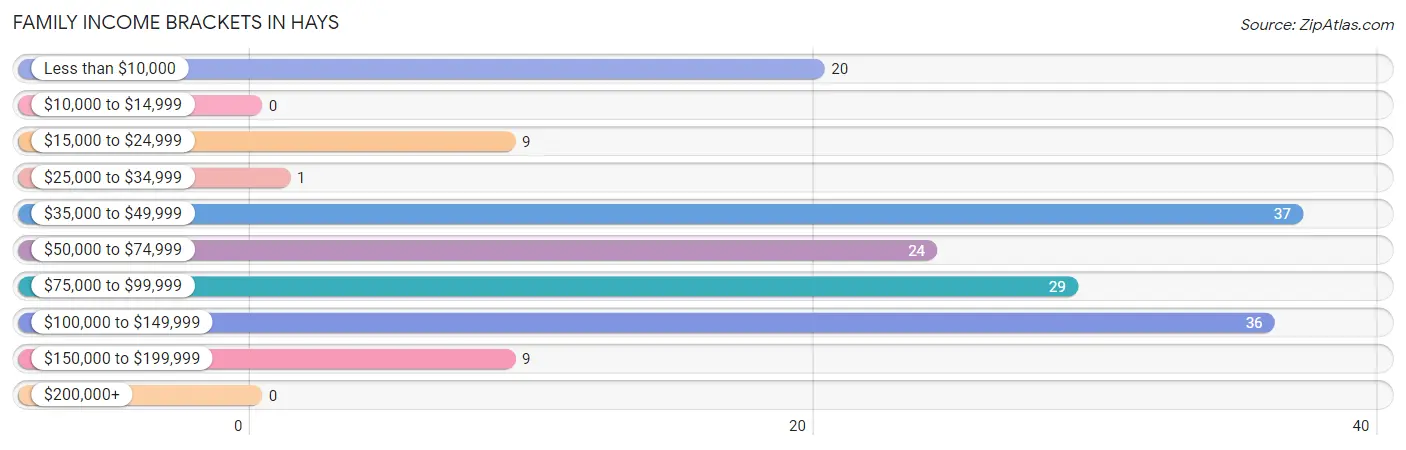
| Income Bracket | # Families | % Families |
| Less than $10,000 | 20 | 12.1% |
| $10,000 to $14,999 | 0 | 0.0% |
| $15,000 to $24,999 | 9 | 5.5% |
| $25,000 to $34,999 | 1 | 0.6% |
| $35,000 to $49,999 | 37 | 22.4% |
| $50,000 to $74,999 | 24 | 14.5% |
| $75,000 to $99,999 | 29 | 17.6% |
| $100,000 to $149,999 | 36 | 21.8% |
| $150,000 to $199,999 | 9 | 5.5% |
| $200,000+ | 0 | 0.0% |
Family Income by Famaliy Size in Hays
6-person families (19 | 11.5%) account for the highest median family income in Hays with $96,875 per family, while 2-person families (43 | 26.1%) have the highest median income of $39,279 per family member.
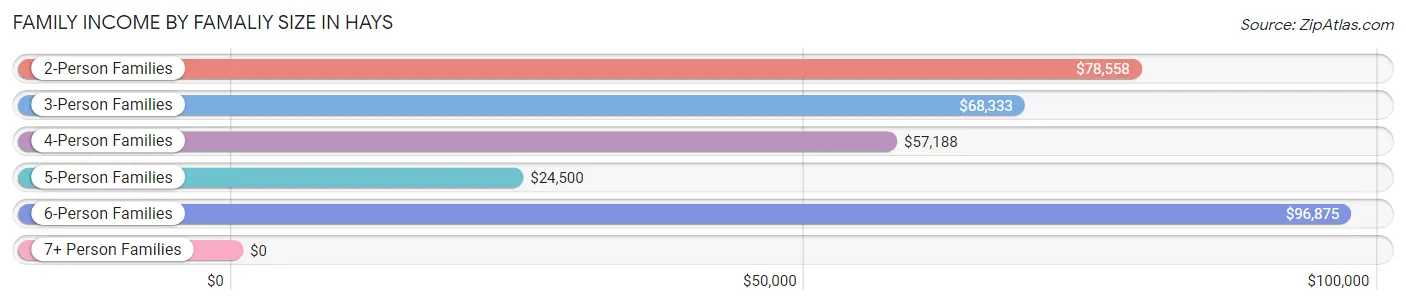
| Income Bracket | # Families | Median Income |
| 2-Person Families | 43 (26.1%) | $78,558 |
| 3-Person Families | 40 (24.2%) | $68,333 |
| 4-Person Families | 47 (28.5%) | $57,188 |
| 5-Person Families | 14 (8.5%) | $24,500 |
| 6-Person Families | 19 (11.5%) | $96,875 |
| 7+ Person Families | 2 (1.2%) | $0 |
| Total | 165 (100.0%) | $66,719 |
Family Income by Number of Earners in Hays
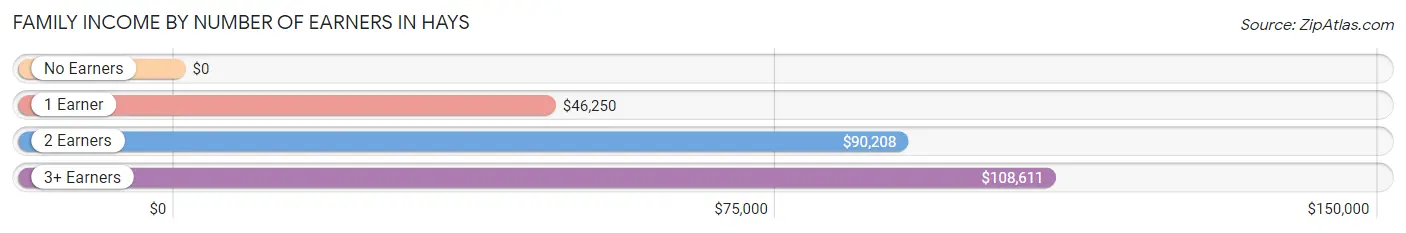
| Number of Earners | # Families | Median Income |
| No Earners | 14 (8.5%) | $0 |
| 1 Earner | 70 (42.4%) | $46,250 |
| 2 Earners | 53 (32.1%) | $90,208 |
| 3+ Earners | 28 (17.0%) | $108,611 |
| Total | 165 (100.0%) | $66,719 |
Household Income in Hays
Household Income Brackets in Hays
With 40 households falling in the category, the $100,000 to $149,999 income range is the most frequent in Hays, accounting for 16.5% of all households.
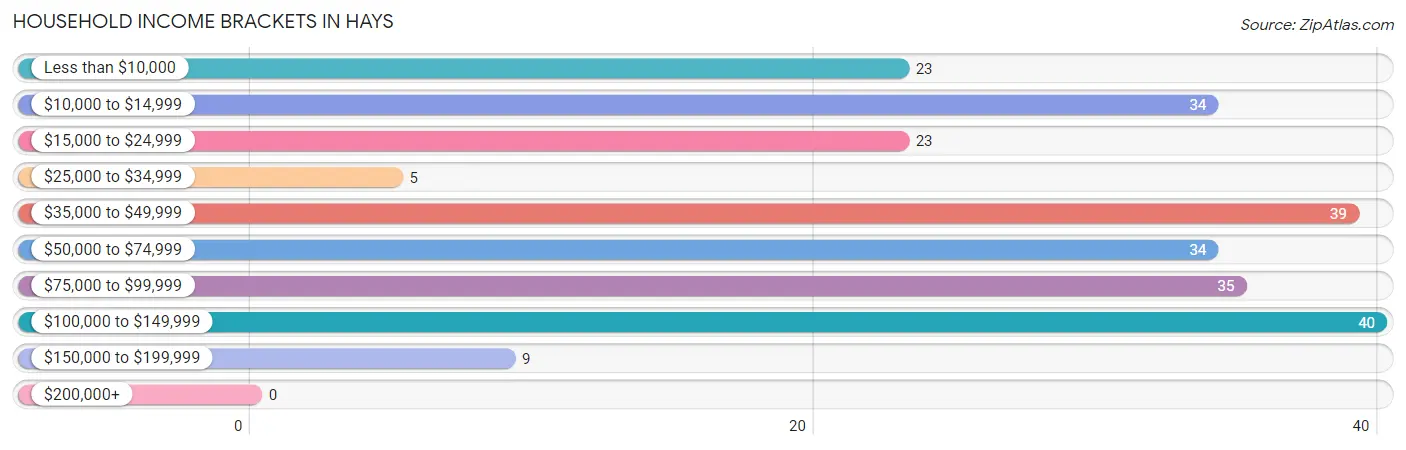
| Income Bracket | # Households | % Households |
| Less than $10,000 | 23 | 9.5% |
| $10,000 to $14,999 | 34 | 14.0% |
| $15,000 to $24,999 | 23 | 9.5% |
| $25,000 to $34,999 | 5 | 2.1% |
| $35,000 to $49,999 | 39 | 16.1% |
| $50,000 to $74,999 | 34 | 14.0% |
| $75,000 to $99,999 | 35 | 14.5% |
| $100,000 to $149,999 | 40 | 16.5% |
| $150,000 to $199,999 | 9 | 3.7% |
| $200,000+ | 0 | 0.0% |
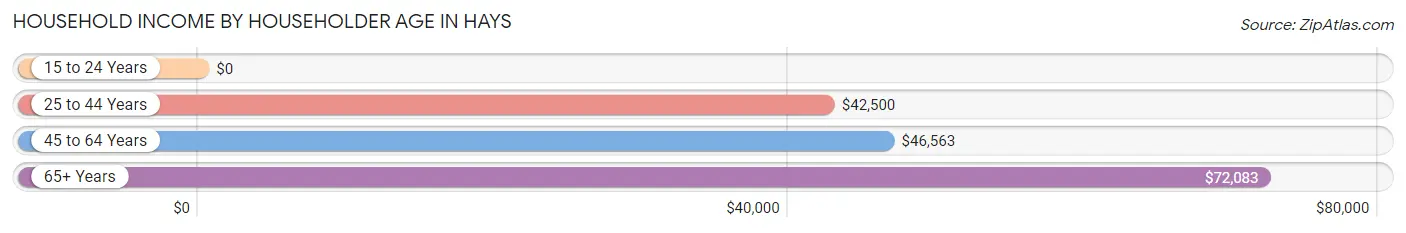
Household Income by Householder Age in Hays
The median household income in Hays is $49,423, with the highest median household income of $72,083 found in the 65+ years age bracket for the primary householder. A total of 95 households (39.3%) fall into this category. Meanwhile, the 15 to 24 years age bracket for the primary householder has the lowest median household income of $0, with 6 households (2.5%) in this group.
| Income Bracket | # Households | Median Income |
| 15 to 24 Years | 6 (2.5%) | $0 |
| 25 to 44 Years | 52 (21.5%) | $42,500 |
| 45 to 64 Years | 89 (36.8%) | $46,563 |
| 65+ Years | 95 (39.3%) | $72,083 |
| Total | 242 (100.0%) | $49,423 |
Poverty in Hays
Income Below Poverty by Sex and Age in Hays
With 22.9% poverty level for males and 36.4% for females among the residents of Hays, under 5 year old males and 25 to 34 year old females are the most vulnerable to poverty, with 12 males (100.0%) and 29 females (64.4%) in their respective age groups living below the poverty level.
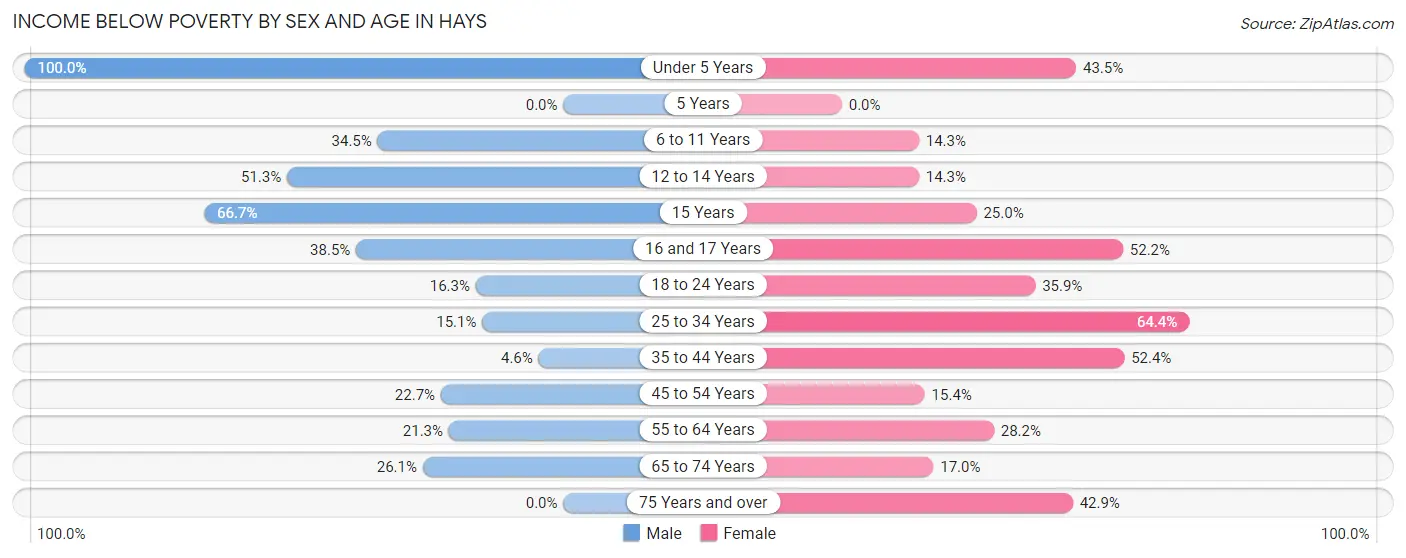
| Age Bracket | Male | Female |
| Under 5 Years | 12 (100.0%) | 10 (43.5%) |
| 5 Years | 0 (0.0%) | 0 (0.0%) |
| 6 to 11 Years | 20 (34.5%) | 6 (14.3%) |
| 12 to 14 Years | 20 (51.3%) | 6 (14.3%) |
| 15 Years | 8 (66.7%) | 2 (25.0%) |
| 16 and 17 Years | 5 (38.5%) | 12 (52.2%) |
| 18 to 24 Years | 13 (16.3%) | 28 (35.9%) |
| 25 to 34 Years | 14 (15.0%) | 29 (64.4%) |
| 35 to 44 Years | 5 (4.6%) | 65 (52.4%) |
| 45 to 54 Years | 5 (22.7%) | 4 (15.4%) |
| 55 to 64 Years | 17 (21.2%) | 11 (28.2%) |
| 65 to 74 Years | 6 (26.1%) | 9 (17.0%) |
| 75 Years and over | 0 (0.0%) | 18 (42.9%) |
| Total | 125 (22.9%) | 200 (36.4%) |
Income Above Poverty by Sex and Age in Hays
According to the poverty statistics in Hays, males aged 75 years and over and females aged 5 years are the age groups that are most secure financially, with 100.0% of males and 100.0% of females in these age groups living above the poverty line.
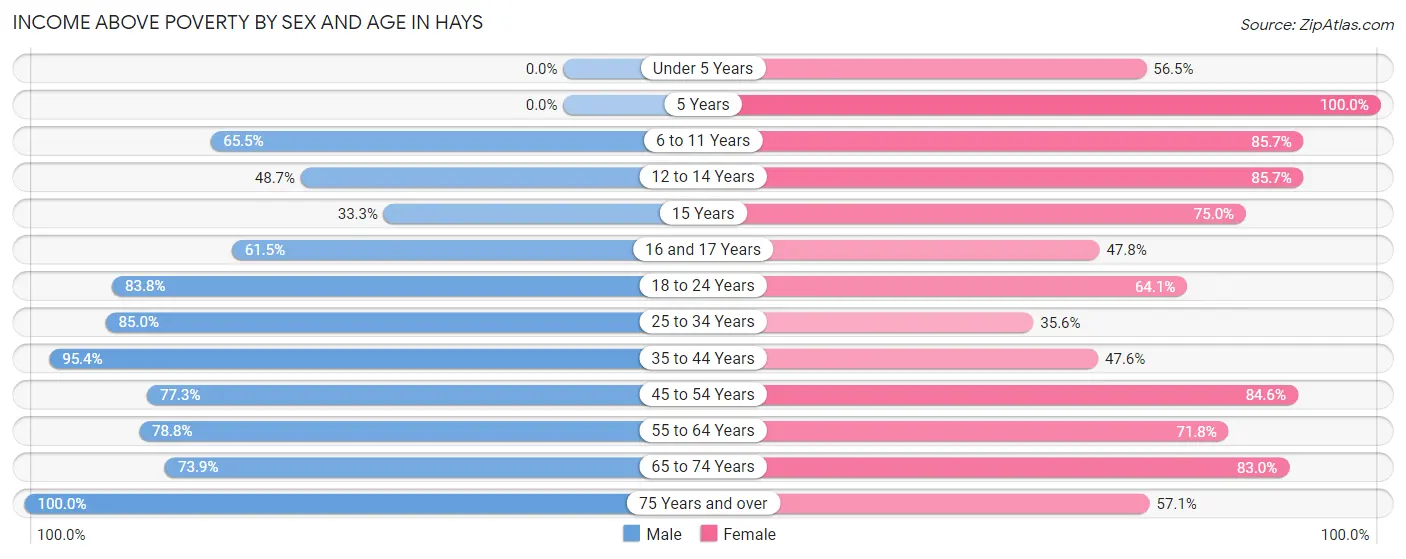
| Age Bracket | Male | Female |
| Under 5 Years | 0 (0.0%) | 13 (56.5%) |
| 5 Years | 0 (0.0%) | 5 (100.0%) |
| 6 to 11 Years | 38 (65.5%) | 36 (85.7%) |
| 12 to 14 Years | 19 (48.7%) | 36 (85.7%) |
| 15 Years | 4 (33.3%) | 6 (75.0%) |
| 16 and 17 Years | 8 (61.5%) | 11 (47.8%) |
| 18 to 24 Years | 67 (83.8%) | 50 (64.1%) |
| 25 to 34 Years | 79 (85.0%) | 16 (35.6%) |
| 35 to 44 Years | 104 (95.4%) | 59 (47.6%) |
| 45 to 54 Years | 17 (77.3%) | 22 (84.6%) |
| 55 to 64 Years | 63 (78.7%) | 28 (71.8%) |
| 65 to 74 Years | 17 (73.9%) | 44 (83.0%) |
| 75 Years and over | 4 (100.0%) | 24 (57.1%) |
| Total | 420 (77.1%) | 350 (63.6%) |
Income Below Poverty Among Married-Couple Families in Hays
The poverty statistics for married-couple families in Hays show that 9.0% or 6 of the total 67 families live below the poverty line. Families with 3 or 4 children have the highest poverty rate of 46.2%, comprising of 6 families. On the other hand, families with no children have the lowest poverty rate of 0.0%, which includes 0 families.
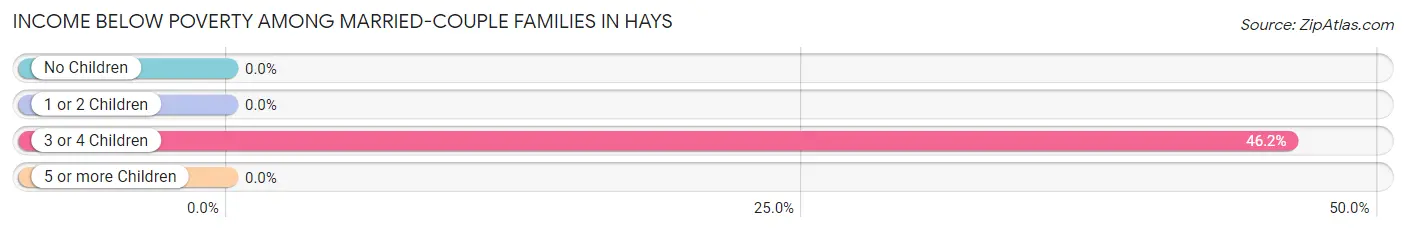
| Children | Above Poverty | Below Poverty |
| No Children | 25 (100.0%) | 0 (0.0%) |
| 1 or 2 Children | 29 (100.0%) | 0 (0.0%) |
| 3 or 4 Children | 7 (53.8%) | 6 (46.2%) |
| 5 or more Children | 0 (0.0%) | 0 (0.0%) |
| Total | 61 (91.0%) | 6 (9.0%) |
Income Below Poverty Among Single-Parent Households in Hays
According to the poverty data in Hays, 19.2% or 5 single-father households and 33.3% or 24 single-mother households are living below the poverty line. Among single-father households, those with 3 or 4 children have the highest poverty rate, with 5 households (100.0%) experiencing poverty. Likewise, among single-mother households, those with 3 or 4 children have the highest poverty rate, with 8 households (61.5%) falling below the poverty line.
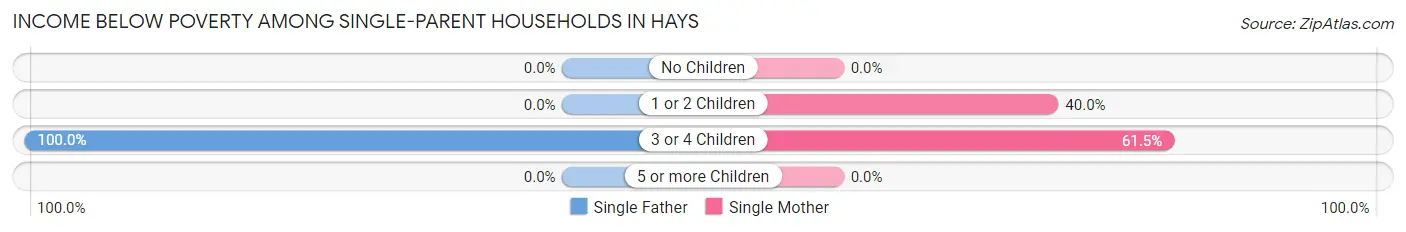
| Children | Single Father | Single Mother |
| No Children | 0 (0.0%) | 0 (0.0%) |
| 1 or 2 Children | 0 (0.0%) | 16 (40.0%) |
| 3 or 4 Children | 5 (100.0%) | 8 (61.5%) |
| 5 or more Children | 0 (0.0%) | 0 (0.0%) |
| Total | 5 (19.2%) | 24 (33.3%) |
Income Below Poverty Among Married-Couple vs Single-Parent Households in Hays
The poverty data for Hays shows that 6 of the married-couple family households (9.0%) and 29 of the single-parent households (29.6%) are living below the poverty level. Within the married-couple family households, those with 3 or 4 children have the highest poverty rate, with 6 households (46.2%) falling below the poverty line. Among the single-parent households, those with 3 or 4 children have the highest poverty rate, with 13 household (72.2%) living below poverty.
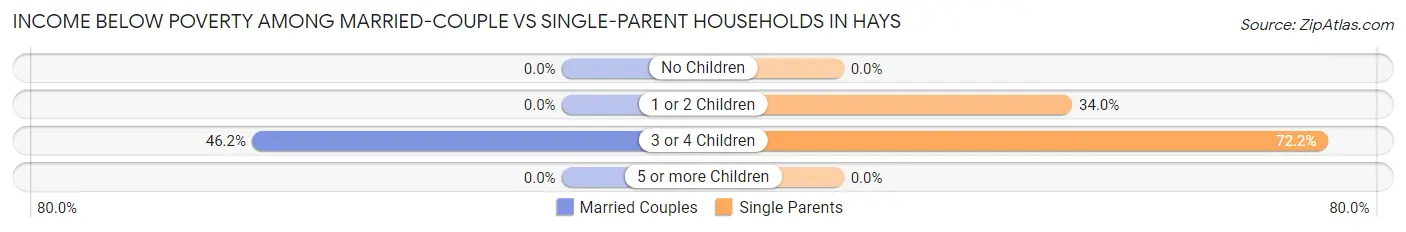
| Children | Married-Couple Families | Single-Parent Households |
| No Children | 0 (0.0%) | 0 (0.0%) |
| 1 or 2 Children | 0 (0.0%) | 16 (34.0%) |
| 3 or 4 Children | 6 (46.2%) | 13 (72.2%) |
| 5 or more Children | 0 (0.0%) | 0 (0.0%) |
| Total | 6 (9.0%) | 29 (29.6%) |
Race in Hays
The most populous races in Hays are Native / Alaskan (1,028 | 93.9%), Hispanic or Latino (82 | 7.5%), and White / Caucasian (36 | 3.3%).
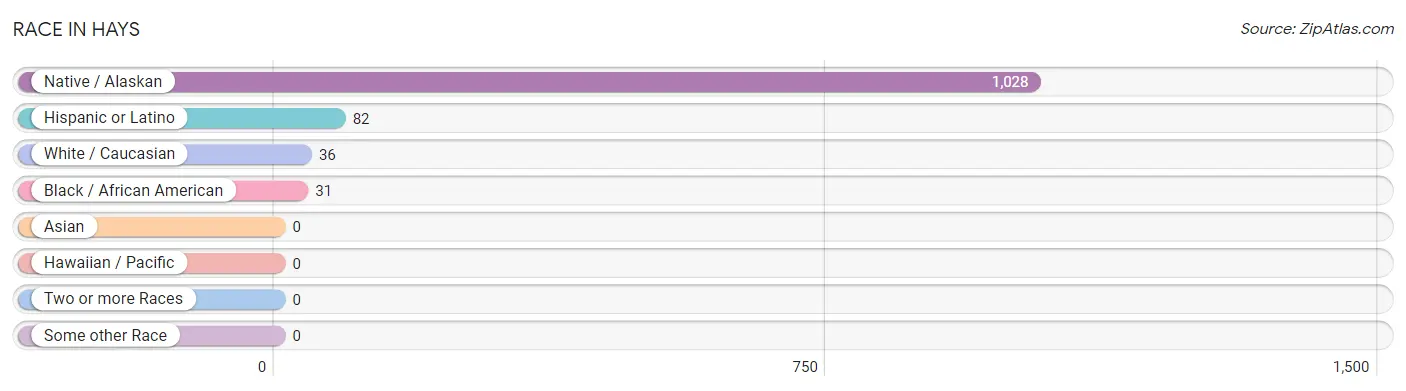
| Race | # Population | % Population |
| Asian | 0 | 0.0% |
| Black / African American | 31 | 2.8% |
| Hawaiian / Pacific | 0 | 0.0% |
| Hispanic or Latino | 82 | 7.5% |
| Native / Alaskan | 1,028 | 93.9% |
| White / Caucasian | 36 | 3.3% |
| Two or more Races | 0 | 0.0% |
| Some other Race | 0 | 0.0% |
| Total | 1,095 | 100.0% |
Ancestry in Hays
The most populous ancestries reported in Hays are Mexican (82 | 7.5%), Cree (14 | 1.3%), Blackfeet (12 | 1.1%), Italian (12 | 1.1%), and German (11 | 1.0%), together accounting for 12.0% of all Hays residents.
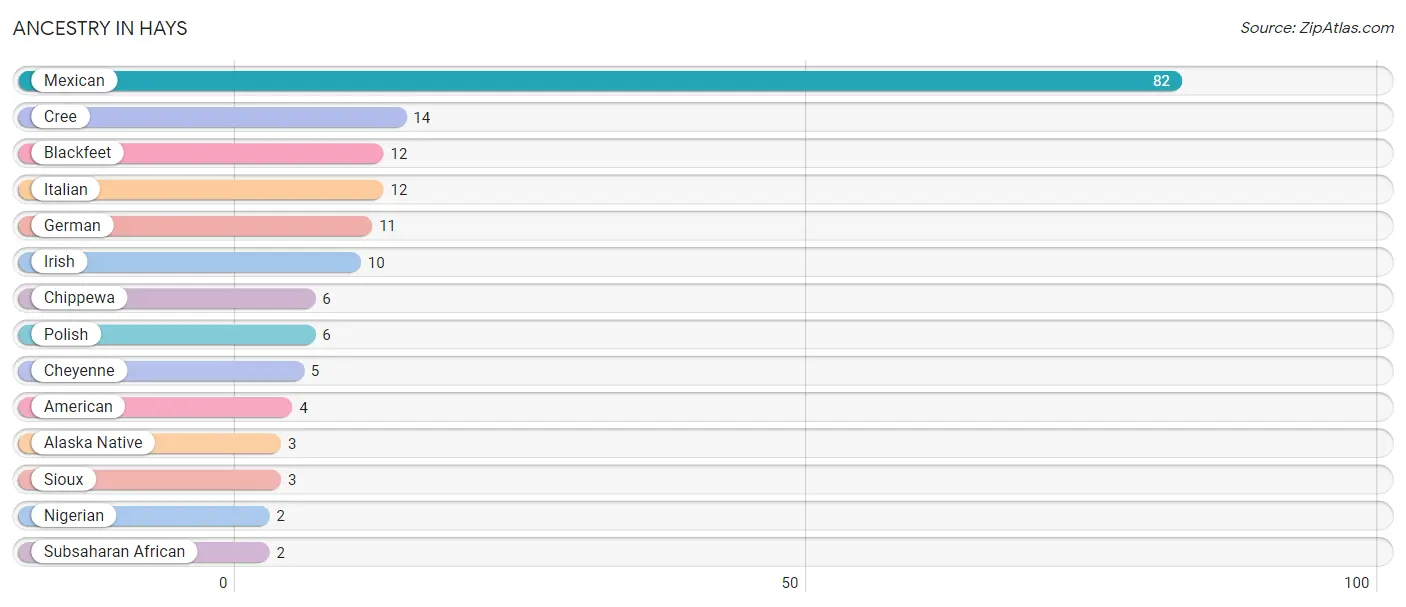
| Ancestry | # Population | % Population |
| Alaska Native | 3 | 0.3% |
| American | 4 | 0.4% |
| Blackfeet | 12 | 1.1% |
| Cheyenne | 5 | 0.5% |
| Chippewa | 6 | 0.5% |
| Cree | 14 | 1.3% |
| German | 11 | 1.0% |
| Irish | 10 | 0.9% |
| Italian | 12 | 1.1% |
| Mexican | 82 | 7.5% |
| Nigerian | 2 | 0.2% |
| Polish | 6 | 0.5% |
| Sioux | 3 | 0.3% |
| Subsaharan African | 2 | 0.2% | View All 14 Rows |
Immigrants in Hays
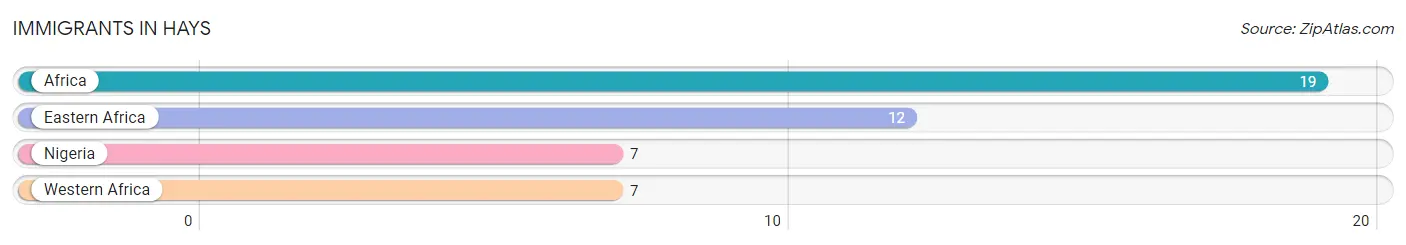
The most numerous immigrant groups reported in Hays came from Africa (19 | 1.7%), Eastern Africa (12 | 1.1%), Nigeria (7 | 0.6%), and Western Africa (7 | 0.6%), together accounting for 4.1% of all Hays residents.
| Immigration Origin | # Population | % Population |
| Africa | 19 | 1.7% |
| Eastern Africa | 12 | 1.1% |
| Nigeria | 7 | 0.6% |
| Western Africa | 7 | 0.6% | View All 4 Rows |
Sex and Age in Hays
Sex and Age in Hays
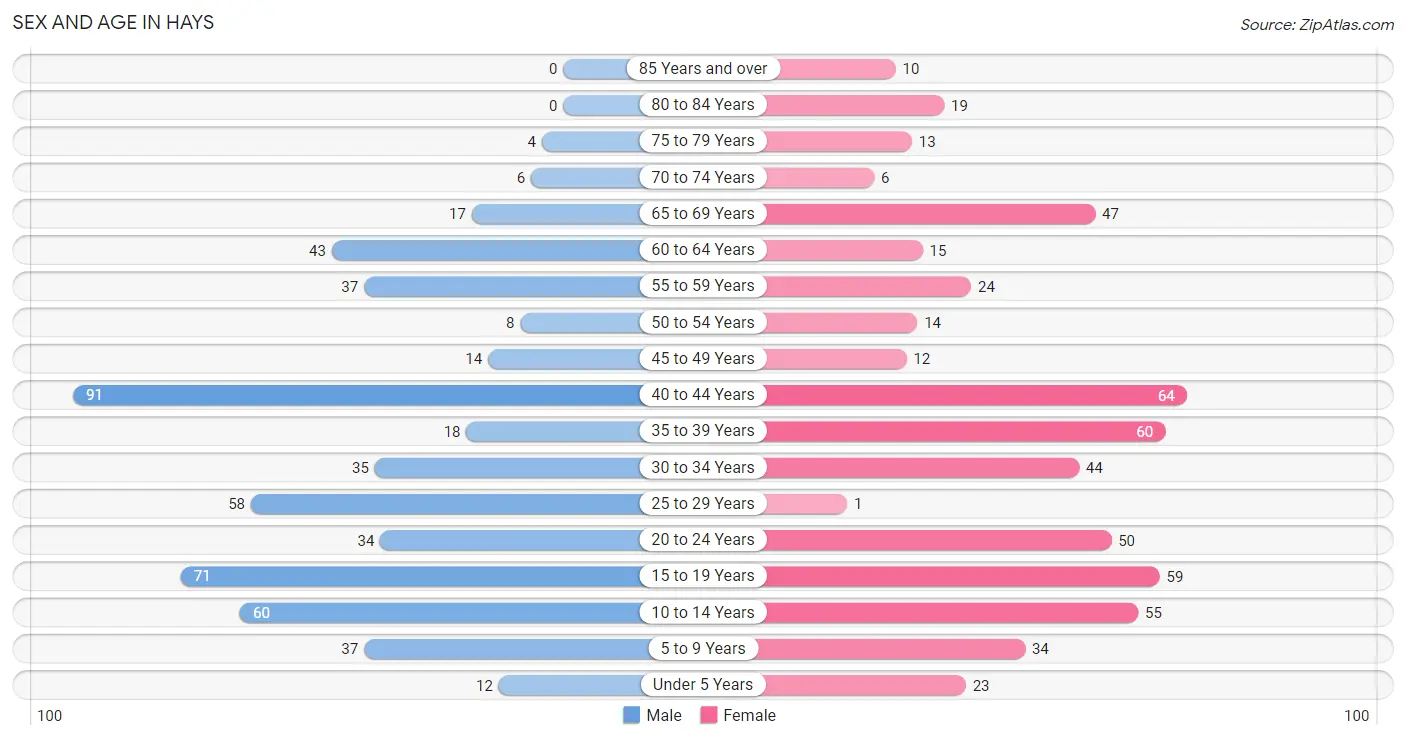
The most populous age groups in Hays are 40 to 44 Years (91 | 16.7%) for men and 40 to 44 Years (64 | 11.6%) for women.
| Age Bracket | Male | Female |
| Under 5 Years | 12 (2.2%) | 23 (4.2%) |
| 5 to 9 Years | 37 (6.8%) | 34 (6.2%) |
| 10 to 14 Years | 60 (11.0%) | 55 (10.0%) |
| 15 to 19 Years | 71 (13.0%) | 59 (10.7%) |
| 20 to 24 Years | 34 (6.2%) | 50 (9.1%) |
| 25 to 29 Years | 58 (10.6%) | 1 (0.2%) |
| 30 to 34 Years | 35 (6.4%) | 44 (8.0%) |
| 35 to 39 Years | 18 (3.3%) | 60 (10.9%) |
| 40 to 44 Years | 91 (16.7%) | 64 (11.6%) |
| 45 to 49 Years | 14 (2.6%) | 12 (2.2%) |
| 50 to 54 Years | 8 (1.5%) | 14 (2.5%) |
| 55 to 59 Years | 37 (6.8%) | 24 (4.4%) |
| 60 to 64 Years | 43 (7.9%) | 15 (2.7%) |
| 65 to 69 Years | 17 (3.1%) | 47 (8.6%) |
| 70 to 74 Years | 6 (1.1%) | 6 (1.1%) |
| 75 to 79 Years | 4 (0.7%) | 13 (2.4%) |
| 80 to 84 Years | 0 (0.0%) | 19 (3.5%) |
| 85 Years and over | 0 (0.0%) | 10 (1.8%) |
| Total | 545 (100.0%) | 550 (100.0%) |
Families and Households in Hays
Median Family Size in Hays
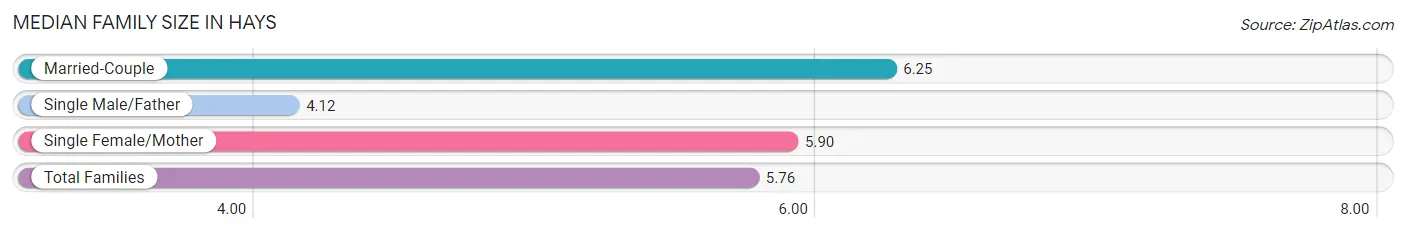
The median family size in Hays is 5.76 persons per family, with married-couple families (67 | 40.6%) accounting for the largest median family size of 6.25 persons per family. On the other hand, single male/father families (26 | 15.8%) represent the smallest median family size with 4.12 persons per family.
| Family Type | # Families | Family Size |
| Married-Couple | 67 (40.6%) | 6.25 |
| Single Male/Father | 26 (15.8%) | 4.12 |
| Single Female/Mother | 72 (43.6%) | 5.90 |
| Total Families | 165 (100.0%) | 5.76 |
Median Household Size in Hays
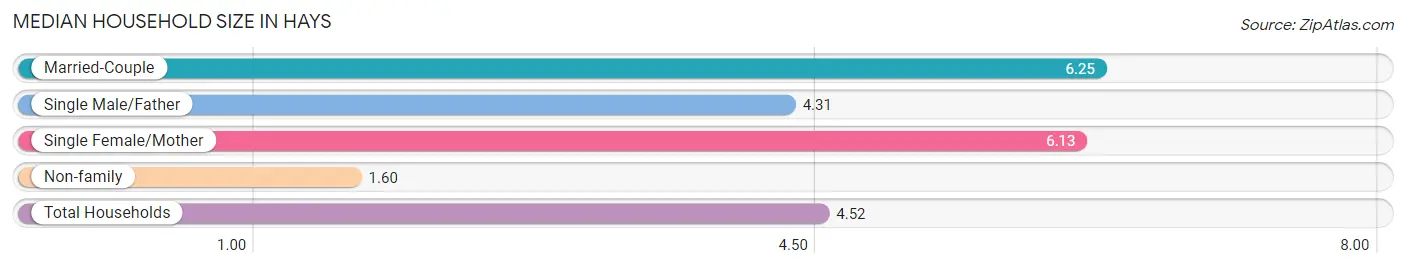
The median household size in Hays is 4.52 persons per household, with married-couple households (67 | 27.7%) accounting for the largest median household size of 6.25 persons per household. non-family households (77 | 31.8%) represent the smallest median household size with 1.60 persons per household.
| Household Type | # Households | Household Size |
| Married-Couple | 67 (27.7%) | 6.25 |
| Single Male/Father | 26 (10.7%) | 4.31 |
| Single Female/Mother | 72 (29.7%) | 6.13 |
| Non-family | 77 (31.8%) | 1.60 |
| Total Households | 242 (100.0%) | 4.52 |
Household Size by Marriage Status in Hays
Out of a total of 242 households in Hays, 165 (68.2%) are family households, while 77 (31.8%) are nonfamily households. The most numerous type of family households are 2-person households, comprising 43, and the most common type of nonfamily households are 1-person households, comprising 67.
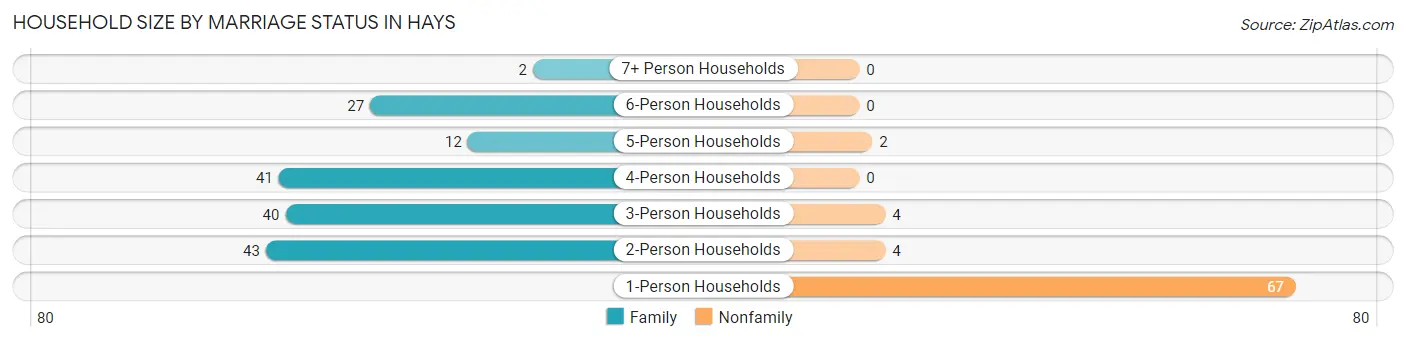
| Household Size | Family Households | Nonfamily Households |
| 1-Person Households | - | 67 (27.7%) |
| 2-Person Households | 43 (17.8%) | 4 (1.7%) |
| 3-Person Households | 40 (16.5%) | 4 (1.7%) |
| 4-Person Households | 41 (16.9%) | 0 (0.0%) |
| 5-Person Households | 12 (5.0%) | 2 (0.8%) |
| 6-Person Households | 27 (11.2%) | 0 (0.0%) |
| 7+ Person Households | 2 (0.8%) | 0 (0.0%) |
| Total | 165 (68.2%) | 77 (31.8%) |
Female Fertility in Hays
Fertility by Age in Hays
Average fertility rate in Hays is 41.0 births per 1,000 women. Women in the age bracket of 20 to 34 years have the highest fertility rate with 126.0 births per 1,000 women. Women in the age bracket of 20 to 34 years acount for 100.0% of all women with births.
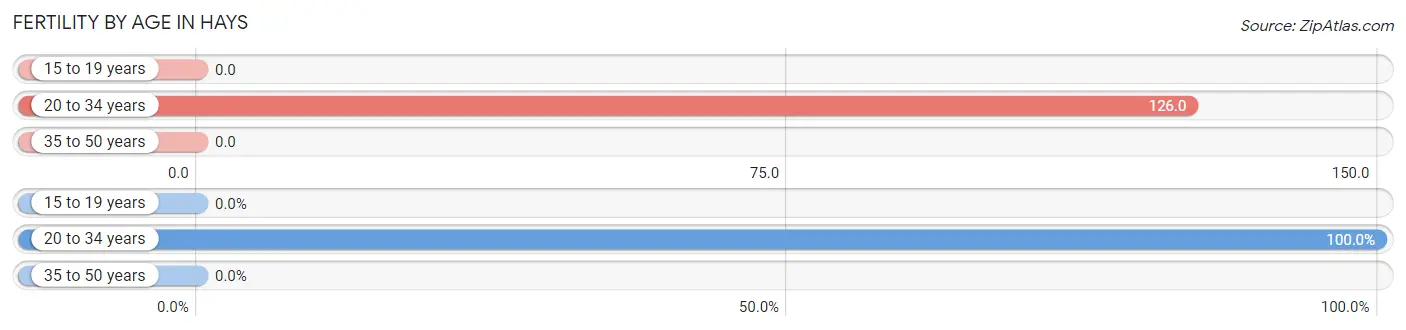
| Age Bracket | Women with Births | Births / 1,000 Women |
| 15 to 19 years | 0 (0.0%) | 0.0 |
| 20 to 34 years | 12 (100.0%) | 126.0 |
| 35 to 50 years | 0 (0.0%) | 0.0 |
| Total | 12 (100.0%) | 41.0 |
Fertility by Age by Marriage Status in Hays
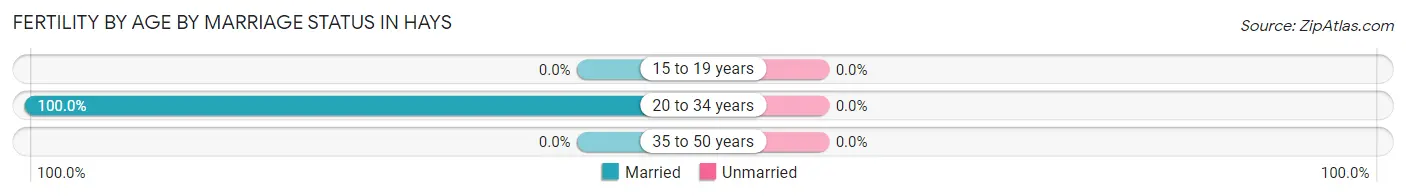
| Age Bracket | Married | Unmarried |
| 15 to 19 years | 0 (0.0%) | 0 (0.0%) |
| 20 to 34 years | 12 (100.0%) | 0 (0.0%) |
| 35 to 50 years | 0 (0.0%) | 0 (0.0%) |
| Total | 12 (100.0%) | 0 (0.0%) |
Fertility by Education in Hays
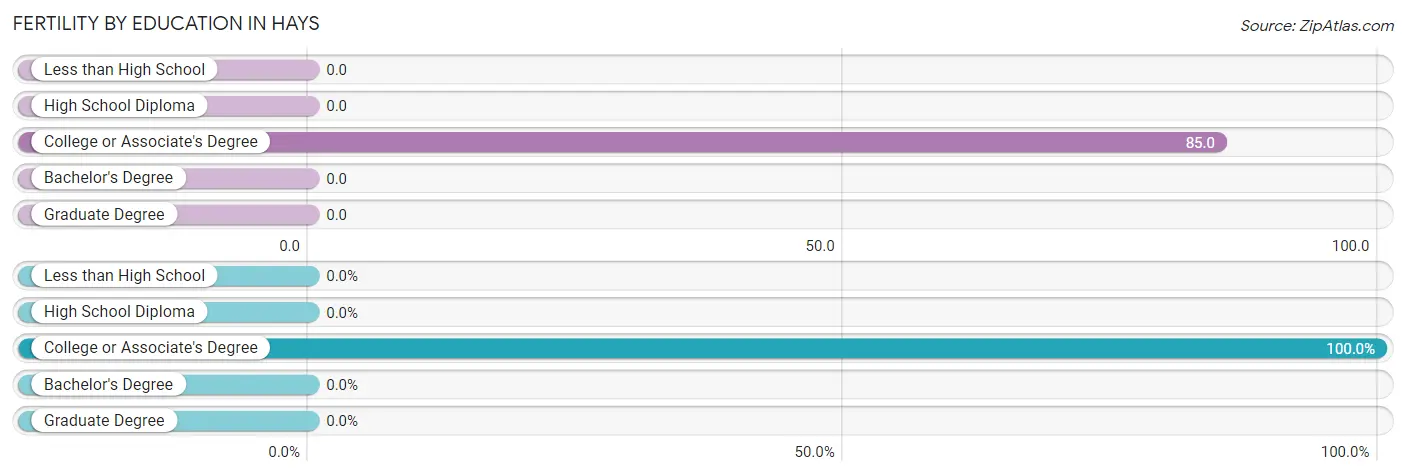
| Educational Attainment | Women with Births | Births / 1,000 Women |
| Less than High School | 0 (0.0%) | 0.0 |
| High School Diploma | 0 (0.0%) | 0.0 |
| College or Associate's Degree | 12 (100.0%) | 85.0 |
| Bachelor's Degree | 0 (0.0%) | 0.0 |
| Graduate Degree | 0 (0.0%) | 0.0 |
| Total | 12 (100.0%) | 41.0 |
Fertility by Education by Marriage Status in Hays
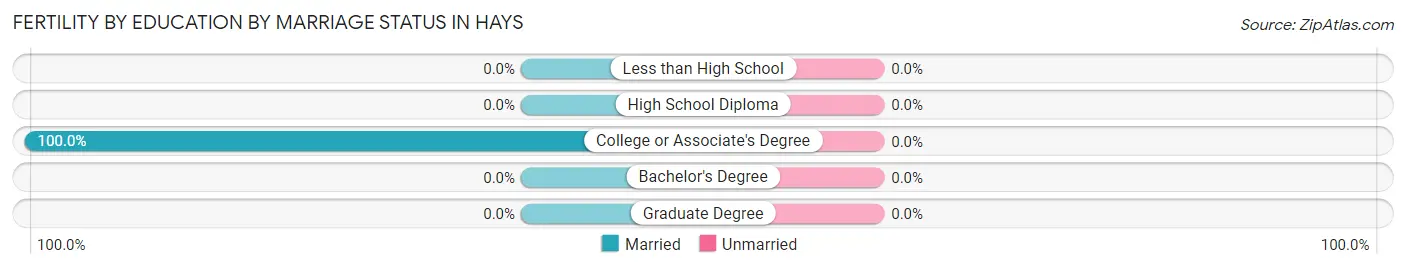
| Educational Attainment | Married | Unmarried |
| Less than High School | 0 (0.0%) | 0 (0.0%) |
| High School Diploma | 0 (0.0%) | 0 (0.0%) |
| College or Associate's Degree | 12 (100.0%) | 0 (0.0%) |
| Bachelor's Degree | 0 (0.0%) | 0 (0.0%) |
| Graduate Degree | 0 (0.0%) | 0 (0.0%) |
| Total | 12 (100.0%) | 0 (0.0%) |
Employment Characteristics in Hays
Employment by Class of Employer in Hays
Among the 346 employed individuals in Hays, private company employees (164 | 47.4%), federal government employees (109 | 31.5%), and not-for-profit organizations (20 | 5.8%) make up the most common classes of employment.
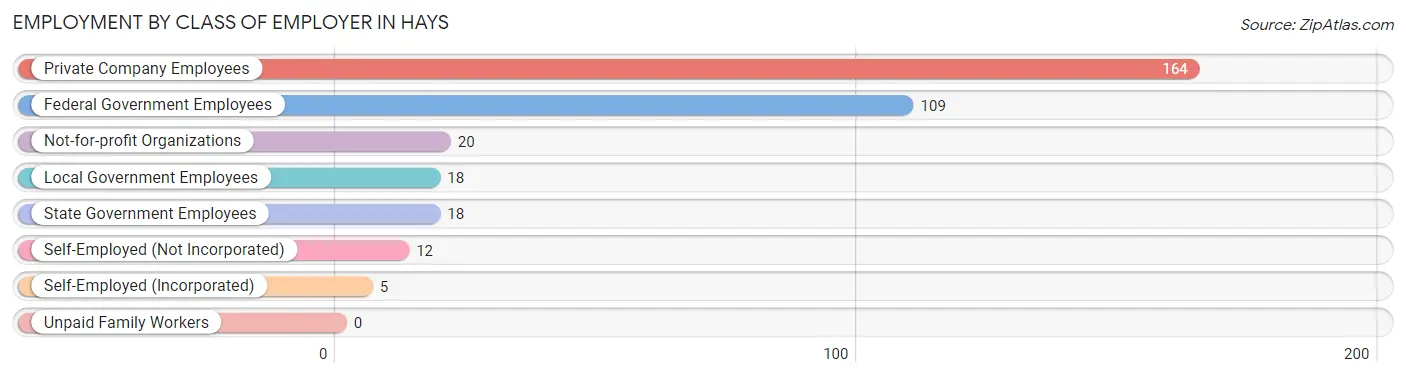
| Employer Class | # Employees | % Employees |
| Private Company Employees | 164 | 47.4% |
| Self-Employed (Incorporated) | 5 | 1.5% |
| Self-Employed (Not Incorporated) | 12 | 3.5% |
| Not-for-profit Organizations | 20 | 5.8% |
| Local Government Employees | 18 | 5.2% |
| State Government Employees | 18 | 5.2% |
| Federal Government Employees | 109 | 31.5% |
| Unpaid Family Workers | 0 | 0.0% |
| Total | 346 | 100.0% |
Employment Status by Age in Hays
According to the labor force statistics for Hays, out of the total population over 16 years of age (854), 57.1% or 488 individuals are in the labor force, with 27.5% or 134 of them unemployed. The age group with the highest labor force participation rate is 30 to 34 years, with 100.0% or 79 individuals in the labor force. Within the labor force, the 20 to 24 years age range has the highest percentage of unemployed individuals, with 82.4% or 56 of them being unemployed.
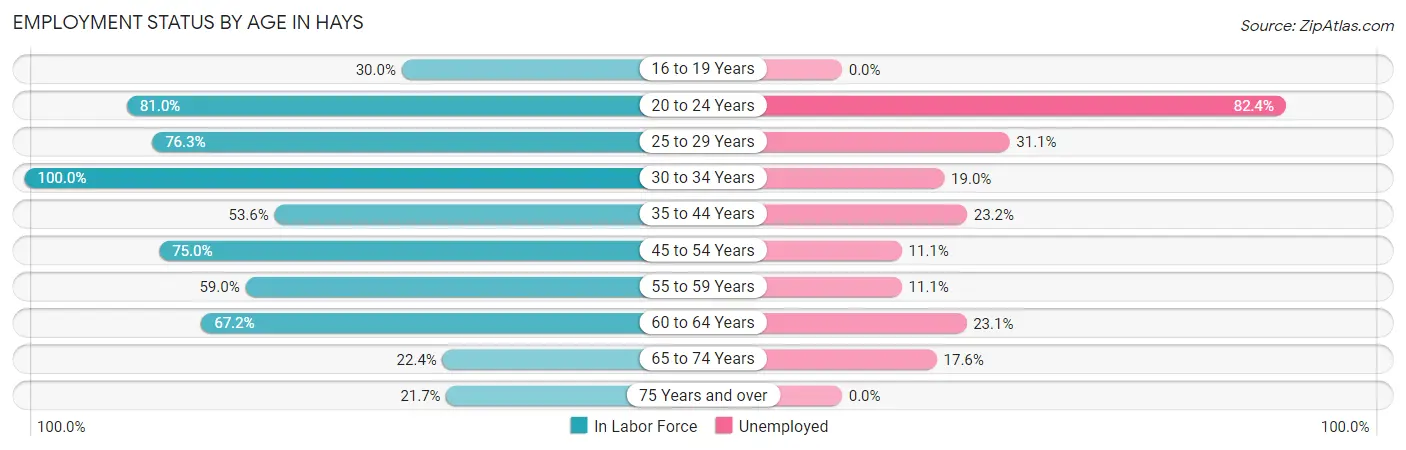
| Age Bracket | In Labor Force | Unemployed |
| 16 to 19 Years | 33 (30.0%) | 0 (0.0%) |
| 20 to 24 Years | 68 (81.0%) | 56 (82.4%) |
| 25 to 29 Years | 45 (76.3%) | 14 (31.1%) |
| 30 to 34 Years | 79 (100.0%) | 15 (19.0%) |
| 35 to 44 Years | 125 (53.6%) | 29 (23.2%) |
| 45 to 54 Years | 36 (75.0%) | 4 (11.1%) |
| 55 to 59 Years | 36 (59.0%) | 4 (11.1%) |
| 60 to 64 Years | 39 (67.2%) | 9 (23.1%) |
| 65 to 74 Years | 17 (22.4%) | 3 (17.6%) |
| 75 Years and over | 10 (21.7%) | 0 (0.0%) |
| Total | 488 (57.1%) | 134 (27.5%) |
Employment Status by Educational Attainment in Hays
According to labor force statistics for Hays, 66.9% of individuals (360) out of the total population between 25 and 64 years of age (538) are in the labor force, with 20.8% or 75 of them being unemployed. The group with the highest labor force participation rate are those with the educational attainment of high school diploma, with 80.0% or 96 individuals in the labor force. Within the labor force, individuals with college / associate degree education have the highest percentage of unemployment, with 32.0% or 55 of them being unemployed.
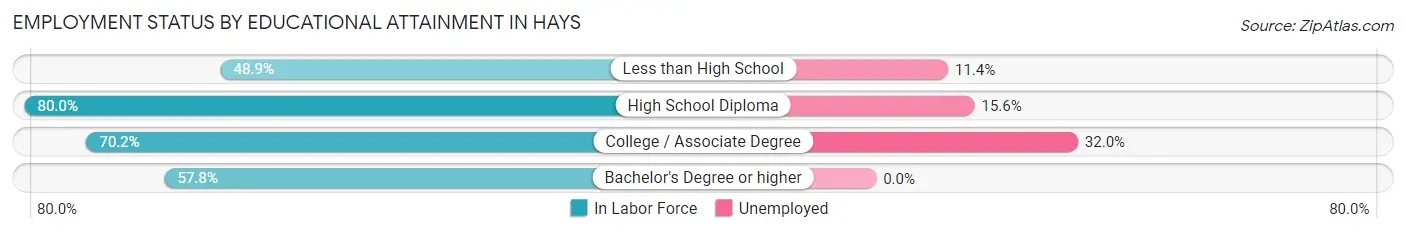
| Educational Attainment | In Labor Force | Unemployed |
| Less than High School | 44 (48.9%) | 10 (11.4%) |
| High School Diploma | 96 (80.0%) | 19 (15.6%) |
| College / Associate Degree | 172 (70.2%) | 78 (32.0%) |
| Bachelor's Degree or higher | 48 (57.8%) | 0 (0.0%) |
| Total | 360 (66.9%) | 112 (20.8%) |
Employment Occupations by Sex in Hays
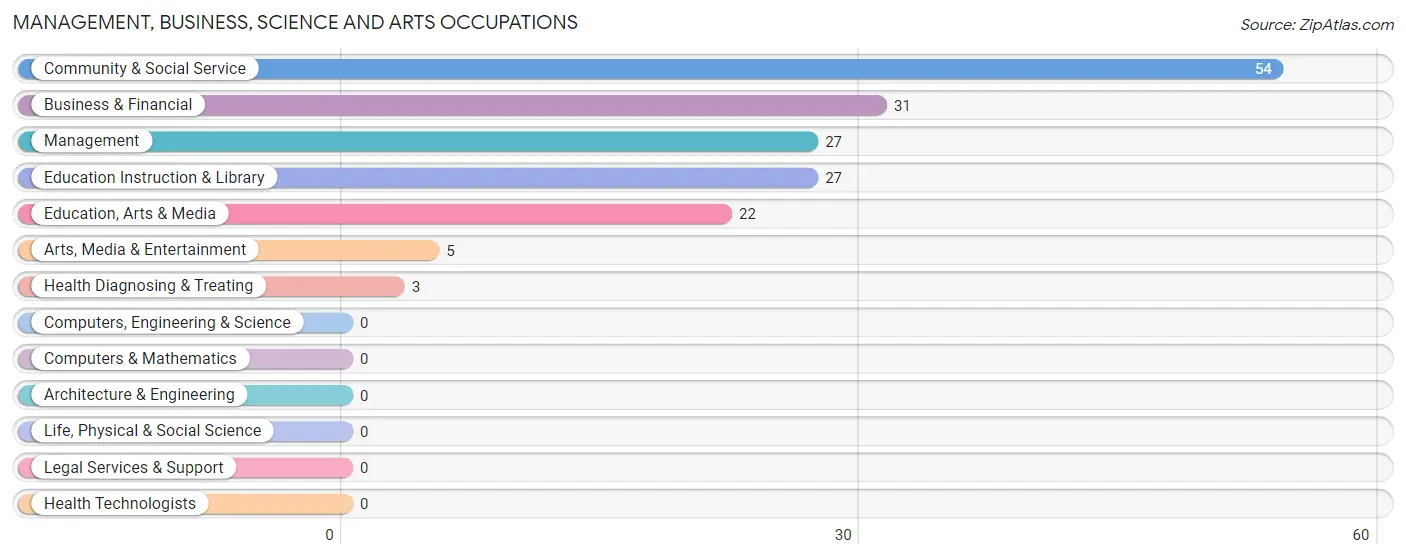
Management, Business, Science and Arts Occupations
The most common Management, Business, Science and Arts occupations in Hays are Community & Social Service (54 | 15.2%), Business & Financial (31 | 8.8%), Management (27 | 7.6%), Education Instruction & Library (27 | 7.6%), and Education, Arts & Media (22 | 6.2%).
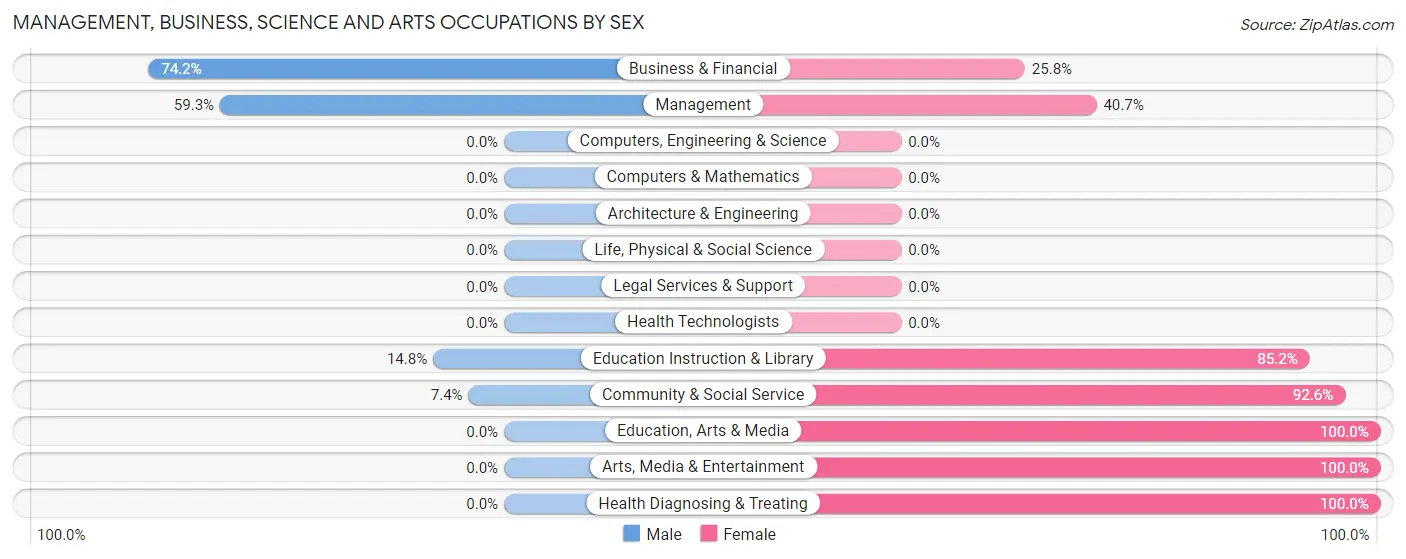
Management, Business, Science and Arts Occupations by Sex
Within the Management, Business, Science and Arts occupations in Hays, the most male-oriented occupations are Business & Financial (74.2%), Management (59.3%), and Education Instruction & Library (14.8%), while the most female-oriented occupations are Education, Arts & Media (100.0%), Arts, Media & Entertainment (100.0%), and Health Diagnosing & Treating (100.0%).
| Occupation | Male | Female |
| Management | 16 (59.3%) | 11 (40.7%) |
| Business & Financial | 23 (74.2%) | 8 (25.8%) |
| Computers, Engineering & Science | 0 (0.0%) | 0 (0.0%) |
| Computers & Mathematics | 0 (0.0%) | 0 (0.0%) |
| Architecture & Engineering | 0 (0.0%) | 0 (0.0%) |
| Life, Physical & Social Science | 0 (0.0%) | 0 (0.0%) |
| Community & Social Service | 4 (7.4%) | 50 (92.6%) |
| Education, Arts & Media | 0 (0.0%) | 22 (100.0%) |
| Legal Services & Support | 0 (0.0%) | 0 (0.0%) |
| Education Instruction & Library | 4 (14.8%) | 23 (85.2%) |
| Arts, Media & Entertainment | 0 (0.0%) | 5 (100.0%) |
| Health Diagnosing & Treating | 0 (0.0%) | 3 (100.0%) |
| Health Technologists | 0 (0.0%) | 0 (0.0%) |
| Total (Category) | 43 (37.4%) | 72 (62.6%) |
| Total (Overall) | 207 (58.5%) | 147 (41.5%) |
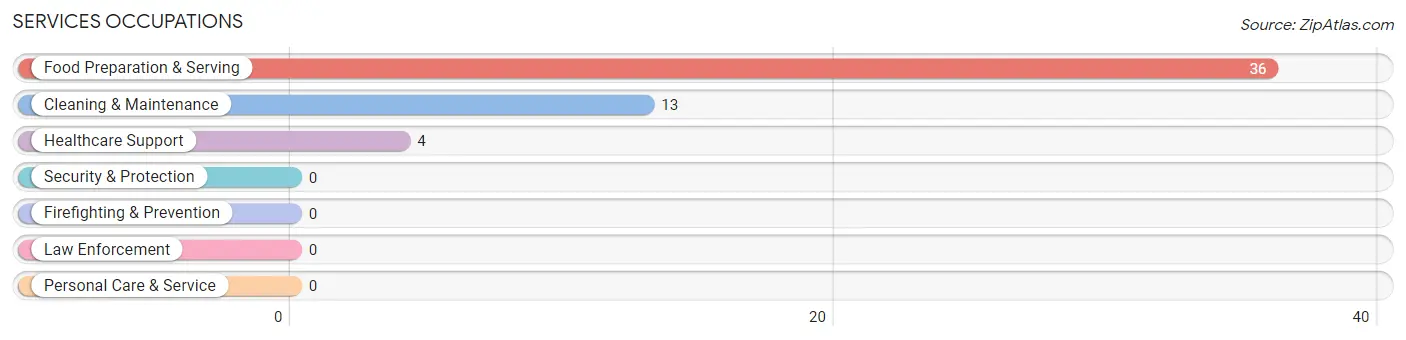
Services Occupations
The most common Services occupations in Hays are Food Preparation & Serving (36 | 10.2%), Cleaning & Maintenance (13 | 3.7%), and Healthcare Support (4 | 1.1%).
Services Occupations by Sex
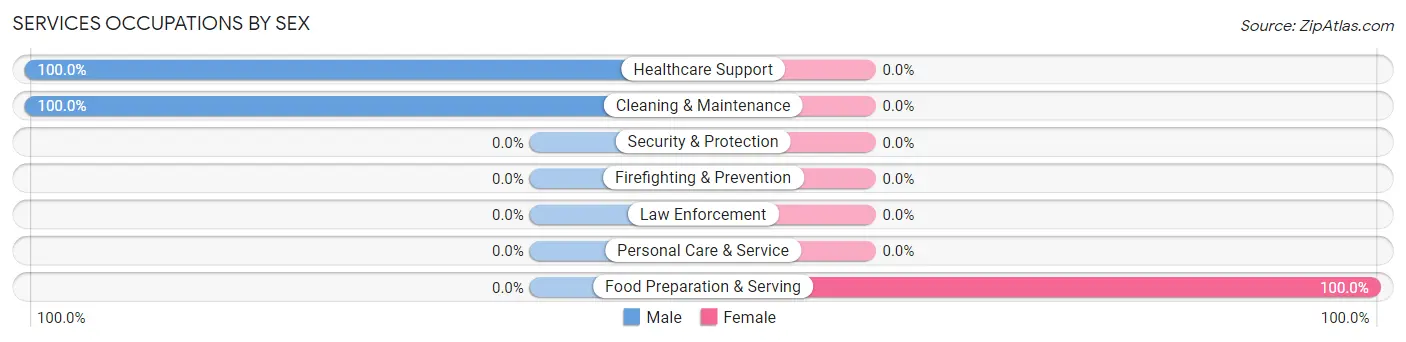
| Occupation | Male | Female |
| Healthcare Support | 4 (100.0%) | 0 (0.0%) |
| Security & Protection | 0 (0.0%) | 0 (0.0%) |
| Firefighting & Prevention | 0 (0.0%) | 0 (0.0%) |
| Law Enforcement | 0 (0.0%) | 0 (0.0%) |
| Food Preparation & Serving | 0 (0.0%) | 36 (100.0%) |
| Cleaning & Maintenance | 13 (100.0%) | 0 (0.0%) |
| Personal Care & Service | 0 (0.0%) | 0 (0.0%) |
| Total (Category) | 17 (32.1%) | 36 (67.9%) |
| Total (Overall) | 207 (58.5%) | 147 (41.5%) |
Sales and Office Occupations
The most common Sales and Office occupations in Hays are Office & Administration (47 | 13.3%), and Sales & Related (9 | 2.5%).
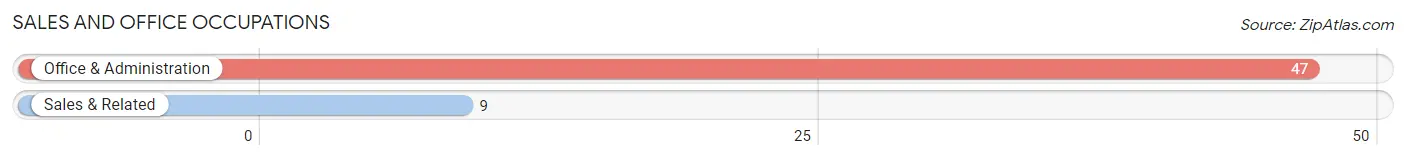
Sales and Office Occupations by Sex
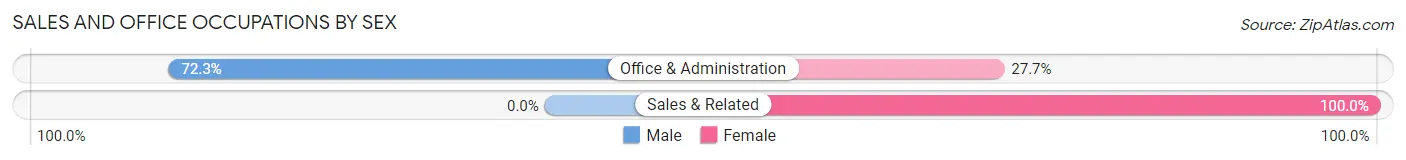
| Occupation | Male | Female |
| Sales & Related | 0 (0.0%) | 9 (100.0%) |
| Office & Administration | 34 (72.3%) | 13 (27.7%) |
| Total (Category) | 34 (60.7%) | 22 (39.3%) |
| Total (Overall) | 207 (58.5%) | 147 (41.5%) |
Natural Resources, Construction and Maintenance Occupations
The most common Natural Resources, Construction and Maintenance occupations in Hays are Construction & Extraction (110 | 31.1%), and Installation, Maintenance & Repair (5 | 1.4%).
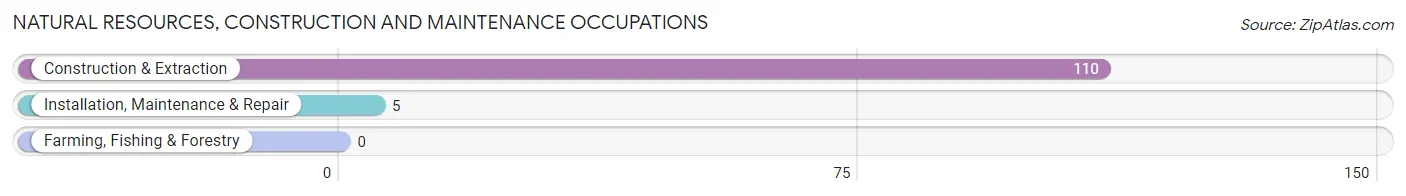
Natural Resources, Construction and Maintenance Occupations by Sex
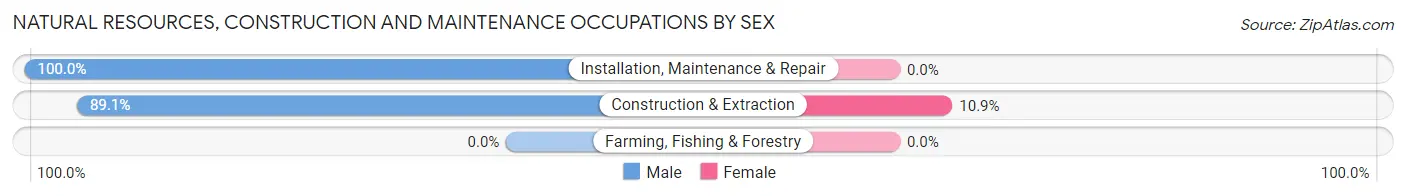
| Occupation | Male | Female |
| Farming, Fishing & Forestry | 0 (0.0%) | 0 (0.0%) |
| Construction & Extraction | 98 (89.1%) | 12 (10.9%) |
| Installation, Maintenance & Repair | 5 (100.0%) | 0 (0.0%) |
| Total (Category) | 103 (89.6%) | 12 (10.4%) |
| Total (Overall) | 207 (58.5%) | 147 (41.5%) |
Production, Transportation and Moving Occupations
The most common Production, Transportation and Moving occupations in Hays are , and Production (15 | 4.2%).
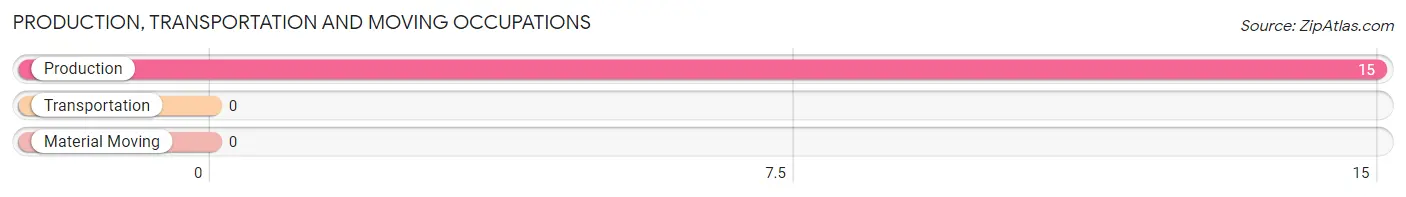
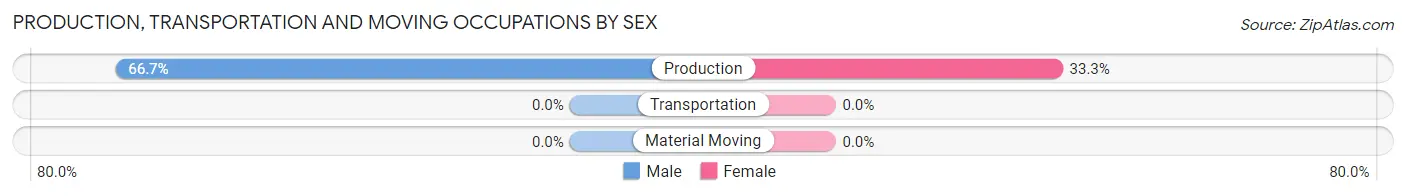
Production, Transportation and Moving Occupations by Sex
| Occupation | Male | Female |
| Production | 10 (66.7%) | 5 (33.3%) |
| Transportation | 0 (0.0%) | 0 (0.0%) |
| Material Moving | 0 (0.0%) | 0 (0.0%) |
| Total (Category) | 10 (66.7%) | 5 (33.3%) |
| Total (Overall) | 207 (58.5%) | 147 (41.5%) |
Employment Industries by Sex in Hays
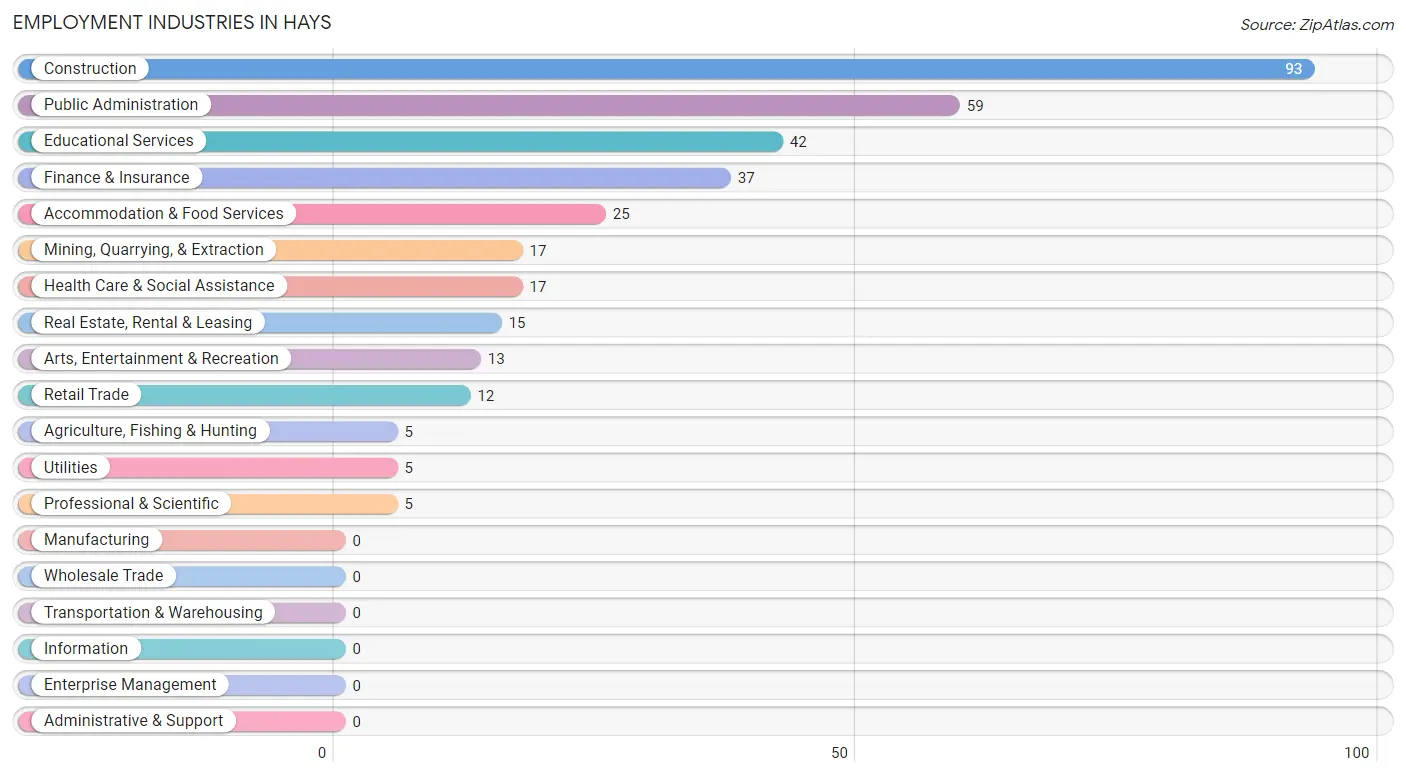
Employment Industries in Hays
The major employment industries in Hays include Construction (93 | 26.3%), Public Administration (59 | 16.7%), Educational Services (42 | 11.9%), Finance & Insurance (37 | 10.4%), and Accommodation & Food Services (25 | 7.1%).
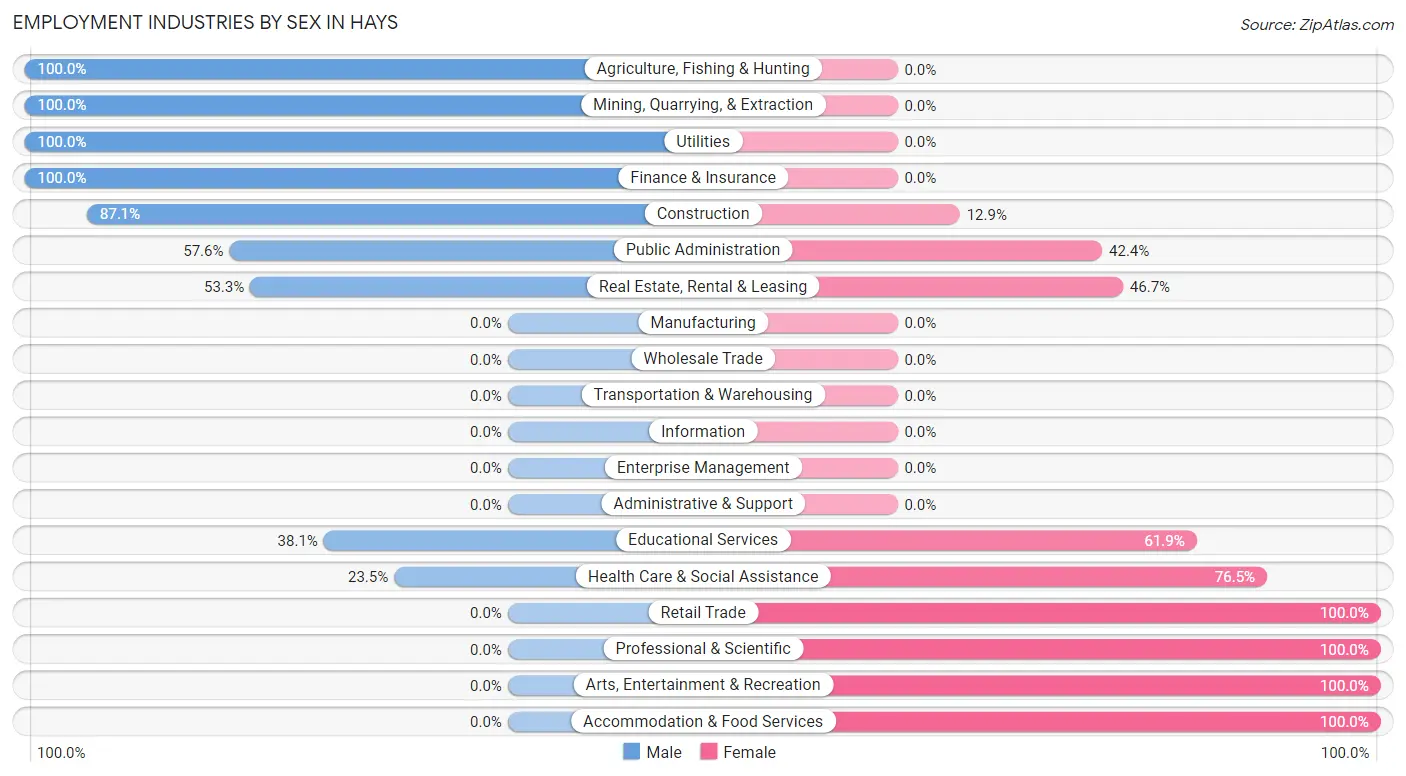
Employment Industries by Sex in Hays
The Hays industries that see more men than women are Agriculture, Fishing & Hunting (100.0%), Mining, Quarrying, & Extraction (100.0%), and Utilities (100.0%), whereas the industries that tend to have a higher number of women are Retail Trade (100.0%), Professional & Scientific (100.0%), and Arts, Entertainment & Recreation (100.0%).
| Industry | Male | Female |
| Agriculture, Fishing & Hunting | 5 (100.0%) | 0 (0.0%) |
| Mining, Quarrying, & Extraction | 17 (100.0%) | 0 (0.0%) |
| Construction | 81 (87.1%) | 12 (12.9%) |
| Manufacturing | 0 (0.0%) | 0 (0.0%) |
| Wholesale Trade | 0 (0.0%) | 0 (0.0%) |
| Retail Trade | 0 (0.0%) | 12 (100.0%) |
| Transportation & Warehousing | 0 (0.0%) | 0 (0.0%) |
| Utilities | 5 (100.0%) | 0 (0.0%) |
| Information | 0 (0.0%) | 0 (0.0%) |
| Finance & Insurance | 37 (100.0%) | 0 (0.0%) |
| Real Estate, Rental & Leasing | 8 (53.3%) | 7 (46.7%) |
| Professional & Scientific | 0 (0.0%) | 5 (100.0%) |
| Enterprise Management | 0 (0.0%) | 0 (0.0%) |
| Administrative & Support | 0 (0.0%) | 0 (0.0%) |
| Educational Services | 16 (38.1%) | 26 (61.9%) |
| Health Care & Social Assistance | 4 (23.5%) | 13 (76.5%) |
| Arts, Entertainment & Recreation | 0 (0.0%) | 13 (100.0%) |
| Accommodation & Food Services | 0 (0.0%) | 25 (100.0%) |
| Public Administration | 34 (57.6%) | 25 (42.4%) |
| Total | 207 (58.5%) | 147 (41.5%) |
Education in Hays
School Enrollment in Hays
The most common levels of schooling among the 288 students in Hays are middle school (92 | 31.9%), high school (79 | 27.4%), and elementary school (65 | 22.6%).
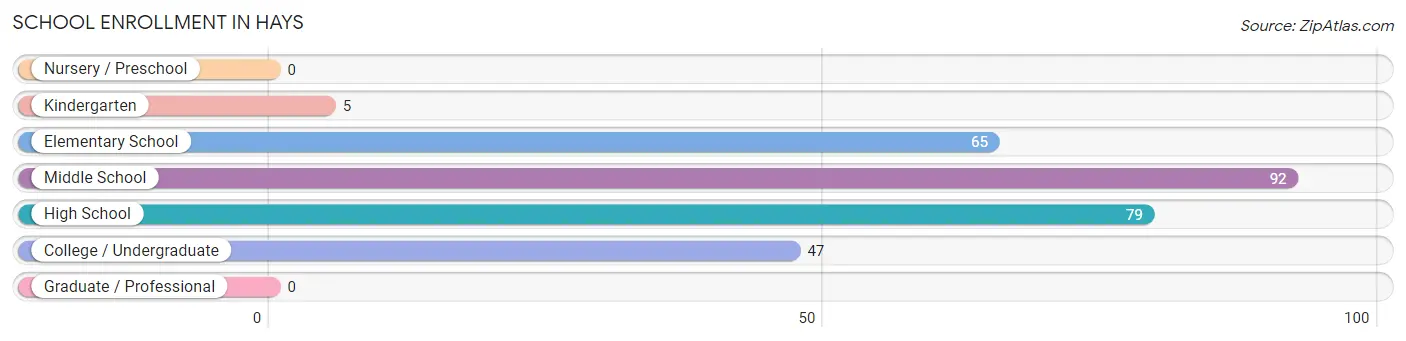
| School Level | # Students | % Students |
| Nursery / Preschool | 0 | 0.0% |
| Kindergarten | 5 | 1.7% |
| Elementary School | 65 | 22.6% |
| Middle School | 92 | 31.9% |
| High School | 79 | 27.4% |
| College / Undergraduate | 47 | 16.3% |
| Graduate / Professional | 0 | 0.0% |
| Total | 288 | 100.0% |
School Enrollment by Age by Funding Source in Hays
Out of a total of 288 students who are enrolled in schools in Hays, 9 (3.1%) attend a private institution, while the remaining 279 (96.9%) are enrolled in public schools. The age group of 5 to 9 year old has the highest likelihood of being enrolled in private schools, with 4 (6.1% in the age bracket) enrolled. Conversely, the age group of 15 to 17 year olds has the lowest likelihood of being enrolled in a private school, with 56 (100.0% in the age bracket) attending a public institution.
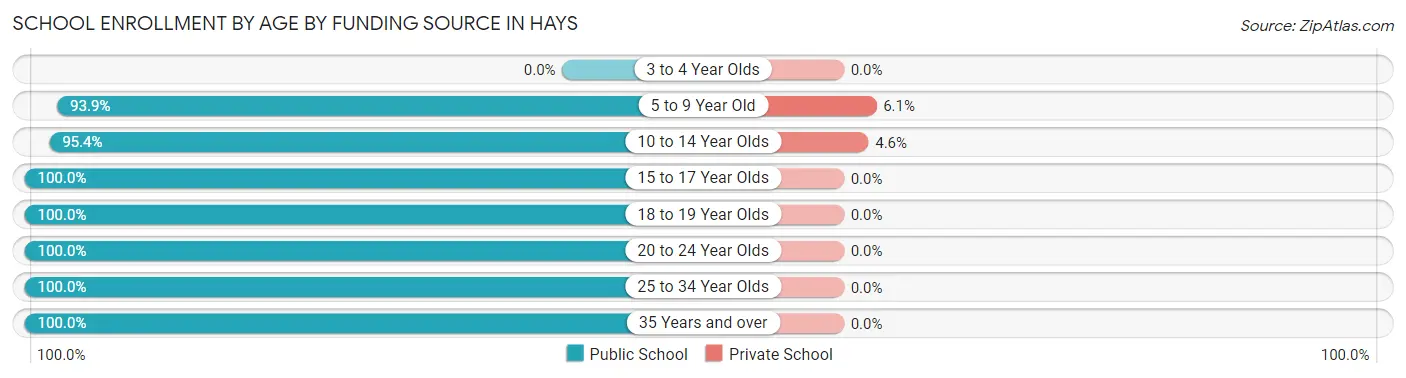
| Age Bracket | Public School | Private School |
| 3 to 4 Year Olds | 0 (0.0%) | 0 (0.0%) |
| 5 to 9 Year Old | 62 (93.9%) | 4 (6.1%) |
| 10 to 14 Year Olds | 104 (95.4%) | 5 (4.6%) |
| 15 to 17 Year Olds | 56 (100.0%) | 0 (0.0%) |
| 18 to 19 Year Olds | 10 (100.0%) | 0 (0.0%) |
| 20 to 24 Year Olds | 34 (100.0%) | 0 (0.0%) |
| 25 to 34 Year Olds | 5 (100.0%) | 0 (0.0%) |
| 35 Years and over | 8 (100.0%) | 0 (0.0%) |
| Total | 279 (96.9%) | 9 (3.1%) |
Educational Attainment by Field of Study in Hays
Education (63 | 52.1%), business (20 | 16.5%), science & technology (14 | 11.6%), bio, nature & agricultural (12 | 9.9%), and arts & humanities (10 | 8.3%) are the most common fields of study among 121 individuals in Hays who have obtained a bachelor's degree or higher.
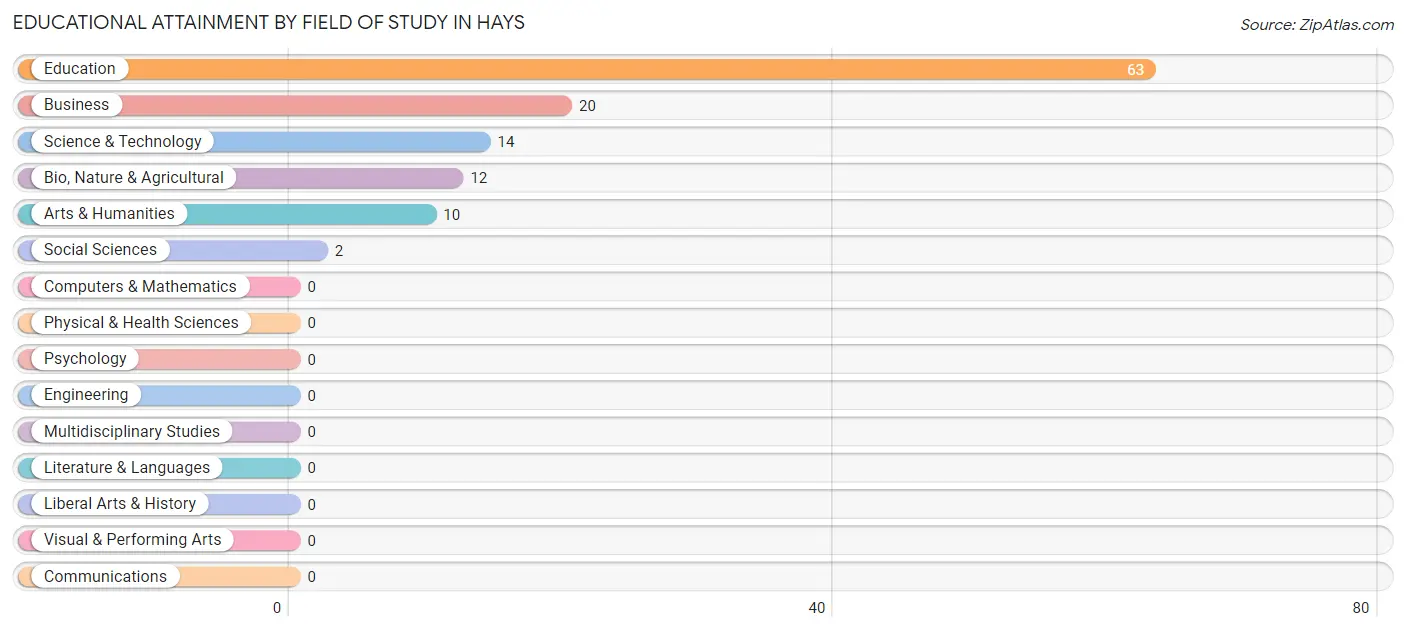
| Field of Study | # Graduates | % Graduates |
| Computers & Mathematics | 0 | 0.0% |
| Bio, Nature & Agricultural | 12 | 9.9% |
| Physical & Health Sciences | 0 | 0.0% |
| Psychology | 0 | 0.0% |
| Social Sciences | 2 | 1.7% |
| Engineering | 0 | 0.0% |
| Multidisciplinary Studies | 0 | 0.0% |
| Science & Technology | 14 | 11.6% |
| Business | 20 | 16.5% |
| Education | 63 | 52.1% |
| Literature & Languages | 0 | 0.0% |
| Liberal Arts & History | 0 | 0.0% |
| Visual & Performing Arts | 0 | 0.0% |
| Communications | 0 | 0.0% |
| Arts & Humanities | 10 | 8.3% |
| Total | 121 | 100.0% |
Transportation & Commute in Hays
Vehicle Availability by Sex in Hays
The most prevalent vehicle ownership categories in Hays are males with 4 vehicles (59, accounting for 29.2%) and females with 4 vehicles (18, making up 41.0%).
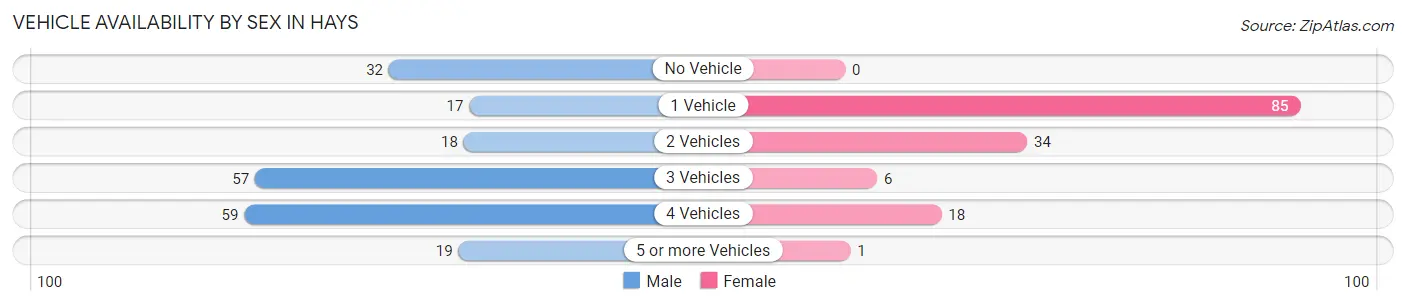
| Vehicles Available | Male | Female |
| No Vehicle | 32 (15.8%) | 0 (0.0%) |
| 1 Vehicle | 17 (8.4%) | 85 (59.0%) |
| 2 Vehicles | 18 (8.9%) | 34 (23.6%) |
| 3 Vehicles | 57 (28.2%) | 6 (4.2%) |
| 4 Vehicles | 59 (29.2%) | 18 (12.5%) |
| 5 or more Vehicles | 19 (9.4%) | 1 (0.7%) |
| Total | 202 (100.0%) | 144 (100.0%) |
Commute Time in Hays
The most frequently occuring commute durations in Hays are 5 to 9 minutes (88 commuters, 27.8%), less than 5 minutes (76 commuters, 24.0%), and 10 to 14 minutes (55 commuters, 17.3%).
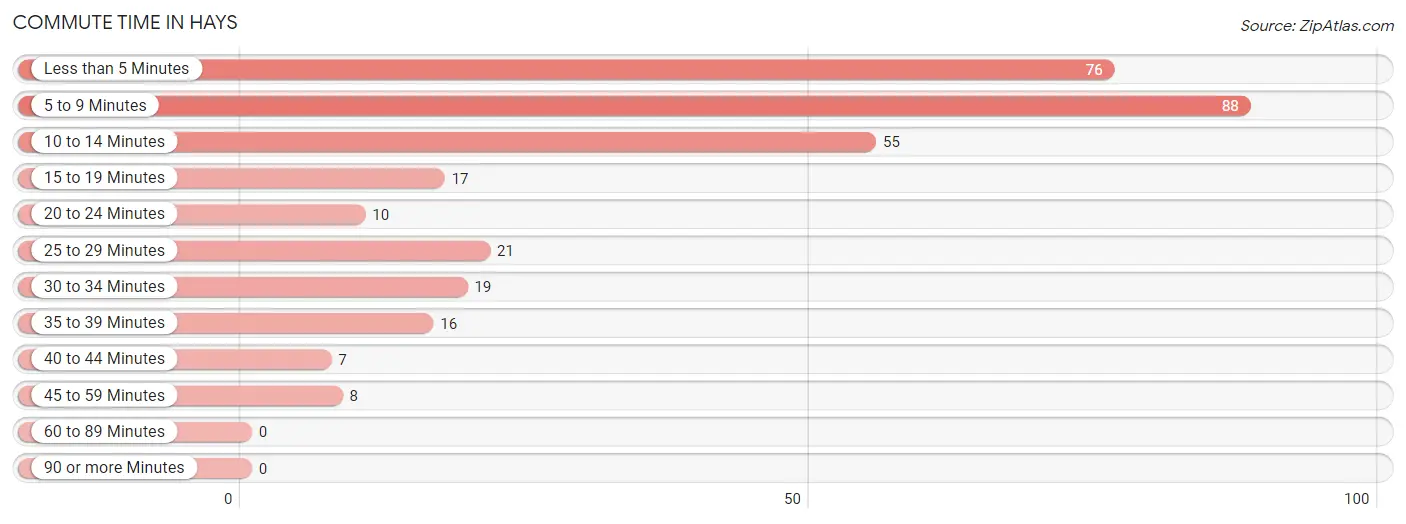
| Commute Time | # Commuters | % Commuters |
| Less than 5 Minutes | 76 | 24.0% |
| 5 to 9 Minutes | 88 | 27.8% |
| 10 to 14 Minutes | 55 | 17.3% |
| 15 to 19 Minutes | 17 | 5.4% |
| 20 to 24 Minutes | 10 | 3.2% |
| 25 to 29 Minutes | 21 | 6.6% |
| 30 to 34 Minutes | 19 | 6.0% |
| 35 to 39 Minutes | 16 | 5.1% |
| 40 to 44 Minutes | 7 | 2.2% |
| 45 to 59 Minutes | 8 | 2.5% |
| 60 to 89 Minutes | 0 | 0.0% |
| 90 or more Minutes | 0 | 0.0% |
Commute Time by Sex in Hays
The most common commute times in Hays are 10 to 14 minutes (51 commuters, 29.5%) for males and 5 to 9 minutes (54 commuters, 37.5%) for females.
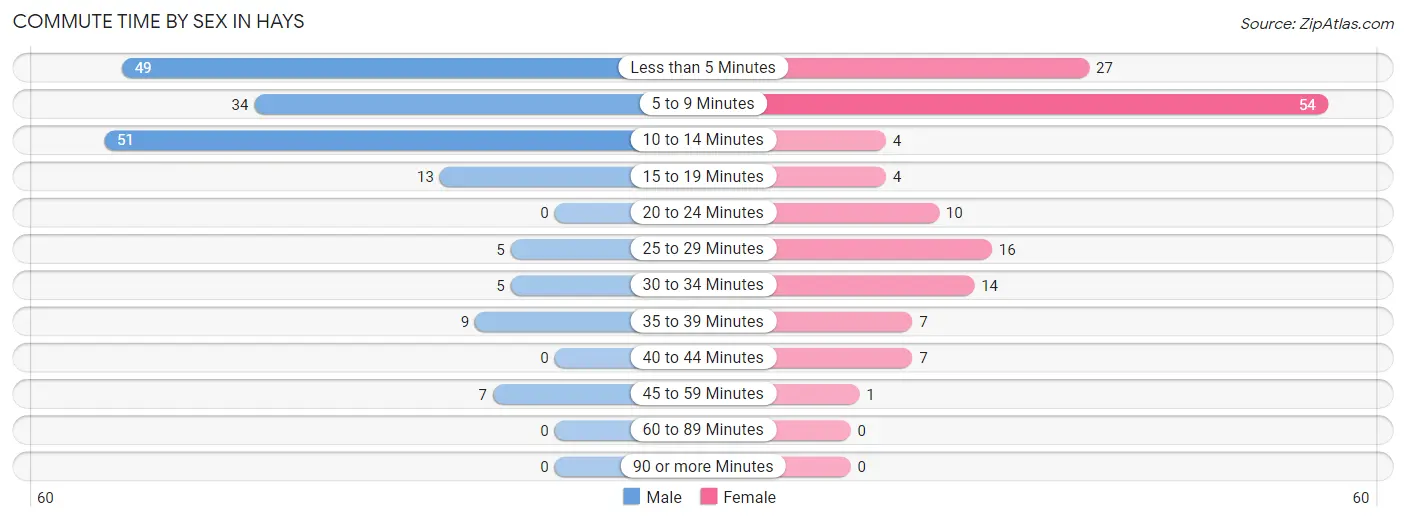
| Commute Time | Male | Female |
| Less than 5 Minutes | 49 (28.3%) | 27 (18.8%) |
| 5 to 9 Minutes | 34 (19.7%) | 54 (37.5%) |
| 10 to 14 Minutes | 51 (29.5%) | 4 (2.8%) |
| 15 to 19 Minutes | 13 (7.5%) | 4 (2.8%) |
| 20 to 24 Minutes | 0 (0.0%) | 10 (6.9%) |
| 25 to 29 Minutes | 5 (2.9%) | 16 (11.1%) |
| 30 to 34 Minutes | 5 (2.9%) | 14 (9.7%) |
| 35 to 39 Minutes | 9 (5.2%) | 7 (4.9%) |
| 40 to 44 Minutes | 0 (0.0%) | 7 (4.9%) |
| 45 to 59 Minutes | 7 (4.1%) | 1 (0.7%) |
| 60 to 89 Minutes | 0 (0.0%) | 0 (0.0%) |
| 90 or more Minutes | 0 (0.0%) | 0 (0.0%) |
Time of Departure to Work by Sex in Hays
The most frequent times of departure to work in Hays are 7:30 AM to 7:59 AM (90, 52.0%) for males and 7:30 AM to 7:59 AM (63, 43.8%) for females.
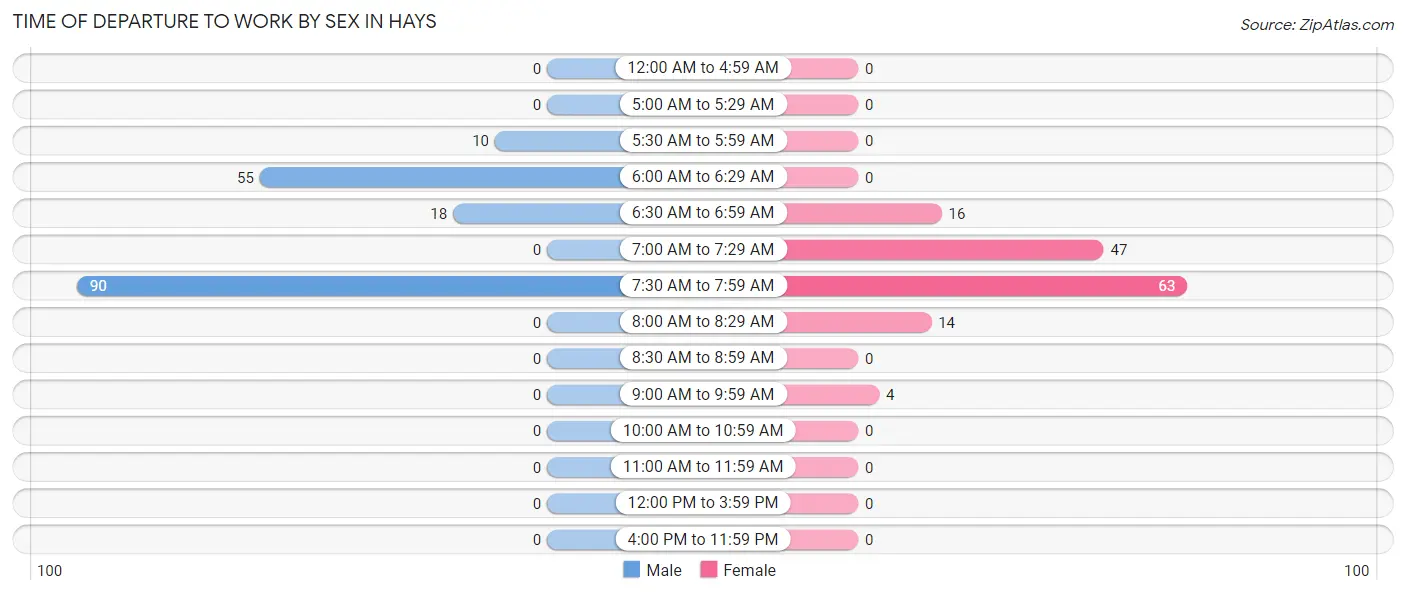
| Time of Departure | Male | Female |
| 12:00 AM to 4:59 AM | 0 (0.0%) | 0 (0.0%) |
| 5:00 AM to 5:29 AM | 0 (0.0%) | 0 (0.0%) |
| 5:30 AM to 5:59 AM | 10 (5.8%) | 0 (0.0%) |
| 6:00 AM to 6:29 AM | 55 (31.8%) | 0 (0.0%) |
| 6:30 AM to 6:59 AM | 18 (10.4%) | 16 (11.1%) |
| 7:00 AM to 7:29 AM | 0 (0.0%) | 47 (32.6%) |
| 7:30 AM to 7:59 AM | 90 (52.0%) | 63 (43.8%) |
| 8:00 AM to 8:29 AM | 0 (0.0%) | 14 (9.7%) |
| 8:30 AM to 8:59 AM | 0 (0.0%) | 0 (0.0%) |
| 9:00 AM to 9:59 AM | 0 (0.0%) | 4 (2.8%) |
| 10:00 AM to 10:59 AM | 0 (0.0%) | 0 (0.0%) |
| 11:00 AM to 11:59 AM | 0 (0.0%) | 0 (0.0%) |
| 12:00 PM to 3:59 PM | 0 (0.0%) | 0 (0.0%) |
| 4:00 PM to 11:59 PM | 0 (0.0%) | 0 (0.0%) |
| Total | 173 (100.0%) | 144 (100.0%) |
Housing Occupancy in Hays
Occupancy by Ownership in Hays
Of the total 242 dwellings in Hays, owner-occupied units account for 134 (55.4%), while renter-occupied units make up 108 (44.6%).
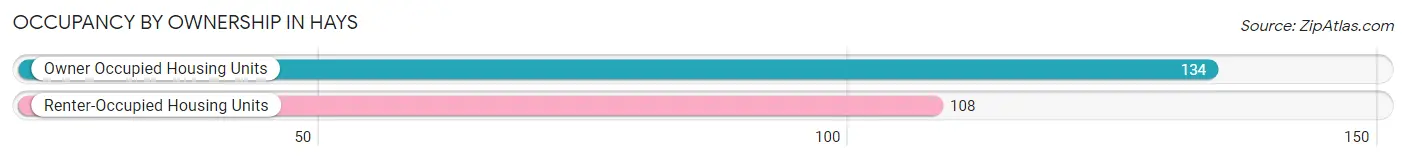
| Occupancy | # Housing Units | % Housing Units |
| Owner Occupied Housing Units | 134 | 55.4% |
| Renter-Occupied Housing Units | 108 | 44.6% |
| Total Occupied Housing Units | 242 | 100.0% |
Occupancy by Household Size in Hays
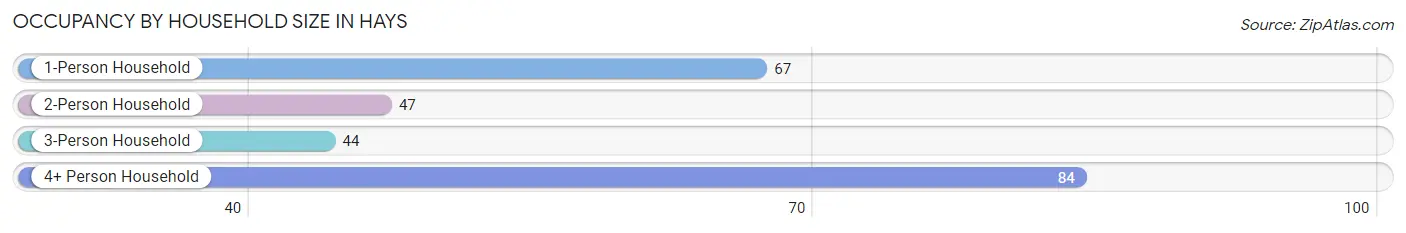
| Household Size | # Housing Units | % Housing Units |
| 1-Person Household | 67 | 27.7% |
| 2-Person Household | 47 | 19.4% |
| 3-Person Household | 44 | 18.2% |
| 4+ Person Household | 84 | 34.7% |
| Total Housing Units | 242 | 100.0% |
Occupancy by Ownership by Household Size in Hays
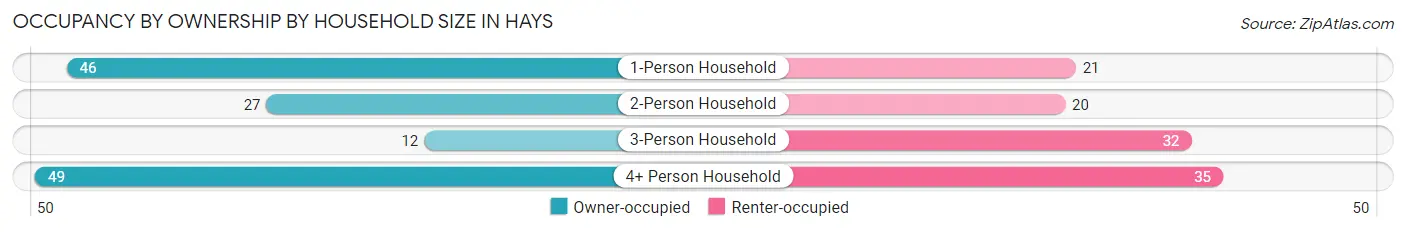
| Household Size | Owner-occupied | Renter-occupied |
| 1-Person Household | 46 (68.7%) | 21 (31.3%) |
| 2-Person Household | 27 (57.5%) | 20 (42.5%) |
| 3-Person Household | 12 (27.3%) | 32 (72.7%) |
| 4+ Person Household | 49 (58.3%) | 35 (41.7%) |
| Total Housing Units | 134 (55.4%) | 108 (44.6%) |
Occupancy by Educational Attainment in Hays
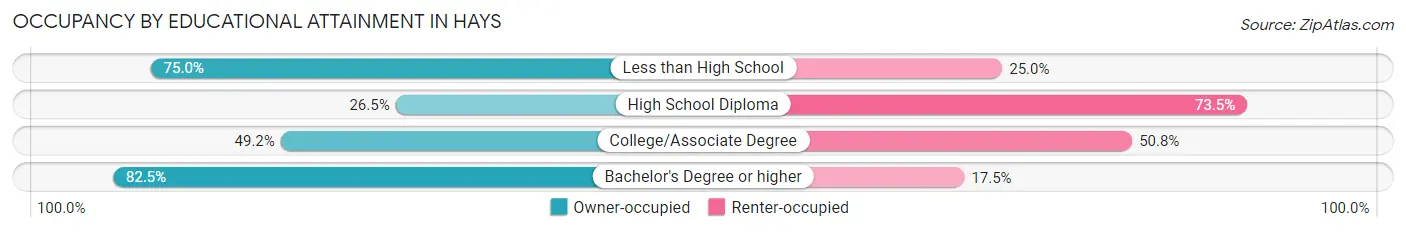
| Household Size | Owner-occupied | Renter-occupied |
| Less than High School | 27 (75.0%) | 9 (25.0%) |
| High School Diploma | 9 (26.5%) | 25 (73.5%) |
| College/Associate Degree | 65 (49.2%) | 67 (50.8%) |
| Bachelor's Degree or higher | 33 (82.5%) | 7 (17.5%) |
Occupancy by Age of Householder in Hays
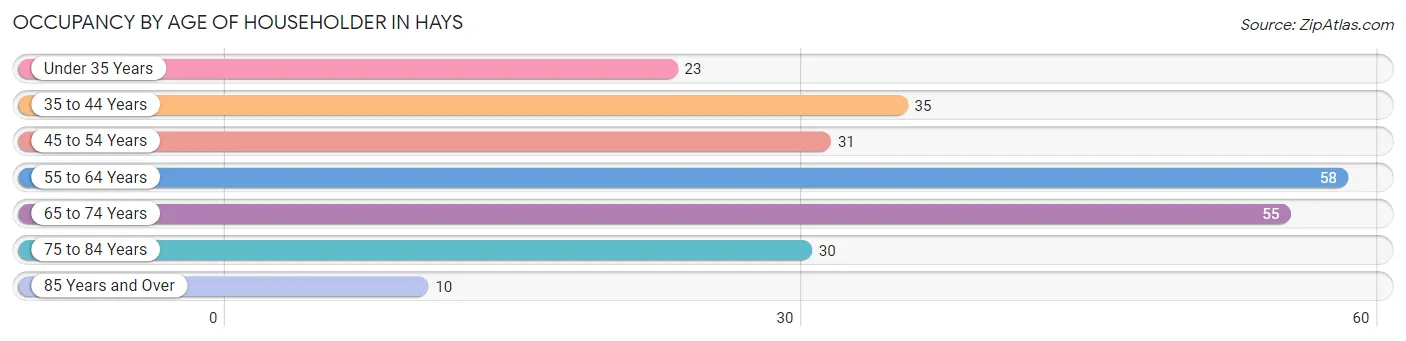
| Age Bracket | # Households | % Households |
| Under 35 Years | 23 | 9.5% |
| 35 to 44 Years | 35 | 14.5% |
| 45 to 54 Years | 31 | 12.8% |
| 55 to 64 Years | 58 | 24.0% |
| 65 to 74 Years | 55 | 22.7% |
| 75 to 84 Years | 30 | 12.4% |
| 85 Years and Over | 10 | 4.1% |
| Total | 242 | 100.0% |
Housing Finances in Hays
Median Income by Occupancy in Hays
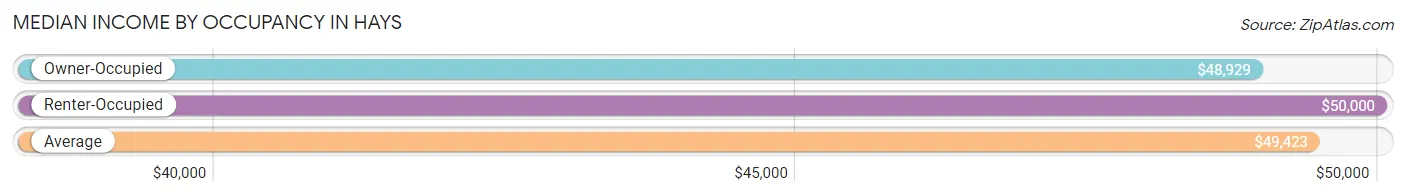
| Occupancy Type | # Households | Median Income |
| Owner-Occupied | 134 (55.4%) | $48,929 |
| Renter-Occupied | 108 (44.6%) | $50,000 |
| Average | 242 (100.0%) | $49,423 |
Occupancy by Householder Income Bracket in Hays
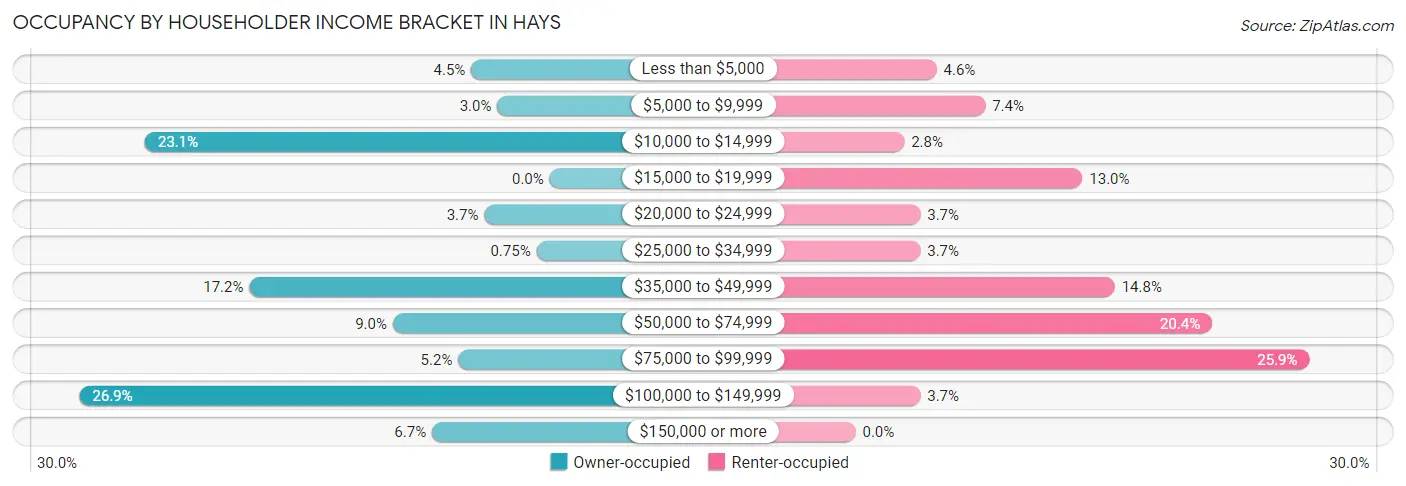
| Income Bracket | Owner-occupied | Renter-occupied |
| Less than $5,000 | 6 (4.5%) | 5 (4.6%) |
| $5,000 to $9,999 | 4 (3.0%) | 8 (7.4%) |
| $10,000 to $14,999 | 31 (23.1%) | 3 (2.8%) |
| $15,000 to $19,999 | 0 (0.0%) | 14 (13.0%) |
| $20,000 to $24,999 | 5 (3.7%) | 4 (3.7%) |
| $25,000 to $34,999 | 1 (0.7%) | 4 (3.7%) |
| $35,000 to $49,999 | 23 (17.2%) | 16 (14.8%) |
| $50,000 to $74,999 | 12 (9.0%) | 22 (20.4%) |
| $75,000 to $99,999 | 7 (5.2%) | 28 (25.9%) |
| $100,000 to $149,999 | 36 (26.9%) | 4 (3.7%) |
| $150,000 or more | 9 (6.7%) | 0 (0.0%) |
| Total | 134 (100.0%) | 108 (100.0%) |
Monthly Housing Cost Tiers in Hays
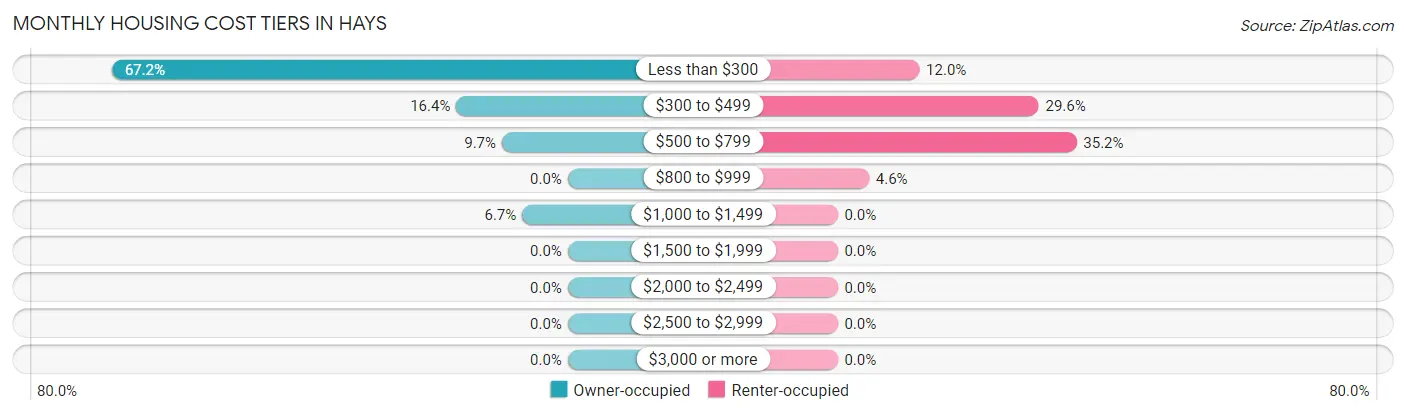
| Monthly Cost | Owner-occupied | Renter-occupied |
| Less than $300 | 90 (67.2%) | 13 (12.0%) |
| $300 to $499 | 22 (16.4%) | 32 (29.6%) |
| $500 to $799 | 13 (9.7%) | 38 (35.2%) |
| $800 to $999 | 0 (0.0%) | 5 (4.6%) |
| $1,000 to $1,499 | 9 (6.7%) | 0 (0.0%) |
| $1,500 to $1,999 | 0 (0.0%) | 0 (0.0%) |
| $2,000 to $2,499 | 0 (0.0%) | 0 (0.0%) |
| $2,500 to $2,999 | 0 (0.0%) | 0 (0.0%) |
| $3,000 or more | 0 (0.0%) | 0 (0.0%) |
| Total | 134 (100.0%) | 108 (100.0%) |
Physical Housing Characteristics in Hays
Housing Structures in Hays
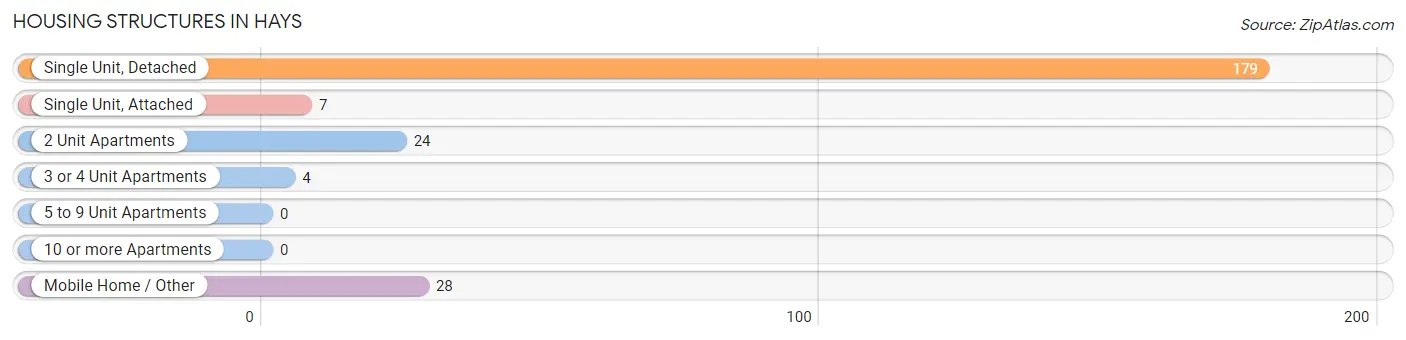
| Structure Type | # Housing Units | % Housing Units |
| Single Unit, Detached | 179 | 74.0% |
| Single Unit, Attached | 7 | 2.9% |
| 2 Unit Apartments | 24 | 9.9% |
| 3 or 4 Unit Apartments | 4 | 1.7% |
| 5 to 9 Unit Apartments | 0 | 0.0% |
| 10 or more Apartments | 0 | 0.0% |
| Mobile Home / Other | 28 | 11.6% |
| Total | 242 | 100.0% |
Housing Structures by Occupancy in Hays
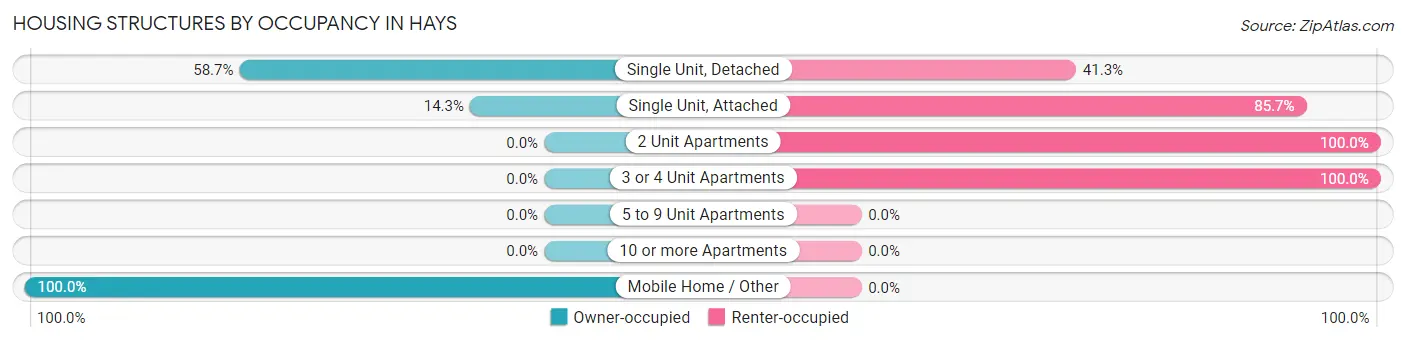
| Structure Type | Owner-occupied | Renter-occupied |
| Single Unit, Detached | 105 (58.7%) | 74 (41.3%) |
| Single Unit, Attached | 1 (14.3%) | 6 (85.7%) |
| 2 Unit Apartments | 0 (0.0%) | 24 (100.0%) |
| 3 or 4 Unit Apartments | 0 (0.0%) | 4 (100.0%) |
| 5 to 9 Unit Apartments | 0 (0.0%) | 0 (0.0%) |
| 10 or more Apartments | 0 (0.0%) | 0 (0.0%) |
| Mobile Home / Other | 28 (100.0%) | 0 (0.0%) |
| Total | 134 (55.4%) | 108 (44.6%) |
Housing Structures by Number of Rooms in Hays
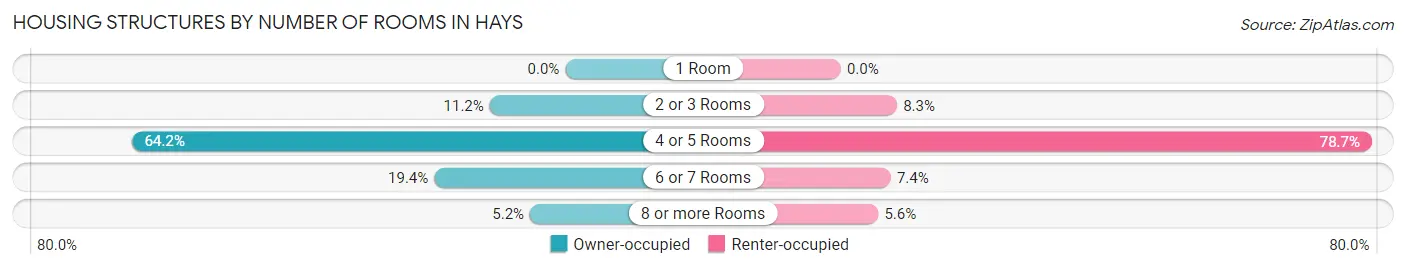
| Number of Rooms | Owner-occupied | Renter-occupied |
| 1 Room | 0 (0.0%) | 0 (0.0%) |
| 2 or 3 Rooms | 15 (11.2%) | 9 (8.3%) |
| 4 or 5 Rooms | 86 (64.2%) | 85 (78.7%) |
| 6 or 7 Rooms | 26 (19.4%) | 8 (7.4%) |
| 8 or more Rooms | 7 (5.2%) | 6 (5.6%) |
| Total | 134 (100.0%) | 108 (100.0%) |
Housing Structure by Heating Type in Hays
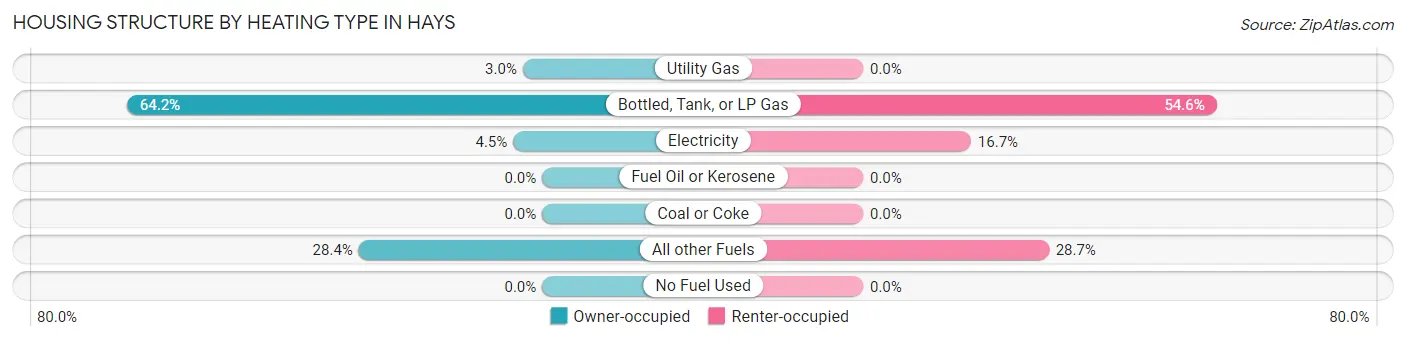
| Heating Type | Owner-occupied | Renter-occupied |
| Utility Gas | 4 (3.0%) | 0 (0.0%) |
| Bottled, Tank, or LP Gas | 86 (64.2%) | 59 (54.6%) |
| Electricity | 6 (4.5%) | 18 (16.7%) |
| Fuel Oil or Kerosene | 0 (0.0%) | 0 (0.0%) |
| Coal or Coke | 0 (0.0%) | 0 (0.0%) |
| All other Fuels | 38 (28.4%) | 31 (28.7%) |
| No Fuel Used | 0 (0.0%) | 0 (0.0%) |
| Total | 134 (100.0%) | 108 (100.0%) |
Household Vehicle Usage in Hays
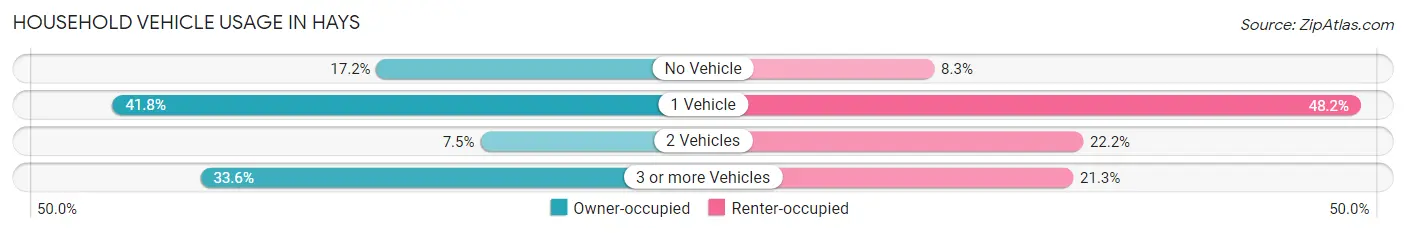
| Vehicles per Household | Owner-occupied | Renter-occupied |
| No Vehicle | 23 (17.2%) | 9 (8.3%) |
| 1 Vehicle | 56 (41.8%) | 52 (48.1%) |
| 2 Vehicles | 10 (7.5%) | 24 (22.2%) |
| 3 or more Vehicles | 45 (33.6%) | 23 (21.3%) |
| Total | 134 (100.0%) | 108 (100.0%) |
Real Estate & Mortgages in Hays
Real Estate and Mortgage Overview in Hays
| Characteristic | Without Mortgage | With Mortgage |
| Housing Units | 123 | 11 |
| Median Property Value | $61,100 | $0 |
| Median Household Income | $46,563 | $9 |
| Monthly Housing Costs | $260 | $0 |
| Real Estate Taxes | $199 | $11 |
Property Value by Mortgage Status in Hays
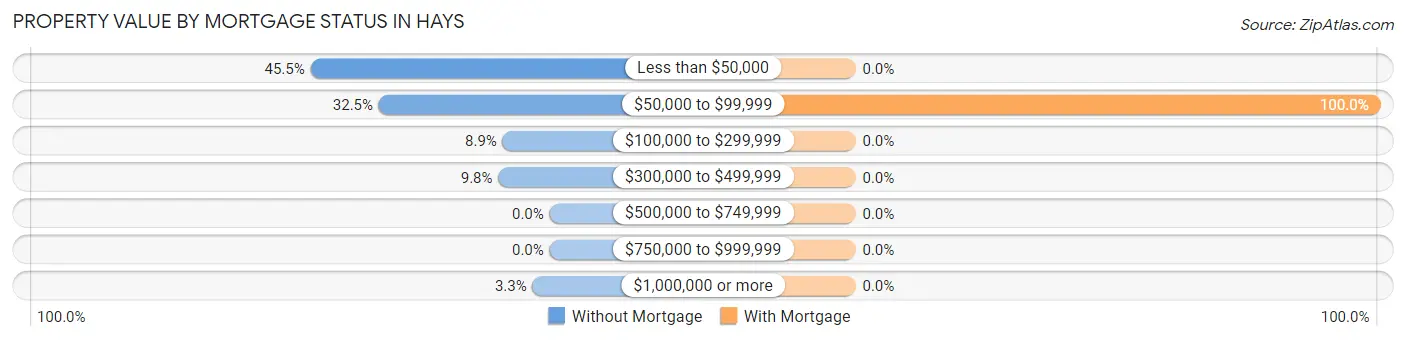
| Property Value | Without Mortgage | With Mortgage |
| Less than $50,000 | 56 (45.5%) | 0 (0.0%) |
| $50,000 to $99,999 | 40 (32.5%) | 11 (100.0%) |
| $100,000 to $299,999 | 11 (8.9%) | 0 (0.0%) |
| $300,000 to $499,999 | 12 (9.8%) | 0 (0.0%) |
| $500,000 to $749,999 | 0 (0.0%) | 0 (0.0%) |
| $750,000 to $999,999 | 0 (0.0%) | 0 (0.0%) |
| $1,000,000 or more | 4 (3.3%) | 0 (0.0%) |
| Total | 123 (100.0%) | 11 (100.0%) |
Household Income by Mortgage Status in Hays
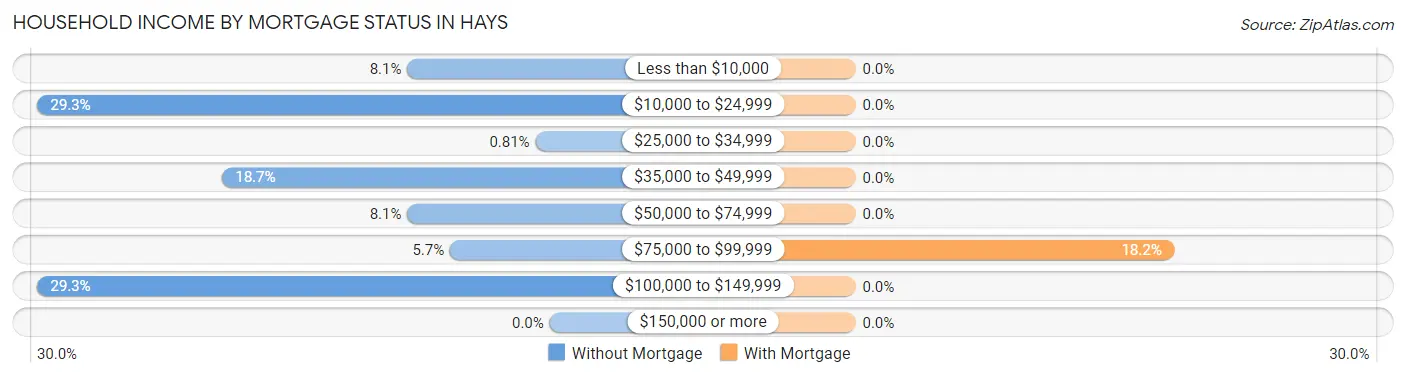
| Household Income | Without Mortgage | With Mortgage |
| Less than $10,000 | 10 (8.1%) | 0 (0.0%) |
| $10,000 to $24,999 | 36 (29.3%) | 0 (0.0%) |
| $25,000 to $34,999 | 1 (0.8%) | 0 (0.0%) |
| $35,000 to $49,999 | 23 (18.7%) | 0 (0.0%) |
| $50,000 to $74,999 | 10 (8.1%) | 0 (0.0%) |
| $75,000 to $99,999 | 7 (5.7%) | 2 (18.2%) |
| $100,000 to $149,999 | 36 (29.3%) | 0 (0.0%) |
| $150,000 or more | 0 (0.0%) | 0 (0.0%) |
| Total | 123 (100.0%) | 11 (100.0%) |
Property Value to Household Income Ratio in Hays
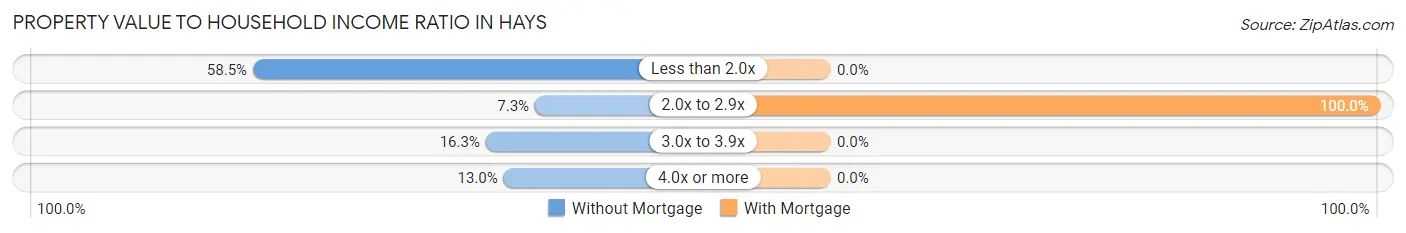
| Value-to-Income Ratio | Without Mortgage | With Mortgage |
| Less than 2.0x | 72 (58.5%) | 0 (0.0%) |
| 2.0x to 2.9x | 9 (7.3%) | 11 (100.0%) |
| 3.0x to 3.9x | 20 (16.3%) | 0 (0.0%) |
| 4.0x or more | 16 (13.0%) | 0 (0.0%) |
| Total | 123 (100.0%) | 11 (100.0%) |
Real Estate Taxes by Mortgage Status in Hays
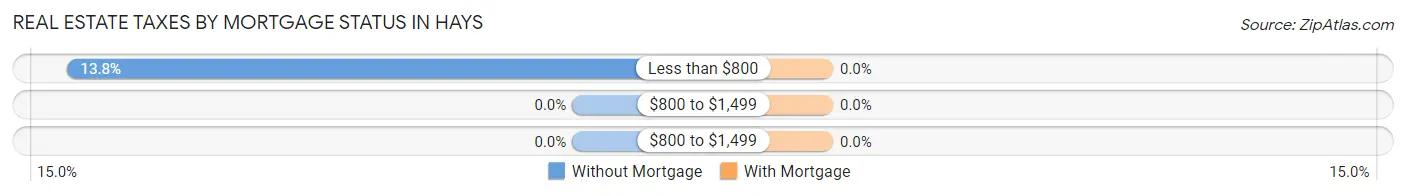
| Property Taxes | Without Mortgage | With Mortgage |
| Less than $800 | 17 (13.8%) | 0 (0.0%) |
| $800 to $1,499 | 0 (0.0%) | 0 (0.0%) |
| $800 to $1,499 | 0 (0.0%) | 0 (0.0%) |
| Total | 123 (100.0%) | 11 (100.0%) |
Health & Disability in Hays
Health Insurance Coverage by Age in Hays
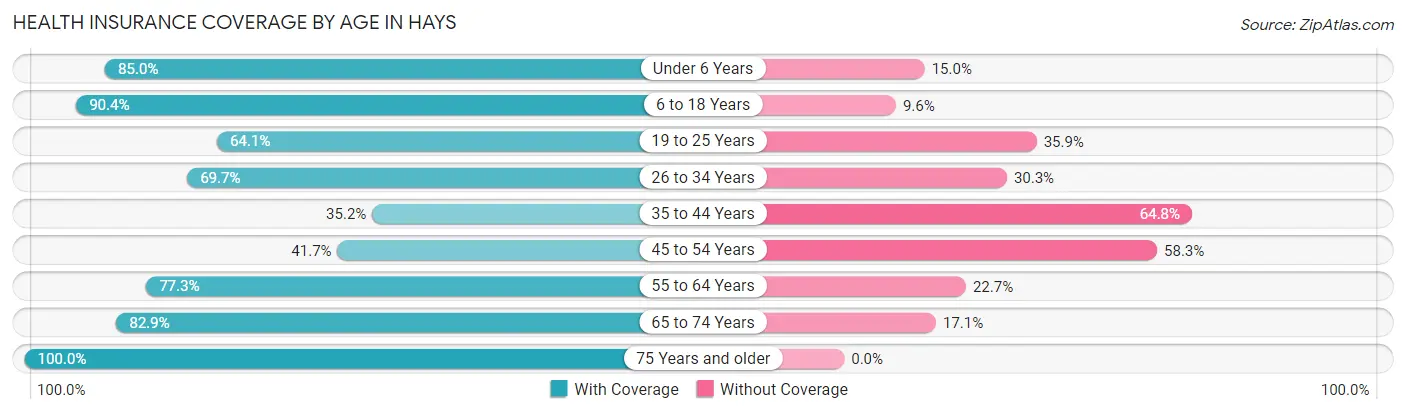
| Age Bracket | With Coverage | Without Coverage |
| Under 6 Years | 34 (85.0%) | 6 (15.0%) |
| 6 to 18 Years | 253 (90.4%) | 27 (9.6%) |
| 19 to 25 Years | 84 (64.1%) | 47 (35.9%) |
| 26 to 34 Years | 85 (69.7%) | 37 (30.3%) |
| 35 to 44 Years | 82 (35.2%) | 151 (64.8%) |
| 45 to 54 Years | 20 (41.7%) | 28 (58.3%) |
| 55 to 64 Years | 92 (77.3%) | 27 (22.7%) |
| 65 to 74 Years | 63 (82.9%) | 13 (17.1%) |
| 75 Years and older | 46 (100.0%) | 0 (0.0%) |
| Total | 759 (69.3%) | 336 (30.7%) |
Health Insurance Coverage by Citizenship Status in Hays
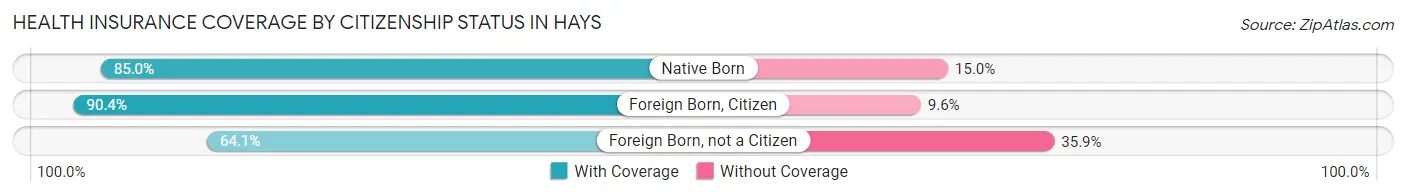
| Citizenship Status | With Coverage | Without Coverage |
| Native Born | 34 (85.0%) | 6 (15.0%) |
| Foreign Born, Citizen | 253 (90.4%) | 27 (9.6%) |
| Foreign Born, not a Citizen | 84 (64.1%) | 47 (35.9%) |
Health Insurance Coverage by Household Income in Hays
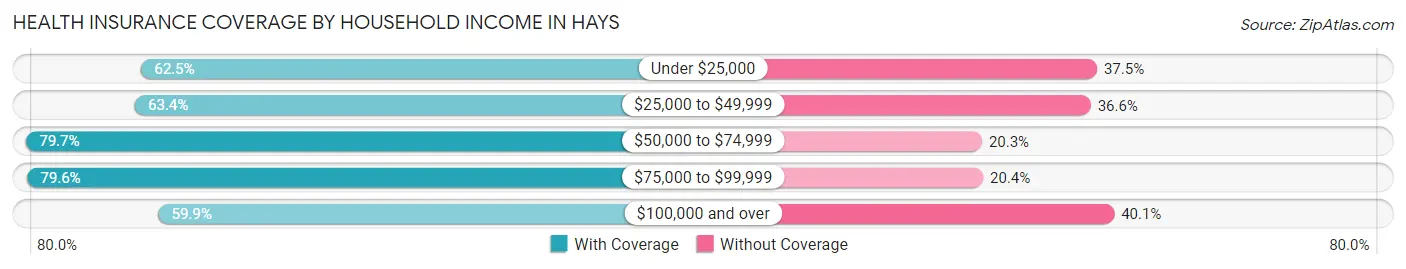
| Household Income | With Coverage | Without Coverage |
| Under $25,000 | 125 (62.5%) | 75 (37.5%) |
| $25,000 to $49,999 | 118 (63.4%) | 68 (36.6%) |
| $50,000 to $74,999 | 181 (79.7%) | 46 (20.3%) |
| $75,000 to $99,999 | 187 (79.6%) | 48 (20.4%) |
| $100,000 and over | 148 (59.9%) | 99 (40.1%) |
Public vs Private Health Insurance Coverage by Age in Hays
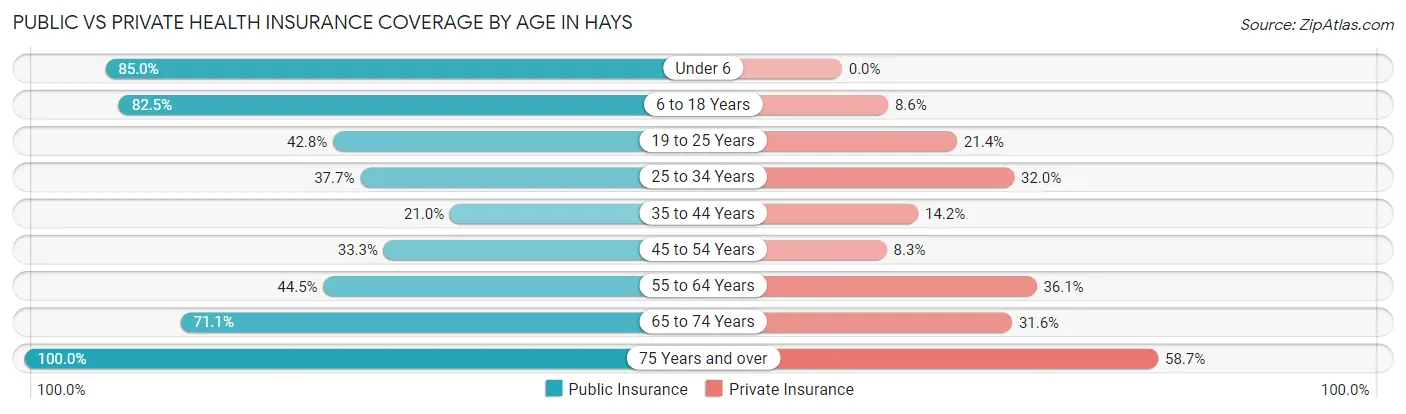
| Age Bracket | Public Insurance | Private Insurance |
| Under 6 | 34 (85.0%) | 0 (0.0%) |
| 6 to 18 Years | 231 (82.5%) | 24 (8.6%) |
| 19 to 25 Years | 56 (42.7%) | 28 (21.4%) |
| 25 to 34 Years | 46 (37.7%) | 39 (32.0%) |
| 35 to 44 Years | 49 (21.0%) | 33 (14.2%) |
| 45 to 54 Years | 16 (33.3%) | 4 (8.3%) |
| 55 to 64 Years | 53 (44.5%) | 43 (36.1%) |
| 65 to 74 Years | 54 (71.1%) | 24 (31.6%) |
| 75 Years and over | 46 (100.0%) | 27 (58.7%) |
| Total | 585 (53.4%) | 222 (20.3%) |
Disability Status by Sex by Age in Hays
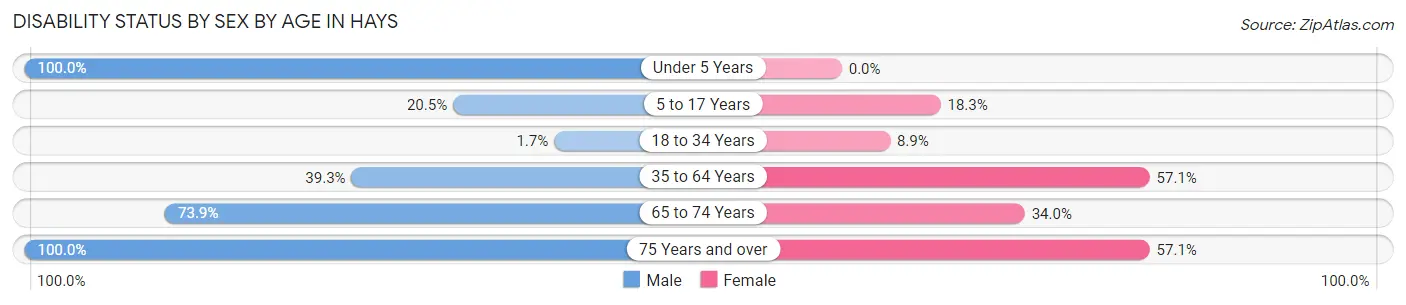
| Age Bracket | Male | Female |
| Under 5 Years | 12 (100.0%) | 0 (0.0%) |
| 5 to 17 Years | 25 (20.5%) | 22 (18.3%) |
| 18 to 34 Years | 3 (1.7%) | 11 (8.9%) |
| 35 to 64 Years | 83 (39.3%) | 108 (57.1%) |
| 65 to 74 Years | 17 (73.9%) | 18 (34.0%) |
| 75 Years and over | 4 (100.0%) | 24 (57.1%) |
Disability Class by Sex by Age in Hays
Disability Class: Hearing Difficulty
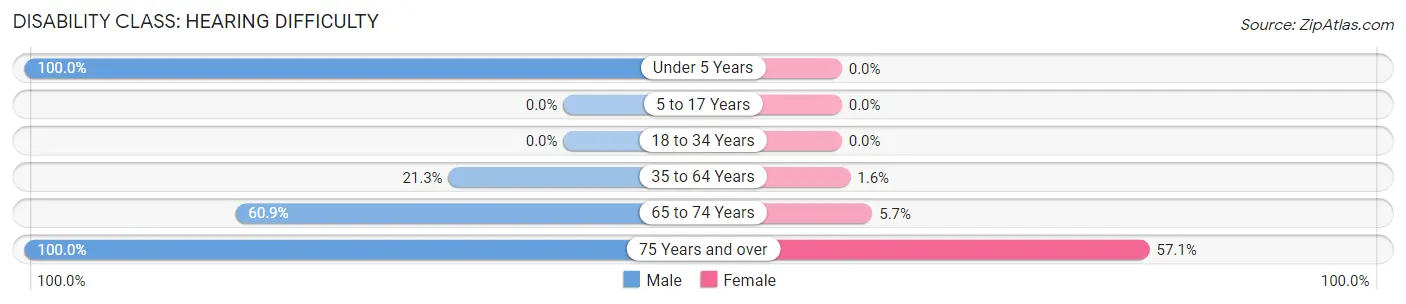
| Age Bracket | Male | Female |
| Under 5 Years | 12 (100.0%) | 0 (0.0%) |
| 5 to 17 Years | 0 (0.0%) | 0 (0.0%) |
| 18 to 34 Years | 0 (0.0%) | 0 (0.0%) |
| 35 to 64 Years | 45 (21.3%) | 3 (1.6%) |
| 65 to 74 Years | 14 (60.9%) | 3 (5.7%) |
| 75 Years and over | 4 (100.0%) | 24 (57.1%) |
Disability Class: Vision Difficulty
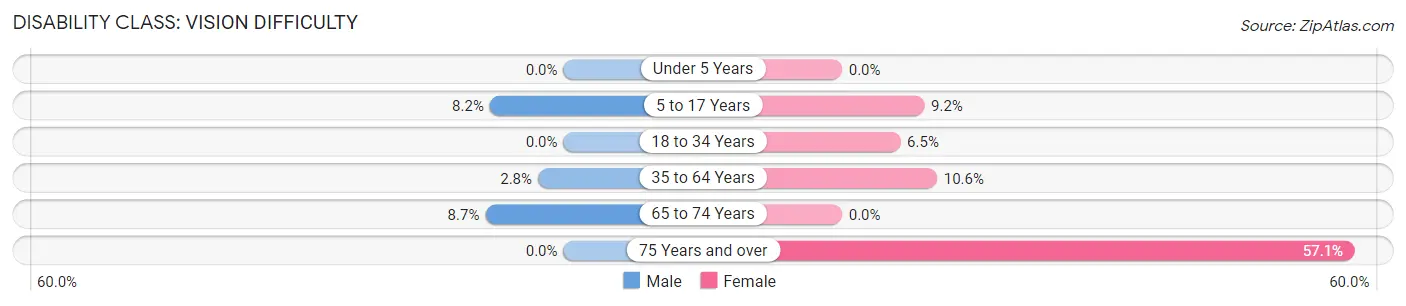
| Age Bracket | Male | Female |
| Under 5 Years | 0 (0.0%) | 0 (0.0%) |
| 5 to 17 Years | 10 (8.2%) | 11 (9.2%) |
| 18 to 34 Years | 0 (0.0%) | 8 (6.5%) |
| 35 to 64 Years | 6 (2.8%) | 20 (10.6%) |
| 65 to 74 Years | 2 (8.7%) | 0 (0.0%) |
| 75 Years and over | 0 (0.0%) | 24 (57.1%) |
Disability Class: Cognitive Difficulty
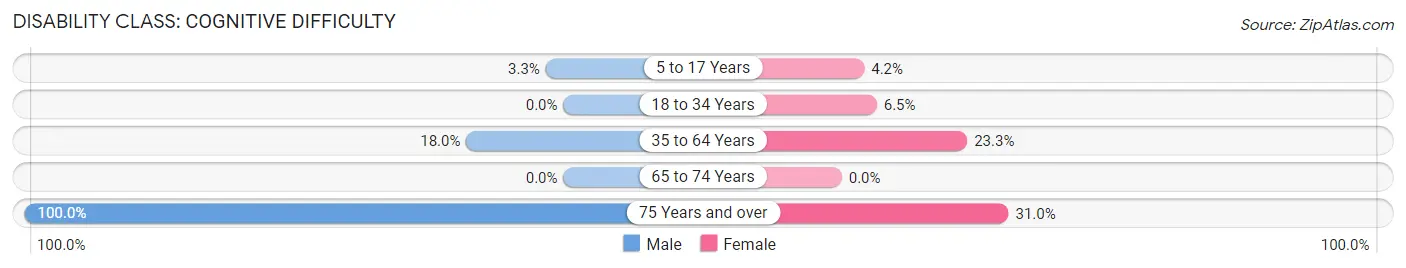
| Age Bracket | Male | Female |
| 5 to 17 Years | 4 (3.3%) | 5 (4.2%) |
| 18 to 34 Years | 0 (0.0%) | 8 (6.5%) |
| 35 to 64 Years | 38 (18.0%) | 44 (23.3%) |
| 65 to 74 Years | 0 (0.0%) | 0 (0.0%) |
| 75 Years and over | 4 (100.0%) | 13 (30.9%) |
Disability Class: Ambulatory Difficulty
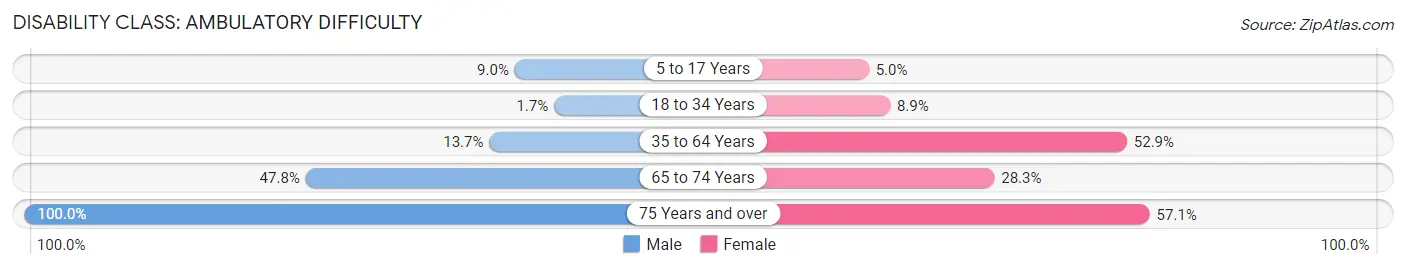
| Age Bracket | Male | Female |
| 5 to 17 Years | 11 (9.0%) | 6 (5.0%) |
| 18 to 34 Years | 3 (1.7%) | 11 (8.9%) |
| 35 to 64 Years | 29 (13.7%) | 100 (52.9%) |
| 65 to 74 Years | 11 (47.8%) | 15 (28.3%) |
| 75 Years and over | 4 (100.0%) | 24 (57.1%) |
Disability Class: Self-Care Difficulty
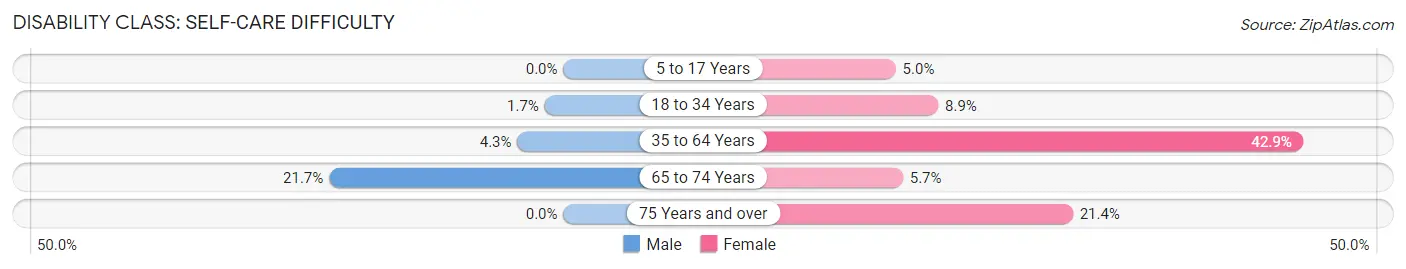
| Age Bracket | Male | Female |
| 5 to 17 Years | 0 (0.0%) | 6 (5.0%) |
| 18 to 34 Years | 3 (1.7%) | 11 (8.9%) |
| 35 to 64 Years | 9 (4.3%) | 81 (42.9%) |
| 65 to 74 Years | 5 (21.7%) | 3 (5.7%) |
| 75 Years and over | 0 (0.0%) | 9 (21.4%) |
Technology Access in Hays
Computing Device Access in Hays
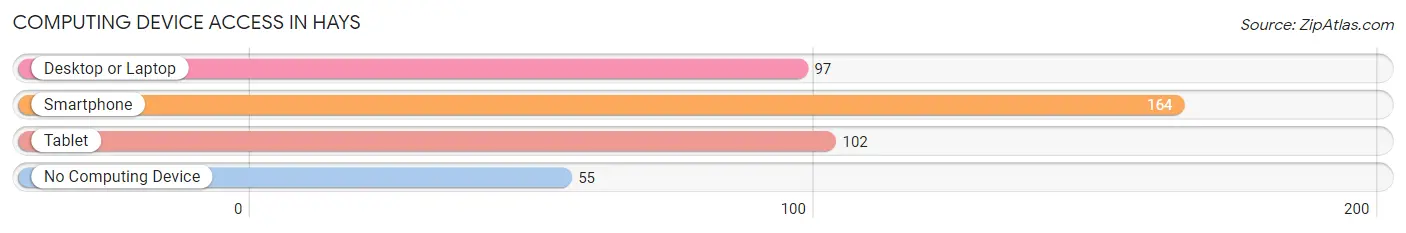
| Device Type | # Households | % Households |
| Desktop or Laptop | 97 | 40.1% |
| Smartphone | 164 | 67.8% |
| Tablet | 102 | 42.1% |
| No Computing Device | 55 | 22.7% |
| Total | 242 | 100.0% |
Internet Access in Hays
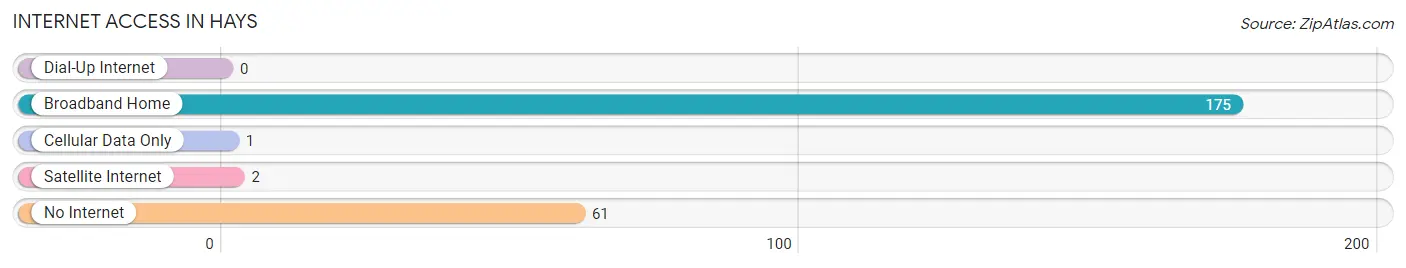
| Internet Type | # Households | % Households |
| Dial-Up Internet | 0 | 0.0% |
| Broadband Home | 175 | 72.3% |
| Cellular Data Only | 1 | 0.4% |
| Satellite Internet | 2 | 0.8% |
| No Internet | 61 | 25.2% |
| Total | 242 | 100.0% |
Hays Summary
Hays is a small town located in Montana, United States. It is situated in the south-central part of the state, in the foothills of the Rocky Mountains. The town is located in Cascade County, and is part of the Great Falls Metropolitan Statistical Area. As of the 2010 census, the population of Hays was 1,093.
History
Hays was founded in 1883 by a group of settlers from the Midwest. The town was named after the Hays family, who were among the first settlers. The town was originally a farming community, and the main crops grown were wheat, barley, and oats. In the early 1900s, the town began to grow and develop, and by the 1920s, it had become a thriving community.
In the 1950s, the town began to experience a decline in population, as many of the younger residents moved away in search of better job opportunities. However, in the late 1970s, the town began to experience a resurgence, as new businesses and industries began to move into the area. Today, Hays is a small but vibrant community, with a variety of businesses and services.
Geography
Hays is located in the south-central part of Montana, in the foothills of the Rocky Mountains. The town is situated in Cascade County, and is part of the Great Falls Metropolitan Statistical Area. The town is located at an elevation of 3,845 feet (1,172 m).
The town is located in a semi-arid climate, with hot summers and cold winters. The average annual temperature is 44.3°F (6.8°C), and the average annual precipitation is 13.3 inches (338 mm).
Economy
Hays is a small town, and the economy is largely based on agriculture and tourism. The town is home to several small businesses, including a grocery store, a hardware store, and a few restaurants. The town also has a small airport, which serves as a hub for private and commercial flights.
The town is also home to a number of tourist attractions, including the Hays Museum, the Hays Historical Society, and the Hays Nature Center. The town also hosts a number of annual events, such as the Hays County Fair and the Hays County Rodeo.
Demographics
As of the 2010 census, the population of Hays was 1,093. The racial makeup of the town was 95.2% White, 0.7% African American, 0.7% Native American, 0.3% Asian, 0.1% Pacific Islander, 1.2% from other races, and 1.8% from two or more races. Hispanic or Latino of any race were 3.2% of the population.
The median income for a household in the town was $37,500, and the median income for a family was $45,000. The per capita income for the town was $19,845. About 11.2% of families and 14.2% of the population were below the poverty line, including 18.2% of those under age 18 and 8.3% of those age 65 or over.
Common Questions
What is Per Capita Income in Hays?
Per Capita income in Hays is $17,043.
What is the Median Family Income in Hays?
Median Family Income in Hays is $66,719.
What is the Median Household income in Hays?
Median Household Income in Hays is $49,423.
What is Inequality or Gini Index in Hays?
Inequality or Gini Index in Hays is 0.42.
What is the Total Population of Hays?
Total Population of Hays is 1,095.
What is the Total Male Population of Hays?
Total Male Population of Hays is 545.
What is the Total Female Population of Hays?
Total Female Population of Hays is 550.
What is the Ratio of Males per 100 Females in Hays?
There are 99.09 Males per 100 Females in Hays.
What is the Ratio of Females per 100 Males in Hays?
There are 100.92 Females per 100 Males in Hays.
What is the Median Population Age in Hays?
Median Population Age in Hays is 33.5 Years.
What is the Average Family Size in Hays
Average Family Size in Hays is 5.8 People.
What is the Average Household Size in Hays
Average Household Size in Hays is 4.5 People.
How Large is the Labor Force in Hays?
There are 488 People in the Labor Forcein in Hays.
What is the Percentage of People in the Labor Force in Hays?
57.1% of People are in the Labor Force in Hays.
What is the Unemployment Rate in Hays?
Unemployment Rate in Hays is 27.5%.