Dunsmuir, CA Map & Demographics
Dunsmuir Map
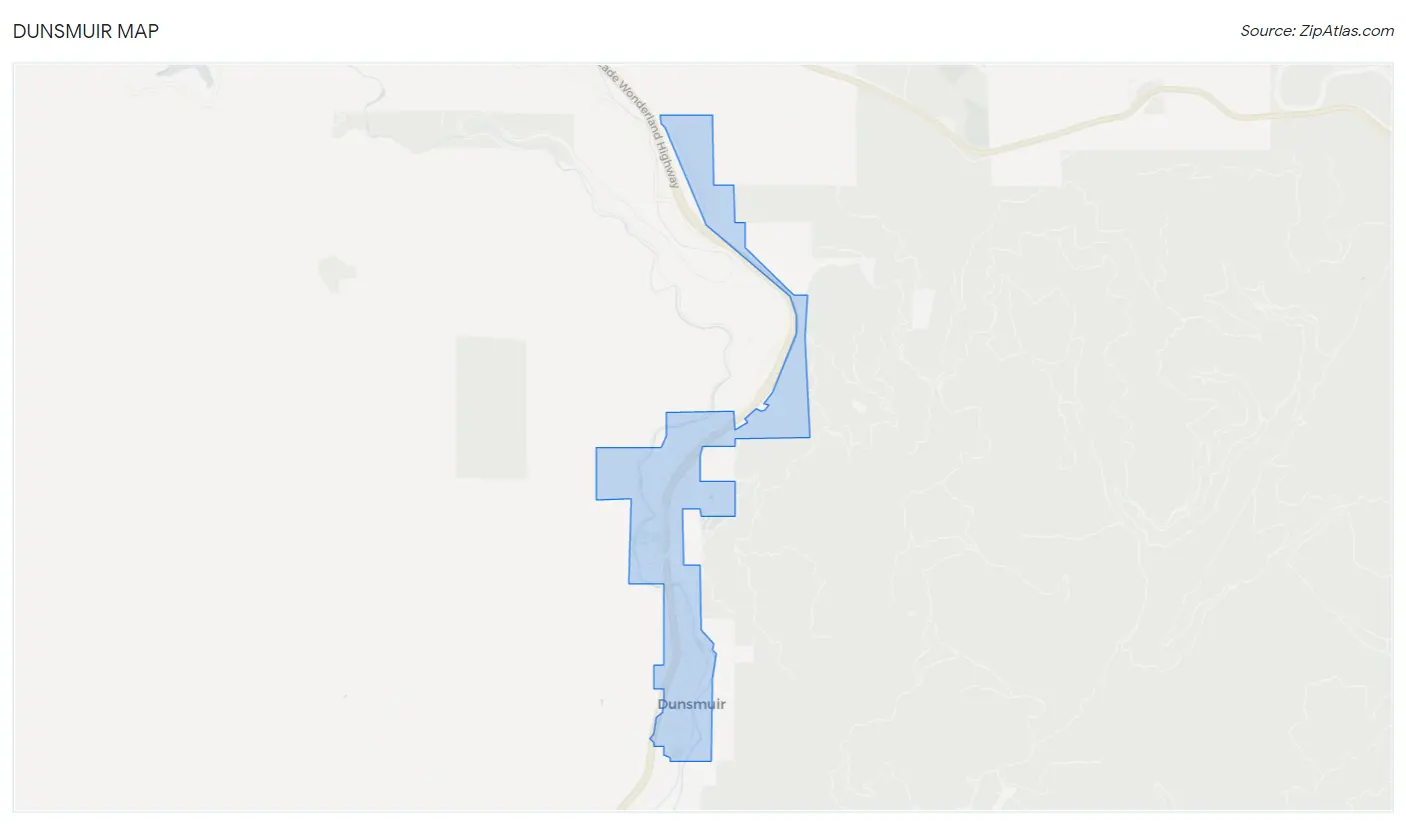
Dunsmuir Overview
$25,012
PER CAPITA INCOME
$56,034
AVG FAMILY INCOME
$42,500
AVG HOUSEHOLD INCOME
13.6%
WAGE / INCOME GAP [ % ]
86.4¢/ $1
WAGE / INCOME GAP [ $ ]
0.40
INEQUALITY / GINI INDEX
1,756
TOTAL POPULATION
834
MALE POPULATION
922
FEMALE POPULATION
90.46
MALES / 100 FEMALES
110.55
FEMALES / 100 MALES
42.6
MEDIAN AGE
3.1
AVG FAMILY SIZE
2.4
AVG HOUSEHOLD SIZE
793
LABOR FORCE [ PEOPLE ]
56.7%
PERCENT IN LABOR FORCE
8.7%
UNEMPLOYMENT RATE
Dunsmuir Zip Codes
Dunsmuir Area Codes
Income in Dunsmuir
Income Overview in Dunsmuir
Per Capita Income in Dunsmuir is $25,012, while median incomes of families and households are $56,034 and $42,500 respectively.
| Characteristic | Number | Measure |
| Per Capita Income | 1,756 | $25,012 |
| Median Family Income | 426 | $56,034 |
| Mean Family Income | 426 | $67,554 |
| Median Household Income | 734 | $42,500 |
| Mean Household Income | 734 | $58,357 |
| Income Deficit | 426 | $0 |
| Wage / Income Gap (%) | 1,756 | 13.56% |
| Wage / Income Gap ($) | 1,756 | 86.44¢ per $1 |
| Gini / Inequality Index | 1,756 | 0.40 |
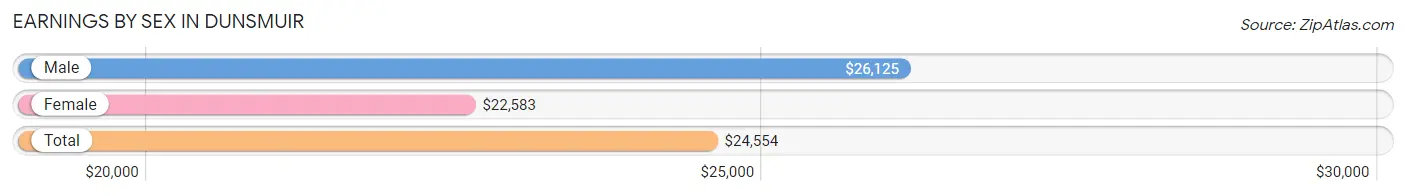
Earnings by Sex in Dunsmuir
Average Earnings in Dunsmuir are $24,554, $26,125 for men and $22,583 for women, a difference of 13.6%.
| Sex | Number | Average Earnings |
| Male | 415 (52.1%) | $26,125 |
| Female | 381 (47.9%) | $22,583 |
| Total | 796 (100.0%) | $24,554 |
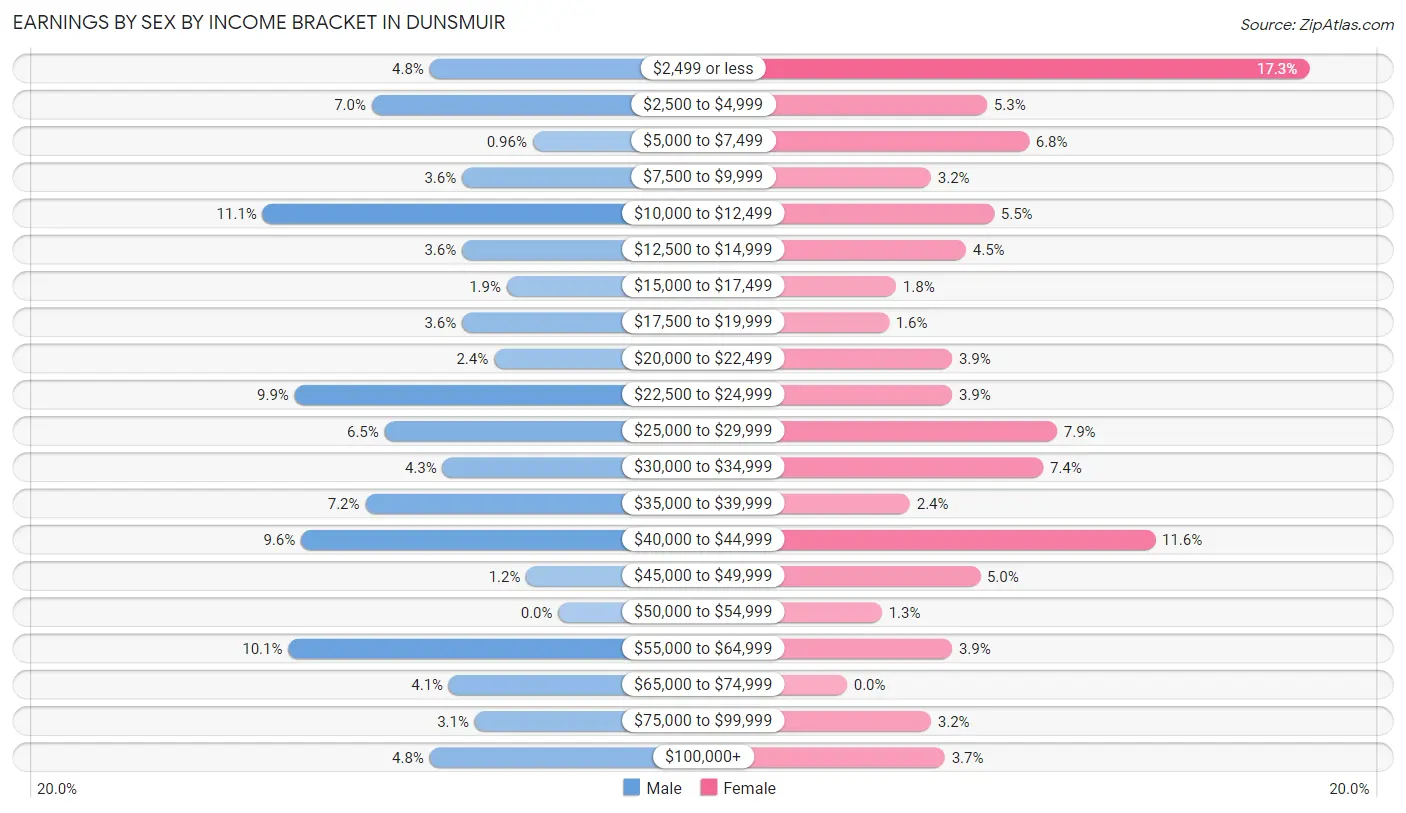
Earnings by Sex by Income Bracket in Dunsmuir
The most common earnings brackets in Dunsmuir are $10,000 to $12,499 for men (46 | 11.1%) and $2,499 or less for women (66 | 17.3%).
| Income | Male | Female |
| $2,499 or less | 20 (4.8%) | 66 (17.3%) |
| $2,500 to $4,999 | 29 (7.0%) | 20 (5.2%) |
| $5,000 to $7,499 | 4 (1.0%) | 26 (6.8%) |
| $7,500 to $9,999 | 15 (3.6%) | 12 (3.2%) |
| $10,000 to $12,499 | 46 (11.1%) | 21 (5.5%) |
| $12,500 to $14,999 | 15 (3.6%) | 17 (4.5%) |
| $15,000 to $17,499 | 8 (1.9%) | 7 (1.8%) |
| $17,500 to $19,999 | 15 (3.6%) | 6 (1.6%) |
| $20,000 to $22,499 | 10 (2.4%) | 15 (3.9%) |
| $22,500 to $24,999 | 41 (9.9%) | 15 (3.9%) |
| $25,000 to $29,999 | 27 (6.5%) | 30 (7.9%) |
| $30,000 to $34,999 | 18 (4.3%) | 28 (7.3%) |
| $35,000 to $39,999 | 30 (7.2%) | 9 (2.4%) |
| $40,000 to $44,999 | 40 (9.6%) | 44 (11.6%) |
| $45,000 to $49,999 | 5 (1.2%) | 19 (5.0%) |
| $50,000 to $54,999 | 0 (0.0%) | 5 (1.3%) |
| $55,000 to $64,999 | 42 (10.1%) | 15 (3.9%) |
| $65,000 to $74,999 | 17 (4.1%) | 0 (0.0%) |
| $75,000 to $99,999 | 13 (3.1%) | 12 (3.2%) |
| $100,000+ | 20 (4.8%) | 14 (3.7%) |
| Total | 415 (100.0%) | 381 (100.0%) |
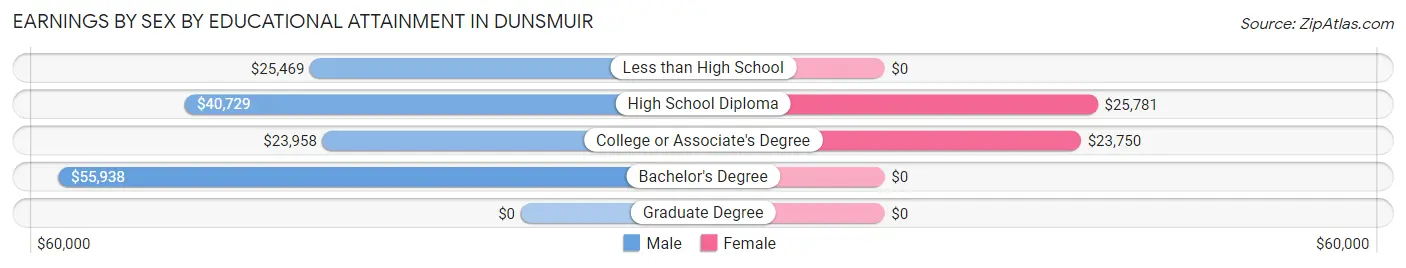
Earnings by Sex by Educational Attainment in Dunsmuir
Average earnings in Dunsmuir are $32,500 for men and $21,833 for women, a difference of 32.8%. Men with an educational attainment of bachelor's degree enjoy the highest average annual earnings of $55,938, while those with college or associate's degree education earn the least with $23,958. Women with an educational attainment of high school diploma earn the most with the average annual earnings of $25,781, while those with college or associate's degree education have the smallest earnings of $23,750.
| Educational Attainment | Male Income | Female Income |
| Less than High School | $25,469 | $0 |
| High School Diploma | $40,729 | $25,781 |
| College or Associate's Degree | $23,958 | $23,750 |
| Bachelor's Degree | $55,938 | $0 |
| Graduate Degree | - | - |
| Total | $32,500 | $21,833 |
Family Income in Dunsmuir
Family Income Brackets in Dunsmuir
According to the Dunsmuir family income data, there are 116 families falling into the $35,000 to $49,999 income range, which is the most common income bracket and makes up 27.2% of all families. Conversely, the $10,000 to $14,999 income bracket is the least frequent group with only 9 families (2.1%) belonging to this category.
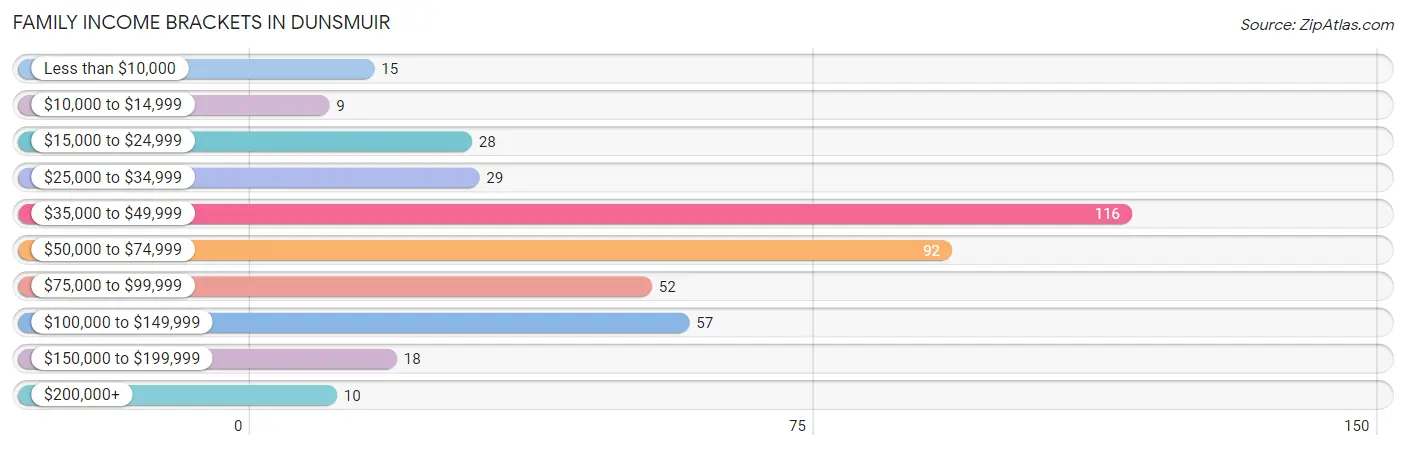
| Income Bracket | # Families | % Families |
| Less than $10,000 | 15 | 3.5% |
| $10,000 to $14,999 | 9 | 2.1% |
| $15,000 to $24,999 | 28 | 6.6% |
| $25,000 to $34,999 | 29 | 6.8% |
| $35,000 to $49,999 | 116 | 27.2% |
| $50,000 to $74,999 | 92 | 21.6% |
| $75,000 to $99,999 | 52 | 12.2% |
| $100,000 to $149,999 | 57 | 13.4% |
| $150,000 to $199,999 | 18 | 4.2% |
| $200,000+ | 10 | 2.3% |
Family Income by Famaliy Size in Dunsmuir
5-person families (12 | 2.8%) account for the highest median family income in Dunsmuir with $71,250 per family, while 2-person families (221 | 51.9%) have the highest median income of $26,094 per family member.
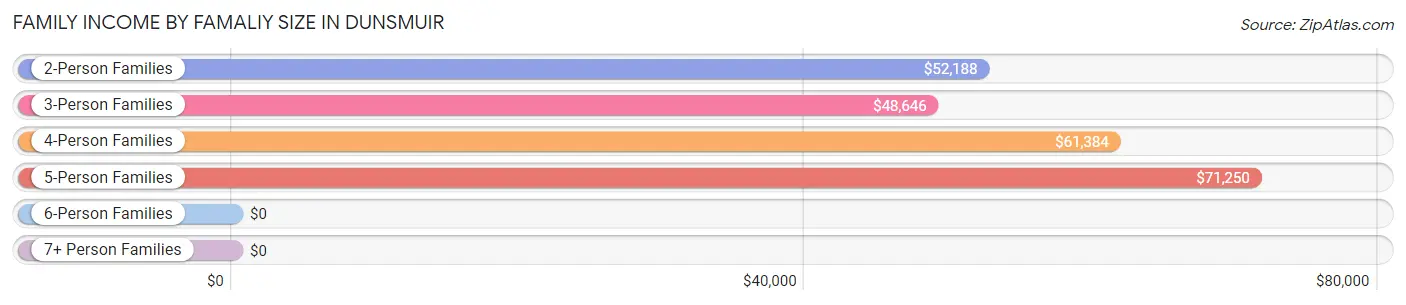
| Income Bracket | # Families | Median Income |
| 2-Person Families | 221 (51.9%) | $52,188 |
| 3-Person Families | 133 (31.2%) | $48,646 |
| 4-Person Families | 57 (13.4%) | $61,384 |
| 5-Person Families | 12 (2.8%) | $71,250 |
| 6-Person Families | 0 (0.0%) | $0 |
| 7+ Person Families | 3 (0.7%) | $0 |
| Total | 426 (100.0%) | $56,034 |
Family Income by Number of Earners in Dunsmuir
The median family income in Dunsmuir is $56,034, with families comprising 3+ earners (28) having the highest median family income of $108,500, while families with no earners (114) have the lowest median family income of $41,389, accounting for 6.6% and 26.8% of families, respectively.
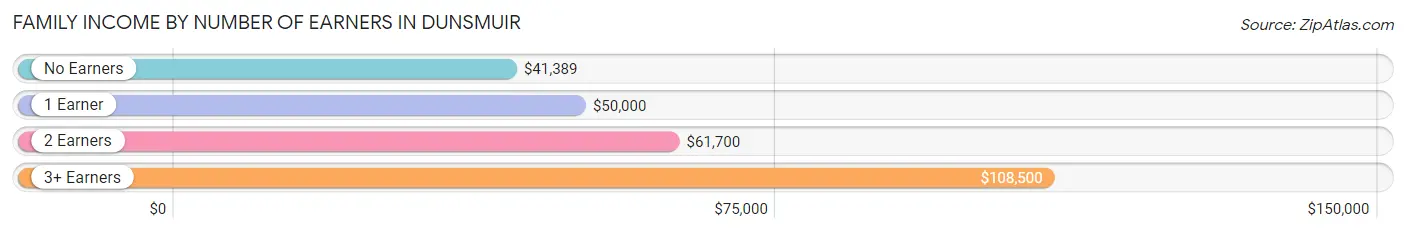
| Number of Earners | # Families | Median Income |
| No Earners | 114 (26.8%) | $41,389 |
| 1 Earner | 142 (33.3%) | $50,000 |
| 2 Earners | 142 (33.3%) | $61,700 |
| 3+ Earners | 28 (6.6%) | $108,500 |
| Total | 426 (100.0%) | $56,034 |
Household Income in Dunsmuir
Household Income Brackets in Dunsmuir
With 188 households falling in the category, the $35,000 to $49,999 income range is the most frequent in Dunsmuir, accounting for 25.6% of all households. In contrast, only 13 households (1.8%) fall into the $200,000+ income bracket, making it the least populous group.
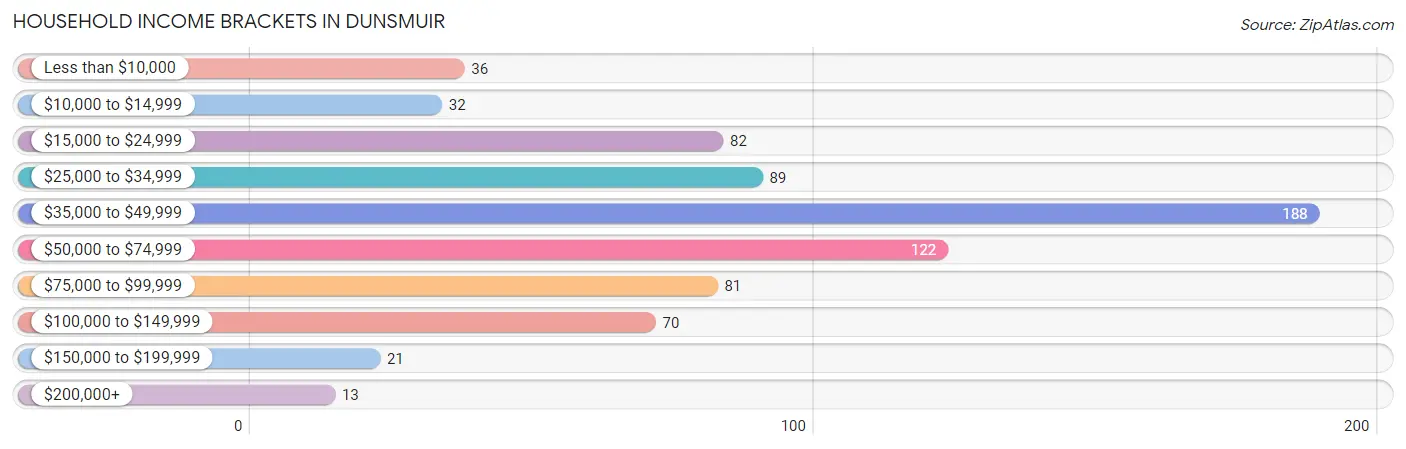
| Income Bracket | # Households | % Households |
| Less than $10,000 | 36 | 4.9% |
| $10,000 to $14,999 | 32 | 4.4% |
| $15,000 to $24,999 | 82 | 11.2% |
| $25,000 to $34,999 | 89 | 12.1% |
| $35,000 to $49,999 | 188 | 25.6% |
| $50,000 to $74,999 | 122 | 16.6% |
| $75,000 to $99,999 | 81 | 11.0% |
| $100,000 to $149,999 | 70 | 9.5% |
| $150,000 to $199,999 | 21 | 2.9% |
| $200,000+ | 13 | 1.8% |
Household Income by Householder Age in Dunsmuir
The median household income in Dunsmuir is $42,500, with the highest median household income of $49,688 found in the 45 to 64 years age bracket for the primary householder. A total of 277 households (37.7%) fall into this category. Meanwhile, the 15 to 24 years age bracket for the primary householder has the lowest median household income of $0, with 29 households (4.0%) in this group.
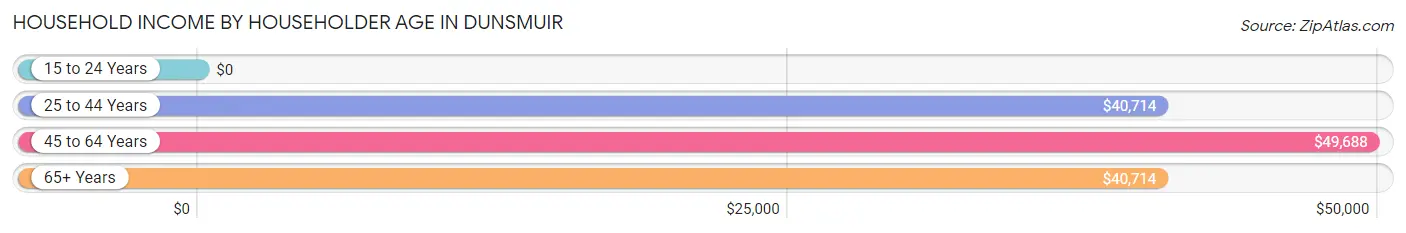
| Income Bracket | # Households | Median Income |
| 15 to 24 Years | 29 (4.0%) | $0 |
| 25 to 44 Years | 162 (22.1%) | $40,714 |
| 45 to 64 Years | 277 (37.7%) | $49,688 |
| 65+ Years | 266 (36.2%) | $40,714 |
| Total | 734 (100.0%) | $42,500 |
Poverty in Dunsmuir
Income Below Poverty by Sex and Age in Dunsmuir
With 16.8% poverty level for males and 14.4% for females among the residents of Dunsmuir, 6 to 11 year old males and 18 to 24 year old females are the most vulnerable to poverty, with 18 males (54.5%) and 24 females (55.8%) in their respective age groups living below the poverty level.
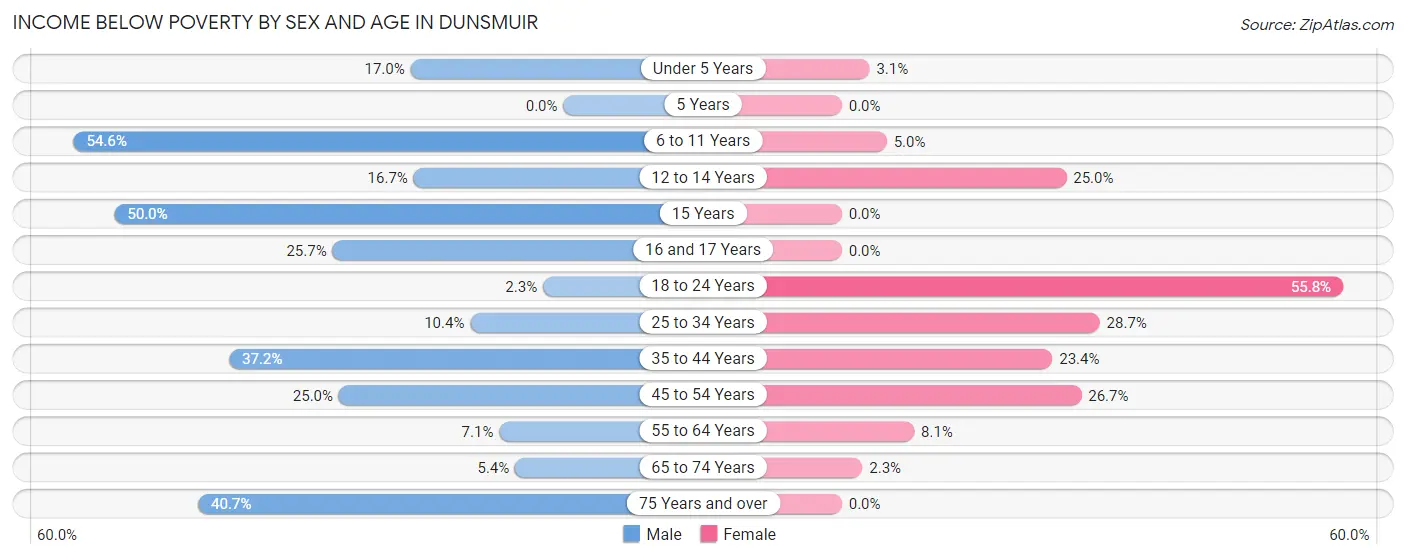
| Age Bracket | Male | Female |
| Under 5 Years | 8 (17.0%) | 4 (3.1%) |
| 5 Years | 0 (0.0%) | 0 (0.0%) |
| 6 to 11 Years | 18 (54.5%) | 3 (5.0%) |
| 12 to 14 Years | 2 (16.7%) | 3 (25.0%) |
| 15 Years | 3 (50.0%) | 0 (0.0%) |
| 16 and 17 Years | 9 (25.7%) | 0 (0.0%) |
| 18 to 24 Years | 2 (2.3%) | 24 (55.8%) |
| 25 to 34 Years | 14 (10.4%) | 27 (28.7%) |
| 35 to 44 Years | 35 (37.2%) | 15 (23.4%) |
| 45 to 54 Years | 8 (25.0%) | 40 (26.7%) |
| 55 to 64 Years | 8 (7.1%) | 12 (8.1%) |
| 65 to 74 Years | 8 (5.4%) | 3 (2.3%) |
| 75 Years and over | 24 (40.7%) | 0 (0.0%) |
| Total | 139 (16.8%) | 131 (14.4%) |
Income Above Poverty by Sex and Age in Dunsmuir
According to the poverty statistics in Dunsmuir, males aged 5 years and females aged 5 years are the age groups that are most secure financially, with 100.0% of males and 100.0% of females in these age groups living above the poverty line.
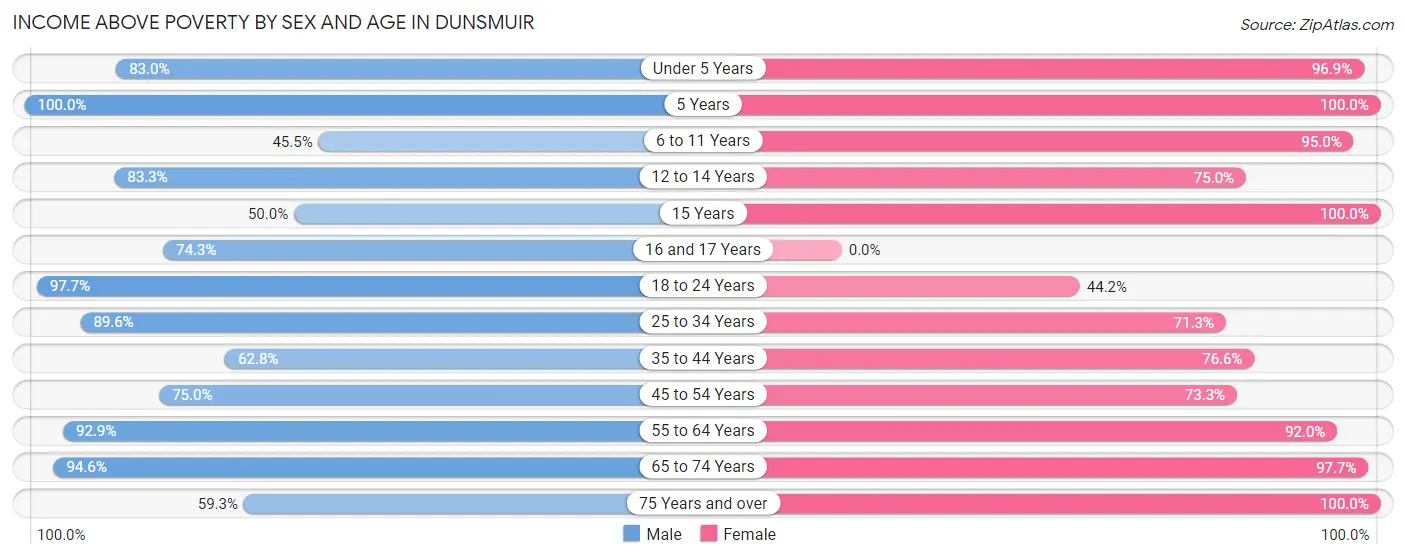
| Age Bracket | Male | Female |
| Under 5 Years | 39 (83.0%) | 126 (96.9%) |
| 5 Years | 27 (100.0%) | 7 (100.0%) |
| 6 to 11 Years | 15 (45.5%) | 57 (95.0%) |
| 12 to 14 Years | 10 (83.3%) | 9 (75.0%) |
| 15 Years | 3 (50.0%) | 8 (100.0%) |
| 16 and 17 Years | 26 (74.3%) | 0 (0.0%) |
| 18 to 24 Years | 86 (97.7%) | 19 (44.2%) |
| 25 to 34 Years | 121 (89.6%) | 67 (71.3%) |
| 35 to 44 Years | 59 (62.8%) | 49 (76.6%) |
| 45 to 54 Years | 24 (75.0%) | 110 (73.3%) |
| 55 to 64 Years | 104 (92.9%) | 137 (91.9%) |
| 65 to 74 Years | 141 (94.6%) | 128 (97.7%) |
| 75 Years and over | 35 (59.3%) | 64 (100.0%) |
| Total | 690 (83.2%) | 781 (85.6%) |
Income Below Poverty Among Married-Couple Families in Dunsmuir
The poverty statistics for married-couple families in Dunsmuir show that 0.7% or 2 of the total 280 families live below the poverty line. Families with 1 or 2 children have the highest poverty rate of 3.0%, comprising of 2 families. On the other hand, families with no children have the lowest poverty rate of 0.0%, which includes 0 families.
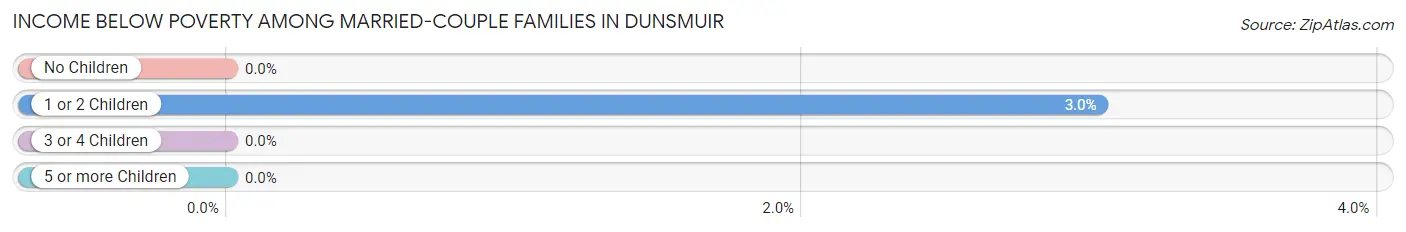
| Children | Above Poverty | Below Poverty |
| No Children | 205 (100.0%) | 0 (0.0%) |
| 1 or 2 Children | 64 (97.0%) | 2 (3.0%) |
| 3 or 4 Children | 9 (100.0%) | 0 (0.0%) |
| 5 or more Children | 0 (0.0%) | 0 (0.0%) |
| Total | 278 (99.3%) | 2 (0.7%) |
Income Below Poverty Among Single-Parent Households in Dunsmuir
According to the poverty data in Dunsmuir, 42.4% or 25 single-father households and 28.7% or 25 single-mother households are living below the poverty line. Among single-father households, those with no children have the highest poverty rate, with 18 households (90.0%) experiencing poverty. Likewise, among single-mother households, those with 3 or 4 children have the highest poverty rate, with 6 households (35.3%) falling below the poverty line.
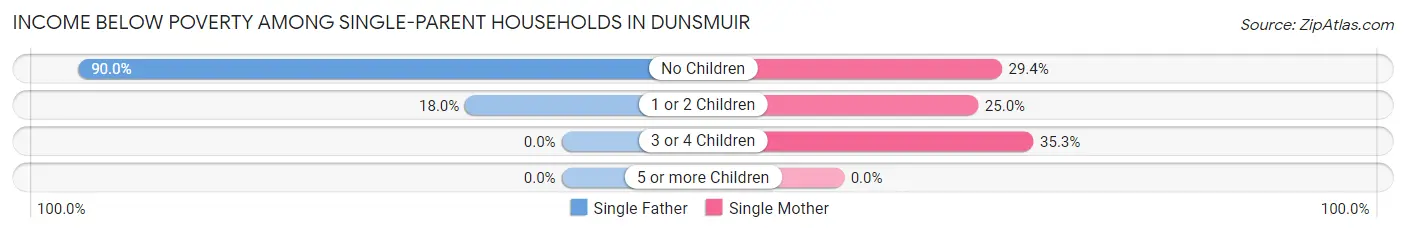
| Children | Single Father | Single Mother |
| No Children | 18 (90.0%) | 10 (29.4%) |
| 1 or 2 Children | 7 (17.9%) | 9 (25.0%) |
| 3 or 4 Children | 0 (0.0%) | 6 (35.3%) |
| 5 or more Children | 0 (0.0%) | 0 (0.0%) |
| Total | 25 (42.4%) | 25 (28.7%) |
Income Below Poverty Among Married-Couple vs Single-Parent Households in Dunsmuir
The poverty data for Dunsmuir shows that 2 of the married-couple family households (0.7%) and 50 of the single-parent households (34.3%) are living below the poverty level. Within the married-couple family households, those with 1 or 2 children have the highest poverty rate, with 2 households (3.0%) falling below the poverty line. Among the single-parent households, those with no children have the highest poverty rate, with 28 household (51.8%) living below poverty.
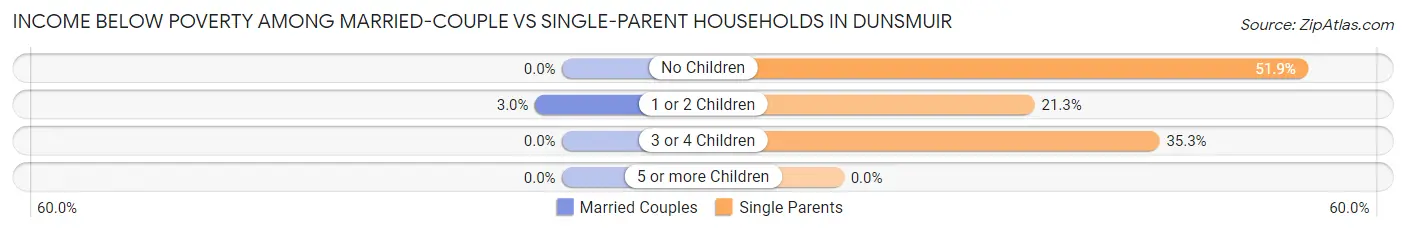
| Children | Married-Couple Families | Single-Parent Households |
| No Children | 0 (0.0%) | 28 (51.8%) |
| 1 or 2 Children | 2 (3.0%) | 16 (21.3%) |
| 3 or 4 Children | 0 (0.0%) | 6 (35.3%) |
| 5 or more Children | 0 (0.0%) | 0 (0.0%) |
| Total | 2 (0.7%) | 50 (34.3%) |
Race in Dunsmuir
The most populous races in Dunsmuir are White / Caucasian (1,338 | 76.2%), Hispanic or Latino (284 | 16.2%), and Two or more Races (237 | 13.5%).
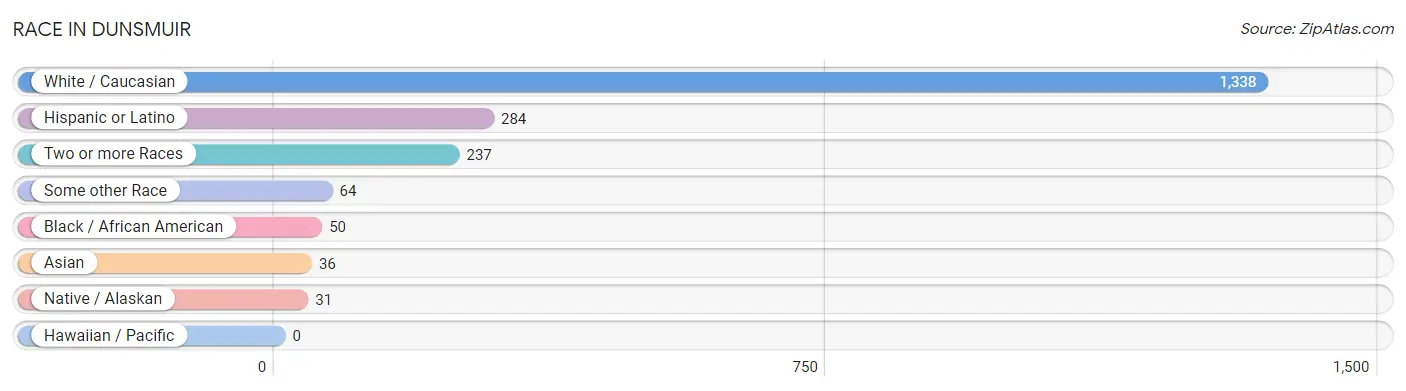
| Race | # Population | % Population |
| Asian | 36 | 2.1% |
| Black / African American | 50 | 2.9% |
| Hawaiian / Pacific | 0 | 0.0% |
| Hispanic or Latino | 284 | 16.2% |
| Native / Alaskan | 31 | 1.8% |
| White / Caucasian | 1,338 | 76.2% |
| Two or more Races | 237 | 13.5% |
| Some other Race | 64 | 3.6% |
| Total | 1,756 | 100.0% |
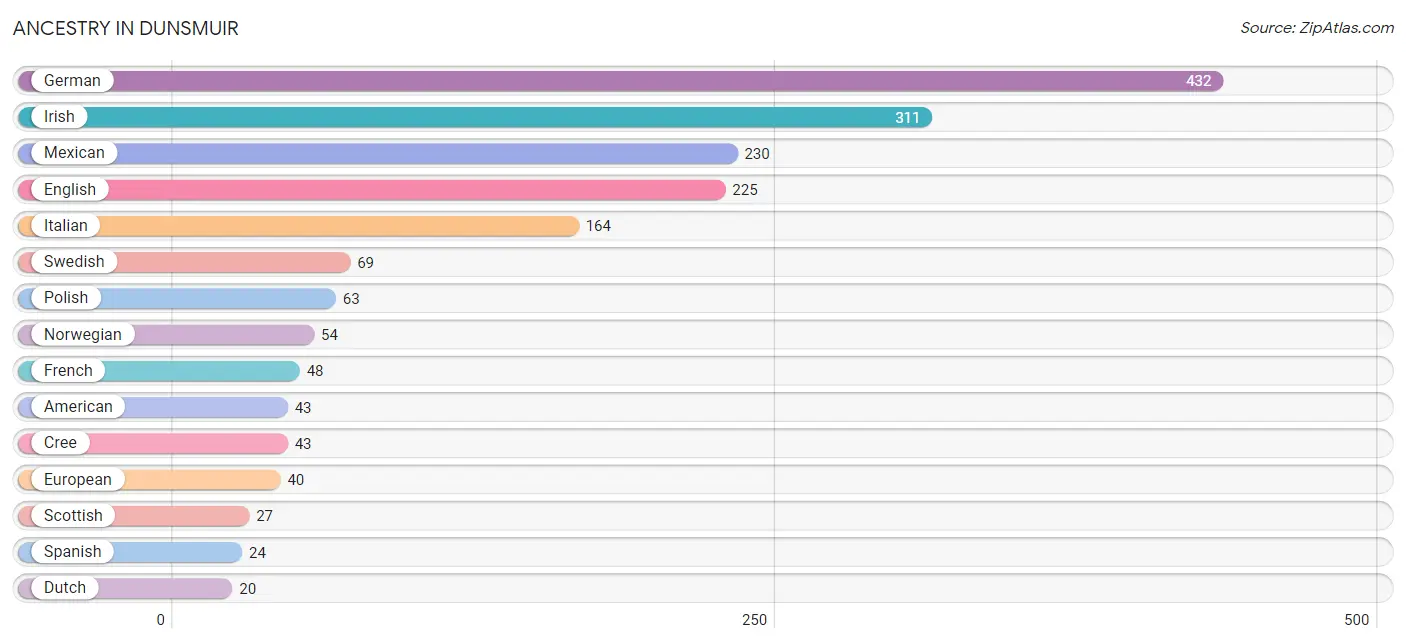
Ancestry in Dunsmuir
The most populous ancestries reported in Dunsmuir are German (432 | 24.6%), Irish (311 | 17.7%), Mexican (230 | 13.1%), English (225 | 12.8%), and Italian (164 | 9.3%), together accounting for 77.6% of all Dunsmuir residents.
| Ancestry | # Population | % Population |
| American | 43 | 2.5% |
| Apache | 16 | 0.9% |
| Bhutanese | 14 | 0.8% |
| Burmese | 13 | 0.7% |
| Central American | 1 | 0.1% |
| Cherokee | 3 | 0.2% |
| Cree | 43 | 2.5% |
| Croatian | 3 | 0.2% |
| Cuban | 3 | 0.2% |
| Danish | 19 | 1.1% |
| Dutch | 20 | 1.1% |
| English | 225 | 12.8% |
| European | 40 | 2.3% |
| French | 48 | 2.7% |
| German | 432 | 24.6% |
| Indian (Asian) | 14 | 0.8% |
| Irish | 311 | 17.7% |
| Italian | 164 | 9.3% |
| Korean | 4 | 0.2% |
| Lithuanian | 4 | 0.2% |
| Mexican | 230 | 13.1% |
| Nicaraguan | 1 | 0.1% |
| Northern European | 5 | 0.3% |
| Norwegian | 54 | 3.1% |
| Peruvian | 15 | 0.9% |
| Polish | 63 | 3.6% |
| Portuguese | 6 | 0.3% |
| Puerto Rican | 11 | 0.6% |
| Russian | 11 | 0.6% |
| Scandinavian | 4 | 0.2% |
| Scotch-Irish | 4 | 0.2% |
| Scottish | 27 | 1.5% |
| South American | 15 | 0.9% |
| Spanish | 24 | 1.4% |
| Swedish | 69 | 3.9% |
| Ukrainian | 14 | 0.8% |
| Yaqui | 5 | 0.3% | View All 37 Rows |
Immigrants in Dunsmuir
The most numerous immigrant groups reported in Dunsmuir came from Latin America (41 | 2.3%), Europe (32 | 1.8%), Central America (26 | 1.5%), Mexico (23 | 1.3%), and Western Europe (21 | 1.2%), together accounting for 8.1% of all Dunsmuir residents.
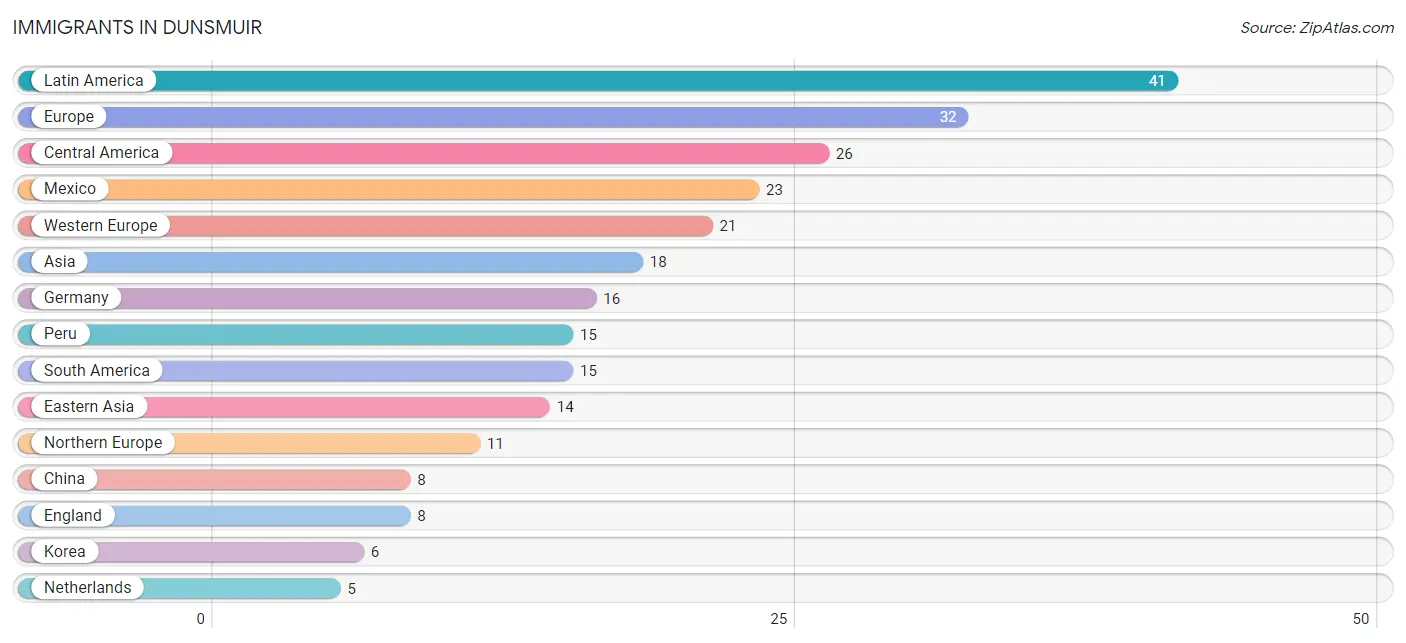
| Immigration Origin | # Population | % Population |
| Asia | 18 | 1.0% |
| Canada | 3 | 0.2% |
| Central America | 26 | 1.5% |
| China | 8 | 0.5% |
| Eastern Asia | 14 | 0.8% |
| England | 8 | 0.5% |
| Europe | 32 | 1.8% |
| Germany | 16 | 0.9% |
| Honduras | 3 | 0.2% |
| Korea | 6 | 0.3% |
| Latin America | 41 | 2.3% |
| Mexico | 23 | 1.3% |
| Netherlands | 5 | 0.3% |
| Northern Europe | 11 | 0.6% |
| Peru | 15 | 0.9% |
| South America | 15 | 0.9% |
| South Central Asia | 4 | 0.2% |
| Sri Lanka | 4 | 0.2% |
| Sweden | 3 | 0.2% |
| Western Europe | 21 | 1.2% | View All 20 Rows |
Sex and Age in Dunsmuir
Sex and Age in Dunsmuir
The most populous age groups in Dunsmuir are 70 to 74 Years (80 | 9.6%) for men and Under 5 Years (140 | 15.2%) for women.
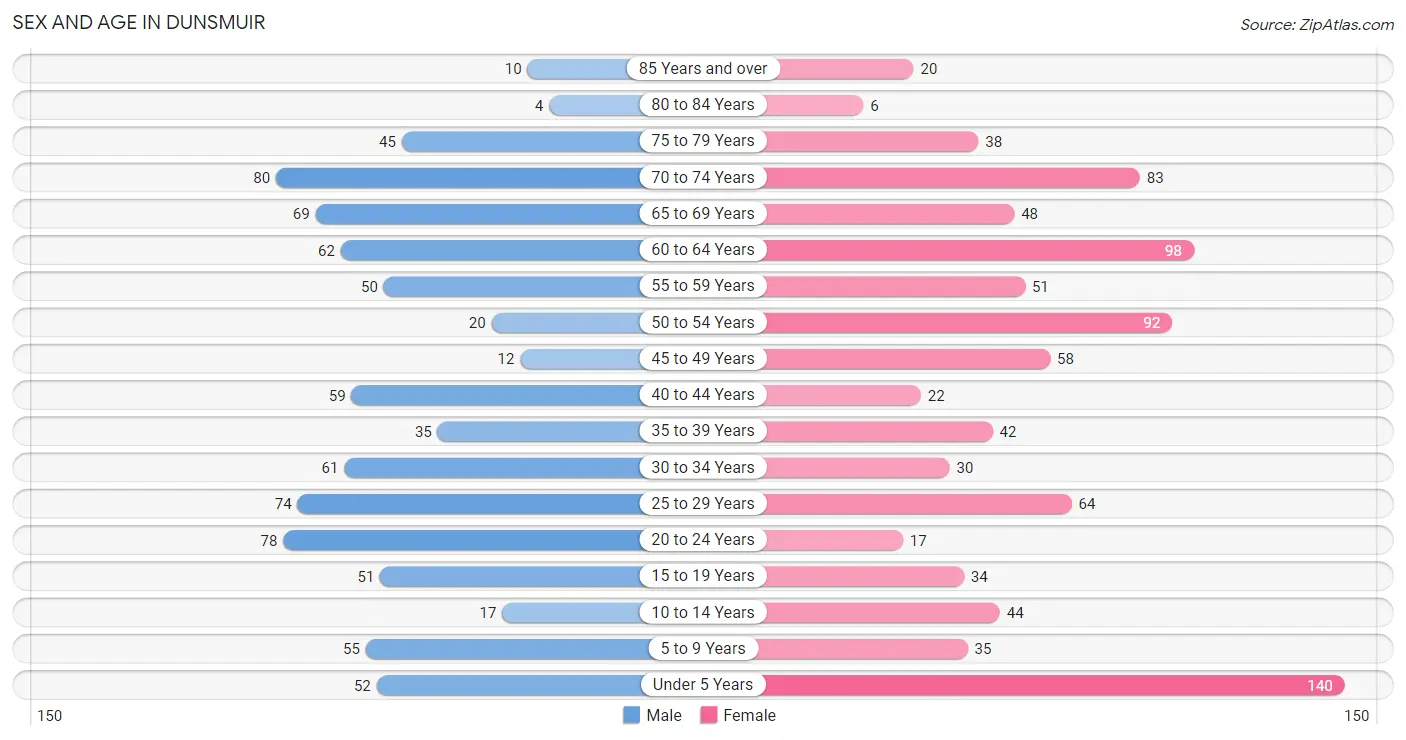
| Age Bracket | Male | Female |
| Under 5 Years | 52 (6.2%) | 140 (15.2%) |
| 5 to 9 Years | 55 (6.6%) | 35 (3.8%) |
| 10 to 14 Years | 17 (2.0%) | 44 (4.8%) |
| 15 to 19 Years | 51 (6.1%) | 34 (3.7%) |
| 20 to 24 Years | 78 (9.3%) | 17 (1.8%) |
| 25 to 29 Years | 74 (8.9%) | 64 (6.9%) |
| 30 to 34 Years | 61 (7.3%) | 30 (3.3%) |
| 35 to 39 Years | 35 (4.2%) | 42 (4.6%) |
| 40 to 44 Years | 59 (7.1%) | 22 (2.4%) |
| 45 to 49 Years | 12 (1.4%) | 58 (6.3%) |
| 50 to 54 Years | 20 (2.4%) | 92 (10.0%) |
| 55 to 59 Years | 50 (6.0%) | 51 (5.5%) |
| 60 to 64 Years | 62 (7.4%) | 98 (10.6%) |
| 65 to 69 Years | 69 (8.3%) | 48 (5.2%) |
| 70 to 74 Years | 80 (9.6%) | 83 (9.0%) |
| 75 to 79 Years | 45 (5.4%) | 38 (4.1%) |
| 80 to 84 Years | 4 (0.5%) | 6 (0.6%) |
| 85 Years and over | 10 (1.2%) | 20 (2.2%) |
| Total | 834 (100.0%) | 922 (100.0%) |
Families and Households in Dunsmuir
Median Family Size in Dunsmuir
The median family size in Dunsmuir is 3.08 persons per family, with single female/mother families (87 | 20.4%) accounting for the largest median family size of 3.57 persons per family. On the other hand, married-couple families (280 | 65.7%) represent the smallest median family size with 2.91 persons per family.
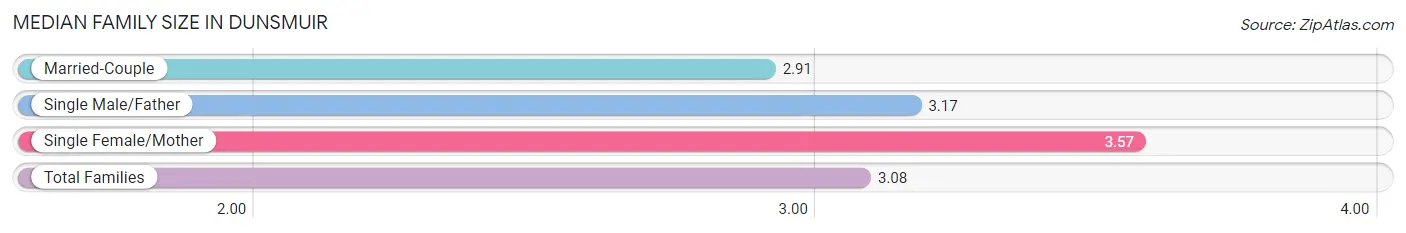
| Family Type | # Families | Family Size |
| Married-Couple | 280 (65.7%) | 2.91 |
| Single Male/Father | 59 (13.9%) | 3.17 |
| Single Female/Mother | 87 (20.4%) | 3.57 |
| Total Families | 426 (100.0%) | 3.08 |
Median Household Size in Dunsmuir
The median household size in Dunsmuir is 2.39 persons per household, with single female/mother households (87 | 11.8%) accounting for the largest median household size of 3.78 persons per household. non-family households (308 | 42.0%) represent the smallest median household size with 1.22 persons per household.
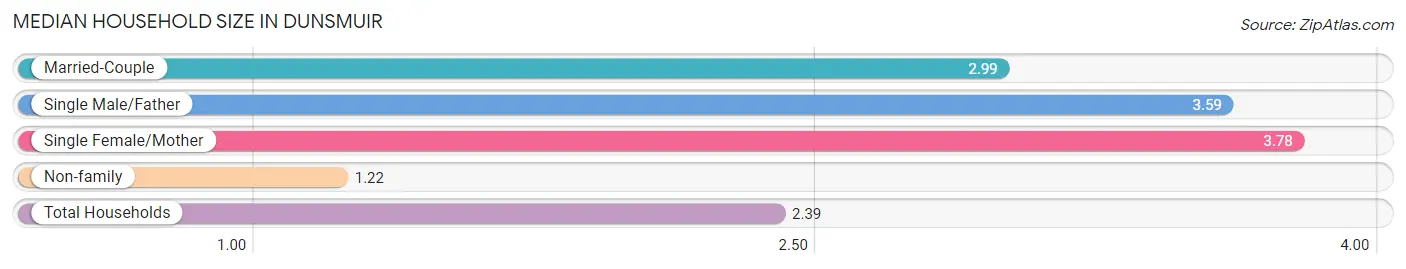
| Household Type | # Households | Household Size |
| Married-Couple | 280 (38.2%) | 2.99 |
| Single Male/Father | 59 (8.0%) | 3.59 |
| Single Female/Mother | 87 (11.8%) | 3.78 |
| Non-family | 308 (42.0%) | 1.22 |
| Total Households | 734 (100.0%) | 2.39 |
Household Size by Marriage Status in Dunsmuir
Out of a total of 734 households in Dunsmuir, 426 (58.0%) are family households, while 308 (42.0%) are nonfamily households. The most numerous type of family households are 2-person households, comprising 208, and the most common type of nonfamily households are 1-person households, comprising 261.
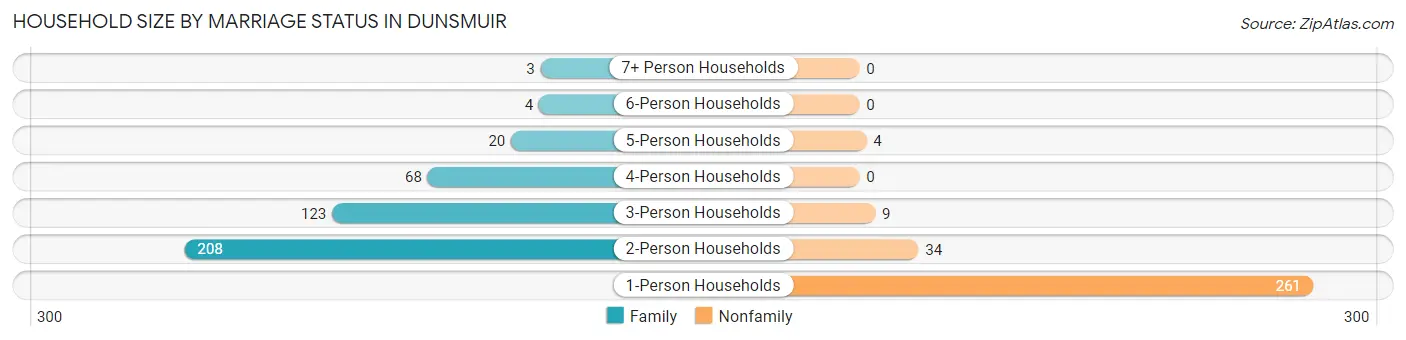
| Household Size | Family Households | Nonfamily Households |
| 1-Person Households | - | 261 (35.6%) |
| 2-Person Households | 208 (28.3%) | 34 (4.6%) |
| 3-Person Households | 123 (16.8%) | 9 (1.2%) |
| 4-Person Households | 68 (9.3%) | 0 (0.0%) |
| 5-Person Households | 20 (2.7%) | 4 (0.5%) |
| 6-Person Households | 4 (0.5%) | 0 (0.0%) |
| 7+ Person Households | 3 (0.4%) | 0 (0.0%) |
| Total | 426 (58.0%) | 308 (42.0%) |
Female Fertility in Dunsmuir
Fertility by Age in Dunsmuir
Average fertility rate in Dunsmuir is 81.0 births per 1,000 women. Women in the age bracket of 15 to 19 years have the highest fertility rate with 471.0 births per 1,000 women. Women in the age bracket of 15 to 19 years acount for 72.7% of all women with births.
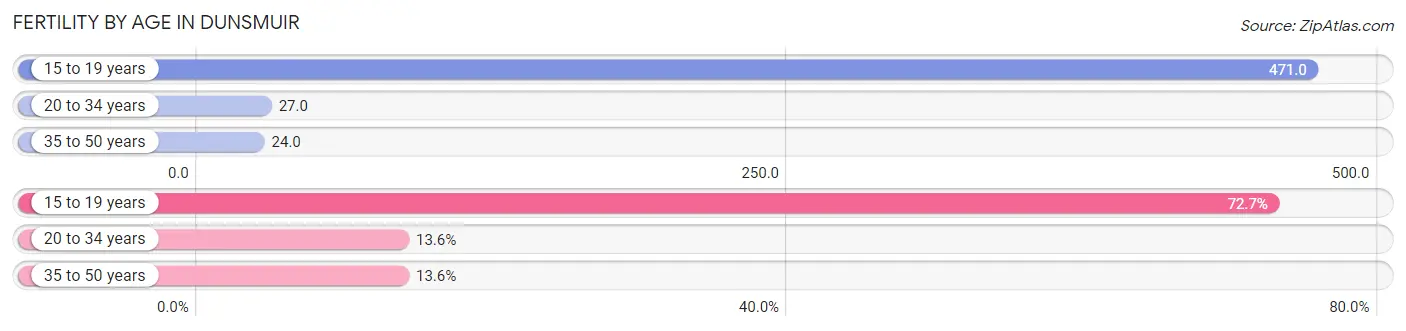
| Age Bracket | Women with Births | Births / 1,000 Women |
| 15 to 19 years | 16 (72.7%) | 471.0 |
| 20 to 34 years | 3 (13.6%) | 27.0 |
| 35 to 50 years | 3 (13.6%) | 24.0 |
| Total | 22 (100.0%) | 81.0 |
Fertility by Age by Marriage Status in Dunsmuir
13.6% of women with births (22) in Dunsmuir are married. The highest percentage of unmarried women with births falls into 15 to 19 years age bracket with 100.0% of them unmarried at the time of birth, while the lowest percentage of unmarried women with births belong to 35 to 50 years age bracket with 0.0% of them unmarried.
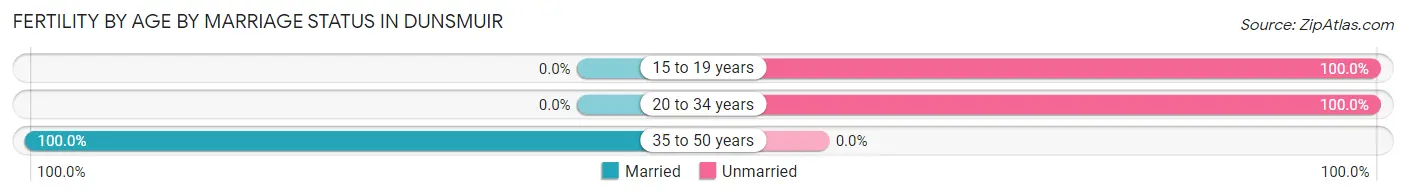
| Age Bracket | Married | Unmarried |
| 15 to 19 years | 0 (0.0%) | 16 (100.0%) |
| 20 to 34 years | 0 (0.0%) | 3 (100.0%) |
| 35 to 50 years | 3 (100.0%) | 0 (0.0%) |
| Total | 3 (13.6%) | 19 (86.4%) |
Fertility by Education in Dunsmuir
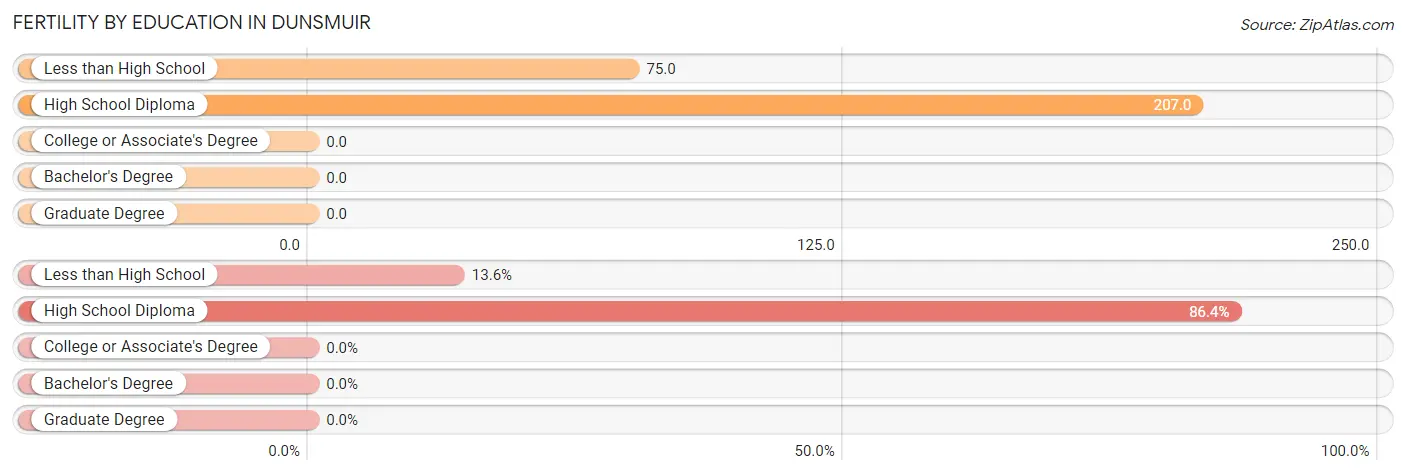
| Educational Attainment | Women with Births | Births / 1,000 Women |
| Less than High School | 3 (13.6%) | 75.0 |
| High School Diploma | 19 (86.4%) | 207.0 |
| College or Associate's Degree | 0 (0.0%) | 0.0 |
| Bachelor's Degree | 0 (0.0%) | 0.0 |
| Graduate Degree | 0 (0.0%) | 0.0 |
| Total | 22 (100.0%) | 81.0 |
Fertility by Education by Marriage Status in Dunsmuir
86.4% of women with births in Dunsmuir are unmarried. Women with the educational attainment of high school diploma are most likely to be married with 15.8% of them married at childbirth, while women with the educational attainment of less than high school are least likely to be married with 100.0% of them unmarried at childbirth.
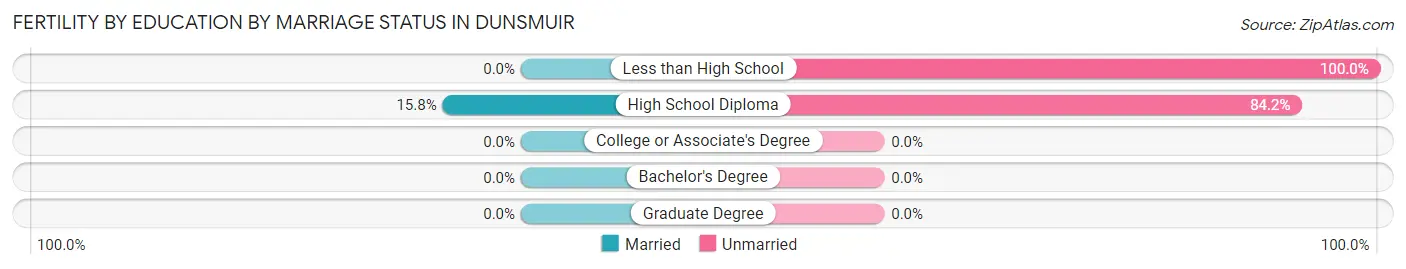
| Educational Attainment | Married | Unmarried |
| Less than High School | 0 (0.0%) | 3 (100.0%) |
| High School Diploma | 3 (15.8%) | 16 (84.2%) |
| College or Associate's Degree | 0 (0.0%) | 0 (0.0%) |
| Bachelor's Degree | 0 (0.0%) | 0 (0.0%) |
| Graduate Degree | 0 (0.0%) | 0 (0.0%) |
| Total | 3 (13.6%) | 19 (86.4%) |
Employment Characteristics in Dunsmuir
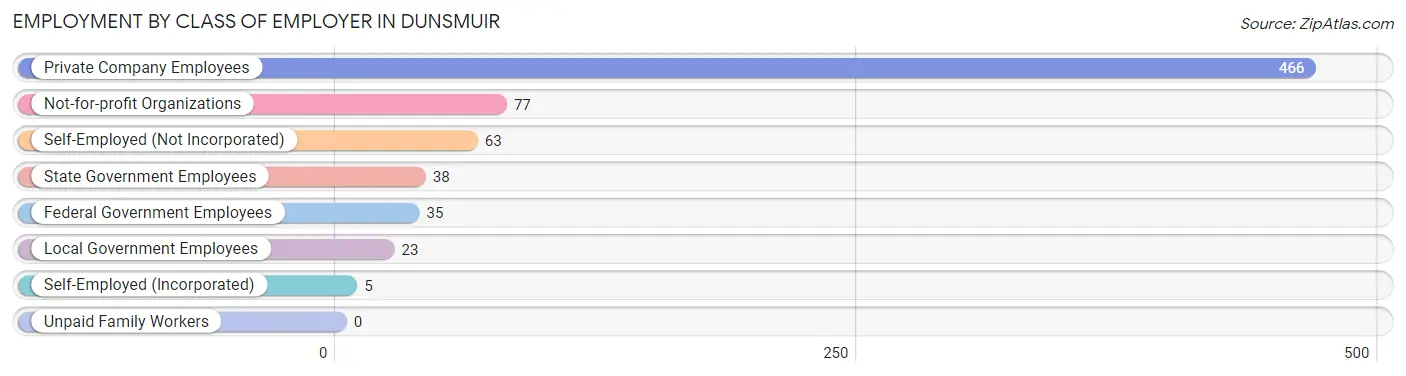
Employment by Class of Employer in Dunsmuir
Among the 707 employed individuals in Dunsmuir, private company employees (466 | 65.9%), not-for-profit organizations (77 | 10.9%), and self-employed (not incorporated) (63 | 8.9%) make up the most common classes of employment.
| Employer Class | # Employees | % Employees |
| Private Company Employees | 466 | 65.9% |
| Self-Employed (Incorporated) | 5 | 0.7% |
| Self-Employed (Not Incorporated) | 63 | 8.9% |
| Not-for-profit Organizations | 77 | 10.9% |
| Local Government Employees | 23 | 3.3% |
| State Government Employees | 38 | 5.4% |
| Federal Government Employees | 35 | 5.0% |
| Unpaid Family Workers | 0 | 0.0% |
| Total | 707 | 100.0% |
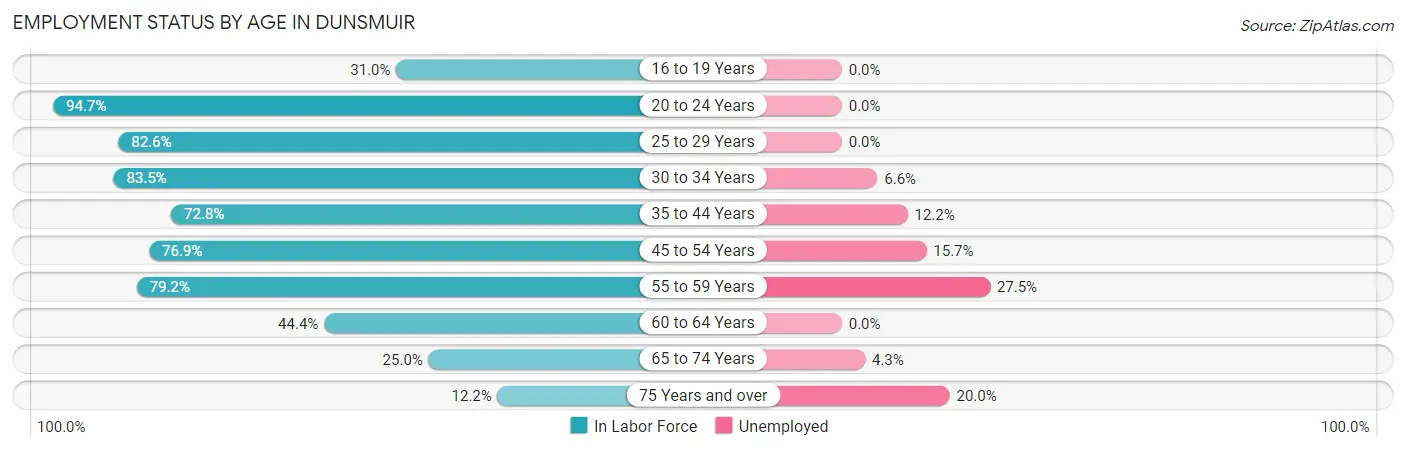
Employment Status by Age in Dunsmuir
According to the labor force statistics for Dunsmuir, out of the total population over 16 years of age (1,399), 56.7% or 793 individuals are in the labor force, with 8.7% or 69 of them unemployed. The age group with the highest labor force participation rate is 20 to 24 years, with 94.7% or 90 individuals in the labor force. Within the labor force, the 55 to 59 years age range has the highest percentage of unemployed individuals, with 27.5% or 22 of them being unemployed.
| Age Bracket | In Labor Force | Unemployed |
| 16 to 19 Years | 22 (31.0%) | 0 (0.0%) |
| 20 to 24 Years | 90 (94.7%) | 0 (0.0%) |
| 25 to 29 Years | 114 (82.6%) | 0 (0.0%) |
| 30 to 34 Years | 76 (83.5%) | 5 (6.6%) |
| 35 to 44 Years | 115 (72.8%) | 14 (12.2%) |
| 45 to 54 Years | 140 (76.9%) | 22 (15.7%) |
| 55 to 59 Years | 80 (79.2%) | 22 (27.5%) |
| 60 to 64 Years | 71 (44.4%) | 0 (0.0%) |
| 65 to 74 Years | 70 (25.0%) | 3 (4.3%) |
| 75 Years and over | 15 (12.2%) | 3 (20.0%) |
| Total | 793 (56.7%) | 69 (8.7%) |
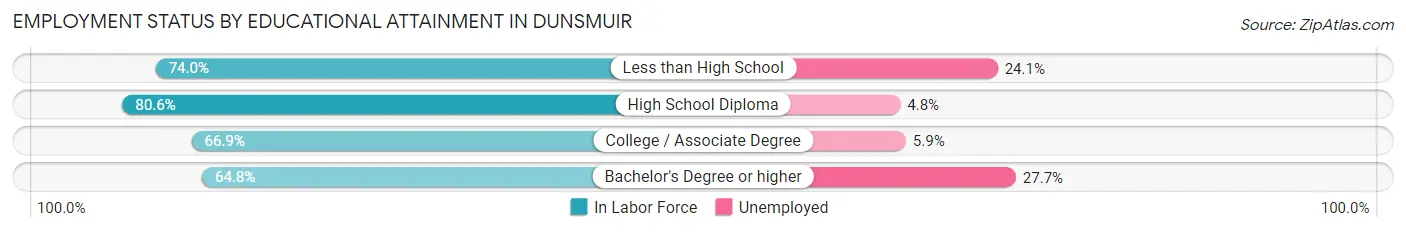
Employment Status by Educational Attainment in Dunsmuir
According to labor force statistics for Dunsmuir, 71.8% of individuals (596) out of the total population between 25 and 64 years of age (830) are in the labor force, with 10.6% or 63 of them being unemployed. The group with the highest labor force participation rate are those with the educational attainment of high school diploma, with 80.6% or 228 individuals in the labor force. Within the labor force, individuals with bachelor's degree or higher education have the highest percentage of unemployment, with 27.7% or 26 of them being unemployed.
| Educational Attainment | In Labor Force | Unemployed |
| Less than High School | 54 (74.0%) | 18 (24.1%) |
| High School Diploma | 228 (80.6%) | 14 (4.8%) |
| College / Associate Degree | 220 (66.9%) | 19 (5.9%) |
| Bachelor's Degree or higher | 94 (64.8%) | 40 (27.7%) |
| Total | 596 (71.8%) | 88 (10.6%) |
Employment Occupations by Sex in Dunsmuir
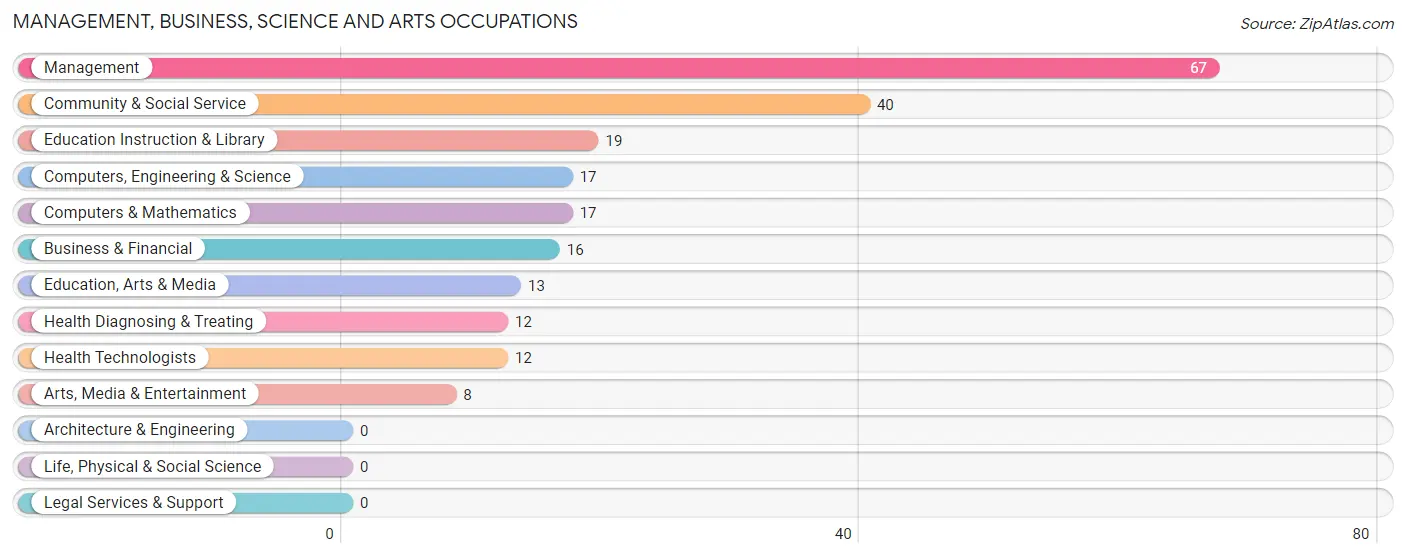
Management, Business, Science and Arts Occupations
The most common Management, Business, Science and Arts occupations in Dunsmuir are Management (67 | 9.2%), Community & Social Service (40 | 5.5%), Education Instruction & Library (19 | 2.6%), Computers, Engineering & Science (17 | 2.4%), and Computers & Mathematics (17 | 2.4%).
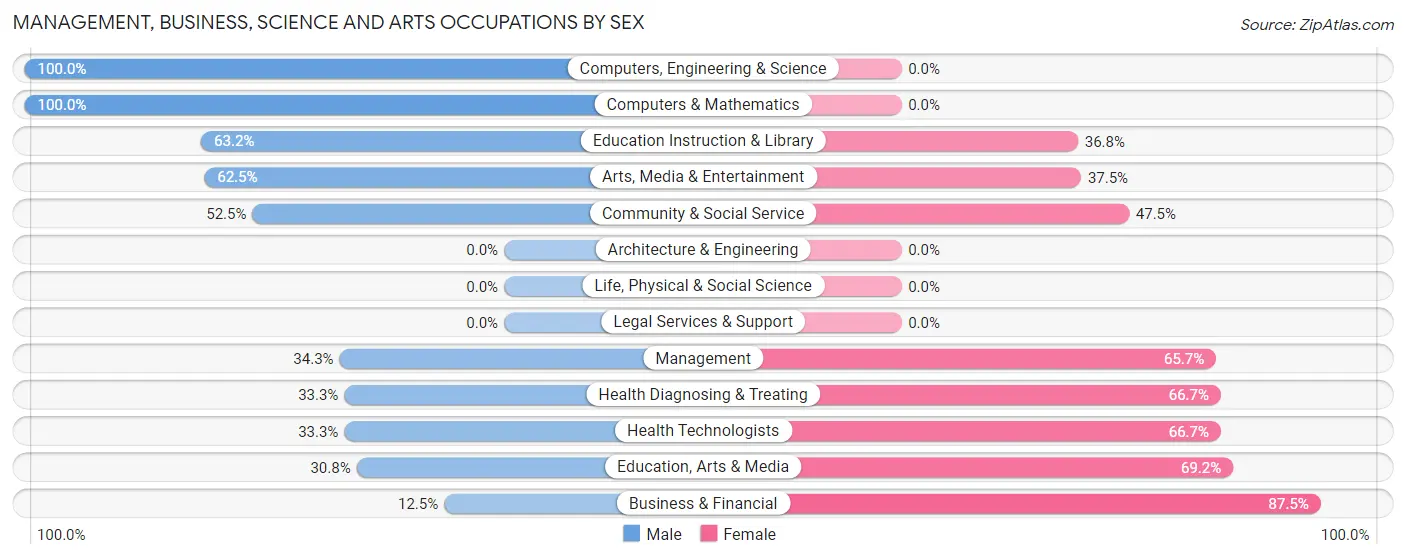
Management, Business, Science and Arts Occupations by Sex
Within the Management, Business, Science and Arts occupations in Dunsmuir, the most male-oriented occupations are Computers, Engineering & Science (100.0%), Computers & Mathematics (100.0%), and Education Instruction & Library (63.2%), while the most female-oriented occupations are Business & Financial (87.5%), Education, Arts & Media (69.2%), and Health Diagnosing & Treating (66.7%).
| Occupation | Male | Female |
| Management | 23 (34.3%) | 44 (65.7%) |
| Business & Financial | 2 (12.5%) | 14 (87.5%) |
| Computers, Engineering & Science | 17 (100.0%) | 0 (0.0%) |
| Computers & Mathematics | 17 (100.0%) | 0 (0.0%) |
| Architecture & Engineering | 0 (0.0%) | 0 (0.0%) |
| Life, Physical & Social Science | 0 (0.0%) | 0 (0.0%) |
| Community & Social Service | 21 (52.5%) | 19 (47.5%) |
| Education, Arts & Media | 4 (30.8%) | 9 (69.2%) |
| Legal Services & Support | 0 (0.0%) | 0 (0.0%) |
| Education Instruction & Library | 12 (63.2%) | 7 (36.8%) |
| Arts, Media & Entertainment | 5 (62.5%) | 3 (37.5%) |
| Health Diagnosing & Treating | 4 (33.3%) | 8 (66.7%) |
| Health Technologists | 4 (33.3%) | 8 (66.7%) |
| Total (Category) | 67 (44.1%) | 85 (55.9%) |
| Total (Overall) | 392 (54.1%) | 332 (45.9%) |
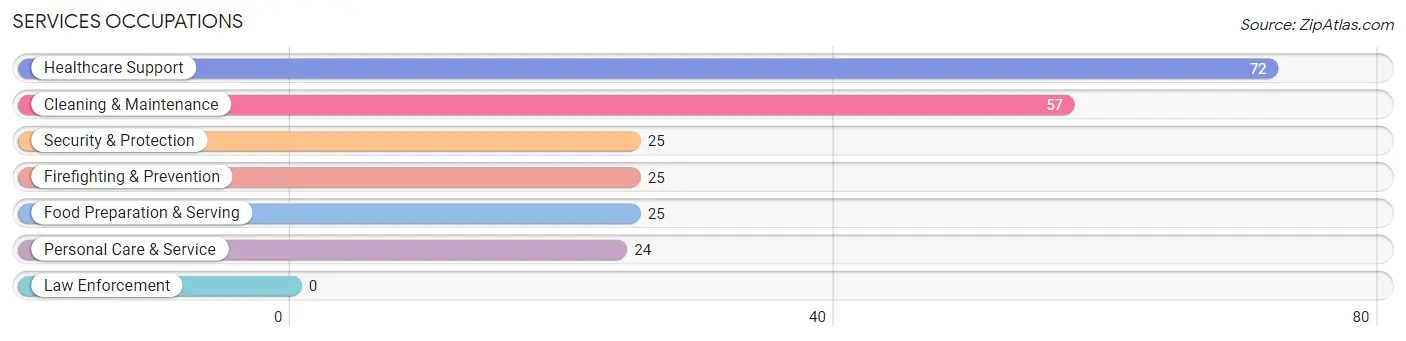
Services Occupations
The most common Services occupations in Dunsmuir are Healthcare Support (72 | 9.9%), Cleaning & Maintenance (57 | 7.9%), Security & Protection (25 | 3.5%), Firefighting & Prevention (25 | 3.5%), and Food Preparation & Serving (25 | 3.5%).
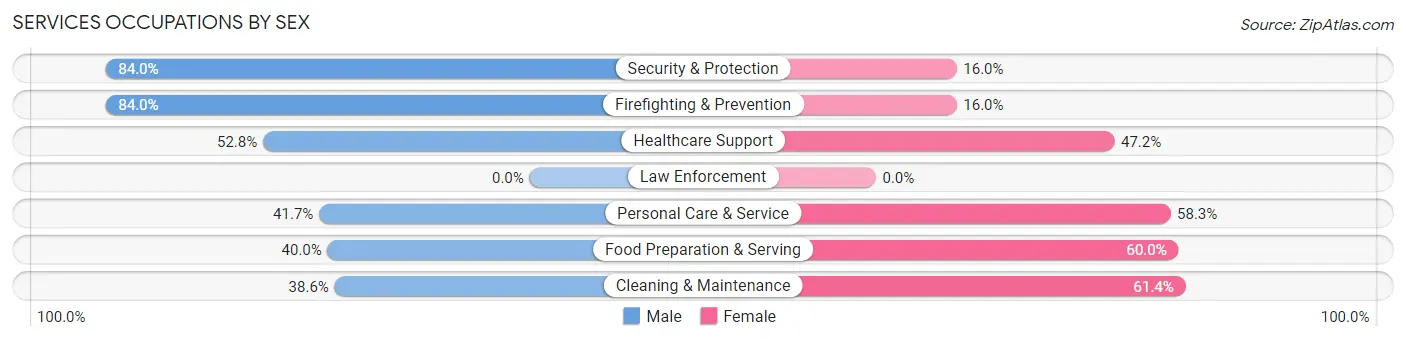
Services Occupations by Sex
Within the Services occupations in Dunsmuir, the most male-oriented occupations are Security & Protection (84.0%), Firefighting & Prevention (84.0%), and Healthcare Support (52.8%), while the most female-oriented occupations are Cleaning & Maintenance (61.4%), Food Preparation & Serving (60.0%), and Personal Care & Service (58.3%).
| Occupation | Male | Female |
| Healthcare Support | 38 (52.8%) | 34 (47.2%) |
| Security & Protection | 21 (84.0%) | 4 (16.0%) |
| Firefighting & Prevention | 21 (84.0%) | 4 (16.0%) |
| Law Enforcement | 0 (0.0%) | 0 (0.0%) |
| Food Preparation & Serving | 10 (40.0%) | 15 (60.0%) |
| Cleaning & Maintenance | 22 (38.6%) | 35 (61.4%) |
| Personal Care & Service | 10 (41.7%) | 14 (58.3%) |
| Total (Category) | 101 (49.7%) | 102 (50.2%) |
| Total (Overall) | 392 (54.1%) | 332 (45.9%) |
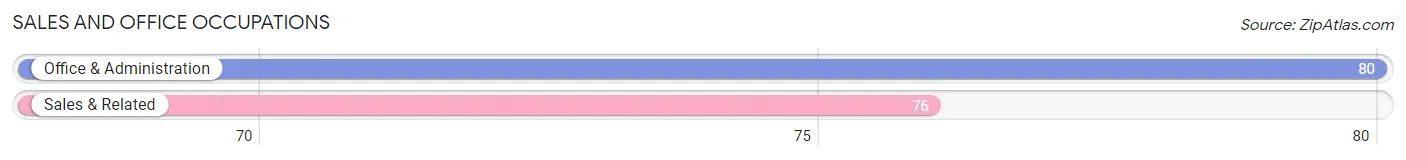
Sales and Office Occupations
The most common Sales and Office occupations in Dunsmuir are Office & Administration (80 | 11.1%), and Sales & Related (76 | 10.5%).
Sales and Office Occupations by Sex
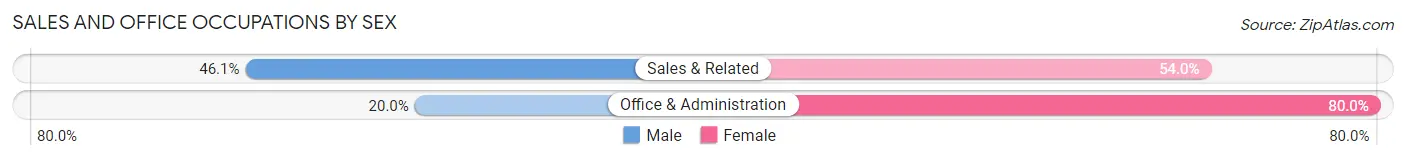
| Occupation | Male | Female |
| Sales & Related | 35 (46.1%) | 41 (53.9%) |
| Office & Administration | 16 (20.0%) | 64 (80.0%) |
| Total (Category) | 51 (32.7%) | 105 (67.3%) |
| Total (Overall) | 392 (54.1%) | 332 (45.9%) |
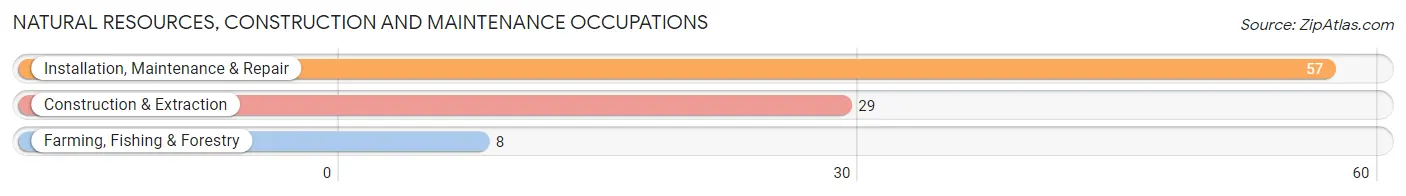
Natural Resources, Construction and Maintenance Occupations
The most common Natural Resources, Construction and Maintenance occupations in Dunsmuir are Installation, Maintenance & Repair (57 | 7.9%), Construction & Extraction (29 | 4.0%), and Farming, Fishing & Forestry (8 | 1.1%).
Natural Resources, Construction and Maintenance Occupations by Sex
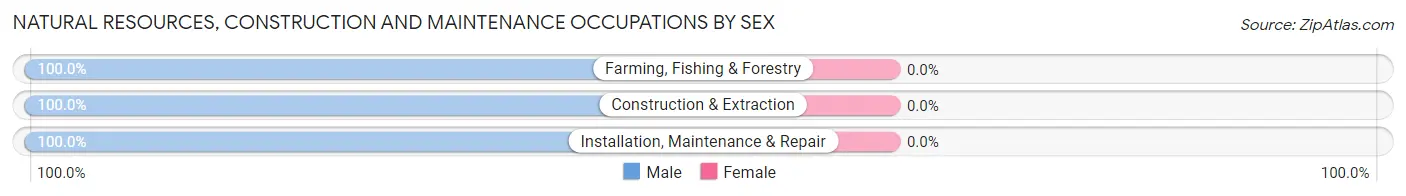
| Occupation | Male | Female |
| Farming, Fishing & Forestry | 8 (100.0%) | 0 (0.0%) |
| Construction & Extraction | 29 (100.0%) | 0 (0.0%) |
| Installation, Maintenance & Repair | 57 (100.0%) | 0 (0.0%) |
| Total (Category) | 94 (100.0%) | 0 (0.0%) |
| Total (Overall) | 392 (54.1%) | 332 (45.9%) |
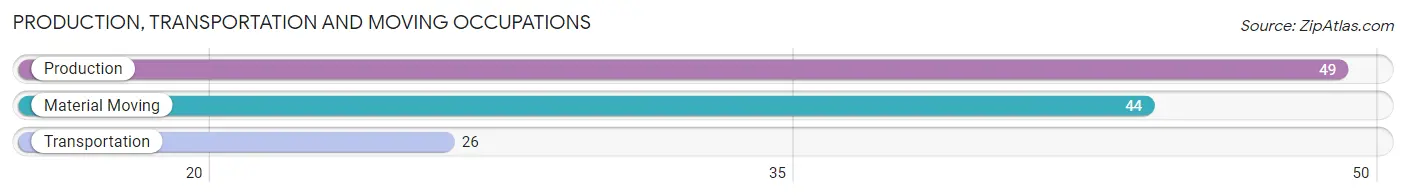
Production, Transportation and Moving Occupations
The most common Production, Transportation and Moving occupations in Dunsmuir are Production (49 | 6.8%), Material Moving (44 | 6.1%), and Transportation (26 | 3.6%).
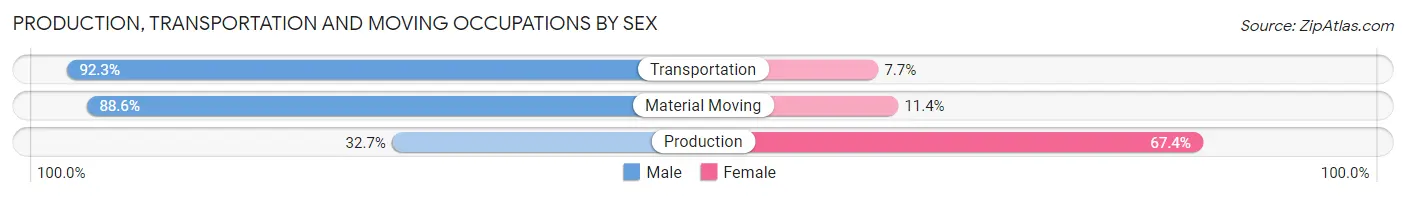
Production, Transportation and Moving Occupations by Sex
| Occupation | Male | Female |
| Production | 16 (32.7%) | 33 (67.3%) |
| Transportation | 24 (92.3%) | 2 (7.7%) |
| Material Moving | 39 (88.6%) | 5 (11.4%) |
| Total (Category) | 79 (66.4%) | 40 (33.6%) |
| Total (Overall) | 392 (54.1%) | 332 (45.9%) |
Employment Industries by Sex in Dunsmuir
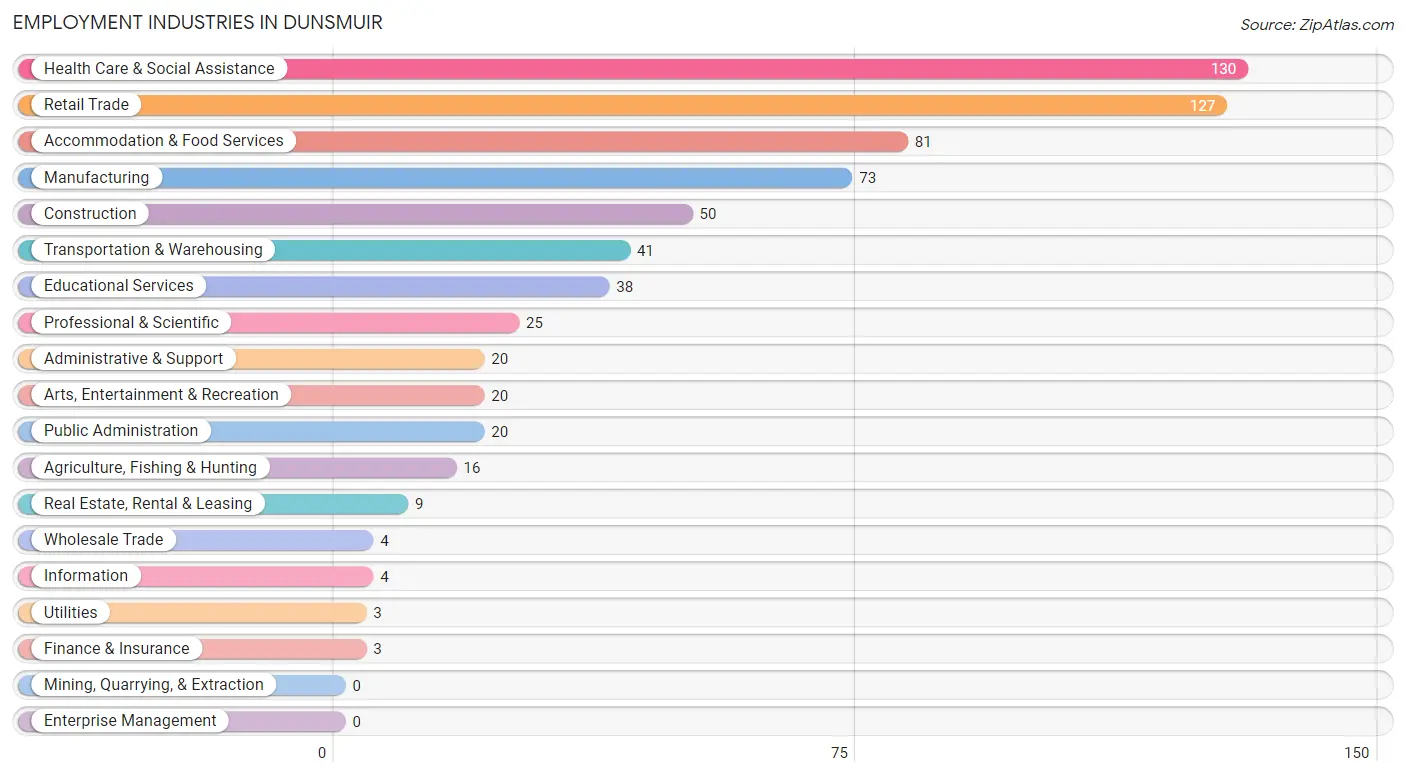
Employment Industries in Dunsmuir
The major employment industries in Dunsmuir include Health Care & Social Assistance (130 | 18.0%), Retail Trade (127 | 17.5%), Accommodation & Food Services (81 | 11.2%), Manufacturing (73 | 10.1%), and Construction (50 | 6.9%).
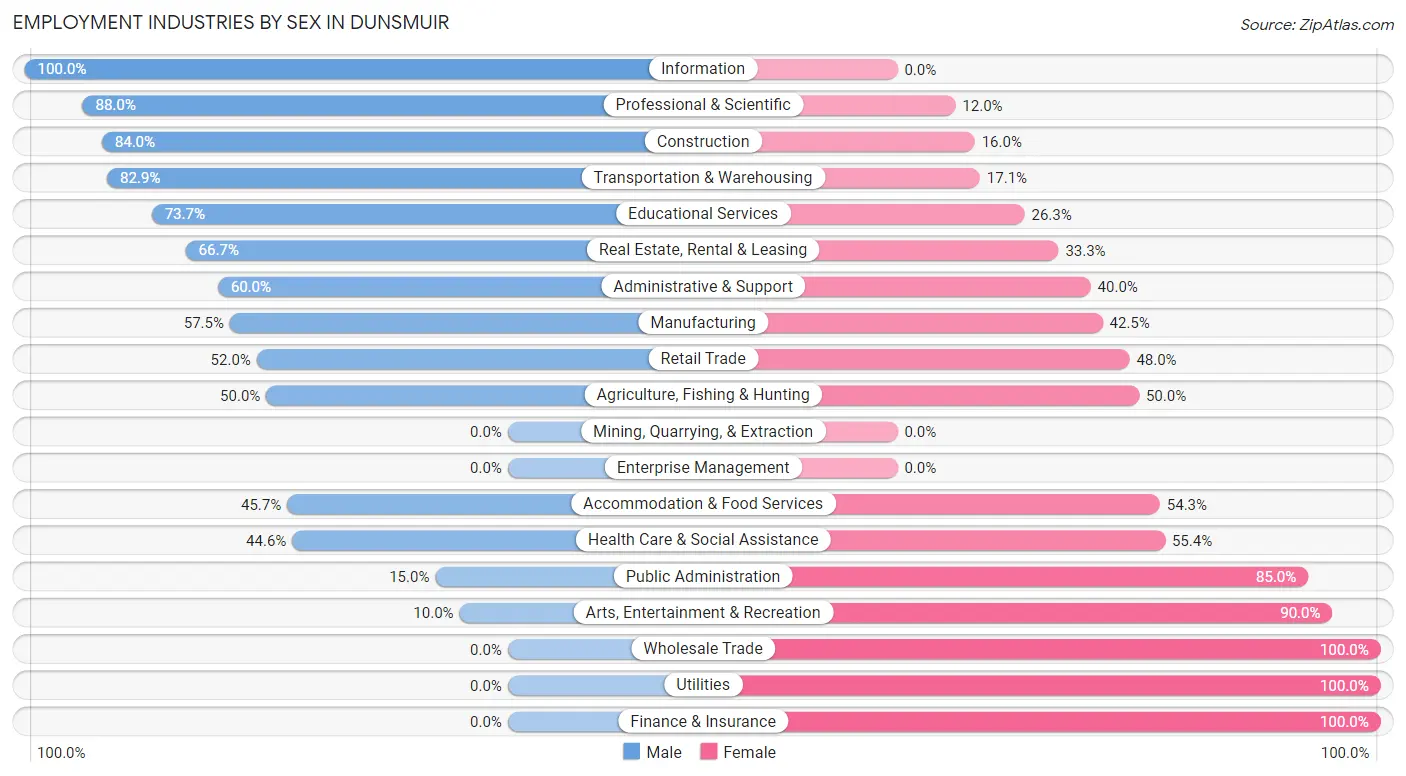
Employment Industries by Sex in Dunsmuir
The Dunsmuir industries that see more men than women are Information (100.0%), Professional & Scientific (88.0%), and Construction (84.0%), whereas the industries that tend to have a higher number of women are Wholesale Trade (100.0%), Utilities (100.0%), and Finance & Insurance (100.0%).
| Industry | Male | Female |
| Agriculture, Fishing & Hunting | 8 (50.0%) | 8 (50.0%) |
| Mining, Quarrying, & Extraction | 0 (0.0%) | 0 (0.0%) |
| Construction | 42 (84.0%) | 8 (16.0%) |
| Manufacturing | 42 (57.5%) | 31 (42.5%) |
| Wholesale Trade | 0 (0.0%) | 4 (100.0%) |
| Retail Trade | 66 (52.0%) | 61 (48.0%) |
| Transportation & Warehousing | 34 (82.9%) | 7 (17.1%) |
| Utilities | 0 (0.0%) | 3 (100.0%) |
| Information | 4 (100.0%) | 0 (0.0%) |
| Finance & Insurance | 0 (0.0%) | 3 (100.0%) |
| Real Estate, Rental & Leasing | 6 (66.7%) | 3 (33.3%) |
| Professional & Scientific | 22 (88.0%) | 3 (12.0%) |
| Enterprise Management | 0 (0.0%) | 0 (0.0%) |
| Administrative & Support | 12 (60.0%) | 8 (40.0%) |
| Educational Services | 28 (73.7%) | 10 (26.3%) |
| Health Care & Social Assistance | 58 (44.6%) | 72 (55.4%) |
| Arts, Entertainment & Recreation | 2 (10.0%) | 18 (90.0%) |
| Accommodation & Food Services | 37 (45.7%) | 44 (54.3%) |
| Public Administration | 3 (15.0%) | 17 (85.0%) |
| Total | 392 (54.1%) | 332 (45.9%) |
Education in Dunsmuir
School Enrollment in Dunsmuir
The most common levels of schooling among the 298 students in Dunsmuir are college / undergraduate (82 | 27.5%), elementary school (60 | 20.1%), and high school (58 | 19.5%).
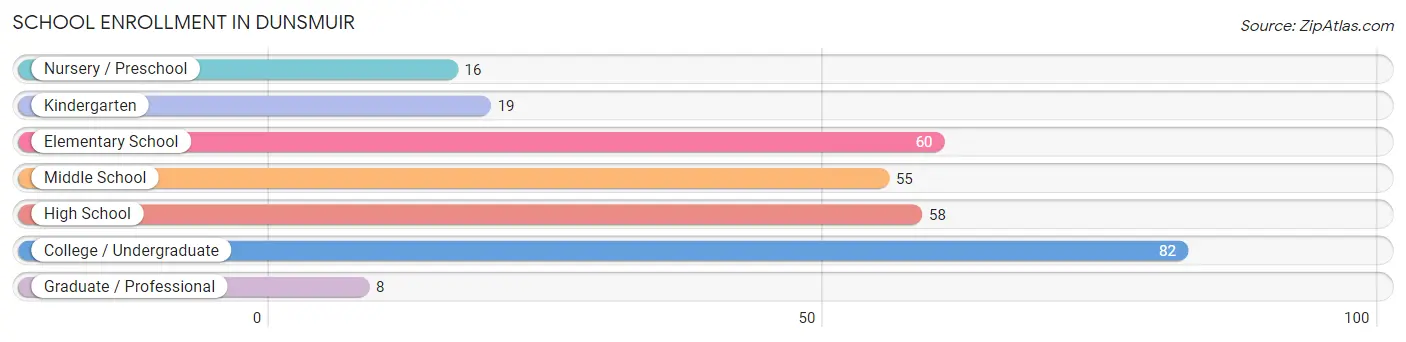
| School Level | # Students | % Students |
| Nursery / Preschool | 16 | 5.4% |
| Kindergarten | 19 | 6.4% |
| Elementary School | 60 | 20.1% |
| Middle School | 55 | 18.5% |
| High School | 58 | 19.5% |
| College / Undergraduate | 82 | 27.5% |
| Graduate / Professional | 8 | 2.7% |
| Total | 298 | 100.0% |
School Enrollment by Age by Funding Source in Dunsmuir
Out of a total of 298 students who are enrolled in schools in Dunsmuir, 47 (15.8%) attend a private institution, while the remaining 251 (84.2%) are enrolled in public schools. The age group of 25 to 34 year olds has the highest likelihood of being enrolled in private schools, with 16 (45.7% in the age bracket) enrolled. Conversely, the age group of 18 to 19 year olds has the lowest likelihood of being enrolled in a private school, with 11 (100.0% in the age bracket) attending a public institution.
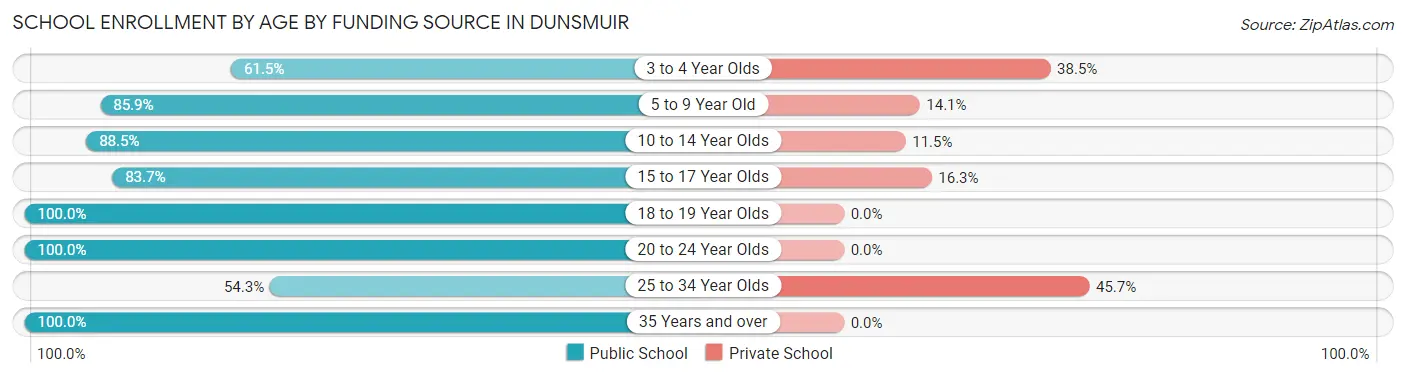
| Age Bracket | Public School | Private School |
| 3 to 4 Year Olds | 8 (61.5%) | 5 (38.5%) |
| 5 to 9 Year Old | 67 (85.9%) | 11 (14.1%) |
| 10 to 14 Year Olds | 54 (88.5%) | 7 (11.5%) |
| 15 to 17 Year Olds | 41 (83.7%) | 8 (16.3%) |
| 18 to 19 Year Olds | 11 (100.0%) | 0 (0.0%) |
| 20 to 24 Year Olds | 2 (100.0%) | 0 (0.0%) |
| 25 to 34 Year Olds | 19 (54.3%) | 16 (45.7%) |
| 35 Years and over | 49 (100.0%) | 0 (0.0%) |
| Total | 251 (84.2%) | 47 (15.8%) |
Educational Attainment by Field of Study in Dunsmuir
Social sciences (38 | 16.1%), science & technology (29 | 12.3%), education (29 | 12.3%), business (28 | 11.9%), and arts & humanities (23 | 9.8%) are the most common fields of study among 236 individuals in Dunsmuir who have obtained a bachelor's degree or higher.
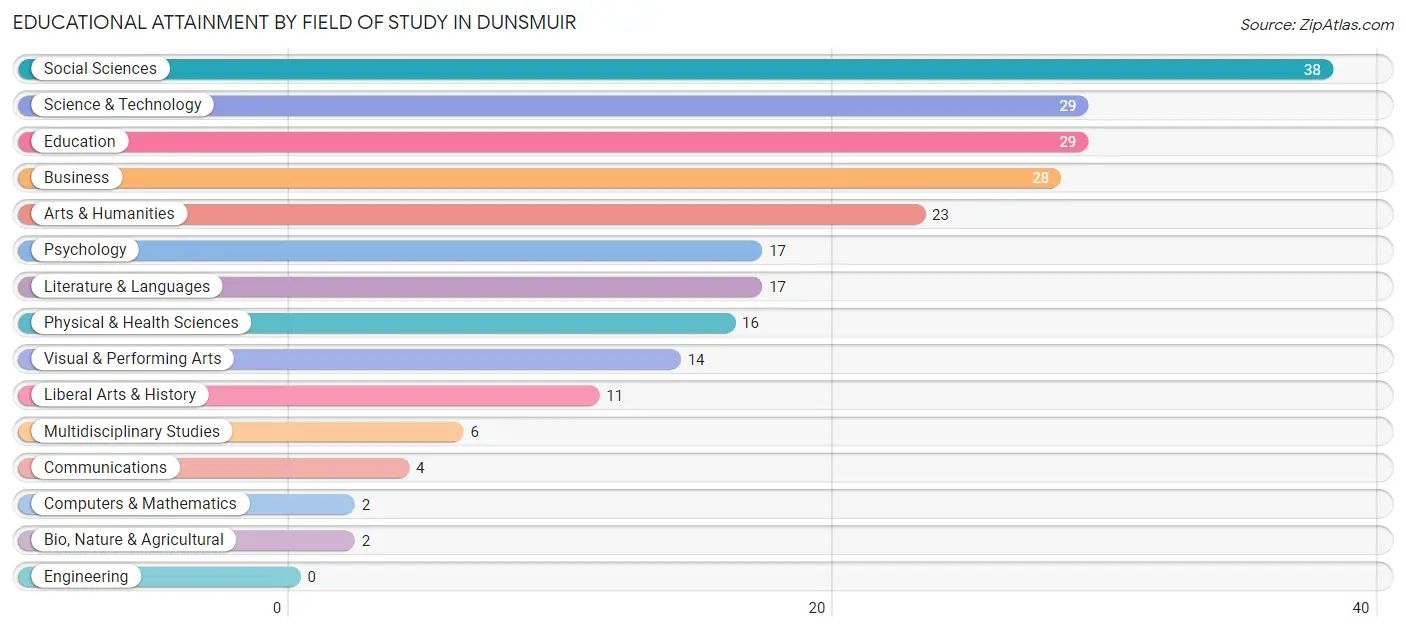
| Field of Study | # Graduates | % Graduates |
| Computers & Mathematics | 2 | 0.9% |
| Bio, Nature & Agricultural | 2 | 0.9% |
| Physical & Health Sciences | 16 | 6.8% |
| Psychology | 17 | 7.2% |
| Social Sciences | 38 | 16.1% |
| Engineering | 0 | 0.0% |
| Multidisciplinary Studies | 6 | 2.5% |
| Science & Technology | 29 | 12.3% |
| Business | 28 | 11.9% |
| Education | 29 | 12.3% |
| Literature & Languages | 17 | 7.2% |
| Liberal Arts & History | 11 | 4.7% |
| Visual & Performing Arts | 14 | 5.9% |
| Communications | 4 | 1.7% |
| Arts & Humanities | 23 | 9.8% |
| Total | 236 | 100.0% |
Transportation & Commute in Dunsmuir
Vehicle Availability by Sex in Dunsmuir
The most prevalent vehicle ownership categories in Dunsmuir are males with 2 vehicles (132, accounting for 34.3%) and females with 2 vehicles (80, making up 41.0%).
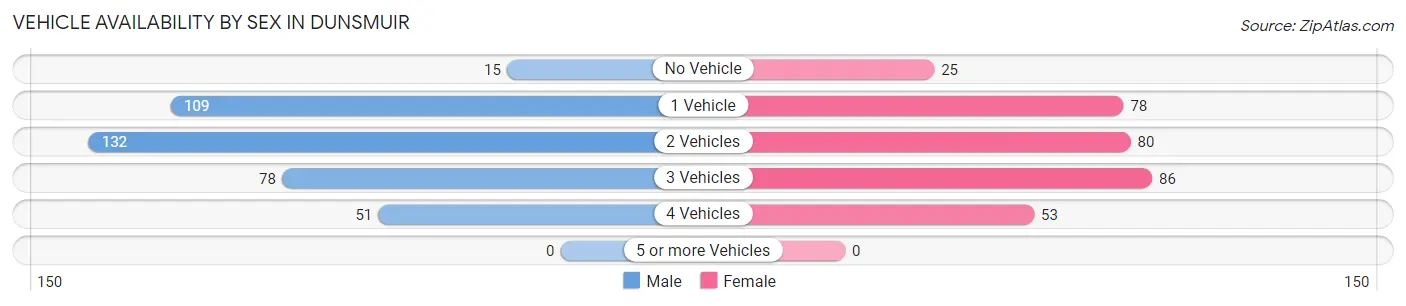
| Vehicles Available | Male | Female |
| No Vehicle | 15 (3.9%) | 25 (7.8%) |
| 1 Vehicle | 109 (28.3%) | 78 (24.2%) |
| 2 Vehicles | 132 (34.3%) | 80 (24.8%) |
| 3 Vehicles | 78 (20.3%) | 86 (26.7%) |
| 4 Vehicles | 51 (13.3%) | 53 (16.5%) |
| 5 or more Vehicles | 0 (0.0%) | 0 (0.0%) |
| Total | 385 (100.0%) | 322 (100.0%) |
Commute Time in Dunsmuir
The most frequently occuring commute durations in Dunsmuir are 15 to 19 minutes (151 commuters, 22.3%), 5 to 9 minutes (116 commuters, 17.1%), and 20 to 24 minutes (116 commuters, 17.1%).
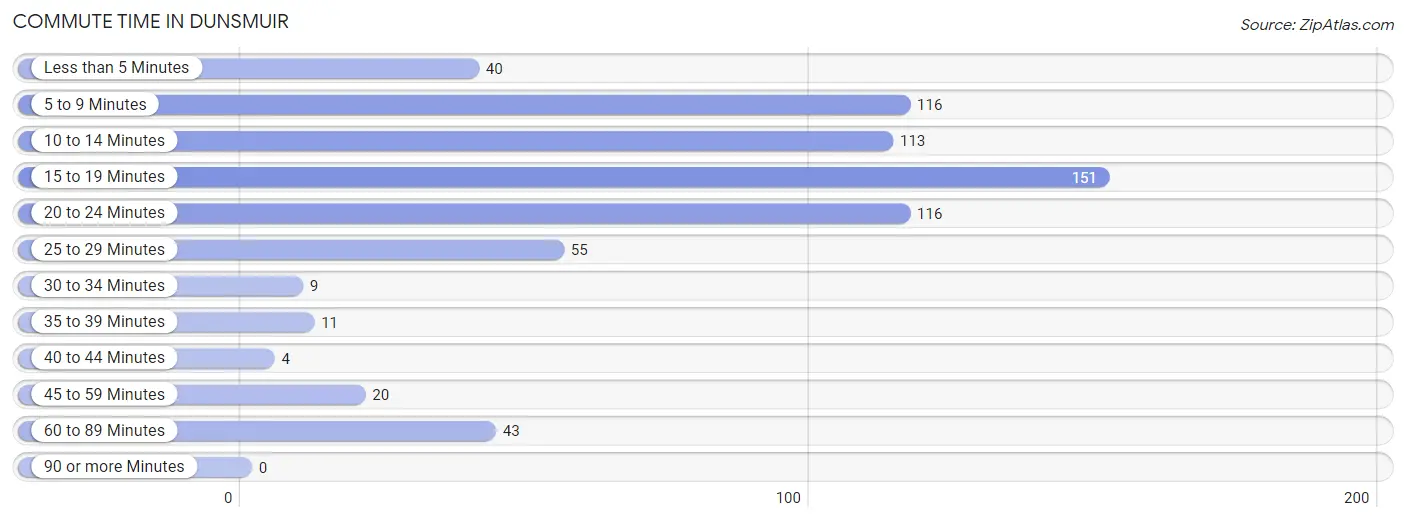
| Commute Time | # Commuters | % Commuters |
| Less than 5 Minutes | 40 | 5.9% |
| 5 to 9 Minutes | 116 | 17.1% |
| 10 to 14 Minutes | 113 | 16.7% |
| 15 to 19 Minutes | 151 | 22.3% |
| 20 to 24 Minutes | 116 | 17.1% |
| 25 to 29 Minutes | 55 | 8.1% |
| 30 to 34 Minutes | 9 | 1.3% |
| 35 to 39 Minutes | 11 | 1.6% |
| 40 to 44 Minutes | 4 | 0.6% |
| 45 to 59 Minutes | 20 | 2.9% |
| 60 to 89 Minutes | 43 | 6.3% |
| 90 or more Minutes | 0 | 0.0% |
Commute Time by Sex in Dunsmuir
The most common commute times in Dunsmuir are 20 to 24 minutes (95 commuters, 25.4%) for males and 15 to 19 minutes (91 commuters, 29.9%) for females.
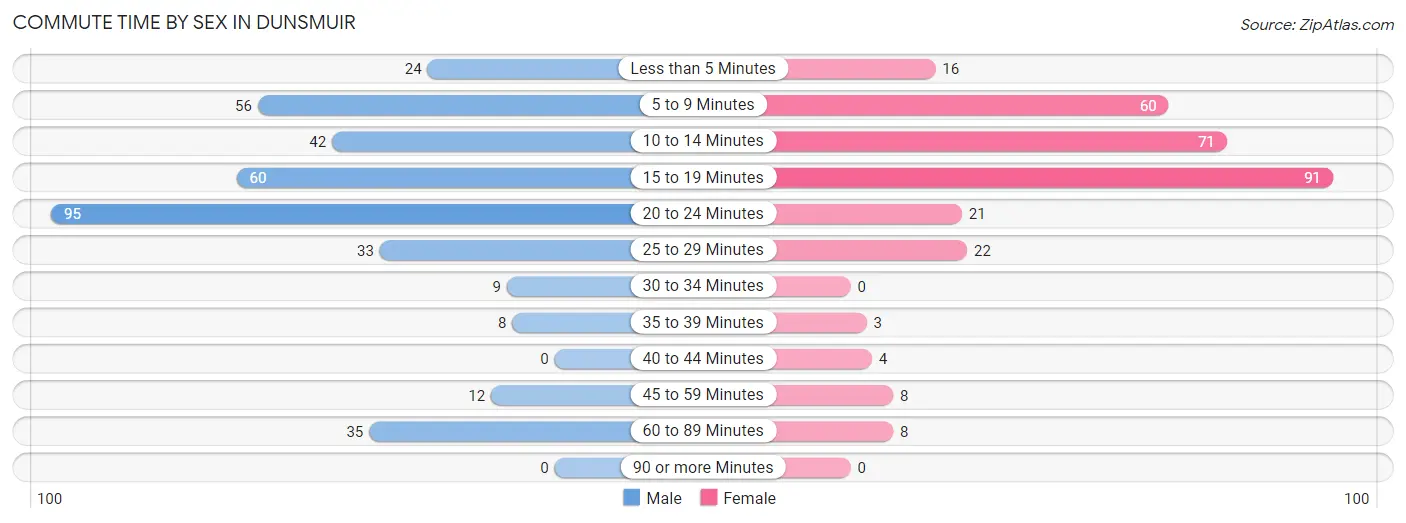
| Commute Time | Male | Female |
| Less than 5 Minutes | 24 (6.4%) | 16 (5.3%) |
| 5 to 9 Minutes | 56 (15.0%) | 60 (19.7%) |
| 10 to 14 Minutes | 42 (11.2%) | 71 (23.4%) |
| 15 to 19 Minutes | 60 (16.0%) | 91 (29.9%) |
| 20 to 24 Minutes | 95 (25.4%) | 21 (6.9%) |
| 25 to 29 Minutes | 33 (8.8%) | 22 (7.2%) |
| 30 to 34 Minutes | 9 (2.4%) | 0 (0.0%) |
| 35 to 39 Minutes | 8 (2.1%) | 3 (1.0%) |
| 40 to 44 Minutes | 0 (0.0%) | 4 (1.3%) |
| 45 to 59 Minutes | 12 (3.2%) | 8 (2.6%) |
| 60 to 89 Minutes | 35 (9.4%) | 8 (2.6%) |
| 90 or more Minutes | 0 (0.0%) | 0 (0.0%) |
Time of Departure to Work by Sex in Dunsmuir
The most frequent times of departure to work in Dunsmuir are 8:00 AM to 8:29 AM (70, 18.7%) for males and 7:00 AM to 7:29 AM (49, 16.1%) for females.
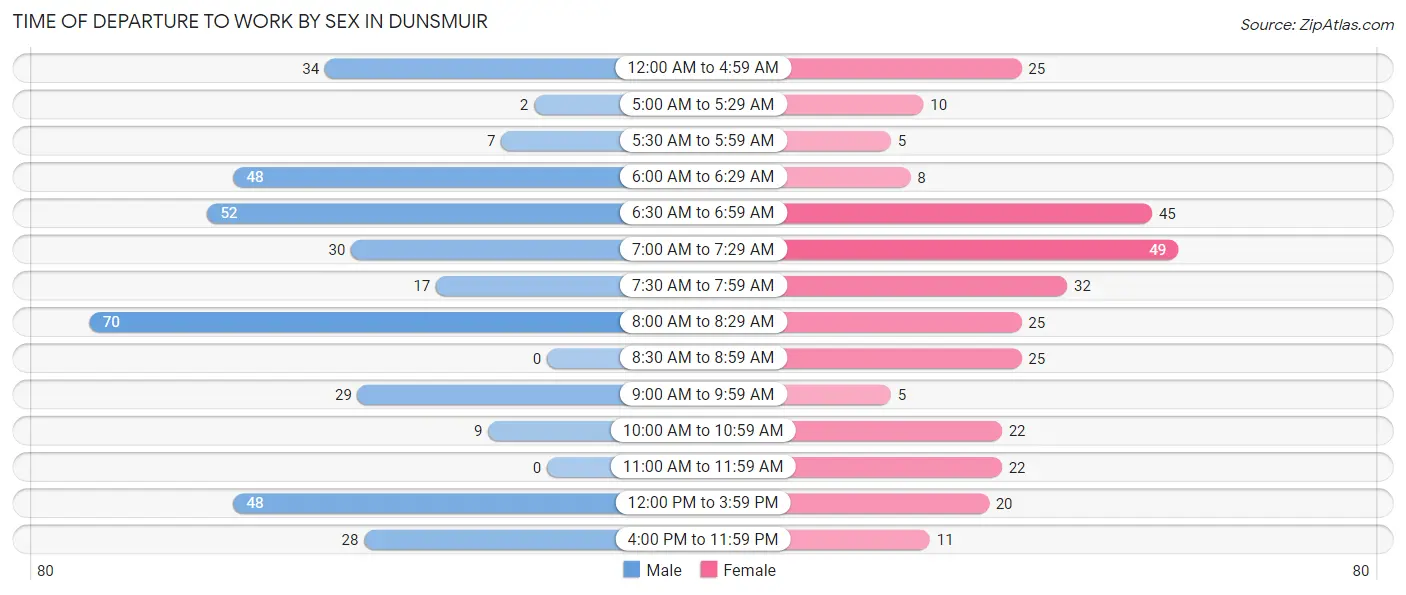
| Time of Departure | Male | Female |
| 12:00 AM to 4:59 AM | 34 (9.1%) | 25 (8.2%) |
| 5:00 AM to 5:29 AM | 2 (0.5%) | 10 (3.3%) |
| 5:30 AM to 5:59 AM | 7 (1.9%) | 5 (1.6%) |
| 6:00 AM to 6:29 AM | 48 (12.8%) | 8 (2.6%) |
| 6:30 AM to 6:59 AM | 52 (13.9%) | 45 (14.8%) |
| 7:00 AM to 7:29 AM | 30 (8.0%) | 49 (16.1%) |
| 7:30 AM to 7:59 AM | 17 (4.5%) | 32 (10.5%) |
| 8:00 AM to 8:29 AM | 70 (18.7%) | 25 (8.2%) |
| 8:30 AM to 8:59 AM | 0 (0.0%) | 25 (8.2%) |
| 9:00 AM to 9:59 AM | 29 (7.7%) | 5 (1.6%) |
| 10:00 AM to 10:59 AM | 9 (2.4%) | 22 (7.2%) |
| 11:00 AM to 11:59 AM | 0 (0.0%) | 22 (7.2%) |
| 12:00 PM to 3:59 PM | 48 (12.8%) | 20 (6.6%) |
| 4:00 PM to 11:59 PM | 28 (7.5%) | 11 (3.6%) |
| Total | 374 (100.0%) | 304 (100.0%) |
Housing Occupancy in Dunsmuir
Occupancy by Ownership in Dunsmuir
Of the total 734 dwellings in Dunsmuir, owner-occupied units account for 393 (53.5%), while renter-occupied units make up 341 (46.5%).
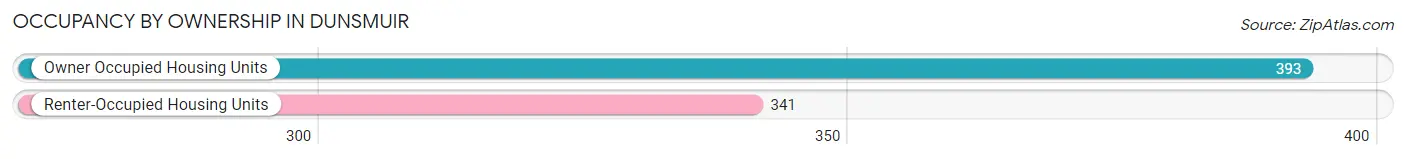
| Occupancy | # Housing Units | % Housing Units |
| Owner Occupied Housing Units | 393 | 53.5% |
| Renter-Occupied Housing Units | 341 | 46.5% |
| Total Occupied Housing Units | 734 | 100.0% |
Occupancy by Household Size in Dunsmuir
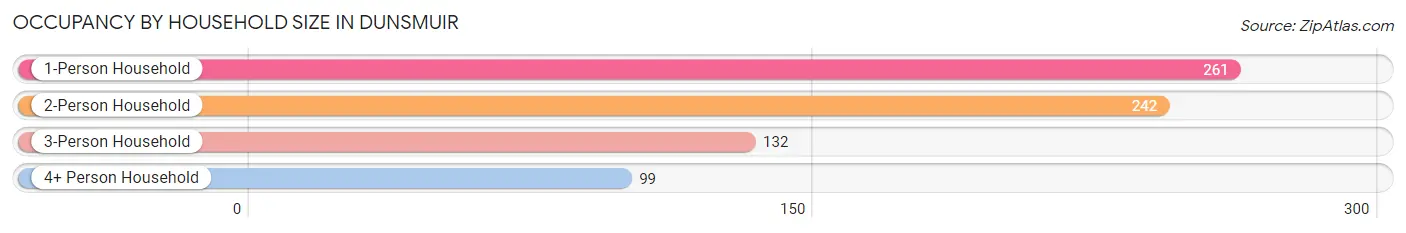
| Household Size | # Housing Units | % Housing Units |
| 1-Person Household | 261 | 35.6% |
| 2-Person Household | 242 | 33.0% |
| 3-Person Household | 132 | 18.0% |
| 4+ Person Household | 99 | 13.5% |
| Total Housing Units | 734 | 100.0% |
Occupancy by Ownership by Household Size in Dunsmuir
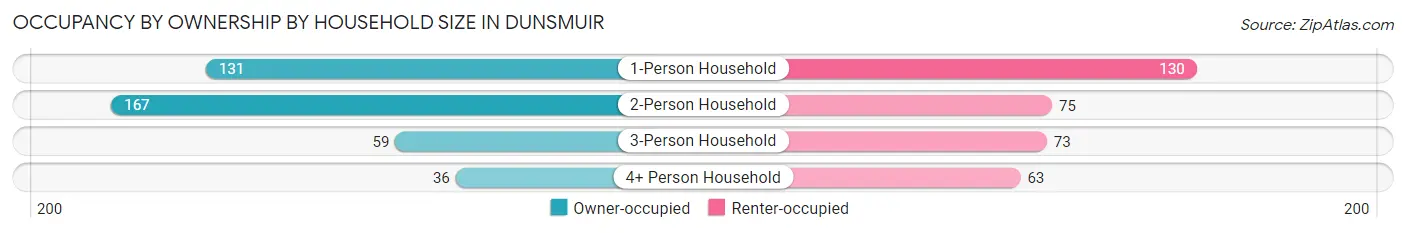
| Household Size | Owner-occupied | Renter-occupied |
| 1-Person Household | 131 (50.2%) | 130 (49.8%) |
| 2-Person Household | 167 (69.0%) | 75 (31.0%) |
| 3-Person Household | 59 (44.7%) | 73 (55.3%) |
| 4+ Person Household | 36 (36.4%) | 63 (63.6%) |
| Total Housing Units | 393 (53.5%) | 341 (46.5%) |
Occupancy by Educational Attainment in Dunsmuir
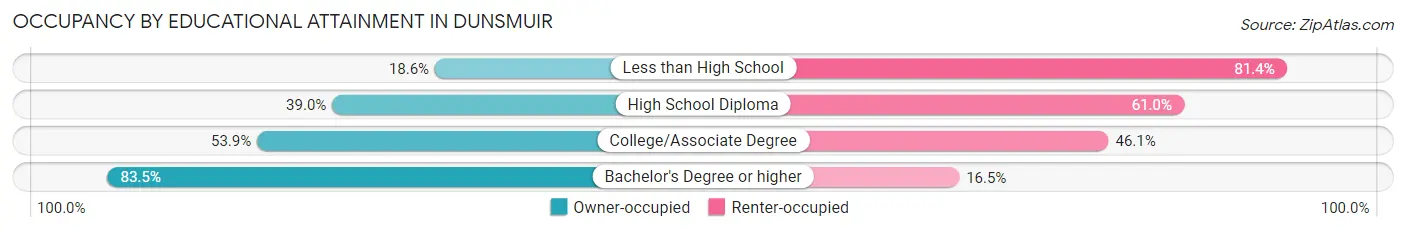
| Household Size | Owner-occupied | Renter-occupied |
| Less than High School | 11 (18.6%) | 48 (81.4%) |
| High School Diploma | 80 (39.0%) | 125 (61.0%) |
| College/Associate Degree | 165 (53.9%) | 141 (46.1%) |
| Bachelor's Degree or higher | 137 (83.5%) | 27 (16.5%) |
Occupancy by Age of Householder in Dunsmuir
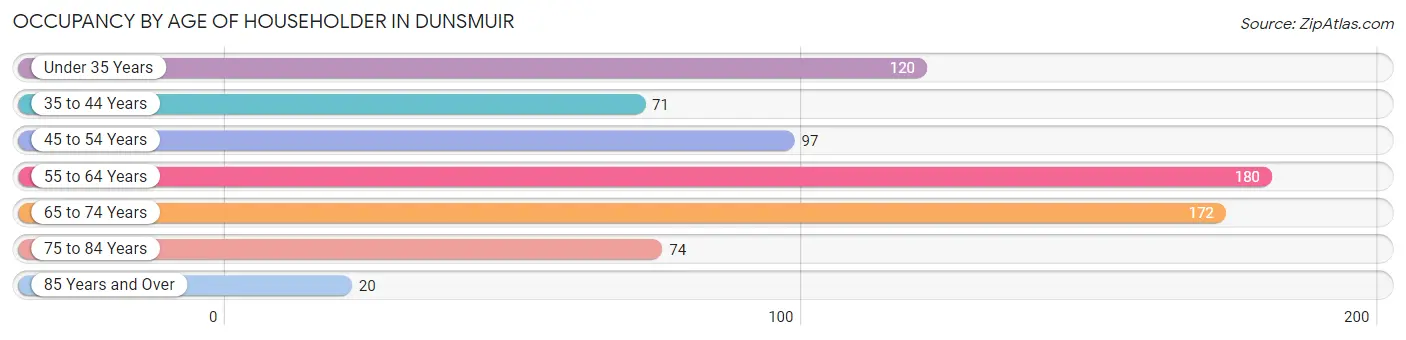
| Age Bracket | # Households | % Households |
| Under 35 Years | 120 | 16.4% |
| 35 to 44 Years | 71 | 9.7% |
| 45 to 54 Years | 97 | 13.2% |
| 55 to 64 Years | 180 | 24.5% |
| 65 to 74 Years | 172 | 23.4% |
| 75 to 84 Years | 74 | 10.1% |
| 85 Years and Over | 20 | 2.7% |
| Total | 734 | 100.0% |
Housing Finances in Dunsmuir
Median Income by Occupancy in Dunsmuir
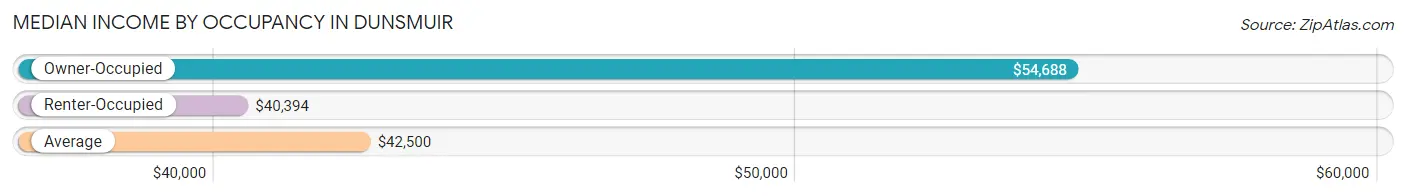
| Occupancy Type | # Households | Median Income |
| Owner-Occupied | 393 (53.5%) | $54,688 |
| Renter-Occupied | 341 (46.5%) | $40,394 |
| Average | 734 (100.0%) | $42,500 |
Occupancy by Householder Income Bracket in Dunsmuir
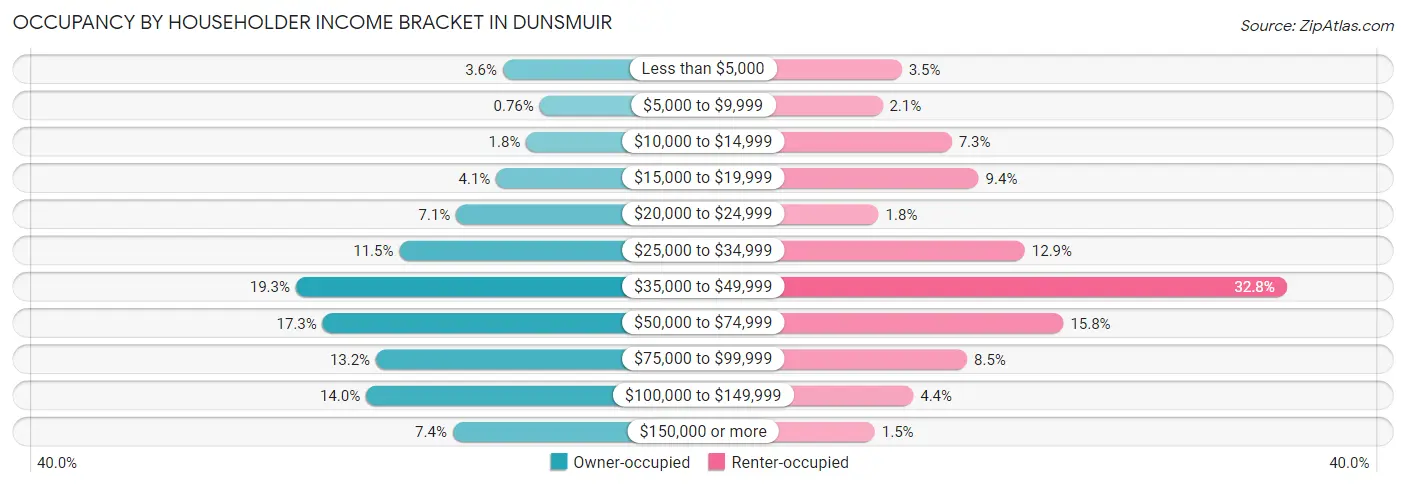
| Income Bracket | Owner-occupied | Renter-occupied |
| Less than $5,000 | 14 (3.6%) | 12 (3.5%) |
| $5,000 to $9,999 | 3 (0.8%) | 7 (2.1%) |
| $10,000 to $14,999 | 7 (1.8%) | 25 (7.3%) |
| $15,000 to $19,999 | 16 (4.1%) | 32 (9.4%) |
| $20,000 to $24,999 | 28 (7.1%) | 6 (1.8%) |
| $25,000 to $34,999 | 45 (11.5%) | 44 (12.9%) |
| $35,000 to $49,999 | 76 (19.3%) | 112 (32.8%) |
| $50,000 to $74,999 | 68 (17.3%) | 54 (15.8%) |
| $75,000 to $99,999 | 52 (13.2%) | 29 (8.5%) |
| $100,000 to $149,999 | 55 (14.0%) | 15 (4.4%) |
| $150,000 or more | 29 (7.4%) | 5 (1.5%) |
| Total | 393 (100.0%) | 341 (100.0%) |
Monthly Housing Cost Tiers in Dunsmuir
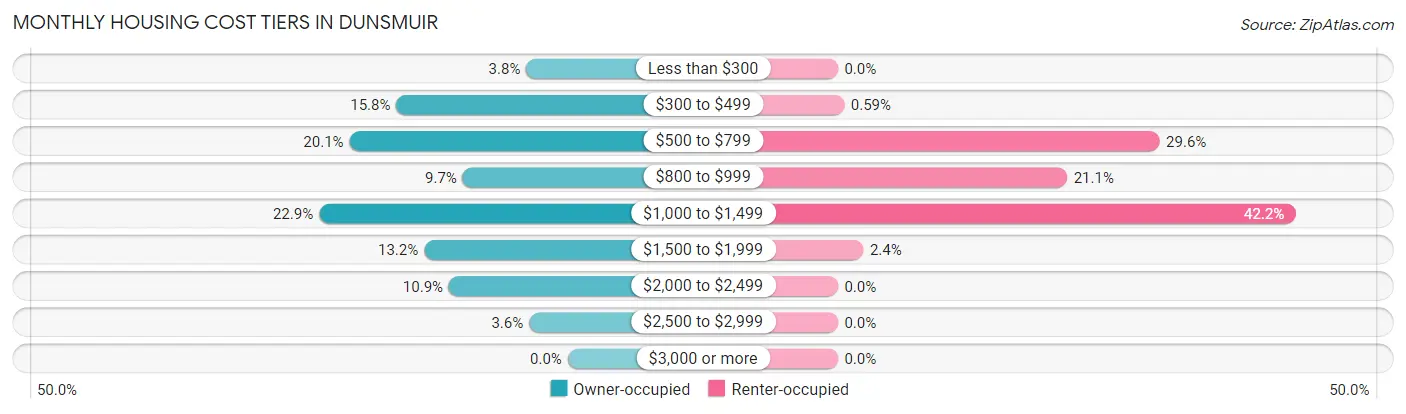
| Monthly Cost | Owner-occupied | Renter-occupied |
| Less than $300 | 15 (3.8%) | 0 (0.0%) |
| $300 to $499 | 62 (15.8%) | 2 (0.6%) |
| $500 to $799 | 79 (20.1%) | 101 (29.6%) |
| $800 to $999 | 38 (9.7%) | 72 (21.1%) |
| $1,000 to $1,499 | 90 (22.9%) | 144 (42.2%) |
| $1,500 to $1,999 | 52 (13.2%) | 8 (2.4%) |
| $2,000 to $2,499 | 43 (10.9%) | 0 (0.0%) |
| $2,500 to $2,999 | 14 (3.6%) | 0 (0.0%) |
| $3,000 or more | 0 (0.0%) | 0 (0.0%) |
| Total | 393 (100.0%) | 341 (100.0%) |
Physical Housing Characteristics in Dunsmuir
Housing Structures in Dunsmuir
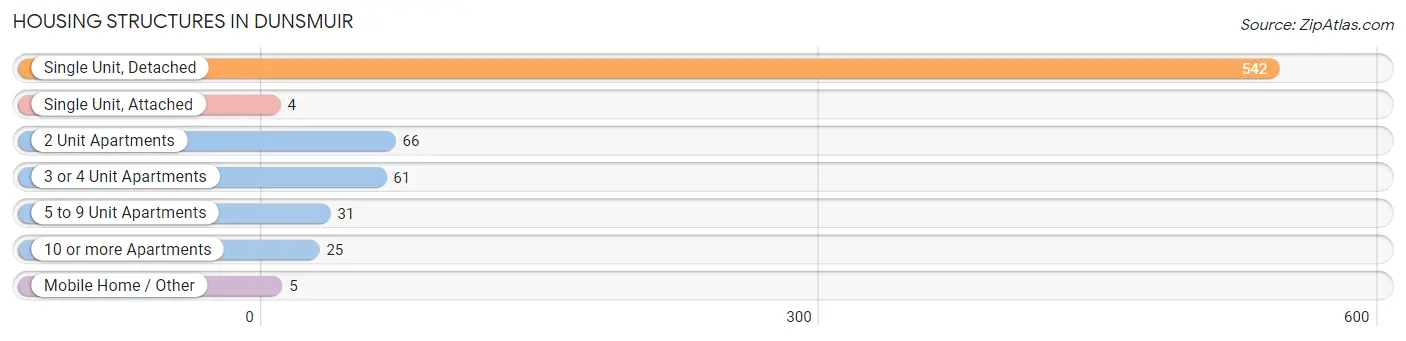
| Structure Type | # Housing Units | % Housing Units |
| Single Unit, Detached | 542 | 73.8% |
| Single Unit, Attached | 4 | 0.5% |
| 2 Unit Apartments | 66 | 9.0% |
| 3 or 4 Unit Apartments | 61 | 8.3% |
| 5 to 9 Unit Apartments | 31 | 4.2% |
| 10 or more Apartments | 25 | 3.4% |
| Mobile Home / Other | 5 | 0.7% |
| Total | 734 | 100.0% |
Housing Structures by Occupancy in Dunsmuir
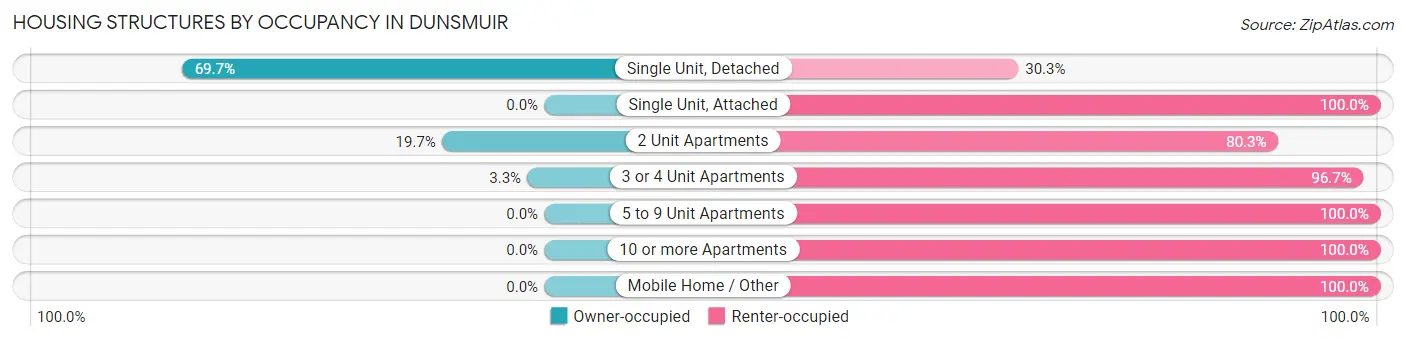
| Structure Type | Owner-occupied | Renter-occupied |
| Single Unit, Detached | 378 (69.7%) | 164 (30.3%) |
| Single Unit, Attached | 0 (0.0%) | 4 (100.0%) |
| 2 Unit Apartments | 13 (19.7%) | 53 (80.3%) |
| 3 or 4 Unit Apartments | 2 (3.3%) | 59 (96.7%) |
| 5 to 9 Unit Apartments | 0 (0.0%) | 31 (100.0%) |
| 10 or more Apartments | 0 (0.0%) | 25 (100.0%) |
| Mobile Home / Other | 0 (0.0%) | 5 (100.0%) |
| Total | 393 (53.5%) | 341 (46.5%) |
Housing Structures by Number of Rooms in Dunsmuir
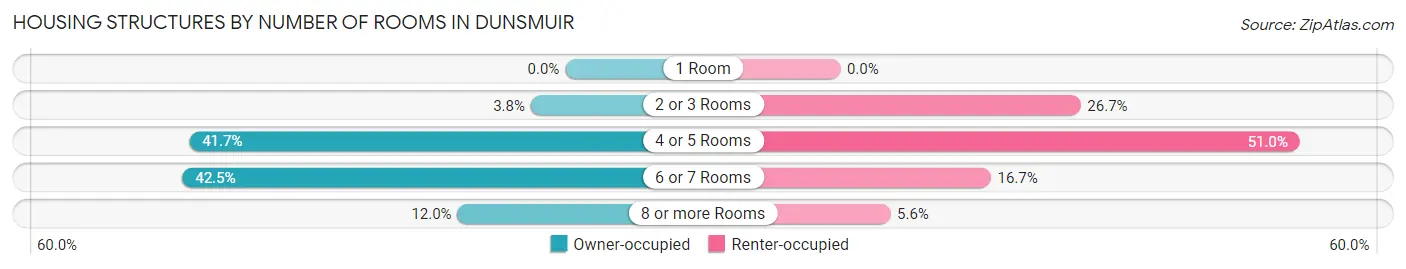
| Number of Rooms | Owner-occupied | Renter-occupied |
| 1 Room | 0 (0.0%) | 0 (0.0%) |
| 2 or 3 Rooms | 15 (3.8%) | 91 (26.7%) |
| 4 or 5 Rooms | 164 (41.7%) | 174 (51.0%) |
| 6 or 7 Rooms | 167 (42.5%) | 57 (16.7%) |
| 8 or more Rooms | 47 (12.0%) | 19 (5.6%) |
| Total | 393 (100.0%) | 341 (100.0%) |
Housing Structure by Heating Type in Dunsmuir
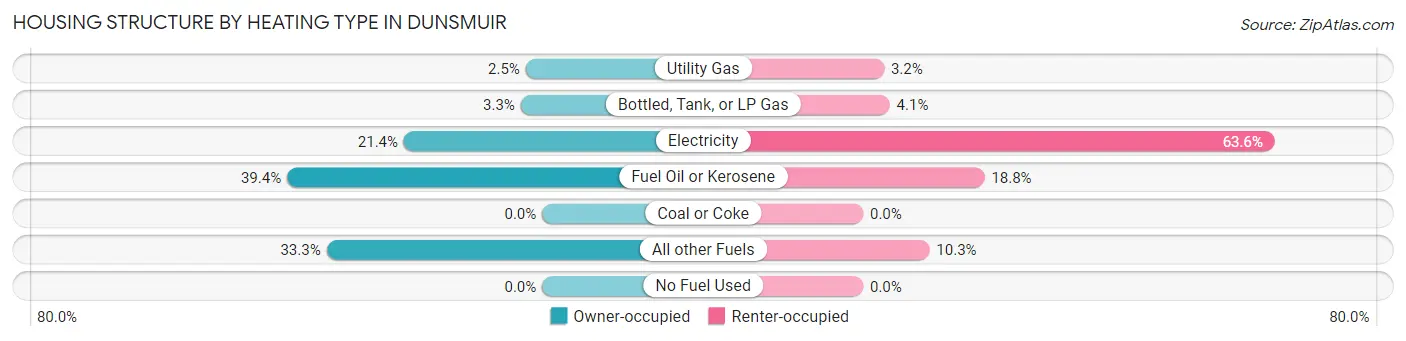
| Heating Type | Owner-occupied | Renter-occupied |
| Utility Gas | 10 (2.5%) | 11 (3.2%) |
| Bottled, Tank, or LP Gas | 13 (3.3%) | 14 (4.1%) |
| Electricity | 84 (21.4%) | 217 (63.6%) |
| Fuel Oil or Kerosene | 155 (39.4%) | 64 (18.8%) |
| Coal or Coke | 0 (0.0%) | 0 (0.0%) |
| All other Fuels | 131 (33.3%) | 35 (10.3%) |
| No Fuel Used | 0 (0.0%) | 0 (0.0%) |
| Total | 393 (100.0%) | 341 (100.0%) |
Household Vehicle Usage in Dunsmuir
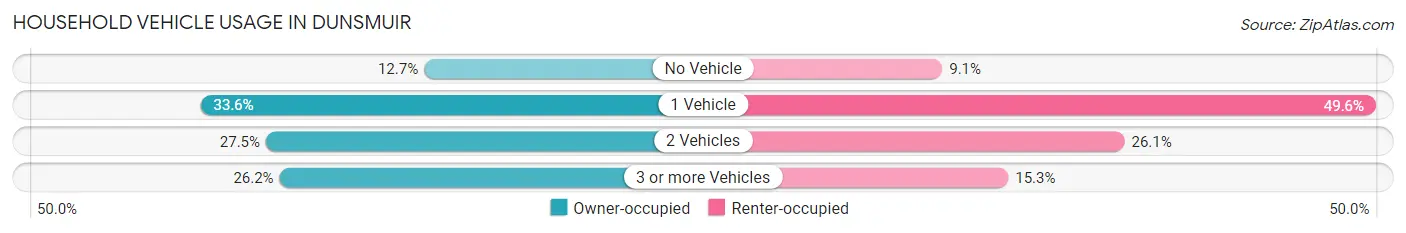
| Vehicles per Household | Owner-occupied | Renter-occupied |
| No Vehicle | 50 (12.7%) | 31 (9.1%) |
| 1 Vehicle | 132 (33.6%) | 169 (49.6%) |
| 2 Vehicles | 108 (27.5%) | 89 (26.1%) |
| 3 or more Vehicles | 103 (26.2%) | 52 (15.2%) |
| Total | 393 (100.0%) | 341 (100.0%) |
Real Estate & Mortgages in Dunsmuir
Real Estate and Mortgage Overview in Dunsmuir
| Characteristic | Without Mortgage | With Mortgage |
| Housing Units | 150 | 243 |
| Median Property Value | $220,200 | $242,100 |
| Median Household Income | $31,429 | $23 |
| Monthly Housing Costs | $500 | $0 |
| Real Estate Taxes | $1,257 | $0 |
Property Value by Mortgage Status in Dunsmuir
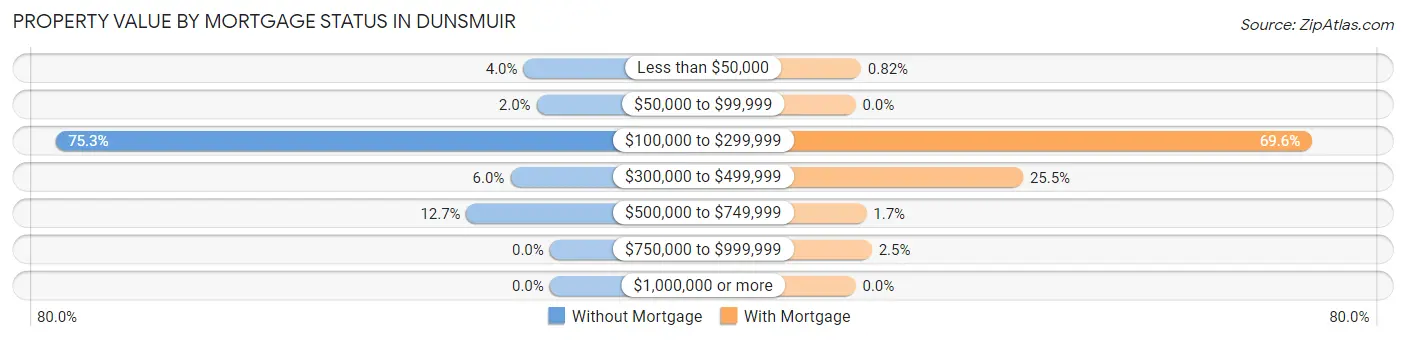
| Property Value | Without Mortgage | With Mortgage |
| Less than $50,000 | 6 (4.0%) | 2 (0.8%) |
| $50,000 to $99,999 | 3 (2.0%) | 0 (0.0%) |
| $100,000 to $299,999 | 113 (75.3%) | 169 (69.6%) |
| $300,000 to $499,999 | 9 (6.0%) | 62 (25.5%) |
| $500,000 to $749,999 | 19 (12.7%) | 4 (1.7%) |
| $750,000 to $999,999 | 0 (0.0%) | 6 (2.5%) |
| $1,000,000 or more | 0 (0.0%) | 0 (0.0%) |
| Total | 150 (100.0%) | 243 (100.0%) |
Household Income by Mortgage Status in Dunsmuir
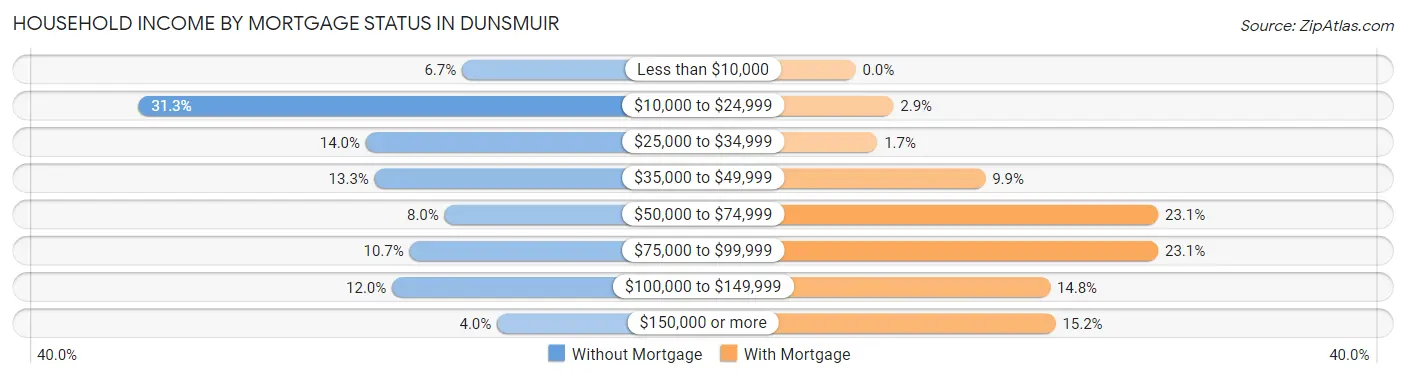
| Household Income | Without Mortgage | With Mortgage |
| Less than $10,000 | 10 (6.7%) | 0 (0.0%) |
| $10,000 to $24,999 | 47 (31.3%) | 7 (2.9%) |
| $25,000 to $34,999 | 21 (14.0%) | 4 (1.7%) |
| $35,000 to $49,999 | 20 (13.3%) | 24 (9.9%) |
| $50,000 to $74,999 | 12 (8.0%) | 56 (23.1%) |
| $75,000 to $99,999 | 16 (10.7%) | 56 (23.1%) |
| $100,000 to $149,999 | 18 (12.0%) | 36 (14.8%) |
| $150,000 or more | 6 (4.0%) | 37 (15.2%) |
| Total | 150 (100.0%) | 243 (100.0%) |
Property Value to Household Income Ratio in Dunsmuir
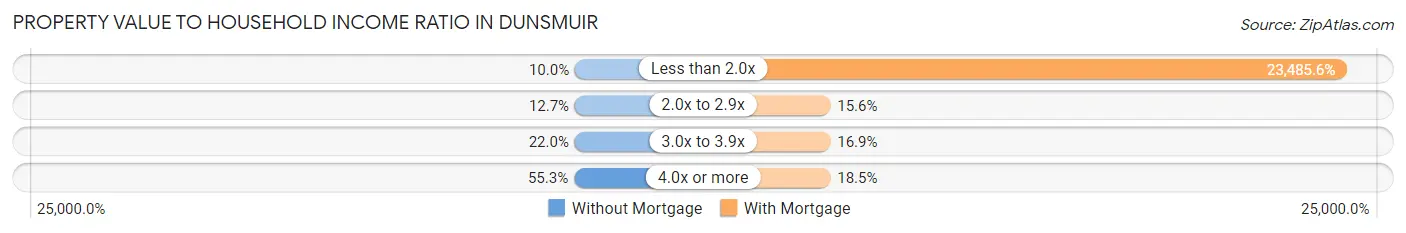
| Value-to-Income Ratio | Without Mortgage | With Mortgage |
| Less than 2.0x | 15 (10.0%) | 57,070 (23,485.6%) |
| 2.0x to 2.9x | 19 (12.7%) | 38 (15.6%) |
| 3.0x to 3.9x | 33 (22.0%) | 41 (16.9%) |
| 4.0x or more | 83 (55.3%) | 45 (18.5%) |
| Total | 150 (100.0%) | 243 (100.0%) |
Real Estate Taxes by Mortgage Status in Dunsmuir
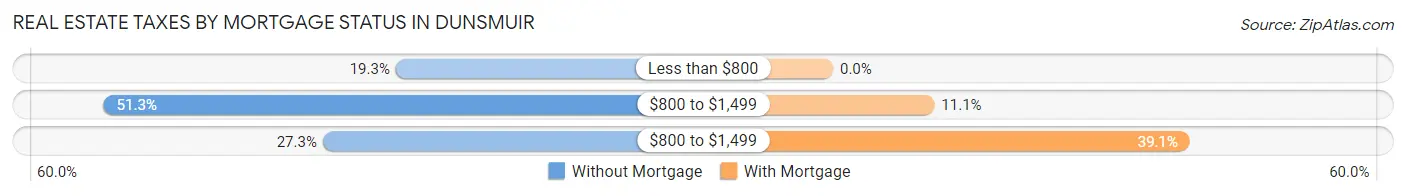
| Property Taxes | Without Mortgage | With Mortgage |
| Less than $800 | 29 (19.3%) | 0 (0.0%) |
| $800 to $1,499 | 77 (51.3%) | 27 (11.1%) |
| $800 to $1,499 | 41 (27.3%) | 95 (39.1%) |
| Total | 150 (100.0%) | 243 (100.0%) |
Health & Disability in Dunsmuir
Health Insurance Coverage by Age in Dunsmuir
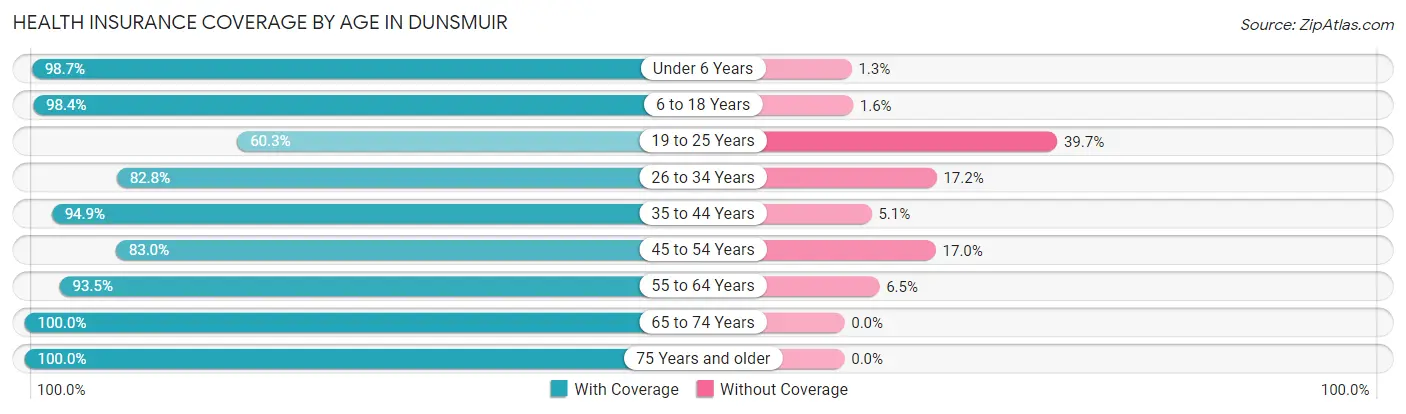
| Age Bracket | With Coverage | Without Coverage |
| Under 6 Years | 223 (98.7%) | 3 (1.3%) |
| 6 to 18 Years | 186 (98.4%) | 3 (1.6%) |
| 19 to 25 Years | 70 (60.3%) | 46 (39.7%) |
| 26 to 34 Years | 183 (82.8%) | 38 (17.2%) |
| 35 to 44 Years | 150 (94.9%) | 8 (5.1%) |
| 45 to 54 Years | 151 (83.0%) | 31 (17.0%) |
| 55 to 64 Years | 244 (93.5%) | 17 (6.5%) |
| 65 to 74 Years | 280 (100.0%) | 0 (0.0%) |
| 75 Years and older | 123 (100.0%) | 0 (0.0%) |
| Total | 1,610 (91.7%) | 146 (8.3%) |
Health Insurance Coverage by Citizenship Status in Dunsmuir
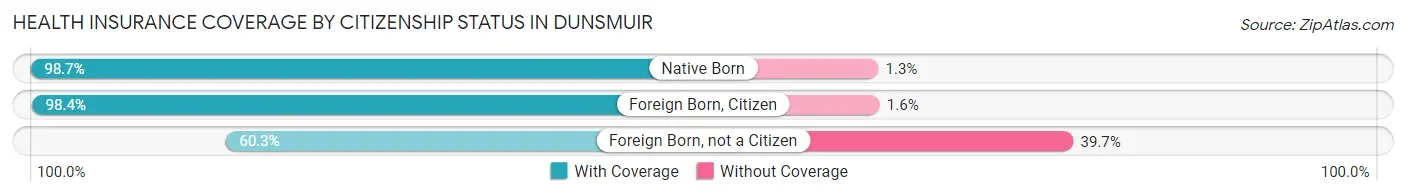
| Citizenship Status | With Coverage | Without Coverage |
| Native Born | 223 (98.7%) | 3 (1.3%) |
| Foreign Born, Citizen | 186 (98.4%) | 3 (1.6%) |
| Foreign Born, not a Citizen | 70 (60.3%) | 46 (39.7%) |
Health Insurance Coverage by Household Income in Dunsmuir
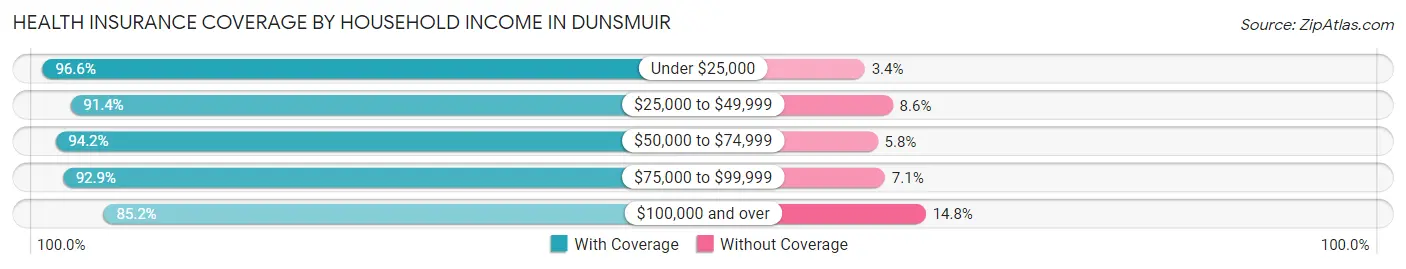
| Household Income | With Coverage | Without Coverage |
| Under $25,000 | 230 (96.6%) | 8 (3.4%) |
| $25,000 to $49,999 | 532 (91.4%) | 50 (8.6%) |
| $50,000 to $74,999 | 359 (94.2%) | 22 (5.8%) |
| $75,000 to $99,999 | 195 (92.9%) | 15 (7.1%) |
| $100,000 and over | 294 (85.2%) | 51 (14.8%) |
Public vs Private Health Insurance Coverage by Age in Dunsmuir
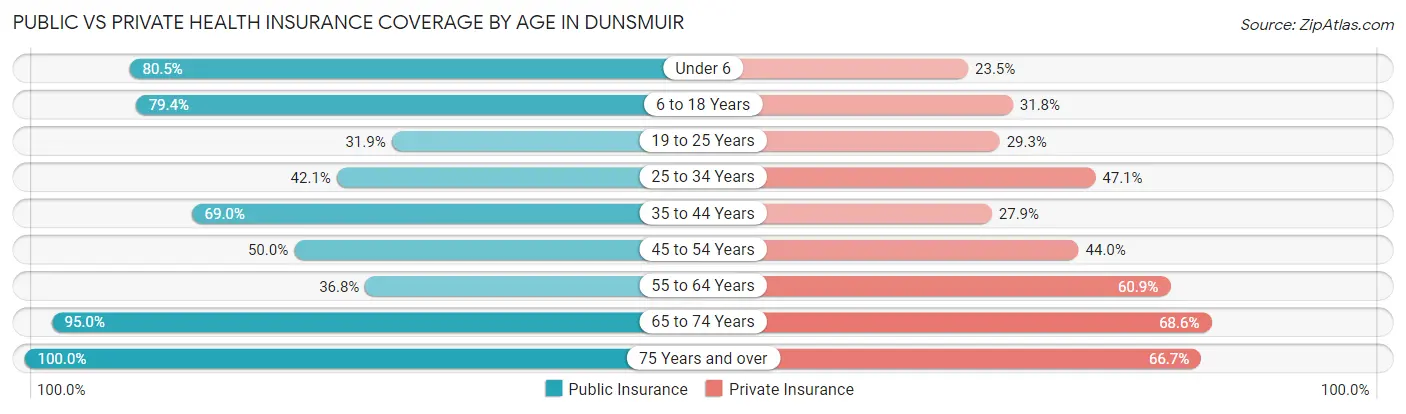
| Age Bracket | Public Insurance | Private Insurance |
| Under 6 | 182 (80.5%) | 53 (23.4%) |
| 6 to 18 Years | 150 (79.4%) | 60 (31.8%) |
| 19 to 25 Years | 37 (31.9%) | 34 (29.3%) |
| 25 to 34 Years | 93 (42.1%) | 104 (47.1%) |
| 35 to 44 Years | 109 (69.0%) | 44 (27.9%) |
| 45 to 54 Years | 91 (50.0%) | 80 (44.0%) |
| 55 to 64 Years | 96 (36.8%) | 159 (60.9%) |
| 65 to 74 Years | 266 (95.0%) | 192 (68.6%) |
| 75 Years and over | 123 (100.0%) | 82 (66.7%) |
| Total | 1,147 (65.3%) | 808 (46.0%) |
Disability Status by Sex by Age in Dunsmuir
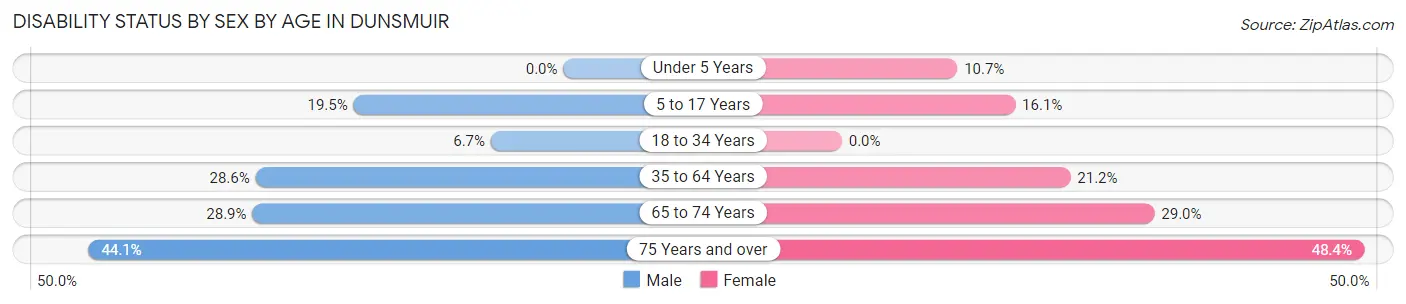
| Age Bracket | Male | Female |
| Under 5 Years | 0 (0.0%) | 15 (10.7%) |
| 5 to 17 Years | 22 (19.5%) | 14 (16.1%) |
| 18 to 34 Years | 15 (6.7%) | 0 (0.0%) |
| 35 to 64 Years | 68 (28.6%) | 77 (21.2%) |
| 65 to 74 Years | 43 (28.9%) | 38 (29.0%) |
| 75 Years and over | 26 (44.1%) | 31 (48.4%) |
Disability Class by Sex by Age in Dunsmuir
Disability Class: Hearing Difficulty
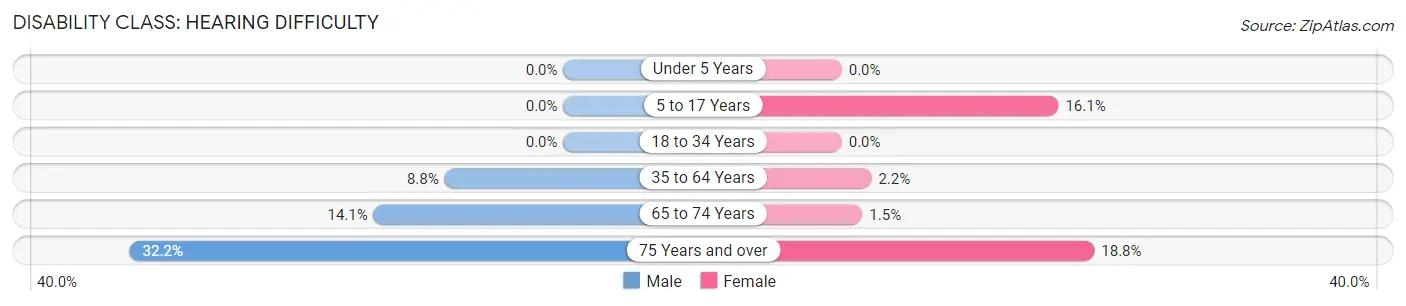
| Age Bracket | Male | Female |
| Under 5 Years | 0 (0.0%) | 0 (0.0%) |
| 5 to 17 Years | 0 (0.0%) | 14 (16.1%) |
| 18 to 34 Years | 0 (0.0%) | 0 (0.0%) |
| 35 to 64 Years | 21 (8.8%) | 8 (2.2%) |
| 65 to 74 Years | 21 (14.1%) | 2 (1.5%) |
| 75 Years and over | 19 (32.2%) | 12 (18.8%) |
Disability Class: Vision Difficulty
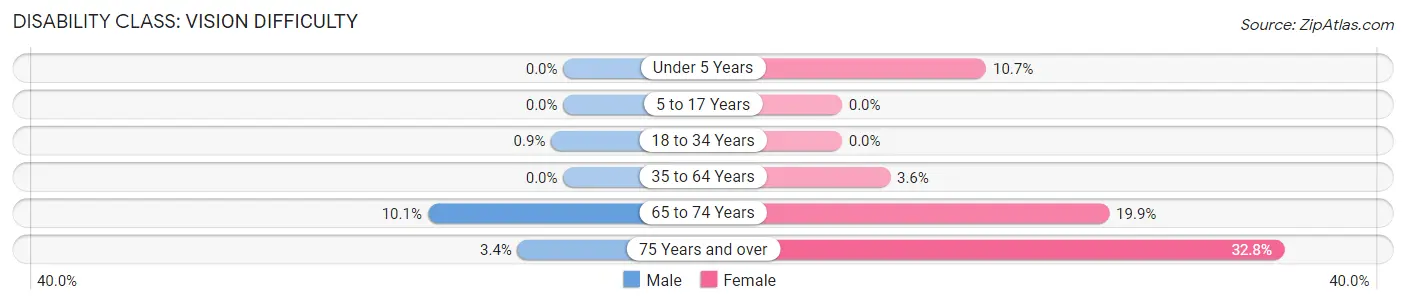
| Age Bracket | Male | Female |
| Under 5 Years | 0 (0.0%) | 15 (10.7%) |
| 5 to 17 Years | 0 (0.0%) | 0 (0.0%) |
| 18 to 34 Years | 2 (0.9%) | 0 (0.0%) |
| 35 to 64 Years | 0 (0.0%) | 13 (3.6%) |
| 65 to 74 Years | 15 (10.1%) | 26 (19.9%) |
| 75 Years and over | 2 (3.4%) | 21 (32.8%) |
Disability Class: Cognitive Difficulty
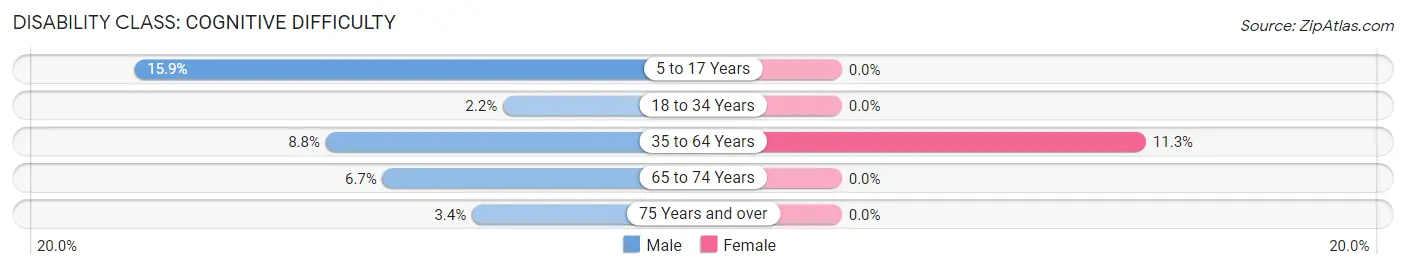
| Age Bracket | Male | Female |
| 5 to 17 Years | 18 (15.9%) | 0 (0.0%) |
| 18 to 34 Years | 5 (2.2%) | 0 (0.0%) |
| 35 to 64 Years | 21 (8.8%) | 41 (11.3%) |
| 65 to 74 Years | 10 (6.7%) | 0 (0.0%) |
| 75 Years and over | 2 (3.4%) | 0 (0.0%) |
Disability Class: Ambulatory Difficulty
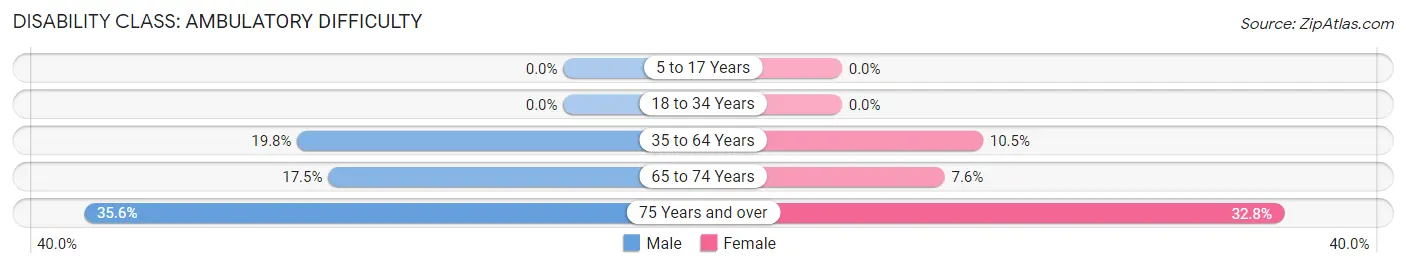
| Age Bracket | Male | Female |
| 5 to 17 Years | 0 (0.0%) | 0 (0.0%) |
| 18 to 34 Years | 0 (0.0%) | 0 (0.0%) |
| 35 to 64 Years | 47 (19.8%) | 38 (10.5%) |
| 65 to 74 Years | 26 (17.4%) | 10 (7.6%) |
| 75 Years and over | 21 (35.6%) | 21 (32.8%) |
Disability Class: Self-Care Difficulty
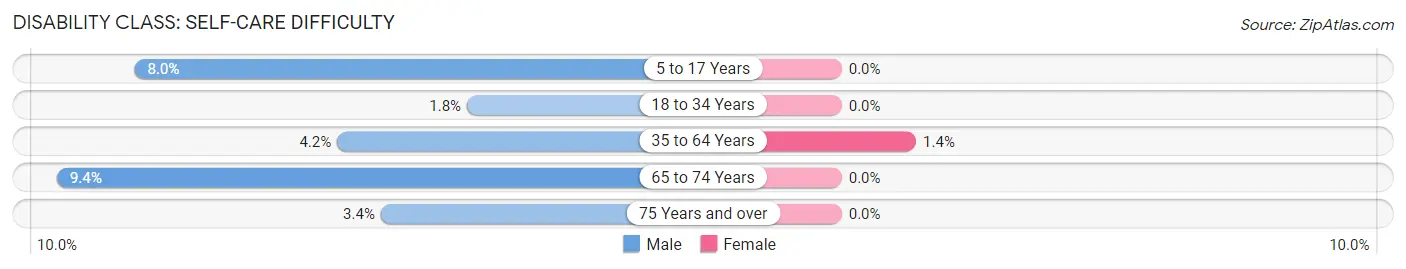
| Age Bracket | Male | Female |
| 5 to 17 Years | 9 (8.0%) | 0 (0.0%) |
| 18 to 34 Years | 4 (1.8%) | 0 (0.0%) |
| 35 to 64 Years | 10 (4.2%) | 5 (1.4%) |
| 65 to 74 Years | 14 (9.4%) | 0 (0.0%) |
| 75 Years and over | 2 (3.4%) | 0 (0.0%) |
Technology Access in Dunsmuir
Computing Device Access in Dunsmuir
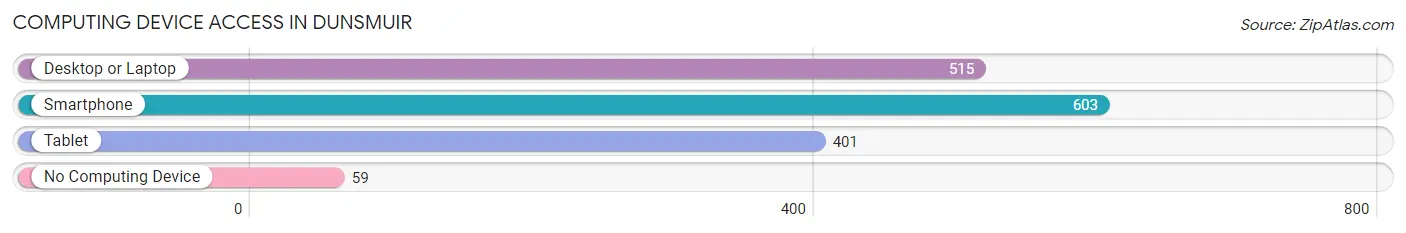
| Device Type | # Households | % Households |
| Desktop or Laptop | 515 | 70.2% |
| Smartphone | 603 | 82.2% |
| Tablet | 401 | 54.6% |
| No Computing Device | 59 | 8.0% |
| Total | 734 | 100.0% |
Internet Access in Dunsmuir
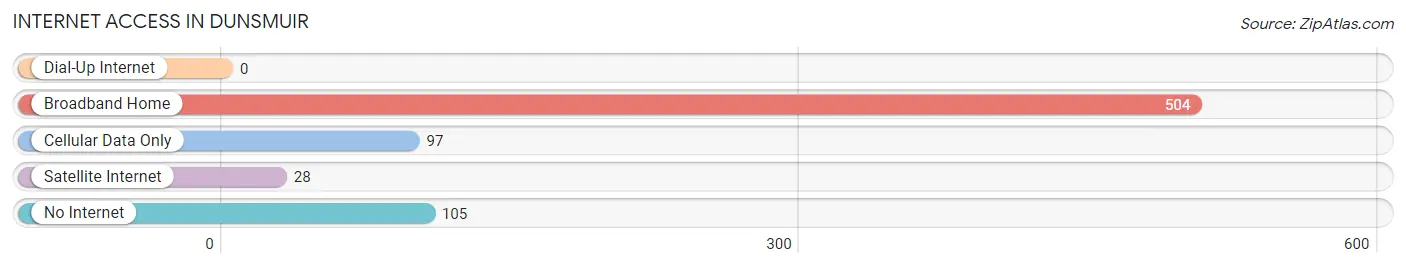
| Internet Type | # Households | % Households |
| Dial-Up Internet | 0 | 0.0% |
| Broadband Home | 504 | 68.7% |
| Cellular Data Only | 97 | 13.2% |
| Satellite Internet | 28 | 3.8% |
| No Internet | 105 | 14.3% |
| Total | 734 | 100.0% |
Dunsmuir Summary
Dunsmuir, California is a small city located in Siskiyou County, California, in the northern part of the state. It is situated along the Sacramento River, near the Oregon border. The city has a population of approximately 1,650 people, and is a popular tourist destination due to its proximity to Mount Shasta and the nearby Castle Crags State Park.
History
The area that is now Dunsmuir was originally inhabited by the Wintu Native American tribe. The first European settlers arrived in the area in the 1850s, and the town of Dunsmuir was founded in 1887. The town was named after Alexander Dunsmuir, the son of a prominent Canadian industrialist. The town quickly grew, and by the early 1900s, it had become a popular tourist destination due to its proximity to Mount Shasta and the nearby Castle Crags State Park.
Geography
Dunsmuir is located in Siskiyou County, California, in the northern part of the state. It is situated along the Sacramento River, near the Oregon border. The city has a total area of 1.3 square miles, all of which is land. The city is located at an elevation of 2,835 feet above sea level.
Climate
Dunsmuir has a Mediterranean climate, with hot, dry summers and cool, wet winters. The average annual temperature is 54°F, and the average annual precipitation is 24 inches.
Economy
The economy of Dunsmuir is largely based on tourism. The city is a popular destination for outdoor recreation, and it is home to several popular attractions, including the Castle Crags State Park and the Dunsmuir Railroad Depot Museum. The city is also home to several businesses, including restaurants, hotels, and retail stores.
Demographics
As of the 2010 census, the population of Dunsmuir was 1,650. The racial makeup of the city was 91.2% White, 0.9% African American, 0.9% Native American, 0.9% Asian, 0.2% Pacific Islander, 2.2% from other races, and 4.6% from two or more races. The median household income was $35,938, and the median family income was $41,250. The per capita income was $19,945. About 11.2% of the population was below the poverty line.
Common Questions
What is Per Capita Income in Dunsmuir?
Per Capita income in Dunsmuir is $25,012.
What is the Median Family Income in Dunsmuir?
Median Family Income in Dunsmuir is $56,034.
What is the Median Household income in Dunsmuir?
Median Household Income in Dunsmuir is $42,500.
What is Income or Wage Gap in Dunsmuir?
Income or Wage Gap in Dunsmuir is 13.6%.
Women in Dunsmuir earn 86.4 cents for every dollar earned by a man.
What is Inequality or Gini Index in Dunsmuir?
Inequality or Gini Index in Dunsmuir is 0.40.
What is the Total Population of Dunsmuir?
Total Population of Dunsmuir is 1,756.
What is the Total Male Population of Dunsmuir?
Total Male Population of Dunsmuir is 834.
What is the Total Female Population of Dunsmuir?
Total Female Population of Dunsmuir is 922.
What is the Ratio of Males per 100 Females in Dunsmuir?
There are 90.46 Males per 100 Females in Dunsmuir.
What is the Ratio of Females per 100 Males in Dunsmuir?
There are 110.55 Females per 100 Males in Dunsmuir.
What is the Median Population Age in Dunsmuir?
Median Population Age in Dunsmuir is 42.6 Years.
What is the Average Family Size in Dunsmuir
Average Family Size in Dunsmuir is 3.1 People.
What is the Average Household Size in Dunsmuir
Average Household Size in Dunsmuir is 2.4 People.
How Large is the Labor Force in Dunsmuir?
There are 793 People in the Labor Forcein in Dunsmuir.
What is the Percentage of People in the Labor Force in Dunsmuir?
56.7% of People are in the Labor Force in Dunsmuir.
What is the Unemployment Rate in Dunsmuir?
Unemployment Rate in Dunsmuir is 8.7%.