Polson, MT Map & Demographics
Polson Map
Polson Overview
$27,117
PER CAPITA INCOME
$60,268
AVG FAMILY INCOME
$48,866
AVG HOUSEHOLD INCOME
43.9%
WAGE / INCOME GAP [ % ]
56.1¢/ $1
WAGE / INCOME GAP [ $ ]
0.42
INEQUALITY / GINI INDEX
5,218
TOTAL POPULATION
2,512
MALE POPULATION
2,706
FEMALE POPULATION
92.83
MALES / 100 FEMALES
107.72
FEMALES / 100 MALES
47.5
MEDIAN AGE
2.9
AVG FAMILY SIZE
2.3
AVG HOUSEHOLD SIZE
2,420
LABOR FORCE [ PEOPLE ]
56.1%
PERCENT IN LABOR FORCE
6.4%
UNEMPLOYMENT RATE
Polson Zip Codes
Polson Area Codes
Income in Polson
Income Overview in Polson
Per Capita Income in Polson is $27,117, while median incomes of families and households are $60,268 and $48,866 respectively.
| Characteristic | Number | Measure |
| Per Capita Income | 5,218 | $27,117 |
| Median Family Income | 1,297 | $60,268 |
| Mean Family Income | 1,297 | $72,465 |
| Median Household Income | 2,231 | $48,866 |
| Mean Household Income | 2,231 | $59,007 |
| Income Deficit | 1,297 | $0 |
| Wage / Income Gap (%) | 5,218 | 43.88% |
| Wage / Income Gap ($) | 5,218 | 56.12¢ per $1 |
| Gini / Inequality Index | 5,218 | 0.42 |
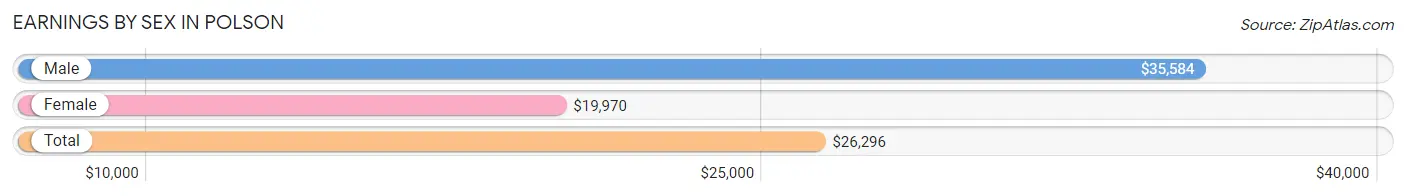
Earnings by Sex in Polson
Average Earnings in Polson are $26,296, $35,584 for men and $19,970 for women, a difference of 43.9%.
| Sex | Number | Average Earnings |
| Male | 1,256 (47.6%) | $35,584 |
| Female | 1,380 (52.3%) | $19,970 |
| Total | 2,636 (100.0%) | $26,296 |
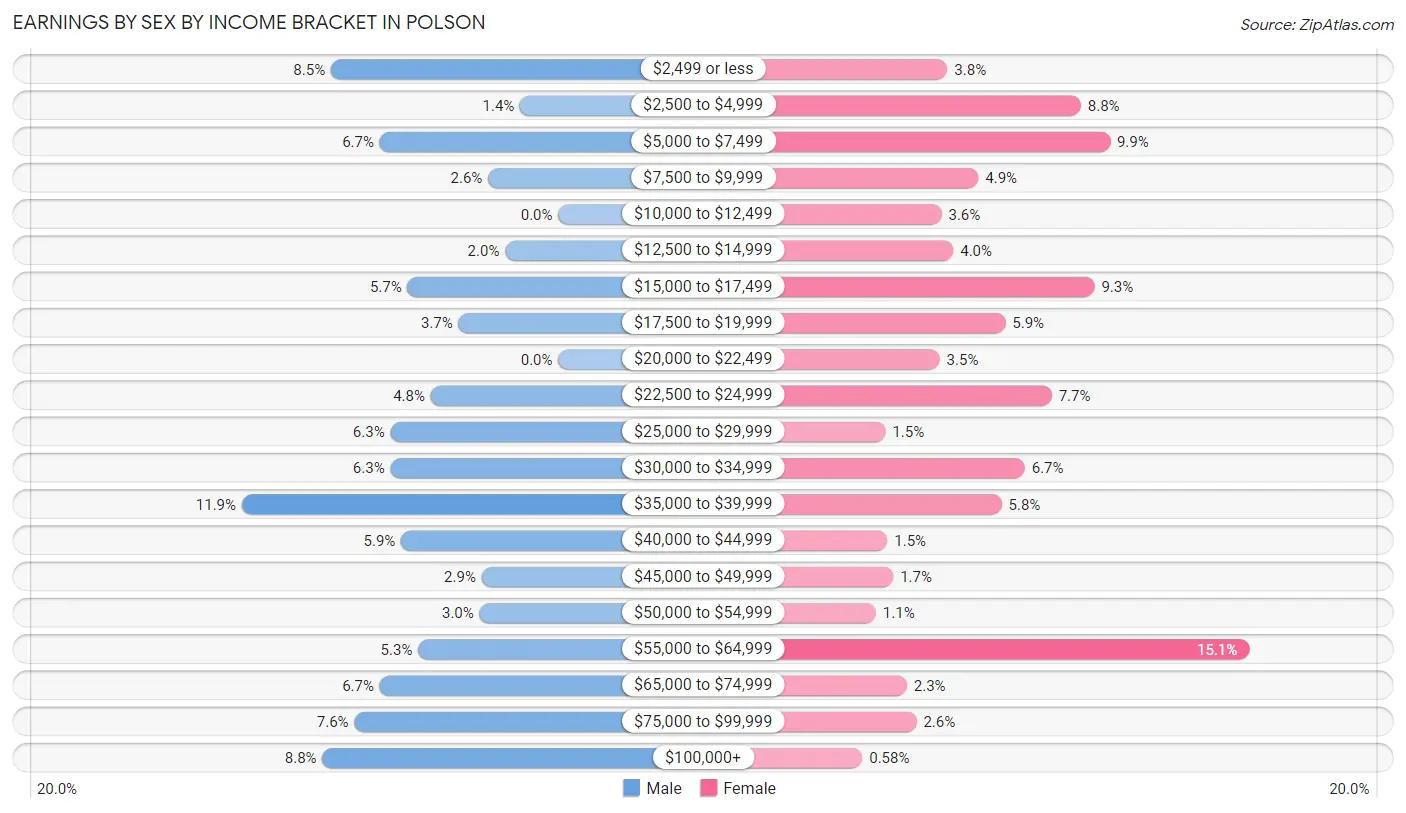
Earnings by Sex by Income Bracket in Polson
The most common earnings brackets in Polson are $35,000 to $39,999 for men (149 | 11.9%) and $55,000 to $64,999 for women (208 | 15.1%).
| Income | Male | Female |
| $2,499 or less | 107 (8.5%) | 52 (3.8%) |
| $2,500 to $4,999 | 18 (1.4%) | 121 (8.8%) |
| $5,000 to $7,499 | 84 (6.7%) | 136 (9.9%) |
| $7,500 to $9,999 | 33 (2.6%) | 68 (4.9%) |
| $10,000 to $12,499 | 0 (0.0%) | 49 (3.5%) |
| $12,500 to $14,999 | 25 (2.0%) | 55 (4.0%) |
| $15,000 to $17,499 | 71 (5.7%) | 128 (9.3%) |
| $17,500 to $19,999 | 47 (3.7%) | 82 (5.9%) |
| $20,000 to $22,499 | 0 (0.0%) | 48 (3.5%) |
| $22,500 to $24,999 | 60 (4.8%) | 106 (7.7%) |
| $25,000 to $29,999 | 79 (6.3%) | 20 (1.5%) |
| $30,000 to $34,999 | 79 (6.3%) | 92 (6.7%) |
| $35,000 to $39,999 | 149 (11.9%) | 80 (5.8%) |
| $40,000 to $44,999 | 74 (5.9%) | 21 (1.5%) |
| $45,000 to $49,999 | 36 (2.9%) | 24 (1.7%) |
| $50,000 to $54,999 | 37 (2.9%) | 15 (1.1%) |
| $55,000 to $64,999 | 66 (5.2%) | 208 (15.1%) |
| $65,000 to $74,999 | 84 (6.7%) | 31 (2.2%) |
| $75,000 to $99,999 | 96 (7.6%) | 36 (2.6%) |
| $100,000+ | 111 (8.8%) | 8 (0.6%) |
| Total | 1,256 (100.0%) | 1,380 (100.0%) |
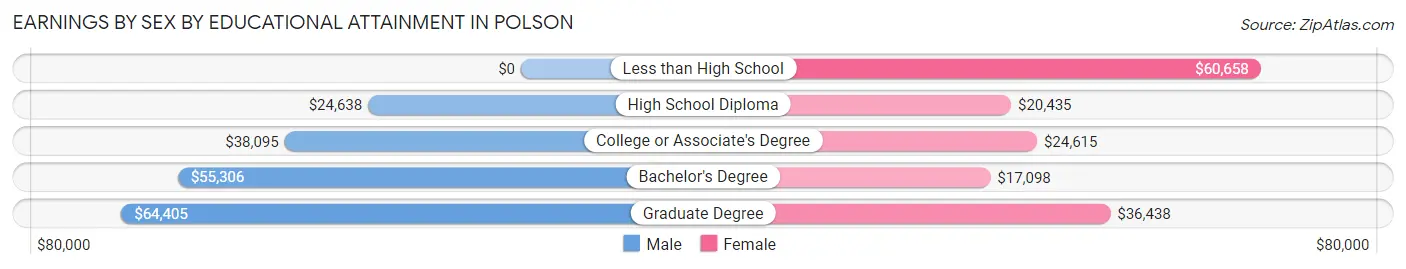
Earnings by Sex by Educational Attainment in Polson
Average earnings in Polson are $39,048 for men and $23,878 for women, a difference of 38.9%. Men with an educational attainment of graduate degree enjoy the highest average annual earnings of $64,405, while those with high school diploma education earn the least with $24,638. Women with an educational attainment of less than high school earn the most with the average annual earnings of $60,658, while those with bachelor's degree education have the smallest earnings of $17,098.
| Educational Attainment | Male Income | Female Income |
| Less than High School | - | - |
| High School Diploma | $24,638 | $20,435 |
| College or Associate's Degree | $38,095 | $24,615 |
| Bachelor's Degree | $55,306 | $17,098 |
| Graduate Degree | $64,405 | $36,438 |
| Total | $39,048 | $23,878 |
Family Income in Polson
Family Income Brackets in Polson
According to the Polson family income data, there are 315 families falling into the $50,000 to $74,999 income range, which is the most common income bracket and makes up 24.3% of all families. Conversely, the $10,000 to $14,999 income bracket is the least frequent group with only 36 families (2.8%) belonging to this category.
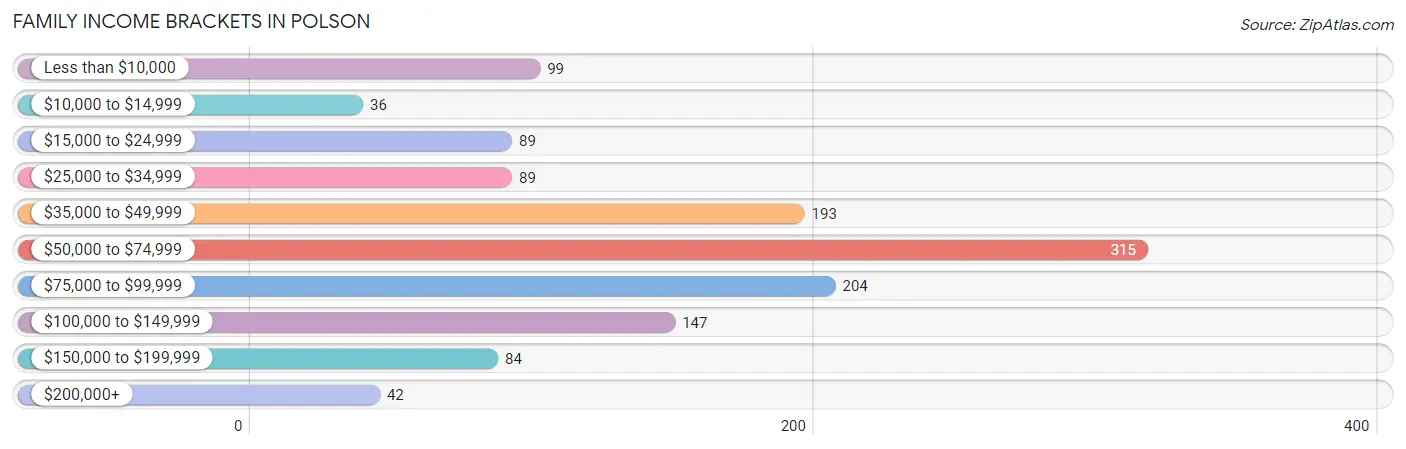
| Income Bracket | # Families | % Families |
| Less than $10,000 | 99 | 7.6% |
| $10,000 to $14,999 | 36 | 2.8% |
| $15,000 to $24,999 | 89 | 6.9% |
| $25,000 to $34,999 | 89 | 6.9% |
| $35,000 to $49,999 | 193 | 14.9% |
| $50,000 to $74,999 | 315 | 24.3% |
| $75,000 to $99,999 | 204 | 15.7% |
| $100,000 to $149,999 | 147 | 11.3% |
| $150,000 to $199,999 | 84 | 6.5% |
| $200,000+ | 42 | 3.2% |
Family Income by Famaliy Size in Polson
4-person families (117 | 9.0%) account for the highest median family income in Polson with $101,513 per family, while 3-person families (219 | 16.9%) have the highest median income of $26,133 per family member.
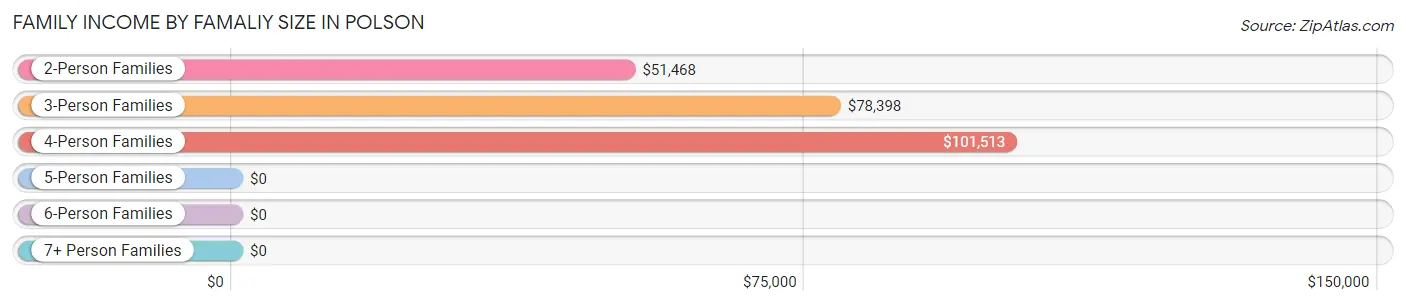
| Income Bracket | # Families | Median Income |
| 2-Person Families | 876 (67.5%) | $51,468 |
| 3-Person Families | 219 (16.9%) | $78,398 |
| 4-Person Families | 117 (9.0%) | $101,513 |
| 5-Person Families | 56 (4.3%) | $0 |
| 6-Person Families | 29 (2.2%) | $0 |
| 7+ Person Families | 0 (0.0%) | $0 |
| Total | 1,297 (100.0%) | $60,268 |
Family Income by Number of Earners in Polson
The median family income in Polson is $60,268, with families comprising 3+ earners (150) having the highest median family income of $113,750, while families with 1 earner (522) have the lowest median family income of $38,393, accounting for 11.6% and 40.3% of families, respectively.
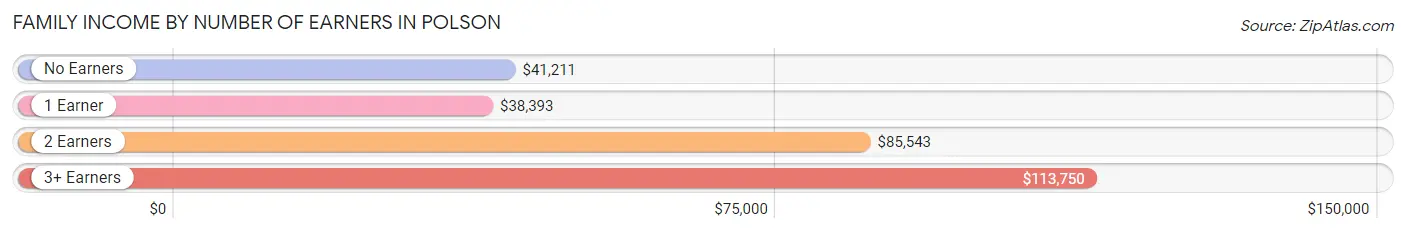
| Number of Earners | # Families | Median Income |
| No Earners | 261 (20.1%) | $41,211 |
| 1 Earner | 522 (40.3%) | $38,393 |
| 2 Earners | 364 (28.1%) | $85,543 |
| 3+ Earners | 150 (11.6%) | $113,750 |
| Total | 1,297 (100.0%) | $60,268 |
Household Income in Polson
Household Income Brackets in Polson
With 515 households falling in the category, the $50,000 to $74,999 income range is the most frequent in Polson, accounting for 23.1% of all households. In contrast, only 42 households (1.9%) fall into the $200,000+ income bracket, making it the least populous group.
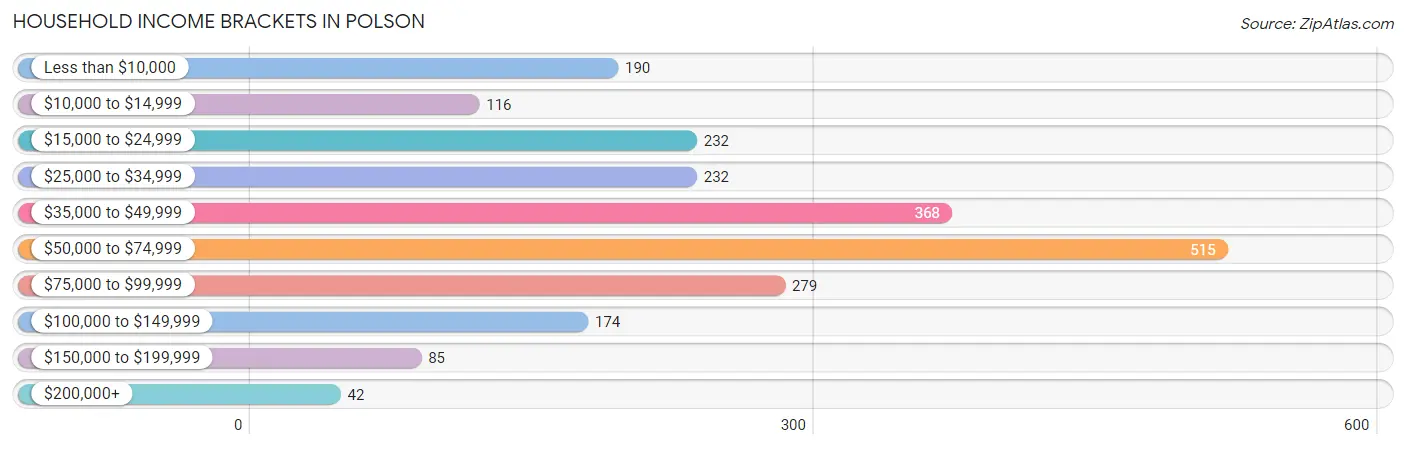
| Income Bracket | # Households | % Households |
| Less than $10,000 | 190 | 8.5% |
| $10,000 to $14,999 | 116 | 5.2% |
| $15,000 to $24,999 | 232 | 10.4% |
| $25,000 to $34,999 | 232 | 10.4% |
| $35,000 to $49,999 | 368 | 16.5% |
| $50,000 to $74,999 | 515 | 23.1% |
| $75,000 to $99,999 | 279 | 12.5% |
| $100,000 to $149,999 | 174 | 7.8% |
| $150,000 to $199,999 | 85 | 3.8% |
| $200,000+ | 42 | 1.9% |
Household Income by Householder Age in Polson
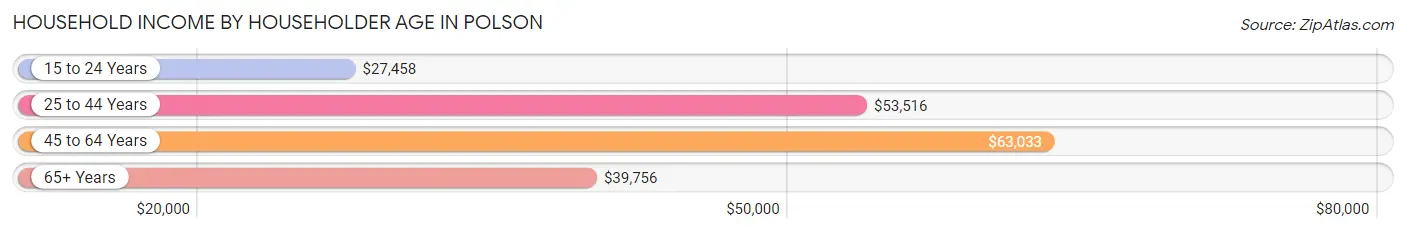
The median household income in Polson is $48,866, with the highest median household income of $63,033 found in the 45 to 64 years age bracket for the primary householder. A total of 788 households (35.3%) fall into this category. Meanwhile, the 15 to 24 years age bracket for the primary householder has the lowest median household income of $27,458, with 185 households (8.3%) in this group.
| Income Bracket | # Households | Median Income |
| 15 to 24 Years | 185 (8.3%) | $27,458 |
| 25 to 44 Years | 509 (22.8%) | $53,516 |
| 45 to 64 Years | 788 (35.3%) | $63,033 |
| 65+ Years | 749 (33.6%) | $39,756 |
| Total | 2,231 (100.0%) | $48,866 |
Poverty in Polson
Income Below Poverty by Sex and Age in Polson
With 20.0% poverty level for males and 17.5% for females among the residents of Polson, under 5 year old males and 25 to 34 year old females are the most vulnerable to poverty, with 109 males (70.3%) and 76 females (34.1%) in their respective age groups living below the poverty level.
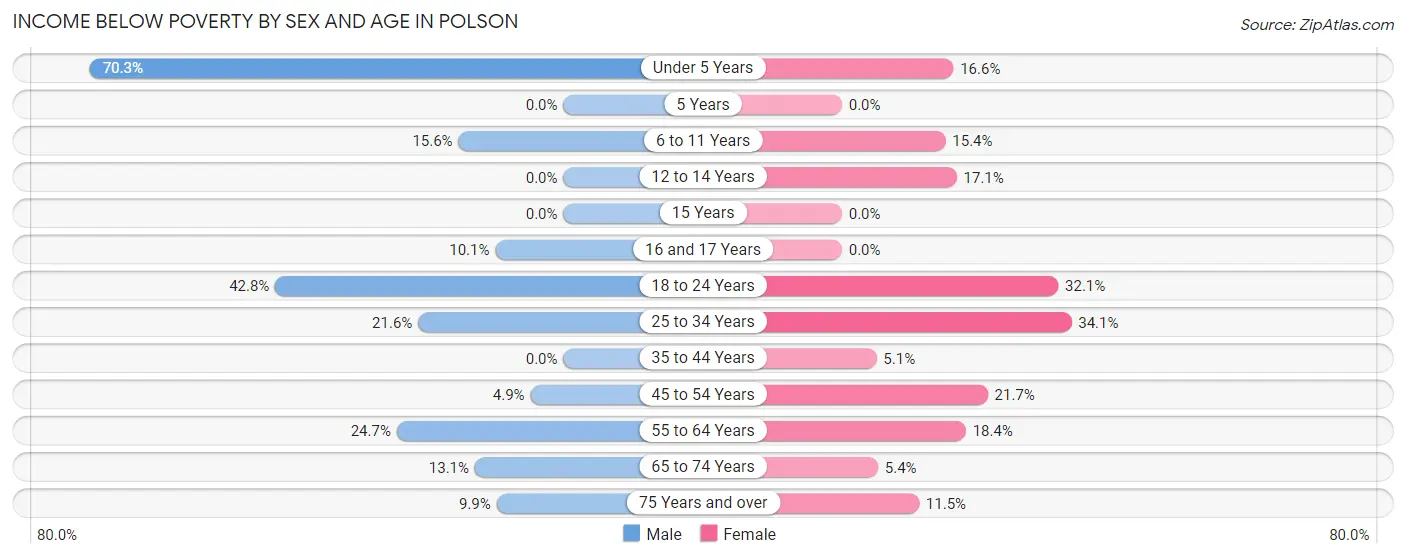
| Age Bracket | Male | Female |
| Under 5 Years | 109 (70.3%) | 23 (16.6%) |
| 5 Years | 0 (0.0%) | 0 (0.0%) |
| 6 to 11 Years | 31 (15.6%) | 24 (15.4%) |
| 12 to 14 Years | 0 (0.0%) | 15 (17.1%) |
| 15 Years | 0 (0.0%) | 0 (0.0%) |
| 16 and 17 Years | 9 (10.1%) | 0 (0.0%) |
| 18 to 24 Years | 95 (42.8%) | 97 (32.1%) |
| 25 to 34 Years | 69 (21.6%) | 76 (34.1%) |
| 35 to 44 Years | 0 (0.0%) | 13 (5.1%) |
| 45 to 54 Years | 13 (4.9%) | 81 (21.7%) |
| 55 to 64 Years | 97 (24.7%) | 78 (18.4%) |
| 65 to 74 Years | 41 (13.1%) | 19 (5.3%) |
| 75 Years and over | 21 (9.9%) | 34 (11.5%) |
| Total | 485 (20.0%) | 460 (17.5%) |
Income Above Poverty by Sex and Age in Polson
According to the poverty statistics in Polson, males aged 12 to 14 years and females aged 16 and 17 years are the age groups that are most secure financially, with 100.0% of males and 100.0% of females in these age groups living above the poverty line.
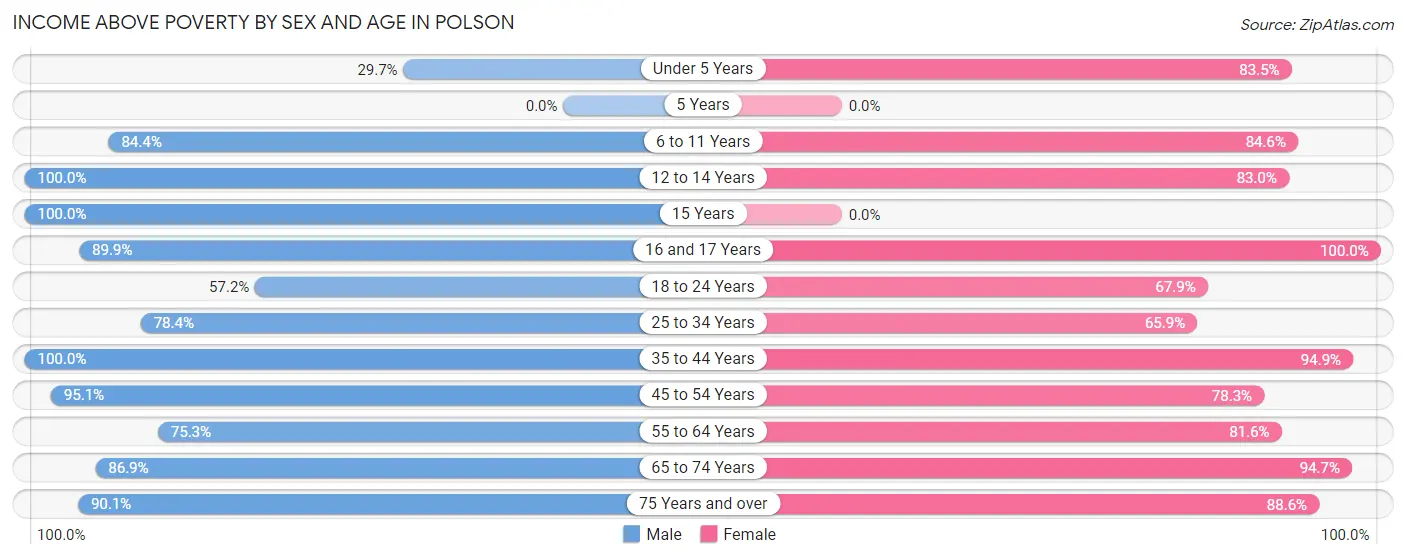
| Age Bracket | Male | Female |
| Under 5 Years | 46 (29.7%) | 116 (83.5%) |
| 5 Years | 0 (0.0%) | 0 (0.0%) |
| 6 to 11 Years | 168 (84.4%) | 132 (84.6%) |
| 12 to 14 Years | 80 (100.0%) | 73 (83.0%) |
| 15 Years | 31 (100.0%) | 0 (0.0%) |
| 16 and 17 Years | 80 (89.9%) | 22 (100.0%) |
| 18 to 24 Years | 127 (57.2%) | 205 (67.9%) |
| 25 to 34 Years | 251 (78.4%) | 147 (65.9%) |
| 35 to 44 Years | 143 (100.0%) | 240 (94.9%) |
| 45 to 54 Years | 253 (95.1%) | 293 (78.3%) |
| 55 to 64 Years | 295 (75.3%) | 346 (81.6%) |
| 65 to 74 Years | 271 (86.9%) | 336 (94.7%) |
| 75 Years and over | 191 (90.1%) | 263 (88.5%) |
| Total | 1,936 (80.0%) | 2,173 (82.5%) |
Income Below Poverty Among Married-Couple Families in Polson
The poverty statistics for married-couple families in Polson show that 4.9% or 41 of the total 840 families live below the poverty line. Families with no children have the highest poverty rate of 6.5%, comprising of 41 families. On the other hand, families with 1 or 2 children have the lowest poverty rate of 0.0%, which includes 0 families.
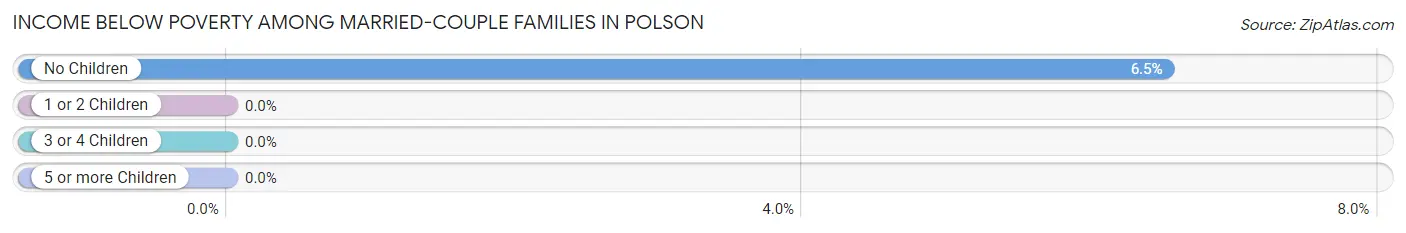
| Children | Above Poverty | Below Poverty |
| No Children | 588 (93.5%) | 41 (6.5%) |
| 1 or 2 Children | 182 (100.0%) | 0 (0.0%) |
| 3 or 4 Children | 29 (100.0%) | 0 (0.0%) |
| 5 or more Children | 0 (0.0%) | 0 (0.0%) |
| Total | 799 (95.1%) | 41 (4.9%) |
Income Below Poverty Among Single-Parent Households in Polson
According to the poverty data in Polson, 34.9% or 38 single-father households and 31.0% or 108 single-mother households are living below the poverty line. Among single-father households, those with no children have the highest poverty rate, with 38 households (48.1%) experiencing poverty. Likewise, among single-mother households, those with 3 or 4 children have the highest poverty rate, with 21 households (80.8%) falling below the poverty line.
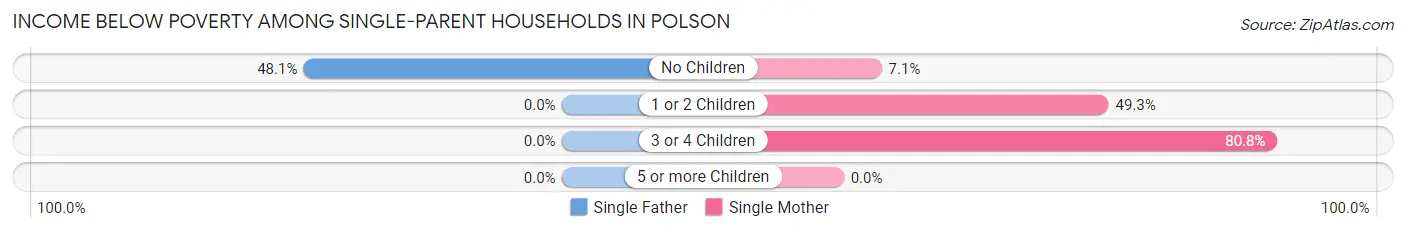
| Children | Single Father | Single Mother |
| No Children | 38 (48.1%) | 12 (7.1%) |
| 1 or 2 Children | 0 (0.0%) | 75 (49.3%) |
| 3 or 4 Children | 0 (0.0%) | 21 (80.8%) |
| 5 or more Children | 0 (0.0%) | 0 (0.0%) |
| Total | 38 (34.9%) | 108 (31.0%) |
Income Below Poverty Among Married-Couple vs Single-Parent Households in Polson
The poverty data for Polson shows that 41 of the married-couple family households (4.9%) and 146 of the single-parent households (32.0%) are living below the poverty level. Within the married-couple family households, those with no children have the highest poverty rate, with 41 households (6.5%) falling below the poverty line. Among the single-parent households, those with 3 or 4 children have the highest poverty rate, with 21 household (80.8%) living below poverty.
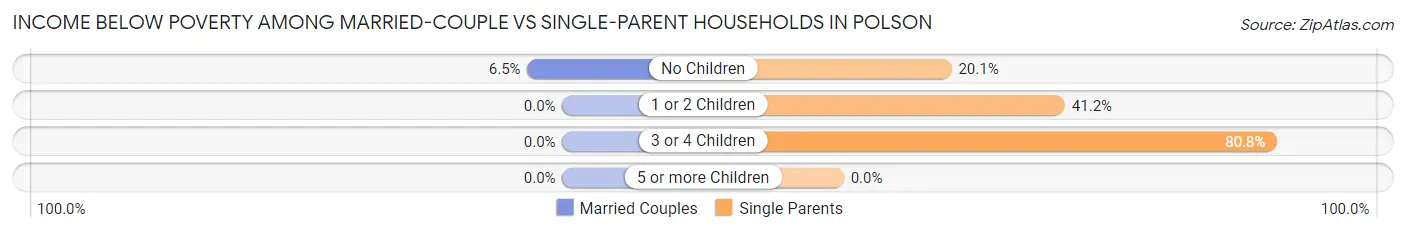
| Children | Married-Couple Families | Single-Parent Households |
| No Children | 41 (6.5%) | 50 (20.1%) |
| 1 or 2 Children | 0 (0.0%) | 75 (41.2%) |
| 3 or 4 Children | 0 (0.0%) | 21 (80.8%) |
| 5 or more Children | 0 (0.0%) | 0 (0.0%) |
| Total | 41 (4.9%) | 146 (32.0%) |
Race in Polson
The most populous races in Polson are White / Caucasian (3,266 | 62.6%), Native / Alaskan (921 | 17.6%), and Two or more Races (728 | 14.0%).
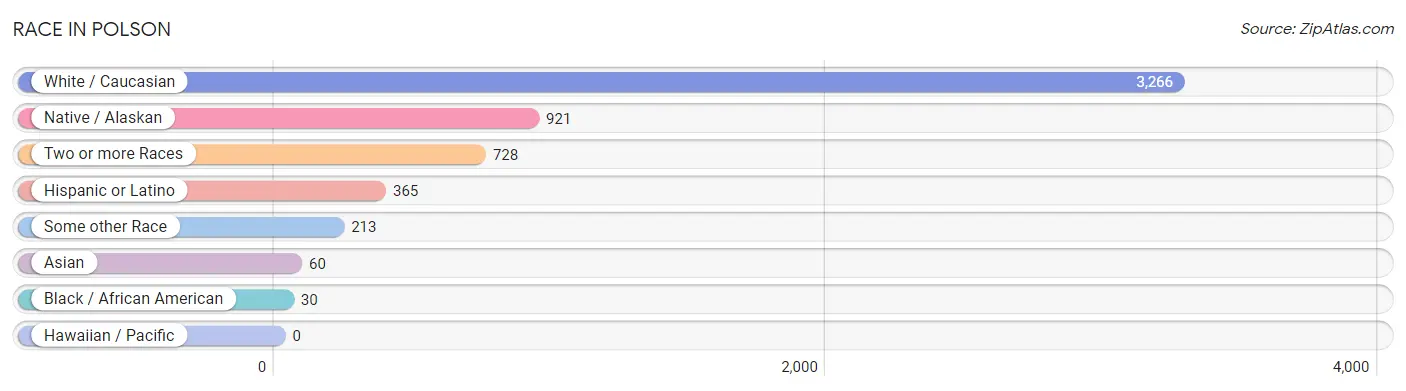
| Race | # Population | % Population |
| Asian | 60 | 1.1% |
| Black / African American | 30 | 0.6% |
| Hawaiian / Pacific | 0 | 0.0% |
| Hispanic or Latino | 365 | 7.0% |
| Native / Alaskan | 921 | 17.6% |
| White / Caucasian | 3,266 | 62.6% |
| Two or more Races | 728 | 14.0% |
| Some other Race | 213 | 4.1% |
| Total | 5,218 | 100.0% |
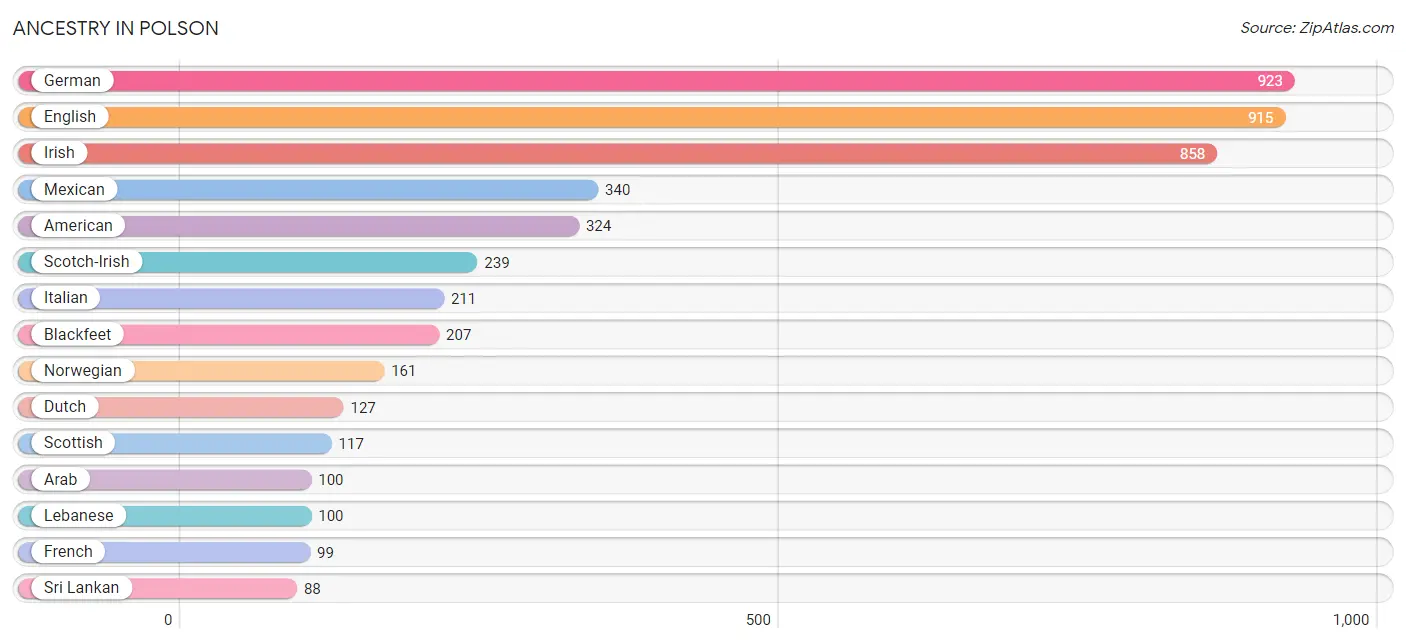
Ancestry in Polson
The most populous ancestries reported in Polson are German (923 | 17.7%), English (915 | 17.5%), Irish (858 | 16.4%), Mexican (340 | 6.5%), and American (324 | 6.2%), together accounting for 64.4% of all Polson residents.
| Ancestry | # Population | % Population |
| American | 324 | 6.2% |
| Arab | 100 | 1.9% |
| Armenian | 11 | 0.2% |
| Austrian | 16 | 0.3% |
| Belgian | 12 | 0.2% |
| Blackfeet | 207 | 4.0% |
| Canadian | 9 | 0.2% |
| Cheyenne | 33 | 0.6% |
| Chippewa | 54 | 1.0% |
| Choctaw | 13 | 0.3% |
| Comanche | 25 | 0.5% |
| Cree | 44 | 0.8% |
| Croatian | 14 | 0.3% |
| Crow | 10 | 0.2% |
| Czech | 19 | 0.4% |
| Danish | 44 | 0.8% |
| Dutch | 127 | 2.4% |
| English | 915 | 17.5% |
| European | 79 | 1.5% |
| French | 99 | 1.9% |
| French American Indian | 41 | 0.8% |
| French Canadian | 22 | 0.4% |
| German | 923 | 17.7% |
| Irish | 858 | 16.4% |
| Italian | 211 | 4.0% |
| Lebanese | 100 | 1.9% |
| Mexican | 340 | 6.5% |
| Norwegian | 161 | 3.1% |
| Peruvian | 25 | 0.5% |
| Polish | 38 | 0.7% |
| Portuguese | 20 | 0.4% |
| Potawatomi | 7 | 0.1% |
| Scandinavian | 9 | 0.2% |
| Scotch-Irish | 239 | 4.6% |
| Scottish | 117 | 2.2% |
| Sioux | 33 | 0.6% |
| Slovak | 10 | 0.2% |
| South American | 25 | 0.5% |
| Sri Lankan | 88 | 1.7% |
| Swedish | 54 | 1.0% |
| Swiss | 16 | 0.3% |
| Welsh | 68 | 1.3% | View All 42 Rows |
Immigrants in Polson
The most numerous immigrant groups reported in Polson came from Central America (158 | 3.0%), Latin America (158 | 3.0%), Mexico (158 | 3.0%), Asia (60 | 1.1%), and South Eastern Asia (39 | 0.7%), together accounting for 11.0% of all Polson residents.
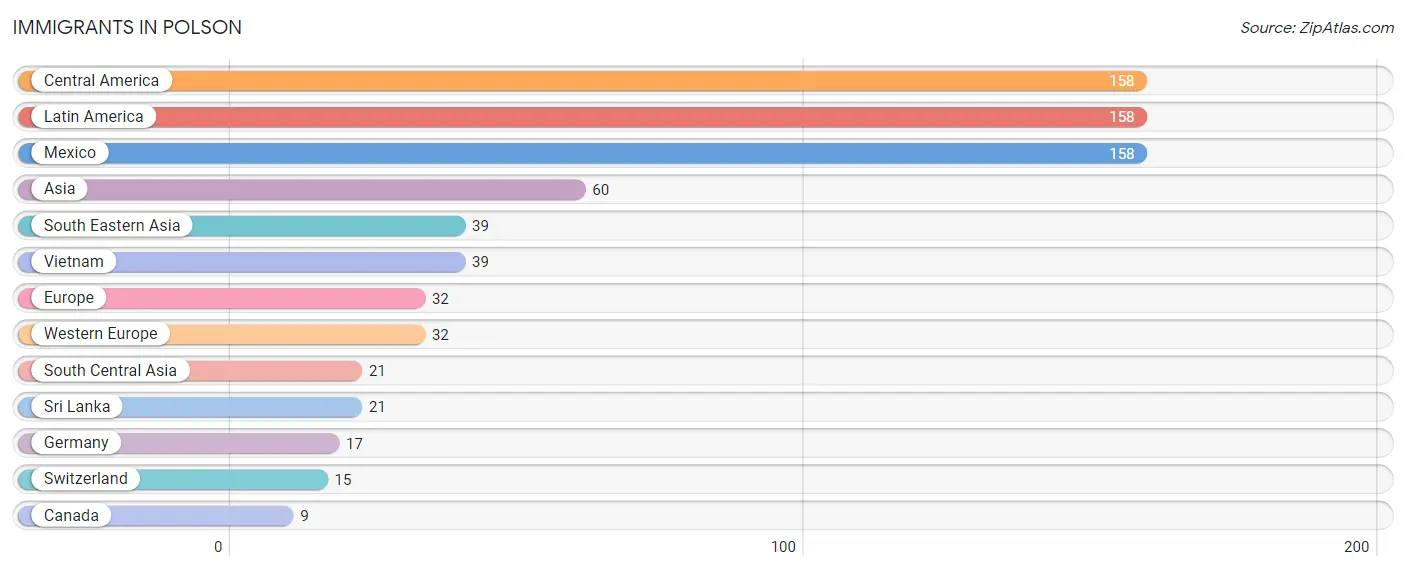
| Immigration Origin | # Population | % Population |
| Asia | 60 | 1.1% |
| Canada | 9 | 0.2% |
| Central America | 158 | 3.0% |
| Europe | 32 | 0.6% |
| Germany | 17 | 0.3% |
| Latin America | 158 | 3.0% |
| Mexico | 158 | 3.0% |
| South Central Asia | 21 | 0.4% |
| South Eastern Asia | 39 | 0.7% |
| Sri Lanka | 21 | 0.4% |
| Switzerland | 15 | 0.3% |
| Vietnam | 39 | 0.7% |
| Western Europe | 32 | 0.6% | View All 13 Rows |
Sex and Age in Polson
Sex and Age in Polson
The most populous age groups in Polson are 55 to 59 Years (273 | 10.9%) for men and 20 to 24 Years (266 | 9.8%) for women.
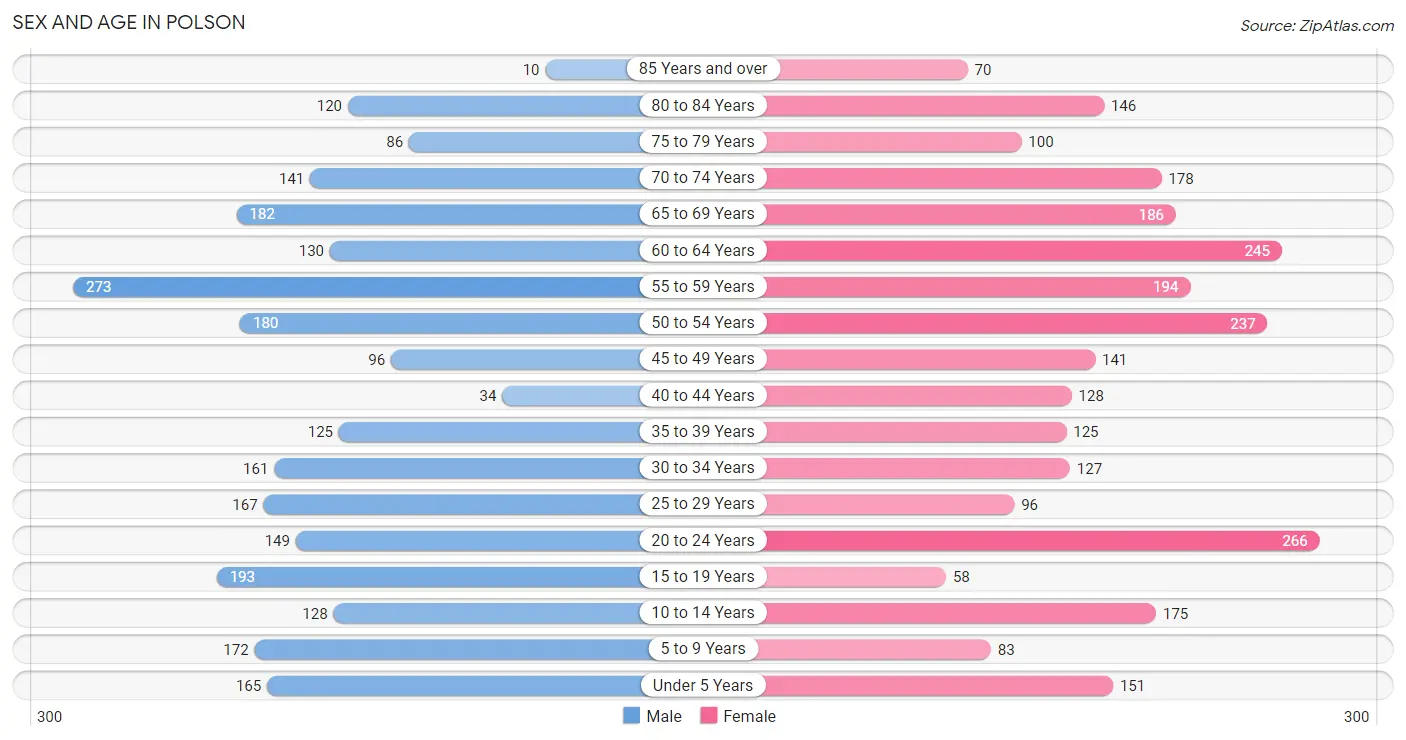
| Age Bracket | Male | Female |
| Under 5 Years | 165 (6.6%) | 151 (5.6%) |
| 5 to 9 Years | 172 (6.9%) | 83 (3.1%) |
| 10 to 14 Years | 128 (5.1%) | 175 (6.5%) |
| 15 to 19 Years | 193 (7.7%) | 58 (2.1%) |
| 20 to 24 Years | 149 (5.9%) | 266 (9.8%) |
| 25 to 29 Years | 167 (6.7%) | 96 (3.5%) |
| 30 to 34 Years | 161 (6.4%) | 127 (4.7%) |
| 35 to 39 Years | 125 (5.0%) | 125 (4.6%) |
| 40 to 44 Years | 34 (1.3%) | 128 (4.7%) |
| 45 to 49 Years | 96 (3.8%) | 141 (5.2%) |
| 50 to 54 Years | 180 (7.2%) | 237 (8.8%) |
| 55 to 59 Years | 273 (10.9%) | 194 (7.2%) |
| 60 to 64 Years | 130 (5.2%) | 245 (9.0%) |
| 65 to 69 Years | 182 (7.2%) | 186 (6.9%) |
| 70 to 74 Years | 141 (5.6%) | 178 (6.6%) |
| 75 to 79 Years | 86 (3.4%) | 100 (3.7%) |
| 80 to 84 Years | 120 (4.8%) | 146 (5.4%) |
| 85 Years and over | 10 (0.4%) | 70 (2.6%) |
| Total | 2,512 (100.0%) | 2,706 (100.0%) |
Families and Households in Polson
Median Family Size in Polson
The median family size in Polson is 2.86 persons per family, with single male/father families (109 | 8.4%) accounting for the largest median family size of 3.61 persons per family. On the other hand, single female/mother families (348 | 26.8%) represent the smallest median family size with 2.63 persons per family.
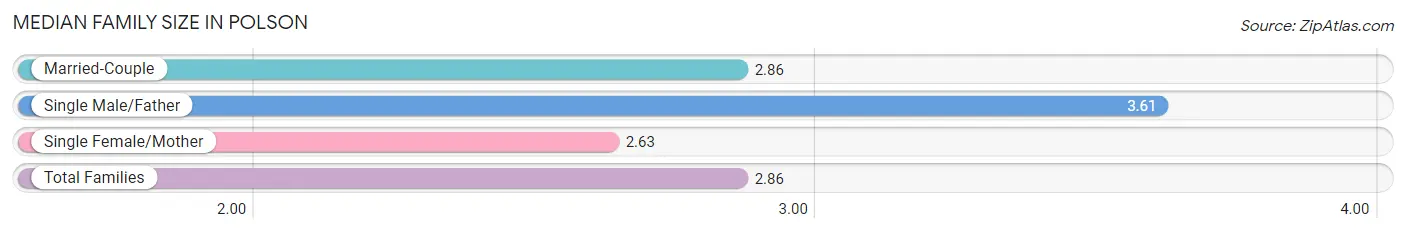
| Family Type | # Families | Family Size |
| Married-Couple | 840 (64.8%) | 2.86 |
| Single Male/Father | 109 (8.4%) | 3.61 |
| Single Female/Mother | 348 (26.8%) | 2.63 |
| Total Families | 1,297 (100.0%) | 2.86 |
Median Household Size in Polson
The median household size in Polson is 2.28 persons per household, with single male/father households (109 | 4.9%) accounting for the largest median household size of 3.74 persons per household. non-family households (934 | 41.9%) represent the smallest median household size with 1.38 persons per household.
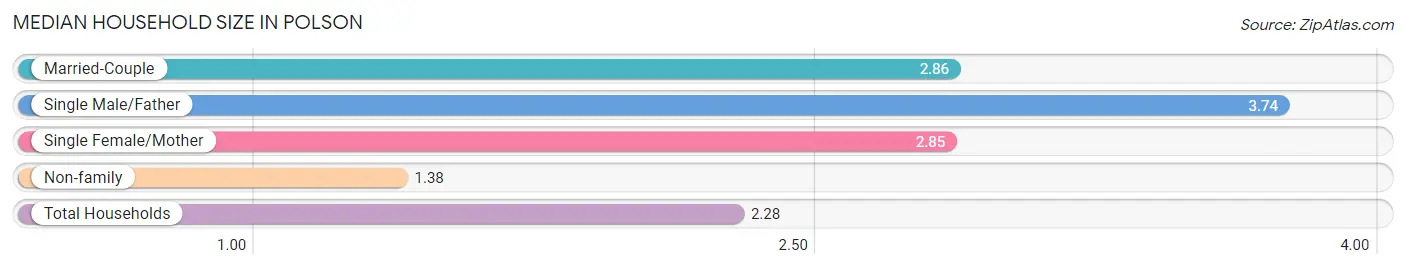
| Household Type | # Households | Household Size |
| Married-Couple | 840 (37.7%) | 2.86 |
| Single Male/Father | 109 (4.9%) | 3.74 |
| Single Female/Mother | 348 (15.6%) | 2.85 |
| Non-family | 934 (41.9%) | 1.38 |
| Total Households | 2,231 (100.0%) | 2.28 |
Household Size by Marriage Status in Polson
Out of a total of 2,231 households in Polson, 1,297 (58.1%) are family households, while 934 (41.9%) are nonfamily households. The most numerous type of family households are 2-person households, comprising 823, and the most common type of nonfamily households are 1-person households, comprising 683.
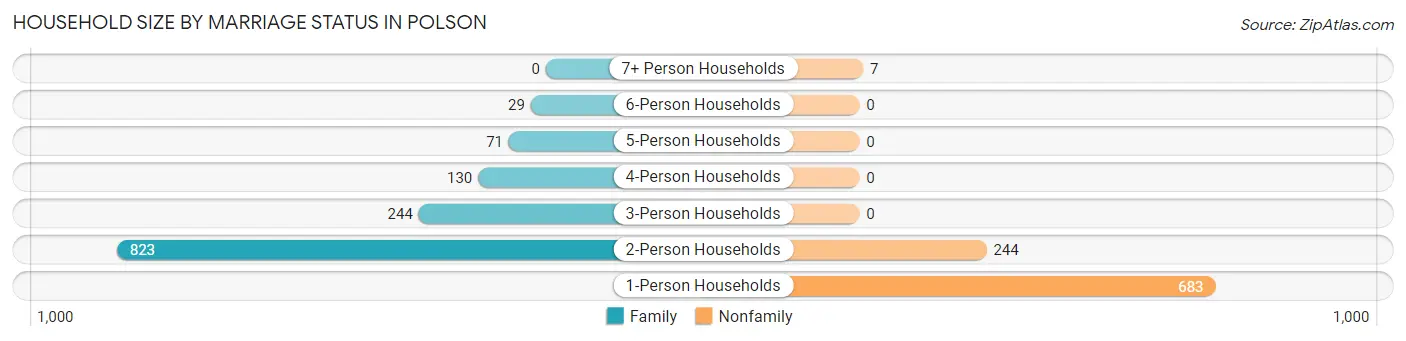
| Household Size | Family Households | Nonfamily Households |
| 1-Person Households | - | 683 (30.6%) |
| 2-Person Households | 823 (36.9%) | 244 (10.9%) |
| 3-Person Households | 244 (10.9%) | 0 (0.0%) |
| 4-Person Households | 130 (5.8%) | 0 (0.0%) |
| 5-Person Households | 71 (3.2%) | 0 (0.0%) |
| 6-Person Households | 29 (1.3%) | 0 (0.0%) |
| 7+ Person Households | 0 (0.0%) | 7 (0.3%) |
| Total | 1,297 (58.1%) | 934 (41.9%) |
Female Fertility in Polson
Fertility by Age in Polson
Average fertility rate in Polson is 43.0 births per 1,000 women. Women in the age bracket of 35 to 50 years have the highest fertility rate with 101.0 births per 1,000 women. Women in the age bracket of 35 to 50 years acount for 100.0% of all women with births.
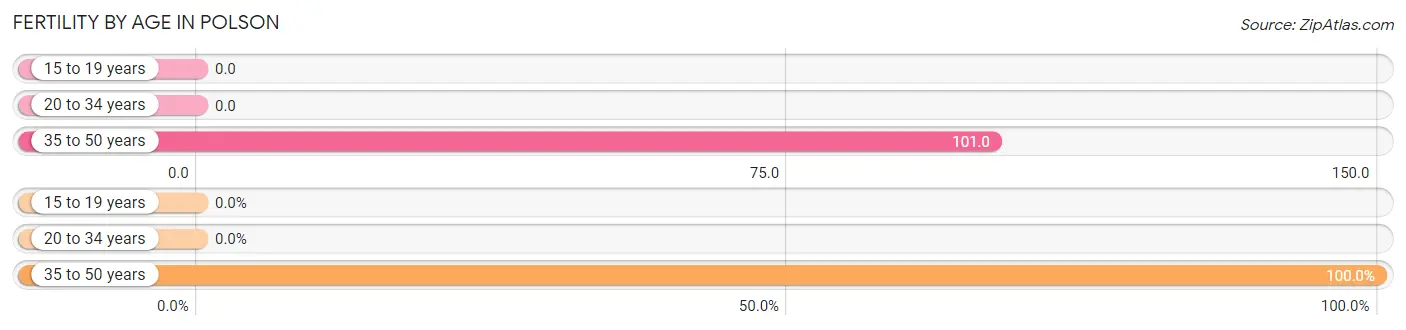
| Age Bracket | Women with Births | Births / 1,000 Women |
| 15 to 19 years | 0 (0.0%) | 0.0 |
| 20 to 34 years | 0 (0.0%) | 0.0 |
| 35 to 50 years | 41 (100.0%) | 101.0 |
| Total | 41 (100.0%) | 43.0 |
Fertility by Age by Marriage Status in Polson
12.2% of women with births (41) in Polson are married. The highest percentage of unmarried women with births falls into 35 to 50 years age bracket with 87.8% of them unmarried at the time of birth, while the lowest percentage of unmarried women with births belong to 35 to 50 years age bracket with 87.8% of them unmarried.
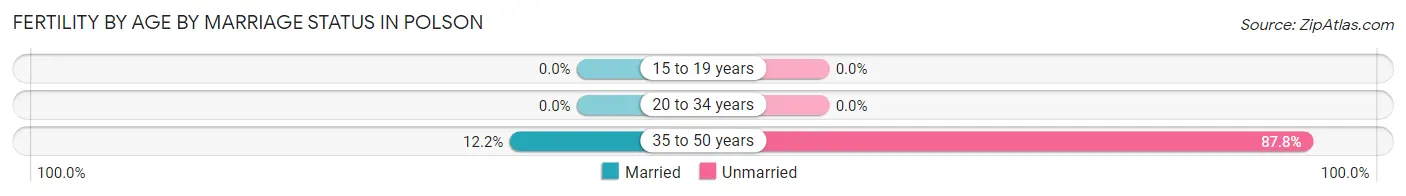
| Age Bracket | Married | Unmarried |
| 15 to 19 years | 0 (0.0%) | 0 (0.0%) |
| 20 to 34 years | 0 (0.0%) | 0 (0.0%) |
| 35 to 50 years | 5 (12.2%) | 36 (87.8%) |
| Total | 5 (12.2%) | 36 (87.8%) |
Fertility by Education in Polson
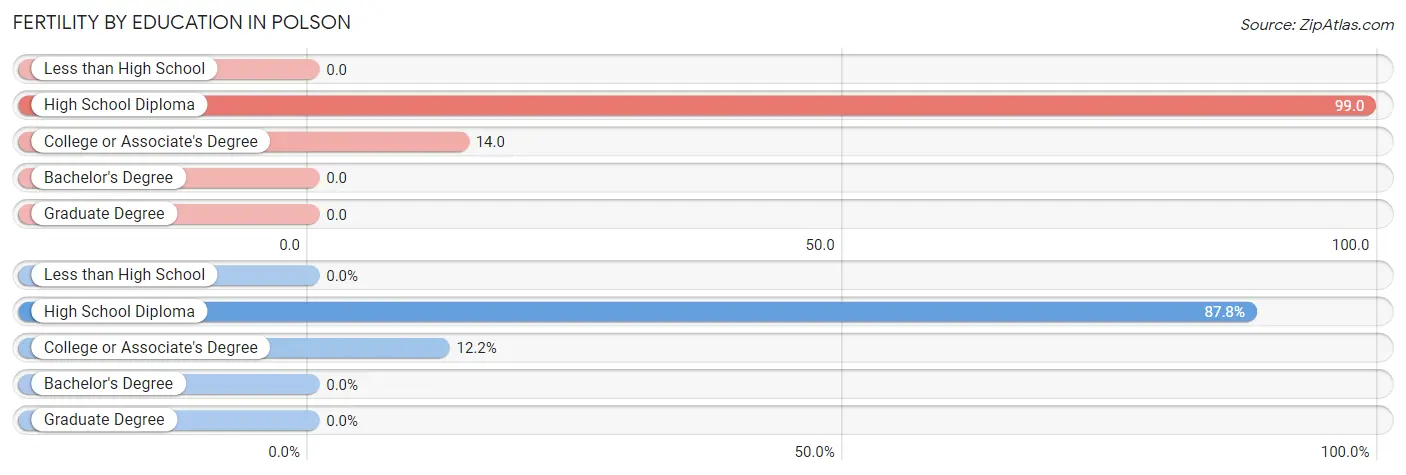
| Educational Attainment | Women with Births | Births / 1,000 Women |
| Less than High School | 0 (0.0%) | 0.0 |
| High School Diploma | 36 (87.8%) | 99.0 |
| College or Associate's Degree | 5 (12.2%) | 14.0 |
| Bachelor's Degree | 0 (0.0%) | 0.0 |
| Graduate Degree | 0 (0.0%) | 0.0 |
| Total | 41 (100.0%) | 43.0 |
Fertility by Education by Marriage Status in Polson
87.8% of women with births in Polson are unmarried. Women with the educational attainment of college or associate's degree are most likely to be married with 100.0% of them married at childbirth, while women with the educational attainment of high school diploma are least likely to be married with 100.0% of them unmarried at childbirth.
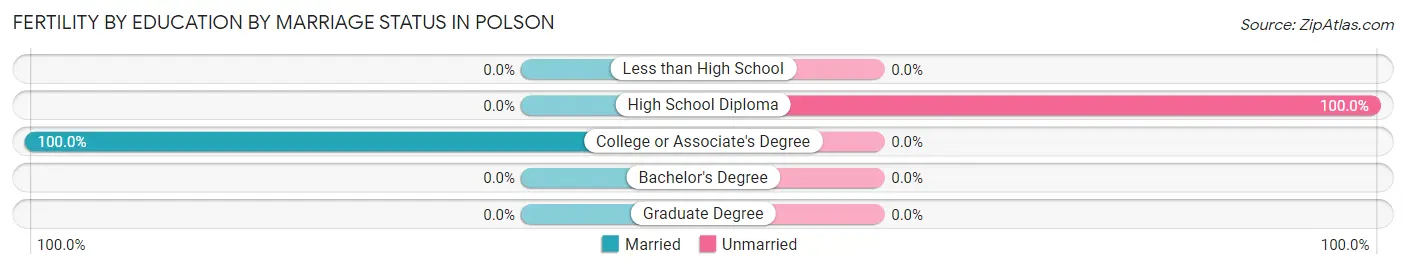
| Educational Attainment | Married | Unmarried |
| Less than High School | 0 (0.0%) | 0 (0.0%) |
| High School Diploma | 0 (0.0%) | 36 (100.0%) |
| College or Associate's Degree | 5 (100.0%) | 0 (0.0%) |
| Bachelor's Degree | 0 (0.0%) | 0 (0.0%) |
| Graduate Degree | 0 (0.0%) | 0 (0.0%) |
| Total | 5 (12.2%) | 36 (87.8%) |
Employment Characteristics in Polson
Employment by Class of Employer in Polson
Among the 2,264 employed individuals in Polson, private company employees (1,380 | 61.0%), not-for-profit organizations (397 | 17.5%), and local government employees (210 | 9.3%) make up the most common classes of employment.
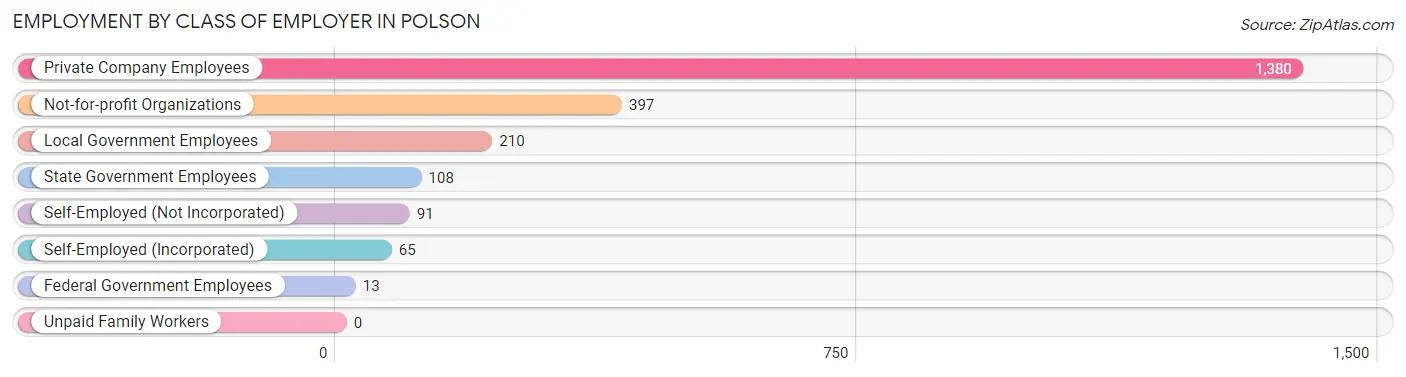
| Employer Class | # Employees | % Employees |
| Private Company Employees | 1,380 | 61.0% |
| Self-Employed (Incorporated) | 65 | 2.9% |
| Self-Employed (Not Incorporated) | 91 | 4.0% |
| Not-for-profit Organizations | 397 | 17.5% |
| Local Government Employees | 210 | 9.3% |
| State Government Employees | 108 | 4.8% |
| Federal Government Employees | 13 | 0.6% |
| Unpaid Family Workers | 0 | 0.0% |
| Total | 2,264 | 100.0% |
Employment Status by Age in Polson
According to the labor force statistics for Polson, out of the total population over 16 years of age (4,313), 56.1% or 2,420 individuals are in the labor force, with 6.4% or 155 of them unemployed. The age group with the highest labor force participation rate is 25 to 29 years, with 93.5% or 246 individuals in the labor force. Within the labor force, the 75 years and over age range has the highest percentage of unemployed individuals, with 33.3% or 23 of them being unemployed.
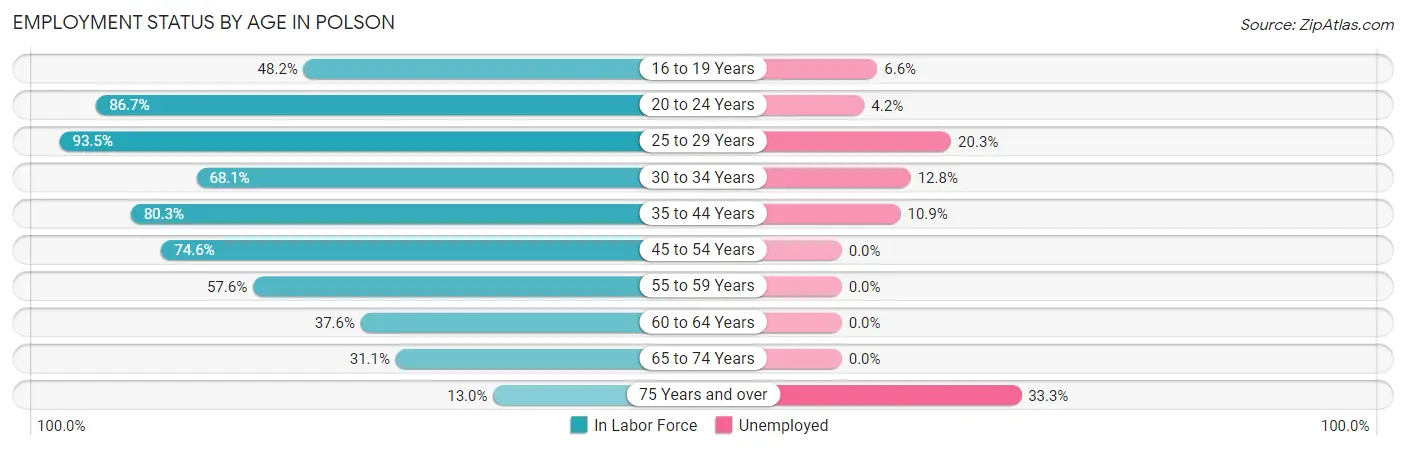
| Age Bracket | In Labor Force | Unemployed |
| 16 to 19 Years | 106 (48.2%) | 7 (6.6%) |
| 20 to 24 Years | 360 (86.7%) | 15 (4.2%) |
| 25 to 29 Years | 246 (93.5%) | 50 (20.3%) |
| 30 to 34 Years | 196 (68.1%) | 25 (12.8%) |
| 35 to 44 Years | 331 (80.3%) | 36 (10.9%) |
| 45 to 54 Years | 488 (74.6%) | 0 (0.0%) |
| 55 to 59 Years | 269 (57.6%) | 0 (0.0%) |
| 60 to 64 Years | 141 (37.6%) | 0 (0.0%) |
| 65 to 74 Years | 214 (31.1%) | 0 (0.0%) |
| 75 Years and over | 69 (13.0%) | 23 (33.3%) |
| Total | 2,420 (56.1%) | 155 (6.4%) |
Employment Status by Educational Attainment in Polson
According to labor force statistics for Polson, 68.0% of individuals (1,672) out of the total population between 25 and 64 years of age (2,459) are in the labor force, with 6.6% or 110 of them being unemployed. The group with the highest labor force participation rate are those with the educational attainment of bachelor's degree or higher, with 78.0% or 425 individuals in the labor force. Within the labor force, individuals with high school diploma education have the highest percentage of unemployment, with 21.4% or 98 of them being unemployed.
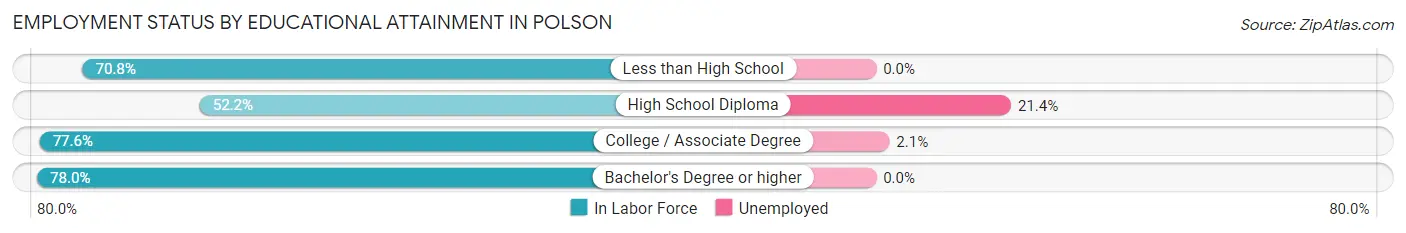
| Educational Attainment | In Labor Force | Unemployed |
| Less than High School | 170 (70.8%) | 0 (0.0%) |
| High School Diploma | 459 (52.2%) | 188 (21.4%) |
| College / Associate Degree | 617 (77.6%) | 17 (2.1%) |
| Bachelor's Degree or higher | 425 (78.0%) | 0 (0.0%) |
| Total | 1,672 (68.0%) | 162 (6.6%) |
Employment Occupations by Sex in Polson
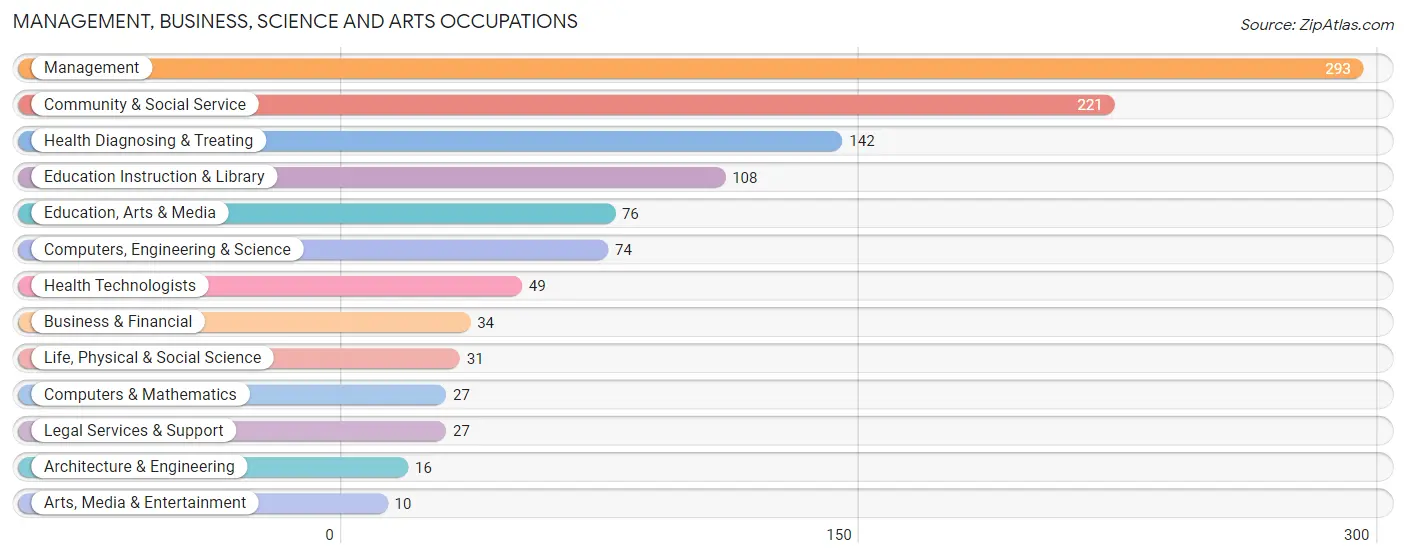
Management, Business, Science and Arts Occupations
The most common Management, Business, Science and Arts occupations in Polson are Management (293 | 12.9%), Community & Social Service (221 | 9.8%), Health Diagnosing & Treating (142 | 6.3%), Education Instruction & Library (108 | 4.8%), and Education, Arts & Media (76 | 3.4%).
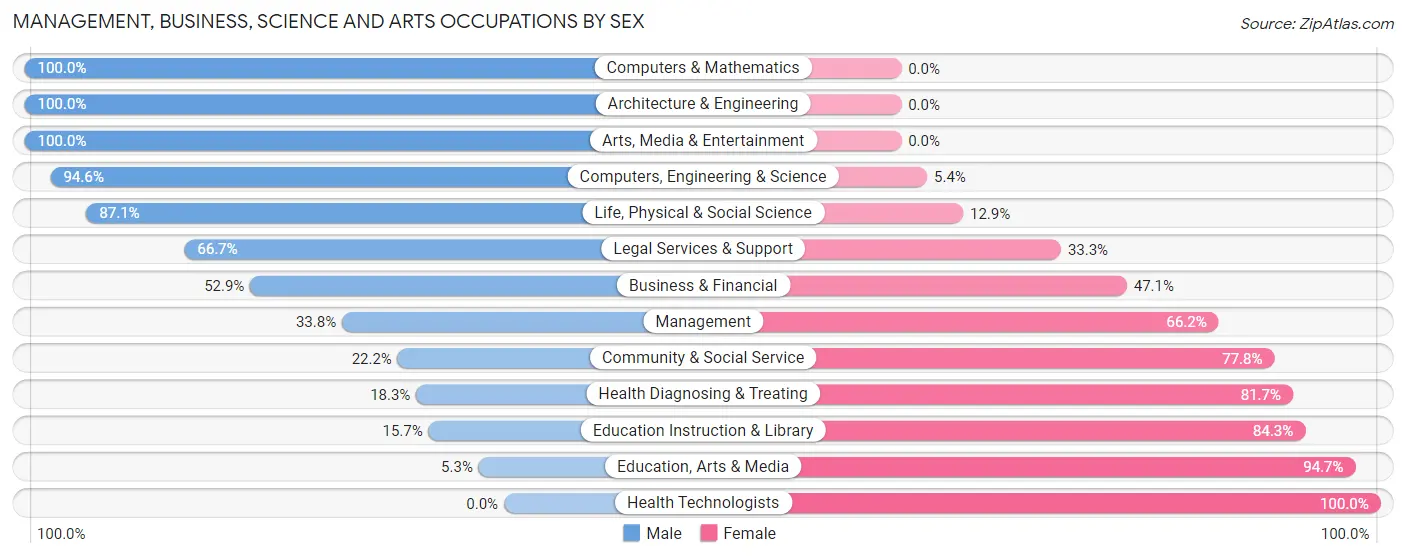
Management, Business, Science and Arts Occupations by Sex
Within the Management, Business, Science and Arts occupations in Polson, the most male-oriented occupations are Computers & Mathematics (100.0%), Architecture & Engineering (100.0%), and Arts, Media & Entertainment (100.0%), while the most female-oriented occupations are Health Technologists (100.0%), Education, Arts & Media (94.7%), and Education Instruction & Library (84.3%).
| Occupation | Male | Female |
| Management | 99 (33.8%) | 194 (66.2%) |
| Business & Financial | 18 (52.9%) | 16 (47.1%) |
| Computers, Engineering & Science | 70 (94.6%) | 4 (5.4%) |
| Computers & Mathematics | 27 (100.0%) | 0 (0.0%) |
| Architecture & Engineering | 16 (100.0%) | 0 (0.0%) |
| Life, Physical & Social Science | 27 (87.1%) | 4 (12.9%) |
| Community & Social Service | 49 (22.2%) | 172 (77.8%) |
| Education, Arts & Media | 4 (5.3%) | 72 (94.7%) |
| Legal Services & Support | 18 (66.7%) | 9 (33.3%) |
| Education Instruction & Library | 17 (15.7%) | 91 (84.3%) |
| Arts, Media & Entertainment | 10 (100.0%) | 0 (0.0%) |
| Health Diagnosing & Treating | 26 (18.3%) | 116 (81.7%) |
| Health Technologists | 0 (0.0%) | 49 (100.0%) |
| Total (Category) | 262 (34.3%) | 502 (65.7%) |
| Total (Overall) | 1,060 (46.8%) | 1,204 (53.2%) |
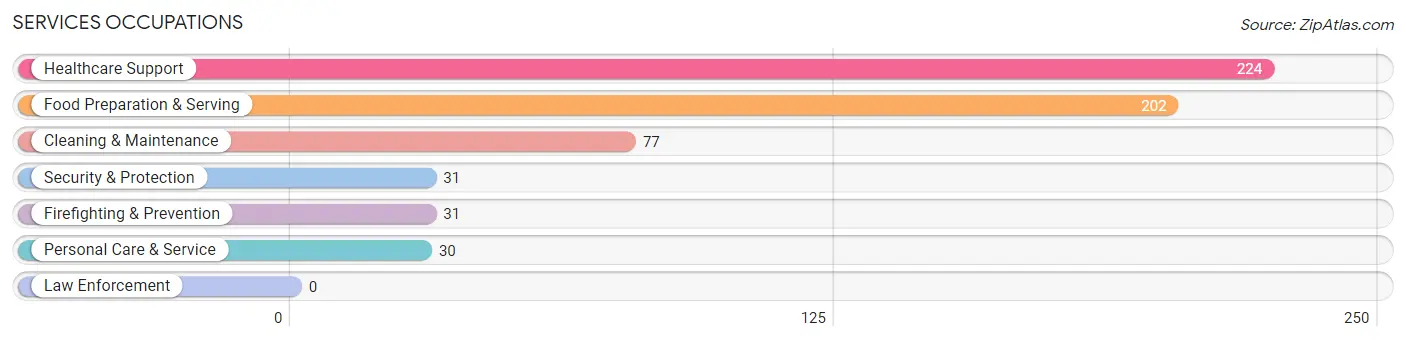
Services Occupations
The most common Services occupations in Polson are Healthcare Support (224 | 9.9%), Food Preparation & Serving (202 | 8.9%), Cleaning & Maintenance (77 | 3.4%), Security & Protection (31 | 1.4%), and Firefighting & Prevention (31 | 1.4%).
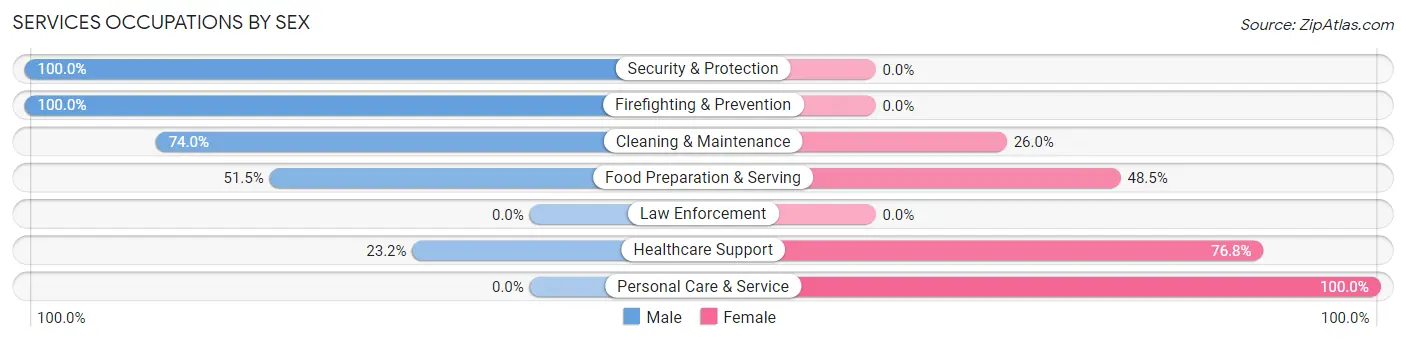
Services Occupations by Sex
Within the Services occupations in Polson, the most male-oriented occupations are Security & Protection (100.0%), Firefighting & Prevention (100.0%), and Cleaning & Maintenance (74.0%), while the most female-oriented occupations are Personal Care & Service (100.0%), Healthcare Support (76.8%), and Food Preparation & Serving (48.5%).
| Occupation | Male | Female |
| Healthcare Support | 52 (23.2%) | 172 (76.8%) |
| Security & Protection | 31 (100.0%) | 0 (0.0%) |
| Firefighting & Prevention | 31 (100.0%) | 0 (0.0%) |
| Law Enforcement | 0 (0.0%) | 0 (0.0%) |
| Food Preparation & Serving | 104 (51.5%) | 98 (48.5%) |
| Cleaning & Maintenance | 57 (74.0%) | 20 (26.0%) |
| Personal Care & Service | 0 (0.0%) | 30 (100.0%) |
| Total (Category) | 244 (43.3%) | 320 (56.7%) |
| Total (Overall) | 1,060 (46.8%) | 1,204 (53.2%) |
Sales and Office Occupations
The most common Sales and Office occupations in Polson are Sales & Related (277 | 12.2%), and Office & Administration (246 | 10.9%).
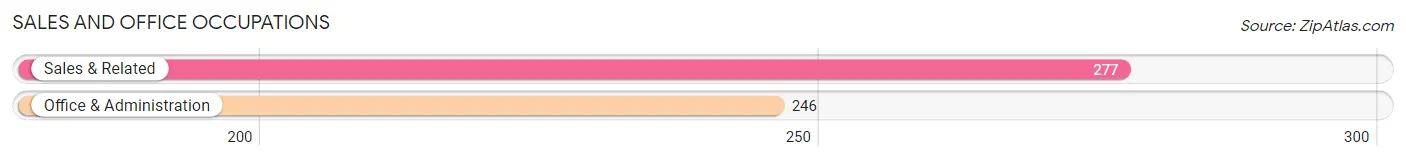
Sales and Office Occupations by Sex
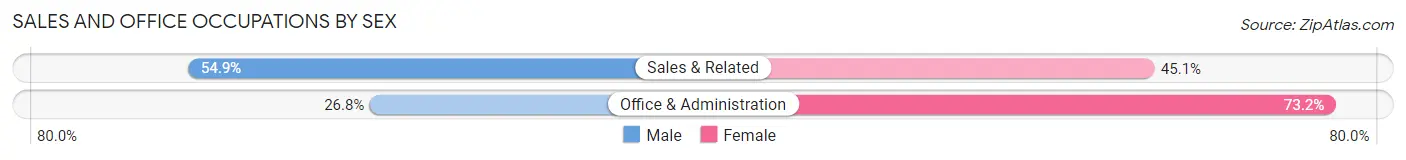
| Occupation | Male | Female |
| Sales & Related | 152 (54.9%) | 125 (45.1%) |
| Office & Administration | 66 (26.8%) | 180 (73.2%) |
| Total (Category) | 218 (41.7%) | 305 (58.3%) |
| Total (Overall) | 1,060 (46.8%) | 1,204 (53.2%) |
Natural Resources, Construction and Maintenance Occupations
The most common Natural Resources, Construction and Maintenance occupations in Polson are Construction & Extraction (61 | 2.7%), Installation, Maintenance & Repair (53 | 2.3%), and Farming, Fishing & Forestry (42 | 1.9%).
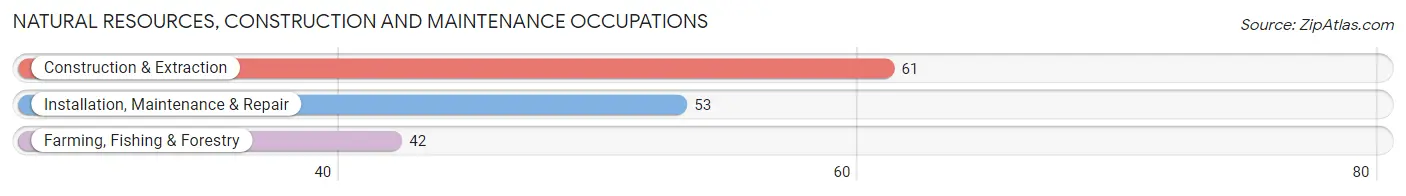
Natural Resources, Construction and Maintenance Occupations by Sex
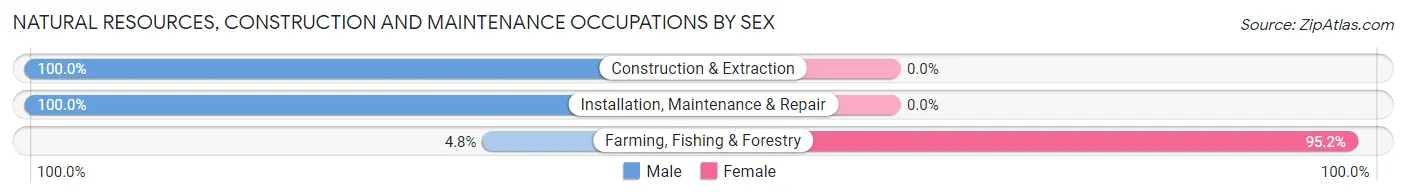
| Occupation | Male | Female |
| Farming, Fishing & Forestry | 2 (4.8%) | 40 (95.2%) |
| Construction & Extraction | 61 (100.0%) | 0 (0.0%) |
| Installation, Maintenance & Repair | 53 (100.0%) | 0 (0.0%) |
| Total (Category) | 116 (74.4%) | 40 (25.6%) |
| Total (Overall) | 1,060 (46.8%) | 1,204 (53.2%) |
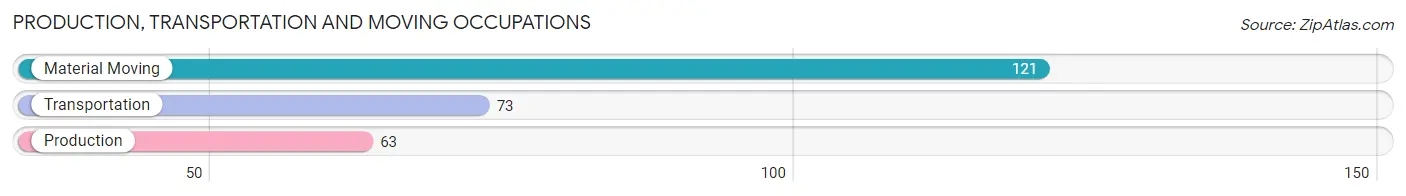
Production, Transportation and Moving Occupations
The most common Production, Transportation and Moving occupations in Polson are Material Moving (121 | 5.3%), Transportation (73 | 3.2%), and Production (63 | 2.8%).
Production, Transportation and Moving Occupations by Sex
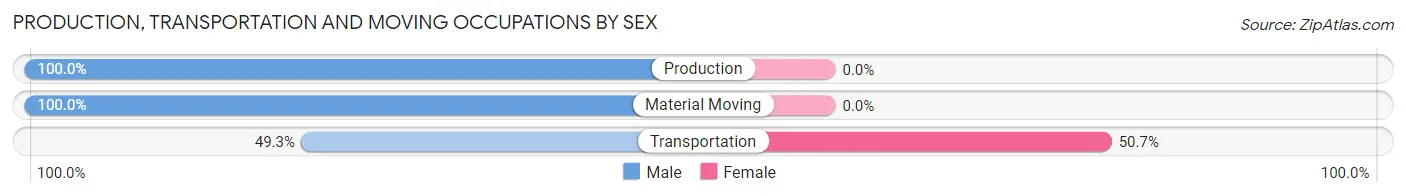
| Occupation | Male | Female |
| Production | 63 (100.0%) | 0 (0.0%) |
| Transportation | 36 (49.3%) | 37 (50.7%) |
| Material Moving | 121 (100.0%) | 0 (0.0%) |
| Total (Category) | 220 (85.6%) | 37 (14.4%) |
| Total (Overall) | 1,060 (46.8%) | 1,204 (53.2%) |
Employment Industries by Sex in Polson
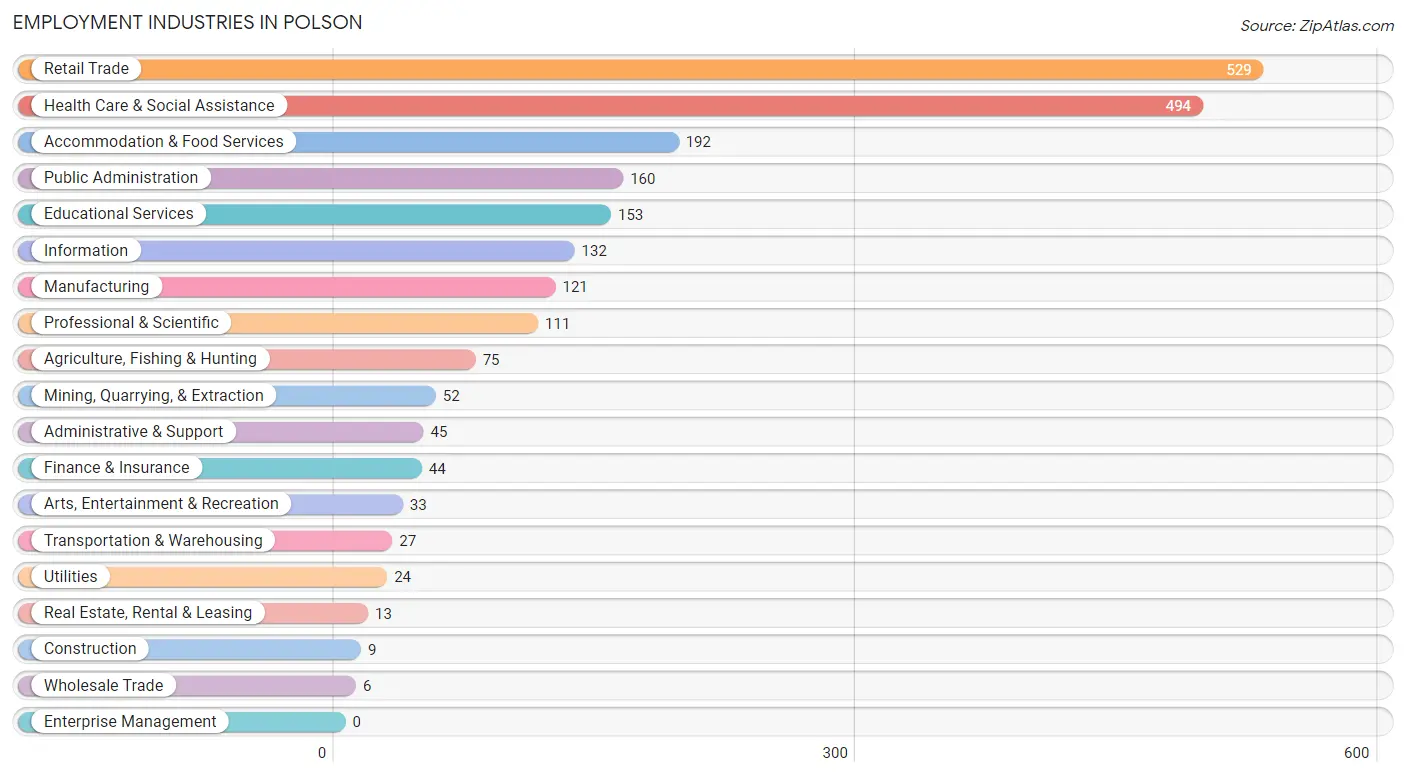
Employment Industries in Polson
The major employment industries in Polson include Retail Trade (529 | 23.4%), Health Care & Social Assistance (494 | 21.8%), Accommodation & Food Services (192 | 8.5%), Public Administration (160 | 7.1%), and Educational Services (153 | 6.8%).
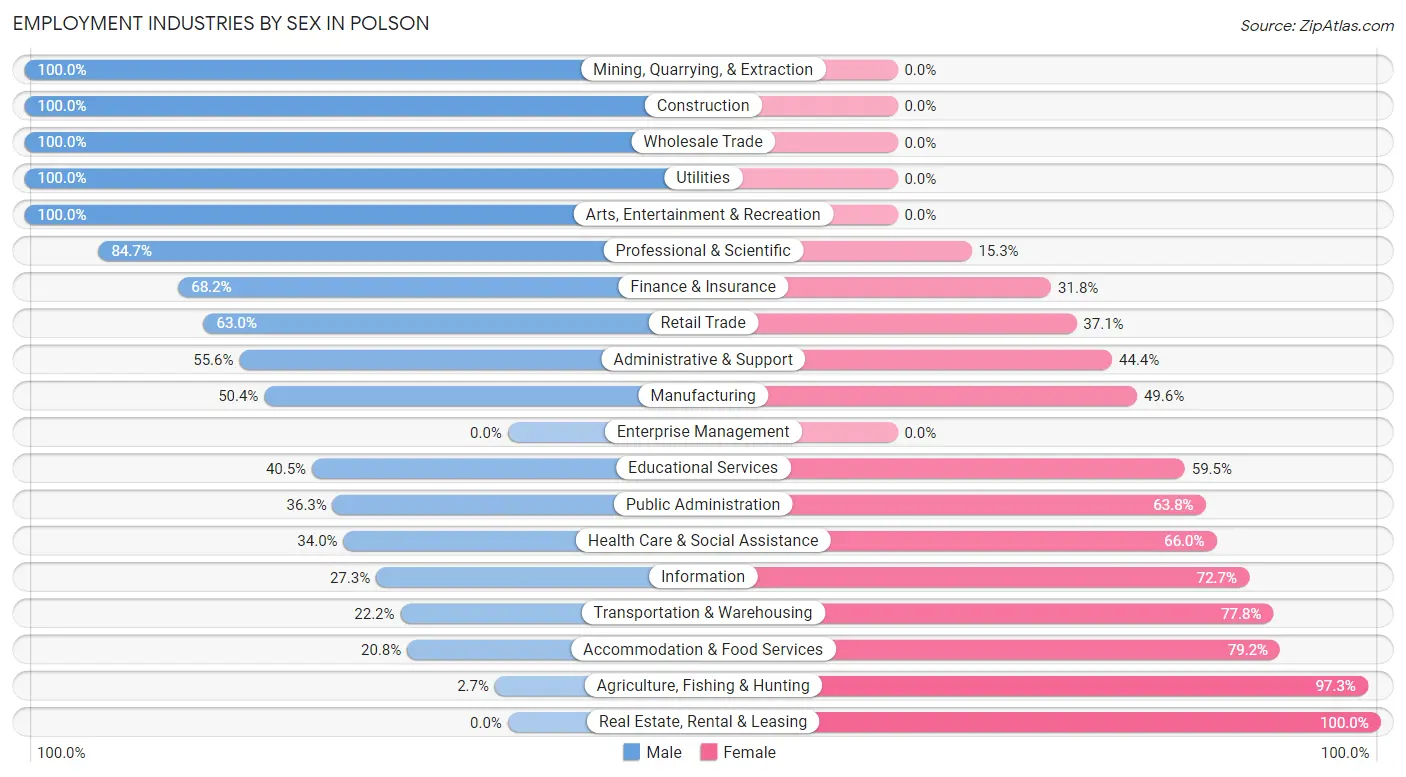
Employment Industries by Sex in Polson
The Polson industries that see more men than women are Mining, Quarrying, & Extraction (100.0%), Construction (100.0%), and Wholesale Trade (100.0%), whereas the industries that tend to have a higher number of women are Real Estate, Rental & Leasing (100.0%), Agriculture, Fishing & Hunting (97.3%), and Accommodation & Food Services (79.2%).
| Industry | Male | Female |
| Agriculture, Fishing & Hunting | 2 (2.7%) | 73 (97.3%) |
| Mining, Quarrying, & Extraction | 52 (100.0%) | 0 (0.0%) |
| Construction | 9 (100.0%) | 0 (0.0%) |
| Manufacturing | 61 (50.4%) | 60 (49.6%) |
| Wholesale Trade | 6 (100.0%) | 0 (0.0%) |
| Retail Trade | 333 (62.9%) | 196 (37.0%) |
| Transportation & Warehousing | 6 (22.2%) | 21 (77.8%) |
| Utilities | 24 (100.0%) | 0 (0.0%) |
| Information | 36 (27.3%) | 96 (72.7%) |
| Finance & Insurance | 30 (68.2%) | 14 (31.8%) |
| Real Estate, Rental & Leasing | 0 (0.0%) | 13 (100.0%) |
| Professional & Scientific | 94 (84.7%) | 17 (15.3%) |
| Enterprise Management | 0 (0.0%) | 0 (0.0%) |
| Administrative & Support | 25 (55.6%) | 20 (44.4%) |
| Educational Services | 62 (40.5%) | 91 (59.5%) |
| Health Care & Social Assistance | 168 (34.0%) | 326 (66.0%) |
| Arts, Entertainment & Recreation | 33 (100.0%) | 0 (0.0%) |
| Accommodation & Food Services | 40 (20.8%) | 152 (79.2%) |
| Public Administration | 58 (36.2%) | 102 (63.7%) |
| Total | 1,060 (46.8%) | 1,204 (53.2%) |
Education in Polson
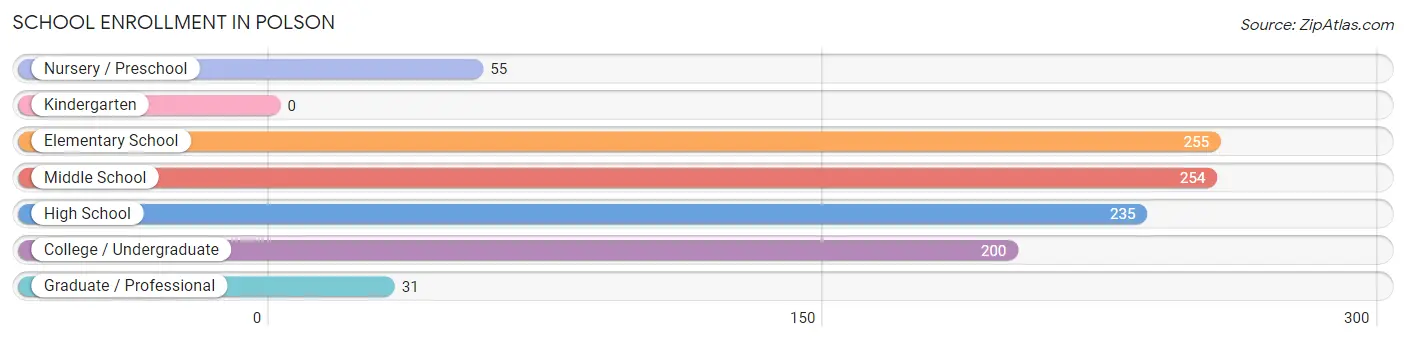
School Enrollment in Polson
The most common levels of schooling among the 1,030 students in Polson are elementary school (255 | 24.8%), middle school (254 | 24.7%), and high school (235 | 22.8%).
| School Level | # Students | % Students |
| Nursery / Preschool | 55 | 5.3% |
| Kindergarten | 0 | 0.0% |
| Elementary School | 255 | 24.8% |
| Middle School | 254 | 24.7% |
| High School | 235 | 22.8% |
| College / Undergraduate | 200 | 19.4% |
| Graduate / Professional | 31 | 3.0% |
| Total | 1,030 | 100.0% |
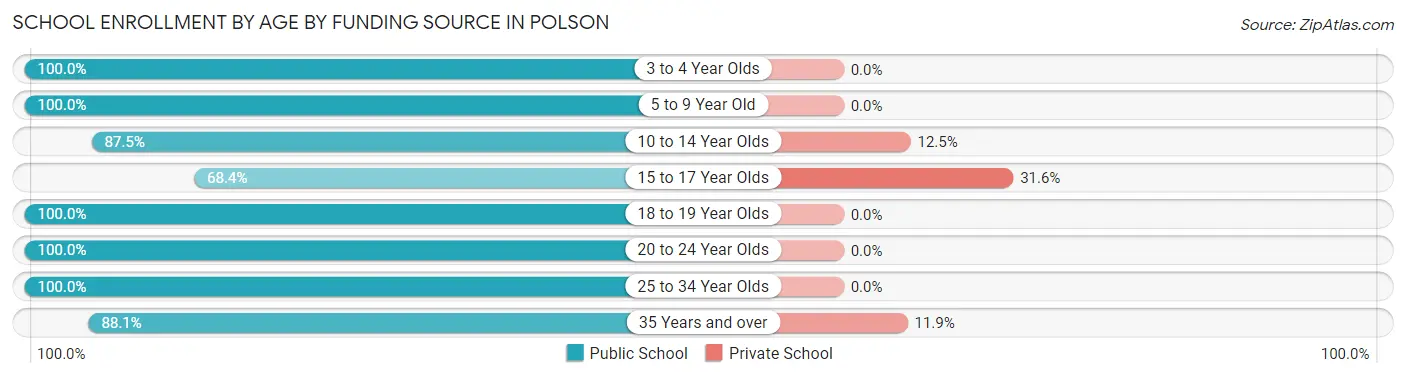
School Enrollment by Age by Funding Source in Polson
Out of a total of 1,030 students who are enrolled in schools in Polson, 84 (8.2%) attend a private institution, while the remaining 946 (91.8%) are enrolled in public schools. The age group of 15 to 17 year olds has the highest likelihood of being enrolled in private schools, with 42 (31.6% in the age bracket) enrolled. Conversely, the age group of 3 to 4 year olds has the lowest likelihood of being enrolled in a private school, with 55 (100.0% in the age bracket) attending a public institution.
| Age Bracket | Public School | Private School |
| 3 to 4 Year Olds | 55 (100.0%) | 0 (0.0%) |
| 5 to 9 Year Old | 249 (100.0%) | 0 (0.0%) |
| 10 to 14 Year Olds | 260 (87.5%) | 37 (12.5%) |
| 15 to 17 Year Olds | 91 (68.4%) | 42 (31.6%) |
| 18 to 19 Year Olds | 56 (100.0%) | 0 (0.0%) |
| 20 to 24 Year Olds | 73 (100.0%) | 0 (0.0%) |
| 25 to 34 Year Olds | 125 (100.0%) | 0 (0.0%) |
| 35 Years and over | 37 (88.1%) | 5 (11.9%) |
| Total | 946 (91.8%) | 84 (8.2%) |
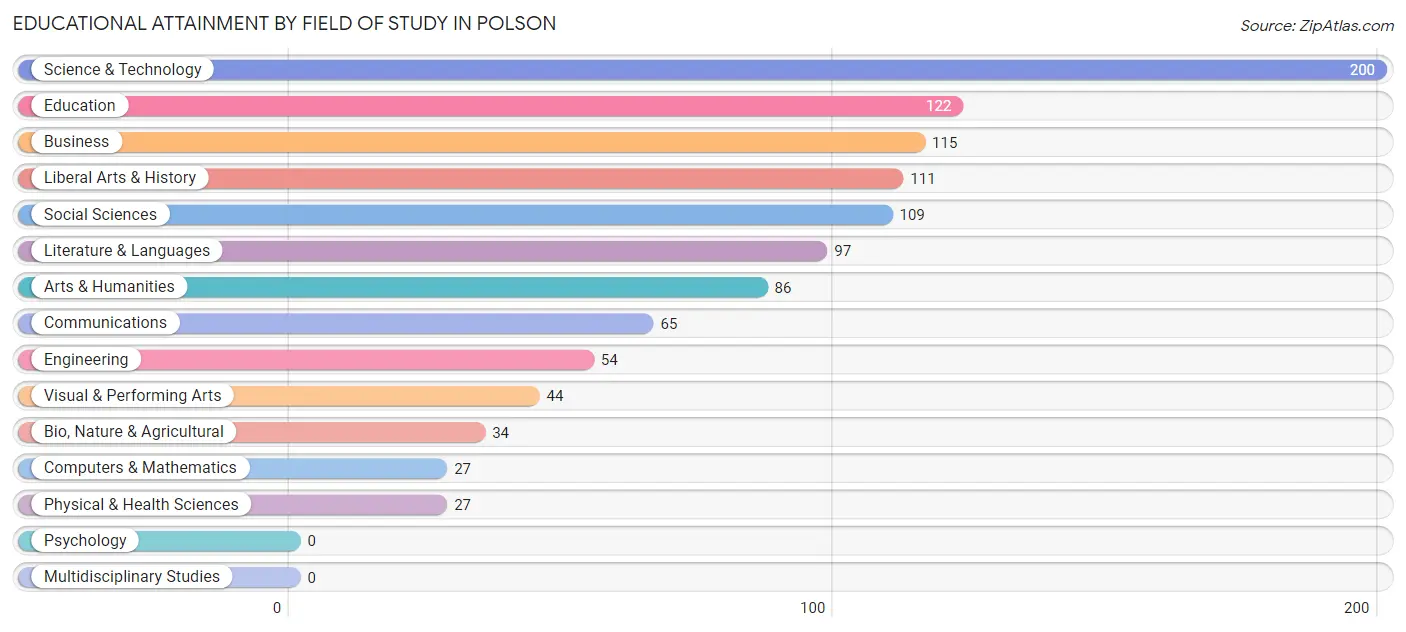
Educational Attainment by Field of Study in Polson
Science & technology (200 | 18.3%), education (122 | 11.2%), business (115 | 10.5%), liberal arts & history (111 | 10.2%), and social sciences (109 | 10.0%) are the most common fields of study among 1,091 individuals in Polson who have obtained a bachelor's degree or higher.
| Field of Study | # Graduates | % Graduates |
| Computers & Mathematics | 27 | 2.5% |
| Bio, Nature & Agricultural | 34 | 3.1% |
| Physical & Health Sciences | 27 | 2.5% |
| Psychology | 0 | 0.0% |
| Social Sciences | 109 | 10.0% |
| Engineering | 54 | 5.0% |
| Multidisciplinary Studies | 0 | 0.0% |
| Science & Technology | 200 | 18.3% |
| Business | 115 | 10.5% |
| Education | 122 | 11.2% |
| Literature & Languages | 97 | 8.9% |
| Liberal Arts & History | 111 | 10.2% |
| Visual & Performing Arts | 44 | 4.0% |
| Communications | 65 | 6.0% |
| Arts & Humanities | 86 | 7.9% |
| Total | 1,091 | 100.0% |
Transportation & Commute in Polson
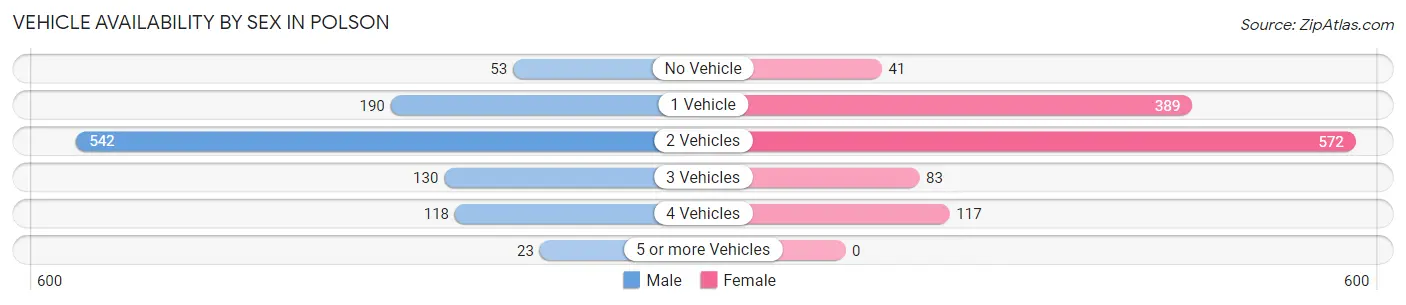
Vehicle Availability by Sex in Polson
The most prevalent vehicle ownership categories in Polson are males with 2 vehicles (542, accounting for 51.3%) and females with 2 vehicles (572, making up 45.1%).
| Vehicles Available | Male | Female |
| No Vehicle | 53 (5.0%) | 41 (3.4%) |
| 1 Vehicle | 190 (18.0%) | 389 (32.4%) |
| 2 Vehicles | 542 (51.3%) | 572 (47.6%) |
| 3 Vehicles | 130 (12.3%) | 83 (6.9%) |
| 4 Vehicles | 118 (11.2%) | 117 (9.7%) |
| 5 or more Vehicles | 23 (2.2%) | 0 (0.0%) |
| Total | 1,056 (100.0%) | 1,202 (100.0%) |
Commute Time in Polson
The most frequently occuring commute durations in Polson are 5 to 9 minutes (613 commuters, 27.4%), 10 to 14 minutes (525 commuters, 23.4%), and 15 to 19 minutes (293 commuters, 13.1%).
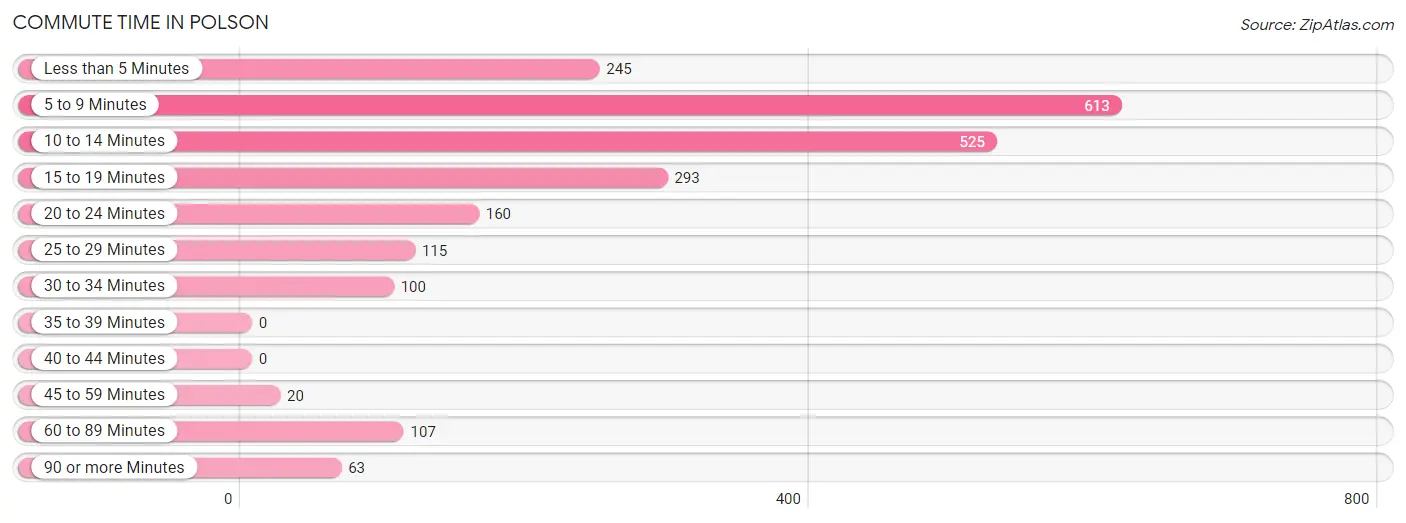
| Commute Time | # Commuters | % Commuters |
| Less than 5 Minutes | 245 | 10.9% |
| 5 to 9 Minutes | 613 | 27.4% |
| 10 to 14 Minutes | 525 | 23.4% |
| 15 to 19 Minutes | 293 | 13.1% |
| 20 to 24 Minutes | 160 | 7.1% |
| 25 to 29 Minutes | 115 | 5.1% |
| 30 to 34 Minutes | 100 | 4.5% |
| 35 to 39 Minutes | 0 | 0.0% |
| 40 to 44 Minutes | 0 | 0.0% |
| 45 to 59 Minutes | 20 | 0.9% |
| 60 to 89 Minutes | 107 | 4.8% |
| 90 or more Minutes | 63 | 2.8% |
Commute Time by Sex in Polson
The most common commute times in Polson are 5 to 9 minutes (259 commuters, 24.7%) for males and 5 to 9 minutes (354 commuters, 29.7%) for females.
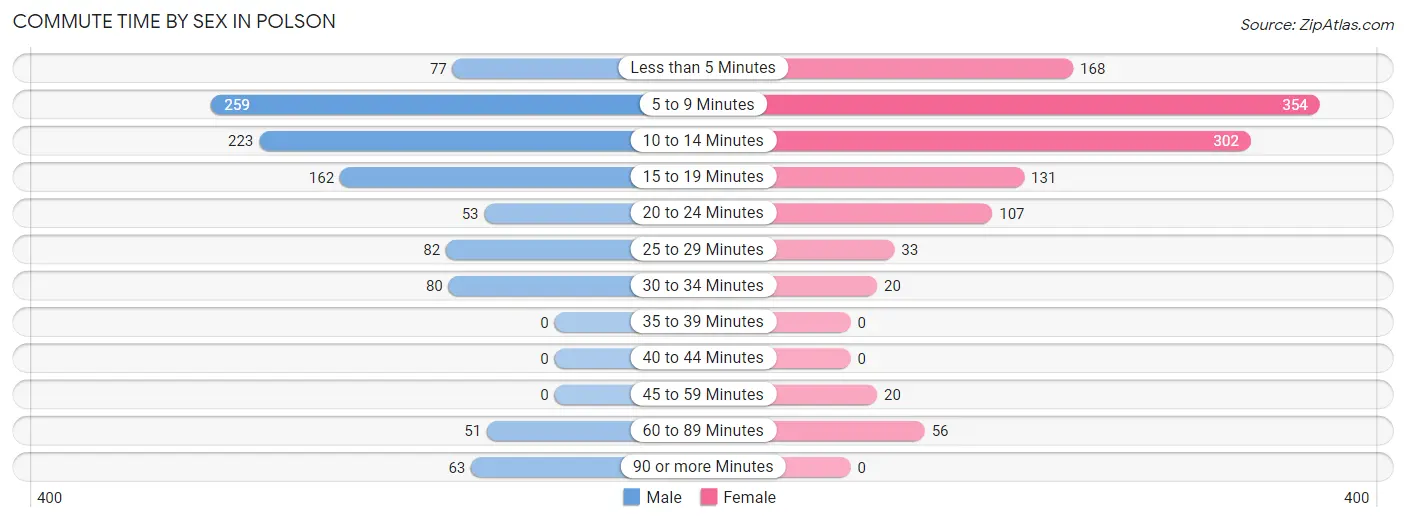
| Commute Time | Male | Female |
| Less than 5 Minutes | 77 (7.3%) | 168 (14.1%) |
| 5 to 9 Minutes | 259 (24.7%) | 354 (29.7%) |
| 10 to 14 Minutes | 223 (21.2%) | 302 (25.4%) |
| 15 to 19 Minutes | 162 (15.4%) | 131 (11.0%) |
| 20 to 24 Minutes | 53 (5.1%) | 107 (9.0%) |
| 25 to 29 Minutes | 82 (7.8%) | 33 (2.8%) |
| 30 to 34 Minutes | 80 (7.6%) | 20 (1.7%) |
| 35 to 39 Minutes | 0 (0.0%) | 0 (0.0%) |
| 40 to 44 Minutes | 0 (0.0%) | 0 (0.0%) |
| 45 to 59 Minutes | 0 (0.0%) | 20 (1.7%) |
| 60 to 89 Minutes | 51 (4.9%) | 56 (4.7%) |
| 90 or more Minutes | 63 (6.0%) | 0 (0.0%) |
Time of Departure to Work by Sex in Polson
The most frequent times of departure to work in Polson are 7:30 AM to 7:59 AM (229, 21.8%) for males and 7:30 AM to 7:59 AM (286, 24.0%) for females.
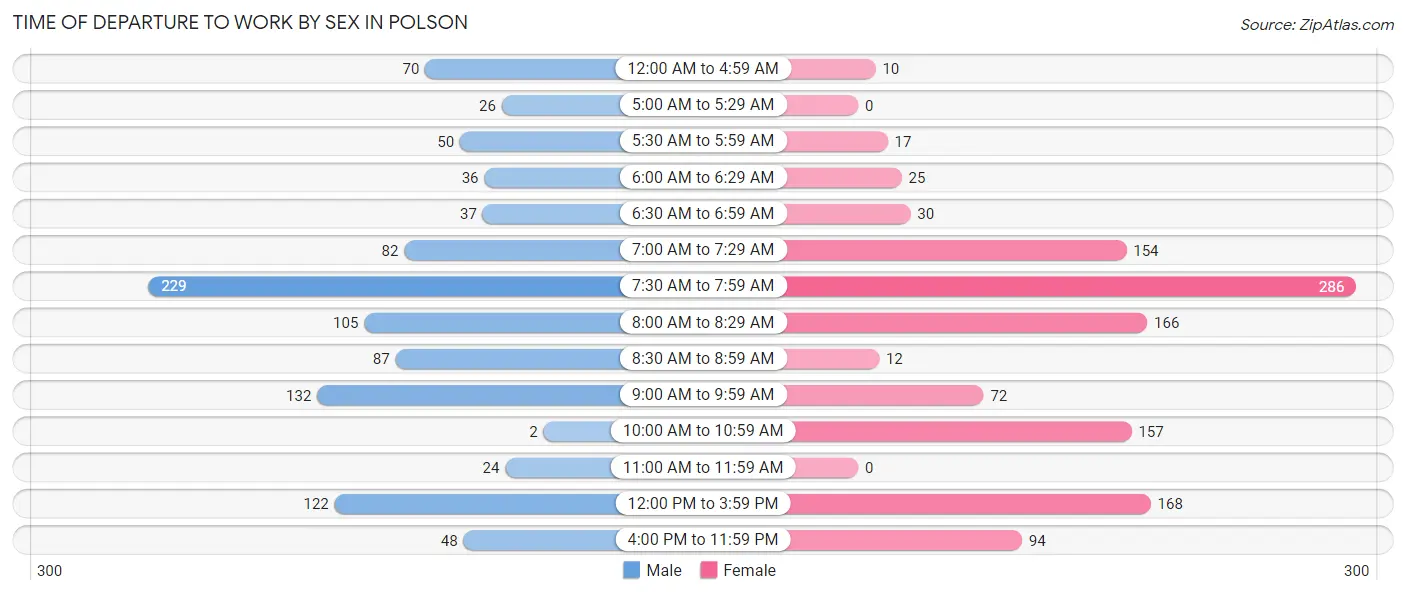
| Time of Departure | Male | Female |
| 12:00 AM to 4:59 AM | 70 (6.7%) | 10 (0.8%) |
| 5:00 AM to 5:29 AM | 26 (2.5%) | 0 (0.0%) |
| 5:30 AM to 5:59 AM | 50 (4.8%) | 17 (1.4%) |
| 6:00 AM to 6:29 AM | 36 (3.4%) | 25 (2.1%) |
| 6:30 AM to 6:59 AM | 37 (3.5%) | 30 (2.5%) |
| 7:00 AM to 7:29 AM | 82 (7.8%) | 154 (12.9%) |
| 7:30 AM to 7:59 AM | 229 (21.8%) | 286 (24.0%) |
| 8:00 AM to 8:29 AM | 105 (10.0%) | 166 (13.9%) |
| 8:30 AM to 8:59 AM | 87 (8.3%) | 12 (1.0%) |
| 9:00 AM to 9:59 AM | 132 (12.6%) | 72 (6.0%) |
| 10:00 AM to 10:59 AM | 2 (0.2%) | 157 (13.2%) |
| 11:00 AM to 11:59 AM | 24 (2.3%) | 0 (0.0%) |
| 12:00 PM to 3:59 PM | 122 (11.6%) | 168 (14.1%) |
| 4:00 PM to 11:59 PM | 48 (4.6%) | 94 (7.9%) |
| Total | 1,050 (100.0%) | 1,191 (100.0%) |
Housing Occupancy in Polson
Occupancy by Ownership in Polson
Of the total 2,231 dwellings in Polson, owner-occupied units account for 1,109 (49.7%), while renter-occupied units make up 1,122 (50.3%).
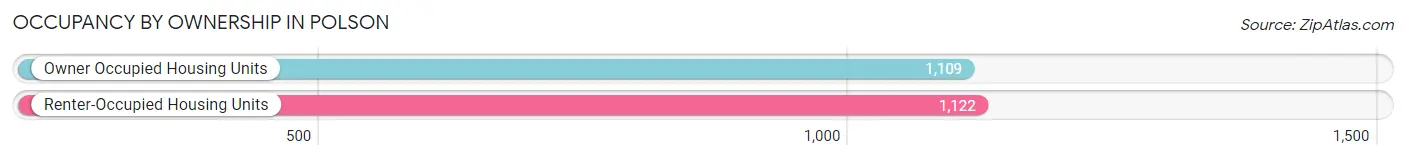
| Occupancy | # Housing Units | % Housing Units |
| Owner Occupied Housing Units | 1,109 | 49.7% |
| Renter-Occupied Housing Units | 1,122 | 50.3% |
| Total Occupied Housing Units | 2,231 | 100.0% |
Occupancy by Household Size in Polson
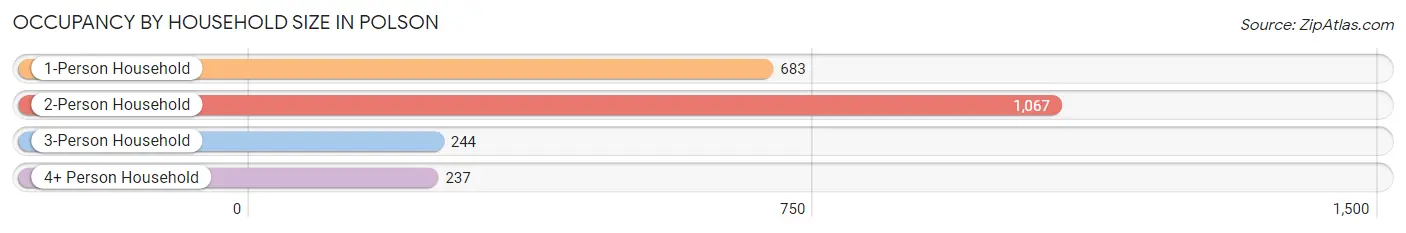
| Household Size | # Housing Units | % Housing Units |
| 1-Person Household | 683 | 30.6% |
| 2-Person Household | 1,067 | 47.8% |
| 3-Person Household | 244 | 10.9% |
| 4+ Person Household | 237 | 10.6% |
| Total Housing Units | 2,231 | 100.0% |
Occupancy by Ownership by Household Size in Polson
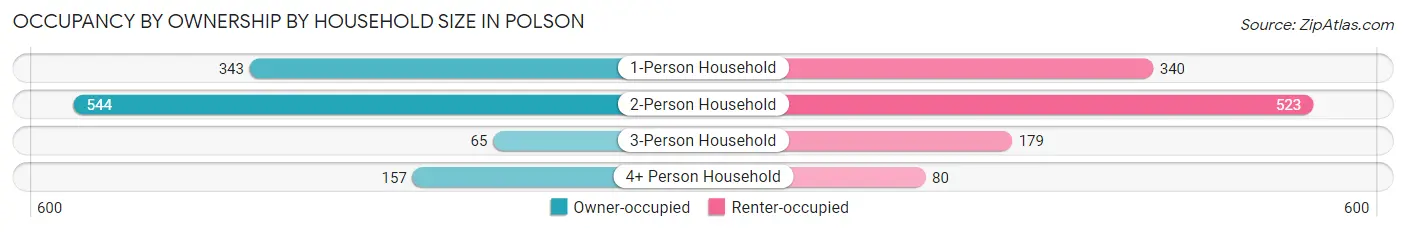
| Household Size | Owner-occupied | Renter-occupied |
| 1-Person Household | 343 (50.2%) | 340 (49.8%) |
| 2-Person Household | 544 (51.0%) | 523 (49.0%) |
| 3-Person Household | 65 (26.6%) | 179 (73.4%) |
| 4+ Person Household | 157 (66.2%) | 80 (33.8%) |
| Total Housing Units | 1,109 (49.7%) | 1,122 (50.3%) |
Occupancy by Educational Attainment in Polson
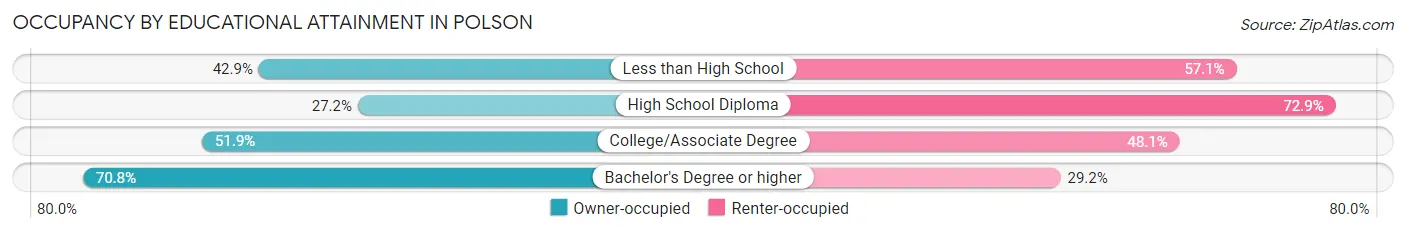
| Household Size | Owner-occupied | Renter-occupied |
| Less than High School | 90 (42.9%) | 120 (57.1%) |
| High School Diploma | 174 (27.2%) | 467 (72.9%) |
| College/Associate Degree | 361 (51.9%) | 335 (48.1%) |
| Bachelor's Degree or higher | 484 (70.8%) | 200 (29.2%) |
Occupancy by Age of Householder in Polson
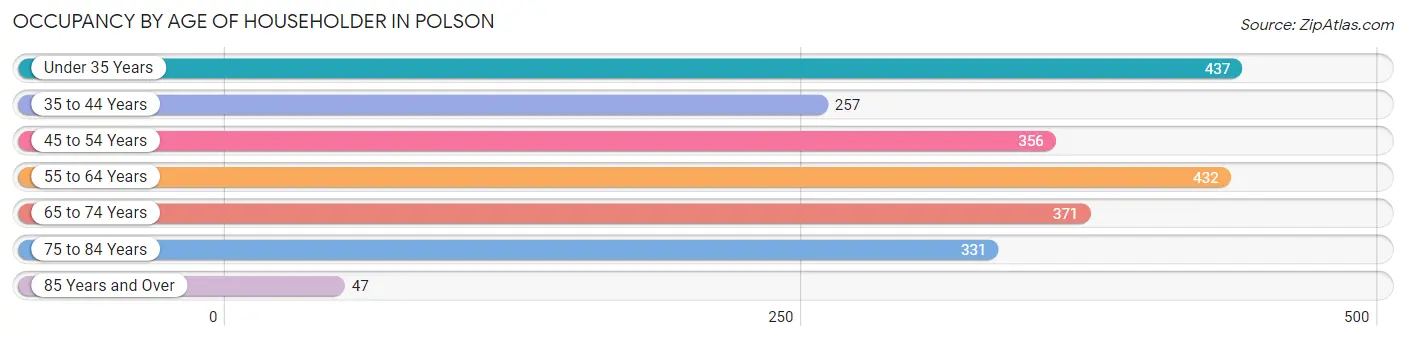
| Age Bracket | # Households | % Households |
| Under 35 Years | 437 | 19.6% |
| 35 to 44 Years | 257 | 11.5% |
| 45 to 54 Years | 356 | 16.0% |
| 55 to 64 Years | 432 | 19.4% |
| 65 to 74 Years | 371 | 16.6% |
| 75 to 84 Years | 331 | 14.8% |
| 85 Years and Over | 47 | 2.1% |
| Total | 2,231 | 100.0% |
Housing Finances in Polson
Median Income by Occupancy in Polson
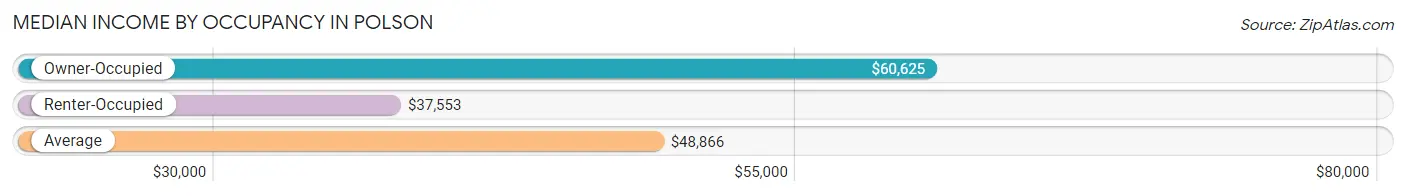
| Occupancy Type | # Households | Median Income |
| Owner-Occupied | 1,109 (49.7%) | $60,625 |
| Renter-Occupied | 1,122 (50.3%) | $37,553 |
| Average | 2,231 (100.0%) | $48,866 |
Occupancy by Householder Income Bracket in Polson
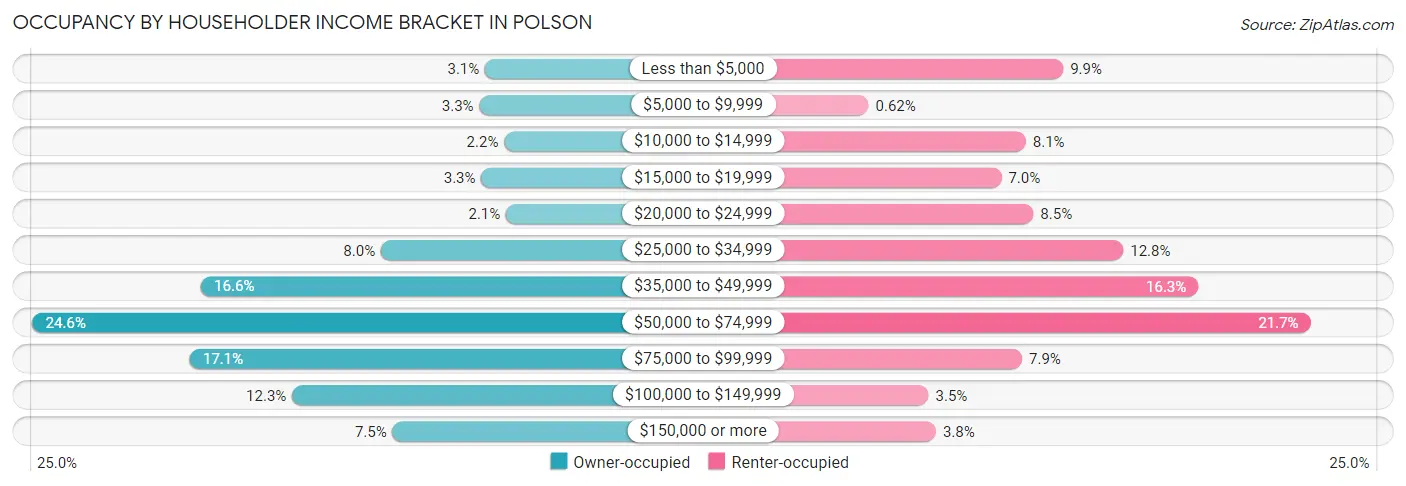
| Income Bracket | Owner-occupied | Renter-occupied |
| Less than $5,000 | 34 (3.1%) | 111 (9.9%) |
| $5,000 to $9,999 | 37 (3.3%) | 7 (0.6%) |
| $10,000 to $14,999 | 24 (2.2%) | 91 (8.1%) |
| $15,000 to $19,999 | 36 (3.3%) | 78 (7.0%) |
| $20,000 to $24,999 | 23 (2.1%) | 95 (8.5%) |
| $25,000 to $34,999 | 89 (8.0%) | 143 (12.8%) |
| $35,000 to $49,999 | 184 (16.6%) | 183 (16.3%) |
| $50,000 to $74,999 | 273 (24.6%) | 243 (21.7%) |
| $75,000 to $99,999 | 190 (17.1%) | 89 (7.9%) |
| $100,000 to $149,999 | 136 (12.3%) | 39 (3.5%) |
| $150,000 or more | 83 (7.5%) | 43 (3.8%) |
| Total | 1,109 (100.0%) | 1,122 (100.0%) |
Monthly Housing Cost Tiers in Polson
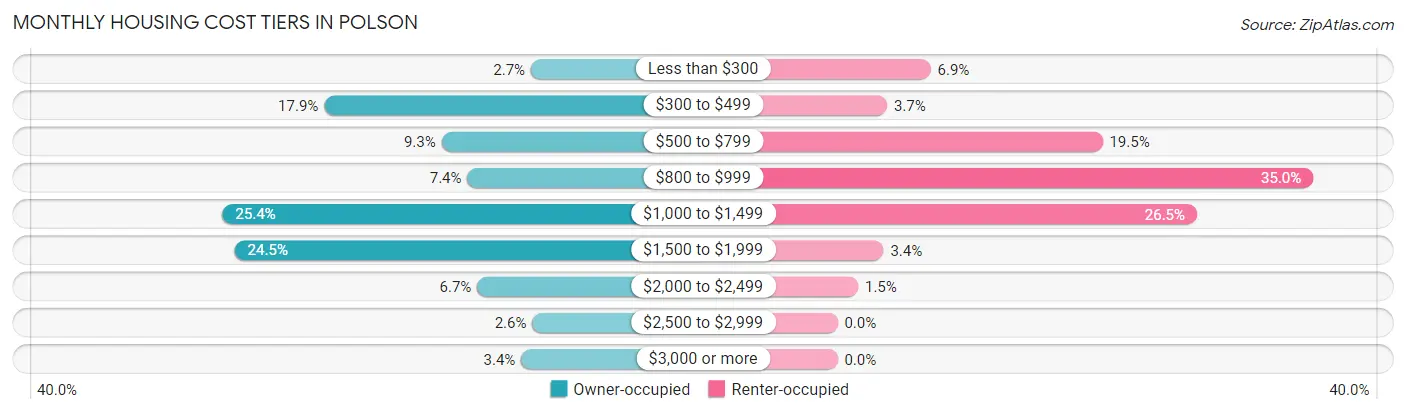
| Monthly Cost | Owner-occupied | Renter-occupied |
| Less than $300 | 30 (2.7%) | 77 (6.9%) |
| $300 to $499 | 199 (17.9%) | 41 (3.6%) |
| $500 to $799 | 103 (9.3%) | 219 (19.5%) |
| $800 to $999 | 82 (7.4%) | 393 (35.0%) |
| $1,000 to $1,499 | 282 (25.4%) | 297 (26.5%) |
| $1,500 to $1,999 | 272 (24.5%) | 38 (3.4%) |
| $2,000 to $2,499 | 74 (6.7%) | 17 (1.5%) |
| $2,500 to $2,999 | 29 (2.6%) | 0 (0.0%) |
| $3,000 or more | 38 (3.4%) | 0 (0.0%) |
| Total | 1,109 (100.0%) | 1,122 (100.0%) |
Physical Housing Characteristics in Polson
Housing Structures in Polson
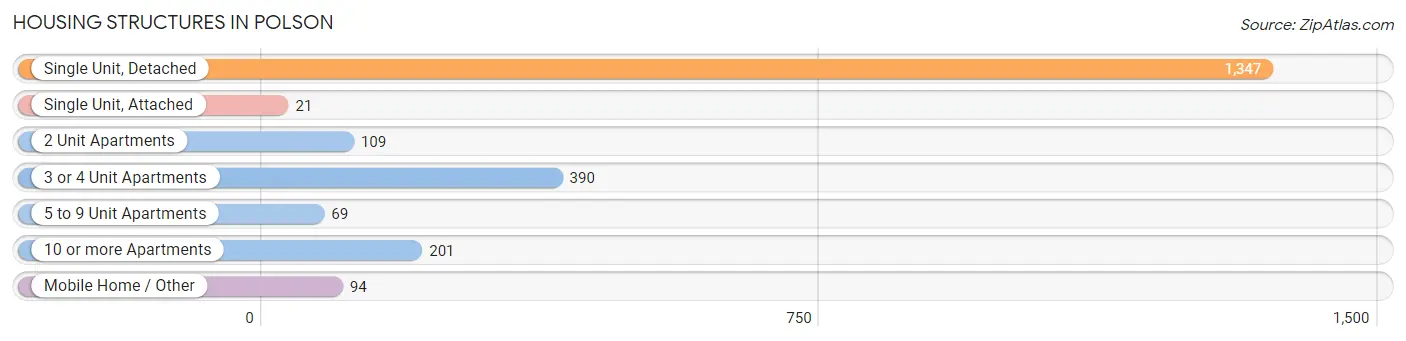
| Structure Type | # Housing Units | % Housing Units |
| Single Unit, Detached | 1,347 | 60.4% |
| Single Unit, Attached | 21 | 0.9% |
| 2 Unit Apartments | 109 | 4.9% |
| 3 or 4 Unit Apartments | 390 | 17.5% |
| 5 to 9 Unit Apartments | 69 | 3.1% |
| 10 or more Apartments | 201 | 9.0% |
| Mobile Home / Other | 94 | 4.2% |
| Total | 2,231 | 100.0% |
Housing Structures by Occupancy in Polson
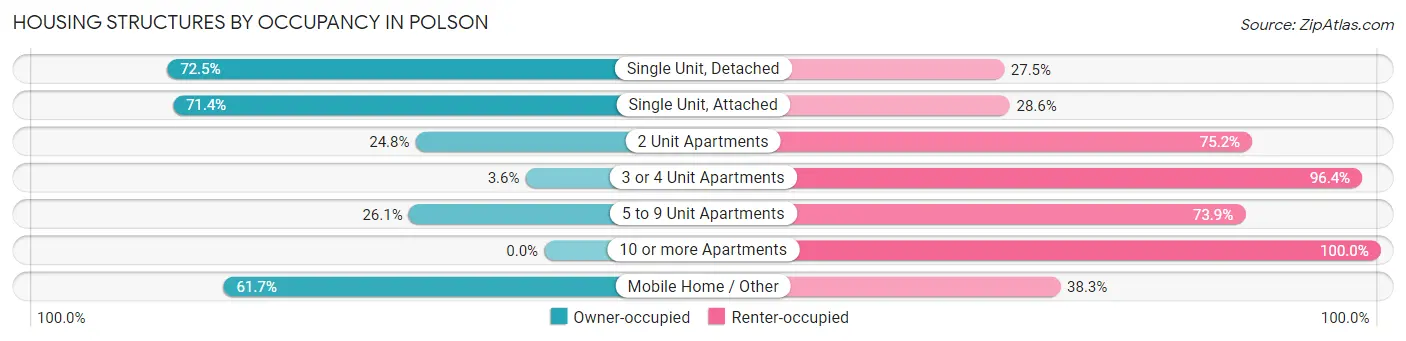
| Structure Type | Owner-occupied | Renter-occupied |
| Single Unit, Detached | 977 (72.5%) | 370 (27.5%) |
| Single Unit, Attached | 15 (71.4%) | 6 (28.6%) |
| 2 Unit Apartments | 27 (24.8%) | 82 (75.2%) |
| 3 or 4 Unit Apartments | 14 (3.6%) | 376 (96.4%) |
| 5 to 9 Unit Apartments | 18 (26.1%) | 51 (73.9%) |
| 10 or more Apartments | 0 (0.0%) | 201 (100.0%) |
| Mobile Home / Other | 58 (61.7%) | 36 (38.3%) |
| Total | 1,109 (49.7%) | 1,122 (50.3%) |
Housing Structures by Number of Rooms in Polson
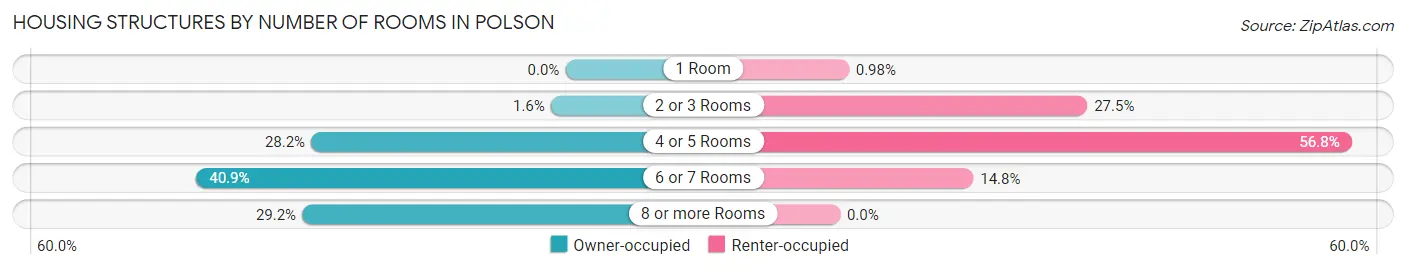
| Number of Rooms | Owner-occupied | Renter-occupied |
| 1 Room | 0 (0.0%) | 11 (1.0%) |
| 2 or 3 Rooms | 18 (1.6%) | 308 (27.5%) |
| 4 or 5 Rooms | 313 (28.2%) | 637 (56.8%) |
| 6 or 7 Rooms | 454 (40.9%) | 166 (14.8%) |
| 8 or more Rooms | 324 (29.2%) | 0 (0.0%) |
| Total | 1,109 (100.0%) | 1,122 (100.0%) |
Housing Structure by Heating Type in Polson
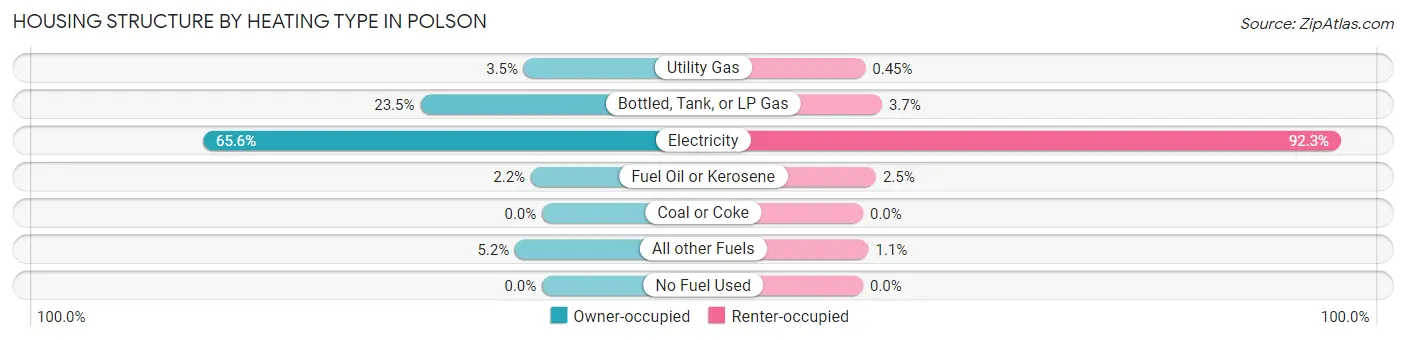
| Heating Type | Owner-occupied | Renter-occupied |
| Utility Gas | 39 (3.5%) | 5 (0.4%) |
| Bottled, Tank, or LP Gas | 261 (23.5%) | 41 (3.6%) |
| Electricity | 727 (65.5%) | 1,036 (92.3%) |
| Fuel Oil or Kerosene | 24 (2.2%) | 28 (2.5%) |
| Coal or Coke | 0 (0.0%) | 0 (0.0%) |
| All other Fuels | 58 (5.2%) | 12 (1.1%) |
| No Fuel Used | 0 (0.0%) | 0 (0.0%) |
| Total | 1,109 (100.0%) | 1,122 (100.0%) |
Household Vehicle Usage in Polson
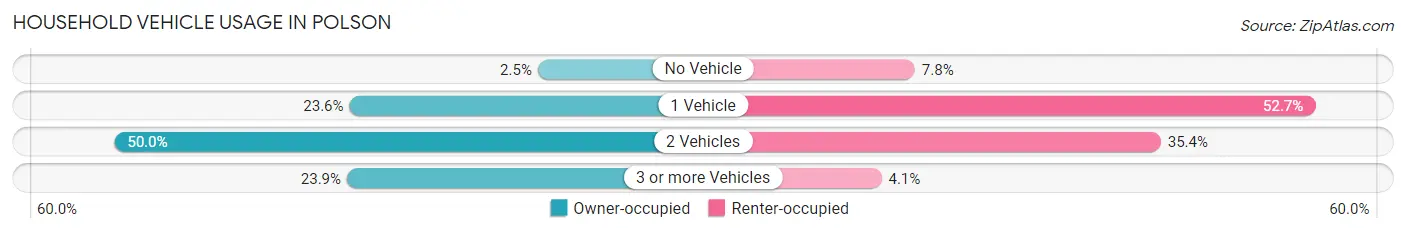
| Vehicles per Household | Owner-occupied | Renter-occupied |
| No Vehicle | 28 (2.5%) | 88 (7.8%) |
| 1 Vehicle | 262 (23.6%) | 591 (52.7%) |
| 2 Vehicles | 554 (49.9%) | 397 (35.4%) |
| 3 or more Vehicles | 265 (23.9%) | 46 (4.1%) |
| Total | 1,109 (100.0%) | 1,122 (100.0%) |
Real Estate & Mortgages in Polson
Real Estate and Mortgage Overview in Polson
| Characteristic | Without Mortgage | With Mortgage |
| Housing Units | 366 | 743 |
| Median Property Value | $249,300 | $293,200 |
| Median Household Income | $40,769 | $66 |
| Monthly Housing Costs | $470 | $38 |
| Real Estate Taxes | $1,699 | $0 |
Property Value by Mortgage Status in Polson
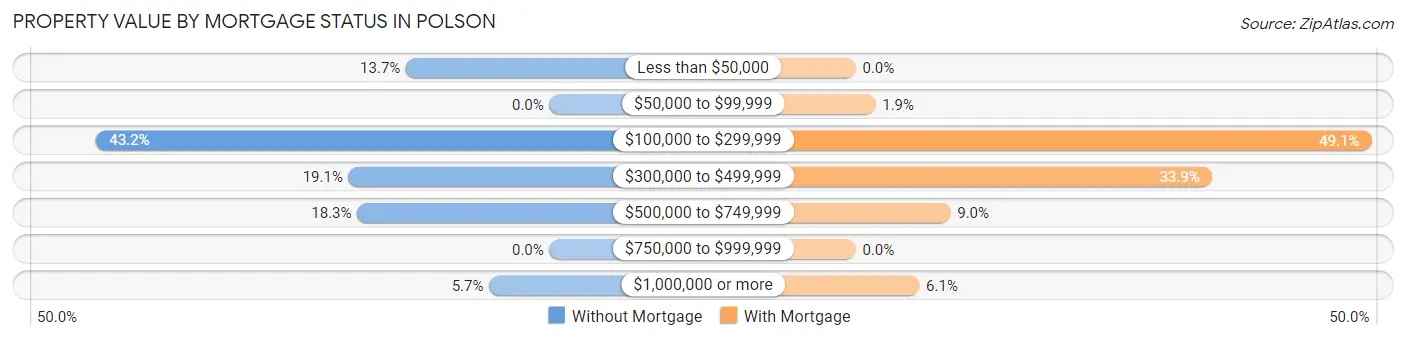
| Property Value | Without Mortgage | With Mortgage |
| Less than $50,000 | 50 (13.7%) | 0 (0.0%) |
| $50,000 to $99,999 | 0 (0.0%) | 14 (1.9%) |
| $100,000 to $299,999 | 158 (43.2%) | 365 (49.1%) |
| $300,000 to $499,999 | 70 (19.1%) | 252 (33.9%) |
| $500,000 to $749,999 | 67 (18.3%) | 67 (9.0%) |
| $750,000 to $999,999 | 0 (0.0%) | 0 (0.0%) |
| $1,000,000 or more | 21 (5.7%) | 45 (6.1%) |
| Total | 366 (100.0%) | 743 (100.0%) |
Household Income by Mortgage Status in Polson
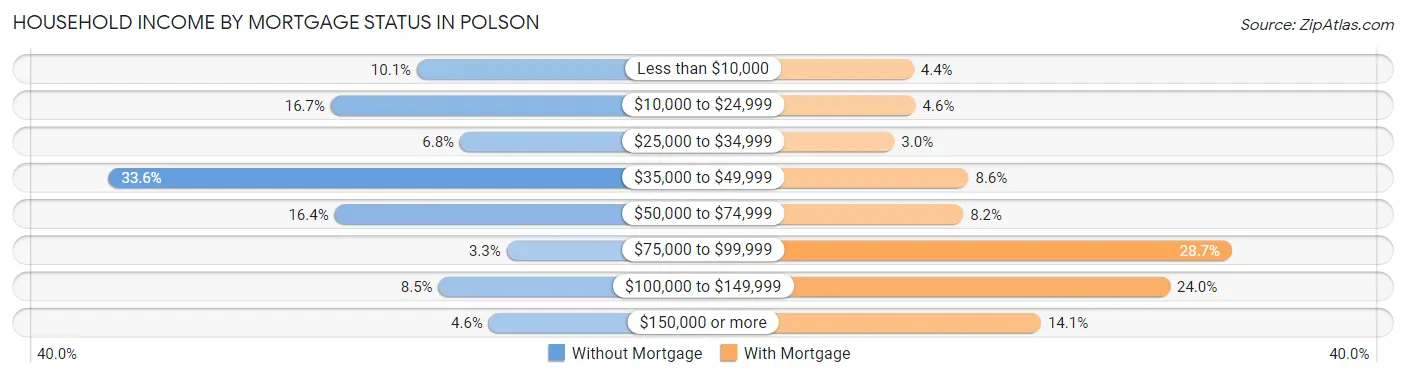
| Household Income | Without Mortgage | With Mortgage |
| Less than $10,000 | 37 (10.1%) | 33 (4.4%) |
| $10,000 to $24,999 | 61 (16.7%) | 34 (4.6%) |
| $25,000 to $34,999 | 25 (6.8%) | 22 (3.0%) |
| $35,000 to $49,999 | 123 (33.6%) | 64 (8.6%) |
| $50,000 to $74,999 | 60 (16.4%) | 61 (8.2%) |
| $75,000 to $99,999 | 12 (3.3%) | 213 (28.7%) |
| $100,000 to $149,999 | 31 (8.5%) | 178 (24.0%) |
| $150,000 or more | 17 (4.6%) | 105 (14.1%) |
| Total | 366 (100.0%) | 743 (100.0%) |
Property Value to Household Income Ratio in Polson
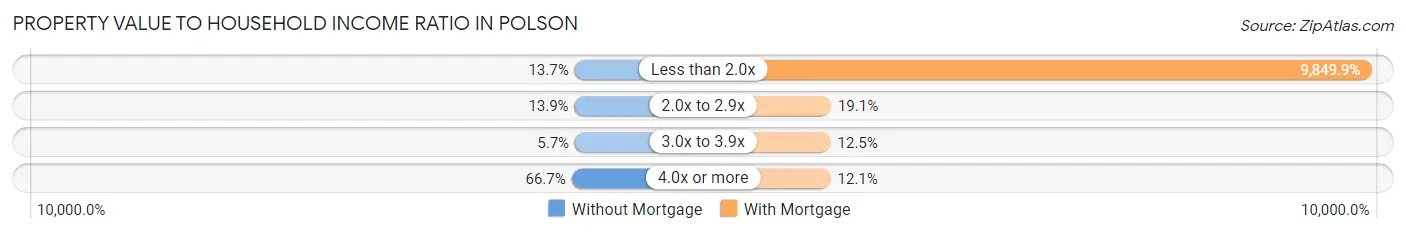
| Value-to-Income Ratio | Without Mortgage | With Mortgage |
| Less than 2.0x | 50 (13.7%) | 73,185 (9,849.9%) |
| 2.0x to 2.9x | 51 (13.9%) | 142 (19.1%) |
| 3.0x to 3.9x | 21 (5.7%) | 93 (12.5%) |
| 4.0x or more | 244 (66.7%) | 90 (12.1%) |
| Total | 366 (100.0%) | 743 (100.0%) |
Real Estate Taxes by Mortgage Status in Polson
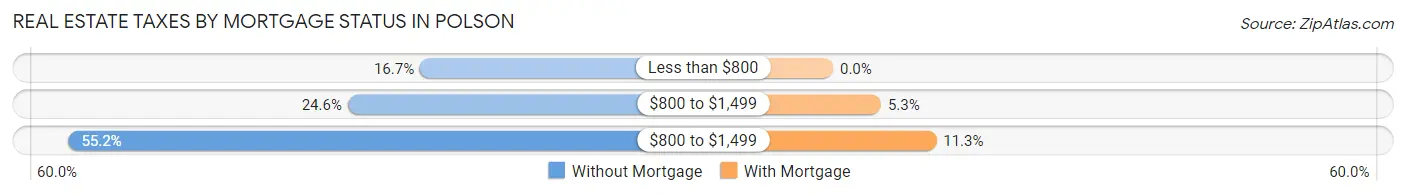
| Property Taxes | Without Mortgage | With Mortgage |
| Less than $800 | 61 (16.7%) | 0 (0.0%) |
| $800 to $1,499 | 90 (24.6%) | 39 (5.2%) |
| $800 to $1,499 | 202 (55.2%) | 84 (11.3%) |
| Total | 366 (100.0%) | 743 (100.0%) |
Health & Disability in Polson
Health Insurance Coverage by Age in Polson
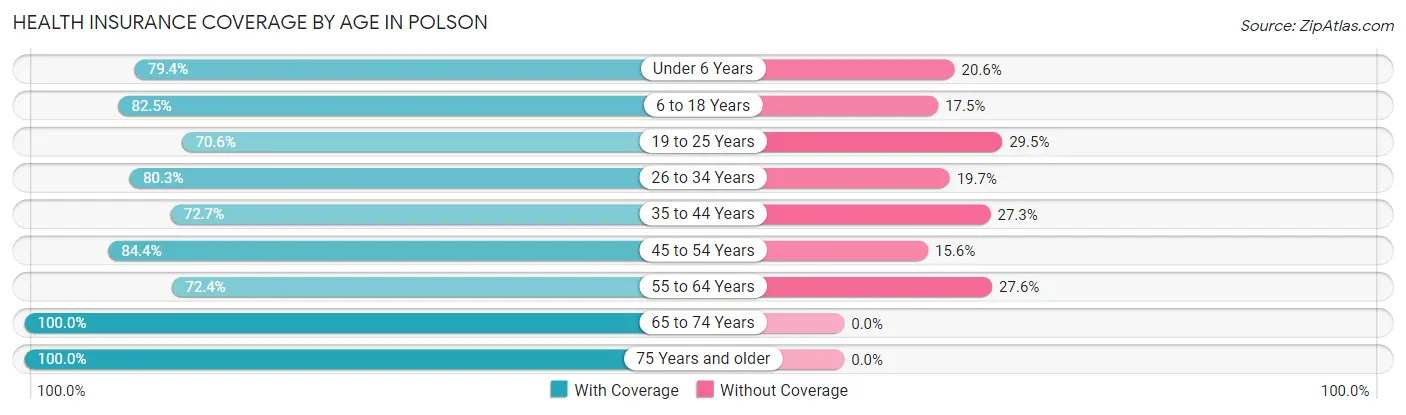
| Age Bracket | With Coverage | Without Coverage |
| Under 6 Years | 251 (79.4%) | 65 (20.6%) |
| 6 to 18 Years | 650 (82.5%) | 138 (17.5%) |
| 19 to 25 Years | 321 (70.6%) | 134 (29.4%) |
| 26 to 34 Years | 421 (80.3%) | 103 (19.7%) |
| 35 to 44 Years | 288 (72.7%) | 108 (27.3%) |
| 45 to 54 Years | 540 (84.4%) | 100 (15.6%) |
| 55 to 64 Years | 591 (72.4%) | 225 (27.6%) |
| 65 to 74 Years | 667 (100.0%) | 0 (0.0%) |
| 75 Years and older | 509 (100.0%) | 0 (0.0%) |
| Total | 4,238 (82.9%) | 873 (17.1%) |
Health Insurance Coverage by Citizenship Status in Polson
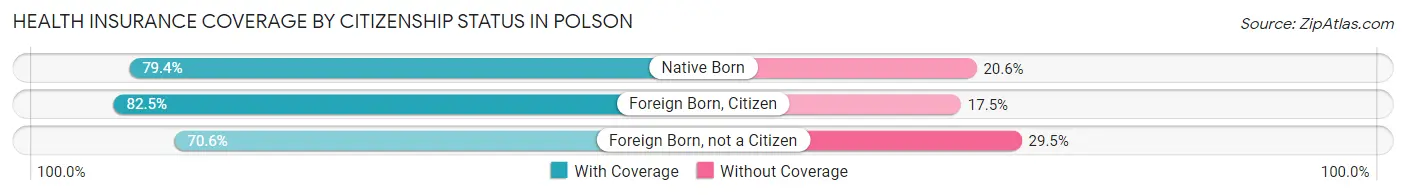
| Citizenship Status | With Coverage | Without Coverage |
| Native Born | 251 (79.4%) | 65 (20.6%) |
| Foreign Born, Citizen | 650 (82.5%) | 138 (17.5%) |
| Foreign Born, not a Citizen | 321 (70.6%) | 134 (29.4%) |
Health Insurance Coverage by Household Income in Polson
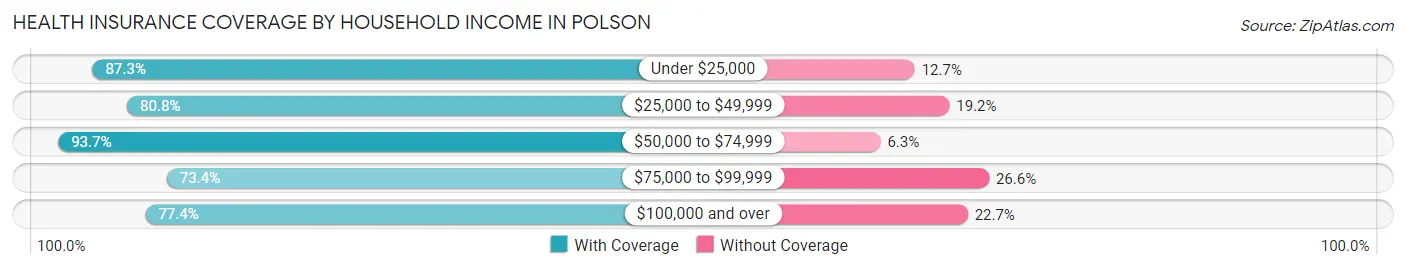
| Household Income | With Coverage | Without Coverage |
| Under $25,000 | 857 (87.3%) | 125 (12.7%) |
| $25,000 to $49,999 | 916 (80.8%) | 218 (19.2%) |
| $50,000 to $74,999 | 980 (93.7%) | 66 (6.3%) |
| $75,000 to $99,999 | 482 (73.4%) | 175 (26.6%) |
| $100,000 and over | 987 (77.3%) | 289 (22.7%) |
Public vs Private Health Insurance Coverage by Age in Polson
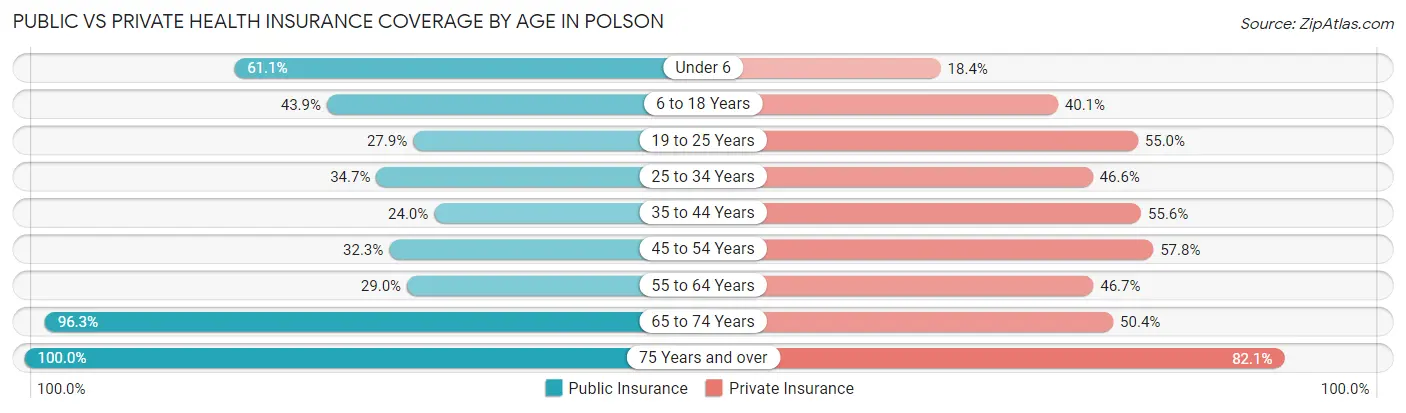
| Age Bracket | Public Insurance | Private Insurance |
| Under 6 | 193 (61.1%) | 58 (18.3%) |
| 6 to 18 Years | 346 (43.9%) | 316 (40.1%) |
| 19 to 25 Years | 127 (27.9%) | 250 (54.9%) |
| 25 to 34 Years | 182 (34.7%) | 244 (46.6%) |
| 35 to 44 Years | 95 (24.0%) | 220 (55.6%) |
| 45 to 54 Years | 207 (32.3%) | 370 (57.8%) |
| 55 to 64 Years | 237 (29.0%) | 381 (46.7%) |
| 65 to 74 Years | 642 (96.3%) | 336 (50.4%) |
| 75 Years and over | 509 (100.0%) | 418 (82.1%) |
| Total | 2,538 (49.7%) | 2,593 (50.7%) |
Disability Status by Sex by Age in Polson
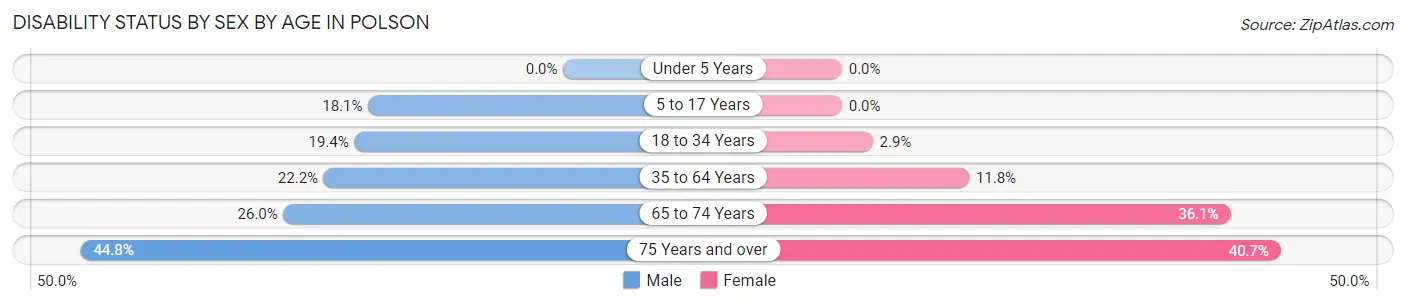
| Age Bracket | Male | Female |
| Under 5 Years | 0 (0.0%) | 0 (0.0%) |
| 5 to 17 Years | 76 (18.1%) | 0 (0.0%) |
| 18 to 34 Years | 105 (19.4%) | 15 (2.9%) |
| 35 to 64 Years | 178 (22.2%) | 124 (11.8%) |
| 65 to 74 Years | 81 (26.0%) | 128 (36.1%) |
| 75 Years and over | 95 (44.8%) | 121 (40.7%) |
Disability Class by Sex by Age in Polson
Disability Class: Hearing Difficulty
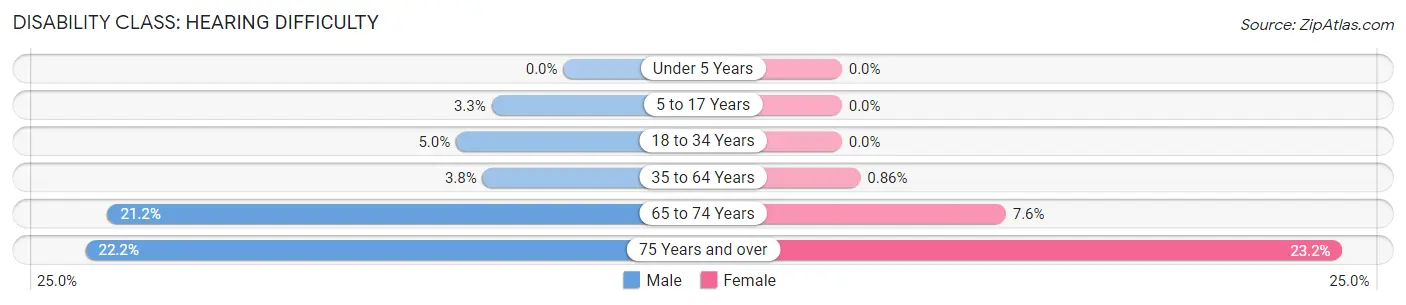
| Age Bracket | Male | Female |
| Under 5 Years | 0 (0.0%) | 0 (0.0%) |
| 5 to 17 Years | 14 (3.3%) | 0 (0.0%) |
| 18 to 34 Years | 27 (5.0%) | 0 (0.0%) |
| 35 to 64 Years | 30 (3.7%) | 9 (0.9%) |
| 65 to 74 Years | 66 (21.1%) | 27 (7.6%) |
| 75 Years and over | 47 (22.2%) | 69 (23.2%) |
Disability Class: Vision Difficulty
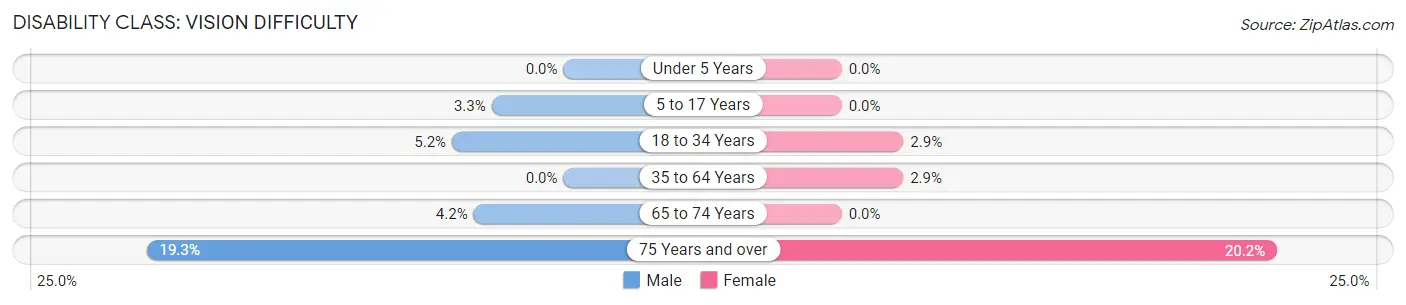
| Age Bracket | Male | Female |
| Under 5 Years | 0 (0.0%) | 0 (0.0%) |
| 5 to 17 Years | 14 (3.3%) | 0 (0.0%) |
| 18 to 34 Years | 28 (5.2%) | 15 (2.9%) |
| 35 to 64 Years | 0 (0.0%) | 30 (2.9%) |
| 65 to 74 Years | 13 (4.2%) | 0 (0.0%) |
| 75 Years and over | 41 (19.3%) | 60 (20.2%) |
Disability Class: Cognitive Difficulty
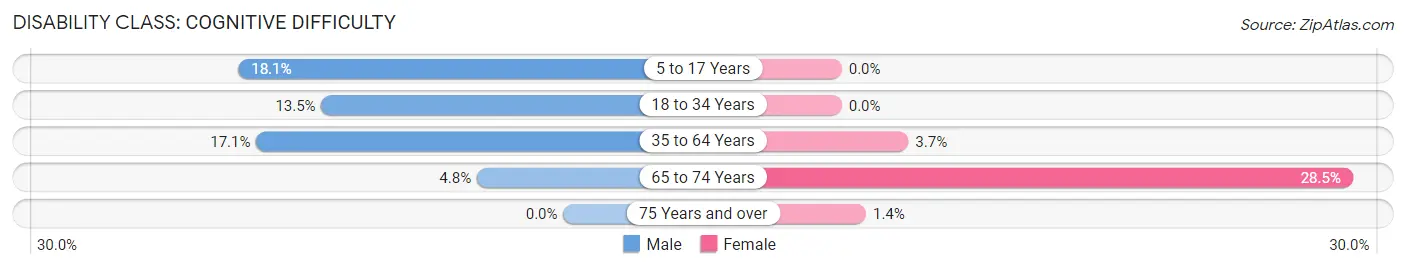
| Age Bracket | Male | Female |
| 5 to 17 Years | 76 (18.1%) | 0 (0.0%) |
| 18 to 34 Years | 73 (13.5%) | 0 (0.0%) |
| 35 to 64 Years | 137 (17.1%) | 39 (3.7%) |
| 65 to 74 Years | 15 (4.8%) | 101 (28.4%) |
| 75 Years and over | 0 (0.0%) | 4 (1.3%) |
Disability Class: Ambulatory Difficulty

| Age Bracket | Male | Female |
| 5 to 17 Years | 14 (3.3%) | 0 (0.0%) |
| 18 to 34 Years | 0 (0.0%) | 0 (0.0%) |
| 35 to 64 Years | 48 (6.0%) | 109 (10.4%) |
| 65 to 74 Years | 15 (4.8%) | 101 (28.4%) |
| 75 Years and over | 11 (5.2%) | 75 (25.3%) |
Disability Class: Self-Care Difficulty
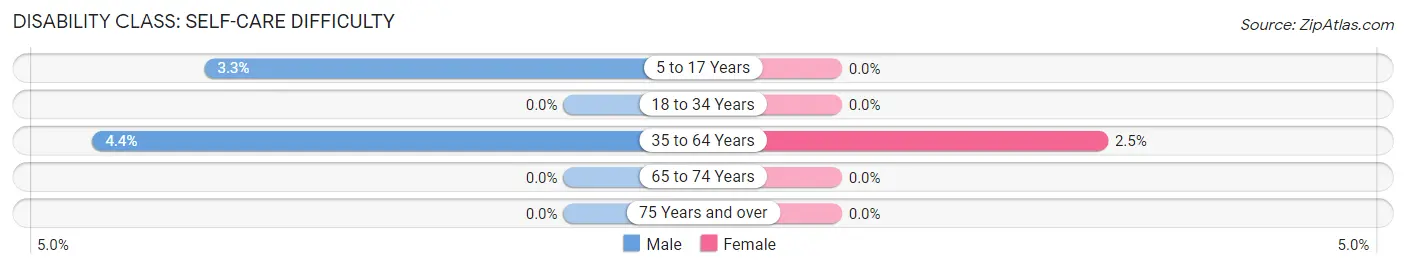
| Age Bracket | Male | Female |
| 5 to 17 Years | 14 (3.3%) | 0 (0.0%) |
| 18 to 34 Years | 0 (0.0%) | 0 (0.0%) |
| 35 to 64 Years | 35 (4.4%) | 26 (2.5%) |
| 65 to 74 Years | 0 (0.0%) | 0 (0.0%) |
| 75 Years and over | 0 (0.0%) | 0 (0.0%) |
Technology Access in Polson
Computing Device Access in Polson
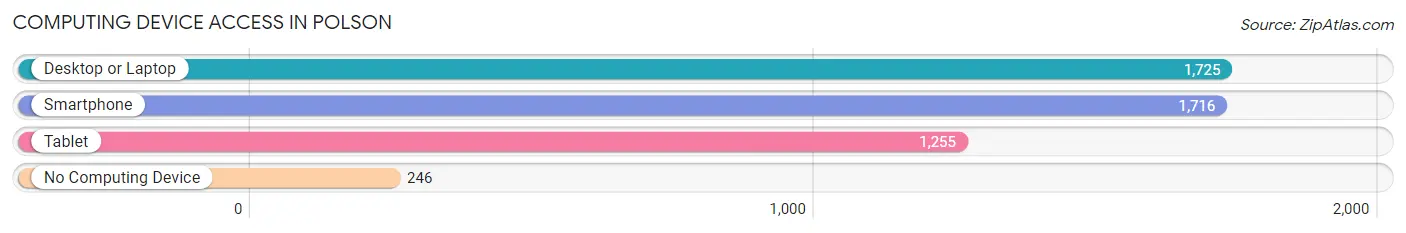
| Device Type | # Households | % Households |
| Desktop or Laptop | 1,725 | 77.3% |
| Smartphone | 1,716 | 76.9% |
| Tablet | 1,255 | 56.2% |
| No Computing Device | 246 | 11.0% |
| Total | 2,231 | 100.0% |
Internet Access in Polson
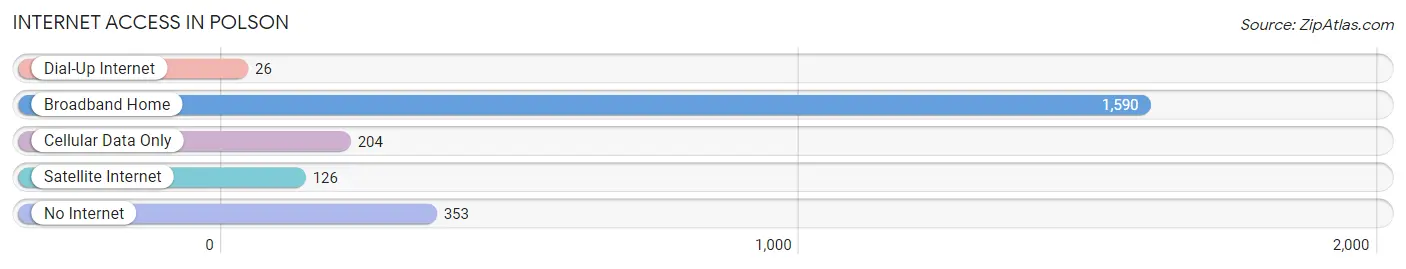
| Internet Type | # Households | % Households |
| Dial-Up Internet | 26 | 1.2% |
| Broadband Home | 1,590 | 71.3% |
| Cellular Data Only | 204 | 9.1% |
| Satellite Internet | 126 | 5.7% |
| No Internet | 353 | 15.8% |
| Total | 2,231 | 100.0% |
Polson Summary
Polson, Montana is a small city located on the Flathead Indian Reservation in the northwestern corner of the state. It is the county seat of Lake County and is situated on the south shore of Flathead Lake, the largest natural freshwater lake in the western United States. The city is home to a population of 4,488 people, according to the 2010 census.
History
The area that is now Polson was first inhabited by the Salish and Kootenai tribes of Native Americans. The first non-native settlers arrived in the area in the late 1800s, and the town was officially founded in 1891. The town was named after David Polson, a local rancher and businessman.
In the early 1900s, the town began to grow as a center for logging and agriculture. The Flathead Indian Reservation was established in 1910, and the town of Polson was incorporated in 1912.
Geography
Polson is located in the northwestern corner of Montana, on the south shore of Flathead Lake. The city is situated at an elevation of 2,945 feet above sea level. The city is surrounded by mountains, including the Mission Mountains to the east and the Swan Range to the west.
The city covers an area of 4.3 square miles, and is located approximately 30 miles south of Kalispell and 40 miles north of Missoula.
Economy
The economy of Polson is largely based on tourism, agriculture, and manufacturing. The city is home to several tourist attractions, including the Miracle of America Museum, the Flathead Lake State Park, and the National Bison Range.
Agriculture is also an important part of the local economy, with the area producing a variety of crops, including wheat, barley, hay, and potatoes.
Manufacturing is also an important part of the local economy, with the city home to several factories, including a paper mill, a wood products plant, and a food processing plant.
Demographics
According to the 2010 census, the population of Polson was 4,488. The racial makeup of the city was 90.3% White, 0.7% African American, 4.3% Native American, 0.4% Asian, 0.1% Pacific Islander, 1.2% from other races, and 3.1% from two or more races. Hispanic or Latino of any race were 3.7% of the population.
The median household income in Polson was $35,938, and the median family income was $41,944. The per capita income for the city was $19,845. About 14.2% of families and 17.3% of the population were below the poverty line, including 22.3% of those under age 18 and 8.2% of those age 65 or over.
Common Questions
What is Per Capita Income in Polson?
Per Capita income in Polson is $27,117.
What is the Median Family Income in Polson?
Median Family Income in Polson is $60,268.
What is the Median Household income in Polson?
Median Household Income in Polson is $48,866.
What is Income or Wage Gap in Polson?
Income or Wage Gap in Polson is 43.9%.
Women in Polson earn 56.1 cents for every dollar earned by a man.
What is Inequality or Gini Index in Polson?
Inequality or Gini Index in Polson is 0.42.
What is the Total Population of Polson?
Total Population of Polson is 5,218.
What is the Total Male Population of Polson?
Total Male Population of Polson is 2,512.
What is the Total Female Population of Polson?
Total Female Population of Polson is 2,706.
What is the Ratio of Males per 100 Females in Polson?
There are 92.83 Males per 100 Females in Polson.
What is the Ratio of Females per 100 Males in Polson?
There are 107.72 Females per 100 Males in Polson.
What is the Median Population Age in Polson?
Median Population Age in Polson is 47.5 Years.
What is the Average Family Size in Polson
Average Family Size in Polson is 2.9 People.
What is the Average Household Size in Polson
Average Household Size in Polson is 2.3 People.
How Large is the Labor Force in Polson?
There are 2,420 People in the Labor Forcein in Polson.
What is the Percentage of People in the Labor Force in Polson?
56.1% of People are in the Labor Force in Polson.
What is the Unemployment Rate in Polson?
Unemployment Rate in Polson is 6.4%.