Verde Village, AZ Map & Demographics
Verde Village Map
Verde Village Overview
$31,399
PER CAPITA INCOME
$69,909
AVG FAMILY INCOME
$63,835
AVG HOUSEHOLD INCOME
34.9%
WAGE / INCOME GAP [ % ]
65.1¢/ $1
WAGE / INCOME GAP [ $ ]
0.41
INEQUALITY / GINI INDEX
12,005
TOTAL POPULATION
6,280
MALE POPULATION
5,725
FEMALE POPULATION
109.69
MALES / 100 FEMALES
91.16
FEMALES / 100 MALES
44.1
MEDIAN AGE
2.8
AVG FAMILY SIZE
2.4
AVG HOUSEHOLD SIZE
6,263
LABOR FORCE [ PEOPLE ]
61.2%
PERCENT IN LABOR FORCE
4.5%
UNEMPLOYMENT RATE
Income in Verde Village
Income Overview in Verde Village
Per Capita Income in Verde Village is $31,399, while median incomes of families and households are $69,909 and $63,835 respectively.
| Characteristic | Number | Measure |
| Per Capita Income | 12,005 | $31,399 |
| Median Family Income | 3,218 | $69,909 |
| Mean Family Income | 3,218 | $86,503 |
| Median Household Income | 4,924 | $63,835 |
| Mean Household Income | 4,924 | $76,889 |
| Income Deficit | 3,218 | $0 |
| Wage / Income Gap (%) | 12,005 | 34.90% |
| Wage / Income Gap ($) | 12,005 | 65.10¢ per $1 |
| Gini / Inequality Index | 12,005 | 0.41 |
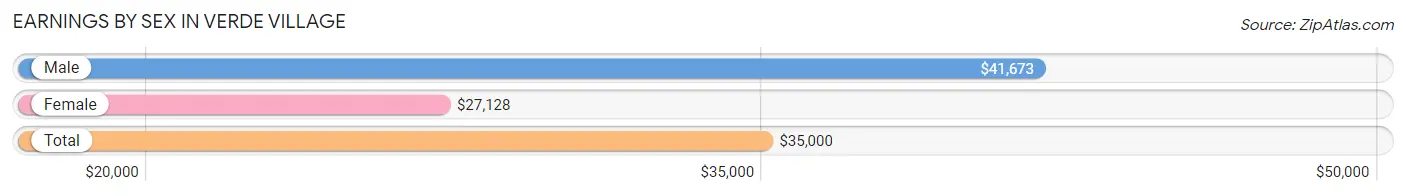
Earnings by Sex in Verde Village
Average Earnings in Verde Village are $35,000, $41,673 for men and $27,128 for women, a difference of 34.9%.
| Sex | Number | Average Earnings |
| Male | 3,367 (51.9%) | $41,673 |
| Female | 3,123 (48.1%) | $27,128 |
| Total | 6,490 (100.0%) | $35,000 |
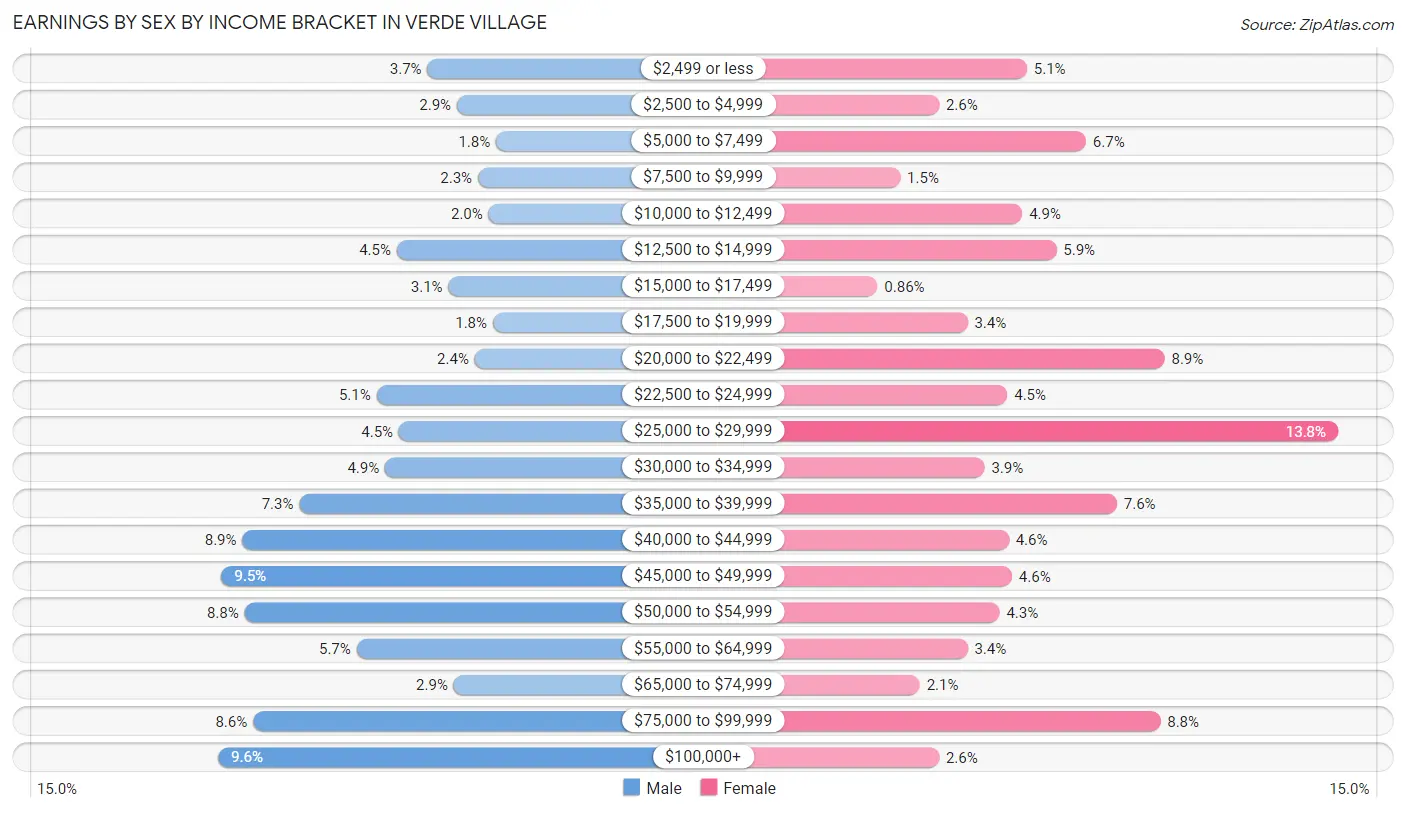
Earnings by Sex by Income Bracket in Verde Village
The most common earnings brackets in Verde Village are $100,000+ for men (322 | 9.6%) and $25,000 to $29,999 for women (431 | 13.8%).
| Income | Male | Female |
| $2,499 or less | 124 (3.7%) | 158 (5.1%) |
| $2,500 to $4,999 | 96 (2.9%) | 81 (2.6%) |
| $5,000 to $7,499 | 59 (1.8%) | 210 (6.7%) |
| $7,500 to $9,999 | 76 (2.3%) | 47 (1.5%) |
| $10,000 to $12,499 | 66 (2.0%) | 154 (4.9%) |
| $12,500 to $14,999 | 153 (4.5%) | 184 (5.9%) |
| $15,000 to $17,499 | 104 (3.1%) | 27 (0.9%) |
| $17,500 to $19,999 | 62 (1.8%) | 106 (3.4%) |
| $20,000 to $22,499 | 79 (2.4%) | 279 (8.9%) |
| $22,500 to $24,999 | 172 (5.1%) | 141 (4.5%) |
| $25,000 to $29,999 | 151 (4.5%) | 431 (13.8%) |
| $30,000 to $34,999 | 164 (4.9%) | 121 (3.9%) |
| $35,000 to $39,999 | 245 (7.3%) | 237 (7.6%) |
| $40,000 to $44,999 | 299 (8.9%) | 142 (4.5%) |
| $45,000 to $49,999 | 319 (9.5%) | 145 (4.6%) |
| $50,000 to $54,999 | 297 (8.8%) | 134 (4.3%) |
| $55,000 to $64,999 | 191 (5.7%) | 106 (3.4%) |
| $65,000 to $74,999 | 99 (2.9%) | 64 (2.1%) |
| $75,000 to $99,999 | 289 (8.6%) | 275 (8.8%) |
| $100,000+ | 322 (9.6%) | 81 (2.6%) |
| Total | 3,367 (100.0%) | 3,123 (100.0%) |
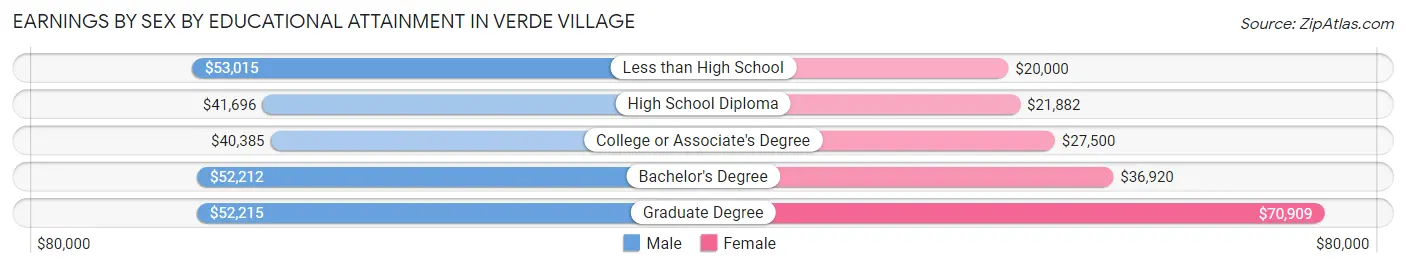
Earnings by Sex by Educational Attainment in Verde Village
Average earnings in Verde Village are $44,666 for men and $27,018 for women, a difference of 39.5%. Men with an educational attainment of less than high school enjoy the highest average annual earnings of $53,015, while those with college or associate's degree education earn the least with $40,385. Women with an educational attainment of graduate degree earn the most with the average annual earnings of $70,909, while those with less than high school education have the smallest earnings of $20,000.
| Educational Attainment | Male Income | Female Income |
| Less than High School | $53,015 | $20,000 |
| High School Diploma | $41,696 | $21,882 |
| College or Associate's Degree | $40,385 | $27,500 |
| Bachelor's Degree | $52,212 | $36,920 |
| Graduate Degree | $52,215 | $70,909 |
| Total | $44,666 | $27,018 |
Family Income in Verde Village
Family Income Brackets in Verde Village
According to the Verde Village family income data, there are 673 families falling into the $100,000 to $149,999 income range, which is the most common income bracket and makes up 20.9% of all families. Conversely, the $10,000 to $14,999 income bracket is the least frequent group with only 39 families (1.2%) belonging to this category.
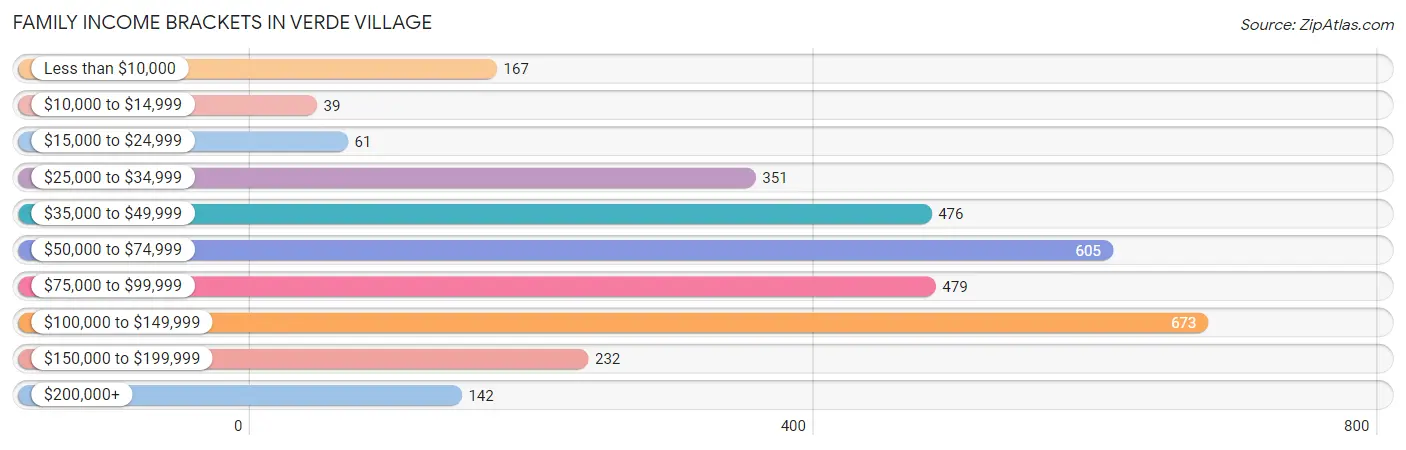
| Income Bracket | # Families | % Families |
| Less than $10,000 | 167 | 5.2% |
| $10,000 to $14,999 | 39 | 1.2% |
| $15,000 to $24,999 | 61 | 1.9% |
| $25,000 to $34,999 | 351 | 10.9% |
| $35,000 to $49,999 | 476 | 14.8% |
| $50,000 to $74,999 | 605 | 18.8% |
| $75,000 to $99,999 | 479 | 14.9% |
| $100,000 to $149,999 | 673 | 20.9% |
| $150,000 to $199,999 | 232 | 7.2% |
| $200,000+ | 142 | 4.4% |
Family Income by Famaliy Size in Verde Village
5-person families (253 | 7.9%) account for the highest median family income in Verde Village with $103,250 per family, while 2-person families (1,864 | 57.9%) have the highest median income of $31,478 per family member.
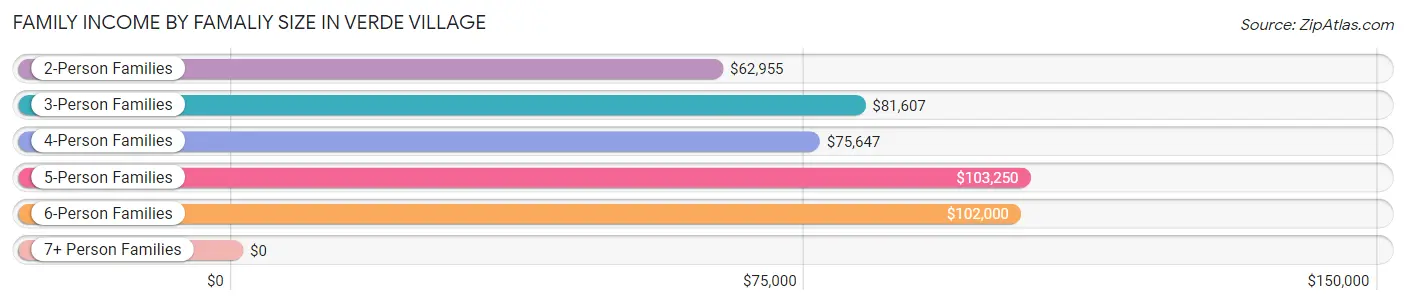
| Income Bracket | # Families | Median Income |
| 2-Person Families | 1,864 (57.9%) | $62,955 |
| 3-Person Families | 622 (19.3%) | $81,607 |
| 4-Person Families | 409 (12.7%) | $75,647 |
| 5-Person Families | 253 (7.9%) | $103,250 |
| 6-Person Families | 68 (2.1%) | $102,000 |
| 7+ Person Families | 2 (0.1%) | $0 |
| Total | 3,218 (100.0%) | $69,909 |
Family Income by Number of Earners in Verde Village
The median family income in Verde Village is $69,909, with families comprising 3+ earners (394) having the highest median family income of $113,548, while families with no earners (614) have the lowest median family income of $32,078, accounting for 12.2% and 19.1% of families, respectively.
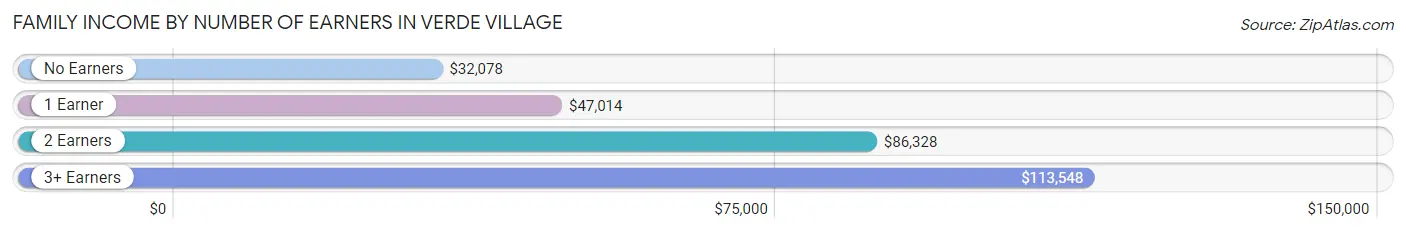
| Number of Earners | # Families | Median Income |
| No Earners | 614 (19.1%) | $32,078 |
| 1 Earner | 885 (27.5%) | $47,014 |
| 2 Earners | 1,325 (41.2%) | $86,328 |
| 3+ Earners | 394 (12.2%) | $113,548 |
| Total | 3,218 (100.0%) | $69,909 |
Household Income in Verde Village
Household Income Brackets in Verde Village
With 955 households falling in the category, the $100,000 to $149,999 income range is the most frequent in Verde Village, accounting for 19.4% of all households. In contrast, only 143 households (2.9%) fall into the $10,000 to $14,999 income bracket, making it the least populous group.
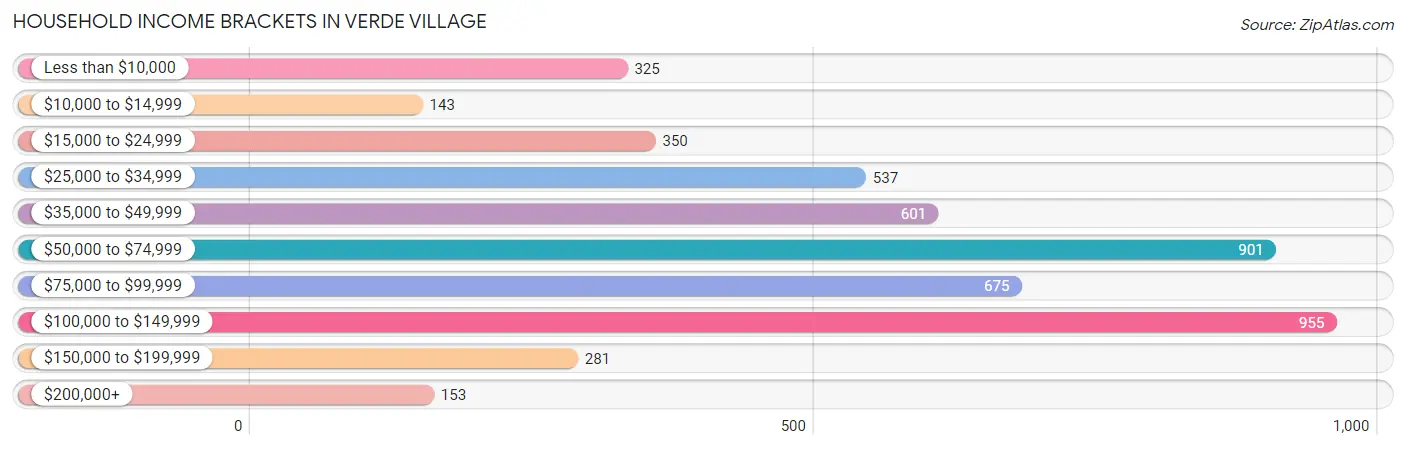
| Income Bracket | # Households | % Households |
| Less than $10,000 | 325 | 6.6% |
| $10,000 to $14,999 | 143 | 2.9% |
| $15,000 to $24,999 | 350 | 7.1% |
| $25,000 to $34,999 | 537 | 10.9% |
| $35,000 to $49,999 | 601 | 12.2% |
| $50,000 to $74,999 | 901 | 18.3% |
| $75,000 to $99,999 | 675 | 13.7% |
| $100,000 to $149,999 | 955 | 19.4% |
| $150,000 to $199,999 | 281 | 5.7% |
| $200,000+ | 153 | 3.1% |
Household Income by Householder Age in Verde Village
The median household income in Verde Village is $63,835, with the highest median household income of $77,830 found in the 25 to 44 years age bracket for the primary householder. A total of 1,288 households (26.2%) fall into this category. Meanwhile, the 65+ years age bracket for the primary householder has the lowest median household income of $43,708, with 1,576 households (32.0%) in this group.
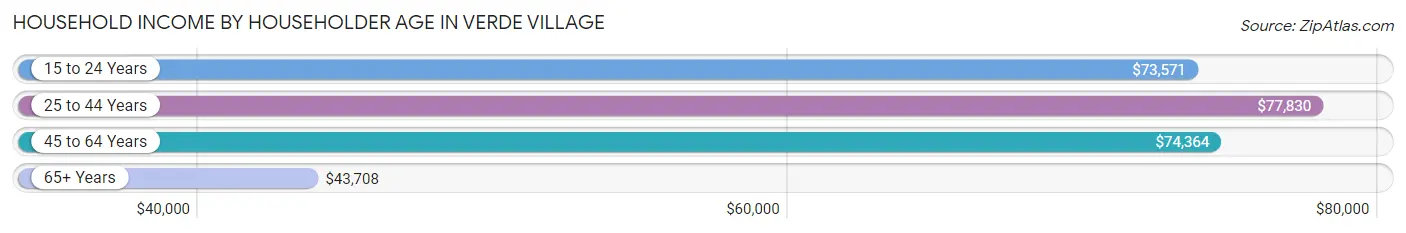
| Income Bracket | # Households | Median Income |
| 15 to 24 Years | 148 (3.0%) | $73,571 |
| 25 to 44 Years | 1,288 (26.2%) | $77,830 |
| 45 to 64 Years | 1,912 (38.8%) | $74,364 |
| 65+ Years | 1,576 (32.0%) | $43,708 |
| Total | 4,924 (100.0%) | $63,835 |
Poverty in Verde Village
Income Below Poverty by Sex and Age in Verde Village
With 13.8% poverty level for males and 11.1% for females among the residents of Verde Village, 5 year old males and 25 to 34 year old females are the most vulnerable to poverty, with 24 males (100.0%) and 135 females (19.2%) in their respective age groups living below the poverty level.
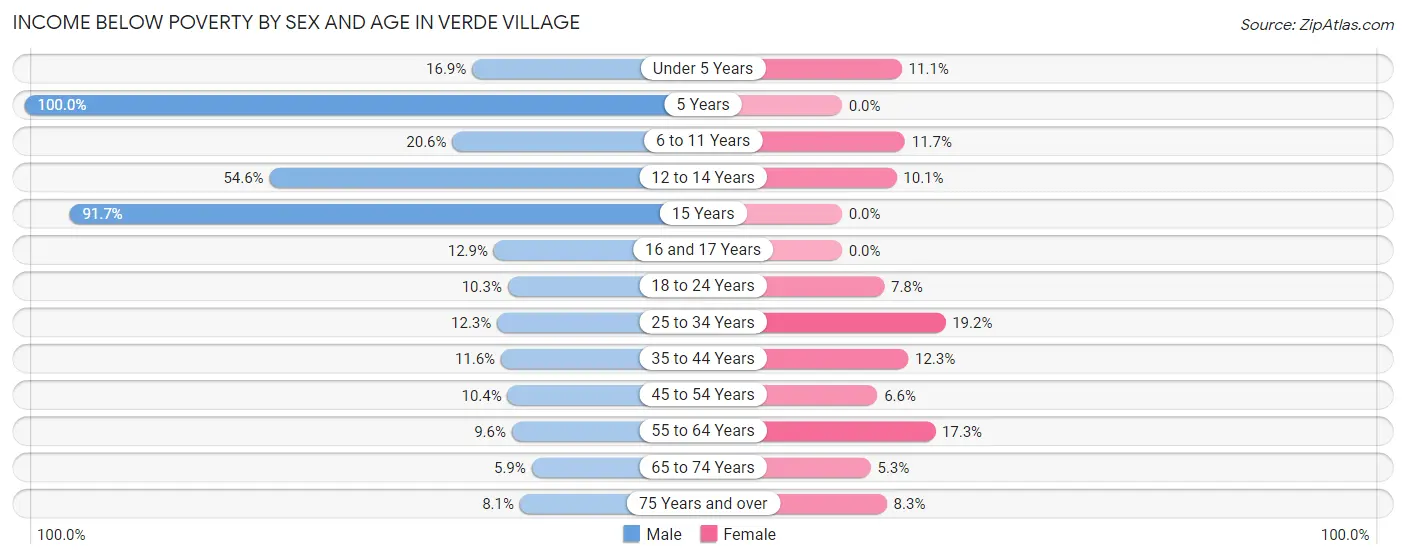
| Age Bracket | Male | Female |
| Under 5 Years | 52 (16.9%) | 21 (11.1%) |
| 5 Years | 24 (100.0%) | 0 (0.0%) |
| 6 to 11 Years | 82 (20.6%) | 20 (11.7%) |
| 12 to 14 Years | 138 (54.5%) | 16 (10.1%) |
| 15 Years | 33 (91.7%) | 0 (0.0%) |
| 16 and 17 Years | 47 (12.9%) | 0 (0.0%) |
| 18 to 24 Years | 49 (10.3%) | 40 (7.8%) |
| 25 to 34 Years | 107 (12.3%) | 135 (19.2%) |
| 35 to 44 Years | 69 (11.6%) | 88 (12.3%) |
| 45 to 54 Years | 77 (10.4%) | 45 (6.6%) |
| 55 to 64 Years | 90 (9.6%) | 161 (17.3%) |
| 65 to 74 Years | 31 (5.9%) | 40 (5.3%) |
| 75 Years and over | 47 (8.1%) | 61 (8.3%) |
| Total | 846 (13.8%) | 627 (11.1%) |
Income Above Poverty by Sex and Age in Verde Village
According to the poverty statistics in Verde Village, males aged 65 to 74 years and females aged 5 years are the age groups that are most secure financially, with 94.1% of males and 100.0% of females in these age groups living above the poverty line.
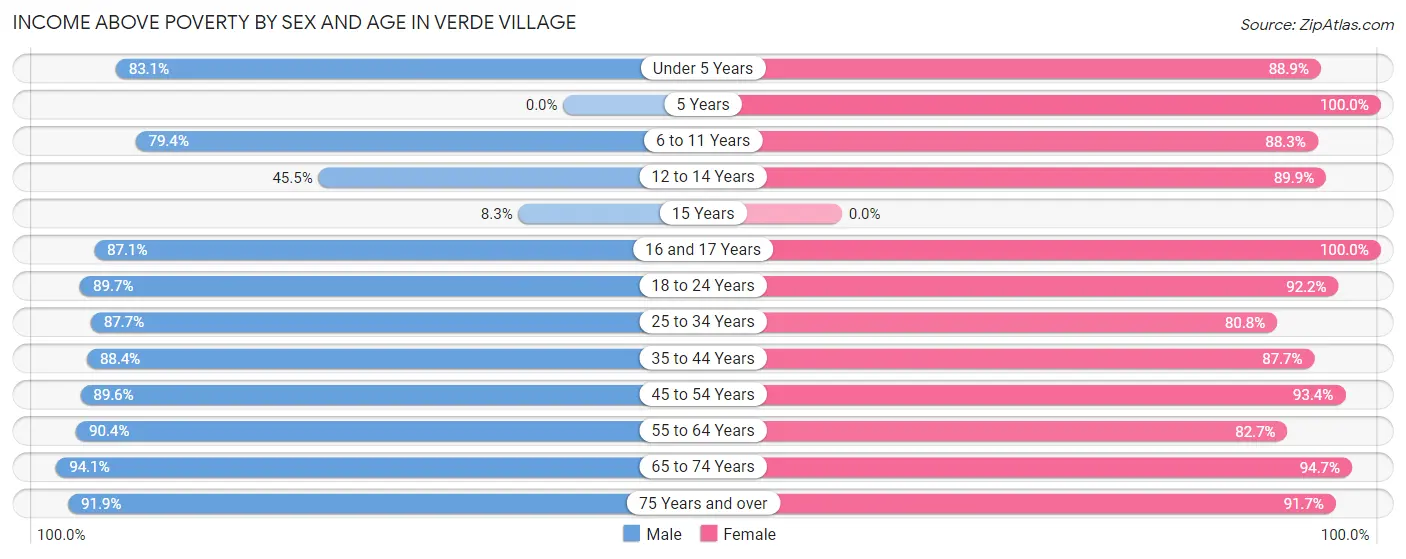
| Age Bracket | Male | Female |
| Under 5 Years | 255 (83.1%) | 168 (88.9%) |
| 5 Years | 0 (0.0%) | 39 (100.0%) |
| 6 to 11 Years | 316 (79.4%) | 151 (88.3%) |
| 12 to 14 Years | 115 (45.5%) | 142 (89.9%) |
| 15 Years | 3 (8.3%) | 0 (0.0%) |
| 16 and 17 Years | 317 (87.1%) | 85 (100.0%) |
| 18 to 24 Years | 426 (89.7%) | 470 (92.2%) |
| 25 to 34 Years | 763 (87.7%) | 568 (80.8%) |
| 35 to 44 Years | 527 (88.4%) | 628 (87.7%) |
| 45 to 54 Years | 666 (89.6%) | 639 (93.4%) |
| 55 to 64 Years | 850 (90.4%) | 770 (82.7%) |
| 65 to 74 Years | 495 (94.1%) | 711 (94.7%) |
| 75 Years and over | 535 (91.9%) | 671 (91.7%) |
| Total | 5,268 (86.2%) | 5,042 (88.9%) |
Income Below Poverty Among Married-Couple Families in Verde Village
The poverty statistics for married-couple families in Verde Village show that 3.2% or 83 of the total 2,582 families live below the poverty line. Families with 1 or 2 children have the highest poverty rate of 6.6%, comprising of 48 families. On the other hand, families with 3 or 4 children have the lowest poverty rate of 0.0%, which includes 0 families.
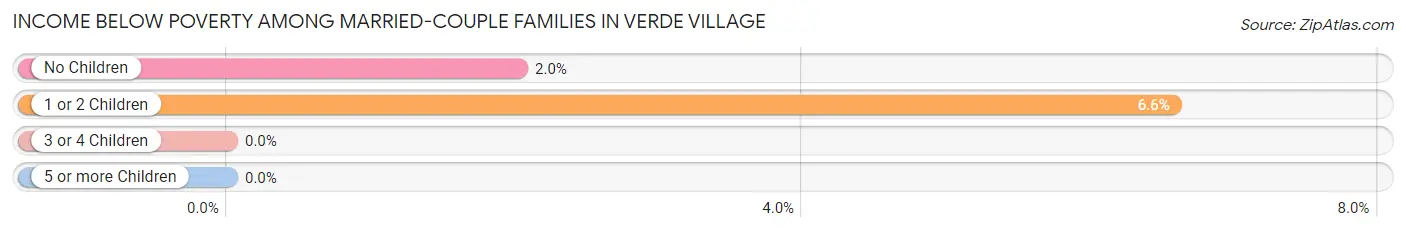
| Children | Above Poverty | Below Poverty |
| No Children | 1,699 (98.0%) | 35 (2.0%) |
| 1 or 2 Children | 683 (93.4%) | 48 (6.6%) |
| 3 or 4 Children | 117 (100.0%) | 0 (0.0%) |
| 5 or more Children | 0 (0.0%) | 0 (0.0%) |
| Total | 2,499 (96.8%) | 83 (3.2%) |
Income Below Poverty Among Single-Parent Households in Verde Village
According to the poverty data in Verde Village, 21.6% or 55 single-father households and 32.0% or 122 single-mother households are living below the poverty line. Among single-father households, those with 3 or 4 children have the highest poverty rate, with 49 households (83.1%) experiencing poverty. Likewise, among single-mother households, those with 3 or 4 children have the highest poverty rate, with 40 households (81.6%) falling below the poverty line.
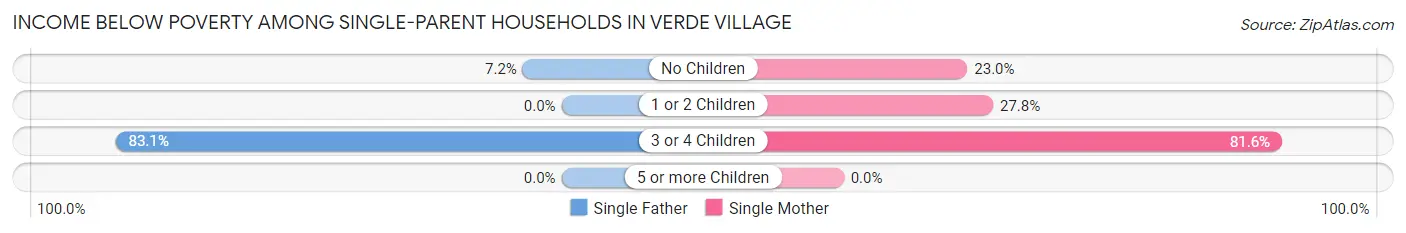
| Children | Single Father | Single Mother |
| No Children | 6 (7.2%) | 50 (23.0%) |
| 1 or 2 Children | 0 (0.0%) | 32 (27.8%) |
| 3 or 4 Children | 49 (83.1%) | 40 (81.6%) |
| 5 or more Children | 0 (0.0%) | 0 (0.0%) |
| Total | 55 (21.6%) | 122 (32.0%) |
Income Below Poverty Among Married-Couple vs Single-Parent Households in Verde Village
The poverty data for Verde Village shows that 83 of the married-couple family households (3.2%) and 177 of the single-parent households (27.8%) are living below the poverty level. Within the married-couple family households, those with 1 or 2 children have the highest poverty rate, with 48 households (6.6%) falling below the poverty line. Among the single-parent households, those with 3 or 4 children have the highest poverty rate, with 89 household (82.4%) living below poverty.
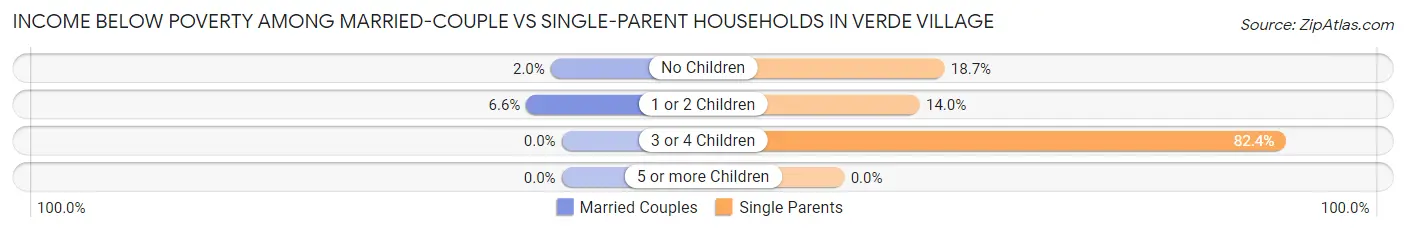
| Children | Married-Couple Families | Single-Parent Households |
| No Children | 35 (2.0%) | 56 (18.7%) |
| 1 or 2 Children | 48 (6.6%) | 32 (14.0%) |
| 3 or 4 Children | 0 (0.0%) | 89 (82.4%) |
| 5 or more Children | 0 (0.0%) | 0 (0.0%) |
| Total | 83 (3.2%) | 177 (27.8%) |
Race in Verde Village
The most populous races in Verde Village are White / Caucasian (9,294 | 77.4%), Hispanic or Latino (2,169 | 18.1%), and Two or more Races (1,360 | 11.3%).
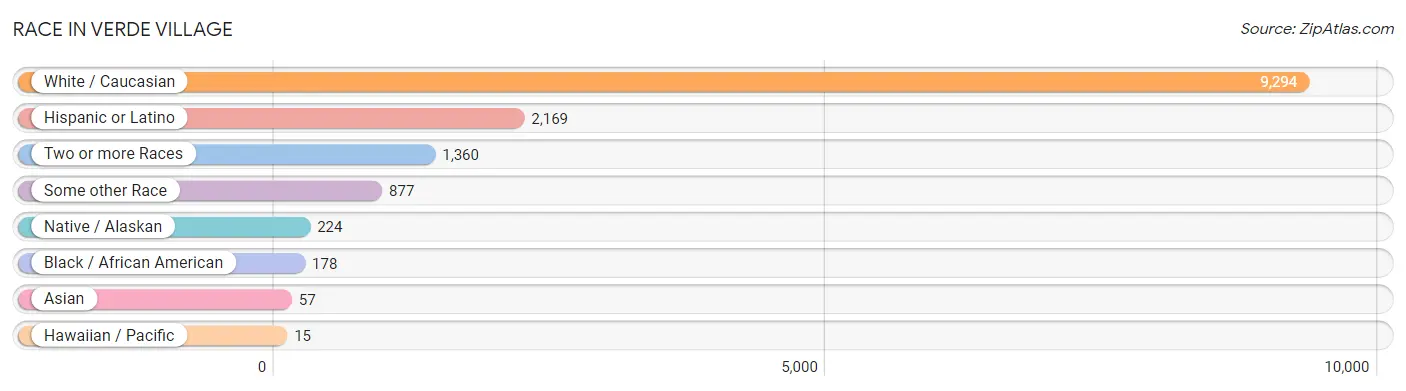
| Race | # Population | % Population |
| Asian | 57 | 0.5% |
| Black / African American | 178 | 1.5% |
| Hawaiian / Pacific | 15 | 0.1% |
| Hispanic or Latino | 2,169 | 18.1% |
| Native / Alaskan | 224 | 1.9% |
| White / Caucasian | 9,294 | 77.4% |
| Two or more Races | 1,360 | 11.3% |
| Some other Race | 877 | 7.3% |
| Total | 12,005 | 100.0% |
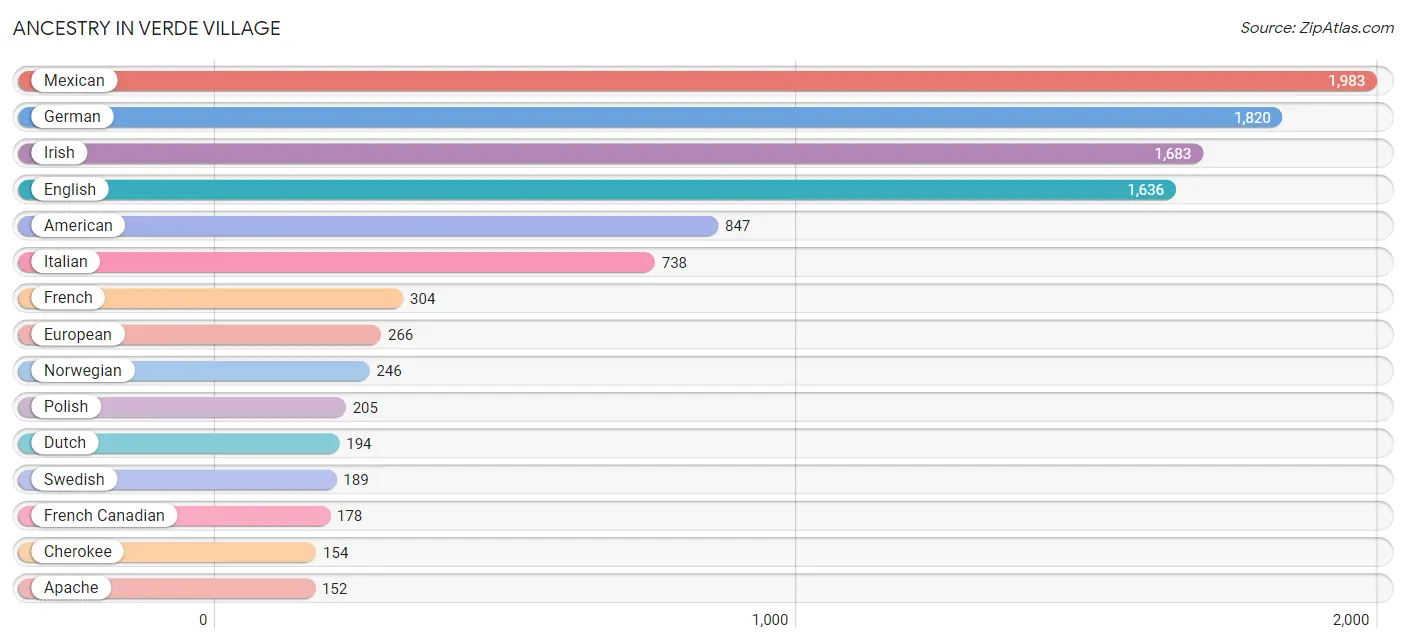
Ancestry in Verde Village
The most populous ancestries reported in Verde Village are Mexican (1,983 | 16.5%), German (1,820 | 15.2%), Irish (1,683 | 14.0%), English (1,636 | 13.6%), and American (847 | 7.1%), together accounting for 66.4% of all Verde Village residents.
| Ancestry | # Population | % Population |
| Afghan | 21 | 0.2% |
| African | 31 | 0.3% |
| Aleut | 14 | 0.1% |
| American | 847 | 7.1% |
| Apache | 152 | 1.3% |
| Arab | 32 | 0.3% |
| Armenian | 21 | 0.2% |
| Austrian | 22 | 0.2% |
| Bhutanese | 28 | 0.2% |
| British | 152 | 1.3% |
| Cajun | 17 | 0.1% |
| Canadian | 37 | 0.3% |
| Celtic | 17 | 0.1% |
| Cherokee | 154 | 1.3% |
| Chippewa | 13 | 0.1% |
| Colombian | 40 | 0.3% |
| Cree | 81 | 0.7% |
| Cuban | 45 | 0.4% |
| Czech | 146 | 1.2% |
| Danish | 12 | 0.1% |
| Dutch | 194 | 1.6% |
| English | 1,636 | 13.6% |
| European | 266 | 2.2% |
| Finnish | 16 | 0.1% |
| French | 304 | 2.5% |
| French American Indian | 81 | 0.7% |
| French Canadian | 178 | 1.5% |
| German | 1,820 | 15.2% |
| Hopi | 31 | 0.3% |
| Hungarian | 14 | 0.1% |
| Icelander | 30 | 0.3% |
| Indian (Asian) | 7 | 0.1% |
| Irish | 1,683 | 14.0% |
| Italian | 738 | 6.1% |
| Korean | 62 | 0.5% |
| Lebanese | 32 | 0.3% |
| Mexican | 1,983 | 16.5% |
| Mexican American Indian | 87 | 0.7% |
| Native Hawaiian | 7 | 0.1% |
| Navajo | 90 | 0.7% |
| Northern European | 4 | 0.0% |
| Norwegian | 246 | 2.1% |
| Polish | 205 | 1.7% |
| Portuguese | 24 | 0.2% |
| Puerto Rican | 20 | 0.2% |
| Romanian | 37 | 0.3% |
| Russian | 12 | 0.1% |
| Scandinavian | 70 | 0.6% |
| Scotch-Irish | 49 | 0.4% |
| Scottish | 123 | 1.0% |
| Shoshone | 81 | 0.7% |
| Sioux | 119 | 1.0% |
| Slavic | 25 | 0.2% |
| Slovak | 37 | 0.3% |
| South American | 40 | 0.3% |
| Spaniard | 67 | 0.6% |
| Spanish | 8 | 0.1% |
| Sri Lankan | 73 | 0.6% |
| Subsaharan African | 31 | 0.3% |
| Swedish | 189 | 1.6% |
| Swiss | 112 | 0.9% |
| Thai | 14 | 0.1% |
| Tohono O'Odham | 17 | 0.1% |
| Turkish | 10 | 0.1% |
| Ukrainian | 27 | 0.2% |
| Welsh | 45 | 0.4% |
| Yaqui | 11 | 0.1% |
| Yuman | 6 | 0.1% | View All 68 Rows |
Immigrants in Verde Village
The most numerous immigrant groups reported in Verde Village came from Latin America (811 | 6.8%), Central America (771 | 6.4%), Mexico (771 | 6.4%), Europe (108 | 0.9%), and Italy (68 | 0.6%), together accounting for 21.1% of all Verde Village residents.
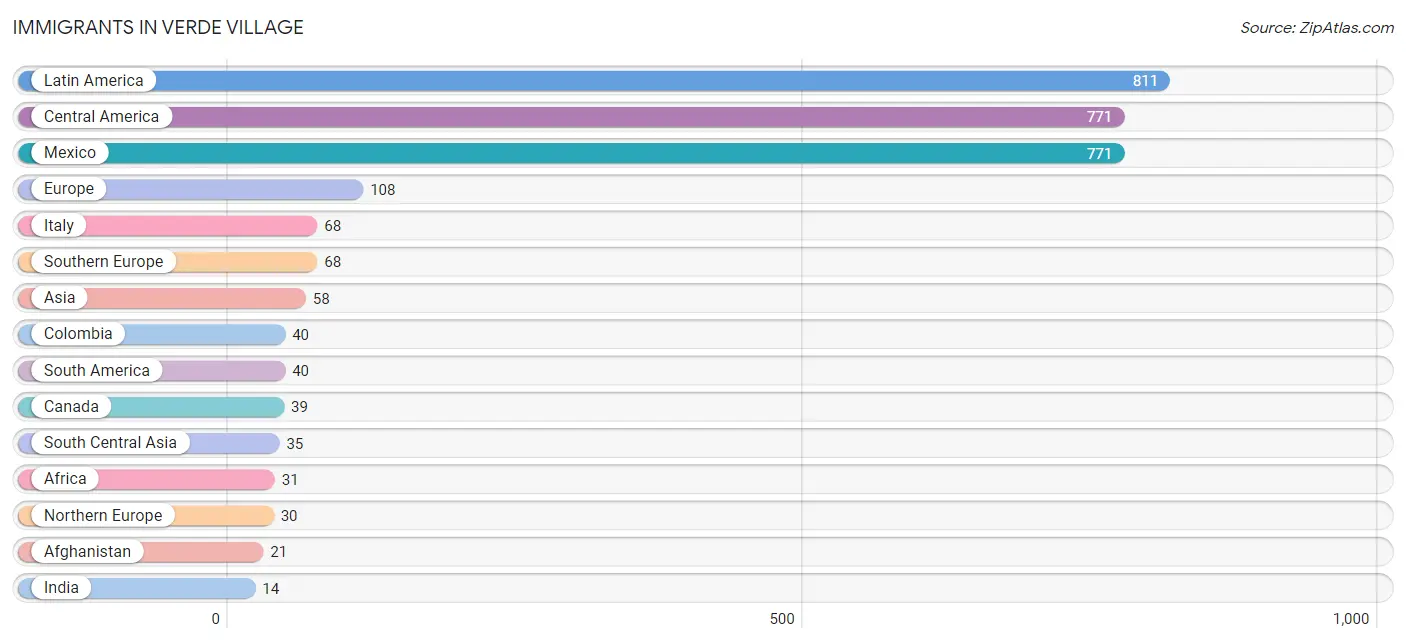
| Immigration Origin | # Population | % Population |
| Afghanistan | 21 | 0.2% |
| Africa | 31 | 0.3% |
| Asia | 58 | 0.5% |
| Canada | 39 | 0.3% |
| Central America | 771 | 6.4% |
| Colombia | 40 | 0.3% |
| Czechoslovakia | 10 | 0.1% |
| Eastern Asia | 12 | 0.1% |
| Eastern Europe | 10 | 0.1% |
| Europe | 108 | 0.9% |
| India | 14 | 0.1% |
| Italy | 68 | 0.6% |
| Japan | 12 | 0.1% |
| Latin America | 811 | 6.8% |
| Mexico | 771 | 6.4% |
| Northern Europe | 30 | 0.3% |
| Norway | 10 | 0.1% |
| Philippines | 11 | 0.1% |
| South America | 40 | 0.3% |
| South Central Asia | 35 | 0.3% |
| South Eastern Asia | 11 | 0.1% |
| Southern Europe | 68 | 0.6% | View All 22 Rows |
Sex and Age in Verde Village
Sex and Age in Verde Village
The most populous age groups in Verde Village are 55 to 59 Years (600 | 9.6%) for men and 60 to 64 Years (578 | 10.1%) for women.
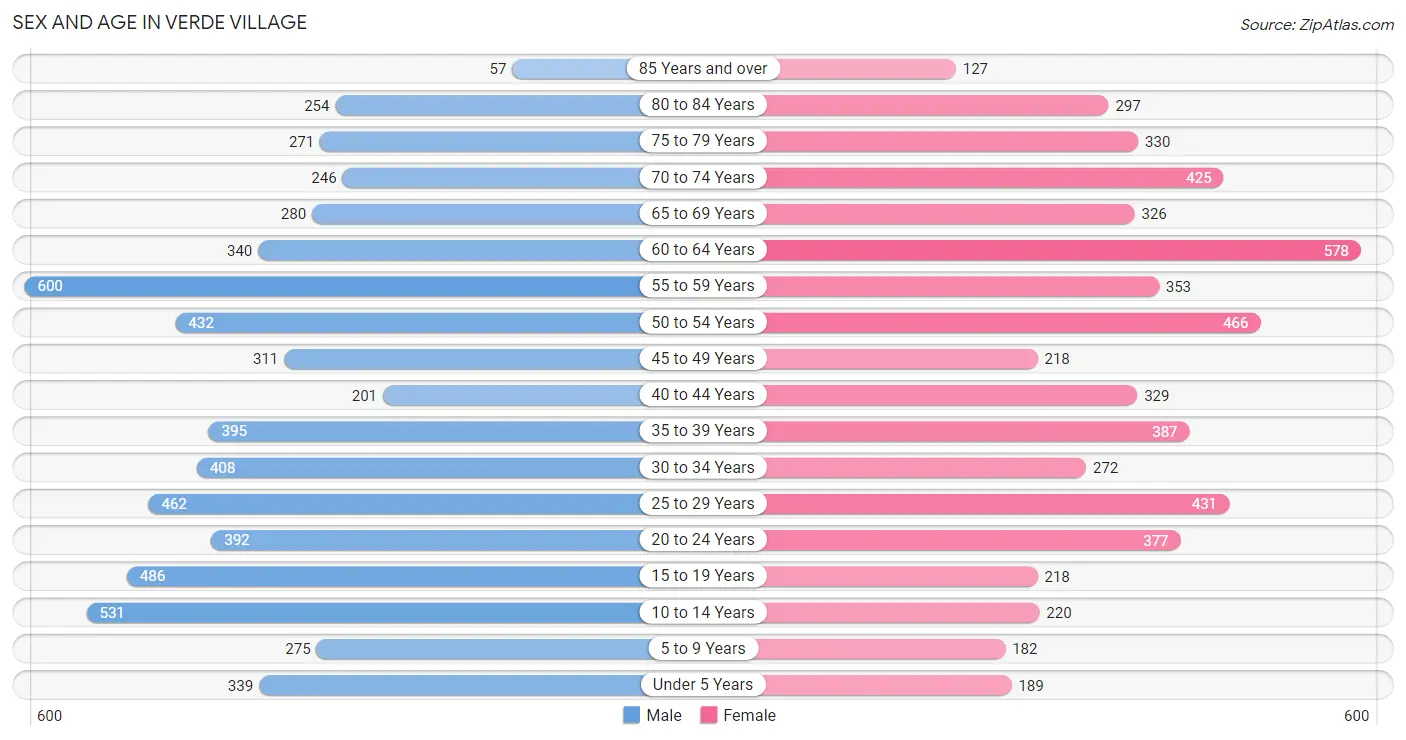
| Age Bracket | Male | Female |
| Under 5 Years | 339 (5.4%) | 189 (3.3%) |
| 5 to 9 Years | 275 (4.4%) | 182 (3.2%) |
| 10 to 14 Years | 531 (8.5%) | 220 (3.8%) |
| 15 to 19 Years | 486 (7.7%) | 218 (3.8%) |
| 20 to 24 Years | 392 (6.2%) | 377 (6.6%) |
| 25 to 29 Years | 462 (7.4%) | 431 (7.5%) |
| 30 to 34 Years | 408 (6.5%) | 272 (4.8%) |
| 35 to 39 Years | 395 (6.3%) | 387 (6.8%) |
| 40 to 44 Years | 201 (3.2%) | 329 (5.8%) |
| 45 to 49 Years | 311 (5.0%) | 218 (3.8%) |
| 50 to 54 Years | 432 (6.9%) | 466 (8.1%) |
| 55 to 59 Years | 600 (9.6%) | 353 (6.2%) |
| 60 to 64 Years | 340 (5.4%) | 578 (10.1%) |
| 65 to 69 Years | 280 (4.5%) | 326 (5.7%) |
| 70 to 74 Years | 246 (3.9%) | 425 (7.4%) |
| 75 to 79 Years | 271 (4.3%) | 330 (5.8%) |
| 80 to 84 Years | 254 (4.0%) | 297 (5.2%) |
| 85 Years and over | 57 (0.9%) | 127 (2.2%) |
| Total | 6,280 (100.0%) | 5,725 (100.0%) |
Families and Households in Verde Village
Median Family Size in Verde Village
The median family size in Verde Village is 2.78 persons per family, with single male/father families (255 | 7.9%) accounting for the largest median family size of 3.29 persons per family. On the other hand, single female/mother families (381 | 11.8%) represent the smallest median family size with 2.63 persons per family.
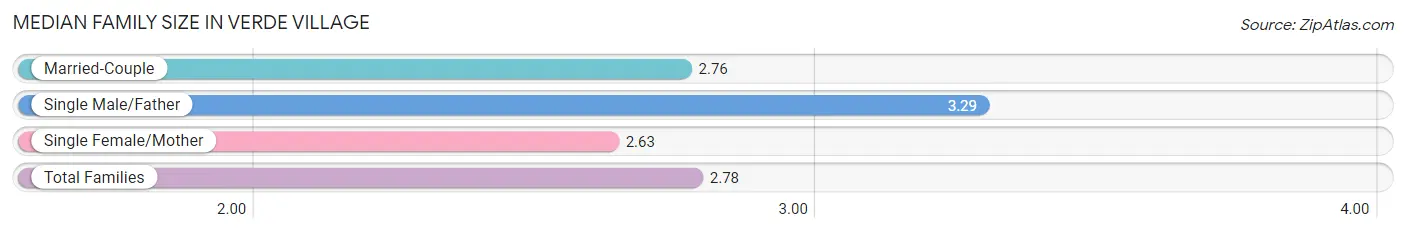
| Family Type | # Families | Family Size |
| Married-Couple | 2,582 (80.2%) | 2.76 |
| Single Male/Father | 255 (7.9%) | 3.29 |
| Single Female/Mother | 381 (11.8%) | 2.63 |
| Total Families | 3,218 (100.0%) | 2.78 |
Median Household Size in Verde Village
The median household size in Verde Village is 2.42 persons per household, with single male/father households (255 | 5.2%) accounting for the largest median household size of 3.82 persons per household. non-family households (1,706 | 34.6%) represent the smallest median household size with 1.53 persons per household.
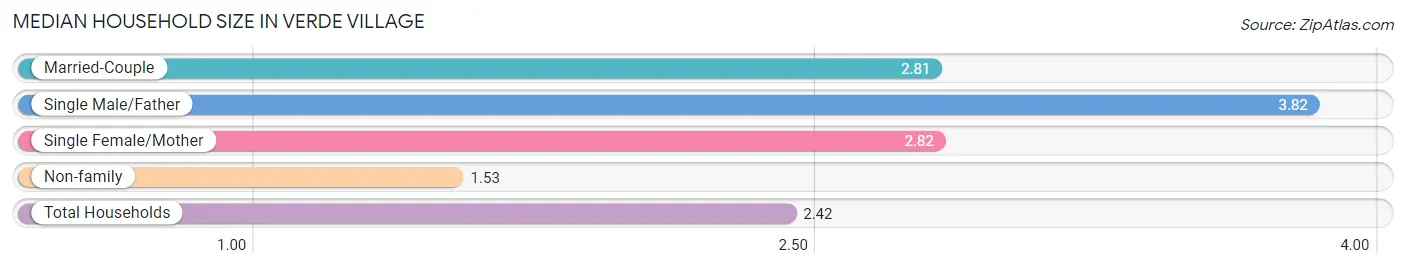
| Household Type | # Households | Household Size |
| Married-Couple | 2,582 (52.4%) | 2.81 |
| Single Male/Father | 255 (5.2%) | 3.82 |
| Single Female/Mother | 381 (7.7%) | 2.82 |
| Non-family | 1,706 (34.6%) | 1.53 |
| Total Households | 4,924 (100.0%) | 2.42 |
Household Size by Marriage Status in Verde Village
Out of a total of 4,924 households in Verde Village, 3,218 (65.3%) are family households, while 1,706 (34.6%) are nonfamily households. The most numerous type of family households are 2-person households, comprising 1,752, and the most common type of nonfamily households are 1-person households, comprising 1,079.
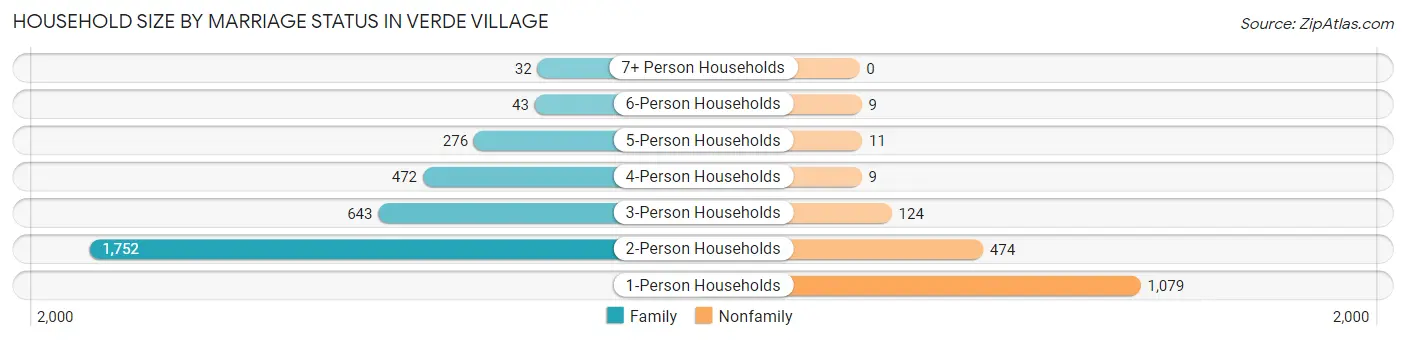
| Household Size | Family Households | Nonfamily Households |
| 1-Person Households | - | 1,079 (21.9%) |
| 2-Person Households | 1,752 (35.6%) | 474 (9.6%) |
| 3-Person Households | 643 (13.1%) | 124 (2.5%) |
| 4-Person Households | 472 (9.6%) | 9 (0.2%) |
| 5-Person Households | 276 (5.6%) | 11 (0.2%) |
| 6-Person Households | 43 (0.9%) | 9 (0.2%) |
| 7+ Person Households | 32 (0.6%) | 0 (0.0%) |
| Total | 3,218 (65.3%) | 1,706 (34.6%) |
Female Fertility in Verde Village
Fertility by Age in Verde Village
Average fertility rate in Verde Village is 37.0 births per 1,000 women. Women in the age bracket of 20 to 34 years have the highest fertility rate with 47.0 births per 1,000 women. Women in the age bracket of 20 to 34 years acount for 56.0% of all women with births.
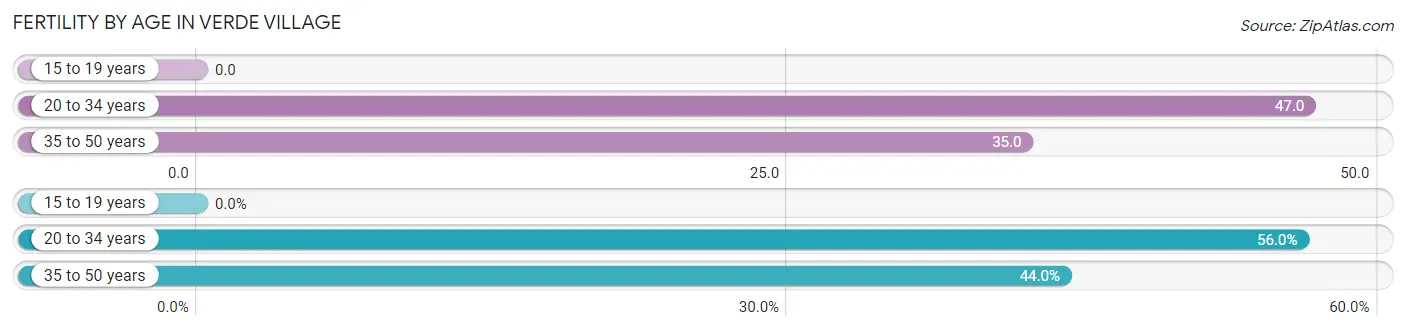
| Age Bracket | Women with Births | Births / 1,000 Women |
| 15 to 19 years | 0 (0.0%) | 0.0 |
| 20 to 34 years | 51 (56.0%) | 47.0 |
| 35 to 50 years | 40 (44.0%) | 35.0 |
| Total | 91 (100.0%) | 37.0 |
Fertility by Age by Marriage Status in Verde Village
7.7% of women with births (91) in Verde Village are married. The highest percentage of unmarried women with births falls into 35 to 50 years age bracket with 100.0% of them unmarried at the time of birth, while the lowest percentage of unmarried women with births belong to 20 to 34 years age bracket with 86.3% of them unmarried.
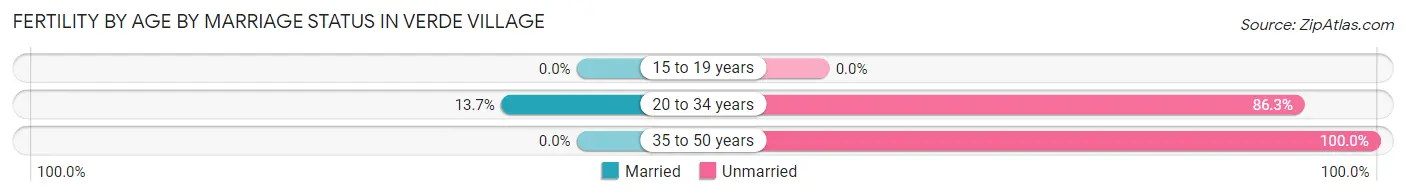
| Age Bracket | Married | Unmarried |
| 15 to 19 years | 0 (0.0%) | 0 (0.0%) |
| 20 to 34 years | 7 (13.7%) | 44 (86.3%) |
| 35 to 50 years | 0 (0.0%) | 40 (100.0%) |
| Total | 7 (7.7%) | 84 (92.3%) |
Fertility by Education in Verde Village
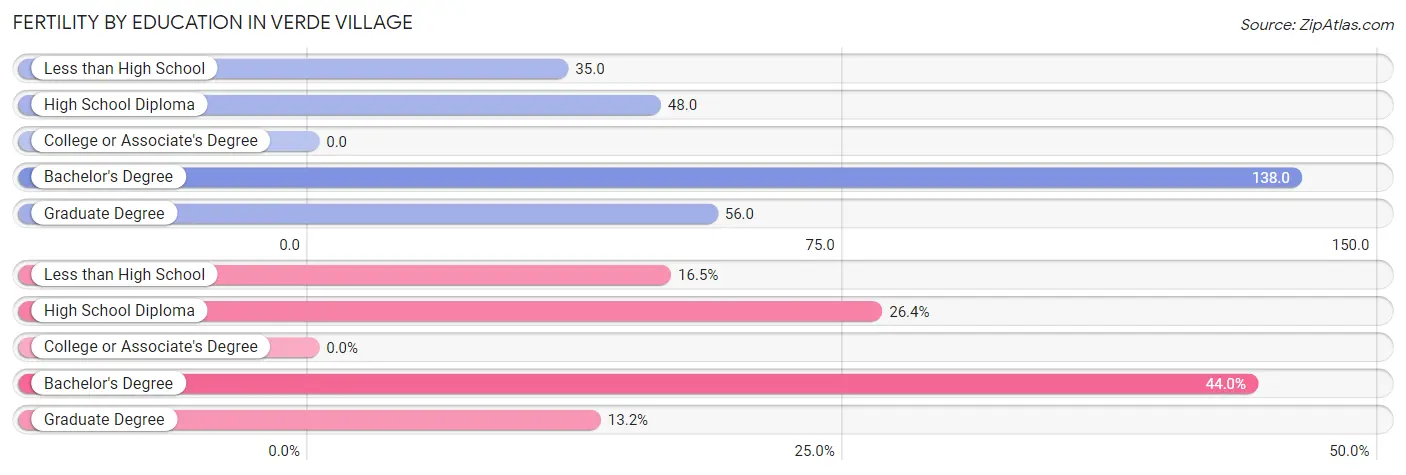
| Educational Attainment | Women with Births | Births / 1,000 Women |
| Less than High School | 15 (16.5%) | 35.0 |
| High School Diploma | 24 (26.4%) | 48.0 |
| College or Associate's Degree | 0 (0.0%) | 0.0 |
| Bachelor's Degree | 40 (44.0%) | 138.0 |
| Graduate Degree | 12 (13.2%) | 56.0 |
| Total | 91 (100.0%) | 37.0 |
Fertility by Education by Marriage Status in Verde Village
92.3% of women with births in Verde Village are unmarried. Women with the educational attainment of high school diploma are most likely to be married with 29.2% of them married at childbirth, while women with the educational attainment of less than high school are least likely to be married with 100.0% of them unmarried at childbirth.
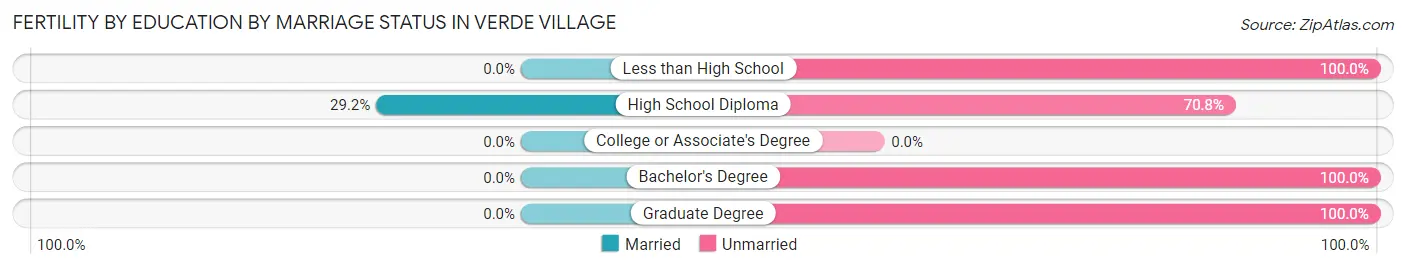
| Educational Attainment | Married | Unmarried |
| Less than High School | 0 (0.0%) | 15 (100.0%) |
| High School Diploma | 7 (29.2%) | 17 (70.8%) |
| College or Associate's Degree | 0 (0.0%) | 0 (0.0%) |
| Bachelor's Degree | 0 (0.0%) | 40 (100.0%) |
| Graduate Degree | 0 (0.0%) | 12 (100.0%) |
| Total | 7 (7.7%) | 84 (92.3%) |
Employment Characteristics in Verde Village
Employment by Class of Employer in Verde Village
Among the 5,872 employed individuals in Verde Village, private company employees (3,748 | 63.8%), self-employed (not incorporated) (614 | 10.5%), and not-for-profit organizations (527 | 9.0%) make up the most common classes of employment.
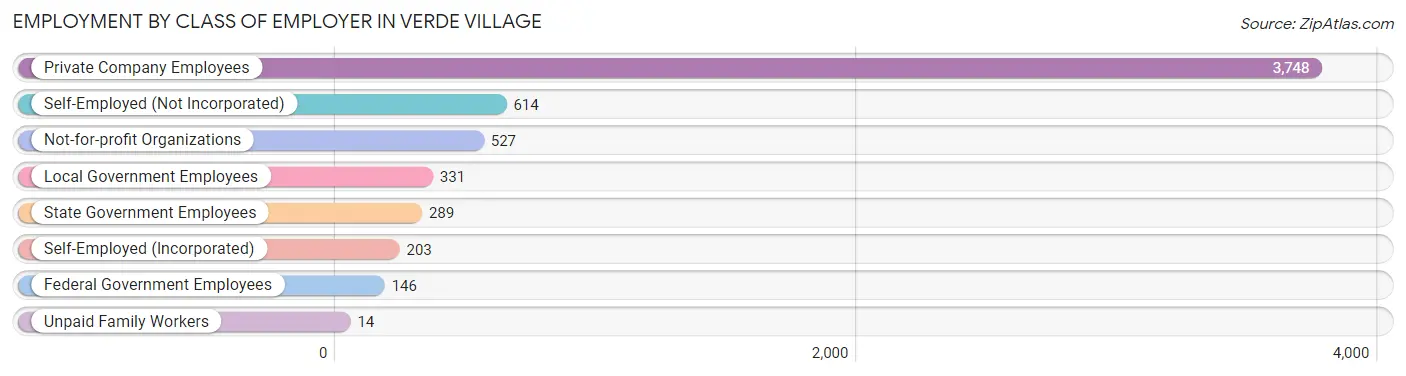
| Employer Class | # Employees | % Employees |
| Private Company Employees | 3,748 | 63.8% |
| Self-Employed (Incorporated) | 203 | 3.5% |
| Self-Employed (Not Incorporated) | 614 | 10.5% |
| Not-for-profit Organizations | 527 | 9.0% |
| Local Government Employees | 331 | 5.6% |
| State Government Employees | 289 | 4.9% |
| Federal Government Employees | 146 | 2.5% |
| Unpaid Family Workers | 14 | 0.2% |
| Total | 5,872 | 100.0% |
Employment Status by Age in Verde Village
According to the labor force statistics for Verde Village, out of the total population over 16 years of age (10,233), 61.2% or 6,263 individuals are in the labor force, with 4.5% or 282 of them unemployed. The age group with the highest labor force participation rate is 25 to 29 years, with 95.1% or 849 individuals in the labor force. Within the labor force, the 16 to 19 years age range has the highest percentage of unemployed individuals, with 37.1% or 46 of them being unemployed.
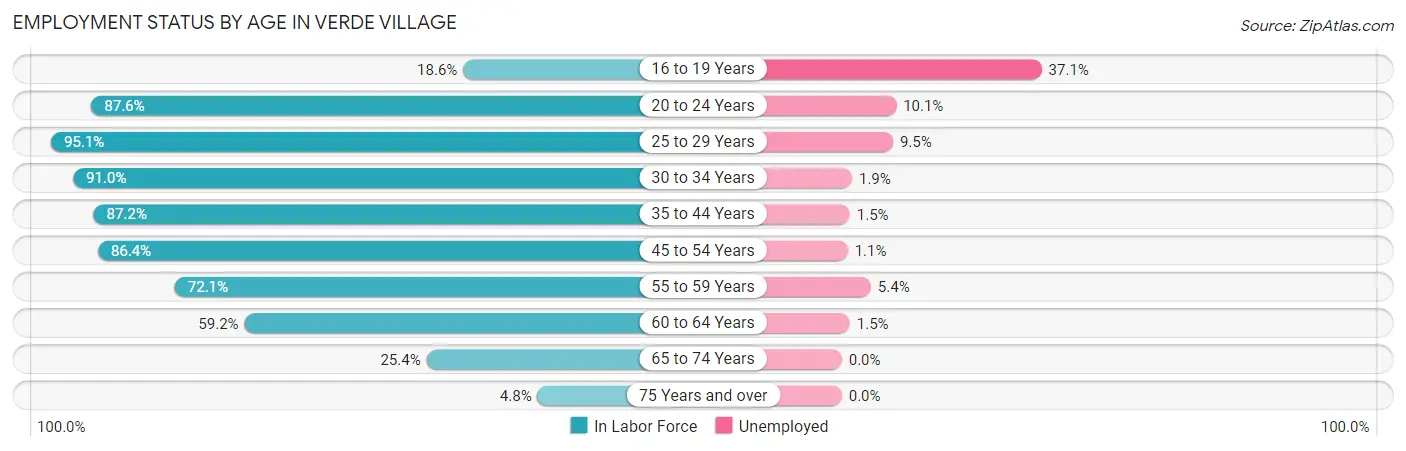
| Age Bracket | In Labor Force | Unemployed |
| 16 to 19 Years | 124 (18.6%) | 46 (37.1%) |
| 20 to 24 Years | 674 (87.6%) | 68 (10.1%) |
| 25 to 29 Years | 849 (95.1%) | 81 (9.5%) |
| 30 to 34 Years | 619 (91.0%) | 12 (1.9%) |
| 35 to 44 Years | 1,144 (87.2%) | 17 (1.5%) |
| 45 to 54 Years | 1,233 (86.4%) | 14 (1.1%) |
| 55 to 59 Years | 687 (72.1%) | 37 (5.4%) |
| 60 to 64 Years | 543 (59.2%) | 8 (1.5%) |
| 65 to 74 Years | 324 (25.4%) | 0 (0.0%) |
| 75 Years and over | 64 (4.8%) | 0 (0.0%) |
| Total | 6,263 (61.2%) | 282 (4.5%) |
Employment Status by Educational Attainment in Verde Village
According to labor force statistics for Verde Village, 82.1% of individuals (5,076) out of the total population between 25 and 64 years of age (6,183) are in the labor force, with 3.3% or 168 of them being unemployed. The group with the highest labor force participation rate are those with the educational attainment of bachelor's degree or higher, with 89.1% or 1,303 individuals in the labor force. Within the labor force, individuals with college / associate degree education have the highest percentage of unemployment, with 5.7% or 115 of them being unemployed.
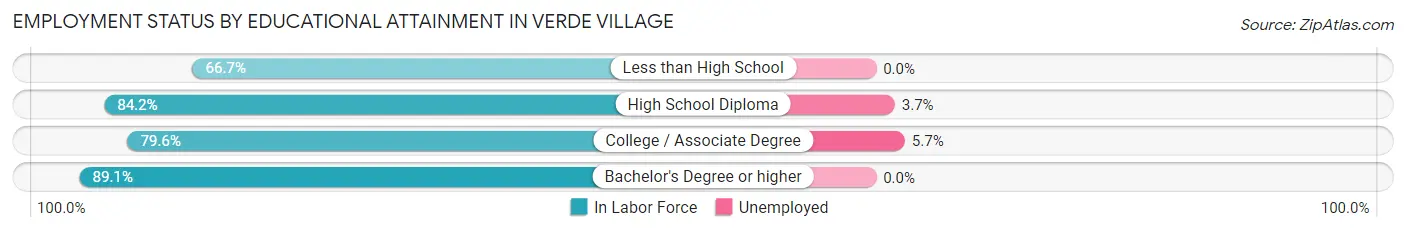
| Educational Attainment | In Labor Force | Unemployed |
| Less than High School | 331 (66.7%) | 0 (0.0%) |
| High School Diploma | 1,419 (84.2%) | 62 (3.7%) |
| College / Associate Degree | 2,022 (79.6%) | 145 (5.7%) |
| Bachelor's Degree or higher | 1,303 (89.1%) | 0 (0.0%) |
| Total | 5,076 (82.1%) | 204 (3.3%) |
Employment Occupations by Sex in Verde Village
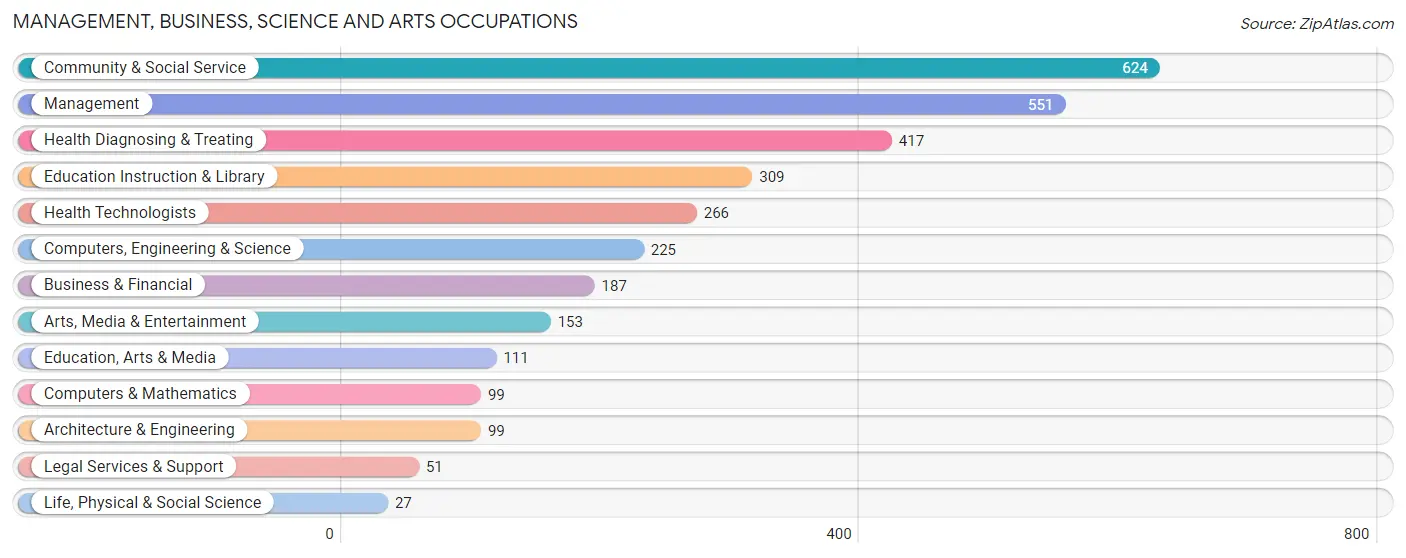
Management, Business, Science and Arts Occupations
The most common Management, Business, Science and Arts occupations in Verde Village are Community & Social Service (624 | 10.4%), Management (551 | 9.2%), Health Diagnosing & Treating (417 | 7.0%), Education Instruction & Library (309 | 5.2%), and Health Technologists (266 | 4.4%).
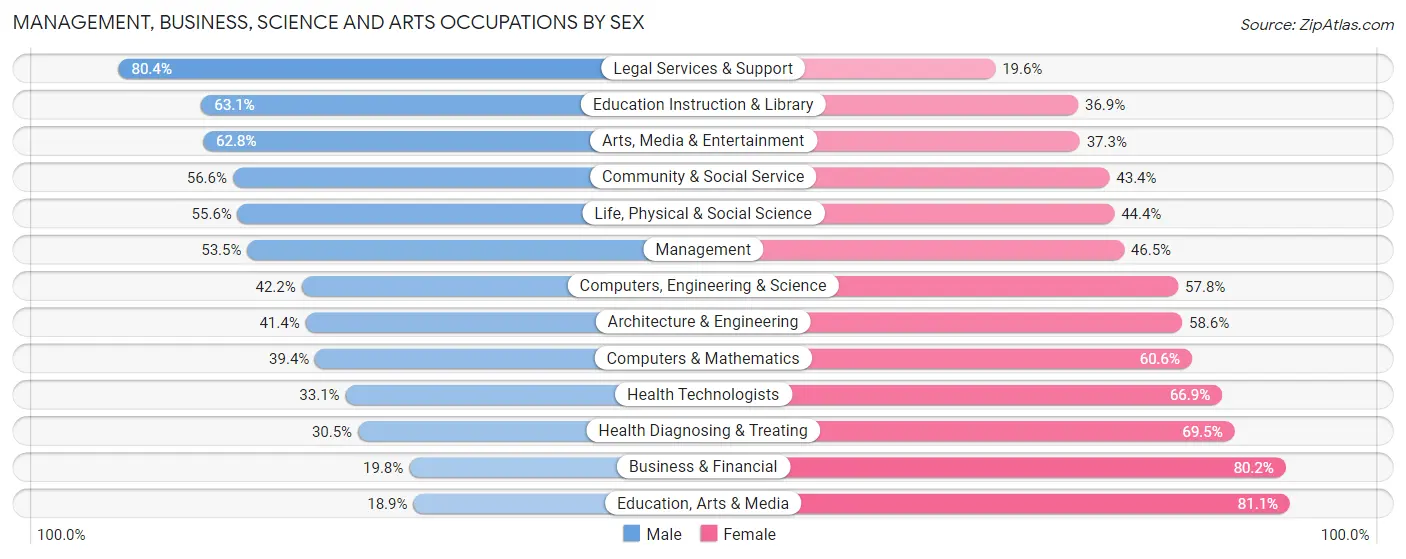
Management, Business, Science and Arts Occupations by Sex
Within the Management, Business, Science and Arts occupations in Verde Village, the most male-oriented occupations are Legal Services & Support (80.4%), Education Instruction & Library (63.1%), and Arts, Media & Entertainment (62.7%), while the most female-oriented occupations are Education, Arts & Media (81.1%), Business & Financial (80.2%), and Health Diagnosing & Treating (69.5%).
| Occupation | Male | Female |
| Management | 295 (53.5%) | 256 (46.5%) |
| Business & Financial | 37 (19.8%) | 150 (80.2%) |
| Computers, Engineering & Science | 95 (42.2%) | 130 (57.8%) |
| Computers & Mathematics | 39 (39.4%) | 60 (60.6%) |
| Architecture & Engineering | 41 (41.4%) | 58 (58.6%) |
| Life, Physical & Social Science | 15 (55.6%) | 12 (44.4%) |
| Community & Social Service | 353 (56.6%) | 271 (43.4%) |
| Education, Arts & Media | 21 (18.9%) | 90 (81.1%) |
| Legal Services & Support | 41 (80.4%) | 10 (19.6%) |
| Education Instruction & Library | 195 (63.1%) | 114 (36.9%) |
| Arts, Media & Entertainment | 96 (62.7%) | 57 (37.2%) |
| Health Diagnosing & Treating | 127 (30.5%) | 290 (69.5%) |
| Health Technologists | 88 (33.1%) | 178 (66.9%) |
| Total (Category) | 907 (45.3%) | 1,097 (54.7%) |
| Total (Overall) | 3,067 (51.3%) | 2,912 (48.7%) |
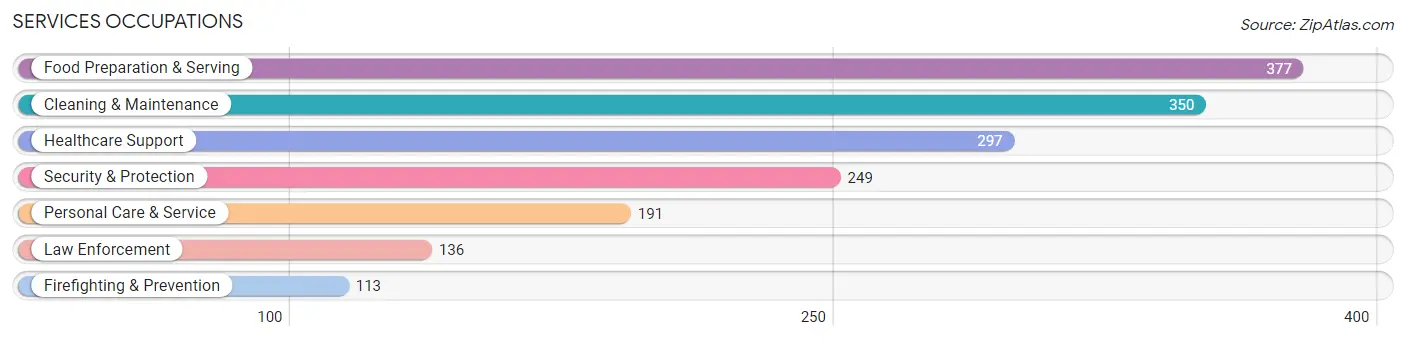
Services Occupations
The most common Services occupations in Verde Village are Food Preparation & Serving (377 | 6.3%), Cleaning & Maintenance (350 | 5.9%), Healthcare Support (297 | 5.0%), Security & Protection (249 | 4.2%), and Personal Care & Service (191 | 3.2%).
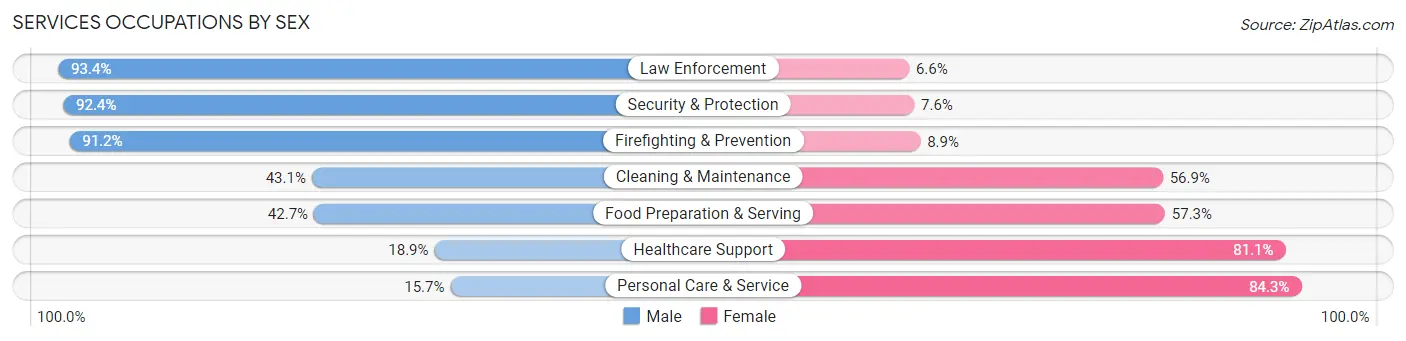
Services Occupations by Sex
Within the Services occupations in Verde Village, the most male-oriented occupations are Law Enforcement (93.4%), Security & Protection (92.4%), and Firefighting & Prevention (91.1%), while the most female-oriented occupations are Personal Care & Service (84.3%), Healthcare Support (81.1%), and Food Preparation & Serving (57.3%).
| Occupation | Male | Female |
| Healthcare Support | 56 (18.9%) | 241 (81.1%) |
| Security & Protection | 230 (92.4%) | 19 (7.6%) |
| Firefighting & Prevention | 103 (91.1%) | 10 (8.8%) |
| Law Enforcement | 127 (93.4%) | 9 (6.6%) |
| Food Preparation & Serving | 161 (42.7%) | 216 (57.3%) |
| Cleaning & Maintenance | 151 (43.1%) | 199 (56.9%) |
| Personal Care & Service | 30 (15.7%) | 161 (84.3%) |
| Total (Category) | 628 (42.9%) | 836 (57.1%) |
| Total (Overall) | 3,067 (51.3%) | 2,912 (48.7%) |
Sales and Office Occupations
The most common Sales and Office occupations in Verde Village are Sales & Related (686 | 11.5%), and Office & Administration (569 | 9.5%).

Sales and Office Occupations by Sex

| Occupation | Male | Female |
| Sales & Related | 303 (44.2%) | 383 (55.8%) |
| Office & Administration | 147 (25.8%) | 422 (74.2%) |
| Total (Category) | 450 (35.9%) | 805 (64.1%) |
| Total (Overall) | 3,067 (51.3%) | 2,912 (48.7%) |
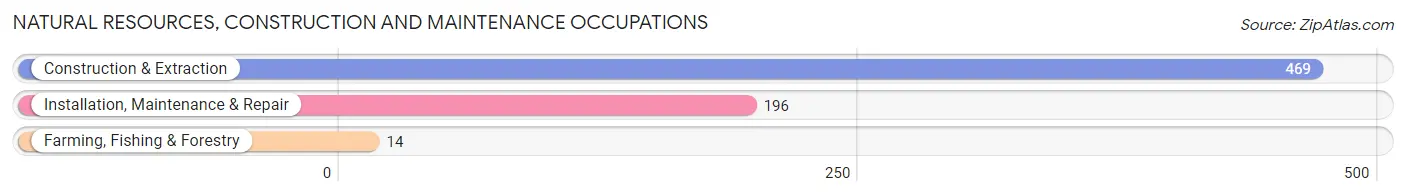
Natural Resources, Construction and Maintenance Occupations
The most common Natural Resources, Construction and Maintenance occupations in Verde Village are Construction & Extraction (469 | 7.8%), Installation, Maintenance & Repair (196 | 3.3%), and Farming, Fishing & Forestry (14 | 0.2%).
Natural Resources, Construction and Maintenance Occupations by Sex
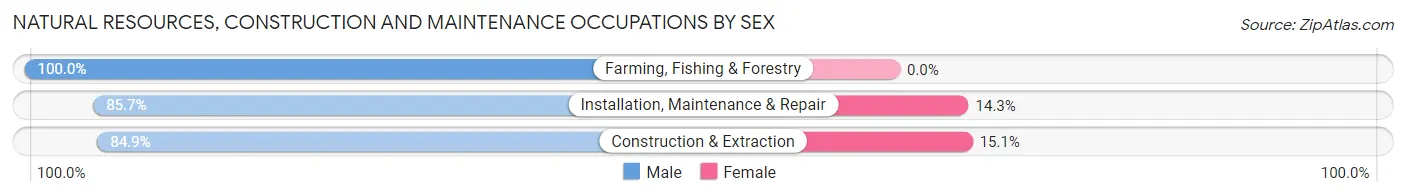
| Occupation | Male | Female |
| Farming, Fishing & Forestry | 14 (100.0%) | 0 (0.0%) |
| Construction & Extraction | 398 (84.9%) | 71 (15.1%) |
| Installation, Maintenance & Repair | 168 (85.7%) | 28 (14.3%) |
| Total (Category) | 580 (85.4%) | 99 (14.6%) |
| Total (Overall) | 3,067 (51.3%) | 2,912 (48.7%) |
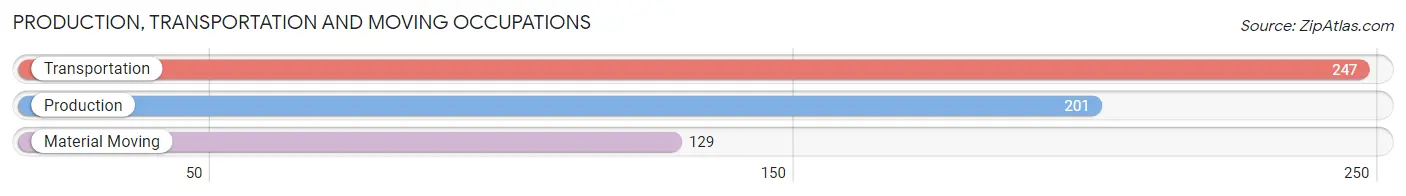
Production, Transportation and Moving Occupations
The most common Production, Transportation and Moving occupations in Verde Village are Transportation (247 | 4.1%), Production (201 | 3.4%), and Material Moving (129 | 2.2%).
Production, Transportation and Moving Occupations by Sex

| Occupation | Male | Female |
| Production | 167 (83.1%) | 34 (16.9%) |
| Transportation | 231 (93.5%) | 16 (6.5%) |
| Material Moving | 104 (80.6%) | 25 (19.4%) |
| Total (Category) | 502 (87.0%) | 75 (13.0%) |
| Total (Overall) | 3,067 (51.3%) | 2,912 (48.7%) |
Employment Industries by Sex in Verde Village
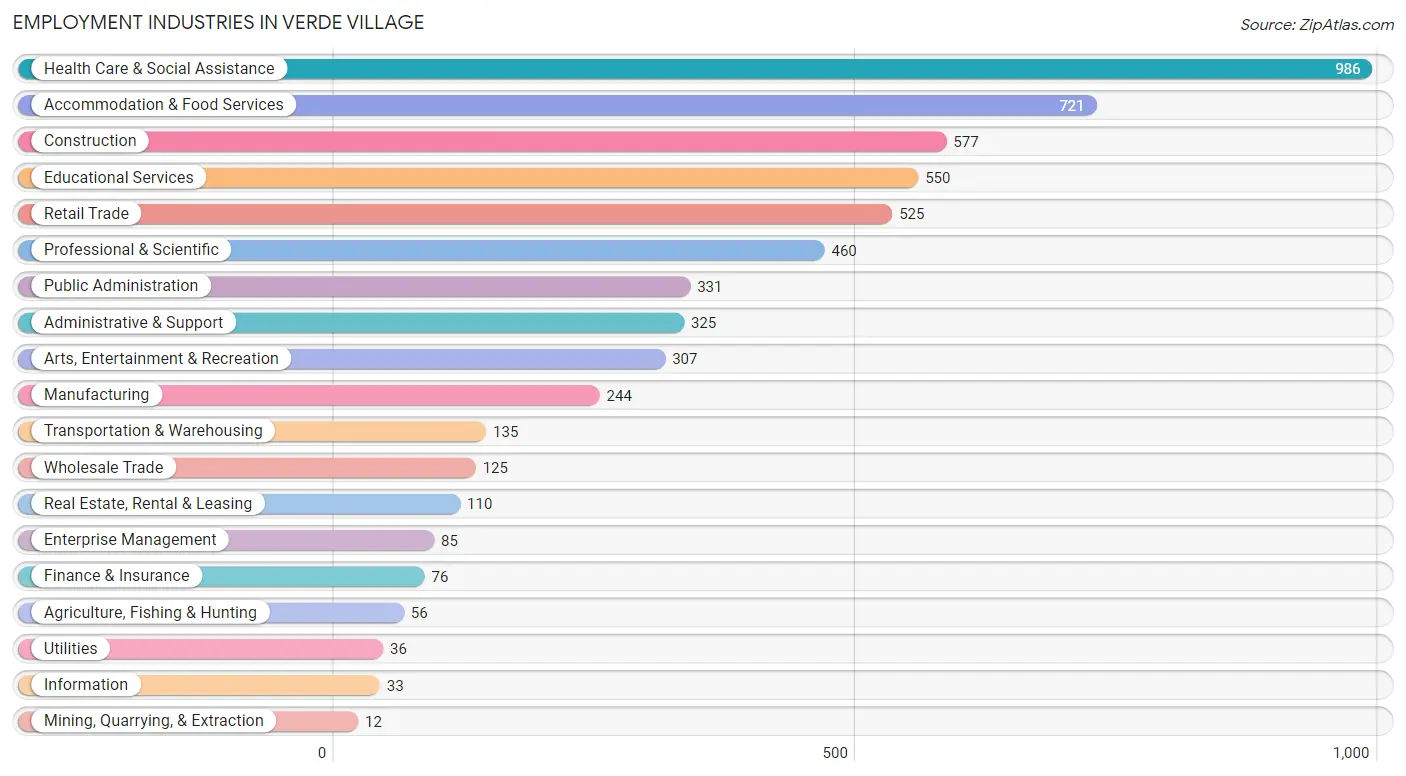
Employment Industries in Verde Village
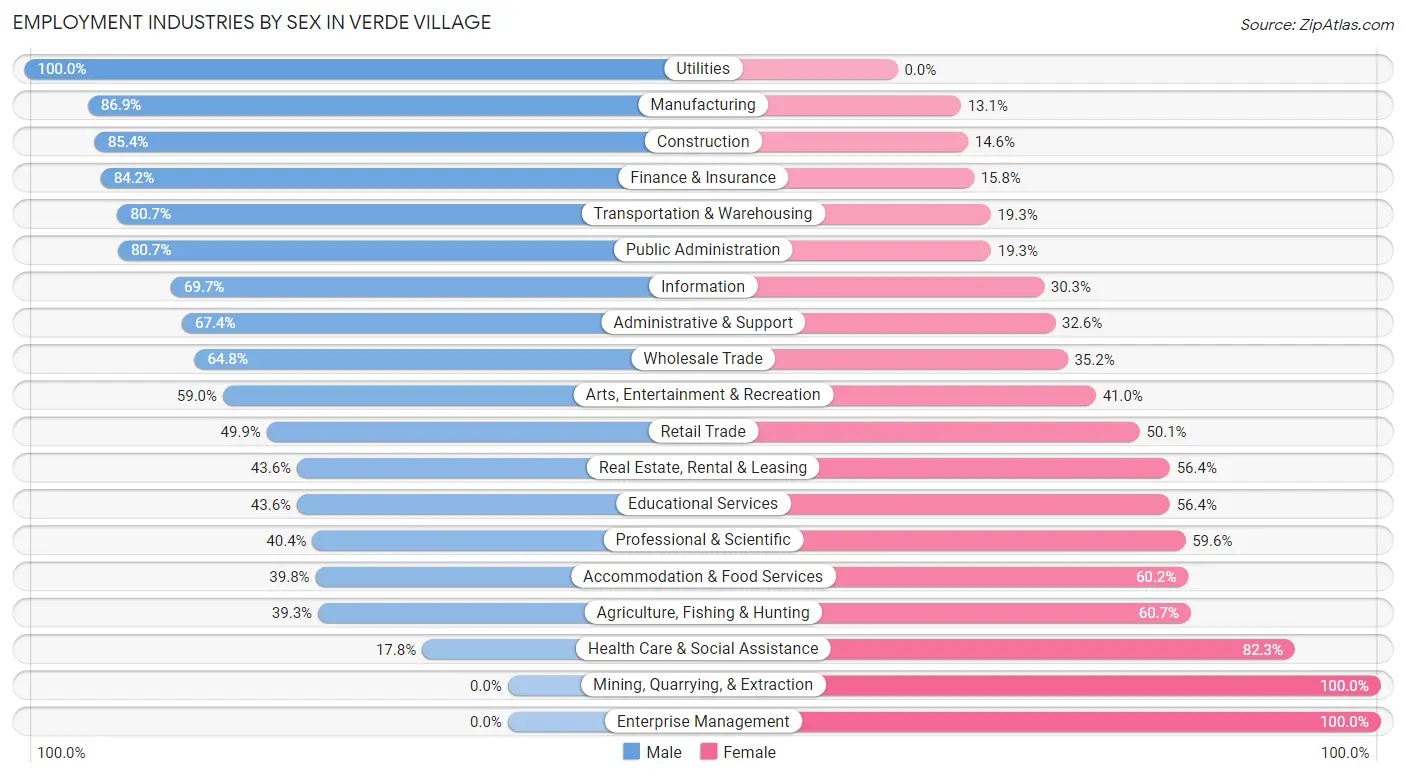
The major employment industries in Verde Village include Health Care & Social Assistance (986 | 16.5%), Accommodation & Food Services (721 | 12.1%), Construction (577 | 9.7%), Educational Services (550 | 9.2%), and Retail Trade (525 | 8.8%).
Employment Industries by Sex in Verde Village
The Verde Village industries that see more men than women are Utilities (100.0%), Manufacturing (86.9%), and Construction (85.4%), whereas the industries that tend to have a higher number of women are Mining, Quarrying, & Extraction (100.0%), Enterprise Management (100.0%), and Health Care & Social Assistance (82.3%).
| Industry | Male | Female |
| Agriculture, Fishing & Hunting | 22 (39.3%) | 34 (60.7%) |
| Mining, Quarrying, & Extraction | 0 (0.0%) | 12 (100.0%) |
| Construction | 493 (85.4%) | 84 (14.6%) |
| Manufacturing | 212 (86.9%) | 32 (13.1%) |
| Wholesale Trade | 81 (64.8%) | 44 (35.2%) |
| Retail Trade | 262 (49.9%) | 263 (50.1%) |
| Transportation & Warehousing | 109 (80.7%) | 26 (19.3%) |
| Utilities | 36 (100.0%) | 0 (0.0%) |
| Information | 23 (69.7%) | 10 (30.3%) |
| Finance & Insurance | 64 (84.2%) | 12 (15.8%) |
| Real Estate, Rental & Leasing | 48 (43.6%) | 62 (56.4%) |
| Professional & Scientific | 186 (40.4%) | 274 (59.6%) |
| Enterprise Management | 0 (0.0%) | 85 (100.0%) |
| Administrative & Support | 219 (67.4%) | 106 (32.6%) |
| Educational Services | 240 (43.6%) | 310 (56.4%) |
| Health Care & Social Assistance | 175 (17.7%) | 811 (82.3%) |
| Arts, Entertainment & Recreation | 181 (59.0%) | 126 (41.0%) |
| Accommodation & Food Services | 287 (39.8%) | 434 (60.2%) |
| Public Administration | 267 (80.7%) | 64 (19.3%) |
| Total | 3,067 (51.3%) | 2,912 (48.7%) |
Education in Verde Village
School Enrollment in Verde Village
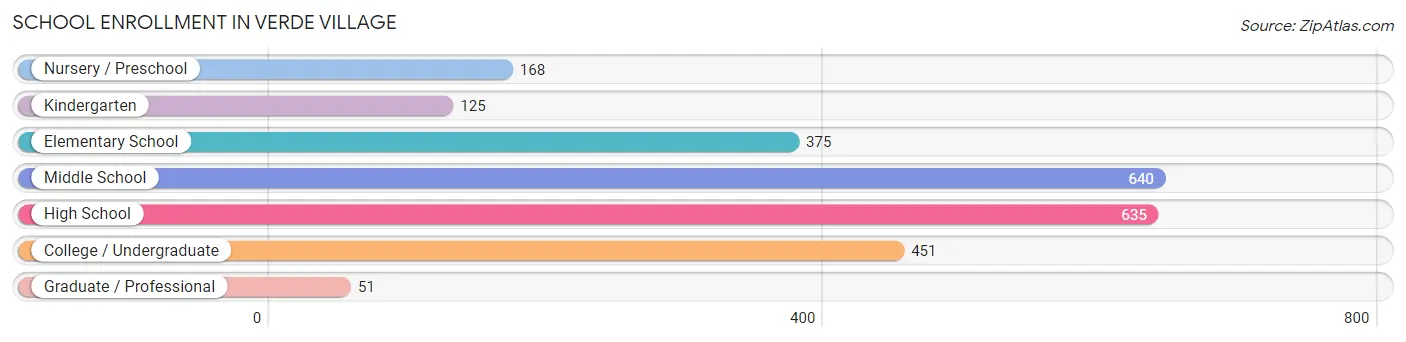
The most common levels of schooling among the 2,445 students in Verde Village are middle school (640 | 26.2%), high school (635 | 26.0%), and college / undergraduate (451 | 18.4%).
| School Level | # Students | % Students |
| Nursery / Preschool | 168 | 6.9% |
| Kindergarten | 125 | 5.1% |
| Elementary School | 375 | 15.3% |
| Middle School | 640 | 26.2% |
| High School | 635 | 26.0% |
| College / Undergraduate | 451 | 18.4% |
| Graduate / Professional | 51 | 2.1% |
| Total | 2,445 | 100.0% |
School Enrollment by Age by Funding Source in Verde Village
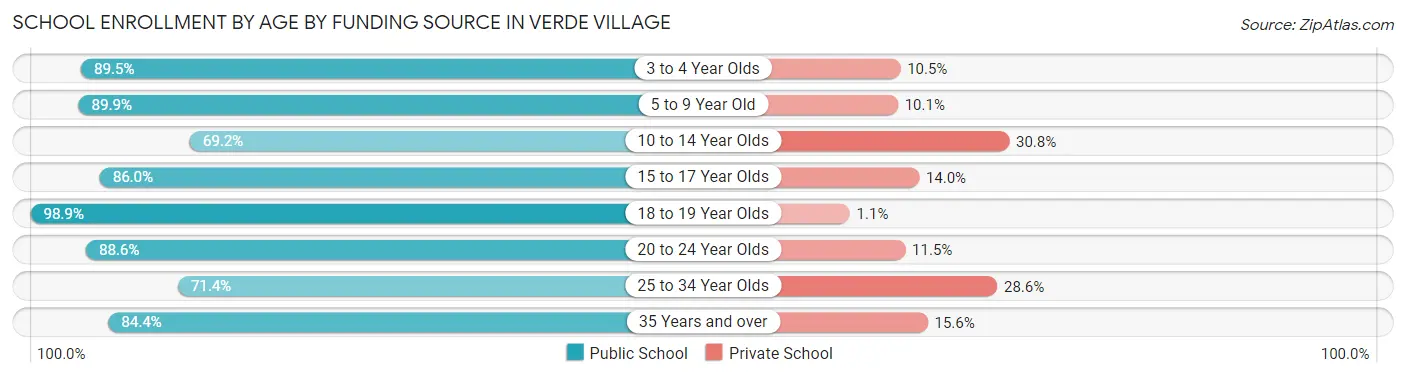
Out of a total of 2,445 students who are enrolled in schools in Verde Village, 423 (17.3%) attend a private institution, while the remaining 2,022 (82.7%) are enrolled in public schools. The age group of 10 to 14 year olds has the highest likelihood of being enrolled in private schools, with 223 (30.8% in the age bracket) enrolled. Conversely, the age group of 18 to 19 year olds has the lowest likelihood of being enrolled in a private school, with 177 (98.9% in the age bracket) attending a public institution.
| Age Bracket | Public School | Private School |
| 3 to 4 Year Olds | 136 (89.5%) | 16 (10.5%) |
| 5 to 9 Year Old | 393 (89.9%) | 44 (10.1%) |
| 10 to 14 Year Olds | 501 (69.2%) | 223 (30.8%) |
| 15 to 17 Year Olds | 417 (86.0%) | 68 (14.0%) |
| 18 to 19 Year Olds | 177 (98.9%) | 2 (1.1%) |
| 20 to 24 Year Olds | 201 (88.5%) | 26 (11.5%) |
| 25 to 34 Year Olds | 35 (71.4%) | 14 (28.6%) |
| 35 Years and over | 162 (84.4%) | 30 (15.6%) |
| Total | 2,022 (82.7%) | 423 (17.3%) |
Educational Attainment by Field of Study in Verde Village
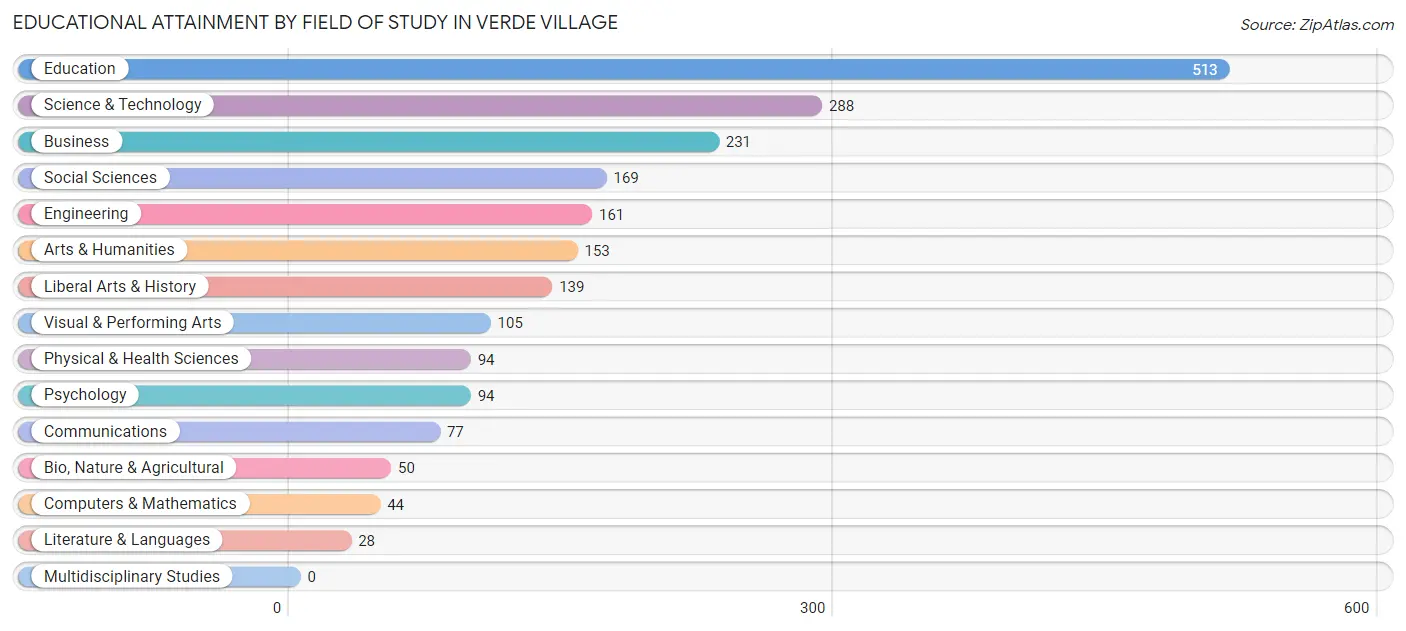
Education (513 | 23.9%), science & technology (288 | 13.4%), business (231 | 10.8%), social sciences (169 | 7.9%), and engineering (161 | 7.5%) are the most common fields of study among 2,146 individuals in Verde Village who have obtained a bachelor's degree or higher.
| Field of Study | # Graduates | % Graduates |
| Computers & Mathematics | 44 | 2.1% |
| Bio, Nature & Agricultural | 50 | 2.3% |
| Physical & Health Sciences | 94 | 4.4% |
| Psychology | 94 | 4.4% |
| Social Sciences | 169 | 7.9% |
| Engineering | 161 | 7.5% |
| Multidisciplinary Studies | 0 | 0.0% |
| Science & Technology | 288 | 13.4% |
| Business | 231 | 10.8% |
| Education | 513 | 23.9% |
| Literature & Languages | 28 | 1.3% |
| Liberal Arts & History | 139 | 6.5% |
| Visual & Performing Arts | 105 | 4.9% |
| Communications | 77 | 3.6% |
| Arts & Humanities | 153 | 7.1% |
| Total | 2,146 | 100.0% |
Transportation & Commute in Verde Village
Vehicle Availability by Sex in Verde Village
The most prevalent vehicle ownership categories in Verde Village are males with 2 vehicles (1,477, accounting for 48.6%) and females with 2 vehicles (1,249, making up 52.3%).
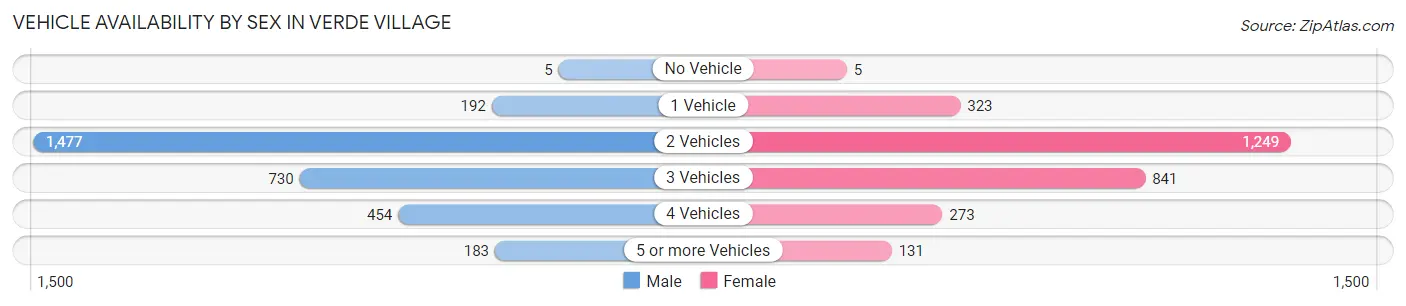
| Vehicles Available | Male | Female |
| No Vehicle | 5 (0.2%) | 5 (0.2%) |
| 1 Vehicle | 192 (6.3%) | 323 (11.5%) |
| 2 Vehicles | 1,477 (48.6%) | 1,249 (44.3%) |
| 3 Vehicles | 730 (24.0%) | 841 (29.8%) |
| 4 Vehicles | 454 (14.9%) | 273 (9.7%) |
| 5 or more Vehicles | 183 (6.0%) | 131 (4.6%) |
| Total | 3,041 (100.0%) | 2,822 (100.0%) |
Commute Time in Verde Village
The most frequently occuring commute durations in Verde Village are 5 to 9 minutes (1,237 commuters, 22.8%), 10 to 14 minutes (1,229 commuters, 22.6%), and 30 to 34 minutes (709 commuters, 13.1%).
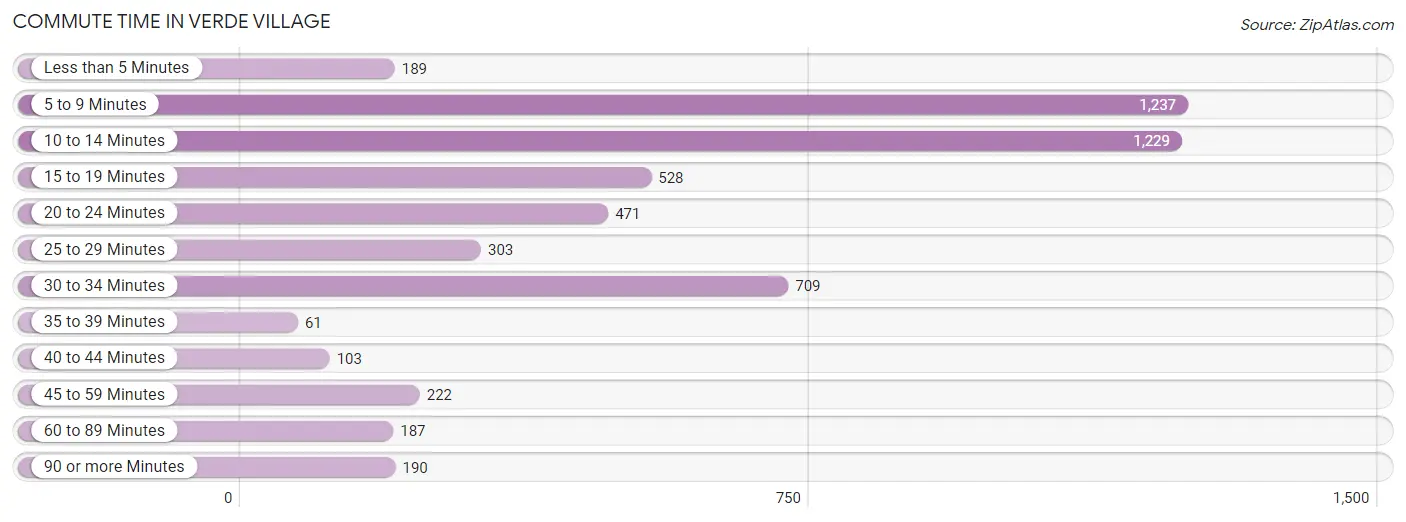
| Commute Time | # Commuters | % Commuters |
| Less than 5 Minutes | 189 | 3.5% |
| 5 to 9 Minutes | 1,237 | 22.8% |
| 10 to 14 Minutes | 1,229 | 22.6% |
| 15 to 19 Minutes | 528 | 9.7% |
| 20 to 24 Minutes | 471 | 8.7% |
| 25 to 29 Minutes | 303 | 5.6% |
| 30 to 34 Minutes | 709 | 13.1% |
| 35 to 39 Minutes | 61 | 1.1% |
| 40 to 44 Minutes | 103 | 1.9% |
| 45 to 59 Minutes | 222 | 4.1% |
| 60 to 89 Minutes | 187 | 3.4% |
| 90 or more Minutes | 190 | 3.5% |
Commute Time by Sex in Verde Village
The most common commute times in Verde Village are 5 to 9 minutes (672 commuters, 23.1%) for males and 10 to 14 minutes (709 commuters, 28.2%) for females.
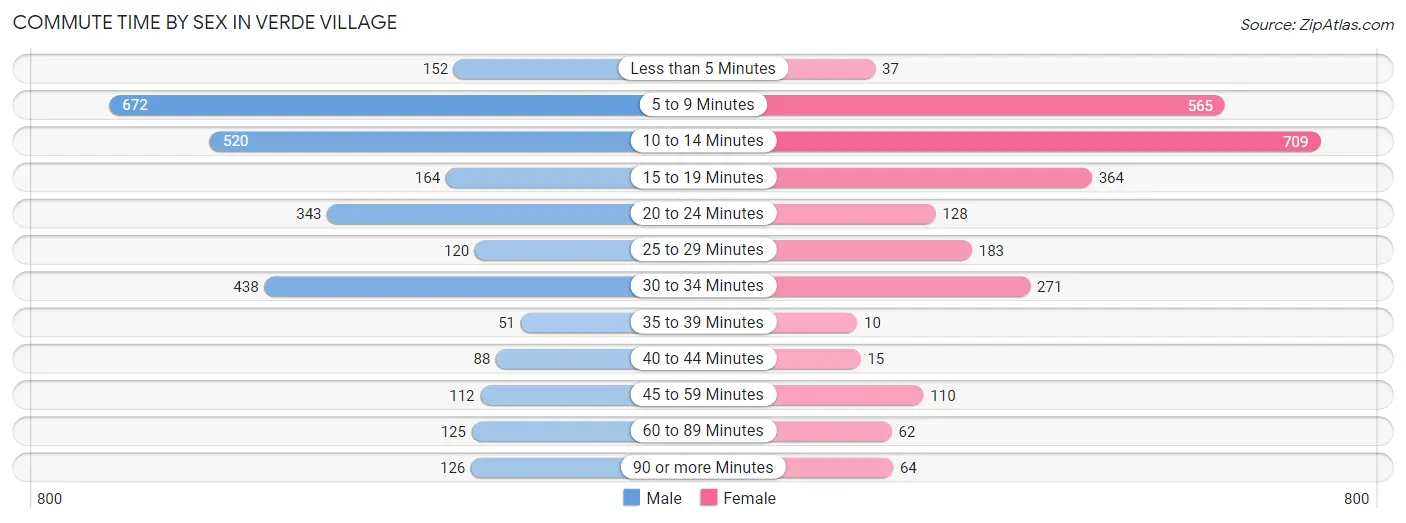
| Commute Time | Male | Female |
| Less than 5 Minutes | 152 (5.2%) | 37 (1.5%) |
| 5 to 9 Minutes | 672 (23.1%) | 565 (22.4%) |
| 10 to 14 Minutes | 520 (17.9%) | 709 (28.2%) |
| 15 to 19 Minutes | 164 (5.6%) | 364 (14.5%) |
| 20 to 24 Minutes | 343 (11.8%) | 128 (5.1%) |
| 25 to 29 Minutes | 120 (4.1%) | 183 (7.3%) |
| 30 to 34 Minutes | 438 (15.0%) | 271 (10.8%) |
| 35 to 39 Minutes | 51 (1.8%) | 10 (0.4%) |
| 40 to 44 Minutes | 88 (3.0%) | 15 (0.6%) |
| 45 to 59 Minutes | 112 (3.8%) | 110 (4.4%) |
| 60 to 89 Minutes | 125 (4.3%) | 62 (2.5%) |
| 90 or more Minutes | 126 (4.3%) | 64 (2.5%) |
Time of Departure to Work by Sex in Verde Village
The most frequent times of departure to work in Verde Village are 6:30 AM to 6:59 AM (502, 17.2%) for males and 7:30 AM to 7:59 AM (418, 16.6%) for females.
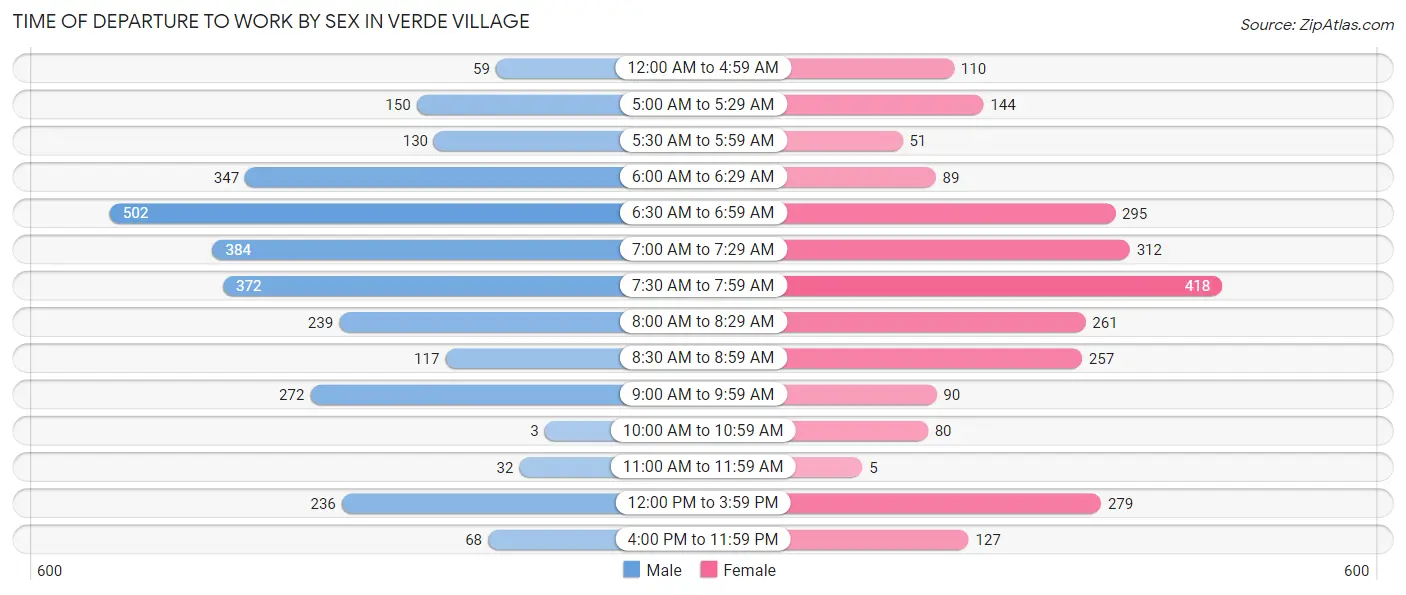
| Time of Departure | Male | Female |
| 12:00 AM to 4:59 AM | 59 (2.0%) | 110 (4.4%) |
| 5:00 AM to 5:29 AM | 150 (5.1%) | 144 (5.7%) |
| 5:30 AM to 5:59 AM | 130 (4.5%) | 51 (2.0%) |
| 6:00 AM to 6:29 AM | 347 (11.9%) | 89 (3.5%) |
| 6:30 AM to 6:59 AM | 502 (17.2%) | 295 (11.7%) |
| 7:00 AM to 7:29 AM | 384 (13.2%) | 312 (12.4%) |
| 7:30 AM to 7:59 AM | 372 (12.8%) | 418 (16.6%) |
| 8:00 AM to 8:29 AM | 239 (8.2%) | 261 (10.4%) |
| 8:30 AM to 8:59 AM | 117 (4.0%) | 257 (10.2%) |
| 9:00 AM to 9:59 AM | 272 (9.3%) | 90 (3.6%) |
| 10:00 AM to 10:59 AM | 3 (0.1%) | 80 (3.2%) |
| 11:00 AM to 11:59 AM | 32 (1.1%) | 5 (0.2%) |
| 12:00 PM to 3:59 PM | 236 (8.1%) | 279 (11.1%) |
| 4:00 PM to 11:59 PM | 68 (2.3%) | 127 (5.0%) |
| Total | 2,911 (100.0%) | 2,518 (100.0%) |
Housing Occupancy in Verde Village
Occupancy by Ownership in Verde Village
Of the total 4,924 dwellings in Verde Village, owner-occupied units account for 3,854 (78.3%), while renter-occupied units make up 1,070 (21.7%).
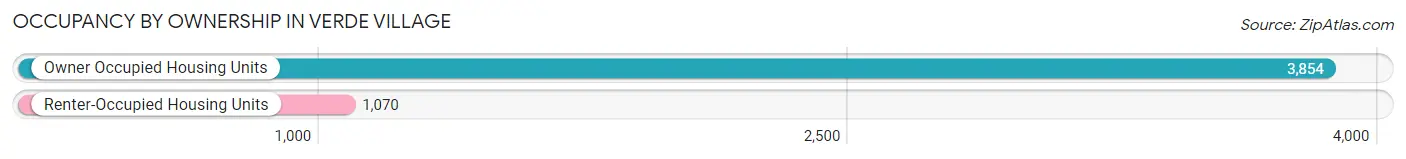
| Occupancy | # Housing Units | % Housing Units |
| Owner Occupied Housing Units | 3,854 | 78.3% |
| Renter-Occupied Housing Units | 1,070 | 21.7% |
| Total Occupied Housing Units | 4,924 | 100.0% |
Occupancy by Household Size in Verde Village
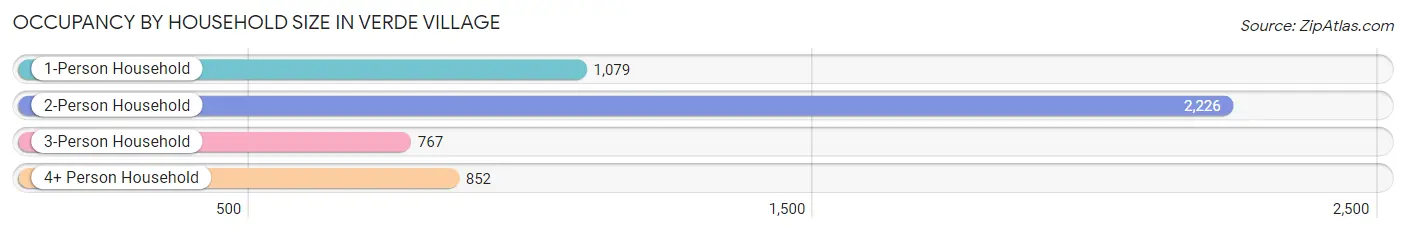
| Household Size | # Housing Units | % Housing Units |
| 1-Person Household | 1,079 | 21.9% |
| 2-Person Household | 2,226 | 45.2% |
| 3-Person Household | 767 | 15.6% |
| 4+ Person Household | 852 | 17.3% |
| Total Housing Units | 4,924 | 100.0% |
Occupancy by Ownership by Household Size in Verde Village
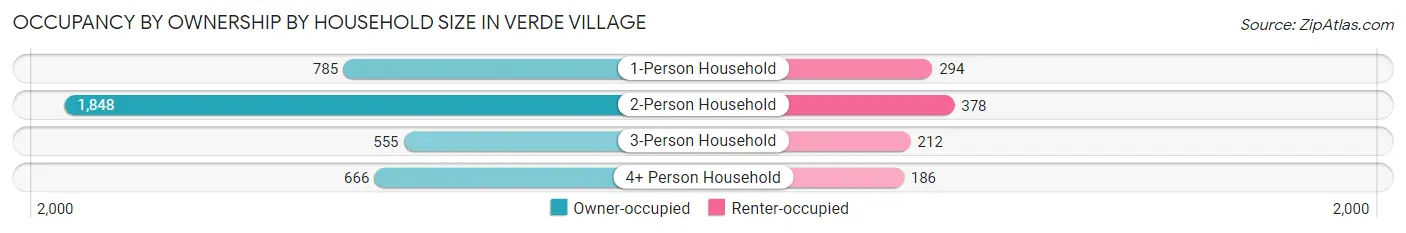
| Household Size | Owner-occupied | Renter-occupied |
| 1-Person Household | 785 (72.8%) | 294 (27.3%) |
| 2-Person Household | 1,848 (83.0%) | 378 (17.0%) |
| 3-Person Household | 555 (72.4%) | 212 (27.6%) |
| 4+ Person Household | 666 (78.2%) | 186 (21.8%) |
| Total Housing Units | 3,854 (78.3%) | 1,070 (21.7%) |
Occupancy by Educational Attainment in Verde Village
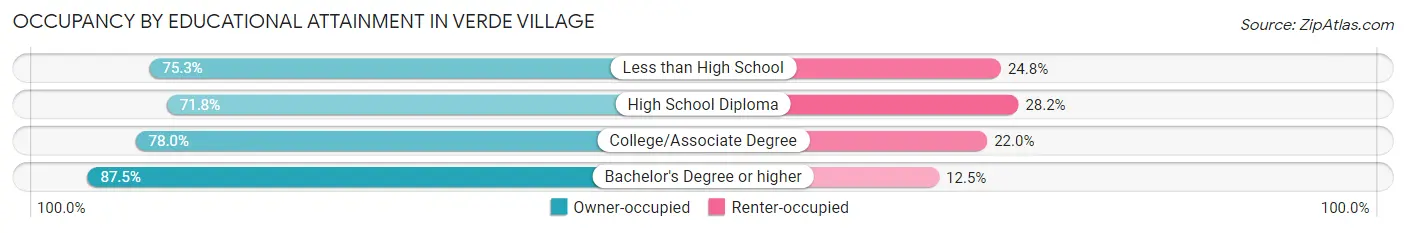
| Household Size | Owner-occupied | Renter-occupied |
| Less than High School | 298 (75.2%) | 98 (24.7%) |
| High School Diploma | 1,028 (71.8%) | 404 (28.2%) |
| College/Associate Degree | 1,484 (78.0%) | 419 (22.0%) |
| Bachelor's Degree or higher | 1,044 (87.5%) | 149 (12.5%) |
Occupancy by Age of Householder in Verde Village
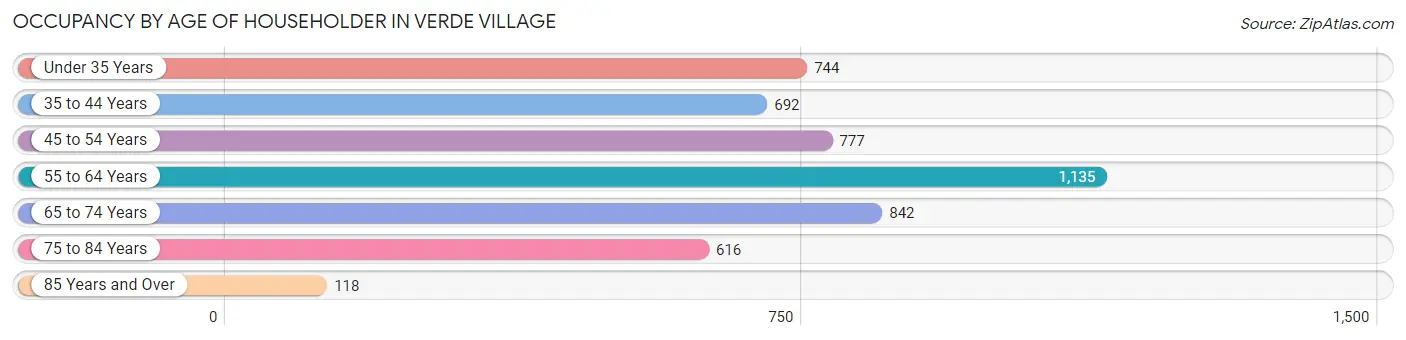
| Age Bracket | # Households | % Households |
| Under 35 Years | 744 | 15.1% |
| 35 to 44 Years | 692 | 14.1% |
| 45 to 54 Years | 777 | 15.8% |
| 55 to 64 Years | 1,135 | 23.1% |
| 65 to 74 Years | 842 | 17.1% |
| 75 to 84 Years | 616 | 12.5% |
| 85 Years and Over | 118 | 2.4% |
| Total | 4,924 | 100.0% |
Housing Finances in Verde Village
Median Income by Occupancy in Verde Village
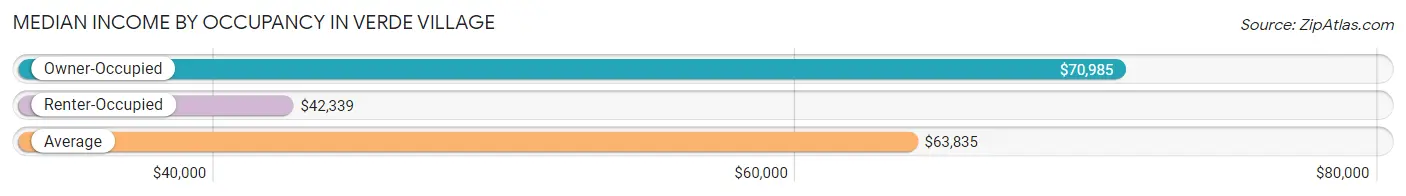
| Occupancy Type | # Households | Median Income |
| Owner-Occupied | 3,854 (78.3%) | $70,985 |
| Renter-Occupied | 1,070 (21.7%) | $42,339 |
| Average | 4,924 (100.0%) | $63,835 |
Occupancy by Householder Income Bracket in Verde Village
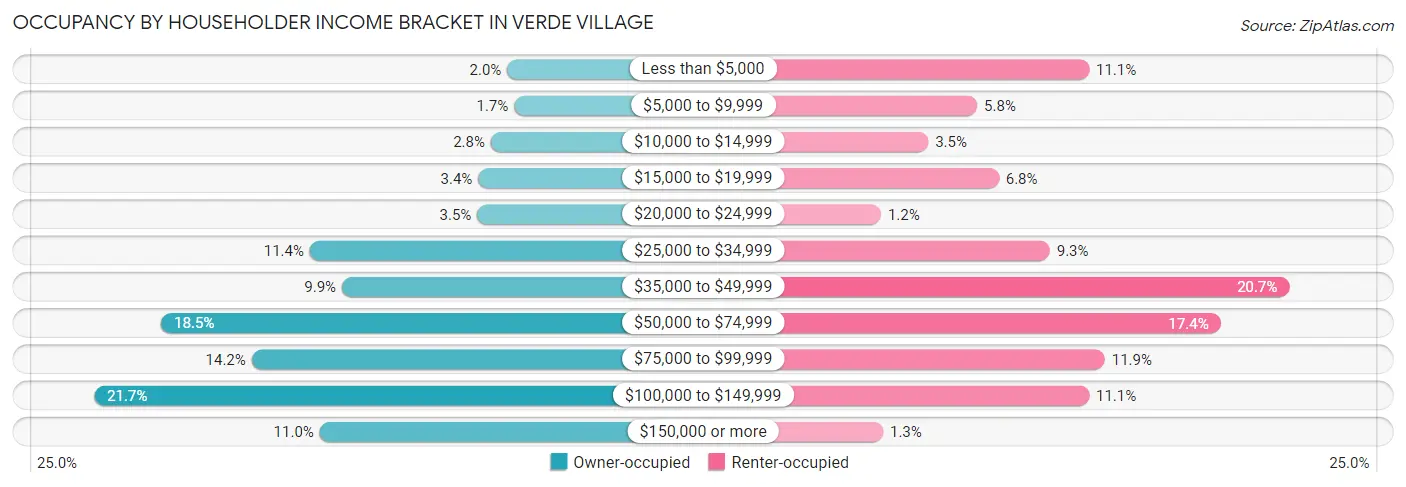
| Income Bracket | Owner-occupied | Renter-occupied |
| Less than $5,000 | 78 (2.0%) | 119 (11.1%) |
| $5,000 to $9,999 | 65 (1.7%) | 62 (5.8%) |
| $10,000 to $14,999 | 108 (2.8%) | 37 (3.5%) |
| $15,000 to $19,999 | 131 (3.4%) | 73 (6.8%) |
| $20,000 to $24,999 | 133 (3.5%) | 13 (1.2%) |
| $25,000 to $34,999 | 440 (11.4%) | 99 (9.2%) |
| $35,000 to $49,999 | 381 (9.9%) | 221 (20.6%) |
| $50,000 to $74,999 | 713 (18.5%) | 186 (17.4%) |
| $75,000 to $99,999 | 547 (14.2%) | 127 (11.9%) |
| $100,000 to $149,999 | 836 (21.7%) | 119 (11.1%) |
| $150,000 or more | 422 (11.0%) | 14 (1.3%) |
| Total | 3,854 (100.0%) | 1,070 (100.0%) |
Monthly Housing Cost Tiers in Verde Village
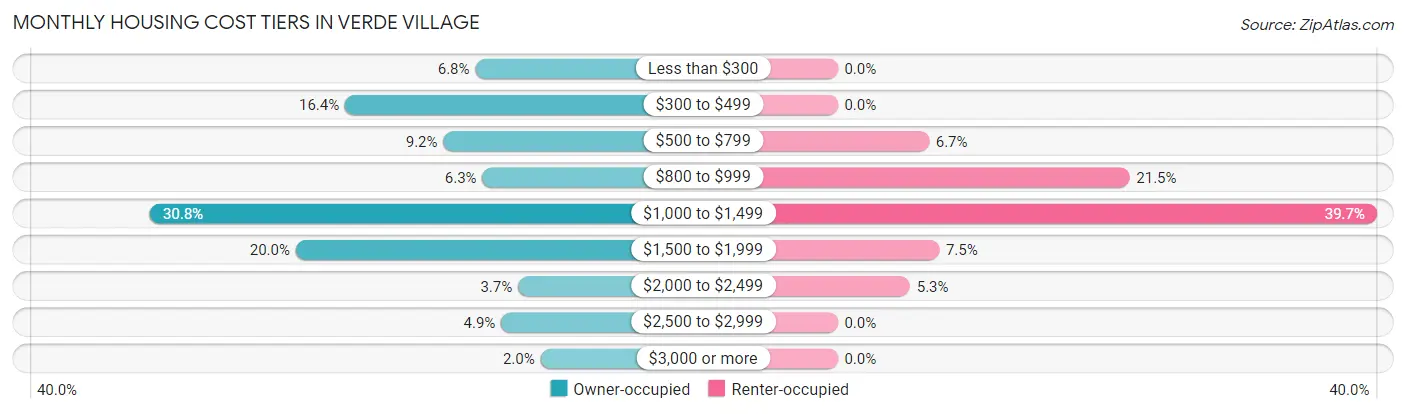
| Monthly Cost | Owner-occupied | Renter-occupied |
| Less than $300 | 262 (6.8%) | 0 (0.0%) |
| $300 to $499 | 632 (16.4%) | 0 (0.0%) |
| $500 to $799 | 353 (9.2%) | 72 (6.7%) |
| $800 to $999 | 242 (6.3%) | 230 (21.5%) |
| $1,000 to $1,499 | 1,186 (30.8%) | 425 (39.7%) |
| $1,500 to $1,999 | 772 (20.0%) | 80 (7.5%) |
| $2,000 to $2,499 | 141 (3.7%) | 57 (5.3%) |
| $2,500 to $2,999 | 189 (4.9%) | 0 (0.0%) |
| $3,000 or more | 77 (2.0%) | 0 (0.0%) |
| Total | 3,854 (100.0%) | 1,070 (100.0%) |
Physical Housing Characteristics in Verde Village
Housing Structures in Verde Village
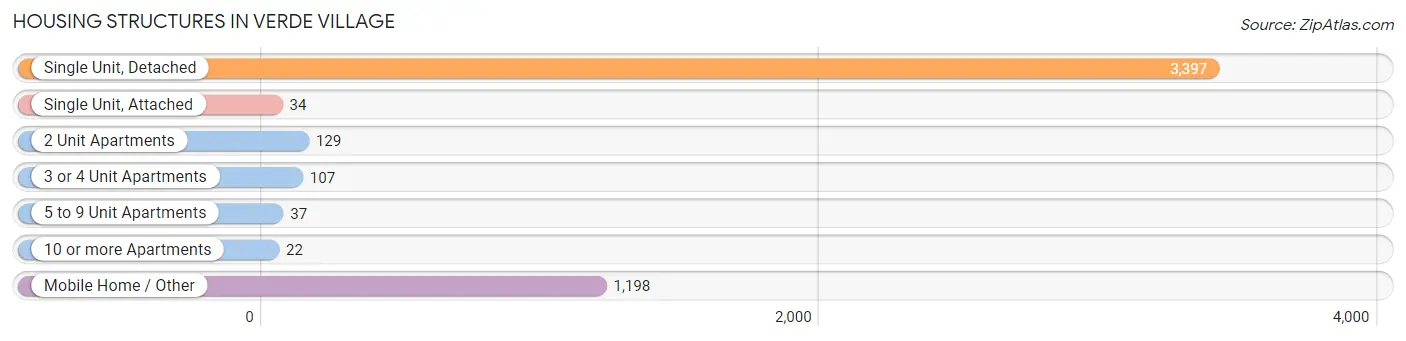
| Structure Type | # Housing Units | % Housing Units |
| Single Unit, Detached | 3,397 | 69.0% |
| Single Unit, Attached | 34 | 0.7% |
| 2 Unit Apartments | 129 | 2.6% |
| 3 or 4 Unit Apartments | 107 | 2.2% |
| 5 to 9 Unit Apartments | 37 | 0.7% |
| 10 or more Apartments | 22 | 0.4% |
| Mobile Home / Other | 1,198 | 24.3% |
| Total | 4,924 | 100.0% |
Housing Structures by Occupancy in Verde Village
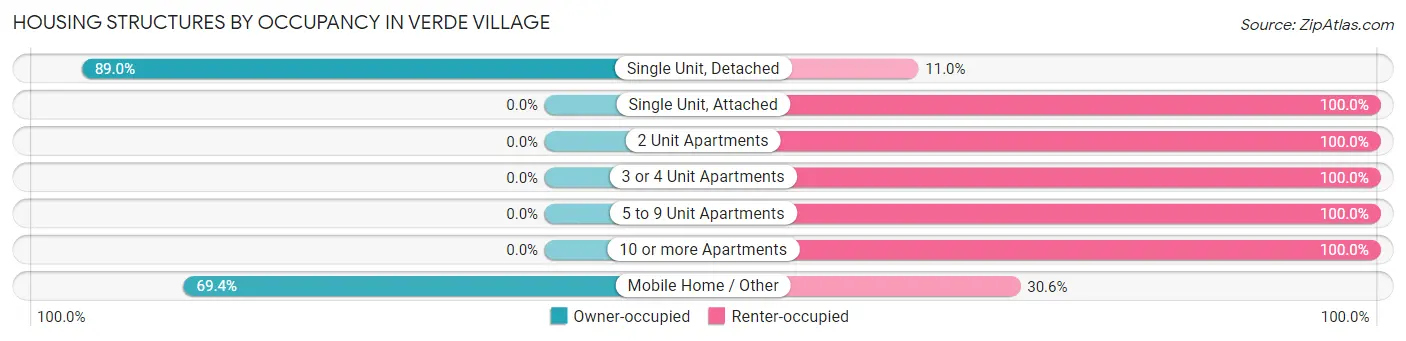
| Structure Type | Owner-occupied | Renter-occupied |
| Single Unit, Detached | 3,023 (89.0%) | 374 (11.0%) |
| Single Unit, Attached | 0 (0.0%) | 34 (100.0%) |
| 2 Unit Apartments | 0 (0.0%) | 129 (100.0%) |
| 3 or 4 Unit Apartments | 0 (0.0%) | 107 (100.0%) |
| 5 to 9 Unit Apartments | 0 (0.0%) | 37 (100.0%) |
| 10 or more Apartments | 0 (0.0%) | 22 (100.0%) |
| Mobile Home / Other | 831 (69.4%) | 367 (30.6%) |
| Total | 3,854 (78.3%) | 1,070 (21.7%) |
Housing Structures by Number of Rooms in Verde Village
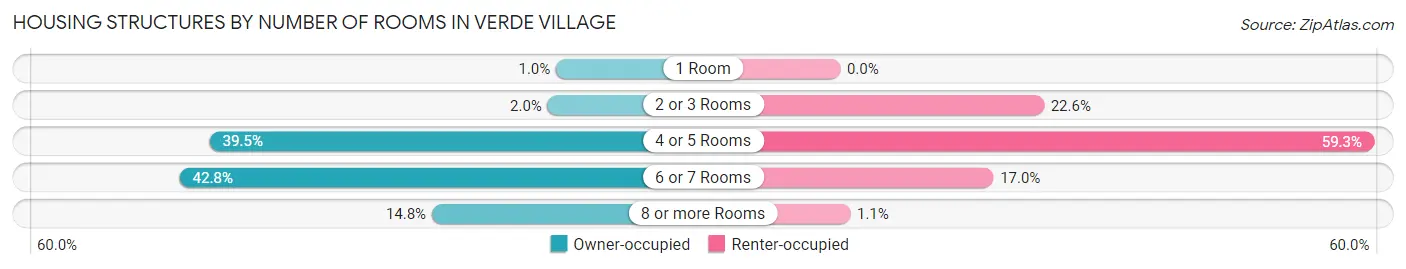
| Number of Rooms | Owner-occupied | Renter-occupied |
| 1 Room | 39 (1.0%) | 0 (0.0%) |
| 2 or 3 Rooms | 75 (1.9%) | 242 (22.6%) |
| 4 or 5 Rooms | 1,521 (39.5%) | 634 (59.3%) |
| 6 or 7 Rooms | 1,649 (42.8%) | 182 (17.0%) |
| 8 or more Rooms | 570 (14.8%) | 12 (1.1%) |
| Total | 3,854 (100.0%) | 1,070 (100.0%) |
Housing Structure by Heating Type in Verde Village
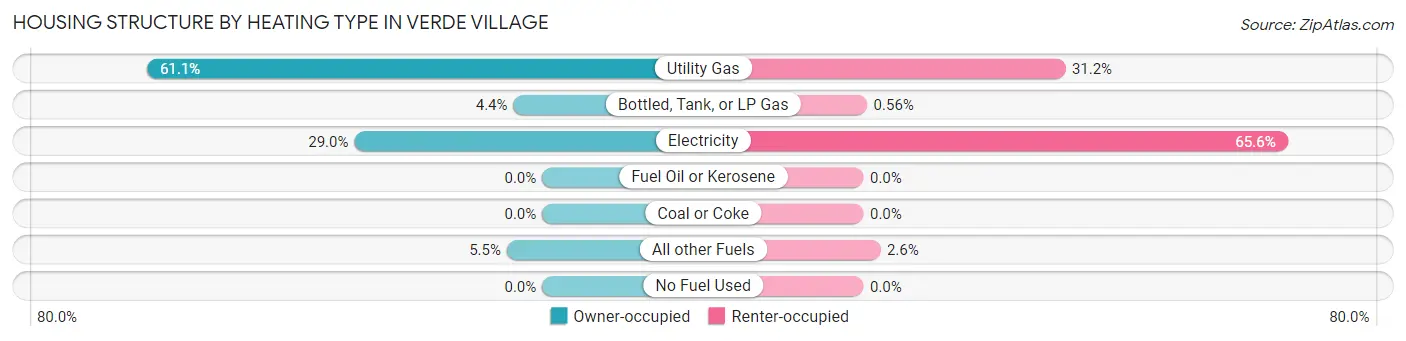
| Heating Type | Owner-occupied | Renter-occupied |
| Utility Gas | 2,354 (61.1%) | 334 (31.2%) |
| Bottled, Tank, or LP Gas | 171 (4.4%) | 6 (0.6%) |
| Electricity | 1,119 (29.0%) | 702 (65.6%) |
| Fuel Oil or Kerosene | 0 (0.0%) | 0 (0.0%) |
| Coal or Coke | 0 (0.0%) | 0 (0.0%) |
| All other Fuels | 210 (5.4%) | 28 (2.6%) |
| No Fuel Used | 0 (0.0%) | 0 (0.0%) |
| Total | 3,854 (100.0%) | 1,070 (100.0%) |
Household Vehicle Usage in Verde Village
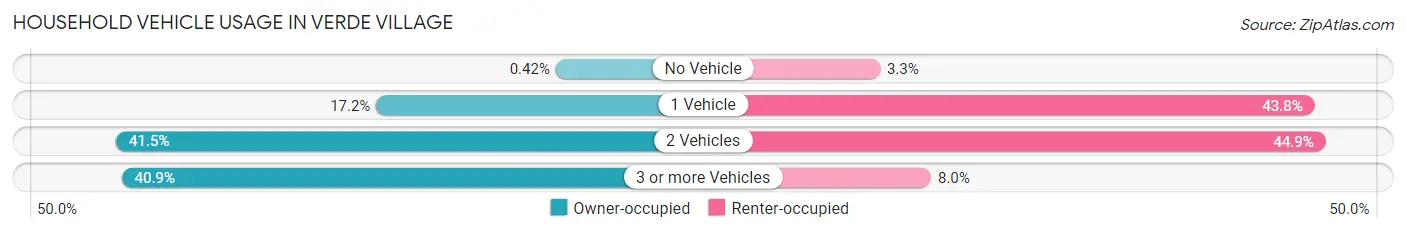
| Vehicles per Household | Owner-occupied | Renter-occupied |
| No Vehicle | 16 (0.4%) | 35 (3.3%) |
| 1 Vehicle | 662 (17.2%) | 469 (43.8%) |
| 2 Vehicles | 1,598 (41.5%) | 480 (44.9%) |
| 3 or more Vehicles | 1,578 (40.9%) | 86 (8.0%) |
| Total | 3,854 (100.0%) | 1,070 (100.0%) |
Real Estate & Mortgages in Verde Village
Real Estate and Mortgage Overview in Verde Village
| Characteristic | Without Mortgage | With Mortgage |
| Housing Units | 1,124 | 2,730 |
| Median Property Value | $264,400 | $291,300 |
| Median Household Income | $45,000 | $316 |
| Monthly Housing Costs | $397 | $77 |
| Real Estate Taxes | $1,536 | $103 |
Property Value by Mortgage Status in Verde Village
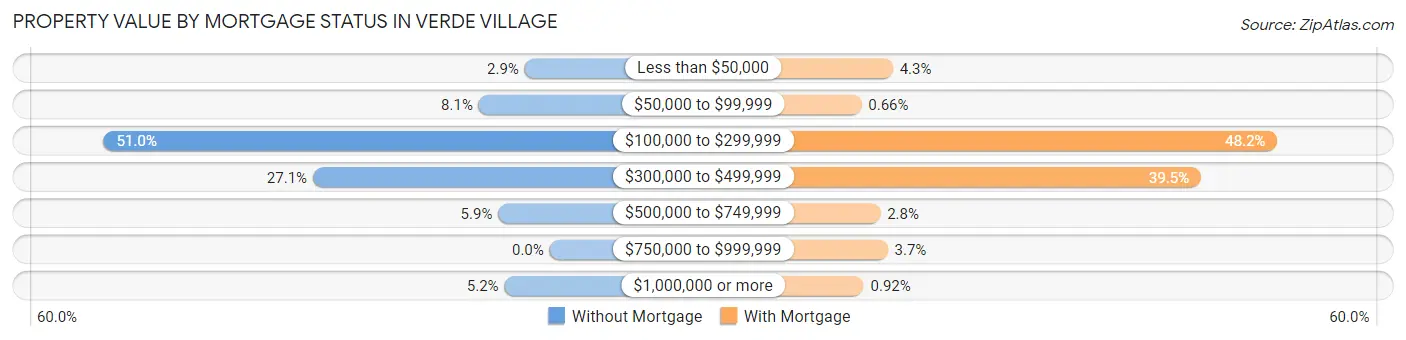
| Property Value | Without Mortgage | With Mortgage |
| Less than $50,000 | 32 (2.9%) | 116 (4.3%) |
| $50,000 to $99,999 | 91 (8.1%) | 18 (0.7%) |
| $100,000 to $299,999 | 573 (51.0%) | 1,316 (48.2%) |
| $300,000 to $499,999 | 304 (27.1%) | 1,078 (39.5%) |
| $500,000 to $749,999 | 66 (5.9%) | 77 (2.8%) |
| $750,000 to $999,999 | 0 (0.0%) | 100 (3.7%) |
| $1,000,000 or more | 58 (5.2%) | 25 (0.9%) |
| Total | 1,124 (100.0%) | 2,730 (100.0%) |
Household Income by Mortgage Status in Verde Village
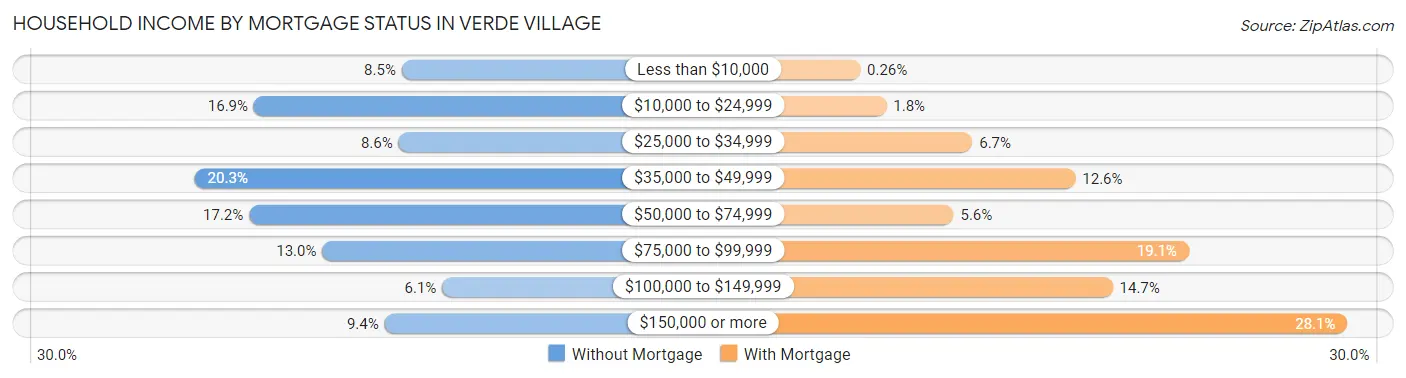
| Household Income | Without Mortgage | With Mortgage |
| Less than $10,000 | 95 (8.5%) | 7 (0.3%) |
| $10,000 to $24,999 | 190 (16.9%) | 48 (1.8%) |
| $25,000 to $34,999 | 97 (8.6%) | 182 (6.7%) |
| $35,000 to $49,999 | 228 (20.3%) | 343 (12.6%) |
| $50,000 to $74,999 | 193 (17.2%) | 153 (5.6%) |
| $75,000 to $99,999 | 146 (13.0%) | 520 (19.1%) |
| $100,000 to $149,999 | 69 (6.1%) | 401 (14.7%) |
| $150,000 or more | 106 (9.4%) | 767 (28.1%) |
| Total | 1,124 (100.0%) | 2,730 (100.0%) |
Property Value to Household Income Ratio in Verde Village
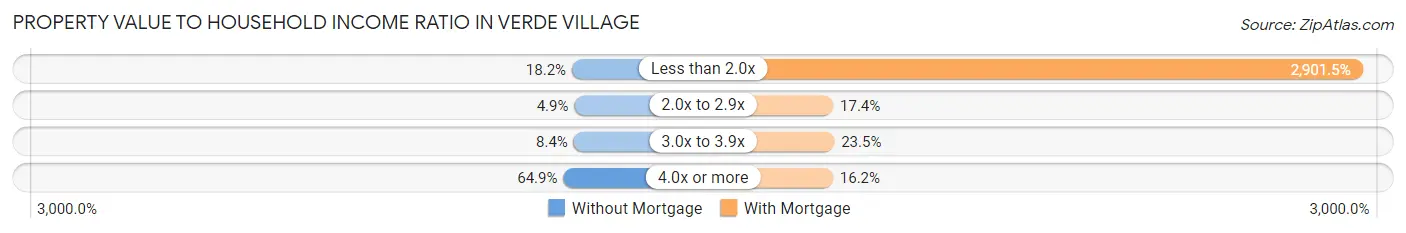
| Value-to-Income Ratio | Without Mortgage | With Mortgage |
| Less than 2.0x | 204 (18.1%) | 79,211 (2,901.5%) |
| 2.0x to 2.9x | 55 (4.9%) | 476 (17.4%) |
| 3.0x to 3.9x | 94 (8.4%) | 642 (23.5%) |
| 4.0x or more | 729 (64.9%) | 441 (16.2%) |
| Total | 1,124 (100.0%) | 2,730 (100.0%) |
Real Estate Taxes by Mortgage Status in Verde Village
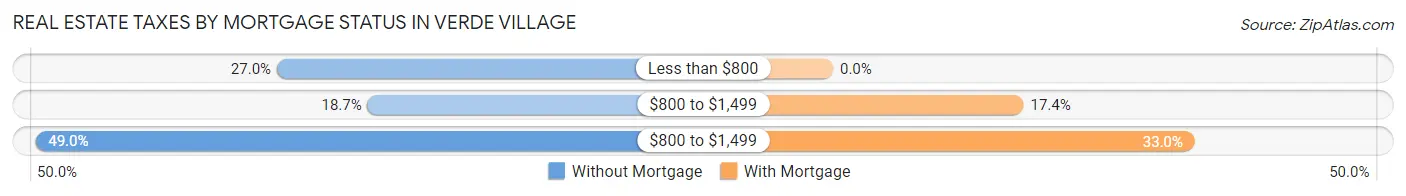
| Property Taxes | Without Mortgage | With Mortgage |
| Less than $800 | 303 (27.0%) | 0 (0.0%) |
| $800 to $1,499 | 210 (18.7%) | 475 (17.4%) |
| $800 to $1,499 | 551 (49.0%) | 902 (33.0%) |
| Total | 1,124 (100.0%) | 2,730 (100.0%) |
Health & Disability in Verde Village
Health Insurance Coverage by Age in Verde Village
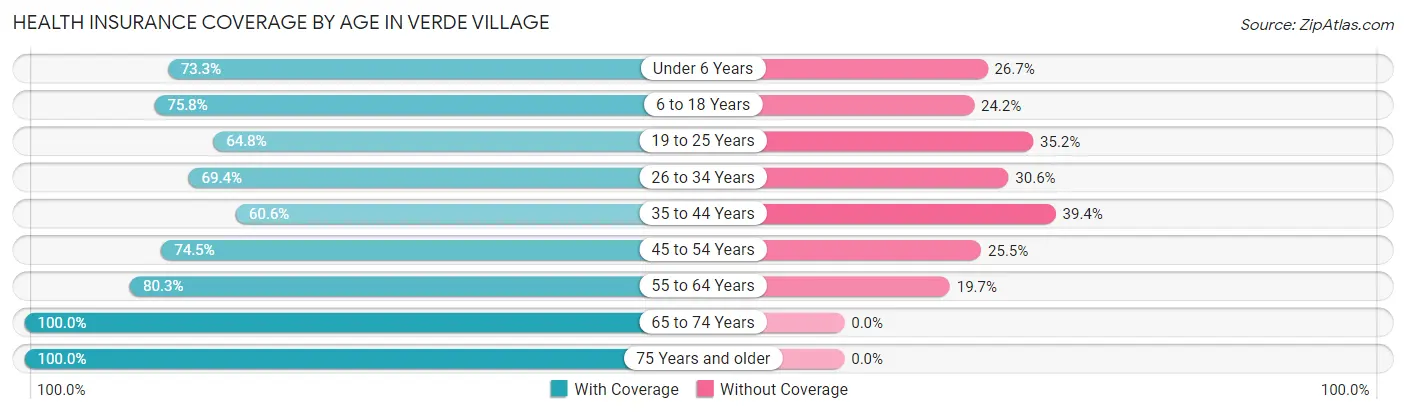
| Age Bracket | With Coverage | Without Coverage |
| Under 6 Years | 442 (73.3%) | 161 (26.7%) |
| 6 to 18 Years | 1,309 (75.8%) | 418 (24.2%) |
| 19 to 25 Years | 712 (64.8%) | 387 (35.2%) |
| 26 to 34 Years | 939 (69.4%) | 414 (30.6%) |
| 35 to 44 Years | 795 (60.6%) | 517 (39.4%) |
| 45 to 54 Years | 1,063 (74.5%) | 364 (25.5%) |
| 55 to 64 Years | 1,503 (80.3%) | 368 (19.7%) |
| 65 to 74 Years | 1,277 (100.0%) | 0 (0.0%) |
| 75 Years and older | 1,314 (100.0%) | 0 (0.0%) |
| Total | 9,354 (78.1%) | 2,629 (21.9%) |
Health Insurance Coverage by Citizenship Status in Verde Village
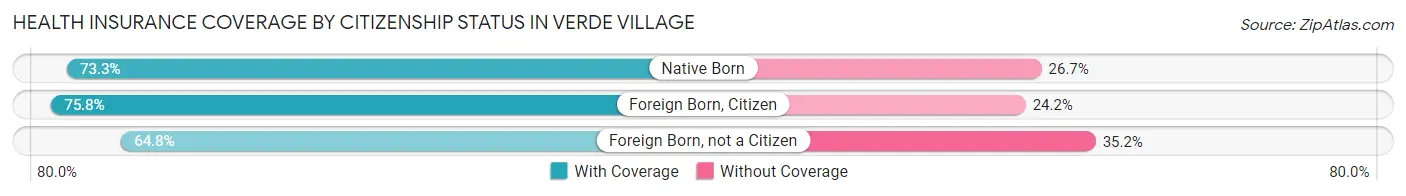
| Citizenship Status | With Coverage | Without Coverage |
| Native Born | 442 (73.3%) | 161 (26.7%) |
| Foreign Born, Citizen | 1,309 (75.8%) | 418 (24.2%) |
| Foreign Born, not a Citizen | 712 (64.8%) | 387 (35.2%) |
Health Insurance Coverage by Household Income in Verde Village
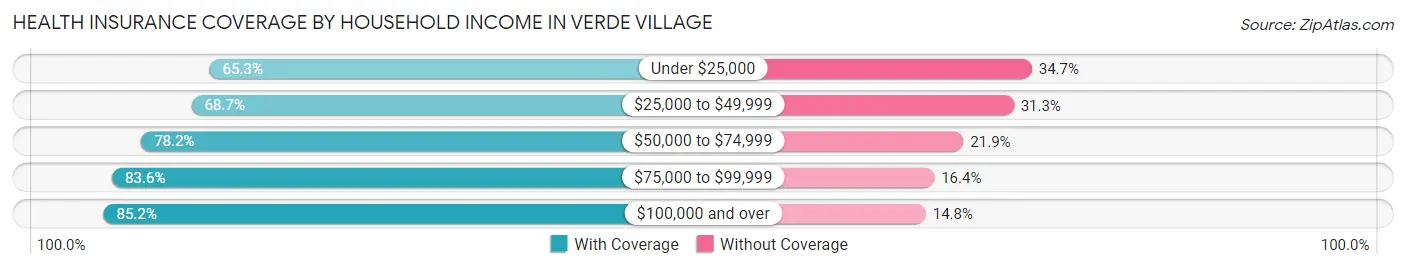
| Household Income | With Coverage | Without Coverage |
| Under $25,000 | 903 (65.3%) | 479 (34.7%) |
| $25,000 to $49,999 | 1,730 (68.7%) | 787 (31.3%) |
| $50,000 to $74,999 | 1,667 (78.1%) | 466 (21.8%) |
| $75,000 to $99,999 | 1,373 (83.6%) | 269 (16.4%) |
| $100,000 and over | 3,615 (85.2%) | 628 (14.8%) |
Public vs Private Health Insurance Coverage by Age in Verde Village
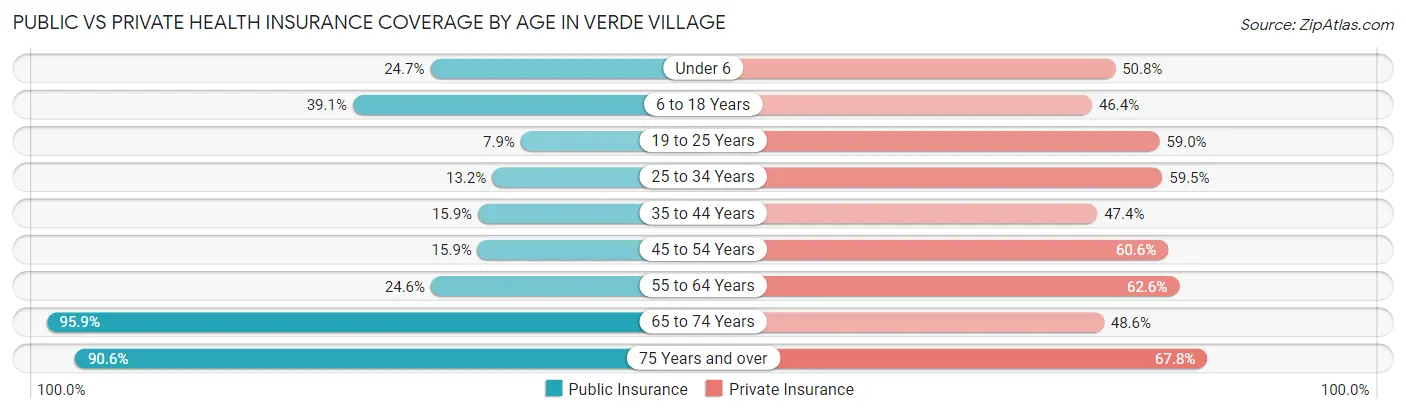
| Age Bracket | Public Insurance | Private Insurance |
| Under 6 | 149 (24.7%) | 306 (50.7%) |
| 6 to 18 Years | 675 (39.1%) | 802 (46.4%) |
| 19 to 25 Years | 87 (7.9%) | 648 (59.0%) |
| 25 to 34 Years | 179 (13.2%) | 805 (59.5%) |
| 35 to 44 Years | 208 (15.9%) | 622 (47.4%) |
| 45 to 54 Years | 227 (15.9%) | 864 (60.6%) |
| 55 to 64 Years | 460 (24.6%) | 1,171 (62.6%) |
| 65 to 74 Years | 1,225 (95.9%) | 621 (48.6%) |
| 75 Years and over | 1,191 (90.6%) | 891 (67.8%) |
| Total | 4,401 (36.7%) | 6,730 (56.2%) |
Disability Status by Sex by Age in Verde Village
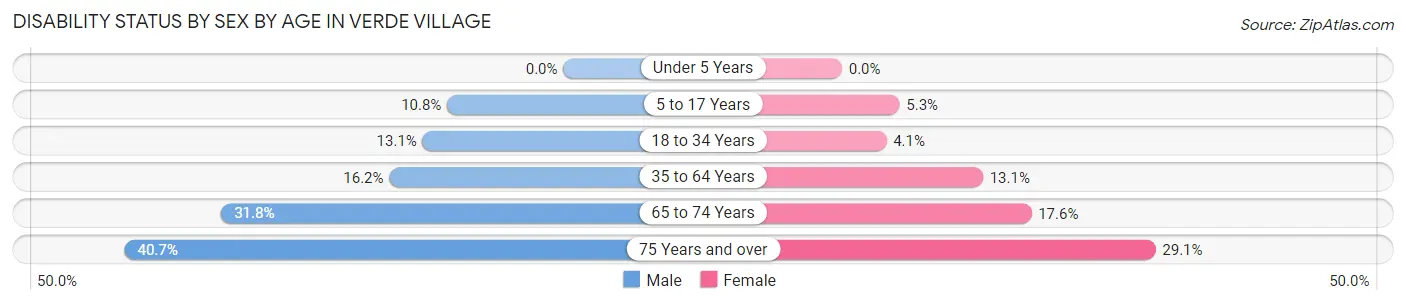
| Age Bracket | Male | Female |
| Under 5 Years | 0 (0.0%) | 0 (0.0%) |
| 5 to 17 Years | 130 (10.8%) | 26 (5.3%) |
| 18 to 34 Years | 176 (13.1%) | 50 (4.1%) |
| 35 to 64 Years | 368 (16.2%) | 305 (13.1%) |
| 65 to 74 Years | 167 (31.8%) | 132 (17.6%) |
| 75 Years and over | 237 (40.7%) | 213 (29.1%) |
Disability Class by Sex by Age in Verde Village
Disability Class: Hearing Difficulty
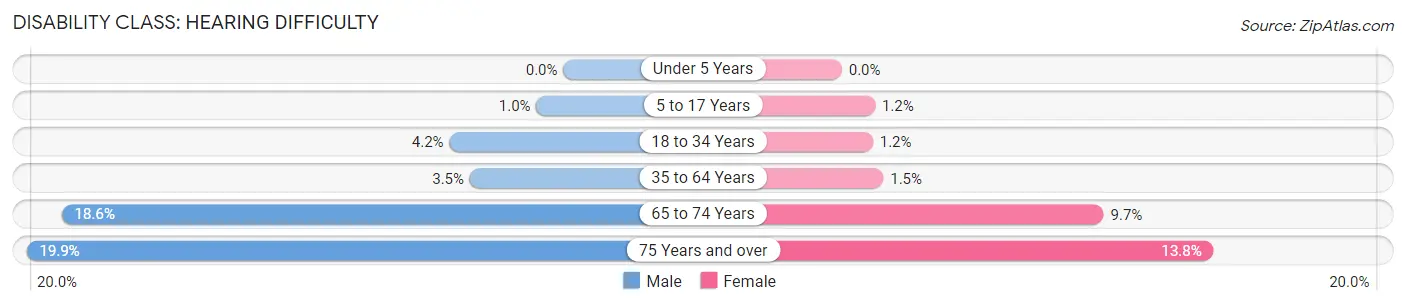
| Age Bracket | Male | Female |
| Under 5 Years | 0 (0.0%) | 0 (0.0%) |
| 5 to 17 Years | 12 (1.0%) | 6 (1.2%) |
| 18 to 34 Years | 57 (4.2%) | 14 (1.1%) |
| 35 to 64 Years | 79 (3.5%) | 36 (1.5%) |
| 65 to 74 Years | 98 (18.6%) | 73 (9.7%) |
| 75 Years and over | 116 (19.9%) | 101 (13.8%) |
Disability Class: Vision Difficulty
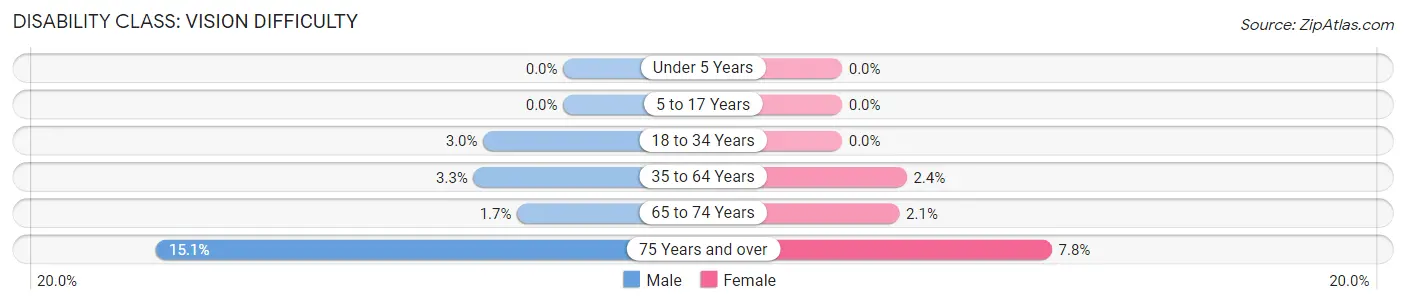
| Age Bracket | Male | Female |
| Under 5 Years | 0 (0.0%) | 0 (0.0%) |
| 5 to 17 Years | 0 (0.0%) | 0 (0.0%) |
| 18 to 34 Years | 40 (3.0%) | 0 (0.0%) |
| 35 to 64 Years | 76 (3.3%) | 56 (2.4%) |
| 65 to 74 Years | 9 (1.7%) | 16 (2.1%) |
| 75 Years and over | 88 (15.1%) | 57 (7.8%) |
Disability Class: Cognitive Difficulty
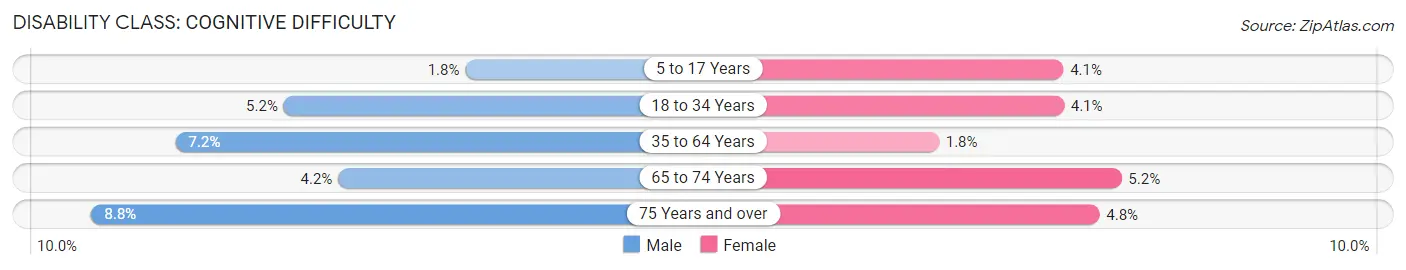
| Age Bracket | Male | Female |
| 5 to 17 Years | 22 (1.8%) | 20 (4.1%) |
| 18 to 34 Years | 70 (5.2%) | 50 (4.1%) |
| 35 to 64 Years | 164 (7.2%) | 42 (1.8%) |
| 65 to 74 Years | 22 (4.2%) | 39 (5.2%) |
| 75 Years and over | 51 (8.8%) | 35 (4.8%) |
Disability Class: Ambulatory Difficulty
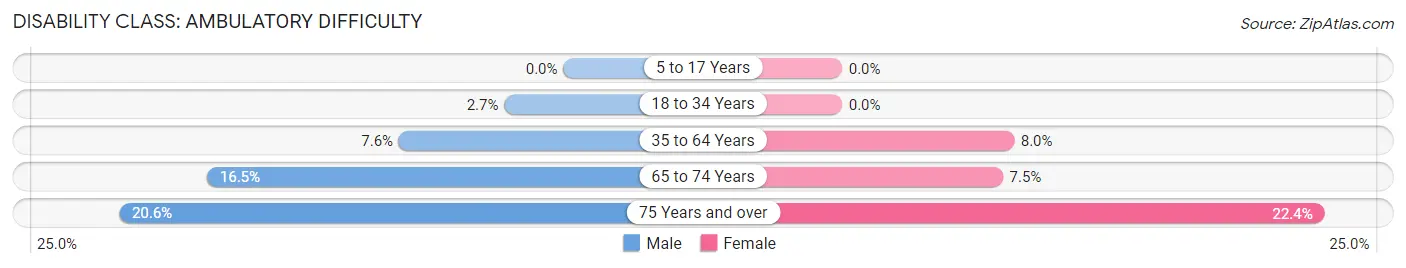
| Age Bracket | Male | Female |
| 5 to 17 Years | 0 (0.0%) | 0 (0.0%) |
| 18 to 34 Years | 37 (2.7%) | 0 (0.0%) |
| 35 to 64 Years | 174 (7.6%) | 186 (8.0%) |
| 65 to 74 Years | 87 (16.5%) | 56 (7.5%) |
| 75 Years and over | 120 (20.6%) | 164 (22.4%) |
Disability Class: Self-Care Difficulty
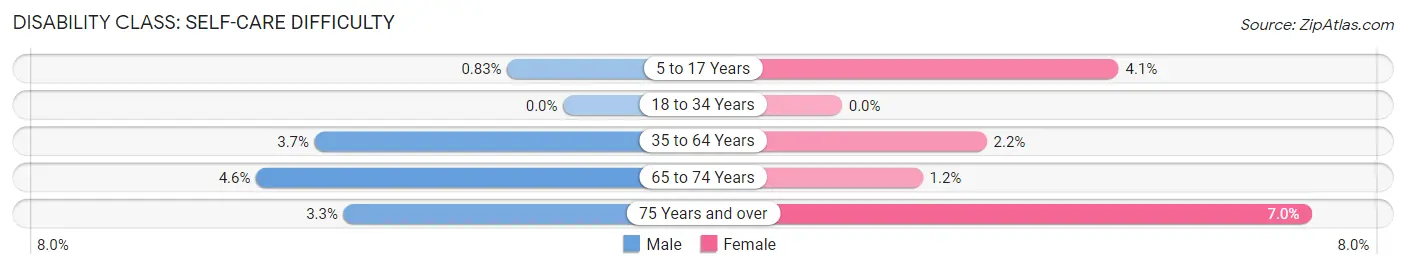
| Age Bracket | Male | Female |
| 5 to 17 Years | 10 (0.8%) | 20 (4.1%) |
| 18 to 34 Years | 0 (0.0%) | 0 (0.0%) |
| 35 to 64 Years | 84 (3.7%) | 50 (2.1%) |
| 65 to 74 Years | 24 (4.6%) | 9 (1.2%) |
| 75 Years and over | 19 (3.3%) | 51 (7.0%) |
Technology Access in Verde Village
Computing Device Access in Verde Village
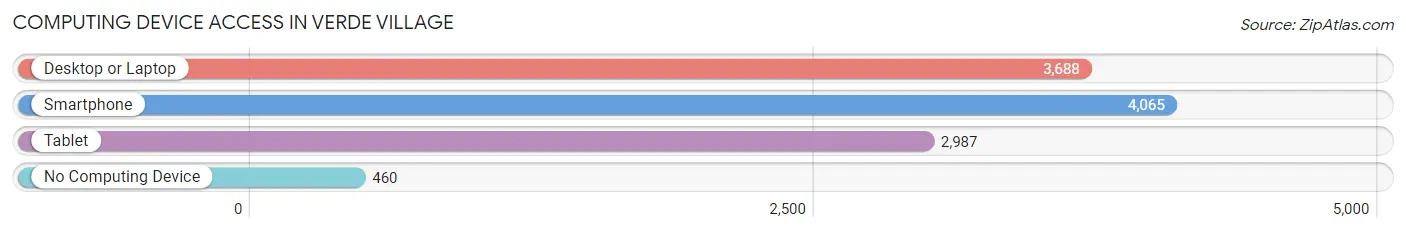
| Device Type | # Households | % Households |
| Desktop or Laptop | 3,688 | 74.9% |
| Smartphone | 4,065 | 82.6% |
| Tablet | 2,987 | 60.7% |
| No Computing Device | 460 | 9.3% |
| Total | 4,924 | 100.0% |
Internet Access in Verde Village
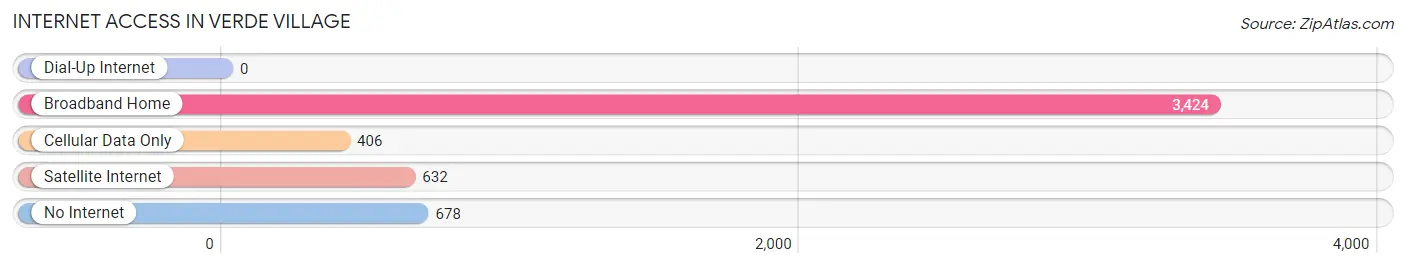
| Internet Type | # Households | % Households |
| Dial-Up Internet | 0 | 0.0% |
| Broadband Home | 3,424 | 69.5% |
| Cellular Data Only | 406 | 8.3% |
| Satellite Internet | 632 | 12.8% |
| No Internet | 678 | 13.8% |
| Total | 4,924 | 100.0% |
Verde Village Summary
Verde Village is a census-designated place (CDP) located in Yavapai County, Arizona. It is situated in the Verde Valley, a region of the state known for its scenic beauty and outdoor recreation opportunities. The village is located about 10 miles south of the city of Cottonwood, and about 25 miles south of the city of Sedona. As of the 2010 census, the population of Verde Village was 6,937.
Geography
Verde Village is located in the Verde Valley, a region of Arizona known for its scenic beauty and outdoor recreation opportunities. The village is situated in the foothills of the Mingus Mountains, which rise to an elevation of 8,000 feet. The Verde River flows through the village, providing a source of water for the area. The village is located about 10 miles south of the city of Cottonwood, and about 25 miles south of the city of Sedona.
Climate
Verde Village has a semi-arid climate, with hot summers and mild winters. The average high temperature in July is 95°F, and the average low temperature in January is 33°F. The average annual precipitation is about 12 inches.
Demographics
As of the 2010 census, the population of Verde Village was 6,937. The racial makeup of the village was 87.3% White, 0.7% African American, 0.9% Native American, 0.7% Asian, 0.1% Pacific Islander, 8.2% from other races, and 2.2% from two or more races. Hispanic or Latino of any race were 16.3% of the population.
Economy
Verde Village is a rural community with a primarily agricultural economy. The village is home to several farms and ranches, as well as a number of small businesses. The village is also home to a number of tourist attractions, including the Verde Valley Railroad, the Verde Valley Wine Trail, and the Verde River Greenway.
History
Verde Village was founded in the late 19th century as a farming community. The village was originally known as "Verde Station," and was a stop on the Verde Valley Railroad. The railroad was built in the 1880s to transport copper ore from the nearby mines. The village was officially incorporated in 1949.
In the late 20th century, Verde Village began to experience rapid growth as people moved to the area to take advantage of the scenic beauty and outdoor recreation opportunities. The village has since become a popular destination for tourists and retirees.
Common Questions
What is Per Capita Income in Verde Village?
Per Capita income in Verde Village is $31,399.
What is the Median Family Income in Verde Village?
Median Family Income in Verde Village is $69,909.
What is the Median Household income in Verde Village?
Median Household Income in Verde Village is $63,835.
What is Income or Wage Gap in Verde Village?
Income or Wage Gap in Verde Village is 34.9%.
Women in Verde Village earn 65.1 cents for every dollar earned by a man.
What is Inequality or Gini Index in Verde Village?
Inequality or Gini Index in Verde Village is 0.41.
What is the Total Population of Verde Village?
Total Population of Verde Village is 12,005.
What is the Total Male Population of Verde Village?
Total Male Population of Verde Village is 6,280.
What is the Total Female Population of Verde Village?
Total Female Population of Verde Village is 5,725.
What is the Ratio of Males per 100 Females in Verde Village?
There are 109.69 Males per 100 Females in Verde Village.
What is the Ratio of Females per 100 Males in Verde Village?
There are 91.16 Females per 100 Males in Verde Village.
What is the Median Population Age in Verde Village?
Median Population Age in Verde Village is 44.1 Years.
What is the Average Family Size in Verde Village
Average Family Size in Verde Village is 2.8 People.
What is the Average Household Size in Verde Village
Average Household Size in Verde Village is 2.4 People.
How Large is the Labor Force in Verde Village?
There are 6,263 People in the Labor Forcein in Verde Village.
What is the Percentage of People in the Labor Force in Verde Village?
61.2% of People are in the Labor Force in Verde Village.
What is the Unemployment Rate in Verde Village?
Unemployment Rate in Verde Village is 4.5%.