Columbia Falls, MT Map & Demographics
Columbia Falls Map
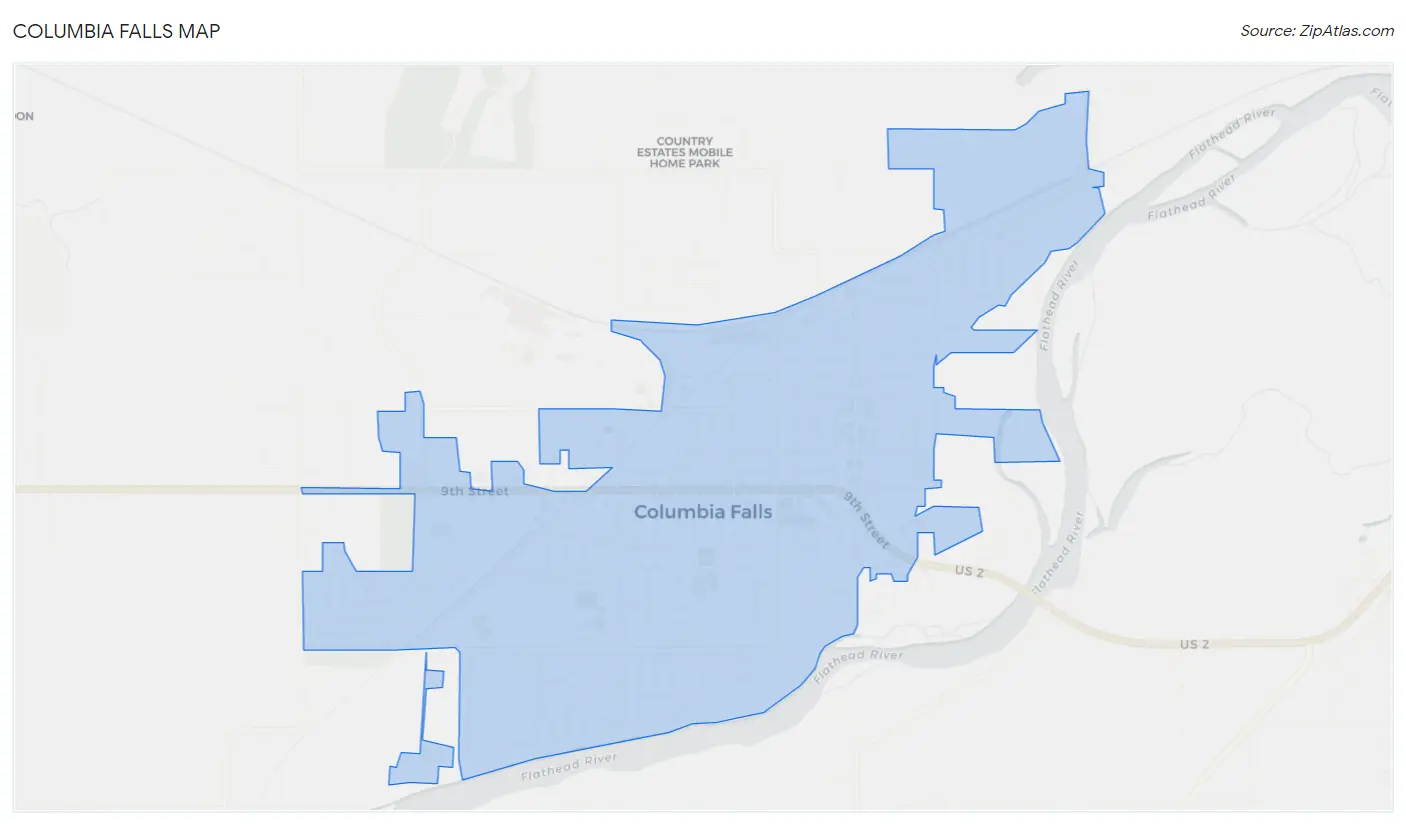
Columbia Falls Overview
$32,635
PER CAPITA INCOME
$77,724
AVG FAMILY INCOME
$64,500
AVG HOUSEHOLD INCOME
4.1%
WAGE / INCOME GAP [ % ]
95.9¢/ $1
WAGE / INCOME GAP [ $ ]
0.46
INEQUALITY / GINI INDEX
5,435
TOTAL POPULATION
2,650
MALE POPULATION
2,785
FEMALE POPULATION
95.15
MALES / 100 FEMALES
105.09
FEMALES / 100 MALES
37.5
MEDIAN AGE
3.0
AVG FAMILY SIZE
2.6
AVG HOUSEHOLD SIZE
2,667
LABOR FORCE [ PEOPLE ]
65.2%
PERCENT IN LABOR FORCE
5.8%
UNEMPLOYMENT RATE
Columbia Falls Zip Codes
Columbia Falls Area Codes
Income in Columbia Falls
Income Overview in Columbia Falls
Per Capita Income in Columbia Falls is $32,635, while median incomes of families and households are $77,724 and $64,500 respectively.
| Characteristic | Number | Measure |
| Per Capita Income | 5,435 | $32,635 |
| Median Family Income | 1,441 | $77,724 |
| Mean Family Income | 1,441 | $99,957 |
| Median Household Income | 2,064 | $64,500 |
| Mean Household Income | 2,064 | $85,017 |
| Income Deficit | 1,441 | $0 |
| Wage / Income Gap (%) | 5,435 | 4.05% |
| Wage / Income Gap ($) | 5,435 | 95.95¢ per $1 |
| Gini / Inequality Index | 5,435 | 0.46 |
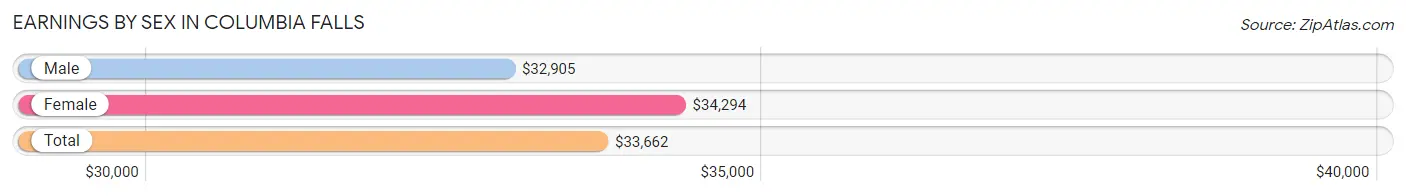
Earnings by Sex in Columbia Falls
Average Earnings in Columbia Falls are $33,662, $32,905 for men and $34,294 for women, a difference of 4.1%.
| Sex | Number | Average Earnings |
| Male | 1,497 (53.5%) | $32,905 |
| Female | 1,302 (46.5%) | $34,294 |
| Total | 2,799 (100.0%) | $33,662 |
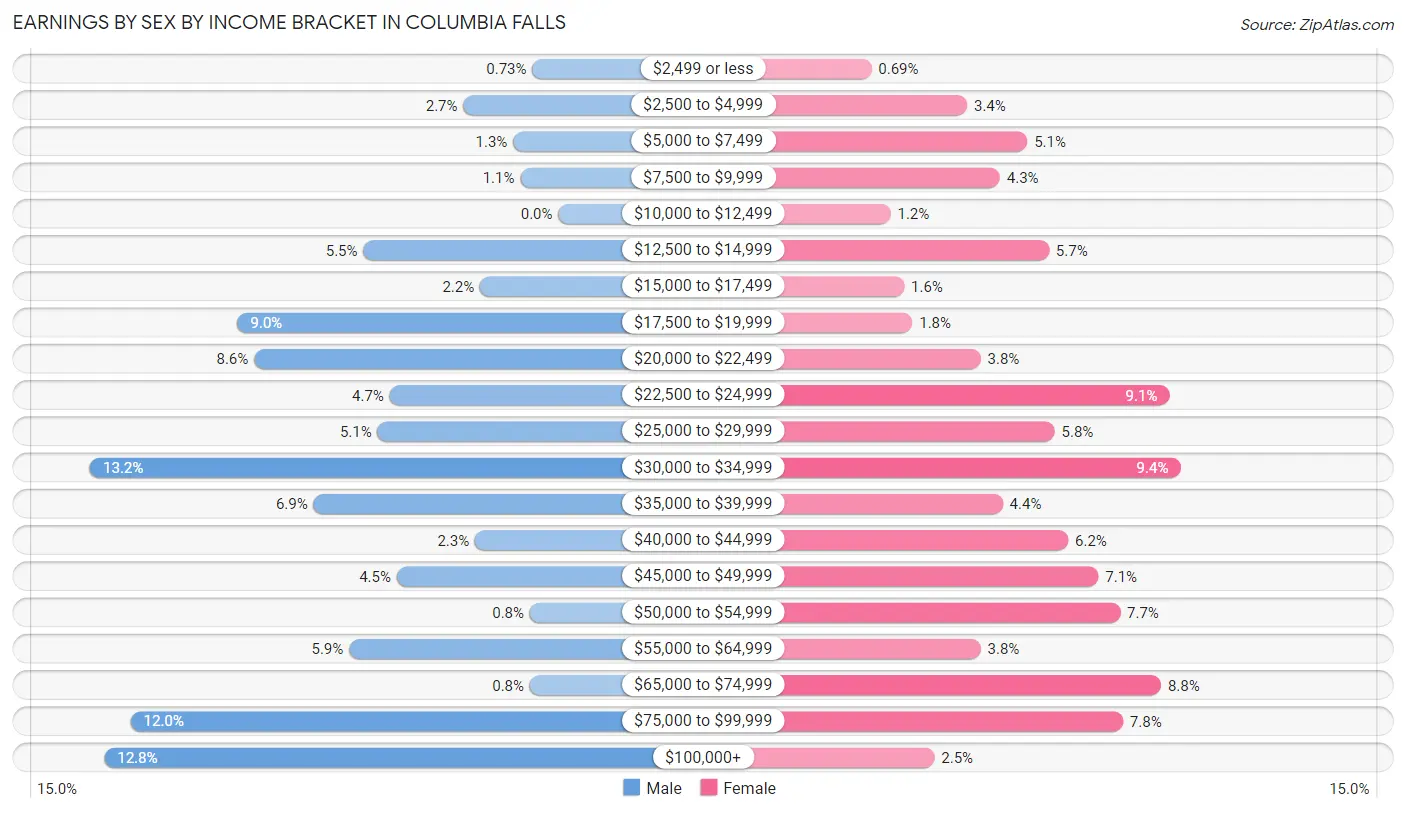
Earnings by Sex by Income Bracket in Columbia Falls
The most common earnings brackets in Columbia Falls are $30,000 to $34,999 for men (197 | 13.2%) and $30,000 to $34,999 for women (122 | 9.4%).
| Income | Male | Female |
| $2,499 or less | 11 (0.7%) | 9 (0.7%) |
| $2,500 to $4,999 | 40 (2.7%) | 44 (3.4%) |
| $5,000 to $7,499 | 19 (1.3%) | 66 (5.1%) |
| $7,500 to $9,999 | 16 (1.1%) | 56 (4.3%) |
| $10,000 to $12,499 | 0 (0.0%) | 16 (1.2%) |
| $12,500 to $14,999 | 82 (5.5%) | 74 (5.7%) |
| $15,000 to $17,499 | 33 (2.2%) | 21 (1.6%) |
| $17,500 to $19,999 | 135 (9.0%) | 24 (1.8%) |
| $20,000 to $22,499 | 128 (8.6%) | 49 (3.8%) |
| $22,500 to $24,999 | 71 (4.7%) | 118 (9.1%) |
| $25,000 to $29,999 | 76 (5.1%) | 76 (5.8%) |
| $30,000 to $34,999 | 197 (13.2%) | 122 (9.4%) |
| $35,000 to $39,999 | 103 (6.9%) | 57 (4.4%) |
| $40,000 to $44,999 | 35 (2.3%) | 81 (6.2%) |
| $45,000 to $49,999 | 68 (4.5%) | 92 (7.1%) |
| $50,000 to $54,999 | 12 (0.8%) | 100 (7.7%) |
| $55,000 to $64,999 | 88 (5.9%) | 49 (3.8%) |
| $65,000 to $74,999 | 12 (0.8%) | 115 (8.8%) |
| $75,000 to $99,999 | 180 (12.0%) | 101 (7.8%) |
| $100,000+ | 191 (12.8%) | 32 (2.5%) |
| Total | 1,497 (100.0%) | 1,302 (100.0%) |
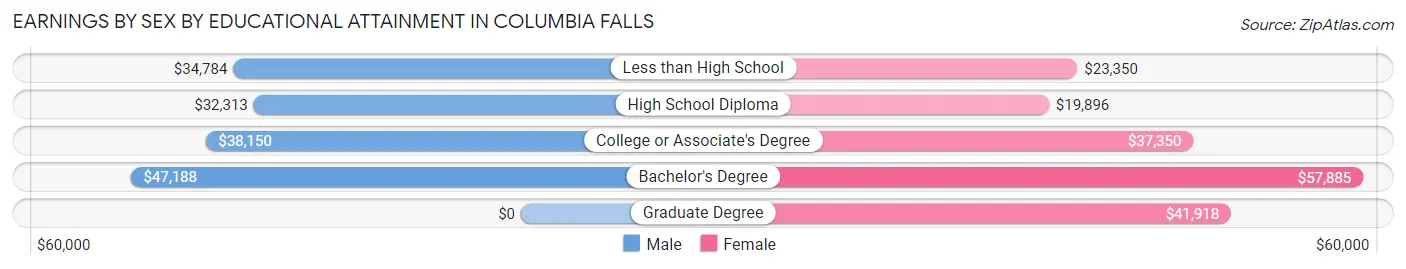
Earnings by Sex by Educational Attainment in Columbia Falls
Average earnings in Columbia Falls are $37,963 for men and $35,964 for women, a difference of 5.3%. Men with an educational attainment of bachelor's degree enjoy the highest average annual earnings of $47,188, while those with high school diploma education earn the least with $32,313. Women with an educational attainment of bachelor's degree earn the most with the average annual earnings of $57,885, while those with high school diploma education have the smallest earnings of $19,896.
| Educational Attainment | Male Income | Female Income |
| Less than High School | $34,784 | $23,350 |
| High School Diploma | $32,313 | $19,896 |
| College or Associate's Degree | $38,150 | $37,350 |
| Bachelor's Degree | $47,188 | $57,885 |
| Graduate Degree | - | - |
| Total | $37,963 | $35,964 |
Family Income in Columbia Falls
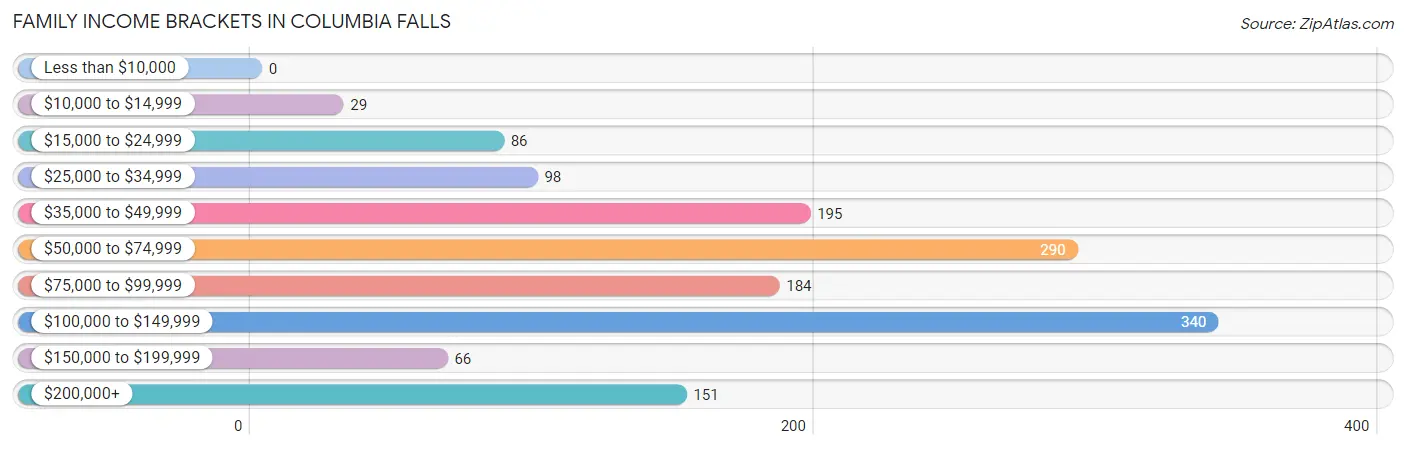
Family Income Brackets in Columbia Falls
According to the Columbia Falls family income data, there are 340 families falling into the $100,000 to $149,999 income range, which is the most common income bracket and makes up 23.6% of all families.
| Income Bracket | # Families | % Families |
| Less than $10,000 | 0 | 0.0% |
| $10,000 to $14,999 | 29 | 2.0% |
| $15,000 to $24,999 | 86 | 6.0% |
| $25,000 to $34,999 | 98 | 6.8% |
| $35,000 to $49,999 | 195 | 13.5% |
| $50,000 to $74,999 | 290 | 20.1% |
| $75,000 to $99,999 | 184 | 12.8% |
| $100,000 to $149,999 | 340 | 23.6% |
| $150,000 to $199,999 | 66 | 4.6% |
| $200,000+ | 151 | 10.5% |
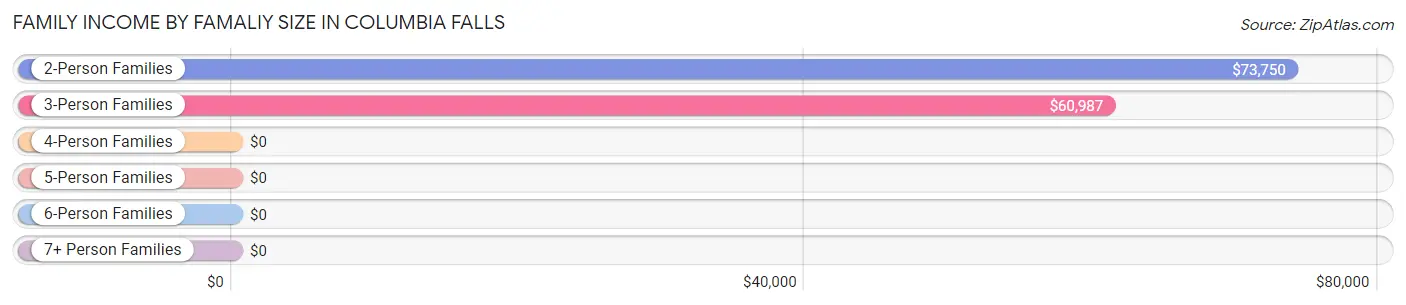
Family Income by Famaliy Size in Columbia Falls
2-person families (796 | 55.2%) account for the highest median family income in Columbia Falls with $73,750 per family, while 2-person families (796 | 55.2%) have the highest median income of $36,875 per family member.
| Income Bracket | # Families | Median Income |
| 2-Person Families | 796 (55.2%) | $73,750 |
| 3-Person Families | 235 (16.3%) | $60,987 |
| 4-Person Families | 206 (14.3%) | $0 |
| 5-Person Families | 155 (10.8%) | $0 |
| 6-Person Families | 33 (2.3%) | $0 |
| 7+ Person Families | 16 (1.1%) | $0 |
| Total | 1,441 (100.0%) | $77,724 |
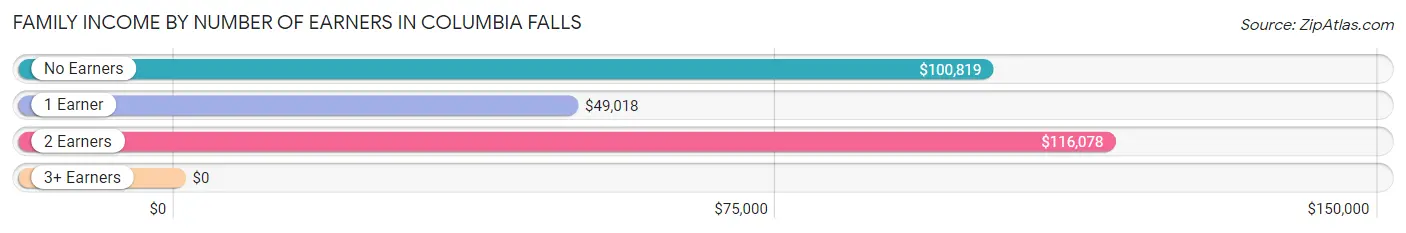
Family Income by Number of Earners in Columbia Falls
| Number of Earners | # Families | Median Income |
| No Earners | 73 (5.1%) | $100,819 |
| 1 Earner | 629 (43.6%) | $49,018 |
| 2 Earners | 722 (50.1%) | $116,078 |
| 3+ Earners | 17 (1.2%) | $0 |
| Total | 1,441 (100.0%) | $77,724 |
Household Income in Columbia Falls
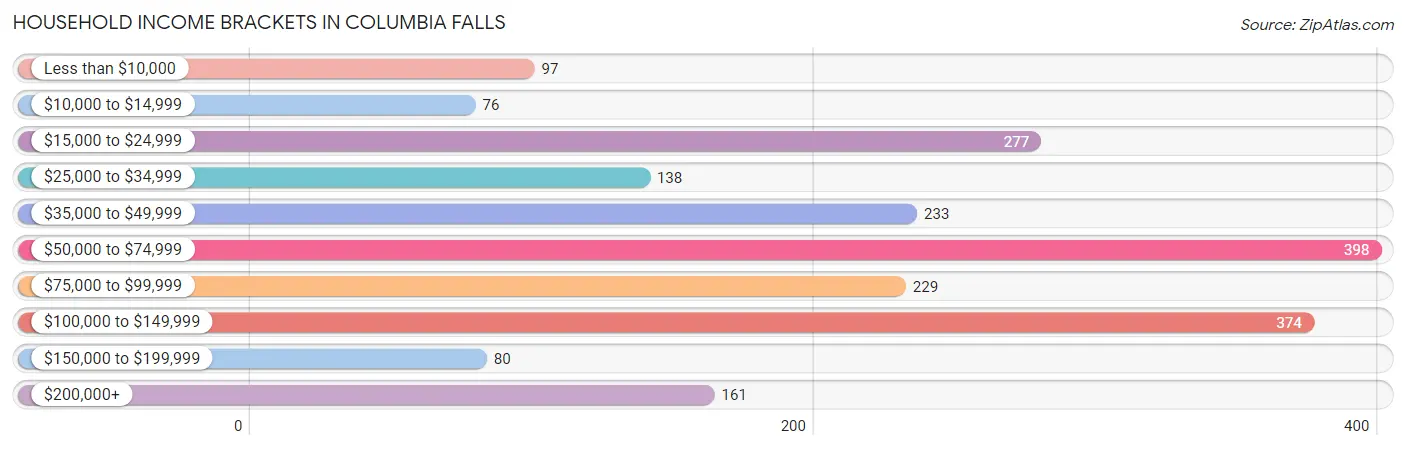
Household Income Brackets in Columbia Falls
With 398 households falling in the category, the $50,000 to $74,999 income range is the most frequent in Columbia Falls, accounting for 19.3% of all households. In contrast, only 76 households (3.7%) fall into the $10,000 to $14,999 income bracket, making it the least populous group.
| Income Bracket | # Households | % Households |
| Less than $10,000 | 97 | 4.7% |
| $10,000 to $14,999 | 76 | 3.7% |
| $15,000 to $24,999 | 277 | 13.4% |
| $25,000 to $34,999 | 138 | 6.7% |
| $35,000 to $49,999 | 233 | 11.3% |
| $50,000 to $74,999 | 398 | 19.3% |
| $75,000 to $99,999 | 229 | 11.1% |
| $100,000 to $149,999 | 374 | 18.1% |
| $150,000 to $199,999 | 80 | 3.9% |
| $200,000+ | 161 | 7.8% |
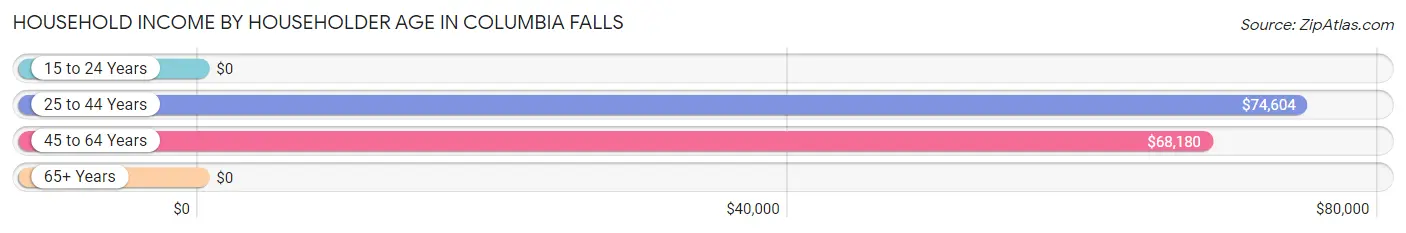
Household Income by Householder Age in Columbia Falls
The median household income in Columbia Falls is $64,500, with the highest median household income of $74,604 found in the 25 to 44 years age bracket for the primary householder. A total of 965 households (46.8%) fall into this category. Meanwhile, the 15 to 24 years age bracket for the primary householder has the lowest median household income of $0, with 29 households (1.4%) in this group.
| Income Bracket | # Households | Median Income |
| 15 to 24 Years | 29 (1.4%) | $0 |
| 25 to 44 Years | 965 (46.8%) | $74,604 |
| 45 to 64 Years | 689 (33.4%) | $68,180 |
| 65+ Years | 381 (18.5%) | $0 |
| Total | 2,064 (100.0%) | $64,500 |
Poverty in Columbia Falls
Income Below Poverty by Sex and Age in Columbia Falls
With 16.0% poverty level for males and 12.3% for females among the residents of Columbia Falls, 75 year old and over males and under 5 year old females are the most vulnerable to poverty, with 31 males (43.7%) and 76 females (31.8%) in their respective age groups living below the poverty level.
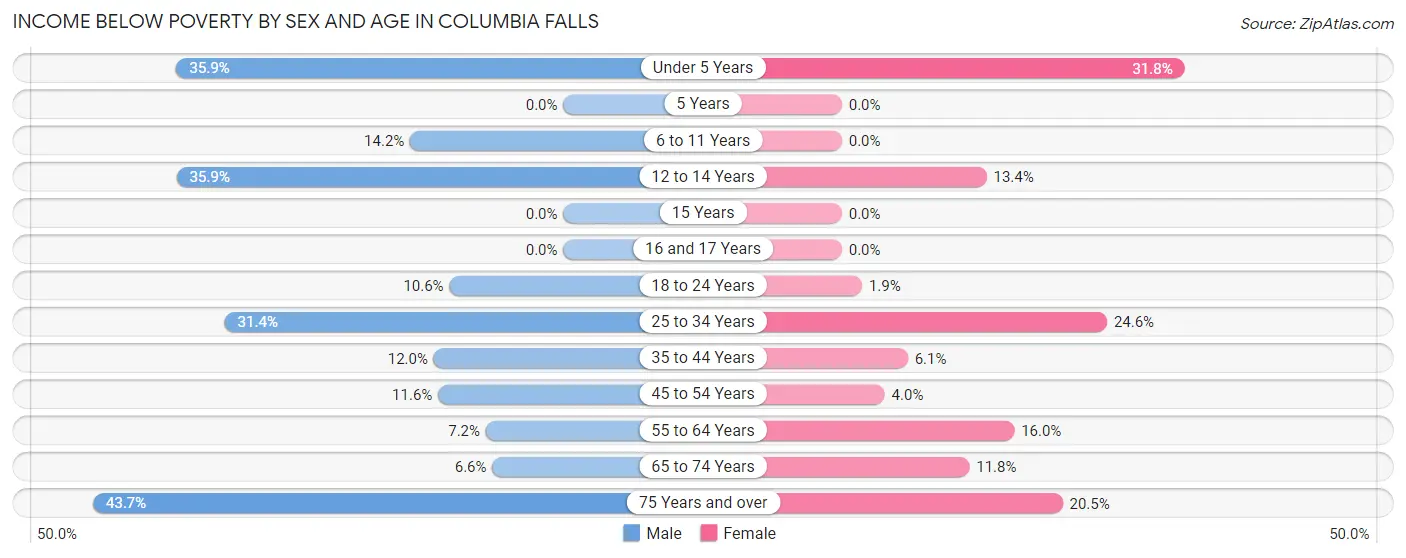
| Age Bracket | Male | Female |
| Under 5 Years | 65 (35.9%) | 76 (31.8%) |
| 5 Years | 0 (0.0%) | 0 (0.0%) |
| 6 to 11 Years | 29 (14.2%) | 0 (0.0%) |
| 12 to 14 Years | 56 (35.9%) | 29 (13.4%) |
| 15 Years | 0 (0.0%) | 0 (0.0%) |
| 16 and 17 Years | 0 (0.0%) | 0 (0.0%) |
| 18 to 24 Years | 24 (10.6%) | 2 (1.9%) |
| 25 to 34 Years | 66 (31.4%) | 95 (24.6%) |
| 35 to 44 Years | 72 (12.0%) | 33 (6.1%) |
| 45 to 54 Years | 33 (11.6%) | 16 (4.0%) |
| 55 to 64 Years | 23 (7.2%) | 40 (16.0%) |
| 65 to 74 Years | 11 (6.6%) | 20 (11.8%) |
| 75 Years and over | 31 (43.7%) | 25 (20.5%) |
| Total | 410 (16.0%) | 336 (12.3%) |
Income Above Poverty by Sex and Age in Columbia Falls
According to the poverty statistics in Columbia Falls, males aged 15 years and females aged 5 years are the age groups that are most secure financially, with 100.0% of males and 100.0% of females in these age groups living above the poverty line.
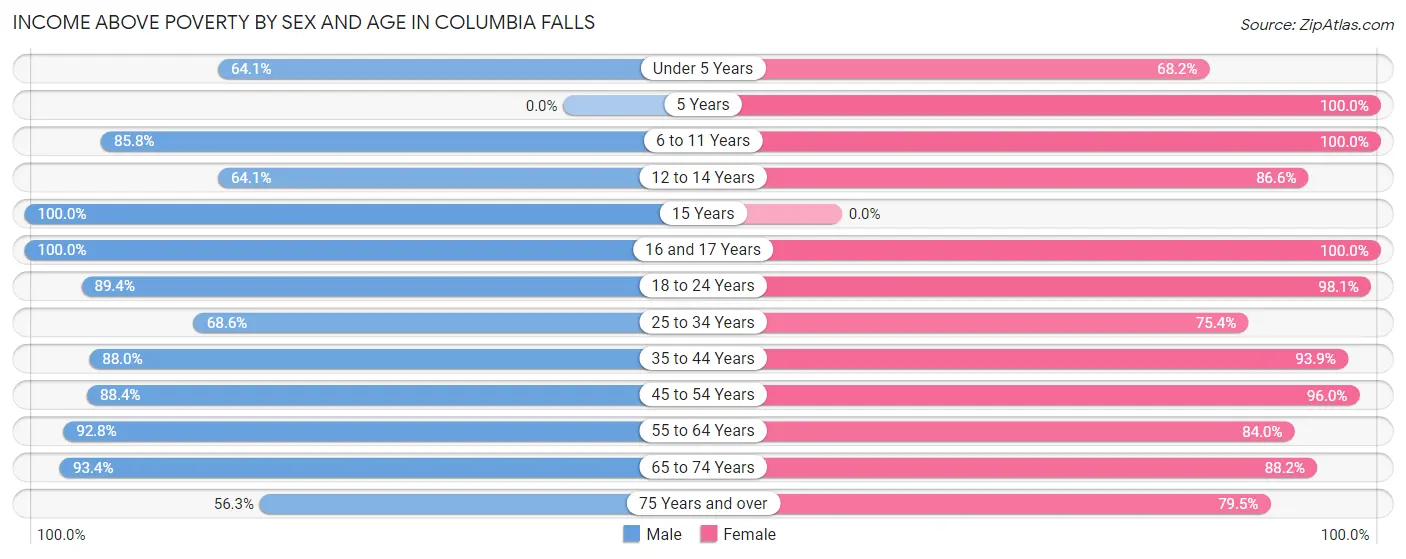
| Age Bracket | Male | Female |
| Under 5 Years | 116 (64.1%) | 163 (68.2%) |
| 5 Years | 0 (0.0%) | 6 (100.0%) |
| 6 to 11 Years | 175 (85.8%) | 268 (100.0%) |
| 12 to 14 Years | 100 (64.1%) | 187 (86.6%) |
| 15 Years | 14 (100.0%) | 0 (0.0%) |
| 16 and 17 Years | 124 (100.0%) | 20 (100.0%) |
| 18 to 24 Years | 203 (89.4%) | 105 (98.1%) |
| 25 to 34 Years | 144 (68.6%) | 291 (75.4%) |
| 35 to 44 Years | 527 (88.0%) | 506 (93.9%) |
| 45 to 54 Years | 251 (88.4%) | 386 (96.0%) |
| 55 to 64 Years | 297 (92.8%) | 210 (84.0%) |
| 65 to 74 Years | 156 (93.4%) | 149 (88.2%) |
| 75 Years and over | 40 (56.3%) | 97 (79.5%) |
| Total | 2,147 (84.0%) | 2,388 (87.7%) |
Income Below Poverty Among Married-Couple Families in Columbia Falls
The poverty statistics for married-couple families in Columbia Falls show that 2.6% or 29 of the total 1,111 families live below the poverty line. Families with 3 or 4 children have the highest poverty rate of 25.7%, comprising of 29 families. On the other hand, families with no children have the lowest poverty rate of 0.0%, which includes 0 families.
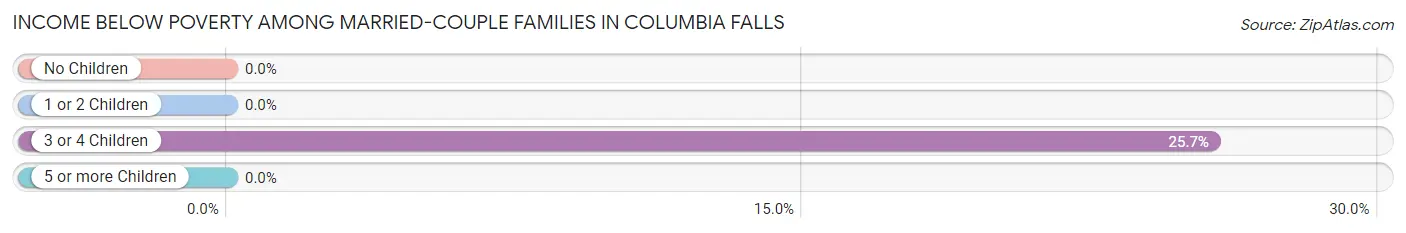
| Children | Above Poverty | Below Poverty |
| No Children | 629 (100.0%) | 0 (0.0%) |
| 1 or 2 Children | 353 (100.0%) | 0 (0.0%) |
| 3 or 4 Children | 84 (74.3%) | 29 (25.7%) |
| 5 or more Children | 16 (100.0%) | 0 (0.0%) |
| Total | 1,082 (97.4%) | 29 (2.6%) |
Income Below Poverty Among Single-Parent Households in Columbia Falls
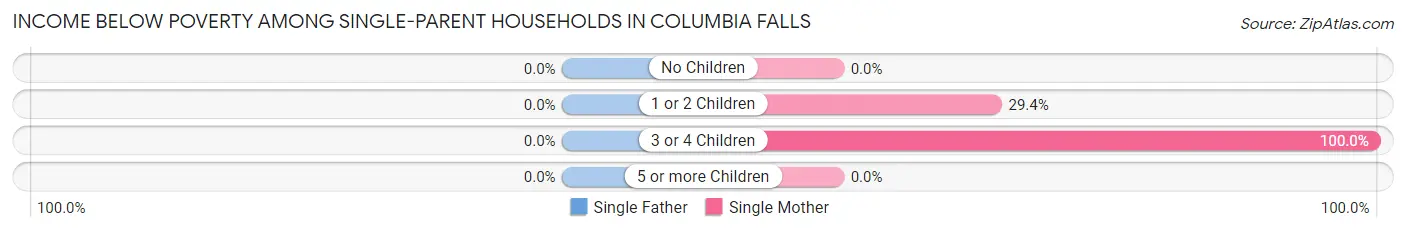
| Children | Single Father | Single Mother |
| No Children | 0 (0.0%) | 0 (0.0%) |
| 1 or 2 Children | 0 (0.0%) | 50 (29.4%) |
| 3 or 4 Children | 0 (0.0%) | 23 (100.0%) |
| 5 or more Children | 0 (0.0%) | 0 (0.0%) |
| Total | 0 (0.0%) | 73 (32.2%) |
Income Below Poverty Among Married-Couple vs Single-Parent Households in Columbia Falls
The poverty data for Columbia Falls shows that 29 of the married-couple family households (2.6%) and 73 of the single-parent households (22.1%) are living below the poverty level. Within the married-couple family households, those with 3 or 4 children have the highest poverty rate, with 29 households (25.7%) falling below the poverty line. Among the single-parent households, those with 3 or 4 children have the highest poverty rate, with 23 household (100.0%) living below poverty.
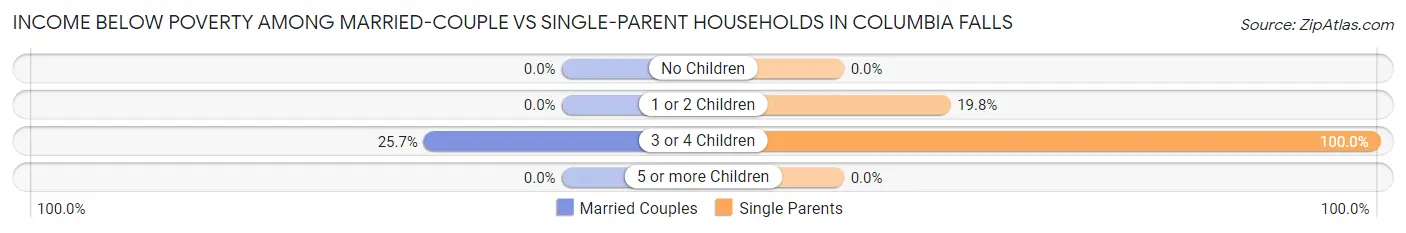
| Children | Married-Couple Families | Single-Parent Households |
| No Children | 0 (0.0%) | 0 (0.0%) |
| 1 or 2 Children | 0 (0.0%) | 50 (19.8%) |
| 3 or 4 Children | 29 (25.7%) | 23 (100.0%) |
| 5 or more Children | 0 (0.0%) | 0 (0.0%) |
| Total | 29 (2.6%) | 73 (22.1%) |
Race in Columbia Falls
The most populous races in Columbia Falls are White / Caucasian (4,925 | 90.6%), Hispanic or Latino (342 | 6.3%), and Two or more Races (264 | 4.9%).
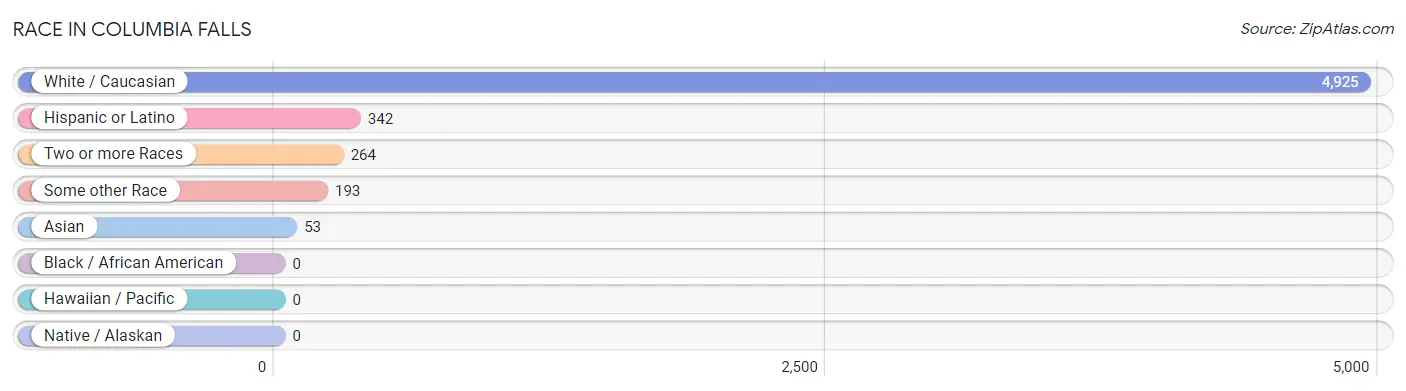
| Race | # Population | % Population |
| Asian | 53 | 1.0% |
| Black / African American | 0 | 0.0% |
| Hawaiian / Pacific | 0 | 0.0% |
| Hispanic or Latino | 342 | 6.3% |
| Native / Alaskan | 0 | 0.0% |
| White / Caucasian | 4,925 | 90.6% |
| Two or more Races | 264 | 4.9% |
| Some other Race | 193 | 3.5% |
| Total | 5,435 | 100.0% |
Ancestry in Columbia Falls
The most populous ancestries reported in Columbia Falls are German (1,329 | 24.4%), English (739 | 13.6%), Irish (679 | 12.5%), Norwegian (556 | 10.2%), and Mexican (256 | 4.7%), together accounting for 65.5% of all Columbia Falls residents.
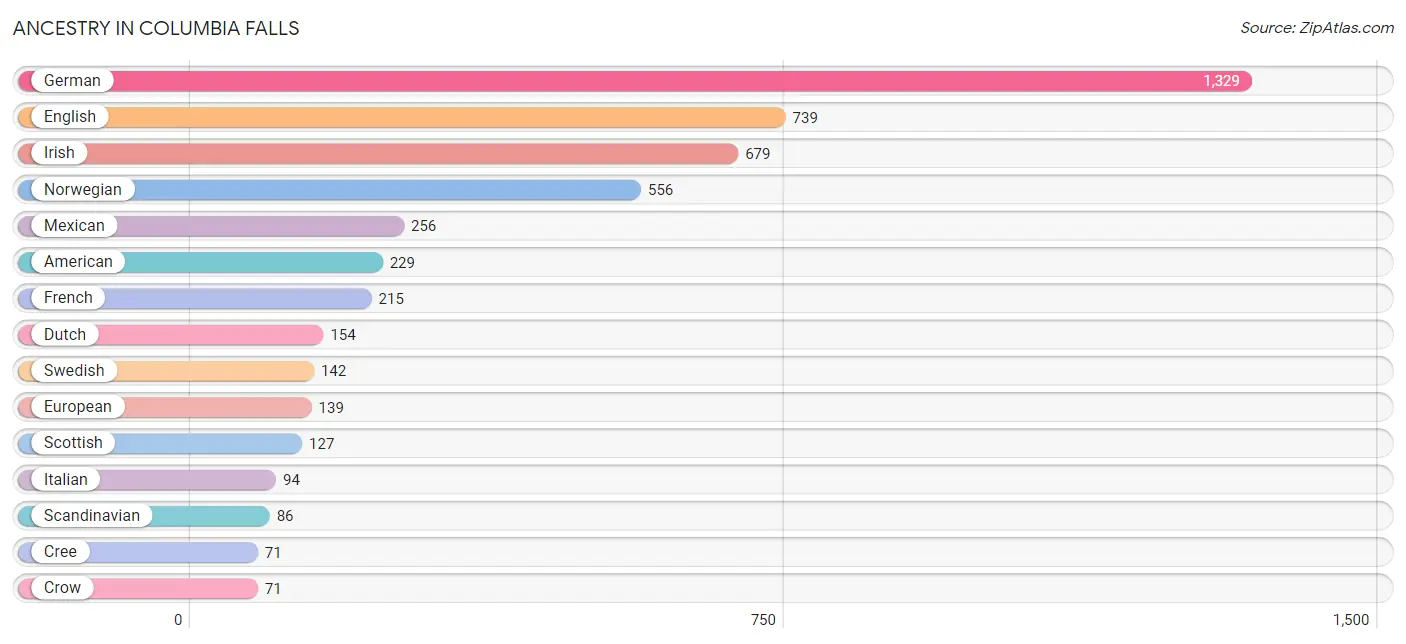
| Ancestry | # Population | % Population |
| Aleut | 32 | 0.6% |
| American | 229 | 4.2% |
| Austrian | 14 | 0.3% |
| Burmese | 55 | 1.0% |
| Canadian | 2 | 0.0% |
| Central American | 3 | 0.1% |
| Chippewa | 11 | 0.2% |
| Cree | 71 | 1.3% |
| Croatian | 9 | 0.2% |
| Crow | 71 | 1.3% |
| Czech | 17 | 0.3% |
| Danish | 46 | 0.9% |
| Dutch | 154 | 2.8% |
| Eastern European | 10 | 0.2% |
| English | 739 | 13.6% |
| European | 139 | 2.6% |
| Finnish | 29 | 0.5% |
| French | 215 | 4.0% |
| French Canadian | 66 | 1.2% |
| German | 1,329 | 24.4% |
| Greek | 56 | 1.0% |
| Hungarian | 20 | 0.4% |
| Irish | 679 | 12.5% |
| Italian | 94 | 1.7% |
| Lithuanian | 45 | 0.8% |
| Mexican | 256 | 4.7% |
| Northern European | 9 | 0.2% |
| Norwegian | 556 | 10.2% |
| Pennsylvania German | 2 | 0.0% |
| Polish | 50 | 0.9% |
| Portuguese | 26 | 0.5% |
| Salvadoran | 3 | 0.1% |
| Scandinavian | 86 | 1.6% |
| Scotch-Irish | 31 | 0.6% |
| Scottish | 127 | 2.3% |
| Sioux | 71 | 1.3% |
| Slovak | 6 | 0.1% |
| Spanish | 71 | 1.3% |
| Swedish | 142 | 2.6% |
| Thai | 4 | 0.1% |
| Ukrainian | 17 | 0.3% |
| Welsh | 39 | 0.7% |
| Yugoslavian | 8 | 0.2% | View All 43 Rows |
Immigrants in Columbia Falls
The most numerous immigrant groups reported in Columbia Falls came from Central America (72 | 1.3%), Latin America (72 | 1.3%), Mexico (72 | 1.3%), Europe (19 | 0.4%), and Asia (16 | 0.3%), together accounting for 4.6% of all Columbia Falls residents.
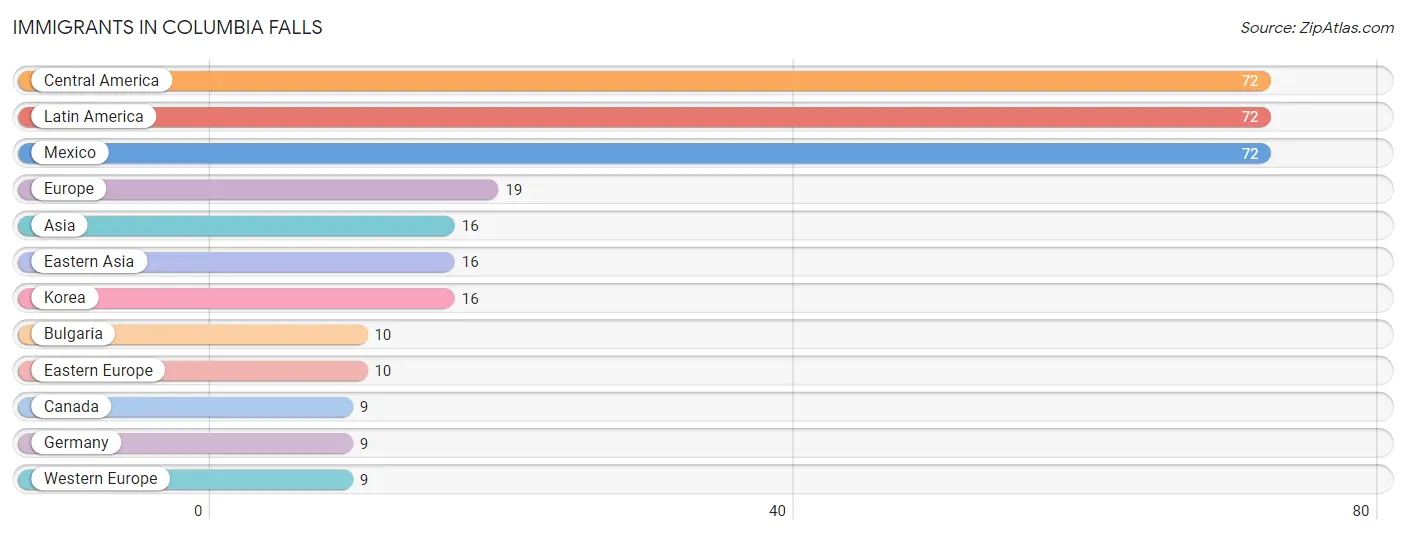
| Immigration Origin | # Population | % Population |
| Asia | 16 | 0.3% |
| Bulgaria | 10 | 0.2% |
| Canada | 9 | 0.2% |
| Central America | 72 | 1.3% |
| Eastern Asia | 16 | 0.3% |
| Eastern Europe | 10 | 0.2% |
| Europe | 19 | 0.4% |
| Germany | 9 | 0.2% |
| Korea | 16 | 0.3% |
| Latin America | 72 | 1.3% |
| Mexico | 72 | 1.3% |
| Western Europe | 9 | 0.2% | View All 12 Rows |
Sex and Age in Columbia Falls
Sex and Age in Columbia Falls
The most populous age groups in Columbia Falls are 40 to 44 Years (327 | 12.3%) for men and 10 to 14 Years (394 | 14.1%) for women.
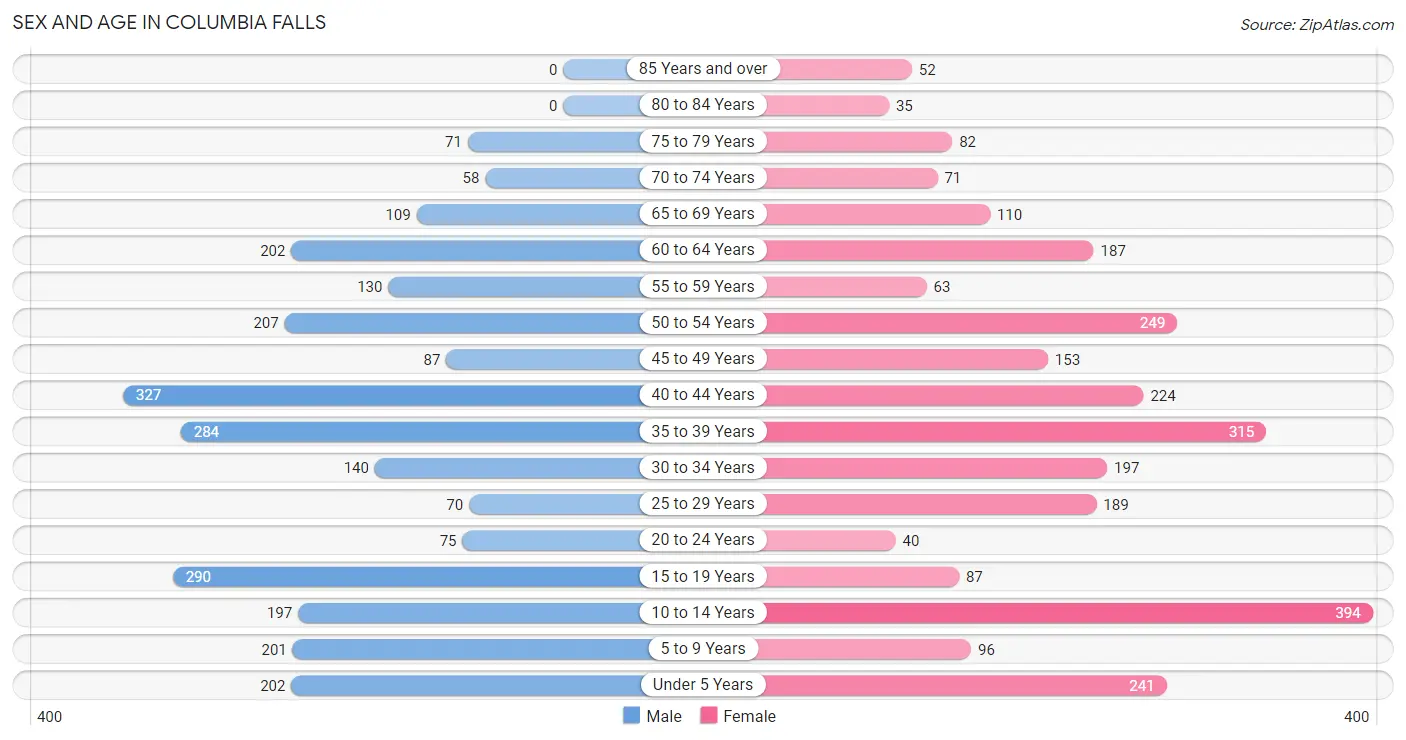
| Age Bracket | Male | Female |
| Under 5 Years | 202 (7.6%) | 241 (8.6%) |
| 5 to 9 Years | 201 (7.6%) | 96 (3.5%) |
| 10 to 14 Years | 197 (7.4%) | 394 (14.1%) |
| 15 to 19 Years | 290 (10.9%) | 87 (3.1%) |
| 20 to 24 Years | 75 (2.8%) | 40 (1.4%) |
| 25 to 29 Years | 70 (2.6%) | 189 (6.8%) |
| 30 to 34 Years | 140 (5.3%) | 197 (7.1%) |
| 35 to 39 Years | 284 (10.7%) | 315 (11.3%) |
| 40 to 44 Years | 327 (12.3%) | 224 (8.0%) |
| 45 to 49 Years | 87 (3.3%) | 153 (5.5%) |
| 50 to 54 Years | 207 (7.8%) | 249 (8.9%) |
| 55 to 59 Years | 130 (4.9%) | 63 (2.3%) |
| 60 to 64 Years | 202 (7.6%) | 187 (6.7%) |
| 65 to 69 Years | 109 (4.1%) | 110 (4.0%) |
| 70 to 74 Years | 58 (2.2%) | 71 (2.5%) |
| 75 to 79 Years | 71 (2.7%) | 82 (2.9%) |
| 80 to 84 Years | 0 (0.0%) | 35 (1.3%) |
| 85 Years and over | 0 (0.0%) | 52 (1.9%) |
| Total | 2,650 (100.0%) | 2,785 (100.0%) |
Families and Households in Columbia Falls
Median Family Size in Columbia Falls
The median family size in Columbia Falls is 2.98 persons per family, with married-couple families (1,111 | 77.1%) accounting for the largest median family size of 3.13 persons per family. On the other hand, single female/mother families (227 | 15.8%) represent the smallest median family size with 2.46 persons per family.
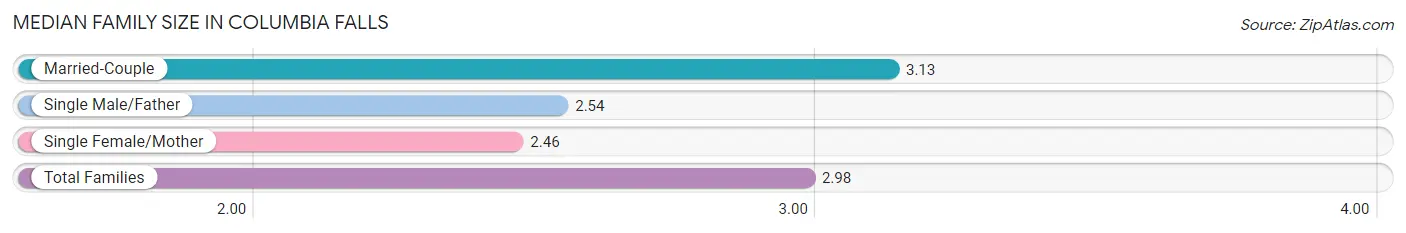
| Family Type | # Families | Family Size |
| Married-Couple | 1,111 (77.1%) | 3.13 |
| Single Male/Father | 103 (7.1%) | 2.54 |
| Single Female/Mother | 227 (15.8%) | 2.46 |
| Total Families | 1,441 (100.0%) | 2.98 |
Median Household Size in Columbia Falls
The median household size in Columbia Falls is 2.58 persons per household, with single male/father households (103 | 5.0%) accounting for the largest median household size of 3.55 persons per household. non-family households (623 | 30.2%) represent the smallest median household size with 1.43 persons per household.
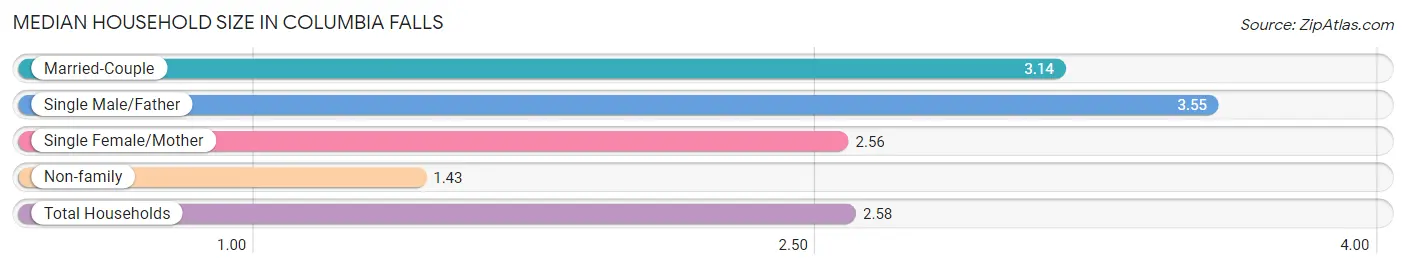
| Household Type | # Households | Household Size |
| Married-Couple | 1,111 (53.8%) | 3.14 |
| Single Male/Father | 103 (5.0%) | 3.55 |
| Single Female/Mother | 227 (11.0%) | 2.56 |
| Non-family | 623 (30.2%) | 1.43 |
| Total Households | 2,064 (100.0%) | 2.58 |
Household Size by Marriage Status in Columbia Falls
Out of a total of 2,064 households in Columbia Falls, 1,441 (69.8%) are family households, while 623 (30.2%) are nonfamily households. The most numerous type of family households are 2-person households, comprising 756, and the most common type of nonfamily households are 1-person households, comprising 492.
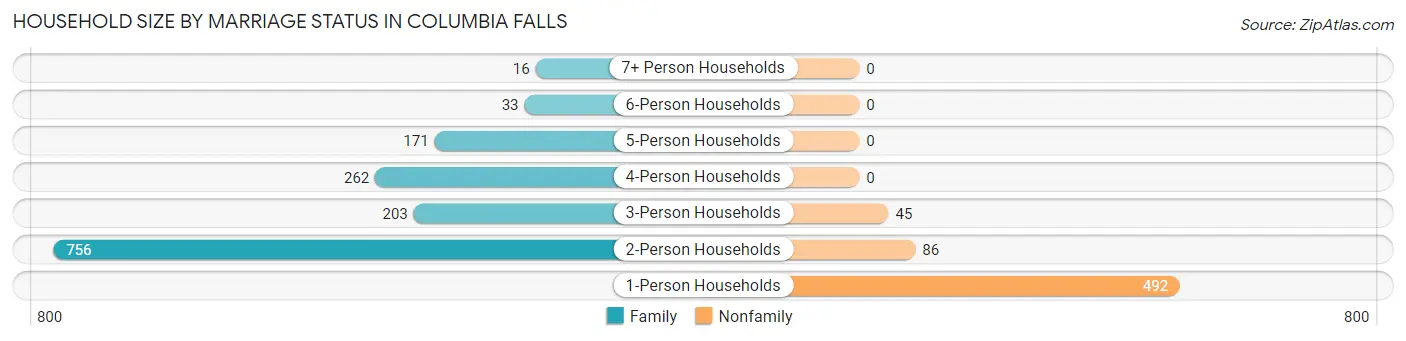
| Household Size | Family Households | Nonfamily Households |
| 1-Person Households | - | 492 (23.8%) |
| 2-Person Households | 756 (36.6%) | 86 (4.2%) |
| 3-Person Households | 203 (9.8%) | 45 (2.2%) |
| 4-Person Households | 262 (12.7%) | 0 (0.0%) |
| 5-Person Households | 171 (8.3%) | 0 (0.0%) |
| 6-Person Households | 33 (1.6%) | 0 (0.0%) |
| 7+ Person Households | 16 (0.8%) | 0 (0.0%) |
| Total | 1,441 (69.8%) | 623 (30.2%) |
Female Fertility in Columbia Falls
Fertility by Age in Columbia Falls
Average fertility rate in Columbia Falls is 68.0 births per 1,000 women. Women in the age bracket of 20 to 34 years have the highest fertility rate with 200.0 births per 1,000 women. Women in the age bracket of 20 to 34 years acount for 100.0% of all women with births.
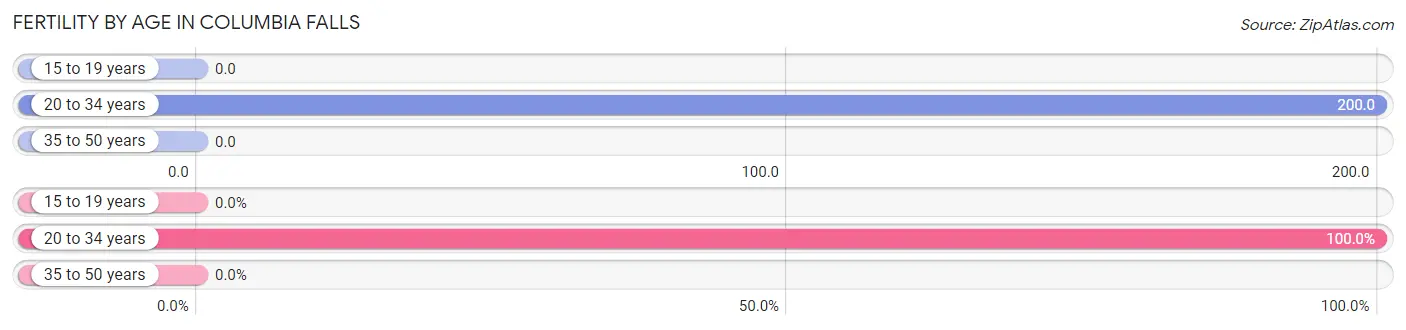
| Age Bracket | Women with Births | Births / 1,000 Women |
| 15 to 19 years | 0 (0.0%) | 0.0 |
| 20 to 34 years | 85 (100.0%) | 200.0 |
| 35 to 50 years | 0 (0.0%) | 0.0 |
| Total | 85 (100.0%) | 68.0 |
Fertility by Age by Marriage Status in Columbia Falls
88.2% of women with births (85) in Columbia Falls are married. The highest percentage of unmarried women with births falls into 20 to 34 years age bracket with 11.8% of them unmarried at the time of birth, while the lowest percentage of unmarried women with births belong to 20 to 34 years age bracket with 11.8% of them unmarried.
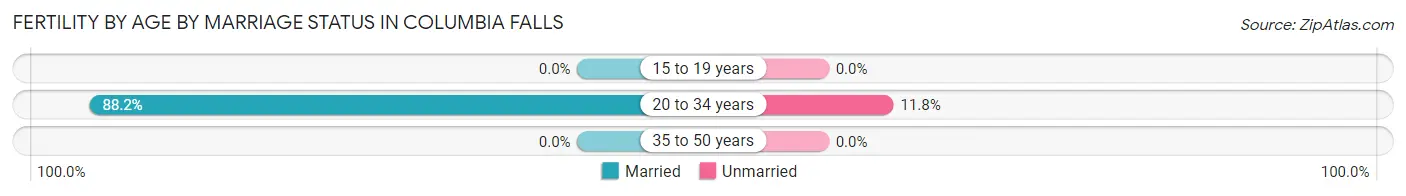
| Age Bracket | Married | Unmarried |
| 15 to 19 years | 0 (0.0%) | 0 (0.0%) |
| 20 to 34 years | 75 (88.2%) | 10 (11.8%) |
| 35 to 50 years | 0 (0.0%) | 0 (0.0%) |
| Total | 75 (88.2%) | 10 (11.8%) |
Fertility by Education in Columbia Falls
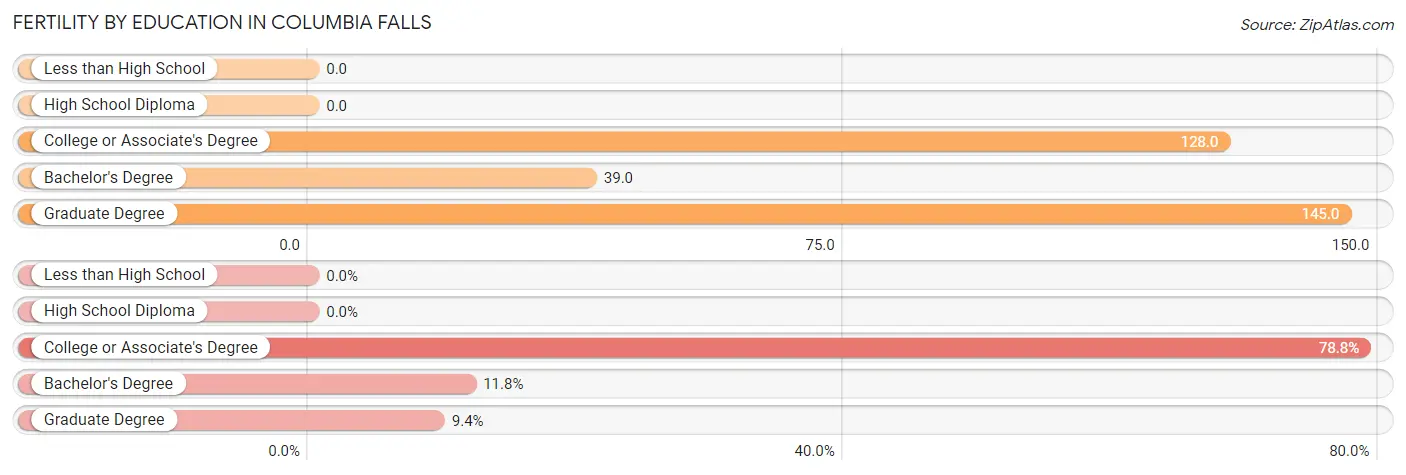
| Educational Attainment | Women with Births | Births / 1,000 Women |
| Less than High School | 0 (0.0%) | 0.0 |
| High School Diploma | 0 (0.0%) | 0.0 |
| College or Associate's Degree | 67 (78.8%) | 128.0 |
| Bachelor's Degree | 10 (11.8%) | 39.0 |
| Graduate Degree | 8 (9.4%) | 145.0 |
| Total | 85 (100.0%) | 68.0 |
Fertility by Education by Marriage Status in Columbia Falls
11.8% of women with births in Columbia Falls are unmarried. Women with the educational attainment of bachelor's degree are most likely to be married with 100.0% of them married at childbirth, while women with the educational attainment of college or associate's degree are least likely to be married with 14.9% of them unmarried at childbirth.
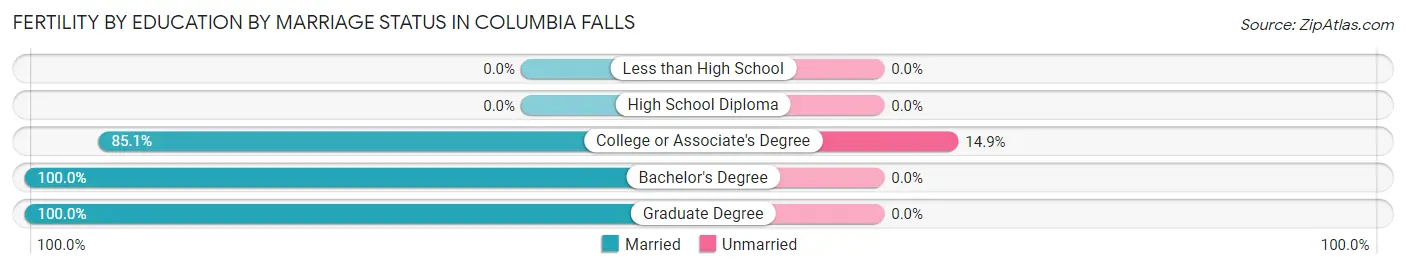
| Educational Attainment | Married | Unmarried |
| Less than High School | 0 (0.0%) | 0 (0.0%) |
| High School Diploma | 0 (0.0%) | 0 (0.0%) |
| College or Associate's Degree | 57 (85.1%) | 10 (14.9%) |
| Bachelor's Degree | 10 (100.0%) | 0 (0.0%) |
| Graduate Degree | 8 (100.0%) | 0 (0.0%) |
| Total | 75 (88.2%) | 10 (11.8%) |
Employment Characteristics in Columbia Falls
Employment by Class of Employer in Columbia Falls
Among the 2,494 employed individuals in Columbia Falls, private company employees (1,759 | 70.5%), self-employed (not incorporated) (270 | 10.8%), and not-for-profit organizations (235 | 9.4%) make up the most common classes of employment.
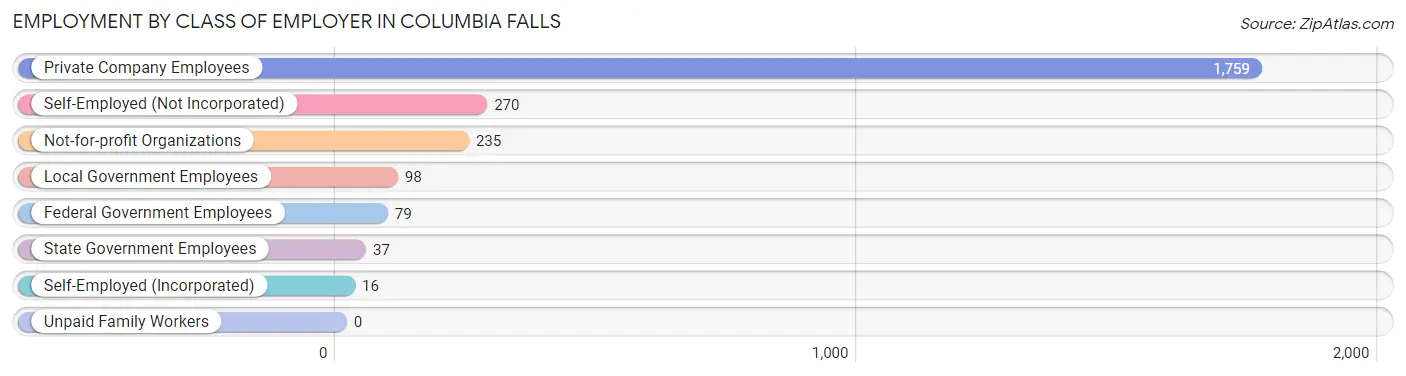
| Employer Class | # Employees | % Employees |
| Private Company Employees | 1,759 | 70.5% |
| Self-Employed (Incorporated) | 16 | 0.6% |
| Self-Employed (Not Incorporated) | 270 | 10.8% |
| Not-for-profit Organizations | 235 | 9.4% |
| Local Government Employees | 98 | 3.9% |
| State Government Employees | 37 | 1.5% |
| Federal Government Employees | 79 | 3.2% |
| Unpaid Family Workers | 0 | 0.0% |
| Total | 2,494 | 100.0% |
Employment Status by Age in Columbia Falls
According to the labor force statistics for Columbia Falls, out of the total population over 16 years of age (4,090), 65.2% or 2,667 individuals are in the labor force, with 5.8% or 155 of them unemployed. The age group with the highest labor force participation rate is 25 to 29 years, with 90.7% or 235 individuals in the labor force. Within the labor force, the 25 to 29 years age range has the highest percentage of unemployed individuals, with 24.3% or 57 of them being unemployed.
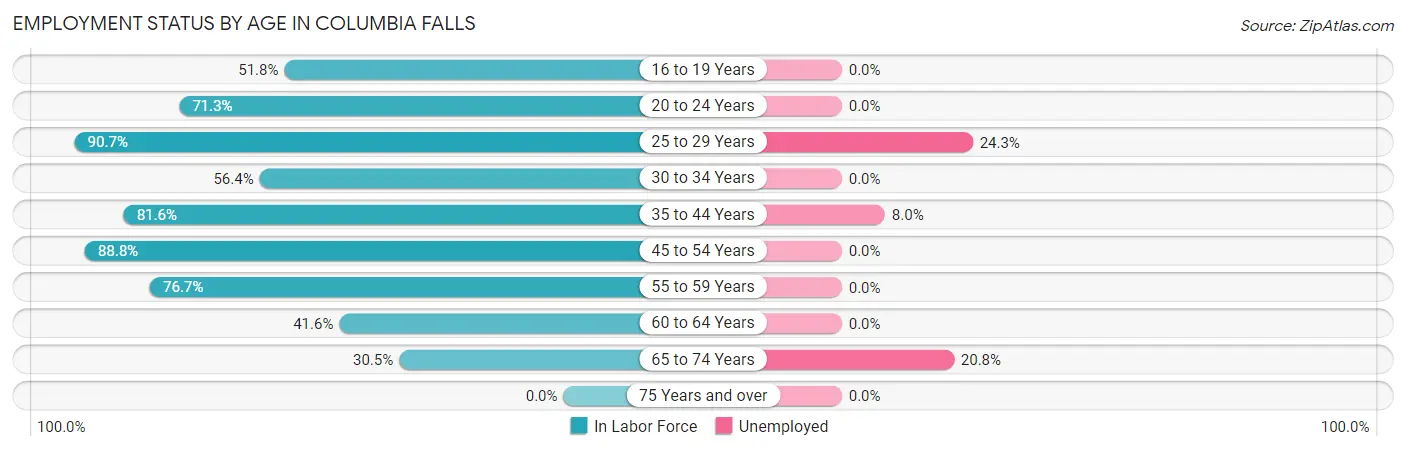
| Age Bracket | In Labor Force | Unemployed |
| 16 to 19 Years | 188 (51.8%) | 0 (0.0%) |
| 20 to 24 Years | 82 (71.3%) | 0 (0.0%) |
| 25 to 29 Years | 235 (90.7%) | 57 (24.3%) |
| 30 to 34 Years | 190 (56.4%) | 0 (0.0%) |
| 35 to 44 Years | 938 (81.6%) | 75 (8.0%) |
| 45 to 54 Years | 618 (88.8%) | 0 (0.0%) |
| 55 to 59 Years | 148 (76.7%) | 0 (0.0%) |
| 60 to 64 Years | 162 (41.6%) | 0 (0.0%) |
| 65 to 74 Years | 106 (30.5%) | 22 (20.8%) |
| 75 Years and over | 0 (0.0%) | 0 (0.0%) |
| Total | 2,667 (65.2%) | 155 (5.8%) |
Employment Status by Educational Attainment in Columbia Falls
According to labor force statistics for Columbia Falls, 75.8% of individuals (2,292) out of the total population between 25 and 64 years of age (3,024) are in the labor force, with 5.8% or 133 of them being unemployed. The group with the highest labor force participation rate are those with the educational attainment of bachelor's degree or higher, with 78.2% or 544 individuals in the labor force. Within the labor force, individuals with less than high school education have the highest percentage of unemployment, with 40.8% or 75 of them being unemployed.
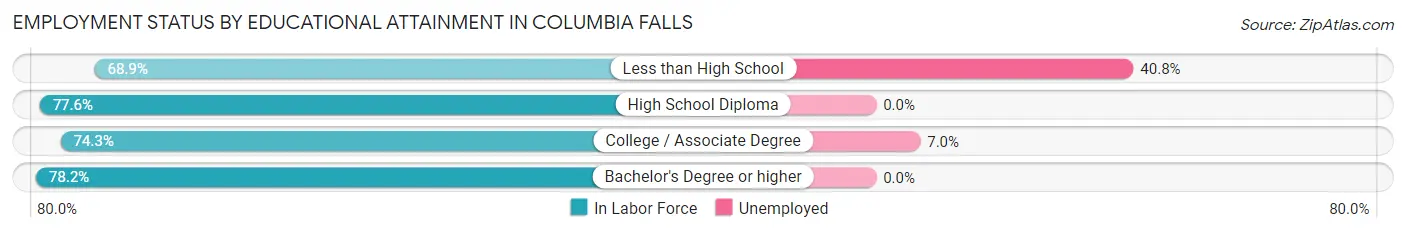
| Educational Attainment | In Labor Force | Unemployed |
| Less than High School | 184 (68.9%) | 109 (40.8%) |
| High School Diploma | 746 (77.6%) | 0 (0.0%) |
| College / Associate Degree | 817 (74.3%) | 77 (7.0%) |
| Bachelor's Degree or higher | 544 (78.2%) | 0 (0.0%) |
| Total | 2,292 (75.8%) | 175 (5.8%) |
Employment Occupations by Sex in Columbia Falls
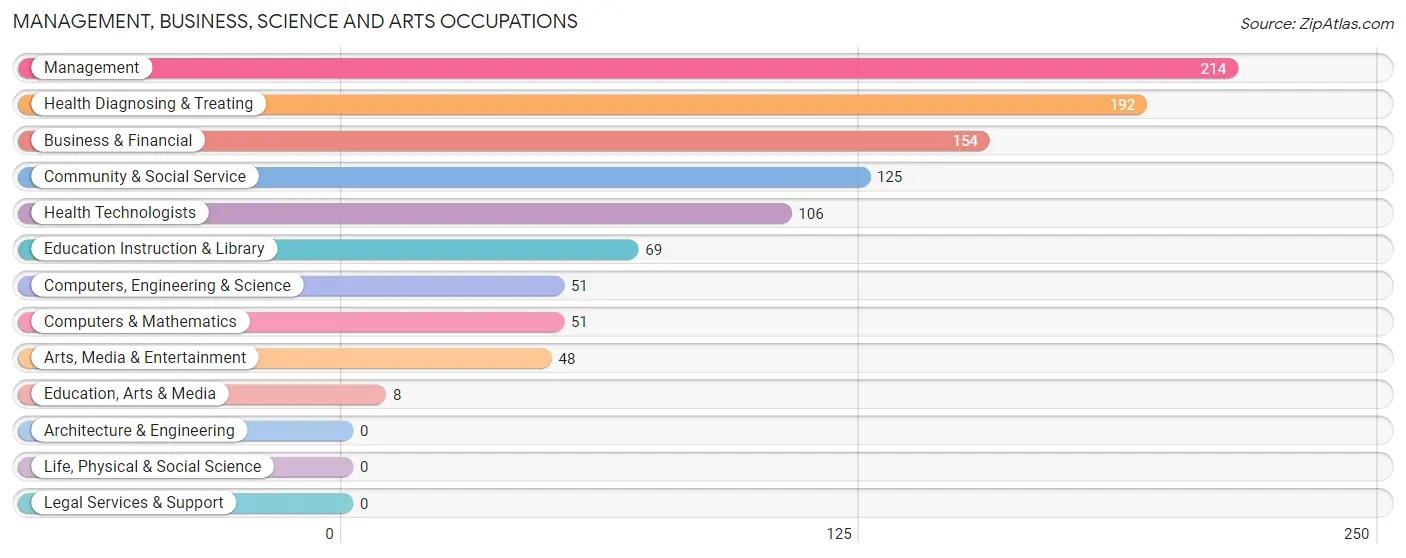
Management, Business, Science and Arts Occupations
The most common Management, Business, Science and Arts occupations in Columbia Falls are Management (214 | 8.5%), Health Diagnosing & Treating (192 | 7.6%), Business & Financial (154 | 6.1%), Community & Social Service (125 | 5.0%), and Health Technologists (106 | 4.2%).
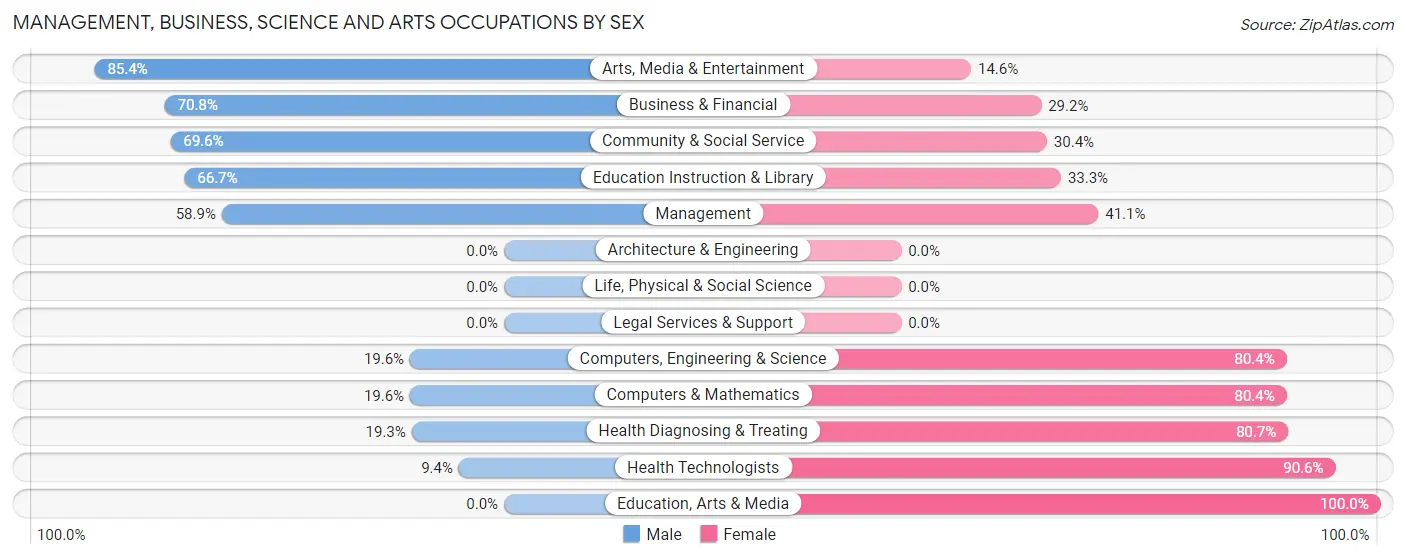
Management, Business, Science and Arts Occupations by Sex
Within the Management, Business, Science and Arts occupations in Columbia Falls, the most male-oriented occupations are Arts, Media & Entertainment (85.4%), Business & Financial (70.8%), and Community & Social Service (69.6%), while the most female-oriented occupations are Education, Arts & Media (100.0%), Health Technologists (90.6%), and Health Diagnosing & Treating (80.7%).
| Occupation | Male | Female |
| Management | 126 (58.9%) | 88 (41.1%) |
| Business & Financial | 109 (70.8%) | 45 (29.2%) |
| Computers, Engineering & Science | 10 (19.6%) | 41 (80.4%) |
| Computers & Mathematics | 10 (19.6%) | 41 (80.4%) |
| Architecture & Engineering | 0 (0.0%) | 0 (0.0%) |
| Life, Physical & Social Science | 0 (0.0%) | 0 (0.0%) |
| Community & Social Service | 87 (69.6%) | 38 (30.4%) |
| Education, Arts & Media | 0 (0.0%) | 8 (100.0%) |
| Legal Services & Support | 0 (0.0%) | 0 (0.0%) |
| Education Instruction & Library | 46 (66.7%) | 23 (33.3%) |
| Arts, Media & Entertainment | 41 (85.4%) | 7 (14.6%) |
| Health Diagnosing & Treating | 37 (19.3%) | 155 (80.7%) |
| Health Technologists | 10 (9.4%) | 96 (90.6%) |
| Total (Category) | 369 (50.1%) | 367 (49.9%) |
| Total (Overall) | 1,418 (56.4%) | 1,095 (43.6%) |
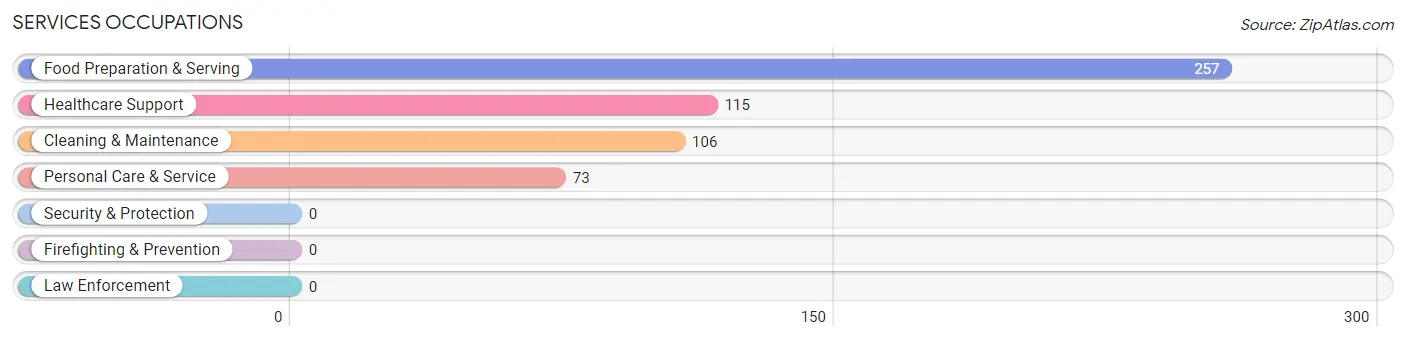
Services Occupations
The most common Services occupations in Columbia Falls are Food Preparation & Serving (257 | 10.2%), Healthcare Support (115 | 4.6%), Cleaning & Maintenance (106 | 4.2%), and Personal Care & Service (73 | 2.9%).
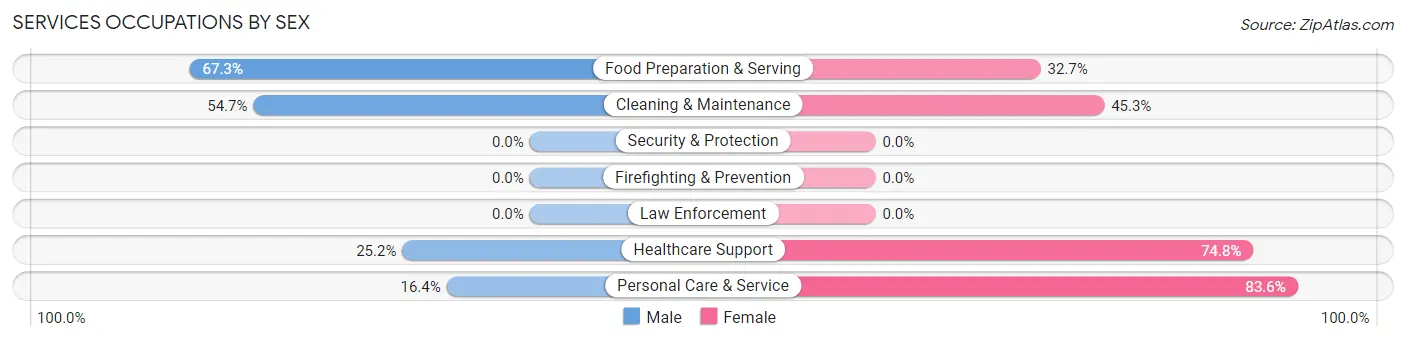
Services Occupations by Sex
Within the Services occupations in Columbia Falls, the most male-oriented occupations are Food Preparation & Serving (67.3%), Cleaning & Maintenance (54.7%), and Healthcare Support (25.2%), while the most female-oriented occupations are Personal Care & Service (83.6%), Healthcare Support (74.8%), and Cleaning & Maintenance (45.3%).
| Occupation | Male | Female |
| Healthcare Support | 29 (25.2%) | 86 (74.8%) |
| Security & Protection | 0 (0.0%) | 0 (0.0%) |
| Firefighting & Prevention | 0 (0.0%) | 0 (0.0%) |
| Law Enforcement | 0 (0.0%) | 0 (0.0%) |
| Food Preparation & Serving | 173 (67.3%) | 84 (32.7%) |
| Cleaning & Maintenance | 58 (54.7%) | 48 (45.3%) |
| Personal Care & Service | 12 (16.4%) | 61 (83.6%) |
| Total (Category) | 272 (49.4%) | 279 (50.6%) |
| Total (Overall) | 1,418 (56.4%) | 1,095 (43.6%) |
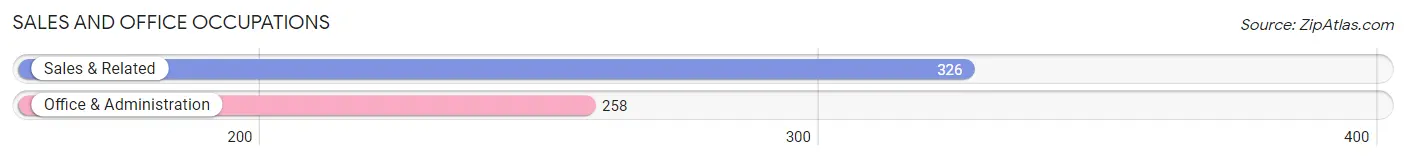
Sales and Office Occupations
The most common Sales and Office occupations in Columbia Falls are Sales & Related (326 | 13.0%), and Office & Administration (258 | 10.3%).
Sales and Office Occupations by Sex
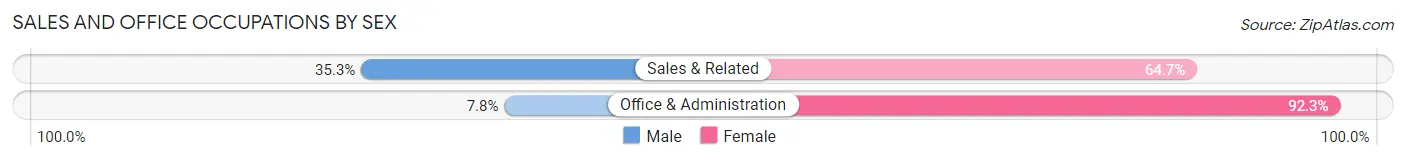
| Occupation | Male | Female |
| Sales & Related | 115 (35.3%) | 211 (64.7%) |
| Office & Administration | 20 (7.7%) | 238 (92.2%) |
| Total (Category) | 135 (23.1%) | 449 (76.9%) |
| Total (Overall) | 1,418 (56.4%) | 1,095 (43.6%) |
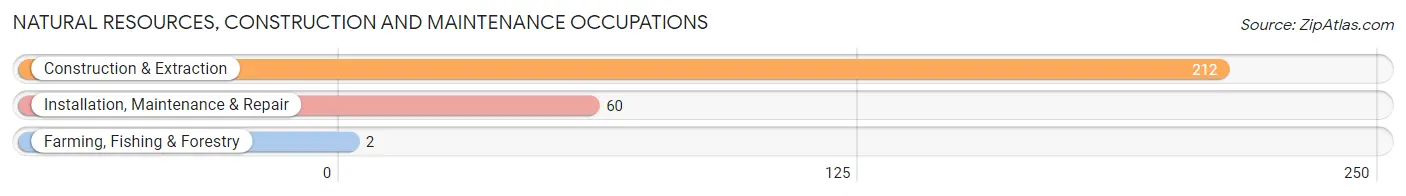
Natural Resources, Construction and Maintenance Occupations
The most common Natural Resources, Construction and Maintenance occupations in Columbia Falls are Construction & Extraction (212 | 8.4%), Installation, Maintenance & Repair (60 | 2.4%), and Farming, Fishing & Forestry (2 | 0.1%).
Natural Resources, Construction and Maintenance Occupations by Sex
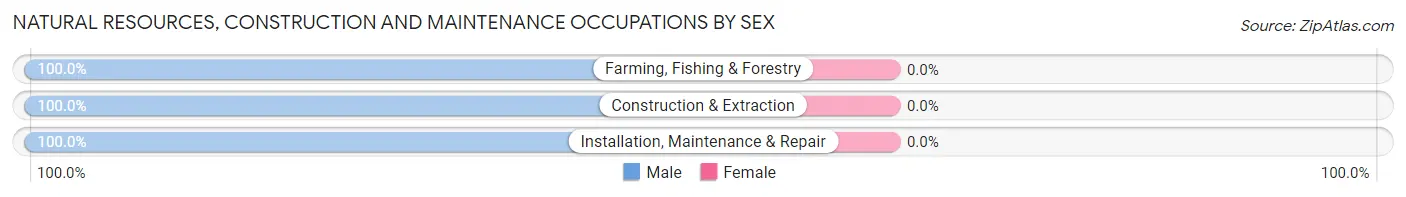
| Occupation | Male | Female |
| Farming, Fishing & Forestry | 2 (100.0%) | 0 (0.0%) |
| Construction & Extraction | 212 (100.0%) | 0 (0.0%) |
| Installation, Maintenance & Repair | 60 (100.0%) | 0 (0.0%) |
| Total (Category) | 274 (100.0%) | 0 (0.0%) |
| Total (Overall) | 1,418 (56.4%) | 1,095 (43.6%) |
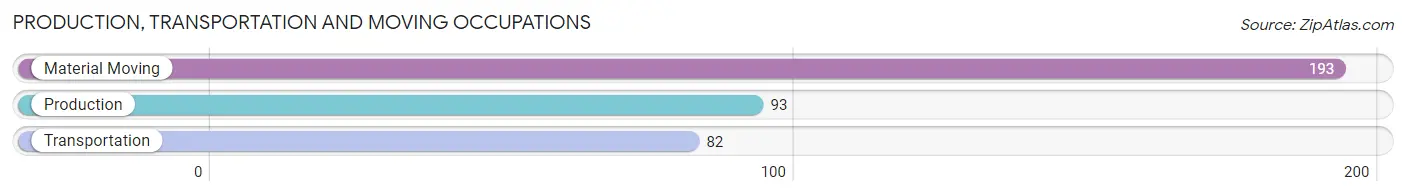
Production, Transportation and Moving Occupations
The most common Production, Transportation and Moving occupations in Columbia Falls are Material Moving (193 | 7.7%), Production (93 | 3.7%), and Transportation (82 | 3.3%).
Production, Transportation and Moving Occupations by Sex
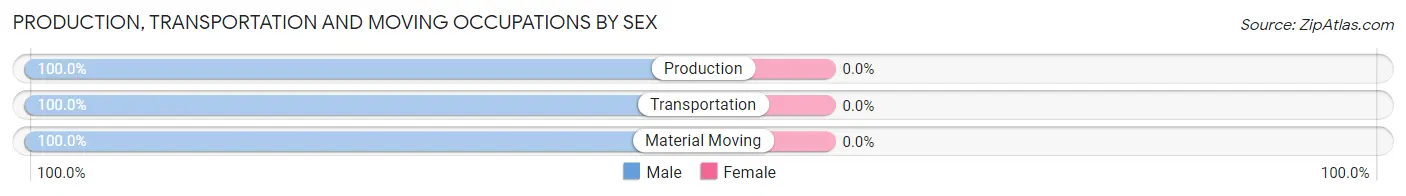
| Occupation | Male | Female |
| Production | 93 (100.0%) | 0 (0.0%) |
| Transportation | 82 (100.0%) | 0 (0.0%) |
| Material Moving | 193 (100.0%) | 0 (0.0%) |
| Total (Category) | 368 (100.0%) | 0 (0.0%) |
| Total (Overall) | 1,418 (56.4%) | 1,095 (43.6%) |
Employment Industries by Sex in Columbia Falls
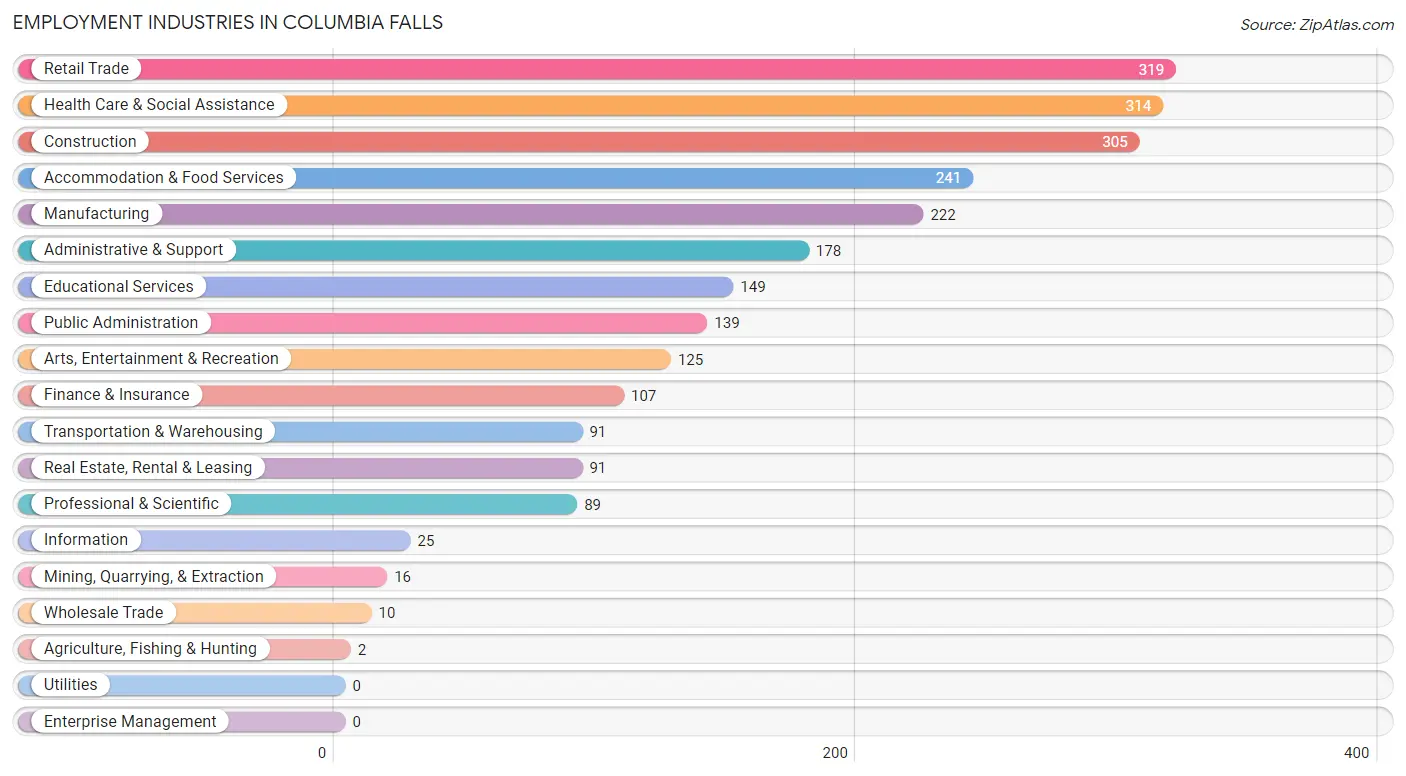
Employment Industries in Columbia Falls
The major employment industries in Columbia Falls include Retail Trade (319 | 12.7%), Health Care & Social Assistance (314 | 12.5%), Construction (305 | 12.1%), Accommodation & Food Services (241 | 9.6%), and Manufacturing (222 | 8.8%).
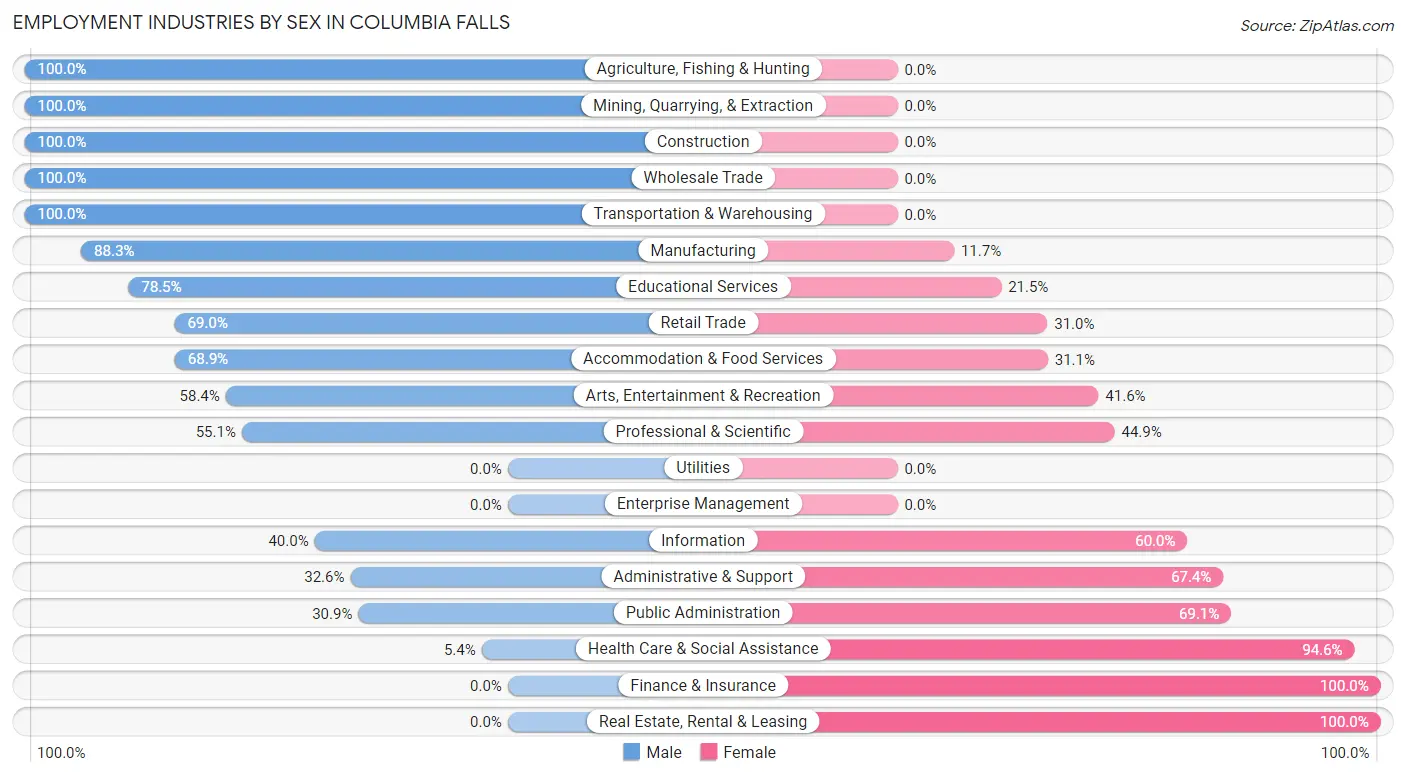
Employment Industries by Sex in Columbia Falls
The Columbia Falls industries that see more men than women are Agriculture, Fishing & Hunting (100.0%), Mining, Quarrying, & Extraction (100.0%), and Construction (100.0%), whereas the industries that tend to have a higher number of women are Finance & Insurance (100.0%), Real Estate, Rental & Leasing (100.0%), and Health Care & Social Assistance (94.6%).
| Industry | Male | Female |
| Agriculture, Fishing & Hunting | 2 (100.0%) | 0 (0.0%) |
| Mining, Quarrying, & Extraction | 16 (100.0%) | 0 (0.0%) |
| Construction | 305 (100.0%) | 0 (0.0%) |
| Manufacturing | 196 (88.3%) | 26 (11.7%) |
| Wholesale Trade | 10 (100.0%) | 0 (0.0%) |
| Retail Trade | 220 (69.0%) | 99 (31.0%) |
| Transportation & Warehousing | 91 (100.0%) | 0 (0.0%) |
| Utilities | 0 (0.0%) | 0 (0.0%) |
| Information | 10 (40.0%) | 15 (60.0%) |
| Finance & Insurance | 0 (0.0%) | 107 (100.0%) |
| Real Estate, Rental & Leasing | 0 (0.0%) | 91 (100.0%) |
| Professional & Scientific | 49 (55.1%) | 40 (44.9%) |
| Enterprise Management | 0 (0.0%) | 0 (0.0%) |
| Administrative & Support | 58 (32.6%) | 120 (67.4%) |
| Educational Services | 117 (78.5%) | 32 (21.5%) |
| Health Care & Social Assistance | 17 (5.4%) | 297 (94.6%) |
| Arts, Entertainment & Recreation | 73 (58.4%) | 52 (41.6%) |
| Accommodation & Food Services | 166 (68.9%) | 75 (31.1%) |
| Public Administration | 43 (30.9%) | 96 (69.1%) |
| Total | 1,418 (56.4%) | 1,095 (43.6%) |
Education in Columbia Falls
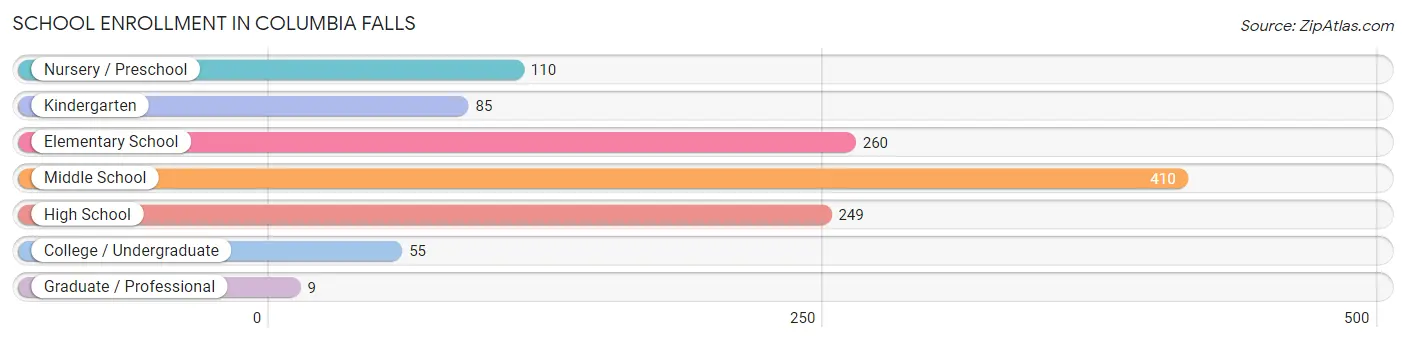
School Enrollment in Columbia Falls
The most common levels of schooling among the 1,178 students in Columbia Falls are middle school (410 | 34.8%), elementary school (260 | 22.1%), and high school (249 | 21.1%).
| School Level | # Students | % Students |
| Nursery / Preschool | 110 | 9.3% |
| Kindergarten | 85 | 7.2% |
| Elementary School | 260 | 22.1% |
| Middle School | 410 | 34.8% |
| High School | 249 | 21.1% |
| College / Undergraduate | 55 | 4.7% |
| Graduate / Professional | 9 | 0.8% |
| Total | 1,178 | 100.0% |
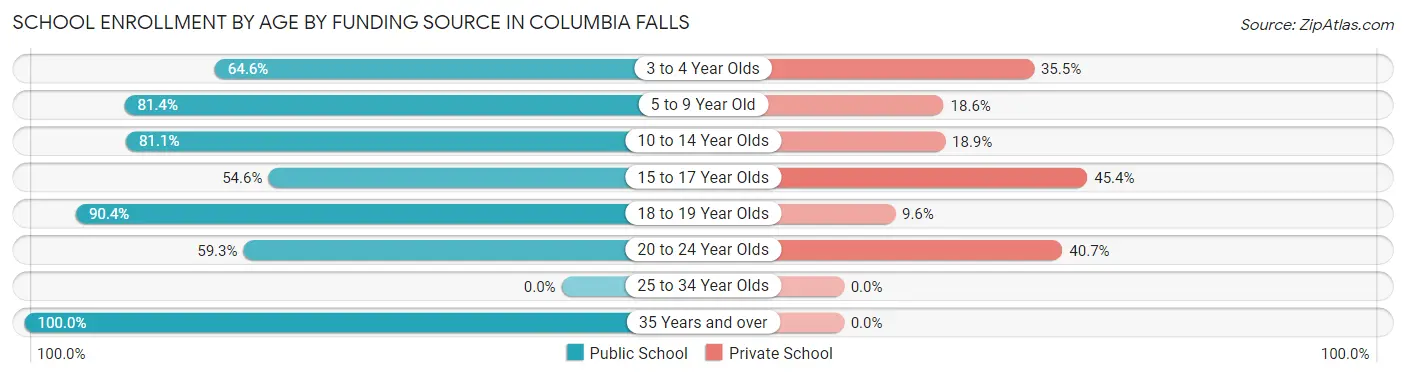
School Enrollment by Age by Funding Source in Columbia Falls
Out of a total of 1,178 students who are enrolled in schools in Columbia Falls, 270 (22.9%) attend a private institution, while the remaining 908 (77.1%) are enrolled in public schools. The age group of 15 to 17 year olds has the highest likelihood of being enrolled in private schools, with 59 (45.4% in the age bracket) enrolled. Conversely, the age group of 35 years and over has the lowest likelihood of being enrolled in a private school, with 9 (100.0% in the age bracket) attending a public institution.
| Age Bracket | Public School | Private School |
| 3 to 4 Year Olds | 71 (64.5%) | 39 (35.4%) |
| 5 to 9 Year Old | 201 (81.4%) | 46 (18.6%) |
| 10 to 14 Year Olds | 455 (81.1%) | 106 (18.9%) |
| 15 to 17 Year Olds | 71 (54.6%) | 59 (45.4%) |
| 18 to 19 Year Olds | 85 (90.4%) | 9 (9.6%) |
| 20 to 24 Year Olds | 16 (59.3%) | 11 (40.7%) |
| 25 to 34 Year Olds | 0 (0.0%) | 0 (0.0%) |
| 35 Years and over | 9 (100.0%) | 0 (0.0%) |
| Total | 908 (77.1%) | 270 (22.9%) |
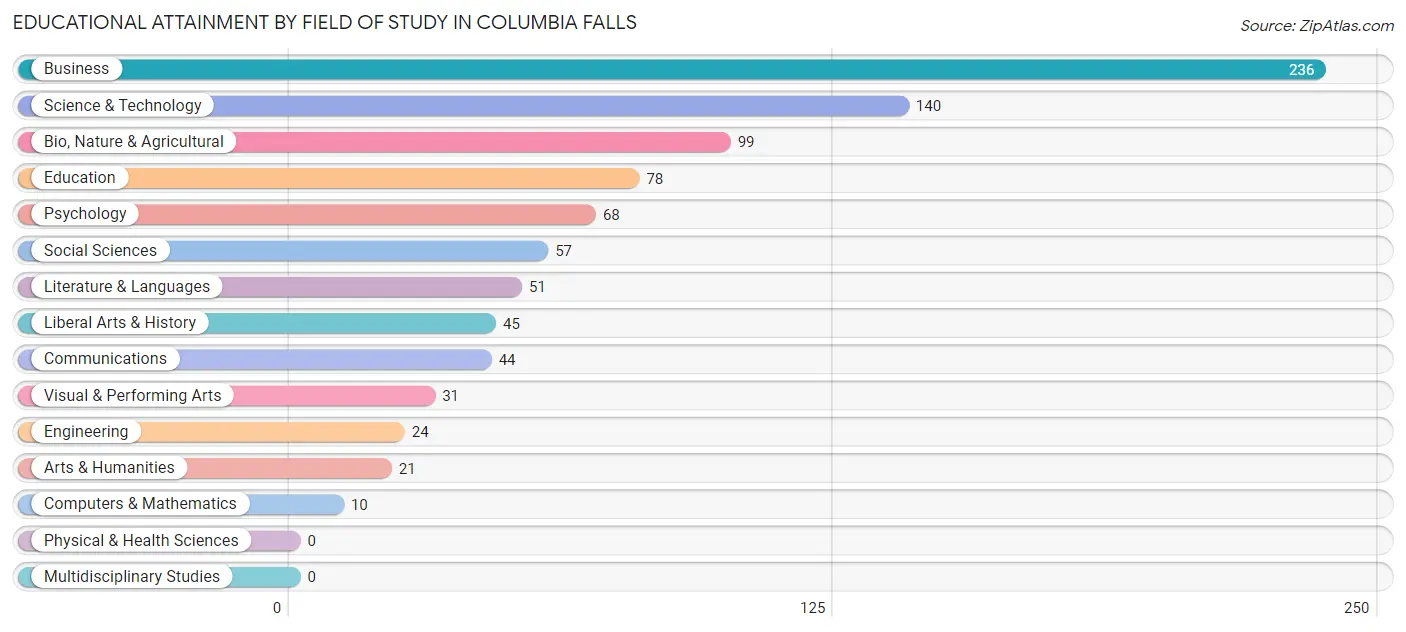
Educational Attainment by Field of Study in Columbia Falls
Business (236 | 26.1%), science & technology (140 | 15.5%), bio, nature & agricultural (99 | 11.0%), education (78 | 8.6%), and psychology (68 | 7.5%) are the most common fields of study among 904 individuals in Columbia Falls who have obtained a bachelor's degree or higher.
| Field of Study | # Graduates | % Graduates |
| Computers & Mathematics | 10 | 1.1% |
| Bio, Nature & Agricultural | 99 | 11.0% |
| Physical & Health Sciences | 0 | 0.0% |
| Psychology | 68 | 7.5% |
| Social Sciences | 57 | 6.3% |
| Engineering | 24 | 2.6% |
| Multidisciplinary Studies | 0 | 0.0% |
| Science & Technology | 140 | 15.5% |
| Business | 236 | 26.1% |
| Education | 78 | 8.6% |
| Literature & Languages | 51 | 5.6% |
| Liberal Arts & History | 45 | 5.0% |
| Visual & Performing Arts | 31 | 3.4% |
| Communications | 44 | 4.9% |
| Arts & Humanities | 21 | 2.3% |
| Total | 904 | 100.0% |
Transportation & Commute in Columbia Falls
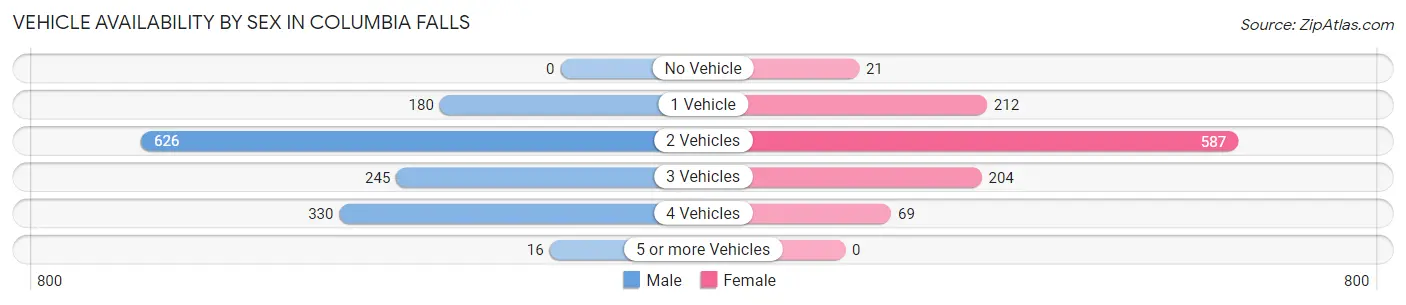
Vehicle Availability by Sex in Columbia Falls
The most prevalent vehicle ownership categories in Columbia Falls are males with 2 vehicles (626, accounting for 44.8%) and females with 2 vehicles (587, making up 57.3%).
| Vehicles Available | Male | Female |
| No Vehicle | 0 (0.0%) | 21 (1.9%) |
| 1 Vehicle | 180 (12.9%) | 212 (19.4%) |
| 2 Vehicles | 626 (44.8%) | 587 (53.7%) |
| 3 Vehicles | 245 (17.5%) | 204 (18.7%) |
| 4 Vehicles | 330 (23.6%) | 69 (6.3%) |
| 5 or more Vehicles | 16 (1.1%) | 0 (0.0%) |
| Total | 1,397 (100.0%) | 1,093 (100.0%) |
Commute Time in Columbia Falls
The most frequently occuring commute durations in Columbia Falls are 30 to 34 minutes (659 commuters, 30.9%), 20 to 24 minutes (409 commuters, 19.2%), and 10 to 14 minutes (373 commuters, 17.5%).
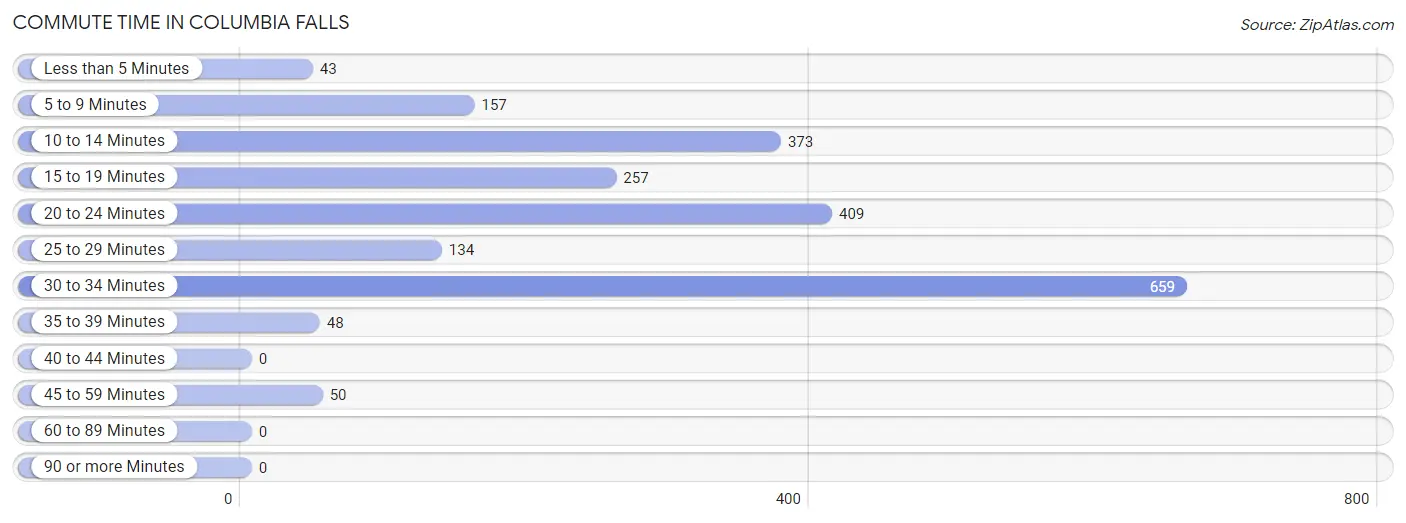
| Commute Time | # Commuters | % Commuters |
| Less than 5 Minutes | 43 | 2.0% |
| 5 to 9 Minutes | 157 | 7.4% |
| 10 to 14 Minutes | 373 | 17.5% |
| 15 to 19 Minutes | 257 | 12.1% |
| 20 to 24 Minutes | 409 | 19.2% |
| 25 to 29 Minutes | 134 | 6.3% |
| 30 to 34 Minutes | 659 | 30.9% |
| 35 to 39 Minutes | 48 | 2.2% |
| 40 to 44 Minutes | 0 | 0.0% |
| 45 to 59 Minutes | 50 | 2.4% |
| 60 to 89 Minutes | 0 | 0.0% |
| 90 or more Minutes | 0 | 0.0% |
Commute Time by Sex in Columbia Falls
The most common commute times in Columbia Falls are 20 to 24 minutes (305 commuters, 24.8%) for males and 30 to 34 minutes (356 commuters, 39.5%) for females.
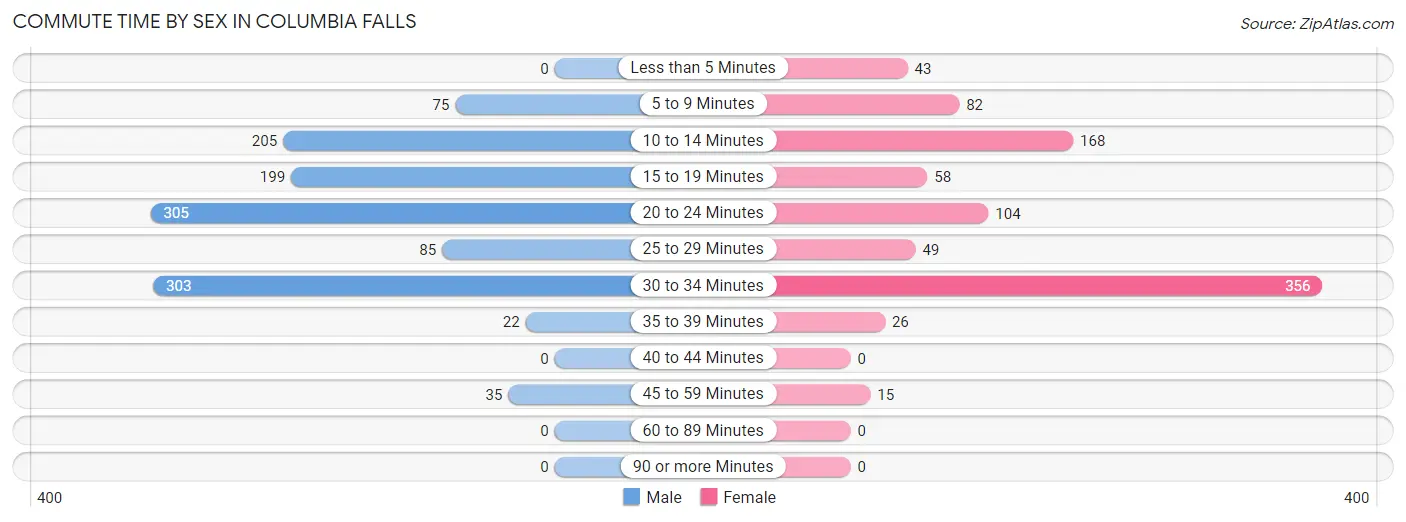
| Commute Time | Male | Female |
| Less than 5 Minutes | 0 (0.0%) | 43 (4.8%) |
| 5 to 9 Minutes | 75 (6.1%) | 82 (9.1%) |
| 10 to 14 Minutes | 205 (16.7%) | 168 (18.6%) |
| 15 to 19 Minutes | 199 (16.2%) | 58 (6.4%) |
| 20 to 24 Minutes | 305 (24.8%) | 104 (11.5%) |
| 25 to 29 Minutes | 85 (6.9%) | 49 (5.4%) |
| 30 to 34 Minutes | 303 (24.6%) | 356 (39.5%) |
| 35 to 39 Minutes | 22 (1.8%) | 26 (2.9%) |
| 40 to 44 Minutes | 0 (0.0%) | 0 (0.0%) |
| 45 to 59 Minutes | 35 (2.9%) | 15 (1.7%) |
| 60 to 89 Minutes | 0 (0.0%) | 0 (0.0%) |
| 90 or more Minutes | 0 (0.0%) | 0 (0.0%) |
Time of Departure to Work by Sex in Columbia Falls
The most frequent times of departure to work in Columbia Falls are 6:30 AM to 6:59 AM (197, 16.0%) for males and 7:00 AM to 7:29 AM (180, 20.0%) for females.
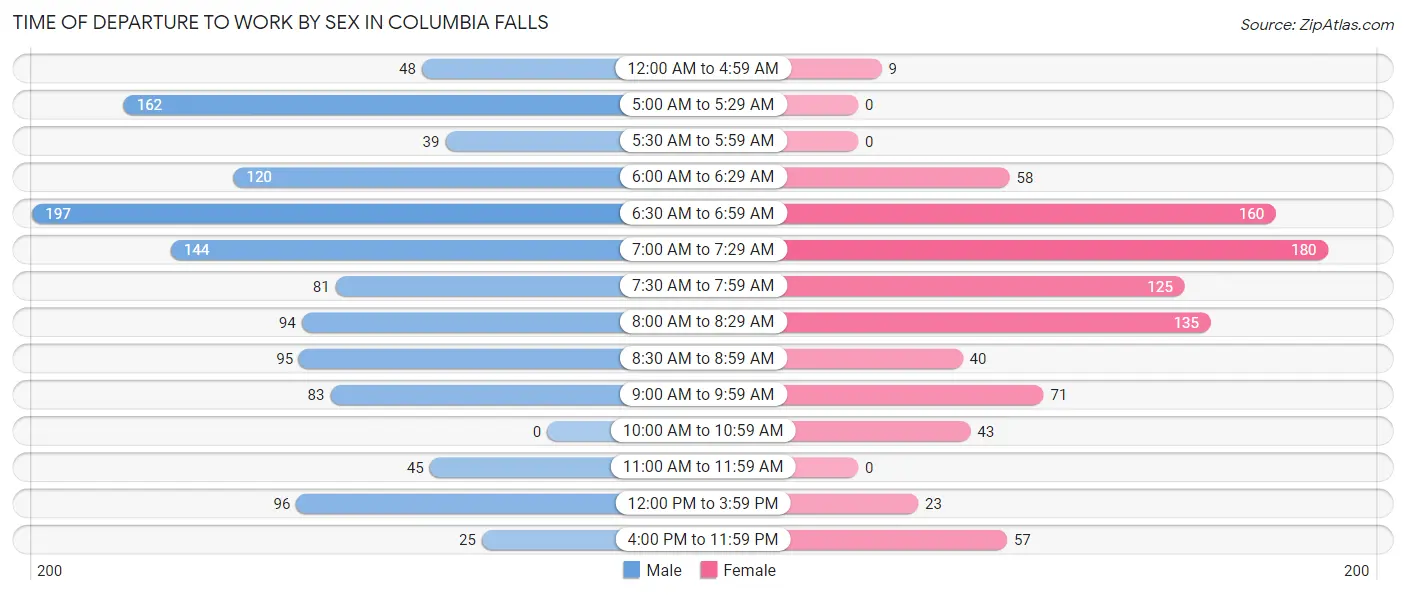
| Time of Departure | Male | Female |
| 12:00 AM to 4:59 AM | 48 (3.9%) | 9 (1.0%) |
| 5:00 AM to 5:29 AM | 162 (13.2%) | 0 (0.0%) |
| 5:30 AM to 5:59 AM | 39 (3.2%) | 0 (0.0%) |
| 6:00 AM to 6:29 AM | 120 (9.8%) | 58 (6.4%) |
| 6:30 AM to 6:59 AM | 197 (16.0%) | 160 (17.8%) |
| 7:00 AM to 7:29 AM | 144 (11.7%) | 180 (20.0%) |
| 7:30 AM to 7:59 AM | 81 (6.6%) | 125 (13.9%) |
| 8:00 AM to 8:29 AM | 94 (7.6%) | 135 (15.0%) |
| 8:30 AM to 8:59 AM | 95 (7.7%) | 40 (4.4%) |
| 9:00 AM to 9:59 AM | 83 (6.8%) | 71 (7.9%) |
| 10:00 AM to 10:59 AM | 0 (0.0%) | 43 (4.8%) |
| 11:00 AM to 11:59 AM | 45 (3.7%) | 0 (0.0%) |
| 12:00 PM to 3:59 PM | 96 (7.8%) | 23 (2.5%) |
| 4:00 PM to 11:59 PM | 25 (2.0%) | 57 (6.3%) |
| Total | 1,229 (100.0%) | 901 (100.0%) |
Housing Occupancy in Columbia Falls
Occupancy by Ownership in Columbia Falls
Of the total 2,064 dwellings in Columbia Falls, owner-occupied units account for 1,313 (63.6%), while renter-occupied units make up 751 (36.4%).
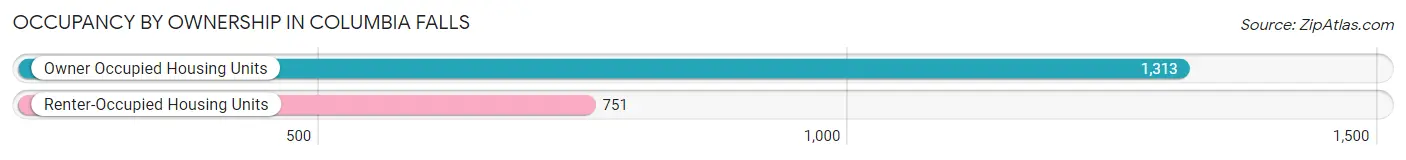
| Occupancy | # Housing Units | % Housing Units |
| Owner Occupied Housing Units | 1,313 | 63.6% |
| Renter-Occupied Housing Units | 751 | 36.4% |
| Total Occupied Housing Units | 2,064 | 100.0% |
Occupancy by Household Size in Columbia Falls
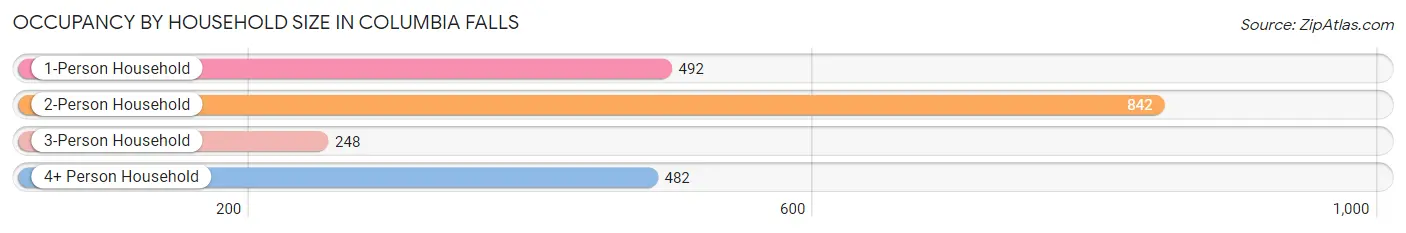
| Household Size | # Housing Units | % Housing Units |
| 1-Person Household | 492 | 23.8% |
| 2-Person Household | 842 | 40.8% |
| 3-Person Household | 248 | 12.0% |
| 4+ Person Household | 482 | 23.4% |
| Total Housing Units | 2,064 | 100.0% |
Occupancy by Ownership by Household Size in Columbia Falls
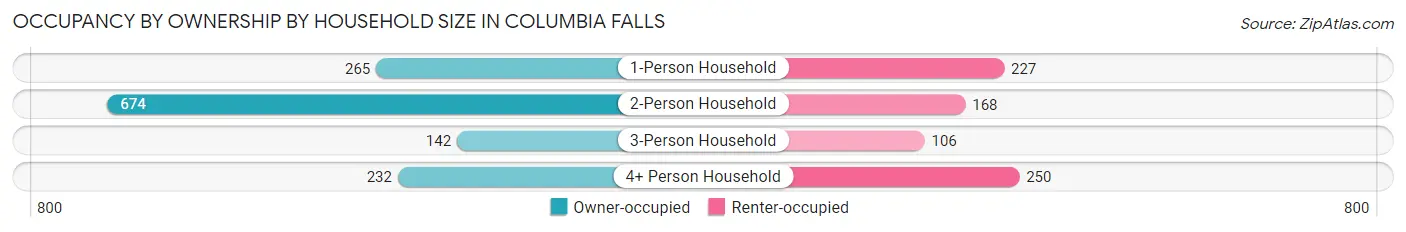
| Household Size | Owner-occupied | Renter-occupied |
| 1-Person Household | 265 (53.9%) | 227 (46.1%) |
| 2-Person Household | 674 (80.0%) | 168 (20.0%) |
| 3-Person Household | 142 (57.3%) | 106 (42.7%) |
| 4+ Person Household | 232 (48.1%) | 250 (51.9%) |
| Total Housing Units | 1,313 (63.6%) | 751 (36.4%) |
Occupancy by Educational Attainment in Columbia Falls
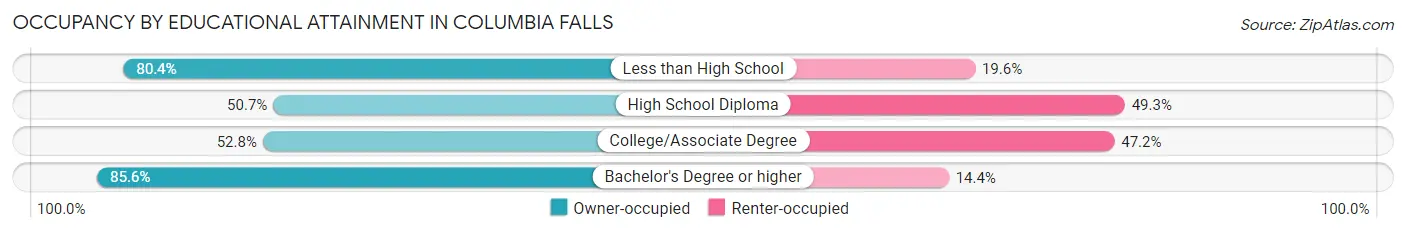
| Household Size | Owner-occupied | Renter-occupied |
| Less than High School | 119 (80.4%) | 29 (19.6%) |
| High School Diploma | 281 (50.7%) | 273 (49.3%) |
| College/Associate Degree | 407 (52.8%) | 364 (47.2%) |
| Bachelor's Degree or higher | 506 (85.6%) | 85 (14.4%) |
Occupancy by Age of Householder in Columbia Falls
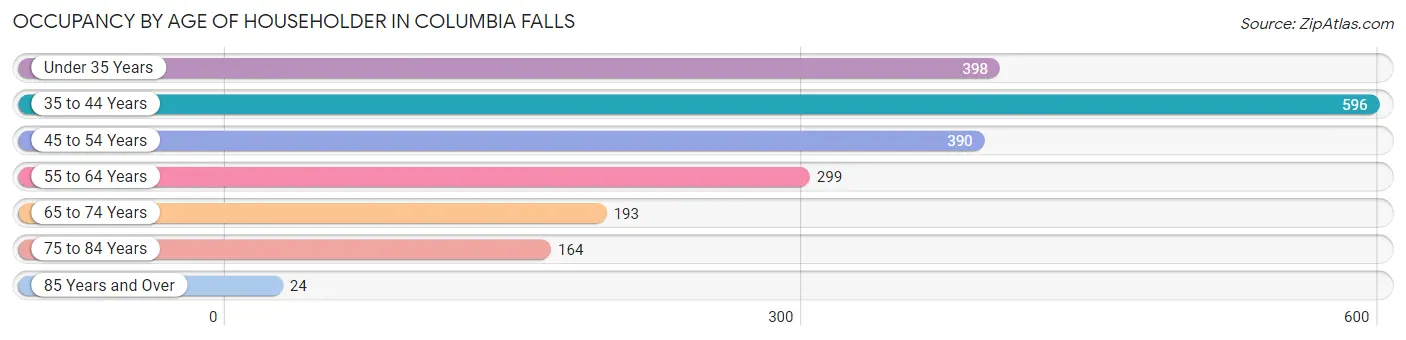
| Age Bracket | # Households | % Households |
| Under 35 Years | 398 | 19.3% |
| 35 to 44 Years | 596 | 28.9% |
| 45 to 54 Years | 390 | 18.9% |
| 55 to 64 Years | 299 | 14.5% |
| 65 to 74 Years | 193 | 9.3% |
| 75 to 84 Years | 164 | 8.0% |
| 85 Years and Over | 24 | 1.2% |
| Total | 2,064 | 100.0% |
Housing Finances in Columbia Falls
Median Income by Occupancy in Columbia Falls
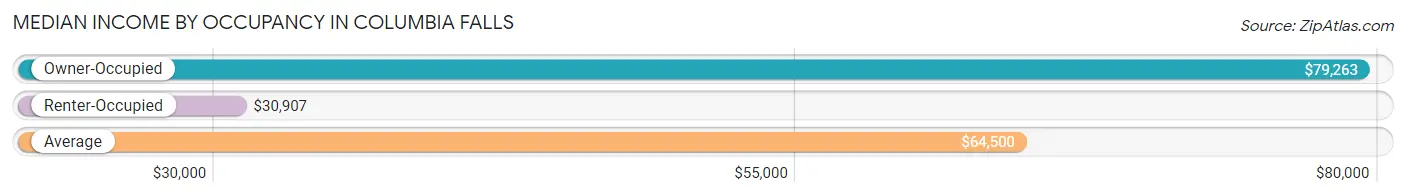
| Occupancy Type | # Households | Median Income |
| Owner-Occupied | 1,313 (63.6%) | $79,263 |
| Renter-Occupied | 751 (36.4%) | $30,907 |
| Average | 2,064 (100.0%) | $64,500 |
Occupancy by Householder Income Bracket in Columbia Falls
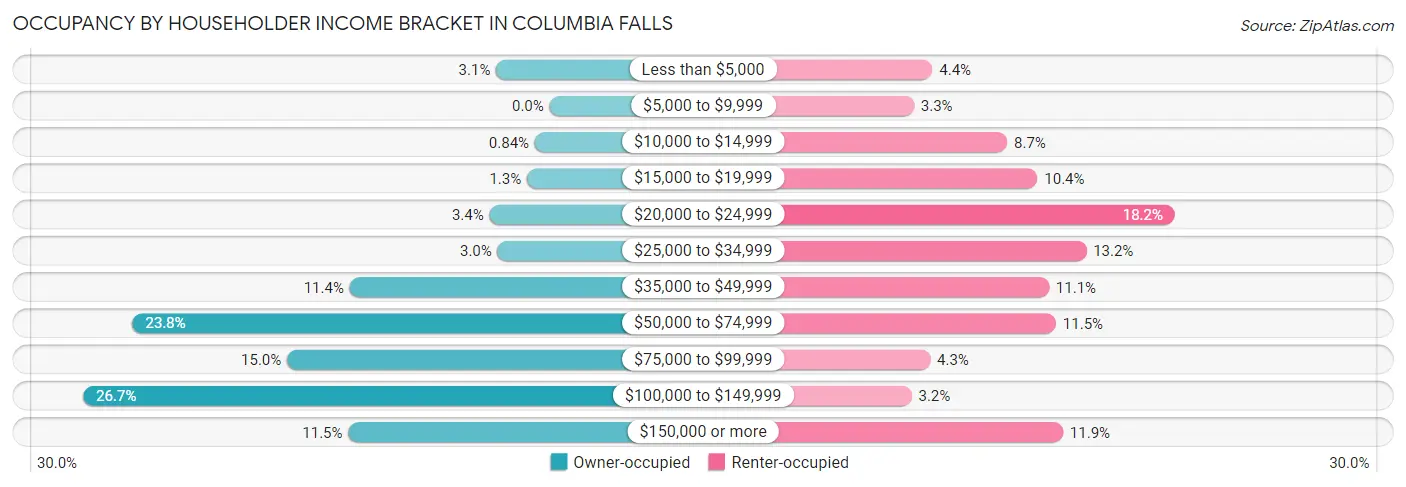
| Income Bracket | Owner-occupied | Renter-occupied |
| Less than $5,000 | 40 (3.0%) | 33 (4.4%) |
| $5,000 to $9,999 | 0 (0.0%) | 25 (3.3%) |
| $10,000 to $14,999 | 11 (0.8%) | 65 (8.7%) |
| $15,000 to $19,999 | 17 (1.3%) | 78 (10.4%) |
| $20,000 to $24,999 | 45 (3.4%) | 137 (18.2%) |
| $25,000 to $34,999 | 39 (3.0%) | 99 (13.2%) |
| $35,000 to $49,999 | 150 (11.4%) | 83 (11.1%) |
| $50,000 to $74,999 | 313 (23.8%) | 86 (11.5%) |
| $75,000 to $99,999 | 197 (15.0%) | 32 (4.3%) |
| $100,000 to $149,999 | 350 (26.7%) | 24 (3.2%) |
| $150,000 or more | 151 (11.5%) | 89 (11.8%) |
| Total | 1,313 (100.0%) | 751 (100.0%) |
Monthly Housing Cost Tiers in Columbia Falls
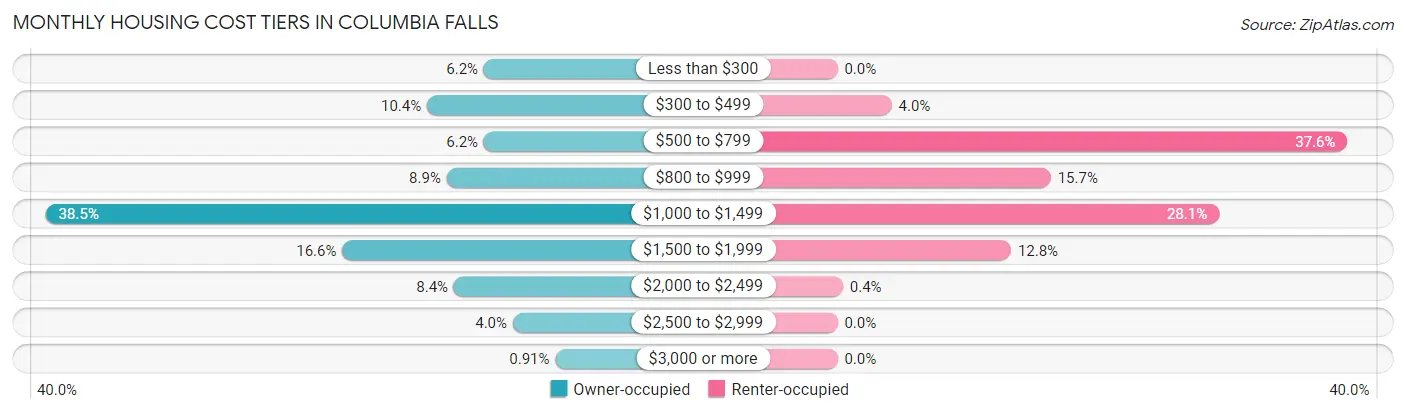
| Monthly Cost | Owner-occupied | Renter-occupied |
| Less than $300 | 81 (6.2%) | 0 (0.0%) |
| $300 to $499 | 136 (10.4%) | 30 (4.0%) |
| $500 to $799 | 81 (6.2%) | 282 (37.6%) |
| $800 to $999 | 117 (8.9%) | 118 (15.7%) |
| $1,000 to $1,499 | 505 (38.5%) | 211 (28.1%) |
| $1,500 to $1,999 | 218 (16.6%) | 96 (12.8%) |
| $2,000 to $2,499 | 110 (8.4%) | 3 (0.4%) |
| $2,500 to $2,999 | 53 (4.0%) | 0 (0.0%) |
| $3,000 or more | 12 (0.9%) | 0 (0.0%) |
| Total | 1,313 (100.0%) | 751 (100.0%) |
Physical Housing Characteristics in Columbia Falls
Housing Structures in Columbia Falls
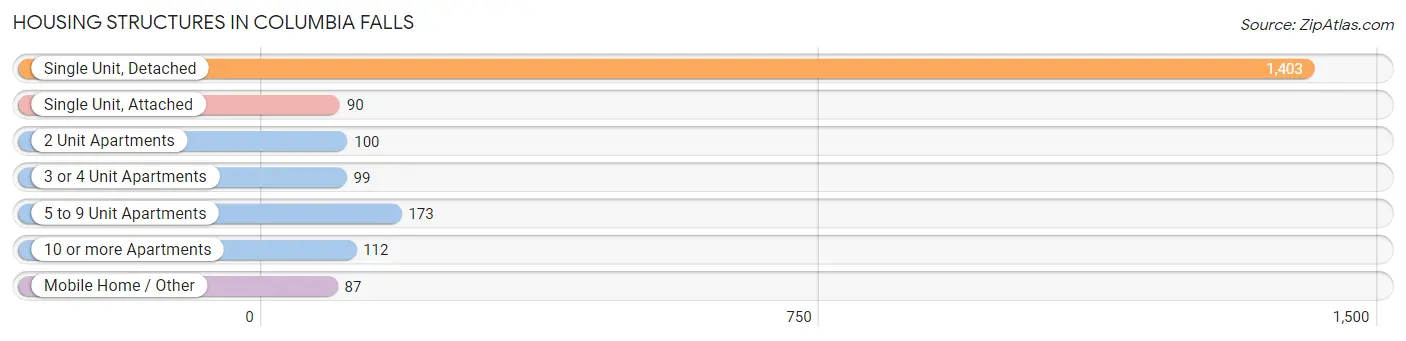
| Structure Type | # Housing Units | % Housing Units |
| Single Unit, Detached | 1,403 | 68.0% |
| Single Unit, Attached | 90 | 4.4% |
| 2 Unit Apartments | 100 | 4.8% |
| 3 or 4 Unit Apartments | 99 | 4.8% |
| 5 to 9 Unit Apartments | 173 | 8.4% |
| 10 or more Apartments | 112 | 5.4% |
| Mobile Home / Other | 87 | 4.2% |
| Total | 2,064 | 100.0% |
Housing Structures by Occupancy in Columbia Falls
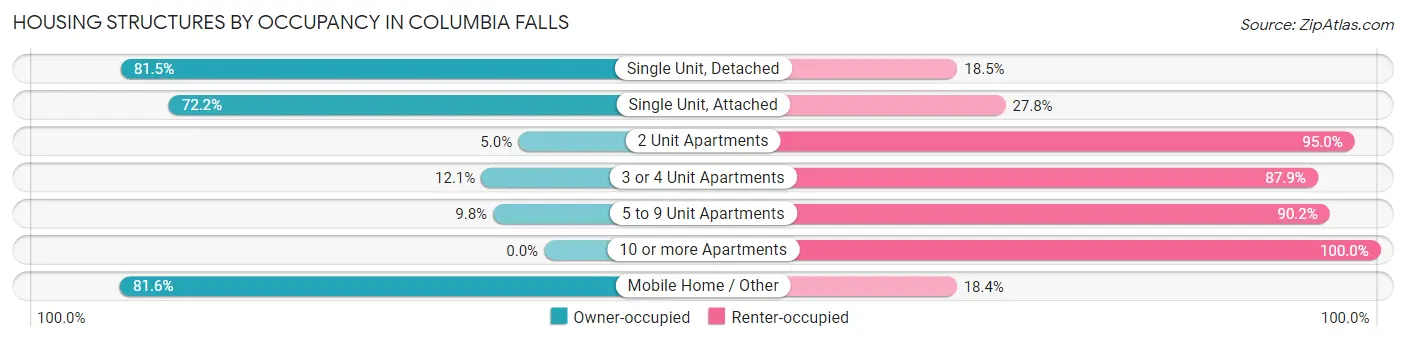
| Structure Type | Owner-occupied | Renter-occupied |
| Single Unit, Detached | 1,143 (81.5%) | 260 (18.5%) |
| Single Unit, Attached | 65 (72.2%) | 25 (27.8%) |
| 2 Unit Apartments | 5 (5.0%) | 95 (95.0%) |
| 3 or 4 Unit Apartments | 12 (12.1%) | 87 (87.9%) |
| 5 to 9 Unit Apartments | 17 (9.8%) | 156 (90.2%) |
| 10 or more Apartments | 0 (0.0%) | 112 (100.0%) |
| Mobile Home / Other | 71 (81.6%) | 16 (18.4%) |
| Total | 1,313 (63.6%) | 751 (36.4%) |
Housing Structures by Number of Rooms in Columbia Falls
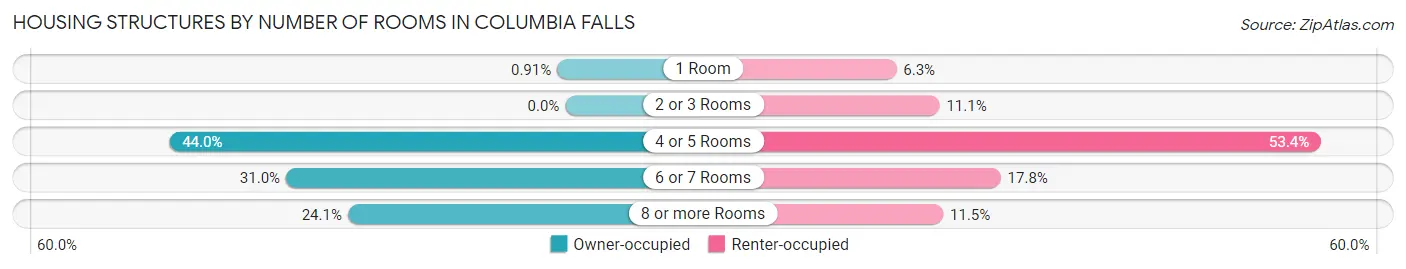
| Number of Rooms | Owner-occupied | Renter-occupied |
| 1 Room | 12 (0.9%) | 47 (6.3%) |
| 2 or 3 Rooms | 0 (0.0%) | 83 (11.1%) |
| 4 or 5 Rooms | 577 (44.0%) | 401 (53.4%) |
| 6 or 7 Rooms | 407 (31.0%) | 134 (17.8%) |
| 8 or more Rooms | 317 (24.1%) | 86 (11.5%) |
| Total | 1,313 (100.0%) | 751 (100.0%) |
Housing Structure by Heating Type in Columbia Falls
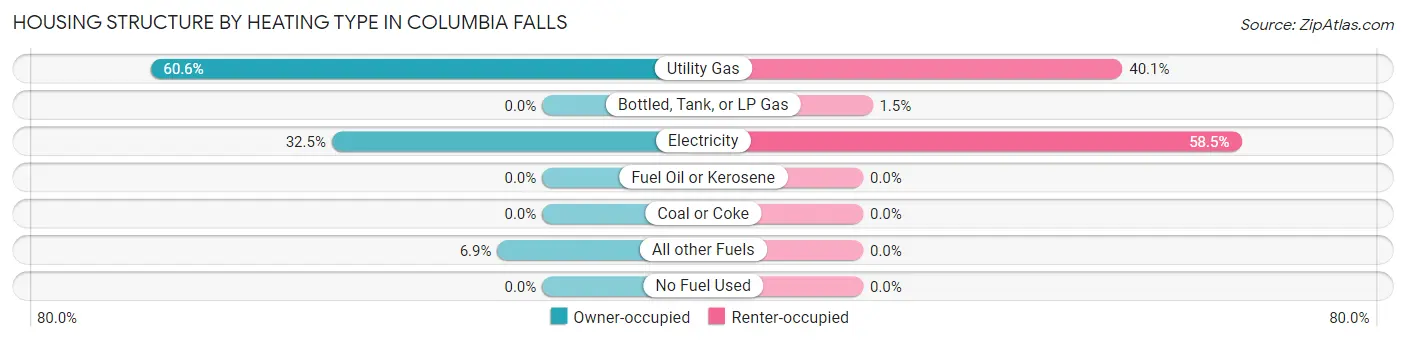
| Heating Type | Owner-occupied | Renter-occupied |
| Utility Gas | 795 (60.6%) | 301 (40.1%) |
| Bottled, Tank, or LP Gas | 0 (0.0%) | 11 (1.5%) |
| Electricity | 427 (32.5%) | 439 (58.5%) |
| Fuel Oil or Kerosene | 0 (0.0%) | 0 (0.0%) |
| Coal or Coke | 0 (0.0%) | 0 (0.0%) |
| All other Fuels | 91 (6.9%) | 0 (0.0%) |
| No Fuel Used | 0 (0.0%) | 0 (0.0%) |
| Total | 1,313 (100.0%) | 751 (100.0%) |
Household Vehicle Usage in Columbia Falls
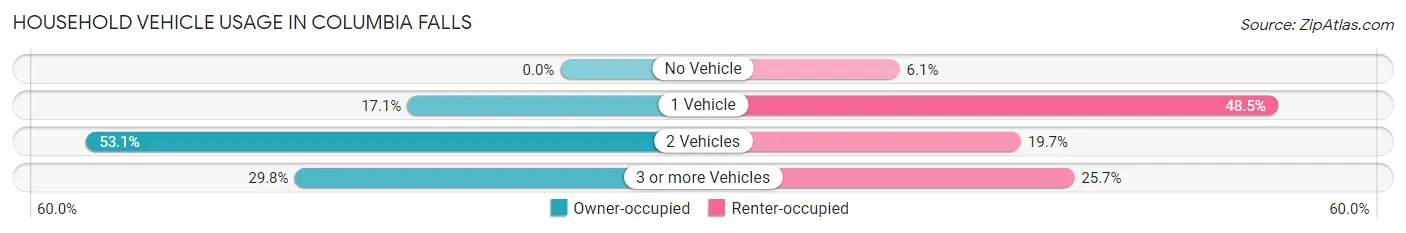
| Vehicles per Household | Owner-occupied | Renter-occupied |
| No Vehicle | 0 (0.0%) | 46 (6.1%) |
| 1 Vehicle | 225 (17.1%) | 364 (48.5%) |
| 2 Vehicles | 697 (53.1%) | 148 (19.7%) |
| 3 or more Vehicles | 391 (29.8%) | 193 (25.7%) |
| Total | 1,313 (100.0%) | 751 (100.0%) |
Real Estate & Mortgages in Columbia Falls
Real Estate and Mortgage Overview in Columbia Falls
| Characteristic | Without Mortgage | With Mortgage |
| Housing Units | 313 | 1,000 |
| Median Property Value | $275,000 | $295,200 |
| Median Household Income | $61,250 | $135 |
| Monthly Housing Costs | $445 | $12 |
| Real Estate Taxes | $2,178 | $21 |
Property Value by Mortgage Status in Columbia Falls
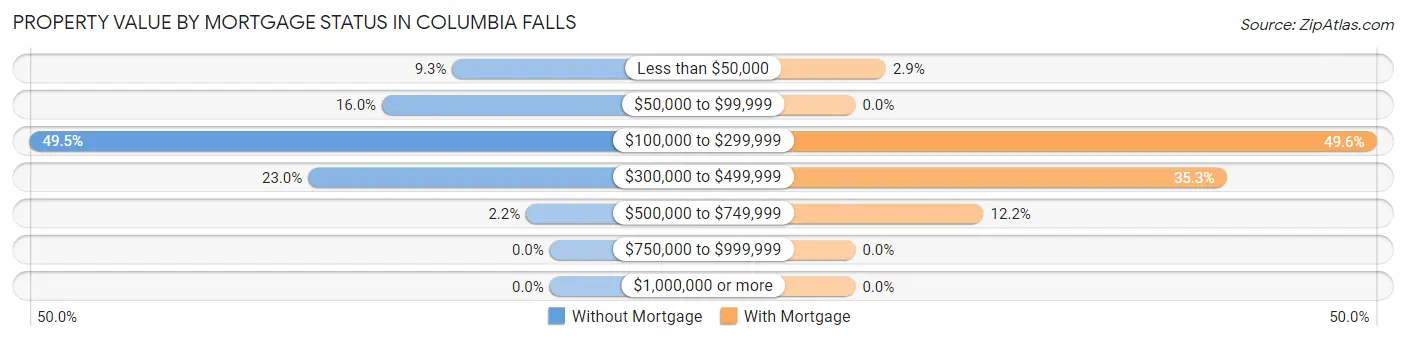
| Property Value | Without Mortgage | With Mortgage |
| Less than $50,000 | 29 (9.3%) | 29 (2.9%) |
| $50,000 to $99,999 | 50 (16.0%) | 0 (0.0%) |
| $100,000 to $299,999 | 155 (49.5%) | 496 (49.6%) |
| $300,000 to $499,999 | 72 (23.0%) | 353 (35.3%) |
| $500,000 to $749,999 | 7 (2.2%) | 122 (12.2%) |
| $750,000 to $999,999 | 0 (0.0%) | 0 (0.0%) |
| $1,000,000 or more | 0 (0.0%) | 0 (0.0%) |
| Total | 313 (100.0%) | 1,000 (100.0%) |
Household Income by Mortgage Status in Columbia Falls
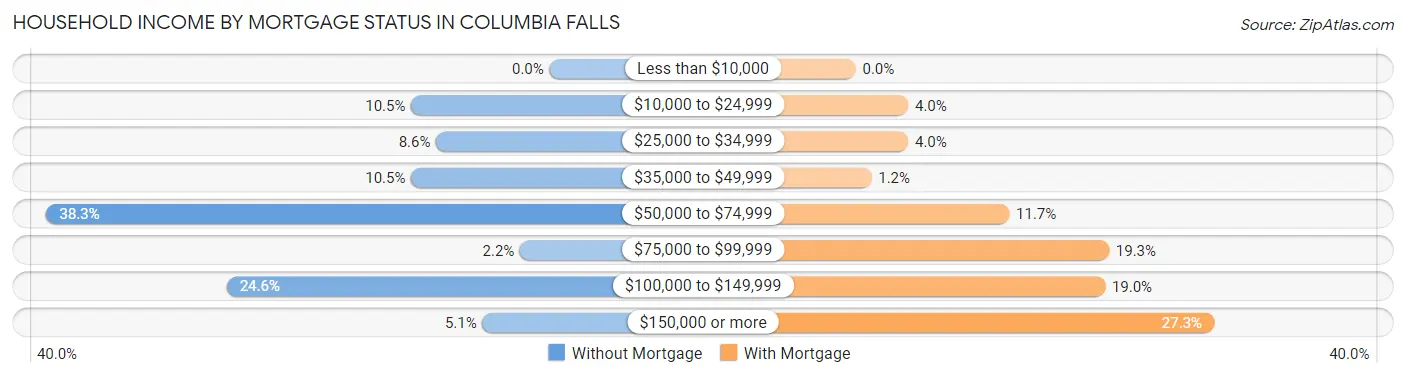
| Household Income | Without Mortgage | With Mortgage |
| Less than $10,000 | 0 (0.0%) | 0 (0.0%) |
| $10,000 to $24,999 | 33 (10.5%) | 40 (4.0%) |
| $25,000 to $34,999 | 27 (8.6%) | 40 (4.0%) |
| $35,000 to $49,999 | 33 (10.5%) | 12 (1.2%) |
| $50,000 to $74,999 | 120 (38.3%) | 117 (11.7%) |
| $75,000 to $99,999 | 7 (2.2%) | 193 (19.3%) |
| $100,000 to $149,999 | 77 (24.6%) | 190 (19.0%) |
| $150,000 or more | 16 (5.1%) | 273 (27.3%) |
| Total | 313 (100.0%) | 1,000 (100.0%) |
Property Value to Household Income Ratio in Columbia Falls
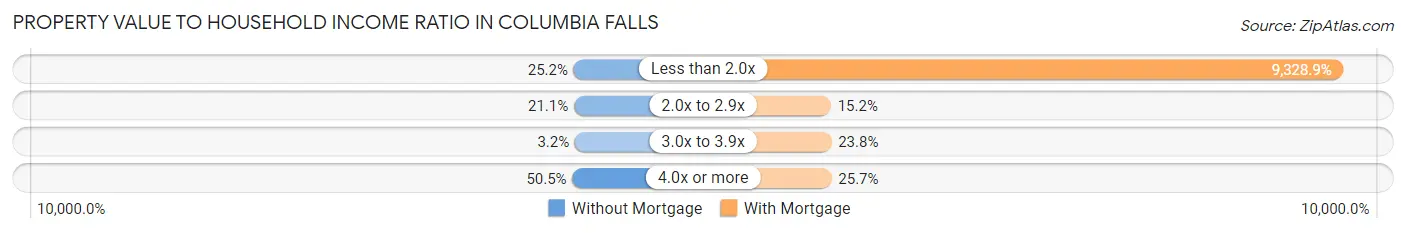
| Value-to-Income Ratio | Without Mortgage | With Mortgage |
| Less than 2.0x | 79 (25.2%) | 93,289 (9,328.9%) |
| 2.0x to 2.9x | 66 (21.1%) | 152 (15.2%) |
| 3.0x to 3.9x | 10 (3.2%) | 238 (23.8%) |
| 4.0x or more | 158 (50.5%) | 257 (25.7%) |
| Total | 313 (100.0%) | 1,000 (100.0%) |
Real Estate Taxes by Mortgage Status in Columbia Falls
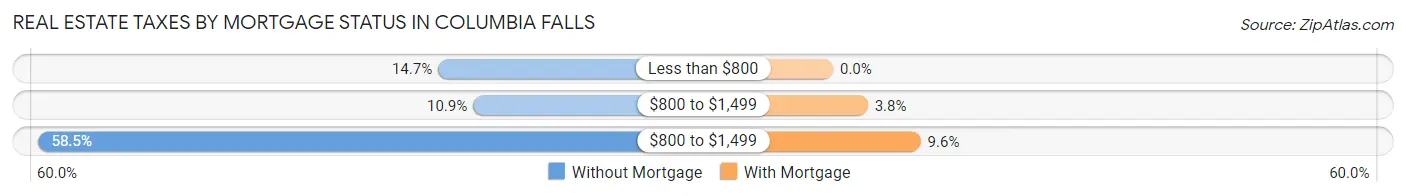
| Property Taxes | Without Mortgage | With Mortgage |
| Less than $800 | 46 (14.7%) | 0 (0.0%) |
| $800 to $1,499 | 34 (10.9%) | 38 (3.8%) |
| $800 to $1,499 | 183 (58.5%) | 96 (9.6%) |
| Total | 313 (100.0%) | 1,000 (100.0%) |
Health & Disability in Columbia Falls
Health Insurance Coverage by Age in Columbia Falls
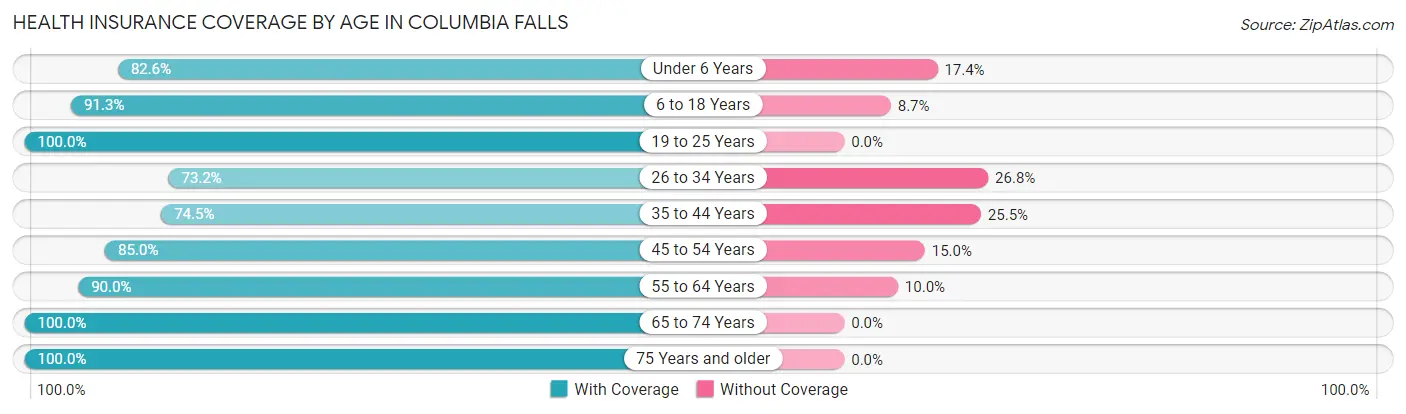
| Age Bracket | With Coverage | Without Coverage |
| Under 6 Years | 371 (82.6%) | 78 (17.4%) |
| 6 to 18 Years | 1,075 (91.3%) | 102 (8.7%) |
| 19 to 25 Years | 260 (100.0%) | 0 (0.0%) |
| 26 to 34 Years | 390 (73.2%) | 143 (26.8%) |
| 35 to 44 Years | 848 (74.5%) | 290 (25.5%) |
| 45 to 54 Years | 583 (85.0%) | 103 (15.0%) |
| 55 to 64 Years | 513 (90.0%) | 57 (10.0%) |
| 65 to 74 Years | 336 (100.0%) | 0 (0.0%) |
| 75 Years and older | 193 (100.0%) | 0 (0.0%) |
| Total | 4,569 (85.5%) | 773 (14.5%) |
Health Insurance Coverage by Citizenship Status in Columbia Falls
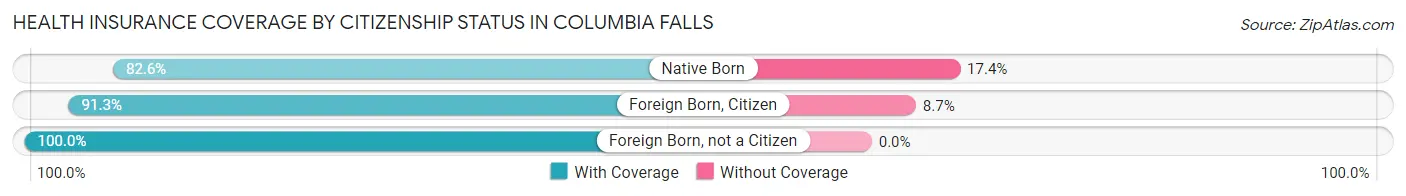
| Citizenship Status | With Coverage | Without Coverage |
| Native Born | 371 (82.6%) | 78 (17.4%) |
| Foreign Born, Citizen | 1,075 (91.3%) | 102 (8.7%) |
| Foreign Born, not a Citizen | 260 (100.0%) | 0 (0.0%) |
Health Insurance Coverage by Household Income in Columbia Falls
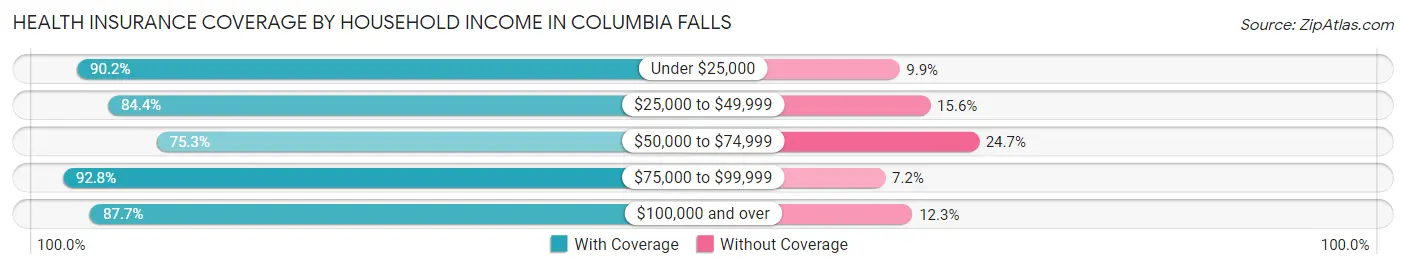
| Household Income | With Coverage | Without Coverage |
| Under $25,000 | 677 (90.1%) | 74 (9.9%) |
| $25,000 to $49,999 | 832 (84.4%) | 154 (15.6%) |
| $50,000 to $74,999 | 798 (75.3%) | 262 (24.7%) |
| $75,000 to $99,999 | 505 (92.8%) | 39 (7.2%) |
| $100,000 and over | 1,747 (87.7%) | 244 (12.3%) |
Public vs Private Health Insurance Coverage by Age in Columbia Falls
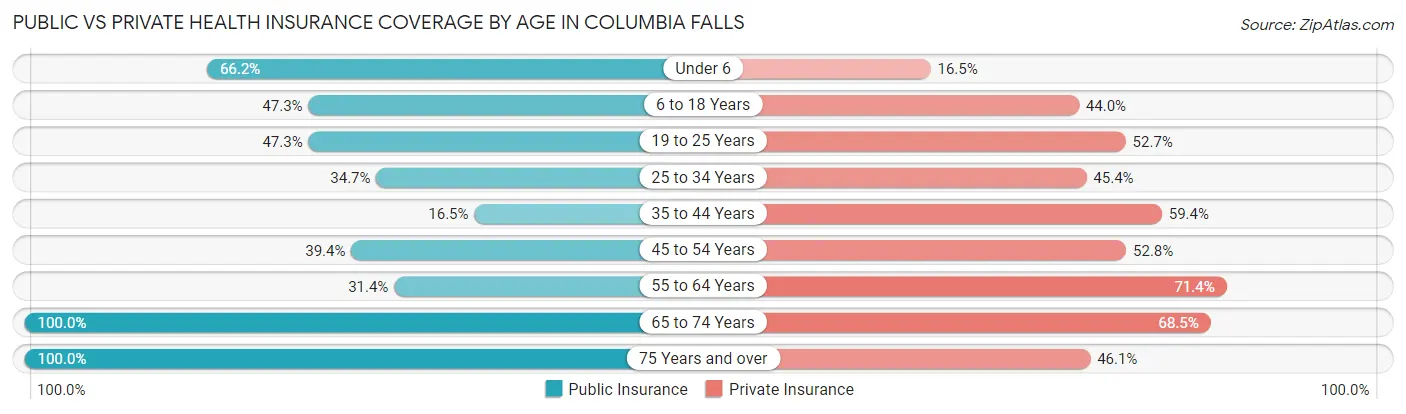
| Age Bracket | Public Insurance | Private Insurance |
| Under 6 | 297 (66.1%) | 74 (16.5%) |
| 6 to 18 Years | 557 (47.3%) | 518 (44.0%) |
| 19 to 25 Years | 123 (47.3%) | 137 (52.7%) |
| 25 to 34 Years | 185 (34.7%) | 242 (45.4%) |
| 35 to 44 Years | 188 (16.5%) | 676 (59.4%) |
| 45 to 54 Years | 270 (39.4%) | 362 (52.8%) |
| 55 to 64 Years | 179 (31.4%) | 407 (71.4%) |
| 65 to 74 Years | 336 (100.0%) | 230 (68.4%) |
| 75 Years and over | 193 (100.0%) | 89 (46.1%) |
| Total | 2,328 (43.6%) | 2,735 (51.2%) |
Disability Status by Sex by Age in Columbia Falls
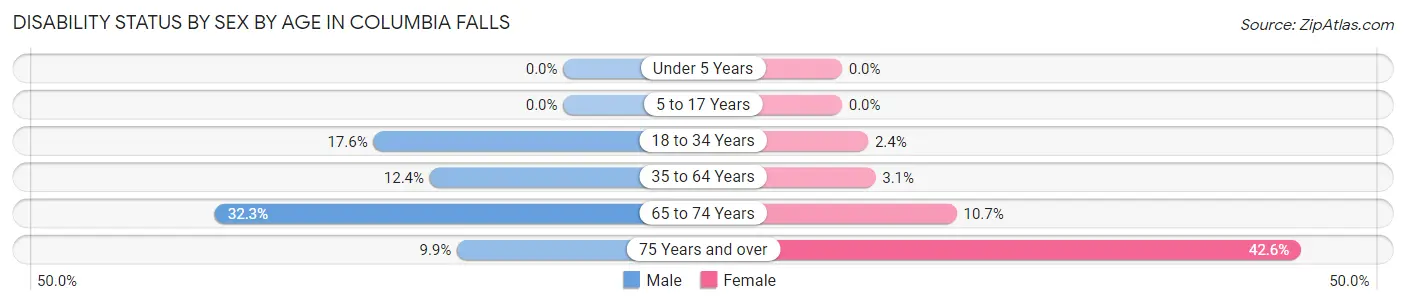
| Age Bracket | Male | Female |
| Under 5 Years | 0 (0.0%) | 0 (0.0%) |
| 5 to 17 Years | 0 (0.0%) | 0 (0.0%) |
| 18 to 34 Years | 77 (17.6%) | 12 (2.4%) |
| 35 to 64 Years | 149 (12.4%) | 37 (3.1%) |
| 65 to 74 Years | 54 (32.3%) | 18 (10.6%) |
| 75 Years and over | 7 (9.9%) | 52 (42.6%) |
Disability Class by Sex by Age in Columbia Falls
Disability Class: Hearing Difficulty
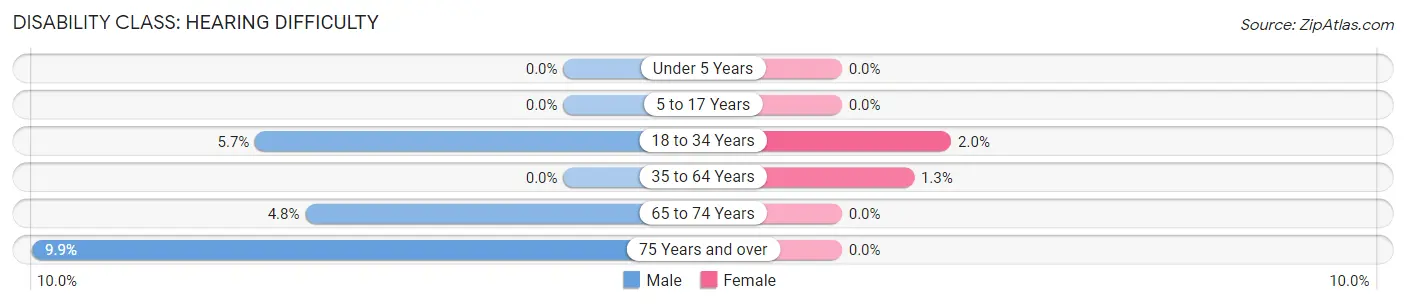
| Age Bracket | Male | Female |
| Under 5 Years | 0 (0.0%) | 0 (0.0%) |
| 5 to 17 Years | 0 (0.0%) | 0 (0.0%) |
| 18 to 34 Years | 25 (5.7%) | 10 (2.0%) |
| 35 to 64 Years | 0 (0.0%) | 16 (1.3%) |
| 65 to 74 Years | 8 (4.8%) | 0 (0.0%) |
| 75 Years and over | 7 (9.9%) | 0 (0.0%) |
Disability Class: Vision Difficulty
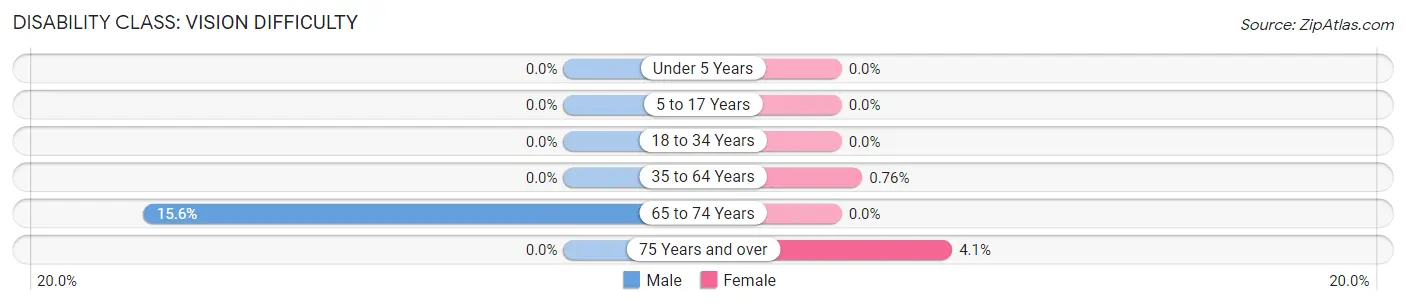
| Age Bracket | Male | Female |
| Under 5 Years | 0 (0.0%) | 0 (0.0%) |
| 5 to 17 Years | 0 (0.0%) | 0 (0.0%) |
| 18 to 34 Years | 0 (0.0%) | 0 (0.0%) |
| 35 to 64 Years | 0 (0.0%) | 9 (0.8%) |
| 65 to 74 Years | 26 (15.6%) | 0 (0.0%) |
| 75 Years and over | 0 (0.0%) | 5 (4.1%) |
Disability Class: Cognitive Difficulty
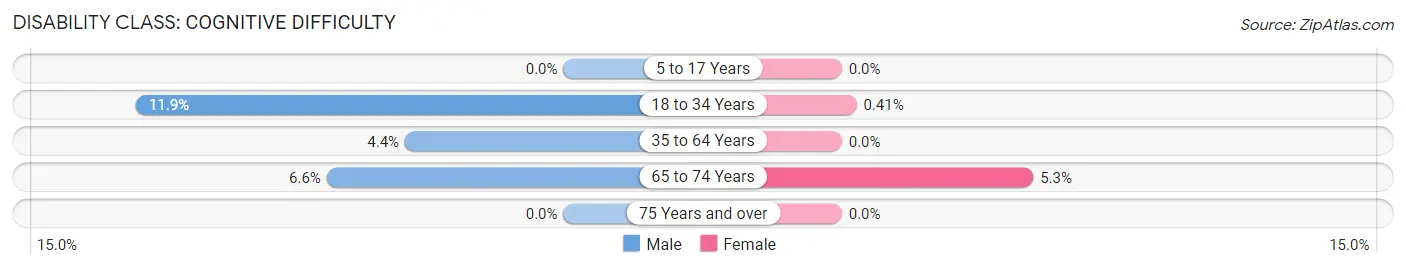
| Age Bracket | Male | Female |
| 5 to 17 Years | 0 (0.0%) | 0 (0.0%) |
| 18 to 34 Years | 52 (11.9%) | 2 (0.4%) |
| 35 to 64 Years | 53 (4.4%) | 0 (0.0%) |
| 65 to 74 Years | 11 (6.6%) | 9 (5.3%) |
| 75 Years and over | 0 (0.0%) | 0 (0.0%) |
Disability Class: Ambulatory Difficulty
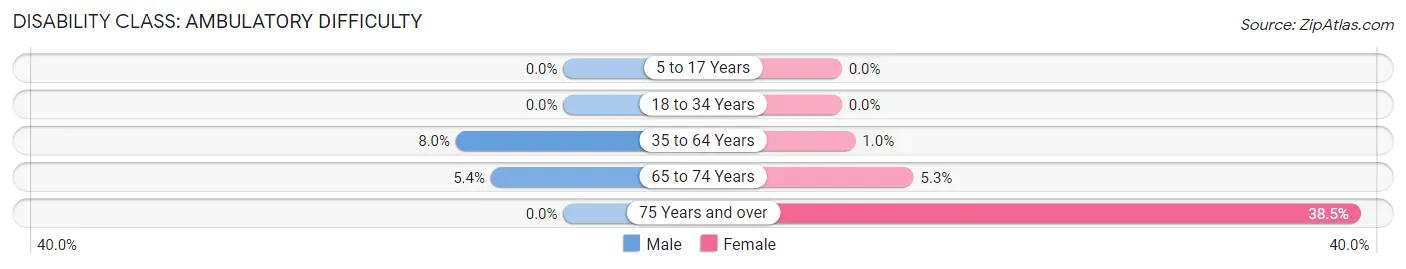
| Age Bracket | Male | Female |
| 5 to 17 Years | 0 (0.0%) | 0 (0.0%) |
| 18 to 34 Years | 0 (0.0%) | 0 (0.0%) |
| 35 to 64 Years | 96 (8.0%) | 12 (1.0%) |
| 65 to 74 Years | 9 (5.4%) | 9 (5.3%) |
| 75 Years and over | 0 (0.0%) | 47 (38.5%) |
Disability Class: Self-Care Difficulty
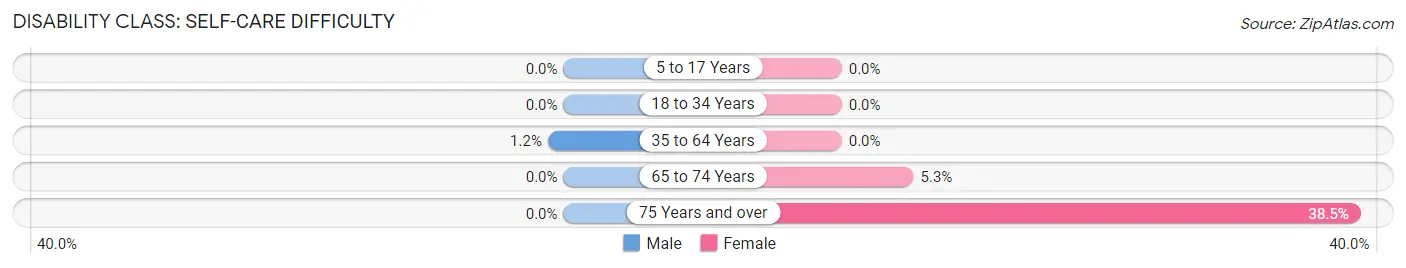
| Age Bracket | Male | Female |
| 5 to 17 Years | 0 (0.0%) | 0 (0.0%) |
| 18 to 34 Years | 0 (0.0%) | 0 (0.0%) |
| 35 to 64 Years | 14 (1.2%) | 0 (0.0%) |
| 65 to 74 Years | 0 (0.0%) | 9 (5.3%) |
| 75 Years and over | 0 (0.0%) | 47 (38.5%) |
Technology Access in Columbia Falls
Computing Device Access in Columbia Falls
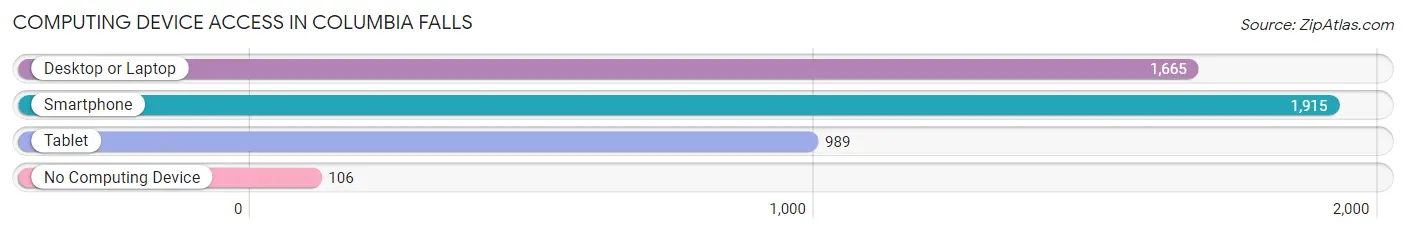
| Device Type | # Households | % Households |
| Desktop or Laptop | 1,665 | 80.7% |
| Smartphone | 1,915 | 92.8% |
| Tablet | 989 | 47.9% |
| No Computing Device | 106 | 5.1% |
| Total | 2,064 | 100.0% |
Internet Access in Columbia Falls
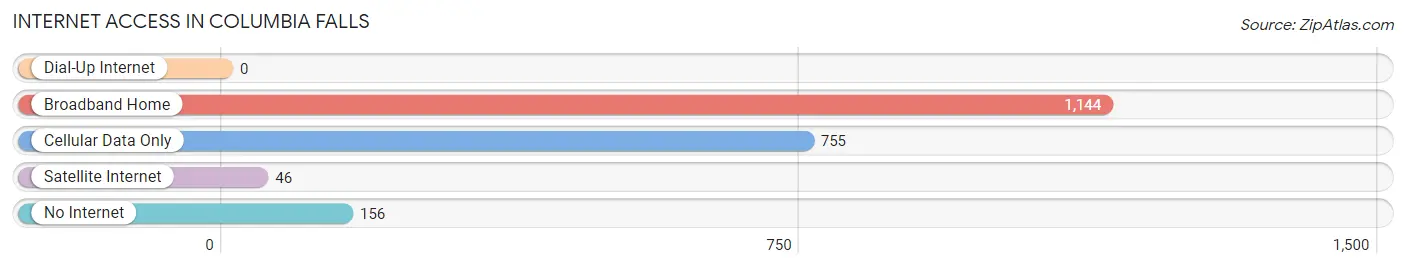
| Internet Type | # Households | % Households |
| Dial-Up Internet | 0 | 0.0% |
| Broadband Home | 1,144 | 55.4% |
| Cellular Data Only | 755 | 36.6% |
| Satellite Internet | 46 | 2.2% |
| No Internet | 156 | 7.6% |
| Total | 2,064 | 100.0% |
Columbia Falls Summary
Columbia Falls, Montana is a small town located in Flathead County, Montana. It is situated on the western edge of the Flathead Valley, just north of the city of Kalispell. The town is home to a population of approximately 4,000 people and is the gateway to Glacier National Park.
History
The area that is now Columbia Falls was first inhabited by the Kootenai and Salish Native American tribes. The first non-native settlers arrived in the area in the late 1800s, and the town was officially founded in 1892. The town was named after the Columbia Falls Lumber Company, which was established in the area in 1892. The company was responsible for the construction of the Great Northern Railway, which connected the town to the rest of the country.
The town grew rapidly in the early 1900s, and by 1910, it had a population of over 1,000 people. The town was home to a variety of businesses, including a sawmill, a flour mill, a creamery, and a brewery. The town also had a variety of churches, schools, and other civic organizations.
In the 1920s, the town experienced a period of decline as the lumber industry began to decline. The Great Northern Railway was abandoned in the 1930s, and the town’s population began to decline as well. The town experienced a resurgence in the 1950s, when the construction of the Hungry Horse Dam brought new jobs and economic opportunities to the area.
Geography
Columbia Falls is located in the Flathead Valley, which is part of the Rocky Mountain region of Montana. The town is situated on the western edge of the valley, just north of the city of Kalispell. The Flathead River runs through the town, and the surrounding area is characterized by rolling hills and forests. The town is located at an elevation of 2,890 feet above sea level.
The climate in Columbia Falls is generally mild, with warm summers and cold winters. The average high temperature in the summer is around 80 degrees Fahrenheit, and the average low temperature in the winter is around 20 degrees Fahrenheit. The town receives an average of 18 inches of precipitation per year.
Economy
The economy of Columbia Falls is largely based on tourism and the timber industry. The town is located near Glacier National Park, which attracts thousands of visitors each year. The town is also home to a variety of businesses, including restaurants, hotels, and retail stores. The timber industry is also an important part of the local economy, and the town is home to several sawmills and lumber companies.
Demographics
As of the 2010 census, the population of Columbia Falls was 4,053. The town is predominantly white, with a population that is 94.3% white, 1.2% Native American, 0.7% Asian, 0.3% African American, and 0.2% from other races. The median household income in the town is $41,944, and the median home value is $179,400. The town has a poverty rate of 13.3%.
Common Questions
What is Per Capita Income in Columbia Falls?
Per Capita income in Columbia Falls is $32,635.
What is the Median Family Income in Columbia Falls?
Median Family Income in Columbia Falls is $77,724.
What is the Median Household income in Columbia Falls?
Median Household Income in Columbia Falls is $64,500.
What is Income or Wage Gap in Columbia Falls?
Income or Wage Gap in Columbia Falls is 4.1%.
Women in Columbia Falls earn 95.9 cents for every dollar earned by a man.
What is Inequality or Gini Index in Columbia Falls?
Inequality or Gini Index in Columbia Falls is 0.46.
What is the Total Population of Columbia Falls?
Total Population of Columbia Falls is 5,435.
What is the Total Male Population of Columbia Falls?
Total Male Population of Columbia Falls is 2,650.
What is the Total Female Population of Columbia Falls?
Total Female Population of Columbia Falls is 2,785.
What is the Ratio of Males per 100 Females in Columbia Falls?
There are 95.15 Males per 100 Females in Columbia Falls.
What is the Ratio of Females per 100 Males in Columbia Falls?
There are 105.09 Females per 100 Males in Columbia Falls.
What is the Median Population Age in Columbia Falls?
Median Population Age in Columbia Falls is 37.5 Years.
What is the Average Family Size in Columbia Falls
Average Family Size in Columbia Falls is 3.0 People.
What is the Average Household Size in Columbia Falls
Average Household Size in Columbia Falls is 2.6 People.
How Large is the Labor Force in Columbia Falls?
There are 2,667 People in the Labor Forcein in Columbia Falls.
What is the Percentage of People in the Labor Force in Columbia Falls?
65.2% of People are in the Labor Force in Columbia Falls.
What is the Unemployment Rate in Columbia Falls?
Unemployment Rate in Columbia Falls is 5.8%.