Montrose, CO Map & Demographics
Montrose Map
Montrose Overview
$36,241
PER CAPITA INCOME
$79,920
AVG FAMILY INCOME
$60,132
AVG HOUSEHOLD INCOME
12.7%
WAGE / INCOME GAP [ % ]
87.3¢/ $1
WAGE / INCOME GAP [ $ ]
0.48
INEQUALITY / GINI INDEX
20,394
TOTAL POPULATION
9,418
MALE POPULATION
10,976
FEMALE POPULATION
85.81
MALES / 100 FEMALES
116.54
FEMALES / 100 MALES
48.7
MEDIAN AGE
3.0
AVG FAMILY SIZE
2.4
AVG HOUSEHOLD SIZE
8,839
LABOR FORCE [ PEOPLE ]
52.9%
PERCENT IN LABOR FORCE
5.1%
UNEMPLOYMENT RATE
Montrose Area Codes
Income in Montrose
Income Overview in Montrose
Per Capita Income in Montrose is $36,241, while median incomes of families and households are $79,920 and $60,132 respectively.
| Characteristic | Number | Measure |
| Per Capita Income | 20,394 | $36,241 |
| Median Family Income | 5,293 | $79,920 |
| Mean Family Income | 5,293 | $103,171 |
| Median Household Income | 8,450 | $60,132 |
| Mean Household Income | 8,450 | $81,652 |
| Income Deficit | 5,293 | $0 |
| Wage / Income Gap (%) | 20,394 | 12.72% |
| Wage / Income Gap ($) | 20,394 | 87.28¢ per $1 |
| Gini / Inequality Index | 20,394 | 0.48 |
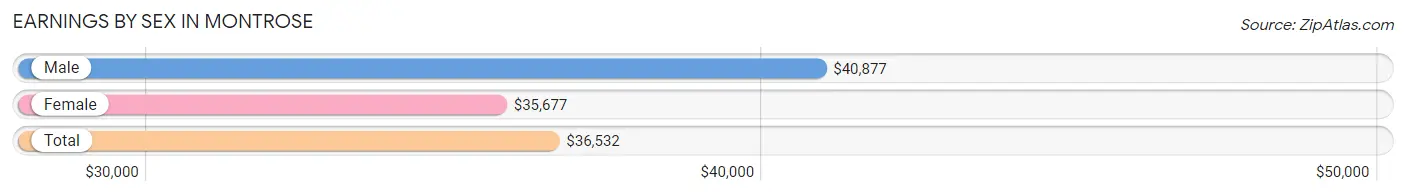
Earnings by Sex in Montrose
Average Earnings in Montrose are $36,532, $40,877 for men and $35,677 for women, a difference of 12.7%.
| Sex | Number | Average Earnings |
| Male | 4,967 (51.1%) | $40,877 |
| Female | 4,755 (48.9%) | $35,677 |
| Total | 9,722 (100.0%) | $36,532 |
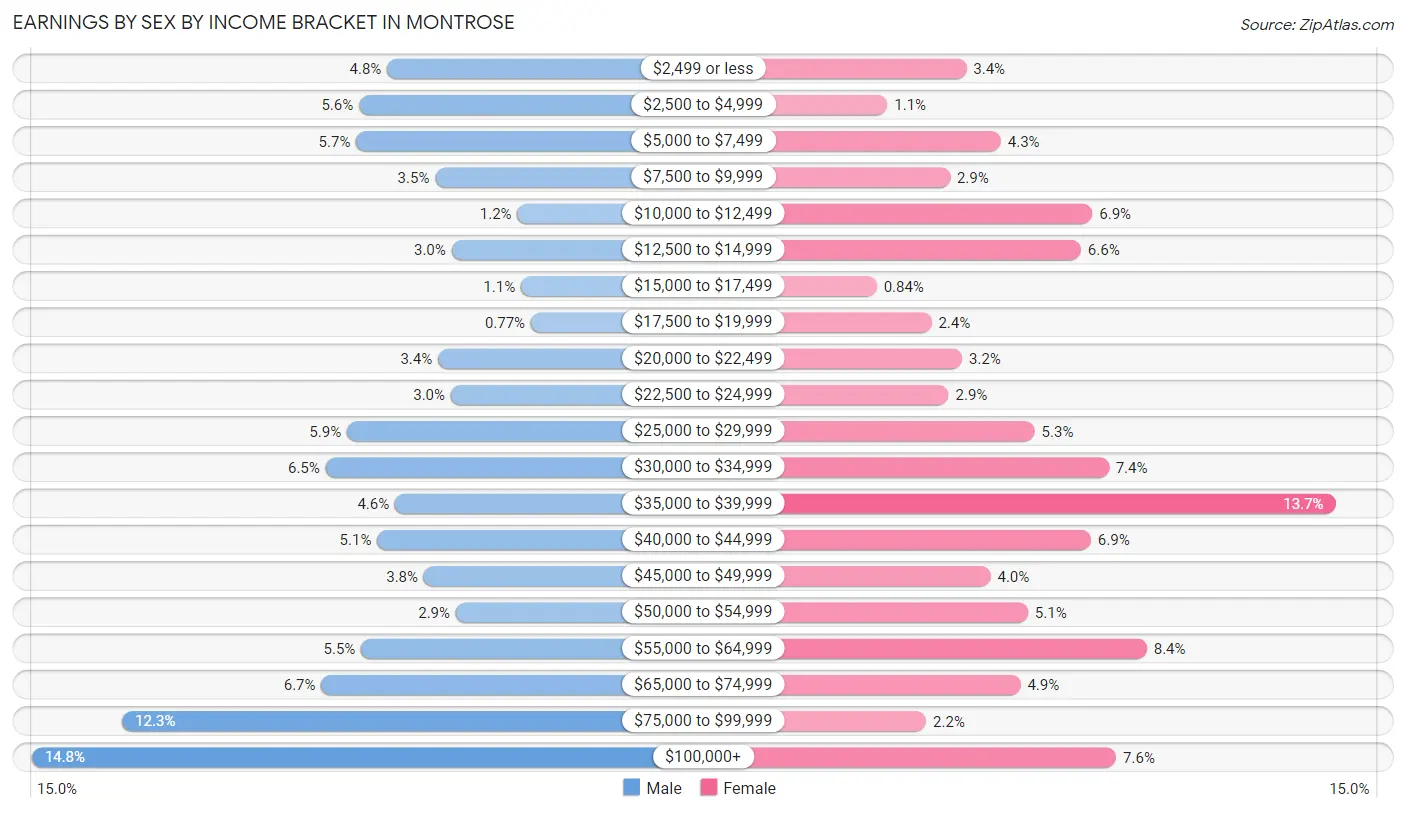
Earnings by Sex by Income Bracket in Montrose
The most common earnings brackets in Montrose are $100,000+ for men (735 | 14.8%) and $35,000 to $39,999 for women (653 | 13.7%).
| Income | Male | Female |
| $2,499 or less | 239 (4.8%) | 160 (3.4%) |
| $2,500 to $4,999 | 278 (5.6%) | 54 (1.1%) |
| $5,000 to $7,499 | 282 (5.7%) | 206 (4.3%) |
| $7,500 to $9,999 | 172 (3.5%) | 138 (2.9%) |
| $10,000 to $12,499 | 57 (1.1%) | 328 (6.9%) |
| $12,500 to $14,999 | 149 (3.0%) | 313 (6.6%) |
| $15,000 to $17,499 | 52 (1.1%) | 40 (0.8%) |
| $17,500 to $19,999 | 38 (0.8%) | 113 (2.4%) |
| $20,000 to $22,499 | 168 (3.4%) | 154 (3.2%) |
| $22,500 to $24,999 | 150 (3.0%) | 136 (2.9%) |
| $25,000 to $29,999 | 295 (5.9%) | 251 (5.3%) |
| $30,000 to $34,999 | 325 (6.5%) | 350 (7.4%) |
| $35,000 to $39,999 | 228 (4.6%) | 653 (13.7%) |
| $40,000 to $44,999 | 253 (5.1%) | 326 (6.9%) |
| $45,000 to $49,999 | 188 (3.8%) | 192 (4.0%) |
| $50,000 to $54,999 | 143 (2.9%) | 242 (5.1%) |
| $55,000 to $64,999 | 275 (5.5%) | 401 (8.4%) |
| $65,000 to $74,999 | 331 (6.7%) | 232 (4.9%) |
| $75,000 to $99,999 | 609 (12.3%) | 106 (2.2%) |
| $100,000+ | 735 (14.8%) | 360 (7.6%) |
| Total | 4,967 (100.0%) | 4,755 (100.0%) |
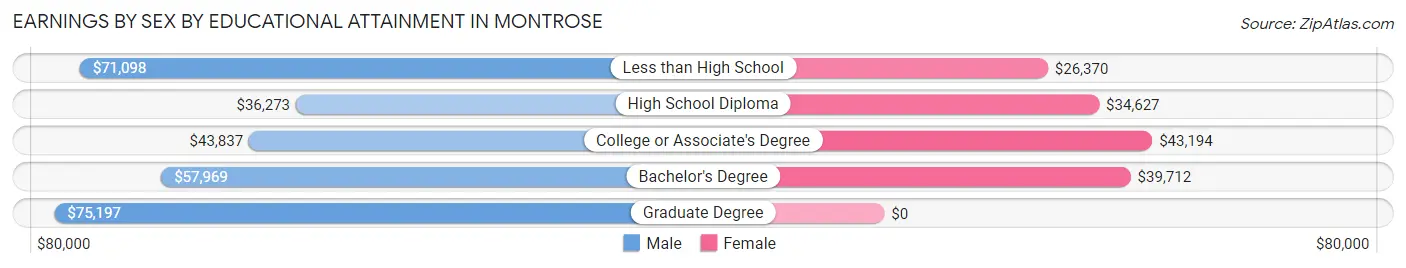
Earnings by Sex by Educational Attainment in Montrose
Average earnings in Montrose are $45,041 for men and $36,468 for women, a difference of 19.0%. Men with an educational attainment of graduate degree enjoy the highest average annual earnings of $75,197, while those with high school diploma education earn the least with $36,273. Women with an educational attainment of college or associate's degree earn the most with the average annual earnings of $43,194, while those with less than high school education have the smallest earnings of $26,370.
| Educational Attainment | Male Income | Female Income |
| Less than High School | $71,098 | $26,370 |
| High School Diploma | $36,273 | $34,627 |
| College or Associate's Degree | $43,837 | $43,194 |
| Bachelor's Degree | $57,969 | $39,712 |
| Graduate Degree | $75,197 | $0 |
| Total | $45,041 | $36,468 |
Family Income in Montrose
Family Income Brackets in Montrose
According to the Montrose family income data, there are 1,000 families falling into the $75,000 to $99,999 income range, which is the most common income bracket and makes up 18.9% of all families. Conversely, the $10,000 to $14,999 income bracket is the least frequent group with only 101 families (1.9%) belonging to this category.
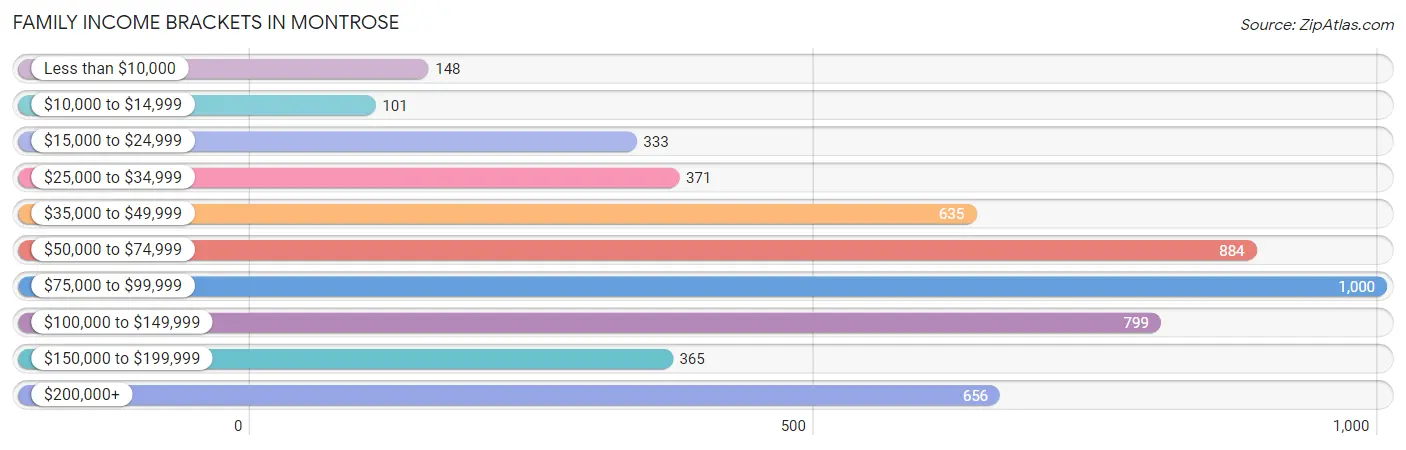
| Income Bracket | # Families | % Families |
| Less than $10,000 | 148 | 2.8% |
| $10,000 to $14,999 | 101 | 1.9% |
| $15,000 to $24,999 | 333 | 6.3% |
| $25,000 to $34,999 | 371 | 7.0% |
| $35,000 to $49,999 | 635 | 12.0% |
| $50,000 to $74,999 | 884 | 16.7% |
| $75,000 to $99,999 | 1,000 | 18.9% |
| $100,000 to $149,999 | 799 | 15.1% |
| $150,000 to $199,999 | 365 | 6.9% |
| $200,000+ | 656 | 12.4% |
Family Income by Famaliy Size in Montrose
5-person families (282 | 5.3%) account for the highest median family income in Montrose with $102,227 per family, while 2-person families (3,363 | 63.5%) have the highest median income of $34,908 per family member.
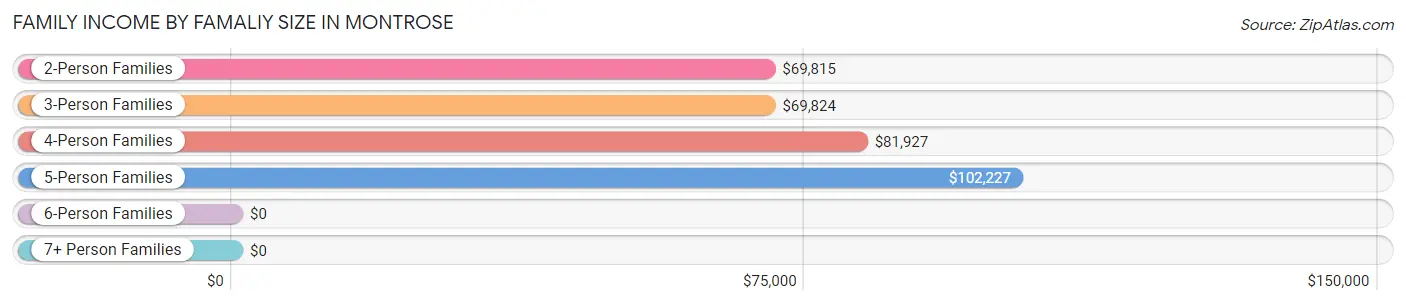
| Income Bracket | # Families | Median Income |
| 2-Person Families | 3,363 (63.5%) | $69,815 |
| 3-Person Families | 837 (15.8%) | $69,824 |
| 4-Person Families | 710 (13.4%) | $81,927 |
| 5-Person Families | 282 (5.3%) | $102,227 |
| 6-Person Families | 66 (1.3%) | $0 |
| 7+ Person Families | 35 (0.7%) | $0 |
| Total | 5,293 (100.0%) | $79,920 |
Family Income by Number of Earners in Montrose
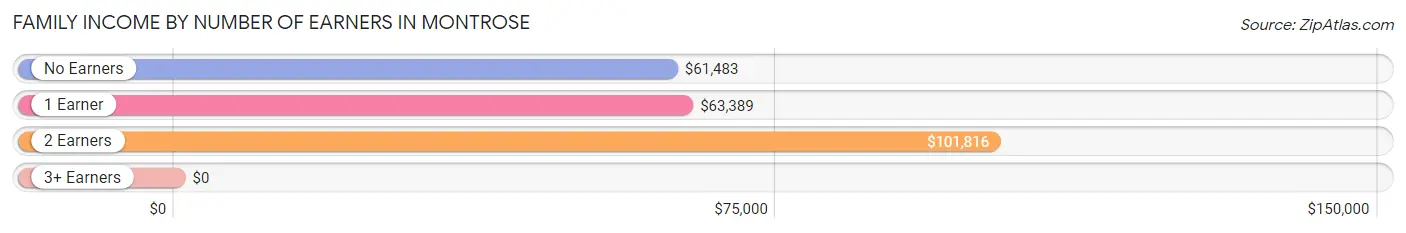
| Number of Earners | # Families | Median Income |
| No Earners | 1,281 (24.2%) | $61,483 |
| 1 Earner | 1,965 (37.1%) | $63,389 |
| 2 Earners | 1,677 (31.7%) | $101,816 |
| 3+ Earners | 370 (7.0%) | $0 |
| Total | 5,293 (100.0%) | $79,920 |
Household Income in Montrose
Household Income Brackets in Montrose
With 1,344 households falling in the category, the $50,000 to $74,999 income range is the most frequent in Montrose, accounting for 15.9% of all households. In contrast, only 363 households (4.3%) fall into the $10,000 to $14,999 income bracket, making it the least populous group.
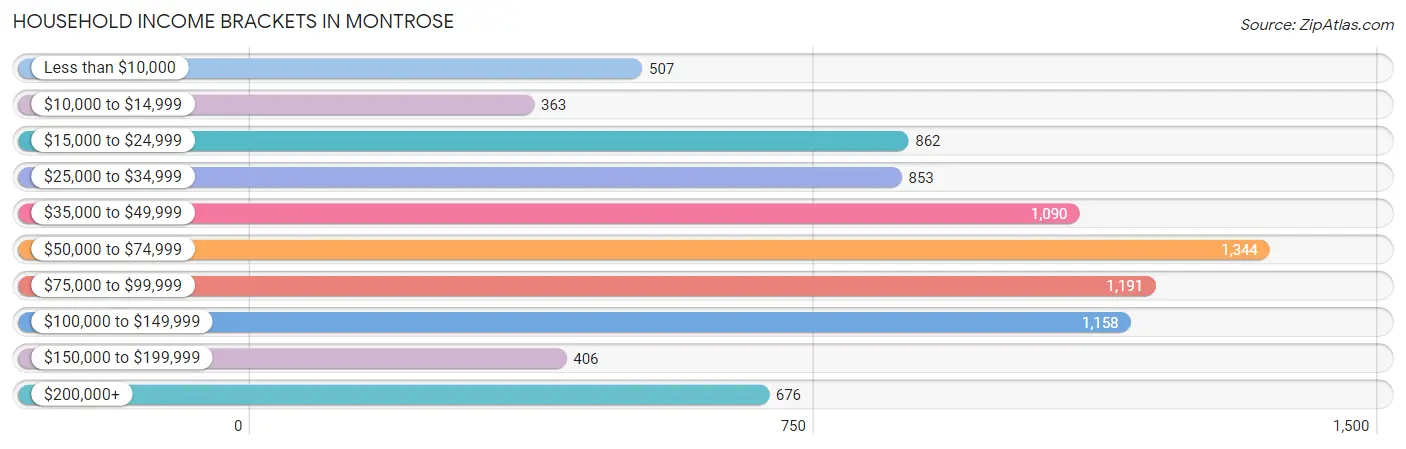
| Income Bracket | # Households | % Households |
| Less than $10,000 | 507 | 6.0% |
| $10,000 to $14,999 | 363 | 4.3% |
| $15,000 to $24,999 | 862 | 10.2% |
| $25,000 to $34,999 | 853 | 10.1% |
| $35,000 to $49,999 | 1,090 | 12.9% |
| $50,000 to $74,999 | 1,344 | 15.9% |
| $75,000 to $99,999 | 1,191 | 14.1% |
| $100,000 to $149,999 | 1,158 | 13.7% |
| $150,000 to $199,999 | 406 | 4.8% |
| $200,000+ | 676 | 8.0% |
Household Income by Householder Age in Montrose
The median household income in Montrose is $60,132, with the highest median household income of $80,328 found in the 25 to 44 years age bracket for the primary householder. A total of 1,915 households (22.7%) fall into this category. Meanwhile, the 15 to 24 years age bracket for the primary householder has the lowest median household income of $0, with 201 households (2.4%) in this group.
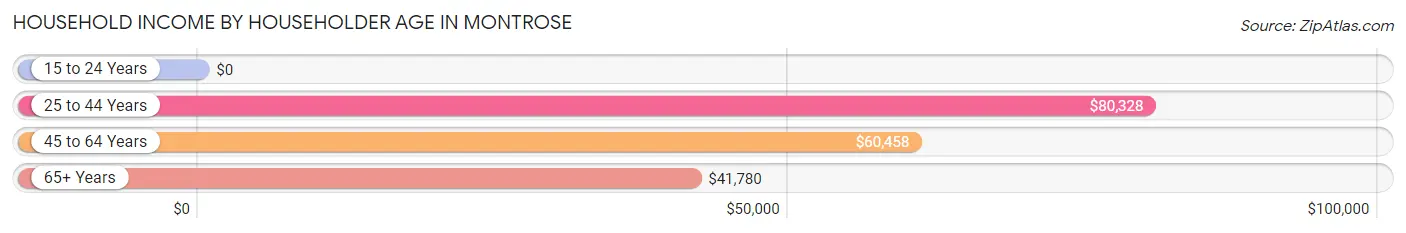
| Income Bracket | # Households | Median Income |
| 15 to 24 Years | 201 (2.4%) | $0 |
| 25 to 44 Years | 1,915 (22.7%) | $80,328 |
| 45 to 64 Years | 2,892 (34.2%) | $60,458 |
| 65+ Years | 3,442 (40.7%) | $41,780 |
| Total | 8,450 (100.0%) | $60,132 |
Poverty in Montrose
Income Below Poverty by Sex and Age in Montrose
With 11.4% poverty level for males and 14.3% for females among the residents of Montrose, 6 to 11 year old males and 5 year old females are the most vulnerable to poverty, with 207 males (31.0%) and 35 females (27.3%) in their respective age groups living below the poverty level.
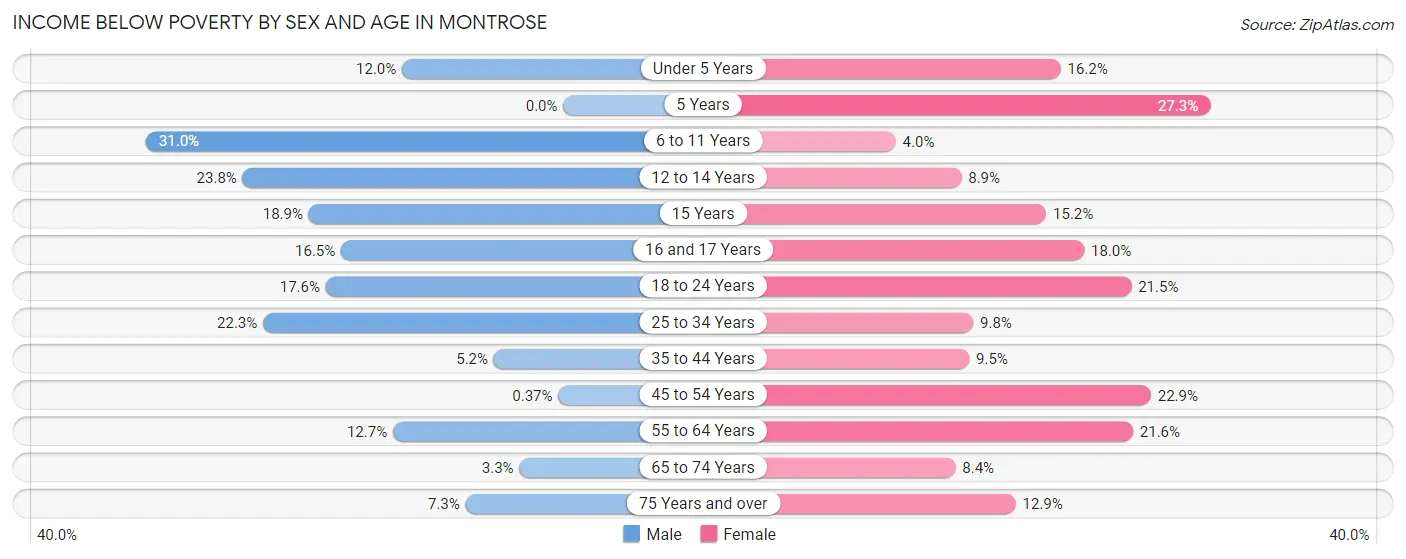
| Age Bracket | Male | Female |
| Under 5 Years | 70 (12.0%) | 76 (16.2%) |
| 5 Years | 0 (0.0%) | 35 (27.3%) |
| 6 to 11 Years | 207 (31.0%) | 27 (4.0%) |
| 12 to 14 Years | 65 (23.8%) | 41 (8.9%) |
| 15 Years | 24 (18.9%) | 22 (15.2%) |
| 16 and 17 Years | 33 (16.5%) | 25 (18.0%) |
| 18 to 24 Years | 109 (17.6%) | 144 (21.5%) |
| 25 to 34 Years | 222 (22.3%) | 106 (9.8%) |
| 35 to 44 Years | 46 (5.2%) | 116 (9.5%) |
| 45 to 54 Years | 4 (0.4%) | 309 (22.9%) |
| 55 to 64 Years | 162 (12.7%) | 323 (21.6%) |
| 65 to 74 Years | 49 (3.3%) | 118 (8.4%) |
| 75 Years and over | 70 (7.3%) | 199 (12.9%) |
| Total | 1,061 (11.4%) | 1,541 (14.3%) |
Income Above Poverty by Sex and Age in Montrose
According to the poverty statistics in Montrose, males aged 5 years and females aged 6 to 11 years are the age groups that are most secure financially, with 100.0% of males and 96.0% of females in these age groups living above the poverty line.
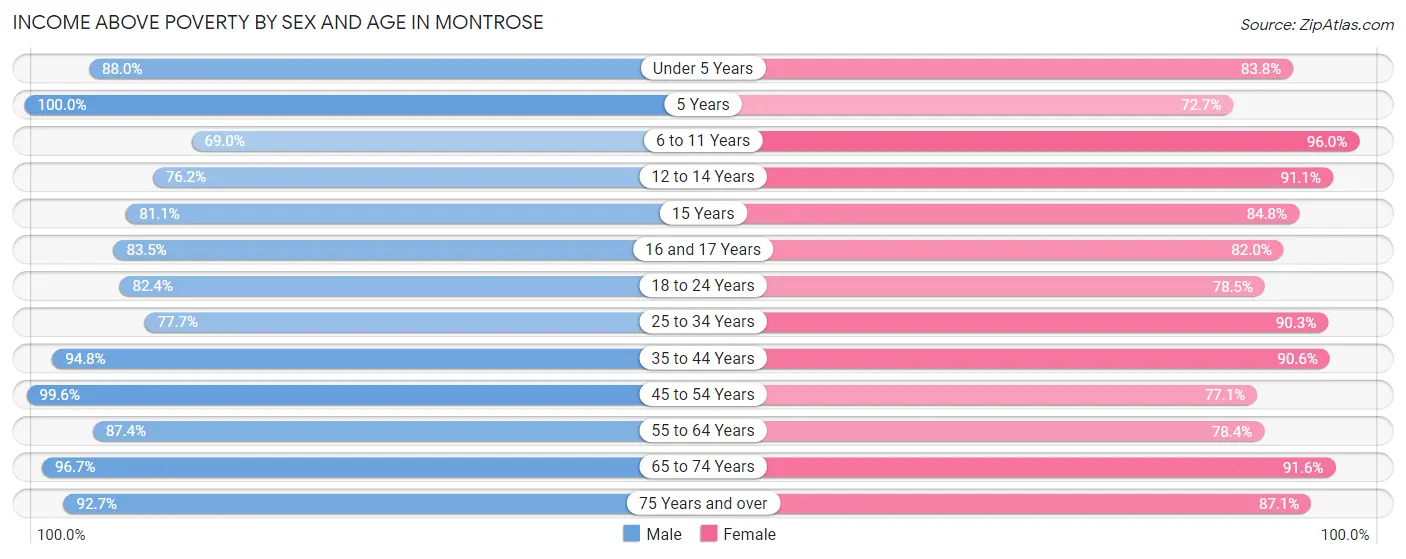
| Age Bracket | Male | Female |
| Under 5 Years | 515 (88.0%) | 392 (83.8%) |
| 5 Years | 88 (100.0%) | 93 (72.7%) |
| 6 to 11 Years | 461 (69.0%) | 648 (96.0%) |
| 12 to 14 Years | 208 (76.2%) | 421 (91.1%) |
| 15 Years | 103 (81.1%) | 123 (84.8%) |
| 16 and 17 Years | 167 (83.5%) | 114 (82.0%) |
| 18 to 24 Years | 509 (82.4%) | 526 (78.5%) |
| 25 to 34 Years | 774 (77.7%) | 981 (90.2%) |
| 35 to 44 Years | 845 (94.8%) | 1,112 (90.5%) |
| 45 to 54 Years | 1,076 (99.6%) | 1,038 (77.1%) |
| 55 to 64 Years | 1,119 (87.4%) | 1,172 (78.4%) |
| 65 to 74 Years | 1,456 (96.7%) | 1,282 (91.6%) |
| 75 Years and over | 894 (92.7%) | 1,344 (87.1%) |
| Total | 8,215 (88.6%) | 9,246 (85.7%) |
Income Below Poverty Among Married-Couple Families in Montrose
The poverty statistics for married-couple families in Montrose show that 6.8% or 266 of the total 3,937 families live below the poverty line. Families with 3 or 4 children have the highest poverty rate of 20.9%, comprising of 66 families. On the other hand, families with 5 or more children have the lowest poverty rate of 0.0%, which includes 0 families.
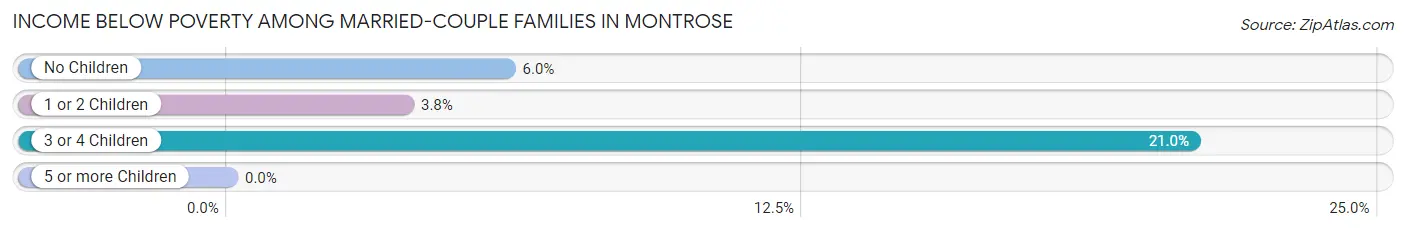
| Children | Above Poverty | Below Poverty |
| No Children | 2,629 (94.0%) | 169 (6.0%) |
| 1 or 2 Children | 779 (96.2%) | 31 (3.8%) |
| 3 or 4 Children | 249 (79.0%) | 66 (20.9%) |
| 5 or more Children | 14 (100.0%) | 0 (0.0%) |
| Total | 3,671 (93.2%) | 266 (6.8%) |
Income Below Poverty Among Single-Parent Households in Montrose
According to the poverty data in Montrose, 4.0% or 16 single-father households and 17.4% or 167 single-mother households are living below the poverty line. Among single-father households, those with 1 or 2 children have the highest poverty rate, with 16 households (9.1%) experiencing poverty. Likewise, among single-mother households, those with 3 or 4 children have the highest poverty rate, with 22 households (31.9%) falling below the poverty line.
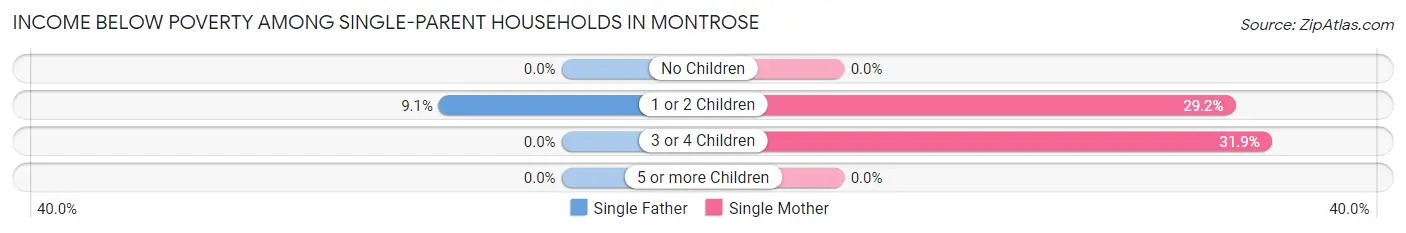
| Children | Single Father | Single Mother |
| No Children | 0 (0.0%) | 0 (0.0%) |
| 1 or 2 Children | 16 (9.1%) | 145 (29.2%) |
| 3 or 4 Children | 0 (0.0%) | 22 (31.9%) |
| 5 or more Children | 0 (0.0%) | 0 (0.0%) |
| Total | 16 (4.0%) | 167 (17.4%) |
Income Below Poverty Among Married-Couple vs Single-Parent Households in Montrose
The poverty data for Montrose shows that 266 of the married-couple family households (6.8%) and 183 of the single-parent households (13.5%) are living below the poverty level. Within the married-couple family households, those with 3 or 4 children have the highest poverty rate, with 66 households (20.9%) falling below the poverty line. Among the single-parent households, those with 1 or 2 children have the highest poverty rate, with 161 household (24.0%) living below poverty.
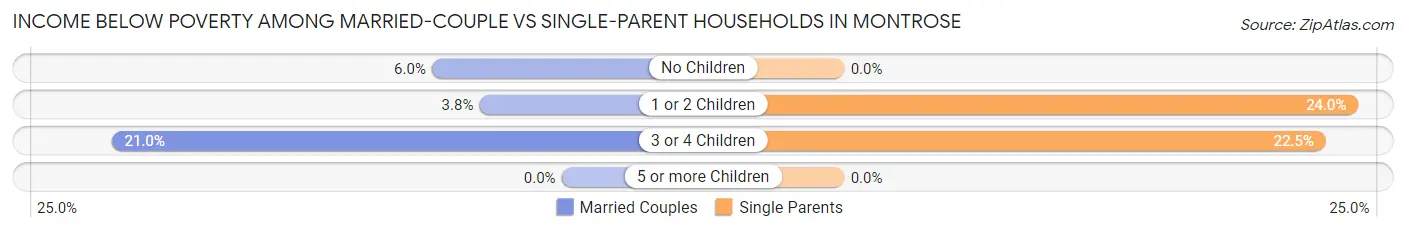
| Children | Married-Couple Families | Single-Parent Households |
| No Children | 169 (6.0%) | 0 (0.0%) |
| 1 or 2 Children | 31 (3.8%) | 161 (24.0%) |
| 3 or 4 Children | 66 (20.9%) | 22 (22.5%) |
| 5 or more Children | 0 (0.0%) | 0 (0.0%) |
| Total | 266 (6.8%) | 183 (13.5%) |
Race in Montrose
The most populous races in Montrose are White / Caucasian (17,079 | 83.8%), Hispanic or Latino (4,150 | 20.3%), and Two or more Races (2,264 | 11.1%).
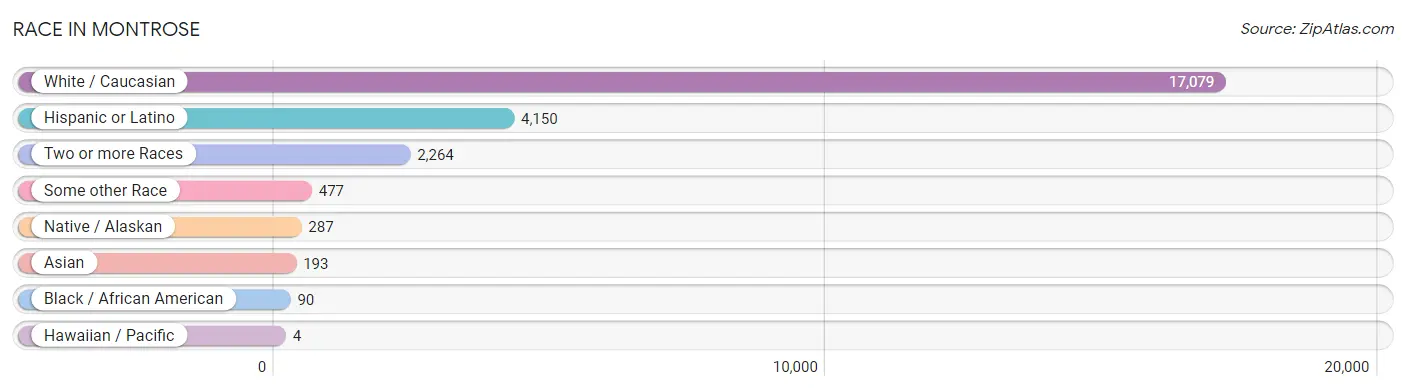
| Race | # Population | % Population |
| Asian | 193 | 0.9% |
| Black / African American | 90 | 0.4% |
| Hawaiian / Pacific | 4 | 0.0% |
| Hispanic or Latino | 4,150 | 20.3% |
| Native / Alaskan | 287 | 1.4% |
| White / Caucasian | 17,079 | 83.8% |
| Two or more Races | 2,264 | 11.1% |
| Some other Race | 477 | 2.3% |
| Total | 20,394 | 100.0% |
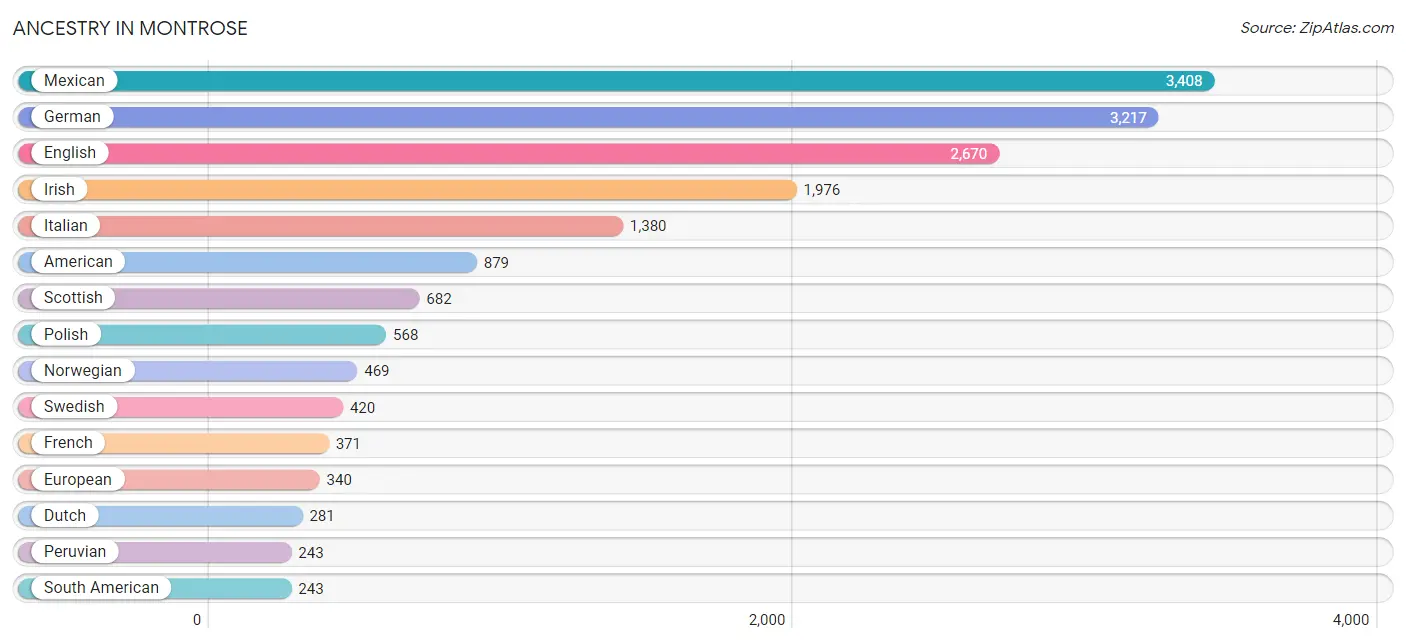
Ancestry in Montrose
The most populous ancestries reported in Montrose are Mexican (3,408 | 16.7%), German (3,217 | 15.8%), English (2,670 | 13.1%), Irish (1,976 | 9.7%), and Italian (1,380 | 6.8%), together accounting for 62.0% of all Montrose residents.
| Ancestry | # Population | % Population |
| African | 10 | 0.1% |
| American | 879 | 4.3% |
| Apache | 33 | 0.2% |
| Arab | 43 | 0.2% |
| Armenian | 46 | 0.2% |
| Australian | 10 | 0.1% |
| Austrian | 11 | 0.1% |
| Basque | 23 | 0.1% |
| Belgian | 10 | 0.1% |
| Bhutanese | 42 | 0.2% |
| British | 76 | 0.4% |
| Burmese | 20 | 0.1% |
| Central American | 9 | 0.0% |
| Central American Indian | 6 | 0.0% |
| Cherokee | 205 | 1.0% |
| Chickasaw | 5 | 0.0% |
| Choctaw | 18 | 0.1% |
| Cree | 184 | 0.9% |
| Croatian | 24 | 0.1% |
| Czech | 86 | 0.4% |
| Czechoslovakian | 17 | 0.1% |
| Danish | 88 | 0.4% |
| Dutch | 281 | 1.4% |
| Eastern European | 47 | 0.2% |
| English | 2,670 | 13.1% |
| European | 340 | 1.7% |
| Finnish | 11 | 0.1% |
| French | 371 | 1.8% |
| French Canadian | 33 | 0.2% |
| German | 3,217 | 15.8% |
| Greek | 18 | 0.1% |
| Honduran | 3 | 0.0% |
| Hungarian | 10 | 0.1% |
| Icelander | 8 | 0.0% |
| Indian (Asian) | 26 | 0.1% |
| Inupiat | 14 | 0.1% |
| Irish | 1,976 | 9.7% |
| Italian | 1,380 | 6.8% |
| Korean | 241 | 1.2% |
| Lebanese | 9 | 0.0% |
| Lithuanian | 34 | 0.2% |
| Luxembourger | 15 | 0.1% |
| Mexican | 3,408 | 16.7% |
| Mexican American Indian | 12 | 0.1% |
| Native Hawaiian | 4 | 0.0% |
| Northern European | 19 | 0.1% |
| Norwegian | 469 | 2.3% |
| Pennsylvania German | 17 | 0.1% |
| Peruvian | 243 | 1.2% |
| Polish | 568 | 2.8% |
| Portuguese | 36 | 0.2% |
| Pueblo | 39 | 0.2% |
| Puerto Rican | 84 | 0.4% |
| Russian | 72 | 0.4% |
| Salvadoran | 6 | 0.0% |
| Scandinavian | 91 | 0.4% |
| Scotch-Irish | 167 | 0.8% |
| Scottish | 682 | 3.3% |
| Serbian | 15 | 0.1% |
| South American | 243 | 1.2% |
| Spaniard | 54 | 0.3% |
| Spanish | 67 | 0.3% |
| Sri Lankan | 78 | 0.4% |
| Subsaharan African | 10 | 0.1% |
| Swedish | 420 | 2.1% |
| Swiss | 158 | 0.8% |
| Ukrainian | 59 | 0.3% |
| Ute | 4 | 0.0% |
| Welsh | 153 | 0.7% | View All 69 Rows |
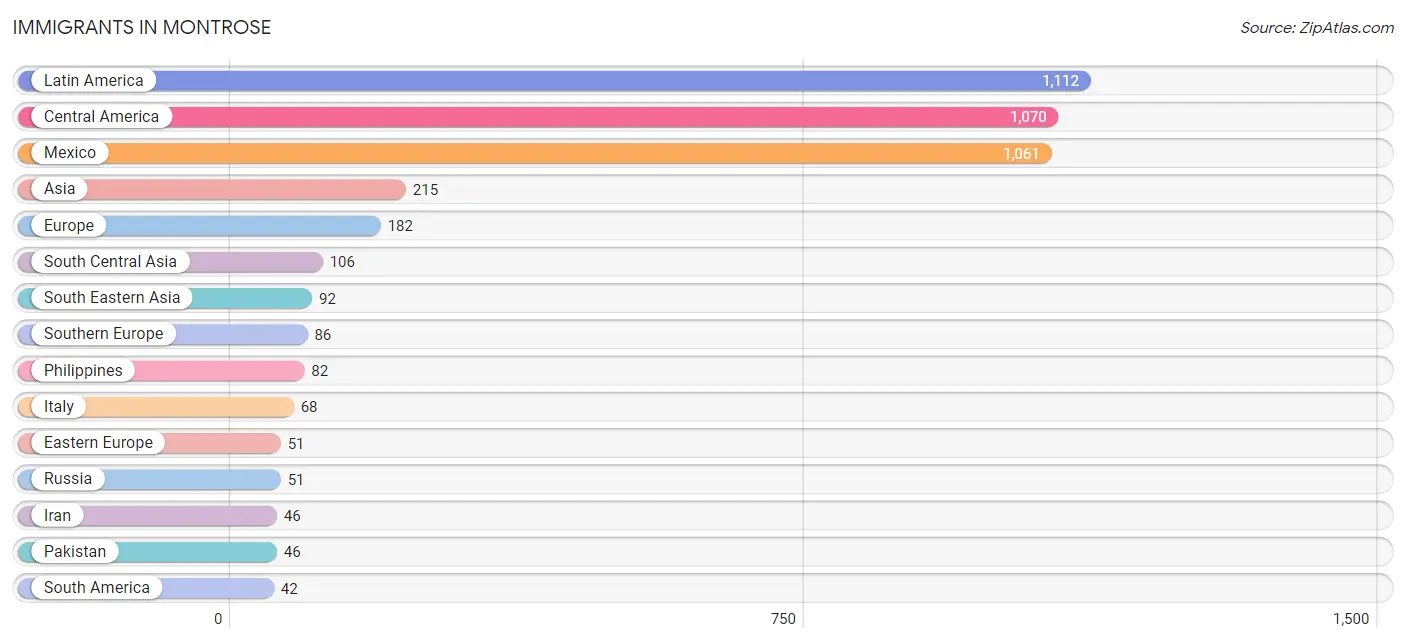
Immigrants in Montrose
The most numerous immigrant groups reported in Montrose came from Latin America (1,112 | 5.4%), Central America (1,070 | 5.2%), Mexico (1,061 | 5.2%), Asia (215 | 1.1%), and Europe (182 | 0.9%), together accounting for 17.8% of all Montrose residents.
| Immigration Origin | # Population | % Population |
| Asia | 215 | 1.1% |
| Australia | 10 | 0.1% |
| Brazil | 19 | 0.1% |
| Canada | 20 | 0.1% |
| Central America | 1,070 | 5.2% |
| China | 4 | 0.0% |
| Eastern Asia | 17 | 0.1% |
| Eastern Europe | 51 | 0.3% |
| El Salvador | 6 | 0.0% |
| England | 9 | 0.0% |
| Europe | 182 | 0.9% |
| Germany | 16 | 0.1% |
| Greece | 18 | 0.1% |
| Honduras | 3 | 0.0% |
| Iran | 46 | 0.2% |
| Italy | 68 | 0.3% |
| Japan | 5 | 0.0% |
| Korea | 8 | 0.0% |
| Latin America | 1,112 | 5.4% |
| Mexico | 1,061 | 5.2% |
| Nepal | 14 | 0.1% |
| Northern Europe | 29 | 0.1% |
| Oceania | 10 | 0.1% |
| Pakistan | 46 | 0.2% |
| Peru | 23 | 0.1% |
| Philippines | 82 | 0.4% |
| Russia | 51 | 0.3% |
| Scotland | 12 | 0.1% |
| South America | 42 | 0.2% |
| South Central Asia | 106 | 0.5% |
| South Eastern Asia | 92 | 0.4% |
| Southern Europe | 86 | 0.4% |
| Vietnam | 10 | 0.1% |
| Western Europe | 16 | 0.1% | View All 34 Rows |
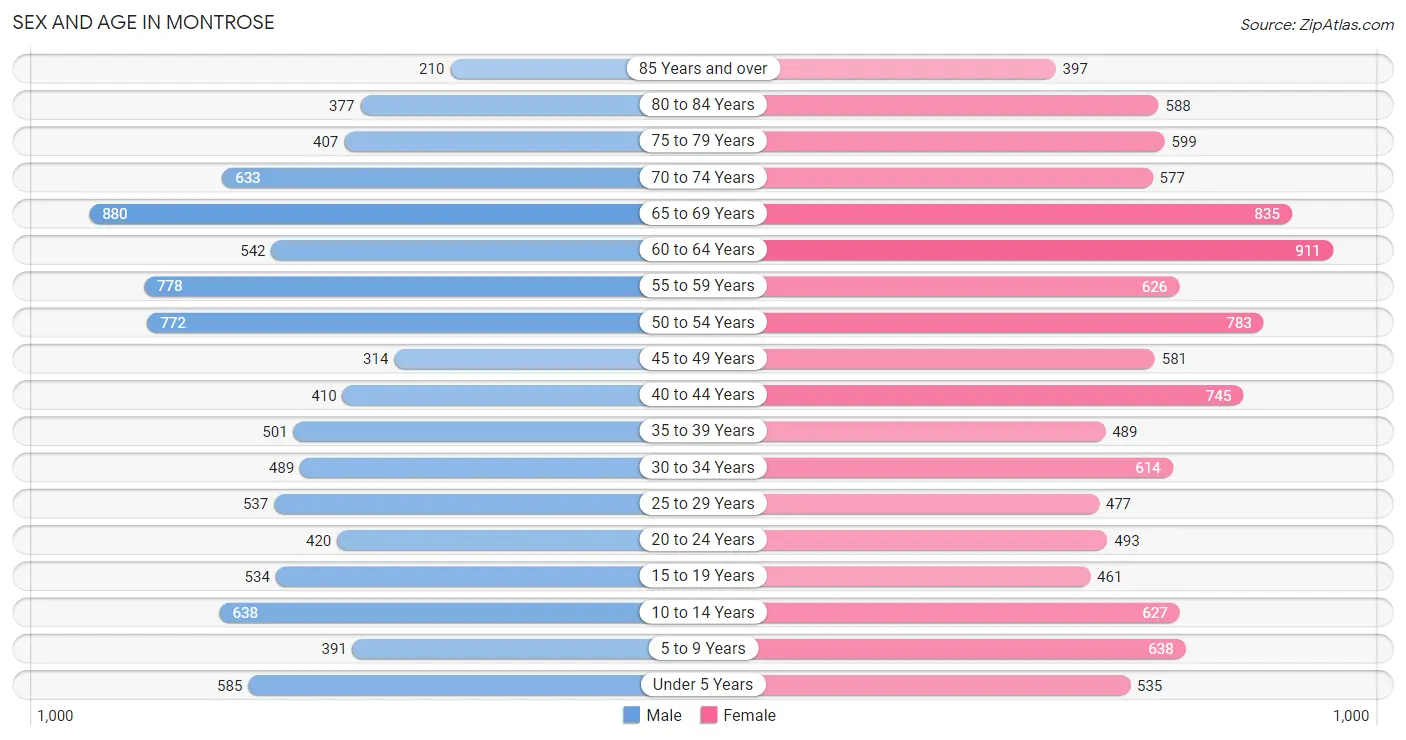
Sex and Age in Montrose
Sex and Age in Montrose
The most populous age groups in Montrose are 65 to 69 Years (880 | 9.3%) for men and 60 to 64 Years (911 | 8.3%) for women.
| Age Bracket | Male | Female |
| Under 5 Years | 585 (6.2%) | 535 (4.9%) |
| 5 to 9 Years | 391 (4.2%) | 638 (5.8%) |
| 10 to 14 Years | 638 (6.8%) | 627 (5.7%) |
| 15 to 19 Years | 534 (5.7%) | 461 (4.2%) |
| 20 to 24 Years | 420 (4.5%) | 493 (4.5%) |
| 25 to 29 Years | 537 (5.7%) | 477 (4.3%) |
| 30 to 34 Years | 489 (5.2%) | 614 (5.6%) |
| 35 to 39 Years | 501 (5.3%) | 489 (4.5%) |
| 40 to 44 Years | 410 (4.3%) | 745 (6.8%) |
| 45 to 49 Years | 314 (3.3%) | 581 (5.3%) |
| 50 to 54 Years | 772 (8.2%) | 783 (7.1%) |
| 55 to 59 Years | 778 (8.3%) | 626 (5.7%) |
| 60 to 64 Years | 542 (5.8%) | 911 (8.3%) |
| 65 to 69 Years | 880 (9.3%) | 835 (7.6%) |
| 70 to 74 Years | 633 (6.7%) | 577 (5.3%) |
| 75 to 79 Years | 407 (4.3%) | 599 (5.5%) |
| 80 to 84 Years | 377 (4.0%) | 588 (5.4%) |
| 85 Years and over | 210 (2.2%) | 397 (3.6%) |
| Total | 9,418 (100.0%) | 10,976 (100.0%) |
Families and Households in Montrose
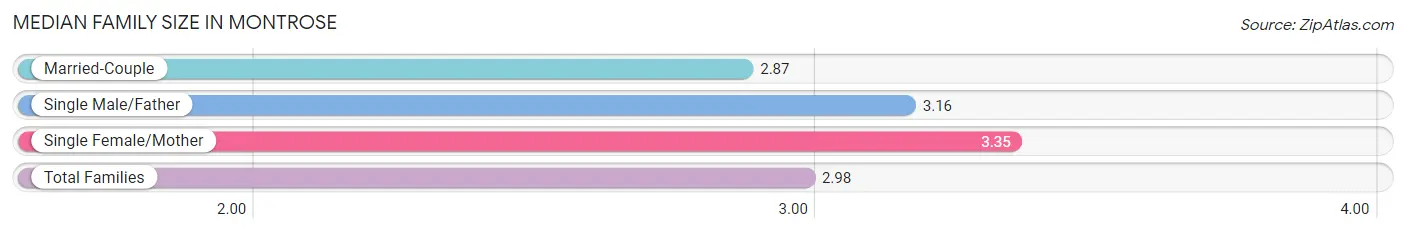
Median Family Size in Montrose
The median family size in Montrose is 2.98 persons per family, with single female/mother families (959 | 18.1%) accounting for the largest median family size of 3.35 persons per family. On the other hand, married-couple families (3,937 | 74.4%) represent the smallest median family size with 2.87 persons per family.
| Family Type | # Families | Family Size |
| Married-Couple | 3,937 (74.4%) | 2.87 |
| Single Male/Father | 397 (7.5%) | 3.16 |
| Single Female/Mother | 959 (18.1%) | 3.35 |
| Total Families | 5,293 (100.0%) | 2.98 |
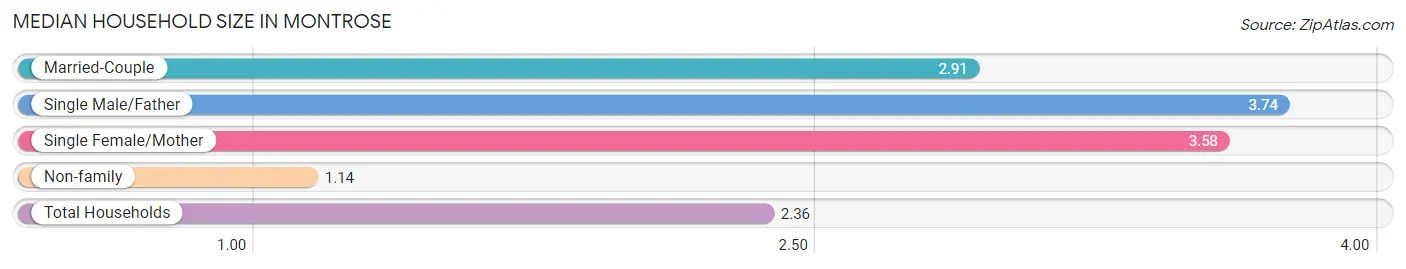
Median Household Size in Montrose
The median household size in Montrose is 2.36 persons per household, with single male/father households (397 | 4.7%) accounting for the largest median household size of 3.74 persons per household. non-family households (3,157 | 37.4%) represent the smallest median household size with 1.14 persons per household.
| Household Type | # Households | Household Size |
| Married-Couple | 3,937 (46.6%) | 2.91 |
| Single Male/Father | 397 (4.7%) | 3.74 |
| Single Female/Mother | 959 (11.4%) | 3.58 |
| Non-family | 3,157 (37.4%) | 1.14 |
| Total Households | 8,450 (100.0%) | 2.36 |
Household Size by Marriage Status in Montrose
Out of a total of 8,450 households in Montrose, 5,293 (62.6%) are family households, while 3,157 (37.4%) are nonfamily households. The most numerous type of family households are 2-person households, comprising 3,043, and the most common type of nonfamily households are 1-person households, comprising 2,779.
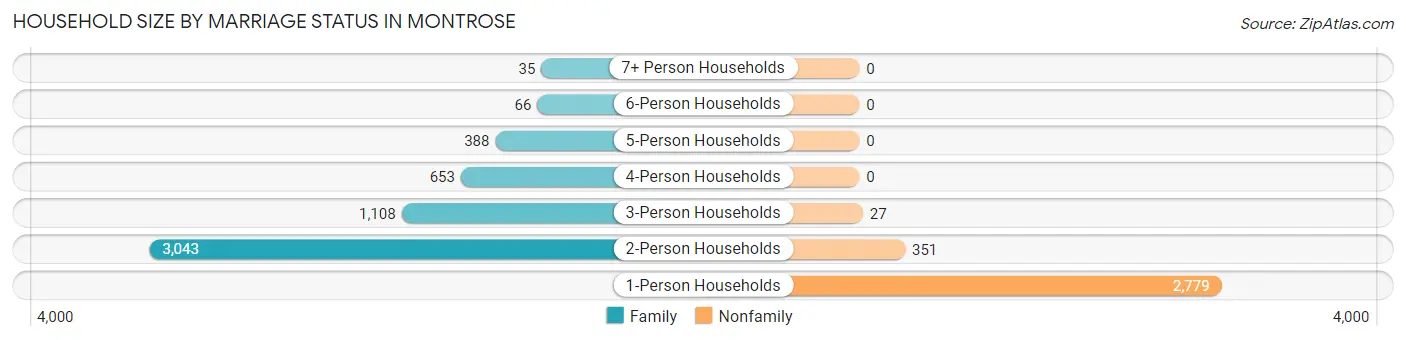
| Household Size | Family Households | Nonfamily Households |
| 1-Person Households | - | 2,779 (32.9%) |
| 2-Person Households | 3,043 (36.0%) | 351 (4.2%) |
| 3-Person Households | 1,108 (13.1%) | 27 (0.3%) |
| 4-Person Households | 653 (7.7%) | 0 (0.0%) |
| 5-Person Households | 388 (4.6%) | 0 (0.0%) |
| 6-Person Households | 66 (0.8%) | 0 (0.0%) |
| 7+ Person Households | 35 (0.4%) | 0 (0.0%) |
| Total | 5,293 (62.6%) | 3,157 (37.4%) |
Female Fertility in Montrose
Fertility by Age in Montrose
Average fertility rate in Montrose is 82.0 births per 1,000 women. Women in the age bracket of 20 to 34 years have the highest fertility rate with 194.0 births per 1,000 women. Women in the age bracket of 20 to 34 years acount for 92.7% of all women with births.
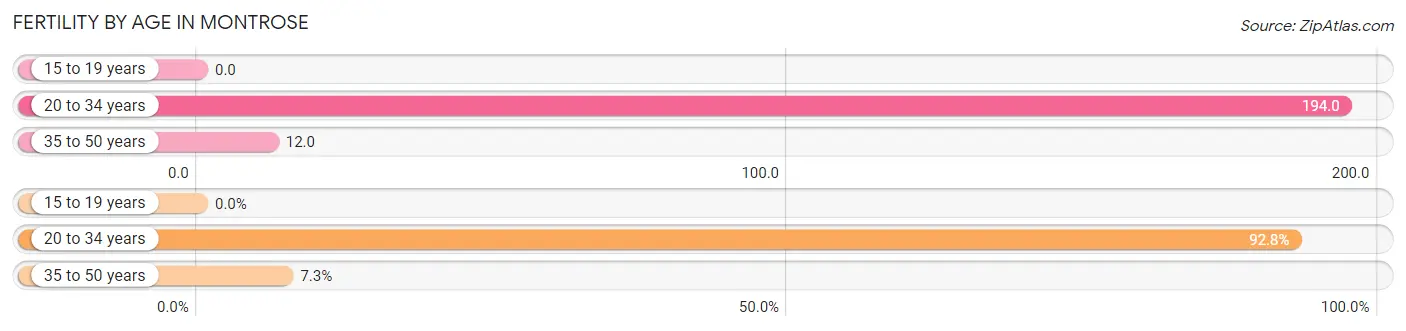
| Age Bracket | Women with Births | Births / 1,000 Women |
| 15 to 19 years | 0 (0.0%) | 0.0 |
| 20 to 34 years | 307 (92.7%) | 194.0 |
| 35 to 50 years | 24 (7.2%) | 12.0 |
| Total | 331 (100.0%) | 82.0 |
Fertility by Age by Marriage Status in Montrose
32.0% of women with births (331) in Montrose are married. The highest percentage of unmarried women with births falls into 20 to 34 years age bracket with 70.0% of them unmarried at the time of birth, while the lowest percentage of unmarried women with births belong to 35 to 50 years age bracket with 41.7% of them unmarried.
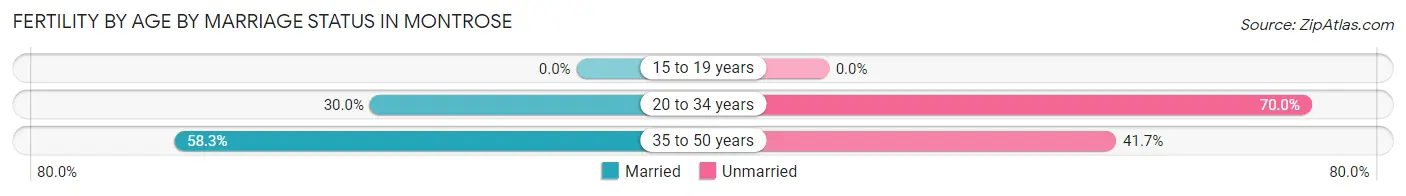
| Age Bracket | Married | Unmarried |
| 15 to 19 years | 0 (0.0%) | 0 (0.0%) |
| 20 to 34 years | 92 (30.0%) | 215 (70.0%) |
| 35 to 50 years | 14 (58.3%) | 10 (41.7%) |
| Total | 106 (32.0%) | 225 (68.0%) |
Fertility by Education in Montrose
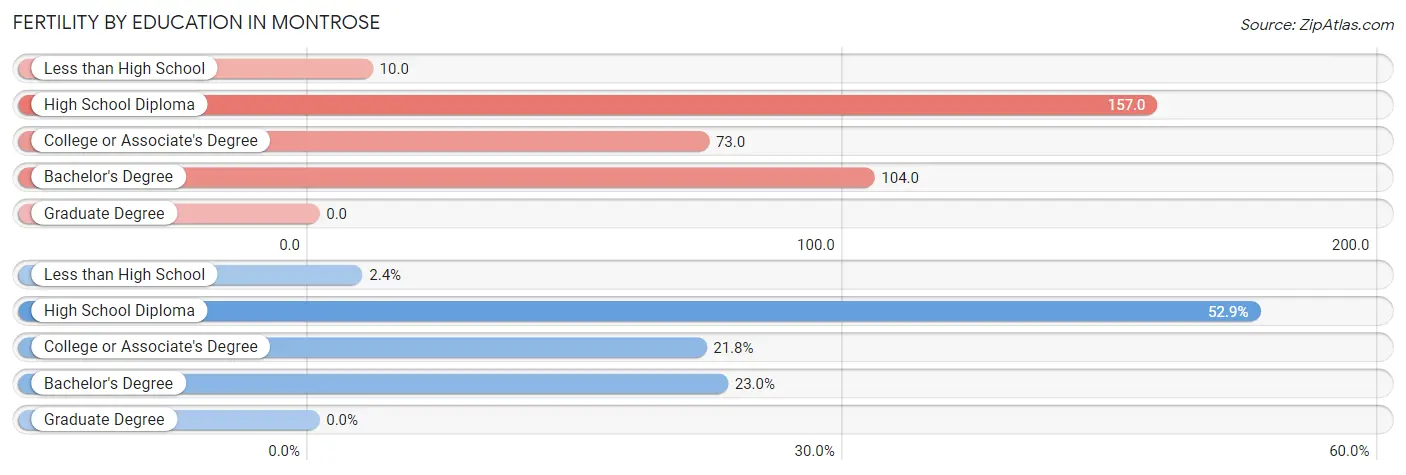
| Educational Attainment | Women with Births | Births / 1,000 Women |
| Less than High School | 8 (2.4%) | 10.0 |
| High School Diploma | 175 (52.9%) | 157.0 |
| College or Associate's Degree | 72 (21.7%) | 73.0 |
| Bachelor's Degree | 76 (23.0%) | 104.0 |
| Graduate Degree | 0 (0.0%) | 0.0 |
| Total | 331 (100.0%) | 82.0 |
Fertility by Education by Marriage Status in Montrose
68.0% of women with births in Montrose are unmarried. Women with the educational attainment of college or associate's degree are most likely to be married with 65.3% of them married at childbirth, while women with the educational attainment of less than high school are least likely to be married with 100.0% of them unmarried at childbirth.
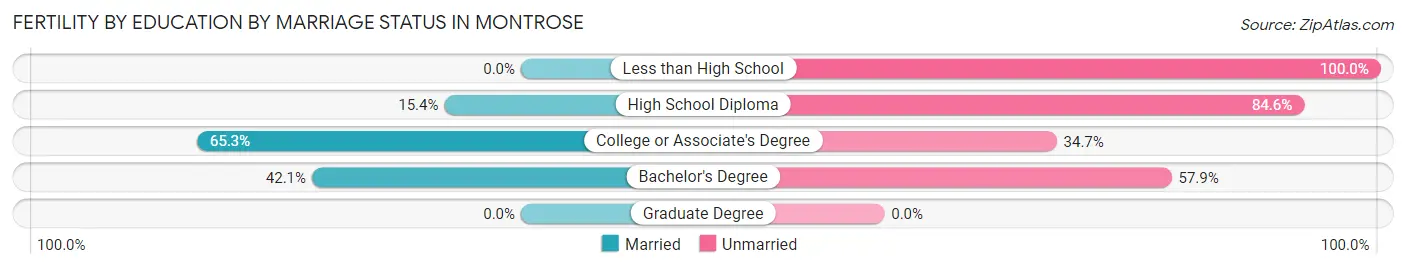
| Educational Attainment | Married | Unmarried |
| Less than High School | 0 (0.0%) | 8 (100.0%) |
| High School Diploma | 27 (15.4%) | 148 (84.6%) |
| College or Associate's Degree | 47 (65.3%) | 25 (34.7%) |
| Bachelor's Degree | 32 (42.1%) | 44 (57.9%) |
| Graduate Degree | 0 (0.0%) | 0 (0.0%) |
| Total | 106 (32.0%) | 225 (68.0%) |
Employment Characteristics in Montrose
Employment by Class of Employer in Montrose
Among the 8,134 employed individuals in Montrose, private company employees (5,078 | 62.4%), not-for-profit organizations (907 | 11.2%), and self-employed (not incorporated) (741 | 9.1%) make up the most common classes of employment.
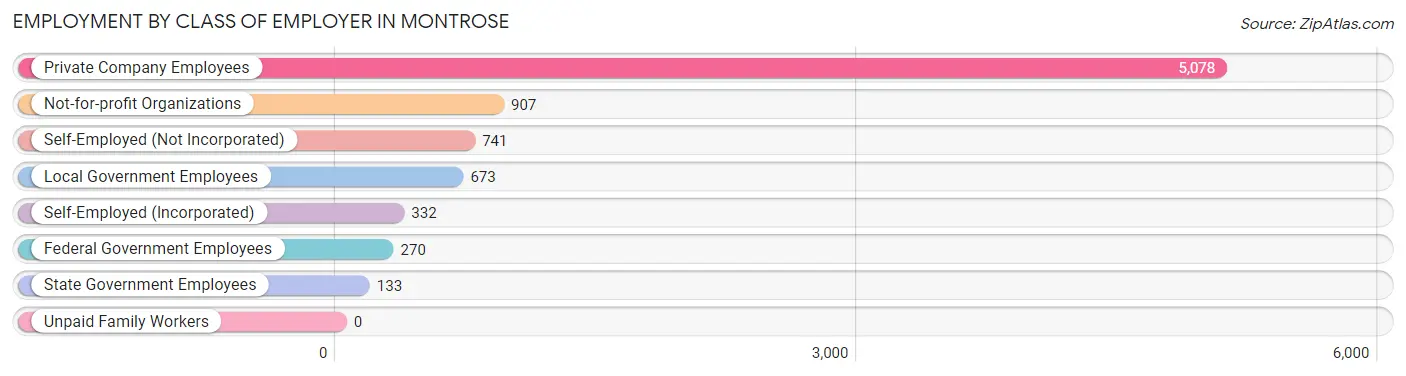
| Employer Class | # Employees | % Employees |
| Private Company Employees | 5,078 | 62.4% |
| Self-Employed (Incorporated) | 332 | 4.1% |
| Self-Employed (Not Incorporated) | 741 | 9.1% |
| Not-for-profit Organizations | 907 | 11.2% |
| Local Government Employees | 673 | 8.3% |
| State Government Employees | 133 | 1.6% |
| Federal Government Employees | 270 | 3.3% |
| Unpaid Family Workers | 0 | 0.0% |
| Total | 8,134 | 100.0% |
Employment Status by Age in Montrose
According to the labor force statistics for Montrose, out of the total population over 16 years of age (16,708), 52.9% or 8,839 individuals are in the labor force, with 5.1% or 451 of them unemployed. The age group with the highest labor force participation rate is 35 to 44 years, with 88.5% or 1,898 individuals in the labor force. Within the labor force, the 35 to 44 years age range has the highest percentage of unemployed individuals, with 15.4% or 292 of them being unemployed.
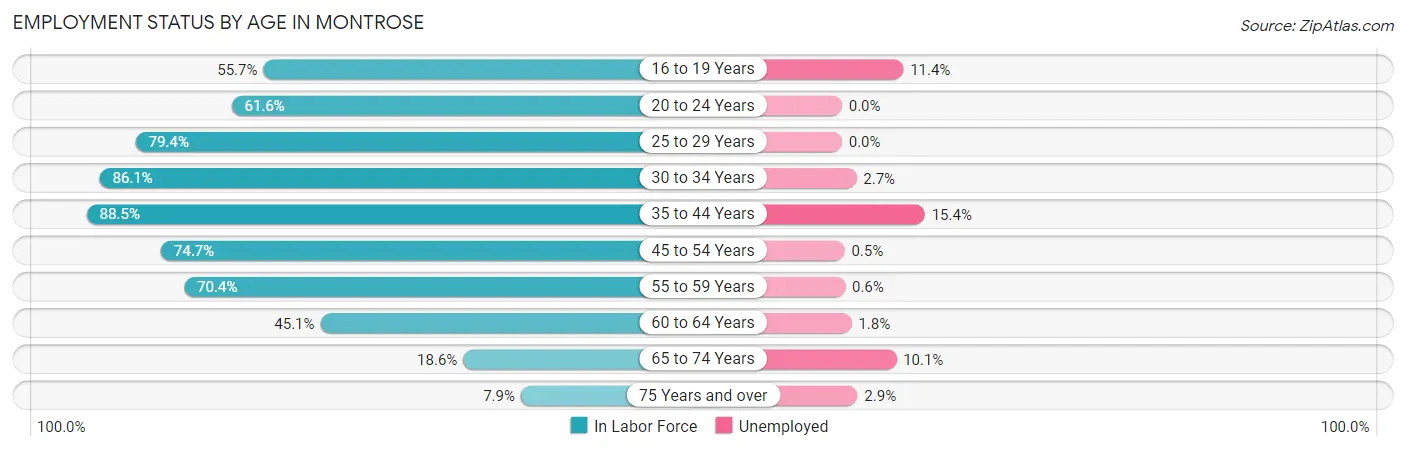
| Age Bracket | In Labor Force | Unemployed |
| 16 to 19 Years | 403 (55.7%) | 46 (11.4%) |
| 20 to 24 Years | 562 (61.6%) | 0 (0.0%) |
| 25 to 29 Years | 805 (79.4%) | 0 (0.0%) |
| 30 to 34 Years | 950 (86.1%) | 26 (2.7%) |
| 35 to 44 Years | 1,898 (88.5%) | 292 (15.4%) |
| 45 to 54 Years | 1,830 (74.7%) | 9 (0.5%) |
| 55 to 59 Years | 988 (70.4%) | 6 (0.6%) |
| 60 to 64 Years | 655 (45.1%) | 12 (1.8%) |
| 65 to 74 Years | 544 (18.6%) | 55 (10.1%) |
| 75 Years and over | 204 (7.9%) | 6 (2.9%) |
| Total | 8,839 (52.9%) | 451 (5.1%) |
Employment Status by Educational Attainment in Montrose
According to labor force statistics for Montrose, 74.5% of individuals (7,129) out of the total population between 25 and 64 years of age (9,569) are in the labor force, with 4.8% or 342 of them being unemployed. The group with the highest labor force participation rate are those with the educational attainment of bachelor's degree or higher, with 82.8% or 2,388 individuals in the labor force. Within the labor force, individuals with bachelor's degree or higher education have the highest percentage of unemployment, with 11.8% or 282 of them being unemployed.
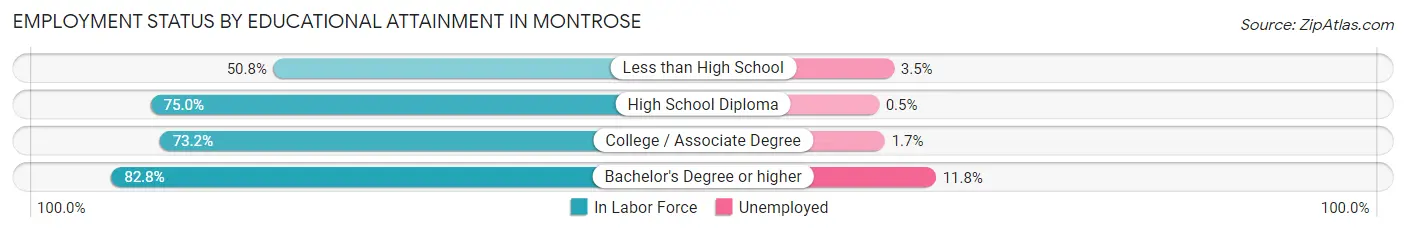
| Educational Attainment | In Labor Force | Unemployed |
| Less than High School | 480 (50.8%) | 33 (3.5%) |
| High School Diploma | 2,245 (75.0%) | 15 (0.5%) |
| College / Associate Degree | 2,011 (73.2%) | 47 (1.7%) |
| Bachelor's Degree or higher | 2,388 (82.8%) | 340 (11.8%) |
| Total | 7,129 (74.5%) | 459 (4.8%) |
Employment Occupations by Sex in Montrose
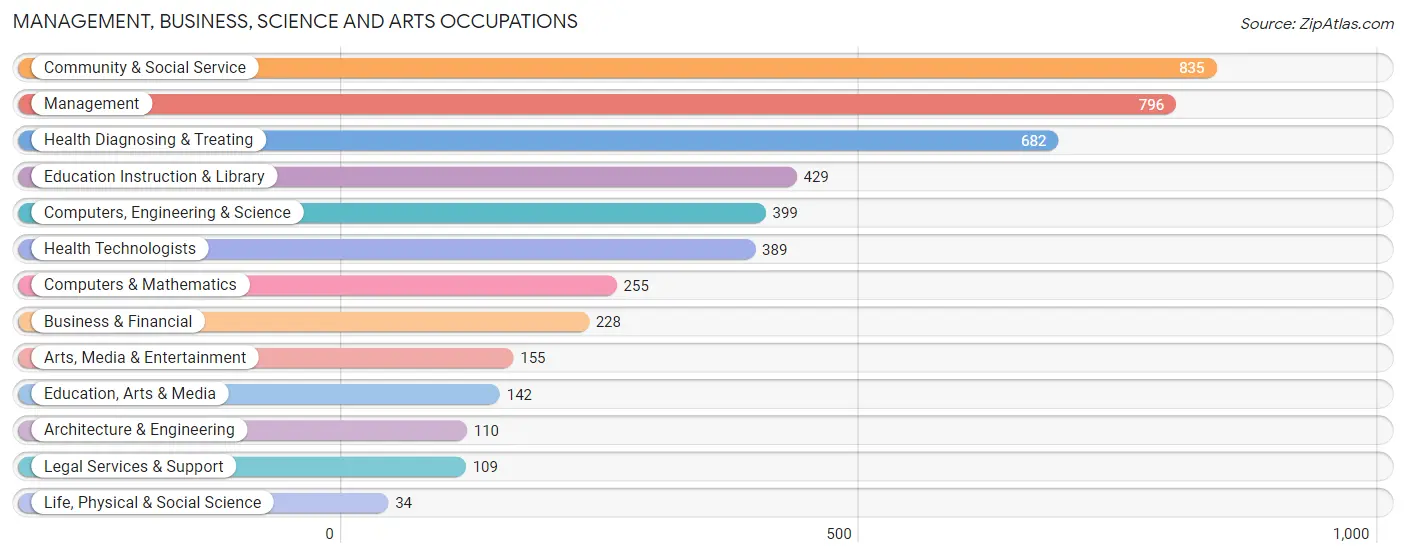
Management, Business, Science and Arts Occupations
The most common Management, Business, Science and Arts occupations in Montrose are Community & Social Service (835 | 10.0%), Management (796 | 9.6%), Health Diagnosing & Treating (682 | 8.2%), Education Instruction & Library (429 | 5.1%), and Computers, Engineering & Science (399 | 4.8%).
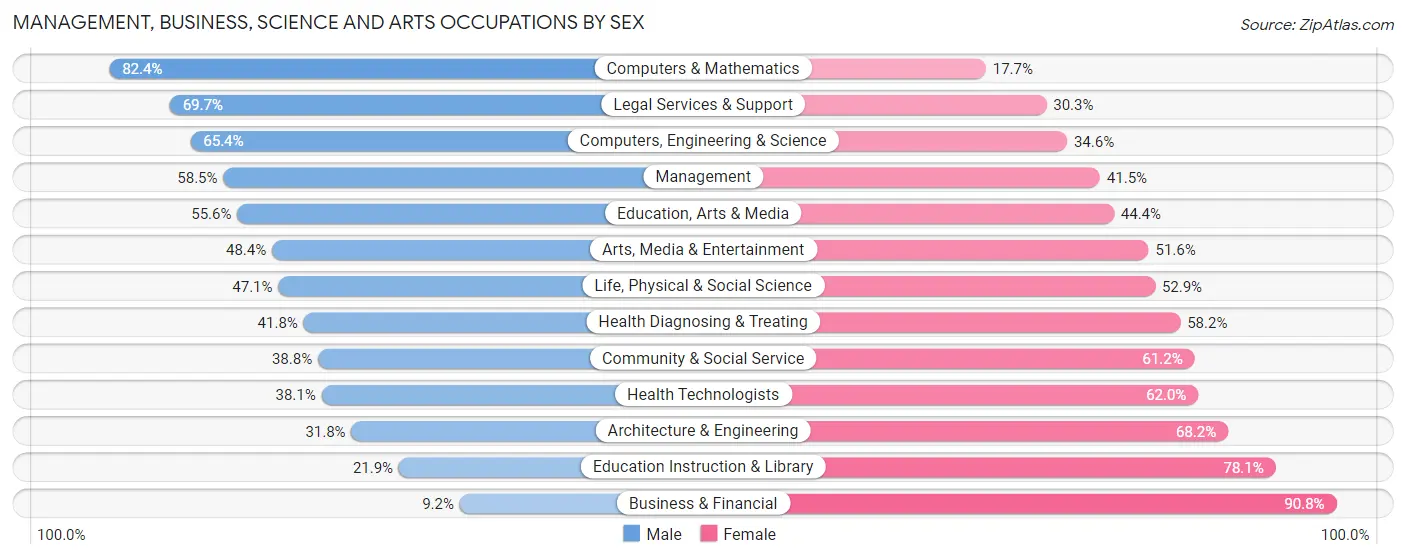
Management, Business, Science and Arts Occupations by Sex
Within the Management, Business, Science and Arts occupations in Montrose, the most male-oriented occupations are Computers & Mathematics (82.4%), Legal Services & Support (69.7%), and Computers, Engineering & Science (65.4%), while the most female-oriented occupations are Business & Financial (90.8%), Education Instruction & Library (78.1%), and Architecture & Engineering (68.2%).
| Occupation | Male | Female |
| Management | 466 (58.5%) | 330 (41.5%) |
| Business & Financial | 21 (9.2%) | 207 (90.8%) |
| Computers, Engineering & Science | 261 (65.4%) | 138 (34.6%) |
| Computers & Mathematics | 210 (82.4%) | 45 (17.6%) |
| Architecture & Engineering | 35 (31.8%) | 75 (68.2%) |
| Life, Physical & Social Science | 16 (47.1%) | 18 (52.9%) |
| Community & Social Service | 324 (38.8%) | 511 (61.2%) |
| Education, Arts & Media | 79 (55.6%) | 63 (44.4%) |
| Legal Services & Support | 76 (69.7%) | 33 (30.3%) |
| Education Instruction & Library | 94 (21.9%) | 335 (78.1%) |
| Arts, Media & Entertainment | 75 (48.4%) | 80 (51.6%) |
| Health Diagnosing & Treating | 285 (41.8%) | 397 (58.2%) |
| Health Technologists | 148 (38.1%) | 241 (62.0%) |
| Total (Category) | 1,357 (46.2%) | 1,583 (53.8%) |
| Total (Overall) | 4,359 (52.3%) | 3,971 (47.7%) |
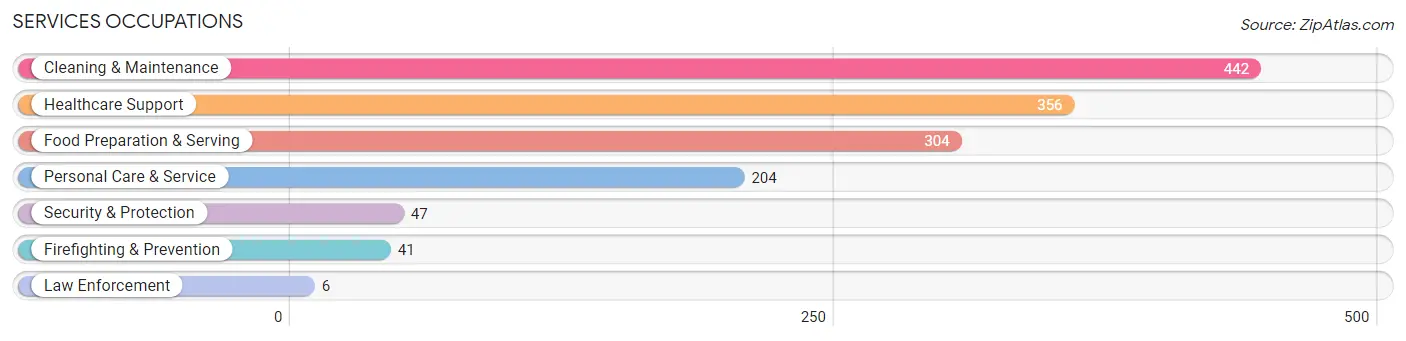
Services Occupations
The most common Services occupations in Montrose are Cleaning & Maintenance (442 | 5.3%), Healthcare Support (356 | 4.3%), Food Preparation & Serving (304 | 3.6%), Personal Care & Service (204 | 2.5%), and Security & Protection (47 | 0.6%).
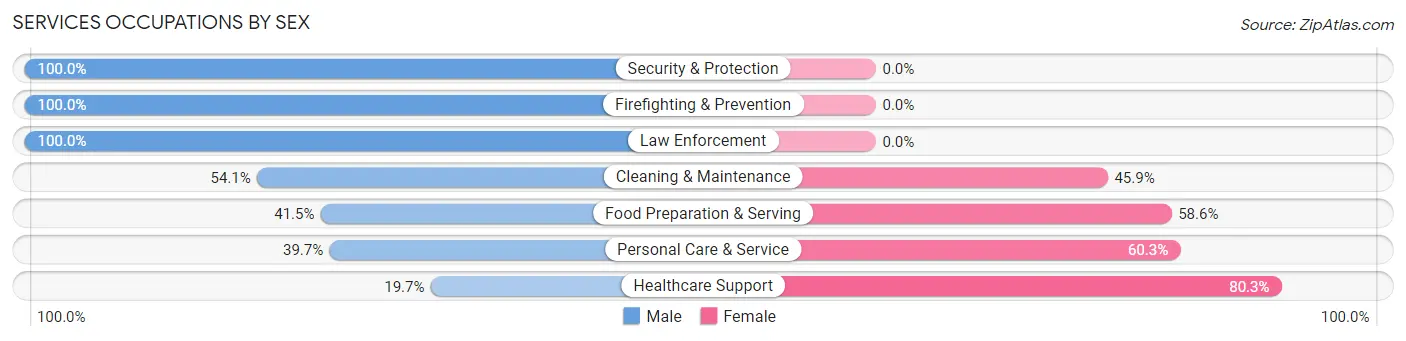
Services Occupations by Sex
Within the Services occupations in Montrose, the most male-oriented occupations are Security & Protection (100.0%), Firefighting & Prevention (100.0%), and Law Enforcement (100.0%), while the most female-oriented occupations are Healthcare Support (80.3%), Personal Care & Service (60.3%), and Food Preparation & Serving (58.6%).
| Occupation | Male | Female |
| Healthcare Support | 70 (19.7%) | 286 (80.3%) |
| Security & Protection | 47 (100.0%) | 0 (0.0%) |
| Firefighting & Prevention | 41 (100.0%) | 0 (0.0%) |
| Law Enforcement | 6 (100.0%) | 0 (0.0%) |
| Food Preparation & Serving | 126 (41.4%) | 178 (58.6%) |
| Cleaning & Maintenance | 239 (54.1%) | 203 (45.9%) |
| Personal Care & Service | 81 (39.7%) | 123 (60.3%) |
| Total (Category) | 563 (41.6%) | 790 (58.4%) |
| Total (Overall) | 4,359 (52.3%) | 3,971 (47.7%) |
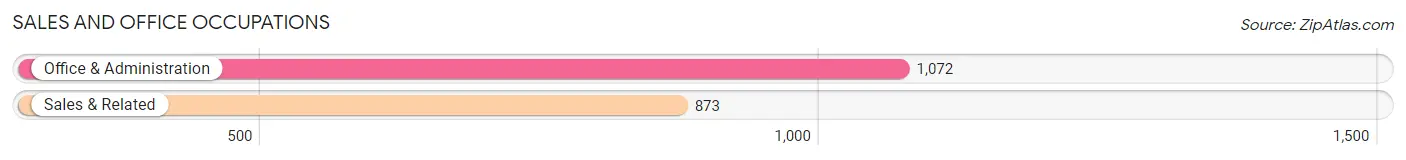
Sales and Office Occupations
The most common Sales and Office occupations in Montrose are Office & Administration (1,072 | 12.9%), and Sales & Related (873 | 10.5%).
Sales and Office Occupations by Sex
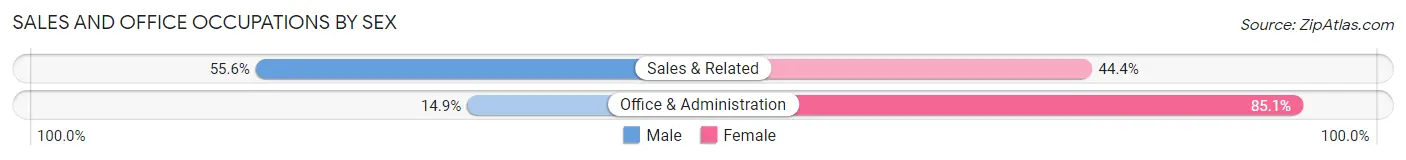
| Occupation | Male | Female |
| Sales & Related | 485 (55.6%) | 388 (44.4%) |
| Office & Administration | 160 (14.9%) | 912 (85.1%) |
| Total (Category) | 645 (33.2%) | 1,300 (66.8%) |
| Total (Overall) | 4,359 (52.3%) | 3,971 (47.7%) |
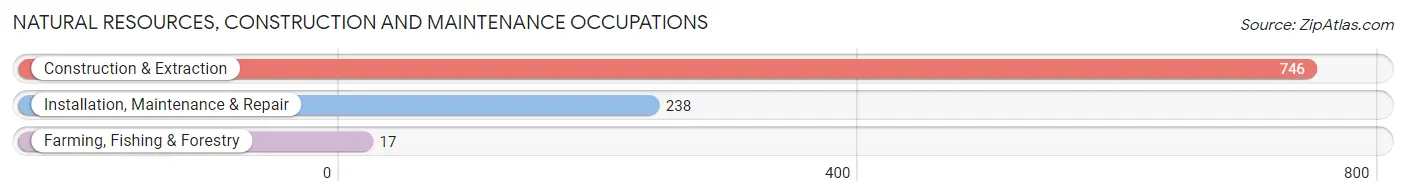
Natural Resources, Construction and Maintenance Occupations
The most common Natural Resources, Construction and Maintenance occupations in Montrose are Construction & Extraction (746 | 9.0%), Installation, Maintenance & Repair (238 | 2.9%), and Farming, Fishing & Forestry (17 | 0.2%).
Natural Resources, Construction and Maintenance Occupations by Sex
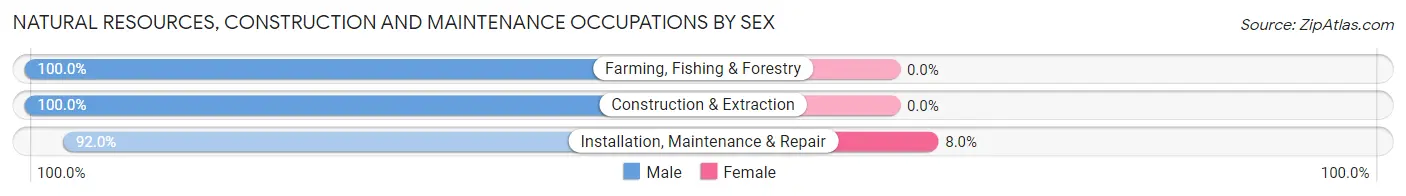
| Occupation | Male | Female |
| Farming, Fishing & Forestry | 17 (100.0%) | 0 (0.0%) |
| Construction & Extraction | 746 (100.0%) | 0 (0.0%) |
| Installation, Maintenance & Repair | 219 (92.0%) | 19 (8.0%) |
| Total (Category) | 982 (98.1%) | 19 (1.9%) |
| Total (Overall) | 4,359 (52.3%) | 3,971 (47.7%) |
Production, Transportation and Moving Occupations
The most common Production, Transportation and Moving occupations in Montrose are Production (490 | 5.9%), Transportation (309 | 3.7%), and Material Moving (292 | 3.5%).
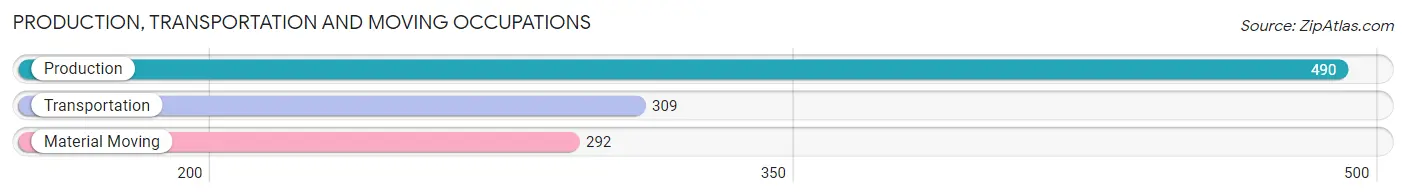
Production, Transportation and Moving Occupations by Sex
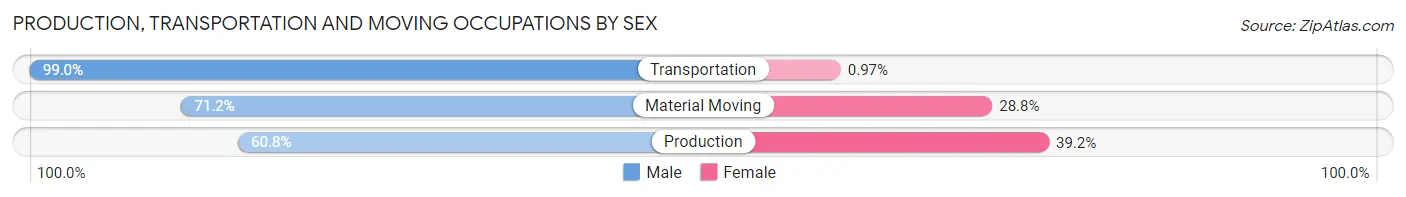
| Occupation | Male | Female |
| Production | 298 (60.8%) | 192 (39.2%) |
| Transportation | 306 (99.0%) | 3 (1.0%) |
| Material Moving | 208 (71.2%) | 84 (28.8%) |
| Total (Category) | 812 (74.4%) | 279 (25.6%) |
| Total (Overall) | 4,359 (52.3%) | 3,971 (47.7%) |
Employment Industries by Sex in Montrose
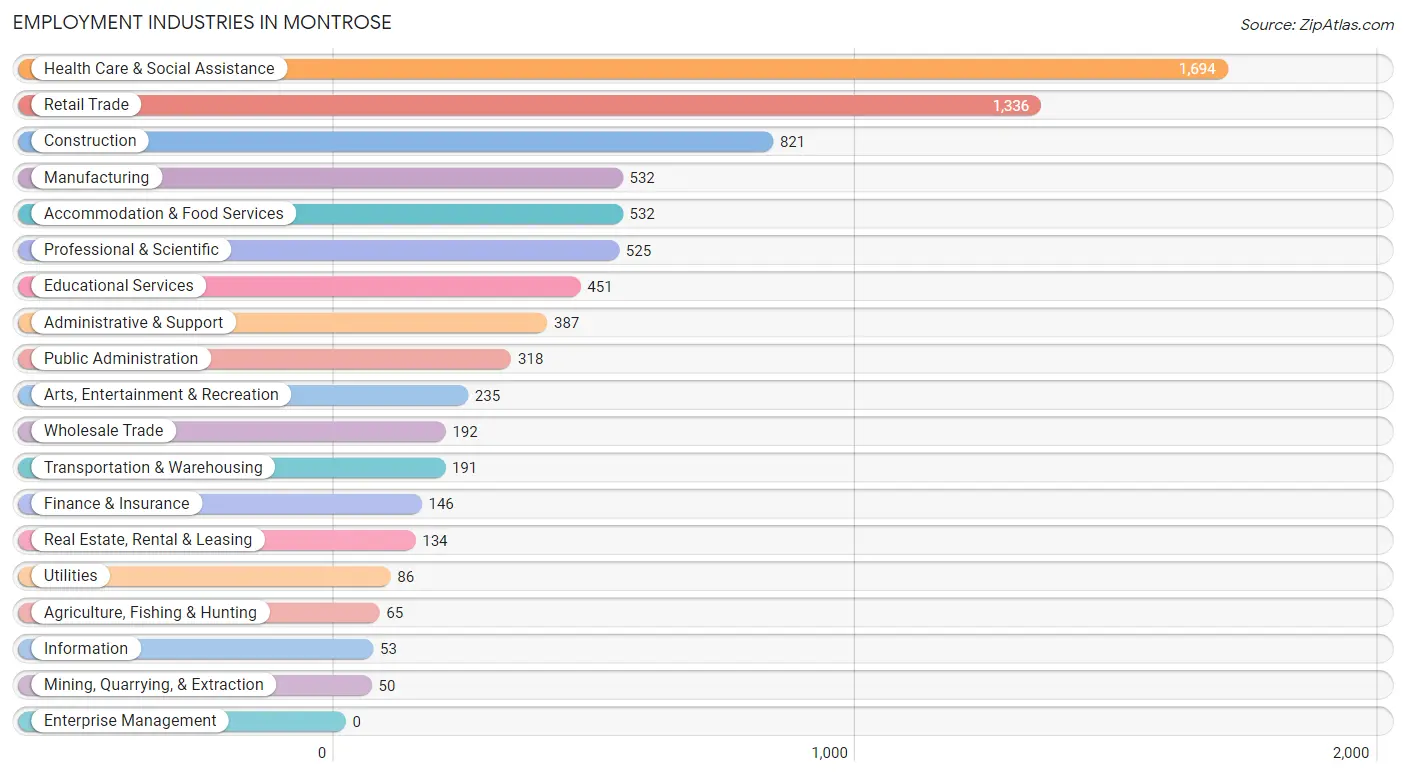
Employment Industries in Montrose
The major employment industries in Montrose include Health Care & Social Assistance (1,694 | 20.3%), Retail Trade (1,336 | 16.0%), Construction (821 | 9.9%), Manufacturing (532 | 6.4%), and Accommodation & Food Services (532 | 6.4%).
Employment Industries by Sex in Montrose
The Montrose industries that see more men than women are Agriculture, Fishing & Hunting (100.0%), Mining, Quarrying, & Extraction (100.0%), and Construction (94.6%), whereas the industries that tend to have a higher number of women are Finance & Insurance (75.3%), Health Care & Social Assistance (73.0%), and Educational Services (68.3%).
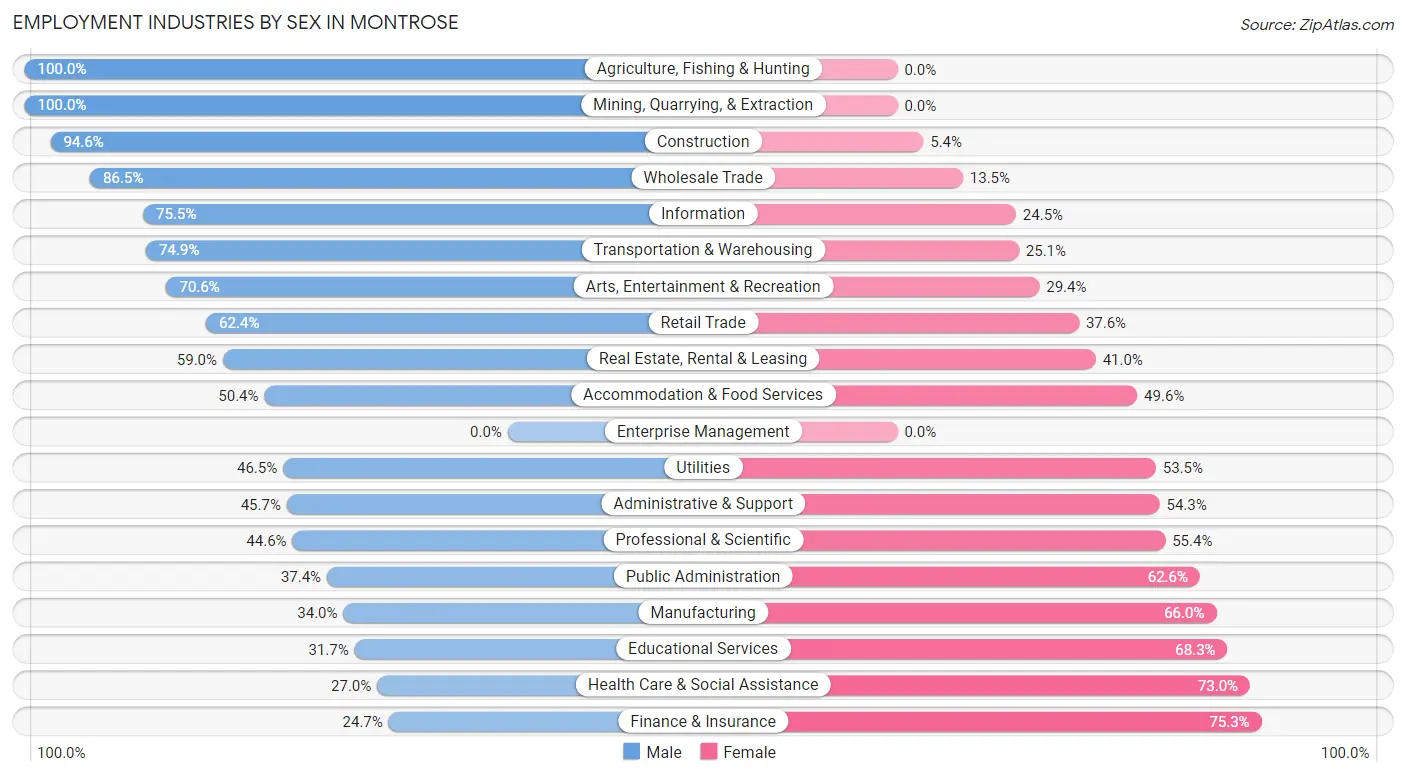
| Industry | Male | Female |
| Agriculture, Fishing & Hunting | 65 (100.0%) | 0 (0.0%) |
| Mining, Quarrying, & Extraction | 50 (100.0%) | 0 (0.0%) |
| Construction | 777 (94.6%) | 44 (5.4%) |
| Manufacturing | 181 (34.0%) | 351 (66.0%) |
| Wholesale Trade | 166 (86.5%) | 26 (13.5%) |
| Retail Trade | 834 (62.4%) | 502 (37.6%) |
| Transportation & Warehousing | 143 (74.9%) | 48 (25.1%) |
| Utilities | 40 (46.5%) | 46 (53.5%) |
| Information | 40 (75.5%) | 13 (24.5%) |
| Finance & Insurance | 36 (24.7%) | 110 (75.3%) |
| Real Estate, Rental & Leasing | 79 (59.0%) | 55 (41.0%) |
| Professional & Scientific | 234 (44.6%) | 291 (55.4%) |
| Enterprise Management | 0 (0.0%) | 0 (0.0%) |
| Administrative & Support | 177 (45.7%) | 210 (54.3%) |
| Educational Services | 143 (31.7%) | 308 (68.3%) |
| Health Care & Social Assistance | 458 (27.0%) | 1,236 (73.0%) |
| Arts, Entertainment & Recreation | 166 (70.6%) | 69 (29.4%) |
| Accommodation & Food Services | 268 (50.4%) | 264 (49.6%) |
| Public Administration | 119 (37.4%) | 199 (62.6%) |
| Total | 4,359 (52.3%) | 3,971 (47.7%) |
Education in Montrose
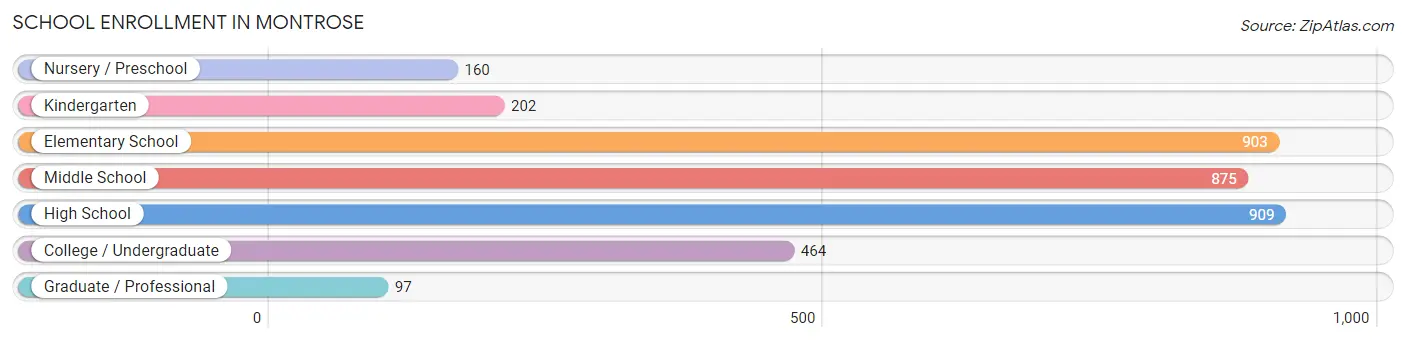
School Enrollment in Montrose
The most common levels of schooling among the 3,610 students in Montrose are high school (909 | 25.2%), elementary school (903 | 25.0%), and middle school (875 | 24.2%).
| School Level | # Students | % Students |
| Nursery / Preschool | 160 | 4.4% |
| Kindergarten | 202 | 5.6% |
| Elementary School | 903 | 25.0% |
| Middle School | 875 | 24.2% |
| High School | 909 | 25.2% |
| College / Undergraduate | 464 | 12.9% |
| Graduate / Professional | 97 | 2.7% |
| Total | 3,610 | 100.0% |
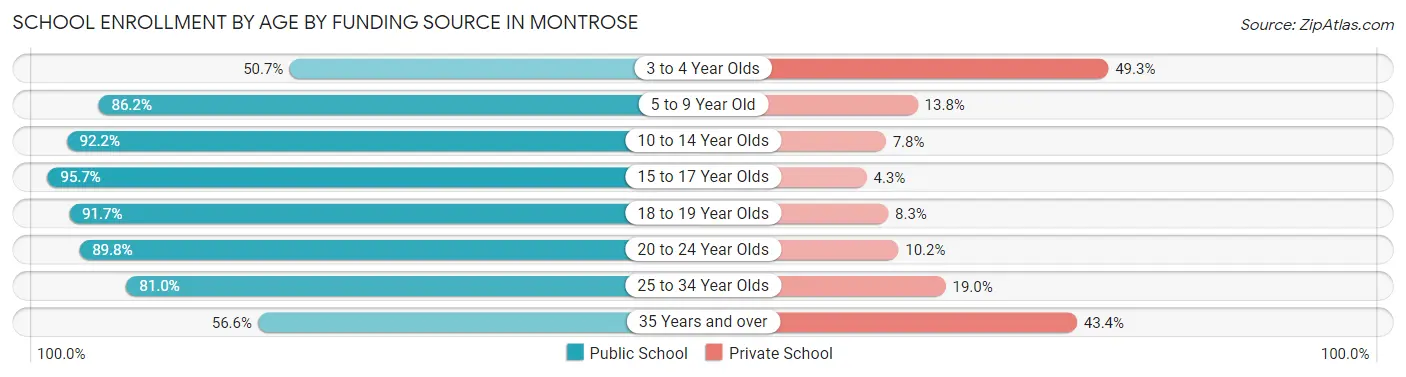
School Enrollment by Age by Funding Source in Montrose
Out of a total of 3,610 students who are enrolled in schools in Montrose, 422 (11.7%) attend a private institution, while the remaining 3,188 (88.3%) are enrolled in public schools. The age group of 3 to 4 year olds has the highest likelihood of being enrolled in private schools, with 34 (49.3% in the age bracket) enrolled. Conversely, the age group of 15 to 17 year olds has the lowest likelihood of being enrolled in a private school, with 562 (95.7% in the age bracket) attending a public institution.
| Age Bracket | Public School | Private School |
| 3 to 4 Year Olds | 35 (50.7%) | 34 (49.3%) |
| 5 to 9 Year Old | 782 (86.2%) | 125 (13.8%) |
| 10 to 14 Year Olds | 1,142 (92.2%) | 97 (7.8%) |
| 15 to 17 Year Olds | 562 (95.7%) | 25 (4.3%) |
| 18 to 19 Year Olds | 266 (91.7%) | 24 (8.3%) |
| 20 to 24 Year Olds | 256 (89.8%) | 29 (10.2%) |
| 25 to 34 Year Olds | 47 (81.0%) | 11 (19.0%) |
| 35 Years and over | 99 (56.6%) | 76 (43.4%) |
| Total | 3,188 (88.3%) | 422 (11.7%) |
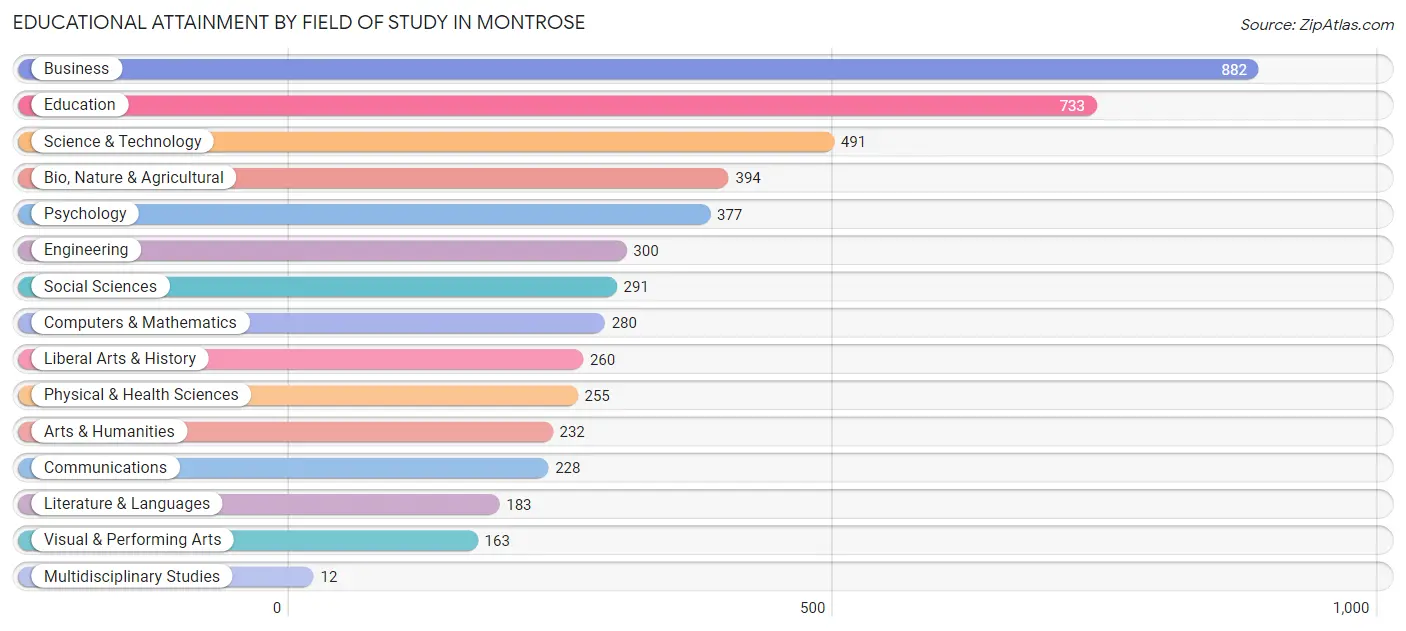
Educational Attainment by Field of Study in Montrose
Business (882 | 17.4%), education (733 | 14.4%), science & technology (491 | 9.7%), bio, nature & agricultural (394 | 7.7%), and psychology (377 | 7.4%) are the most common fields of study among 5,081 individuals in Montrose who have obtained a bachelor's degree or higher.
| Field of Study | # Graduates | % Graduates |
| Computers & Mathematics | 280 | 5.5% |
| Bio, Nature & Agricultural | 394 | 7.7% |
| Physical & Health Sciences | 255 | 5.0% |
| Psychology | 377 | 7.4% |
| Social Sciences | 291 | 5.7% |
| Engineering | 300 | 5.9% |
| Multidisciplinary Studies | 12 | 0.2% |
| Science & Technology | 491 | 9.7% |
| Business | 882 | 17.4% |
| Education | 733 | 14.4% |
| Literature & Languages | 183 | 3.6% |
| Liberal Arts & History | 260 | 5.1% |
| Visual & Performing Arts | 163 | 3.2% |
| Communications | 228 | 4.5% |
| Arts & Humanities | 232 | 4.6% |
| Total | 5,081 | 100.0% |
Transportation & Commute in Montrose
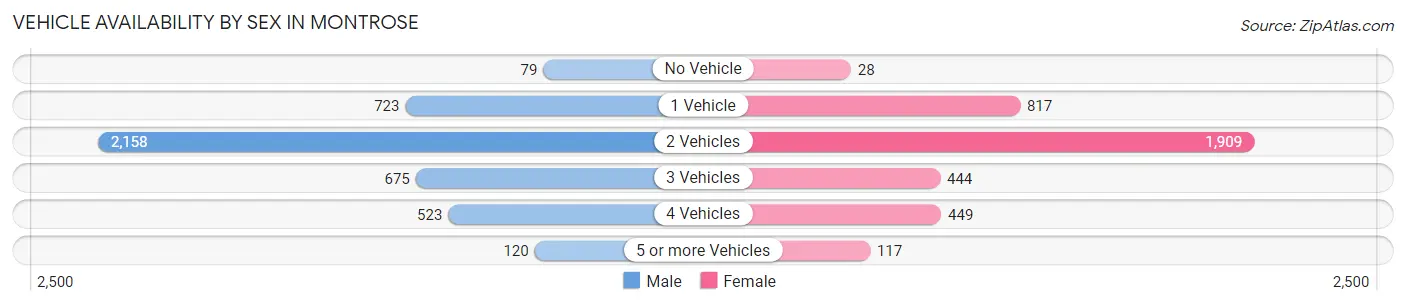
Vehicle Availability by Sex in Montrose
The most prevalent vehicle ownership categories in Montrose are males with 2 vehicles (2,158, accounting for 50.4%) and females with 2 vehicles (1,909, making up 57.3%).
| Vehicles Available | Male | Female |
| No Vehicle | 79 (1.8%) | 28 (0.7%) |
| 1 Vehicle | 723 (16.9%) | 817 (21.7%) |
| 2 Vehicles | 2,158 (50.4%) | 1,909 (50.7%) |
| 3 Vehicles | 675 (15.8%) | 444 (11.8%) |
| 4 Vehicles | 523 (12.2%) | 449 (11.9%) |
| 5 or more Vehicles | 120 (2.8%) | 117 (3.1%) |
| Total | 4,278 (100.0%) | 3,764 (100.0%) |
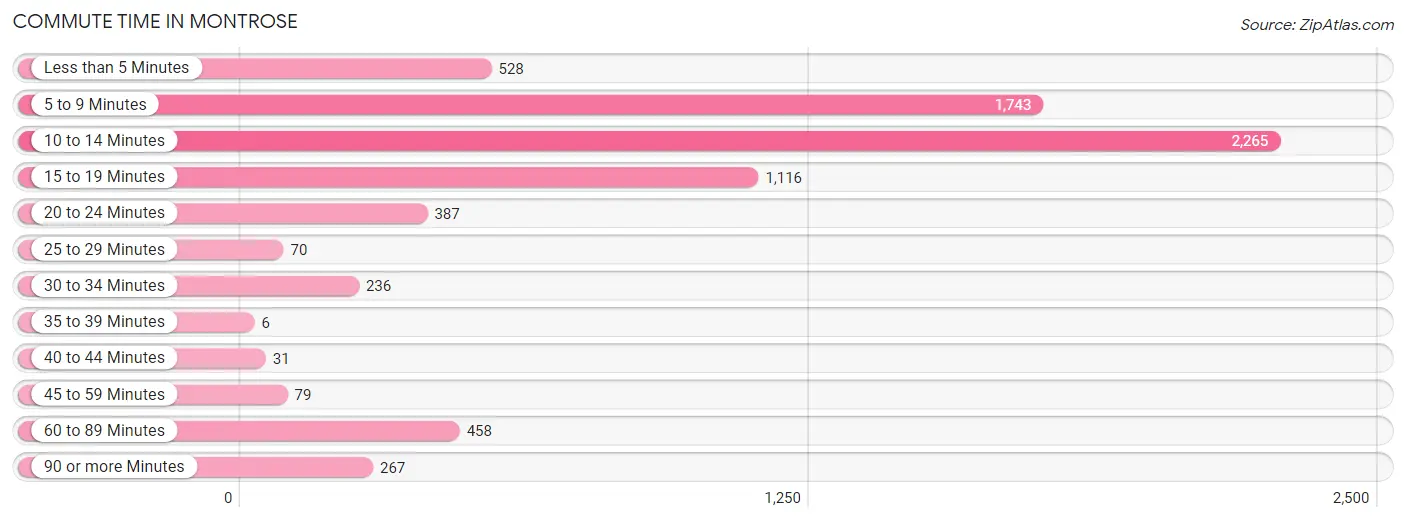
Commute Time in Montrose
The most frequently occuring commute durations in Montrose are 10 to 14 minutes (2,265 commuters, 31.5%), 5 to 9 minutes (1,743 commuters, 24.3%), and 15 to 19 minutes (1,116 commuters, 15.5%).
| Commute Time | # Commuters | % Commuters |
| Less than 5 Minutes | 528 | 7.3% |
| 5 to 9 Minutes | 1,743 | 24.3% |
| 10 to 14 Minutes | 2,265 | 31.5% |
| 15 to 19 Minutes | 1,116 | 15.5% |
| 20 to 24 Minutes | 387 | 5.4% |
| 25 to 29 Minutes | 70 | 1.0% |
| 30 to 34 Minutes | 236 | 3.3% |
| 35 to 39 Minutes | 6 | 0.1% |
| 40 to 44 Minutes | 31 | 0.4% |
| 45 to 59 Minutes | 79 | 1.1% |
| 60 to 89 Minutes | 458 | 6.4% |
| 90 or more Minutes | 267 | 3.7% |
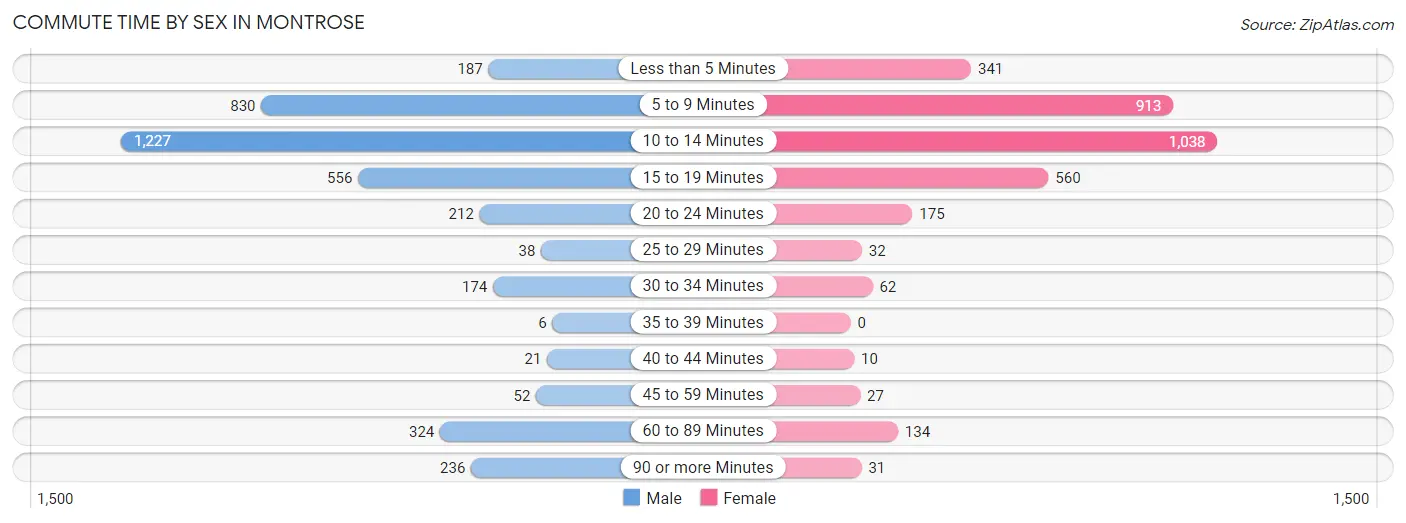
Commute Time by Sex in Montrose
The most common commute times in Montrose are 10 to 14 minutes (1,227 commuters, 31.8%) for males and 10 to 14 minutes (1,038 commuters, 31.2%) for females.
| Commute Time | Male | Female |
| Less than 5 Minutes | 187 (4.8%) | 341 (10.3%) |
| 5 to 9 Minutes | 830 (21.5%) | 913 (27.5%) |
| 10 to 14 Minutes | 1,227 (31.8%) | 1,038 (31.2%) |
| 15 to 19 Minutes | 556 (14.4%) | 560 (16.9%) |
| 20 to 24 Minutes | 212 (5.5%) | 175 (5.3%) |
| 25 to 29 Minutes | 38 (1.0%) | 32 (1.0%) |
| 30 to 34 Minutes | 174 (4.5%) | 62 (1.9%) |
| 35 to 39 Minutes | 6 (0.2%) | 0 (0.0%) |
| 40 to 44 Minutes | 21 (0.5%) | 10 (0.3%) |
| 45 to 59 Minutes | 52 (1.3%) | 27 (0.8%) |
| 60 to 89 Minutes | 324 (8.4%) | 134 (4.0%) |
| 90 or more Minutes | 236 (6.1%) | 31 (0.9%) |
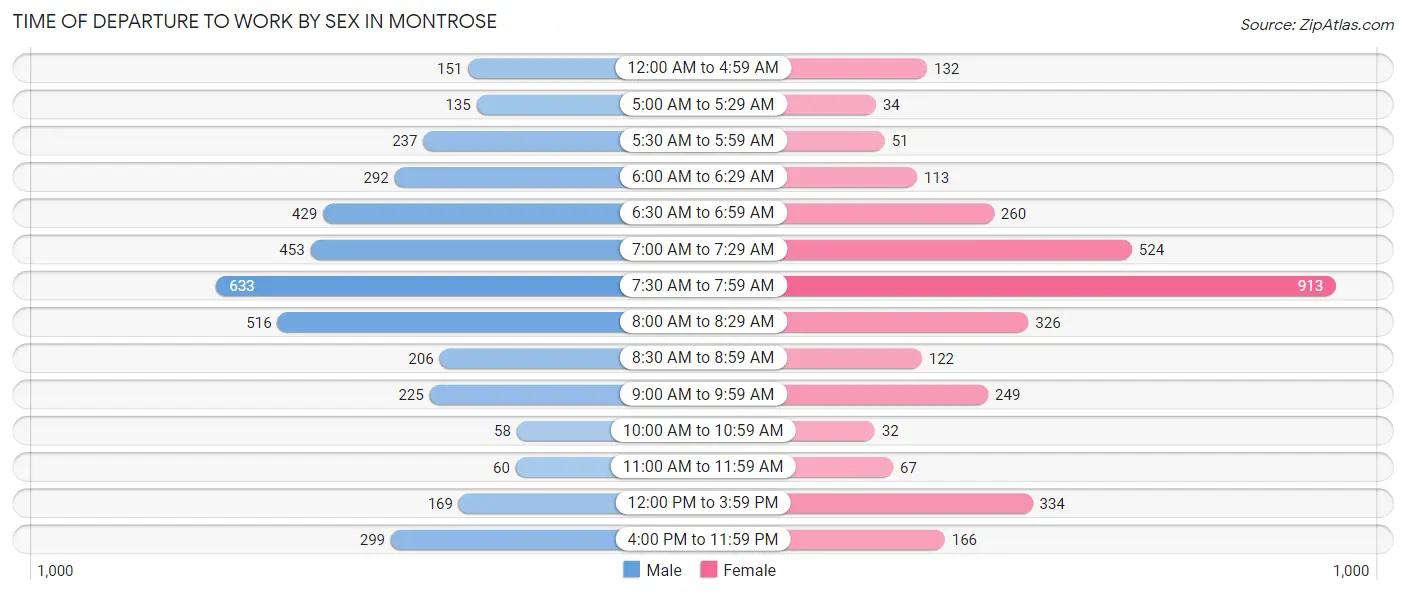
Time of Departure to Work by Sex in Montrose
The most frequent times of departure to work in Montrose are 7:30 AM to 7:59 AM (633, 16.4%) for males and 7:30 AM to 7:59 AM (913, 27.5%) for females.
| Time of Departure | Male | Female |
| 12:00 AM to 4:59 AM | 151 (3.9%) | 132 (4.0%) |
| 5:00 AM to 5:29 AM | 135 (3.5%) | 34 (1.0%) |
| 5:30 AM to 5:59 AM | 237 (6.1%) | 51 (1.5%) |
| 6:00 AM to 6:29 AM | 292 (7.6%) | 113 (3.4%) |
| 6:30 AM to 6:59 AM | 429 (11.1%) | 260 (7.8%) |
| 7:00 AM to 7:29 AM | 453 (11.7%) | 524 (15.8%) |
| 7:30 AM to 7:59 AM | 633 (16.4%) | 913 (27.5%) |
| 8:00 AM to 8:29 AM | 516 (13.4%) | 326 (9.8%) |
| 8:30 AM to 8:59 AM | 206 (5.3%) | 122 (3.7%) |
| 9:00 AM to 9:59 AM | 225 (5.8%) | 249 (7.5%) |
| 10:00 AM to 10:59 AM | 58 (1.5%) | 32 (1.0%) |
| 11:00 AM to 11:59 AM | 60 (1.5%) | 67 (2.0%) |
| 12:00 PM to 3:59 PM | 169 (4.4%) | 334 (10.1%) |
| 4:00 PM to 11:59 PM | 299 (7.7%) | 166 (5.0%) |
| Total | 3,863 (100.0%) | 3,323 (100.0%) |
Housing Occupancy in Montrose
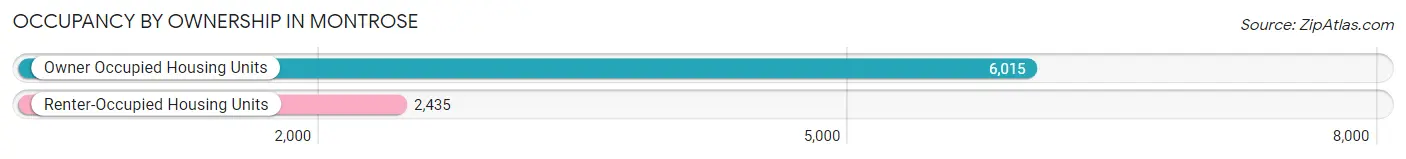
Occupancy by Ownership in Montrose
Of the total 8,450 dwellings in Montrose, owner-occupied units account for 6,015 (71.2%), while renter-occupied units make up 2,435 (28.8%).
| Occupancy | # Housing Units | % Housing Units |
| Owner Occupied Housing Units | 6,015 | 71.2% |
| Renter-Occupied Housing Units | 2,435 | 28.8% |
| Total Occupied Housing Units | 8,450 | 100.0% |
Occupancy by Household Size in Montrose
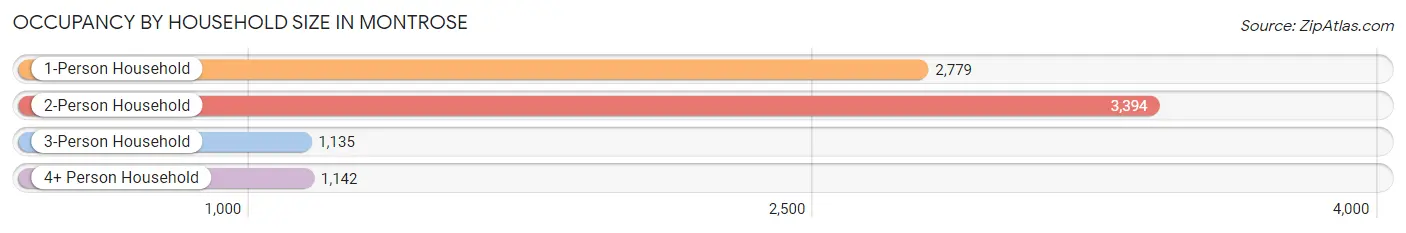
| Household Size | # Housing Units | % Housing Units |
| 1-Person Household | 2,779 | 32.9% |
| 2-Person Household | 3,394 | 40.2% |
| 3-Person Household | 1,135 | 13.4% |
| 4+ Person Household | 1,142 | 13.5% |
| Total Housing Units | 8,450 | 100.0% |
Occupancy by Ownership by Household Size in Montrose
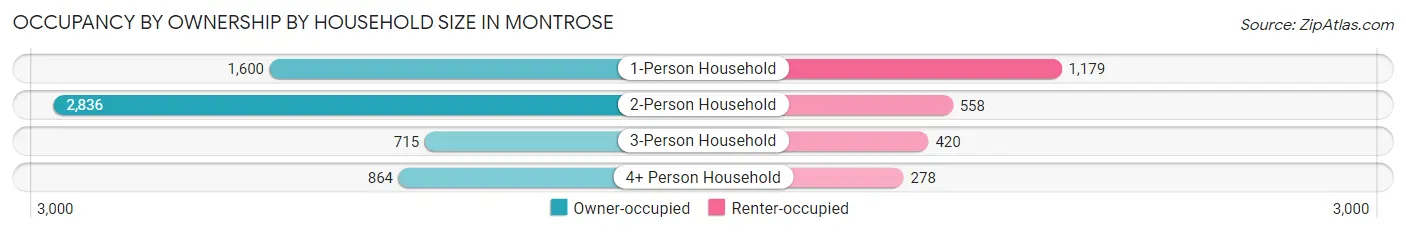
| Household Size | Owner-occupied | Renter-occupied |
| 1-Person Household | 1,600 (57.6%) | 1,179 (42.4%) |
| 2-Person Household | 2,836 (83.6%) | 558 (16.4%) |
| 3-Person Household | 715 (63.0%) | 420 (37.0%) |
| 4+ Person Household | 864 (75.7%) | 278 (24.3%) |
| Total Housing Units | 6,015 (71.2%) | 2,435 (28.8%) |
Occupancy by Educational Attainment in Montrose
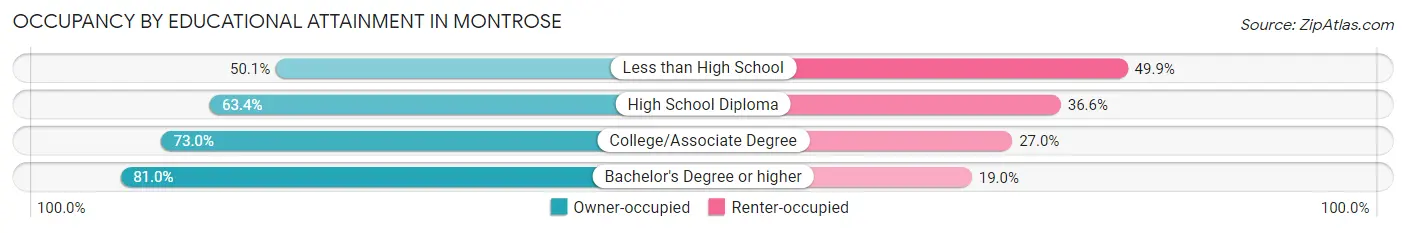
| Household Size | Owner-occupied | Renter-occupied |
| Less than High School | 368 (50.1%) | 366 (49.9%) |
| High School Diploma | 1,462 (63.4%) | 844 (36.6%) |
| College/Associate Degree | 1,817 (73.0%) | 671 (27.0%) |
| Bachelor's Degree or higher | 2,368 (81.0%) | 554 (19.0%) |
Occupancy by Age of Householder in Montrose
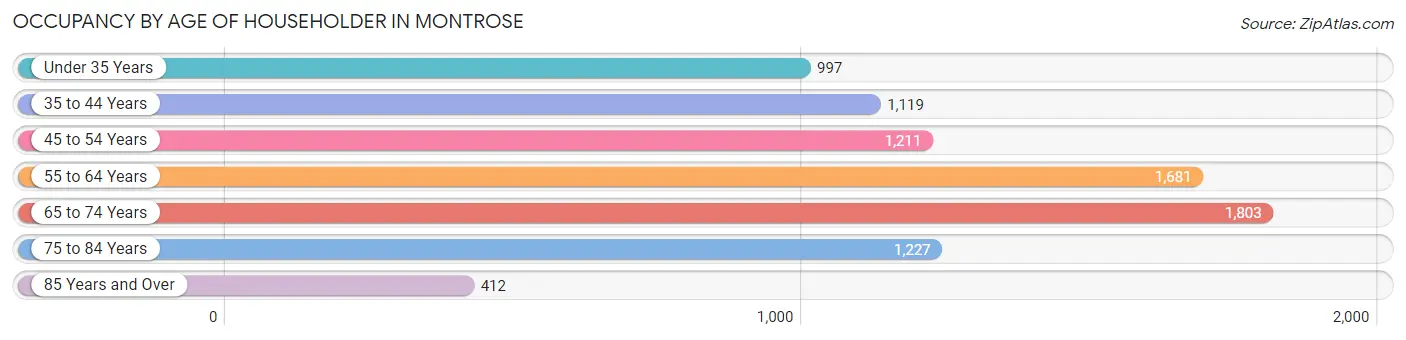
| Age Bracket | # Households | % Households |
| Under 35 Years | 997 | 11.8% |
| 35 to 44 Years | 1,119 | 13.2% |
| 45 to 54 Years | 1,211 | 14.3% |
| 55 to 64 Years | 1,681 | 19.9% |
| 65 to 74 Years | 1,803 | 21.3% |
| 75 to 84 Years | 1,227 | 14.5% |
| 85 Years and Over | 412 | 4.9% |
| Total | 8,450 | 100.0% |
Housing Finances in Montrose
Median Income by Occupancy in Montrose
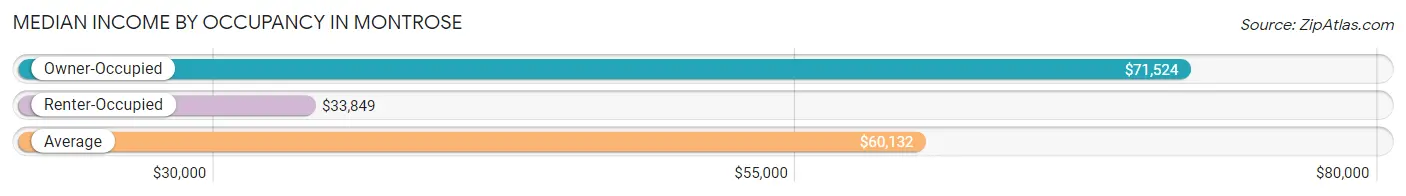
| Occupancy Type | # Households | Median Income |
| Owner-Occupied | 6,015 (71.2%) | $71,524 |
| Renter-Occupied | 2,435 (28.8%) | $33,849 |
| Average | 8,450 (100.0%) | $60,132 |
Occupancy by Householder Income Bracket in Montrose
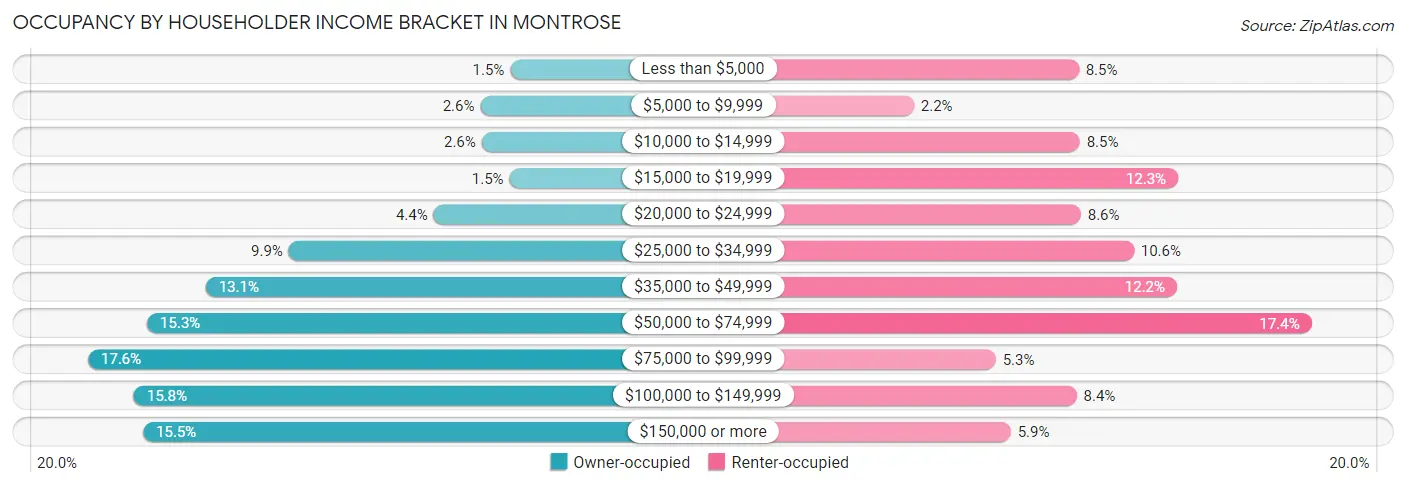
| Income Bracket | Owner-occupied | Renter-occupied |
| Less than $5,000 | 90 (1.5%) | 207 (8.5%) |
| $5,000 to $9,999 | 159 (2.6%) | 54 (2.2%) |
| $10,000 to $14,999 | 156 (2.6%) | 208 (8.5%) |
| $15,000 to $19,999 | 92 (1.5%) | 299 (12.3%) |
| $20,000 to $24,999 | 266 (4.4%) | 209 (8.6%) |
| $25,000 to $34,999 | 598 (9.9%) | 258 (10.6%) |
| $35,000 to $49,999 | 788 (13.1%) | 298 (12.2%) |
| $50,000 to $74,999 | 923 (15.3%) | 423 (17.4%) |
| $75,000 to $99,999 | 1,058 (17.6%) | 130 (5.3%) |
| $100,000 to $149,999 | 953 (15.8%) | 205 (8.4%) |
| $150,000 or more | 932 (15.5%) | 144 (5.9%) |
| Total | 6,015 (100.0%) | 2,435 (100.0%) |
Monthly Housing Cost Tiers in Montrose
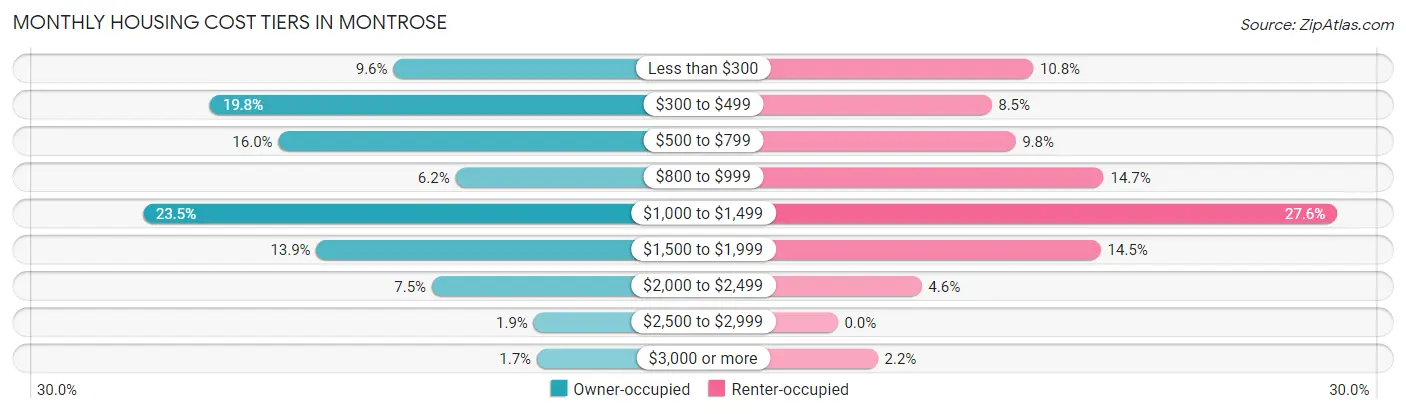
| Monthly Cost | Owner-occupied | Renter-occupied |
| Less than $300 | 579 (9.6%) | 263 (10.8%) |
| $300 to $499 | 1,189 (19.8%) | 207 (8.5%) |
| $500 to $799 | 961 (16.0%) | 239 (9.8%) |
| $800 to $999 | 373 (6.2%) | 358 (14.7%) |
| $1,000 to $1,499 | 1,412 (23.5%) | 672 (27.6%) |
| $1,500 to $1,999 | 835 (13.9%) | 354 (14.5%) |
| $2,000 to $2,499 | 451 (7.5%) | 113 (4.6%) |
| $2,500 to $2,999 | 113 (1.9%) | 0 (0.0%) |
| $3,000 or more | 102 (1.7%) | 54 (2.2%) |
| Total | 6,015 (100.0%) | 2,435 (100.0%) |
Physical Housing Characteristics in Montrose
Housing Structures in Montrose
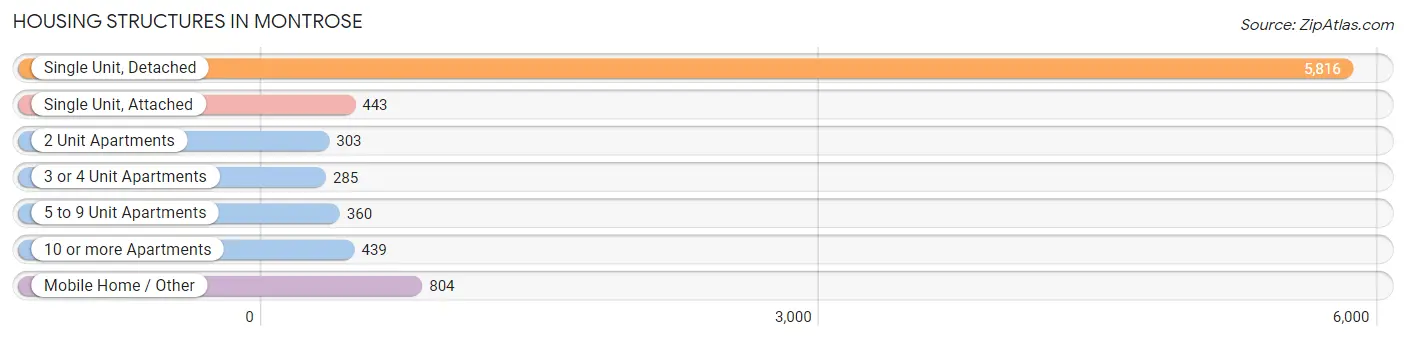
| Structure Type | # Housing Units | % Housing Units |
| Single Unit, Detached | 5,816 | 68.8% |
| Single Unit, Attached | 443 | 5.2% |
| 2 Unit Apartments | 303 | 3.6% |
| 3 or 4 Unit Apartments | 285 | 3.4% |
| 5 to 9 Unit Apartments | 360 | 4.3% |
| 10 or more Apartments | 439 | 5.2% |
| Mobile Home / Other | 804 | 9.5% |
| Total | 8,450 | 100.0% |
Housing Structures by Occupancy in Montrose
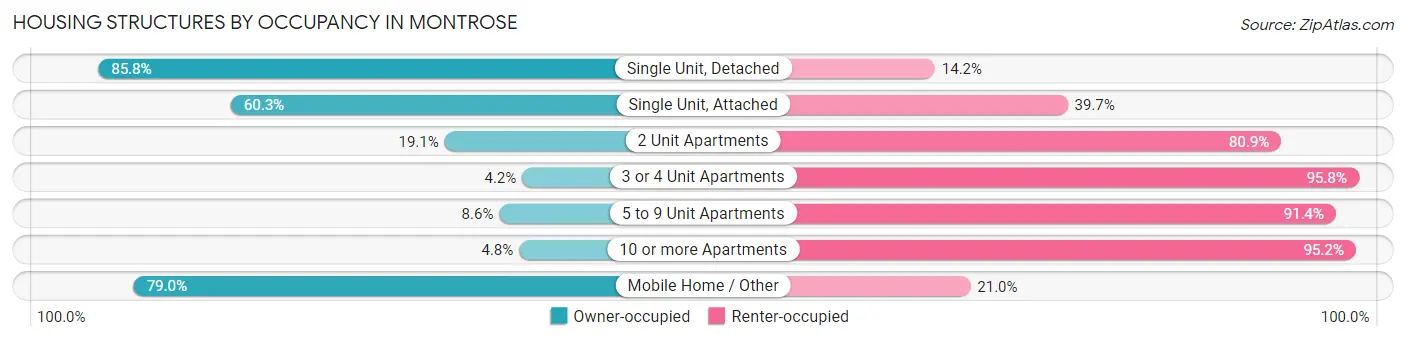
| Structure Type | Owner-occupied | Renter-occupied |
| Single Unit, Detached | 4,991 (85.8%) | 825 (14.2%) |
| Single Unit, Attached | 267 (60.3%) | 176 (39.7%) |
| 2 Unit Apartments | 58 (19.1%) | 245 (80.9%) |
| 3 or 4 Unit Apartments | 12 (4.2%) | 273 (95.8%) |
| 5 to 9 Unit Apartments | 31 (8.6%) | 329 (91.4%) |
| 10 or more Apartments | 21 (4.8%) | 418 (95.2%) |
| Mobile Home / Other | 635 (79.0%) | 169 (21.0%) |
| Total | 6,015 (71.2%) | 2,435 (28.8%) |
Housing Structures by Number of Rooms in Montrose
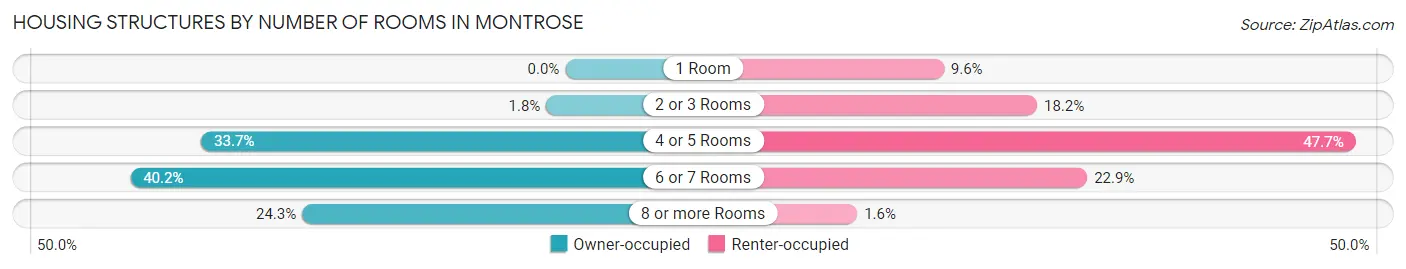
| Number of Rooms | Owner-occupied | Renter-occupied |
| 1 Room | 0 (0.0%) | 234 (9.6%) |
| 2 or 3 Rooms | 106 (1.8%) | 444 (18.2%) |
| 4 or 5 Rooms | 2,025 (33.7%) | 1,161 (47.7%) |
| 6 or 7 Rooms | 2,420 (40.2%) | 557 (22.9%) |
| 8 or more Rooms | 1,464 (24.3%) | 39 (1.6%) |
| Total | 6,015 (100.0%) | 2,435 (100.0%) |
Housing Structure by Heating Type in Montrose
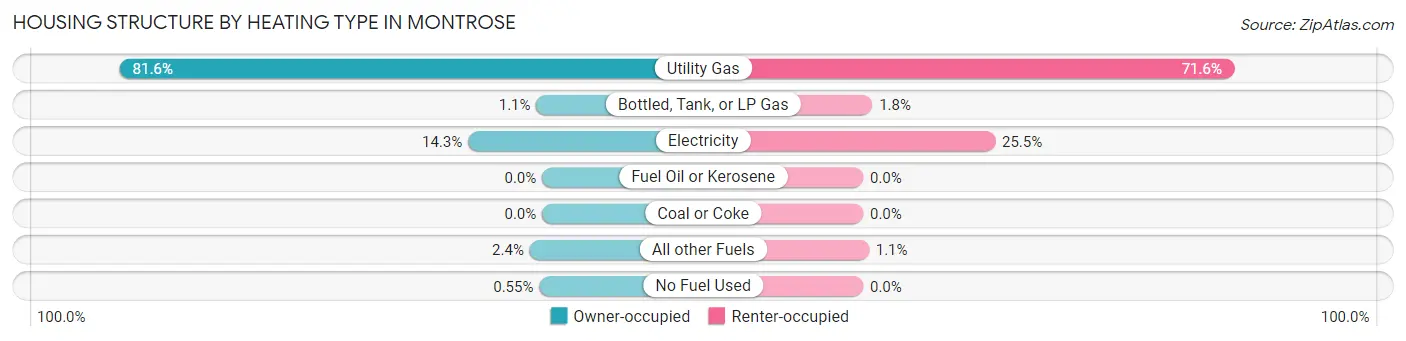
| Heating Type | Owner-occupied | Renter-occupied |
| Utility Gas | 4,910 (81.6%) | 1,744 (71.6%) |
| Bottled, Tank, or LP Gas | 67 (1.1%) | 43 (1.8%) |
| Electricity | 861 (14.3%) | 621 (25.5%) |
| Fuel Oil or Kerosene | 0 (0.0%) | 0 (0.0%) |
| Coal or Coke | 0 (0.0%) | 0 (0.0%) |
| All other Fuels | 144 (2.4%) | 27 (1.1%) |
| No Fuel Used | 33 (0.5%) | 0 (0.0%) |
| Total | 6,015 (100.0%) | 2,435 (100.0%) |
Household Vehicle Usage in Montrose
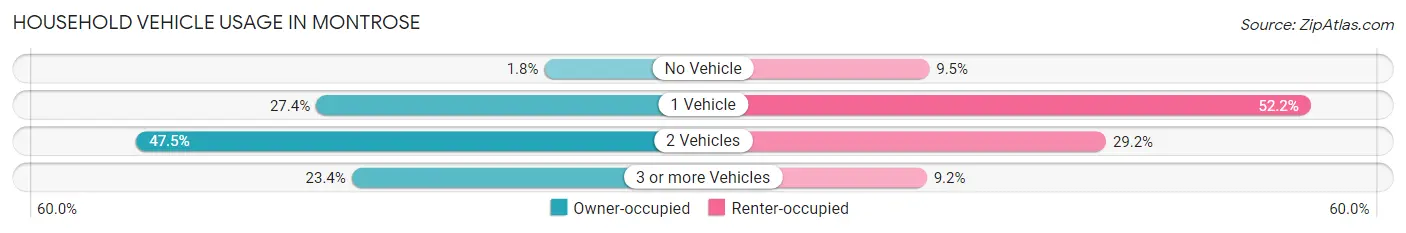
| Vehicles per Household | Owner-occupied | Renter-occupied |
| No Vehicle | 107 (1.8%) | 230 (9.5%) |
| 1 Vehicle | 1,646 (27.4%) | 1,270 (52.2%) |
| 2 Vehicles | 2,856 (47.5%) | 712 (29.2%) |
| 3 or more Vehicles | 1,406 (23.4%) | 223 (9.2%) |
| Total | 6,015 (100.0%) | 2,435 (100.0%) |
Real Estate & Mortgages in Montrose
Real Estate and Mortgage Overview in Montrose
| Characteristic | Without Mortgage | With Mortgage |
| Housing Units | 2,705 | 3,310 |
| Median Property Value | $317,700 | $317,400 |
| Median Household Income | $54,081 | $498 |
| Monthly Housing Costs | $424 | $102 |
| Real Estate Taxes | $1,200 | $19 |
Property Value by Mortgage Status in Montrose
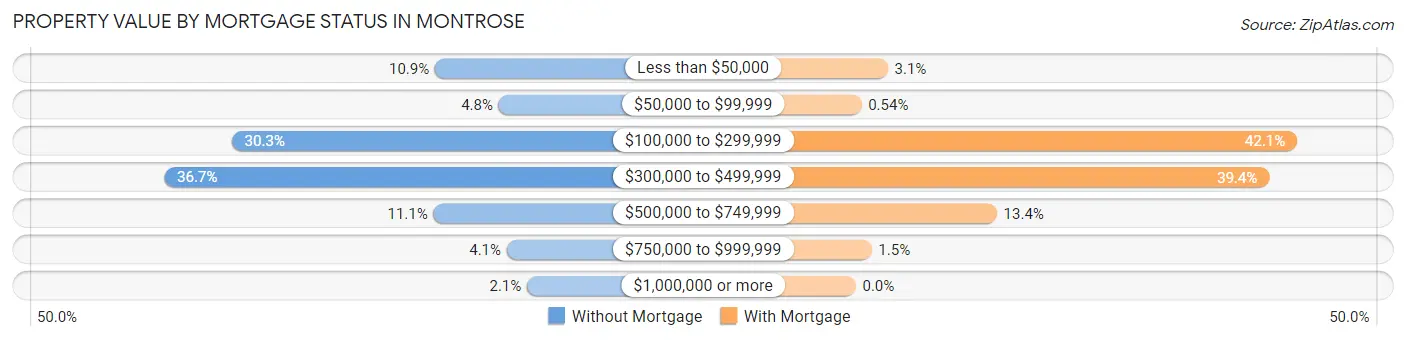
| Property Value | Without Mortgage | With Mortgage |
| Less than $50,000 | 295 (10.9%) | 101 (3.0%) |
| $50,000 to $99,999 | 131 (4.8%) | 18 (0.5%) |
| $100,000 to $299,999 | 819 (30.3%) | 1,392 (42.0%) |
| $300,000 to $499,999 | 993 (36.7%) | 1,304 (39.4%) |
| $500,000 to $749,999 | 299 (11.1%) | 445 (13.4%) |
| $750,000 to $999,999 | 110 (4.1%) | 50 (1.5%) |
| $1,000,000 or more | 58 (2.1%) | 0 (0.0%) |
| Total | 2,705 (100.0%) | 3,310 (100.0%) |
Household Income by Mortgage Status in Montrose
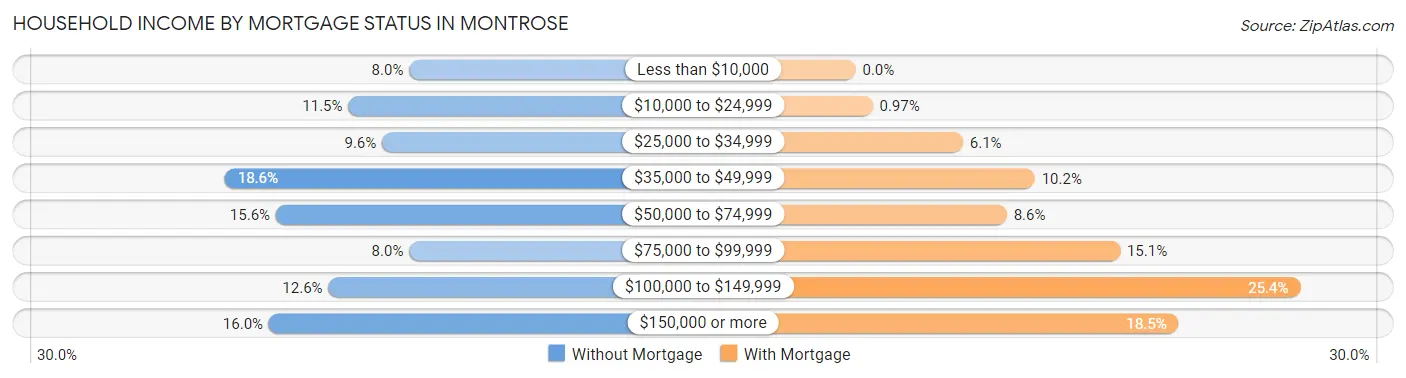
| Household Income | Without Mortgage | With Mortgage |
| Less than $10,000 | 217 (8.0%) | 0 (0.0%) |
| $10,000 to $24,999 | 311 (11.5%) | 32 (1.0%) |
| $25,000 to $34,999 | 259 (9.6%) | 203 (6.1%) |
| $35,000 to $49,999 | 502 (18.6%) | 339 (10.2%) |
| $50,000 to $74,999 | 423 (15.6%) | 286 (8.6%) |
| $75,000 to $99,999 | 217 (8.0%) | 500 (15.1%) |
| $100,000 to $149,999 | 342 (12.6%) | 841 (25.4%) |
| $150,000 or more | 434 (16.0%) | 611 (18.5%) |
| Total | 2,705 (100.0%) | 3,310 (100.0%) |
Property Value to Household Income Ratio in Montrose
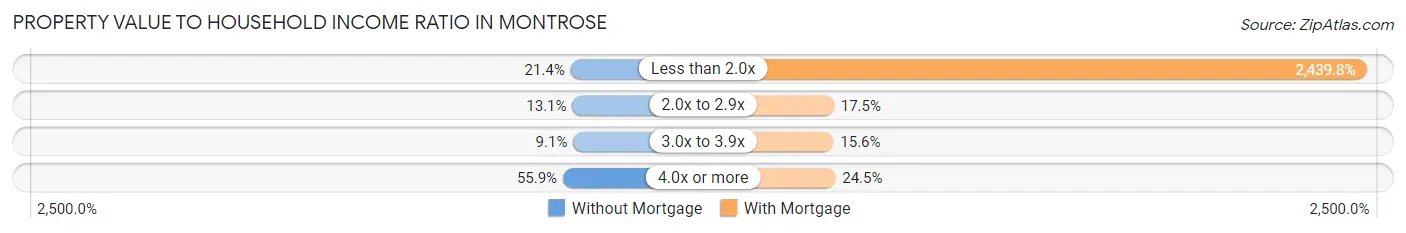
| Value-to-Income Ratio | Without Mortgage | With Mortgage |
| Less than 2.0x | 579 (21.4%) | 80,756 (2,439.8%) |
| 2.0x to 2.9x | 354 (13.1%) | 580 (17.5%) |
| 3.0x to 3.9x | 247 (9.1%) | 517 (15.6%) |
| 4.0x or more | 1,511 (55.9%) | 811 (24.5%) |
| Total | 2,705 (100.0%) | 3,310 (100.0%) |
Real Estate Taxes by Mortgage Status in Montrose
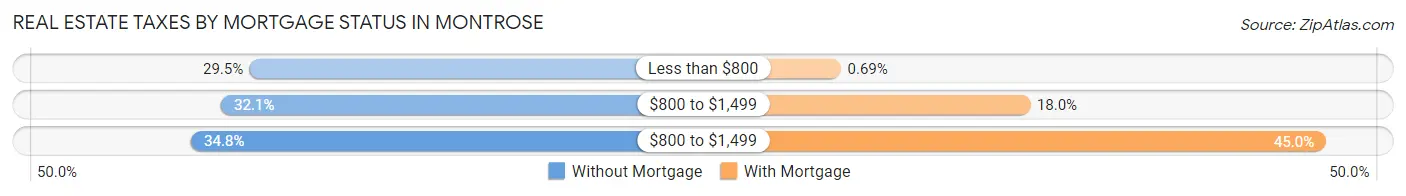
| Property Taxes | Without Mortgage | With Mortgage |
| Less than $800 | 798 (29.5%) | 23 (0.7%) |
| $800 to $1,499 | 867 (32.1%) | 595 (18.0%) |
| $800 to $1,499 | 941 (34.8%) | 1,490 (45.0%) |
| Total | 2,705 (100.0%) | 3,310 (100.0%) |
Health & Disability in Montrose
Health Insurance Coverage by Age in Montrose
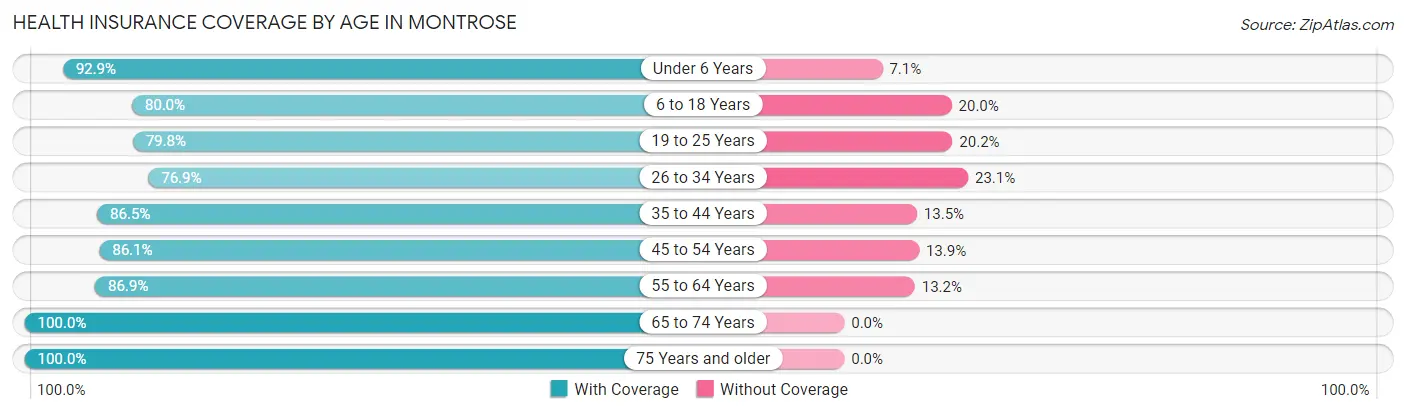
| Age Bracket | With Coverage | Without Coverage |
| Under 6 Years | 1,241 (92.9%) | 95 (7.1%) |
| 6 to 18 Years | 2,310 (80.0%) | 578 (20.0%) |
| 19 to 25 Years | 1,030 (79.8%) | 260 (20.2%) |
| 26 to 34 Years | 1,424 (76.9%) | 427 (23.1%) |
| 35 to 44 Years | 1,807 (86.5%) | 283 (13.5%) |
| 45 to 54 Years | 2,089 (86.1%) | 338 (13.9%) |
| 55 to 64 Years | 2,411 (86.9%) | 365 (13.2%) |
| 65 to 74 Years | 2,905 (100.0%) | 0 (0.0%) |
| 75 Years and older | 2,507 (100.0%) | 0 (0.0%) |
| Total | 17,724 (88.3%) | 2,346 (11.7%) |
Health Insurance Coverage by Citizenship Status in Montrose
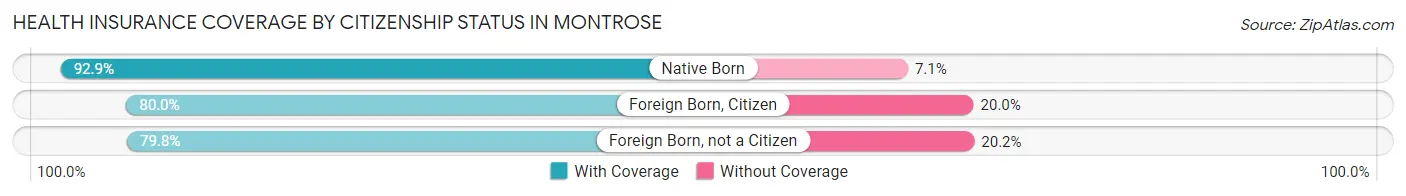
| Citizenship Status | With Coverage | Without Coverage |
| Native Born | 1,241 (92.9%) | 95 (7.1%) |
| Foreign Born, Citizen | 2,310 (80.0%) | 578 (20.0%) |
| Foreign Born, not a Citizen | 1,030 (79.8%) | 260 (20.2%) |
Health Insurance Coverage by Household Income in Montrose
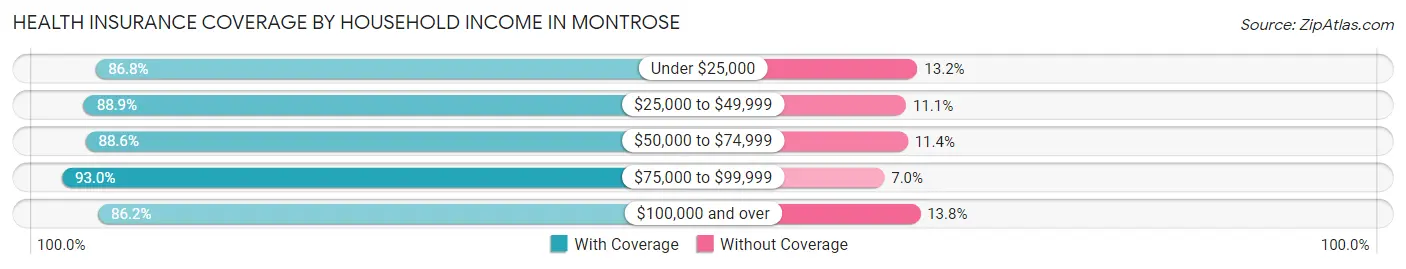
| Household Income | With Coverage | Without Coverage |
| Under $25,000 | 2,367 (86.8%) | 361 (13.2%) |
| $25,000 to $49,999 | 3,315 (88.9%) | 414 (11.1%) |
| $50,000 to $74,999 | 2,909 (88.6%) | 375 (11.4%) |
| $75,000 to $99,999 | 2,821 (93.0%) | 213 (7.0%) |
| $100,000 and over | 6,159 (86.2%) | 983 (13.8%) |
Public vs Private Health Insurance Coverage by Age in Montrose
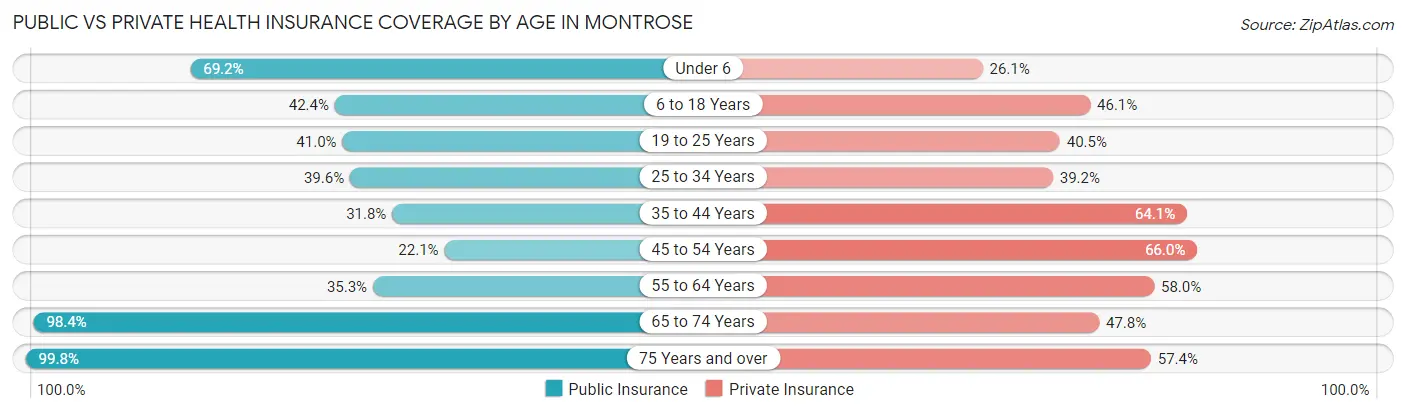
| Age Bracket | Public Insurance | Private Insurance |
| Under 6 | 925 (69.2%) | 349 (26.1%) |
| 6 to 18 Years | 1,225 (42.4%) | 1,331 (46.1%) |
| 19 to 25 Years | 529 (41.0%) | 522 (40.5%) |
| 25 to 34 Years | 733 (39.6%) | 725 (39.2%) |
| 35 to 44 Years | 664 (31.8%) | 1,339 (64.1%) |
| 45 to 54 Years | 536 (22.1%) | 1,601 (66.0%) |
| 55 to 64 Years | 981 (35.3%) | 1,609 (58.0%) |
| 65 to 74 Years | 2,857 (98.4%) | 1,387 (47.7%) |
| 75 Years and over | 2,502 (99.8%) | 1,438 (57.4%) |
| Total | 10,952 (54.6%) | 10,301 (51.3%) |
Disability Status by Sex by Age in Montrose
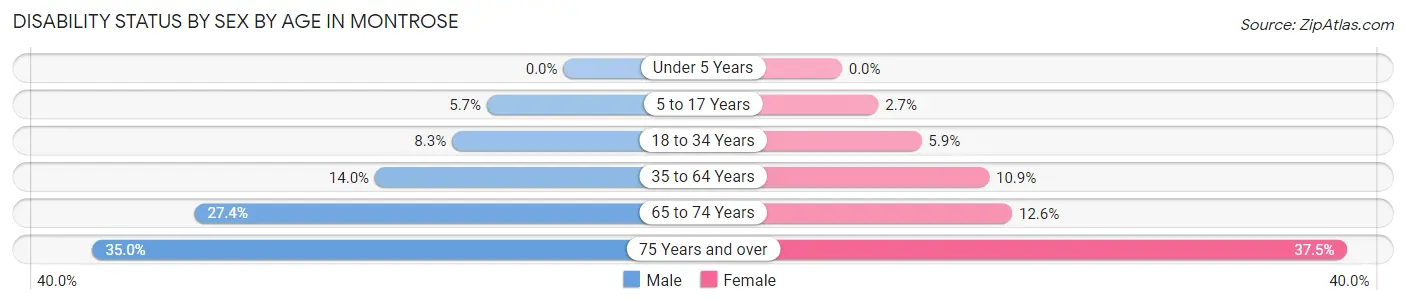
| Age Bracket | Male | Female |
| Under 5 Years | 0 (0.0%) | 0 (0.0%) |
| 5 to 17 Years | 77 (5.7%) | 42 (2.7%) |
| 18 to 34 Years | 132 (8.3%) | 103 (5.9%) |
| 35 to 64 Years | 451 (14.0%) | 445 (10.9%) |
| 65 to 74 Years | 412 (27.4%) | 177 (12.6%) |
| 75 Years and over | 337 (35.0%) | 578 (37.5%) |
Disability Class by Sex by Age in Montrose
Disability Class: Hearing Difficulty
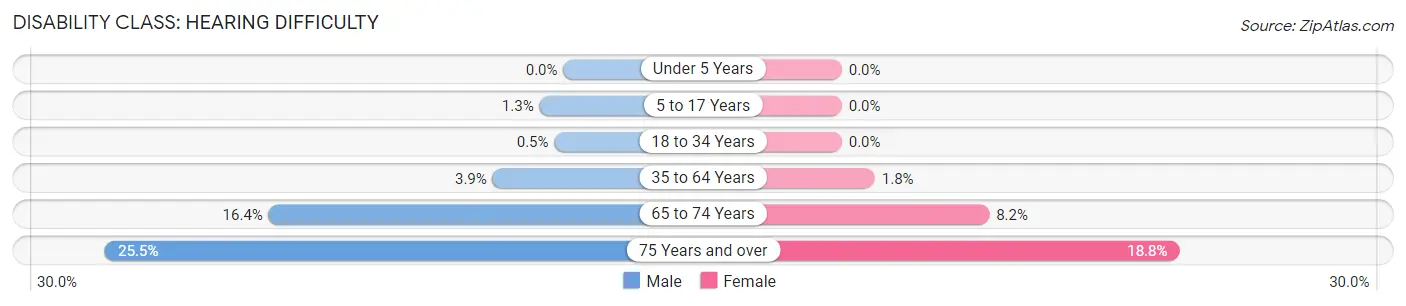
| Age Bracket | Male | Female |
| Under 5 Years | 0 (0.0%) | 0 (0.0%) |
| 5 to 17 Years | 18 (1.3%) | 0 (0.0%) |
| 18 to 34 Years | 8 (0.5%) | 0 (0.0%) |
| 35 to 64 Years | 127 (3.9%) | 75 (1.8%) |
| 65 to 74 Years | 247 (16.4%) | 115 (8.2%) |
| 75 Years and over | 246 (25.5%) | 290 (18.8%) |
Disability Class: Vision Difficulty
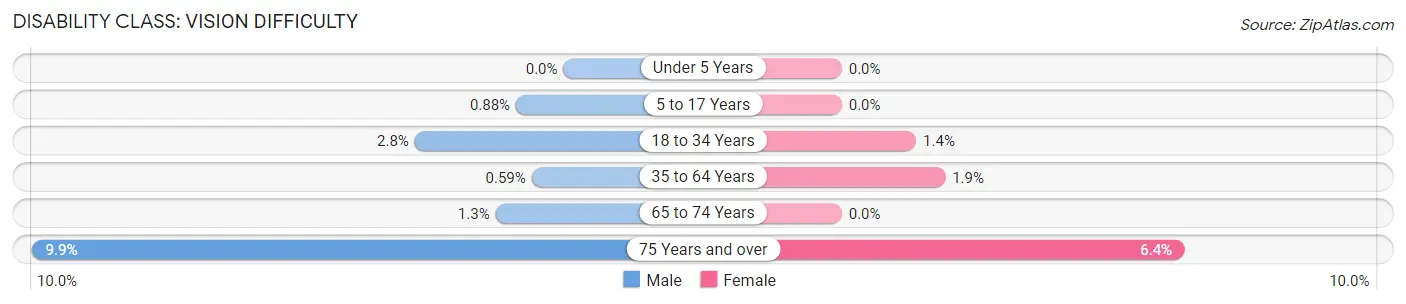
| Age Bracket | Male | Female |
| Under 5 Years | 0 (0.0%) | 0 (0.0%) |
| 5 to 17 Years | 12 (0.9%) | 0 (0.0%) |
| 18 to 34 Years | 44 (2.8%) | 24 (1.4%) |
| 35 to 64 Years | 19 (0.6%) | 78 (1.9%) |
| 65 to 74 Years | 19 (1.3%) | 0 (0.0%) |
| 75 Years and over | 95 (9.9%) | 98 (6.4%) |
Disability Class: Cognitive Difficulty
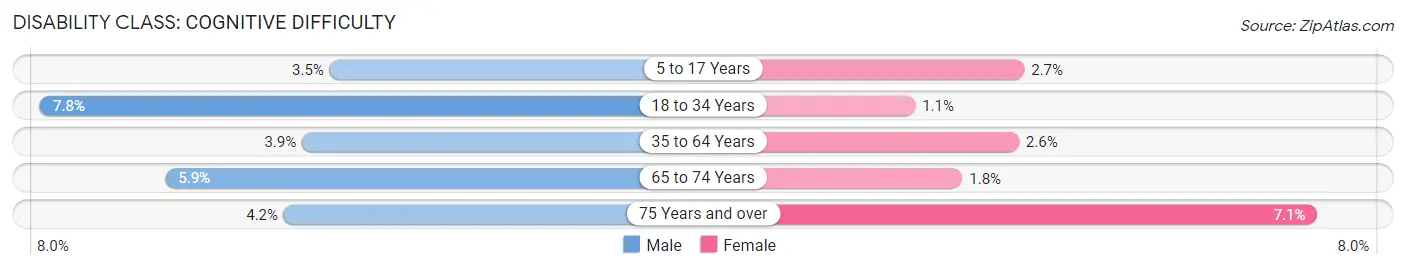
| Age Bracket | Male | Female |
| 5 to 17 Years | 47 (3.5%) | 42 (2.7%) |
| 18 to 34 Years | 124 (7.8%) | 19 (1.1%) |
| 35 to 64 Years | 125 (3.9%) | 107 (2.6%) |
| 65 to 74 Years | 89 (5.9%) | 25 (1.8%) |
| 75 Years and over | 40 (4.2%) | 109 (7.1%) |
Disability Class: Ambulatory Difficulty
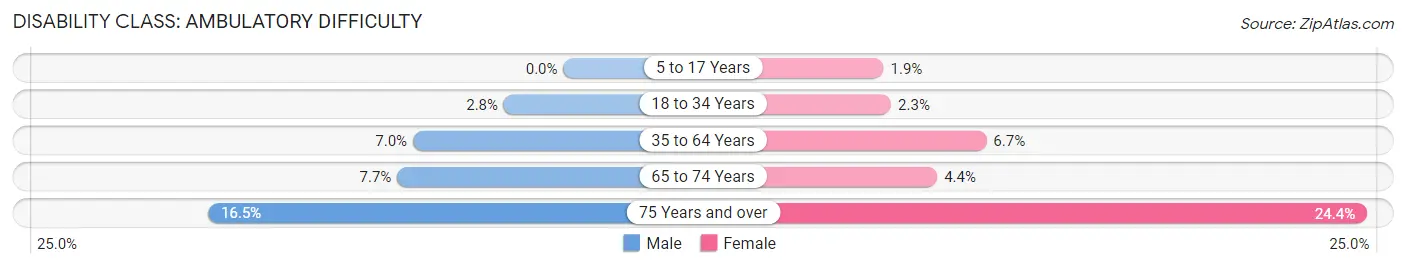
| Age Bracket | Male | Female |
| 5 to 17 Years | 0 (0.0%) | 30 (1.9%) |
| 18 to 34 Years | 44 (2.8%) | 40 (2.3%) |
| 35 to 64 Years | 225 (7.0%) | 273 (6.7%) |
| 65 to 74 Years | 116 (7.7%) | 62 (4.4%) |
| 75 Years and over | 159 (16.5%) | 376 (24.4%) |
Disability Class: Self-Care Difficulty
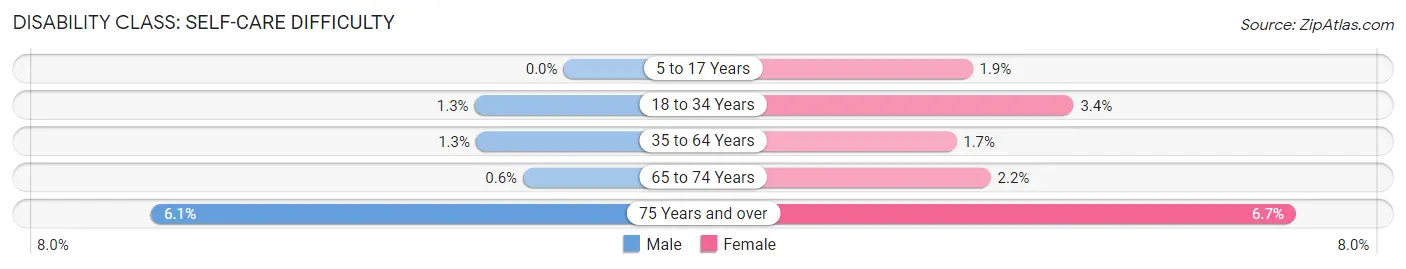
| Age Bracket | Male | Female |
| 5 to 17 Years | 0 (0.0%) | 30 (1.9%) |
| 18 to 34 Years | 21 (1.3%) | 60 (3.4%) |
| 35 to 64 Years | 42 (1.3%) | 69 (1.7%) |
| 65 to 74 Years | 9 (0.6%) | 31 (2.2%) |
| 75 Years and over | 59 (6.1%) | 104 (6.7%) |
Technology Access in Montrose
Computing Device Access in Montrose
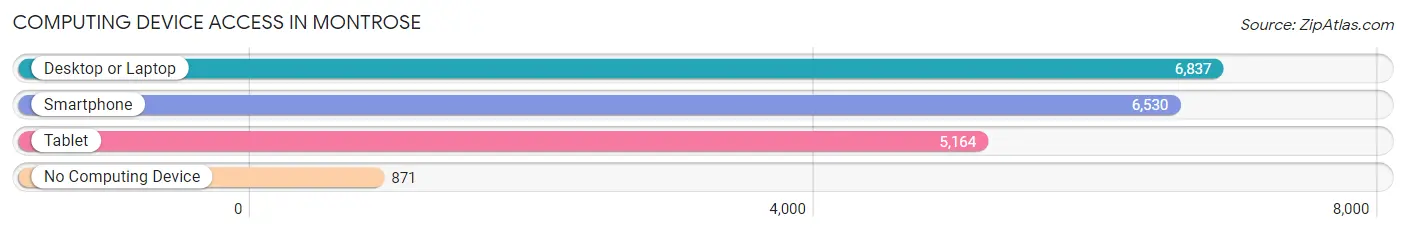
| Device Type | # Households | % Households |
| Desktop or Laptop | 6,837 | 80.9% |
| Smartphone | 6,530 | 77.3% |
| Tablet | 5,164 | 61.1% |
| No Computing Device | 871 | 10.3% |
| Total | 8,450 | 100.0% |
Internet Access in Montrose
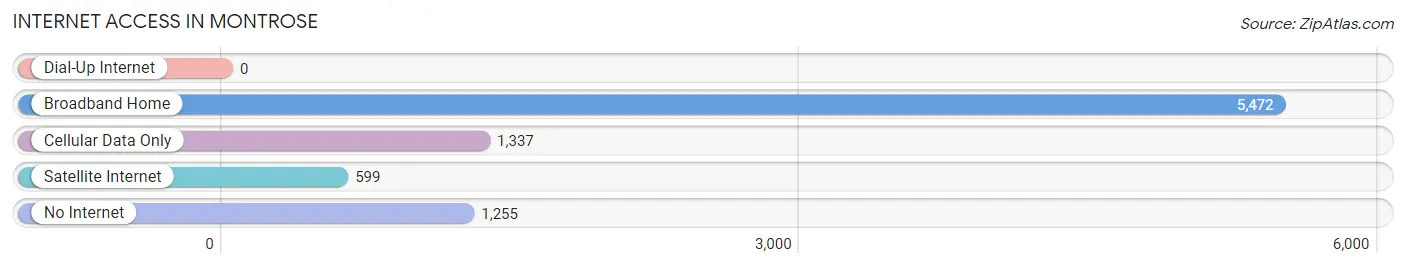
| Internet Type | # Households | % Households |
| Dial-Up Internet | 0 | 0.0% |
| Broadband Home | 5,472 | 64.8% |
| Cellular Data Only | 1,337 | 15.8% |
| Satellite Internet | 599 | 7.1% |
| No Internet | 1,255 | 14.8% |
| Total | 8,450 | 100.0% |
Montrose Summary
Montrose, Colorado is a small city located in the western part of the state, in the heart of the Uncompahgre Valley. It is the county seat of Montrose County and is situated at the confluence of the Uncompahgre and San Miguel Rivers. The city is located at an elevation of 5,858 feet and has a population of 19,132 as of the 2010 census.
History
The area that is now Montrose was first inhabited by the Ute Indians, who used the area as a summer hunting ground. The first white settlers arrived in the area in the late 1860s, and the town of Montrose was officially founded in 1882. The town was named after Sir Walter Scott’s novel, “The Lady of the Lake”, which featured a character named Montrose.
The town quickly grew and by the early 1900s, it had become a major agricultural center, with a variety of crops being grown in the area. The town also became a major railroad hub, with the Denver and Rio Grande Western Railroad running through the town.
In the 1950s, the town began to experience a population boom, as people moved to the area to take advantage of the booming agricultural industry. The population continued to grow throughout the 1960s and 1970s, and by the 1980s, the town had become a major tourist destination, with a variety of outdoor activities available in the area.
Geography
Montrose is located in the western part of Colorado, in the heart of the Uncompahgre Valley. The city is situated at the confluence of the Uncompahgre and San Miguel Rivers, and is surrounded by the San Juan Mountains to the west and the Grand Mesa to the east. The city is located at an elevation of 5,858 feet and has a total area of 8.3 square miles.
The climate in Montrose is semi-arid, with hot summers and cold winters. The average high temperature in the summer is around 85 degrees Fahrenheit, while the average low temperature in the winter is around 15 degrees Fahrenheit.
Economy
Montrose’s economy is largely based on agriculture, tourism, and energy production. The city is home to a variety of agricultural businesses, including dairy farms, cattle ranches, and fruit orchards. The city is also home to a variety of tourist attractions, including the Black Canyon of the Gunnison National Park, the Uncompahgre National Forest, and the Grand Mesa National Forest.
The city is also home to a variety of energy production facilities, including coal-fired power plants, natural gas processing plants, and oil and gas production facilities. The city is also home to a variety of manufacturing businesses, including food processing plants, metal fabrication plants, and plastics manufacturing plants.
Demographics
As of the 2010 census, the population of Montrose was 19,132. The racial makeup of the city was 87.3% White, 0.7% African American, 1.2% Native American, 0.7% Asian, 0.1% Pacific Islander, 8.2% from other races, and 2.0% from two or more races. Hispanic or Latino of any race were 16.7% of the population.
The median income for a household in the city was $37,945, and the median income for a family was $45,945. The per capita income for the city was $20,945. About 13.2% of families and 17.2% of the population were below the poverty line, including 25.2% of those under age 18 and 8.2% of those age 65 or over.
Common Questions
What is Per Capita Income in Montrose?
Per Capita income in Montrose is $36,241.
What is the Median Family Income in Montrose?
Median Family Income in Montrose is $79,920.
What is the Median Household income in Montrose?
Median Household Income in Montrose is $60,132.
What is Income or Wage Gap in Montrose?
Income or Wage Gap in Montrose is 12.7%.
Women in Montrose earn 87.3 cents for every dollar earned by a man.
What is Inequality or Gini Index in Montrose?
Inequality or Gini Index in Montrose is 0.48.
What is the Total Population of Montrose?
Total Population of Montrose is 20,394.
What is the Total Male Population of Montrose?
Total Male Population of Montrose is 9,418.
What is the Total Female Population of Montrose?
Total Female Population of Montrose is 10,976.
What is the Ratio of Males per 100 Females in Montrose?
There are 85.81 Males per 100 Females in Montrose.
What is the Ratio of Females per 100 Males in Montrose?
There are 116.54 Females per 100 Males in Montrose.
What is the Median Population Age in Montrose?
Median Population Age in Montrose is 48.7 Years.
What is the Average Family Size in Montrose
Average Family Size in Montrose is 3.0 People.
What is the Average Household Size in Montrose
Average Household Size in Montrose is 2.4 People.
How Large is the Labor Force in Montrose?
There are 8,839 People in the Labor Forcein in Montrose.
What is the Percentage of People in the Labor Force in Montrose?
52.9% of People are in the Labor Force in Montrose.
What is the Unemployment Rate in Montrose?
Unemployment Rate in Montrose is 5.1%.