Shepherd, MT Map & Demographics
Shepherd Map
Shepherd Overview
$41,144
PER CAPITA INCOME
$149,800
AVG FAMILY INCOME
$125,179
AVG HOUSEHOLD INCOME
0.38
INEQUALITY / GINI INDEX
772
TOTAL POPULATION
374
MALE POPULATION
398
FEMALE POPULATION
93.97
MALES / 100 FEMALES
106.42
FEMALES / 100 MALES
40.5
MEDIAN AGE
3.5
AVG FAMILY SIZE
2.8
AVG HOUSEHOLD SIZE
394
LABOR FORCE [ PEOPLE ]
73.9%
PERCENT IN LABOR FORCE
6.3%
UNEMPLOYMENT RATE
Shepherd Zip Codes
Shepherd Area Codes
Income in Shepherd
Income Overview in Shepherd
Per Capita Income in Shepherd is $41,144, while median incomes of families and households are $149,800 and $125,179 respectively.
| Characteristic | Number | Measure |
| Per Capita Income | 772 | $41,144 |
| Median Family Income | 198 | $149,800 |
| Mean Family Income | 198 | $150,782 |
| Median Household Income | 275 | $125,179 |
| Mean Household Income | 275 | $121,248 |
| Income Deficit | 198 | $0 |
| Wage / Income Gap (%) | 772 | 0.00% |
| Wage / Income Gap ($) | 772 | 100.00¢ per $1 |
| Gini / Inequality Index | 772 | 0.38 |
Earnings by Sex in Shepherd
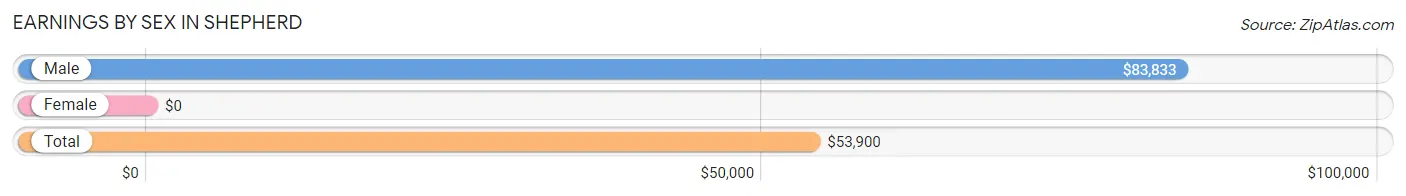
| Sex | Number | Average Earnings |
| Male | 208 (50.0%) | $83,833 |
| Female | 208 (50.0%) | $0 |
| Total | 416 (100.0%) | $53,900 |
Earnings by Sex by Income Bracket in Shepherd
The most common earnings brackets in Shepherd are $100,000+ for men (67 | 32.2%) and $75,000 to $99,999 for women (52 | 25.0%).
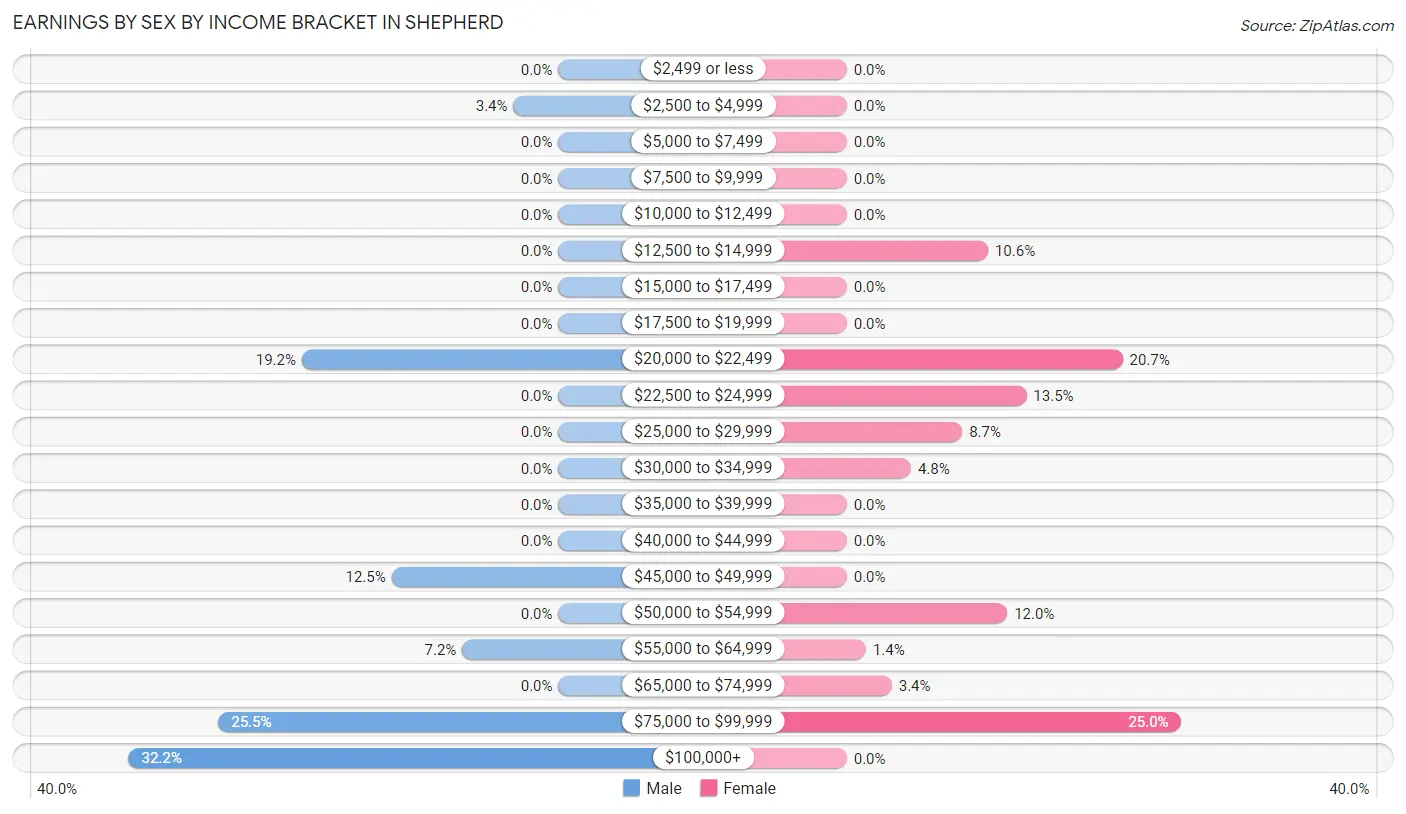
| Income | Male | Female |
| $2,499 or less | 0 (0.0%) | 0 (0.0%) |
| $2,500 to $4,999 | 7 (3.4%) | 0 (0.0%) |
| $5,000 to $7,499 | 0 (0.0%) | 0 (0.0%) |
| $7,500 to $9,999 | 0 (0.0%) | 0 (0.0%) |
| $10,000 to $12,499 | 0 (0.0%) | 0 (0.0%) |
| $12,500 to $14,999 | 0 (0.0%) | 22 (10.6%) |
| $15,000 to $17,499 | 0 (0.0%) | 0 (0.0%) |
| $17,500 to $19,999 | 0 (0.0%) | 0 (0.0%) |
| $20,000 to $22,499 | 40 (19.2%) | 43 (20.7%) |
| $22,500 to $24,999 | 0 (0.0%) | 28 (13.5%) |
| $25,000 to $29,999 | 0 (0.0%) | 18 (8.6%) |
| $30,000 to $34,999 | 0 (0.0%) | 10 (4.8%) |
| $35,000 to $39,999 | 0 (0.0%) | 0 (0.0%) |
| $40,000 to $44,999 | 0 (0.0%) | 0 (0.0%) |
| $45,000 to $49,999 | 26 (12.5%) | 0 (0.0%) |
| $50,000 to $54,999 | 0 (0.0%) | 25 (12.0%) |
| $55,000 to $64,999 | 15 (7.2%) | 3 (1.4%) |
| $65,000 to $74,999 | 0 (0.0%) | 7 (3.4%) |
| $75,000 to $99,999 | 53 (25.5%) | 52 (25.0%) |
| $100,000+ | 67 (32.2%) | 0 (0.0%) |
| Total | 208 (100.0%) | 208 (100.0%) |
Earnings by Sex by Educational Attainment in Shepherd
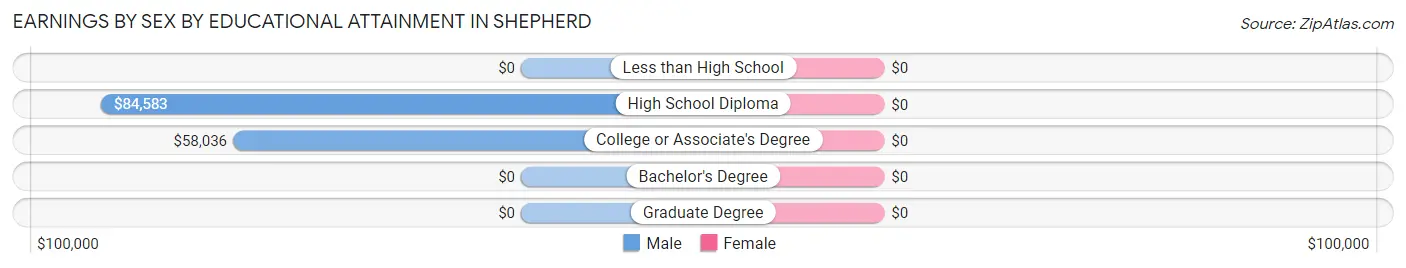
| Educational Attainment | Male Income | Female Income |
| Less than High School | - | - |
| High School Diploma | $84,583 | $0 |
| College or Associate's Degree | $58,036 | $0 |
| Bachelor's Degree | - | - |
| Graduate Degree | - | - |
| Total | $85,000 | $0 |
Family Income in Shepherd
Family Income Brackets in Shepherd
According to the Shepherd family income data, there are 79 families falling into the $150,000 to $199,999 income range, which is the most common income bracket and makes up 39.9% of all families.
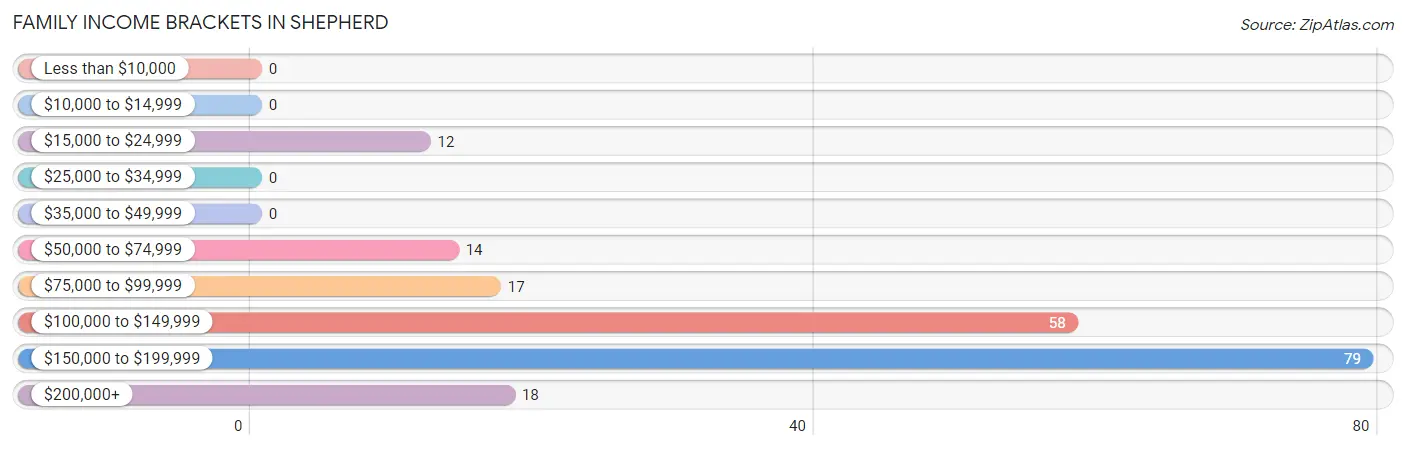
| Income Bracket | # Families | % Families |
| Less than $10,000 | 0 | 0.0% |
| $10,000 to $14,999 | 0 | 0.0% |
| $15,000 to $24,999 | 12 | 6.1% |
| $25,000 to $34,999 | 0 | 0.0% |
| $35,000 to $49,999 | 0 | 0.0% |
| $50,000 to $74,999 | 14 | 7.1% |
| $75,000 to $99,999 | 17 | 8.6% |
| $100,000 to $149,999 | 58 | 29.3% |
| $150,000 to $199,999 | 79 | 39.9% |
| $200,000+ | 18 | 9.1% |
Family Income by Famaliy Size in Shepherd
2-person families (94 | 47.5%) account for the highest median family income in Shepherd with $178,606 per family, while 2-person families (94 | 47.5%) have the highest median income of $89,303 per family member.
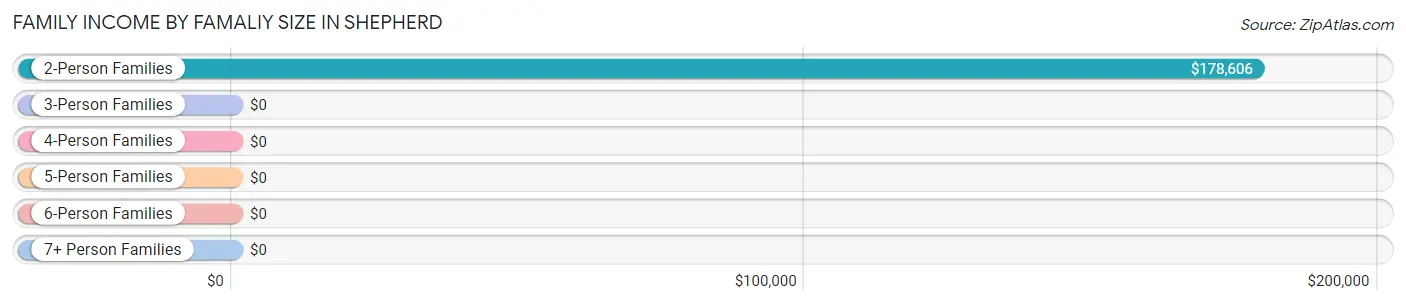
| Income Bracket | # Families | Median Income |
| 2-Person Families | 94 (47.5%) | $178,606 |
| 3-Person Families | 38 (19.2%) | $0 |
| 4-Person Families | 0 (0.0%) | $0 |
| 5-Person Families | 35 (17.7%) | $0 |
| 6-Person Families | 22 (11.1%) | $0 |
| 7+ Person Families | 9 (4.5%) | $0 |
| Total | 198 (100.0%) | $149,800 |
Family Income by Number of Earners in Shepherd
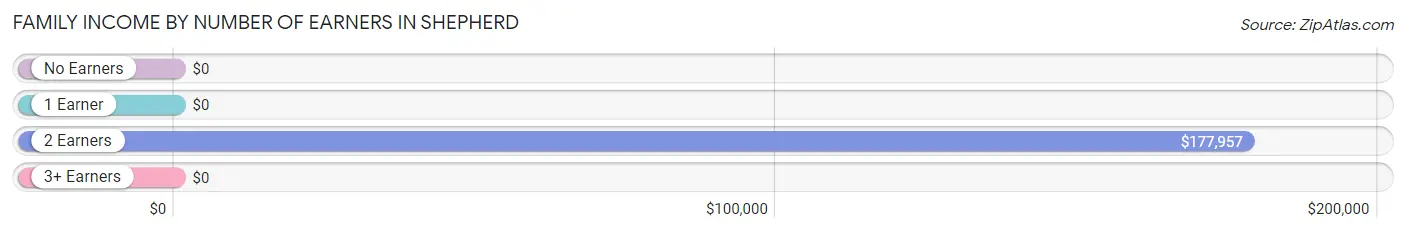
| Number of Earners | # Families | Median Income |
| No Earners | 7 (3.5%) | $0 |
| 1 Earner | 43 (21.7%) | $0 |
| 2 Earners | 121 (61.1%) | $177,957 |
| 3+ Earners | 27 (13.6%) | $0 |
| Total | 198 (100.0%) | $149,800 |
Household Income in Shepherd
Household Income Brackets in Shepherd
With 79 households falling in the category, the $150,000 to $199,999 income range is the most frequent in Shepherd, accounting for 28.7% of all households.
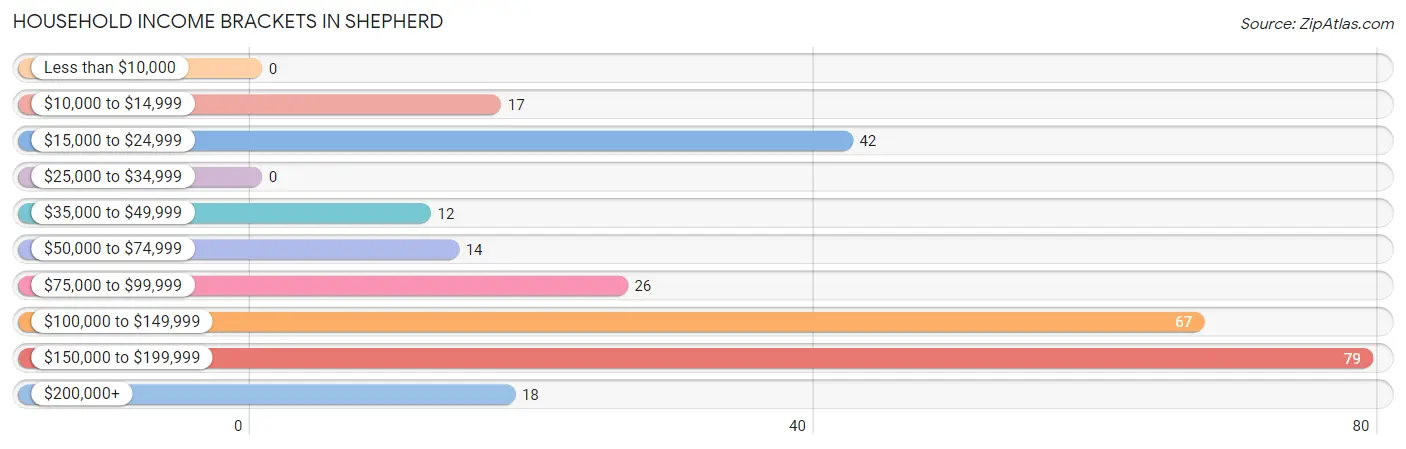
| Income Bracket | # Households | % Households |
| Less than $10,000 | 0 | 0.0% |
| $10,000 to $14,999 | 17 | 6.2% |
| $15,000 to $24,999 | 42 | 15.3% |
| $25,000 to $34,999 | 0 | 0.0% |
| $35,000 to $49,999 | 12 | 4.4% |
| $50,000 to $74,999 | 14 | 5.1% |
| $75,000 to $99,999 | 26 | 9.5% |
| $100,000 to $149,999 | 67 | 24.4% |
| $150,000 to $199,999 | 79 | 28.7% |
| $200,000+ | 18 | 6.5% |
Household Income by Householder Age in Shepherd
The median household income in Shepherd is $125,179, with the highest median household income of $161,019 found in the 45 to 64 years age bracket for the primary householder. A total of 172 households (62.5%) fall into this category.
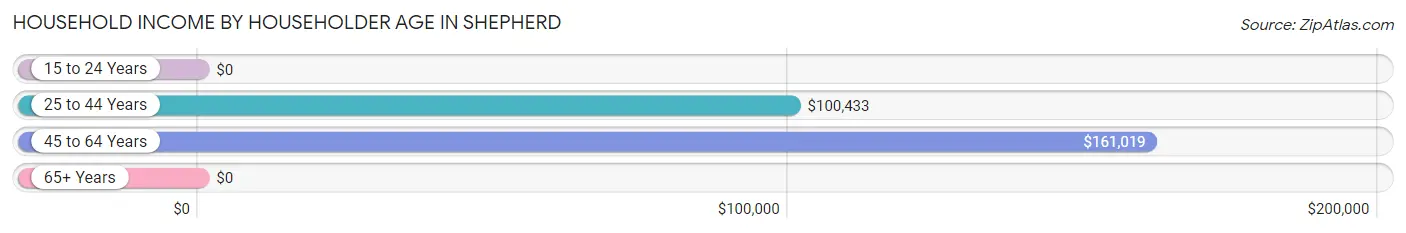
| Income Bracket | # Households | Median Income |
| 15 to 24 Years | 0 (0.0%) | $0 |
| 25 to 44 Years | 49 (17.8%) | $100,433 |
| 45 to 64 Years | 172 (62.5%) | $161,019 |
| 65+ Years | 54 (19.6%) | $0 |
| Total | 275 (100.0%) | $125,179 |
Poverty in Shepherd
Income Below Poverty by Sex and Age in Shepherd
With 9.6% poverty level for males and 3.0% for females among the residents of Shepherd, 12 to 14 year old males and 35 to 44 year old females are the most vulnerable to poverty, with 10 males (100.0%) and 12 females (17.4%) in their respective age groups living below the poverty level.
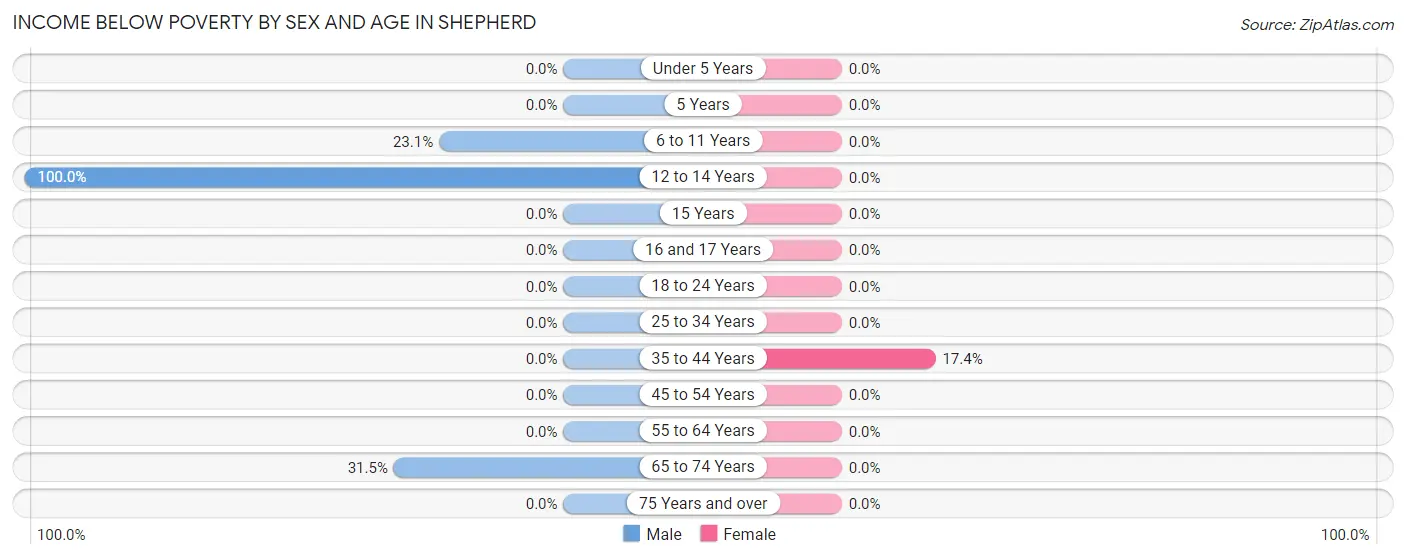
| Age Bracket | Male | Female |
| Under 5 Years | 0 (0.0%) | 0 (0.0%) |
| 5 Years | 0 (0.0%) | 0 (0.0%) |
| 6 to 11 Years | 9 (23.1%) | 0 (0.0%) |
| 12 to 14 Years | 10 (100.0%) | 0 (0.0%) |
| 15 Years | 0 (0.0%) | 0 (0.0%) |
| 16 and 17 Years | 0 (0.0%) | 0 (0.0%) |
| 18 to 24 Years | 0 (0.0%) | 0 (0.0%) |
| 25 to 34 Years | 0 (0.0%) | 0 (0.0%) |
| 35 to 44 Years | 0 (0.0%) | 12 (17.4%) |
| 45 to 54 Years | 0 (0.0%) | 0 (0.0%) |
| 55 to 64 Years | 0 (0.0%) | 0 (0.0%) |
| 65 to 74 Years | 17 (31.5%) | 0 (0.0%) |
| 75 Years and over | 0 (0.0%) | 0 (0.0%) |
| Total | 36 (9.6%) | 12 (3.0%) |
Income Above Poverty by Sex and Age in Shepherd
According to the poverty statistics in Shepherd, males aged under 5 years and females aged under 5 years are the age groups that are most secure financially, with 100.0% of males and 100.0% of females in these age groups living above the poverty line.
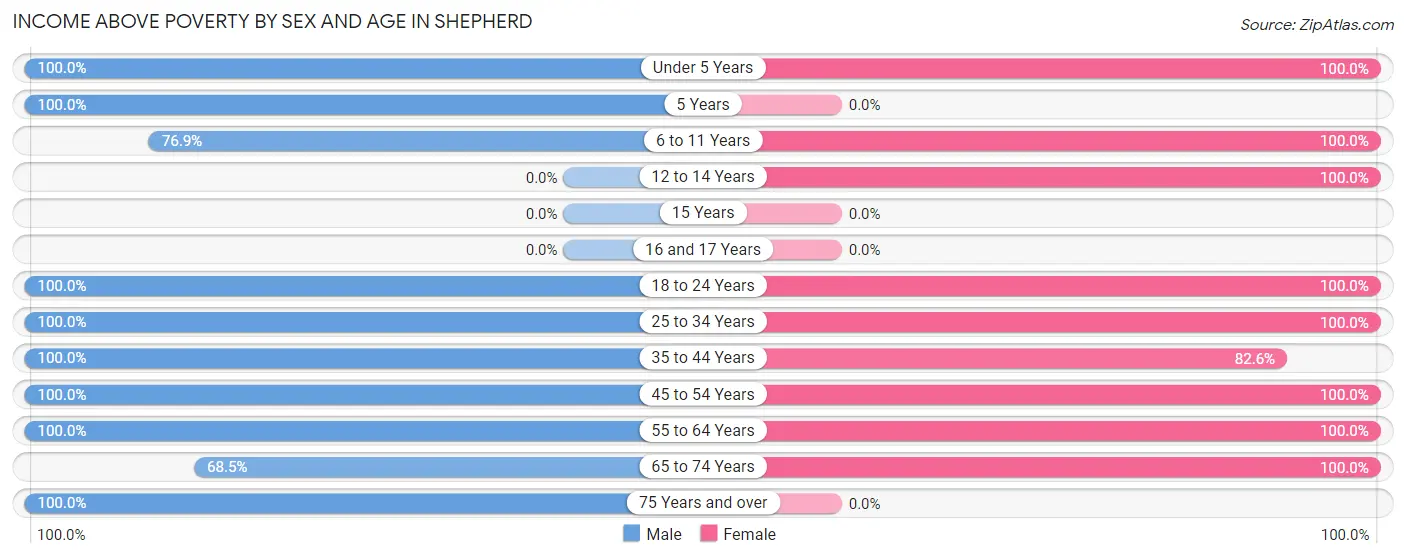
| Age Bracket | Male | Female |
| Under 5 Years | 54 (100.0%) | 27 (100.0%) |
| 5 Years | 18 (100.0%) | 0 (0.0%) |
| 6 to 11 Years | 30 (76.9%) | 10 (100.0%) |
| 12 to 14 Years | 0 (0.0%) | 81 (100.0%) |
| 15 Years | 0 (0.0%) | 0 (0.0%) |
| 16 and 17 Years | 0 (0.0%) | 0 (0.0%) |
| 18 to 24 Years | 28 (100.0%) | 31 (100.0%) |
| 25 to 34 Years | 34 (100.0%) | 25 (100.0%) |
| 35 to 44 Years | 17 (100.0%) | 57 (82.6%) |
| 45 to 54 Years | 97 (100.0%) | 113 (100.0%) |
| 55 to 64 Years | 16 (100.0%) | 23 (100.0%) |
| 65 to 74 Years | 37 (68.5%) | 19 (100.0%) |
| 75 Years and over | 7 (100.0%) | 0 (0.0%) |
| Total | 338 (90.4%) | 386 (97.0%) |
Income Below Poverty Among Married-Couple Families in Shepherd
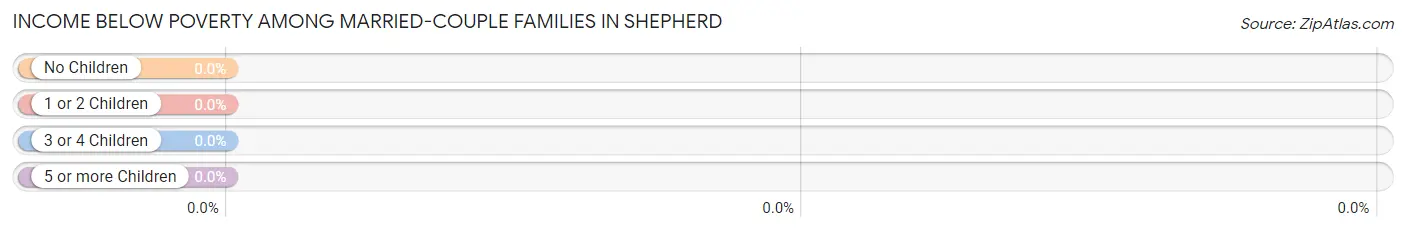
| Children | Above Poverty | Below Poverty |
| No Children | 94 (100.0%) | 0 (0.0%) |
| 1 or 2 Children | 53 (100.0%) | 0 (0.0%) |
| 3 or 4 Children | 30 (100.0%) | 0 (0.0%) |
| 5 or more Children | 9 (100.0%) | 0 (0.0%) |
| Total | 186 (100.0%) | 0 (0.0%) |
Income Below Poverty Among Single-Parent Households in Shepherd
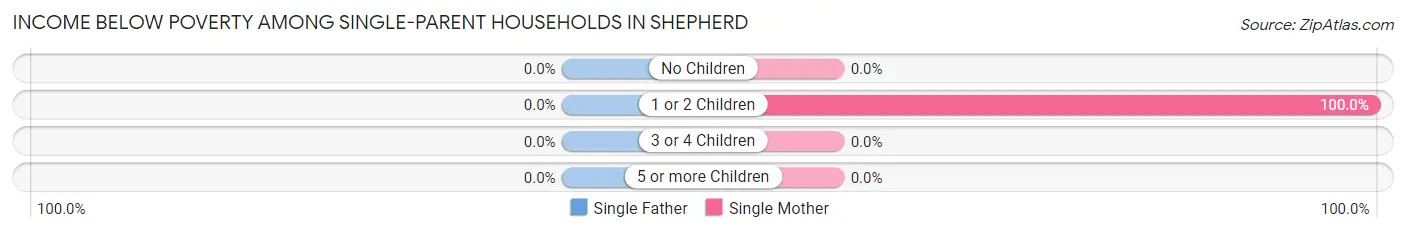
| Children | Single Father | Single Mother |
| No Children | 0 (0.0%) | 0 (0.0%) |
| 1 or 2 Children | 0 (0.0%) | 12 (100.0%) |
| 3 or 4 Children | 0 (0.0%) | 0 (0.0%) |
| 5 or more Children | 0 (0.0%) | 0 (0.0%) |
| Total | 0 (0.0%) | 12 (100.0%) |
Income Below Poverty Among Married-Couple vs Single-Parent Households in Shepherd
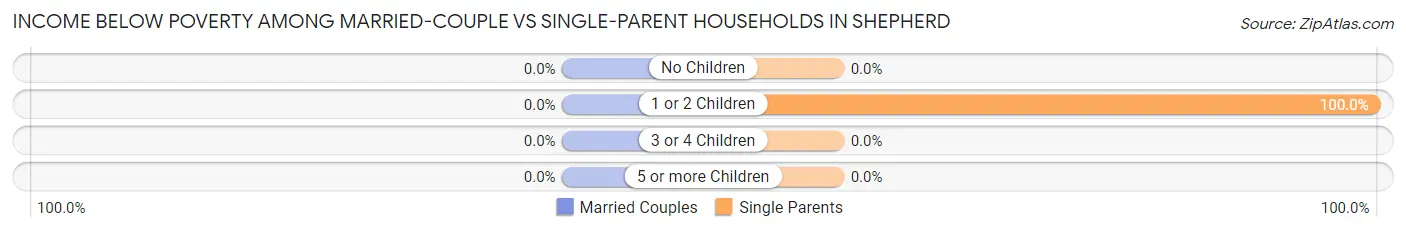
| Children | Married-Couple Families | Single-Parent Households |
| No Children | 0 (0.0%) | 0 (0.0%) |
| 1 or 2 Children | 0 (0.0%) | 12 (100.0%) |
| 3 or 4 Children | 0 (0.0%) | 0 (0.0%) |
| 5 or more Children | 0 (0.0%) | 0 (0.0%) |
| Total | 0 (0.0%) | 12 (100.0%) |
Race in Shepherd
The most populous races in Shepherd are White / Caucasian (662 | 85.8%), and Native / Alaskan (110 | 14.2%).
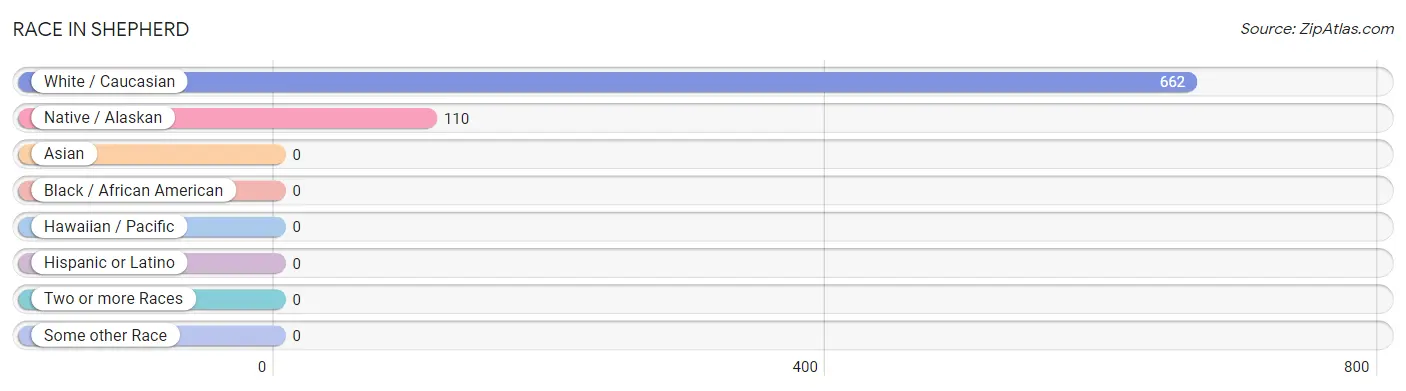
| Race | # Population | % Population |
| Asian | 0 | 0.0% |
| Black / African American | 0 | 0.0% |
| Hawaiian / Pacific | 0 | 0.0% |
| Hispanic or Latino | 0 | 0.0% |
| Native / Alaskan | 110 | 14.2% |
| White / Caucasian | 662 | 85.8% |
| Two or more Races | 0 | 0.0% |
| Some other Race | 0 | 0.0% |
| Total | 772 | 100.0% |
Ancestry in Shepherd
The most populous ancestries reported in Shepherd are German (292 | 37.8%), Irish (180 | 23.3%), Cree (110 | 14.2%), Hungarian (50 | 6.5%), and Norwegian (26 | 3.4%), together accounting for 85.2% of all Shepherd residents.
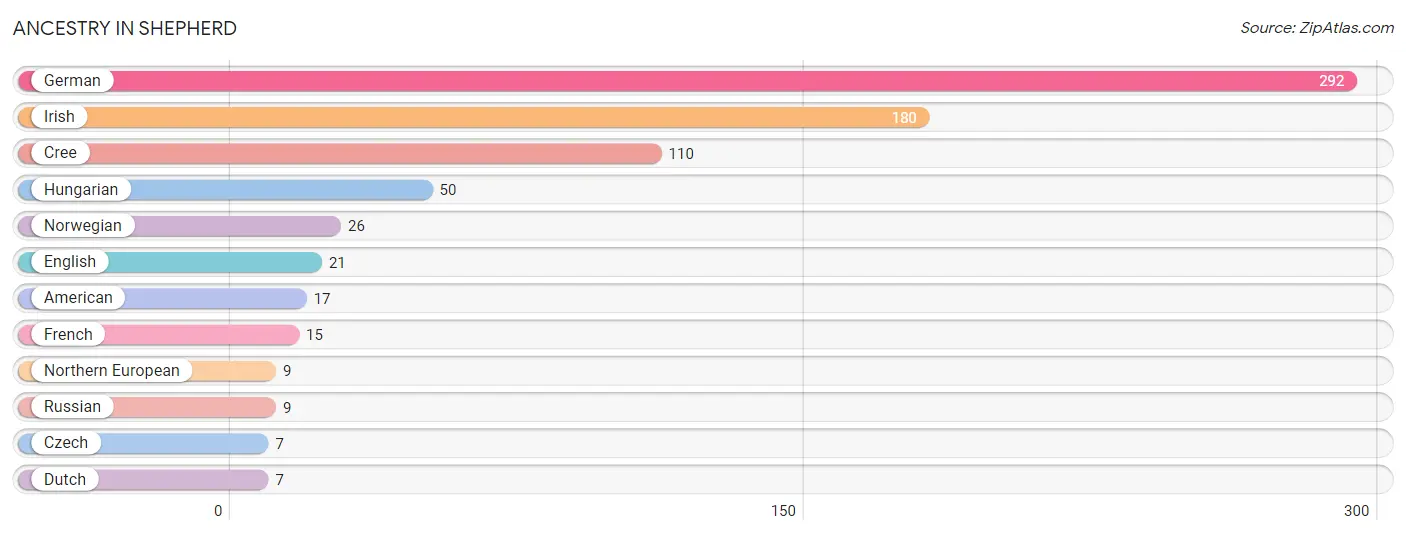
| Ancestry | # Population | % Population |
| American | 17 | 2.2% |
| Cree | 110 | 14.2% |
| Czech | 7 | 0.9% |
| Dutch | 7 | 0.9% |
| English | 21 | 2.7% |
| French | 15 | 1.9% |
| German | 292 | 37.8% |
| Hungarian | 50 | 6.5% |
| Irish | 180 | 23.3% |
| Northern European | 9 | 1.2% |
| Norwegian | 26 | 3.4% |
| Russian | 9 | 1.2% | View All 12 Rows |
Immigrants in Shepherd

| Immigration Origin | # Population | % Population | View All 0 Rows |
Sex and Age in Shepherd
Sex and Age in Shepherd
The most populous age groups in Shepherd are Under 5 Years (54 | 14.4%) for men and 10 to 14 Years (81 | 20.3%) for women.
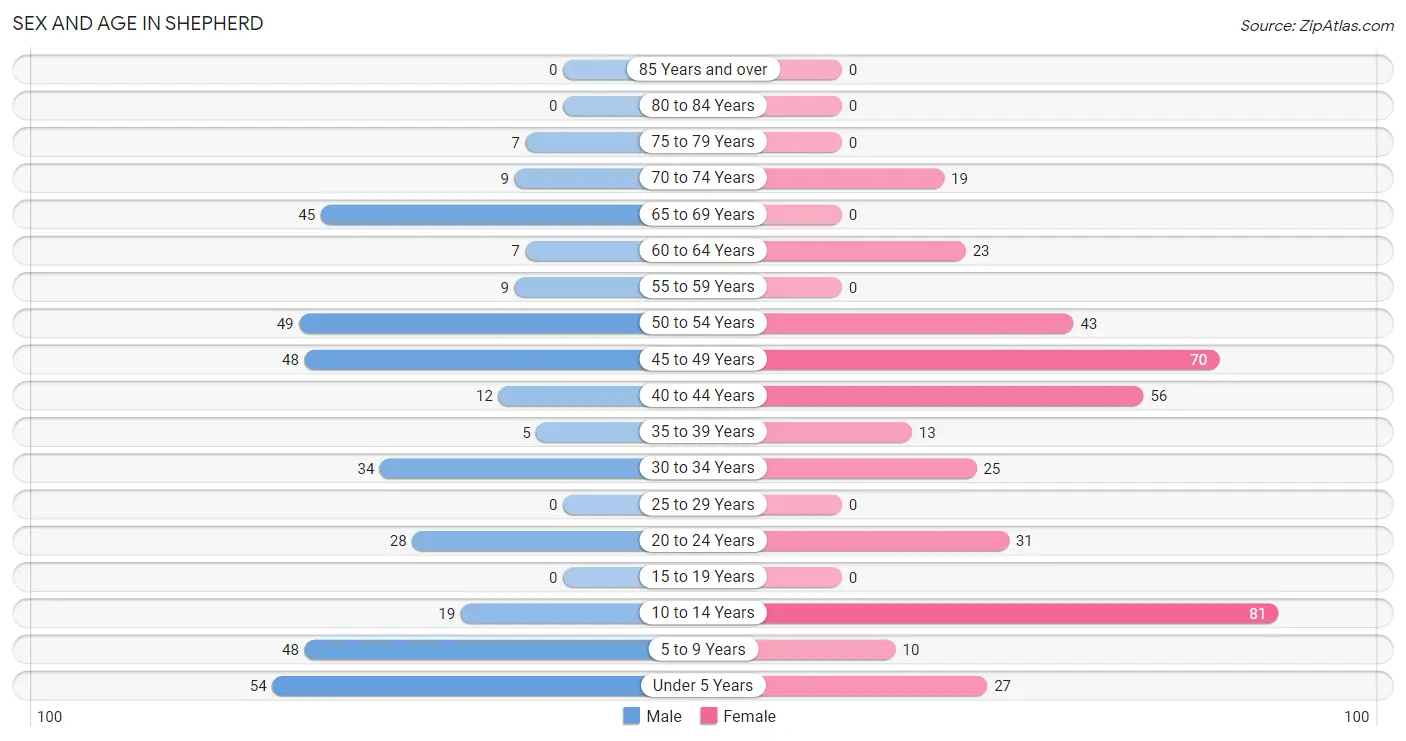
| Age Bracket | Male | Female |
| Under 5 Years | 54 (14.4%) | 27 (6.8%) |
| 5 to 9 Years | 48 (12.8%) | 10 (2.5%) |
| 10 to 14 Years | 19 (5.1%) | 81 (20.3%) |
| 15 to 19 Years | 0 (0.0%) | 0 (0.0%) |
| 20 to 24 Years | 28 (7.5%) | 31 (7.8%) |
| 25 to 29 Years | 0 (0.0%) | 0 (0.0%) |
| 30 to 34 Years | 34 (9.1%) | 25 (6.3%) |
| 35 to 39 Years | 5 (1.3%) | 13 (3.3%) |
| 40 to 44 Years | 12 (3.2%) | 56 (14.1%) |
| 45 to 49 Years | 48 (12.8%) | 70 (17.6%) |
| 50 to 54 Years | 49 (13.1%) | 43 (10.8%) |
| 55 to 59 Years | 9 (2.4%) | 0 (0.0%) |
| 60 to 64 Years | 7 (1.9%) | 23 (5.8%) |
| 65 to 69 Years | 45 (12.0%) | 0 (0.0%) |
| 70 to 74 Years | 9 (2.4%) | 19 (4.8%) |
| 75 to 79 Years | 7 (1.9%) | 0 (0.0%) |
| 80 to 84 Years | 0 (0.0%) | 0 (0.0%) |
| 85 Years and over | 0 (0.0%) | 0 (0.0%) |
| Total | 374 (100.0%) | 398 (100.0%) |
Families and Households in Shepherd
Median Family Size in Shepherd
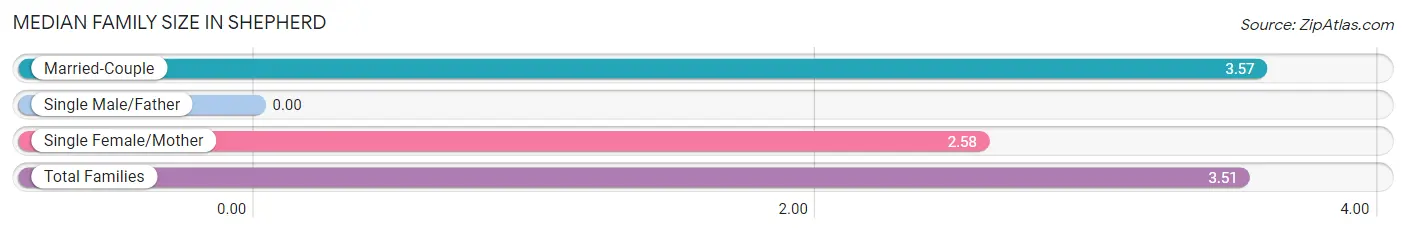
| Family Type | # Families | Family Size |
| Married-Couple | 186 (93.9%) | 3.57 |
| Single Male/Father | 0 (0.0%) | - |
| Single Female/Mother | 12 (6.1%) | 2.58 |
| Total Families | 198 (100.0%) | 3.51 |
Median Household Size in Shepherd
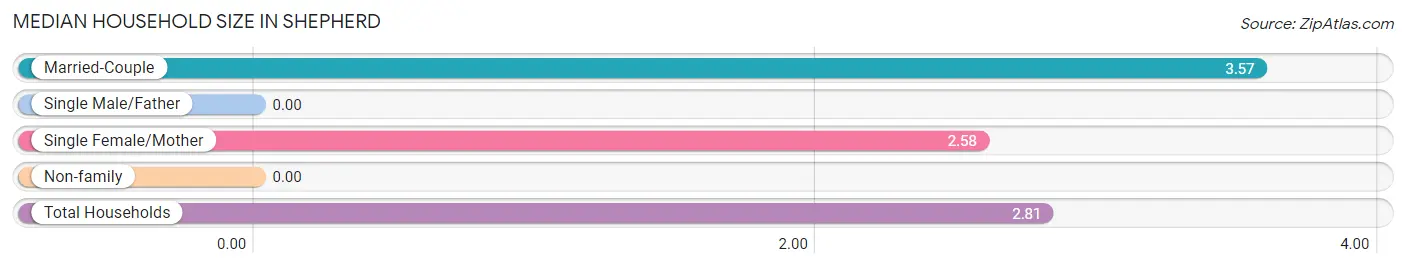
| Household Type | # Households | Household Size |
| Married-Couple | 186 (67.6%) | 3.57 |
| Single Male/Father | 0 (0.0%) | - |
| Single Female/Mother | 12 (4.4%) | 2.58 |
| Non-family | 77 (28.0%) | - |
| Total Households | 275 (100.0%) | 2.81 |
Household Size by Marriage Status in Shepherd
Out of a total of 275 households in Shepherd, 198 (72.0%) are family households, while 77 (28.0%) are nonfamily households. The most numerous type of family households are 2-person households, comprising 94, and the most common type of nonfamily households are 1-person households, comprising 77.
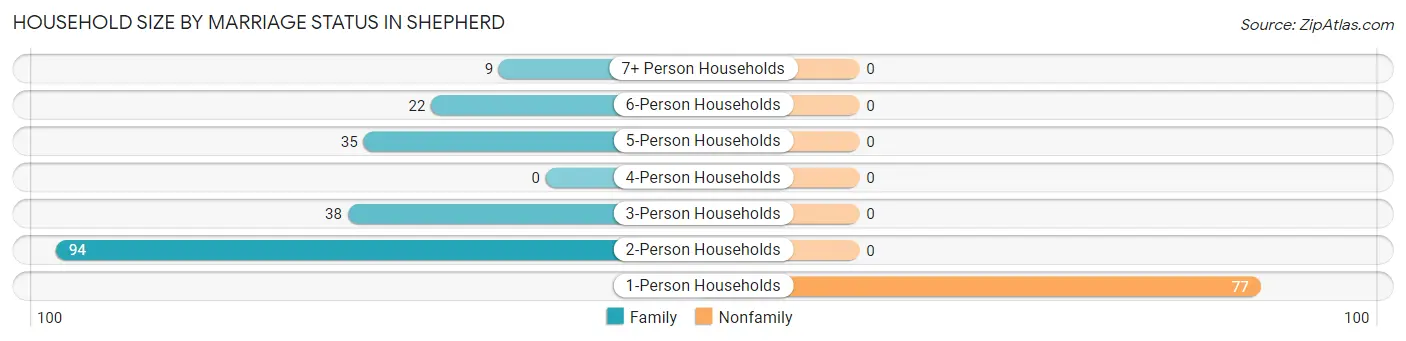
| Household Size | Family Households | Nonfamily Households |
| 1-Person Households | - | 77 (28.0%) |
| 2-Person Households | 94 (34.2%) | 0 (0.0%) |
| 3-Person Households | 38 (13.8%) | 0 (0.0%) |
| 4-Person Households | 0 (0.0%) | 0 (0.0%) |
| 5-Person Households | 35 (12.7%) | 0 (0.0%) |
| 6-Person Households | 22 (8.0%) | 0 (0.0%) |
| 7+ Person Households | 9 (3.3%) | 0 (0.0%) |
| Total | 198 (72.0%) | 77 (28.0%) |
Female Fertility in Shepherd
Fertility by Age in Shepherd
| Age Bracket | Women with Births | Births / 1,000 Women |
| 15 to 19 years | 0 (0.0%) | 0.0 |
| 20 to 34 years | 0 (0.0%) | 0.0 |
| 35 to 50 years | 0 (0.0%) | 0.0 |
| Total | 0 (0.0%) | 0.0 |
Fertility by Age by Marriage Status in Shepherd
| Age Bracket | Married | Unmarried |
| 15 to 19 years | 0 (0.0%) | 0 (0.0%) |
| 20 to 34 years | 0 (0.0%) | 0 (0.0%) |
| 35 to 50 years | 0 (0.0%) | 0 (0.0%) |
| Total | 0 (0.0%) | 0 (0.0%) |
Fertility by Education in Shepherd
| Educational Attainment | Women with Births | Births / 1,000 Women |
| Less than High School | 0 (0.0%) | 0.0 |
| High School Diploma | 0 (0.0%) | 0.0 |
| College or Associate's Degree | 0 (0.0%) | 0.0 |
| Bachelor's Degree | 0 (0.0%) | 0.0 |
| Graduate Degree | 0 (0.0%) | 0.0 |
| Total | 0 (0.0%) | 0.0 |
Fertility by Education by Marriage Status in Shepherd
| Educational Attainment | Married | Unmarried |
| Less than High School | 0 (0.0%) | 0 (0.0%) |
| High School Diploma | 0 (0.0%) | 0 (0.0%) |
| College or Associate's Degree | 0 (0.0%) | 0 (0.0%) |
| Bachelor's Degree | 0 (0.0%) | 0 (0.0%) |
| Graduate Degree | 0 (0.0%) | 0 (0.0%) |
| Total | 0 (0.0%) | 0 (0.0%) |
Employment Characteristics in Shepherd
Employment by Class of Employer in Shepherd
Among the 364 employed individuals in Shepherd, private company employees (287 | 78.8%), self-employed (not incorporated) (43 | 11.8%), and self-employed (incorporated) (19 | 5.2%) make up the most common classes of employment.
| Employer Class | # Employees | % Employees |
| Private Company Employees | 287 | 78.8% |
| Self-Employed (Incorporated) | 19 | 5.2% |
| Self-Employed (Not Incorporated) | 43 | 11.8% |
| Not-for-profit Organizations | 0 | 0.0% |
| Local Government Employees | 15 | 4.1% |
| State Government Employees | 0 | 0.0% |
| Federal Government Employees | 0 | 0.0% |
| Unpaid Family Workers | 0 | 0.0% |
| Total | 364 | 100.0% |
Employment Status by Age in Shepherd
According to the labor force statistics for Shepherd, out of the total population over 16 years of age (533), 73.9% or 394 individuals are in the labor force, with 6.3% or 25 of them unemployed. The age group with the highest labor force participation rate is 20 to 24 years, with 100.0% or 59 individuals in the labor force. Within the labor force, the 30 to 34 years age range has the highest percentage of unemployed individuals, with 42.4% or 25 of them being unemployed.
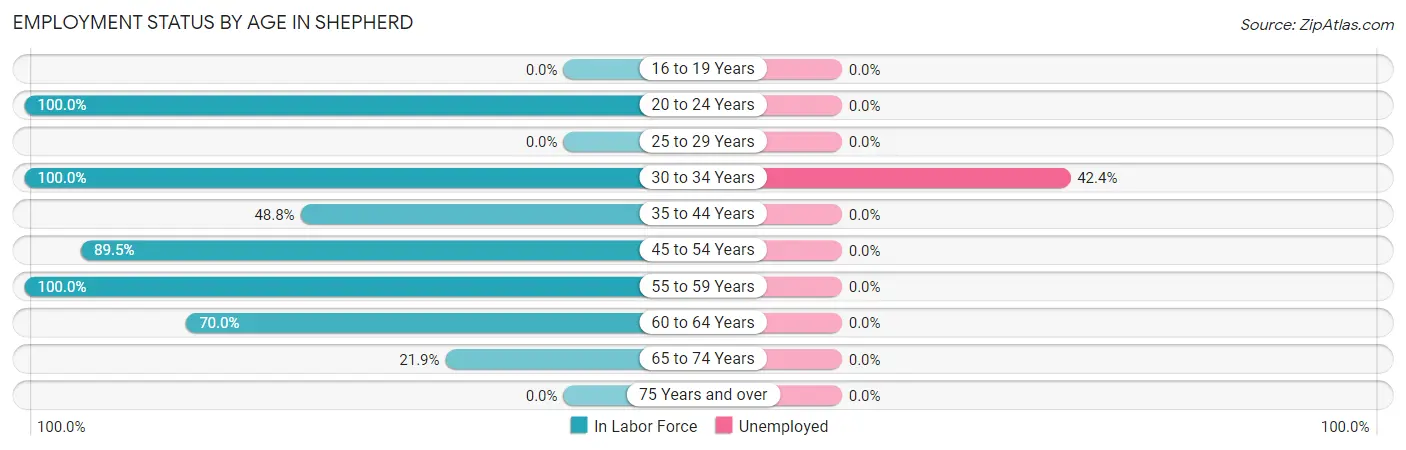
| Age Bracket | In Labor Force | Unemployed |
| 16 to 19 Years | 0 (0.0%) | 0 (0.0%) |
| 20 to 24 Years | 59 (100.0%) | 0 (0.0%) |
| 25 to 29 Years | 0 (0.0%) | 0 (0.0%) |
| 30 to 34 Years | 59 (100.0%) | 25 (42.4%) |
| 35 to 44 Years | 42 (48.8%) | 0 (0.0%) |
| 45 to 54 Years | 188 (89.5%) | 0 (0.0%) |
| 55 to 59 Years | 9 (100.0%) | 0 (0.0%) |
| 60 to 64 Years | 21 (70.0%) | 0 (0.0%) |
| 65 to 74 Years | 16 (21.9%) | 0 (0.0%) |
| 75 Years and over | 0 (0.0%) | 0 (0.0%) |
| Total | 394 (73.9%) | 25 (6.3%) |
Employment Status by Educational Attainment in Shepherd
According to labor force statistics for Shepherd, 81.0% of individuals (319) out of the total population between 25 and 64 years of age (394) are in the labor force, with 7.8% or 25 of them being unemployed. The group with the highest labor force participation rate are those with the educational attainment of less than high school, with 100.0% or 22 individuals in the labor force. Within the labor force, individuals with college / associate degree education have the highest percentage of unemployment, with 22.3% or 25 of them being unemployed.
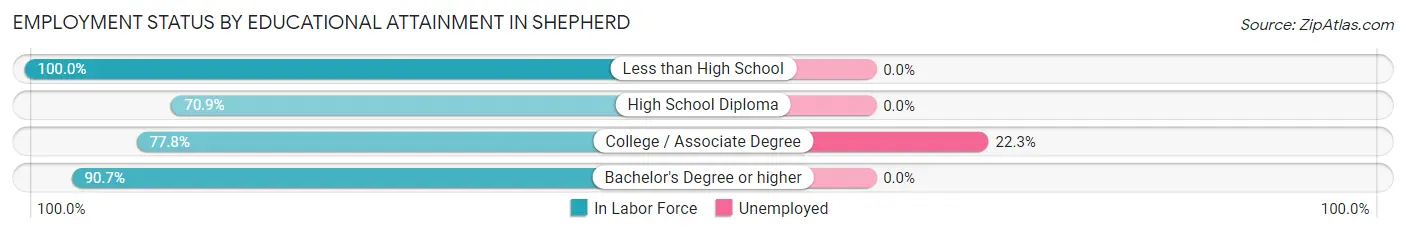
| Educational Attainment | In Labor Force | Unemployed |
| Less than High School | 22 (100.0%) | 0 (0.0%) |
| High School Diploma | 78 (70.9%) | 0 (0.0%) |
| College / Associate Degree | 112 (77.8%) | 32 (22.3%) |
| Bachelor's Degree or higher | 107 (90.7%) | 0 (0.0%) |
| Total | 319 (81.0%) | 31 (7.8%) |
Employment Occupations by Sex in Shepherd
Management, Business, Science and Arts Occupations
The most common Management, Business, Science and Arts occupations in Shepherd are Management (113 | 30.6%), Health Diagnosing & Treating (18 | 4.9%), Health Technologists (18 | 4.9%), Business & Financial (13 | 3.5%), and Computers, Engineering & Science (8 | 2.2%).
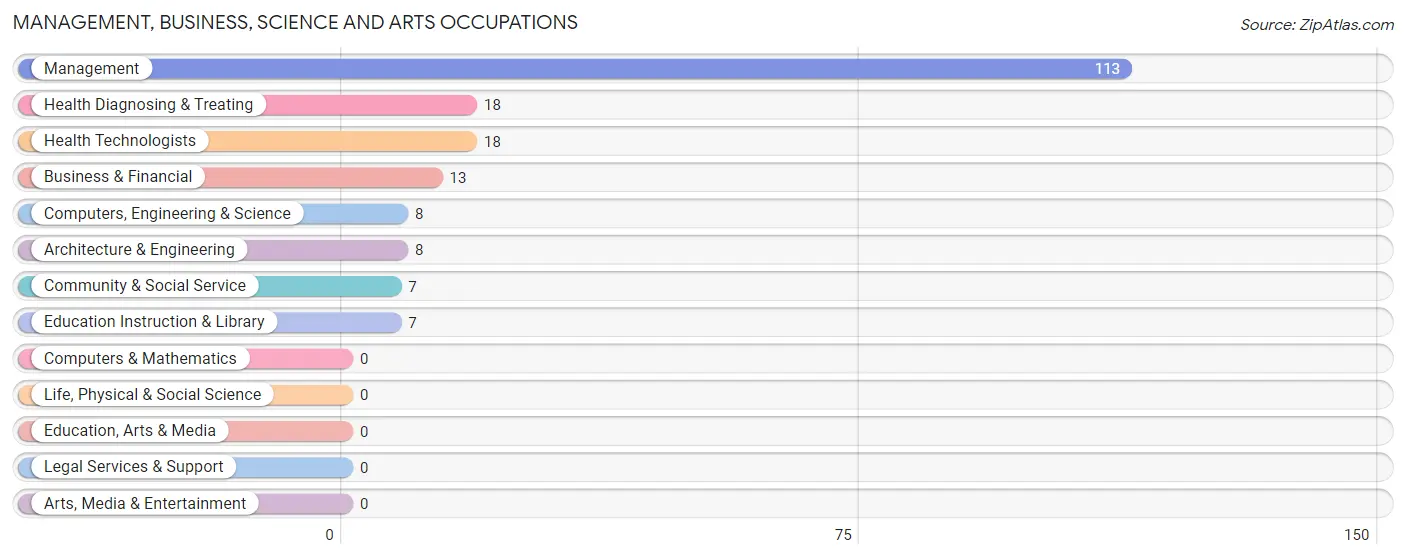
Management, Business, Science and Arts Occupations by Sex
Within the Management, Business, Science and Arts occupations in Shepherd, the most male-oriented occupations are Computers, Engineering & Science (100.0%), Architecture & Engineering (100.0%), and Health Diagnosing & Treating (100.0%), while the most female-oriented occupations are Business & Financial (100.0%), Community & Social Service (100.0%), and Education Instruction & Library (100.0%).
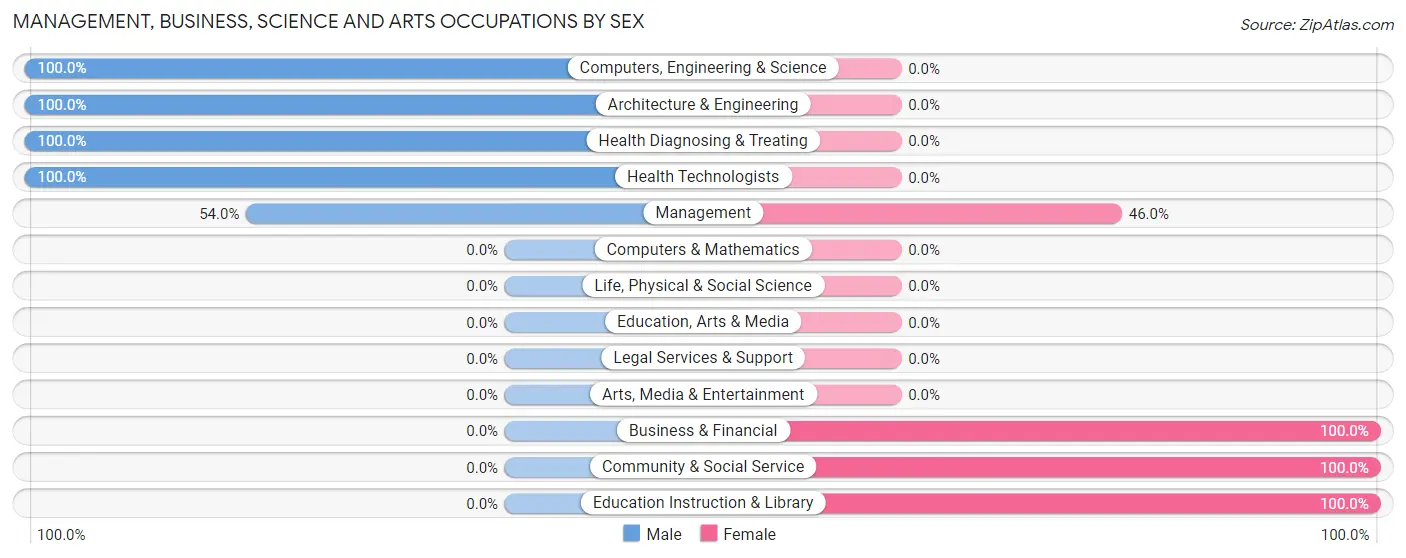
| Occupation | Male | Female |
| Management | 61 (54.0%) | 52 (46.0%) |
| Business & Financial | 0 (0.0%) | 13 (100.0%) |
| Computers, Engineering & Science | 8 (100.0%) | 0 (0.0%) |
| Computers & Mathematics | 0 (0.0%) | 0 (0.0%) |
| Architecture & Engineering | 8 (100.0%) | 0 (0.0%) |
| Life, Physical & Social Science | 0 (0.0%) | 0 (0.0%) |
| Community & Social Service | 0 (0.0%) | 7 (100.0%) |
| Education, Arts & Media | 0 (0.0%) | 0 (0.0%) |
| Legal Services & Support | 0 (0.0%) | 0 (0.0%) |
| Education Instruction & Library | 0 (0.0%) | 7 (100.0%) |
| Arts, Media & Entertainment | 0 (0.0%) | 0 (0.0%) |
| Health Diagnosing & Treating | 18 (100.0%) | 0 (0.0%) |
| Health Technologists | 18 (100.0%) | 0 (0.0%) |
| Total (Category) | 87 (54.7%) | 72 (45.3%) |
| Total (Overall) | 208 (56.4%) | 161 (43.6%) |
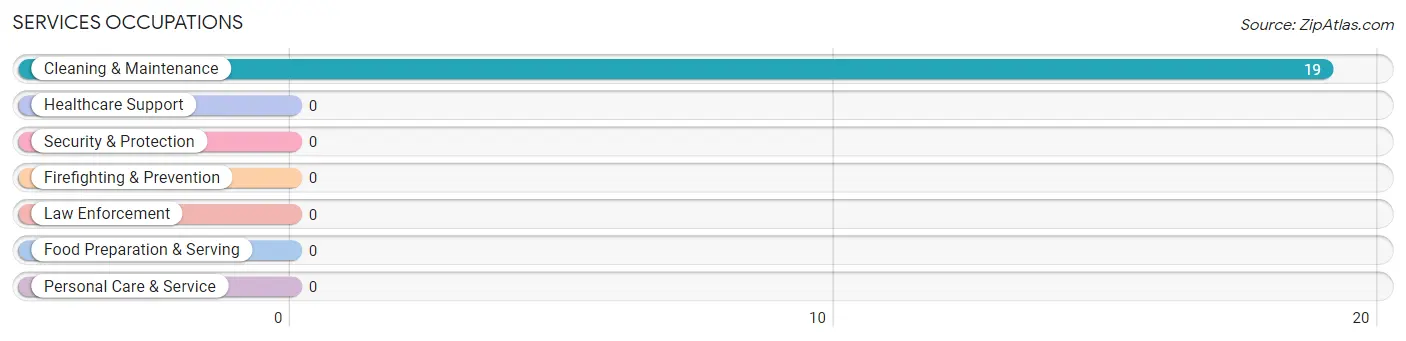
Services Occupations
The most common Services occupations in Shepherd are , and Cleaning & Maintenance (19 | 5.1%).
Services Occupations by Sex
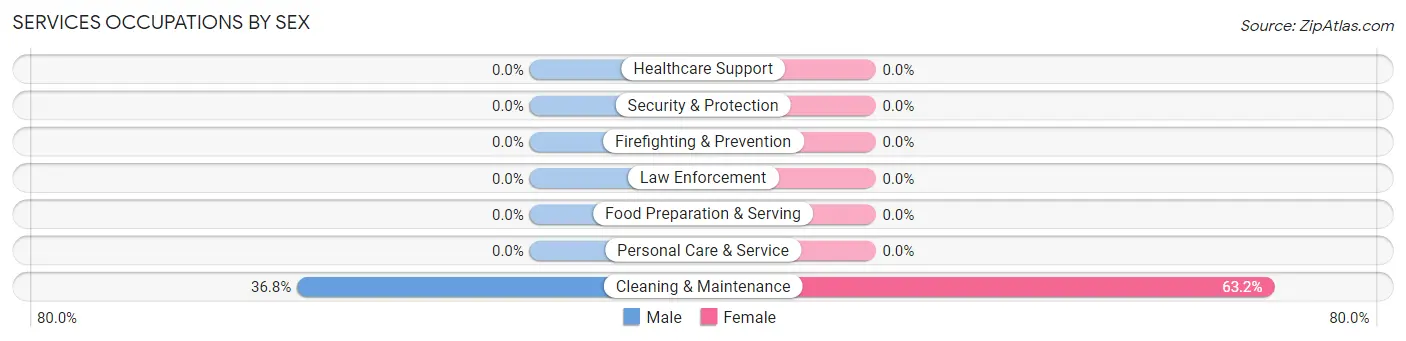
| Occupation | Male | Female |
| Healthcare Support | 0 (0.0%) | 0 (0.0%) |
| Security & Protection | 0 (0.0%) | 0 (0.0%) |
| Firefighting & Prevention | 0 (0.0%) | 0 (0.0%) |
| Law Enforcement | 0 (0.0%) | 0 (0.0%) |
| Food Preparation & Serving | 0 (0.0%) | 0 (0.0%) |
| Cleaning & Maintenance | 7 (36.8%) | 12 (63.2%) |
| Personal Care & Service | 0 (0.0%) | 0 (0.0%) |
| Total (Category) | 7 (36.8%) | 12 (63.2%) |
| Total (Overall) | 208 (56.4%) | 161 (43.6%) |
Sales and Office Occupations
The most common Sales and Office occupations in Shepherd are Sales & Related (80 | 21.7%), and Office & Administration (25 | 6.8%).
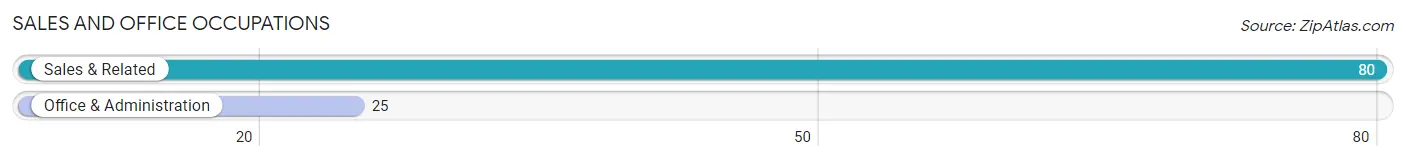
Sales and Office Occupations by Sex
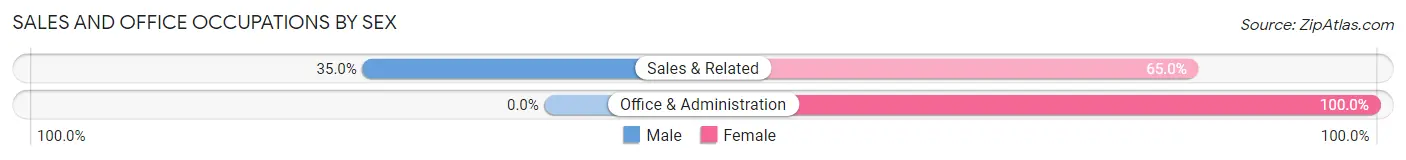
| Occupation | Male | Female |
| Sales & Related | 28 (35.0%) | 52 (65.0%) |
| Office & Administration | 0 (0.0%) | 25 (100.0%) |
| Total (Category) | 28 (26.7%) | 77 (73.3%) |
| Total (Overall) | 208 (56.4%) | 161 (43.6%) |
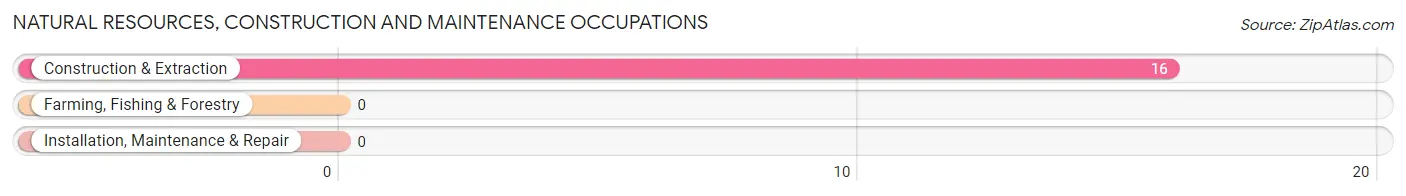
Natural Resources, Construction and Maintenance Occupations
The most common Natural Resources, Construction and Maintenance occupations in Shepherd are , and Construction & Extraction (16 | 4.3%).
Natural Resources, Construction and Maintenance Occupations by Sex
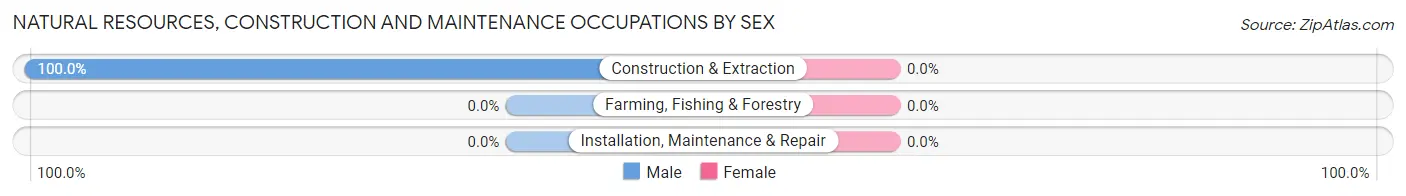
| Occupation | Male | Female |
| Farming, Fishing & Forestry | 0 (0.0%) | 0 (0.0%) |
| Construction & Extraction | 16 (100.0%) | 0 (0.0%) |
| Installation, Maintenance & Repair | 0 (0.0%) | 0 (0.0%) |
| Total (Category) | 16 (100.0%) | 0 (0.0%) |
| Total (Overall) | 208 (56.4%) | 161 (43.6%) |
Production, Transportation and Moving Occupations
The most common Production, Transportation and Moving occupations in Shepherd are Production (30 | 8.1%), Material Moving (26 | 7.0%), and Transportation (14 | 3.8%).
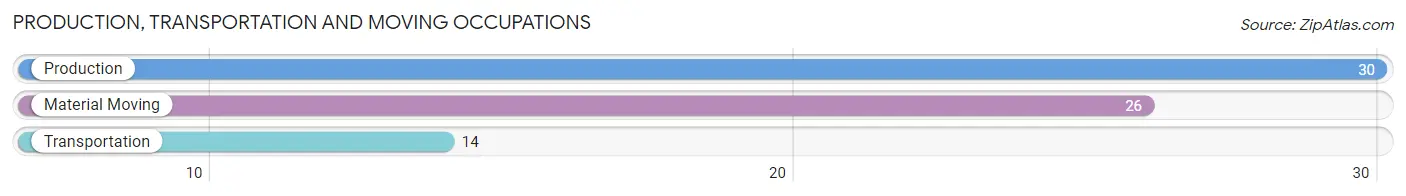
Production, Transportation and Moving Occupations by Sex
| Occupation | Male | Female |
| Production | 30 (100.0%) | 0 (0.0%) |
| Transportation | 14 (100.0%) | 0 (0.0%) |
| Material Moving | 26 (100.0%) | 0 (0.0%) |
| Total (Category) | 70 (100.0%) | 0 (0.0%) |
| Total (Overall) | 208 (56.4%) | 161 (43.6%) |
Employment Industries by Sex in Shepherd
Employment Industries in Shepherd
The major employment industries in Shepherd include Retail Trade (80 | 21.7%), Manufacturing (65 | 17.6%), Finance & Insurance (59 | 16.0%), Construction (56 | 15.2%), and Health Care & Social Assistance (39 | 10.6%).
Employment Industries by Sex in Shepherd
The Shepherd industries that see more men than women are Agriculture, Fishing & Hunting (100.0%), Construction (100.0%), and Manufacturing (100.0%), whereas the industries that tend to have a higher number of women are Finance & Insurance (100.0%), Educational Services (100.0%), and Administrative & Support (75.9%).
| Industry | Male | Female |
| Agriculture, Fishing & Hunting | 12 (100.0%) | 0 (0.0%) |
| Mining, Quarrying, & Extraction | 0 (0.0%) | 0 (0.0%) |
| Construction | 56 (100.0%) | 0 (0.0%) |
| Manufacturing | 65 (100.0%) | 0 (0.0%) |
| Wholesale Trade | 0 (0.0%) | 0 (0.0%) |
| Retail Trade | 28 (35.0%) | 52 (65.0%) |
| Transportation & Warehousing | 14 (100.0%) | 0 (0.0%) |
| Utilities | 8 (100.0%) | 0 (0.0%) |
| Information | 0 (0.0%) | 0 (0.0%) |
| Finance & Insurance | 0 (0.0%) | 59 (100.0%) |
| Real Estate, Rental & Leasing | 0 (0.0%) | 0 (0.0%) |
| Professional & Scientific | 0 (0.0%) | 0 (0.0%) |
| Enterprise Management | 0 (0.0%) | 0 (0.0%) |
| Administrative & Support | 7 (24.1%) | 22 (75.9%) |
| Educational Services | 0 (0.0%) | 7 (100.0%) |
| Health Care & Social Assistance | 18 (46.2%) | 21 (53.8%) |
| Arts, Entertainment & Recreation | 0 (0.0%) | 0 (0.0%) |
| Accommodation & Food Services | 0 (0.0%) | 0 (0.0%) |
| Public Administration | 0 (0.0%) | 0 (0.0%) |
| Total | 208 (56.4%) | 161 (43.6%) |
Education in Shepherd
School Enrollment in Shepherd
The most common levels of schooling among the 177 students in Shepherd are middle school (72 | 40.7%), elementary school (49 | 27.7%), and nursery / preschool (19 | 10.7%).
| School Level | # Students | % Students |
| Nursery / Preschool | 19 | 10.7% |
| Kindergarten | 18 | 10.2% |
| Elementary School | 49 | 27.7% |
| Middle School | 72 | 40.7% |
| High School | 19 | 10.7% |
| College / Undergraduate | 0 | 0.0% |
| Graduate / Professional | 0 | 0.0% |
| Total | 177 | 100.0% |
School Enrollment by Age by Funding Source in Shepherd
Out of a total of 177 students who are enrolled in schools in Shepherd, 10 (5.6%) attend a private institution, while the remaining 167 (94.4%) are enrolled in public schools. The age group of 3 to 4 year olds has the highest likelihood of being enrolled in private schools, with 10 (52.6% in the age bracket) enrolled. Conversely, the age group of 5 to 9 year old has the lowest likelihood of being enrolled in a private school, with 58 (100.0% in the age bracket) attending a public institution.
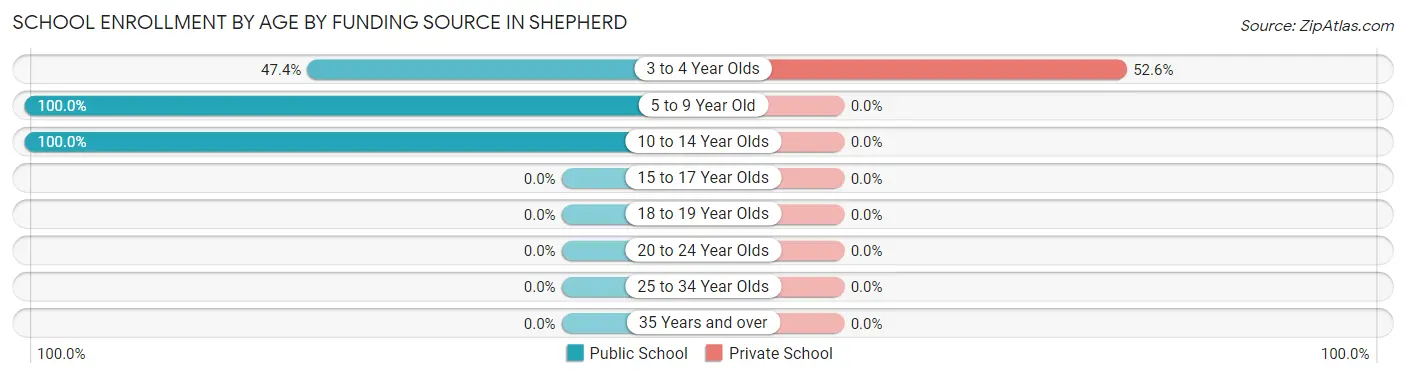
| Age Bracket | Public School | Private School |
| 3 to 4 Year Olds | 9 (47.4%) | 10 (52.6%) |
| 5 to 9 Year Old | 58 (100.0%) | 0 (0.0%) |
| 10 to 14 Year Olds | 100 (100.0%) | 0 (0.0%) |
| 15 to 17 Year Olds | 0 (0.0%) | 0 (0.0%) |
| 18 to 19 Year Olds | 0 (0.0%) | 0 (0.0%) |
| 20 to 24 Year Olds | 0 (0.0%) | 0 (0.0%) |
| 25 to 34 Year Olds | 0 (0.0%) | 0 (0.0%) |
| 35 Years and over | 0 (0.0%) | 0 (0.0%) |
| Total | 167 (94.4%) | 10 (5.6%) |
Educational Attainment by Field of Study in Shepherd
Visual & performing arts (52 | 27.4%), communications (52 | 27.4%), bio, nature & agricultural (27 | 14.2%), business (22 | 11.6%), and psychology (18 | 9.5%) are the most common fields of study among 190 individuals in Shepherd who have obtained a bachelor's degree or higher.
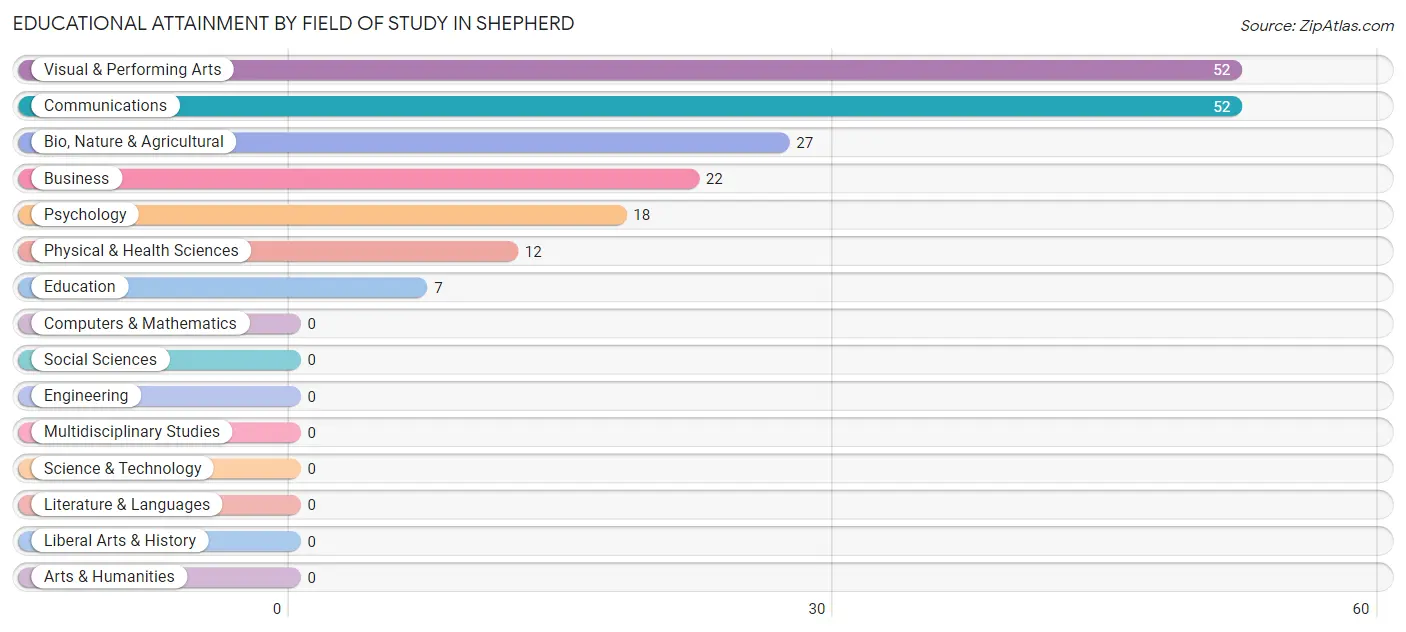
| Field of Study | # Graduates | % Graduates |
| Computers & Mathematics | 0 | 0.0% |
| Bio, Nature & Agricultural | 27 | 14.2% |
| Physical & Health Sciences | 12 | 6.3% |
| Psychology | 18 | 9.5% |
| Social Sciences | 0 | 0.0% |
| Engineering | 0 | 0.0% |
| Multidisciplinary Studies | 0 | 0.0% |
| Science & Technology | 0 | 0.0% |
| Business | 22 | 11.6% |
| Education | 7 | 3.7% |
| Literature & Languages | 0 | 0.0% |
| Liberal Arts & History | 0 | 0.0% |
| Visual & Performing Arts | 52 | 27.4% |
| Communications | 52 | 27.4% |
| Arts & Humanities | 0 | 0.0% |
| Total | 190 | 100.0% |
Transportation & Commute in Shepherd
Vehicle Availability by Sex in Shepherd
The most prevalent vehicle ownership categories in Shepherd are males with 5 or more vehicles (67, accounting for 33.0%) and females with 5 or more vehicles (34, making up 41.6%).
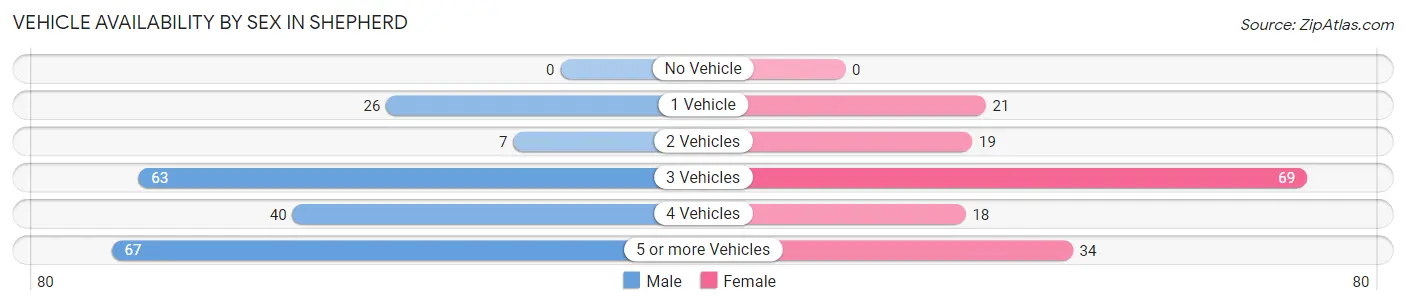
| Vehicles Available | Male | Female |
| No Vehicle | 0 (0.0%) | 0 (0.0%) |
| 1 Vehicle | 26 (12.8%) | 21 (13.0%) |
| 2 Vehicles | 7 (3.5%) | 19 (11.8%) |
| 3 Vehicles | 63 (31.0%) | 69 (42.9%) |
| 4 Vehicles | 40 (19.7%) | 18 (11.2%) |
| 5 or more Vehicles | 67 (33.0%) | 34 (21.1%) |
| Total | 203 (100.0%) | 161 (100.0%) |
Commute Time in Shepherd
The most frequently occuring commute durations in Shepherd are 20 to 24 minutes (77 commuters, 25.5%), 30 to 34 minutes (73 commuters, 24.2%), and 15 to 19 minutes (59 commuters, 19.5%).
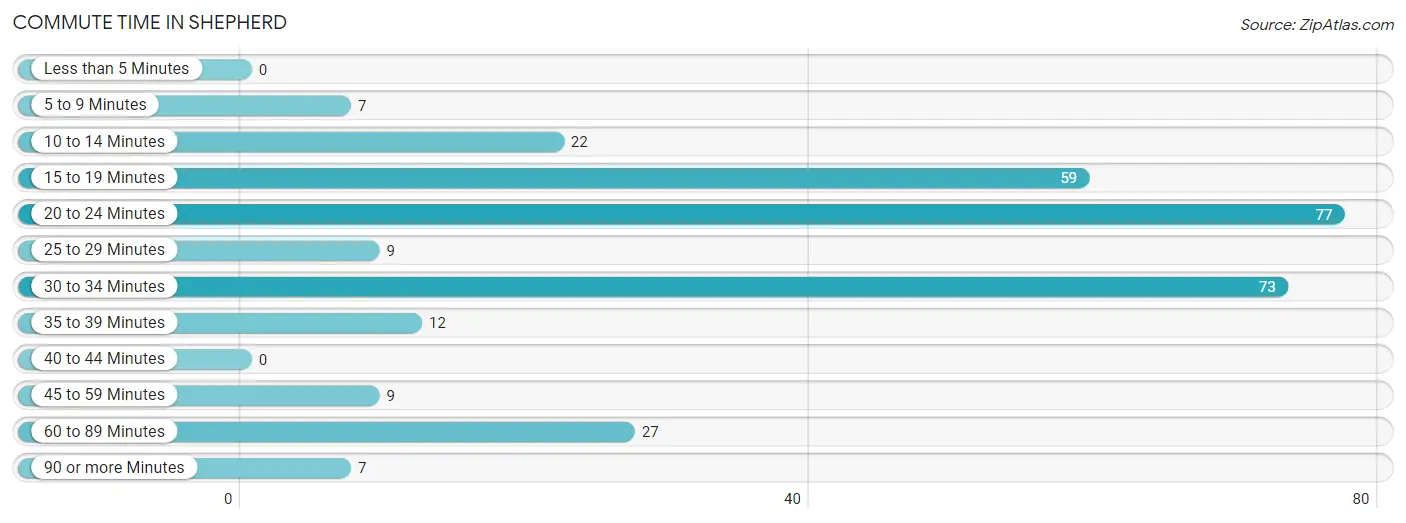
| Commute Time | # Commuters | % Commuters |
| Less than 5 Minutes | 0 | 0.0% |
| 5 to 9 Minutes | 7 | 2.3% |
| 10 to 14 Minutes | 22 | 7.3% |
| 15 to 19 Minutes | 59 | 19.5% |
| 20 to 24 Minutes | 77 | 25.5% |
| 25 to 29 Minutes | 9 | 3.0% |
| 30 to 34 Minutes | 73 | 24.2% |
| 35 to 39 Minutes | 12 | 4.0% |
| 40 to 44 Minutes | 0 | 0.0% |
| 45 to 59 Minutes | 9 | 3.0% |
| 60 to 89 Minutes | 27 | 8.9% |
| 90 or more Minutes | 7 | 2.3% |
Commute Time by Sex in Shepherd
The most common commute times in Shepherd are 20 to 24 minutes (56 commuters, 27.6%) for males and 15 to 19 minutes (31 commuters, 31.3%) for females.
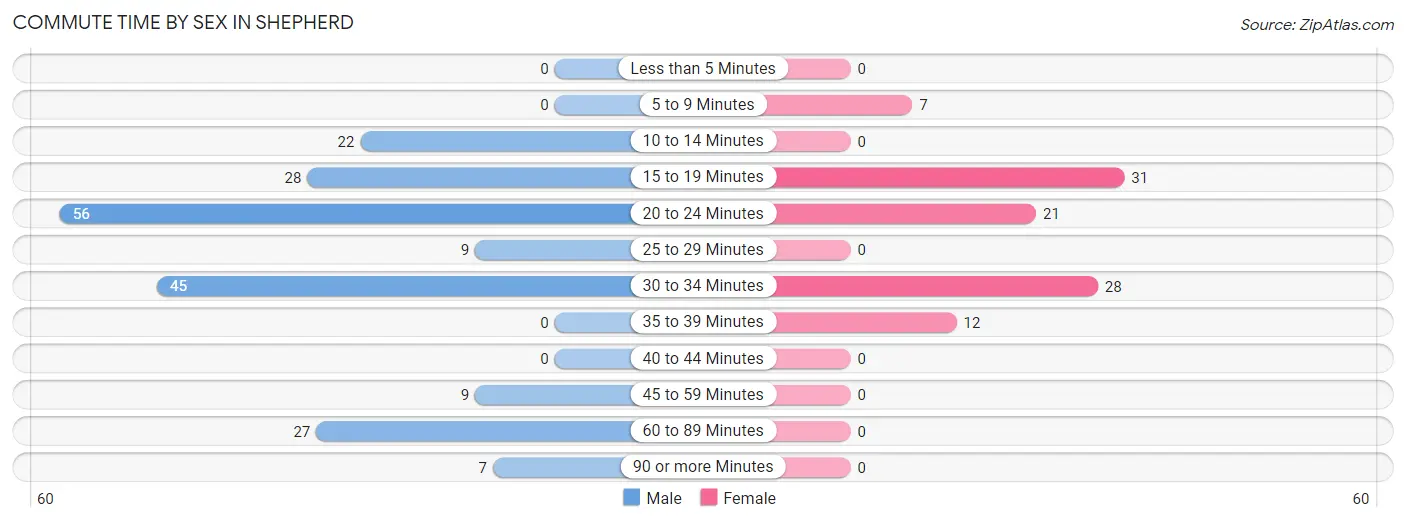
| Commute Time | Male | Female |
| Less than 5 Minutes | 0 (0.0%) | 0 (0.0%) |
| 5 to 9 Minutes | 0 (0.0%) | 7 (7.1%) |
| 10 to 14 Minutes | 22 (10.8%) | 0 (0.0%) |
| 15 to 19 Minutes | 28 (13.8%) | 31 (31.3%) |
| 20 to 24 Minutes | 56 (27.6%) | 21 (21.2%) |
| 25 to 29 Minutes | 9 (4.4%) | 0 (0.0%) |
| 30 to 34 Minutes | 45 (22.2%) | 28 (28.3%) |
| 35 to 39 Minutes | 0 (0.0%) | 12 (12.1%) |
| 40 to 44 Minutes | 0 (0.0%) | 0 (0.0%) |
| 45 to 59 Minutes | 9 (4.4%) | 0 (0.0%) |
| 60 to 89 Minutes | 27 (13.3%) | 0 (0.0%) |
| 90 or more Minutes | 7 (3.5%) | 0 (0.0%) |
Time of Departure to Work by Sex in Shepherd
The most frequent times of departure to work in Shepherd are 5:00 AM to 5:29 AM (56, 27.6%) for males and 7:00 AM to 7:29 AM (31, 31.3%) for females.
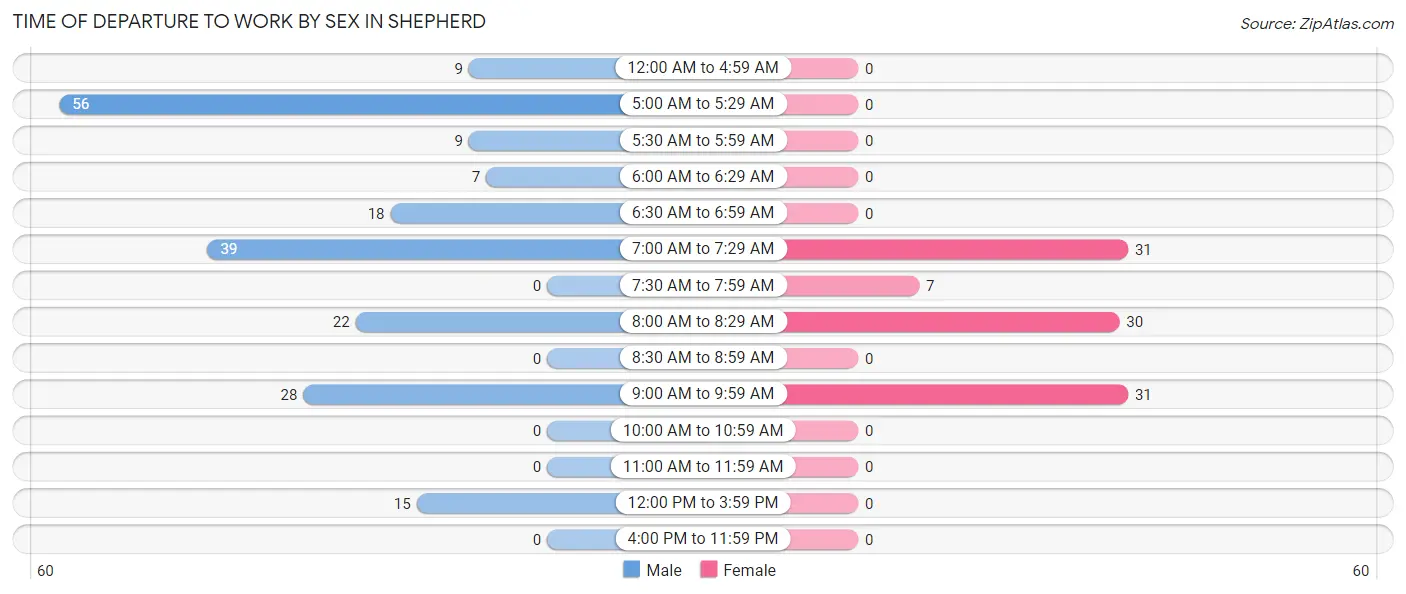
| Time of Departure | Male | Female |
| 12:00 AM to 4:59 AM | 9 (4.4%) | 0 (0.0%) |
| 5:00 AM to 5:29 AM | 56 (27.6%) | 0 (0.0%) |
| 5:30 AM to 5:59 AM | 9 (4.4%) | 0 (0.0%) |
| 6:00 AM to 6:29 AM | 7 (3.5%) | 0 (0.0%) |
| 6:30 AM to 6:59 AM | 18 (8.9%) | 0 (0.0%) |
| 7:00 AM to 7:29 AM | 39 (19.2%) | 31 (31.3%) |
| 7:30 AM to 7:59 AM | 0 (0.0%) | 7 (7.1%) |
| 8:00 AM to 8:29 AM | 22 (10.8%) | 30 (30.3%) |
| 8:30 AM to 8:59 AM | 0 (0.0%) | 0 (0.0%) |
| 9:00 AM to 9:59 AM | 28 (13.8%) | 31 (31.3%) |
| 10:00 AM to 10:59 AM | 0 (0.0%) | 0 (0.0%) |
| 11:00 AM to 11:59 AM | 0 (0.0%) | 0 (0.0%) |
| 12:00 PM to 3:59 PM | 15 (7.4%) | 0 (0.0%) |
| 4:00 PM to 11:59 PM | 0 (0.0%) | 0 (0.0%) |
| Total | 203 (100.0%) | 99 (100.0%) |
Housing Occupancy in Shepherd
Occupancy by Ownership in Shepherd
Of the total 275 dwellings in Shepherd, owner-occupied units account for 263 (95.6%), while renter-occupied units make up 12 (4.4%).
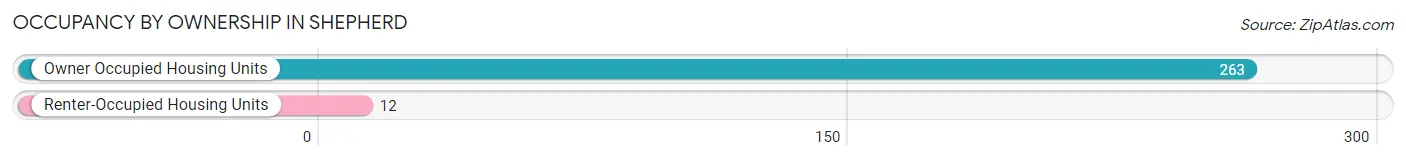
| Occupancy | # Housing Units | % Housing Units |
| Owner Occupied Housing Units | 263 | 95.6% |
| Renter-Occupied Housing Units | 12 | 4.4% |
| Total Occupied Housing Units | 275 | 100.0% |
Occupancy by Household Size in Shepherd
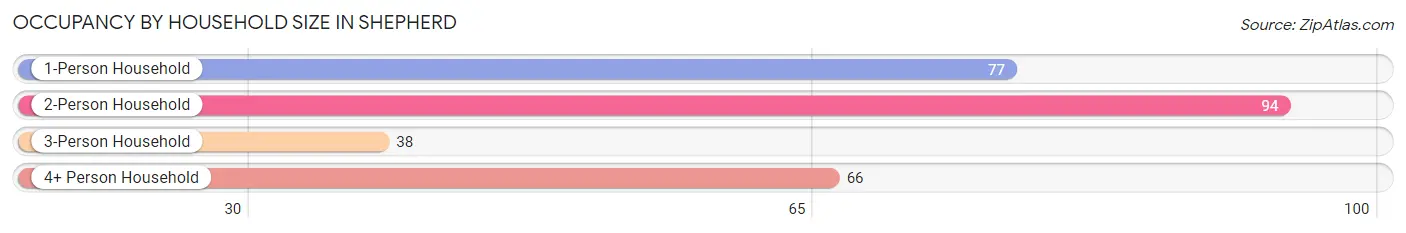
| Household Size | # Housing Units | % Housing Units |
| 1-Person Household | 77 | 28.0% |
| 2-Person Household | 94 | 34.2% |
| 3-Person Household | 38 | 13.8% |
| 4+ Person Household | 66 | 24.0% |
| Total Housing Units | 275 | 100.0% |
Occupancy by Ownership by Household Size in Shepherd
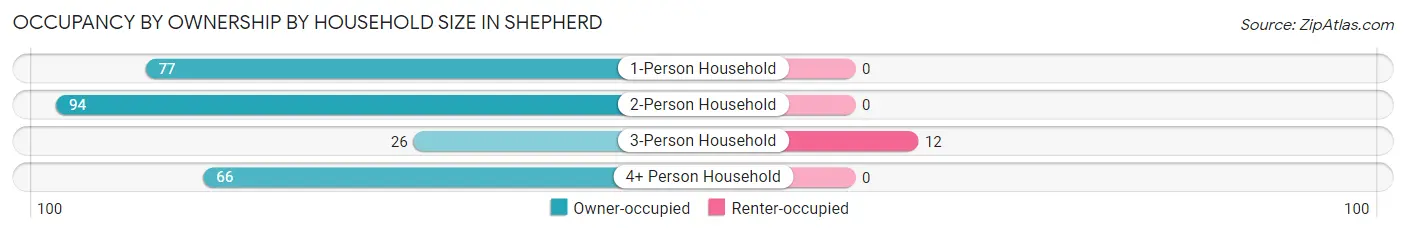
| Household Size | Owner-occupied | Renter-occupied |
| 1-Person Household | 77 (100.0%) | 0 (0.0%) |
| 2-Person Household | 94 (100.0%) | 0 (0.0%) |
| 3-Person Household | 26 (68.4%) | 12 (31.6%) |
| 4+ Person Household | 66 (100.0%) | 0 (0.0%) |
| Total Housing Units | 263 (95.6%) | 12 (4.4%) |
Occupancy by Educational Attainment in Shepherd
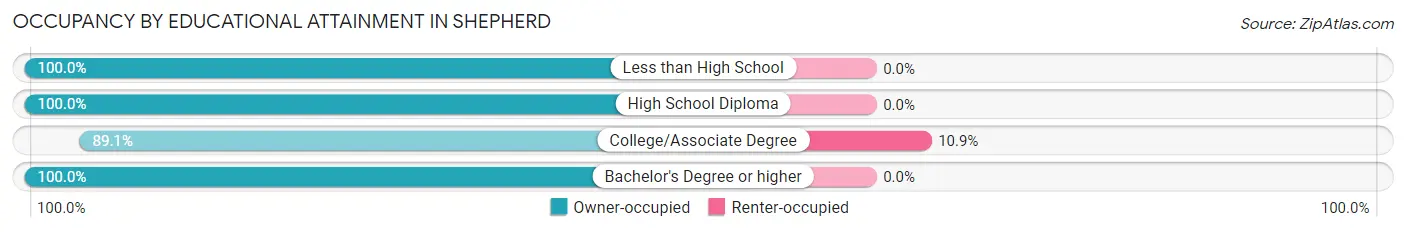
| Household Size | Owner-occupied | Renter-occupied |
| Less than High School | 31 (100.0%) | 0 (0.0%) |
| High School Diploma | 55 (100.0%) | 0 (0.0%) |
| College/Associate Degree | 98 (89.1%) | 12 (10.9%) |
| Bachelor's Degree or higher | 79 (100.0%) | 0 (0.0%) |
Occupancy by Age of Householder in Shepherd
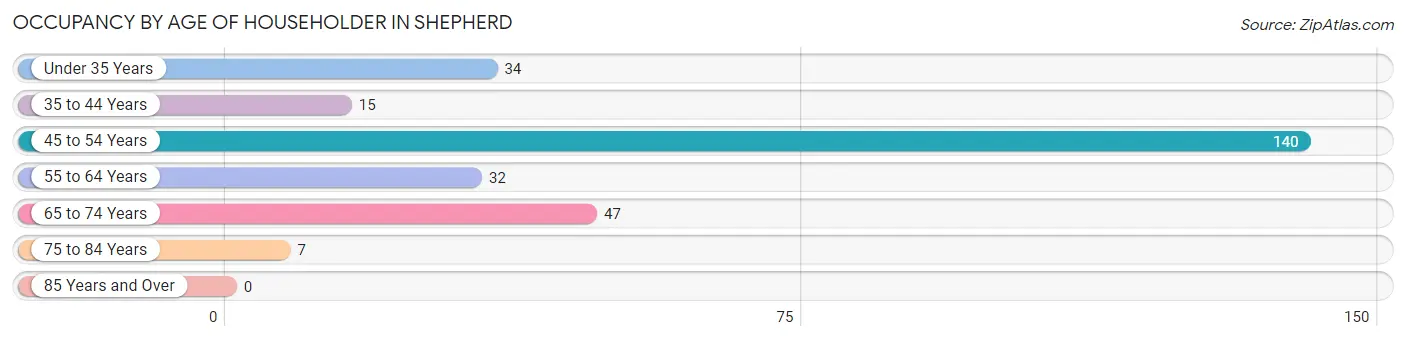
| Age Bracket | # Households | % Households |
| Under 35 Years | 34 | 12.4% |
| 35 to 44 Years | 15 | 5.4% |
| 45 to 54 Years | 140 | 50.9% |
| 55 to 64 Years | 32 | 11.6% |
| 65 to 74 Years | 47 | 17.1% |
| 75 to 84 Years | 7 | 2.5% |
| 85 Years and Over | 0 | 0.0% |
| Total | 275 | 100.0% |
Housing Finances in Shepherd
Median Income by Occupancy in Shepherd
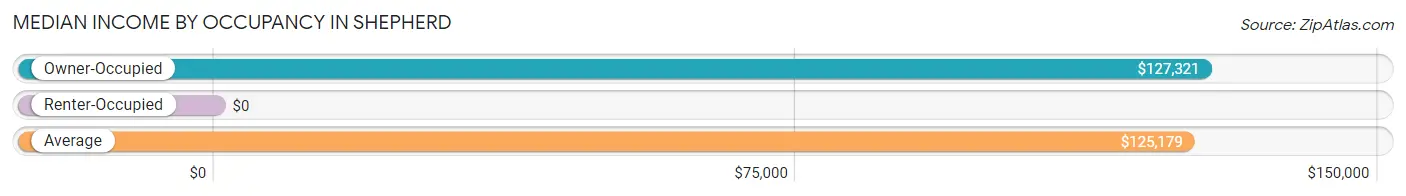
| Occupancy Type | # Households | Median Income |
| Owner-Occupied | 263 (95.6%) | $127,321 |
| Renter-Occupied | 12 (4.4%) | $0 |
| Average | 275 (100.0%) | $125,179 |
Occupancy by Householder Income Bracket in Shepherd
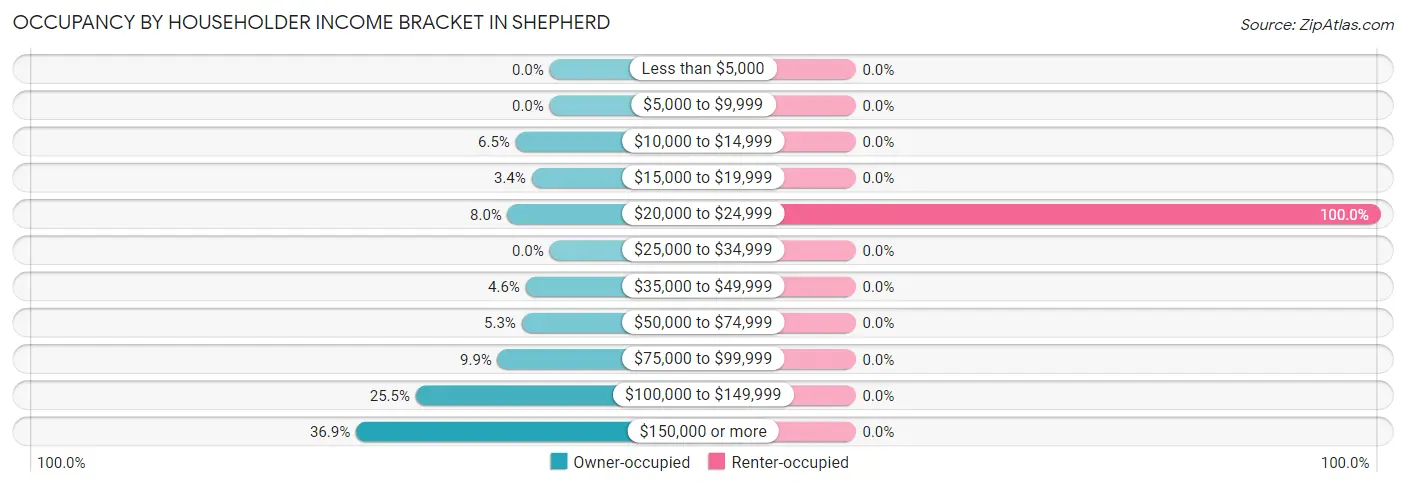
| Income Bracket | Owner-occupied | Renter-occupied |
| Less than $5,000 | 0 (0.0%) | 0 (0.0%) |
| $5,000 to $9,999 | 0 (0.0%) | 0 (0.0%) |
| $10,000 to $14,999 | 17 (6.5%) | 0 (0.0%) |
| $15,000 to $19,999 | 9 (3.4%) | 0 (0.0%) |
| $20,000 to $24,999 | 21 (8.0%) | 12 (100.0%) |
| $25,000 to $34,999 | 0 (0.0%) | 0 (0.0%) |
| $35,000 to $49,999 | 12 (4.6%) | 0 (0.0%) |
| $50,000 to $74,999 | 14 (5.3%) | 0 (0.0%) |
| $75,000 to $99,999 | 26 (9.9%) | 0 (0.0%) |
| $100,000 to $149,999 | 67 (25.5%) | 0 (0.0%) |
| $150,000 or more | 97 (36.9%) | 0 (0.0%) |
| Total | 263 (100.0%) | 12 (100.0%) |
Monthly Housing Cost Tiers in Shepherd
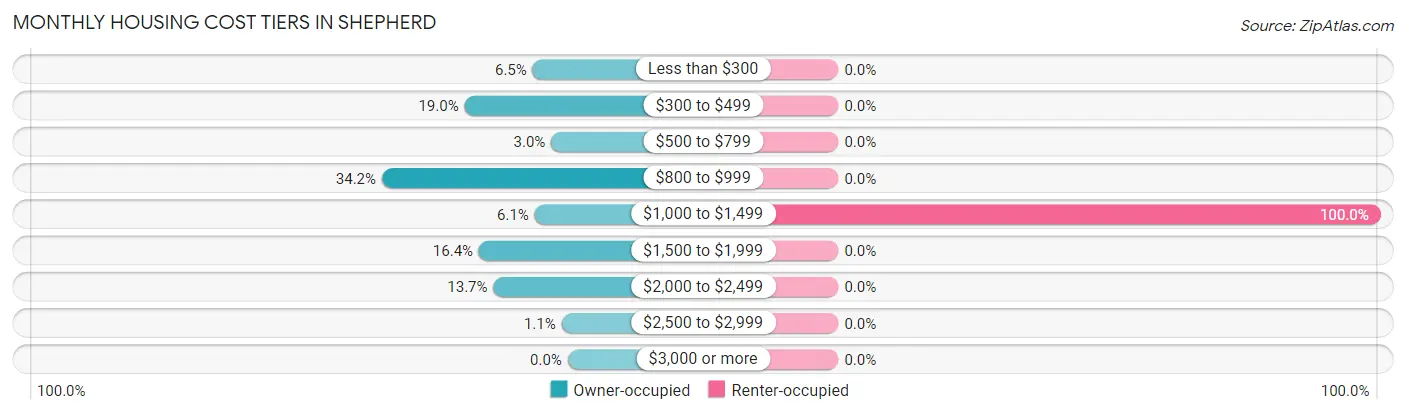
| Monthly Cost | Owner-occupied | Renter-occupied |
| Less than $300 | 17 (6.5%) | 0 (0.0%) |
| $300 to $499 | 50 (19.0%) | 0 (0.0%) |
| $500 to $799 | 8 (3.0%) | 0 (0.0%) |
| $800 to $999 | 90 (34.2%) | 0 (0.0%) |
| $1,000 to $1,499 | 16 (6.1%) | 12 (100.0%) |
| $1,500 to $1,999 | 43 (16.4%) | 0 (0.0%) |
| $2,000 to $2,499 | 36 (13.7%) | 0 (0.0%) |
| $2,500 to $2,999 | 3 (1.1%) | 0 (0.0%) |
| $3,000 or more | 0 (0.0%) | 0 (0.0%) |
| Total | 263 (100.0%) | 12 (100.0%) |
Physical Housing Characteristics in Shepherd
Housing Structures in Shepherd
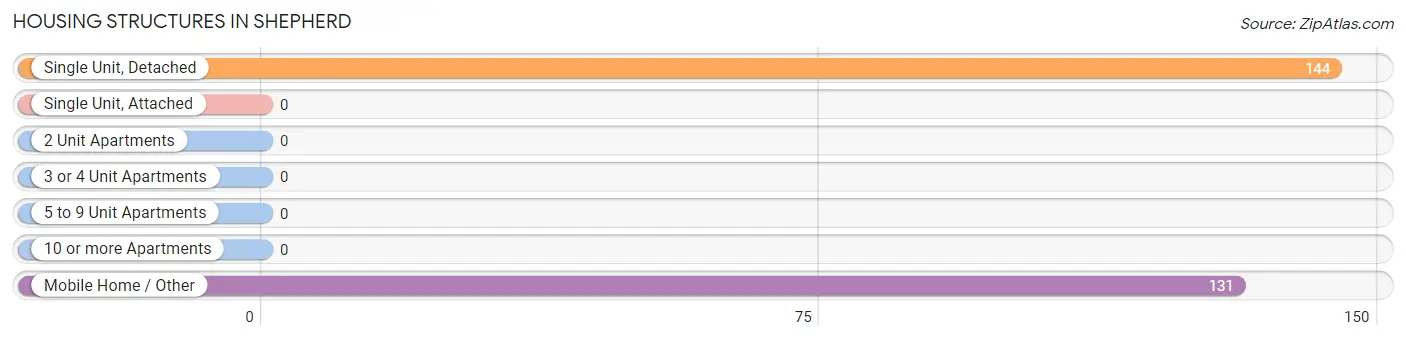
| Structure Type | # Housing Units | % Housing Units |
| Single Unit, Detached | 144 | 52.4% |
| Single Unit, Attached | 0 | 0.0% |
| 2 Unit Apartments | 0 | 0.0% |
| 3 or 4 Unit Apartments | 0 | 0.0% |
| 5 to 9 Unit Apartments | 0 | 0.0% |
| 10 or more Apartments | 0 | 0.0% |
| Mobile Home / Other | 131 | 47.6% |
| Total | 275 | 100.0% |
Housing Structures by Occupancy in Shepherd
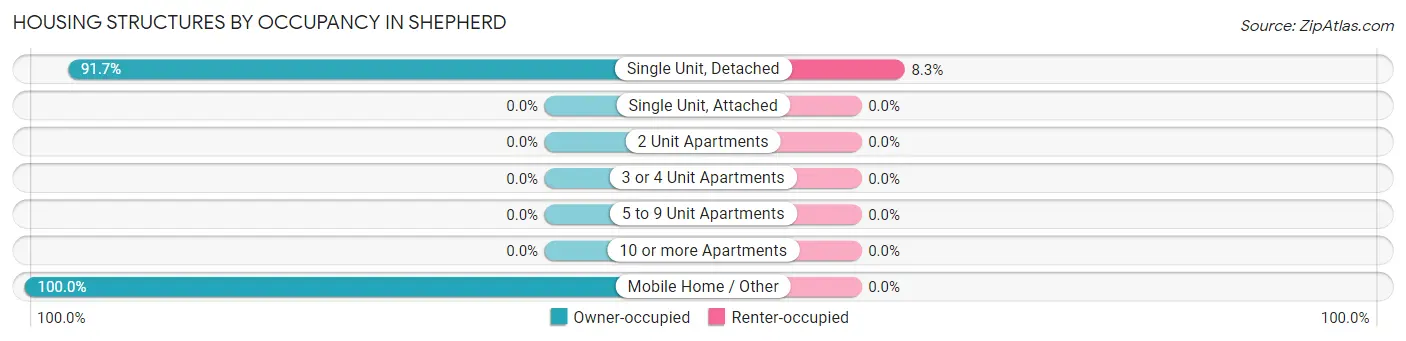
| Structure Type | Owner-occupied | Renter-occupied |
| Single Unit, Detached | 132 (91.7%) | 12 (8.3%) |
| Single Unit, Attached | 0 (0.0%) | 0 (0.0%) |
| 2 Unit Apartments | 0 (0.0%) | 0 (0.0%) |
| 3 or 4 Unit Apartments | 0 (0.0%) | 0 (0.0%) |
| 5 to 9 Unit Apartments | 0 (0.0%) | 0 (0.0%) |
| 10 or more Apartments | 0 (0.0%) | 0 (0.0%) |
| Mobile Home / Other | 131 (100.0%) | 0 (0.0%) |
| Total | 263 (95.6%) | 12 (4.4%) |
Housing Structures by Number of Rooms in Shepherd
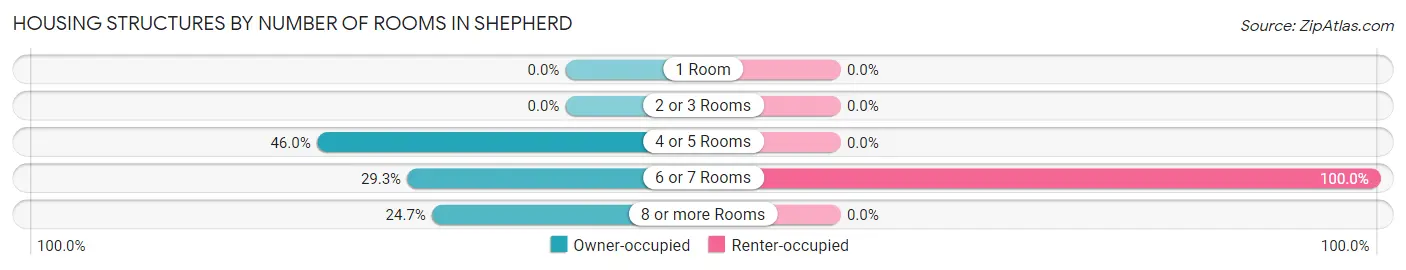
| Number of Rooms | Owner-occupied | Renter-occupied |
| 1 Room | 0 (0.0%) | 0 (0.0%) |
| 2 or 3 Rooms | 0 (0.0%) | 0 (0.0%) |
| 4 or 5 Rooms | 121 (46.0%) | 0 (0.0%) |
| 6 or 7 Rooms | 77 (29.3%) | 12 (100.0%) |
| 8 or more Rooms | 65 (24.7%) | 0 (0.0%) |
| Total | 263 (100.0%) | 12 (100.0%) |
Housing Structure by Heating Type in Shepherd
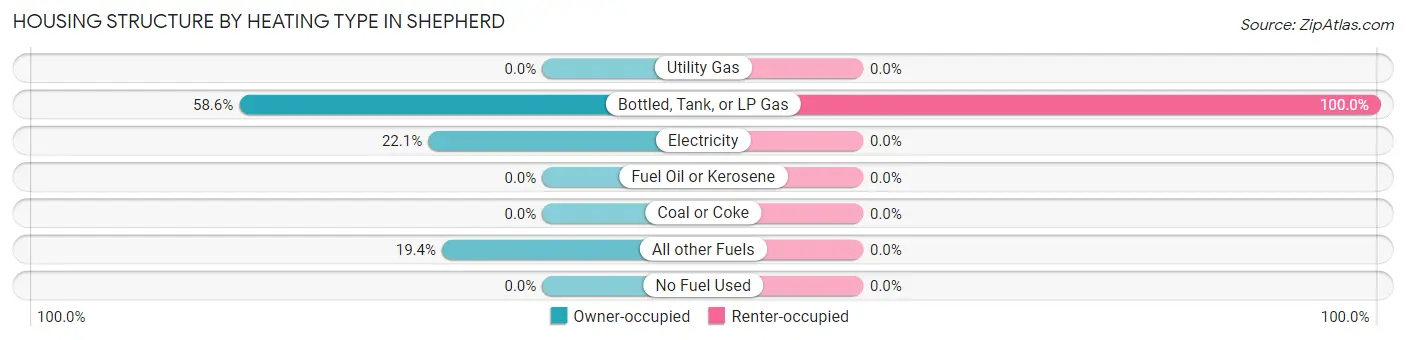
| Heating Type | Owner-occupied | Renter-occupied |
| Utility Gas | 0 (0.0%) | 0 (0.0%) |
| Bottled, Tank, or LP Gas | 154 (58.6%) | 12 (100.0%) |
| Electricity | 58 (22.1%) | 0 (0.0%) |
| Fuel Oil or Kerosene | 0 (0.0%) | 0 (0.0%) |
| Coal or Coke | 0 (0.0%) | 0 (0.0%) |
| All other Fuels | 51 (19.4%) | 0 (0.0%) |
| No Fuel Used | 0 (0.0%) | 0 (0.0%) |
| Total | 263 (100.0%) | 12 (100.0%) |
Household Vehicle Usage in Shepherd
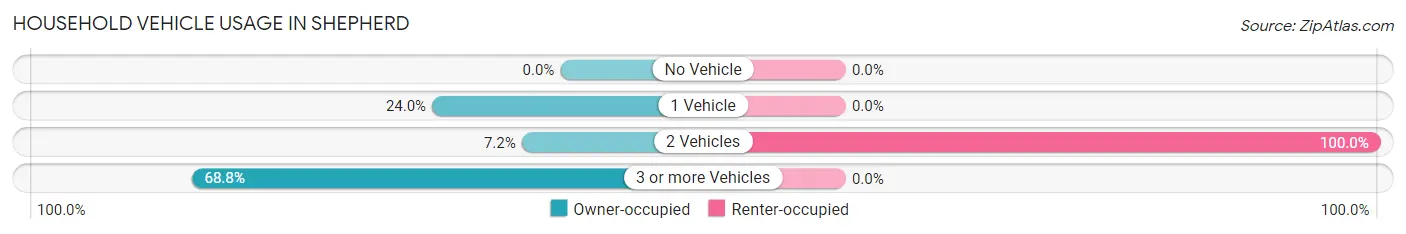
| Vehicles per Household | Owner-occupied | Renter-occupied |
| No Vehicle | 0 (0.0%) | 0 (0.0%) |
| 1 Vehicle | 63 (23.9%) | 0 (0.0%) |
| 2 Vehicles | 19 (7.2%) | 12 (100.0%) |
| 3 or more Vehicles | 181 (68.8%) | 0 (0.0%) |
| Total | 263 (100.0%) | 12 (100.0%) |
Real Estate & Mortgages in Shepherd
Real Estate and Mortgage Overview in Shepherd
| Characteristic | Without Mortgage | With Mortgage |
| Housing Units | 131 | 132 |
| Median Property Value | $115,000 | $320,800 |
| Median Household Income | - | - |
| Monthly Housing Costs | - | - |
| Real Estate Taxes | $990 | $0 |
Property Value by Mortgage Status in Shepherd
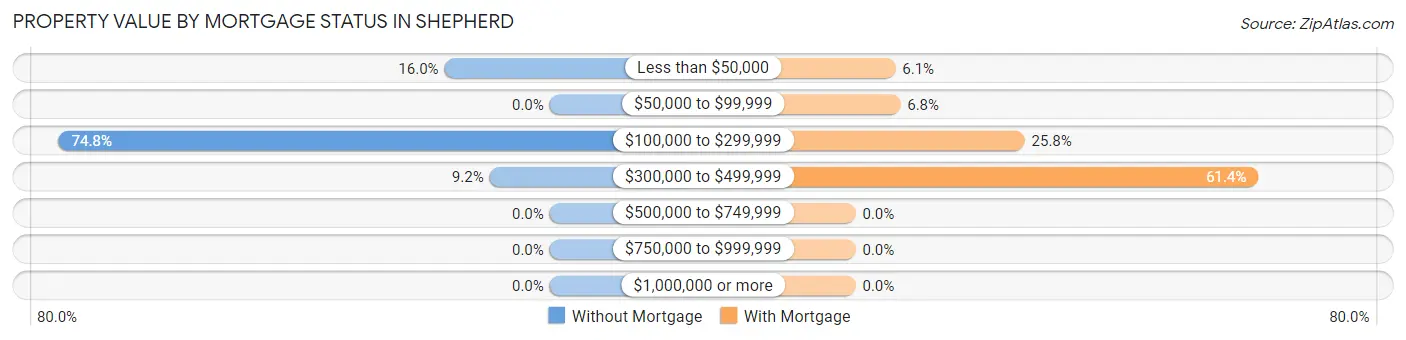
| Property Value | Without Mortgage | With Mortgage |
| Less than $50,000 | 21 (16.0%) | 8 (6.1%) |
| $50,000 to $99,999 | 0 (0.0%) | 9 (6.8%) |
| $100,000 to $299,999 | 98 (74.8%) | 34 (25.8%) |
| $300,000 to $499,999 | 12 (9.2%) | 81 (61.4%) |
| $500,000 to $749,999 | 0 (0.0%) | 0 (0.0%) |
| $750,000 to $999,999 | 0 (0.0%) | 0 (0.0%) |
| $1,000,000 or more | 0 (0.0%) | 0 (0.0%) |
| Total | 131 (100.0%) | 132 (100.0%) |
Household Income by Mortgage Status in Shepherd
| Household Income | Without Mortgage | With Mortgage |
| Less than $10,000 | 0 (0.0%) | 0 (0.0%) |
| $10,000 to $24,999 | 38 (29.0%) | 0 (0.0%) |
| $25,000 to $34,999 | 0 (0.0%) | 9 (6.8%) |
| $35,000 to $49,999 | 12 (9.2%) | 0 (0.0%) |
| $50,000 to $74,999 | 7 (5.3%) | 0 (0.0%) |
| $75,000 to $99,999 | 0 (0.0%) | 7 (5.3%) |
| $100,000 to $149,999 | 22 (16.8%) | 26 (19.7%) |
| $150,000 or more | 52 (39.7%) | 45 (34.1%) |
| Total | 131 (100.0%) | 132 (100.0%) |
Property Value to Household Income Ratio in Shepherd
| Value-to-Income Ratio | Without Mortgage | With Mortgage |
| Less than 2.0x | 95 (72.5%) | 102,308 (77,506.1%) |
| 2.0x to 2.9x | 0 (0.0%) | 42 (31.8%) |
| 3.0x to 3.9x | 0 (0.0%) | 48 (36.4%) |
| 4.0x or more | 36 (27.5%) | 26 (19.7%) |
| Total | 131 (100.0%) | 132 (100.0%) |
Real Estate Taxes by Mortgage Status in Shepherd
| Property Taxes | Without Mortgage | With Mortgage |
| Less than $800 | 38 (29.0%) | 0 (0.0%) |
| $800 to $1,499 | 81 (61.8%) | 17 (12.9%) |
| $800 to $1,499 | 12 (9.2%) | 26 (19.7%) |
| Total | 131 (100.0%) | 132 (100.0%) |
Health & Disability in Shepherd
Health Insurance Coverage by Age in Shepherd
| Age Bracket | With Coverage | Without Coverage |
| Under 6 Years | 99 (100.0%) | 0 (0.0%) |
| 6 to 18 Years | 132 (94.3%) | 8 (5.7%) |
| 19 to 25 Years | 59 (100.0%) | 0 (0.0%) |
| 26 to 34 Years | 51 (86.4%) | 8 (13.6%) |
| 35 to 44 Years | 53 (61.6%) | 33 (38.4%) |
| 45 to 54 Years | 188 (89.5%) | 22 (10.5%) |
| 55 to 64 Years | 39 (100.0%) | 0 (0.0%) |
| 65 to 74 Years | 73 (100.0%) | 0 (0.0%) |
| 75 Years and older | 7 (100.0%) | 0 (0.0%) |
| Total | 701 (90.8%) | 71 (9.2%) |
Health Insurance Coverage by Citizenship Status in Shepherd
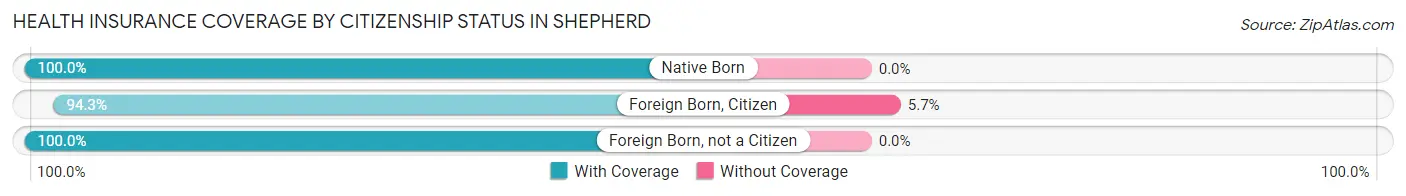
| Citizenship Status | With Coverage | Without Coverage |
| Native Born | 99 (100.0%) | 0 (0.0%) |
| Foreign Born, Citizen | 132 (94.3%) | 8 (5.7%) |
| Foreign Born, not a Citizen | 59 (100.0%) | 0 (0.0%) |
Health Insurance Coverage by Household Income in Shepherd
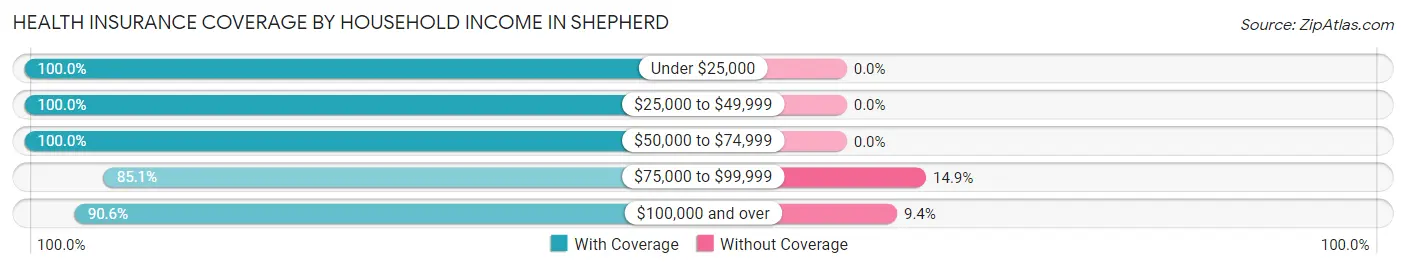
| Household Income | With Coverage | Without Coverage |
| Under $25,000 | 78 (100.0%) | 0 (0.0%) |
| $25,000 to $49,999 | 12 (100.0%) | 0 (0.0%) |
| $50,000 to $74,999 | 29 (100.0%) | 0 (0.0%) |
| $75,000 to $99,999 | 149 (85.1%) | 26 (14.9%) |
| $100,000 and over | 433 (90.6%) | 45 (9.4%) |
Public vs Private Health Insurance Coverage by Age in Shepherd
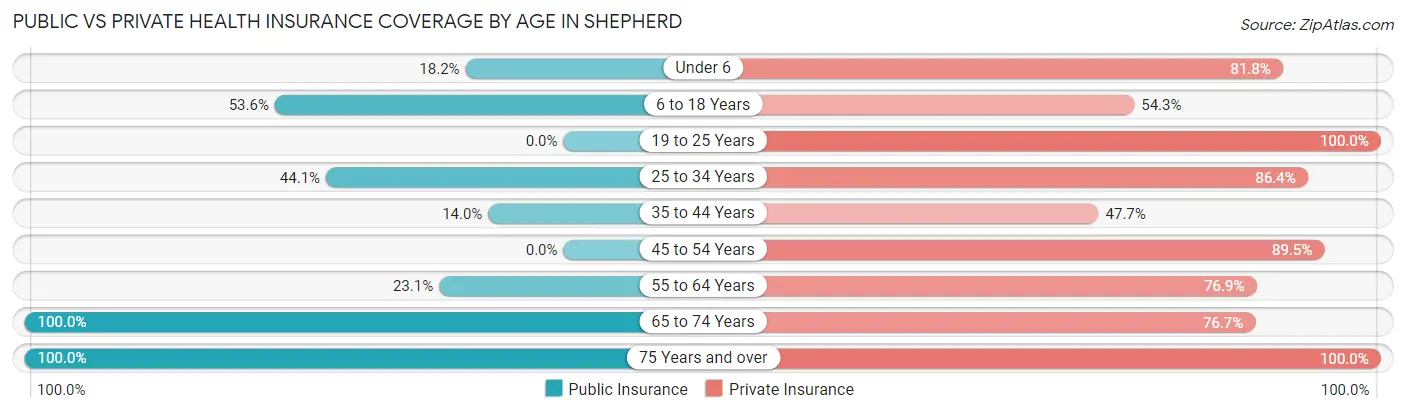
| Age Bracket | Public Insurance | Private Insurance |
| Under 6 | 18 (18.2%) | 81 (81.8%) |
| 6 to 18 Years | 75 (53.6%) | 76 (54.3%) |
| 19 to 25 Years | 0 (0.0%) | 59 (100.0%) |
| 25 to 34 Years | 26 (44.1%) | 51 (86.4%) |
| 35 to 44 Years | 12 (14.0%) | 41 (47.7%) |
| 45 to 54 Years | 0 (0.0%) | 188 (89.5%) |
| 55 to 64 Years | 9 (23.1%) | 30 (76.9%) |
| 65 to 74 Years | 73 (100.0%) | 56 (76.7%) |
| 75 Years and over | 7 (100.0%) | 7 (100.0%) |
| Total | 220 (28.5%) | 589 (76.3%) |
Disability Status by Sex by Age in Shepherd
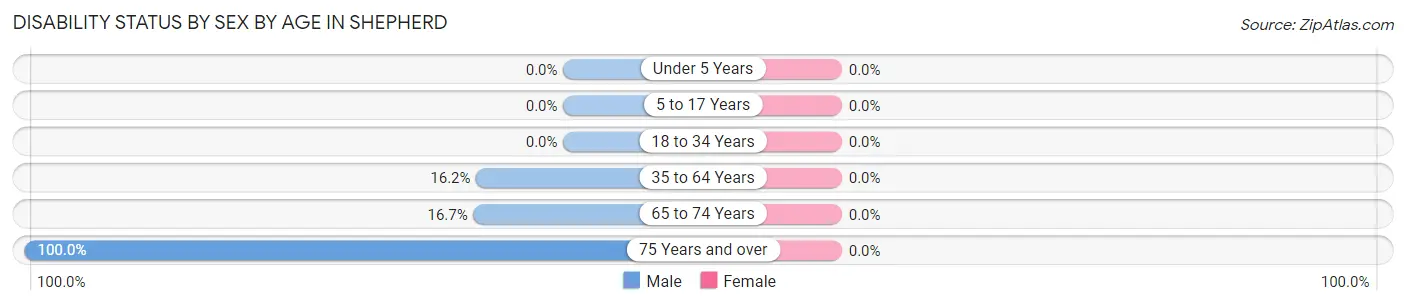
| Age Bracket | Male | Female |
| Under 5 Years | 0 (0.0%) | 0 (0.0%) |
| 5 to 17 Years | 0 (0.0%) | 0 (0.0%) |
| 18 to 34 Years | 0 (0.0%) | 0 (0.0%) |
| 35 to 64 Years | 21 (16.2%) | 0 (0.0%) |
| 65 to 74 Years | 9 (16.7%) | 0 (0.0%) |
| 75 Years and over | 7 (100.0%) | 0 (0.0%) |
Disability Class by Sex by Age in Shepherd
Disability Class: Hearing Difficulty
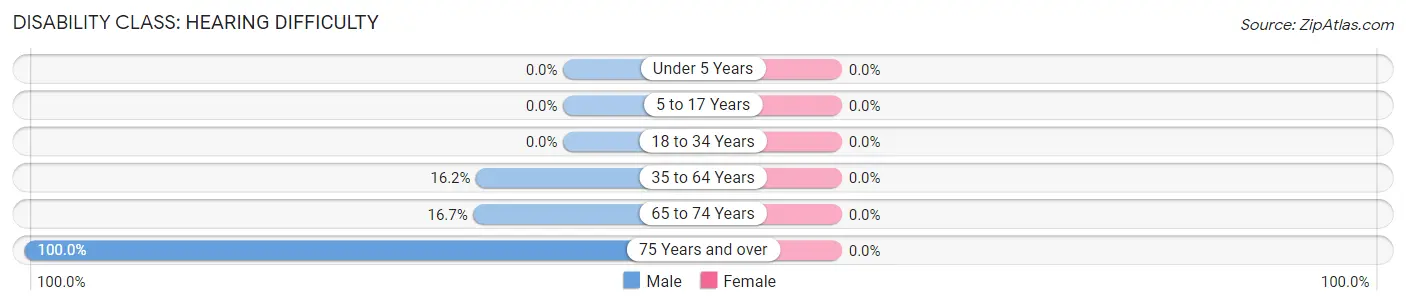
| Age Bracket | Male | Female |
| Under 5 Years | 0 (0.0%) | 0 (0.0%) |
| 5 to 17 Years | 0 (0.0%) | 0 (0.0%) |
| 18 to 34 Years | 0 (0.0%) | 0 (0.0%) |
| 35 to 64 Years | 21 (16.2%) | 0 (0.0%) |
| 65 to 74 Years | 9 (16.7%) | 0 (0.0%) |
| 75 Years and over | 7 (100.0%) | 0 (0.0%) |
Disability Class: Vision Difficulty
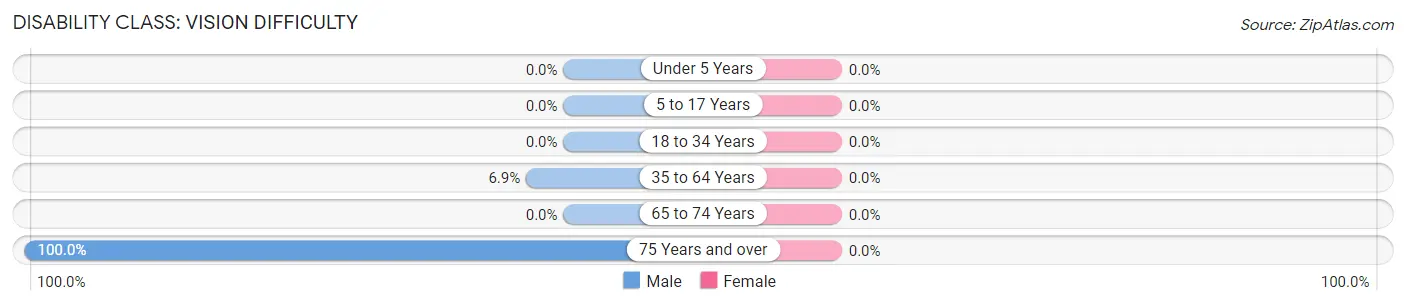
| Age Bracket | Male | Female |
| Under 5 Years | 0 (0.0%) | 0 (0.0%) |
| 5 to 17 Years | 0 (0.0%) | 0 (0.0%) |
| 18 to 34 Years | 0 (0.0%) | 0 (0.0%) |
| 35 to 64 Years | 9 (6.9%) | 0 (0.0%) |
| 65 to 74 Years | 0 (0.0%) | 0 (0.0%) |
| 75 Years and over | 7 (100.0%) | 0 (0.0%) |
Disability Class: Cognitive Difficulty
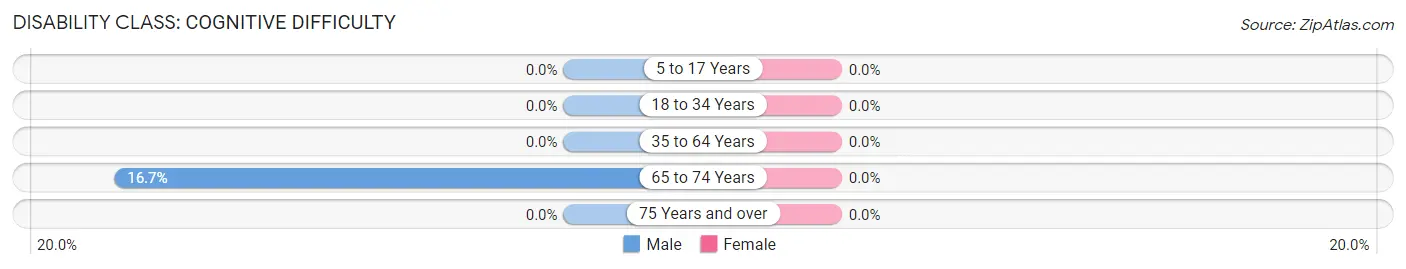
| Age Bracket | Male | Female |
| 5 to 17 Years | 0 (0.0%) | 0 (0.0%) |
| 18 to 34 Years | 0 (0.0%) | 0 (0.0%) |
| 35 to 64 Years | 0 (0.0%) | 0 (0.0%) |
| 65 to 74 Years | 9 (16.7%) | 0 (0.0%) |
| 75 Years and over | 0 (0.0%) | 0 (0.0%) |
Disability Class: Ambulatory Difficulty
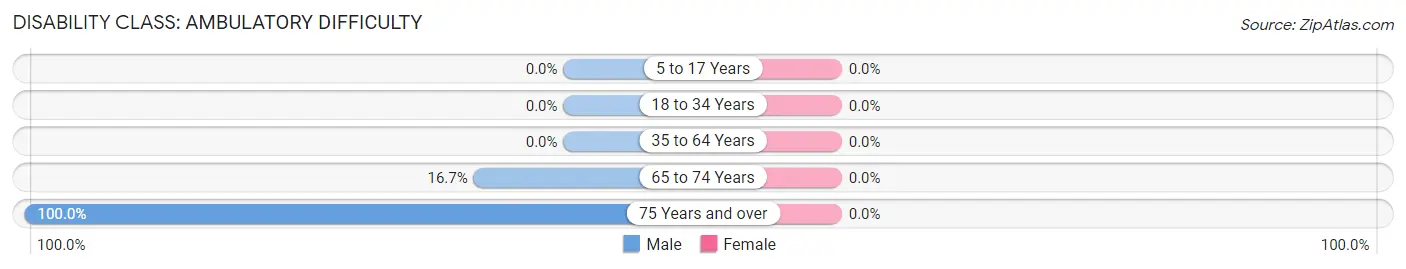
| Age Bracket | Male | Female |
| 5 to 17 Years | 0 (0.0%) | 0 (0.0%) |
| 18 to 34 Years | 0 (0.0%) | 0 (0.0%) |
| 35 to 64 Years | 0 (0.0%) | 0 (0.0%) |
| 65 to 74 Years | 9 (16.7%) | 0 (0.0%) |
| 75 Years and over | 7 (100.0%) | 0 (0.0%) |
Disability Class: Self-Care Difficulty
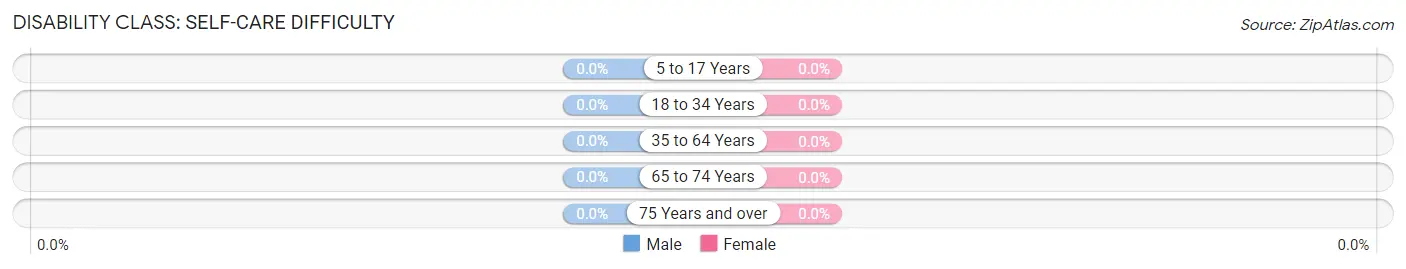
| Age Bracket | Male | Female |
| 5 to 17 Years | 0 (0.0%) | 0 (0.0%) |
| 18 to 34 Years | 0 (0.0%) | 0 (0.0%) |
| 35 to 64 Years | 0 (0.0%) | 0 (0.0%) |
| 65 to 74 Years | 0 (0.0%) | 0 (0.0%) |
| 75 Years and over | 0 (0.0%) | 0 (0.0%) |
Technology Access in Shepherd
Computing Device Access in Shepherd
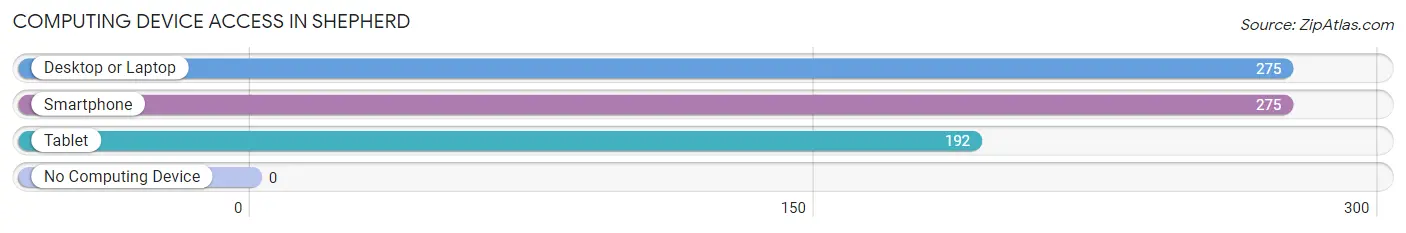
| Device Type | # Households | % Households |
| Desktop or Laptop | 275 | 100.0% |
| Smartphone | 275 | 100.0% |
| Tablet | 192 | 69.8% |
| No Computing Device | 0 | 0.0% |
| Total | 275 | 100.0% |
Internet Access in Shepherd
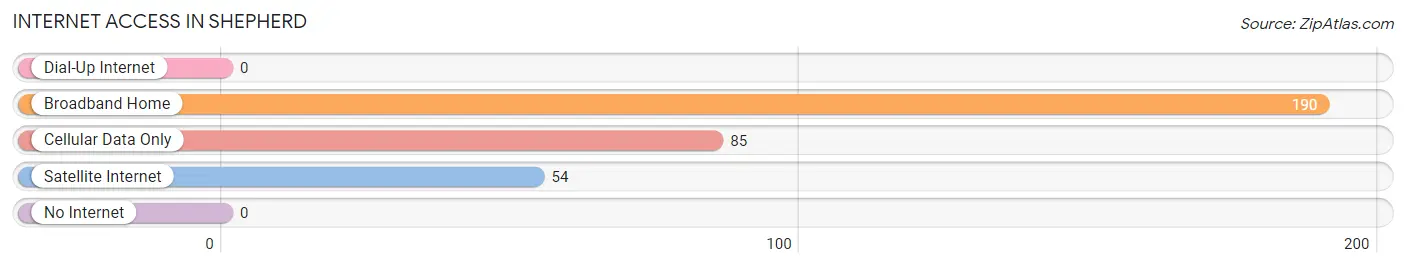
| Internet Type | # Households | % Households |
| Dial-Up Internet | 0 | 0.0% |
| Broadband Home | 190 | 69.1% |
| Cellular Data Only | 85 | 30.9% |
| Satellite Internet | 54 | 19.6% |
| No Internet | 0 | 0.0% |
| Total | 275 | 100.0% |
Shepherd Summary
Shepherd, Montana is a small town located in Yellowstone County, in the south-central part of the state. It is situated on the banks of the Yellowstone River, about 20 miles east of Billings. The town was founded in 1882 and has a population of about 1,500 people.
The area around Shepherd was first inhabited by Native Americans, including the Crow, Cheyenne, and Sioux tribes. The first white settlers arrived in the area in the late 1800s, and the town was officially founded in 1882. The town was named after a local rancher, William Shepherd, who had a large ranch in the area.
The economy of Shepherd is largely based on agriculture and ranching. The town is home to several large farms and ranches, as well as a number of smaller family-owned operations. The town also has a few small businesses, including a grocery store, a hardware store, and a few restaurants.
The climate in Shepherd is typical of the northern Great Plains, with cold winters and hot summers. The average annual temperature is around 45 degrees Fahrenheit, and the average annual precipitation is around 16 inches.
The population of Shepherd is mostly white, with a small percentage of African Americans, Native Americans, and Hispanics. The median household income is around $45,000, and the median home value is around $150,000. The town has a low unemployment rate, and the poverty rate is below the national average.
Shepherd is served by the Shepherd School District, which includes two elementary schools, a middle school, and a high school. The town also has a public library, a post office, and a few churches.
Shepherd is a small town with a rich history and a strong sense of community. It is a great place to live and raise a family, and it offers a variety of activities and attractions for visitors. From its beautiful scenery to its friendly people, Shepherd is a great place to call home.
Common Questions
What is Per Capita Income in Shepherd?
Per Capita income in Shepherd is $41,144.
What is the Median Family Income in Shepherd?
Median Family Income in Shepherd is $149,800.
What is the Median Household income in Shepherd?
Median Household Income in Shepherd is $125,179.
What is Inequality or Gini Index in Shepherd?
Inequality or Gini Index in Shepherd is 0.38.
What is the Total Population of Shepherd?
Total Population of Shepherd is 772.
What is the Total Male Population of Shepherd?
Total Male Population of Shepherd is 374.
What is the Total Female Population of Shepherd?
Total Female Population of Shepherd is 398.
What is the Ratio of Males per 100 Females in Shepherd?
There are 93.97 Males per 100 Females in Shepherd.
What is the Ratio of Females per 100 Males in Shepherd?
There are 106.42 Females per 100 Males in Shepherd.
What is the Median Population Age in Shepherd?
Median Population Age in Shepherd is 40.5 Years.
What is the Average Family Size in Shepherd
Average Family Size in Shepherd is 3.5 People.
What is the Average Household Size in Shepherd
Average Household Size in Shepherd is 2.8 People.
How Large is the Labor Force in Shepherd?
There are 394 People in the Labor Forcein in Shepherd.
What is the Percentage of People in the Labor Force in Shepherd?
73.9% of People are in the Labor Force in Shepherd.
What is the Unemployment Rate in Shepherd?
Unemployment Rate in Shepherd is 6.3%.