Babb, MT Map & Demographics
Babb Map
Babb Overview
$21,736
PER CAPITA INCOME
$59,659
AVG FAMILY INCOME
0.33
INEQUALITY / GINI INDEX
271
TOTAL POPULATION
98
MALE POPULATION
173
FEMALE POPULATION
56.65
MALES / 100 FEMALES
176.53
FEMALES / 100 MALES
32.8
MEDIAN AGE
6.5
AVG FAMILY SIZE
4.0
AVG HOUSEHOLD SIZE
103
LABOR FORCE [ PEOPLE ]
50.2%
PERCENT IN LABOR FORCE
Babb Zip Codes
Babb Area Codes
Income in Babb
Income Overview in Babb
| Characteristic | Number | Measure |
| Per Capita Income | 271 | $21,736 |
| Median Family Income | 35 | $59,659 |
| Mean Family Income | 35 | $54,449 |
| Median Household Income | 67 | $0 |
| Mean Household Income | 67 | $54,236 |
| Income Deficit | 35 | $0 |
| Wage / Income Gap (%) | 271 | 0.00% |
| Wage / Income Gap ($) | 271 | 100.00¢ per $1 |
| Gini / Inequality Index | 271 | 0.33 |
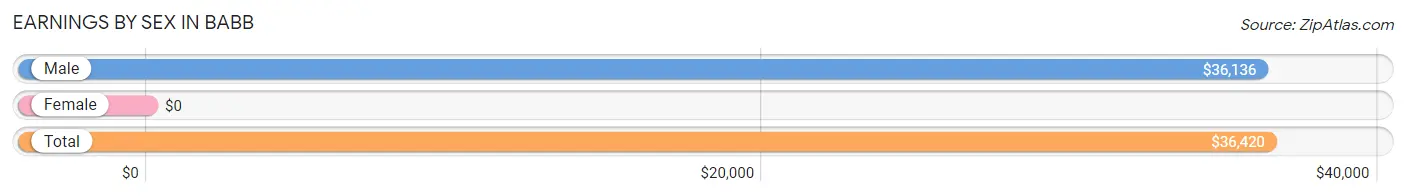
Earnings by Sex in Babb
| Sex | Number | Average Earnings |
| Male | 66 (50.0%) | $36,136 |
| Female | 66 (50.0%) | $0 |
| Total | 132 (100.0%) | $36,420 |
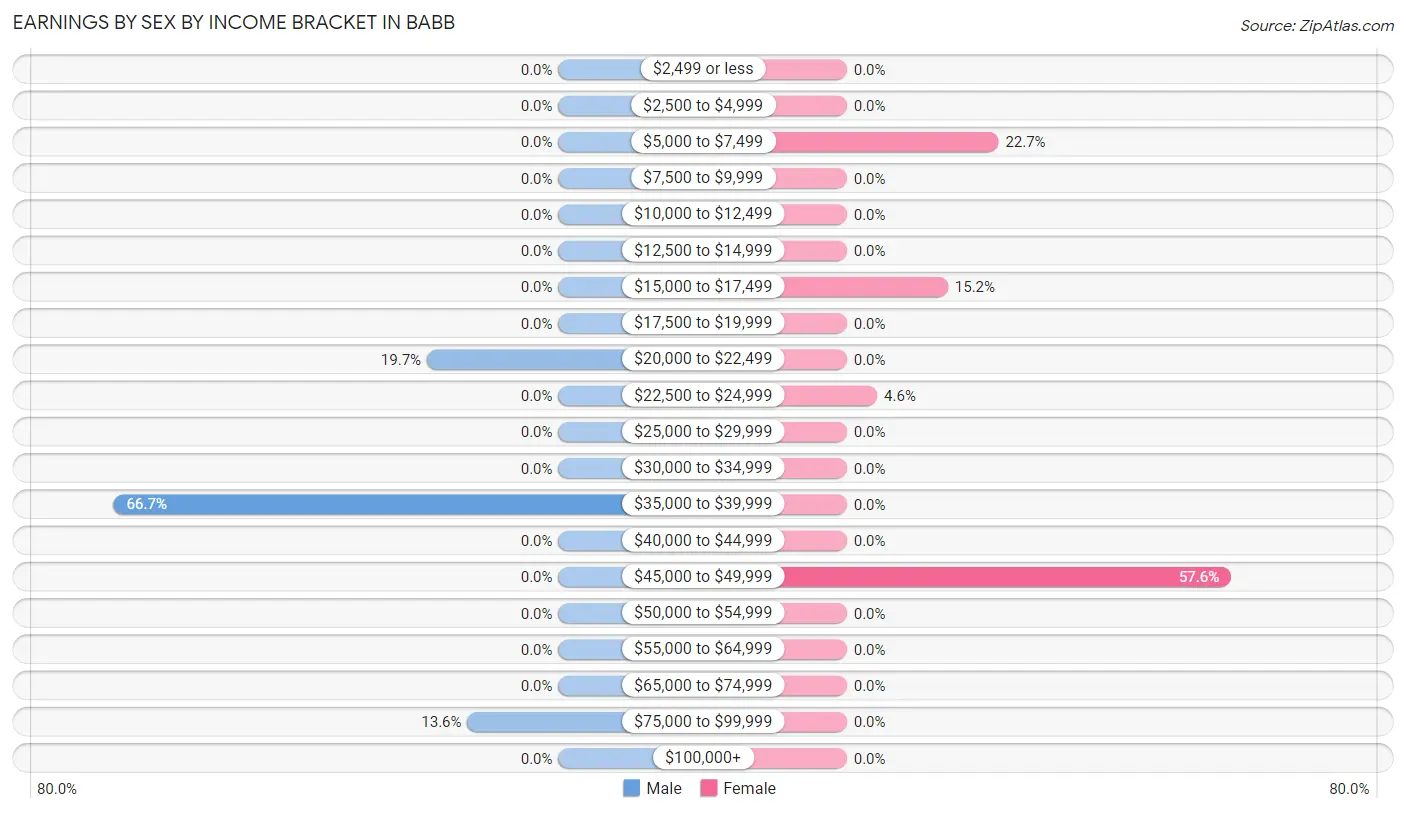
Earnings by Sex by Income Bracket in Babb
The most common earnings brackets in Babb are $35,000 to $39,999 for men (44 | 66.7%) and $45,000 to $49,999 for women (38 | 57.6%).
| Income | Male | Female |
| $2,499 or less | 0 (0.0%) | 0 (0.0%) |
| $2,500 to $4,999 | 0 (0.0%) | 0 (0.0%) |
| $5,000 to $7,499 | 0 (0.0%) | 15 (22.7%) |
| $7,500 to $9,999 | 0 (0.0%) | 0 (0.0%) |
| $10,000 to $12,499 | 0 (0.0%) | 0 (0.0%) |
| $12,500 to $14,999 | 0 (0.0%) | 0 (0.0%) |
| $15,000 to $17,499 | 0 (0.0%) | 10 (15.1%) |
| $17,500 to $19,999 | 0 (0.0%) | 0 (0.0%) |
| $20,000 to $22,499 | 13 (19.7%) | 0 (0.0%) |
| $22,500 to $24,999 | 0 (0.0%) | 3 (4.5%) |
| $25,000 to $29,999 | 0 (0.0%) | 0 (0.0%) |
| $30,000 to $34,999 | 0 (0.0%) | 0 (0.0%) |
| $35,000 to $39,999 | 44 (66.7%) | 0 (0.0%) |
| $40,000 to $44,999 | 0 (0.0%) | 0 (0.0%) |
| $45,000 to $49,999 | 0 (0.0%) | 38 (57.6%) |
| $50,000 to $54,999 | 0 (0.0%) | 0 (0.0%) |
| $55,000 to $64,999 | 0 (0.0%) | 0 (0.0%) |
| $65,000 to $74,999 | 0 (0.0%) | 0 (0.0%) |
| $75,000 to $99,999 | 9 (13.6%) | 0 (0.0%) |
| $100,000+ | 0 (0.0%) | 0 (0.0%) |
| Total | 66 (100.0%) | 66 (100.0%) |
Earnings by Sex by Educational Attainment in Babb
| Educational Attainment | Male Income | Female Income |
| Less than High School | - | - |
| High School Diploma | - | - |
| College or Associate's Degree | - | - |
| Bachelor's Degree | - | - |
| Graduate Degree | - | - |
| Total | $36,136 | $45,822 |
Family Income in Babb
Family Income Brackets in Babb
According to the Babb family income data, there are 24 families falling into the $50,000 to $74,999 income range, which is the most common income bracket and makes up 68.6% of all families.
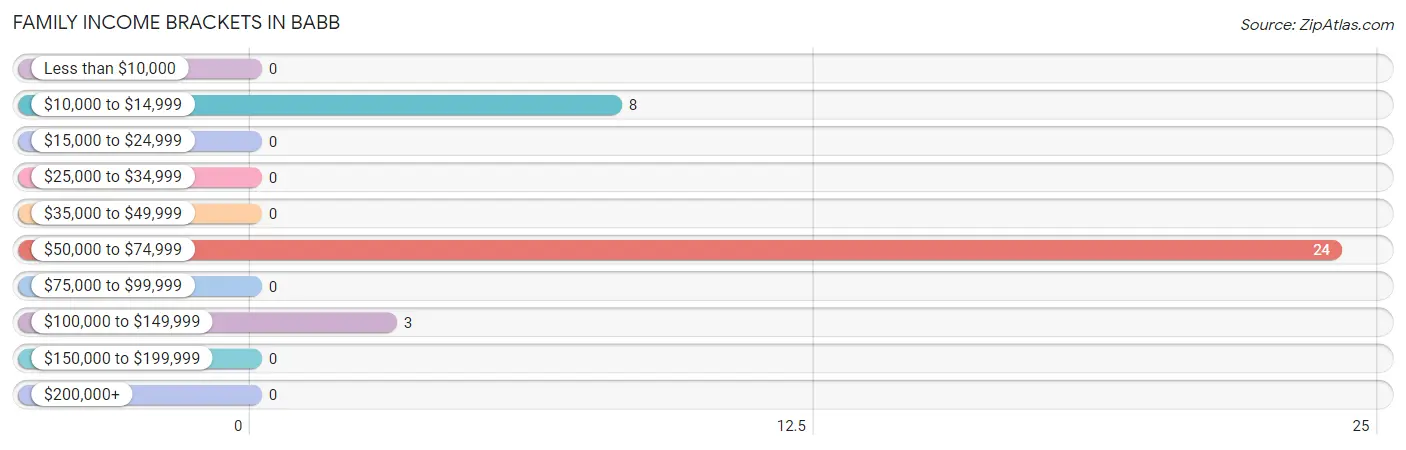
| Income Bracket | # Families | % Families |
| Less than $10,000 | 0 | 0.0% |
| $10,000 to $14,999 | 8 | 22.9% |
| $15,000 to $24,999 | 0 | 0.0% |
| $25,000 to $34,999 | 0 | 0.0% |
| $35,000 to $49,999 | 0 | 0.0% |
| $50,000 to $74,999 | 24 | 68.6% |
| $75,000 to $99,999 | 0 | 0.0% |
| $100,000 to $149,999 | 3 | 8.6% |
| $150,000 to $199,999 | 0 | 0.0% |
| $200,000+ | 0 | 0.0% |
Family Income by Famaliy Size in Babb
| Income Bracket | # Families | Median Income |
| 2-Person Families | 19 (54.3%) | $0 |
| 3-Person Families | 0 (0.0%) | $0 |
| 4-Person Families | 13 (37.1%) | $0 |
| 5-Person Families | 0 (0.0%) | $0 |
| 6-Person Families | 3 (8.6%) | $0 |
| 7+ Person Families | 0 (0.0%) | $0 |
| Total | 35 (100.0%) | $59,659 |
Family Income by Number of Earners in Babb
| Number of Earners | # Families | Median Income |
| No Earners | 19 (54.3%) | $0 |
| 1 Earner | 0 (0.0%) | $0 |
| 2 Earners | 0 (0.0%) | $0 |
| 3+ Earners | 16 (45.7%) | $0 |
| Total | 35 (100.0%) | $59,659 |
Household Income in Babb
Household Income Brackets in Babb
With 24 households falling in the category, the $50,000 to $74,999 income range is the most frequent in Babb, accounting for 35.8% of all households.
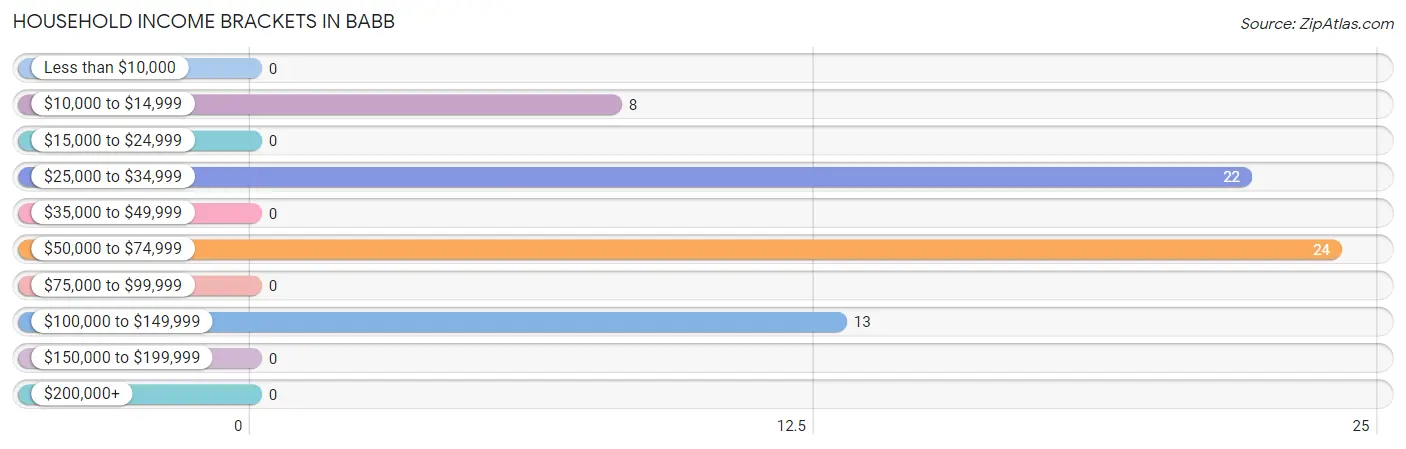
| Income Bracket | # Households | % Households |
| Less than $10,000 | 0 | 0.0% |
| $10,000 to $14,999 | 8 | 11.9% |
| $15,000 to $24,999 | 0 | 0.0% |
| $25,000 to $34,999 | 22 | 32.8% |
| $35,000 to $49,999 | 0 | 0.0% |
| $50,000 to $74,999 | 24 | 35.8% |
| $75,000 to $99,999 | 0 | 0.0% |
| $100,000 to $149,999 | 13 | 19.4% |
| $150,000 to $199,999 | 0 | 0.0% |
| $200,000+ | 0 | 0.0% |
Household Income by Householder Age in Babb
The median household income in Babb is $0, with the highest median household income of $83,750 found in the 45 to 64 years age bracket for the primary householder. A total of 26 households (38.8%) fall into this category.
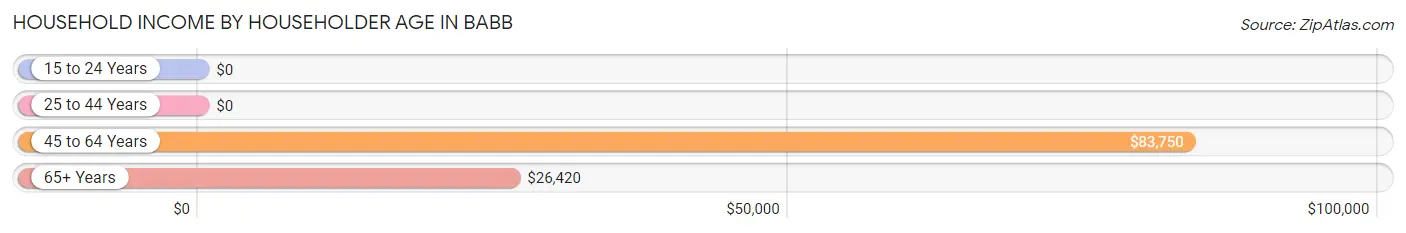
| Income Bracket | # Households | Median Income |
| 15 to 24 Years | 0 (0.0%) | $0 |
| 25 to 44 Years | 0 (0.0%) | $0 |
| 45 to 64 Years | 26 (38.8%) | $83,750 |
| 65+ Years | 41 (61.2%) | $26,420 |
| Total | 67 (100.0%) | $0 |
Poverty in Babb
Income Below Poverty by Sex and Age in Babb
With 16.3% poverty level for males and 4.6% for females among the residents of Babb, 65 to 74 year old males and 75 year old and over females are the most vulnerable to poverty, with 1 males (100.0%) and 8 females (19.5%) in their respective age groups living below the poverty level.
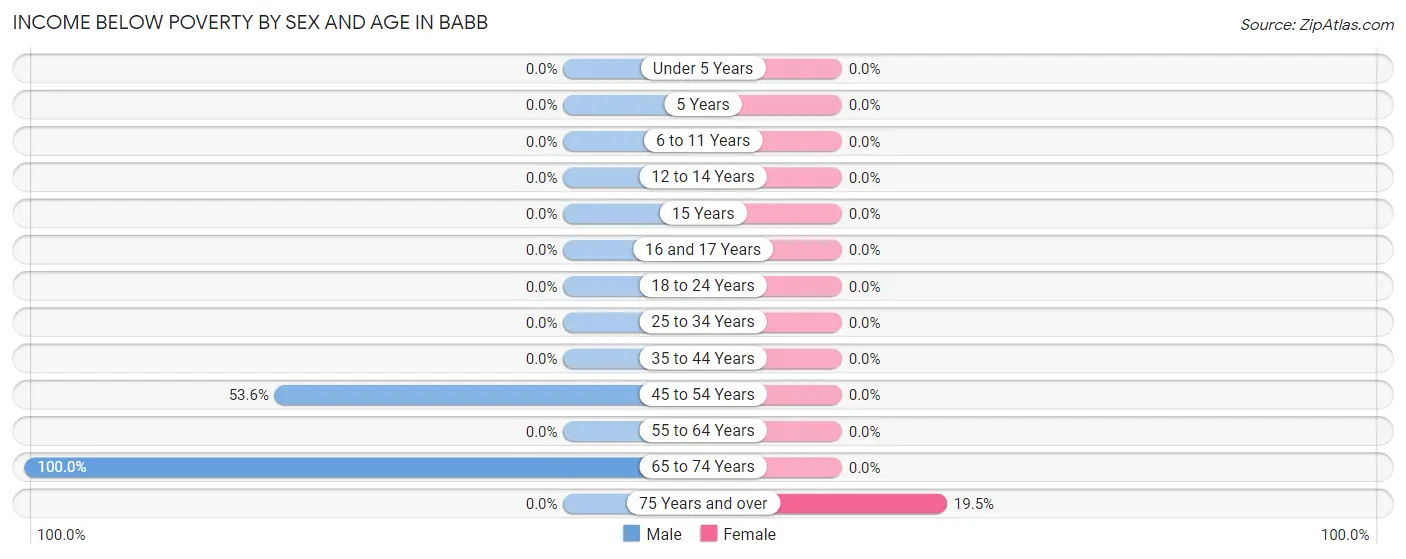
| Age Bracket | Male | Female |
| Under 5 Years | 0 (0.0%) | 0 (0.0%) |
| 5 Years | 0 (0.0%) | 0 (0.0%) |
| 6 to 11 Years | 0 (0.0%) | 0 (0.0%) |
| 12 to 14 Years | 0 (0.0%) | 0 (0.0%) |
| 15 Years | 0 (0.0%) | 0 (0.0%) |
| 16 and 17 Years | 0 (0.0%) | 0 (0.0%) |
| 18 to 24 Years | 0 (0.0%) | 0 (0.0%) |
| 25 to 34 Years | 0 (0.0%) | 0 (0.0%) |
| 35 to 44 Years | 0 (0.0%) | 0 (0.0%) |
| 45 to 54 Years | 15 (53.6%) | 0 (0.0%) |
| 55 to 64 Years | 0 (0.0%) | 0 (0.0%) |
| 65 to 74 Years | 1 (100.0%) | 0 (0.0%) |
| 75 Years and over | 0 (0.0%) | 8 (19.5%) |
| Total | 16 (16.3%) | 8 (4.6%) |
Income Above Poverty by Sex and Age in Babb
According to the poverty statistics in Babb, males aged 25 to 34 years and females aged under 5 years are the age groups that are most secure financially, with 100.0% of males and 100.0% of females in these age groups living above the poverty line.
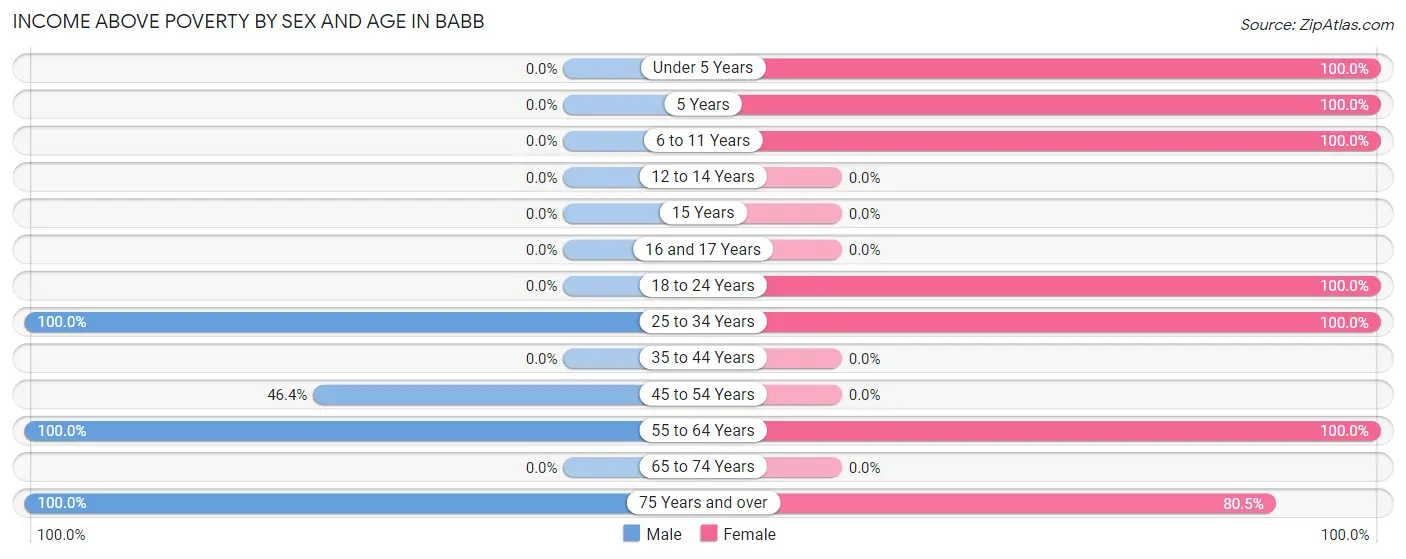
| Age Bracket | Male | Female |
| Under 5 Years | 0 (0.0%) | 28 (100.0%) |
| 5 Years | 0 (0.0%) | 24 (100.0%) |
| 6 to 11 Years | 0 (0.0%) | 14 (100.0%) |
| 12 to 14 Years | 0 (0.0%) | 0 (0.0%) |
| 15 Years | 0 (0.0%) | 0 (0.0%) |
| 16 and 17 Years | 0 (0.0%) | 0 (0.0%) |
| 18 to 24 Years | 0 (0.0%) | 15 (100.0%) |
| 25 to 34 Years | 44 (100.0%) | 38 (100.0%) |
| 35 to 44 Years | 0 (0.0%) | 0 (0.0%) |
| 45 to 54 Years | 13 (46.4%) | 0 (0.0%) |
| 55 to 64 Years | 15 (100.0%) | 13 (100.0%) |
| 65 to 74 Years | 0 (0.0%) | 0 (0.0%) |
| 75 Years and over | 10 (100.0%) | 33 (80.5%) |
| Total | 82 (83.7%) | 165 (95.4%) |
Income Below Poverty Among Married-Couple Families in Babb
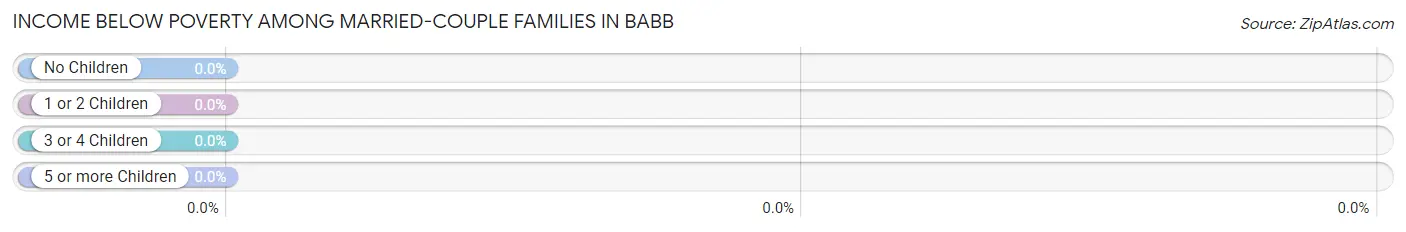
| Children | Above Poverty | Below Poverty |
| No Children | 11 (100.0%) | 0 (0.0%) |
| 1 or 2 Children | 3 (100.0%) | 0 (0.0%) |
| 3 or 4 Children | 0 (0.0%) | 0 (0.0%) |
| 5 or more Children | 0 (0.0%) | 0 (0.0%) |
| Total | 14 (100.0%) | 0 (0.0%) |
Income Below Poverty Among Single-Parent Households in Babb
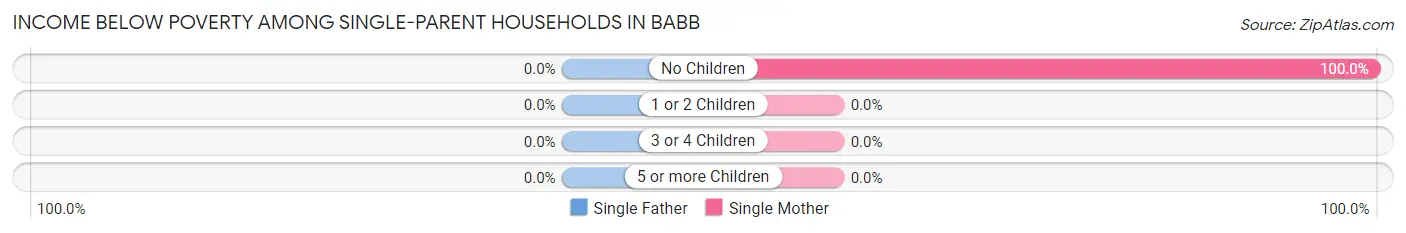
| Children | Single Father | Single Mother |
| No Children | 0 (0.0%) | 8 (100.0%) |
| 1 or 2 Children | 0 (0.0%) | 0 (0.0%) |
| 3 or 4 Children | 0 (0.0%) | 0 (0.0%) |
| 5 or more Children | 0 (0.0%) | 0 (0.0%) |
| Total | 0 (0.0%) | 8 (100.0%) |
Income Below Poverty Among Married-Couple vs Single-Parent Households in Babb
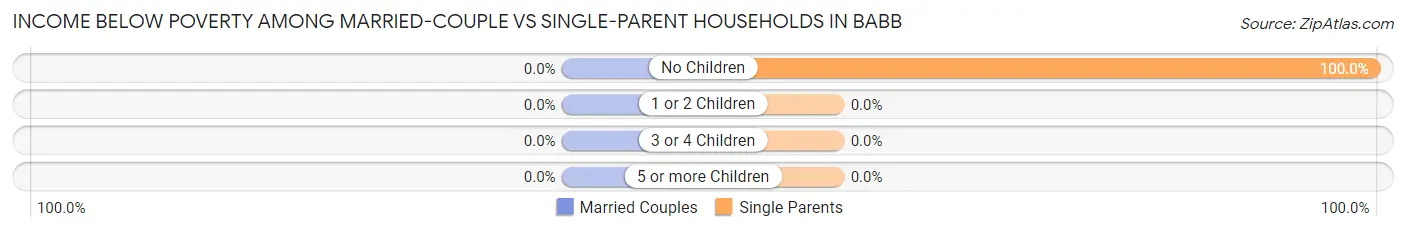
| Children | Married-Couple Families | Single-Parent Households |
| No Children | 0 (0.0%) | 8 (100.0%) |
| 1 or 2 Children | 0 (0.0%) | 0 (0.0%) |
| 3 or 4 Children | 0 (0.0%) | 0 (0.0%) |
| 5 or more Children | 0 (0.0%) | 0 (0.0%) |
| Total | 0 (0.0%) | 8 (38.1%) |
Race in Babb
The most populous races in Babb are Native / Alaskan (250 | 92.2%), Hispanic or Latino (21 | 7.7%), and Some other Race (21 | 7.7%).
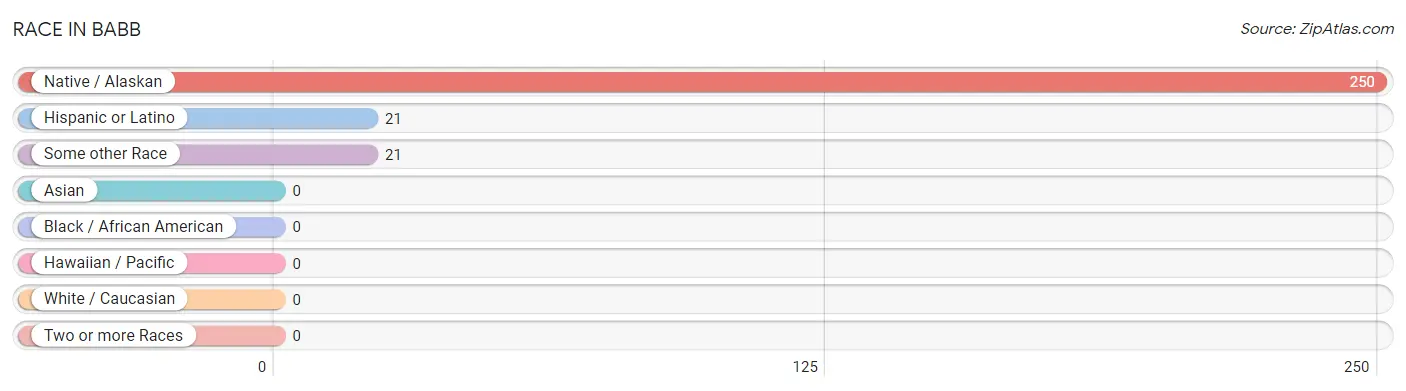
| Race | # Population | % Population |
| Asian | 0 | 0.0% |
| Black / African American | 0 | 0.0% |
| Hawaiian / Pacific | 0 | 0.0% |
| Hispanic or Latino | 21 | 7.7% |
| Native / Alaskan | 250 | 92.2% |
| White / Caucasian | 0 | 0.0% |
| Two or more Races | 0 | 0.0% |
| Some other Race | 21 | 7.7% |
| Total | 271 | 100.0% |
Ancestry in Babb
The most populous ancestries reported in Babb are Blackfeet (128 | 47.2%), Chippewa (77 | 28.4%), Apache (38 | 14.0%), and Cree (6 | 2.2%), together accounting for 91.9% of all Babb residents.
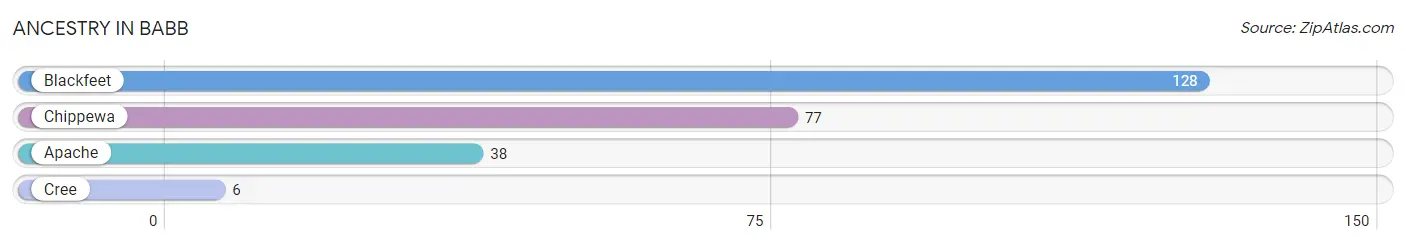
| Ancestry | # Population | % Population |
| Apache | 38 | 14.0% |
| Blackfeet | 128 | 47.2% |
| Chippewa | 77 | 28.4% |
| Cree | 6 | 2.2% | View All 4 Rows |
Immigrants in Babb

| Immigration Origin | # Population | % Population | View All 0 Rows |
Sex and Age in Babb
Sex and Age in Babb
The most populous age groups in Babb are 50 to 54 Years (28 | 28.6%) for men and 30 to 34 Years (38 | 22.0%) for women.
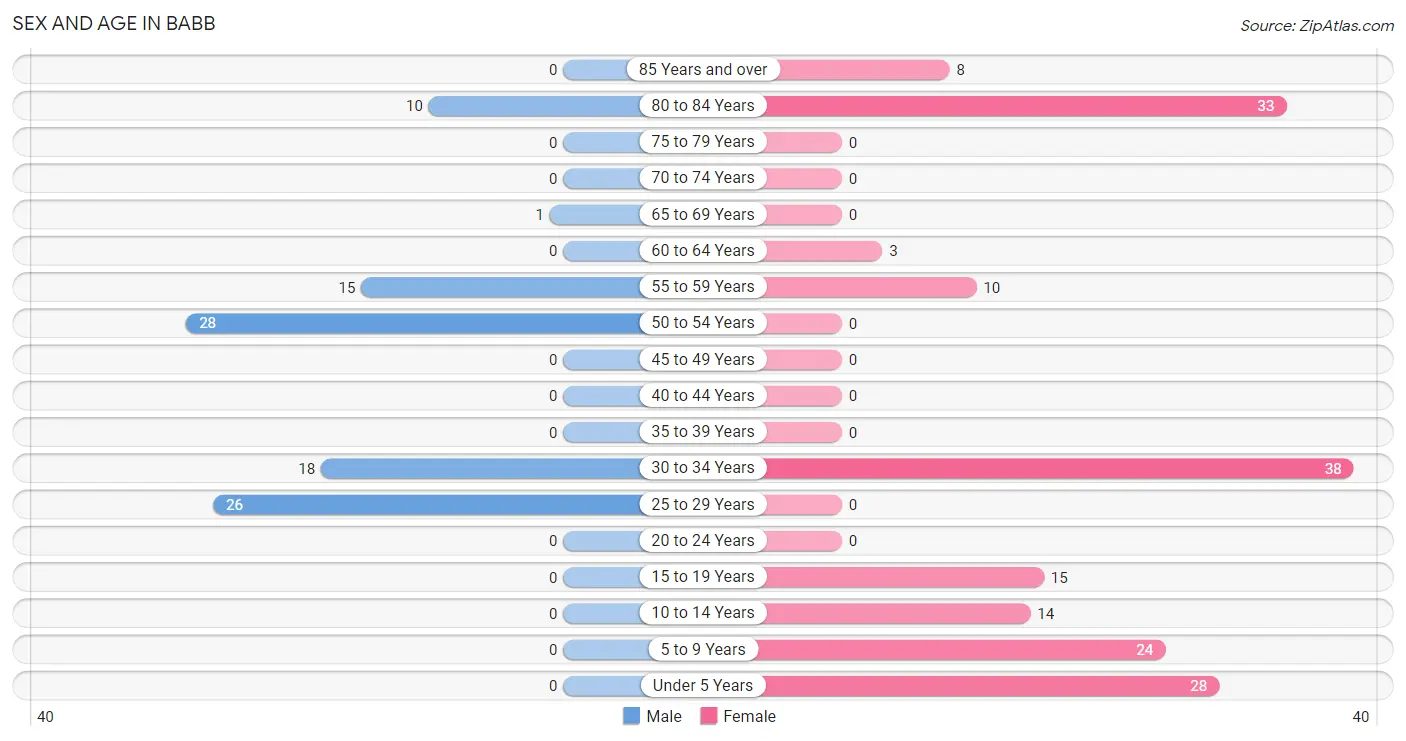
| Age Bracket | Male | Female |
| Under 5 Years | 0 (0.0%) | 28 (16.2%) |
| 5 to 9 Years | 0 (0.0%) | 24 (13.9%) |
| 10 to 14 Years | 0 (0.0%) | 14 (8.1%) |
| 15 to 19 Years | 0 (0.0%) | 15 (8.7%) |
| 20 to 24 Years | 0 (0.0%) | 0 (0.0%) |
| 25 to 29 Years | 26 (26.5%) | 0 (0.0%) |
| 30 to 34 Years | 18 (18.4%) | 38 (22.0%) |
| 35 to 39 Years | 0 (0.0%) | 0 (0.0%) |
| 40 to 44 Years | 0 (0.0%) | 0 (0.0%) |
| 45 to 49 Years | 0 (0.0%) | 0 (0.0%) |
| 50 to 54 Years | 28 (28.6%) | 0 (0.0%) |
| 55 to 59 Years | 15 (15.3%) | 10 (5.8%) |
| 60 to 64 Years | 0 (0.0%) | 3 (1.7%) |
| 65 to 69 Years | 1 (1.0%) | 0 (0.0%) |
| 70 to 74 Years | 0 (0.0%) | 0 (0.0%) |
| 75 to 79 Years | 0 (0.0%) | 0 (0.0%) |
| 80 to 84 Years | 10 (10.2%) | 33 (19.1%) |
| 85 Years and over | 0 (0.0%) | 8 (4.6%) |
| Total | 98 (100.0%) | 173 (100.0%) |
Families and Households in Babb
Median Family Size in Babb
The median family size in Babb is 6.54 persons per family, with married-couple families (14 | 40.0%) accounting for the largest median family size of 9.86 persons per family. On the other hand, single female/mother families (8 | 22.9%) represent the smallest median family size with 2.88 persons per family.
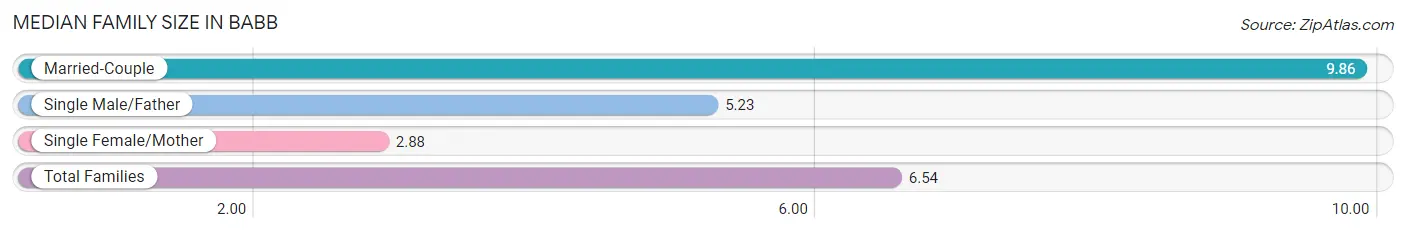
| Family Type | # Families | Family Size |
| Married-Couple | 14 (40.0%) | 9.86 |
| Single Male/Father | 13 (37.1%) | 5.23 |
| Single Female/Mother | 8 (22.9%) | 2.88 |
| Total Families | 35 (100.0%) | 6.54 |
Median Household Size in Babb
The median household size in Babb is 4.04 persons per household, with married-couple households (14 | 20.9%) accounting for the largest median household size of 9.86 persons per household. non-family households (32 | 47.8%) represent the smallest median household size with 1.31 persons per household.
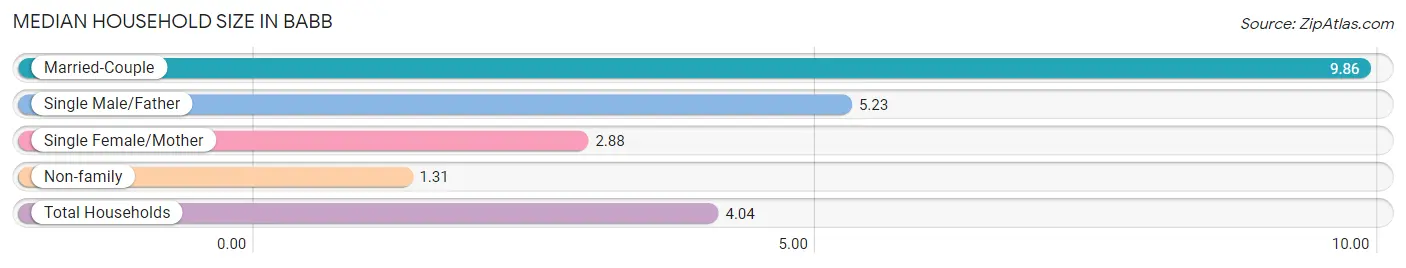
| Household Type | # Households | Household Size |
| Married-Couple | 14 (20.9%) | 9.86 |
| Single Male/Father | 13 (19.4%) | 5.23 |
| Single Female/Mother | 8 (11.9%) | 2.88 |
| Non-family | 32 (47.8%) | 1.31 |
| Total Households | 67 (100.0%) | 4.04 |
Household Size by Marriage Status in Babb
Out of a total of 67 households in Babb, 35 (52.2%) are family households, while 32 (47.8%) are nonfamily households. The most numerous type of family households are 2-person households, comprising 19, and the most common type of nonfamily households are 2-person households, comprising 32.
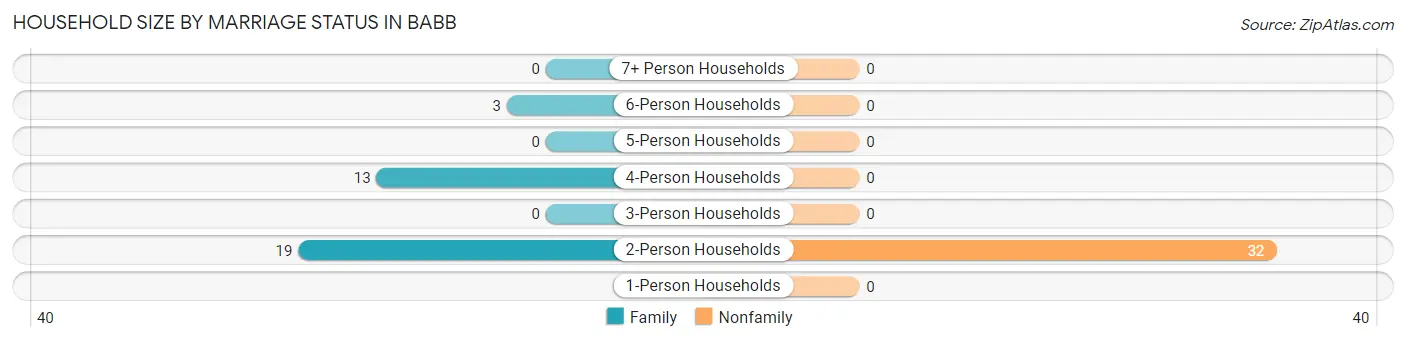
| Household Size | Family Households | Nonfamily Households |
| 1-Person Households | - | 0 (0.0%) |
| 2-Person Households | 19 (28.4%) | 32 (47.8%) |
| 3-Person Households | 0 (0.0%) | 0 (0.0%) |
| 4-Person Households | 13 (19.4%) | 0 (0.0%) |
| 5-Person Households | 0 (0.0%) | 0 (0.0%) |
| 6-Person Households | 3 (4.5%) | 0 (0.0%) |
| 7+ Person Households | 0 (0.0%) | 0 (0.0%) |
| Total | 35 (52.2%) | 32 (47.8%) |
Female Fertility in Babb
Fertility by Age in Babb
| Age Bracket | Women with Births | Births / 1,000 Women |
| 15 to 19 years | 0 (0.0%) | 0.0 |
| 20 to 34 years | 0 (0.0%) | 0.0 |
| 35 to 50 years | 0 (0.0%) | 0.0 |
| Total | 0 (0.0%) | 0.0 |
Fertility by Age by Marriage Status in Babb
| Age Bracket | Married | Unmarried |
| 15 to 19 years | 0 (0.0%) | 0 (0.0%) |
| 20 to 34 years | 0 (0.0%) | 0 (0.0%) |
| 35 to 50 years | 0 (0.0%) | 0 (0.0%) |
| Total | 0 (0.0%) | 0 (0.0%) |
Fertility by Education in Babb
| Educational Attainment | Women with Births | Births / 1,000 Women |
| Less than High School | 0 (0.0%) | 0.0 |
| High School Diploma | 0 (0.0%) | 0.0 |
| College or Associate's Degree | 0 (0.0%) | 0.0 |
| Bachelor's Degree | 0 (0.0%) | 0.0 |
| Graduate Degree | 0 (0.0%) | 0.0 |
| Total | 0 (0.0%) | 0.0 |
Fertility by Education by Marriage Status in Babb
| Educational Attainment | Married | Unmarried |
| Less than High School | 0 (0.0%) | 0 (0.0%) |
| High School Diploma | 0 (0.0%) | 0 (0.0%) |
| College or Associate's Degree | 0 (0.0%) | 0 (0.0%) |
| Bachelor's Degree | 0 (0.0%) | 0 (0.0%) |
| Graduate Degree | 0 (0.0%) | 0 (0.0%) |
| Total | 0 (0.0%) | 0 (0.0%) |
Employment Characteristics in Babb
Employment by Class of Employer in Babb
Among the 103 employed individuals in Babb, federal government employees (38 | 36.9%), private company employees (31 | 30.1%), and self-employed (not incorporated) (19 | 18.4%) make up the most common classes of employment.
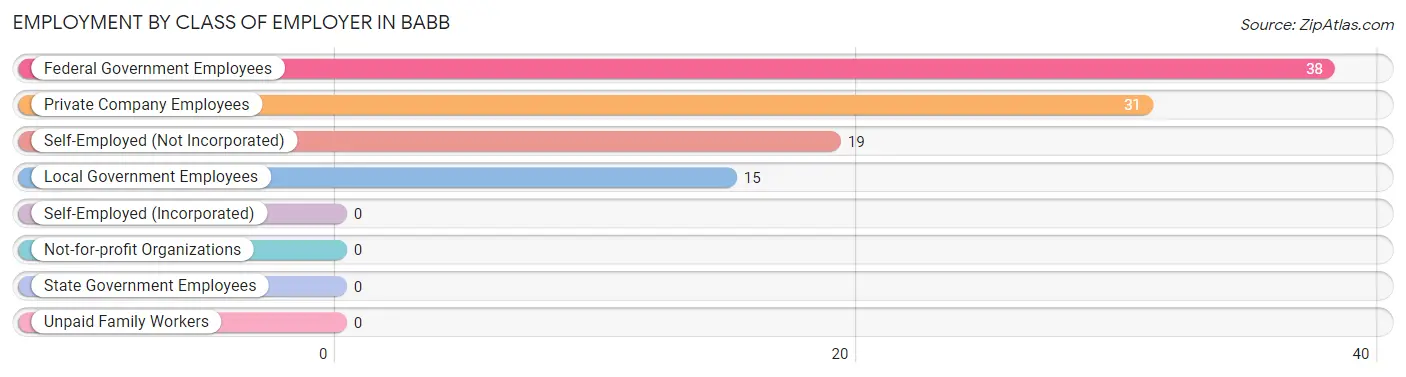
| Employer Class | # Employees | % Employees |
| Private Company Employees | 31 | 30.1% |
| Self-Employed (Incorporated) | 0 | 0.0% |
| Self-Employed (Not Incorporated) | 19 | 18.4% |
| Not-for-profit Organizations | 0 | 0.0% |
| Local Government Employees | 15 | 14.6% |
| State Government Employees | 0 | 0.0% |
| Federal Government Employees | 38 | 36.9% |
| Unpaid Family Workers | 0 | 0.0% |
| Total | 103 | 100.0% |
Employment Status by Age in Babb
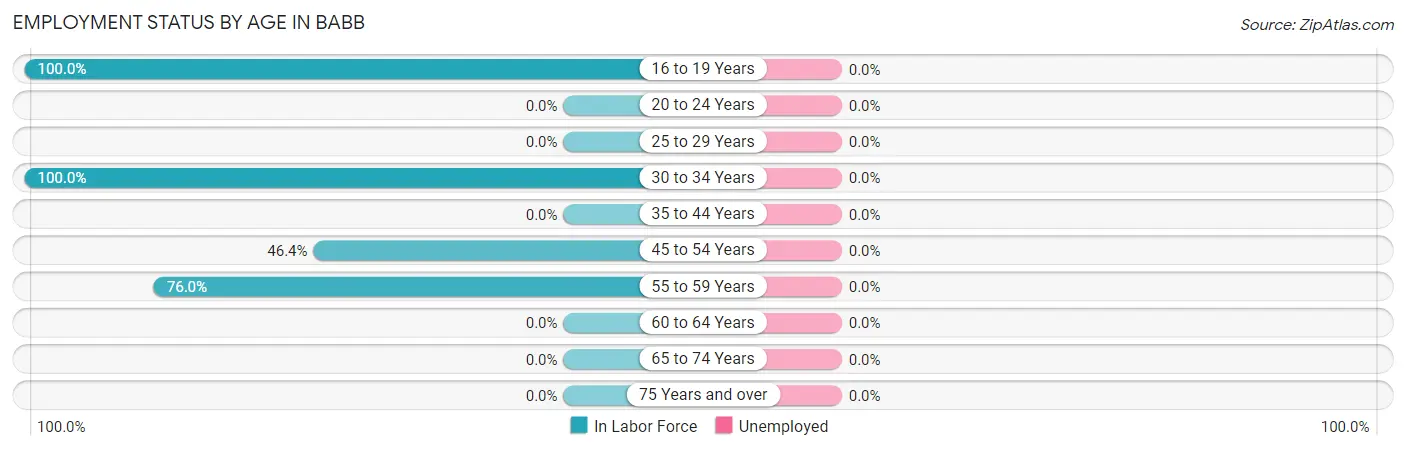
| Age Bracket | In Labor Force | Unemployed |
| 16 to 19 Years | 15 (100.0%) | 0 (0.0%) |
| 20 to 24 Years | 0 (0.0%) | 0 (0.0%) |
| 25 to 29 Years | 0 (0.0%) | 0 (0.0%) |
| 30 to 34 Years | 56 (100.0%) | 0 (0.0%) |
| 35 to 44 Years | 0 (0.0%) | 0 (0.0%) |
| 45 to 54 Years | 13 (46.4%) | 0 (0.0%) |
| 55 to 59 Years | 19 (76.0%) | 0 (0.0%) |
| 60 to 64 Years | 0 (0.0%) | 0 (0.0%) |
| 65 to 74 Years | 0 (0.0%) | 0 (0.0%) |
| 75 Years and over | 0 (0.0%) | 0 (0.0%) |
| Total | 103 (50.2%) | 0 (0.0%) |
Employment Status by Educational Attainment in Babb
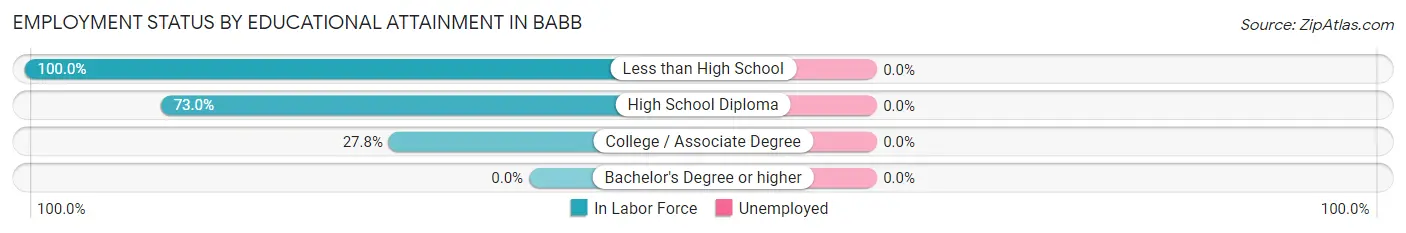
| Educational Attainment | In Labor Force | Unemployed |
| Less than High School | 13 (100.0%) | 0 (0.0%) |
| High School Diploma | 65 (73.0%) | 0 (0.0%) |
| College / Associate Degree | 10 (27.8%) | 0 (0.0%) |
| Bachelor's Degree or higher | 0 (0.0%) | 0 (0.0%) |
| Total | 88 (63.8%) | 0 (0.0%) |
Employment Occupations by Sex in Babb
Management, Business, Science and Arts Occupations
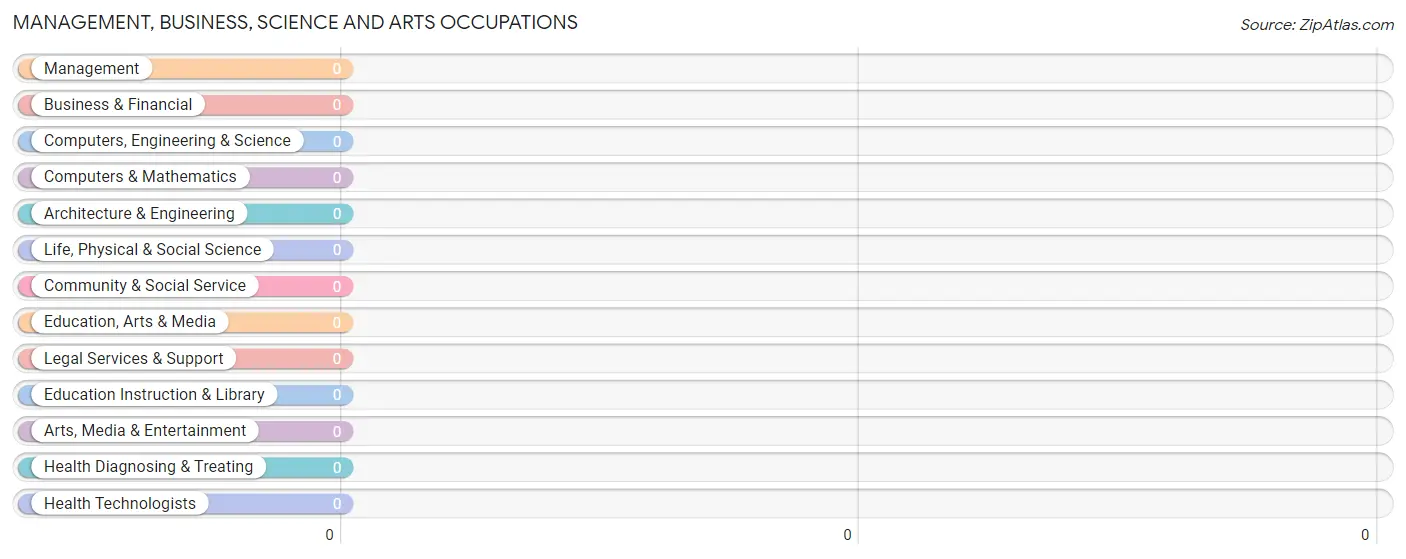
Management, Business, Science and Arts Occupations by Sex
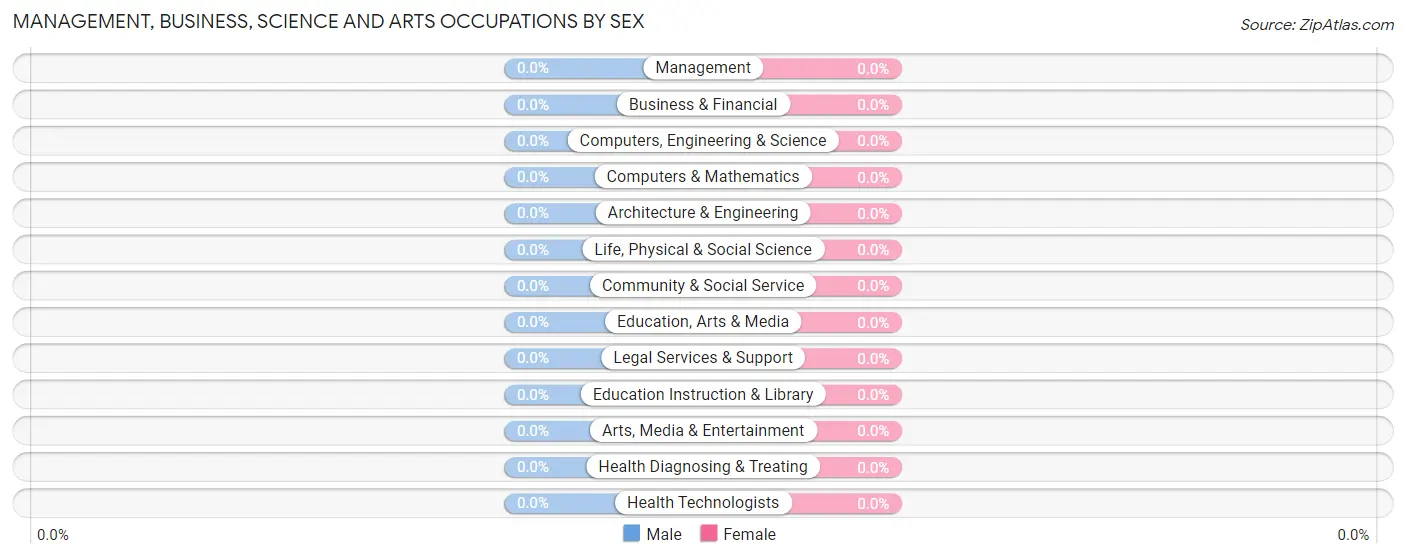
| Occupation | Male | Female |
| Management | 0 (0.0%) | 0 (0.0%) |
| Business & Financial | 0 (0.0%) | 0 (0.0%) |
| Computers, Engineering & Science | 0 (0.0%) | 0 (0.0%) |
| Computers & Mathematics | 0 (0.0%) | 0 (0.0%) |
| Architecture & Engineering | 0 (0.0%) | 0 (0.0%) |
| Life, Physical & Social Science | 0 (0.0%) | 0 (0.0%) |
| Community & Social Service | 0 (0.0%) | 0 (0.0%) |
| Education, Arts & Media | 0 (0.0%) | 0 (0.0%) |
| Legal Services & Support | 0 (0.0%) | 0 (0.0%) |
| Education Instruction & Library | 0 (0.0%) | 0 (0.0%) |
| Arts, Media & Entertainment | 0 (0.0%) | 0 (0.0%) |
| Health Diagnosing & Treating | 0 (0.0%) | 0 (0.0%) |
| Health Technologists | 0 (0.0%) | 0 (0.0%) |
| Total (Category) | 0 (0.0%) | 0 (0.0%) |
| Total (Overall) | 40 (38.8%) | 63 (61.2%) |
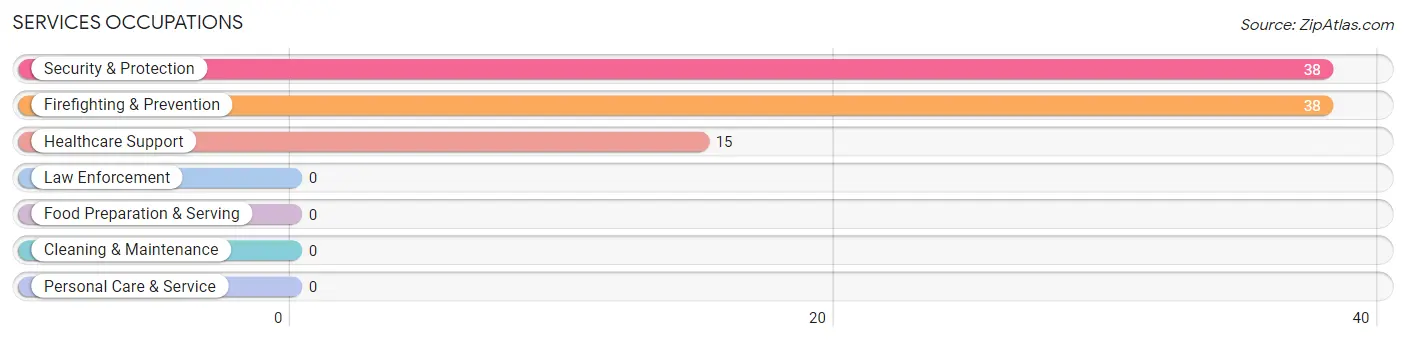
Services Occupations
The most common Services occupations in Babb are Security & Protection (38 | 36.9%), Firefighting & Prevention (38 | 36.9%), and Healthcare Support (15 | 14.6%).
Services Occupations by Sex
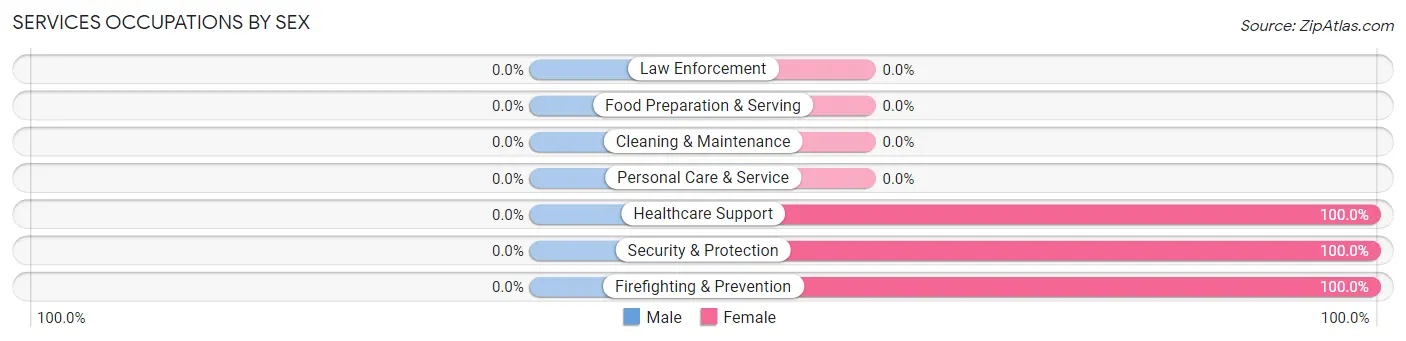
| Occupation | Male | Female |
| Healthcare Support | 0 (0.0%) | 15 (100.0%) |
| Security & Protection | 0 (0.0%) | 38 (100.0%) |
| Firefighting & Prevention | 0 (0.0%) | 38 (100.0%) |
| Law Enforcement | 0 (0.0%) | 0 (0.0%) |
| Food Preparation & Serving | 0 (0.0%) | 0 (0.0%) |
| Cleaning & Maintenance | 0 (0.0%) | 0 (0.0%) |
| Personal Care & Service | 0 (0.0%) | 0 (0.0%) |
| Total (Category) | 0 (0.0%) | 53 (100.0%) |
| Total (Overall) | 40 (38.8%) | 63 (61.2%) |
Sales and Office Occupations
The most common Sales and Office occupations in Babb are , and Sales & Related (10 | 9.7%).
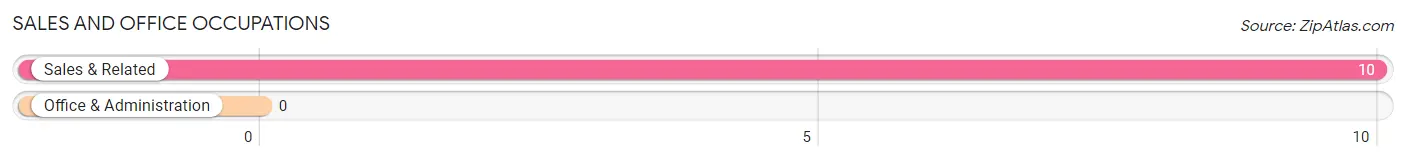
Sales and Office Occupations by Sex
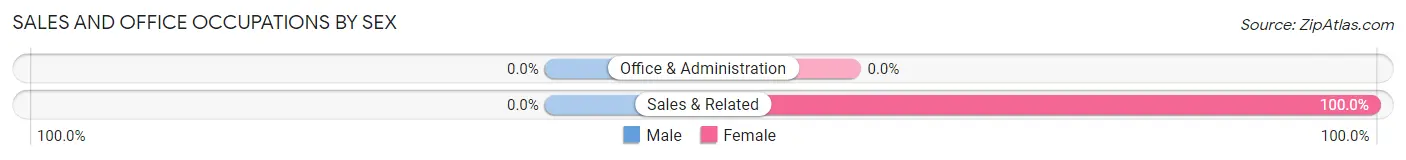
| Occupation | Male | Female |
| Sales & Related | 0 (0.0%) | 10 (100.0%) |
| Office & Administration | 0 (0.0%) | 0 (0.0%) |
| Total (Category) | 0 (0.0%) | 10 (100.0%) |
| Total (Overall) | 40 (38.8%) | 63 (61.2%) |
Natural Resources, Construction and Maintenance Occupations
The most common Natural Resources, Construction and Maintenance occupations in Babb are Construction & Extraction (27 | 26.2%), and Farming, Fishing & Forestry (13 | 12.6%).
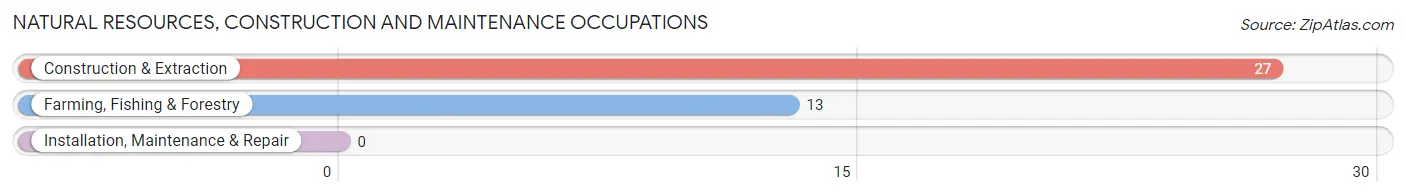
Natural Resources, Construction and Maintenance Occupations by Sex
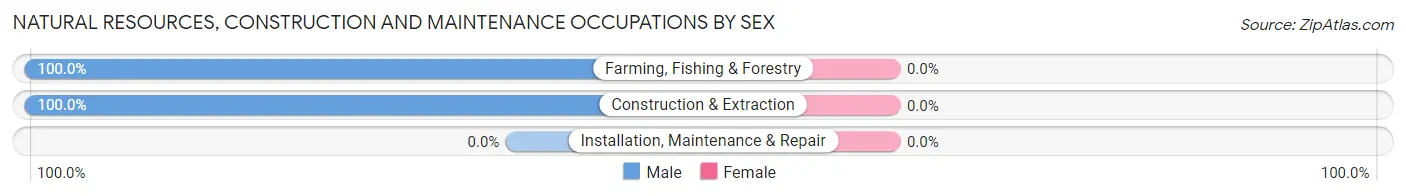
| Occupation | Male | Female |
| Farming, Fishing & Forestry | 13 (100.0%) | 0 (0.0%) |
| Construction & Extraction | 27 (100.0%) | 0 (0.0%) |
| Installation, Maintenance & Repair | 0 (0.0%) | 0 (0.0%) |
| Total (Category) | 40 (100.0%) | 0 (0.0%) |
| Total (Overall) | 40 (38.8%) | 63 (61.2%) |
Production, Transportation and Moving Occupations
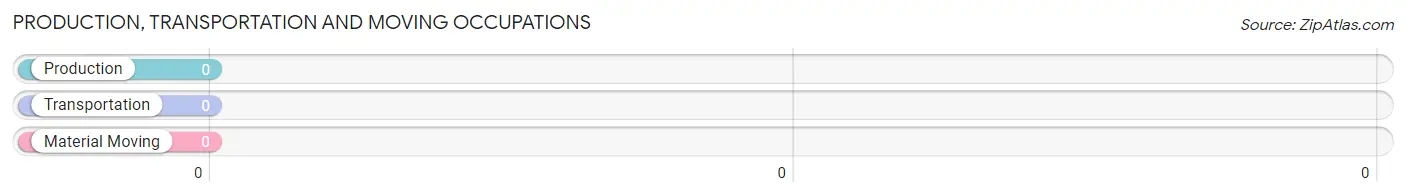
Production, Transportation and Moving Occupations by Sex
| Occupation | Male | Female |
| Production | 0 (0.0%) | 0 (0.0%) |
| Transportation | 0 (0.0%) | 0 (0.0%) |
| Material Moving | 0 (0.0%) | 0 (0.0%) |
| Total (Category) | 0 (0.0%) | 0 (0.0%) |
| Total (Overall) | 40 (38.8%) | 63 (61.2%) |
Employment Industries by Sex in Babb
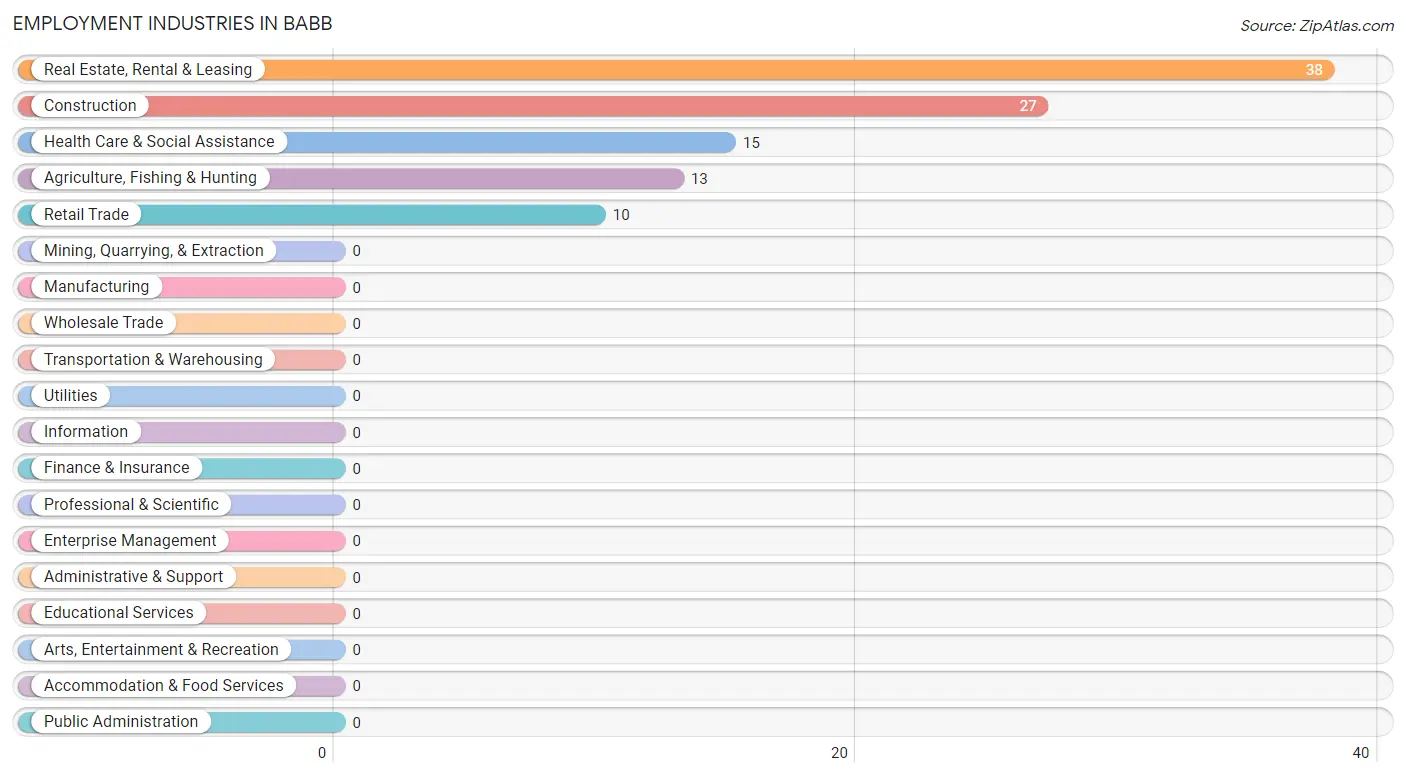
Employment Industries in Babb
The major employment industries in Babb include Real Estate, Rental & Leasing (38 | 36.9%), Construction (27 | 26.2%), Health Care & Social Assistance (15 | 14.6%), Agriculture, Fishing & Hunting (13 | 12.6%), and Retail Trade (10 | 9.7%).
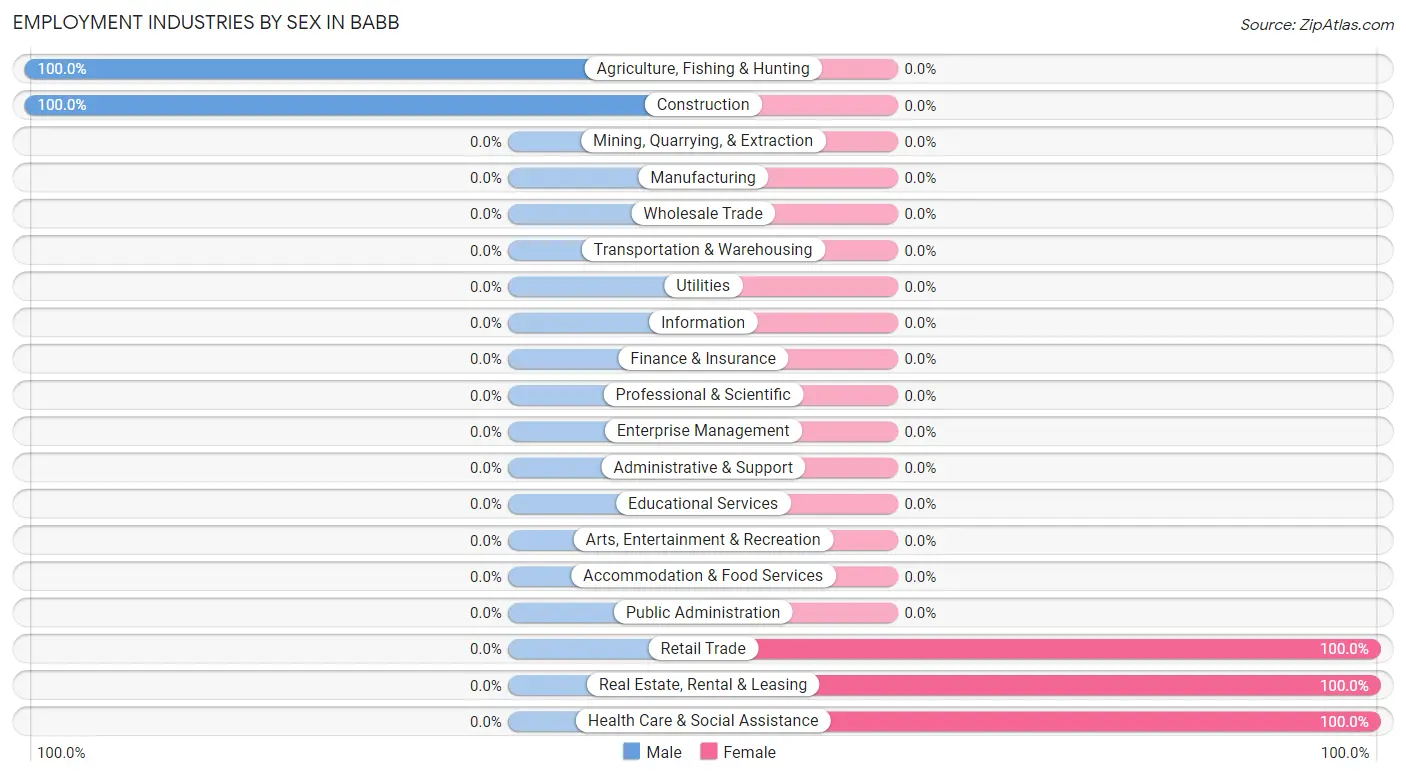
Employment Industries by Sex in Babb
The Babb industries that see more men than women are Agriculture, Fishing & Hunting (100.0%), and Construction (100.0%), whereas the industries that tend to have a higher number of women are Retail Trade (100.0%), Real Estate, Rental & Leasing (100.0%), and Health Care & Social Assistance (100.0%).
| Industry | Male | Female |
| Agriculture, Fishing & Hunting | 13 (100.0%) | 0 (0.0%) |
| Mining, Quarrying, & Extraction | 0 (0.0%) | 0 (0.0%) |
| Construction | 27 (100.0%) | 0 (0.0%) |
| Manufacturing | 0 (0.0%) | 0 (0.0%) |
| Wholesale Trade | 0 (0.0%) | 0 (0.0%) |
| Retail Trade | 0 (0.0%) | 10 (100.0%) |
| Transportation & Warehousing | 0 (0.0%) | 0 (0.0%) |
| Utilities | 0 (0.0%) | 0 (0.0%) |
| Information | 0 (0.0%) | 0 (0.0%) |
| Finance & Insurance | 0 (0.0%) | 0 (0.0%) |
| Real Estate, Rental & Leasing | 0 (0.0%) | 38 (100.0%) |
| Professional & Scientific | 0 (0.0%) | 0 (0.0%) |
| Enterprise Management | 0 (0.0%) | 0 (0.0%) |
| Administrative & Support | 0 (0.0%) | 0 (0.0%) |
| Educational Services | 0 (0.0%) | 0 (0.0%) |
| Health Care & Social Assistance | 0 (0.0%) | 15 (100.0%) |
| Arts, Entertainment & Recreation | 0 (0.0%) | 0 (0.0%) |
| Accommodation & Food Services | 0 (0.0%) | 0 (0.0%) |
| Public Administration | 0 (0.0%) | 0 (0.0%) |
| Total | 40 (38.8%) | 63 (61.2%) |
Education in Babb
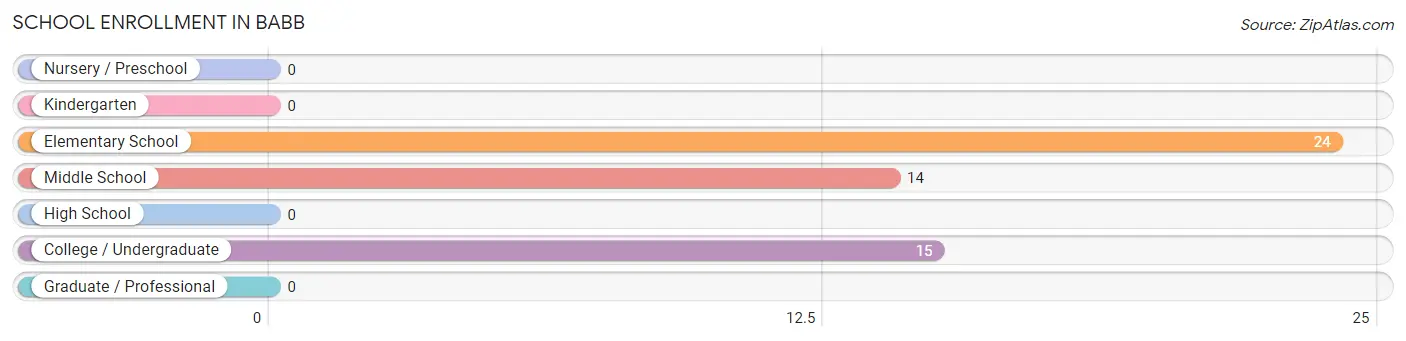
School Enrollment in Babb
The most common levels of schooling among the 53 students in Babb are elementary school (24 | 45.3%), college / undergraduate (15 | 28.3%), and middle school (14 | 26.4%).
| School Level | # Students | % Students |
| Nursery / Preschool | 0 | 0.0% |
| Kindergarten | 0 | 0.0% |
| Elementary School | 24 | 45.3% |
| Middle School | 14 | 26.4% |
| High School | 0 | 0.0% |
| College / Undergraduate | 15 | 28.3% |
| Graduate / Professional | 0 | 0.0% |
| Total | 53 | 100.0% |
School Enrollment by Age by Funding Source in Babb
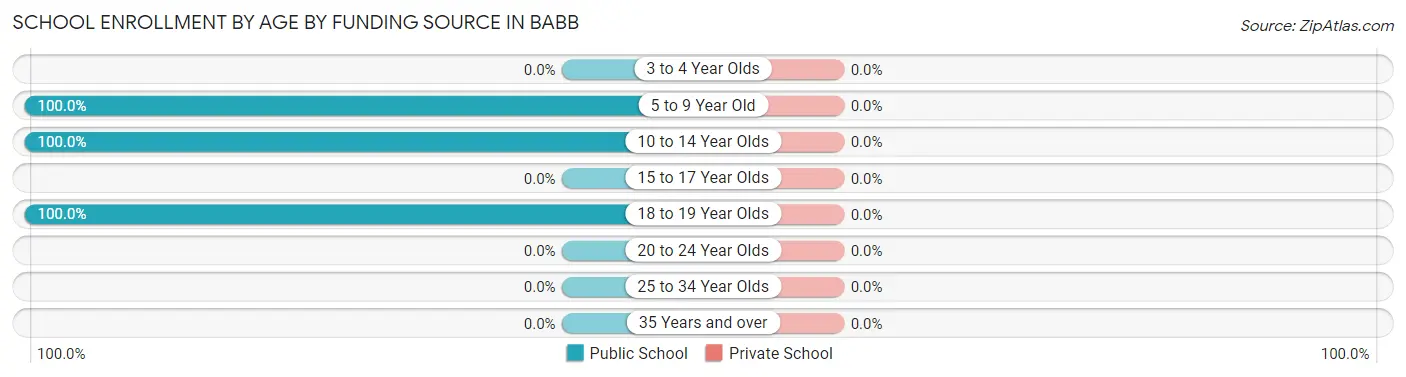
| Age Bracket | Public School | Private School |
| 3 to 4 Year Olds | 0 (0.0%) | 0 (0.0%) |
| 5 to 9 Year Old | 24 (100.0%) | 0 (0.0%) |
| 10 to 14 Year Olds | 14 (100.0%) | 0 (0.0%) |
| 15 to 17 Year Olds | 0 (0.0%) | 0 (0.0%) |
| 18 to 19 Year Olds | 15 (100.0%) | 0 (0.0%) |
| 20 to 24 Year Olds | 0 (0.0%) | 0 (0.0%) |
| 25 to 34 Year Olds | 0 (0.0%) | 0 (0.0%) |
| 35 Years and over | 0 (0.0%) | 0 (0.0%) |
| Total | 53 (100.0%) | 0 (0.0%) |
Educational Attainment by Field of Study in Babb
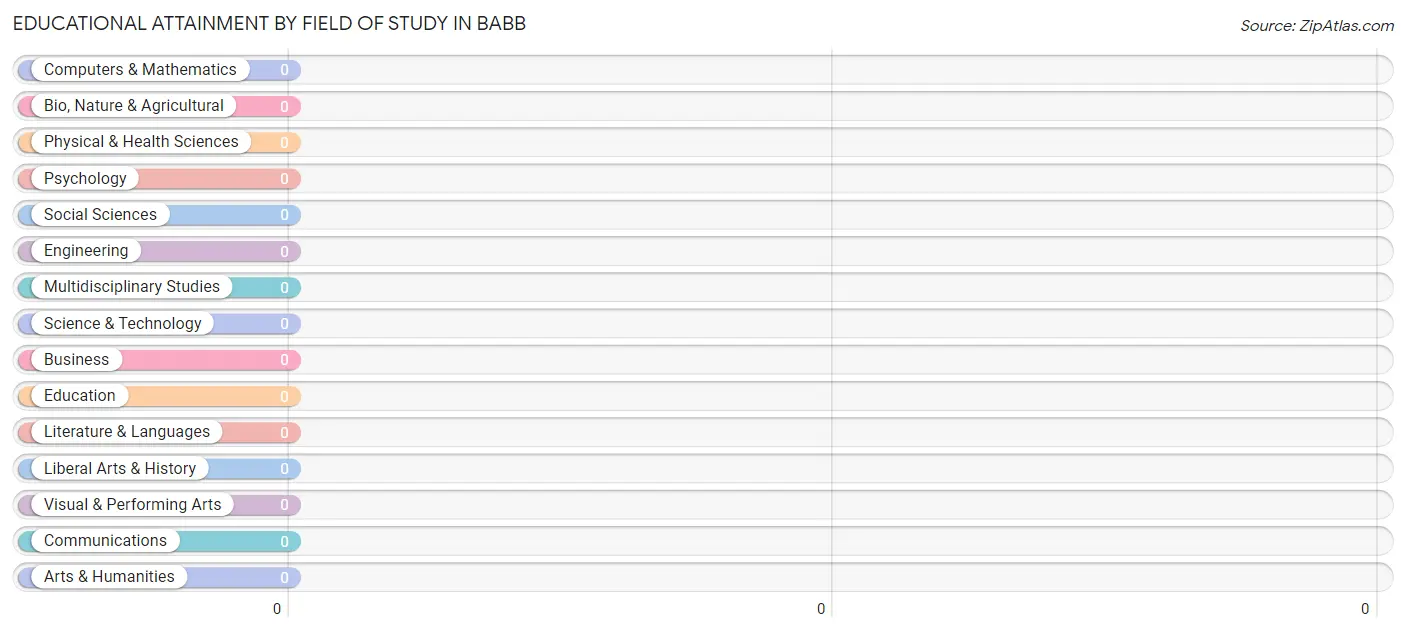
| Field of Study | # Graduates | % Graduates |
| Computers & Mathematics | 0 | 0.0% |
| Bio, Nature & Agricultural | 0 | 0.0% |
| Physical & Health Sciences | 0 | 0.0% |
| Psychology | 0 | 0.0% |
| Social Sciences | 0 | 0.0% |
| Engineering | 0 | 0.0% |
| Multidisciplinary Studies | 0 | 0.0% |
| Science & Technology | 0 | 0.0% |
| Business | 0 | 0.0% |
| Education | 0 | 0.0% |
| Literature & Languages | 0 | 0.0% |
| Liberal Arts & History | 0 | 0.0% |
| Visual & Performing Arts | 0 | 0.0% |
| Communications | 0 | 0.0% |
| Arts & Humanities | 0 | 0.0% |
| Total | 0 | 0.0% |
Transportation & Commute in Babb
Vehicle Availability by Sex in Babb
The most prevalent vehicle ownership categories in Babb are males with 4 vehicles (18, accounting for 45.0%) and females with 4 vehicles (38, making up 28.6%).
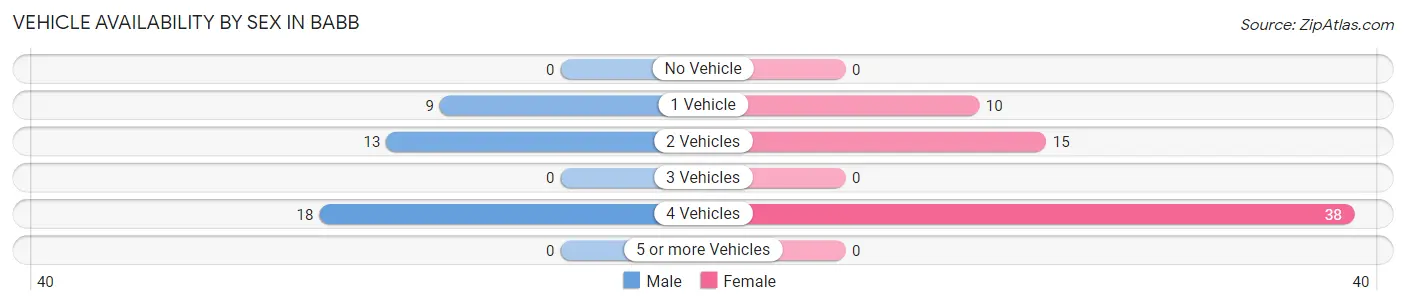
| Vehicles Available | Male | Female |
| No Vehicle | 0 (0.0%) | 0 (0.0%) |
| 1 Vehicle | 9 (22.5%) | 10 (15.9%) |
| 2 Vehicles | 13 (32.5%) | 15 (23.8%) |
| 3 Vehicles | 0 (0.0%) | 0 (0.0%) |
| 4 Vehicles | 18 (45.0%) | 38 (60.3%) |
| 5 or more Vehicles | 0 (0.0%) | 0 (0.0%) |
| Total | 40 (100.0%) | 63 (100.0%) |
Commute Time in Babb
The most frequently occuring commute durations in Babb are 45 to 59 minutes (38 commuters, 57.6%), 10 to 14 minutes (28 commuters, 42.4%), and less than 5 minutes (0 commuters, 0.0%).
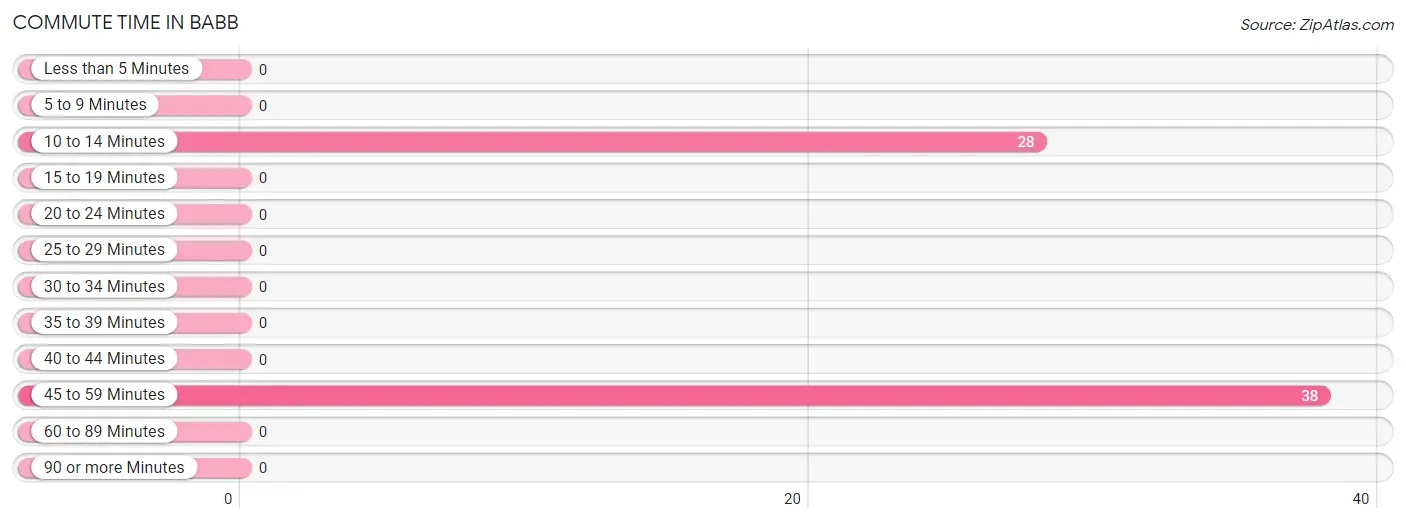
| Commute Time | # Commuters | % Commuters |
| Less than 5 Minutes | 0 | 0.0% |
| 5 to 9 Minutes | 0 | 0.0% |
| 10 to 14 Minutes | 28 | 42.4% |
| 15 to 19 Minutes | 0 | 0.0% |
| 20 to 24 Minutes | 0 | 0.0% |
| 25 to 29 Minutes | 0 | 0.0% |
| 30 to 34 Minutes | 0 | 0.0% |
| 35 to 39 Minutes | 0 | 0.0% |
| 40 to 44 Minutes | 0 | 0.0% |
| 45 to 59 Minutes | 38 | 57.6% |
| 60 to 89 Minutes | 0 | 0.0% |
| 90 or more Minutes | 0 | 0.0% |
Commute Time by Sex in Babb
The most common commute times in Babb are 10 to 14 minutes (13 commuters, 100.0%) for males and 45 to 59 minutes (38 commuters, 71.7%) for females.
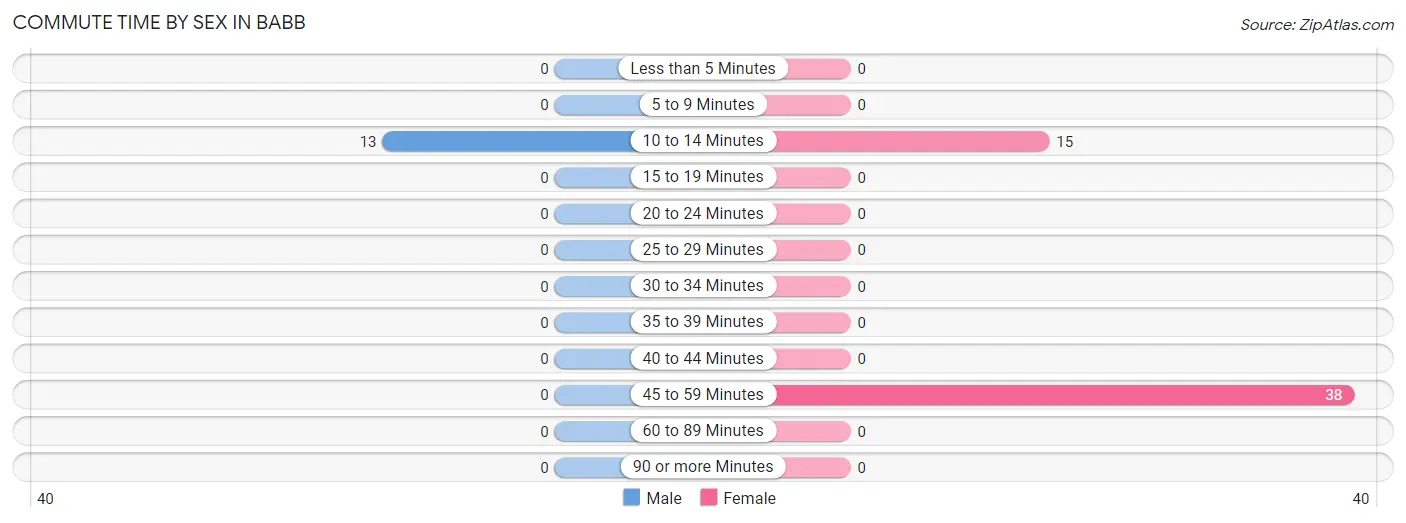
| Commute Time | Male | Female |
| Less than 5 Minutes | 0 (0.0%) | 0 (0.0%) |
| 5 to 9 Minutes | 0 (0.0%) | 0 (0.0%) |
| 10 to 14 Minutes | 13 (100.0%) | 15 (28.3%) |
| 15 to 19 Minutes | 0 (0.0%) | 0 (0.0%) |
| 20 to 24 Minutes | 0 (0.0%) | 0 (0.0%) |
| 25 to 29 Minutes | 0 (0.0%) | 0 (0.0%) |
| 30 to 34 Minutes | 0 (0.0%) | 0 (0.0%) |
| 35 to 39 Minutes | 0 (0.0%) | 0 (0.0%) |
| 40 to 44 Minutes | 0 (0.0%) | 0 (0.0%) |
| 45 to 59 Minutes | 0 (0.0%) | 38 (71.7%) |
| 60 to 89 Minutes | 0 (0.0%) | 0 (0.0%) |
| 90 or more Minutes | 0 (0.0%) | 0 (0.0%) |
Time of Departure to Work by Sex in Babb
The most frequent times of departure to work in Babb are 7:00 AM to 7:29 AM (13, 100.0%) for males and 6:30 AM to 6:59 AM (38, 71.7%) for females.
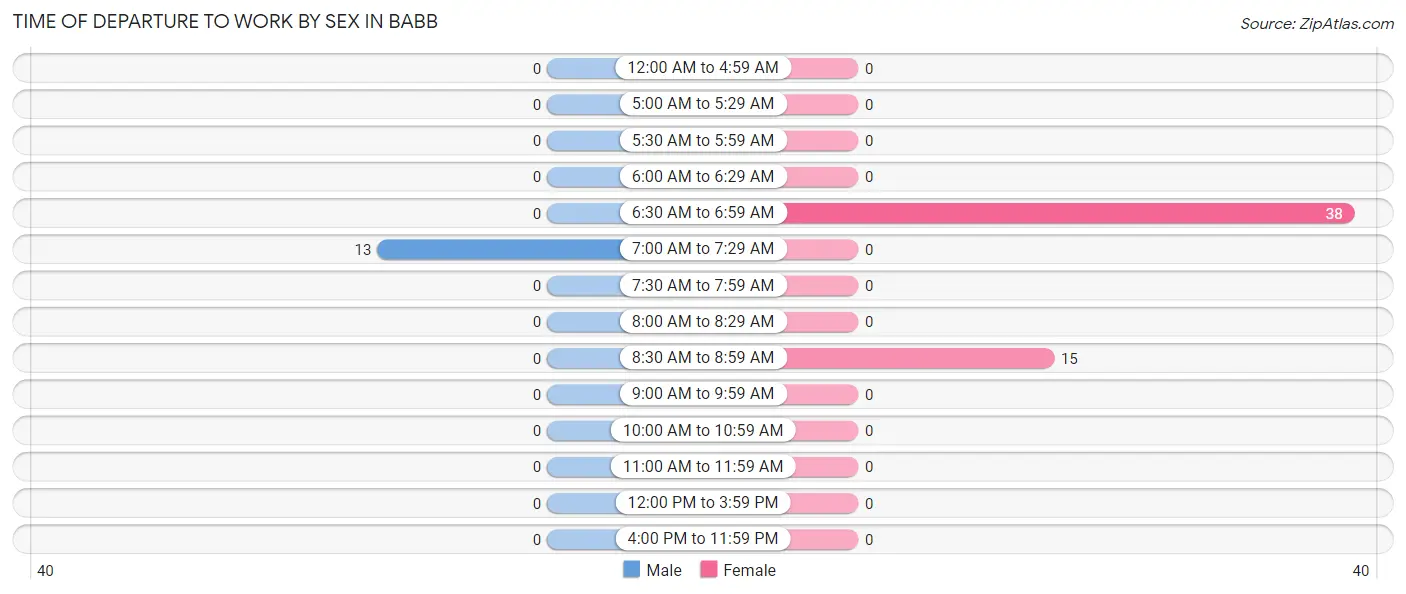
| Time of Departure | Male | Female |
| 12:00 AM to 4:59 AM | 0 (0.0%) | 0 (0.0%) |
| 5:00 AM to 5:29 AM | 0 (0.0%) | 0 (0.0%) |
| 5:30 AM to 5:59 AM | 0 (0.0%) | 0 (0.0%) |
| 6:00 AM to 6:29 AM | 0 (0.0%) | 0 (0.0%) |
| 6:30 AM to 6:59 AM | 0 (0.0%) | 38 (71.7%) |
| 7:00 AM to 7:29 AM | 13 (100.0%) | 0 (0.0%) |
| 7:30 AM to 7:59 AM | 0 (0.0%) | 0 (0.0%) |
| 8:00 AM to 8:29 AM | 0 (0.0%) | 0 (0.0%) |
| 8:30 AM to 8:59 AM | 0 (0.0%) | 15 (28.3%) |
| 9:00 AM to 9:59 AM | 0 (0.0%) | 0 (0.0%) |
| 10:00 AM to 10:59 AM | 0 (0.0%) | 0 (0.0%) |
| 11:00 AM to 11:59 AM | 0 (0.0%) | 0 (0.0%) |
| 12:00 PM to 3:59 PM | 0 (0.0%) | 0 (0.0%) |
| 4:00 PM to 11:59 PM | 0 (0.0%) | 0 (0.0%) |
| Total | 13 (100.0%) | 53 (100.0%) |
Housing Occupancy in Babb
Occupancy by Ownership in Babb
Of the total 67 dwellings in Babb, owner-occupied units account for 67 (100.0%), while renter-occupied units make up 0 (0.0%).
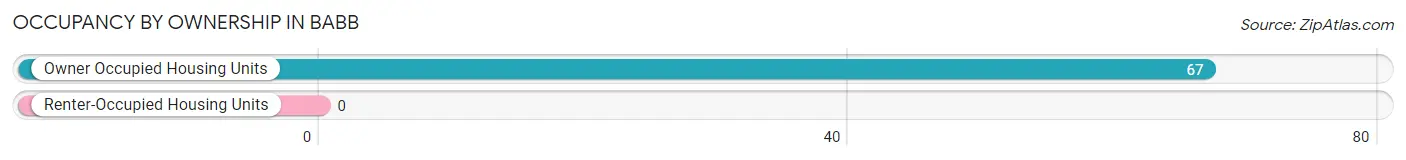
| Occupancy | # Housing Units | % Housing Units |
| Owner Occupied Housing Units | 67 | 100.0% |
| Renter-Occupied Housing Units | 0 | 0.0% |
| Total Occupied Housing Units | 67 | 100.0% |
Occupancy by Household Size in Babb
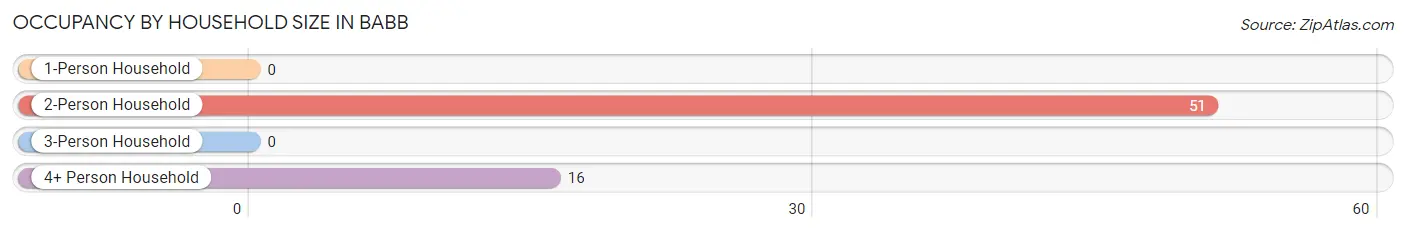
| Household Size | # Housing Units | % Housing Units |
| 1-Person Household | 0 | 0.0% |
| 2-Person Household | 51 | 76.1% |
| 3-Person Household | 0 | 0.0% |
| 4+ Person Household | 16 | 23.9% |
| Total Housing Units | 67 | 100.0% |
Occupancy by Ownership by Household Size in Babb
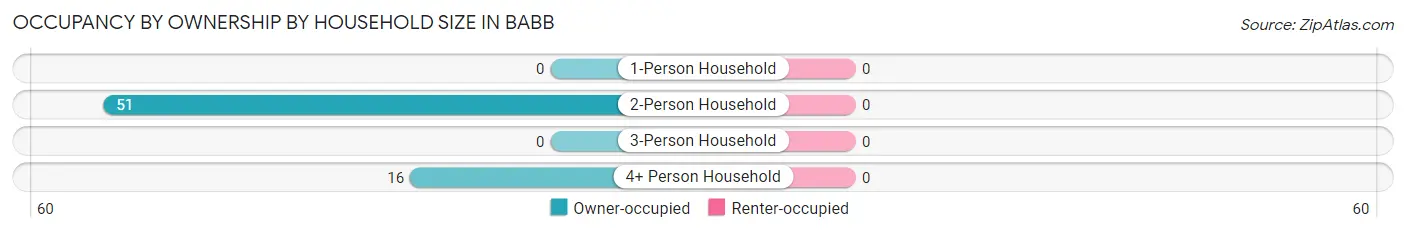
| Household Size | Owner-occupied | Renter-occupied |
| 1-Person Household | 0 (0.0%) | 0 (0.0%) |
| 2-Person Household | 51 (100.0%) | 0 (0.0%) |
| 3-Person Household | 0 (0.0%) | 0 (0.0%) |
| 4+ Person Household | 16 (100.0%) | 0 (0.0%) |
| Total Housing Units | 67 (100.0%) | 0 (0.0%) |
Occupancy by Educational Attainment in Babb
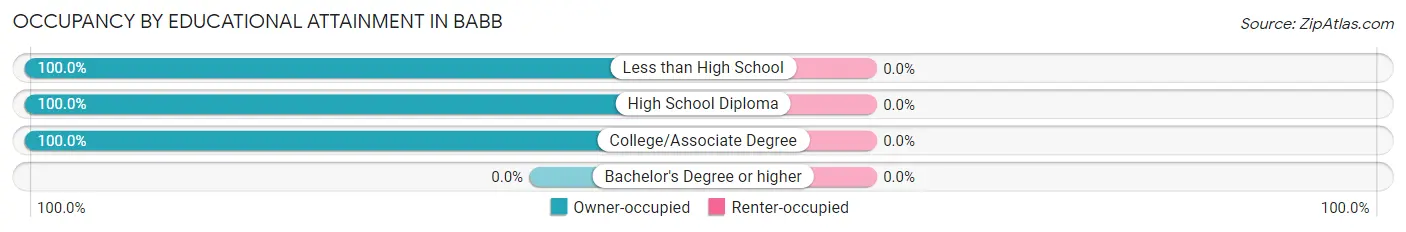
| Household Size | Owner-occupied | Renter-occupied |
| Less than High School | 24 (100.0%) | 0 (0.0%) |
| High School Diploma | 11 (100.0%) | 0 (0.0%) |
| College/Associate Degree | 32 (100.0%) | 0 (0.0%) |
| Bachelor's Degree or higher | 0 (0.0%) | 0 (0.0%) |
Occupancy by Age of Householder in Babb
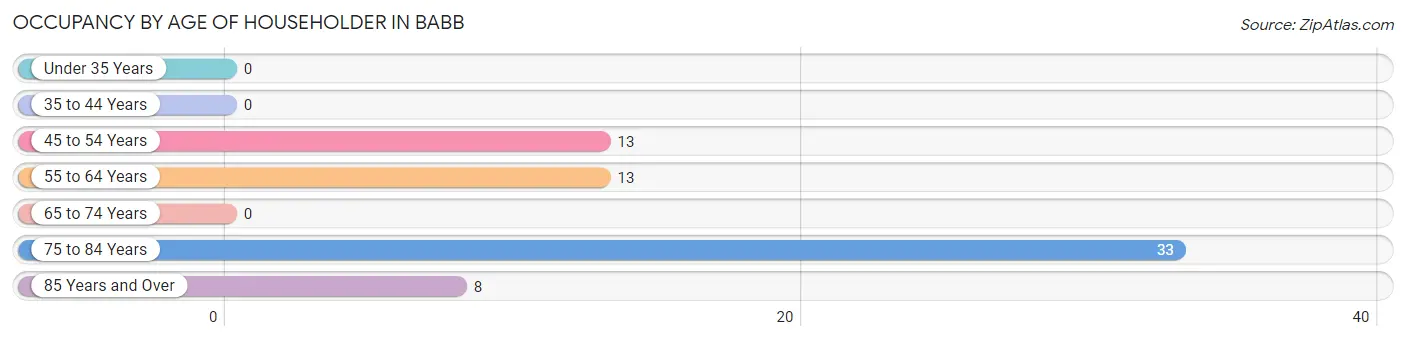
| Age Bracket | # Households | % Households |
| Under 35 Years | 0 | 0.0% |
| 35 to 44 Years | 0 | 0.0% |
| 45 to 54 Years | 13 | 19.4% |
| 55 to 64 Years | 13 | 19.4% |
| 65 to 74 Years | 0 | 0.0% |
| 75 to 84 Years | 33 | 49.2% |
| 85 Years and Over | 8 | 11.9% |
| Total | 67 | 100.0% |
Housing Finances in Babb
Median Income by Occupancy in Babb
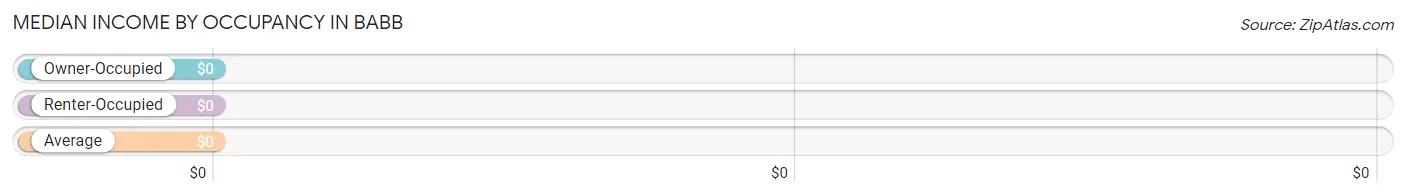
| Occupancy Type | # Households | Median Income |
| Owner-Occupied | 67 (100.0%) | $0 |
| Renter-Occupied | 0 (0.0%) | $0 |
| Average | 67 (100.0%) | $0 |
Occupancy by Householder Income Bracket in Babb
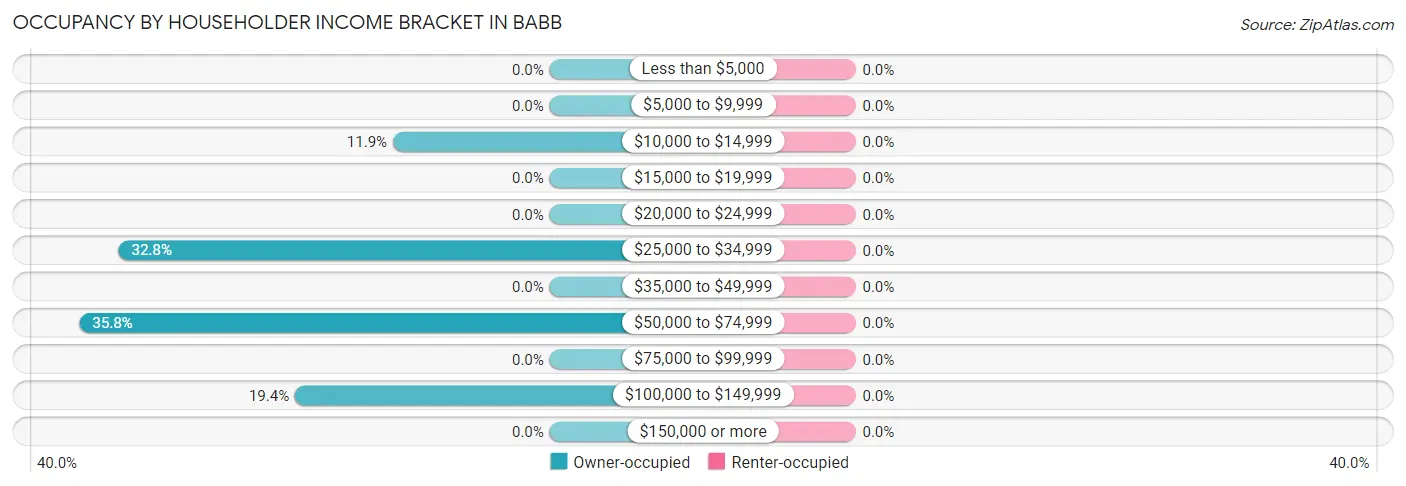
| Income Bracket | Owner-occupied | Renter-occupied |
| Less than $5,000 | 0 (0.0%) | 0 (0.0%) |
| $5,000 to $9,999 | 0 (0.0%) | 0 (0.0%) |
| $10,000 to $14,999 | 8 (11.9%) | 0 (0.0%) |
| $15,000 to $19,999 | 0 (0.0%) | 0 (0.0%) |
| $20,000 to $24,999 | 0 (0.0%) | 0 (0.0%) |
| $25,000 to $34,999 | 22 (32.8%) | 0 (0.0%) |
| $35,000 to $49,999 | 0 (0.0%) | 0 (0.0%) |
| $50,000 to $74,999 | 24 (35.8%) | 0 (0.0%) |
| $75,000 to $99,999 | 0 (0.0%) | 0 (0.0%) |
| $100,000 to $149,999 | 13 (19.4%) | 0 (0.0%) |
| $150,000 or more | 0 (0.0%) | 0 (0.0%) |
| Total | 67 (100.0%) | 0 (0.0%) |
Monthly Housing Cost Tiers in Babb
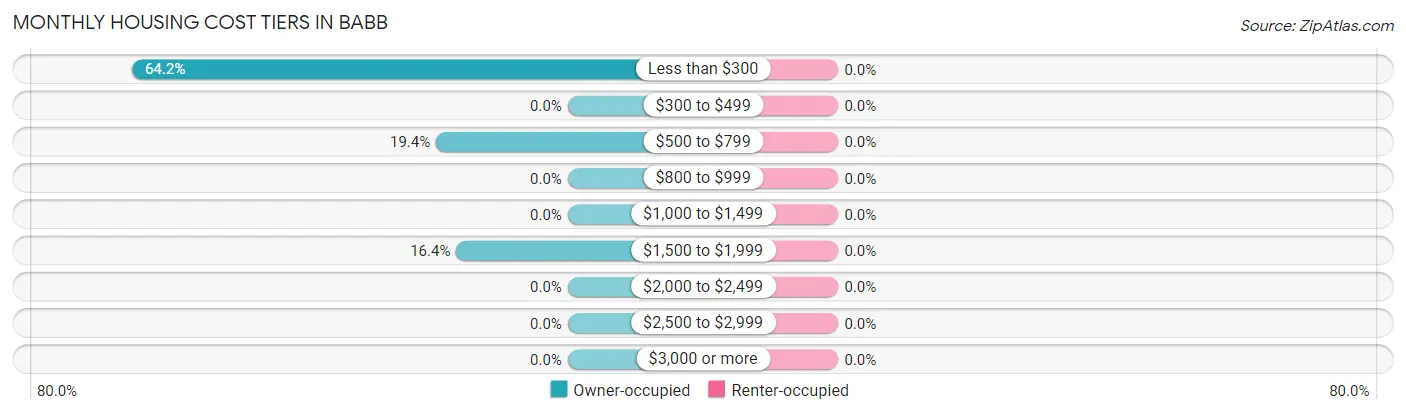
| Monthly Cost | Owner-occupied | Renter-occupied |
| Less than $300 | 43 (64.2%) | 0 (0.0%) |
| $300 to $499 | 0 (0.0%) | 0 (0.0%) |
| $500 to $799 | 13 (19.4%) | 0 (0.0%) |
| $800 to $999 | 0 (0.0%) | 0 (0.0%) |
| $1,000 to $1,499 | 0 (0.0%) | 0 (0.0%) |
| $1,500 to $1,999 | 11 (16.4%) | 0 (0.0%) |
| $2,000 to $2,499 | 0 (0.0%) | 0 (0.0%) |
| $2,500 to $2,999 | 0 (0.0%) | 0 (0.0%) |
| $3,000 or more | 0 (0.0%) | 0 (0.0%) |
| Total | 67 (100.0%) | 0 (0.0%) |
Physical Housing Characteristics in Babb
Housing Structures in Babb
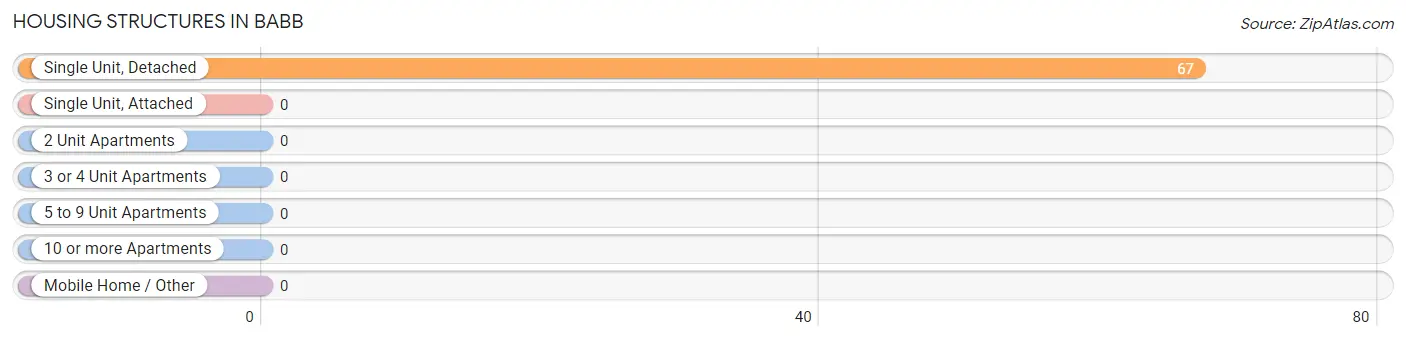
| Structure Type | # Housing Units | % Housing Units |
| Single Unit, Detached | 67 | 100.0% |
| Single Unit, Attached | 0 | 0.0% |
| 2 Unit Apartments | 0 | 0.0% |
| 3 or 4 Unit Apartments | 0 | 0.0% |
| 5 to 9 Unit Apartments | 0 | 0.0% |
| 10 or more Apartments | 0 | 0.0% |
| Mobile Home / Other | 0 | 0.0% |
| Total | 67 | 100.0% |
Housing Structures by Occupancy in Babb
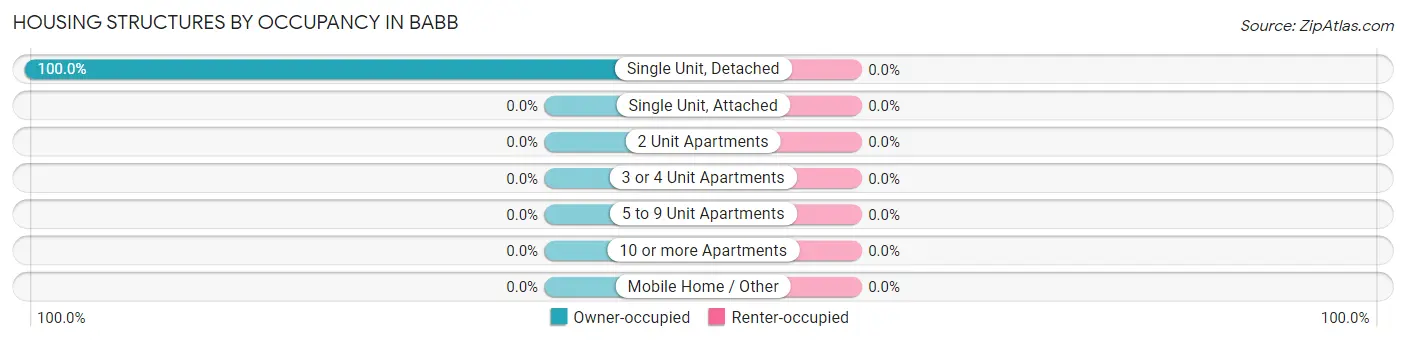
| Structure Type | Owner-occupied | Renter-occupied |
| Single Unit, Detached | 67 (100.0%) | 0 (0.0%) |
| Single Unit, Attached | 0 (0.0%) | 0 (0.0%) |
| 2 Unit Apartments | 0 (0.0%) | 0 (0.0%) |
| 3 or 4 Unit Apartments | 0 (0.0%) | 0 (0.0%) |
| 5 to 9 Unit Apartments | 0 (0.0%) | 0 (0.0%) |
| 10 or more Apartments | 0 (0.0%) | 0 (0.0%) |
| Mobile Home / Other | 0 (0.0%) | 0 (0.0%) |
| Total | 67 (100.0%) | 0 (0.0%) |
Housing Structures by Number of Rooms in Babb
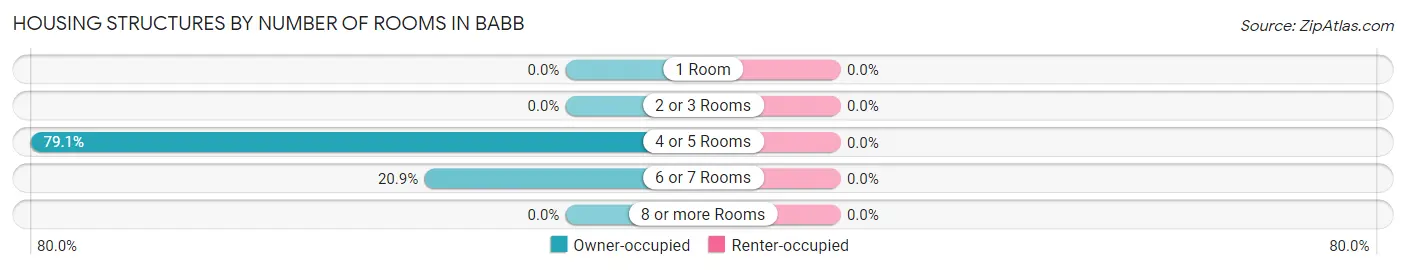
| Number of Rooms | Owner-occupied | Renter-occupied |
| 1 Room | 0 (0.0%) | 0 (0.0%) |
| 2 or 3 Rooms | 0 (0.0%) | 0 (0.0%) |
| 4 or 5 Rooms | 53 (79.1%) | 0 (0.0%) |
| 6 or 7 Rooms | 14 (20.9%) | 0 (0.0%) |
| 8 or more Rooms | 0 (0.0%) | 0 (0.0%) |
| Total | 67 (100.0%) | 0 (0.0%) |
Housing Structure by Heating Type in Babb
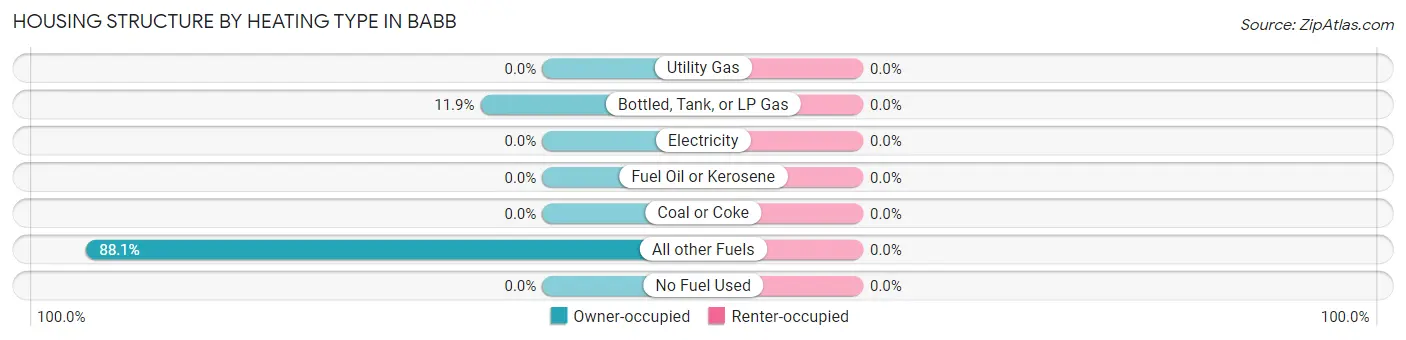
| Heating Type | Owner-occupied | Renter-occupied |
| Utility Gas | 0 (0.0%) | 0 (0.0%) |
| Bottled, Tank, or LP Gas | 8 (11.9%) | 0 (0.0%) |
| Electricity | 0 (0.0%) | 0 (0.0%) |
| Fuel Oil or Kerosene | 0 (0.0%) | 0 (0.0%) |
| Coal or Coke | 0 (0.0%) | 0 (0.0%) |
| All other Fuels | 59 (88.1%) | 0 (0.0%) |
| No Fuel Used | 0 (0.0%) | 0 (0.0%) |
| Total | 67 (100.0%) | 0 (0.0%) |
Household Vehicle Usage in Babb
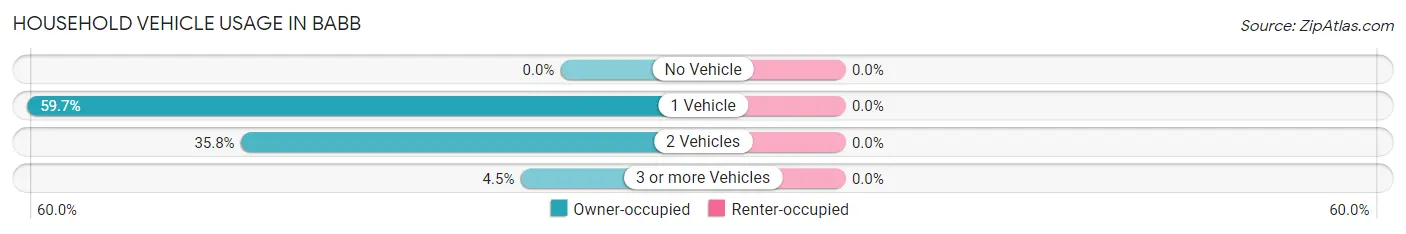
| Vehicles per Household | Owner-occupied | Renter-occupied |
| No Vehicle | 0 (0.0%) | 0 (0.0%) |
| 1 Vehicle | 40 (59.7%) | 0 (0.0%) |
| 2 Vehicles | 24 (35.8%) | 0 (0.0%) |
| 3 or more Vehicles | 3 (4.5%) | 0 (0.0%) |
| Total | 67 (100.0%) | 0 (0.0%) |
Real Estate & Mortgages in Babb
Real Estate and Mortgage Overview in Babb
| Characteristic | Without Mortgage | With Mortgage |
| Housing Units | 56 | 11 |
| Median Property Value | $158,000 | $0 |
| Median Household Income | - | - |
| Monthly Housing Costs | $195 | $0 |
| Real Estate Taxes | - | - |
Property Value by Mortgage Status in Babb
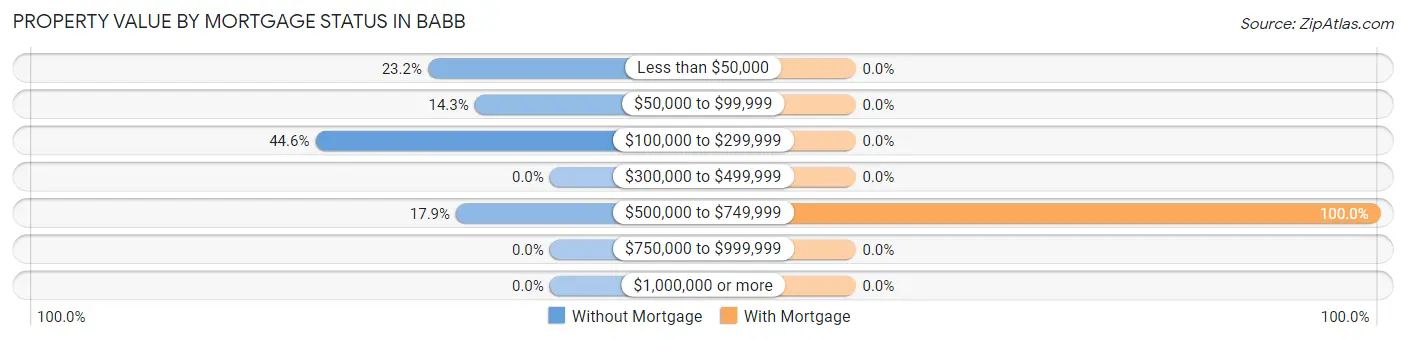
| Property Value | Without Mortgage | With Mortgage |
| Less than $50,000 | 13 (23.2%) | 0 (0.0%) |
| $50,000 to $99,999 | 8 (14.3%) | 0 (0.0%) |
| $100,000 to $299,999 | 25 (44.6%) | 0 (0.0%) |
| $300,000 to $499,999 | 0 (0.0%) | 0 (0.0%) |
| $500,000 to $749,999 | 10 (17.9%) | 11 (100.0%) |
| $750,000 to $999,999 | 0 (0.0%) | 0 (0.0%) |
| $1,000,000 or more | 0 (0.0%) | 0 (0.0%) |
| Total | 56 (100.0%) | 11 (100.0%) |
Household Income by Mortgage Status in Babb
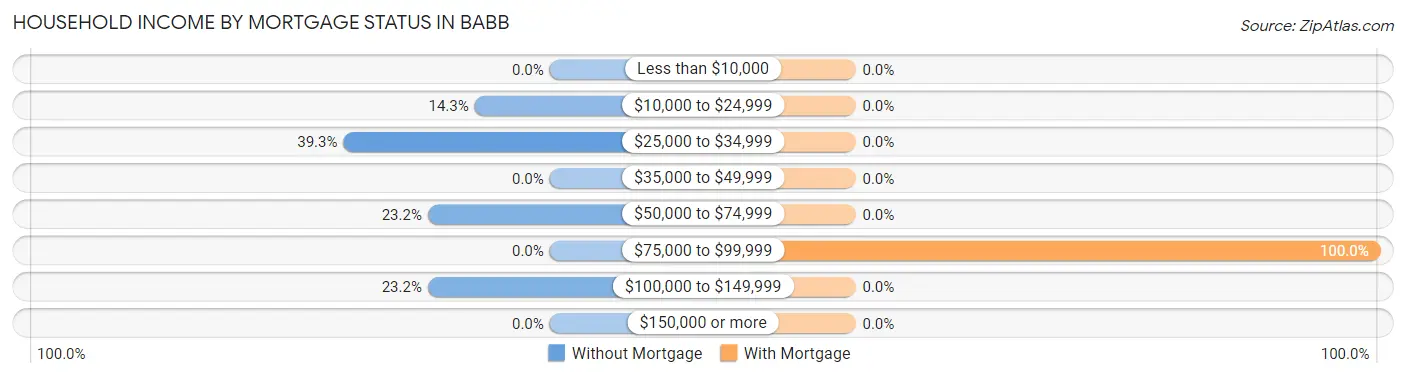
| Household Income | Without Mortgage | With Mortgage |
| Less than $10,000 | 0 (0.0%) | 0 (0.0%) |
| $10,000 to $24,999 | 8 (14.3%) | 0 (0.0%) |
| $25,000 to $34,999 | 22 (39.3%) | 0 (0.0%) |
| $35,000 to $49,999 | 0 (0.0%) | 0 (0.0%) |
| $50,000 to $74,999 | 13 (23.2%) | 0 (0.0%) |
| $75,000 to $99,999 | 0 (0.0%) | 11 (100.0%) |
| $100,000 to $149,999 | 13 (23.2%) | 0 (0.0%) |
| $150,000 or more | 0 (0.0%) | 0 (0.0%) |
| Total | 56 (100.0%) | 11 (100.0%) |
Property Value to Household Income Ratio in Babb
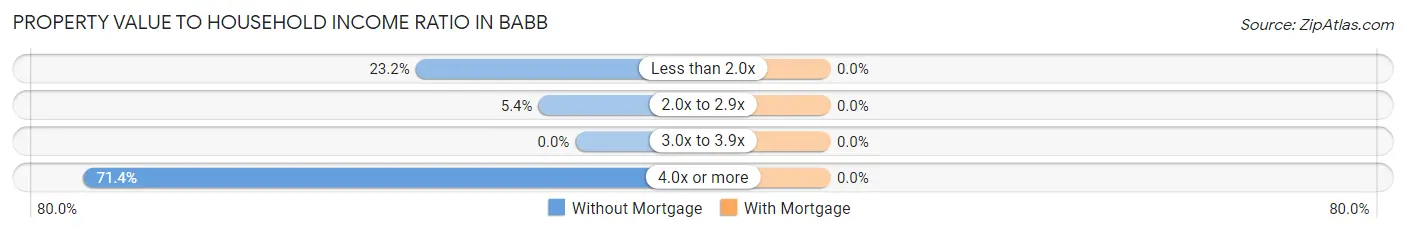
| Value-to-Income Ratio | Without Mortgage | With Mortgage |
| Less than 2.0x | 13 (23.2%) | 0 (0.0%) |
| 2.0x to 2.9x | 3 (5.4%) | 0 (0.0%) |
| 3.0x to 3.9x | 0 (0.0%) | 0 (0.0%) |
| 4.0x or more | 40 (71.4%) | 0 (0.0%) |
| Total | 56 (100.0%) | 11 (100.0%) |
Real Estate Taxes by Mortgage Status in Babb
| Property Taxes | Without Mortgage | With Mortgage |
| Less than $800 | 0 (0.0%) | 0 (0.0%) |
| $800 to $1,499 | 0 (0.0%) | 0 (0.0%) |
| $800 to $1,499 | 0 (0.0%) | 0 (0.0%) |
| Total | 56 (100.0%) | 11 (100.0%) |
Health & Disability in Babb
Health Insurance Coverage by Age in Babb
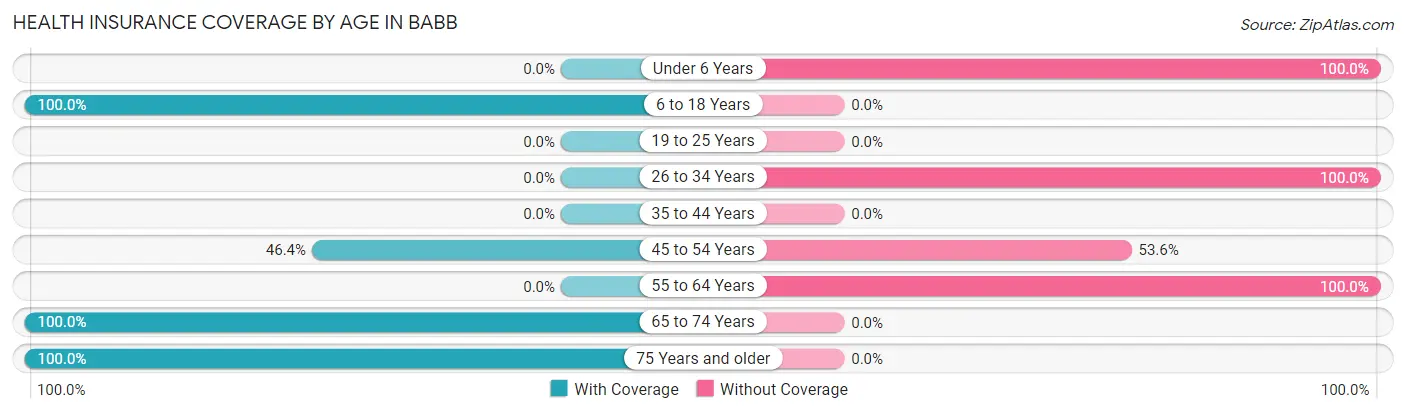
| Age Bracket | With Coverage | Without Coverage |
| Under 6 Years | 0 (0.0%) | 52 (100.0%) |
| 6 to 18 Years | 29 (100.0%) | 0 (0.0%) |
| 19 to 25 Years | 0 (0.0%) | 0 (0.0%) |
| 26 to 34 Years | 0 (0.0%) | 82 (100.0%) |
| 35 to 44 Years | 0 (0.0%) | 0 (0.0%) |
| 45 to 54 Years | 13 (46.4%) | 15 (53.6%) |
| 55 to 64 Years | 0 (0.0%) | 28 (100.0%) |
| 65 to 74 Years | 1 (100.0%) | 0 (0.0%) |
| 75 Years and older | 51 (100.0%) | 0 (0.0%) |
| Total | 94 (34.7%) | 177 (65.3%) |
Health Insurance Coverage by Citizenship Status in Babb
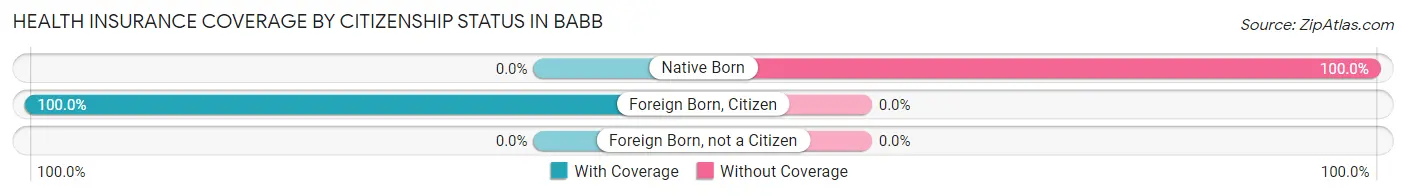
| Citizenship Status | With Coverage | Without Coverage |
| Native Born | 0 (0.0%) | 52 (100.0%) |
| Foreign Born, Citizen | 29 (100.0%) | 0 (0.0%) |
| Foreign Born, not a Citizen | 0 (0.0%) | 0 (0.0%) |
Health Insurance Coverage by Household Income in Babb
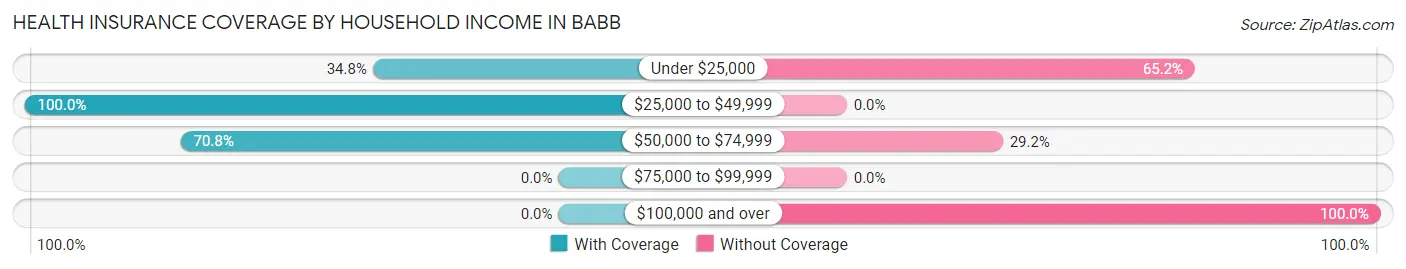
| Household Income | With Coverage | Without Coverage |
| Under $25,000 | 8 (34.8%) | 15 (65.2%) |
| $25,000 to $49,999 | 23 (100.0%) | 0 (0.0%) |
| $50,000 to $74,999 | 63 (70.8%) | 26 (29.2%) |
| $75,000 to $99,999 | 0 (0.0%) | 0 (0.0%) |
| $100,000 and over | 0 (0.0%) | 136 (100.0%) |
Public vs Private Health Insurance Coverage by Age in Babb
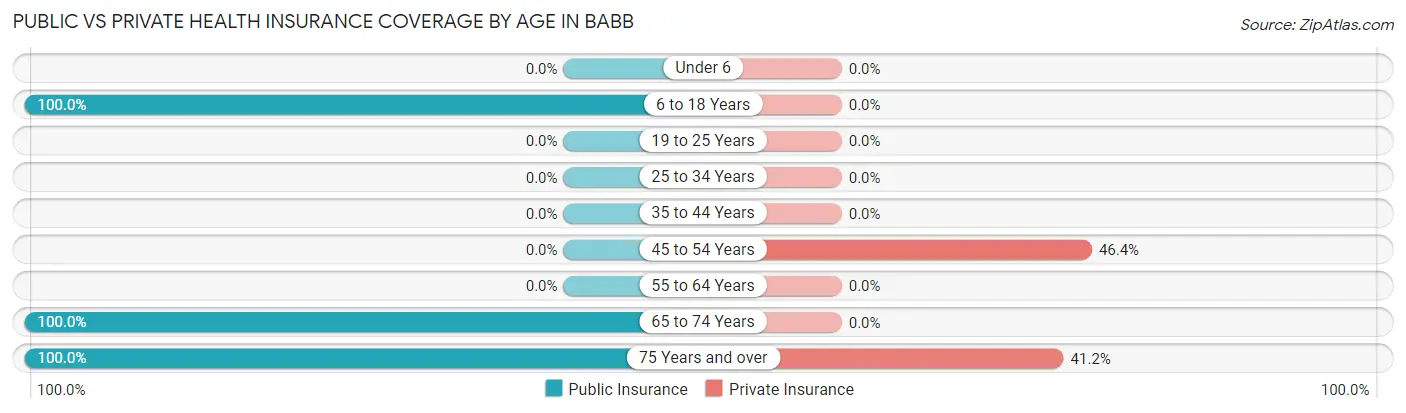
| Age Bracket | Public Insurance | Private Insurance |
| Under 6 | 0 (0.0%) | 0 (0.0%) |
| 6 to 18 Years | 29 (100.0%) | 0 (0.0%) |
| 19 to 25 Years | 0 (0.0%) | 0 (0.0%) |
| 25 to 34 Years | 0 (0.0%) | 0 (0.0%) |
| 35 to 44 Years | 0 (0.0%) | 0 (0.0%) |
| 45 to 54 Years | 0 (0.0%) | 13 (46.4%) |
| 55 to 64 Years | 0 (0.0%) | 0 (0.0%) |
| 65 to 74 Years | 1 (100.0%) | 0 (0.0%) |
| 75 Years and over | 51 (100.0%) | 21 (41.2%) |
| Total | 81 (29.9%) | 34 (12.6%) |
Disability Status by Sex by Age in Babb
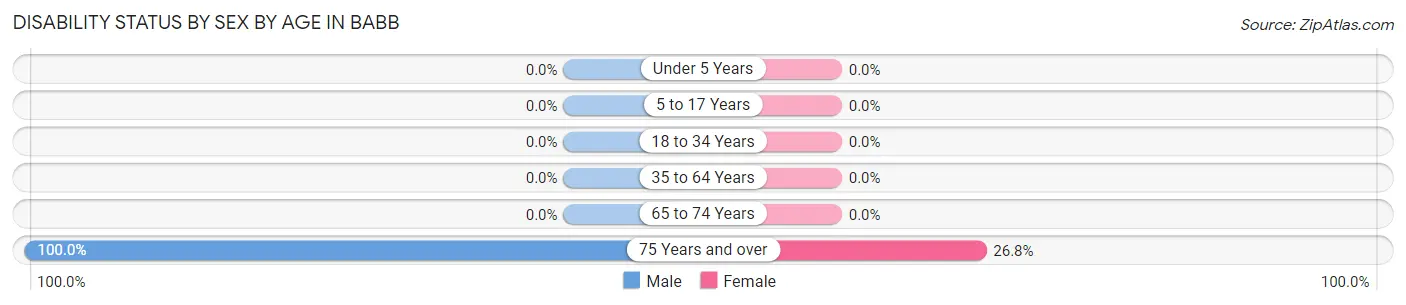
| Age Bracket | Male | Female |
| Under 5 Years | 0 (0.0%) | 0 (0.0%) |
| 5 to 17 Years | 0 (0.0%) | 0 (0.0%) |
| 18 to 34 Years | 0 (0.0%) | 0 (0.0%) |
| 35 to 64 Years | 0 (0.0%) | 0 (0.0%) |
| 65 to 74 Years | 0 (0.0%) | 0 (0.0%) |
| 75 Years and over | 10 (100.0%) | 11 (26.8%) |
Disability Class by Sex by Age in Babb
Disability Class: Hearing Difficulty
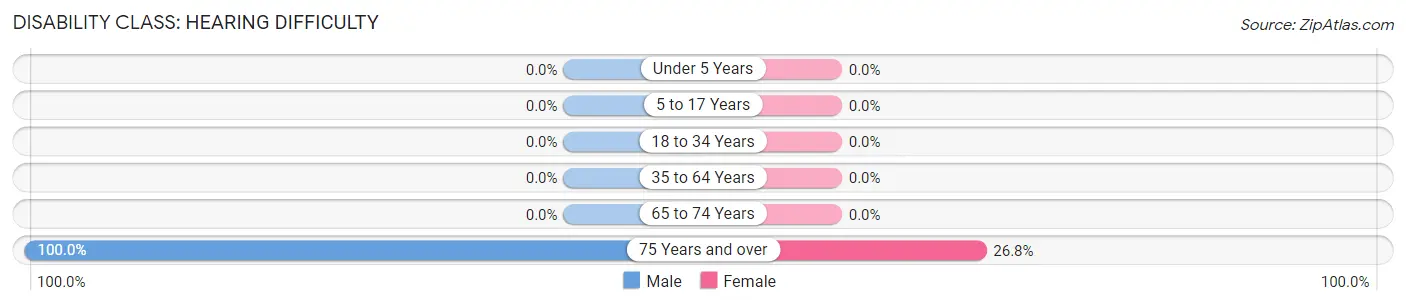
| Age Bracket | Male | Female |
| Under 5 Years | 0 (0.0%) | 0 (0.0%) |
| 5 to 17 Years | 0 (0.0%) | 0 (0.0%) |
| 18 to 34 Years | 0 (0.0%) | 0 (0.0%) |
| 35 to 64 Years | 0 (0.0%) | 0 (0.0%) |
| 65 to 74 Years | 0 (0.0%) | 0 (0.0%) |
| 75 Years and over | 10 (100.0%) | 11 (26.8%) |
Disability Class: Vision Difficulty
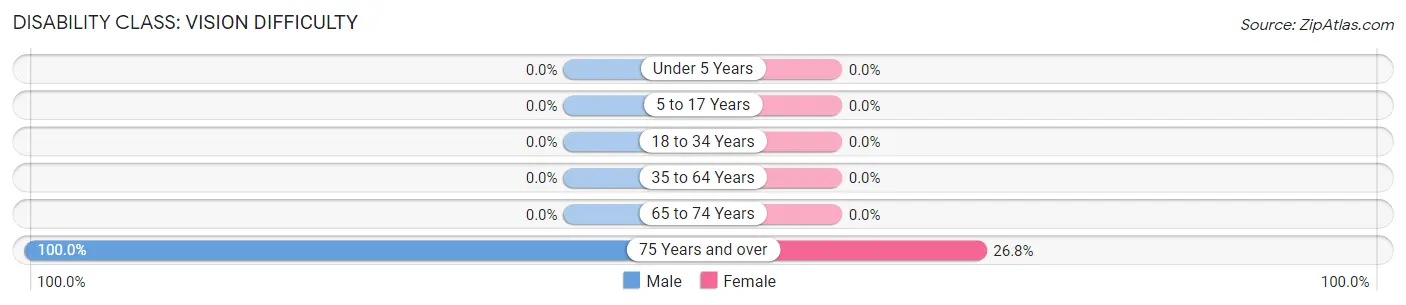
| Age Bracket | Male | Female |
| Under 5 Years | 0 (0.0%) | 0 (0.0%) |
| 5 to 17 Years | 0 (0.0%) | 0 (0.0%) |
| 18 to 34 Years | 0 (0.0%) | 0 (0.0%) |
| 35 to 64 Years | 0 (0.0%) | 0 (0.0%) |
| 65 to 74 Years | 0 (0.0%) | 0 (0.0%) |
| 75 Years and over | 10 (100.0%) | 11 (26.8%) |
Disability Class: Cognitive Difficulty
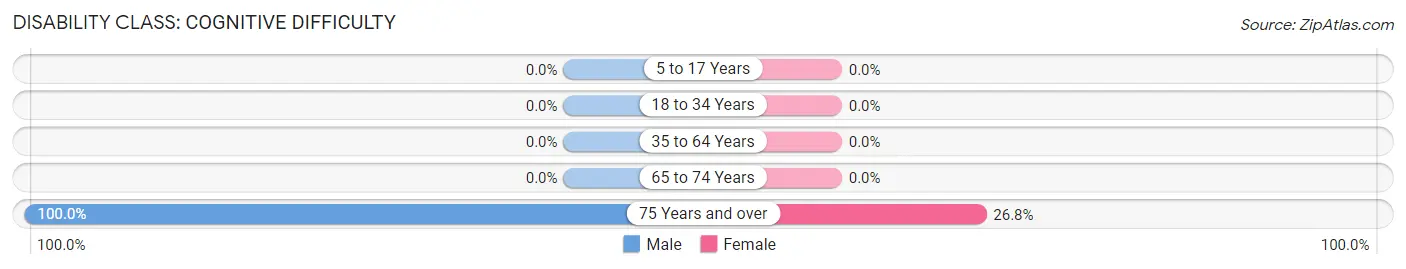
| Age Bracket | Male | Female |
| 5 to 17 Years | 0 (0.0%) | 0 (0.0%) |
| 18 to 34 Years | 0 (0.0%) | 0 (0.0%) |
| 35 to 64 Years | 0 (0.0%) | 0 (0.0%) |
| 65 to 74 Years | 0 (0.0%) | 0 (0.0%) |
| 75 Years and over | 10 (100.0%) | 11 (26.8%) |
Disability Class: Ambulatory Difficulty
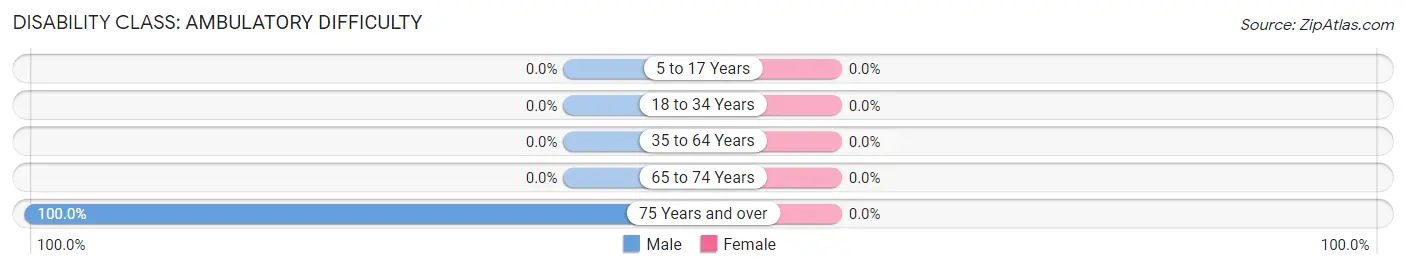
| Age Bracket | Male | Female |
| 5 to 17 Years | 0 (0.0%) | 0 (0.0%) |
| 18 to 34 Years | 0 (0.0%) | 0 (0.0%) |
| 35 to 64 Years | 0 (0.0%) | 0 (0.0%) |
| 65 to 74 Years | 0 (0.0%) | 0 (0.0%) |
| 75 Years and over | 10 (100.0%) | 0 (0.0%) |
Disability Class: Self-Care Difficulty
| Age Bracket | Male | Female |
| 5 to 17 Years | 0 (0.0%) | 0 (0.0%) |
| 18 to 34 Years | 0 (0.0%) | 0 (0.0%) |
| 35 to 64 Years | 0 (0.0%) | 0 (0.0%) |
| 65 to 74 Years | 0 (0.0%) | 0 (0.0%) |
| 75 Years and over | 0 (0.0%) | 0 (0.0%) |
Technology Access in Babb
Computing Device Access in Babb
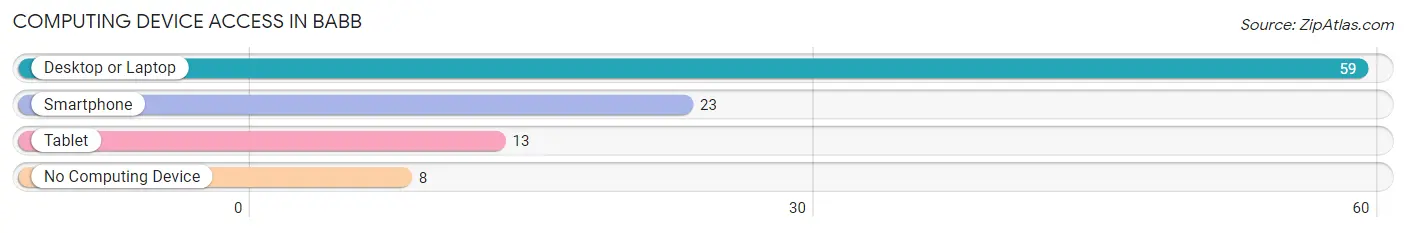
| Device Type | # Households | % Households |
| Desktop or Laptop | 59 | 88.1% |
| Smartphone | 23 | 34.3% |
| Tablet | 13 | 19.4% |
| No Computing Device | 8 | 11.9% |
| Total | 67 | 100.0% |
Internet Access in Babb
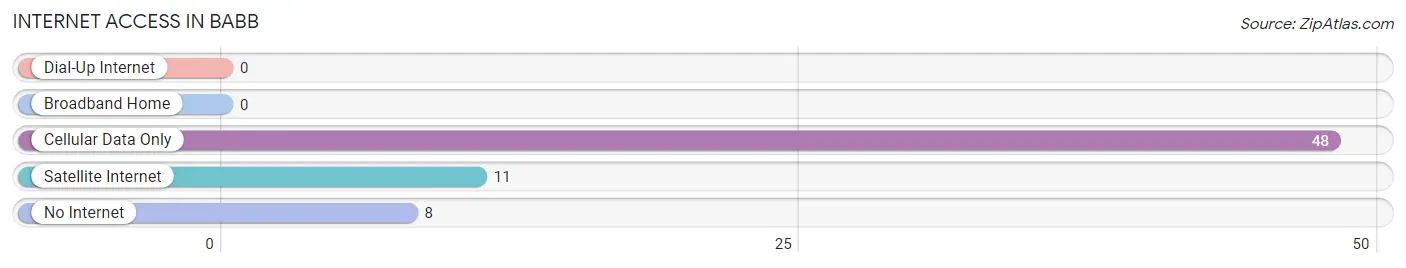
| Internet Type | # Households | % Households |
| Dial-Up Internet | 0 | 0.0% |
| Broadband Home | 0 | 0.0% |
| Cellular Data Only | 48 | 71.6% |
| Satellite Internet | 11 | 16.4% |
| No Internet | 8 | 11.9% |
| Total | 67 | 100.0% |
Babb Summary
Babb, Montana is a small unincorporated community located in Glacier County, Montana. It is situated on the Blackfeet Indian Reservation, and is home to the Blackfeet Nation. The population of Babb was estimated to be around 200 in 2020.
History
Babb was founded in the early 1900s by a group of Blackfeet Indians who had been relocated from their traditional homelands in Canada. The town was named after a Blackfeet chief, Chief Babb. The town was originally a trading post, and it quickly grew into a small community.
In the early 1900s, Babb was a bustling community with a variety of businesses, including a hotel, a general store, a post office, a blacksmith shop, and a saloon. The town also had a school, a church, and a cemetery.
In the 1920s, the Great Northern Railway built a line through Babb, connecting it to the larger towns of Browning and Cut Bank. This allowed Babb to become a major trading center for the Blackfeet Nation.
Geography
Babb is located in the Rocky Mountains of Montana, in the Blackfeet Indian Reservation. The town is situated at an elevation of 4,400 feet, and is surrounded by mountains and forests. The closest major city is Great Falls, which is about 70 miles away.
The climate in Babb is semi-arid, with cold winters and hot summers. The average annual temperature is around 40 degrees Fahrenheit. The average annual precipitation is around 12 inches.
Economy
The economy of Babb is largely based on tourism and agriculture. The town is home to several tourist attractions, including the Blackfeet Heritage Center, the Blackfeet Nation Museum, and the Blackfeet National Park.
Agriculture is also an important part of the economy. The town is home to several farms, which produce a variety of crops, including wheat, barley, oats, and hay.
Demographics
As of 2020, the population of Babb was estimated to be around 200. The majority of the population is Native American, with the Blackfeet Nation making up the majority of the population. The town also has a small population of non-Native Americans.
The median household income in Babb is around $30,000, and the median home value is around $100,000. The town has a high poverty rate, with around 40% of the population living below the poverty line.
Conclusion
Babb, Montana is a small unincorporated community located in Glacier County, Montana. It is situated on the Blackfeet Indian Reservation, and is home to the Blackfeet Nation. The town has a long history, and is home to several tourist attractions and farms. The population of Babb is largely Native American, and the town has a high poverty rate. Despite this, Babb is a vibrant community with a rich culture and history.
Common Questions
What is Per Capita Income in Babb?
Per Capita income in Babb is $21,736.
What is the Median Family Income in Babb?
Median Family Income in Babb is $59,659.
What is Inequality or Gini Index in Babb?
Inequality or Gini Index in Babb is 0.33.
What is the Total Population of Babb?
Total Population of Babb is 271.
What is the Total Male Population of Babb?
Total Male Population of Babb is 98.
What is the Total Female Population of Babb?
Total Female Population of Babb is 173.
What is the Ratio of Males per 100 Females in Babb?
There are 56.65 Males per 100 Females in Babb.
What is the Ratio of Females per 100 Males in Babb?
There are 176.53 Females per 100 Males in Babb.
What is the Median Population Age in Babb?
Median Population Age in Babb is 32.8 Years.
What is the Average Family Size in Babb
Average Family Size in Babb is 6.5 People.
What is the Average Household Size in Babb
Average Household Size in Babb is 4.0 People.
How Large is the Labor Force in Babb?
There are 103 People in the Labor Forcein in Babb.
What is the Percentage of People in the Labor Force in Babb?
50.2% of People are in the Labor Force in Babb.