Arlee, MT Map & Demographics
Arlee Map
Arlee Overview
$20,834
PER CAPITA INCOME
$53,000
AVG FAMILY INCOME
$37,109
AVG HOUSEHOLD INCOME
30.0%
WAGE / INCOME GAP [ % ]
70.0¢/ $1
WAGE / INCOME GAP [ $ ]
0.48
INEQUALITY / GINI INDEX
693
TOTAL POPULATION
327
MALE POPULATION
366
FEMALE POPULATION
89.34
MALES / 100 FEMALES
111.93
FEMALES / 100 MALES
36.6
MEDIAN AGE
3.5
AVG FAMILY SIZE
2.7
AVG HOUSEHOLD SIZE
316
LABOR FORCE [ PEOPLE ]
57.4%
PERCENT IN LABOR FORCE
9.5%
UNEMPLOYMENT RATE
Arlee Zip Codes
Arlee Area Codes
Income in Arlee
Income Overview in Arlee
Per Capita Income in Arlee is $20,834, while median incomes of families and households are $53,000 and $37,109 respectively.
| Characteristic | Number | Measure |
| Per Capita Income | 693 | $20,834 |
| Median Family Income | 160 | $53,000 |
| Mean Family Income | 160 | $67,324 |
| Median Household Income | 253 | $37,109 |
| Mean Household Income | 253 | $58,479 |
| Income Deficit | 160 | $0 |
| Wage / Income Gap (%) | 693 | 29.98% |
| Wage / Income Gap ($) | 693 | 70.02¢ per $1 |
| Gini / Inequality Index | 693 | 0.48 |
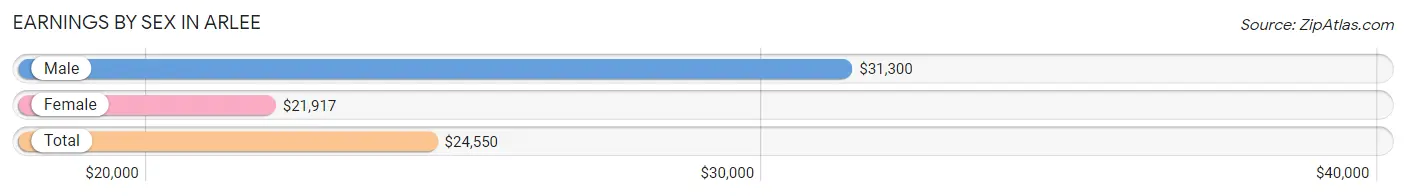
Earnings by Sex in Arlee
Average Earnings in Arlee are $24,550, $31,300 for men and $21,917 for women, a difference of 30.0%.
| Sex | Number | Average Earnings |
| Male | 186 (51.8%) | $31,300 |
| Female | 173 (48.2%) | $21,917 |
| Total | 359 (100.0%) | $24,550 |
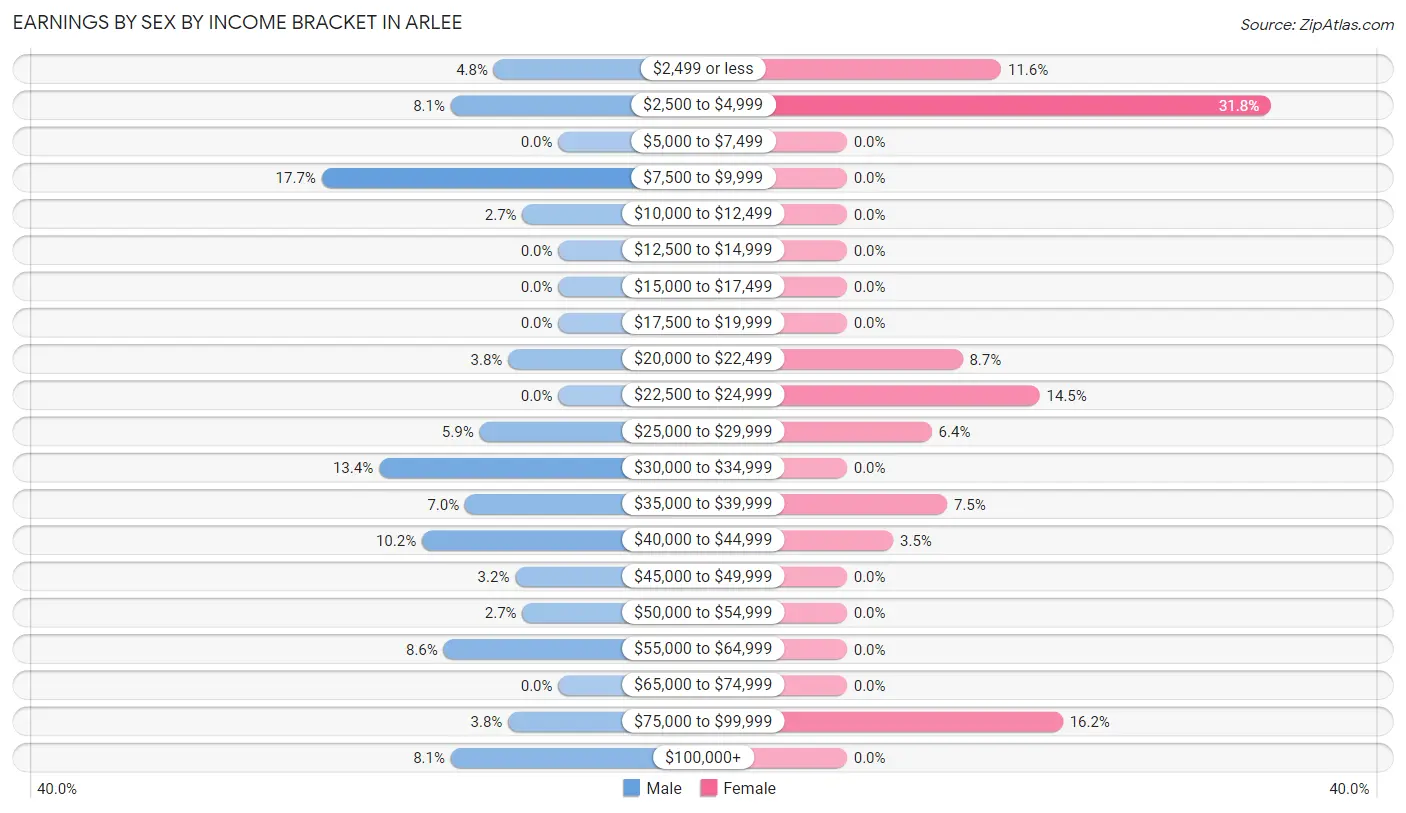
Earnings by Sex by Income Bracket in Arlee
The most common earnings brackets in Arlee are $7,500 to $9,999 for men (33 | 17.7%) and $2,500 to $4,999 for women (55 | 31.8%).
| Income | Male | Female |
| $2,499 or less | 9 (4.8%) | 20 (11.6%) |
| $2,500 to $4,999 | 15 (8.1%) | 55 (31.8%) |
| $5,000 to $7,499 | 0 (0.0%) | 0 (0.0%) |
| $7,500 to $9,999 | 33 (17.7%) | 0 (0.0%) |
| $10,000 to $12,499 | 5 (2.7%) | 0 (0.0%) |
| $12,500 to $14,999 | 0 (0.0%) | 0 (0.0%) |
| $15,000 to $17,499 | 0 (0.0%) | 0 (0.0%) |
| $17,500 to $19,999 | 0 (0.0%) | 0 (0.0%) |
| $20,000 to $22,499 | 7 (3.8%) | 15 (8.7%) |
| $22,500 to $24,999 | 0 (0.0%) | 25 (14.4%) |
| $25,000 to $29,999 | 11 (5.9%) | 11 (6.4%) |
| $30,000 to $34,999 | 25 (13.4%) | 0 (0.0%) |
| $35,000 to $39,999 | 13 (7.0%) | 13 (7.5%) |
| $40,000 to $44,999 | 19 (10.2%) | 6 (3.5%) |
| $45,000 to $49,999 | 6 (3.2%) | 0 (0.0%) |
| $50,000 to $54,999 | 5 (2.7%) | 0 (0.0%) |
| $55,000 to $64,999 | 16 (8.6%) | 0 (0.0%) |
| $65,000 to $74,999 | 0 (0.0%) | 0 (0.0%) |
| $75,000 to $99,999 | 7 (3.8%) | 28 (16.2%) |
| $100,000+ | 15 (8.1%) | 0 (0.0%) |
| Total | 186 (100.0%) | 173 (100.0%) |
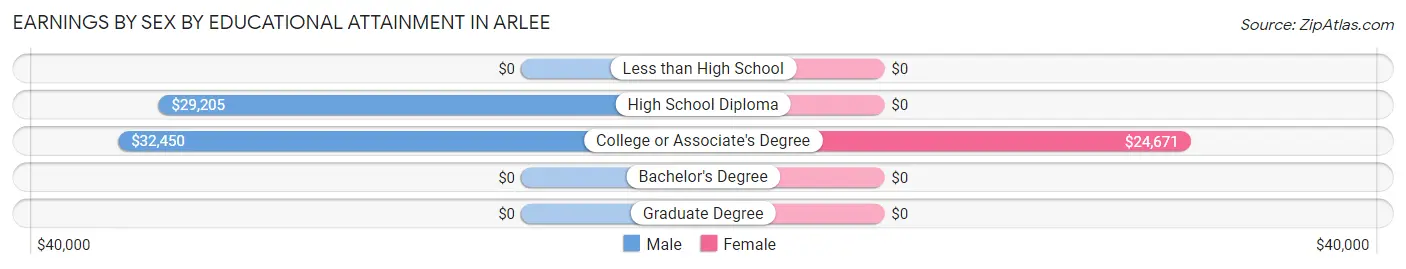
Earnings by Sex by Educational Attainment in Arlee
Average earnings in Arlee are $38,846 for men and $21,917 for women, a difference of 43.6%. Men with an educational attainment of college or associate's degree enjoy the highest average annual earnings of $32,450, while those with high school diploma education earn the least with $29,205. Women with an educational attainment of college or associate's degree earn the most with the average annual earnings of $24,671, while those with college or associate's degree education have the smallest earnings of $24,671.
| Educational Attainment | Male Income | Female Income |
| Less than High School | - | - |
| High School Diploma | $29,205 | $0 |
| College or Associate's Degree | $32,450 | $24,671 |
| Bachelor's Degree | - | - |
| Graduate Degree | - | - |
| Total | $38,846 | $21,917 |
Family Income in Arlee
Family Income Brackets in Arlee
According to the Arlee family income data, there are 41 families falling into the $100,000 to $149,999 income range, which is the most common income bracket and makes up 25.6% of all families.
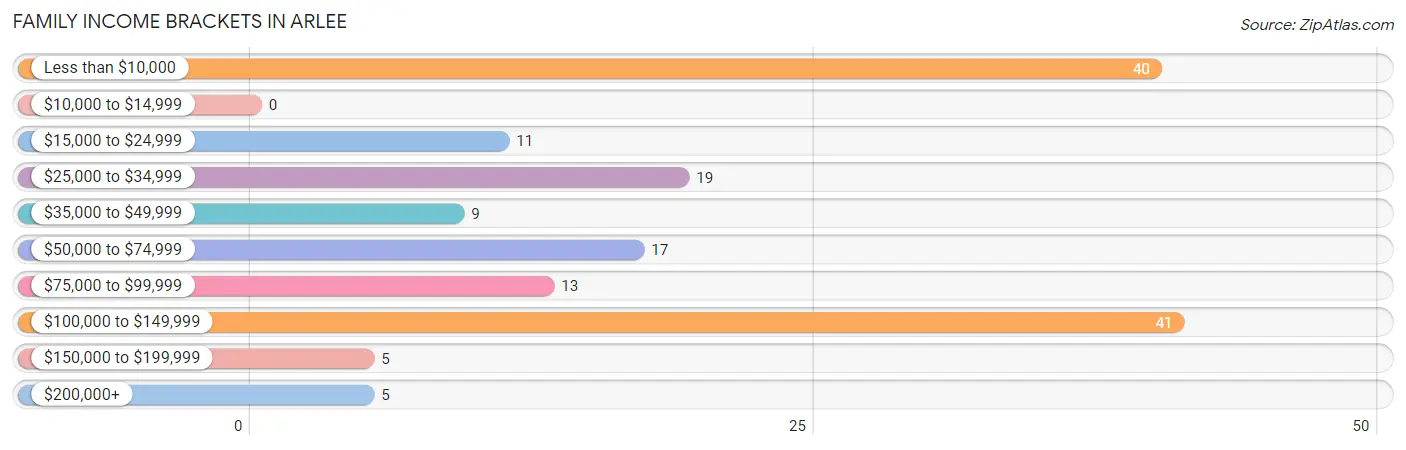
| Income Bracket | # Families | % Families |
| Less than $10,000 | 40 | 25.0% |
| $10,000 to $14,999 | 0 | 0.0% |
| $15,000 to $24,999 | 11 | 6.9% |
| $25,000 to $34,999 | 19 | 11.9% |
| $35,000 to $49,999 | 9 | 5.6% |
| $50,000 to $74,999 | 17 | 10.6% |
| $75,000 to $99,999 | 13 | 8.1% |
| $100,000 to $149,999 | 41 | 25.6% |
| $150,000 to $199,999 | 5 | 3.1% |
| $200,000+ | 5 | 3.1% |
Family Income by Famaliy Size in Arlee
4-person families (37 | 23.1%) account for the highest median family income in Arlee with $86,528 per family, while 4-person families (37 | 23.1%) have the highest median income of $21,632 per family member.
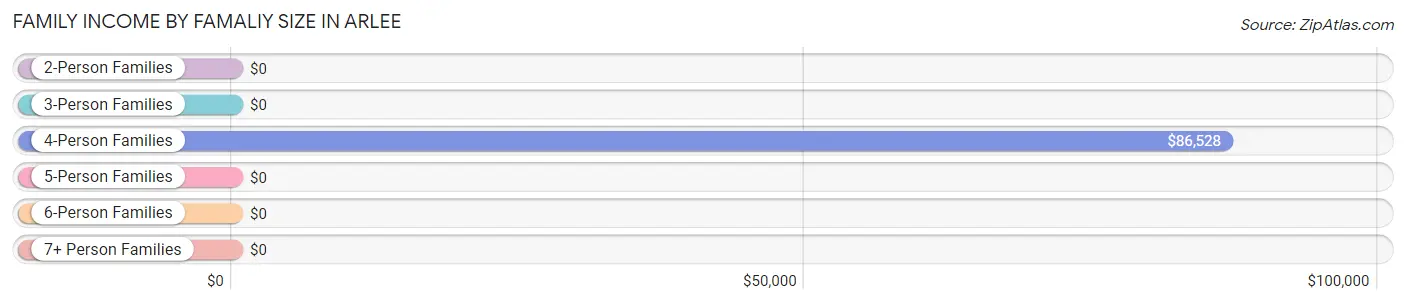
| Income Bracket | # Families | Median Income |
| 2-Person Families | 70 (43.8%) | $0 |
| 3-Person Families | 30 (18.8%) | $0 |
| 4-Person Families | 37 (23.1%) | $86,528 |
| 5-Person Families | 23 (14.4%) | $0 |
| 6-Person Families | 0 (0.0%) | $0 |
| 7+ Person Families | 0 (0.0%) | $0 |
| Total | 160 (100.0%) | $53,000 |
Family Income by Number of Earners in Arlee
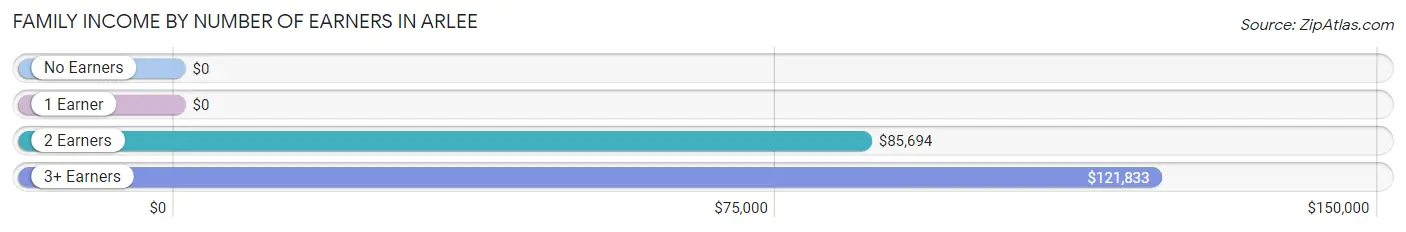
| Number of Earners | # Families | Median Income |
| No Earners | 29 (18.1%) | $0 |
| 1 Earner | 46 (28.7%) | $0 |
| 2 Earners | 47 (29.4%) | $85,694 |
| 3+ Earners | 38 (23.7%) | $121,833 |
| Total | 160 (100.0%) | $53,000 |
Household Income in Arlee
Household Income Brackets in Arlee
With 46 households falling in the category, the less than $10,000 income range is the most frequent in Arlee, accounting for 18.2% of all households. In contrast, only 5 households (2.0%) fall into the $150,000 to $199,999 income bracket, making it the least populous group.
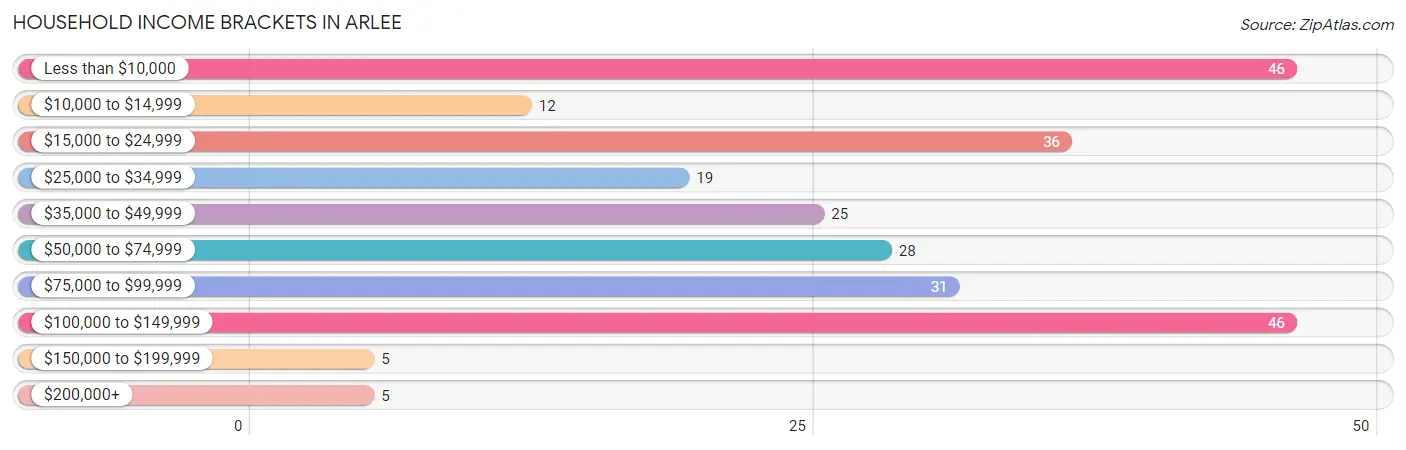
| Income Bracket | # Households | % Households |
| Less than $10,000 | 46 | 18.2% |
| $10,000 to $14,999 | 12 | 4.7% |
| $15,000 to $24,999 | 36 | 14.2% |
| $25,000 to $34,999 | 19 | 7.5% |
| $35,000 to $49,999 | 25 | 9.9% |
| $50,000 to $74,999 | 28 | 11.1% |
| $75,000 to $99,999 | 31 | 12.3% |
| $100,000 to $149,999 | 46 | 18.2% |
| $150,000 to $199,999 | 5 | 2.0% |
| $200,000+ | 5 | 2.0% |
Household Income by Householder Age in Arlee
The median household income in Arlee is $37,109, with the highest median household income of $63,571 found in the 45 to 64 years age bracket for the primary householder. A total of 62 households (24.5%) fall into this category. Meanwhile, the 15 to 24 years age bracket for the primary householder has the lowest median household income of $0, with 22 households (8.7%) in this group.
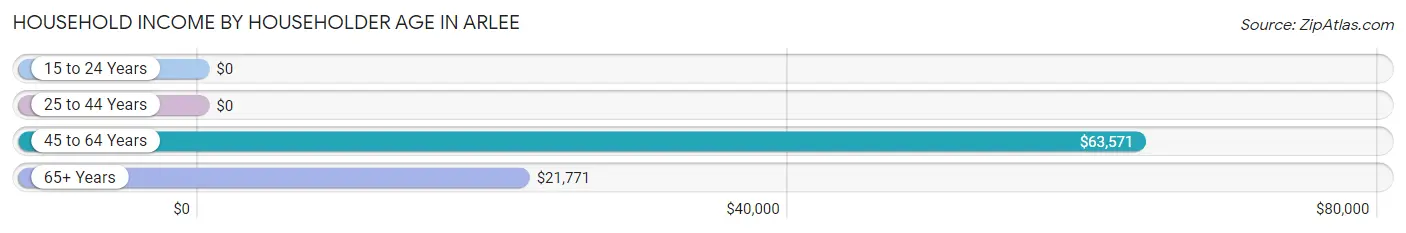
| Income Bracket | # Households | Median Income |
| 15 to 24 Years | 22 (8.7%) | $0 |
| 25 to 44 Years | 88 (34.8%) | $0 |
| 45 to 64 Years | 62 (24.5%) | $63,571 |
| 65+ Years | 81 (32.0%) | $21,771 |
| Total | 253 (100.0%) | $37,109 |
Poverty in Arlee
Income Below Poverty by Sex and Age in Arlee
With 36.1% poverty level for males and 32.6% for females among the residents of Arlee, 35 to 44 year old males and 25 to 34 year old females are the most vulnerable to poverty, with 65 males (67.7%) and 27 females (81.8%) in their respective age groups living below the poverty level.
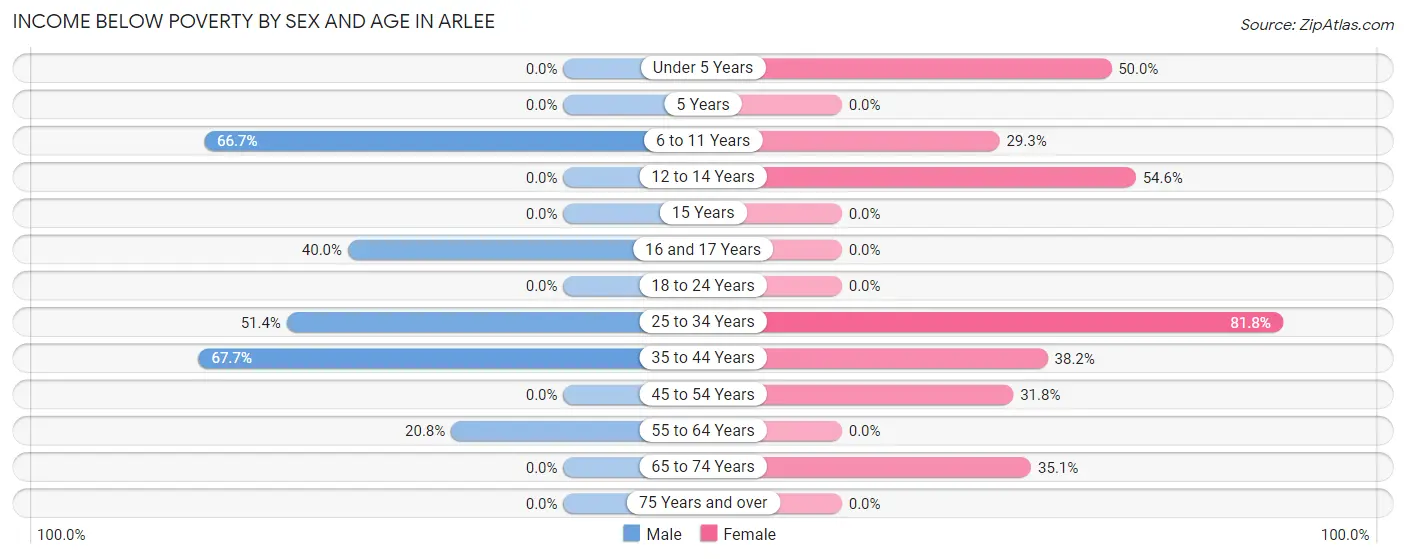
| Age Bracket | Male | Female |
| Under 5 Years | 0 (0.0%) | 11 (50.0%) |
| 5 Years | 0 (0.0%) | 0 (0.0%) |
| 6 to 11 Years | 18 (66.7%) | 12 (29.3%) |
| 12 to 14 Years | 0 (0.0%) | 12 (54.5%) |
| 15 Years | 0 (0.0%) | 0 (0.0%) |
| 16 and 17 Years | 6 (40.0%) | 0 (0.0%) |
| 18 to 24 Years | 0 (0.0%) | 0 (0.0%) |
| 25 to 34 Years | 19 (51.3%) | 27 (81.8%) |
| 35 to 44 Years | 65 (67.7%) | 34 (38.2%) |
| 45 to 54 Years | 0 (0.0%) | 7 (31.8%) |
| 55 to 64 Years | 10 (20.8%) | 0 (0.0%) |
| 65 to 74 Years | 0 (0.0%) | 13 (35.1%) |
| 75 Years and over | 0 (0.0%) | 0 (0.0%) |
| Total | 118 (36.1%) | 116 (32.6%) |
Income Above Poverty by Sex and Age in Arlee
According to the poverty statistics in Arlee, males aged under 5 years and females aged 15 years are the age groups that are most secure financially, with 100.0% of males and 100.0% of females in these age groups living above the poverty line.
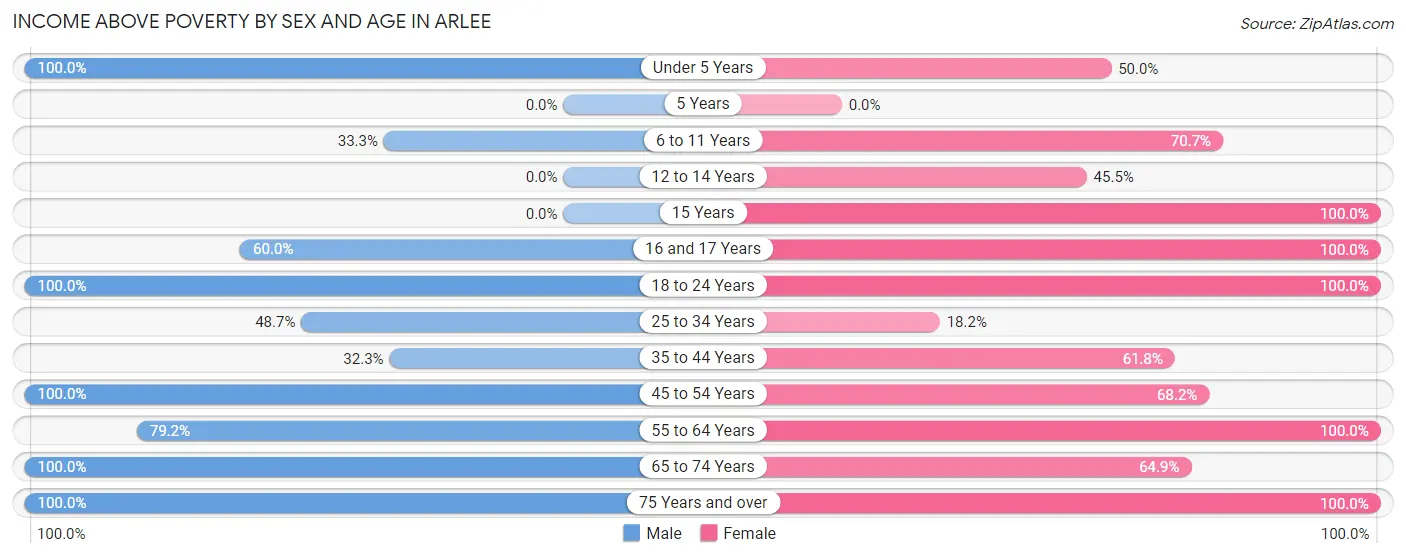
| Age Bracket | Male | Female |
| Under 5 Years | 15 (100.0%) | 11 (50.0%) |
| 5 Years | 0 (0.0%) | 0 (0.0%) |
| 6 to 11 Years | 9 (33.3%) | 29 (70.7%) |
| 12 to 14 Years | 0 (0.0%) | 10 (45.5%) |
| 15 Years | 0 (0.0%) | 5 (100.0%) |
| 16 and 17 Years | 9 (60.0%) | 21 (100.0%) |
| 18 to 24 Years | 29 (100.0%) | 21 (100.0%) |
| 25 to 34 Years | 18 (48.6%) | 6 (18.2%) |
| 35 to 44 Years | 31 (32.3%) | 55 (61.8%) |
| 45 to 54 Years | 15 (100.0%) | 15 (68.2%) |
| 55 to 64 Years | 38 (79.2%) | 31 (100.0%) |
| 65 to 74 Years | 18 (100.0%) | 24 (64.9%) |
| 75 Years and over | 27 (100.0%) | 12 (100.0%) |
| Total | 209 (63.9%) | 240 (67.4%) |
Income Below Poverty Among Married-Couple Families in Arlee
The poverty statistics for married-couple families in Arlee show that 13.2% or 15 of the total 114 families live below the poverty line. Families with 3 or 4 children have the highest poverty rate of 100.0%, comprising of 11 families. On the other hand, families with no children have the lowest poverty rate of 0.0%, which includes 0 families.
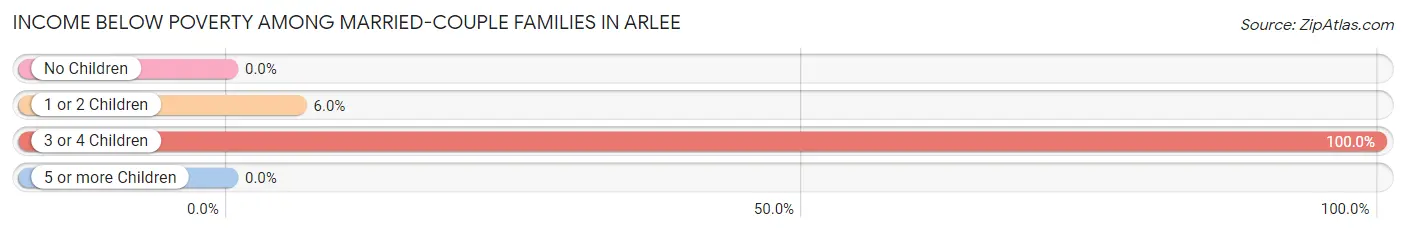
| Children | Above Poverty | Below Poverty |
| No Children | 36 (100.0%) | 0 (0.0%) |
| 1 or 2 Children | 63 (94.0%) | 4 (6.0%) |
| 3 or 4 Children | 0 (0.0%) | 11 (100.0%) |
| 5 or more Children | 0 (0.0%) | 0 (0.0%) |
| Total | 99 (86.8%) | 15 (13.2%) |
Income Below Poverty Among Single-Parent Households in Arlee
According to the poverty data in Arlee, 90.5% or 19 single-father households and 84.0% or 21 single-mother households are living below the poverty line. Among single-father households, those with no children have the highest poverty rate, with 19 households (90.5%) experiencing poverty. Likewise, among single-mother households, those with 1 or 2 children have the highest poverty rate, with 21 households (100.0%) falling below the poverty line.
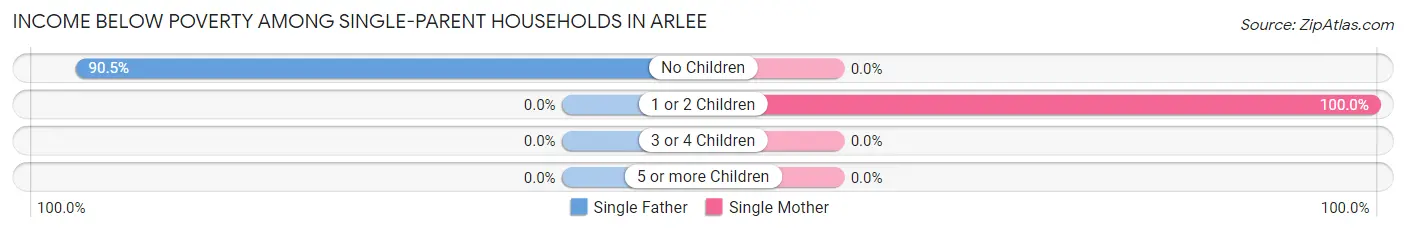
| Children | Single Father | Single Mother |
| No Children | 19 (90.5%) | 0 (0.0%) |
| 1 or 2 Children | 0 (0.0%) | 21 (100.0%) |
| 3 or 4 Children | 0 (0.0%) | 0 (0.0%) |
| 5 or more Children | 0 (0.0%) | 0 (0.0%) |
| Total | 19 (90.5%) | 21 (84.0%) |
Income Below Poverty Among Married-Couple vs Single-Parent Households in Arlee
The poverty data for Arlee shows that 15 of the married-couple family households (13.2%) and 40 of the single-parent households (87.0%) are living below the poverty level. Within the married-couple family households, those with 3 or 4 children have the highest poverty rate, with 11 households (100.0%) falling below the poverty line. Among the single-parent households, those with 1 or 2 children have the highest poverty rate, with 21 household (100.0%) living below poverty.
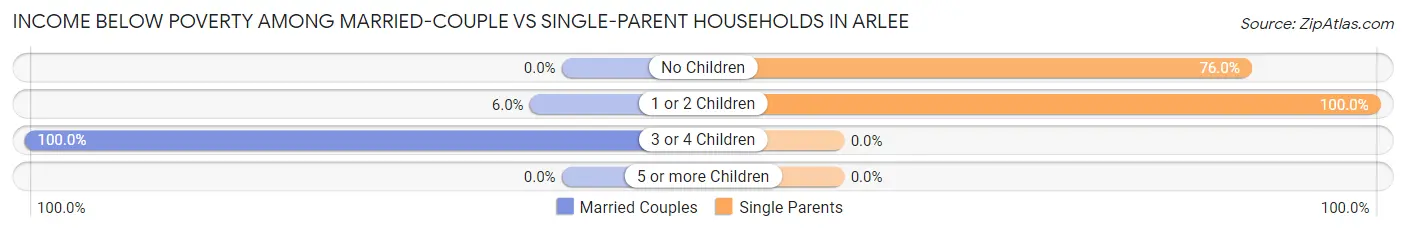
| Children | Married-Couple Families | Single-Parent Households |
| No Children | 0 (0.0%) | 19 (76.0%) |
| 1 or 2 Children | 4 (6.0%) | 21 (100.0%) |
| 3 or 4 Children | 11 (100.0%) | 0 (0.0%) |
| 5 or more Children | 0 (0.0%) | 0 (0.0%) |
| Total | 15 (13.2%) | 40 (87.0%) |
Race in Arlee
The most populous races in Arlee are Native / Alaskan (387 | 55.8%), White / Caucasian (281 | 40.6%), and Hispanic or Latino (26 | 3.7%).
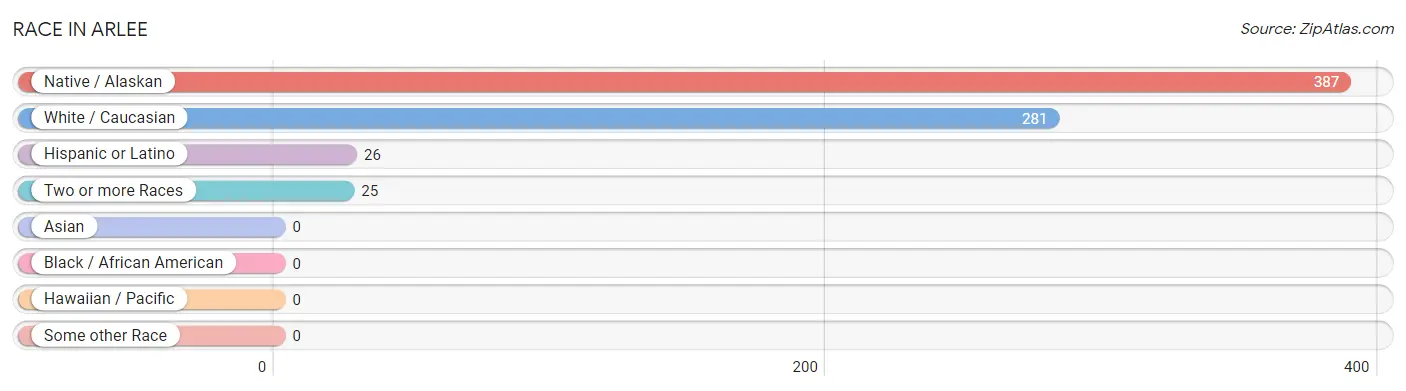
| Race | # Population | % Population |
| Asian | 0 | 0.0% |
| Black / African American | 0 | 0.0% |
| Hawaiian / Pacific | 0 | 0.0% |
| Hispanic or Latino | 26 | 3.7% |
| Native / Alaskan | 387 | 55.8% |
| White / Caucasian | 281 | 40.6% |
| Two or more Races | 25 | 3.6% |
| Some other Race | 0 | 0.0% |
| Total | 693 | 100.0% |
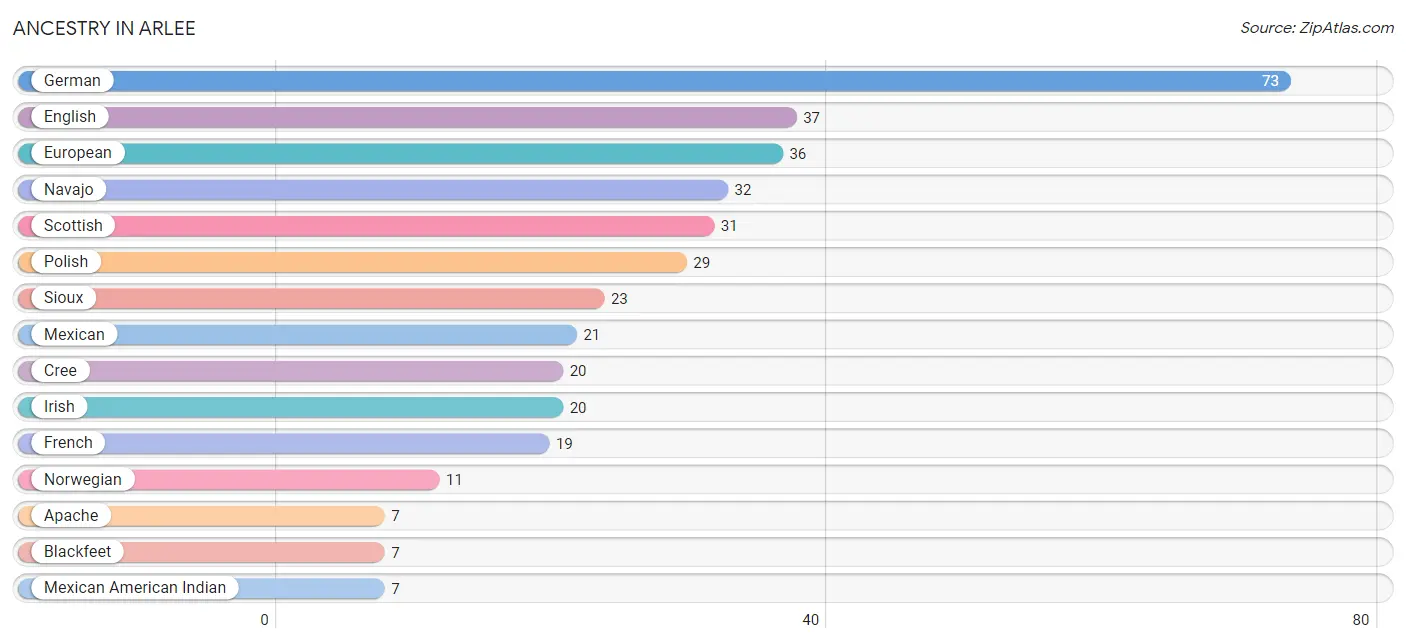
Ancestry in Arlee
The most populous ancestries reported in Arlee are German (73 | 10.5%), English (37 | 5.3%), European (36 | 5.2%), Navajo (32 | 4.6%), and Scottish (31 | 4.5%), together accounting for 30.2% of all Arlee residents.
| Ancestry | # Population | % Population |
| American | 6 | 0.9% |
| Apache | 7 | 1.0% |
| Blackfeet | 7 | 1.0% |
| Cree | 20 | 2.9% |
| English | 37 | 5.3% |
| European | 36 | 5.2% |
| French | 19 | 2.7% |
| French American Indian | 6 | 0.9% |
| German | 73 | 10.5% |
| Irish | 20 | 2.9% |
| Mexican | 21 | 3.0% |
| Mexican American Indian | 7 | 1.0% |
| Navajo | 32 | 4.6% |
| Norwegian | 11 | 1.6% |
| Polish | 29 | 4.2% |
| Scottish | 31 | 4.5% |
| Sioux | 23 | 3.3% |
| Spanish | 5 | 0.7% | View All 18 Rows |
Immigrants in Arlee

| Immigration Origin | # Population | % Population | View All 0 Rows |
Sex and Age in Arlee
Sex and Age in Arlee
The most populous age groups in Arlee are 35 to 39 Years (74 | 22.6%) for men and 35 to 39 Years (63 | 17.2%) for women.
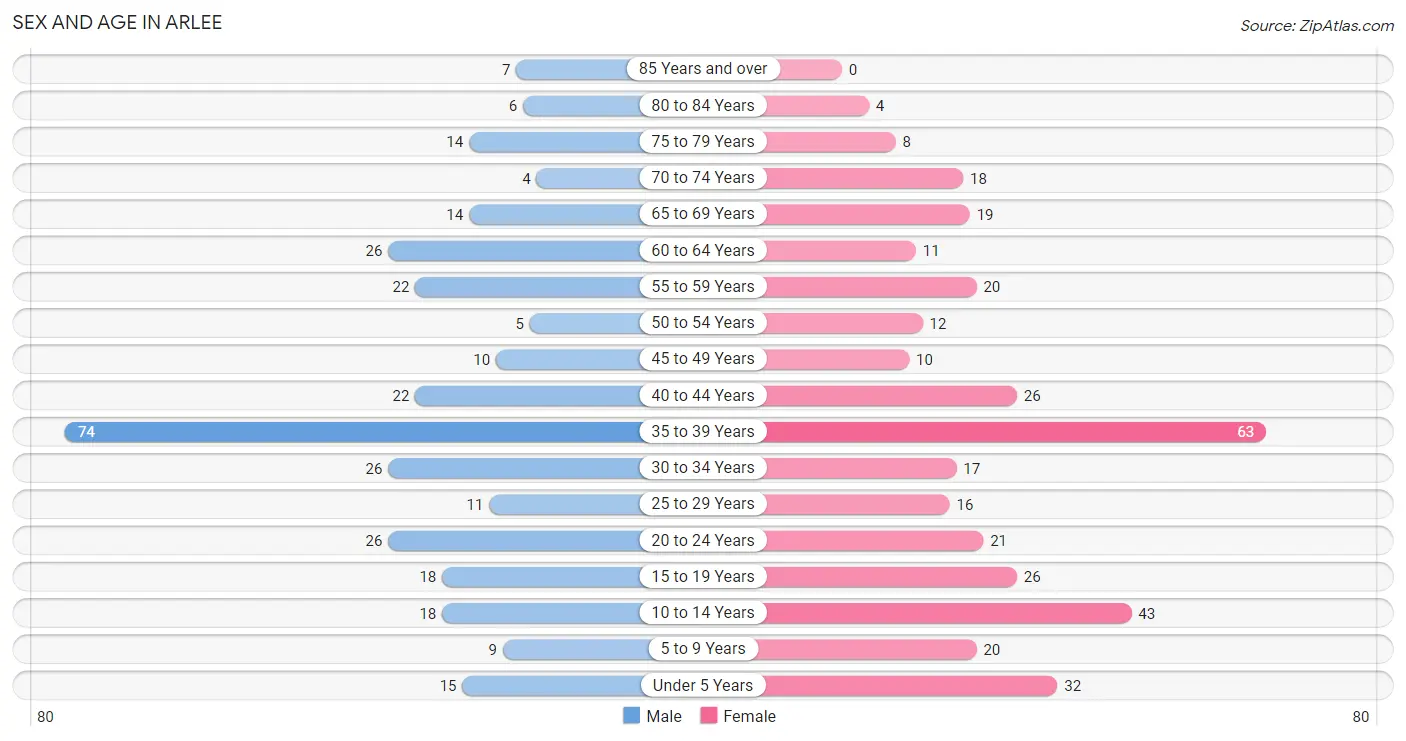
| Age Bracket | Male | Female |
| Under 5 Years | 15 (4.6%) | 32 (8.7%) |
| 5 to 9 Years | 9 (2.8%) | 20 (5.5%) |
| 10 to 14 Years | 18 (5.5%) | 43 (11.7%) |
| 15 to 19 Years | 18 (5.5%) | 26 (7.1%) |
| 20 to 24 Years | 26 (8.0%) | 21 (5.7%) |
| 25 to 29 Years | 11 (3.4%) | 16 (4.4%) |
| 30 to 34 Years | 26 (8.0%) | 17 (4.6%) |
| 35 to 39 Years | 74 (22.6%) | 63 (17.2%) |
| 40 to 44 Years | 22 (6.7%) | 26 (7.1%) |
| 45 to 49 Years | 10 (3.1%) | 10 (2.7%) |
| 50 to 54 Years | 5 (1.5%) | 12 (3.3%) |
| 55 to 59 Years | 22 (6.7%) | 20 (5.5%) |
| 60 to 64 Years | 26 (8.0%) | 11 (3.0%) |
| 65 to 69 Years | 14 (4.3%) | 19 (5.2%) |
| 70 to 74 Years | 4 (1.2%) | 18 (4.9%) |
| 75 to 79 Years | 14 (4.3%) | 8 (2.2%) |
| 80 to 84 Years | 6 (1.8%) | 4 (1.1%) |
| 85 Years and over | 7 (2.1%) | 0 (0.0%) |
| Total | 327 (100.0%) | 366 (100.0%) |
Families and Households in Arlee
Median Family Size in Arlee
The median family size in Arlee is 3.51 persons per family, with single male/father families (21 | 13.1%) accounting for the largest median family size of 3.81 persons per family. On the other hand, single female/mother families (25 | 15.6%) represent the smallest median family size with 2.92 persons per family.
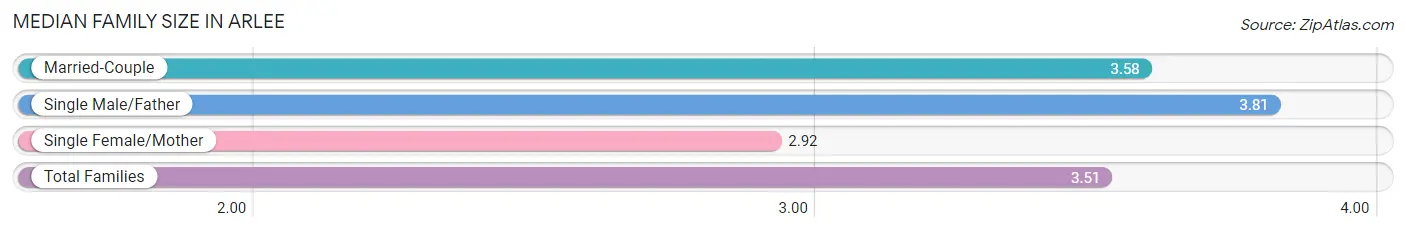
| Family Type | # Families | Family Size |
| Married-Couple | 114 (71.3%) | 3.58 |
| Single Male/Father | 21 (13.1%) | 3.81 |
| Single Female/Mother | 25 (15.6%) | 2.92 |
| Total Families | 160 (100.0%) | 3.51 |
Median Household Size in Arlee
The median household size in Arlee is 2.74 persons per household, with married-couple households (114 | 45.1%) accounting for the largest median household size of 3.81 persons per household. non-family households (93 | 36.8%) represent the smallest median household size with 1.14 persons per household.
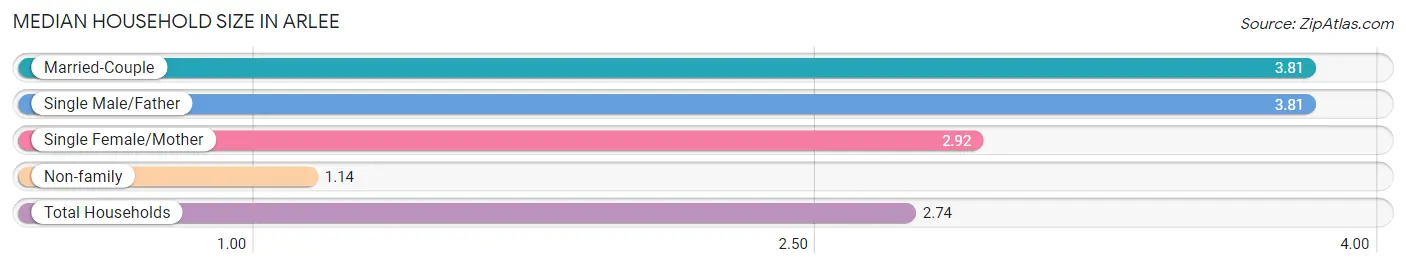
| Household Type | # Households | Household Size |
| Married-Couple | 114 (45.1%) | 3.81 |
| Single Male/Father | 21 (8.3%) | 3.81 |
| Single Female/Mother | 25 (9.9%) | 2.92 |
| Non-family | 93 (36.8%) | 1.14 |
| Total Households | 253 (100.0%) | 2.74 |
Household Size by Marriage Status in Arlee
Out of a total of 253 households in Arlee, 160 (63.2%) are family households, while 93 (36.8%) are nonfamily households. The most numerous type of family households are 2-person households, comprising 65, and the most common type of nonfamily households are 1-person households, comprising 82.
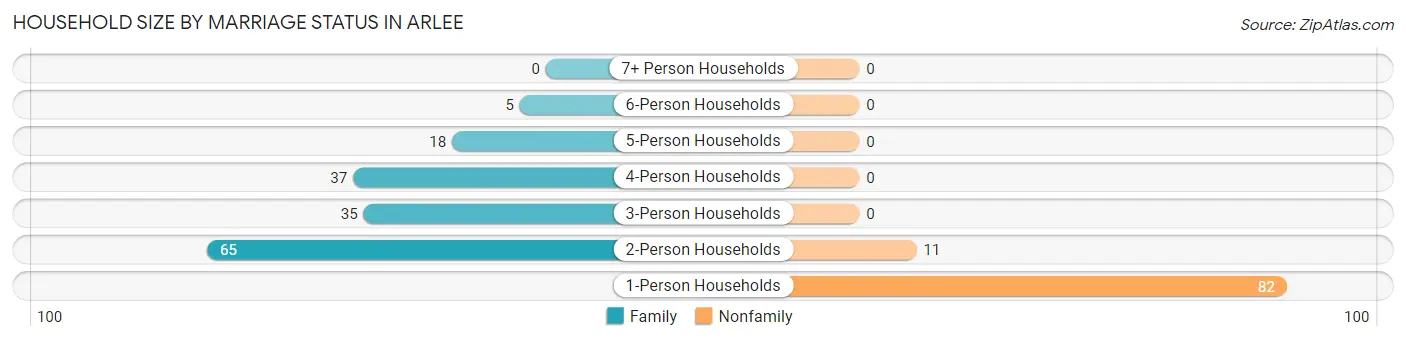
| Household Size | Family Households | Nonfamily Households |
| 1-Person Households | - | 82 (32.4%) |
| 2-Person Households | 65 (25.7%) | 11 (4.3%) |
| 3-Person Households | 35 (13.8%) | 0 (0.0%) |
| 4-Person Households | 37 (14.6%) | 0 (0.0%) |
| 5-Person Households | 18 (7.1%) | 0 (0.0%) |
| 6-Person Households | 5 (2.0%) | 0 (0.0%) |
| 7+ Person Households | 0 (0.0%) | 0 (0.0%) |
| Total | 160 (63.2%) | 93 (36.8%) |
Female Fertility in Arlee
Fertility by Age in Arlee
| Age Bracket | Women with Births | Births / 1,000 Women |
| 15 to 19 years | 0 (0.0%) | 0.0 |
| 20 to 34 years | 0 (0.0%) | 0.0 |
| 35 to 50 years | 0 (0.0%) | 0.0 |
| Total | 0 (0.0%) | 0.0 |
Fertility by Age by Marriage Status in Arlee
| Age Bracket | Married | Unmarried |
| 15 to 19 years | 0 (0.0%) | 0 (0.0%) |
| 20 to 34 years | 0 (0.0%) | 0 (0.0%) |
| 35 to 50 years | 0 (0.0%) | 0 (0.0%) |
| Total | 0 (0.0%) | 0 (0.0%) |
Fertility by Education in Arlee
| Educational Attainment | Women with Births | Births / 1,000 Women |
| Less than High School | 0 (0.0%) | 0.0 |
| High School Diploma | 0 (0.0%) | 0.0 |
| College or Associate's Degree | 0 (0.0%) | 0.0 |
| Bachelor's Degree | 0 (0.0%) | 0.0 |
| Graduate Degree | 0 (0.0%) | 0.0 |
| Total | 0 (0.0%) | 0.0 |
Fertility by Education by Marriage Status in Arlee
| Educational Attainment | Married | Unmarried |
| Less than High School | 0 (0.0%) | 0 (0.0%) |
| High School Diploma | 0 (0.0%) | 0 (0.0%) |
| College or Associate's Degree | 0 (0.0%) | 0 (0.0%) |
| Bachelor's Degree | 0 (0.0%) | 0 (0.0%) |
| Graduate Degree | 0 (0.0%) | 0 (0.0%) |
| Total | 0 (0.0%) | 0 (0.0%) |
Employment Characteristics in Arlee
Employment by Class of Employer in Arlee
Among the 275 employed individuals in Arlee, private company employees (132 | 48.0%), state government employees (44 | 16.0%), and federal government employees (22 | 8.0%) make up the most common classes of employment.
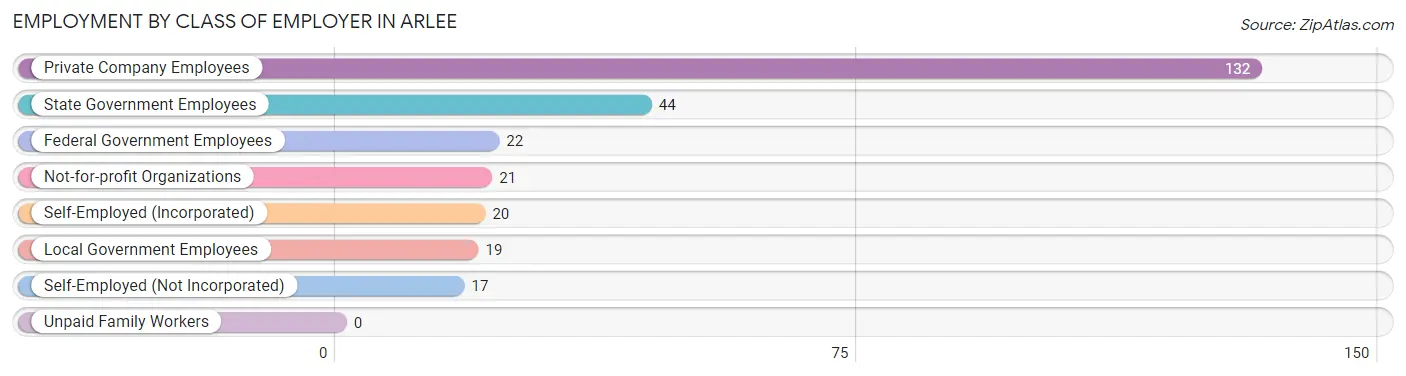
| Employer Class | # Employees | % Employees |
| Private Company Employees | 132 | 48.0% |
| Self-Employed (Incorporated) | 20 | 7.3% |
| Self-Employed (Not Incorporated) | 17 | 6.2% |
| Not-for-profit Organizations | 21 | 7.6% |
| Local Government Employees | 19 | 6.9% |
| State Government Employees | 44 | 16.0% |
| Federal Government Employees | 22 | 8.0% |
| Unpaid Family Workers | 0 | 0.0% |
| Total | 275 | 100.0% |
Employment Status by Age in Arlee
According to the labor force statistics for Arlee, out of the total population over 16 years of age (551), 57.4% or 316 individuals are in the labor force, with 9.5% or 30 of them unemployed. The age group with the highest labor force participation rate is 20 to 24 years, with 100.0% or 47 individuals in the labor force. Within the labor force, the 20 to 24 years age range has the highest percentage of unemployed individuals, with 23.4% or 11 of them being unemployed.
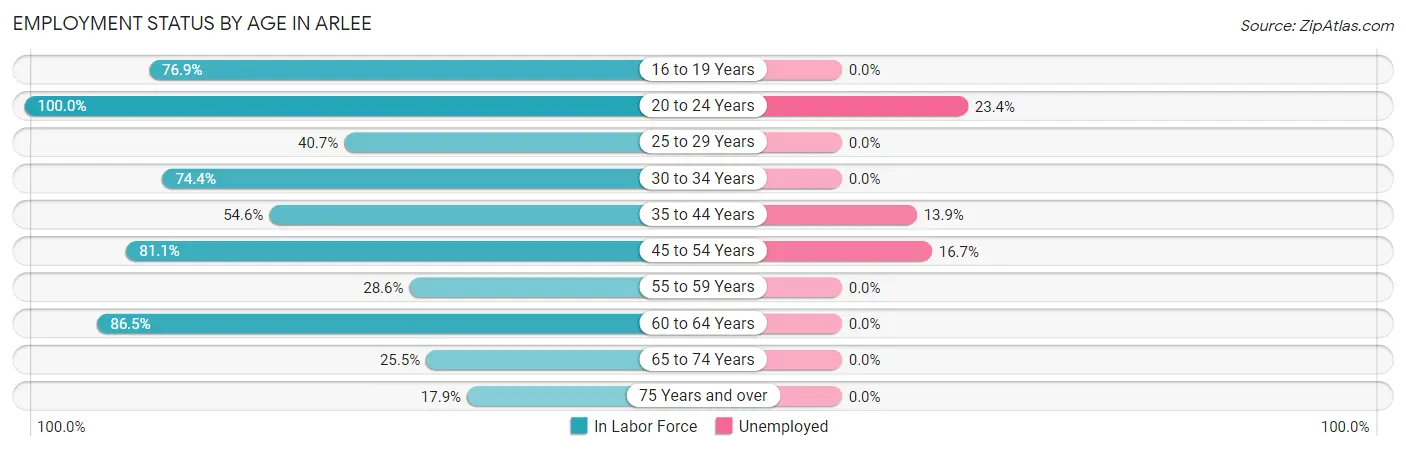
| Age Bracket | In Labor Force | Unemployed |
| 16 to 19 Years | 30 (76.9%) | 0 (0.0%) |
| 20 to 24 Years | 47 (100.0%) | 11 (23.4%) |
| 25 to 29 Years | 11 (40.7%) | 0 (0.0%) |
| 30 to 34 Years | 32 (74.4%) | 0 (0.0%) |
| 35 to 44 Years | 101 (54.6%) | 14 (13.9%) |
| 45 to 54 Years | 30 (81.1%) | 5 (16.7%) |
| 55 to 59 Years | 12 (28.6%) | 0 (0.0%) |
| 60 to 64 Years | 32 (86.5%) | 0 (0.0%) |
| 65 to 74 Years | 14 (25.5%) | 0 (0.0%) |
| 75 Years and over | 7 (17.9%) | 0 (0.0%) |
| Total | 316 (57.4%) | 30 (9.5%) |
Employment Status by Educational Attainment in Arlee
According to labor force statistics for Arlee, 58.8% of individuals (218) out of the total population between 25 and 64 years of age (371) are in the labor force, with 8.7% or 19 of them being unemployed. The group with the highest labor force participation rate are those with the educational attainment of high school diploma, with 94.2% or 65 individuals in the labor force. Within the labor force, individuals with high school diploma education have the highest percentage of unemployment, with 29.2% or 19 of them being unemployed.
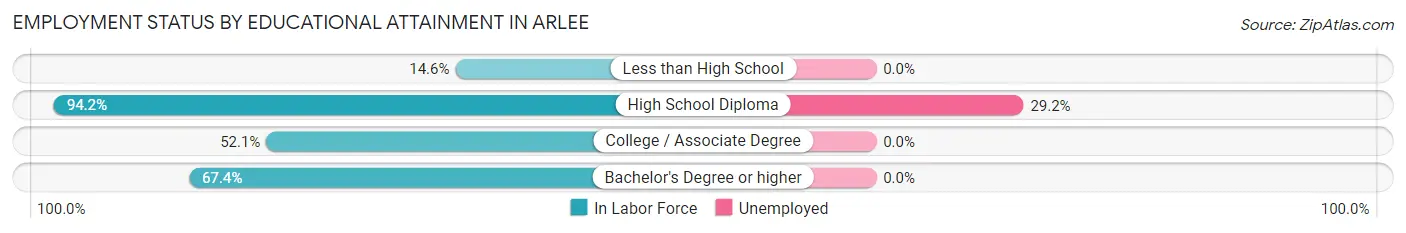
| Educational Attainment | In Labor Force | Unemployed |
| Less than High School | 7 (14.6%) | 0 (0.0%) |
| High School Diploma | 65 (94.2%) | 20 (29.2%) |
| College / Associate Degree | 86 (52.1%) | 0 (0.0%) |
| Bachelor's Degree or higher | 60 (67.4%) | 0 (0.0%) |
| Total | 218 (58.8%) | 32 (8.7%) |
Employment Occupations by Sex in Arlee
Management, Business, Science and Arts Occupations
The most common Management, Business, Science and Arts occupations in Arlee are Management (33 | 11.5%), Business & Financial (26 | 9.1%), Health Diagnosing & Treating (18 | 6.3%), Community & Social Service (17 | 5.9%), and Education Instruction & Library (17 | 5.9%).
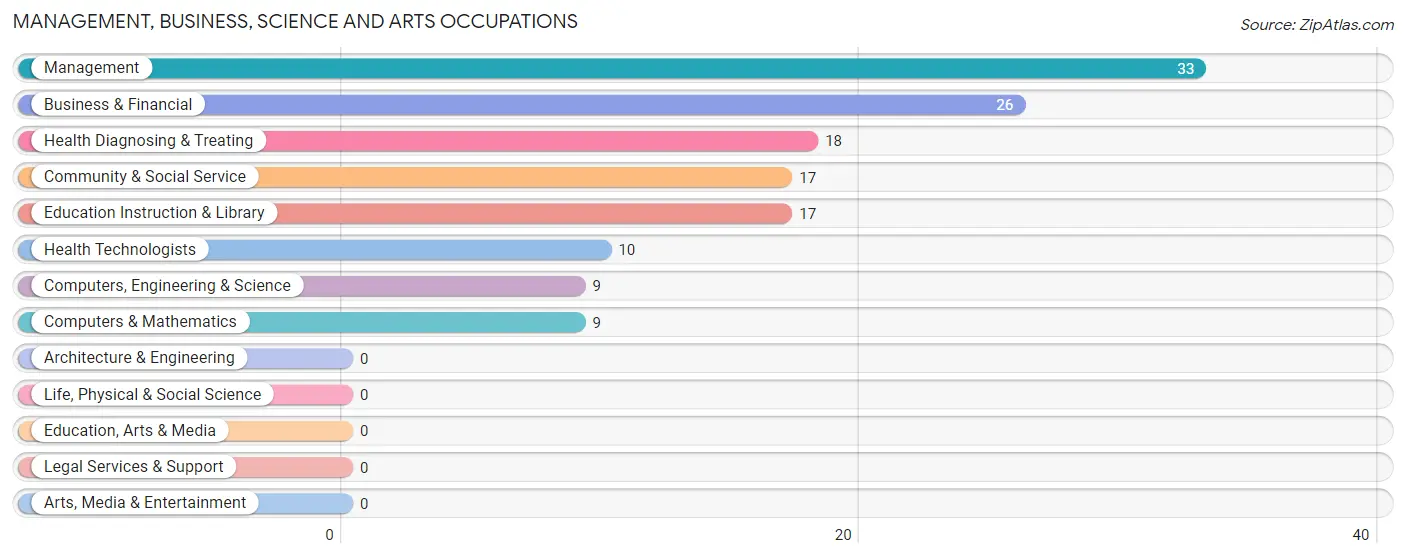
Management, Business, Science and Arts Occupations by Sex
Within the Management, Business, Science and Arts occupations in Arlee, the most male-oriented occupations are Management (100.0%), Computers, Engineering & Science (100.0%), and Computers & Mathematics (100.0%), while the most female-oriented occupations are Business & Financial (100.0%), Health Diagnosing & Treating (72.2%), and Community & Social Service (58.8%).
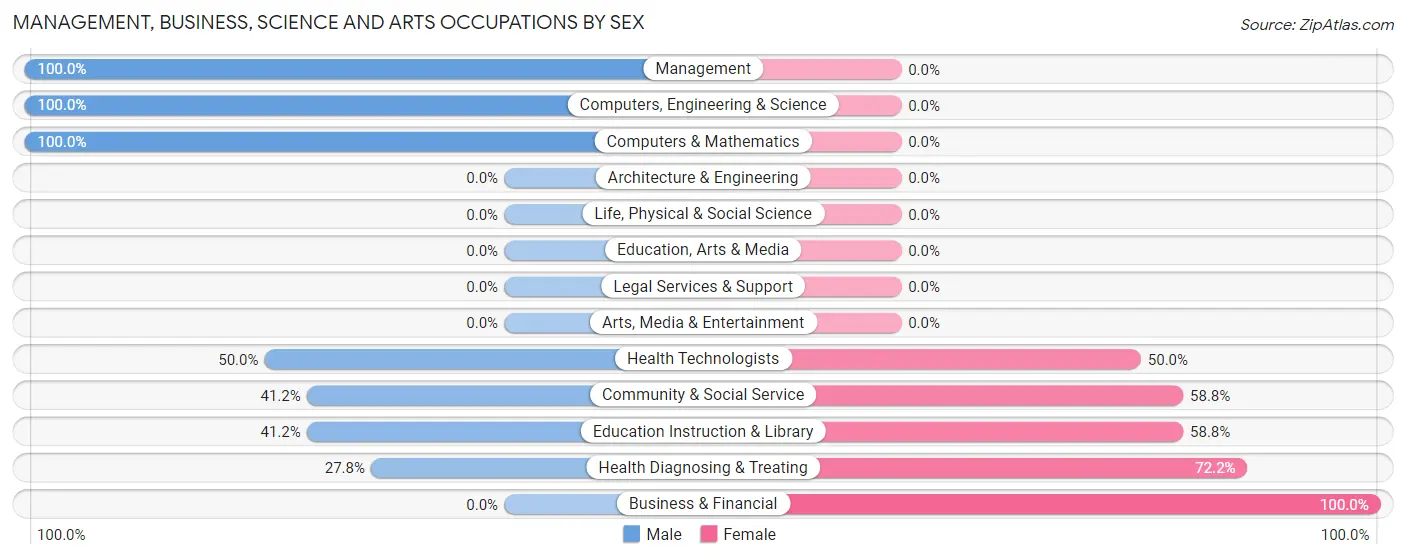
| Occupation | Male | Female |
| Management | 33 (100.0%) | 0 (0.0%) |
| Business & Financial | 0 (0.0%) | 26 (100.0%) |
| Computers, Engineering & Science | 9 (100.0%) | 0 (0.0%) |
| Computers & Mathematics | 9 (100.0%) | 0 (0.0%) |
| Architecture & Engineering | 0 (0.0%) | 0 (0.0%) |
| Life, Physical & Social Science | 0 (0.0%) | 0 (0.0%) |
| Community & Social Service | 7 (41.2%) | 10 (58.8%) |
| Education, Arts & Media | 0 (0.0%) | 0 (0.0%) |
| Legal Services & Support | 0 (0.0%) | 0 (0.0%) |
| Education Instruction & Library | 7 (41.2%) | 10 (58.8%) |
| Arts, Media & Entertainment | 0 (0.0%) | 0 (0.0%) |
| Health Diagnosing & Treating | 5 (27.8%) | 13 (72.2%) |
| Health Technologists | 5 (50.0%) | 5 (50.0%) |
| Total (Category) | 54 (52.4%) | 49 (47.6%) |
| Total (Overall) | 167 (58.4%) | 119 (41.6%) |
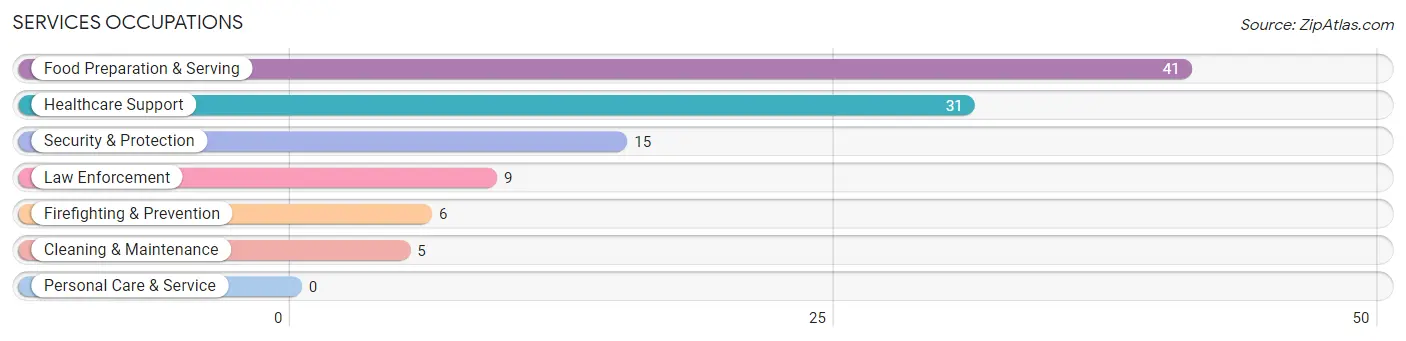
Services Occupations
The most common Services occupations in Arlee are Food Preparation & Serving (41 | 14.3%), Healthcare Support (31 | 10.8%), Security & Protection (15 | 5.2%), Law Enforcement (9 | 3.2%), and Firefighting & Prevention (6 | 2.1%).
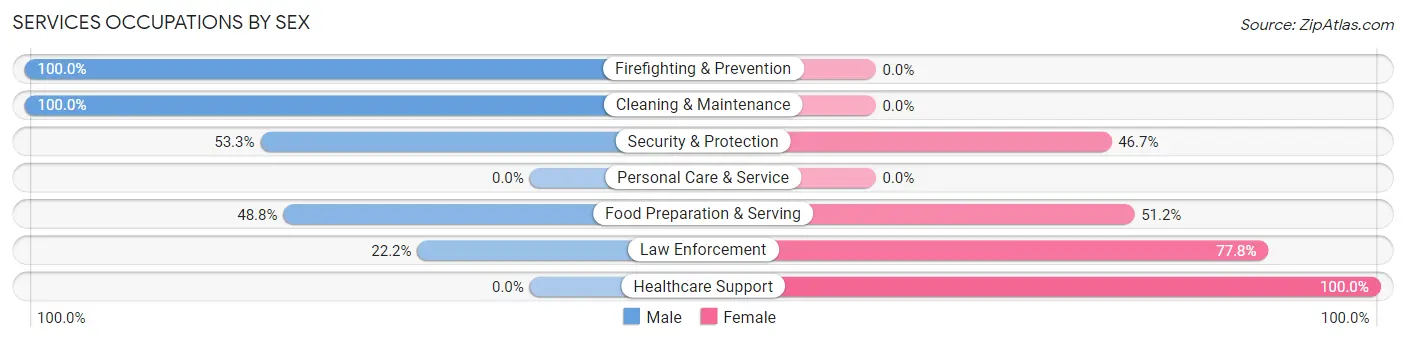
Services Occupations by Sex
Within the Services occupations in Arlee, the most male-oriented occupations are Firefighting & Prevention (100.0%), Cleaning & Maintenance (100.0%), and Security & Protection (53.3%), while the most female-oriented occupations are Healthcare Support (100.0%), Law Enforcement (77.8%), and Food Preparation & Serving (51.2%).
| Occupation | Male | Female |
| Healthcare Support | 0 (0.0%) | 31 (100.0%) |
| Security & Protection | 8 (53.3%) | 7 (46.7%) |
| Firefighting & Prevention | 6 (100.0%) | 0 (0.0%) |
| Law Enforcement | 2 (22.2%) | 7 (77.8%) |
| Food Preparation & Serving | 20 (48.8%) | 21 (51.2%) |
| Cleaning & Maintenance | 5 (100.0%) | 0 (0.0%) |
| Personal Care & Service | 0 (0.0%) | 0 (0.0%) |
| Total (Category) | 33 (35.9%) | 59 (64.1%) |
| Total (Overall) | 167 (58.4%) | 119 (41.6%) |
Sales and Office Occupations
The most common Sales and Office occupations in Arlee are , and Office & Administration (27 | 9.4%).

Sales and Office Occupations by Sex
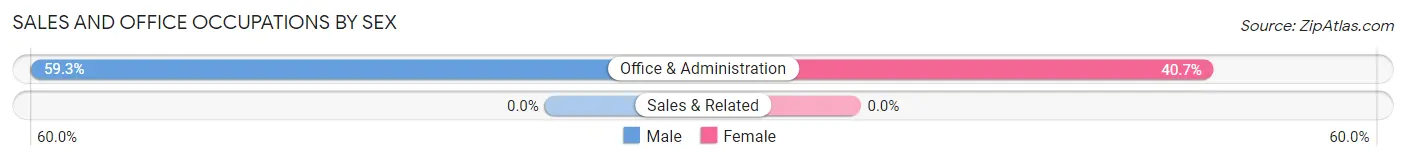
| Occupation | Male | Female |
| Sales & Related | 0 (0.0%) | 0 (0.0%) |
| Office & Administration | 16 (59.3%) | 11 (40.7%) |
| Total (Category) | 16 (59.3%) | 11 (40.7%) |
| Total (Overall) | 167 (58.4%) | 119 (41.6%) |
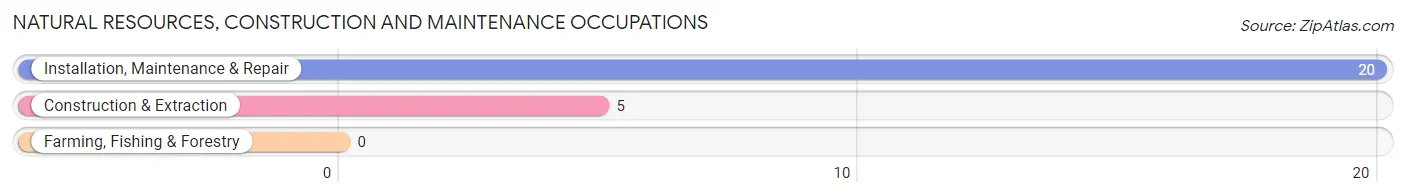
Natural Resources, Construction and Maintenance Occupations
The most common Natural Resources, Construction and Maintenance occupations in Arlee are Installation, Maintenance & Repair (20 | 7.0%), and Construction & Extraction (5 | 1.8%).
Natural Resources, Construction and Maintenance Occupations by Sex

| Occupation | Male | Female |
| Farming, Fishing & Forestry | 0 (0.0%) | 0 (0.0%) |
| Construction & Extraction | 5 (100.0%) | 0 (0.0%) |
| Installation, Maintenance & Repair | 20 (100.0%) | 0 (0.0%) |
| Total (Category) | 25 (100.0%) | 0 (0.0%) |
| Total (Overall) | 167 (58.4%) | 119 (41.6%) |
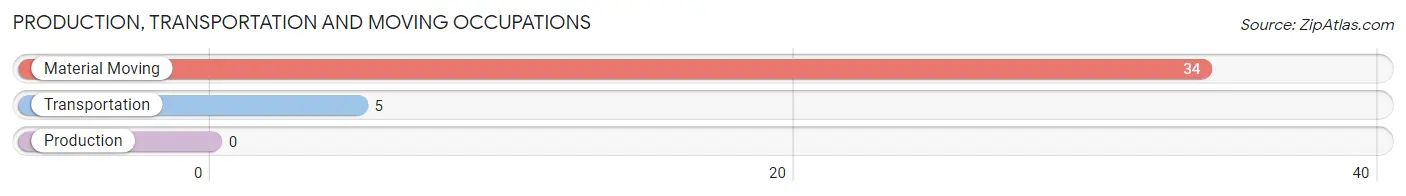
Production, Transportation and Moving Occupations
The most common Production, Transportation and Moving occupations in Arlee are Material Moving (34 | 11.9%), and Transportation (5 | 1.8%).
Production, Transportation and Moving Occupations by Sex
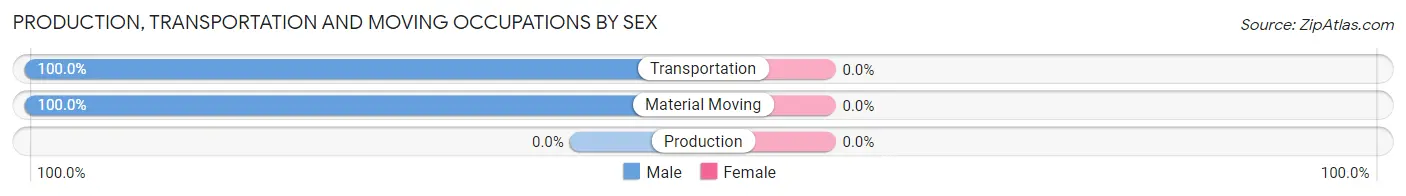
| Occupation | Male | Female |
| Production | 0 (0.0%) | 0 (0.0%) |
| Transportation | 5 (100.0%) | 0 (0.0%) |
| Material Moving | 34 (100.0%) | 0 (0.0%) |
| Total (Category) | 39 (100.0%) | 0 (0.0%) |
| Total (Overall) | 167 (58.4%) | 119 (41.6%) |
Employment Industries by Sex in Arlee
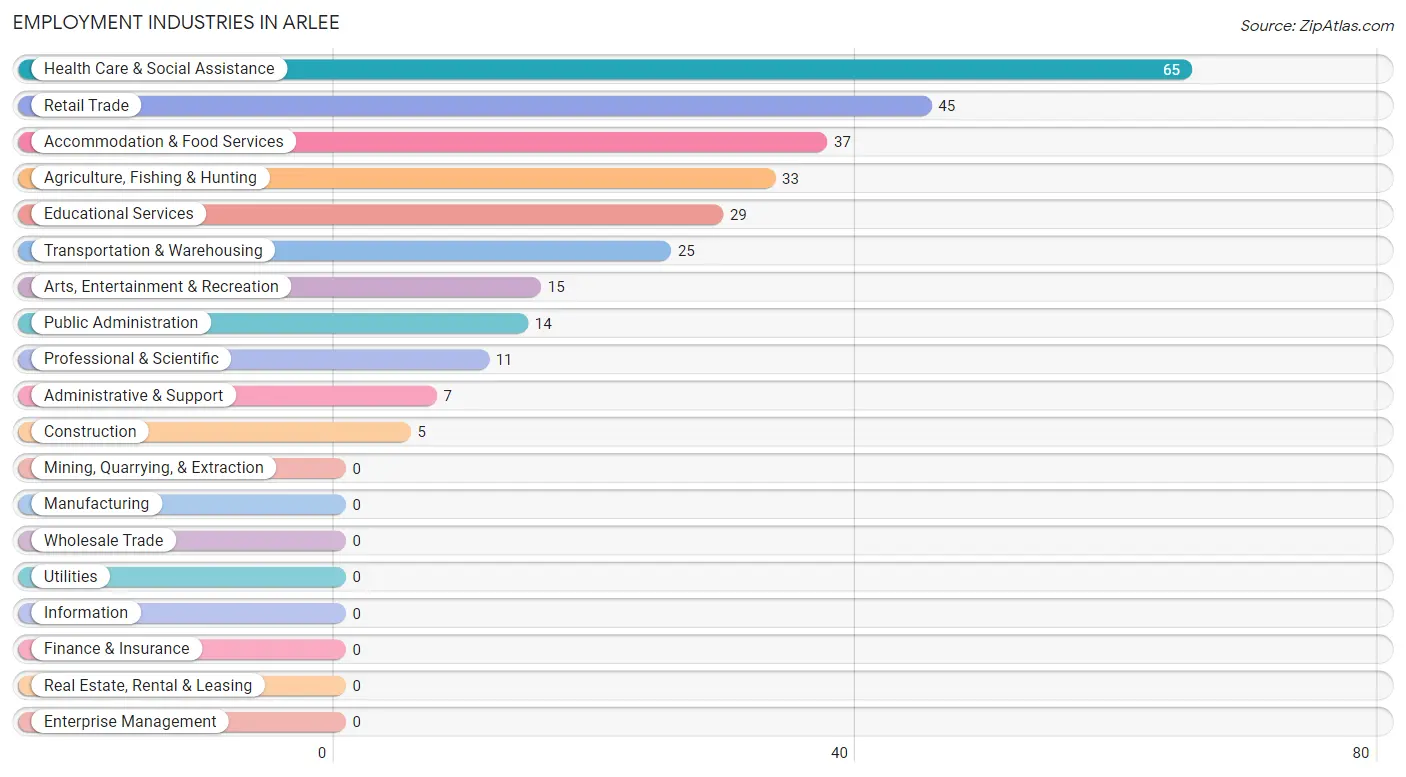
Employment Industries in Arlee
The major employment industries in Arlee include Health Care & Social Assistance (65 | 22.7%), Retail Trade (45 | 15.7%), Accommodation & Food Services (37 | 12.9%), Agriculture, Fishing & Hunting (33 | 11.5%), and Educational Services (29 | 10.1%).
Employment Industries by Sex in Arlee
The Arlee industries that see more men than women are Construction (100.0%), Retail Trade (100.0%), and Administrative & Support (100.0%), whereas the industries that tend to have a higher number of women are Professional & Scientific (100.0%), Arts, Entertainment & Recreation (100.0%), and Health Care & Social Assistance (67.7%).
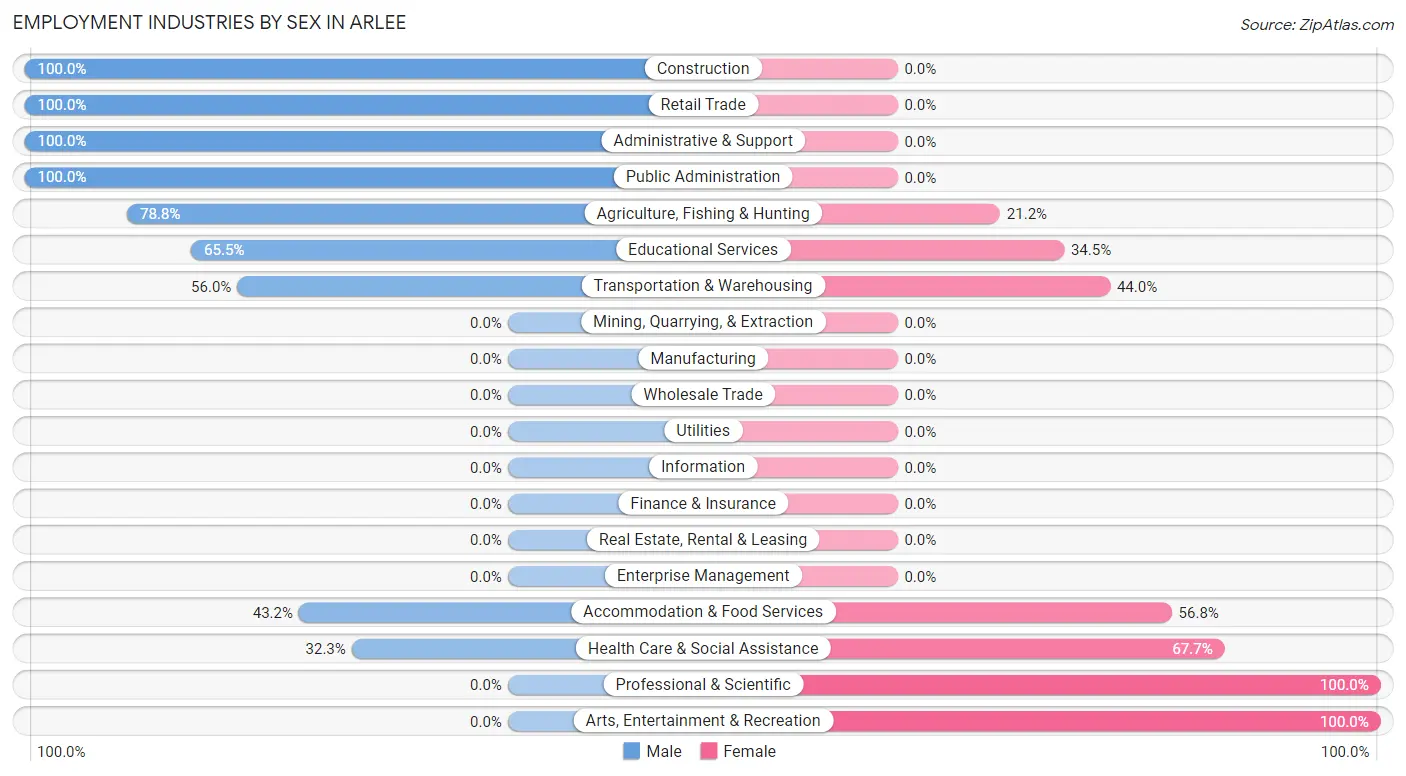
| Industry | Male | Female |
| Agriculture, Fishing & Hunting | 26 (78.8%) | 7 (21.2%) |
| Mining, Quarrying, & Extraction | 0 (0.0%) | 0 (0.0%) |
| Construction | 5 (100.0%) | 0 (0.0%) |
| Manufacturing | 0 (0.0%) | 0 (0.0%) |
| Wholesale Trade | 0 (0.0%) | 0 (0.0%) |
| Retail Trade | 45 (100.0%) | 0 (0.0%) |
| Transportation & Warehousing | 14 (56.0%) | 11 (44.0%) |
| Utilities | 0 (0.0%) | 0 (0.0%) |
| Information | 0 (0.0%) | 0 (0.0%) |
| Finance & Insurance | 0 (0.0%) | 0 (0.0%) |
| Real Estate, Rental & Leasing | 0 (0.0%) | 0 (0.0%) |
| Professional & Scientific | 0 (0.0%) | 11 (100.0%) |
| Enterprise Management | 0 (0.0%) | 0 (0.0%) |
| Administrative & Support | 7 (100.0%) | 0 (0.0%) |
| Educational Services | 19 (65.5%) | 10 (34.5%) |
| Health Care & Social Assistance | 21 (32.3%) | 44 (67.7%) |
| Arts, Entertainment & Recreation | 0 (0.0%) | 15 (100.0%) |
| Accommodation & Food Services | 16 (43.2%) | 21 (56.8%) |
| Public Administration | 14 (100.0%) | 0 (0.0%) |
| Total | 167 (58.4%) | 119 (41.6%) |
Education in Arlee
School Enrollment in Arlee
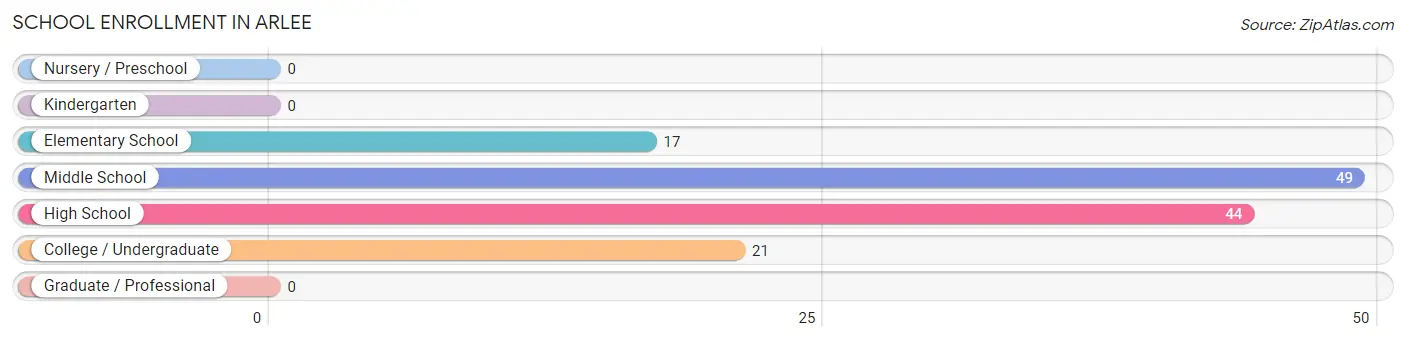
The most common levels of schooling among the 131 students in Arlee are middle school (49 | 37.4%), high school (44 | 33.6%), and college / undergraduate (21 | 16.0%).
| School Level | # Students | % Students |
| Nursery / Preschool | 0 | 0.0% |
| Kindergarten | 0 | 0.0% |
| Elementary School | 17 | 13.0% |
| Middle School | 49 | 37.4% |
| High School | 44 | 33.6% |
| College / Undergraduate | 21 | 16.0% |
| Graduate / Professional | 0 | 0.0% |
| Total | 131 | 100.0% |
School Enrollment by Age by Funding Source in Arlee
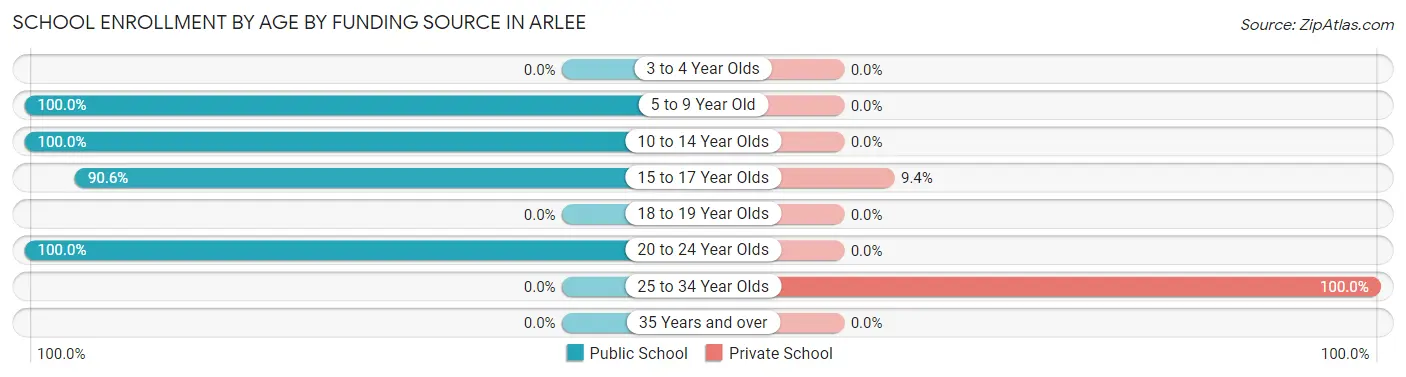
Out of a total of 131 students who are enrolled in schools in Arlee, 9 (6.9%) attend a private institution, while the remaining 122 (93.1%) are enrolled in public schools. The age group of 25 to 34 year olds has the highest likelihood of being enrolled in private schools, with 6 (100.0% in the age bracket) enrolled. Conversely, the age group of 5 to 9 year old has the lowest likelihood of being enrolled in a private school, with 17 (100.0% in the age bracket) attending a public institution.
| Age Bracket | Public School | Private School |
| 3 to 4 Year Olds | 0 (0.0%) | 0 (0.0%) |
| 5 to 9 Year Old | 17 (100.0%) | 0 (0.0%) |
| 10 to 14 Year Olds | 61 (100.0%) | 0 (0.0%) |
| 15 to 17 Year Olds | 29 (90.6%) | 3 (9.4%) |
| 18 to 19 Year Olds | 0 (0.0%) | 0 (0.0%) |
| 20 to 24 Year Olds | 15 (100.0%) | 0 (0.0%) |
| 25 to 34 Year Olds | 0 (0.0%) | 6 (100.0%) |
| 35 Years and over | 0 (0.0%) | 0 (0.0%) |
| Total | 122 (93.1%) | 9 (6.9%) |
Educational Attainment by Field of Study in Arlee
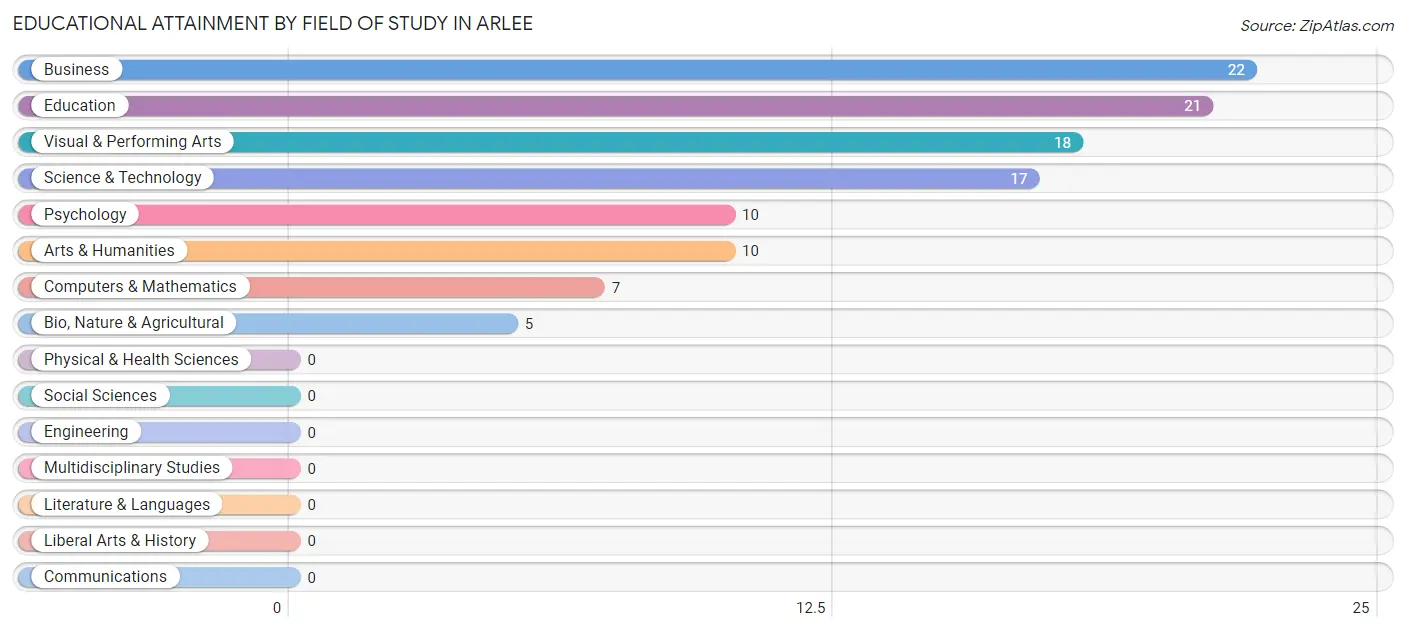
Business (22 | 20.0%), education (21 | 19.1%), visual & performing arts (18 | 16.4%), science & technology (17 | 15.4%), and psychology (10 | 9.1%) are the most common fields of study among 110 individuals in Arlee who have obtained a bachelor's degree or higher.
| Field of Study | # Graduates | % Graduates |
| Computers & Mathematics | 7 | 6.4% |
| Bio, Nature & Agricultural | 5 | 4.5% |
| Physical & Health Sciences | 0 | 0.0% |
| Psychology | 10 | 9.1% |
| Social Sciences | 0 | 0.0% |
| Engineering | 0 | 0.0% |
| Multidisciplinary Studies | 0 | 0.0% |
| Science & Technology | 17 | 15.4% |
| Business | 22 | 20.0% |
| Education | 21 | 19.1% |
| Literature & Languages | 0 | 0.0% |
| Liberal Arts & History | 0 | 0.0% |
| Visual & Performing Arts | 18 | 16.4% |
| Communications | 0 | 0.0% |
| Arts & Humanities | 10 | 9.1% |
| Total | 110 | 100.0% |
Transportation & Commute in Arlee
Vehicle Availability by Sex in Arlee
The most prevalent vehicle ownership categories in Arlee are males with 2 vehicles (63, accounting for 37.7%) and females with 2 vehicles (46, making up 58.3%).
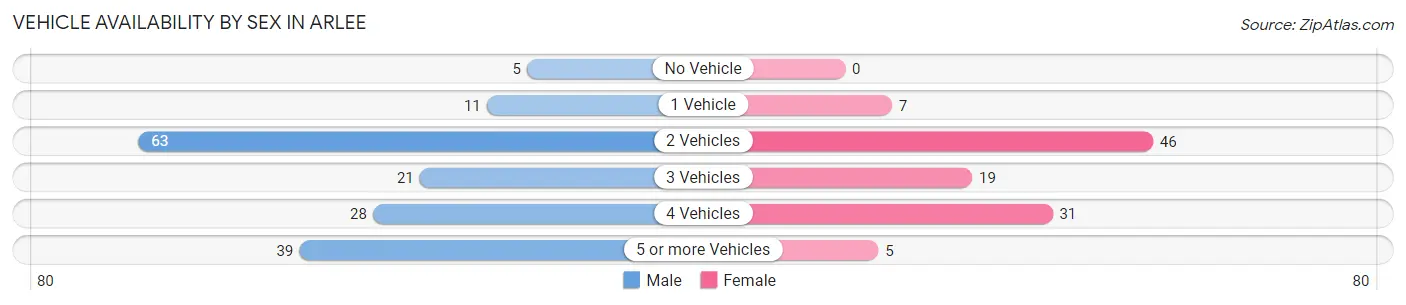
| Vehicles Available | Male | Female |
| No Vehicle | 5 (3.0%) | 0 (0.0%) |
| 1 Vehicle | 11 (6.6%) | 7 (6.5%) |
| 2 Vehicles | 63 (37.7%) | 46 (42.6%) |
| 3 Vehicles | 21 (12.6%) | 19 (17.6%) |
| 4 Vehicles | 28 (16.8%) | 31 (28.7%) |
| 5 or more Vehicles | 39 (23.4%) | 5 (4.6%) |
| Total | 167 (100.0%) | 108 (100.0%) |
Commute Time in Arlee
The most frequently occuring commute durations in Arlee are less than 5 minutes (63 commuters, 31.5%), 30 to 34 minutes (31 commuters, 15.5%), and 5 to 9 minutes (27 commuters, 13.5%).
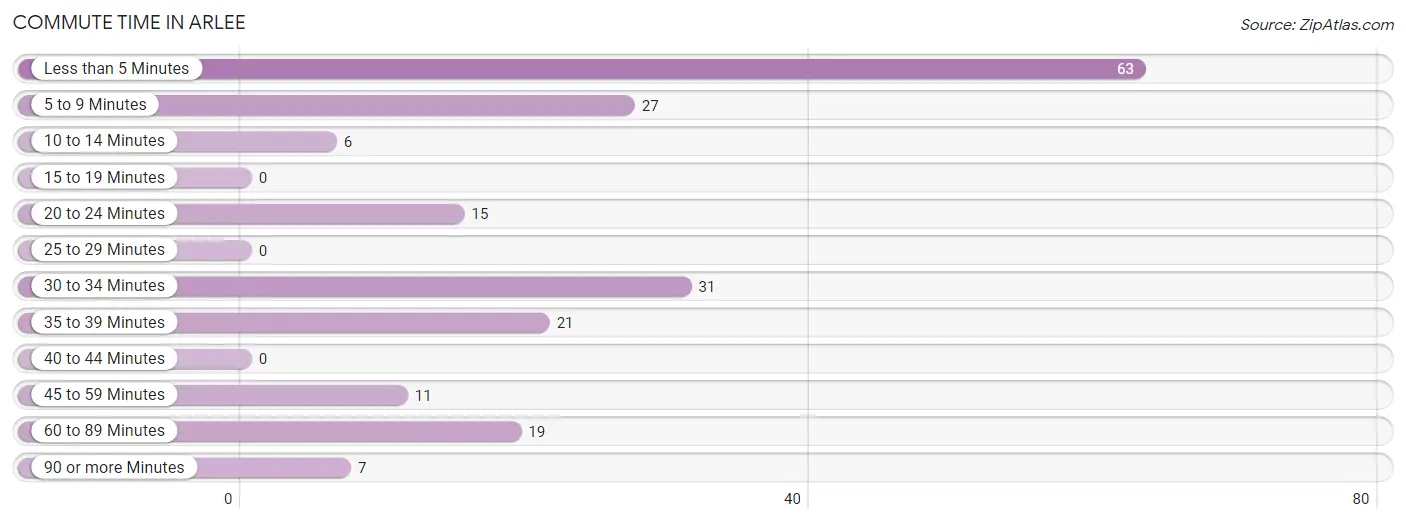
| Commute Time | # Commuters | % Commuters |
| Less than 5 Minutes | 63 | 31.5% |
| 5 to 9 Minutes | 27 | 13.5% |
| 10 to 14 Minutes | 6 | 3.0% |
| 15 to 19 Minutes | 0 | 0.0% |
| 20 to 24 Minutes | 15 | 7.5% |
| 25 to 29 Minutes | 0 | 0.0% |
| 30 to 34 Minutes | 31 | 15.5% |
| 35 to 39 Minutes | 21 | 10.5% |
| 40 to 44 Minutes | 0 | 0.0% |
| 45 to 59 Minutes | 11 | 5.5% |
| 60 to 89 Minutes | 19 | 9.5% |
| 90 or more Minutes | 7 | 3.5% |
Commute Time by Sex in Arlee
The most common commute times in Arlee are less than 5 minutes (32 commuters, 32.7%) for males and less than 5 minutes (31 commuters, 30.4%) for females.
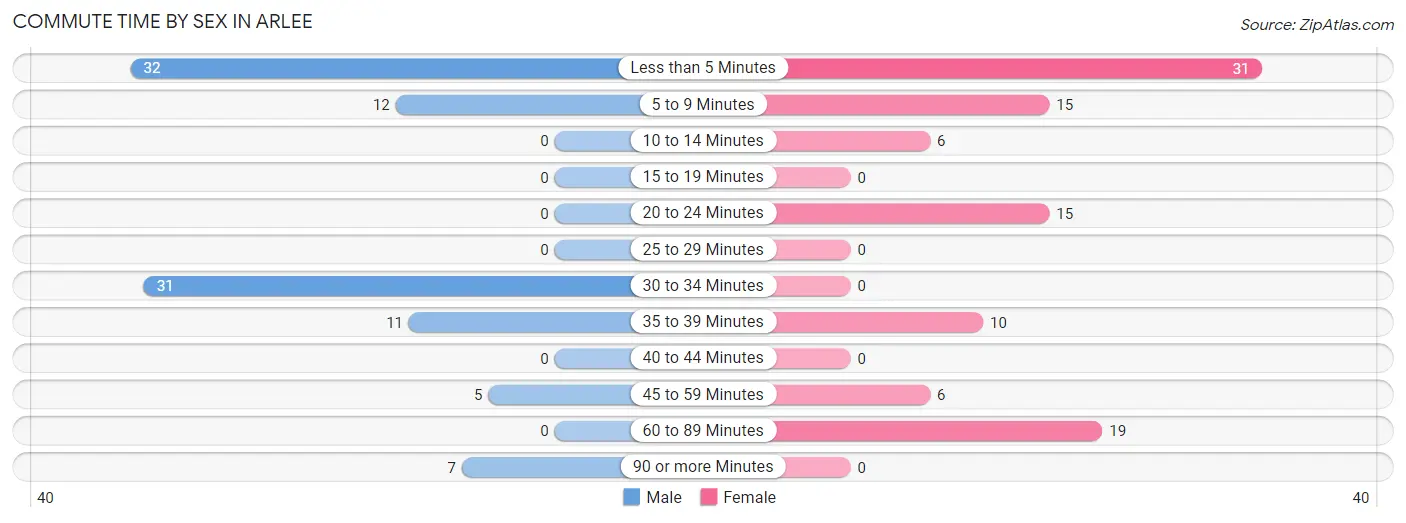
| Commute Time | Male | Female |
| Less than 5 Minutes | 32 (32.7%) | 31 (30.4%) |
| 5 to 9 Minutes | 12 (12.2%) | 15 (14.7%) |
| 10 to 14 Minutes | 0 (0.0%) | 6 (5.9%) |
| 15 to 19 Minutes | 0 (0.0%) | 0 (0.0%) |
| 20 to 24 Minutes | 0 (0.0%) | 15 (14.7%) |
| 25 to 29 Minutes | 0 (0.0%) | 0 (0.0%) |
| 30 to 34 Minutes | 31 (31.6%) | 0 (0.0%) |
| 35 to 39 Minutes | 11 (11.2%) | 10 (9.8%) |
| 40 to 44 Minutes | 0 (0.0%) | 0 (0.0%) |
| 45 to 59 Minutes | 5 (5.1%) | 6 (5.9%) |
| 60 to 89 Minutes | 0 (0.0%) | 19 (18.6%) |
| 90 or more Minutes | 7 (7.1%) | 0 (0.0%) |
Time of Departure to Work by Sex in Arlee
The most frequent times of departure to work in Arlee are 12:00 AM to 4:59 AM (37, 37.8%) for males and 7:30 AM to 7:59 AM (39, 38.2%) for females.
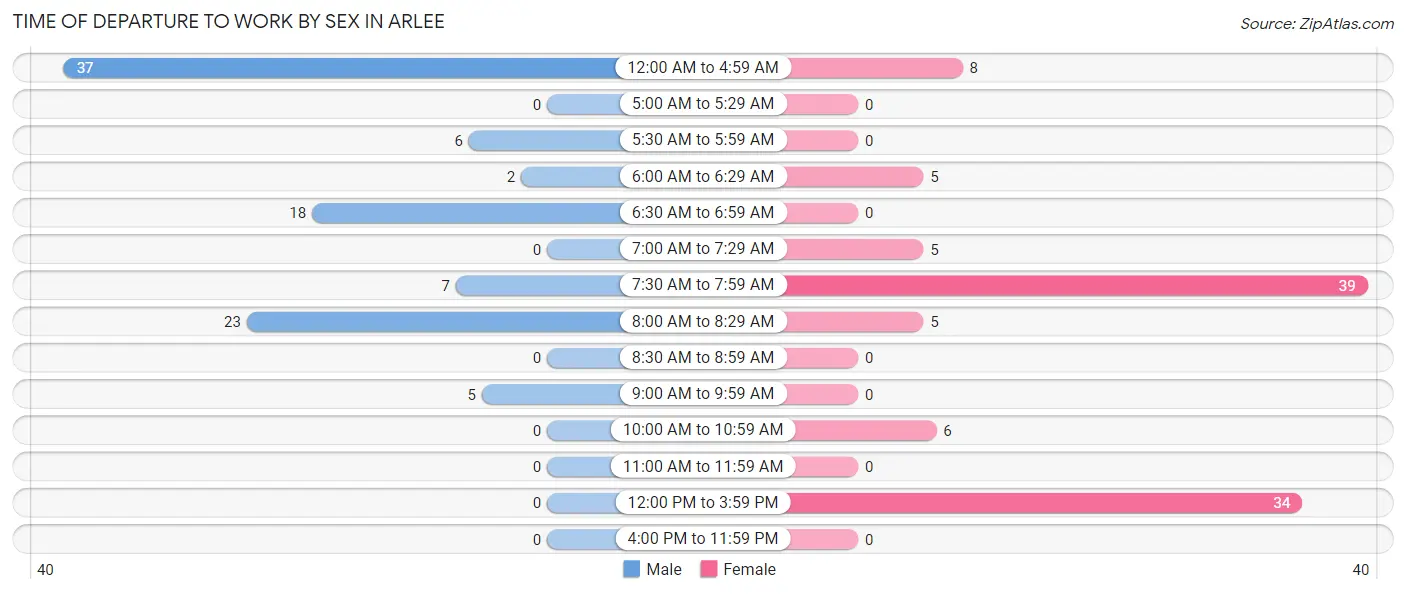
| Time of Departure | Male | Female |
| 12:00 AM to 4:59 AM | 37 (37.8%) | 8 (7.8%) |
| 5:00 AM to 5:29 AM | 0 (0.0%) | 0 (0.0%) |
| 5:30 AM to 5:59 AM | 6 (6.1%) | 0 (0.0%) |
| 6:00 AM to 6:29 AM | 2 (2.0%) | 5 (4.9%) |
| 6:30 AM to 6:59 AM | 18 (18.4%) | 0 (0.0%) |
| 7:00 AM to 7:29 AM | 0 (0.0%) | 5 (4.9%) |
| 7:30 AM to 7:59 AM | 7 (7.1%) | 39 (38.2%) |
| 8:00 AM to 8:29 AM | 23 (23.5%) | 5 (4.9%) |
| 8:30 AM to 8:59 AM | 0 (0.0%) | 0 (0.0%) |
| 9:00 AM to 9:59 AM | 5 (5.1%) | 0 (0.0%) |
| 10:00 AM to 10:59 AM | 0 (0.0%) | 6 (5.9%) |
| 11:00 AM to 11:59 AM | 0 (0.0%) | 0 (0.0%) |
| 12:00 PM to 3:59 PM | 0 (0.0%) | 34 (33.3%) |
| 4:00 PM to 11:59 PM | 0 (0.0%) | 0 (0.0%) |
| Total | 98 (100.0%) | 102 (100.0%) |
Housing Occupancy in Arlee
Occupancy by Ownership in Arlee
Of the total 253 dwellings in Arlee, owner-occupied units account for 144 (56.9%), while renter-occupied units make up 109 (43.1%).
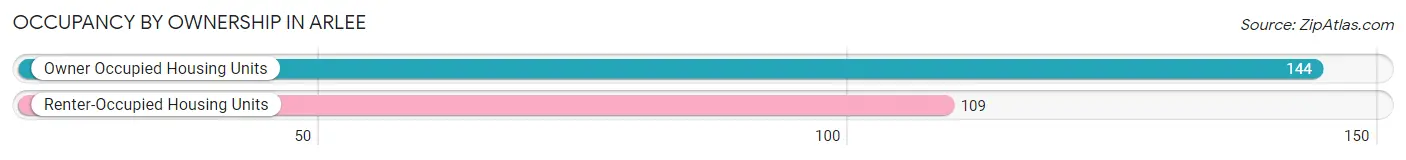
| Occupancy | # Housing Units | % Housing Units |
| Owner Occupied Housing Units | 144 | 56.9% |
| Renter-Occupied Housing Units | 109 | 43.1% |
| Total Occupied Housing Units | 253 | 100.0% |
Occupancy by Household Size in Arlee
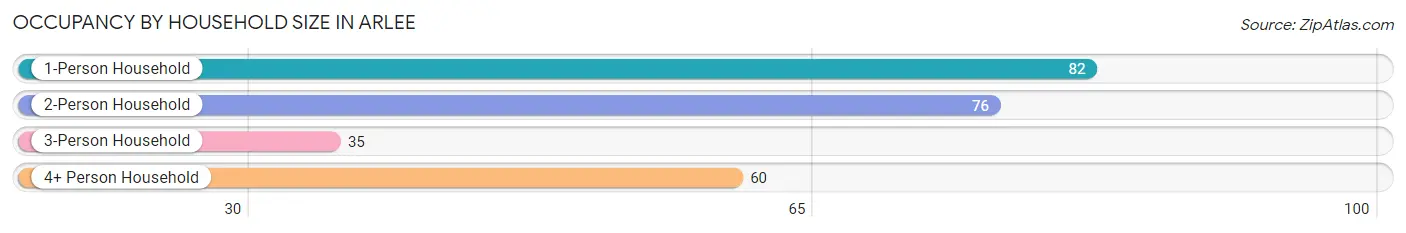
| Household Size | # Housing Units | % Housing Units |
| 1-Person Household | 82 | 32.4% |
| 2-Person Household | 76 | 30.0% |
| 3-Person Household | 35 | 13.8% |
| 4+ Person Household | 60 | 23.7% |
| Total Housing Units | 253 | 100.0% |
Occupancy by Ownership by Household Size in Arlee
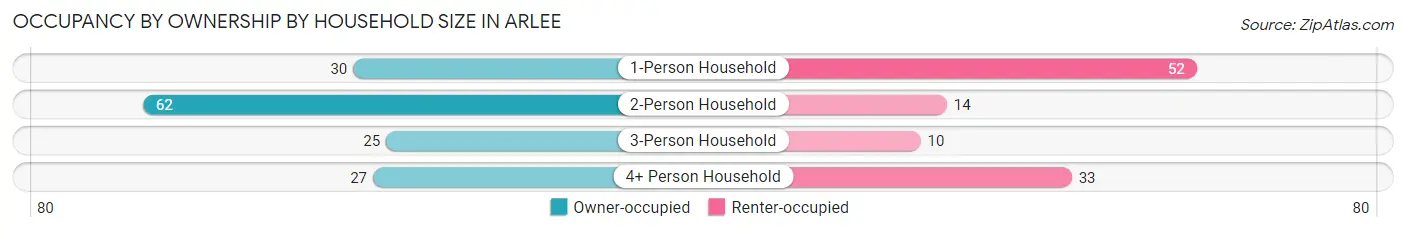
| Household Size | Owner-occupied | Renter-occupied |
| 1-Person Household | 30 (36.6%) | 52 (63.4%) |
| 2-Person Household | 62 (81.6%) | 14 (18.4%) |
| 3-Person Household | 25 (71.4%) | 10 (28.6%) |
| 4+ Person Household | 27 (45.0%) | 33 (55.0%) |
| Total Housing Units | 144 (56.9%) | 109 (43.1%) |
Occupancy by Educational Attainment in Arlee
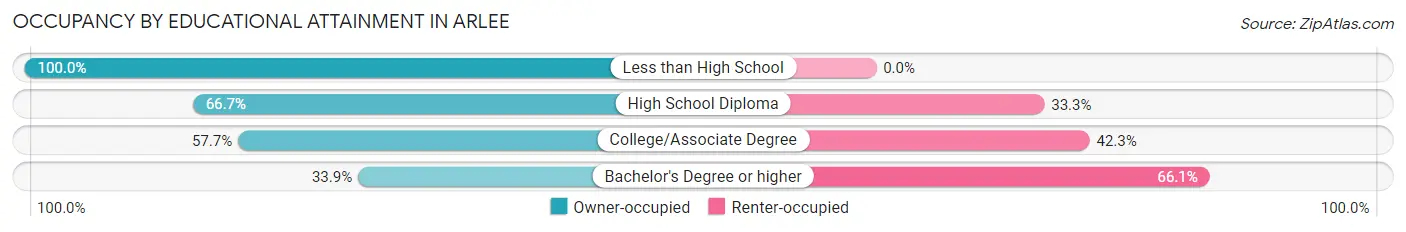
| Household Size | Owner-occupied | Renter-occupied |
| Less than High School | 12 (100.0%) | 0 (0.0%) |
| High School Diploma | 52 (66.7%) | 26 (33.3%) |
| College/Associate Degree | 60 (57.7%) | 44 (42.3%) |
| Bachelor's Degree or higher | 20 (33.9%) | 39 (66.1%) |
Occupancy by Age of Householder in Arlee
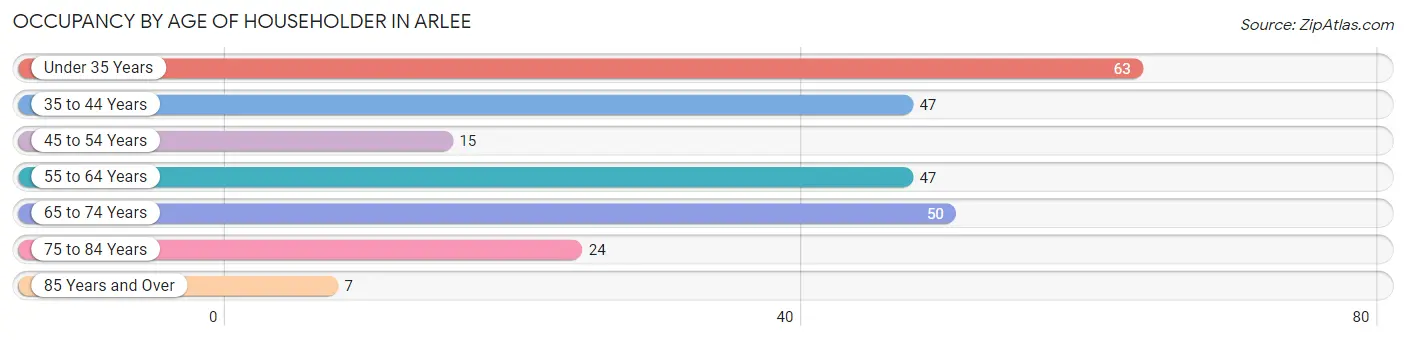
| Age Bracket | # Households | % Households |
| Under 35 Years | 63 | 24.9% |
| 35 to 44 Years | 47 | 18.6% |
| 45 to 54 Years | 15 | 5.9% |
| 55 to 64 Years | 47 | 18.6% |
| 65 to 74 Years | 50 | 19.8% |
| 75 to 84 Years | 24 | 9.5% |
| 85 Years and Over | 7 | 2.8% |
| Total | 253 | 100.0% |
Housing Finances in Arlee
Median Income by Occupancy in Arlee
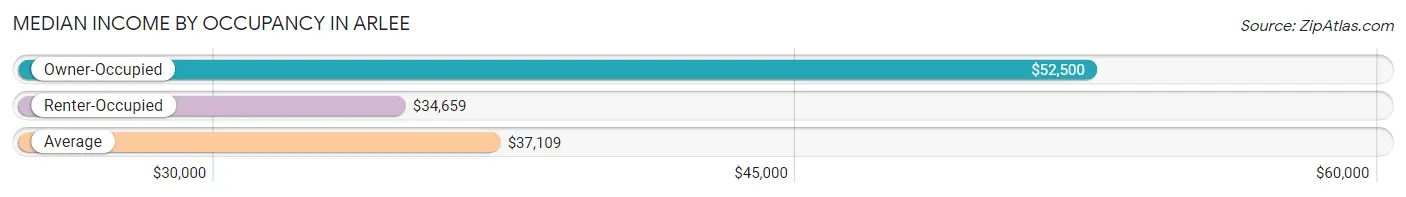
| Occupancy Type | # Households | Median Income |
| Owner-Occupied | 144 (56.9%) | $52,500 |
| Renter-Occupied | 109 (43.1%) | $34,659 |
| Average | 253 (100.0%) | $37,109 |
Occupancy by Householder Income Bracket in Arlee
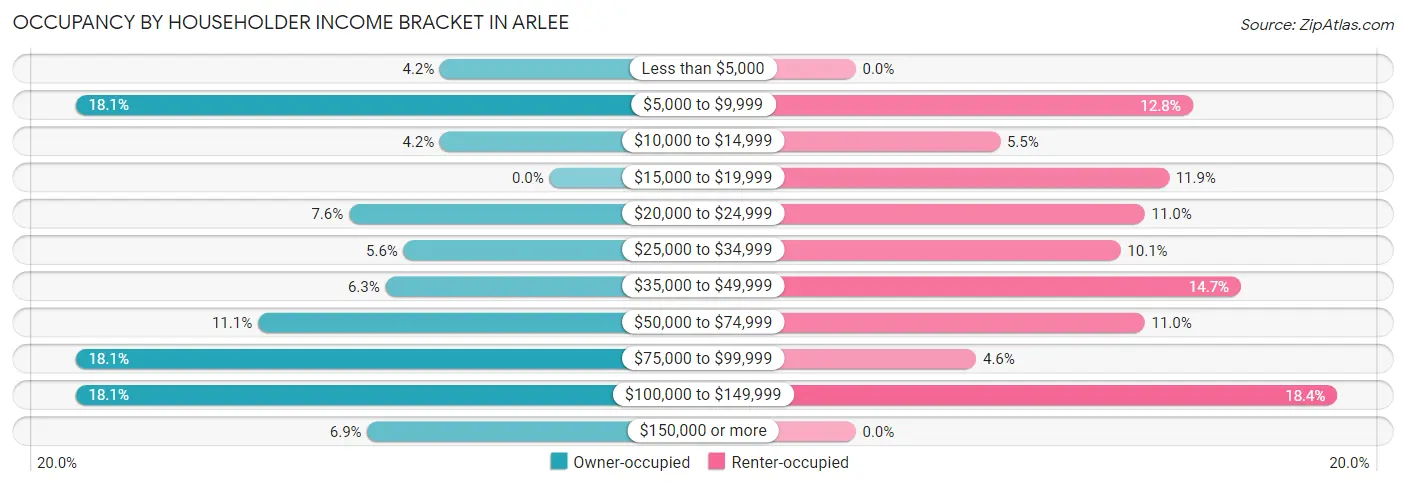
| Income Bracket | Owner-occupied | Renter-occupied |
| Less than $5,000 | 6 (4.2%) | 0 (0.0%) |
| $5,000 to $9,999 | 26 (18.1%) | 14 (12.8%) |
| $10,000 to $14,999 | 6 (4.2%) | 6 (5.5%) |
| $15,000 to $19,999 | 0 (0.0%) | 13 (11.9%) |
| $20,000 to $24,999 | 11 (7.6%) | 12 (11.0%) |
| $25,000 to $34,999 | 8 (5.6%) | 11 (10.1%) |
| $35,000 to $49,999 | 9 (6.2%) | 16 (14.7%) |
| $50,000 to $74,999 | 16 (11.1%) | 12 (11.0%) |
| $75,000 to $99,999 | 26 (18.1%) | 5 (4.6%) |
| $100,000 to $149,999 | 26 (18.1%) | 20 (18.3%) |
| $150,000 or more | 10 (6.9%) | 0 (0.0%) |
| Total | 144 (100.0%) | 109 (100.0%) |
Monthly Housing Cost Tiers in Arlee
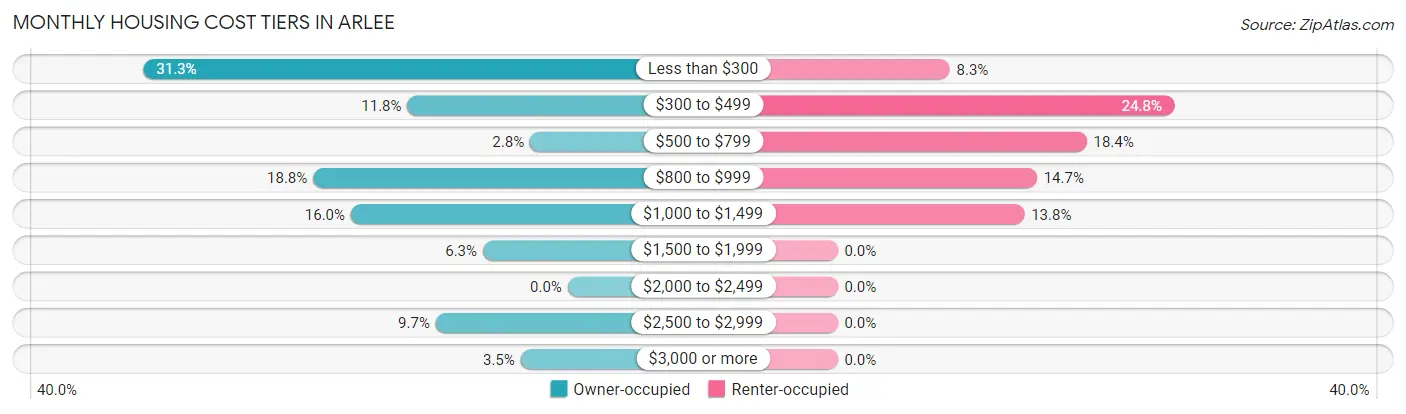
| Monthly Cost | Owner-occupied | Renter-occupied |
| Less than $300 | 45 (31.2%) | 9 (8.3%) |
| $300 to $499 | 17 (11.8%) | 27 (24.8%) |
| $500 to $799 | 4 (2.8%) | 20 (18.3%) |
| $800 to $999 | 27 (18.8%) | 16 (14.7%) |
| $1,000 to $1,499 | 23 (16.0%) | 15 (13.8%) |
| $1,500 to $1,999 | 9 (6.2%) | 0 (0.0%) |
| $2,000 to $2,499 | 0 (0.0%) | 0 (0.0%) |
| $2,500 to $2,999 | 14 (9.7%) | 0 (0.0%) |
| $3,000 or more | 5 (3.5%) | 0 (0.0%) |
| Total | 144 (100.0%) | 109 (100.0%) |
Physical Housing Characteristics in Arlee
Housing Structures in Arlee
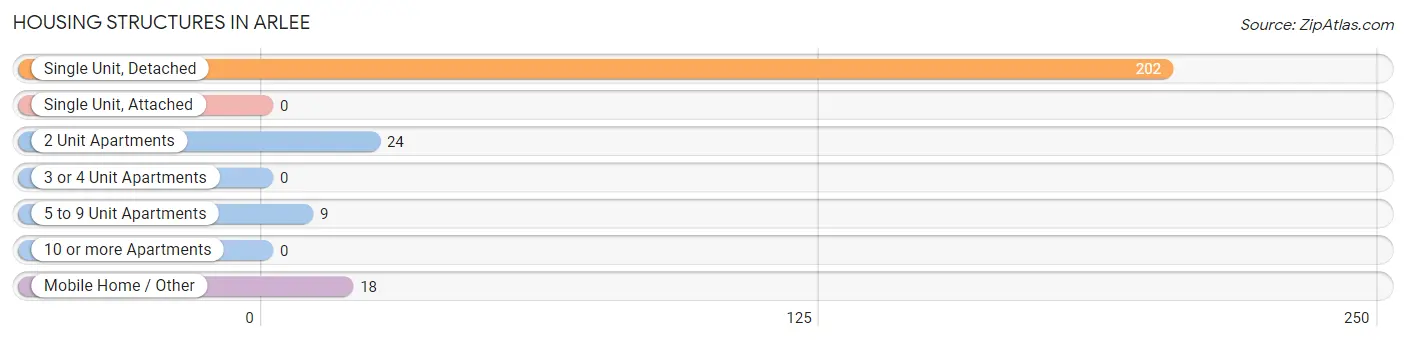
| Structure Type | # Housing Units | % Housing Units |
| Single Unit, Detached | 202 | 79.8% |
| Single Unit, Attached | 0 | 0.0% |
| 2 Unit Apartments | 24 | 9.5% |
| 3 or 4 Unit Apartments | 0 | 0.0% |
| 5 to 9 Unit Apartments | 9 | 3.6% |
| 10 or more Apartments | 0 | 0.0% |
| Mobile Home / Other | 18 | 7.1% |
| Total | 253 | 100.0% |
Housing Structures by Occupancy in Arlee
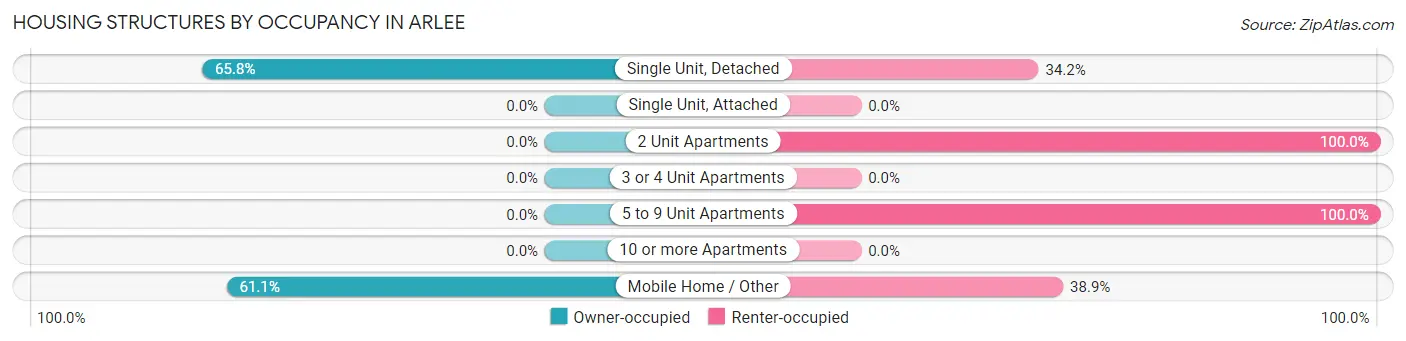
| Structure Type | Owner-occupied | Renter-occupied |
| Single Unit, Detached | 133 (65.8%) | 69 (34.2%) |
| Single Unit, Attached | 0 (0.0%) | 0 (0.0%) |
| 2 Unit Apartments | 0 (0.0%) | 24 (100.0%) |
| 3 or 4 Unit Apartments | 0 (0.0%) | 0 (0.0%) |
| 5 to 9 Unit Apartments | 0 (0.0%) | 9 (100.0%) |
| 10 or more Apartments | 0 (0.0%) | 0 (0.0%) |
| Mobile Home / Other | 11 (61.1%) | 7 (38.9%) |
| Total | 144 (56.9%) | 109 (43.1%) |
Housing Structures by Number of Rooms in Arlee
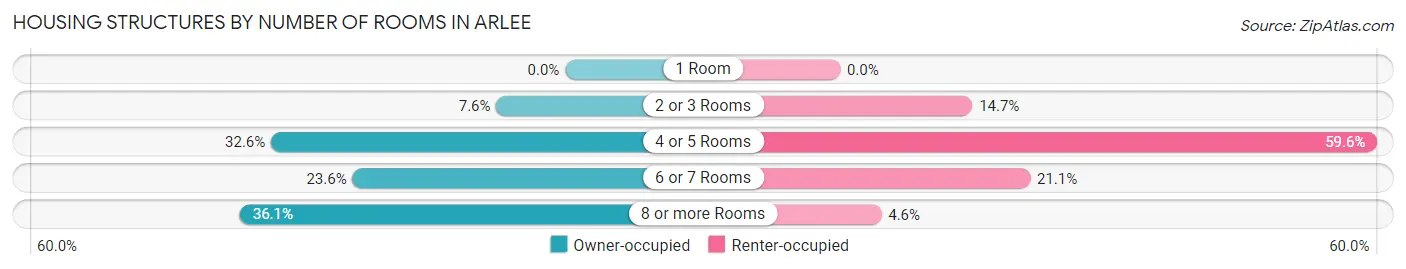
| Number of Rooms | Owner-occupied | Renter-occupied |
| 1 Room | 0 (0.0%) | 0 (0.0%) |
| 2 or 3 Rooms | 11 (7.6%) | 16 (14.7%) |
| 4 or 5 Rooms | 47 (32.6%) | 65 (59.6%) |
| 6 or 7 Rooms | 34 (23.6%) | 23 (21.1%) |
| 8 or more Rooms | 52 (36.1%) | 5 (4.6%) |
| Total | 144 (100.0%) | 109 (100.0%) |
Housing Structure by Heating Type in Arlee
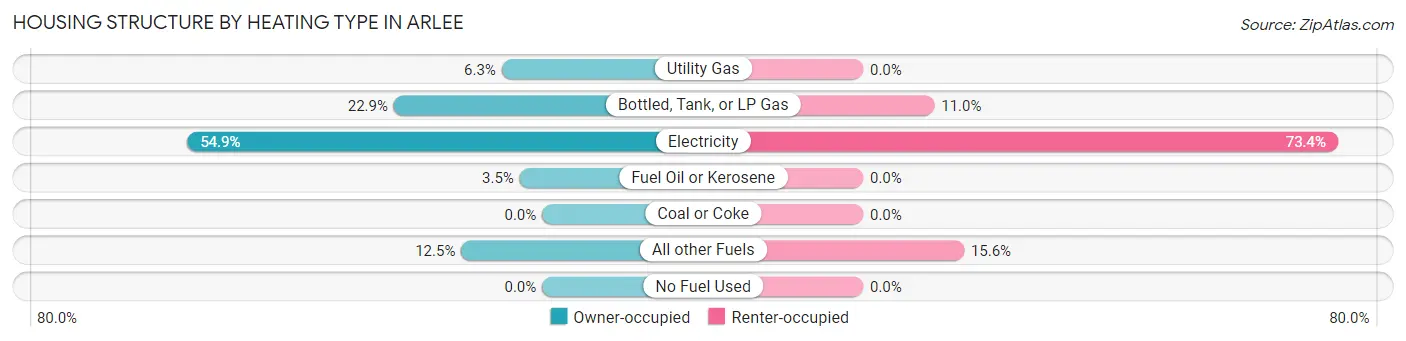
| Heating Type | Owner-occupied | Renter-occupied |
| Utility Gas | 9 (6.2%) | 0 (0.0%) |
| Bottled, Tank, or LP Gas | 33 (22.9%) | 12 (11.0%) |
| Electricity | 79 (54.9%) | 80 (73.4%) |
| Fuel Oil or Kerosene | 5 (3.5%) | 0 (0.0%) |
| Coal or Coke | 0 (0.0%) | 0 (0.0%) |
| All other Fuels | 18 (12.5%) | 17 (15.6%) |
| No Fuel Used | 0 (0.0%) | 0 (0.0%) |
| Total | 144 (100.0%) | 109 (100.0%) |
Household Vehicle Usage in Arlee
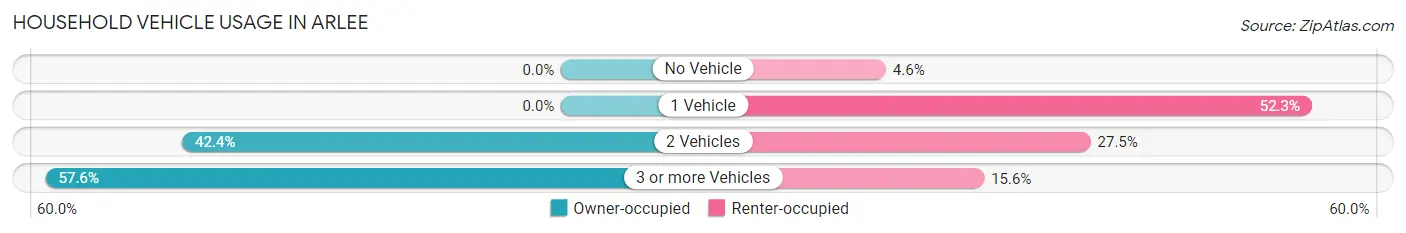
| Vehicles per Household | Owner-occupied | Renter-occupied |
| No Vehicle | 0 (0.0%) | 5 (4.6%) |
| 1 Vehicle | 0 (0.0%) | 57 (52.3%) |
| 2 Vehicles | 61 (42.4%) | 30 (27.5%) |
| 3 or more Vehicles | 83 (57.6%) | 17 (15.6%) |
| Total | 144 (100.0%) | 109 (100.0%) |
Real Estate & Mortgages in Arlee
Real Estate and Mortgage Overview in Arlee
| Characteristic | Without Mortgage | With Mortgage |
| Housing Units | 91 | 53 |
| Median Property Value | $176,100 | $265,000 |
| Median Household Income | - | - |
| Monthly Housing Costs | $340 | $5 |
| Real Estate Taxes | - | - |
Property Value by Mortgage Status in Arlee
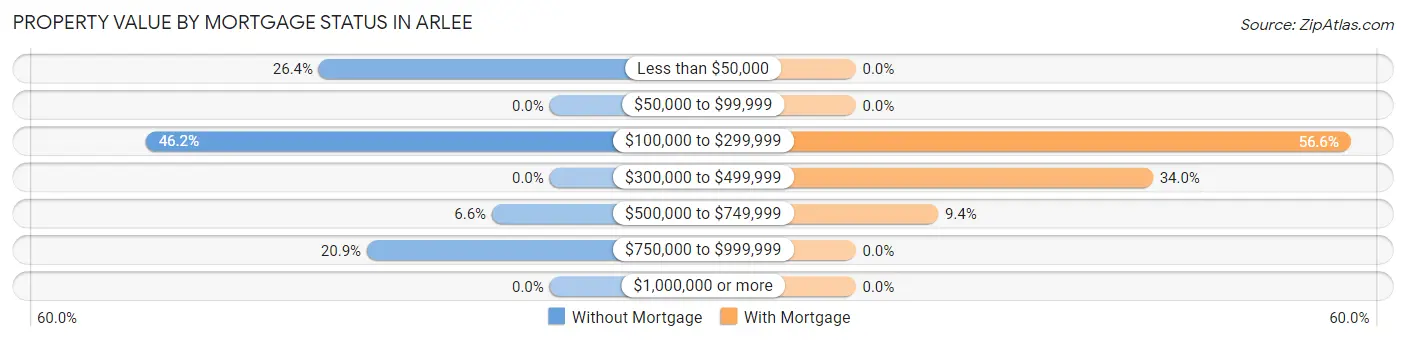
| Property Value | Without Mortgage | With Mortgage |
| Less than $50,000 | 24 (26.4%) | 0 (0.0%) |
| $50,000 to $99,999 | 0 (0.0%) | 0 (0.0%) |
| $100,000 to $299,999 | 42 (46.2%) | 30 (56.6%) |
| $300,000 to $499,999 | 0 (0.0%) | 18 (34.0%) |
| $500,000 to $749,999 | 6 (6.6%) | 5 (9.4%) |
| $750,000 to $999,999 | 19 (20.9%) | 0 (0.0%) |
| $1,000,000 or more | 0 (0.0%) | 0 (0.0%) |
| Total | 91 (100.0%) | 53 (100.0%) |
Household Income by Mortgage Status in Arlee
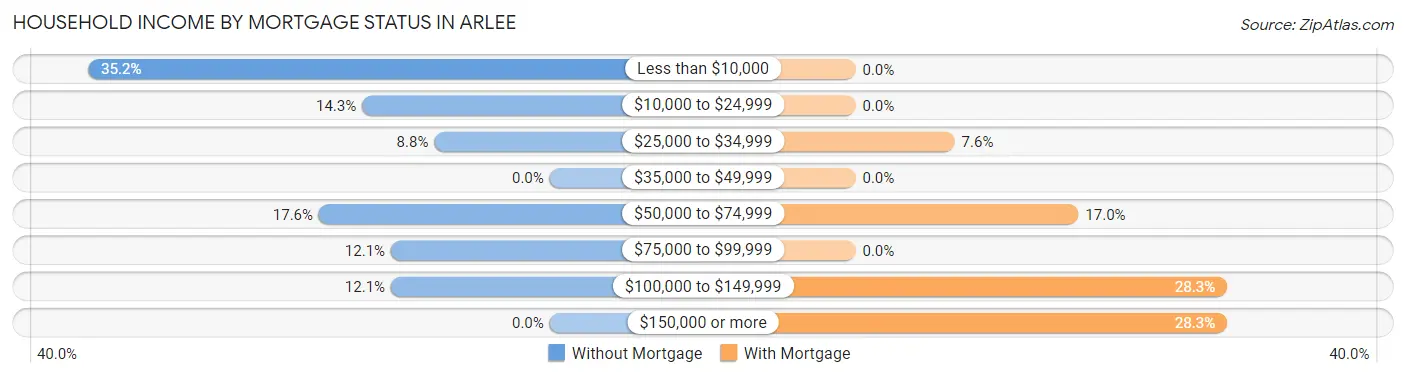
| Household Income | Without Mortgage | With Mortgage |
| Less than $10,000 | 32 (35.2%) | 0 (0.0%) |
| $10,000 to $24,999 | 13 (14.3%) | 0 (0.0%) |
| $25,000 to $34,999 | 8 (8.8%) | 4 (7.5%) |
| $35,000 to $49,999 | 0 (0.0%) | 0 (0.0%) |
| $50,000 to $74,999 | 16 (17.6%) | 9 (17.0%) |
| $75,000 to $99,999 | 11 (12.1%) | 0 (0.0%) |
| $100,000 to $149,999 | 11 (12.1%) | 15 (28.3%) |
| $150,000 or more | 0 (0.0%) | 15 (28.3%) |
| Total | 91 (100.0%) | 53 (100.0%) |
Property Value to Household Income Ratio in Arlee
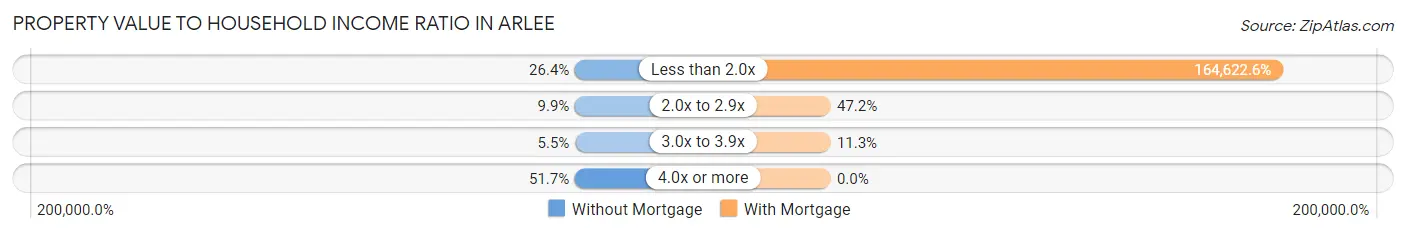
| Value-to-Income Ratio | Without Mortgage | With Mortgage |
| Less than 2.0x | 24 (26.4%) | 87,250 (164,622.6%) |
| 2.0x to 2.9x | 9 (9.9%) | 25 (47.2%) |
| 3.0x to 3.9x | 5 (5.5%) | 6 (11.3%) |
| 4.0x or more | 47 (51.6%) | 0 (0.0%) |
| Total | 91 (100.0%) | 53 (100.0%) |
Real Estate Taxes by Mortgage Status in Arlee
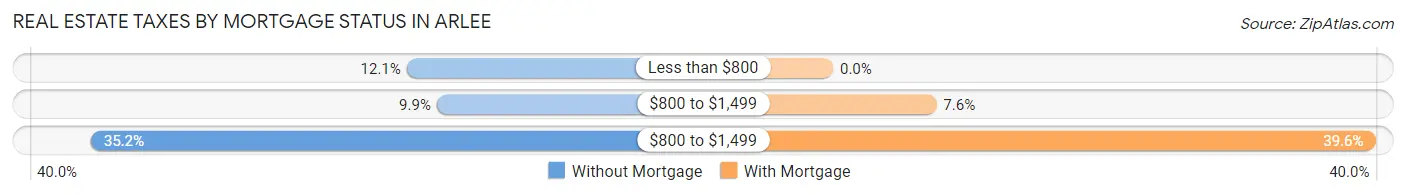
| Property Taxes | Without Mortgage | With Mortgage |
| Less than $800 | 11 (12.1%) | 0 (0.0%) |
| $800 to $1,499 | 9 (9.9%) | 4 (7.5%) |
| $800 to $1,499 | 32 (35.2%) | 21 (39.6%) |
| Total | 91 (100.0%) | 53 (100.0%) |
Health & Disability in Arlee
Health Insurance Coverage by Age in Arlee
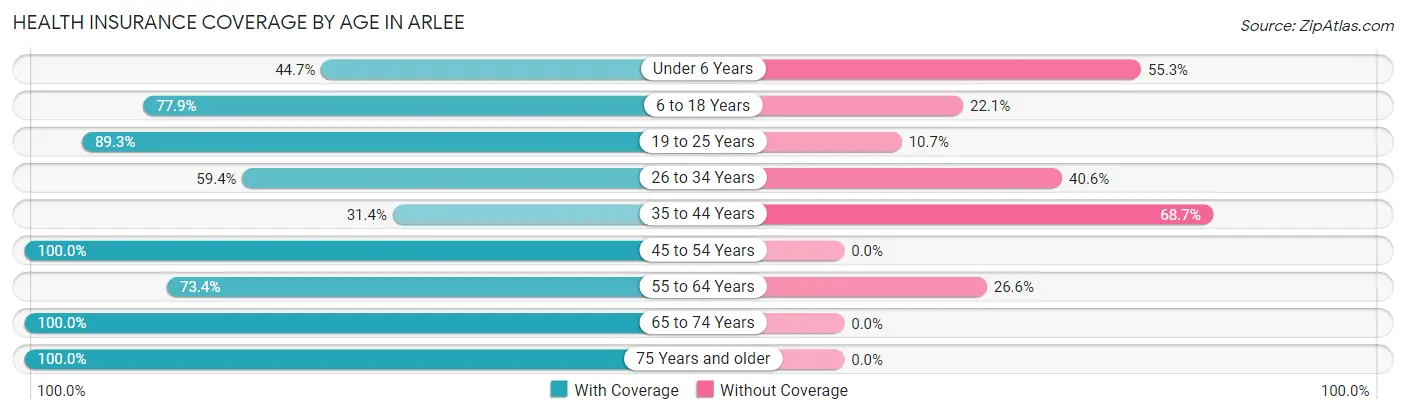
| Age Bracket | With Coverage | Without Coverage |
| Under 6 Years | 21 (44.7%) | 26 (55.3%) |
| 6 to 18 Years | 102 (77.9%) | 29 (22.1%) |
| 19 to 25 Years | 50 (89.3%) | 6 (10.7%) |
| 26 to 34 Years | 38 (59.4%) | 26 (40.6%) |
| 35 to 44 Years | 58 (31.4%) | 127 (68.6%) |
| 45 to 54 Years | 37 (100.0%) | 0 (0.0%) |
| 55 to 64 Years | 58 (73.4%) | 21 (26.6%) |
| 65 to 74 Years | 55 (100.0%) | 0 (0.0%) |
| 75 Years and older | 39 (100.0%) | 0 (0.0%) |
| Total | 458 (66.1%) | 235 (33.9%) |
Health Insurance Coverage by Citizenship Status in Arlee
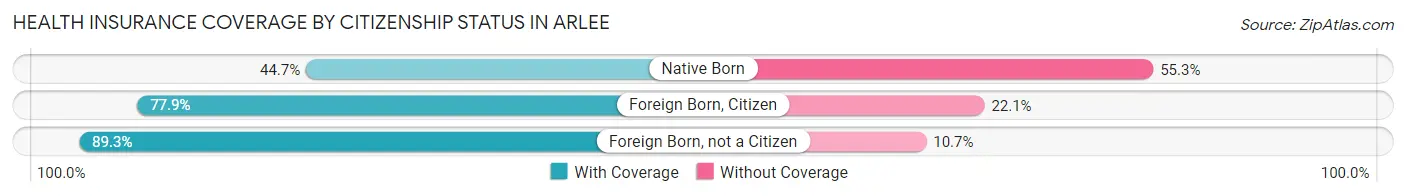
| Citizenship Status | With Coverage | Without Coverage |
| Native Born | 21 (44.7%) | 26 (55.3%) |
| Foreign Born, Citizen | 102 (77.9%) | 29 (22.1%) |
| Foreign Born, not a Citizen | 50 (89.3%) | 6 (10.7%) |
Health Insurance Coverage by Household Income in Arlee
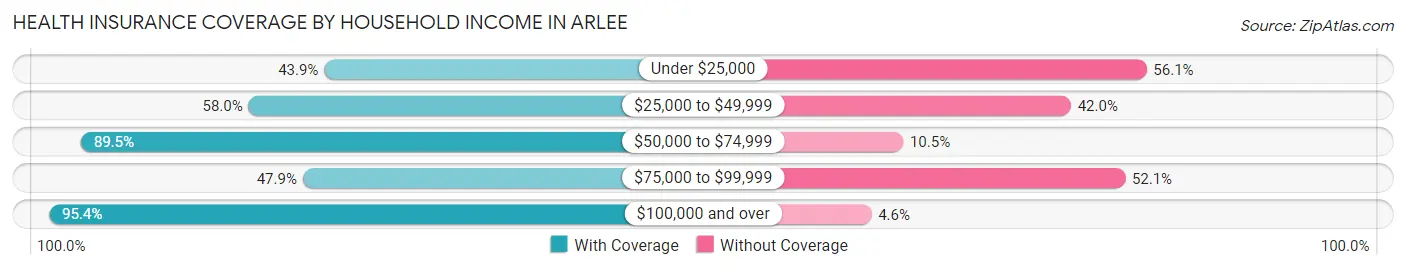
| Household Income | With Coverage | Without Coverage |
| Under $25,000 | 93 (43.9%) | 119 (56.1%) |
| $25,000 to $49,999 | 83 (58.0%) | 60 (42.0%) |
| $50,000 to $74,999 | 102 (89.5%) | 12 (10.5%) |
| $75,000 to $99,999 | 34 (47.9%) | 37 (52.1%) |
| $100,000 and over | 146 (95.4%) | 7 (4.6%) |
Public vs Private Health Insurance Coverage by Age in Arlee
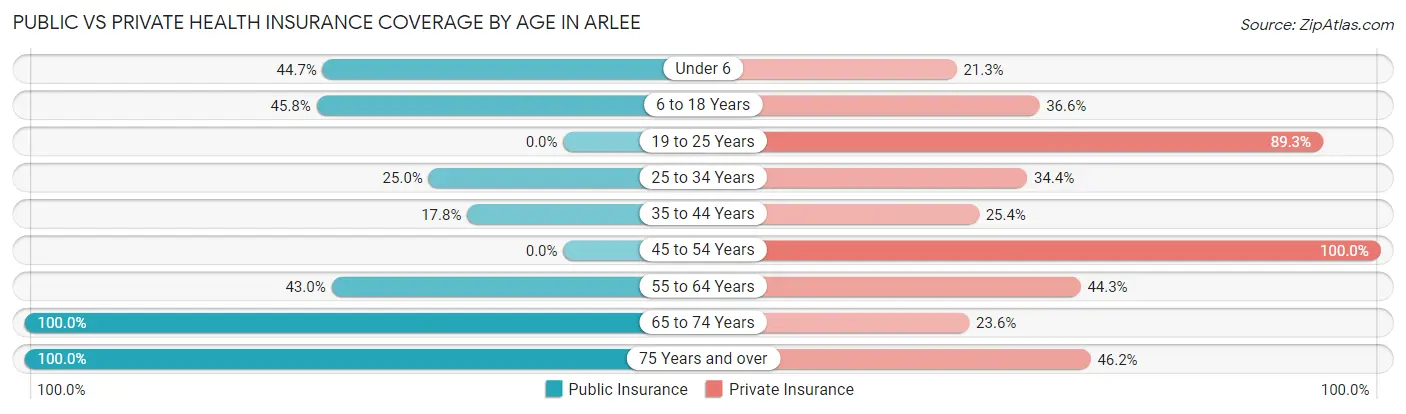
| Age Bracket | Public Insurance | Private Insurance |
| Under 6 | 21 (44.7%) | 10 (21.3%) |
| 6 to 18 Years | 60 (45.8%) | 48 (36.6%) |
| 19 to 25 Years | 0 (0.0%) | 50 (89.3%) |
| 25 to 34 Years | 16 (25.0%) | 22 (34.4%) |
| 35 to 44 Years | 33 (17.8%) | 47 (25.4%) |
| 45 to 54 Years | 0 (0.0%) | 37 (100.0%) |
| 55 to 64 Years | 34 (43.0%) | 35 (44.3%) |
| 65 to 74 Years | 55 (100.0%) | 13 (23.6%) |
| 75 Years and over | 39 (100.0%) | 18 (46.2%) |
| Total | 258 (37.2%) | 280 (40.4%) |
Disability Status by Sex by Age in Arlee
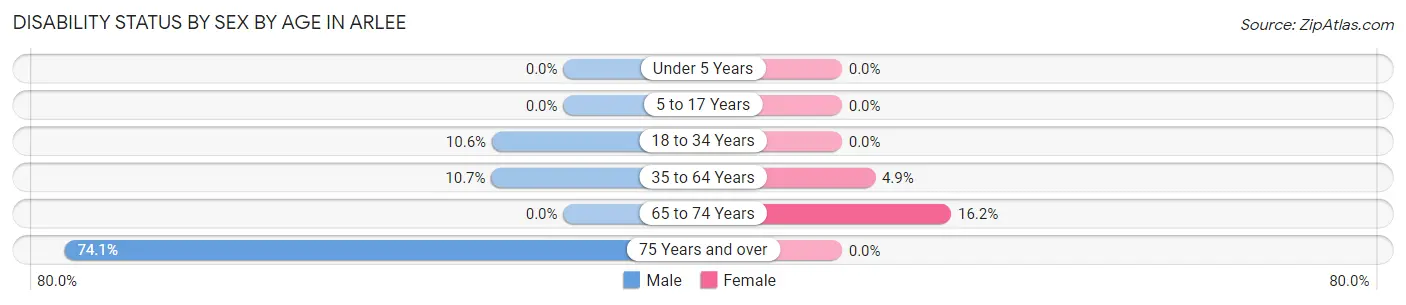
| Age Bracket | Male | Female |
| Under 5 Years | 0 (0.0%) | 0 (0.0%) |
| 5 to 17 Years | 0 (0.0%) | 0 (0.0%) |
| 18 to 34 Years | 7 (10.6%) | 0 (0.0%) |
| 35 to 64 Years | 17 (10.7%) | 7 (4.9%) |
| 65 to 74 Years | 0 (0.0%) | 6 (16.2%) |
| 75 Years and over | 20 (74.1%) | 0 (0.0%) |
Disability Class by Sex by Age in Arlee
Disability Class: Hearing Difficulty
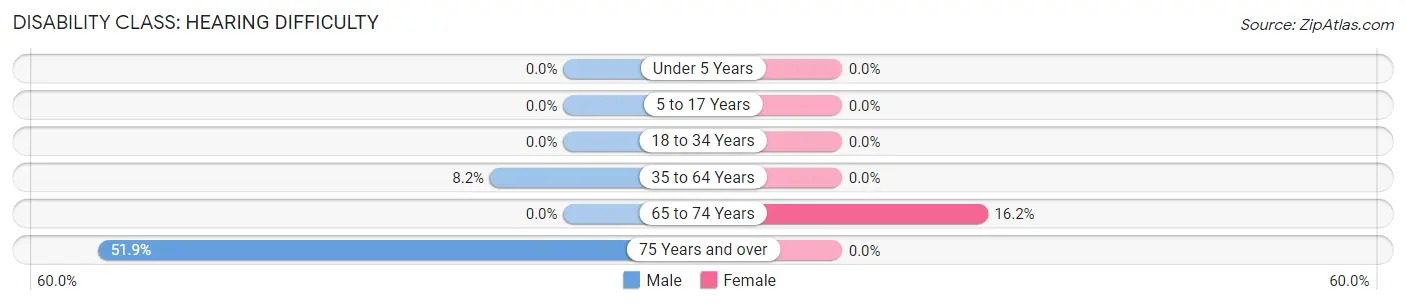
| Age Bracket | Male | Female |
| Under 5 Years | 0 (0.0%) | 0 (0.0%) |
| 5 to 17 Years | 0 (0.0%) | 0 (0.0%) |
| 18 to 34 Years | 0 (0.0%) | 0 (0.0%) |
| 35 to 64 Years | 13 (8.2%) | 0 (0.0%) |
| 65 to 74 Years | 0 (0.0%) | 6 (16.2%) |
| 75 Years and over | 14 (51.8%) | 0 (0.0%) |
Disability Class: Vision Difficulty
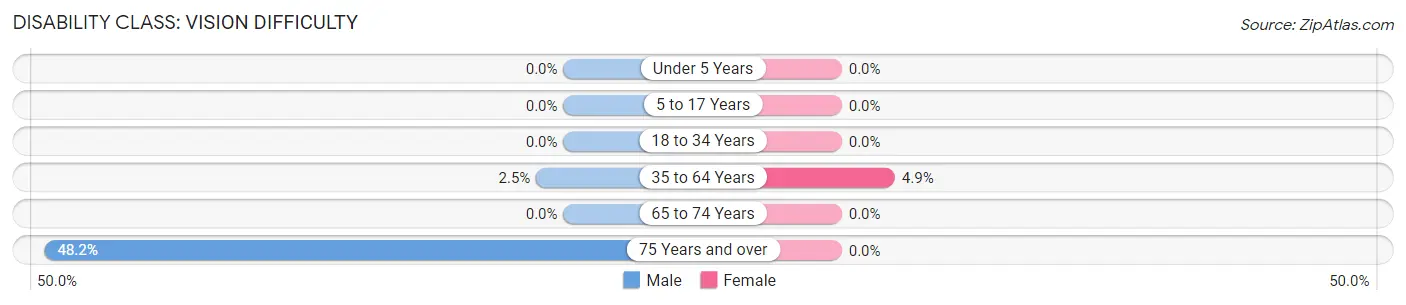
| Age Bracket | Male | Female |
| Under 5 Years | 0 (0.0%) | 0 (0.0%) |
| 5 to 17 Years | 0 (0.0%) | 0 (0.0%) |
| 18 to 34 Years | 0 (0.0%) | 0 (0.0%) |
| 35 to 64 Years | 4 (2.5%) | 7 (4.9%) |
| 65 to 74 Years | 0 (0.0%) | 0 (0.0%) |
| 75 Years and over | 13 (48.1%) | 0 (0.0%) |
Disability Class: Cognitive Difficulty
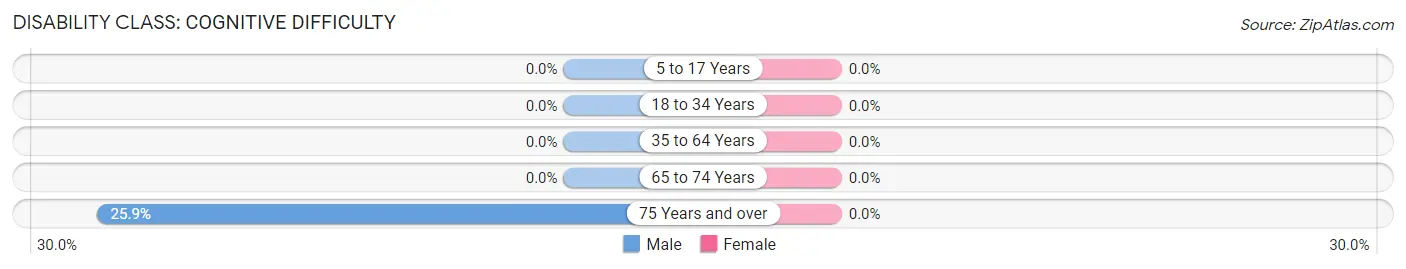
| Age Bracket | Male | Female |
| 5 to 17 Years | 0 (0.0%) | 0 (0.0%) |
| 18 to 34 Years | 0 (0.0%) | 0 (0.0%) |
| 35 to 64 Years | 0 (0.0%) | 0 (0.0%) |
| 65 to 74 Years | 0 (0.0%) | 0 (0.0%) |
| 75 Years and over | 7 (25.9%) | 0 (0.0%) |
Disability Class: Ambulatory Difficulty
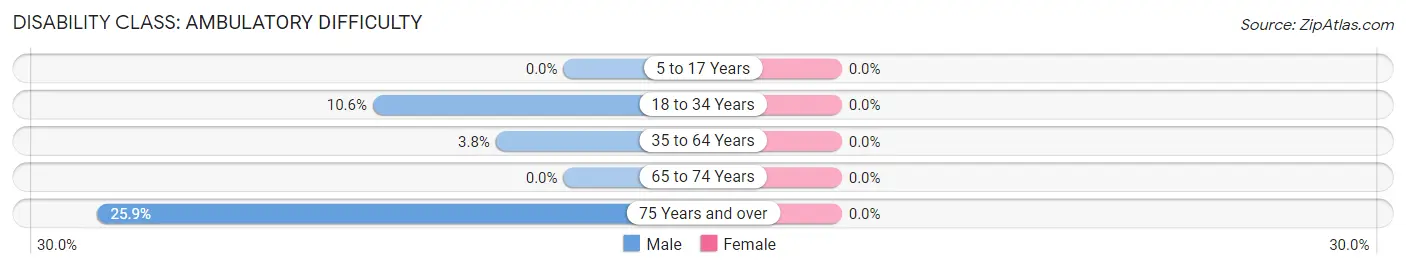
| Age Bracket | Male | Female |
| 5 to 17 Years | 0 (0.0%) | 0 (0.0%) |
| 18 to 34 Years | 7 (10.6%) | 0 (0.0%) |
| 35 to 64 Years | 6 (3.8%) | 0 (0.0%) |
| 65 to 74 Years | 0 (0.0%) | 0 (0.0%) |
| 75 Years and over | 7 (25.9%) | 0 (0.0%) |
Disability Class: Self-Care Difficulty
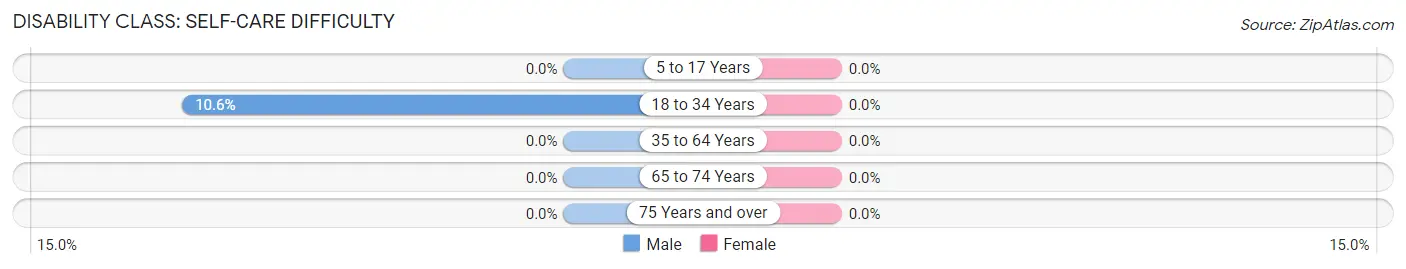
| Age Bracket | Male | Female |
| 5 to 17 Years | 0 (0.0%) | 0 (0.0%) |
| 18 to 34 Years | 7 (10.6%) | 0 (0.0%) |
| 35 to 64 Years | 0 (0.0%) | 0 (0.0%) |
| 65 to 74 Years | 0 (0.0%) | 0 (0.0%) |
| 75 Years and over | 0 (0.0%) | 0 (0.0%) |
Technology Access in Arlee
Computing Device Access in Arlee
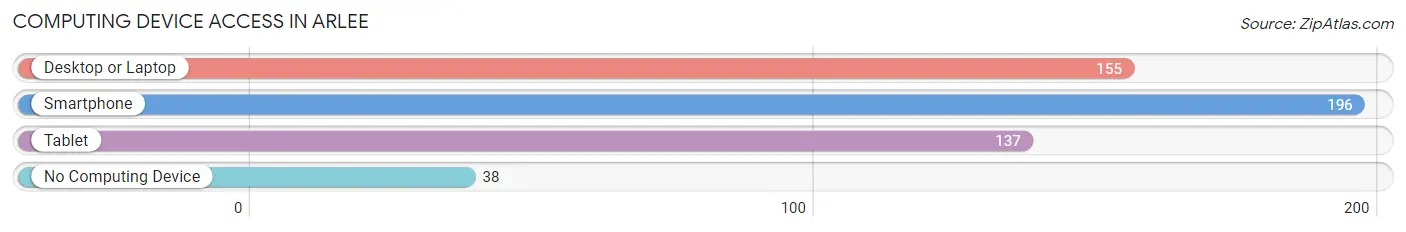
| Device Type | # Households | % Households |
| Desktop or Laptop | 155 | 61.3% |
| Smartphone | 196 | 77.5% |
| Tablet | 137 | 54.1% |
| No Computing Device | 38 | 15.0% |
| Total | 253 | 100.0% |
Internet Access in Arlee
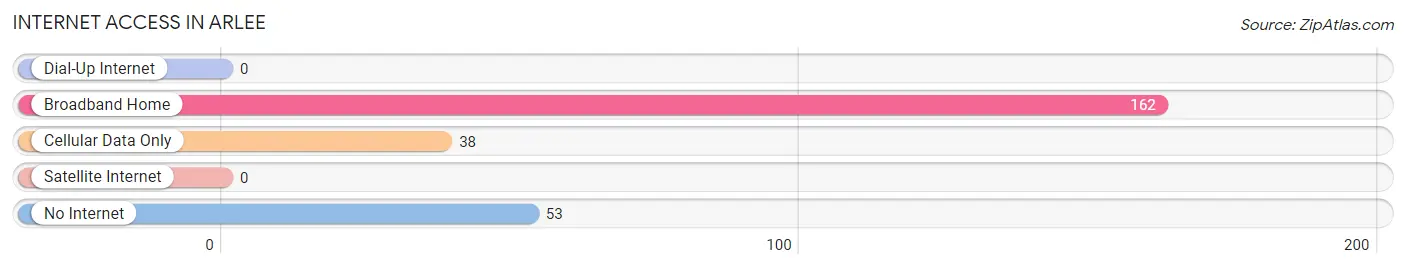
| Internet Type | # Households | % Households |
| Dial-Up Internet | 0 | 0.0% |
| Broadband Home | 162 | 64.0% |
| Cellular Data Only | 38 | 15.0% |
| Satellite Internet | 0 | 0.0% |
| No Internet | 53 | 20.9% |
| Total | 253 | 100.0% |
Arlee Summary
Arlee is a small town located in the western part of Montana, in the United States. It is situated in the Jocko Valley, in Lake County, and is part of the Flathead Indian Reservation. The town has a population of about 1,000 people, and is located about 20 miles south of Missoula.
History
Arlee was founded in 1891 by a group of Salish Indians, who were led by Chief Arlee. The town was originally called “Arlee’s Camp”, and was located on the Flathead Indian Reservation. The town was officially incorporated in 1909, and was named after Chief Arlee.
In the early 1900s, Arlee was a bustling town, with a population of over 1,000 people. The town was home to a variety of businesses, including a hotel, a general store, a blacksmith shop, and a saloon. The town also had a school, a post office, and a church.
In the 1920s, the town began to decline, as many of the businesses closed down. The population of the town decreased to about 500 people. In the 1940s, the town began to experience a resurgence, as new businesses opened up and the population increased to about 1,000 people.
Geography
Arlee is located in the western part of Montana, in the Jocko Valley. The town is situated in Lake County, and is part of the Flathead Indian Reservation. The town is located about 20 miles south of Missoula.
The town is situated in a valley, surrounded by mountains. The Jocko River runs through the town, and is a popular spot for fishing and rafting. The town is also located near several lakes, including Flathead Lake, which is the largest natural freshwater lake in the western United States.
Economy
The economy of Arlee is largely based on agriculture and tourism. The town is home to several farms, which produce a variety of crops, including wheat, barley, and hay. The town is also home to several tourist attractions, including the Jocko Valley Museum, which showcases the history of the area.
The town is also home to several businesses, including restaurants, stores, and a gas station. The town is also home to a casino, which is owned and operated by the Confederated Salish and Kootenai Tribes.
Demographics
As of the 2010 census, the population of Arlee was 1,068 people. The town has a median age of 37.7 years, and a median household income of $35,000. The town is predominantly white, with about 90% of the population being white. The town also has a small Native American population, with about 8% of the population being Native American.
Common Questions
What is Per Capita Income in Arlee?
Per Capita income in Arlee is $20,834.
What is the Median Family Income in Arlee?
Median Family Income in Arlee is $53,000.
What is the Median Household income in Arlee?
Median Household Income in Arlee is $37,109.
What is Income or Wage Gap in Arlee?
Income or Wage Gap in Arlee is 30.0%.
Women in Arlee earn 70.0 cents for every dollar earned by a man.
What is Inequality or Gini Index in Arlee?
Inequality or Gini Index in Arlee is 0.48.
What is the Total Population of Arlee?
Total Population of Arlee is 693.
What is the Total Male Population of Arlee?
Total Male Population of Arlee is 327.
What is the Total Female Population of Arlee?
Total Female Population of Arlee is 366.
What is the Ratio of Males per 100 Females in Arlee?
There are 89.34 Males per 100 Females in Arlee.
What is the Ratio of Females per 100 Males in Arlee?
There are 111.93 Females per 100 Males in Arlee.
What is the Median Population Age in Arlee?
Median Population Age in Arlee is 36.6 Years.
What is the Average Family Size in Arlee
Average Family Size in Arlee is 3.5 People.
What is the Average Household Size in Arlee
Average Household Size in Arlee is 2.7 People.
How Large is the Labor Force in Arlee?
There are 316 People in the Labor Forcein in Arlee.
What is the Percentage of People in the Labor Force in Arlee?
57.4% of People are in the Labor Force in Arlee.
What is the Unemployment Rate in Arlee?
Unemployment Rate in Arlee is 9.5%.