Hardin, MT Map & Demographics
Hardin Map
Hardin Overview
$24,933
PER CAPITA INCOME
$67,298
AVG FAMILY INCOME
$57,266
AVG HOUSEHOLD INCOME
23.8%
WAGE / INCOME GAP [ % ]
76.2¢/ $1
WAGE / INCOME GAP [ $ ]
0.42
INEQUALITY / GINI INDEX
3,803
TOTAL POPULATION
1,727
MALE POPULATION
2,076
FEMALE POPULATION
83.19
MALES / 100 FEMALES
120.21
FEMALES / 100 MALES
32.9
MEDIAN AGE
3.5
AVG FAMILY SIZE
2.9
AVG HOUSEHOLD SIZE
1,908
LABOR FORCE [ PEOPLE ]
68.9%
PERCENT IN LABOR FORCE
11.5%
UNEMPLOYMENT RATE
Hardin Zip Codes
Hardin Area Codes
Income in Hardin
Income Overview in Hardin
Per Capita Income in Hardin is $24,933, while median incomes of families and households are $67,298 and $57,266 respectively.
| Characteristic | Number | Measure |
| Per Capita Income | 3,803 | $24,933 |
| Median Family Income | 847 | $67,298 |
| Mean Family Income | 847 | $82,086 |
| Median Household Income | 1,277 | $57,266 |
| Mean Household Income | 1,277 | $68,478 |
| Income Deficit | 847 | $0 |
| Wage / Income Gap (%) | 3,803 | 23.83% |
| Wage / Income Gap ($) | 3,803 | 76.17¢ per $1 |
| Gini / Inequality Index | 3,803 | 0.42 |
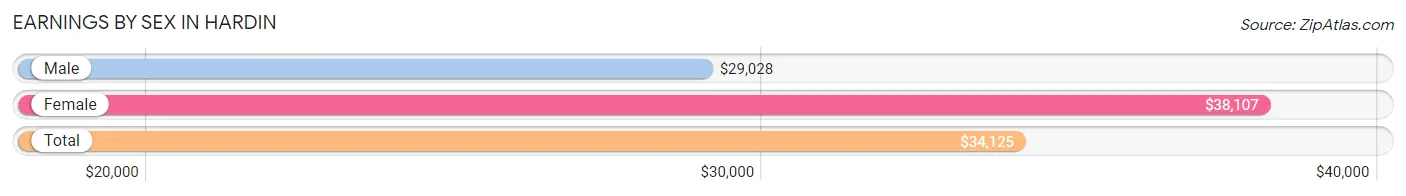
Earnings by Sex in Hardin
Average Earnings in Hardin are $34,125, $29,028 for men and $38,107 for women, a difference of 23.8%.
| Sex | Number | Average Earnings |
| Male | 912 (49.1%) | $29,028 |
| Female | 944 (50.9%) | $38,107 |
| Total | 1,856 (100.0%) | $34,125 |
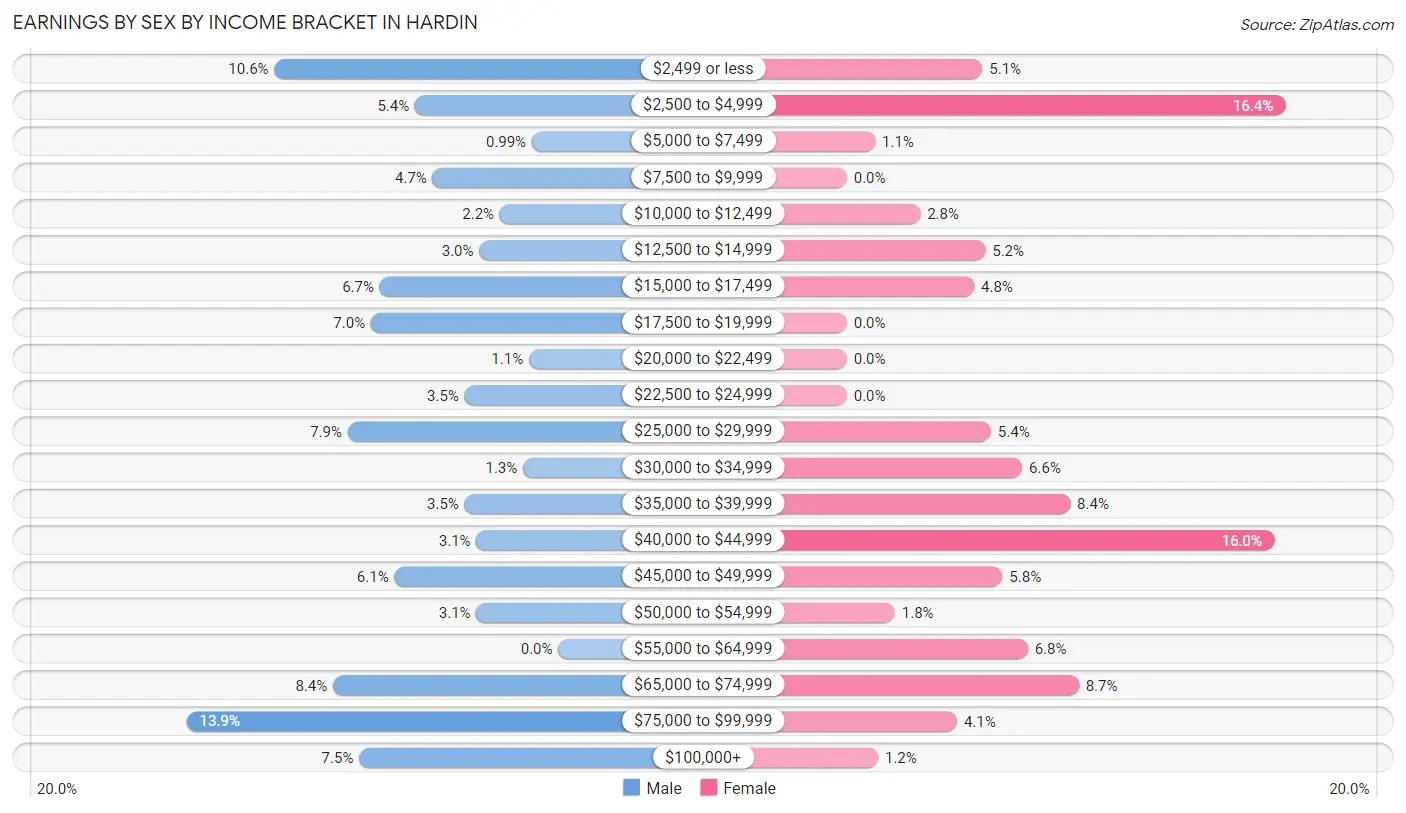
Earnings by Sex by Income Bracket in Hardin
The most common earnings brackets in Hardin are $75,000 to $99,999 for men (127 | 13.9%) and $2,500 to $4,999 for women (155 | 16.4%).
| Income | Male | Female |
| $2,499 or less | 97 (10.6%) | 48 (5.1%) |
| $2,500 to $4,999 | 49 (5.4%) | 155 (16.4%) |
| $5,000 to $7,499 | 9 (1.0%) | 10 (1.1%) |
| $7,500 to $9,999 | 43 (4.7%) | 0 (0.0%) |
| $10,000 to $12,499 | 20 (2.2%) | 26 (2.8%) |
| $12,500 to $14,999 | 27 (3.0%) | 49 (5.2%) |
| $15,000 to $17,499 | 61 (6.7%) | 45 (4.8%) |
| $17,500 to $19,999 | 64 (7.0%) | 0 (0.0%) |
| $20,000 to $22,499 | 10 (1.1%) | 0 (0.0%) |
| $22,500 to $24,999 | 32 (3.5%) | 0 (0.0%) |
| $25,000 to $29,999 | 72 (7.9%) | 51 (5.4%) |
| $30,000 to $34,999 | 12 (1.3%) | 62 (6.6%) |
| $35,000 to $39,999 | 32 (3.5%) | 79 (8.4%) |
| $40,000 to $44,999 | 28 (3.1%) | 151 (16.0%) |
| $45,000 to $49,999 | 56 (6.1%) | 55 (5.8%) |
| $50,000 to $54,999 | 28 (3.1%) | 17 (1.8%) |
| $55,000 to $64,999 | 0 (0.0%) | 64 (6.8%) |
| $65,000 to $74,999 | 77 (8.4%) | 82 (8.7%) |
| $75,000 to $99,999 | 127 (13.9%) | 39 (4.1%) |
| $100,000+ | 68 (7.5%) | 11 (1.2%) |
| Total | 912 (100.0%) | 944 (100.0%) |
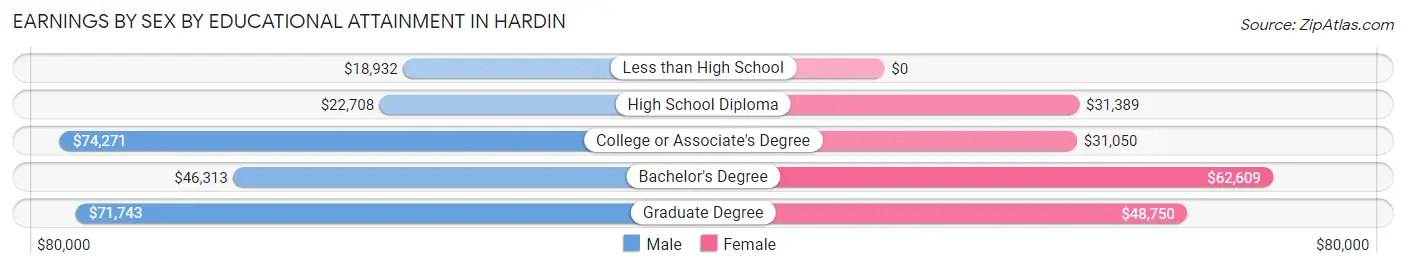
Earnings by Sex by Educational Attainment in Hardin
Average earnings in Hardin are $40,147 for men and $40,260 for women, a difference of 0.3%. Men with an educational attainment of college or associate's degree enjoy the highest average annual earnings of $74,271, while those with less than high school education earn the least with $18,932. Women with an educational attainment of bachelor's degree earn the most with the average annual earnings of $62,609, while those with college or associate's degree education have the smallest earnings of $31,050.
| Educational Attainment | Male Income | Female Income |
| Less than High School | $18,932 | $0 |
| High School Diploma | $22,708 | $31,389 |
| College or Associate's Degree | $74,271 | $31,050 |
| Bachelor's Degree | $46,313 | $62,609 |
| Graduate Degree | $71,743 | $48,750 |
| Total | $40,147 | $40,260 |
Family Income in Hardin
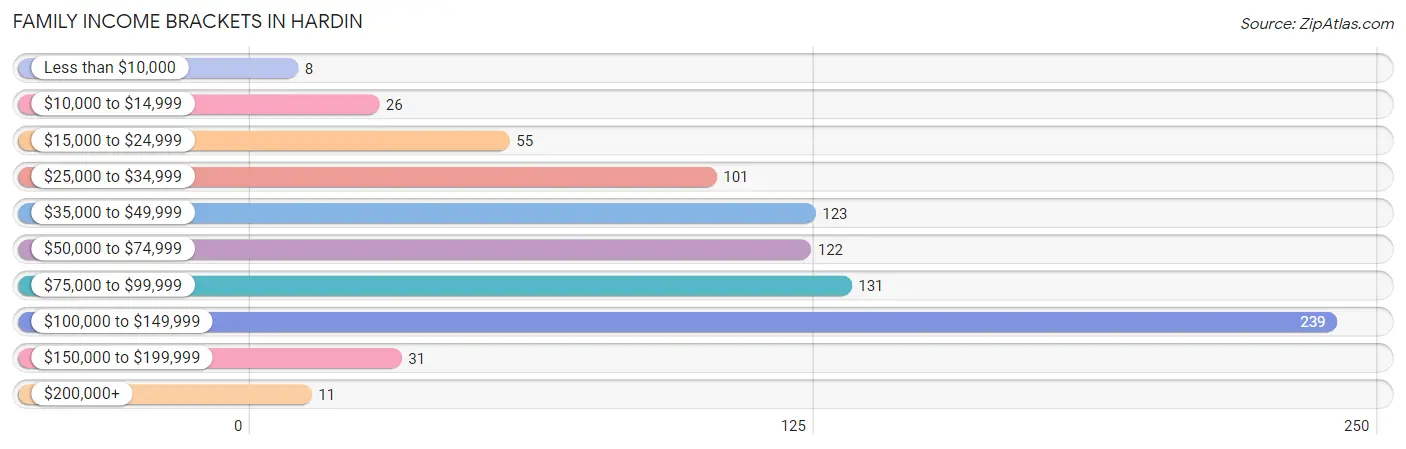
Family Income Brackets in Hardin
According to the Hardin family income data, there are 239 families falling into the $100,000 to $149,999 income range, which is the most common income bracket and makes up 28.2% of all families. Conversely, the less than $10,000 income bracket is the least frequent group with only 8 families (0.9%) belonging to this category.
| Income Bracket | # Families | % Families |
| Less than $10,000 | 8 | 0.9% |
| $10,000 to $14,999 | 26 | 3.1% |
| $15,000 to $24,999 | 55 | 6.5% |
| $25,000 to $34,999 | 101 | 11.9% |
| $35,000 to $49,999 | 123 | 14.5% |
| $50,000 to $74,999 | 122 | 14.4% |
| $75,000 to $99,999 | 131 | 15.5% |
| $100,000 to $149,999 | 239 | 28.2% |
| $150,000 to $199,999 | 31 | 3.7% |
| $200,000+ | 11 | 1.3% |
Family Income by Famaliy Size in Hardin
3-person families (189 | 22.3%) account for the highest median family income in Hardin with $134,196 per family, while 3-person families (189 | 22.3%) have the highest median income of $44,732 per family member.

| Income Bracket | # Families | Median Income |
| 2-Person Families | 347 (41.0%) | $71,250 |
| 3-Person Families | 189 (22.3%) | $134,196 |
| 4-Person Families | 149 (17.6%) | $46,743 |
| 5-Person Families | 104 (12.3%) | $87,283 |
| 6-Person Families | 58 (6.9%) | $0 |
| 7+ Person Families | 0 (0.0%) | $0 |
| Total | 847 (100.0%) | $67,298 |
Family Income by Number of Earners in Hardin
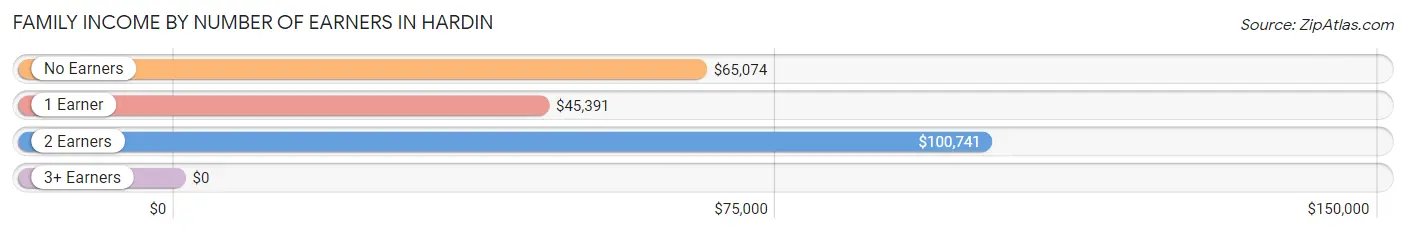
| Number of Earners | # Families | Median Income |
| No Earners | 51 (6.0%) | $65,074 |
| 1 Earner | 365 (43.1%) | $45,391 |
| 2 Earners | 400 (47.2%) | $100,741 |
| 3+ Earners | 31 (3.7%) | $0 |
| Total | 847 (100.0%) | $67,298 |
Household Income in Hardin
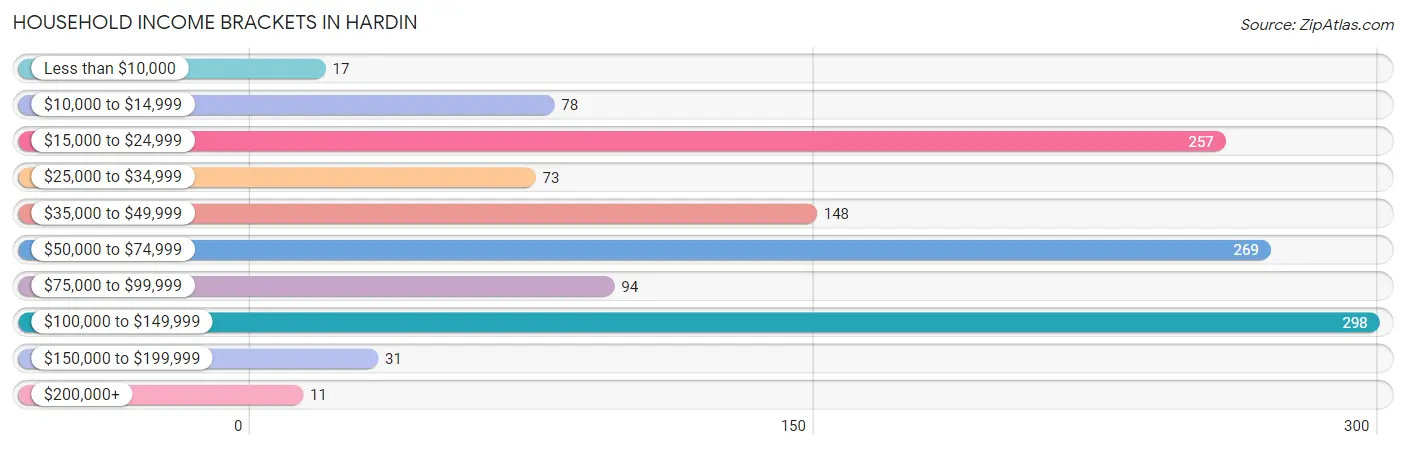
Household Income Brackets in Hardin
With 298 households falling in the category, the $100,000 to $149,999 income range is the most frequent in Hardin, accounting for 23.3% of all households. In contrast, only 11 households (0.9%) fall into the $200,000+ income bracket, making it the least populous group.
| Income Bracket | # Households | % Households |
| Less than $10,000 | 17 | 1.3% |
| $10,000 to $14,999 | 78 | 6.1% |
| $15,000 to $24,999 | 257 | 20.1% |
| $25,000 to $34,999 | 73 | 5.7% |
| $35,000 to $49,999 | 148 | 11.6% |
| $50,000 to $74,999 | 269 | 21.1% |
| $75,000 to $99,999 | 94 | 7.4% |
| $100,000 to $149,999 | 298 | 23.3% |
| $150,000 to $199,999 | 31 | 2.4% |
| $200,000+ | 11 | 0.9% |
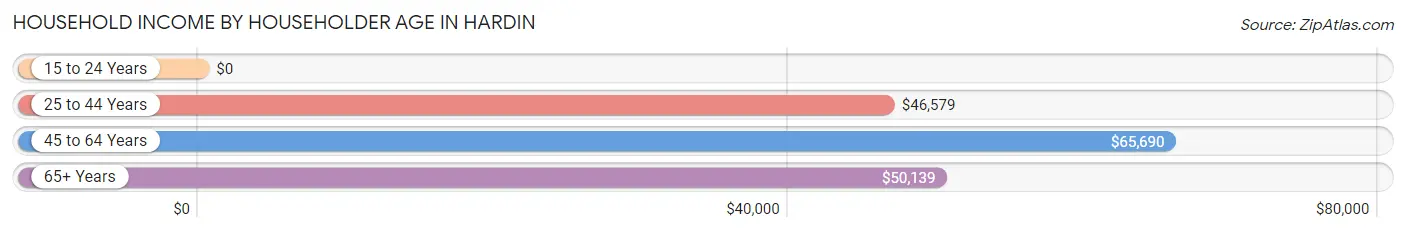
Household Income by Householder Age in Hardin
The median household income in Hardin is $57,266, with the highest median household income of $65,690 found in the 45 to 64 years age bracket for the primary householder. A total of 462 households (36.2%) fall into this category. Meanwhile, the 15 to 24 years age bracket for the primary householder has the lowest median household income of $0, with 54 households (4.2%) in this group.
| Income Bracket | # Households | Median Income |
| 15 to 24 Years | 54 (4.2%) | $0 |
| 25 to 44 Years | 466 (36.5%) | $46,579 |
| 45 to 64 Years | 462 (36.2%) | $65,690 |
| 65+ Years | 295 (23.1%) | $50,139 |
| Total | 1,277 (100.0%) | $57,266 |
Poverty in Hardin
Income Below Poverty by Sex and Age in Hardin
With 14.3% poverty level for males and 22.0% for females among the residents of Hardin, 18 to 24 year old males and 16 and 17 year old females are the most vulnerable to poverty, with 96 males (45.7%) and 64 females (100.0%) in their respective age groups living below the poverty level.
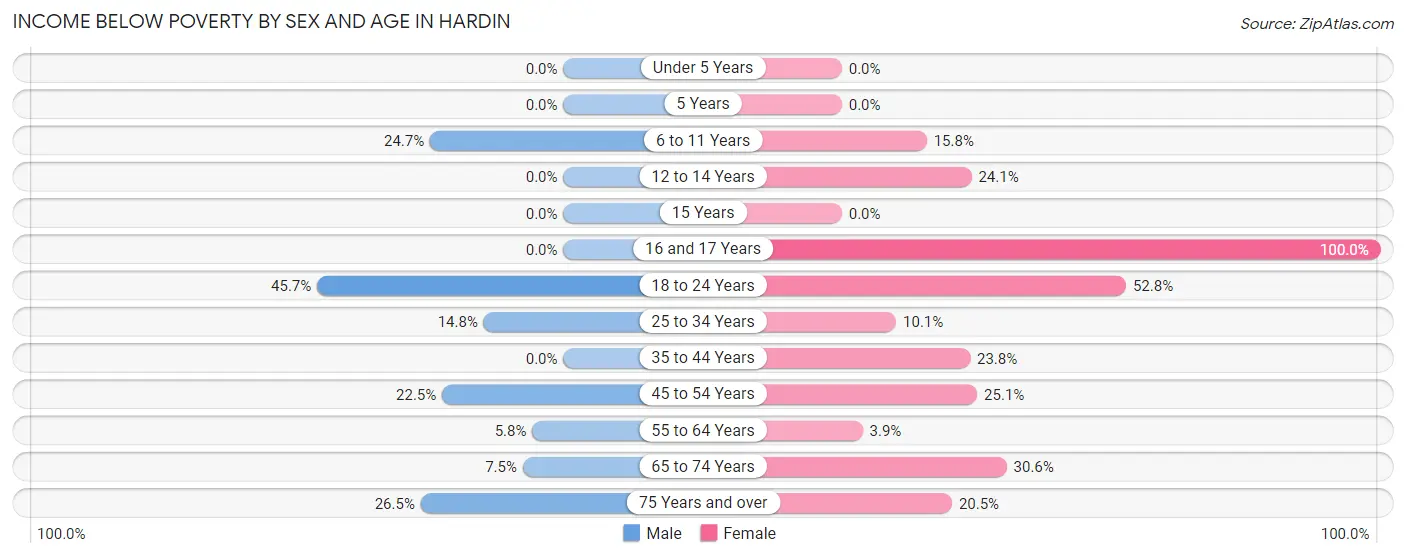
| Age Bracket | Male | Female |
| Under 5 Years | 0 (0.0%) | 0 (0.0%) |
| 5 Years | 0 (0.0%) | 0 (0.0%) |
| 6 to 11 Years | 47 (24.7%) | 41 (15.8%) |
| 12 to 14 Years | 0 (0.0%) | 39 (24.1%) |
| 15 Years | 0 (0.0%) | 0 (0.0%) |
| 16 and 17 Years | 0 (0.0%) | 64 (100.0%) |
| 18 to 24 Years | 96 (45.7%) | 96 (52.7%) |
| 25 to 34 Years | 34 (14.8%) | 26 (10.1%) |
| 35 to 44 Years | 0 (0.0%) | 55 (23.8%) |
| 45 to 54 Years | 27 (22.5%) | 49 (25.1%) |
| 55 to 64 Years | 15 (5.8%) | 8 (3.9%) |
| 65 to 74 Years | 11 (7.5%) | 52 (30.6%) |
| 75 Years and over | 9 (26.5%) | 18 (20.4%) |
| Total | 239 (14.3%) | 448 (22.0%) |
Income Above Poverty by Sex and Age in Hardin
According to the poverty statistics in Hardin, males aged under 5 years and females aged under 5 years are the age groups that are most secure financially, with 100.0% of males and 100.0% of females in these age groups living above the poverty line.
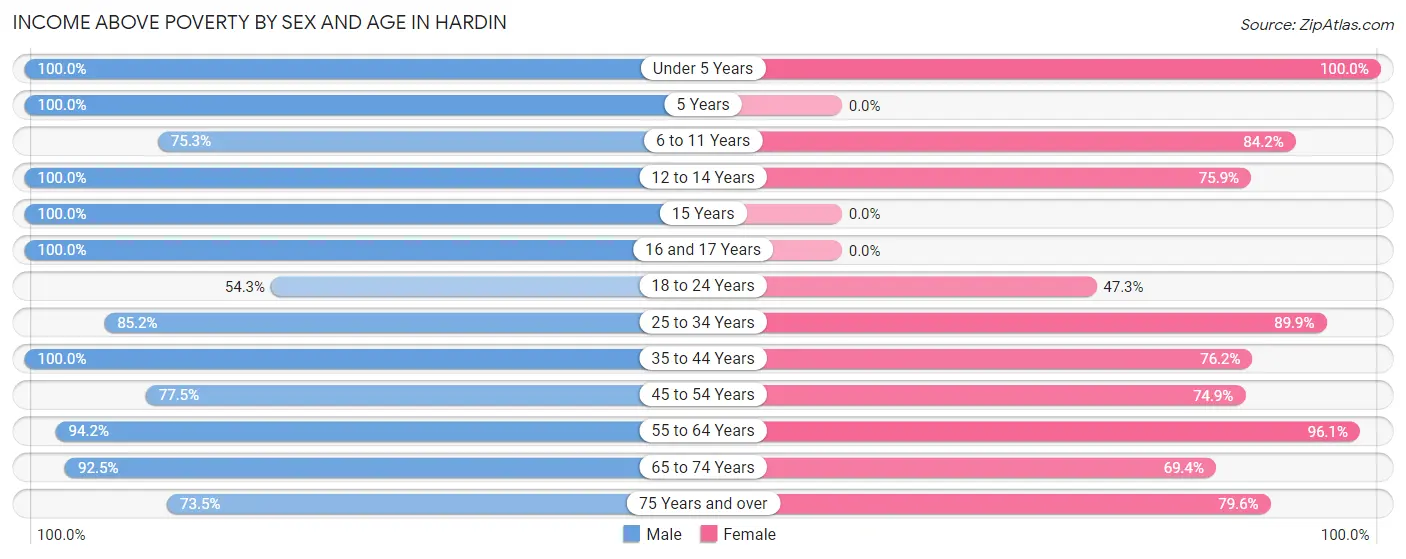
| Age Bracket | Male | Female |
| Under 5 Years | 64 (100.0%) | 219 (100.0%) |
| 5 Years | 21 (100.0%) | 0 (0.0%) |
| 6 to 11 Years | 143 (75.3%) | 219 (84.2%) |
| 12 to 14 Years | 58 (100.0%) | 123 (75.9%) |
| 15 Years | 60 (100.0%) | 0 (0.0%) |
| 16 and 17 Years | 46 (100.0%) | 0 (0.0%) |
| 18 to 24 Years | 114 (54.3%) | 86 (47.2%) |
| 25 to 34 Years | 196 (85.2%) | 232 (89.9%) |
| 35 to 44 Years | 231 (100.0%) | 176 (76.2%) |
| 45 to 54 Years | 93 (77.5%) | 146 (74.9%) |
| 55 to 64 Years | 245 (94.2%) | 199 (96.1%) |
| 65 to 74 Years | 135 (92.5%) | 118 (69.4%) |
| 75 Years and over | 25 (73.5%) | 70 (79.5%) |
| Total | 1,431 (85.7%) | 1,588 (78.0%) |
Income Below Poverty Among Married-Couple Families in Hardin
The poverty statistics for married-couple families in Hardin show that 9.8% or 57 of the total 584 families live below the poverty line. Families with 3 or 4 children have the highest poverty rate of 33.8%, comprising of 49 families. On the other hand, families with 1 or 2 children have the lowest poverty rate of 0.0%, which includes 0 families.
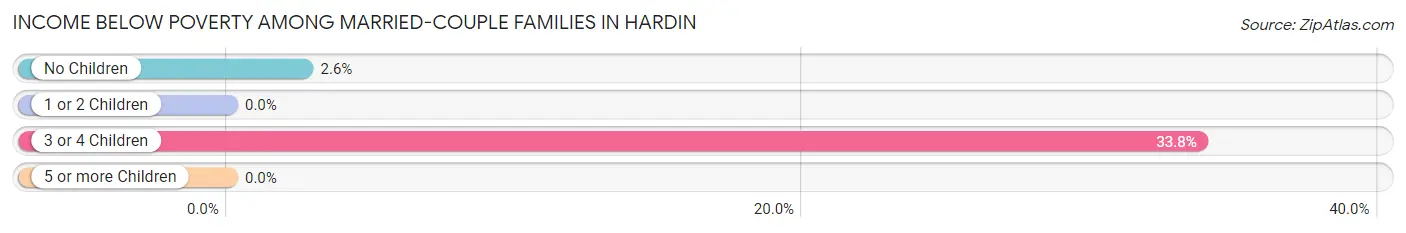
| Children | Above Poverty | Below Poverty |
| No Children | 296 (97.4%) | 8 (2.6%) |
| 1 or 2 Children | 135 (100.0%) | 0 (0.0%) |
| 3 or 4 Children | 96 (66.2%) | 49 (33.8%) |
| 5 or more Children | 0 (0.0%) | 0 (0.0%) |
| Total | 527 (90.2%) | 57 (9.8%) |
Income Below Poverty Among Single-Parent Households in Hardin
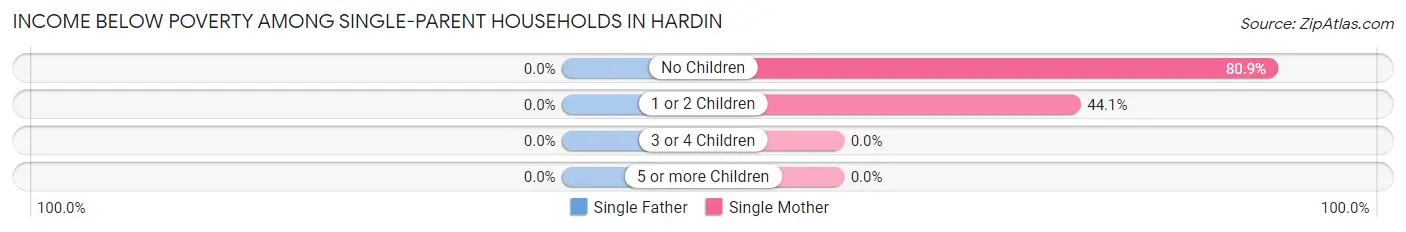
| Children | Single Father | Single Mother |
| No Children | 0 (0.0%) | 55 (80.9%) |
| 1 or 2 Children | 0 (0.0%) | 26 (44.1%) |
| 3 or 4 Children | 0 (0.0%) | 0 (0.0%) |
| 5 or more Children | 0 (0.0%) | 0 (0.0%) |
| Total | 0 (0.0%) | 81 (49.1%) |
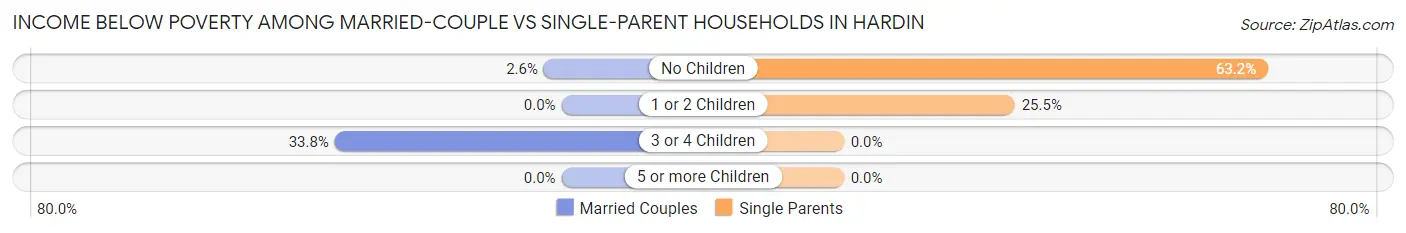
Income Below Poverty Among Married-Couple vs Single-Parent Households in Hardin
The poverty data for Hardin shows that 57 of the married-couple family households (9.8%) and 81 of the single-parent households (30.8%) are living below the poverty level. Within the married-couple family households, those with 3 or 4 children have the highest poverty rate, with 49 households (33.8%) falling below the poverty line. Among the single-parent households, those with no children have the highest poverty rate, with 55 household (63.2%) living below poverty.
| Children | Married-Couple Families | Single-Parent Households |
| No Children | 8 (2.6%) | 55 (63.2%) |
| 1 or 2 Children | 0 (0.0%) | 26 (25.5%) |
| 3 or 4 Children | 49 (33.8%) | 0 (0.0%) |
| 5 or more Children | 0 (0.0%) | 0 (0.0%) |
| Total | 57 (9.8%) | 81 (30.8%) |
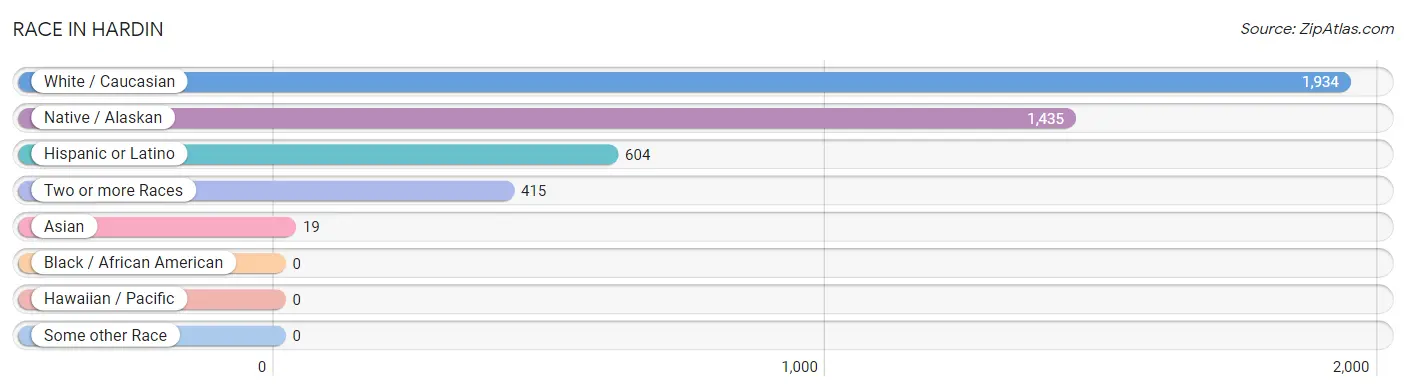
Race in Hardin
The most populous races in Hardin are White / Caucasian (1,934 | 50.8%), Native / Alaskan (1,435 | 37.7%), and Hispanic or Latino (604 | 15.9%).
| Race | # Population | % Population |
| Asian | 19 | 0.5% |
| Black / African American | 0 | 0.0% |
| Hawaiian / Pacific | 0 | 0.0% |
| Hispanic or Latino | 604 | 15.9% |
| Native / Alaskan | 1,435 | 37.7% |
| White / Caucasian | 1,934 | 50.8% |
| Two or more Races | 415 | 10.9% |
| Some other Race | 0 | 0.0% |
| Total | 3,803 | 100.0% |
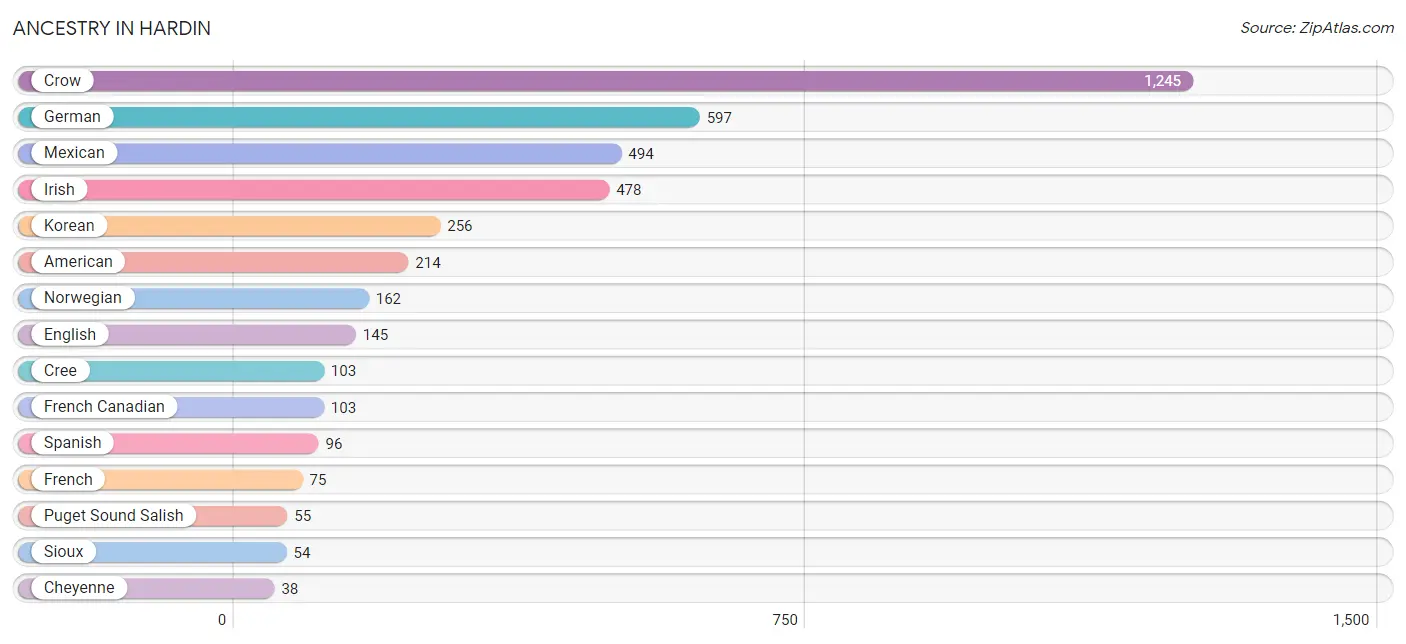
Ancestry in Hardin
The most populous ancestries reported in Hardin are Crow (1,245 | 32.7%), German (597 | 15.7%), Mexican (494 | 13.0%), Irish (478 | 12.6%), and Korean (256 | 6.7%), together accounting for 80.7% of all Hardin residents.
| Ancestry | # Population | % Population |
| African | 9 | 0.2% |
| American | 214 | 5.6% |
| Armenian | 26 | 0.7% |
| Bhutanese | 19 | 0.5% |
| Blackfeet | 20 | 0.5% |
| British | 10 | 0.3% |
| Central American | 14 | 0.4% |
| Cheyenne | 38 | 1.0% |
| Chippewa | 18 | 0.5% |
| Cree | 103 | 2.7% |
| Crow | 1,245 | 32.7% |
| Czech | 28 | 0.7% |
| Danish | 27 | 0.7% |
| Dutch | 23 | 0.6% |
| Eastern European | 21 | 0.5% |
| English | 145 | 3.8% |
| European | 11 | 0.3% |
| Finnish | 37 | 1.0% |
| French | 75 | 2.0% |
| French Canadian | 103 | 2.7% |
| German | 597 | 15.7% |
| Guatemalan | 14 | 0.4% |
| Irish | 478 | 12.6% |
| Korean | 256 | 6.7% |
| Mexican | 494 | 13.0% |
| Norwegian | 162 | 4.3% |
| Puget Sound Salish | 55 | 1.5% |
| Russian | 6 | 0.2% |
| Scandinavian | 27 | 0.7% |
| Scotch-Irish | 14 | 0.4% |
| Scottish | 38 | 1.0% |
| Sioux | 54 | 1.4% |
| Spanish | 96 | 2.5% |
| Subsaharan African | 9 | 0.2% |
| Swedish | 27 | 0.7% | View All 35 Rows |
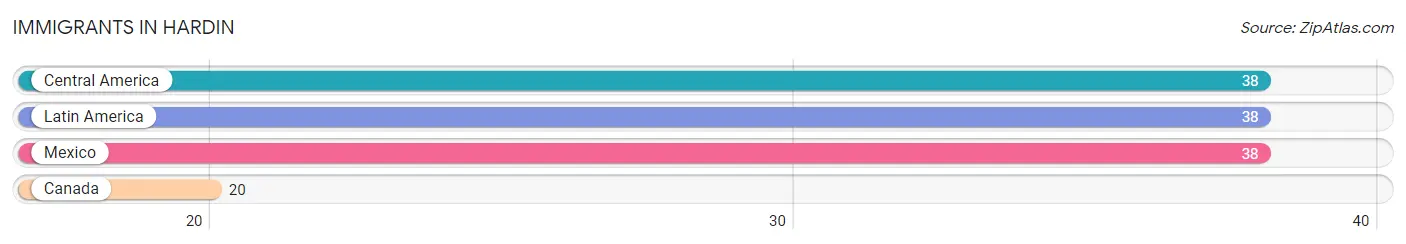
Immigrants in Hardin
The most numerous immigrant groups reported in Hardin came from Central America (38 | 1.0%), Latin America (38 | 1.0%), Mexico (38 | 1.0%), and Canada (20 | 0.5%), together accounting for 3.5% of all Hardin residents.
| Immigration Origin | # Population | % Population |
| Canada | 20 | 0.5% |
| Central America | 38 | 1.0% |
| Latin America | 38 | 1.0% |
| Mexico | 38 | 1.0% | View All 4 Rows |
Sex and Age in Hardin
Sex and Age in Hardin
The most populous age groups in Hardin are 15 to 19 Years (217 | 12.6%) for men and 10 to 14 Years (248 | 11.9%) for women.
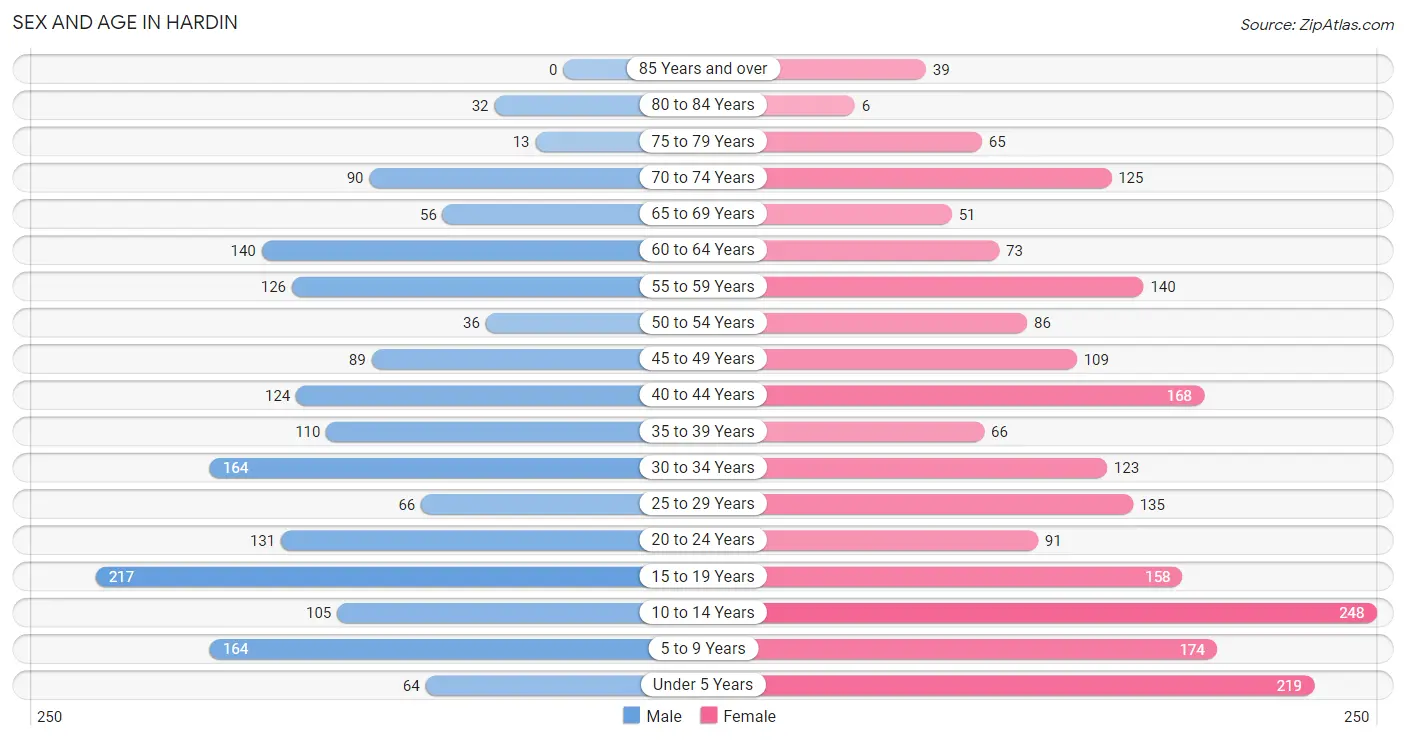
| Age Bracket | Male | Female |
| Under 5 Years | 64 (3.7%) | 219 (10.5%) |
| 5 to 9 Years | 164 (9.5%) | 174 (8.4%) |
| 10 to 14 Years | 105 (6.1%) | 248 (11.9%) |
| 15 to 19 Years | 217 (12.6%) | 158 (7.6%) |
| 20 to 24 Years | 131 (7.6%) | 91 (4.4%) |
| 25 to 29 Years | 66 (3.8%) | 135 (6.5%) |
| 30 to 34 Years | 164 (9.5%) | 123 (5.9%) |
| 35 to 39 Years | 110 (6.4%) | 66 (3.2%) |
| 40 to 44 Years | 124 (7.2%) | 168 (8.1%) |
| 45 to 49 Years | 89 (5.1%) | 109 (5.2%) |
| 50 to 54 Years | 36 (2.1%) | 86 (4.1%) |
| 55 to 59 Years | 126 (7.3%) | 140 (6.7%) |
| 60 to 64 Years | 140 (8.1%) | 73 (3.5%) |
| 65 to 69 Years | 56 (3.2%) | 51 (2.5%) |
| 70 to 74 Years | 90 (5.2%) | 125 (6.0%) |
| 75 to 79 Years | 13 (0.7%) | 65 (3.1%) |
| 80 to 84 Years | 32 (1.8%) | 6 (0.3%) |
| 85 Years and over | 0 (0.0%) | 39 (1.9%) |
| Total | 1,727 (100.0%) | 2,076 (100.0%) |
Families and Households in Hardin
Median Family Size in Hardin
The median family size in Hardin is 3.52 persons per family, with single male/father families (98 | 11.6%) accounting for the largest median family size of 3.98 persons per family. On the other hand, single female/mother families (165 | 19.5%) represent the smallest median family size with 3.25 persons per family.
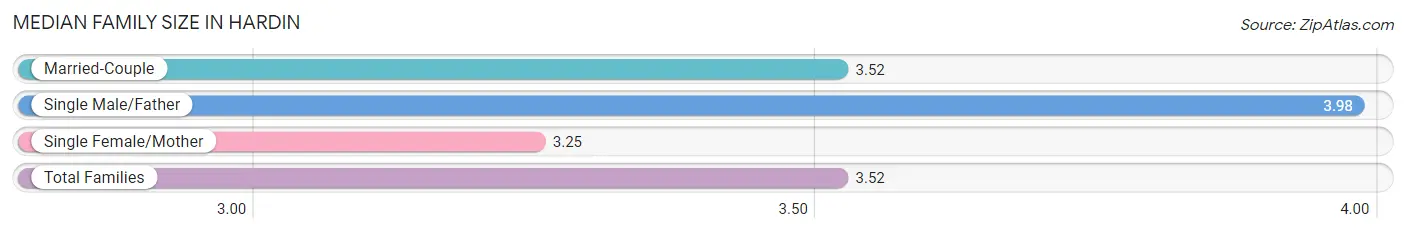
| Family Type | # Families | Family Size |
| Married-Couple | 584 (69.0%) | 3.52 |
| Single Male/Father | 98 (11.6%) | 3.98 |
| Single Female/Mother | 165 (19.5%) | 3.25 |
| Total Families | 847 (100.0%) | 3.52 |
Median Household Size in Hardin
The median household size in Hardin is 2.87 persons per household, with single male/father households (98 | 7.7%) accounting for the largest median household size of 4.94 persons per household. non-family households (430 | 33.7%) represent the smallest median household size with 1.22 persons per household.
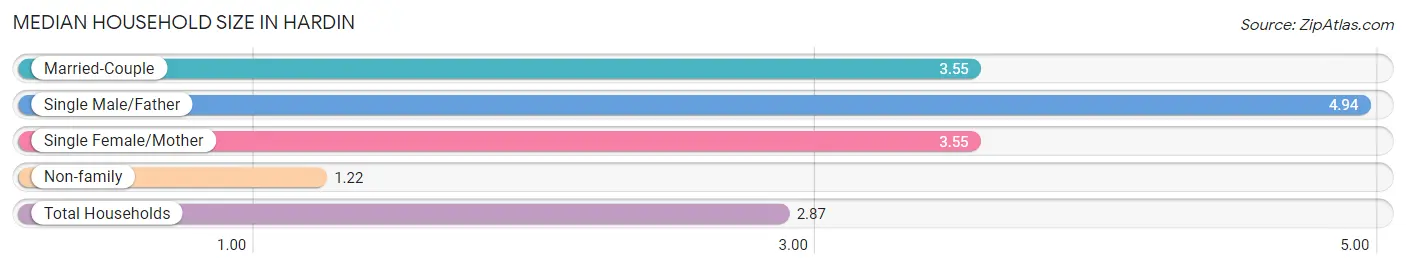
| Household Type | # Households | Household Size |
| Married-Couple | 584 (45.7%) | 3.55 |
| Single Male/Father | 98 (7.7%) | 4.94 |
| Single Female/Mother | 165 (12.9%) | 3.55 |
| Non-family | 430 (33.7%) | 1.22 |
| Total Households | 1,277 (100.0%) | 2.87 |
Household Size by Marriage Status in Hardin
Out of a total of 1,277 households in Hardin, 847 (66.3%) are family households, while 430 (33.7%) are nonfamily households. The most numerous type of family households are 2-person households, comprising 321, and the most common type of nonfamily households are 1-person households, comprising 340.
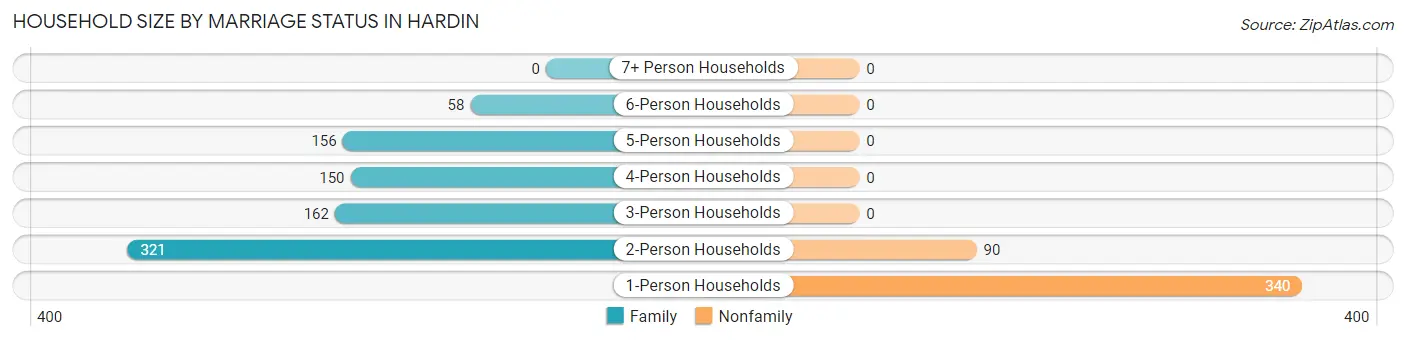
| Household Size | Family Households | Nonfamily Households |
| 1-Person Households | - | 340 (26.6%) |
| 2-Person Households | 321 (25.1%) | 90 (7.0%) |
| 3-Person Households | 162 (12.7%) | 0 (0.0%) |
| 4-Person Households | 150 (11.7%) | 0 (0.0%) |
| 5-Person Households | 156 (12.2%) | 0 (0.0%) |
| 6-Person Households | 58 (4.5%) | 0 (0.0%) |
| 7+ Person Households | 0 (0.0%) | 0 (0.0%) |
| Total | 847 (66.3%) | 430 (33.7%) |
Female Fertility in Hardin
Fertility by Age in Hardin
Average fertility rate in Hardin is 33.0 births per 1,000 women. Women in the age bracket of 20 to 34 years have the highest fertility rate with 83.0 births per 1,000 women. Women in the age bracket of 20 to 34 years acount for 100.0% of all women with births.
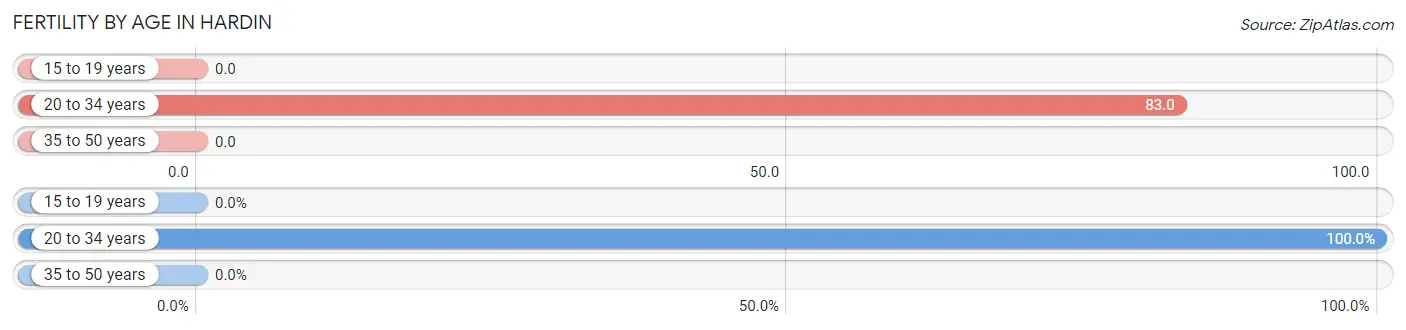
| Age Bracket | Women with Births | Births / 1,000 Women |
| 15 to 19 years | 0 (0.0%) | 0.0 |
| 20 to 34 years | 29 (100.0%) | 83.0 |
| 35 to 50 years | 0 (0.0%) | 0.0 |
| Total | 29 (100.0%) | 33.0 |
Fertility by Age by Marriage Status in Hardin
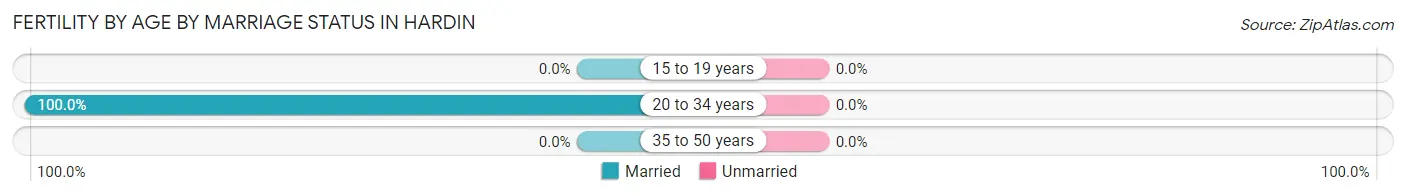
| Age Bracket | Married | Unmarried |
| 15 to 19 years | 0 (0.0%) | 0 (0.0%) |
| 20 to 34 years | 29 (100.0%) | 0 (0.0%) |
| 35 to 50 years | 0 (0.0%) | 0 (0.0%) |
| Total | 29 (100.0%) | 0 (0.0%) |
Fertility by Education in Hardin
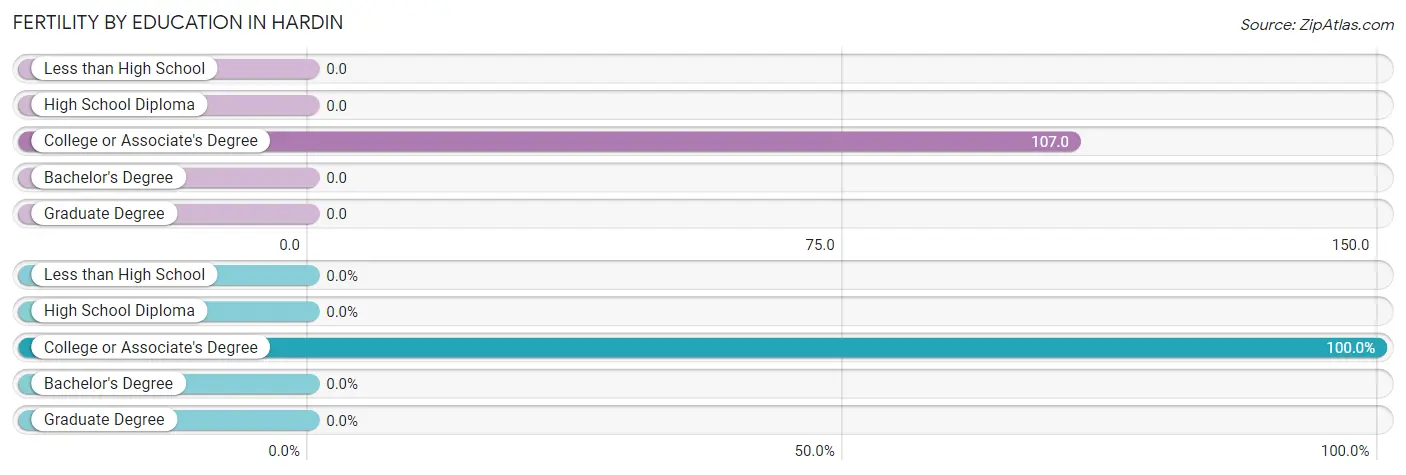
| Educational Attainment | Women with Births | Births / 1,000 Women |
| Less than High School | 0 (0.0%) | 0.0 |
| High School Diploma | 0 (0.0%) | 0.0 |
| College or Associate's Degree | 29 (100.0%) | 107.0 |
| Bachelor's Degree | 0 (0.0%) | 0.0 |
| Graduate Degree | 0 (0.0%) | 0.0 |
| Total | 29 (100.0%) | 33.0 |
Fertility by Education by Marriage Status in Hardin
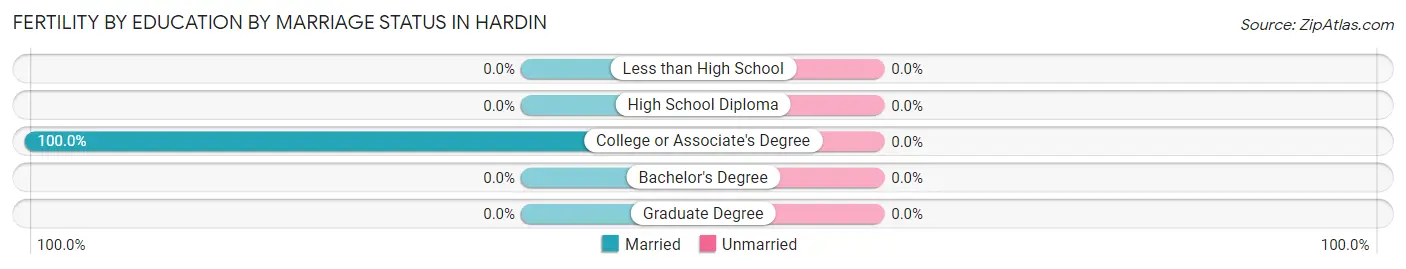
| Educational Attainment | Married | Unmarried |
| Less than High School | 0 (0.0%) | 0 (0.0%) |
| High School Diploma | 0 (0.0%) | 0 (0.0%) |
| College or Associate's Degree | 29 (100.0%) | 0 (0.0%) |
| Bachelor's Degree | 0 (0.0%) | 0 (0.0%) |
| Graduate Degree | 0 (0.0%) | 0 (0.0%) |
| Total | 29 (100.0%) | 0 (0.0%) |
Employment Characteristics in Hardin
Employment by Class of Employer in Hardin
Among the 1,672 employed individuals in Hardin, private company employees (829 | 49.6%), local government employees (364 | 21.8%), and not-for-profit organizations (185 | 11.1%) make up the most common classes of employment.
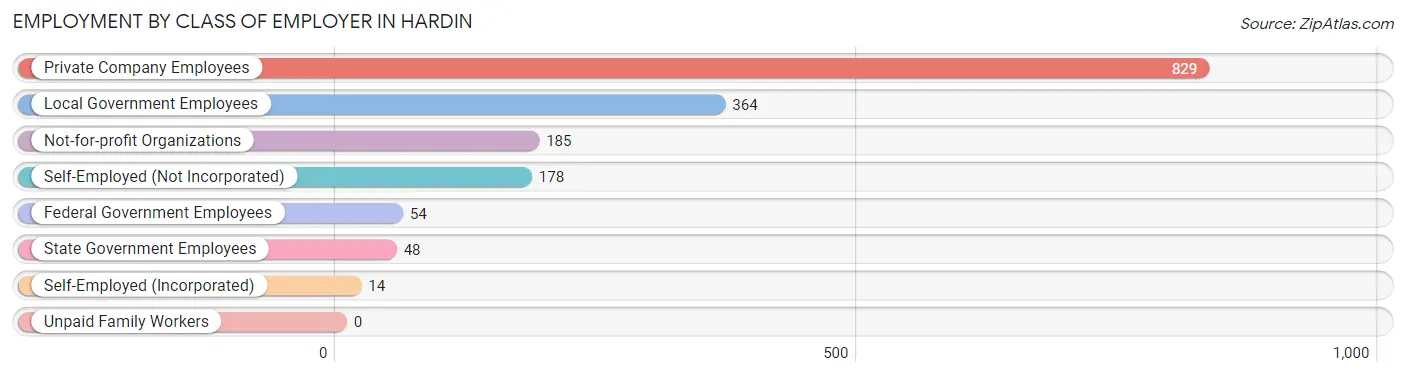
| Employer Class | # Employees | % Employees |
| Private Company Employees | 829 | 49.6% |
| Self-Employed (Incorporated) | 14 | 0.8% |
| Self-Employed (Not Incorporated) | 178 | 10.6% |
| Not-for-profit Organizations | 185 | 11.1% |
| Local Government Employees | 364 | 21.8% |
| State Government Employees | 48 | 2.9% |
| Federal Government Employees | 54 | 3.2% |
| Unpaid Family Workers | 0 | 0.0% |
| Total | 1,672 | 100.0% |
Employment Status by Age in Hardin
According to the labor force statistics for Hardin, out of the total population over 16 years of age (2,769), 68.9% or 1,908 individuals are in the labor force, with 11.5% or 219 of them unemployed. The age group with the highest labor force participation rate is 45 to 54 years, with 90.6% or 290 individuals in the labor force. Within the labor force, the 16 to 19 years age range has the highest percentage of unemployed individuals, with 59.4% or 120 of them being unemployed.
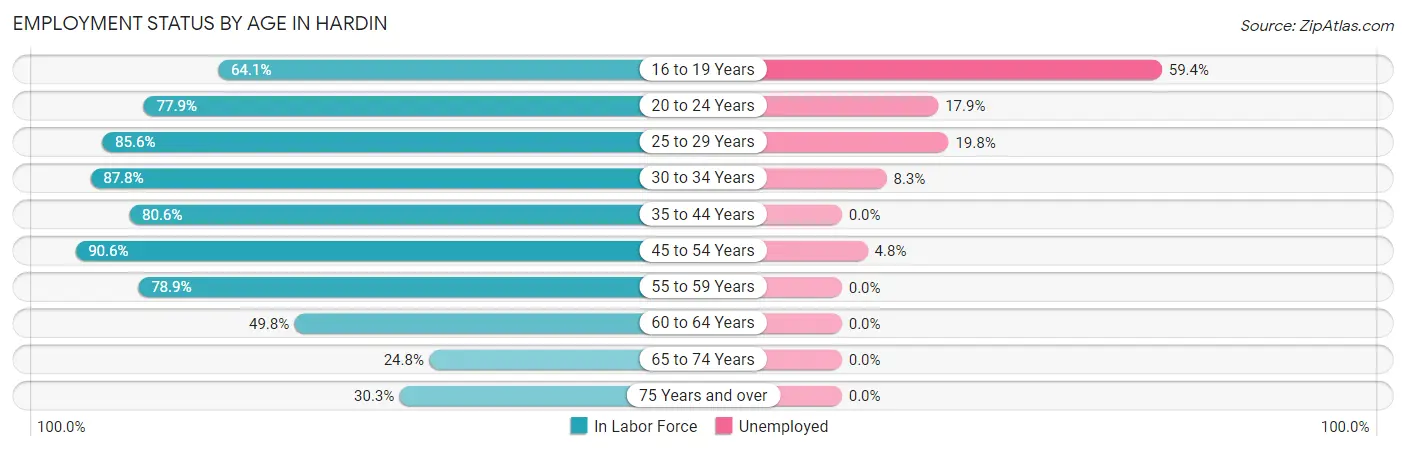
| Age Bracket | In Labor Force | Unemployed |
| 16 to 19 Years | 202 (64.1%) | 120 (59.4%) |
| 20 to 24 Years | 173 (77.9%) | 31 (17.9%) |
| 25 to 29 Years | 172 (85.6%) | 34 (19.8%) |
| 30 to 34 Years | 252 (87.8%) | 21 (8.3%) |
| 35 to 44 Years | 377 (80.6%) | 0 (0.0%) |
| 45 to 54 Years | 290 (90.6%) | 14 (4.8%) |
| 55 to 59 Years | 210 (78.9%) | 0 (0.0%) |
| 60 to 64 Years | 106 (49.8%) | 0 (0.0%) |
| 65 to 74 Years | 80 (24.8%) | 0 (0.0%) |
| 75 Years and over | 47 (30.3%) | 0 (0.0%) |
| Total | 1,908 (68.9%) | 219 (11.5%) |
Employment Status by Educational Attainment in Hardin
According to labor force statistics for Hardin, 80.2% of individuals (1,408) out of the total population between 25 and 64 years of age (1,755) are in the labor force, with 4.9% or 69 of them being unemployed. The group with the highest labor force participation rate are those with the educational attainment of college / associate degree, with 98.3% or 460 individuals in the labor force. Within the labor force, individuals with high school diploma education have the highest percentage of unemployment, with 7.6% or 34 of them being unemployed.
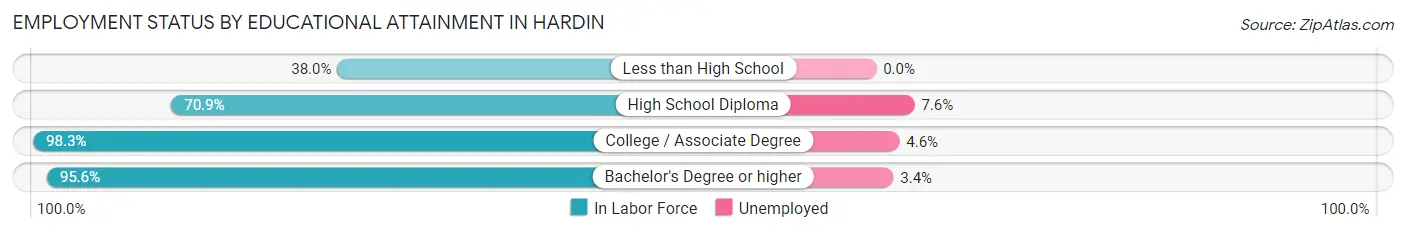
| Educational Attainment | In Labor Force | Unemployed |
| Less than High School | 84 (38.0%) | 0 (0.0%) |
| High School Diploma | 449 (70.9%) | 48 (7.6%) |
| College / Associate Degree | 460 (98.3%) | 22 (4.6%) |
| Bachelor's Degree or higher | 414 (95.6%) | 15 (3.4%) |
| Total | 1,408 (80.2%) | 86 (4.9%) |
Employment Occupations by Sex in Hardin
Management, Business, Science and Arts Occupations
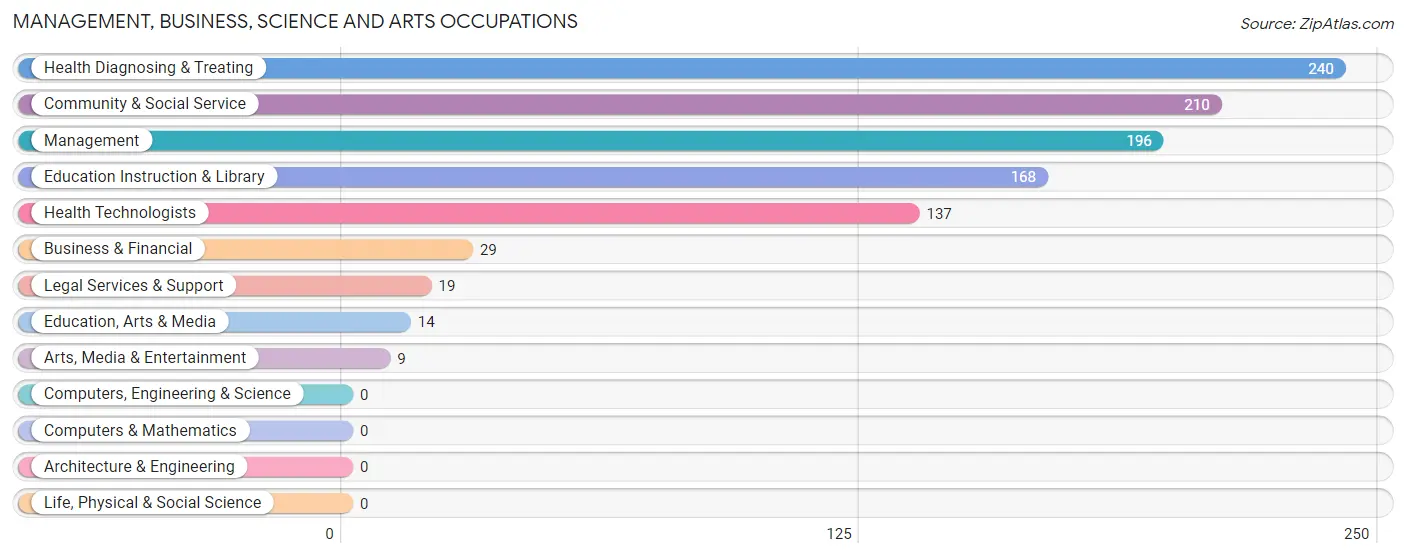
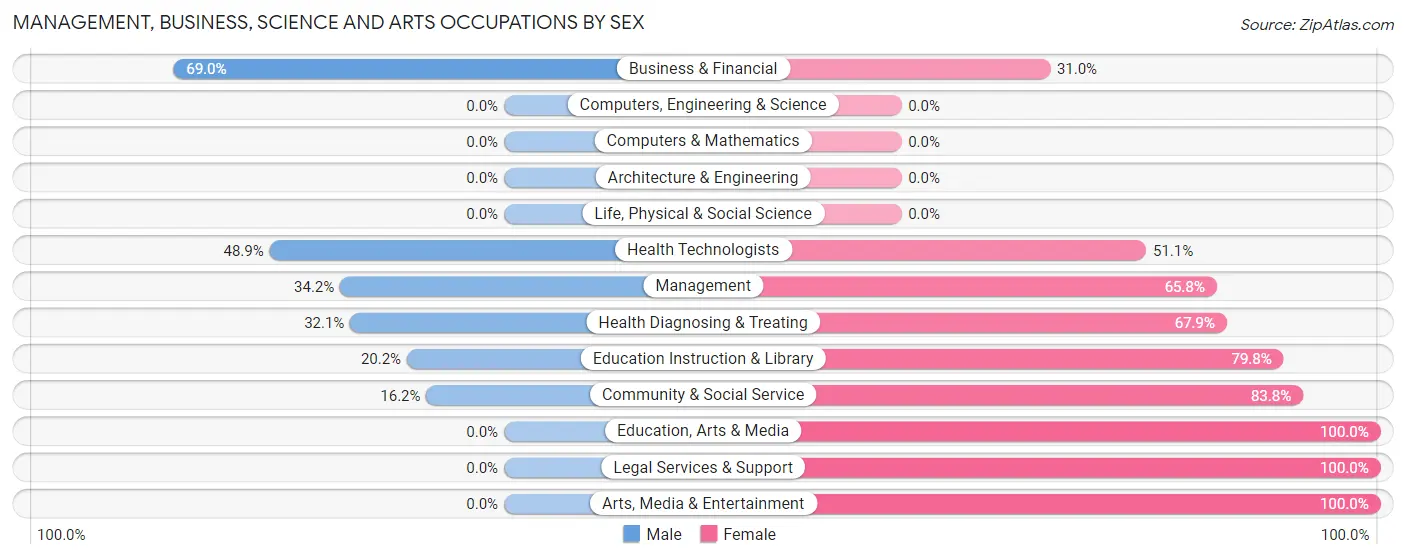
The most common Management, Business, Science and Arts occupations in Hardin are Health Diagnosing & Treating (240 | 14.2%), Community & Social Service (210 | 12.4%), Management (196 | 11.6%), Education Instruction & Library (168 | 10.0%), and Health Technologists (137 | 8.1%).
Management, Business, Science and Arts Occupations by Sex
Within the Management, Business, Science and Arts occupations in Hardin, the most male-oriented occupations are Business & Financial (69.0%), Health Technologists (48.9%), and Management (34.2%), while the most female-oriented occupations are Education, Arts & Media (100.0%), Legal Services & Support (100.0%), and Arts, Media & Entertainment (100.0%).
| Occupation | Male | Female |
| Management | 67 (34.2%) | 129 (65.8%) |
| Business & Financial | 20 (69.0%) | 9 (31.0%) |
| Computers, Engineering & Science | 0 (0.0%) | 0 (0.0%) |
| Computers & Mathematics | 0 (0.0%) | 0 (0.0%) |
| Architecture & Engineering | 0 (0.0%) | 0 (0.0%) |
| Life, Physical & Social Science | 0 (0.0%) | 0 (0.0%) |
| Community & Social Service | 34 (16.2%) | 176 (83.8%) |
| Education, Arts & Media | 0 (0.0%) | 14 (100.0%) |
| Legal Services & Support | 0 (0.0%) | 19 (100.0%) |
| Education Instruction & Library | 34 (20.2%) | 134 (79.8%) |
| Arts, Media & Entertainment | 0 (0.0%) | 9 (100.0%) |
| Health Diagnosing & Treating | 77 (32.1%) | 163 (67.9%) |
| Health Technologists | 67 (48.9%) | 70 (51.1%) |
| Total (Category) | 198 (29.3%) | 477 (70.7%) |
| Total (Overall) | 801 (47.4%) | 888 (52.6%) |
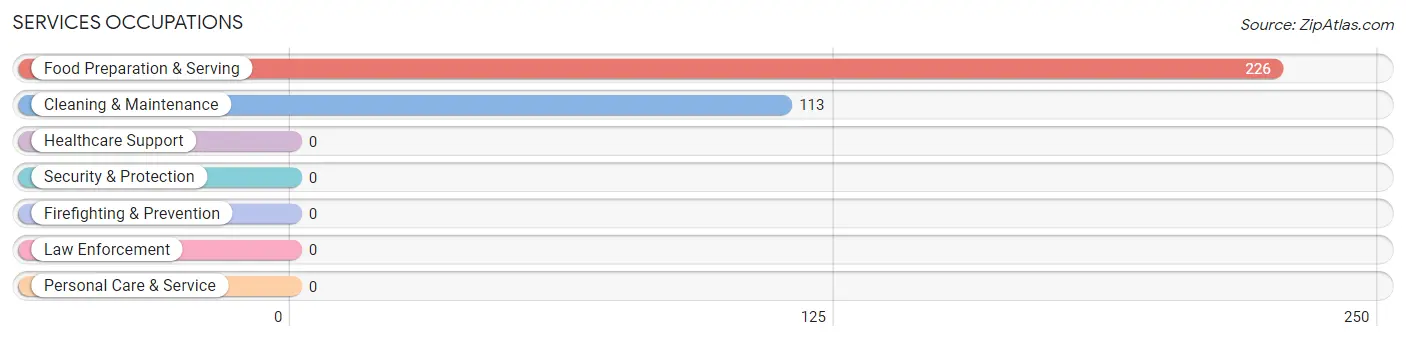
Services Occupations
The most common Services occupations in Hardin are Food Preparation & Serving (226 | 13.4%), and Cleaning & Maintenance (113 | 6.7%).
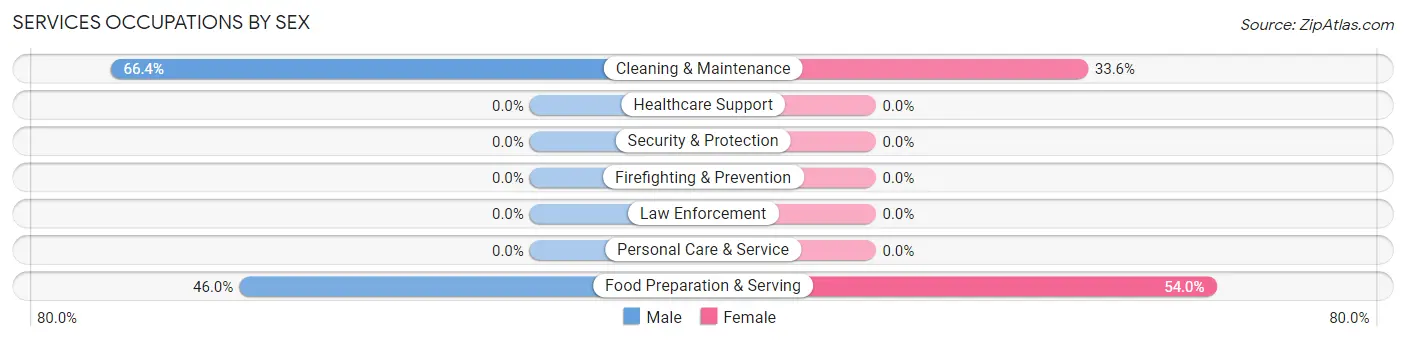
Services Occupations by Sex
Within the Services occupations in Hardin, the most male-oriented occupations are Cleaning & Maintenance (66.4%), and Food Preparation & Serving (46.0%), while the most female-oriented occupations are Food Preparation & Serving (54.0%), and Cleaning & Maintenance (33.6%).
| Occupation | Male | Female |
| Healthcare Support | 0 (0.0%) | 0 (0.0%) |
| Security & Protection | 0 (0.0%) | 0 (0.0%) |
| Firefighting & Prevention | 0 (0.0%) | 0 (0.0%) |
| Law Enforcement | 0 (0.0%) | 0 (0.0%) |
| Food Preparation & Serving | 104 (46.0%) | 122 (54.0%) |
| Cleaning & Maintenance | 75 (66.4%) | 38 (33.6%) |
| Personal Care & Service | 0 (0.0%) | 0 (0.0%) |
| Total (Category) | 179 (52.8%) | 160 (47.2%) |
| Total (Overall) | 801 (47.4%) | 888 (52.6%) |
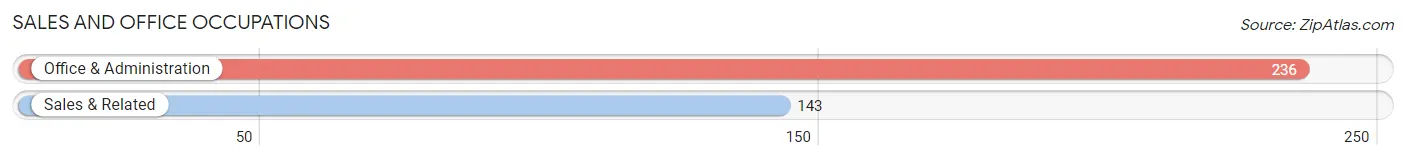
Sales and Office Occupations
The most common Sales and Office occupations in Hardin are Office & Administration (236 | 14.0%), and Sales & Related (143 | 8.5%).
Sales and Office Occupations by Sex
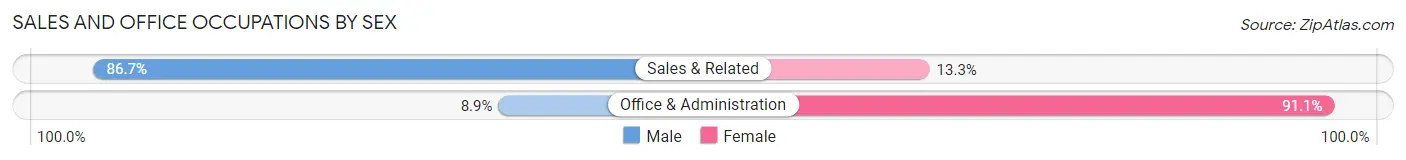
| Occupation | Male | Female |
| Sales & Related | 124 (86.7%) | 19 (13.3%) |
| Office & Administration | 21 (8.9%) | 215 (91.1%) |
| Total (Category) | 145 (38.3%) | 234 (61.7%) |
| Total (Overall) | 801 (47.4%) | 888 (52.6%) |
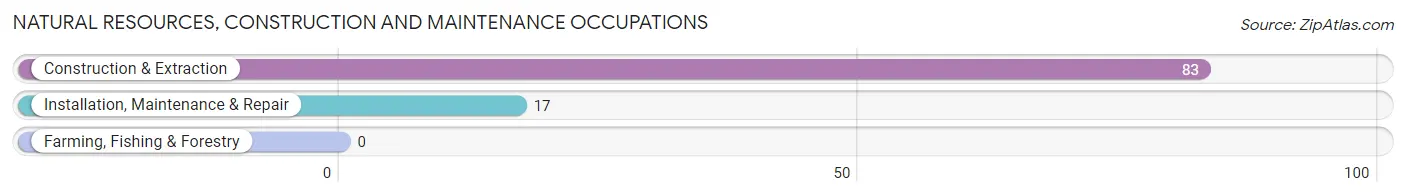
Natural Resources, Construction and Maintenance Occupations
The most common Natural Resources, Construction and Maintenance occupations in Hardin are Construction & Extraction (83 | 4.9%), and Installation, Maintenance & Repair (17 | 1.0%).
Natural Resources, Construction and Maintenance Occupations by Sex
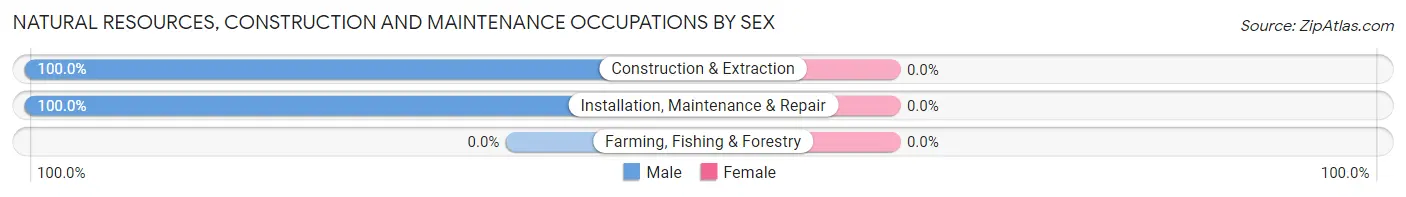
| Occupation | Male | Female |
| Farming, Fishing & Forestry | 0 (0.0%) | 0 (0.0%) |
| Construction & Extraction | 83 (100.0%) | 0 (0.0%) |
| Installation, Maintenance & Repair | 17 (100.0%) | 0 (0.0%) |
| Total (Category) | 100 (100.0%) | 0 (0.0%) |
| Total (Overall) | 801 (47.4%) | 888 (52.6%) |
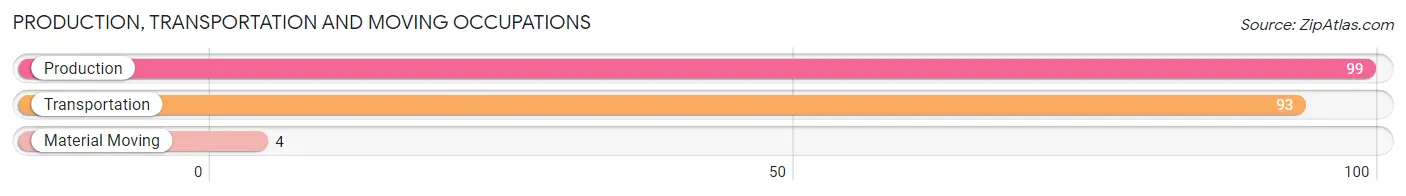
Production, Transportation and Moving Occupations
The most common Production, Transportation and Moving occupations in Hardin are Production (99 | 5.9%), Transportation (93 | 5.5%), and Material Moving (4 | 0.2%).
Production, Transportation and Moving Occupations by Sex
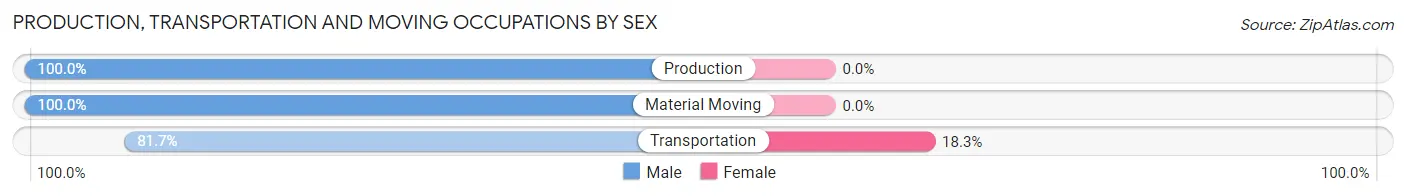
| Occupation | Male | Female |
| Production | 99 (100.0%) | 0 (0.0%) |
| Transportation | 76 (81.7%) | 17 (18.3%) |
| Material Moving | 4 (100.0%) | 0 (0.0%) |
| Total (Category) | 179 (91.3%) | 17 (8.7%) |
| Total (Overall) | 801 (47.4%) | 888 (52.6%) |
Employment Industries by Sex in Hardin
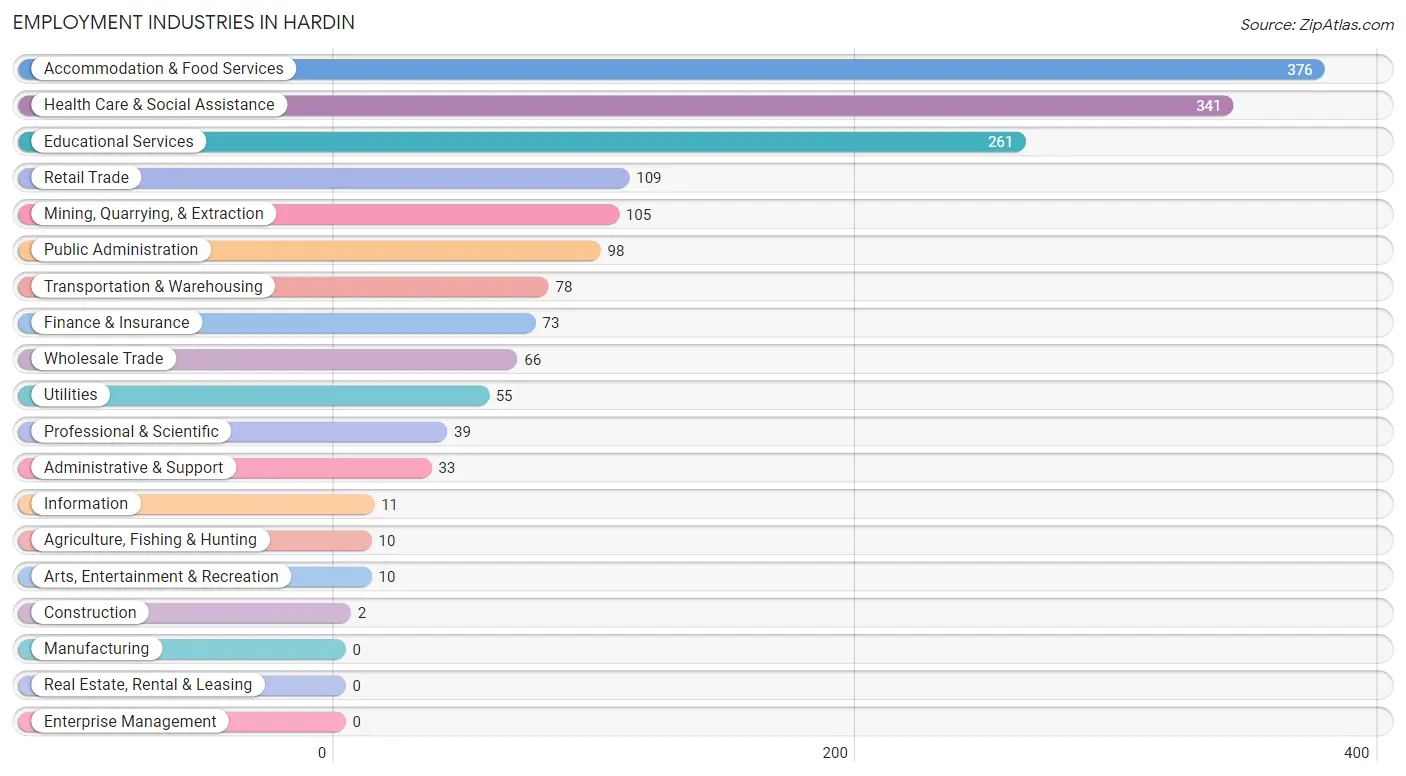
Employment Industries in Hardin
The major employment industries in Hardin include Accommodation & Food Services (376 | 22.3%), Health Care & Social Assistance (341 | 20.2%), Educational Services (261 | 15.4%), Retail Trade (109 | 6.5%), and Mining, Quarrying, & Extraction (105 | 6.2%).
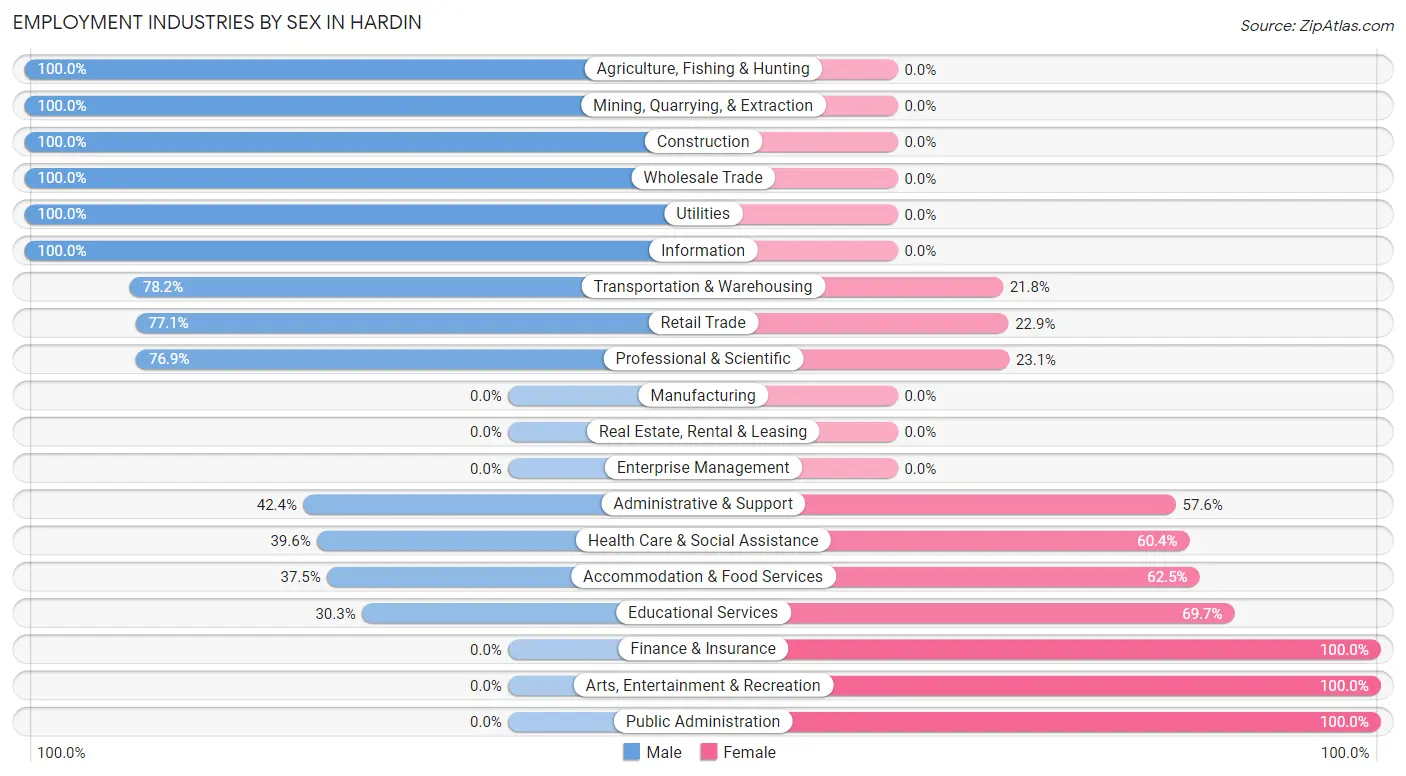
Employment Industries by Sex in Hardin
The Hardin industries that see more men than women are Agriculture, Fishing & Hunting (100.0%), Mining, Quarrying, & Extraction (100.0%), and Construction (100.0%), whereas the industries that tend to have a higher number of women are Finance & Insurance (100.0%), Arts, Entertainment & Recreation (100.0%), and Public Administration (100.0%).
| Industry | Male | Female |
| Agriculture, Fishing & Hunting | 10 (100.0%) | 0 (0.0%) |
| Mining, Quarrying, & Extraction | 105 (100.0%) | 0 (0.0%) |
| Construction | 2 (100.0%) | 0 (0.0%) |
| Manufacturing | 0 (0.0%) | 0 (0.0%) |
| Wholesale Trade | 66 (100.0%) | 0 (0.0%) |
| Retail Trade | 84 (77.1%) | 25 (22.9%) |
| Transportation & Warehousing | 61 (78.2%) | 17 (21.8%) |
| Utilities | 55 (100.0%) | 0 (0.0%) |
| Information | 11 (100.0%) | 0 (0.0%) |
| Finance & Insurance | 0 (0.0%) | 73 (100.0%) |
| Real Estate, Rental & Leasing | 0 (0.0%) | 0 (0.0%) |
| Professional & Scientific | 30 (76.9%) | 9 (23.1%) |
| Enterprise Management | 0 (0.0%) | 0 (0.0%) |
| Administrative & Support | 14 (42.4%) | 19 (57.6%) |
| Educational Services | 79 (30.3%) | 182 (69.7%) |
| Health Care & Social Assistance | 135 (39.6%) | 206 (60.4%) |
| Arts, Entertainment & Recreation | 0 (0.0%) | 10 (100.0%) |
| Accommodation & Food Services | 141 (37.5%) | 235 (62.5%) |
| Public Administration | 0 (0.0%) | 98 (100.0%) |
| Total | 801 (47.4%) | 888 (52.6%) |
Education in Hardin
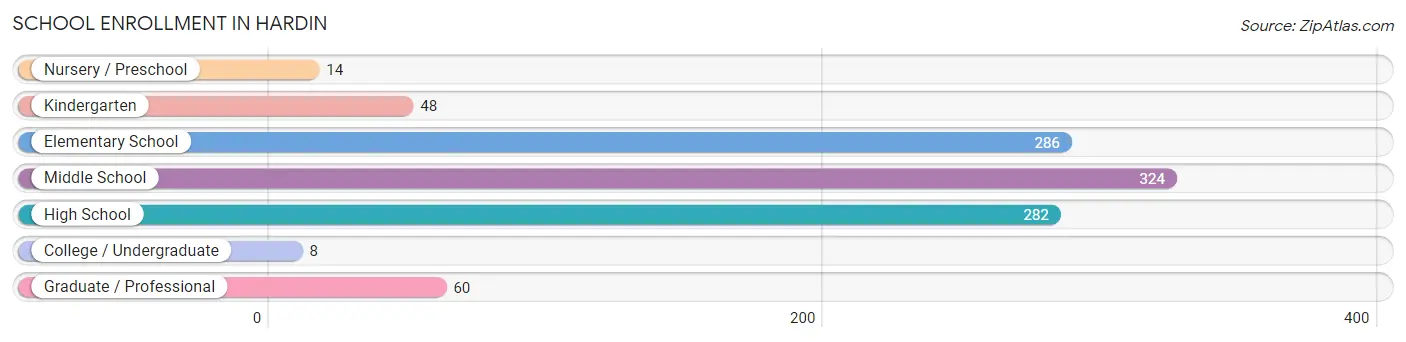
School Enrollment in Hardin
The most common levels of schooling among the 1,022 students in Hardin are middle school (324 | 31.7%), elementary school (286 | 28.0%), and high school (282 | 27.6%).
| School Level | # Students | % Students |
| Nursery / Preschool | 14 | 1.4% |
| Kindergarten | 48 | 4.7% |
| Elementary School | 286 | 28.0% |
| Middle School | 324 | 31.7% |
| High School | 282 | 27.6% |
| College / Undergraduate | 8 | 0.8% |
| Graduate / Professional | 60 | 5.9% |
| Total | 1,022 | 100.0% |
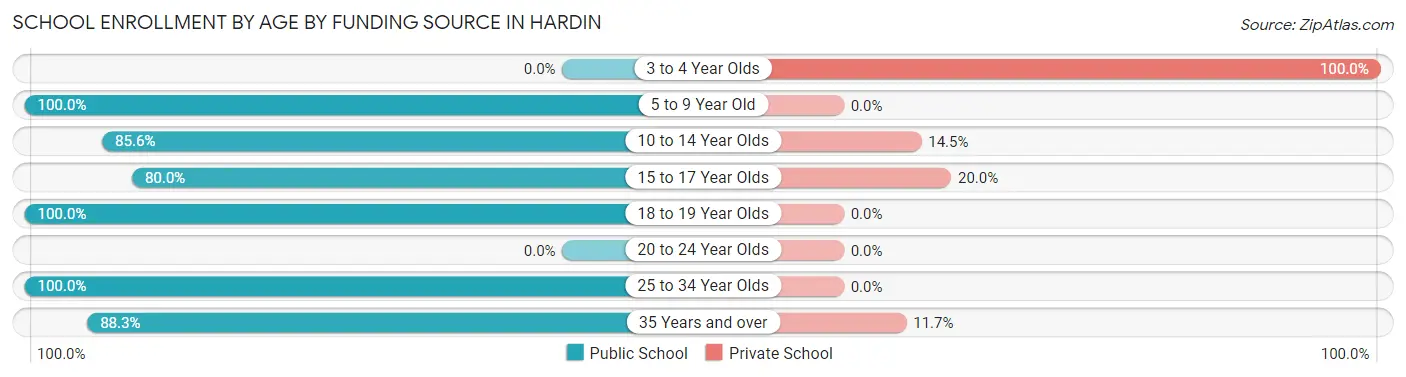
School Enrollment by Age by Funding Source in Hardin
Out of a total of 1,022 students who are enrolled in schools in Hardin, 106 (10.4%) attend a private institution, while the remaining 916 (89.6%) are enrolled in public schools. The age group of 3 to 4 year olds has the highest likelihood of being enrolled in private schools, with 14 (100.0% in the age bracket) enrolled. Conversely, the age group of 5 to 9 year old has the lowest likelihood of being enrolled in a private school, with 317 (100.0% in the age bracket) attending a public institution.
| Age Bracket | Public School | Private School |
| 3 to 4 Year Olds | 0 (0.0%) | 14 (100.0%) |
| 5 to 9 Year Old | 317 (100.0%) | 0 (0.0%) |
| 10 to 14 Year Olds | 302 (85.6%) | 51 (14.4%) |
| 15 to 17 Year Olds | 136 (80.0%) | 34 (20.0%) |
| 18 to 19 Year Olds | 96 (100.0%) | 0 (0.0%) |
| 20 to 24 Year Olds | 0 (0.0%) | 0 (0.0%) |
| 25 to 34 Year Olds | 12 (100.0%) | 0 (0.0%) |
| 35 Years and over | 53 (88.3%) | 7 (11.7%) |
| Total | 916 (89.6%) | 106 (10.4%) |
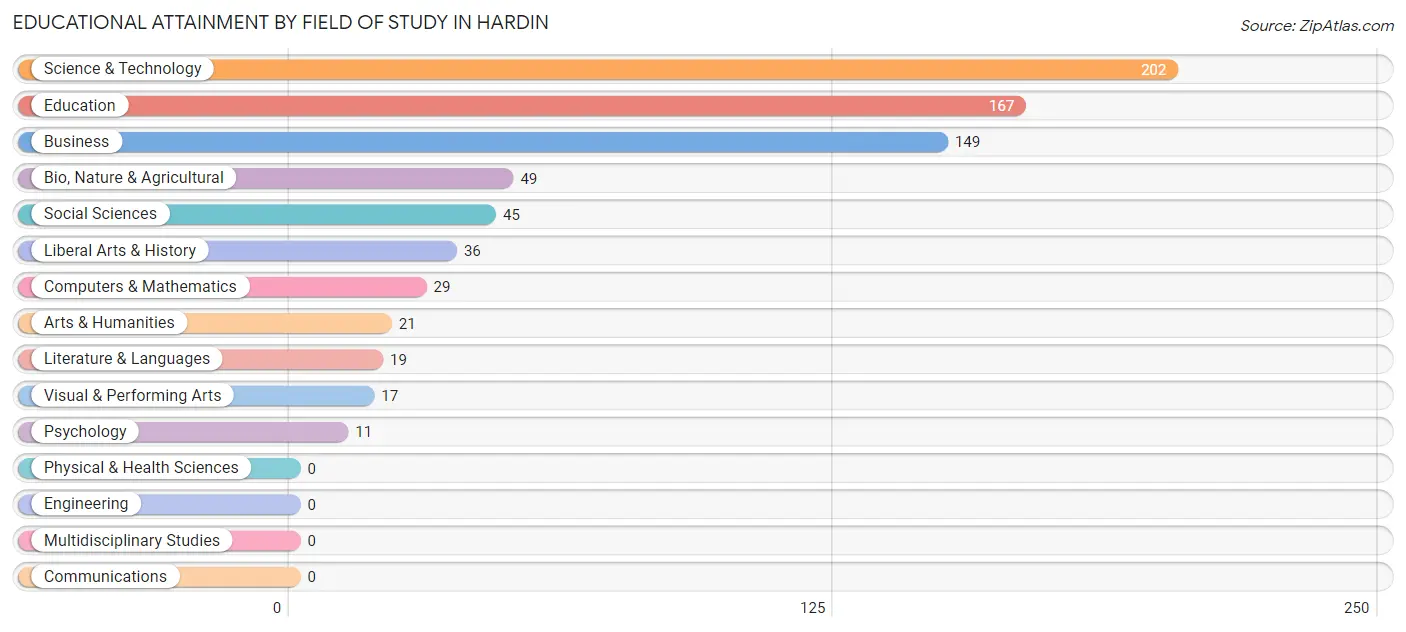
Educational Attainment by Field of Study in Hardin
Science & technology (202 | 27.1%), education (167 | 22.4%), business (149 | 20.0%), bio, nature & agricultural (49 | 6.6%), and social sciences (45 | 6.0%) are the most common fields of study among 745 individuals in Hardin who have obtained a bachelor's degree or higher.
| Field of Study | # Graduates | % Graduates |
| Computers & Mathematics | 29 | 3.9% |
| Bio, Nature & Agricultural | 49 | 6.6% |
| Physical & Health Sciences | 0 | 0.0% |
| Psychology | 11 | 1.5% |
| Social Sciences | 45 | 6.0% |
| Engineering | 0 | 0.0% |
| Multidisciplinary Studies | 0 | 0.0% |
| Science & Technology | 202 | 27.1% |
| Business | 149 | 20.0% |
| Education | 167 | 22.4% |
| Literature & Languages | 19 | 2.5% |
| Liberal Arts & History | 36 | 4.8% |
| Visual & Performing Arts | 17 | 2.3% |
| Communications | 0 | 0.0% |
| Arts & Humanities | 21 | 2.8% |
| Total | 745 | 100.0% |
Transportation & Commute in Hardin
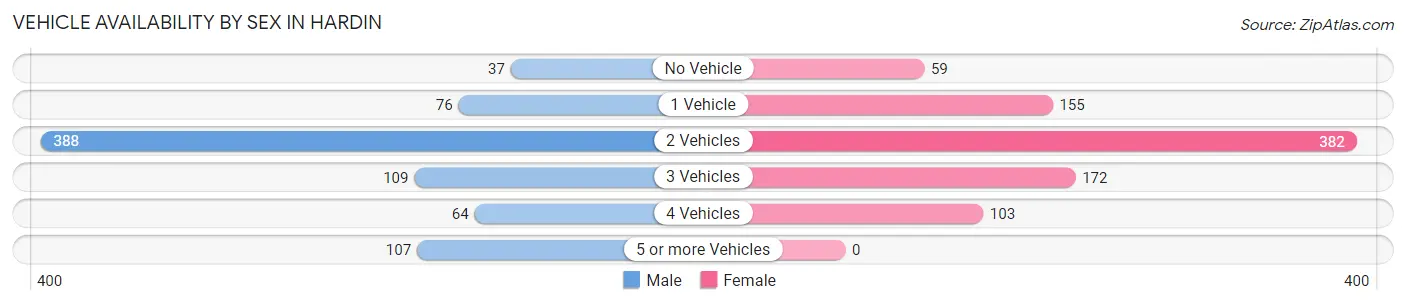
Vehicle Availability by Sex in Hardin
The most prevalent vehicle ownership categories in Hardin are males with 2 vehicles (388, accounting for 49.7%) and females with 2 vehicles (382, making up 44.6%).
| Vehicles Available | Male | Female |
| No Vehicle | 37 (4.7%) | 59 (6.8%) |
| 1 Vehicle | 76 (9.7%) | 155 (17.8%) |
| 2 Vehicles | 388 (49.7%) | 382 (43.9%) |
| 3 Vehicles | 109 (14.0%) | 172 (19.8%) |
| 4 Vehicles | 64 (8.2%) | 103 (11.8%) |
| 5 or more Vehicles | 107 (13.7%) | 0 (0.0%) |
| Total | 781 (100.0%) | 871 (100.0%) |
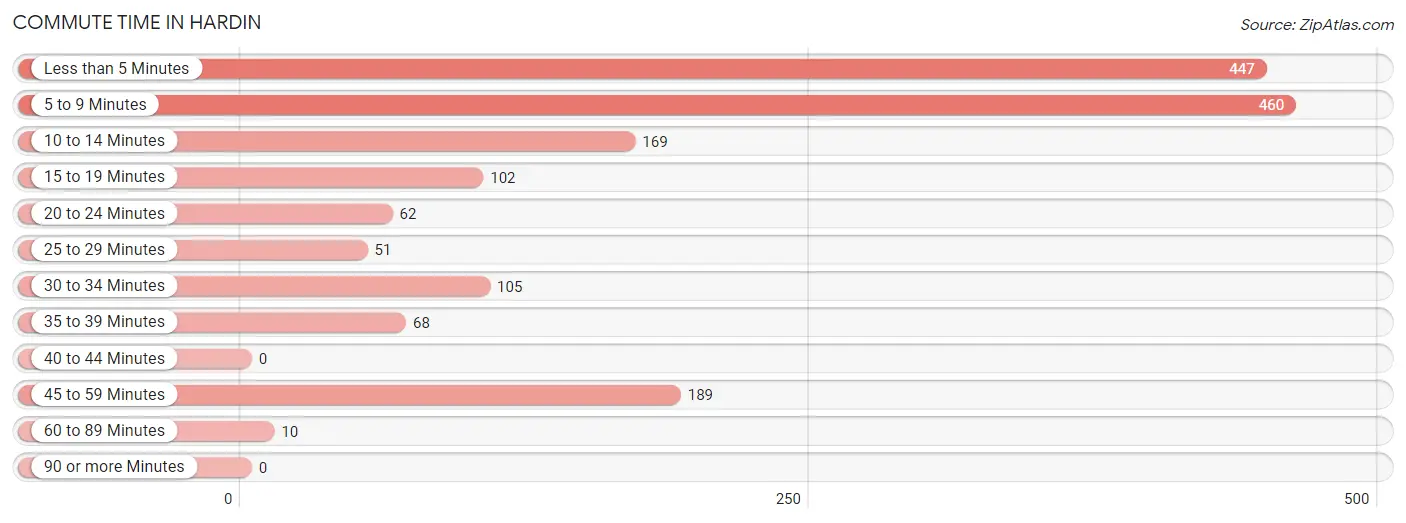
Commute Time in Hardin
The most frequently occuring commute durations in Hardin are 5 to 9 minutes (460 commuters, 27.7%), less than 5 minutes (447 commuters, 26.9%), and 45 to 59 minutes (189 commuters, 11.4%).
| Commute Time | # Commuters | % Commuters |
| Less than 5 Minutes | 447 | 26.9% |
| 5 to 9 Minutes | 460 | 27.7% |
| 10 to 14 Minutes | 169 | 10.2% |
| 15 to 19 Minutes | 102 | 6.1% |
| 20 to 24 Minutes | 62 | 3.7% |
| 25 to 29 Minutes | 51 | 3.1% |
| 30 to 34 Minutes | 105 | 6.3% |
| 35 to 39 Minutes | 68 | 4.1% |
| 40 to 44 Minutes | 0 | 0.0% |
| 45 to 59 Minutes | 189 | 11.4% |
| 60 to 89 Minutes | 10 | 0.6% |
| 90 or more Minutes | 0 | 0.0% |
Commute Time by Sex in Hardin
The most common commute times in Hardin are less than 5 minutes (219 commuters, 27.7%) for males and 5 to 9 minutes (273 commuters, 31.3%) for females.
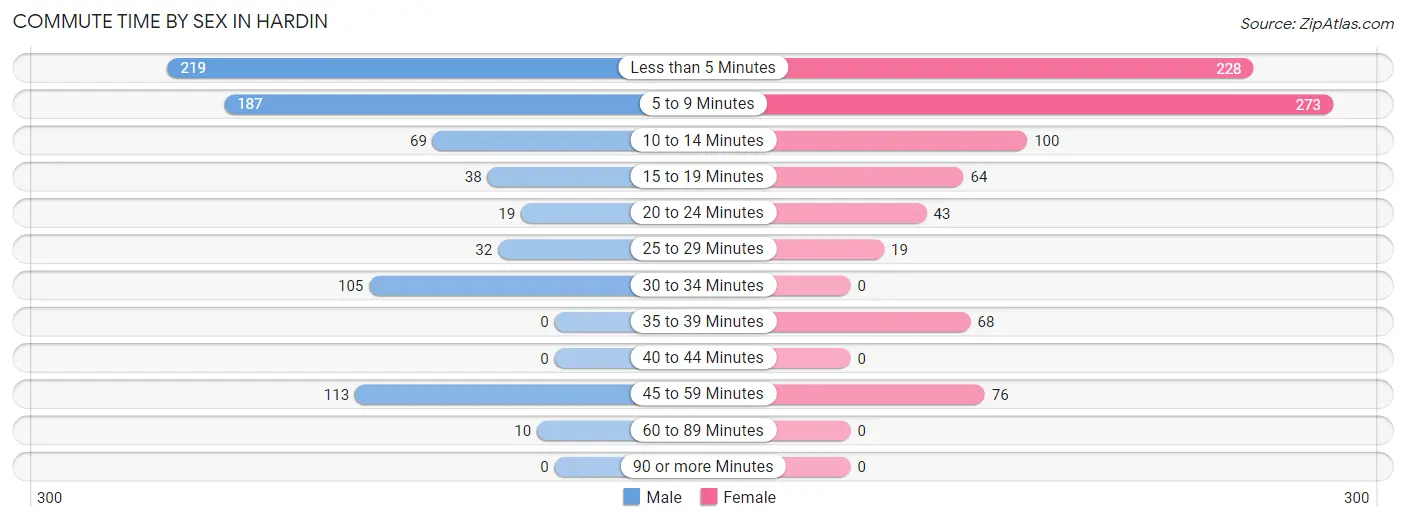
| Commute Time | Male | Female |
| Less than 5 Minutes | 219 (27.7%) | 228 (26.2%) |
| 5 to 9 Minutes | 187 (23.6%) | 273 (31.3%) |
| 10 to 14 Minutes | 69 (8.7%) | 100 (11.5%) |
| 15 to 19 Minutes | 38 (4.8%) | 64 (7.3%) |
| 20 to 24 Minutes | 19 (2.4%) | 43 (4.9%) |
| 25 to 29 Minutes | 32 (4.0%) | 19 (2.2%) |
| 30 to 34 Minutes | 105 (13.3%) | 0 (0.0%) |
| 35 to 39 Minutes | 0 (0.0%) | 68 (7.8%) |
| 40 to 44 Minutes | 0 (0.0%) | 0 (0.0%) |
| 45 to 59 Minutes | 113 (14.3%) | 76 (8.7%) |
| 60 to 89 Minutes | 10 (1.3%) | 0 (0.0%) |
| 90 or more Minutes | 0 (0.0%) | 0 (0.0%) |
Time of Departure to Work by Sex in Hardin
The most frequent times of departure to work in Hardin are 5:00 AM to 5:29 AM (115, 14.5%) for males and 7:30 AM to 7:59 AM (267, 30.6%) for females.
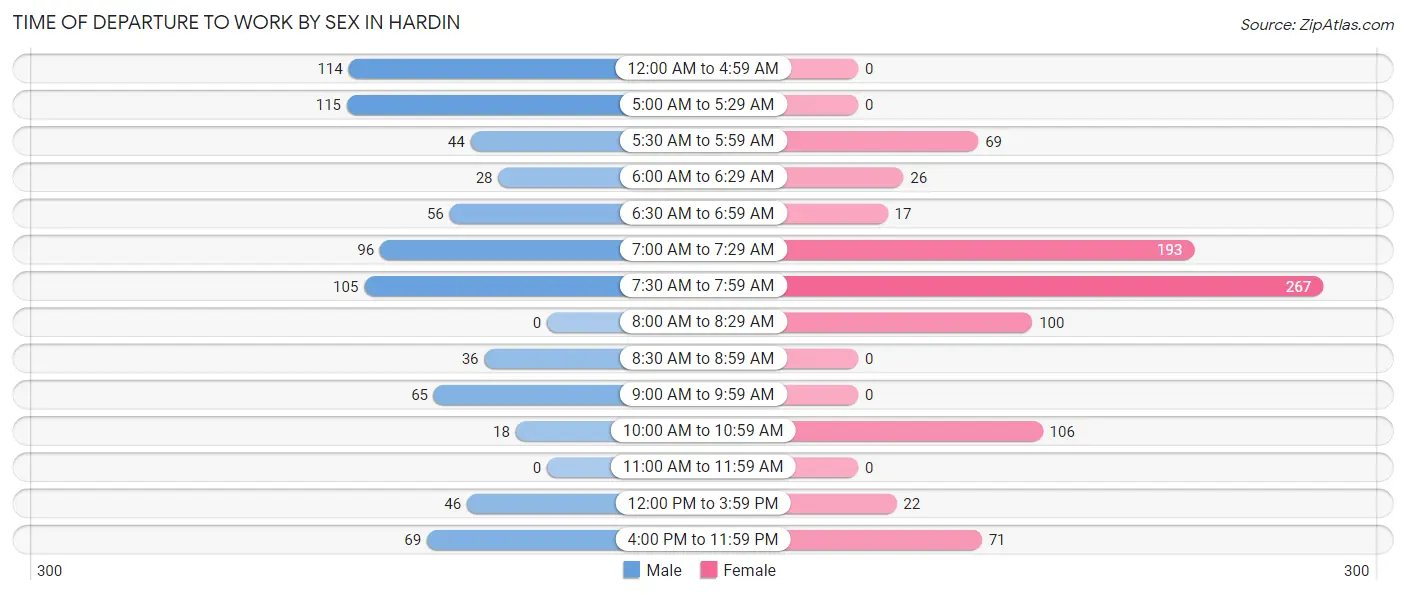
| Time of Departure | Male | Female |
| 12:00 AM to 4:59 AM | 114 (14.4%) | 0 (0.0%) |
| 5:00 AM to 5:29 AM | 115 (14.5%) | 0 (0.0%) |
| 5:30 AM to 5:59 AM | 44 (5.6%) | 69 (7.9%) |
| 6:00 AM to 6:29 AM | 28 (3.5%) | 26 (3.0%) |
| 6:30 AM to 6:59 AM | 56 (7.1%) | 17 (1.9%) |
| 7:00 AM to 7:29 AM | 96 (12.1%) | 193 (22.2%) |
| 7:30 AM to 7:59 AM | 105 (13.3%) | 267 (30.6%) |
| 8:00 AM to 8:29 AM | 0 (0.0%) | 100 (11.5%) |
| 8:30 AM to 8:59 AM | 36 (4.5%) | 0 (0.0%) |
| 9:00 AM to 9:59 AM | 65 (8.2%) | 0 (0.0%) |
| 10:00 AM to 10:59 AM | 18 (2.3%) | 106 (12.2%) |
| 11:00 AM to 11:59 AM | 0 (0.0%) | 0 (0.0%) |
| 12:00 PM to 3:59 PM | 46 (5.8%) | 22 (2.5%) |
| 4:00 PM to 11:59 PM | 69 (8.7%) | 71 (8.2%) |
| Total | 792 (100.0%) | 871 (100.0%) |
Housing Occupancy in Hardin
Occupancy by Ownership in Hardin
Of the total 1,277 dwellings in Hardin, owner-occupied units account for 722 (56.5%), while renter-occupied units make up 555 (43.5%).
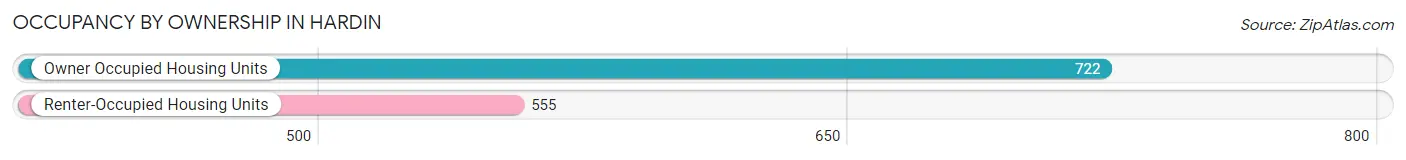
| Occupancy | # Housing Units | % Housing Units |
| Owner Occupied Housing Units | 722 | 56.5% |
| Renter-Occupied Housing Units | 555 | 43.5% |
| Total Occupied Housing Units | 1,277 | 100.0% |
Occupancy by Household Size in Hardin
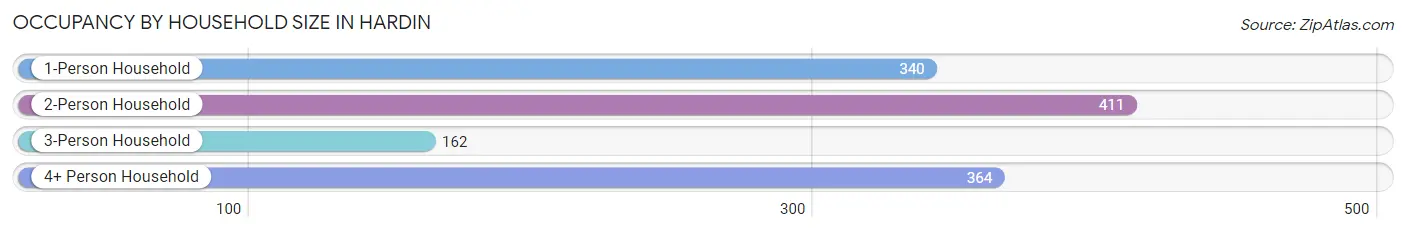
| Household Size | # Housing Units | % Housing Units |
| 1-Person Household | 340 | 26.6% |
| 2-Person Household | 411 | 32.2% |
| 3-Person Household | 162 | 12.7% |
| 4+ Person Household | 364 | 28.5% |
| Total Housing Units | 1,277 | 100.0% |
Occupancy by Ownership by Household Size in Hardin
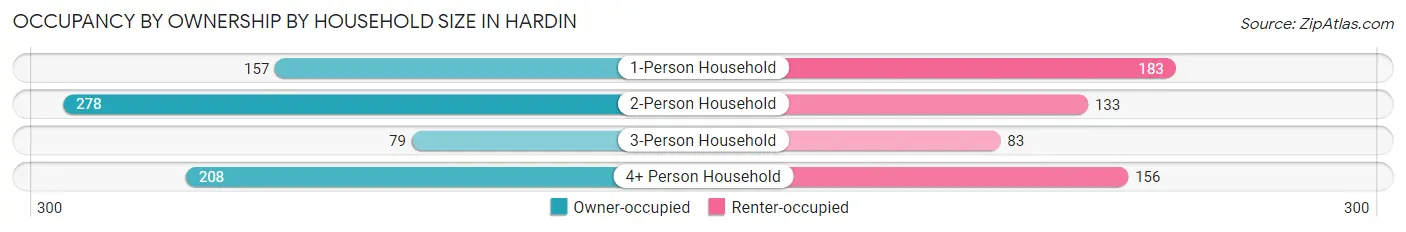
| Household Size | Owner-occupied | Renter-occupied |
| 1-Person Household | 157 (46.2%) | 183 (53.8%) |
| 2-Person Household | 278 (67.6%) | 133 (32.4%) |
| 3-Person Household | 79 (48.8%) | 83 (51.2%) |
| 4+ Person Household | 208 (57.1%) | 156 (42.9%) |
| Total Housing Units | 722 (56.5%) | 555 (43.5%) |
Occupancy by Educational Attainment in Hardin
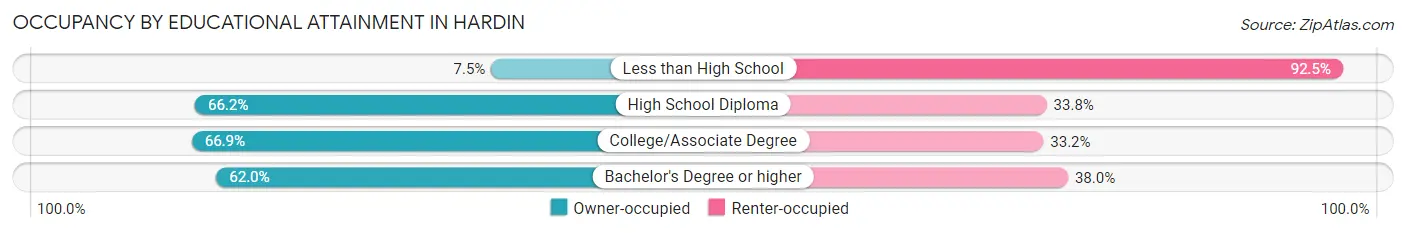
| Household Size | Owner-occupied | Renter-occupied |
| Less than High School | 14 (7.5%) | 173 (92.5%) |
| High School Diploma | 235 (66.2%) | 120 (33.8%) |
| College/Associate Degree | 240 (66.8%) | 119 (33.2%) |
| Bachelor's Degree or higher | 233 (62.0%) | 143 (38.0%) |
Occupancy by Age of Householder in Hardin
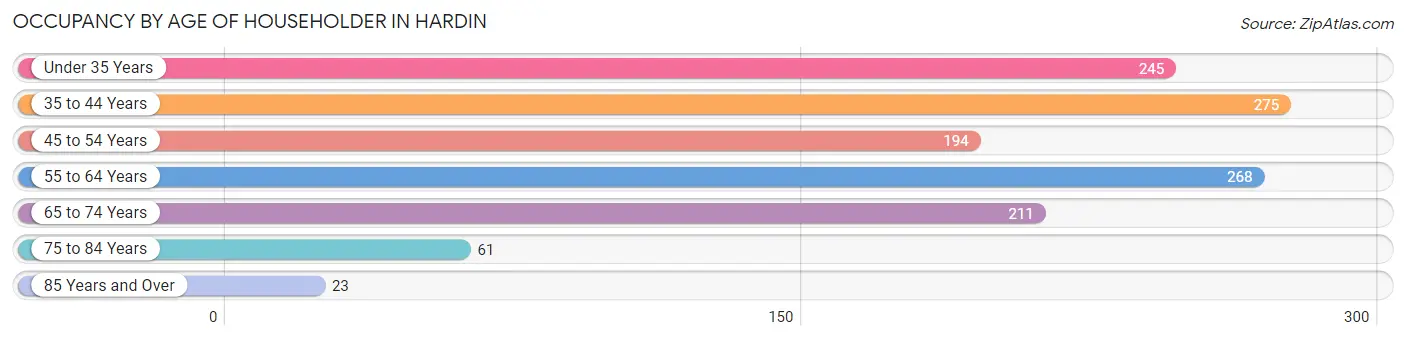
| Age Bracket | # Households | % Households |
| Under 35 Years | 245 | 19.2% |
| 35 to 44 Years | 275 | 21.5% |
| 45 to 54 Years | 194 | 15.2% |
| 55 to 64 Years | 268 | 21.0% |
| 65 to 74 Years | 211 | 16.5% |
| 75 to 84 Years | 61 | 4.8% |
| 85 Years and Over | 23 | 1.8% |
| Total | 1,277 | 100.0% |
Housing Finances in Hardin
Median Income by Occupancy in Hardin
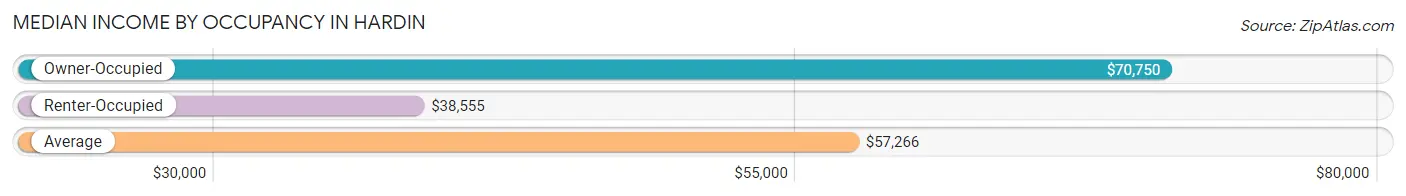
| Occupancy Type | # Households | Median Income |
| Owner-Occupied | 722 (56.5%) | $70,750 |
| Renter-Occupied | 555 (43.5%) | $38,555 |
| Average | 1,277 (100.0%) | $57,266 |
Occupancy by Householder Income Bracket in Hardin
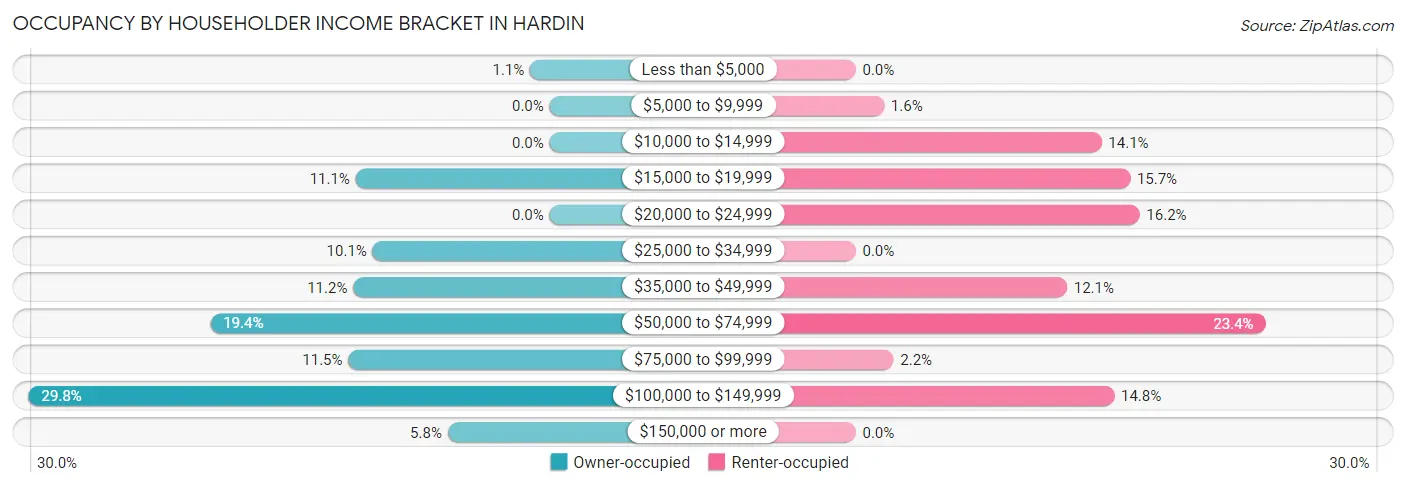
| Income Bracket | Owner-occupied | Renter-occupied |
| Less than $5,000 | 8 (1.1%) | 0 (0.0%) |
| $5,000 to $9,999 | 0 (0.0%) | 9 (1.6%) |
| $10,000 to $14,999 | 0 (0.0%) | 78 (14.1%) |
| $15,000 to $19,999 | 80 (11.1%) | 87 (15.7%) |
| $20,000 to $24,999 | 0 (0.0%) | 90 (16.2%) |
| $25,000 to $34,999 | 73 (10.1%) | 0 (0.0%) |
| $35,000 to $49,999 | 81 (11.2%) | 67 (12.1%) |
| $50,000 to $74,999 | 140 (19.4%) | 130 (23.4%) |
| $75,000 to $99,999 | 83 (11.5%) | 12 (2.2%) |
| $100,000 to $149,999 | 215 (29.8%) | 82 (14.8%) |
| $150,000 or more | 42 (5.8%) | 0 (0.0%) |
| Total | 722 (100.0%) | 555 (100.0%) |
Monthly Housing Cost Tiers in Hardin
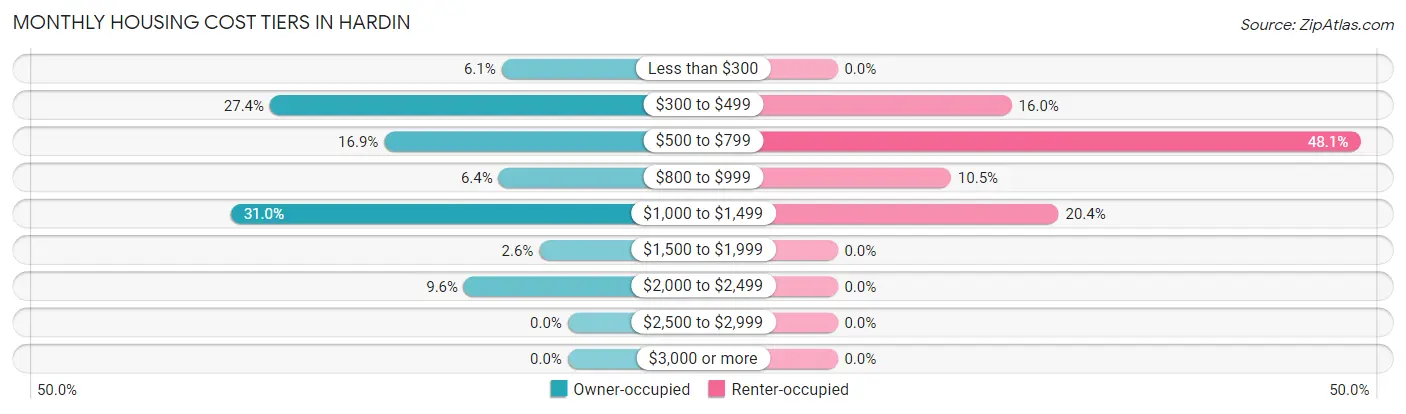
| Monthly Cost | Owner-occupied | Renter-occupied |
| Less than $300 | 44 (6.1%) | 0 (0.0%) |
| $300 to $499 | 198 (27.4%) | 89 (16.0%) |
| $500 to $799 | 122 (16.9%) | 267 (48.1%) |
| $800 to $999 | 46 (6.4%) | 58 (10.4%) |
| $1,000 to $1,499 | 224 (31.0%) | 113 (20.4%) |
| $1,500 to $1,999 | 19 (2.6%) | 0 (0.0%) |
| $2,000 to $2,499 | 69 (9.6%) | 0 (0.0%) |
| $2,500 to $2,999 | 0 (0.0%) | 0 (0.0%) |
| $3,000 or more | 0 (0.0%) | 0 (0.0%) |
| Total | 722 (100.0%) | 555 (100.0%) |
Physical Housing Characteristics in Hardin
Housing Structures in Hardin
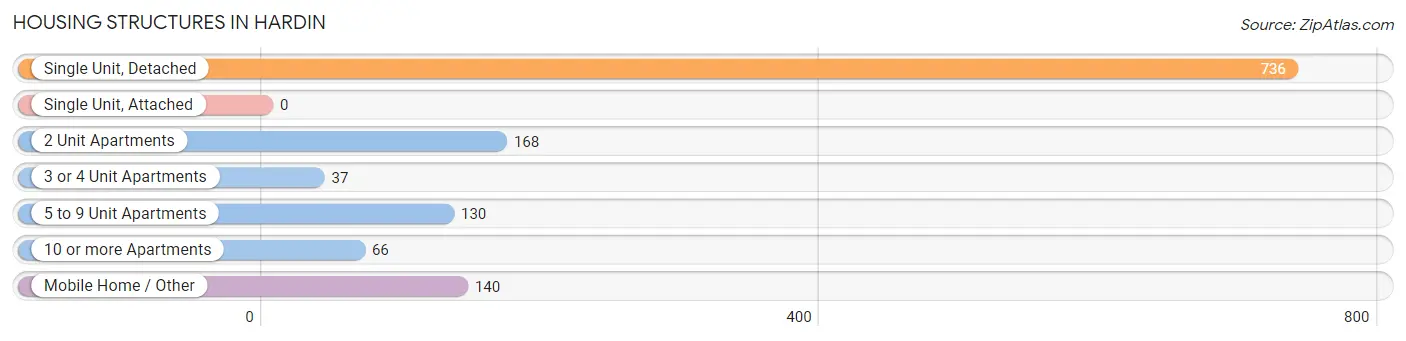
| Structure Type | # Housing Units | % Housing Units |
| Single Unit, Detached | 736 | 57.6% |
| Single Unit, Attached | 0 | 0.0% |
| 2 Unit Apartments | 168 | 13.2% |
| 3 or 4 Unit Apartments | 37 | 2.9% |
| 5 to 9 Unit Apartments | 130 | 10.2% |
| 10 or more Apartments | 66 | 5.2% |
| Mobile Home / Other | 140 | 11.0% |
| Total | 1,277 | 100.0% |
Housing Structures by Occupancy in Hardin
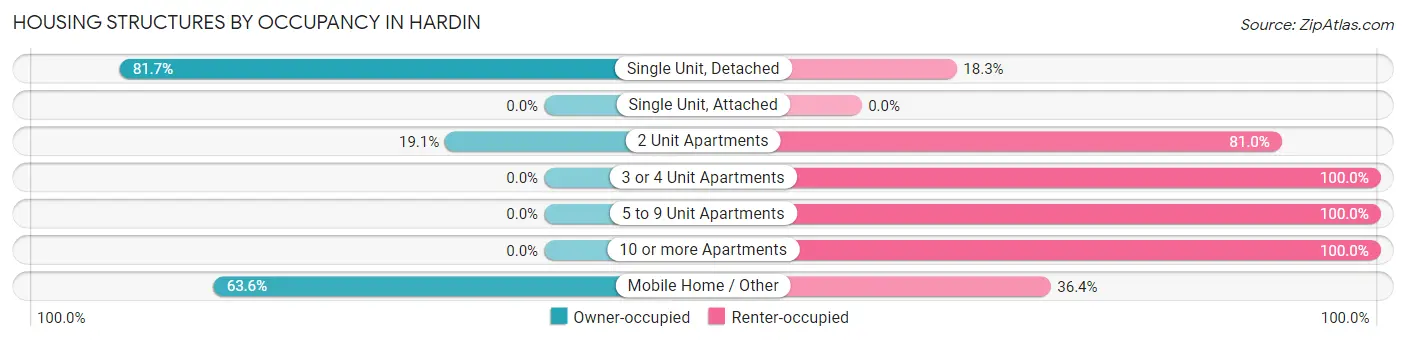
| Structure Type | Owner-occupied | Renter-occupied |
| Single Unit, Detached | 601 (81.7%) | 135 (18.3%) |
| Single Unit, Attached | 0 (0.0%) | 0 (0.0%) |
| 2 Unit Apartments | 32 (19.1%) | 136 (80.9%) |
| 3 or 4 Unit Apartments | 0 (0.0%) | 37 (100.0%) |
| 5 to 9 Unit Apartments | 0 (0.0%) | 130 (100.0%) |
| 10 or more Apartments | 0 (0.0%) | 66 (100.0%) |
| Mobile Home / Other | 89 (63.6%) | 51 (36.4%) |
| Total | 722 (56.5%) | 555 (43.5%) |
Housing Structures by Number of Rooms in Hardin
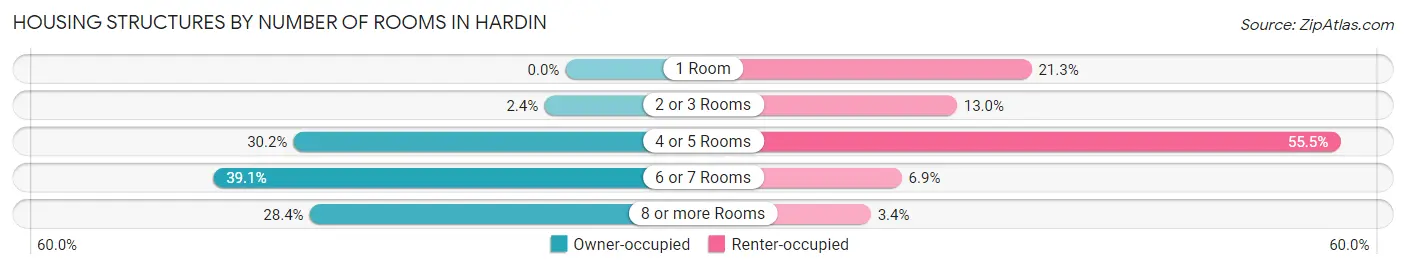
| Number of Rooms | Owner-occupied | Renter-occupied |
| 1 Room | 0 (0.0%) | 118 (21.3%) |
| 2 or 3 Rooms | 17 (2.4%) | 72 (13.0%) |
| 4 or 5 Rooms | 218 (30.2%) | 308 (55.5%) |
| 6 or 7 Rooms | 282 (39.1%) | 38 (6.9%) |
| 8 or more Rooms | 205 (28.4%) | 19 (3.4%) |
| Total | 722 (100.0%) | 555 (100.0%) |
Housing Structure by Heating Type in Hardin
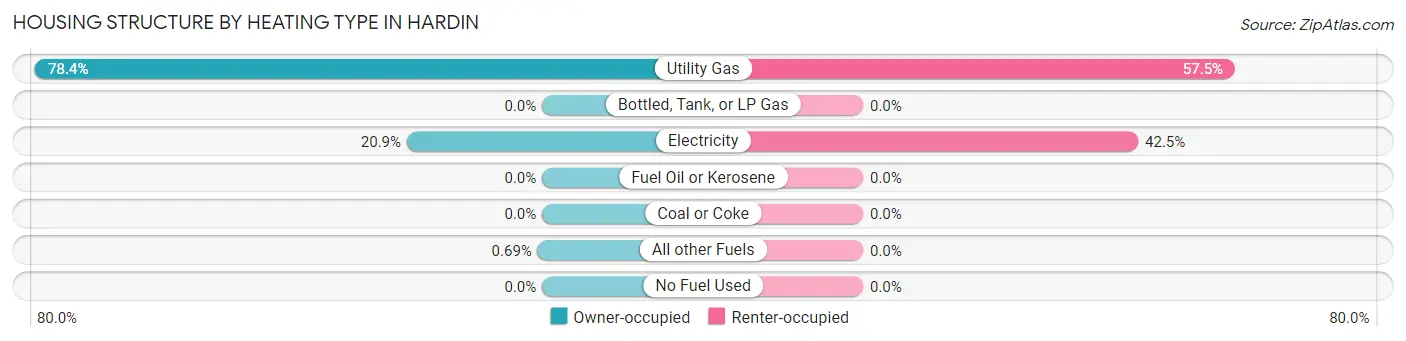
| Heating Type | Owner-occupied | Renter-occupied |
| Utility Gas | 566 (78.4%) | 319 (57.5%) |
| Bottled, Tank, or LP Gas | 0 (0.0%) | 0 (0.0%) |
| Electricity | 151 (20.9%) | 236 (42.5%) |
| Fuel Oil or Kerosene | 0 (0.0%) | 0 (0.0%) |
| Coal or Coke | 0 (0.0%) | 0 (0.0%) |
| All other Fuels | 5 (0.7%) | 0 (0.0%) |
| No Fuel Used | 0 (0.0%) | 0 (0.0%) |
| Total | 722 (100.0%) | 555 (100.0%) |
Household Vehicle Usage in Hardin
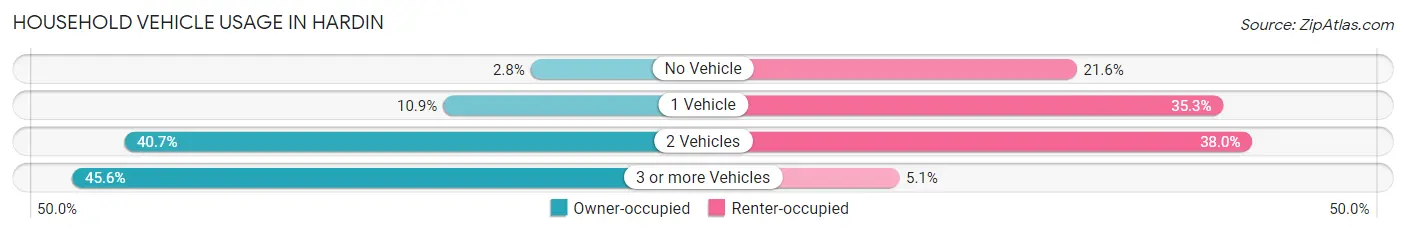
| Vehicles per Household | Owner-occupied | Renter-occupied |
| No Vehicle | 20 (2.8%) | 120 (21.6%) |
| 1 Vehicle | 79 (10.9%) | 196 (35.3%) |
| 2 Vehicles | 294 (40.7%) | 211 (38.0%) |
| 3 or more Vehicles | 329 (45.6%) | 28 (5.1%) |
| Total | 722 (100.0%) | 555 (100.0%) |
Real Estate & Mortgages in Hardin
Real Estate and Mortgage Overview in Hardin
| Characteristic | Without Mortgage | With Mortgage |
| Housing Units | 321 | 401 |
| Median Property Value | $130,500 | $163,000 |
| Median Household Income | $47,292 | $23 |
| Monthly Housing Costs | $437 | $0 |
| Real Estate Taxes | $1,518 | $0 |
Property Value by Mortgage Status in Hardin
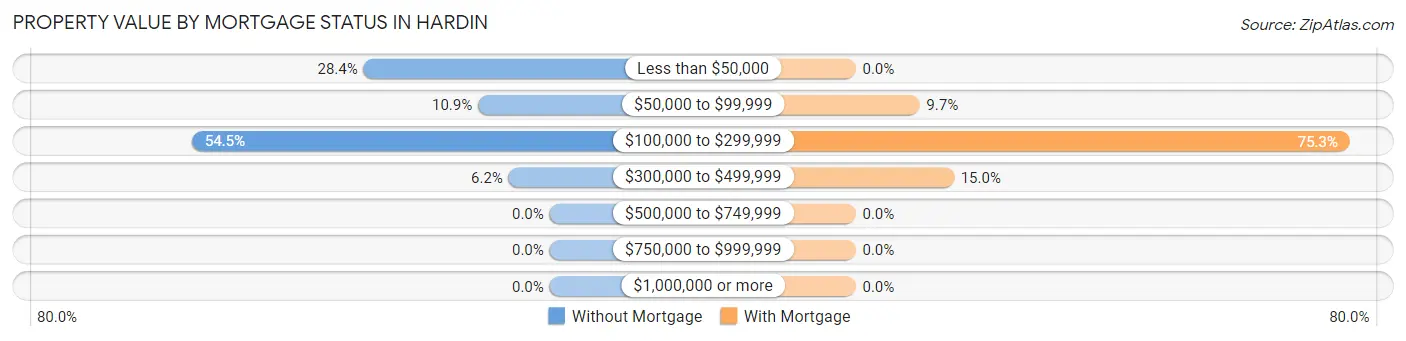
| Property Value | Without Mortgage | With Mortgage |
| Less than $50,000 | 91 (28.3%) | 0 (0.0%) |
| $50,000 to $99,999 | 35 (10.9%) | 39 (9.7%) |
| $100,000 to $299,999 | 175 (54.5%) | 302 (75.3%) |
| $300,000 to $499,999 | 20 (6.2%) | 60 (15.0%) |
| $500,000 to $749,999 | 0 (0.0%) | 0 (0.0%) |
| $750,000 to $999,999 | 0 (0.0%) | 0 (0.0%) |
| $1,000,000 or more | 0 (0.0%) | 0 (0.0%) |
| Total | 321 (100.0%) | 401 (100.0%) |
Household Income by Mortgage Status in Hardin
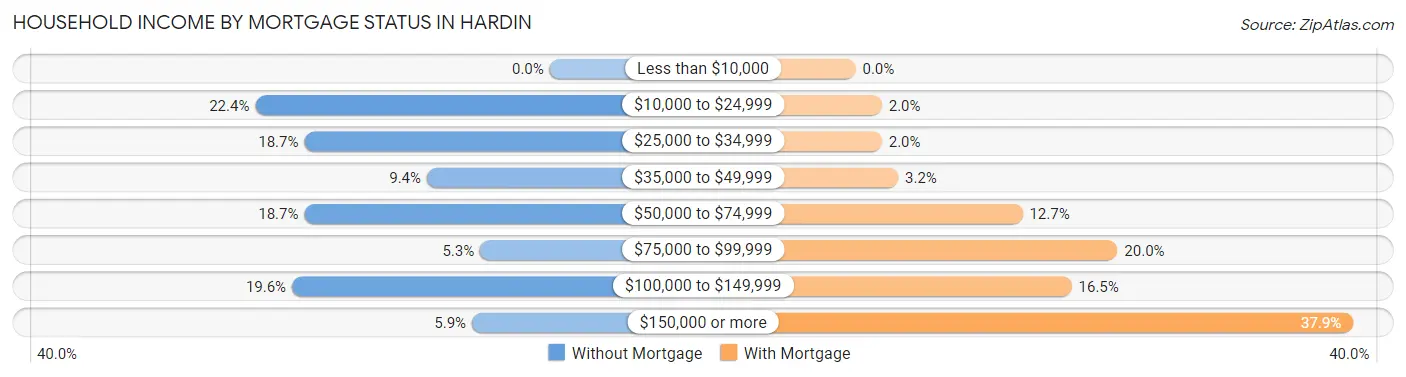
| Household Income | Without Mortgage | With Mortgage |
| Less than $10,000 | 0 (0.0%) | 0 (0.0%) |
| $10,000 to $24,999 | 72 (22.4%) | 8 (2.0%) |
| $25,000 to $34,999 | 60 (18.7%) | 8 (2.0%) |
| $35,000 to $49,999 | 30 (9.3%) | 13 (3.2%) |
| $50,000 to $74,999 | 60 (18.7%) | 51 (12.7%) |
| $75,000 to $99,999 | 17 (5.3%) | 80 (20.0%) |
| $100,000 to $149,999 | 63 (19.6%) | 66 (16.5%) |
| $150,000 or more | 19 (5.9%) | 152 (37.9%) |
| Total | 321 (100.0%) | 401 (100.0%) |
Property Value to Household Income Ratio in Hardin
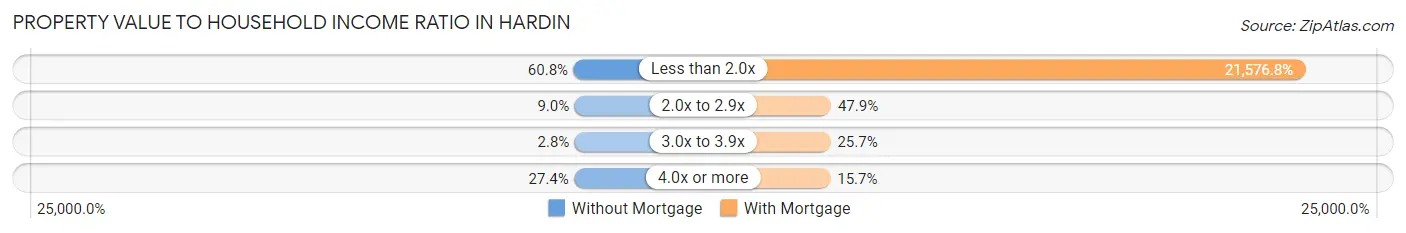
| Value-to-Income Ratio | Without Mortgage | With Mortgage |
| Less than 2.0x | 195 (60.8%) | 86,523 (21,576.8%) |
| 2.0x to 2.9x | 29 (9.0%) | 192 (47.9%) |
| 3.0x to 3.9x | 9 (2.8%) | 103 (25.7%) |
| 4.0x or more | 88 (27.4%) | 63 (15.7%) |
| Total | 321 (100.0%) | 401 (100.0%) |
Real Estate Taxes by Mortgage Status in Hardin
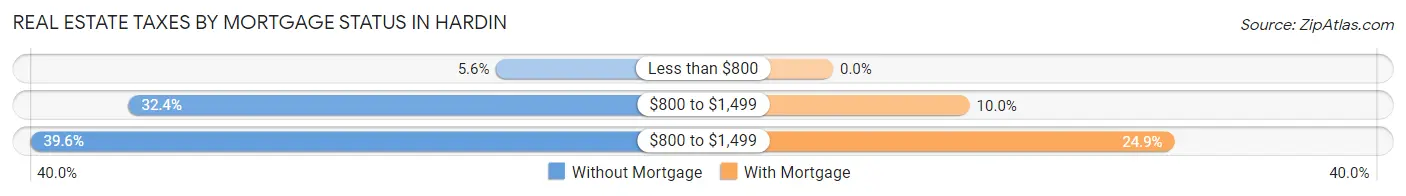
| Property Taxes | Without Mortgage | With Mortgage |
| Less than $800 | 18 (5.6%) | 0 (0.0%) |
| $800 to $1,499 | 104 (32.4%) | 40 (10.0%) |
| $800 to $1,499 | 127 (39.6%) | 100 (24.9%) |
| Total | 321 (100.0%) | 401 (100.0%) |
Health & Disability in Hardin
Health Insurance Coverage by Age in Hardin
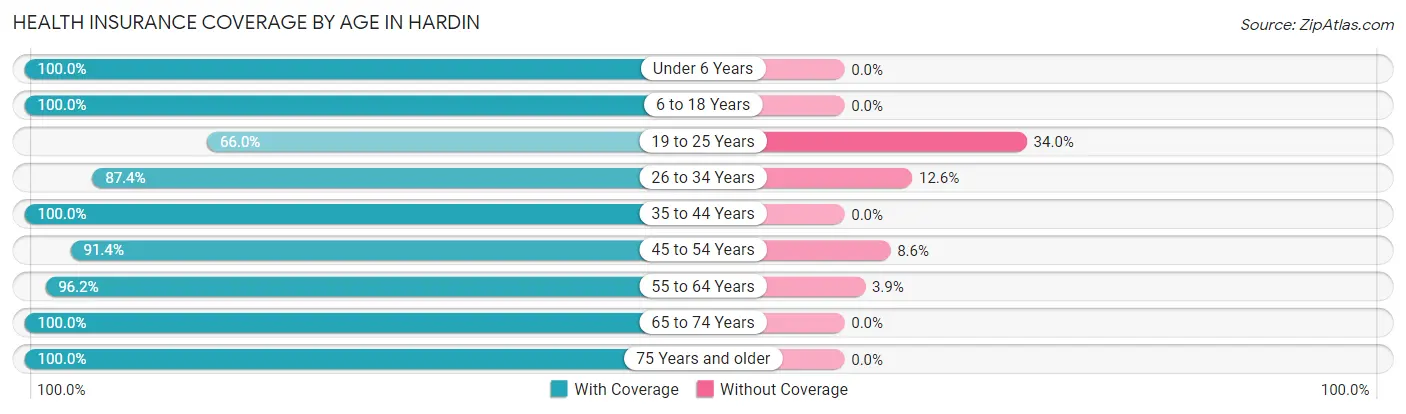
| Age Bracket | With Coverage | Without Coverage |
| Under 6 Years | 304 (100.0%) | 0 (0.0%) |
| 6 to 18 Years | 1,030 (100.0%) | 0 (0.0%) |
| 19 to 25 Years | 194 (66.0%) | 100 (34.0%) |
| 26 to 34 Years | 346 (87.4%) | 50 (12.6%) |
| 35 to 44 Years | 462 (100.0%) | 0 (0.0%) |
| 45 to 54 Years | 288 (91.4%) | 27 (8.6%) |
| 55 to 64 Years | 449 (96.2%) | 18 (3.8%) |
| 65 to 74 Years | 316 (100.0%) | 0 (0.0%) |
| 75 Years and older | 122 (100.0%) | 0 (0.0%) |
| Total | 3,511 (94.7%) | 195 (5.3%) |
Health Insurance Coverage by Citizenship Status in Hardin
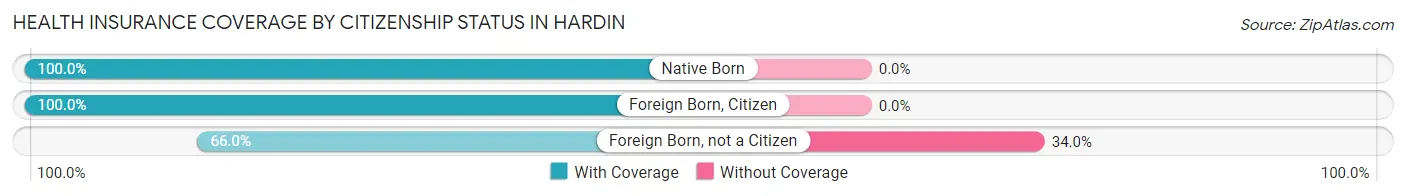
| Citizenship Status | With Coverage | Without Coverage |
| Native Born | 304 (100.0%) | 0 (0.0%) |
| Foreign Born, Citizen | 1,030 (100.0%) | 0 (0.0%) |
| Foreign Born, not a Citizen | 194 (66.0%) | 100 (34.0%) |
Health Insurance Coverage by Household Income in Hardin
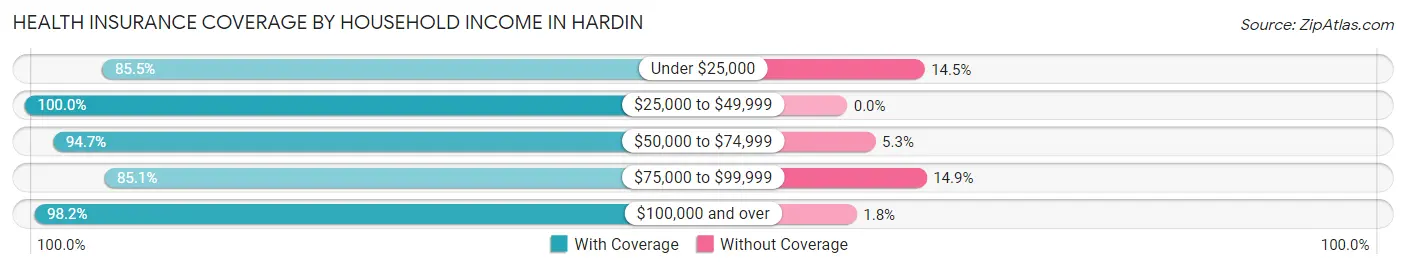
| Household Income | With Coverage | Without Coverage |
| Under $25,000 | 454 (85.5%) | 77 (14.5%) |
| $25,000 to $49,999 | 823 (100.0%) | 0 (0.0%) |
| $50,000 to $74,999 | 714 (94.7%) | 40 (5.3%) |
| $75,000 to $99,999 | 326 (85.1%) | 57 (14.9%) |
| $100,000 and over | 1,152 (98.2%) | 21 (1.8%) |
Public vs Private Health Insurance Coverage by Age in Hardin

| Age Bracket | Public Insurance | Private Insurance |
| Under 6 | 240 (78.9%) | 154 (50.7%) |
| 6 to 18 Years | 661 (64.2%) | 560 (54.4%) |
| 19 to 25 Years | 183 (62.2%) | 54 (18.4%) |
| 25 to 34 Years | 154 (38.9%) | 268 (67.7%) |
| 35 to 44 Years | 142 (30.7%) | 334 (72.3%) |
| 45 to 54 Years | 123 (39.1%) | 182 (57.8%) |
| 55 to 64 Years | 93 (19.9%) | 388 (83.1%) |
| 65 to 74 Years | 316 (100.0%) | 97 (30.7%) |
| 75 Years and over | 122 (100.0%) | 77 (63.1%) |
| Total | 2,034 (54.9%) | 2,114 (57.0%) |
Disability Status by Sex by Age in Hardin
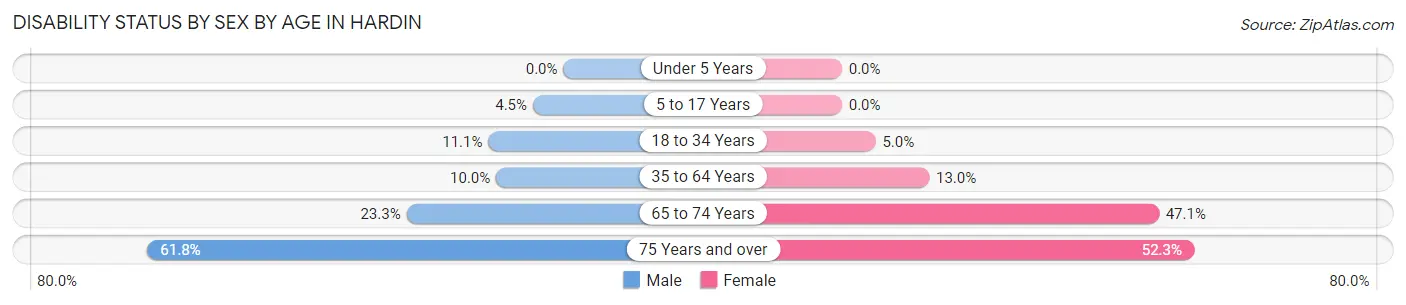
| Age Bracket | Male | Female |
| Under 5 Years | 0 (0.0%) | 0 (0.0%) |
| 5 to 17 Years | 17 (4.5%) | 0 (0.0%) |
| 18 to 34 Years | 49 (11.1%) | 22 (5.0%) |
| 35 to 64 Years | 61 (10.0%) | 82 (13.0%) |
| 65 to 74 Years | 34 (23.3%) | 80 (47.1%) |
| 75 Years and over | 21 (61.8%) | 46 (52.3%) |
Disability Class by Sex by Age in Hardin
Disability Class: Hearing Difficulty
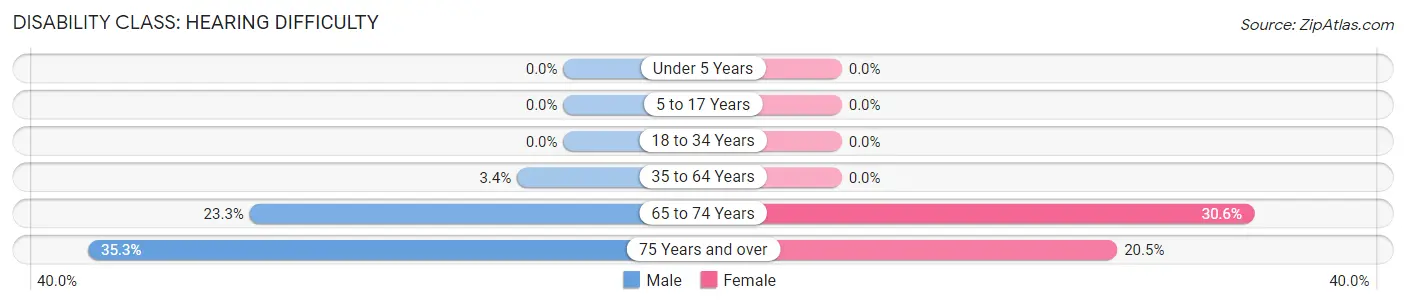
| Age Bracket | Male | Female |
| Under 5 Years | 0 (0.0%) | 0 (0.0%) |
| 5 to 17 Years | 0 (0.0%) | 0 (0.0%) |
| 18 to 34 Years | 0 (0.0%) | 0 (0.0%) |
| 35 to 64 Years | 21 (3.4%) | 0 (0.0%) |
| 65 to 74 Years | 34 (23.3%) | 52 (30.6%) |
| 75 Years and over | 12 (35.3%) | 18 (20.4%) |
Disability Class: Vision Difficulty
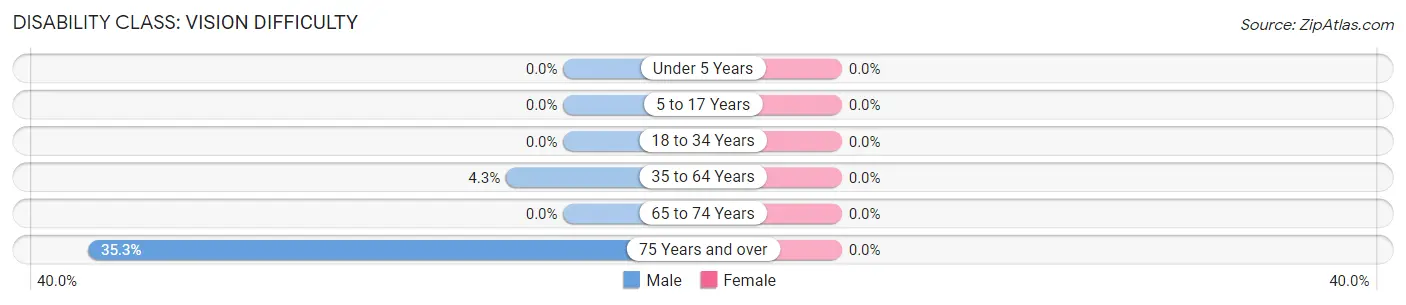
| Age Bracket | Male | Female |
| Under 5 Years | 0 (0.0%) | 0 (0.0%) |
| 5 to 17 Years | 0 (0.0%) | 0 (0.0%) |
| 18 to 34 Years | 0 (0.0%) | 0 (0.0%) |
| 35 to 64 Years | 26 (4.3%) | 0 (0.0%) |
| 65 to 74 Years | 0 (0.0%) | 0 (0.0%) |
| 75 Years and over | 12 (35.3%) | 0 (0.0%) |
Disability Class: Cognitive Difficulty
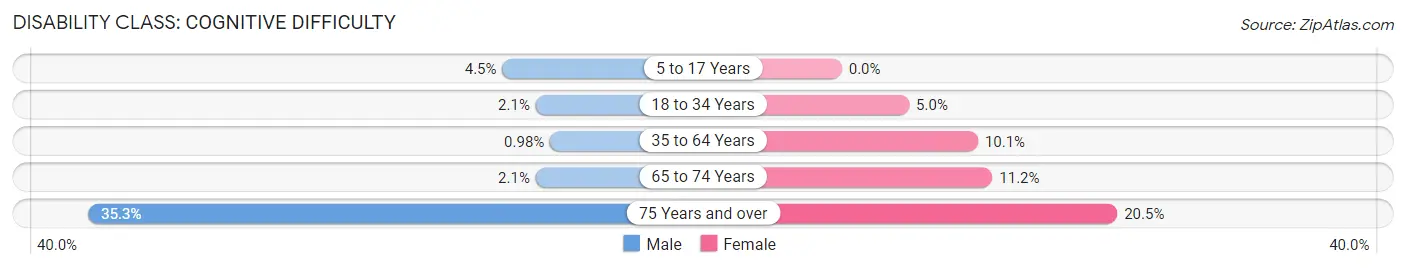
| Age Bracket | Male | Female |
| 5 to 17 Years | 17 (4.5%) | 0 (0.0%) |
| 18 to 34 Years | 9 (2.1%) | 22 (5.0%) |
| 35 to 64 Years | 6 (1.0%) | 64 (10.1%) |
| 65 to 74 Years | 3 (2.1%) | 19 (11.2%) |
| 75 Years and over | 12 (35.3%) | 18 (20.4%) |
Disability Class: Ambulatory Difficulty
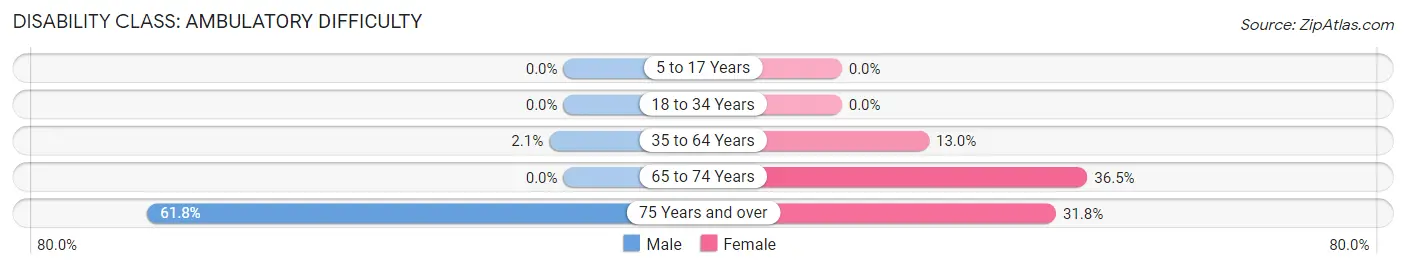
| Age Bracket | Male | Female |
| 5 to 17 Years | 0 (0.0%) | 0 (0.0%) |
| 18 to 34 Years | 0 (0.0%) | 0 (0.0%) |
| 35 to 64 Years | 13 (2.1%) | 82 (13.0%) |
| 65 to 74 Years | 0 (0.0%) | 62 (36.5%) |
| 75 Years and over | 21 (61.8%) | 28 (31.8%) |
Disability Class: Self-Care Difficulty
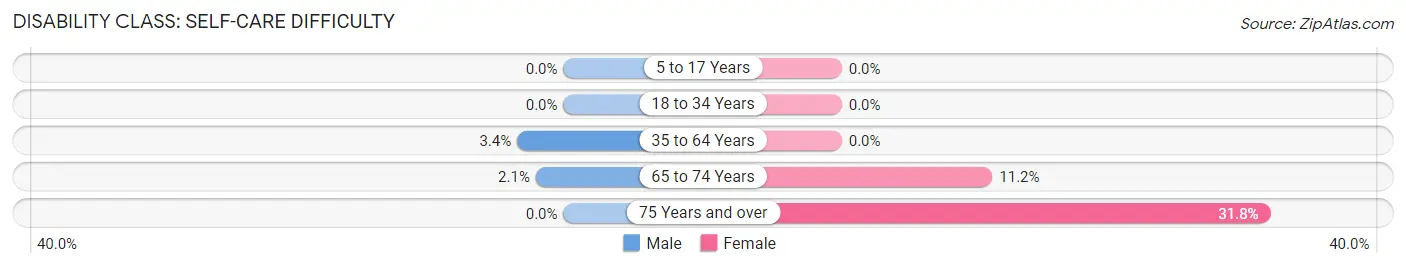
| Age Bracket | Male | Female |
| 5 to 17 Years | 0 (0.0%) | 0 (0.0%) |
| 18 to 34 Years | 0 (0.0%) | 0 (0.0%) |
| 35 to 64 Years | 21 (3.4%) | 0 (0.0%) |
| 65 to 74 Years | 3 (2.1%) | 19 (11.2%) |
| 75 Years and over | 0 (0.0%) | 28 (31.8%) |
Technology Access in Hardin
Computing Device Access in Hardin
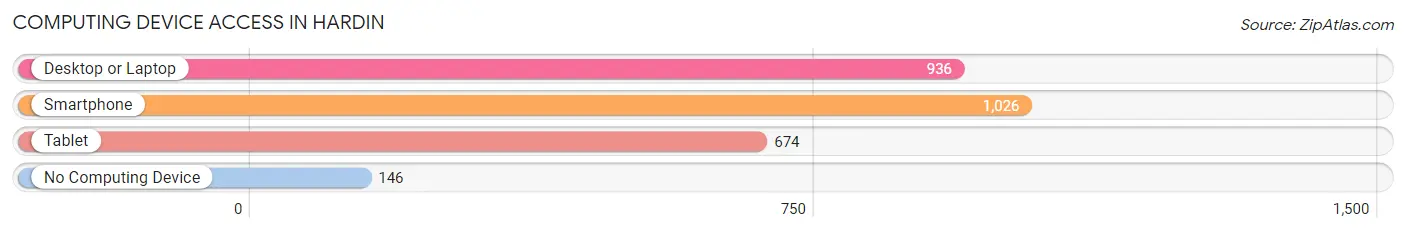
| Device Type | # Households | % Households |
| Desktop or Laptop | 936 | 73.3% |
| Smartphone | 1,026 | 80.3% |
| Tablet | 674 | 52.8% |
| No Computing Device | 146 | 11.4% |
| Total | 1,277 | 100.0% |
Internet Access in Hardin
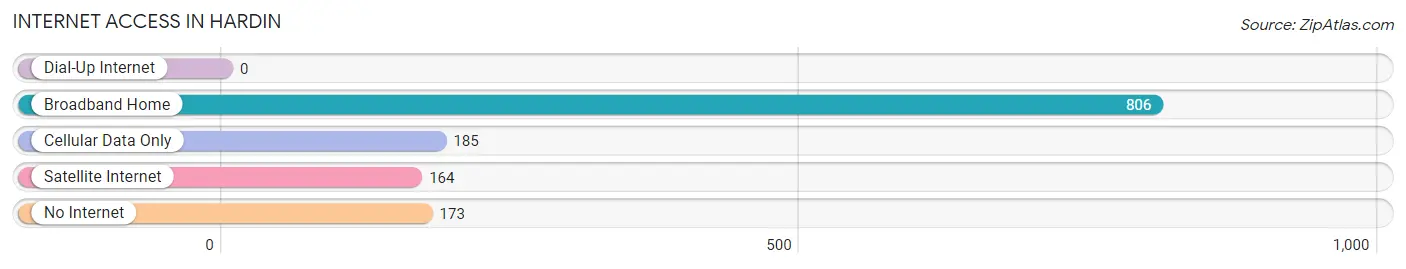
| Internet Type | # Households | % Households |
| Dial-Up Internet | 0 | 0.0% |
| Broadband Home | 806 | 63.1% |
| Cellular Data Only | 185 | 14.5% |
| Satellite Internet | 164 | 12.8% |
| No Internet | 173 | 13.6% |
| Total | 1,277 | 100.0% |
Hardin Summary
Hardin, Montana is a small town located in Big Horn County in the southeastern corner of the state. It is situated on the banks of the Bighorn River, and is the county seat of Big Horn County. The town was founded in 1882 and was named after Colonel John J. Hardin, a Civil War veteran. The population of Hardin was 3,500 in 2020.
Geography
Hardin is located in the southeastern corner of Montana, in Big Horn County. It is situated on the banks of the Bighorn River, and is the county seat of Big Horn County. The town is located at an elevation of 3,400 feet, and is surrounded by rolling hills and prairies. The climate in Hardin is semi-arid, with hot summers and cold winters. The average annual precipitation is 12.5 inches.
Economy
The economy of Hardin is largely based on agriculture and tourism. The town is home to several large farms, which produce wheat, barley, hay, and other crops. The town is also home to several small businesses, including restaurants, retail stores, and service providers. Tourism is also an important part of the local economy, with visitors coming to the area to enjoy the natural beauty of the area, as well as to take part in outdoor activities such as fishing, hunting, and camping.
Demographics
The population of Hardin was 3,500 in 2020. The racial makeup of the town was 90.2% White, 0.3% African American, 0.7% Native American, 0.2% Asian, 0.1% Pacific Islander, and 8.5% from other races. The median household income in Hardin was $37,941 in 2020. The median age of the population was 37.5 years.
History
Hardin was founded in 1882 and was named after Colonel John J. Hardin, a Civil War veteran. The town was originally a trading post for the Crow Indians, and was later used as a supply point for the U.S. Army during the Indian Wars. In the late 19th century, the town became a center for ranching and farming. In the early 20th century, the town was a major stop on the Chicago, Milwaukee, St. Paul and Pacific Railroad. The town was also home to a large military base during World War II.
Today, Hardin is a small town with a rich history and a vibrant economy. The town is home to several large farms, which produce wheat, barley, hay, and other crops. The town is also home to several small businesses, including restaurants, retail stores, and service providers. Tourism is also an important part of the local economy, with visitors coming to the area to enjoy the natural beauty of the area, as well as to take part in outdoor activities such as fishing, hunting, and camping.
Common Questions
What is Per Capita Income in Hardin?
Per Capita income in Hardin is $24,933.
What is the Median Family Income in Hardin?
Median Family Income in Hardin is $67,298.
What is the Median Household income in Hardin?
Median Household Income in Hardin is $57,266.
What is Income or Wage Gap in Hardin?
Income or Wage Gap in Hardin is 23.8%.
Women in Hardin earn 76.2 cents for every dollar earned by a man.
What is Inequality or Gini Index in Hardin?
Inequality or Gini Index in Hardin is 0.42.
What is the Total Population of Hardin?
Total Population of Hardin is 3,803.
What is the Total Male Population of Hardin?
Total Male Population of Hardin is 1,727.
What is the Total Female Population of Hardin?
Total Female Population of Hardin is 2,076.
What is the Ratio of Males per 100 Females in Hardin?
There are 83.19 Males per 100 Females in Hardin.
What is the Ratio of Females per 100 Males in Hardin?
There are 120.21 Females per 100 Males in Hardin.
What is the Median Population Age in Hardin?
Median Population Age in Hardin is 32.9 Years.
What is the Average Family Size in Hardin
Average Family Size in Hardin is 3.5 People.
What is the Average Household Size in Hardin
Average Household Size in Hardin is 2.9 People.
How Large is the Labor Force in Hardin?
There are 1,908 People in the Labor Forcein in Hardin.
What is the Percentage of People in the Labor Force in Hardin?
68.9% of People are in the Labor Force in Hardin.
What is the Unemployment Rate in Hardin?
Unemployment Rate in Hardin is 11.5%.