Hawthorne, NV Map & Demographics
Hawthorne Map
Hawthorne Overview
$27,593
PER CAPITA INCOME
$65,744
AVG FAMILY INCOME
$55,847
AVG HOUSEHOLD INCOME
48.6%
WAGE / INCOME GAP [ % ]
51.4¢/ $1
WAGE / INCOME GAP [ $ ]
$4,580
FAMILY INCOME DEFICIT
0.39
INEQUALITY / GINI INDEX
2,739
TOTAL POPULATION
1,269
MALE POPULATION
1,470
FEMALE POPULATION
86.33
MALES / 100 FEMALES
115.84
FEMALES / 100 MALES
38.6
MEDIAN AGE
2.9
AVG FAMILY SIZE
2.4
AVG HOUSEHOLD SIZE
1,143
LABOR FORCE [ PEOPLE ]
50.9%
PERCENT IN LABOR FORCE
2.3%
UNEMPLOYMENT RATE
Hawthorne Zip Codes
Hawthorne Area Codes
Income in Hawthorne
Income Overview in Hawthorne
Per Capita Income in Hawthorne is $27,593, while median incomes of families and households are $65,744 and $55,847 respectively.
| Characteristic | Number | Measure |
| Per Capita Income | 2,739 | $27,593 |
| Median Family Income | 679 | $65,744 |
| Mean Family Income | 679 | $76,480 |
| Median Household Income | 1,120 | $55,847 |
| Mean Household Income | 1,120 | $67,084 |
| Income Deficit | 679 | $4,580 |
| Wage / Income Gap (%) | 2,739 | 48.58% |
| Wage / Income Gap ($) | 2,739 | 51.42¢ per $1 |
| Gini / Inequality Index | 2,739 | 0.39 |
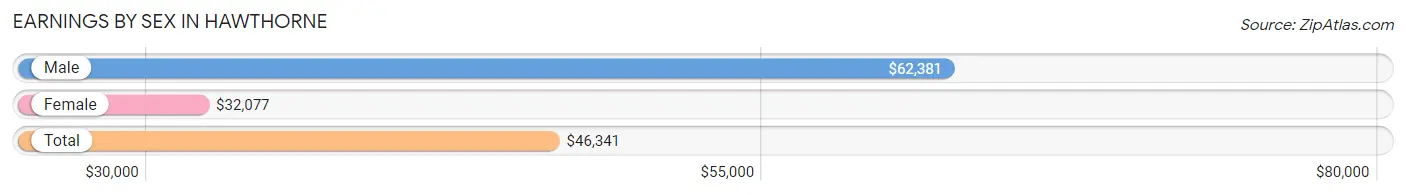
Earnings by Sex in Hawthorne
Average Earnings in Hawthorne are $46,341, $62,381 for men and $32,077 for women, a difference of 48.6%.
| Sex | Number | Average Earnings |
| Male | 528 (45.4%) | $62,381 |
| Female | 635 (54.6%) | $32,077 |
| Total | 1,163 (100.0%) | $46,341 |
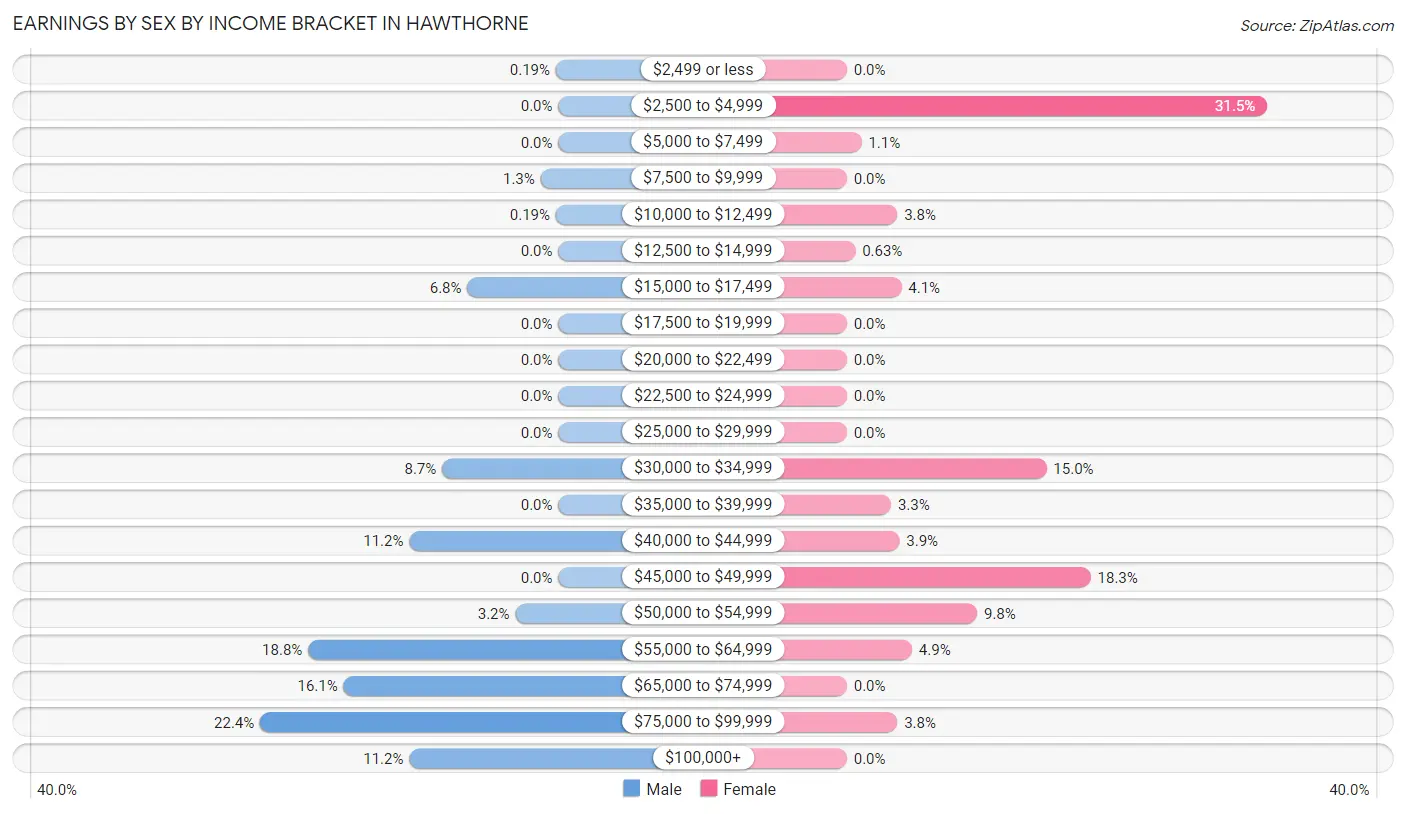
Earnings by Sex by Income Bracket in Hawthorne
The most common earnings brackets in Hawthorne are $75,000 to $99,999 for men (118 | 22.4%) and $2,500 to $4,999 for women (200 | 31.5%).
| Income | Male | Female |
| $2,499 or less | 1 (0.2%) | 0 (0.0%) |
| $2,500 to $4,999 | 0 (0.0%) | 200 (31.5%) |
| $5,000 to $7,499 | 0 (0.0%) | 7 (1.1%) |
| $7,500 to $9,999 | 7 (1.3%) | 0 (0.0%) |
| $10,000 to $12,499 | 1 (0.2%) | 24 (3.8%) |
| $12,500 to $14,999 | 0 (0.0%) | 4 (0.6%) |
| $15,000 to $17,499 | 36 (6.8%) | 26 (4.1%) |
| $17,500 to $19,999 | 0 (0.0%) | 0 (0.0%) |
| $20,000 to $22,499 | 0 (0.0%) | 0 (0.0%) |
| $22,500 to $24,999 | 0 (0.0%) | 0 (0.0%) |
| $25,000 to $29,999 | 0 (0.0%) | 0 (0.0%) |
| $30,000 to $34,999 | 46 (8.7%) | 95 (15.0%) |
| $35,000 to $39,999 | 0 (0.0%) | 21 (3.3%) |
| $40,000 to $44,999 | 59 (11.2%) | 25 (3.9%) |
| $45,000 to $49,999 | 0 (0.0%) | 116 (18.3%) |
| $50,000 to $54,999 | 17 (3.2%) | 62 (9.8%) |
| $55,000 to $64,999 | 99 (18.8%) | 31 (4.9%) |
| $65,000 to $74,999 | 85 (16.1%) | 0 (0.0%) |
| $75,000 to $99,999 | 118 (22.4%) | 24 (3.8%) |
| $100,000+ | 59 (11.2%) | 0 (0.0%) |
| Total | 528 (100.0%) | 635 (100.0%) |
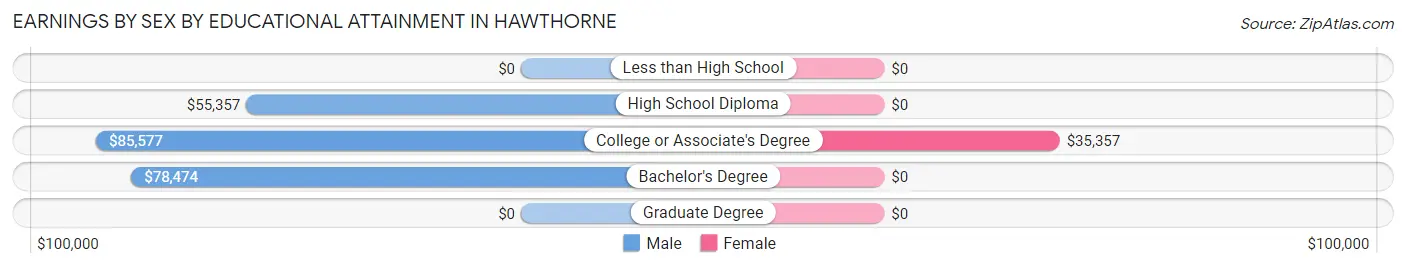
Earnings by Sex by Educational Attainment in Hawthorne
Average earnings in Hawthorne are $62,440 for men and $37,262 for women, a difference of 40.3%. Men with an educational attainment of college or associate's degree enjoy the highest average annual earnings of $85,577, while those with high school diploma education earn the least with $55,357. Women with an educational attainment of college or associate's degree earn the most with the average annual earnings of $35,357, while those with college or associate's degree education have the smallest earnings of $35,357.
| Educational Attainment | Male Income | Female Income |
| Less than High School | - | - |
| High School Diploma | $55,357 | $0 |
| College or Associate's Degree | $85,577 | $35,357 |
| Bachelor's Degree | $78,474 | $0 |
| Graduate Degree | - | - |
| Total | $62,440 | $37,262 |
Family Income in Hawthorne
Family Income Brackets in Hawthorne
According to the Hawthorne family income data, there are 250 families falling into the $50,000 to $74,999 income range, which is the most common income bracket and makes up 36.8% of all families.
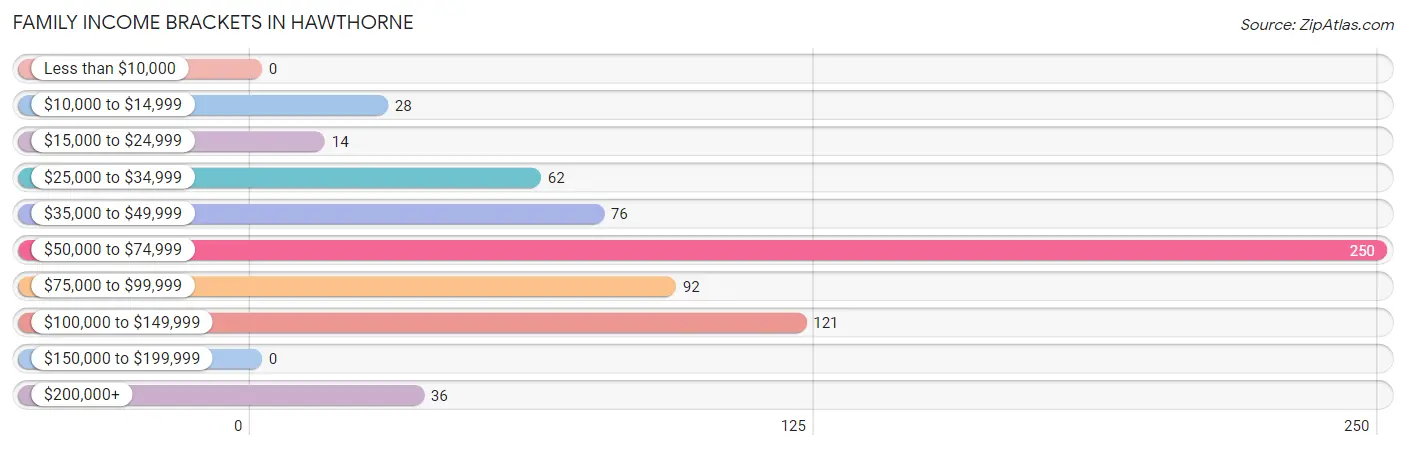
| Income Bracket | # Families | % Families |
| Less than $10,000 | 0 | 0.0% |
| $10,000 to $14,999 | 28 | 4.1% |
| $15,000 to $24,999 | 14 | 2.1% |
| $25,000 to $34,999 | 62 | 9.1% |
| $35,000 to $49,999 | 76 | 11.2% |
| $50,000 to $74,999 | 250 | 36.8% |
| $75,000 to $99,999 | 92 | 13.5% |
| $100,000 to $149,999 | 121 | 17.8% |
| $150,000 to $199,999 | 0 | 0.0% |
| $200,000+ | 36 | 5.3% |
Family Income by Famaliy Size in Hawthorne
4-person families (133 | 19.6%) account for the highest median family income in Hawthorne with $96,101 per family, while 2-person families (391 | 57.6%) have the highest median income of $32,842 per family member.
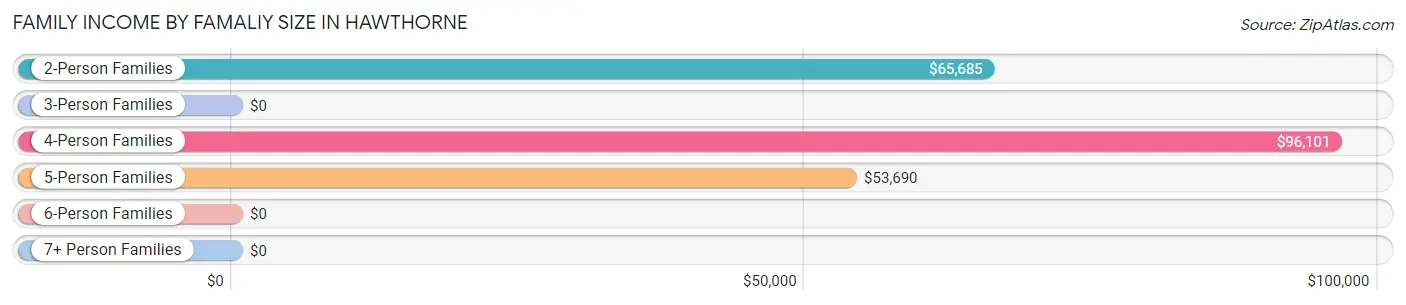
| Income Bracket | # Families | Median Income |
| 2-Person Families | 391 (57.6%) | $65,685 |
| 3-Person Families | 80 (11.8%) | $0 |
| 4-Person Families | 133 (19.6%) | $96,101 |
| 5-Person Families | 65 (9.6%) | $53,690 |
| 6-Person Families | 10 (1.5%) | $0 |
| 7+ Person Families | 0 (0.0%) | $0 |
| Total | 679 (100.0%) | $65,744 |
Family Income by Number of Earners in Hawthorne
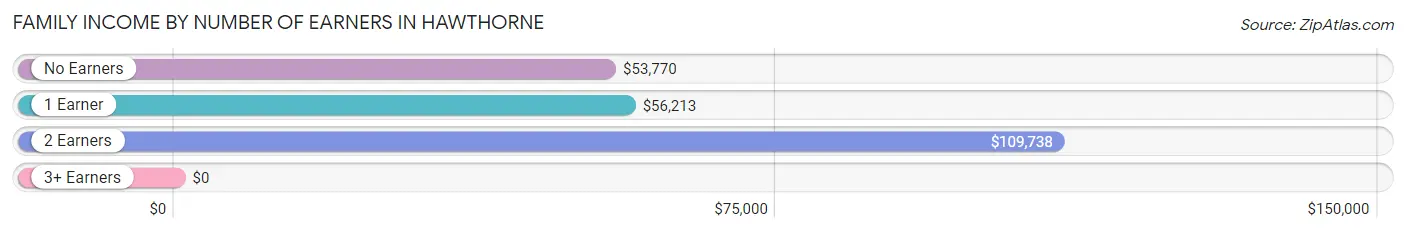
| Number of Earners | # Families | Median Income |
| No Earners | 209 (30.8%) | $53,770 |
| 1 Earner | 233 (34.3%) | $56,213 |
| 2 Earners | 237 (34.9%) | $109,738 |
| 3+ Earners | 0 (0.0%) | $0 |
| Total | 679 (100.0%) | $65,744 |
Household Income in Hawthorne
Household Income Brackets in Hawthorne
With 239 households falling in the category, the $50,000 to $74,999 income range is the most frequent in Hawthorne, accounting for 21.3% of all households.
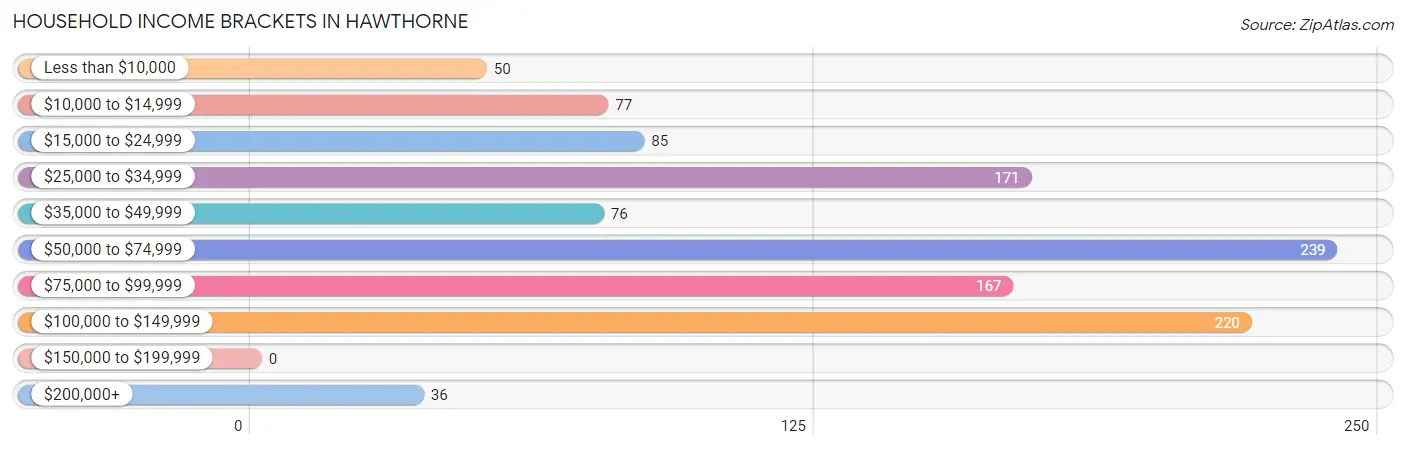
| Income Bracket | # Households | % Households |
| Less than $10,000 | 50 | 4.5% |
| $10,000 to $14,999 | 77 | 6.9% |
| $15,000 to $24,999 | 85 | 7.6% |
| $25,000 to $34,999 | 171 | 15.3% |
| $35,000 to $49,999 | 76 | 6.8% |
| $50,000 to $74,999 | 239 | 21.3% |
| $75,000 to $99,999 | 167 | 14.9% |
| $100,000 to $149,999 | 220 | 19.6% |
| $150,000 to $199,999 | 0 | 0.0% |
| $200,000+ | 36 | 3.2% |
Household Income by Householder Age in Hawthorne
The median household income in Hawthorne is $55,847, with the highest median household income of $94,700 found in the 25 to 44 years age bracket for the primary householder. A total of 402 households (35.9%) fall into this category.
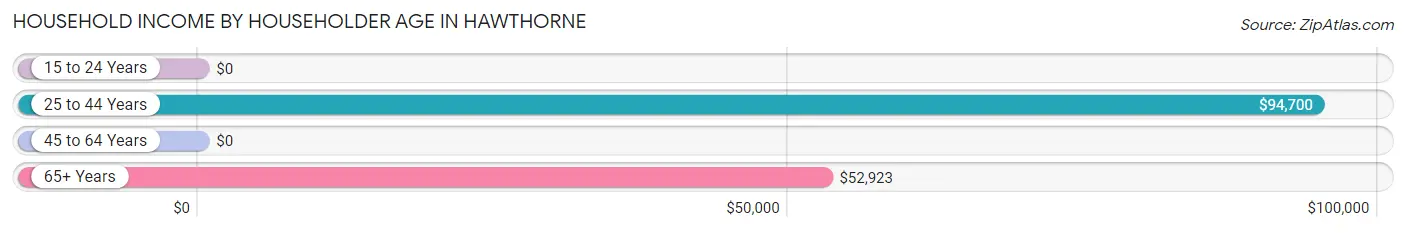
| Income Bracket | # Households | Median Income |
| 15 to 24 Years | 0 (0.0%) | $0 |
| 25 to 44 Years | 402 (35.9%) | $94,700 |
| 45 to 64 Years | 311 (27.8%) | $0 |
| 65+ Years | 407 (36.3%) | $52,923 |
| Total | 1,120 (100.0%) | $55,847 |
Poverty in Hawthorne
Income Below Poverty by Sex and Age in Hawthorne
With 11.5% poverty level for males and 10.6% for females among the residents of Hawthorne, 55 to 64 year old males and 18 to 24 year old females are the most vulnerable to poverty, with 77 males (45.8%) and 86 females (38.9%) in their respective age groups living below the poverty level.
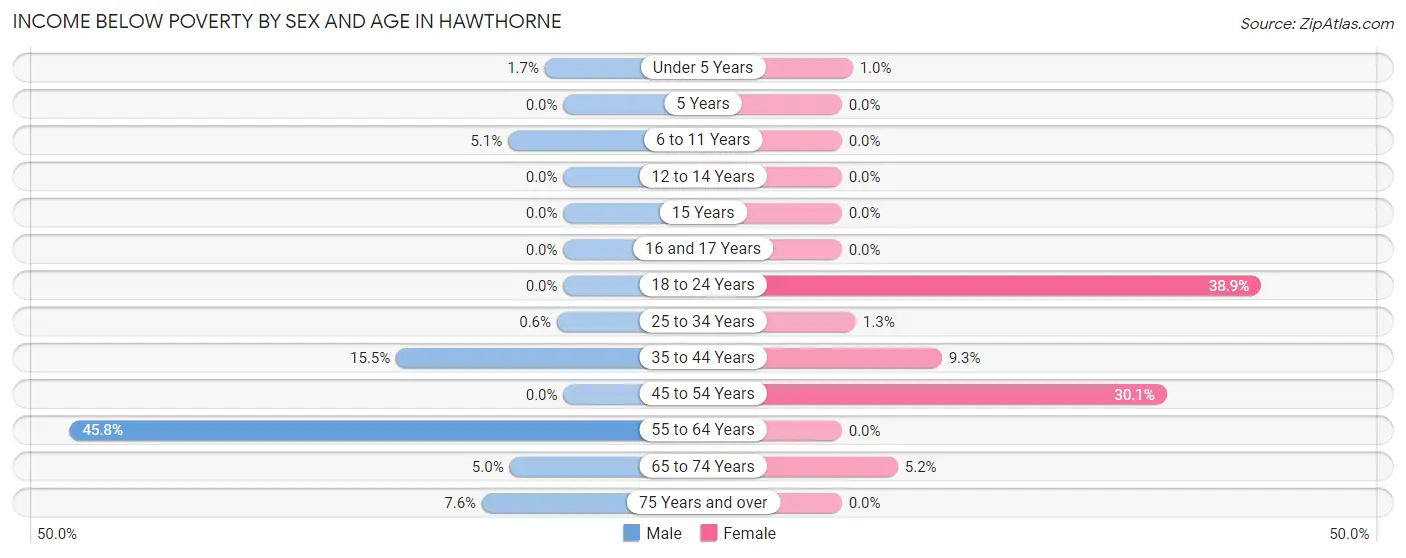
| Age Bracket | Male | Female |
| Under 5 Years | 2 (1.7%) | 1 (1.0%) |
| 5 Years | 0 (0.0%) | 0 (0.0%) |
| 6 to 11 Years | 2 (5.1%) | 0 (0.0%) |
| 12 to 14 Years | 0 (0.0%) | 0 (0.0%) |
| 15 Years | 0 (0.0%) | 0 (0.0%) |
| 16 and 17 Years | 0 (0.0%) | 0 (0.0%) |
| 18 to 24 Years | 0 (0.0%) | 86 (38.9%) |
| 25 to 34 Years | 1 (0.6%) | 2 (1.3%) |
| 35 to 44 Years | 36 (15.5%) | 23 (9.3%) |
| 45 to 54 Years | 0 (0.0%) | 22 (30.1%) |
| 55 to 64 Years | 77 (45.8%) | 0 (0.0%) |
| 65 to 74 Years | 5 (5.0%) | 17 (5.2%) |
| 75 Years and over | 18 (7.6%) | 0 (0.0%) |
| Total | 141 (11.5%) | 151 (10.6%) |
Income Above Poverty by Sex and Age in Hawthorne
According to the poverty statistics in Hawthorne, males aged 12 to 14 years and females aged 6 to 11 years are the age groups that are most secure financially, with 100.0% of males and 100.0% of females in these age groups living above the poverty line.
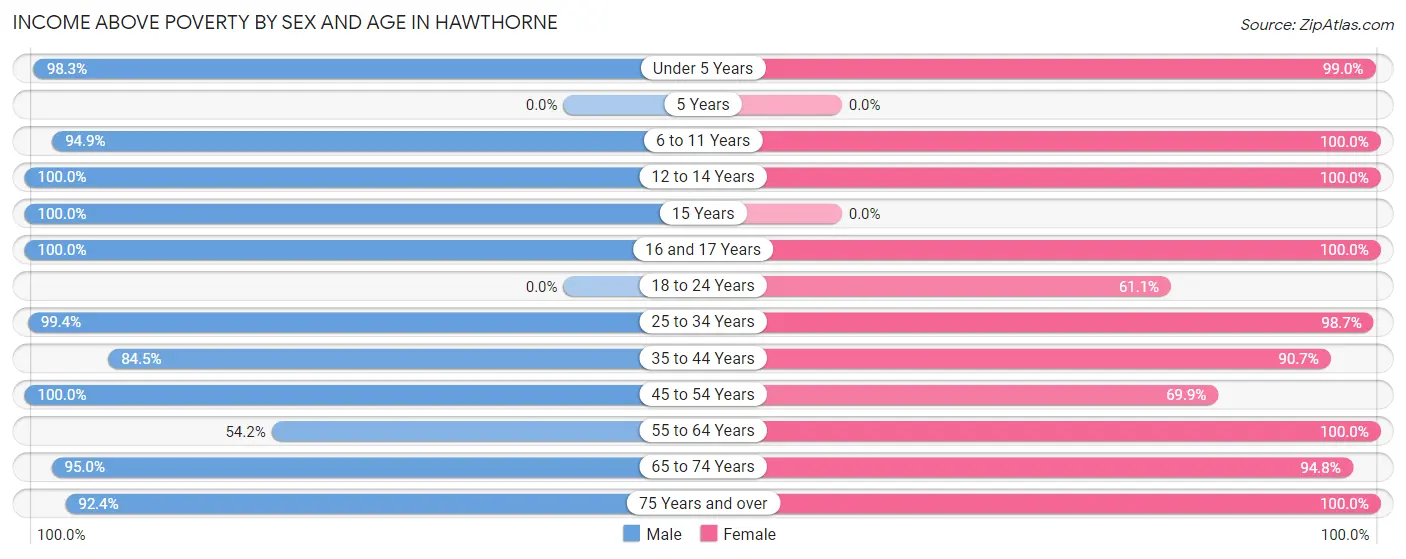
| Age Bracket | Male | Female |
| Under 5 Years | 114 (98.3%) | 98 (99.0%) |
| 5 Years | 0 (0.0%) | 0 (0.0%) |
| 6 to 11 Years | 37 (94.9%) | 145 (100.0%) |
| 12 to 14 Years | 60 (100.0%) | 21 (100.0%) |
| 15 Years | 3 (100.0%) | 0 (0.0%) |
| 16 and 17 Years | 7 (100.0%) | 29 (100.0%) |
| 18 to 24 Years | 0 (0.0%) | 135 (61.1%) |
| 25 to 34 Years | 167 (99.4%) | 151 (98.7%) |
| 35 to 44 Years | 196 (84.5%) | 225 (90.7%) |
| 45 to 54 Years | 95 (100.0%) | 51 (69.9%) |
| 55 to 64 Years | 91 (54.2%) | 49 (100.0%) |
| 65 to 74 Years | 95 (95.0%) | 310 (94.8%) |
| 75 Years and over | 220 (92.4%) | 62 (100.0%) |
| Total | 1,085 (88.5%) | 1,276 (89.4%) |
Income Below Poverty Among Married-Couple Families in Hawthorne
The poverty statistics for married-couple families in Hawthorne show that 9.7% or 44 of the total 453 families live below the poverty line. Families with 3 or 4 children have the highest poverty rate of 16.7%, comprising of 2 families. On the other hand, families with 1 or 2 children have the lowest poverty rate of 0.0%, which includes 0 families.
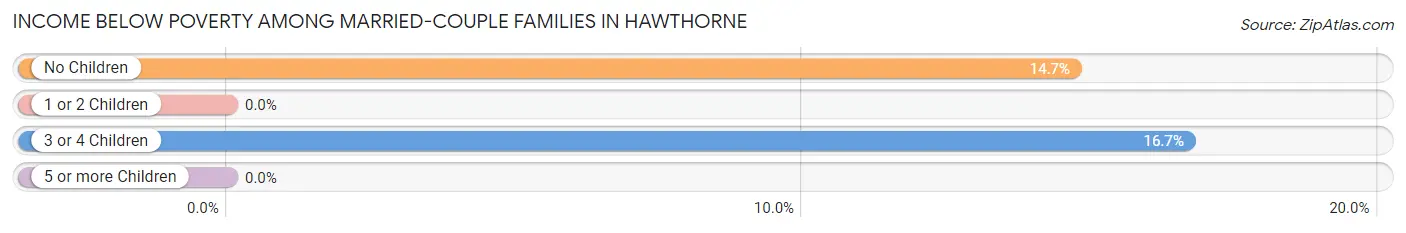
| Children | Above Poverty | Below Poverty |
| No Children | 244 (85.3%) | 42 (14.7%) |
| 1 or 2 Children | 155 (100.0%) | 0 (0.0%) |
| 3 or 4 Children | 10 (83.3%) | 2 (16.7%) |
| 5 or more Children | 0 (0.0%) | 0 (0.0%) |
| Total | 409 (90.3%) | 44 (9.7%) |
Income Below Poverty Among Single-Parent Households in Hawthorne
| Children | Single Father | Single Mother |
| No Children | 0 (0.0%) | 0 (0.0%) |
| 1 or 2 Children | 0 (0.0%) | 0 (0.0%) |
| 3 or 4 Children | 0 (0.0%) | 0 (0.0%) |
| 5 or more Children | 0 (0.0%) | 0 (0.0%) |
| Total | 0 (0.0%) | 0 (0.0%) |
Income Below Poverty Among Married-Couple vs Single-Parent Households in Hawthorne
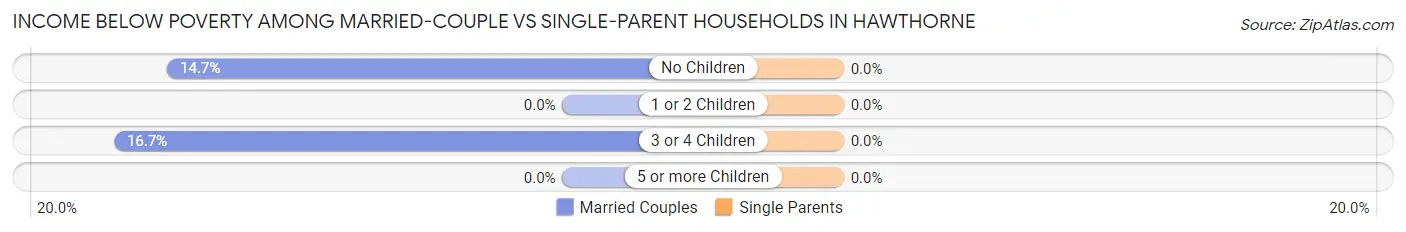
| Children | Married-Couple Families | Single-Parent Households |
| No Children | 42 (14.7%) | 0 (0.0%) |
| 1 or 2 Children | 0 (0.0%) | 0 (0.0%) |
| 3 or 4 Children | 2 (16.7%) | 0 (0.0%) |
| 5 or more Children | 0 (0.0%) | 0 (0.0%) |
| Total | 44 (9.7%) | 0 (0.0%) |
Race in Hawthorne
The most populous races in Hawthorne are White / Caucasian (2,278 | 83.2%), Hispanic or Latino (562 | 20.5%), and Two or more Races (211 | 7.7%).
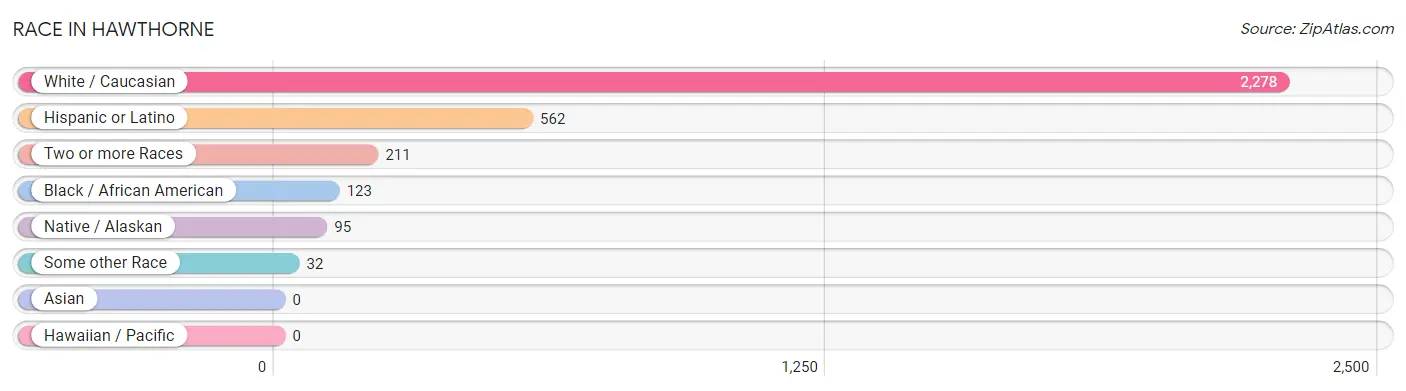
| Race | # Population | % Population |
| Asian | 0 | 0.0% |
| Black / African American | 123 | 4.5% |
| Hawaiian / Pacific | 0 | 0.0% |
| Hispanic or Latino | 562 | 20.5% |
| Native / Alaskan | 95 | 3.5% |
| White / Caucasian | 2,278 | 83.2% |
| Two or more Races | 211 | 7.7% |
| Some other Race | 32 | 1.2% |
| Total | 2,739 | 100.0% |
Ancestry in Hawthorne
The most populous ancestries reported in Hawthorne are Mexican (497 | 18.1%), German (480 | 17.5%), English (478 | 17.4%), Irish (405 | 14.8%), and American (191 | 7.0%), together accounting for 74.9% of all Hawthorne residents.
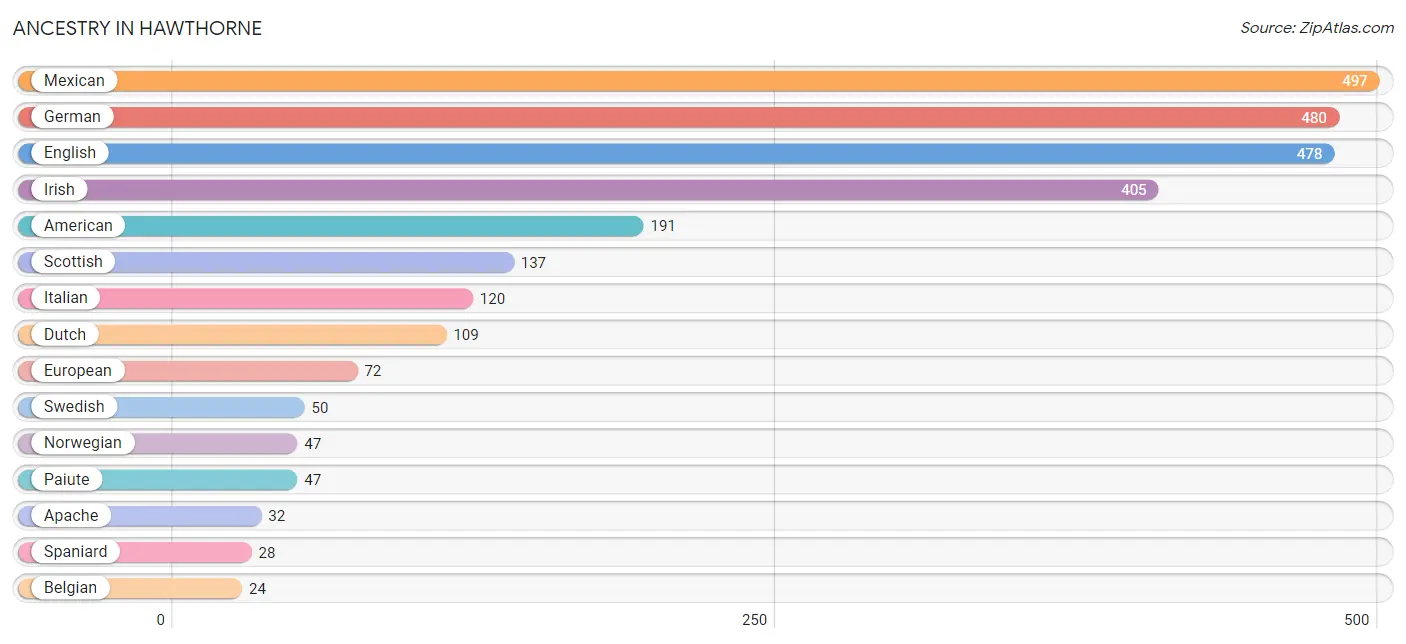
| Ancestry | # Population | % Population |
| American | 191 | 7.0% |
| Apache | 32 | 1.2% |
| Basque | 14 | 0.5% |
| Belgian | 24 | 0.9% |
| British | 24 | 0.9% |
| Cherokee | 18 | 0.7% |
| Cree | 18 | 0.7% |
| Czech | 23 | 0.8% |
| Dutch | 109 | 4.0% |
| English | 478 | 17.4% |
| European | 72 | 2.6% |
| French | 4 | 0.2% |
| German | 480 | 17.5% |
| Irish | 405 | 14.8% |
| Italian | 120 | 4.4% |
| Korean | 1 | 0.0% |
| Mexican | 497 | 18.1% |
| Norwegian | 47 | 1.7% |
| Paiute | 47 | 1.7% |
| Portuguese | 17 | 0.6% |
| Russian | 14 | 0.5% |
| Scottish | 137 | 5.0% |
| Sioux | 7 | 0.3% |
| Slavic | 13 | 0.5% |
| Spaniard | 28 | 1.0% |
| Spanish | 5 | 0.2% |
| Swedish | 50 | 1.8% |
| Thai | 1 | 0.0% | View All 28 Rows |
Immigrants in Hawthorne
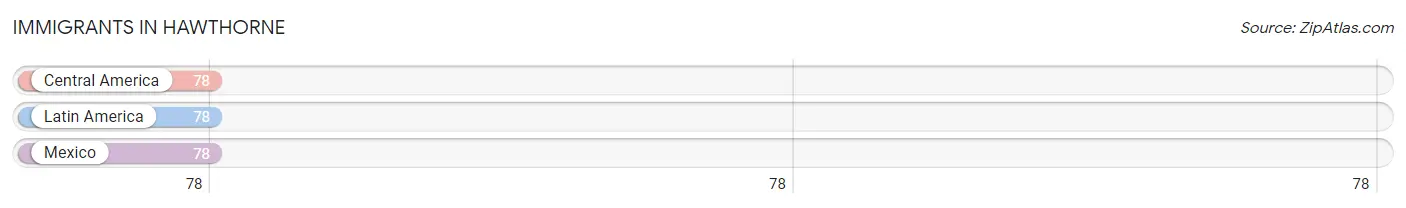
The most numerous immigrant groups reported in Hawthorne came from Central America (78 | 2.9%), Latin America (78 | 2.9%), and Mexico (78 | 2.9%), together accounting for 8.6% of all Hawthorne residents.
| Immigration Origin | # Population | % Population |
| Central America | 78 | 2.9% |
| Latin America | 78 | 2.9% |
| Mexico | 78 | 2.9% | View All 3 Rows |
Sex and Age in Hawthorne
Sex and Age in Hawthorne
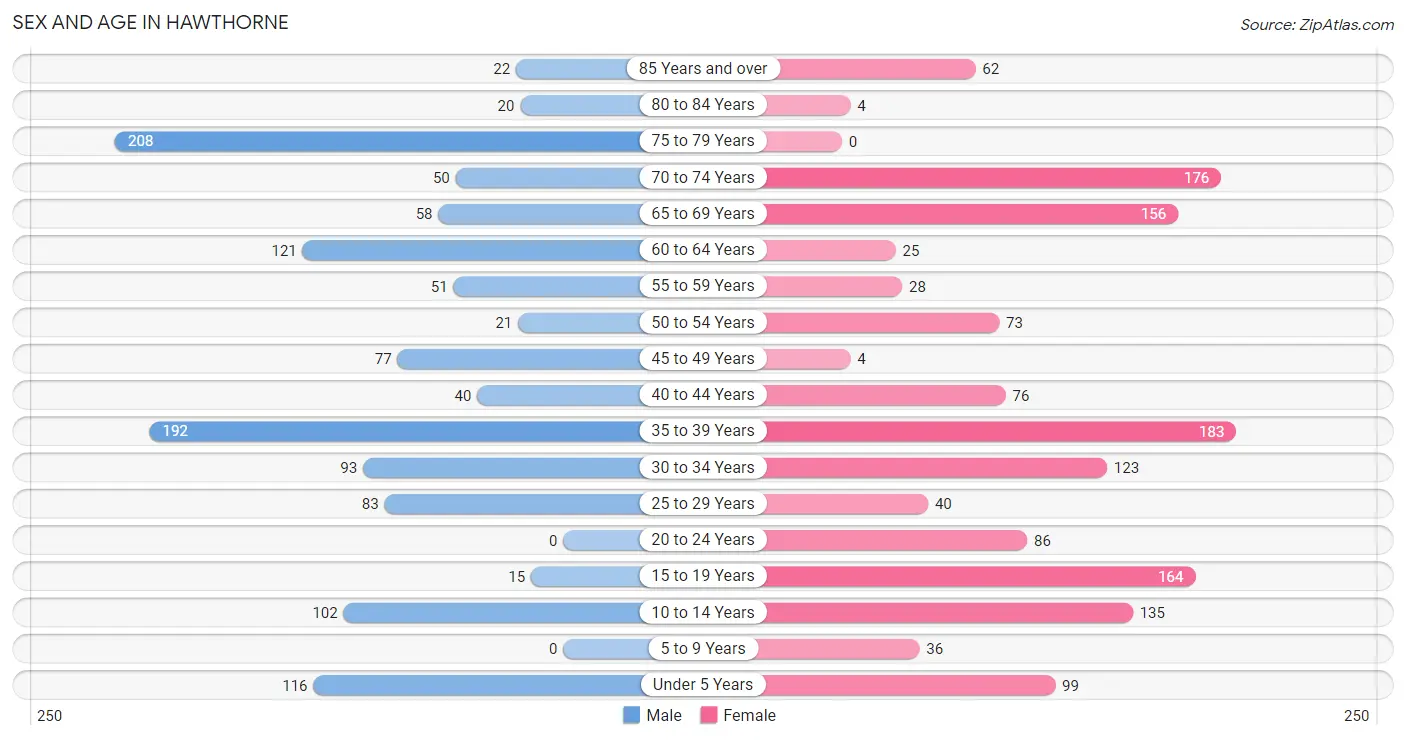
The most populous age groups in Hawthorne are 75 to 79 Years (208 | 16.4%) for men and 35 to 39 Years (183 | 12.4%) for women.
| Age Bracket | Male | Female |
| Under 5 Years | 116 (9.1%) | 99 (6.7%) |
| 5 to 9 Years | 0 (0.0%) | 36 (2.5%) |
| 10 to 14 Years | 102 (8.0%) | 135 (9.2%) |
| 15 to 19 Years | 15 (1.2%) | 164 (11.2%) |
| 20 to 24 Years | 0 (0.0%) | 86 (5.9%) |
| 25 to 29 Years | 83 (6.5%) | 40 (2.7%) |
| 30 to 34 Years | 93 (7.3%) | 123 (8.4%) |
| 35 to 39 Years | 192 (15.1%) | 183 (12.4%) |
| 40 to 44 Years | 40 (3.2%) | 76 (5.2%) |
| 45 to 49 Years | 77 (6.1%) | 4 (0.3%) |
| 50 to 54 Years | 21 (1.7%) | 73 (5.0%) |
| 55 to 59 Years | 51 (4.0%) | 28 (1.9%) |
| 60 to 64 Years | 121 (9.5%) | 25 (1.7%) |
| 65 to 69 Years | 58 (4.6%) | 156 (10.6%) |
| 70 to 74 Years | 50 (3.9%) | 176 (12.0%) |
| 75 to 79 Years | 208 (16.4%) | 0 (0.0%) |
| 80 to 84 Years | 20 (1.6%) | 4 (0.3%) |
| 85 Years and over | 22 (1.7%) | 62 (4.2%) |
| Total | 1,269 (100.0%) | 1,470 (100.0%) |
Families and Households in Hawthorne
Median Family Size in Hawthorne
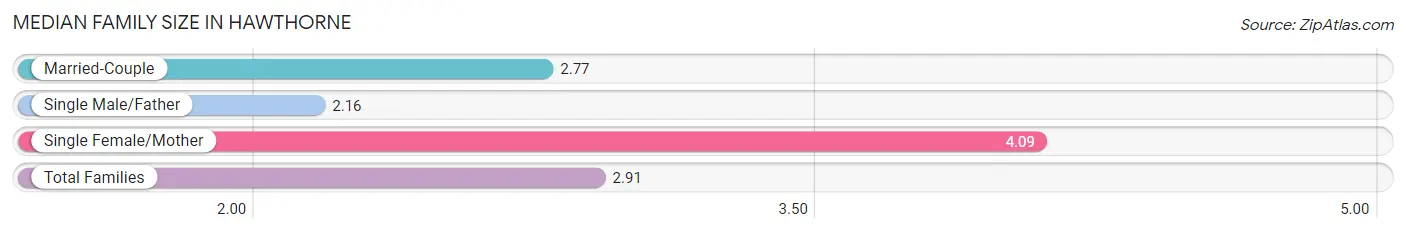
The median family size in Hawthorne is 2.91 persons per family, with single female/mother families (121 | 17.8%) accounting for the largest median family size of 4.09 persons per family. On the other hand, single male/father families (105 | 15.5%) represent the smallest median family size with 2.16 persons per family.
| Family Type | # Families | Family Size |
| Married-Couple | 453 (66.7%) | 2.77 |
| Single Male/Father | 105 (15.5%) | 2.16 |
| Single Female/Mother | 121 (17.8%) | 4.09 |
| Total Families | 679 (100.0%) | 2.91 |
Median Household Size in Hawthorne
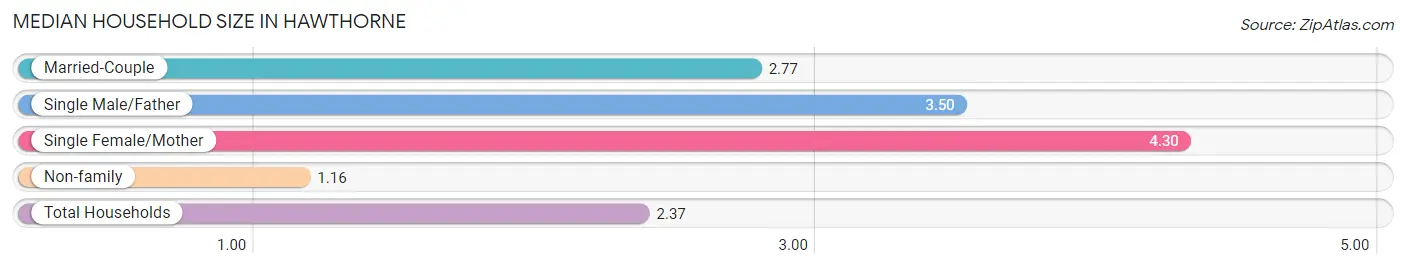
The median household size in Hawthorne is 2.37 persons per household, with single female/mother households (121 | 10.8%) accounting for the largest median household size of 4.3 persons per household. non-family households (441 | 39.4%) represent the smallest median household size with 1.16 persons per household.
| Household Type | # Households | Household Size |
| Married-Couple | 453 (40.5%) | 2.77 |
| Single Male/Father | 105 (9.4%) | 3.50 |
| Single Female/Mother | 121 (10.8%) | 4.30 |
| Non-family | 441 (39.4%) | 1.16 |
| Total Households | 1,120 (100.0%) | 2.37 |
Household Size by Marriage Status in Hawthorne
Out of a total of 1,120 households in Hawthorne, 679 (60.6%) are family households, while 441 (39.4%) are nonfamily households. The most numerous type of family households are 2-person households, comprising 332, and the most common type of nonfamily households are 1-person households, comprising 390.
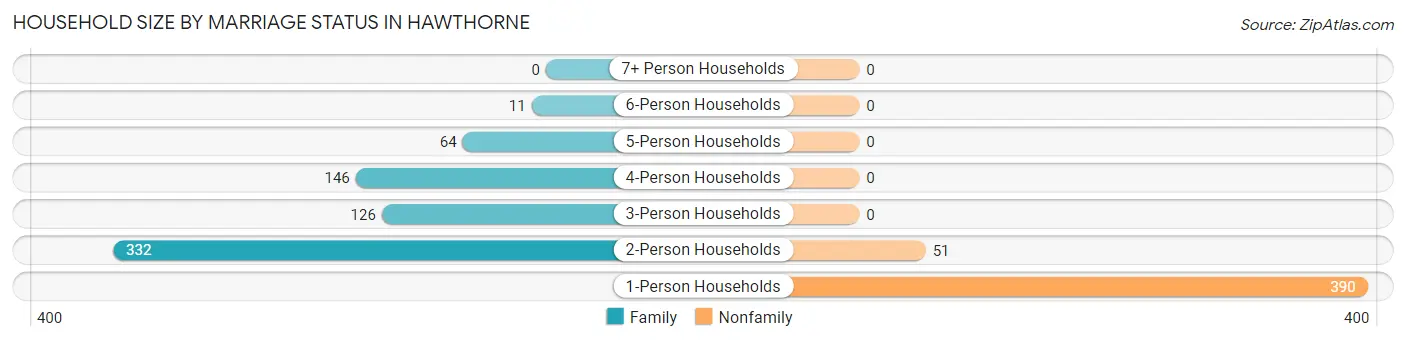
| Household Size | Family Households | Nonfamily Households |
| 1-Person Households | - | 390 (34.8%) |
| 2-Person Households | 332 (29.6%) | 51 (4.5%) |
| 3-Person Households | 126 (11.3%) | 0 (0.0%) |
| 4-Person Households | 146 (13.0%) | 0 (0.0%) |
| 5-Person Households | 64 (5.7%) | 0 (0.0%) |
| 6-Person Households | 11 (1.0%) | 0 (0.0%) |
| 7+ Person Households | 0 (0.0%) | 0 (0.0%) |
| Total | 679 (60.6%) | 441 (39.4%) |
Female Fertility in Hawthorne
Fertility by Age in Hawthorne
Average fertility rate in Hawthorne is 105.0 births per 1,000 women. Women in the age bracket of 15 to 19 years have the highest fertility rate with 433.0 births per 1,000 women. Women in the age bracket of 15 to 19 years acount for 100.0% of all women with births.
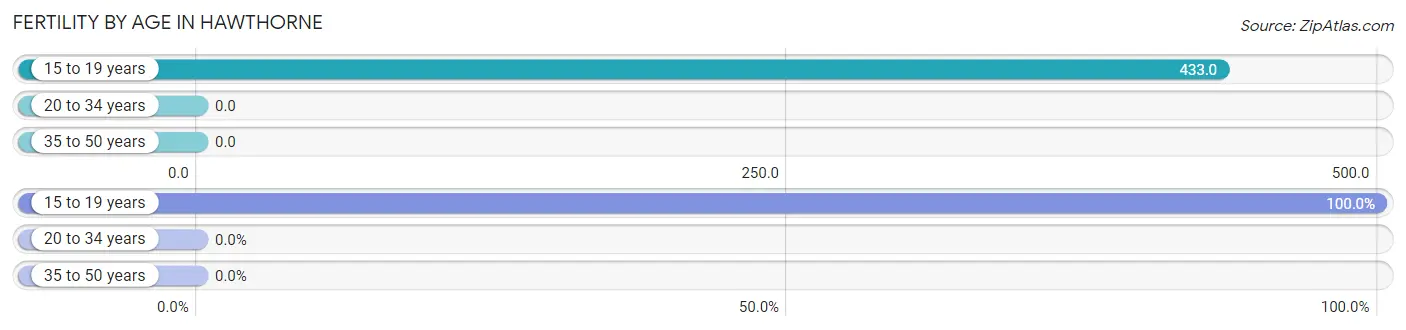
| Age Bracket | Women with Births | Births / 1,000 Women |
| 15 to 19 years | 71 (100.0%) | 433.0 |
| 20 to 34 years | 0 (0.0%) | 0.0 |
| 35 to 50 years | 0 (0.0%) | 0.0 |
| Total | 71 (100.0%) | 105.0 |
Fertility by Age by Marriage Status in Hawthorne
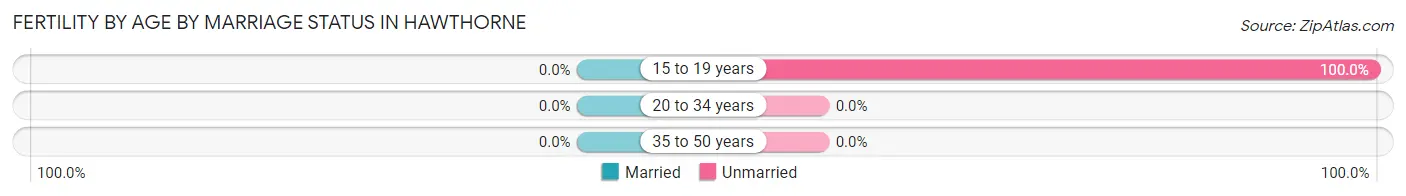
| Age Bracket | Married | Unmarried |
| 15 to 19 years | 0 (0.0%) | 71 (100.0%) |
| 20 to 34 years | 0 (0.0%) | 0 (0.0%) |
| 35 to 50 years | 0 (0.0%) | 0 (0.0%) |
| Total | 0 (0.0%) | 71 (100.0%) |
Fertility by Education in Hawthorne
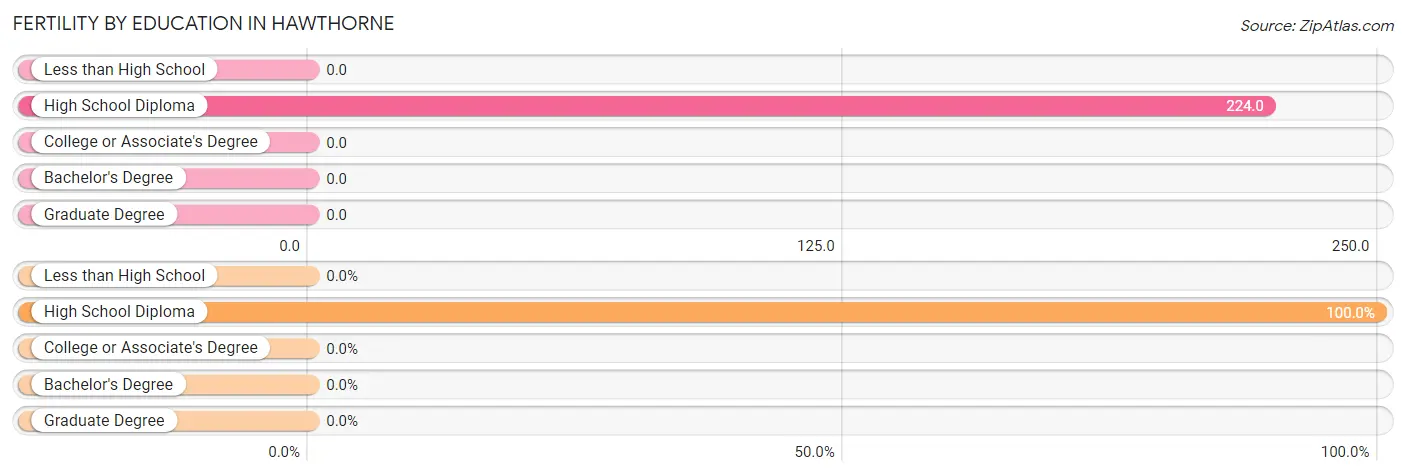
| Educational Attainment | Women with Births | Births / 1,000 Women |
| Less than High School | 0 (0.0%) | 0.0 |
| High School Diploma | 71 (100.0%) | 224.0 |
| College or Associate's Degree | 0 (0.0%) | 0.0 |
| Bachelor's Degree | 0 (0.0%) | 0.0 |
| Graduate Degree | 0 (0.0%) | 0.0 |
| Total | 71 (100.0%) | 105.0 |
Fertility by Education by Marriage Status in Hawthorne
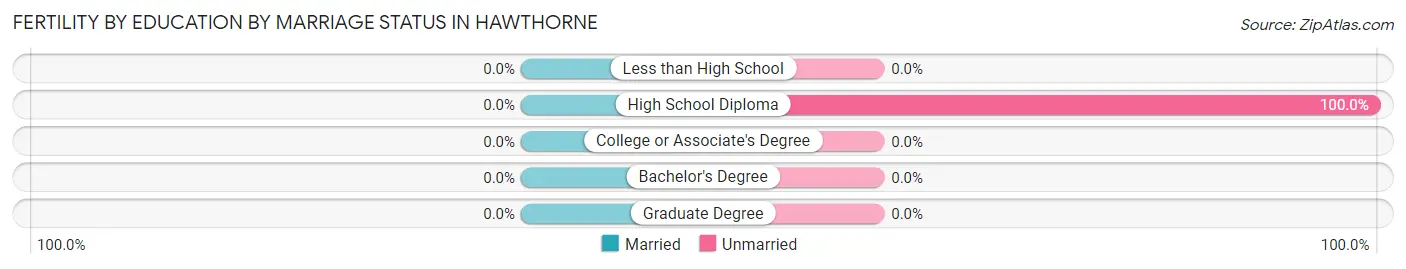
| Educational Attainment | Married | Unmarried |
| Less than High School | 0 (0.0%) | 0 (0.0%) |
| High School Diploma | 0 (0.0%) | 71 (100.0%) |
| College or Associate's Degree | 0 (0.0%) | 0 (0.0%) |
| Bachelor's Degree | 0 (0.0%) | 0 (0.0%) |
| Graduate Degree | 0 (0.0%) | 0 (0.0%) |
| Total | 0 (0.0%) | 71 (100.0%) |
Employment Characteristics in Hawthorne
Employment by Class of Employer in Hawthorne
Among the 1,117 employed individuals in Hawthorne, private company employees (646 | 57.8%), local government employees (232 | 20.8%), and federal government employees (170 | 15.2%) make up the most common classes of employment.
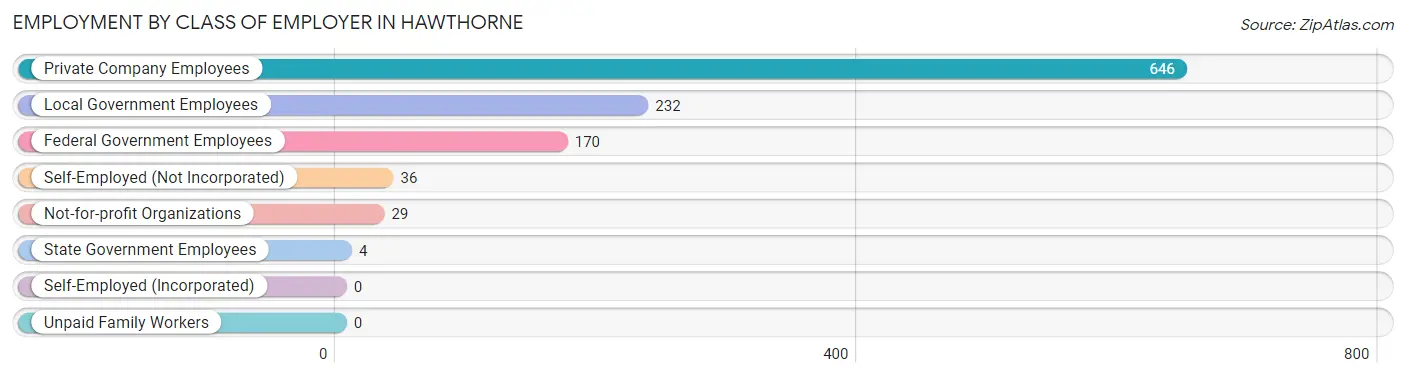
| Employer Class | # Employees | % Employees |
| Private Company Employees | 646 | 57.8% |
| Self-Employed (Incorporated) | 0 | 0.0% |
| Self-Employed (Not Incorporated) | 36 | 3.2% |
| Not-for-profit Organizations | 29 | 2.6% |
| Local Government Employees | 232 | 20.8% |
| State Government Employees | 4 | 0.4% |
| Federal Government Employees | 170 | 15.2% |
| Unpaid Family Workers | 0 | 0.0% |
| Total | 1,117 | 100.0% |
Employment Status by Age in Hawthorne
According to the labor force statistics for Hawthorne, out of the total population over 16 years of age (2,246), 50.9% or 1,143 individuals are in the labor force, with 2.3% or 26 of them unemployed. The age group with the highest labor force participation rate is 20 to 24 years, with 100.0% or 86 individuals in the labor force. Within the labor force, the 45 to 54 years age range has the highest percentage of unemployed individuals, with 15.8% or 18 of them being unemployed.
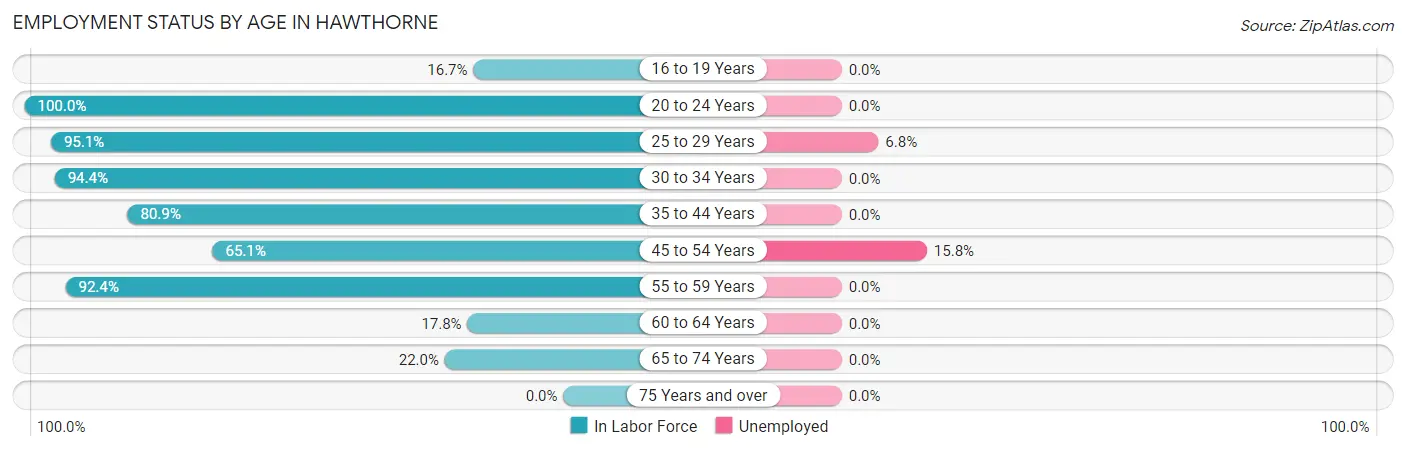
| Age Bracket | In Labor Force | Unemployed |
| 16 to 19 Years | 29 (16.7%) | 0 (0.0%) |
| 20 to 24 Years | 86 (100.0%) | 0 (0.0%) |
| 25 to 29 Years | 117 (95.1%) | 8 (6.8%) |
| 30 to 34 Years | 204 (94.4%) | 0 (0.0%) |
| 35 to 44 Years | 397 (80.9%) | 0 (0.0%) |
| 45 to 54 Years | 114 (65.1%) | 18 (15.8%) |
| 55 to 59 Years | 73 (92.4%) | 0 (0.0%) |
| 60 to 64 Years | 26 (17.8%) | 0 (0.0%) |
| 65 to 74 Years | 97 (22.0%) | 0 (0.0%) |
| 75 Years and over | 0 (0.0%) | 0 (0.0%) |
| Total | 1,143 (50.9%) | 26 (2.3%) |
Employment Status by Educational Attainment in Hawthorne
According to labor force statistics for Hawthorne, 75.7% of individuals (931) out of the total population between 25 and 64 years of age (1,230) are in the labor force, with 2.8% or 26 of them being unemployed. The group with the highest labor force participation rate are those with the educational attainment of high school diploma, with 88.2% or 441 individuals in the labor force. Within the labor force, individuals with college / associate degree education have the highest percentage of unemployment, with 6.1% or 18 of them being unemployed.
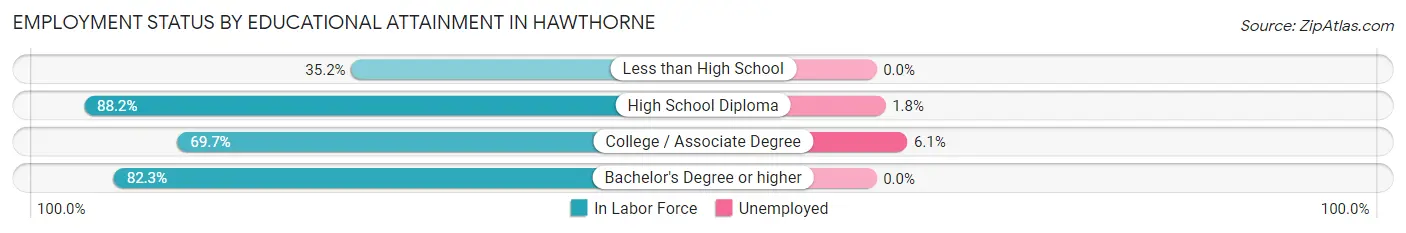
| Educational Attainment | In Labor Force | Unemployed |
| Less than High School | 43 (35.2%) | 0 (0.0%) |
| High School Diploma | 441 (88.2%) | 9 (1.8%) |
| College / Associate Degree | 294 (69.7%) | 26 (6.1%) |
| Bachelor's Degree or higher | 153 (82.3%) | 0 (0.0%) |
| Total | 931 (75.7%) | 34 (2.8%) |
Employment Occupations by Sex in Hawthorne
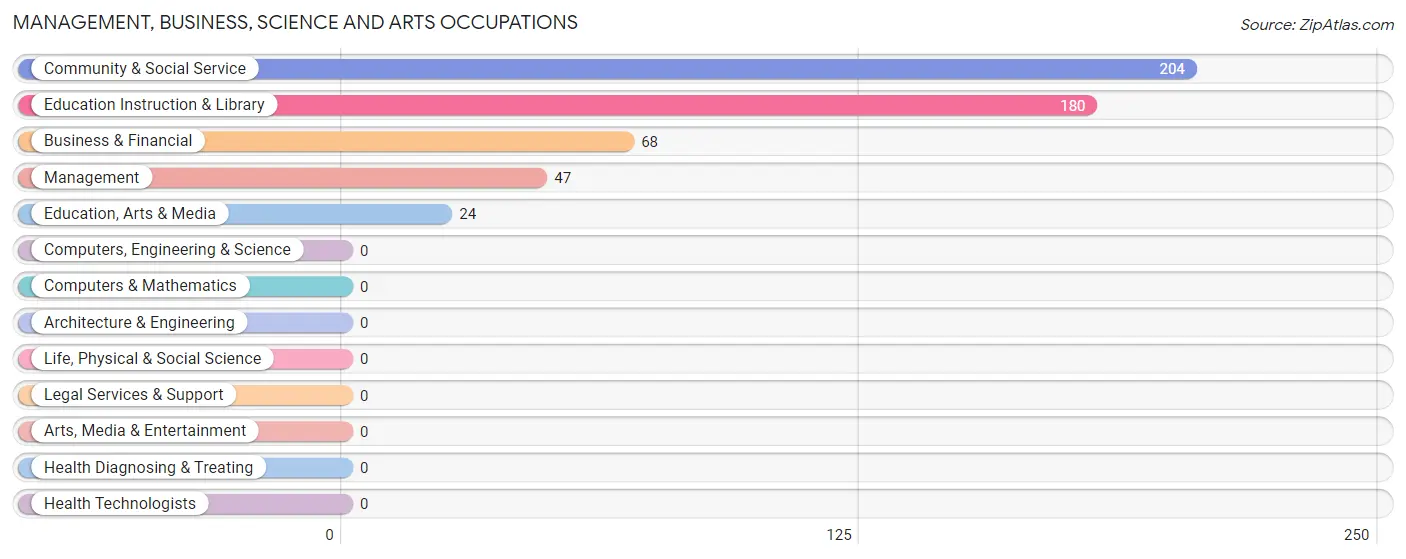
Management, Business, Science and Arts Occupations
The most common Management, Business, Science and Arts occupations in Hawthorne are Community & Social Service (204 | 18.3%), Education Instruction & Library (180 | 16.1%), Business & Financial (68 | 6.1%), Management (47 | 4.2%), and Education, Arts & Media (24 | 2.1%).
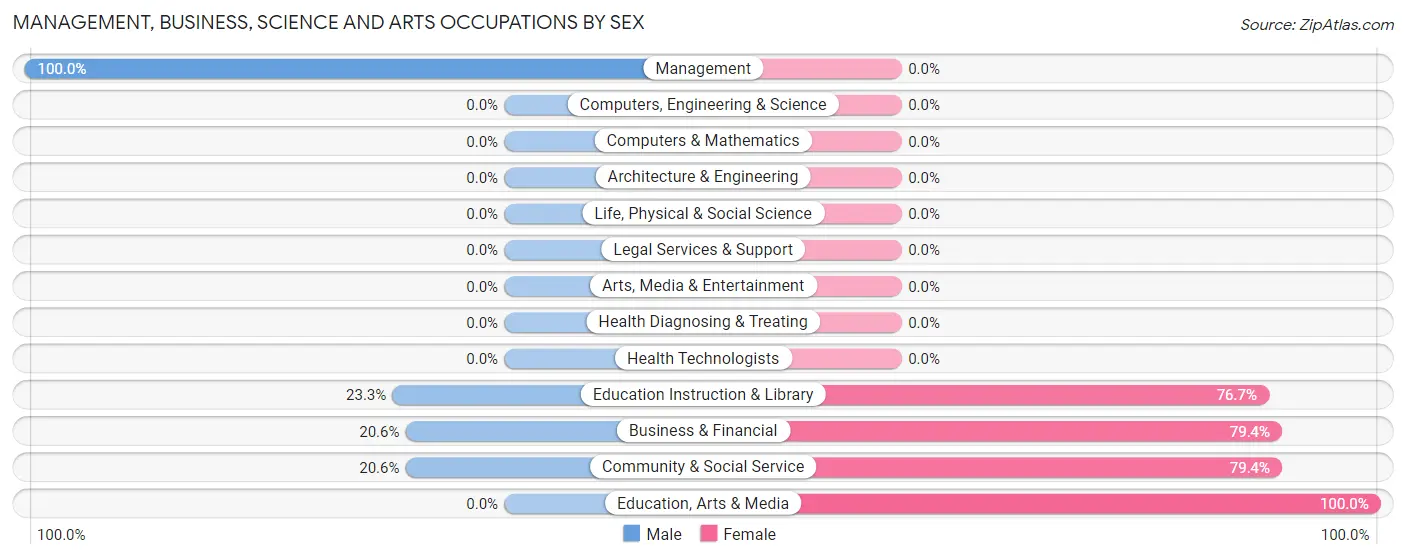
Management, Business, Science and Arts Occupations by Sex
Within the Management, Business, Science and Arts occupations in Hawthorne, the most male-oriented occupations are Management (100.0%), Education Instruction & Library (23.3%), and Business & Financial (20.6%), while the most female-oriented occupations are Education, Arts & Media (100.0%), Business & Financial (79.4%), and Community & Social Service (79.4%).
| Occupation | Male | Female |
| Management | 47 (100.0%) | 0 (0.0%) |
| Business & Financial | 14 (20.6%) | 54 (79.4%) |
| Computers, Engineering & Science | 0 (0.0%) | 0 (0.0%) |
| Computers & Mathematics | 0 (0.0%) | 0 (0.0%) |
| Architecture & Engineering | 0 (0.0%) | 0 (0.0%) |
| Life, Physical & Social Science | 0 (0.0%) | 0 (0.0%) |
| Community & Social Service | 42 (20.6%) | 162 (79.4%) |
| Education, Arts & Media | 0 (0.0%) | 24 (100.0%) |
| Legal Services & Support | 0 (0.0%) | 0 (0.0%) |
| Education Instruction & Library | 42 (23.3%) | 138 (76.7%) |
| Arts, Media & Entertainment | 0 (0.0%) | 0 (0.0%) |
| Health Diagnosing & Treating | 0 (0.0%) | 0 (0.0%) |
| Health Technologists | 0 (0.0%) | 0 (0.0%) |
| Total (Category) | 103 (32.3%) | 216 (67.7%) |
| Total (Overall) | 519 (46.5%) | 598 (53.5%) |
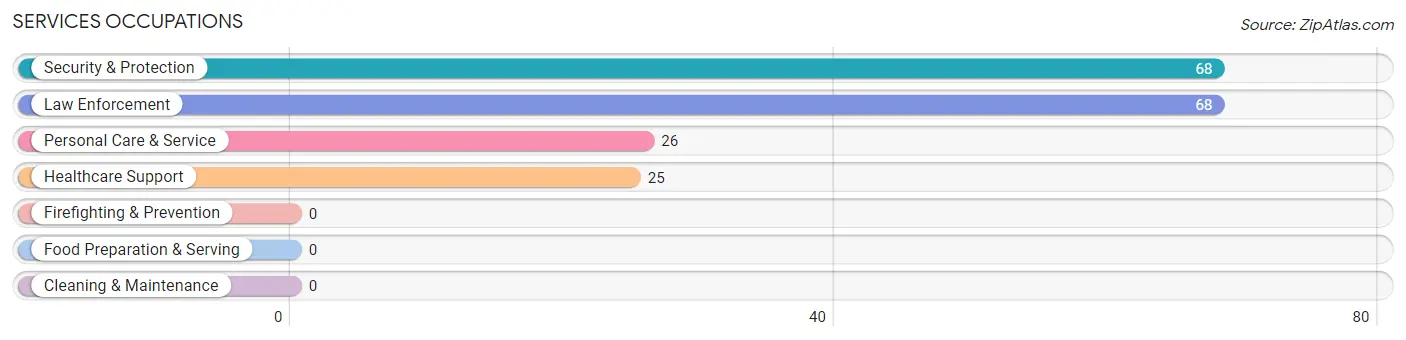
Services Occupations
The most common Services occupations in Hawthorne are Security & Protection (68 | 6.1%), Law Enforcement (68 | 6.1%), Personal Care & Service (26 | 2.3%), and Healthcare Support (25 | 2.2%).
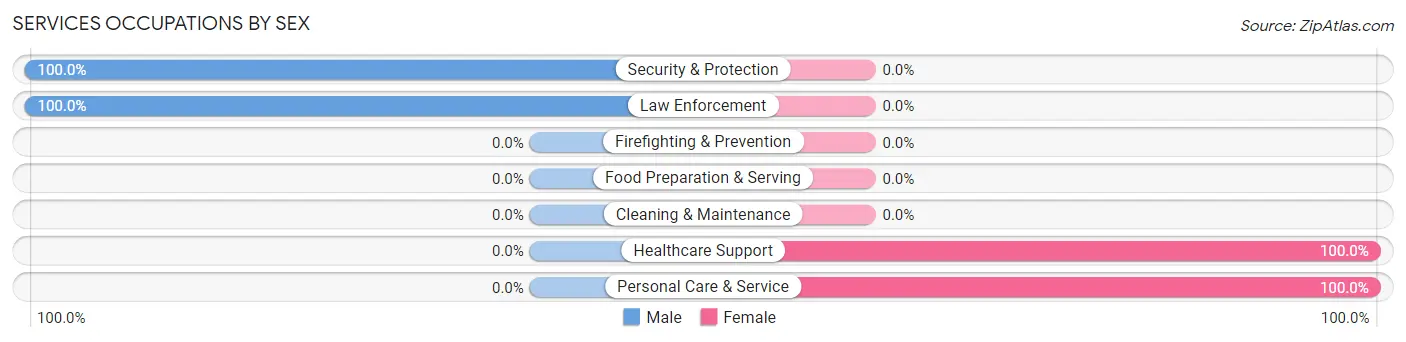
Services Occupations by Sex
Within the Services occupations in Hawthorne, the most male-oriented occupations are Security & Protection (100.0%), and Law Enforcement (100.0%), while the most female-oriented occupations are Healthcare Support (100.0%), and Personal Care & Service (100.0%).
| Occupation | Male | Female |
| Healthcare Support | 0 (0.0%) | 25 (100.0%) |
| Security & Protection | 68 (100.0%) | 0 (0.0%) |
| Firefighting & Prevention | 0 (0.0%) | 0 (0.0%) |
| Law Enforcement | 68 (100.0%) | 0 (0.0%) |
| Food Preparation & Serving | 0 (0.0%) | 0 (0.0%) |
| Cleaning & Maintenance | 0 (0.0%) | 0 (0.0%) |
| Personal Care & Service | 0 (0.0%) | 26 (100.0%) |
| Total (Category) | 68 (57.1%) | 51 (42.9%) |
| Total (Overall) | 519 (46.5%) | 598 (53.5%) |
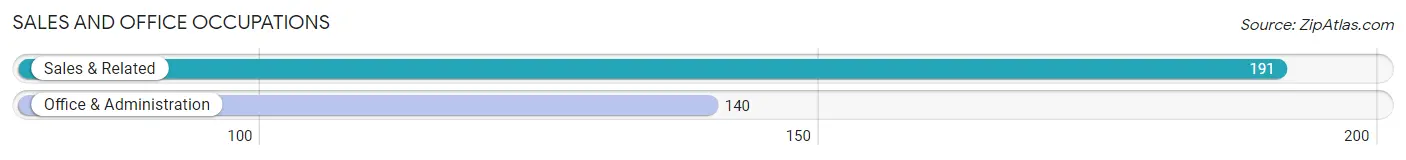
Sales and Office Occupations
The most common Sales and Office occupations in Hawthorne are Sales & Related (191 | 17.1%), and Office & Administration (140 | 12.5%).
Sales and Office Occupations by Sex
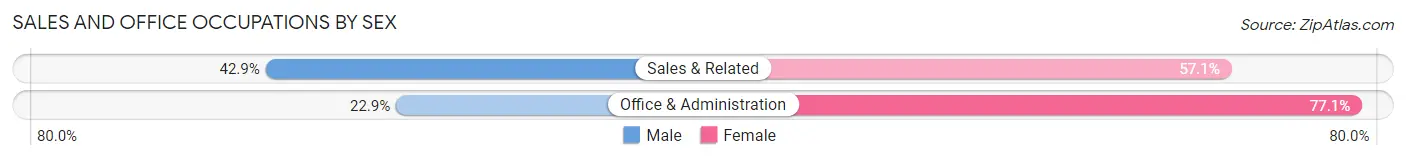
| Occupation | Male | Female |
| Sales & Related | 82 (42.9%) | 109 (57.1%) |
| Office & Administration | 32 (22.9%) | 108 (77.1%) |
| Total (Category) | 114 (34.4%) | 217 (65.6%) |
| Total (Overall) | 519 (46.5%) | 598 (53.5%) |
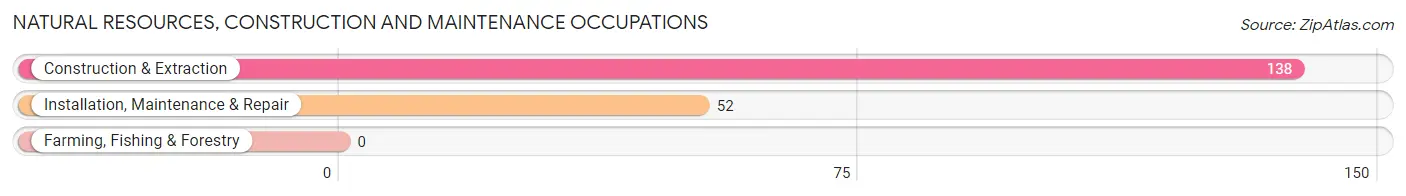
Natural Resources, Construction and Maintenance Occupations
The most common Natural Resources, Construction and Maintenance occupations in Hawthorne are Construction & Extraction (138 | 12.3%), and Installation, Maintenance & Repair (52 | 4.7%).
Natural Resources, Construction and Maintenance Occupations by Sex
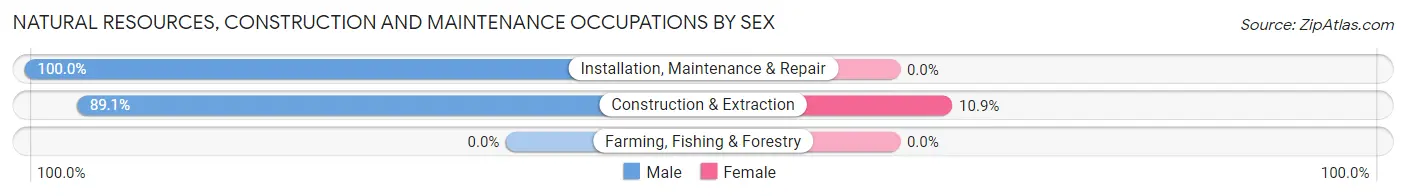
| Occupation | Male | Female |
| Farming, Fishing & Forestry | 0 (0.0%) | 0 (0.0%) |
| Construction & Extraction | 123 (89.1%) | 15 (10.9%) |
| Installation, Maintenance & Repair | 52 (100.0%) | 0 (0.0%) |
| Total (Category) | 175 (92.1%) | 15 (7.9%) |
| Total (Overall) | 519 (46.5%) | 598 (53.5%) |
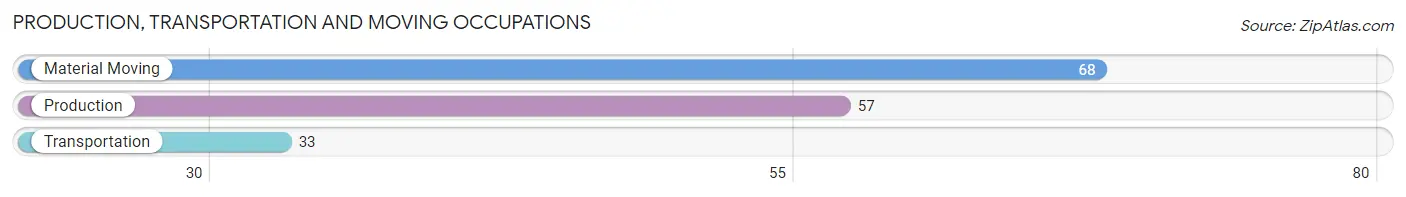
Production, Transportation and Moving Occupations
The most common Production, Transportation and Moving occupations in Hawthorne are Material Moving (68 | 6.1%), Production (57 | 5.1%), and Transportation (33 | 2.9%).
Production, Transportation and Moving Occupations by Sex
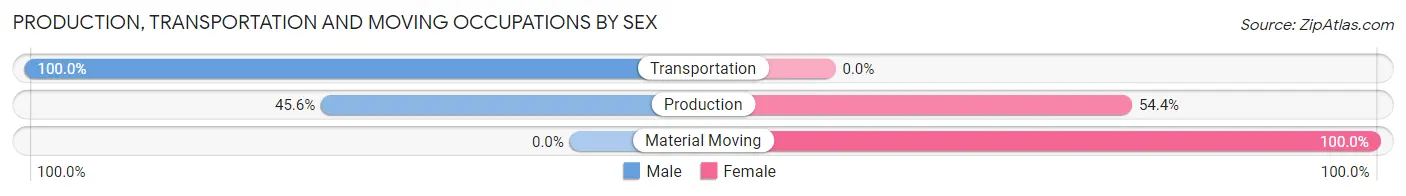
| Occupation | Male | Female |
| Production | 26 (45.6%) | 31 (54.4%) |
| Transportation | 33 (100.0%) | 0 (0.0%) |
| Material Moving | 0 (0.0%) | 68 (100.0%) |
| Total (Category) | 59 (37.3%) | 99 (62.7%) |
| Total (Overall) | 519 (46.5%) | 598 (53.5%) |
Employment Industries by Sex in Hawthorne
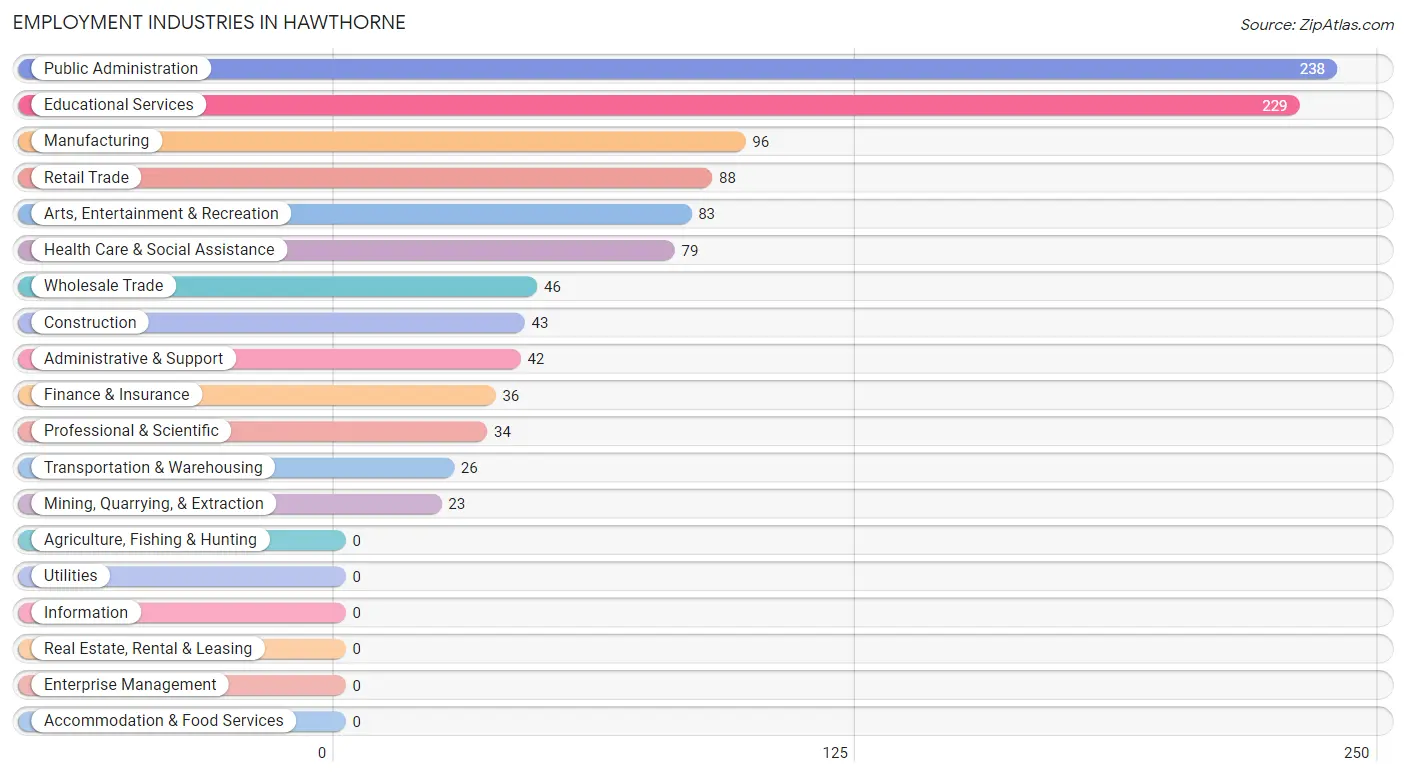
Employment Industries in Hawthorne
The major employment industries in Hawthorne include Public Administration (238 | 21.3%), Educational Services (229 | 20.5%), Manufacturing (96 | 8.6%), Retail Trade (88 | 7.9%), and Arts, Entertainment & Recreation (83 | 7.4%).
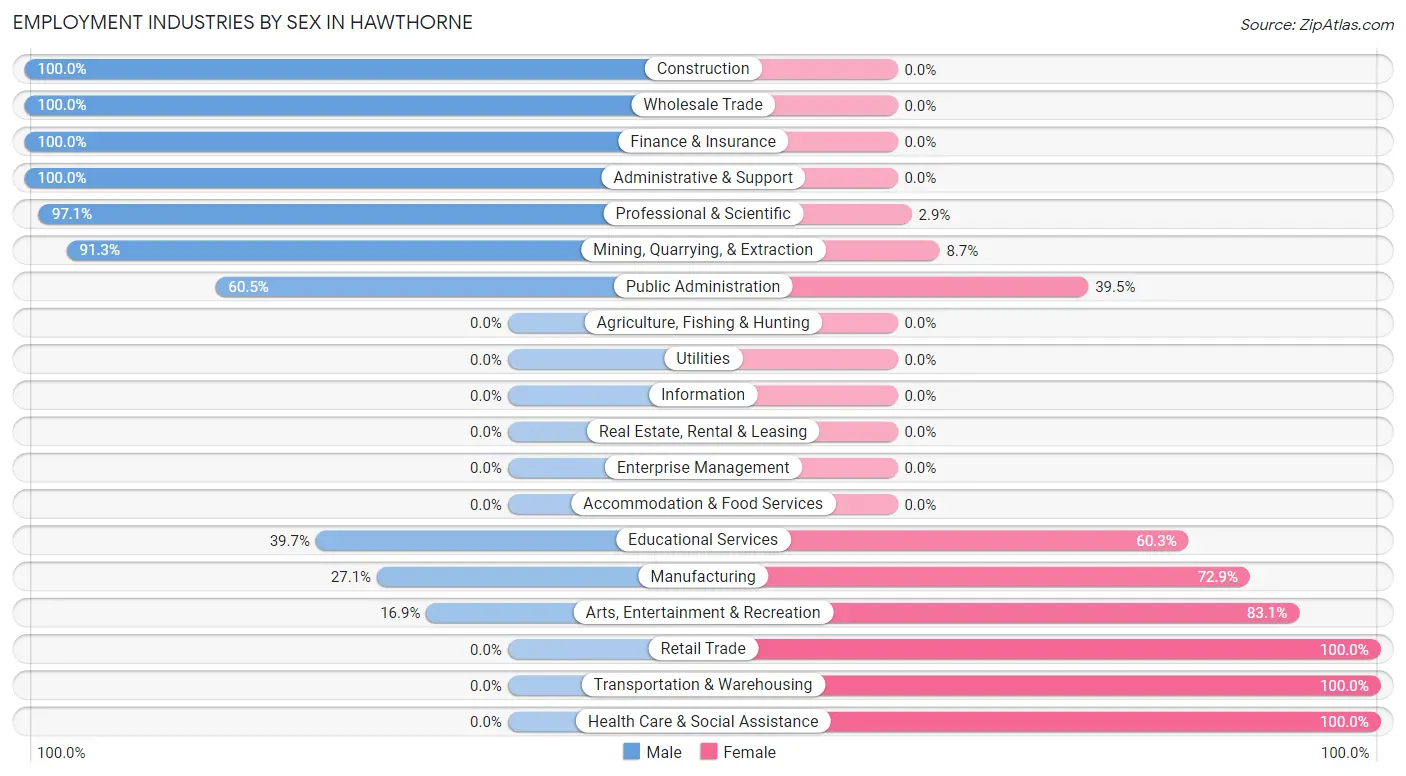
Employment Industries by Sex in Hawthorne
The Hawthorne industries that see more men than women are Construction (100.0%), Wholesale Trade (100.0%), and Finance & Insurance (100.0%), whereas the industries that tend to have a higher number of women are Retail Trade (100.0%), Transportation & Warehousing (100.0%), and Health Care & Social Assistance (100.0%).
| Industry | Male | Female |
| Agriculture, Fishing & Hunting | 0 (0.0%) | 0 (0.0%) |
| Mining, Quarrying, & Extraction | 21 (91.3%) | 2 (8.7%) |
| Construction | 43 (100.0%) | 0 (0.0%) |
| Manufacturing | 26 (27.1%) | 70 (72.9%) |
| Wholesale Trade | 46 (100.0%) | 0 (0.0%) |
| Retail Trade | 0 (0.0%) | 88 (100.0%) |
| Transportation & Warehousing | 0 (0.0%) | 26 (100.0%) |
| Utilities | 0 (0.0%) | 0 (0.0%) |
| Information | 0 (0.0%) | 0 (0.0%) |
| Finance & Insurance | 36 (100.0%) | 0 (0.0%) |
| Real Estate, Rental & Leasing | 0 (0.0%) | 0 (0.0%) |
| Professional & Scientific | 33 (97.1%) | 1 (2.9%) |
| Enterprise Management | 0 (0.0%) | 0 (0.0%) |
| Administrative & Support | 42 (100.0%) | 0 (0.0%) |
| Educational Services | 91 (39.7%) | 138 (60.3%) |
| Health Care & Social Assistance | 0 (0.0%) | 79 (100.0%) |
| Arts, Entertainment & Recreation | 14 (16.9%) | 69 (83.1%) |
| Accommodation & Food Services | 0 (0.0%) | 0 (0.0%) |
| Public Administration | 144 (60.5%) | 94 (39.5%) |
| Total | 519 (46.5%) | 598 (53.5%) |
Education in Hawthorne
School Enrollment in Hawthorne
The most common levels of schooling among the 525 students in Hawthorne are middle school (151 | 28.8%), college / undergraduate (127 | 24.2%), and high school (107 | 20.4%).
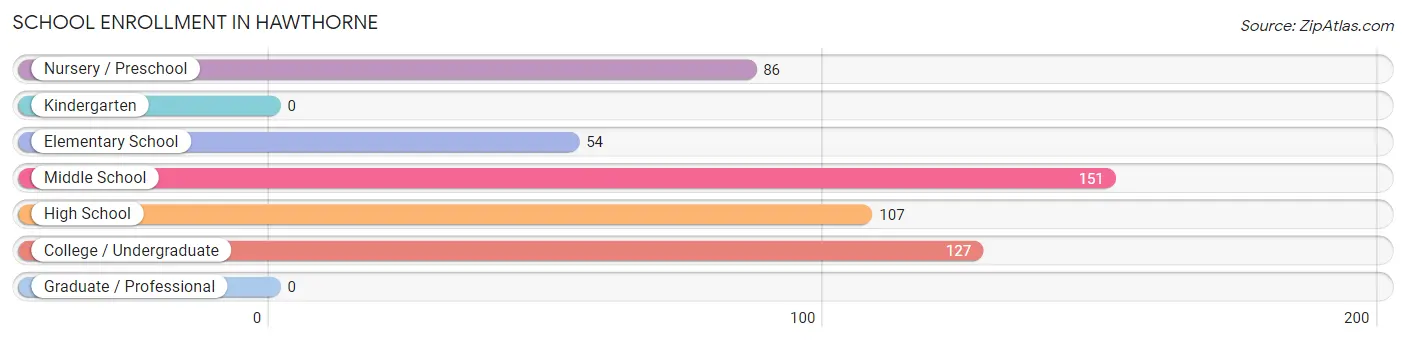
| School Level | # Students | % Students |
| Nursery / Preschool | 86 | 16.4% |
| Kindergarten | 0 | 0.0% |
| Elementary School | 54 | 10.3% |
| Middle School | 151 | 28.8% |
| High School | 107 | 20.4% |
| College / Undergraduate | 127 | 24.2% |
| Graduate / Professional | 0 | 0.0% |
| Total | 525 | 100.0% |
School Enrollment by Age by Funding Source in Hawthorne
Out of a total of 525 students who are enrolled in schools in Hawthorne, 109 (20.8%) attend a private institution, while the remaining 416 (79.2%) are enrolled in public schools. The age group of 35 years and over has the highest likelihood of being enrolled in private schools, with 68 (100.0% in the age bracket) enrolled. Conversely, the age group of 5 to 9 year old has the lowest likelihood of being enrolled in a private school, with 33 (100.0% in the age bracket) attending a public institution.
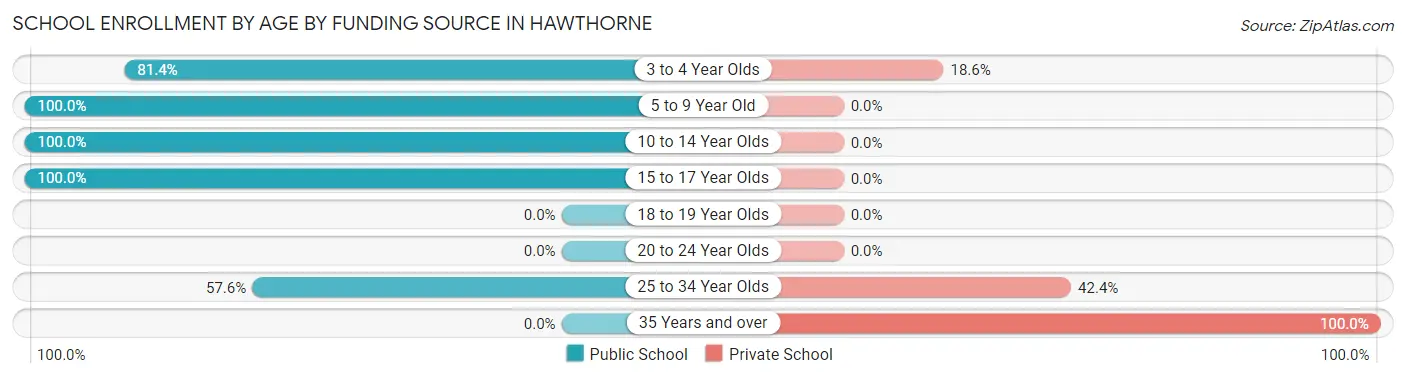
| Age Bracket | Public School | Private School |
| 3 to 4 Year Olds | 70 (81.4%) | 16 (18.6%) |
| 5 to 9 Year Old | 33 (100.0%) | 0 (0.0%) |
| 10 to 14 Year Olds | 235 (100.0%) | 0 (0.0%) |
| 15 to 17 Year Olds | 44 (100.0%) | 0 (0.0%) |
| 18 to 19 Year Olds | 0 (0.0%) | 0 (0.0%) |
| 20 to 24 Year Olds | 0 (0.0%) | 0 (0.0%) |
| 25 to 34 Year Olds | 34 (57.6%) | 25 (42.4%) |
| 35 Years and over | 0 (0.0%) | 68 (100.0%) |
| Total | 416 (79.2%) | 109 (20.8%) |
Educational Attainment by Field of Study in Hawthorne
Arts & humanities (114 | 30.1%), business (75 | 19.8%), engineering (62 | 16.4%), liberal arts & history (38 | 10.0%), and social sciences (28 | 7.4%) are the most common fields of study among 379 individuals in Hawthorne who have obtained a bachelor's degree or higher.
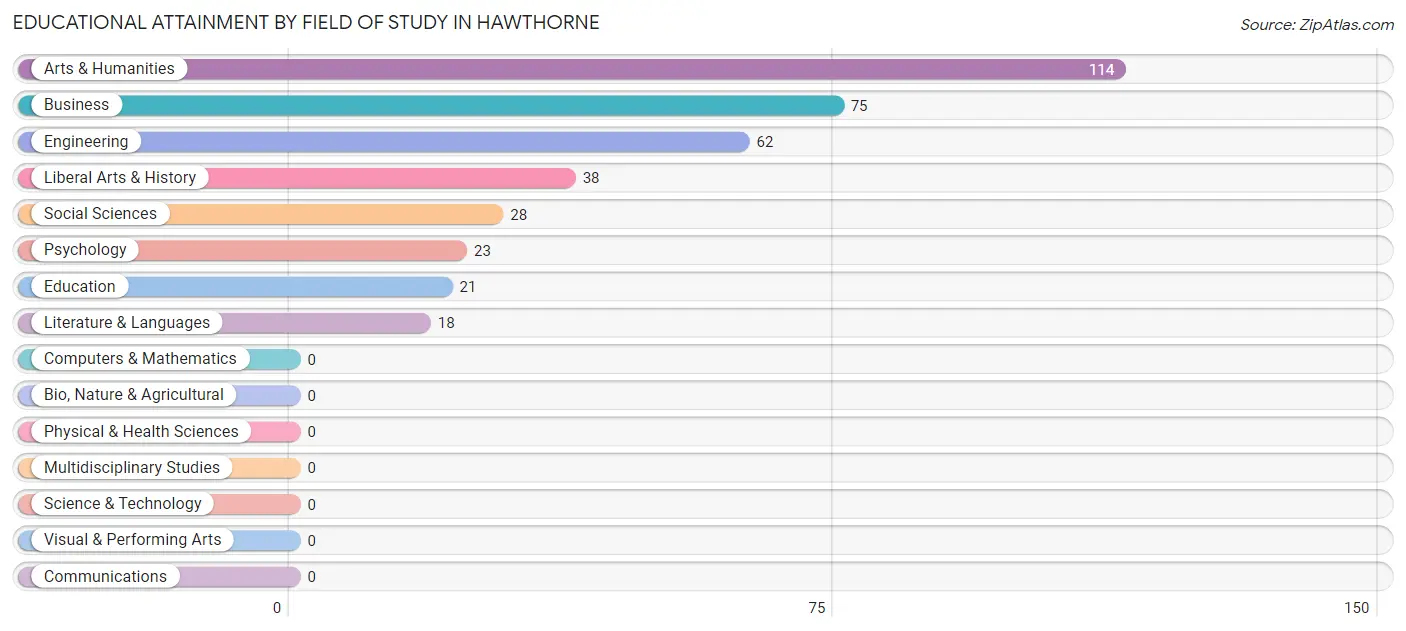
| Field of Study | # Graduates | % Graduates |
| Computers & Mathematics | 0 | 0.0% |
| Bio, Nature & Agricultural | 0 | 0.0% |
| Physical & Health Sciences | 0 | 0.0% |
| Psychology | 23 | 6.1% |
| Social Sciences | 28 | 7.4% |
| Engineering | 62 | 16.4% |
| Multidisciplinary Studies | 0 | 0.0% |
| Science & Technology | 0 | 0.0% |
| Business | 75 | 19.8% |
| Education | 21 | 5.5% |
| Literature & Languages | 18 | 4.8% |
| Liberal Arts & History | 38 | 10.0% |
| Visual & Performing Arts | 0 | 0.0% |
| Communications | 0 | 0.0% |
| Arts & Humanities | 114 | 30.1% |
| Total | 379 | 100.0% |
Transportation & Commute in Hawthorne
Vehicle Availability by Sex in Hawthorne
The most prevalent vehicle ownership categories in Hawthorne are males with 2 vehicles (175, accounting for 33.7%) and females with 2 vehicles (85, making up 29.3%).
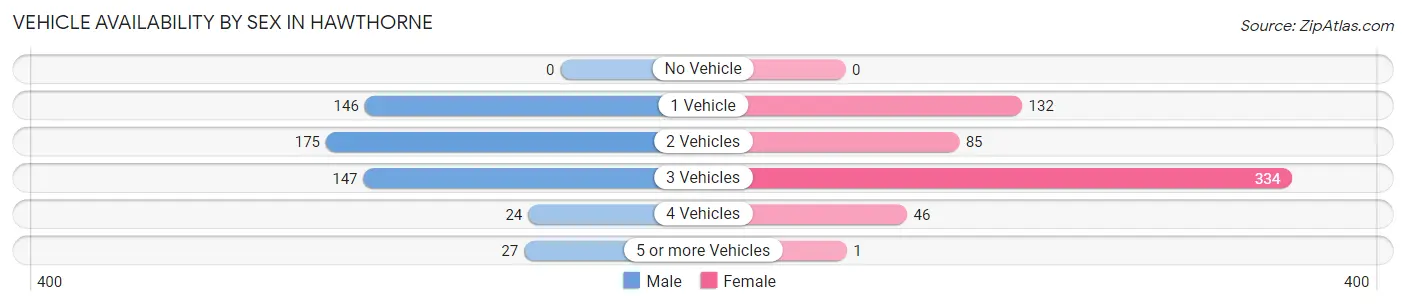
| Vehicles Available | Male | Female |
| No Vehicle | 0 (0.0%) | 0 (0.0%) |
| 1 Vehicle | 146 (28.1%) | 132 (22.1%) |
| 2 Vehicles | 175 (33.7%) | 85 (14.2%) |
| 3 Vehicles | 147 (28.3%) | 334 (55.8%) |
| 4 Vehicles | 24 (4.6%) | 46 (7.7%) |
| 5 or more Vehicles | 27 (5.2%) | 1 (0.2%) |
| Total | 519 (100.0%) | 598 (100.0%) |
Commute Time in Hawthorne
The most frequently occuring commute durations in Hawthorne are 5 to 9 minutes (372 commuters, 34.0%), less than 5 minutes (242 commuters, 22.1%), and 10 to 14 minutes (213 commuters, 19.5%).
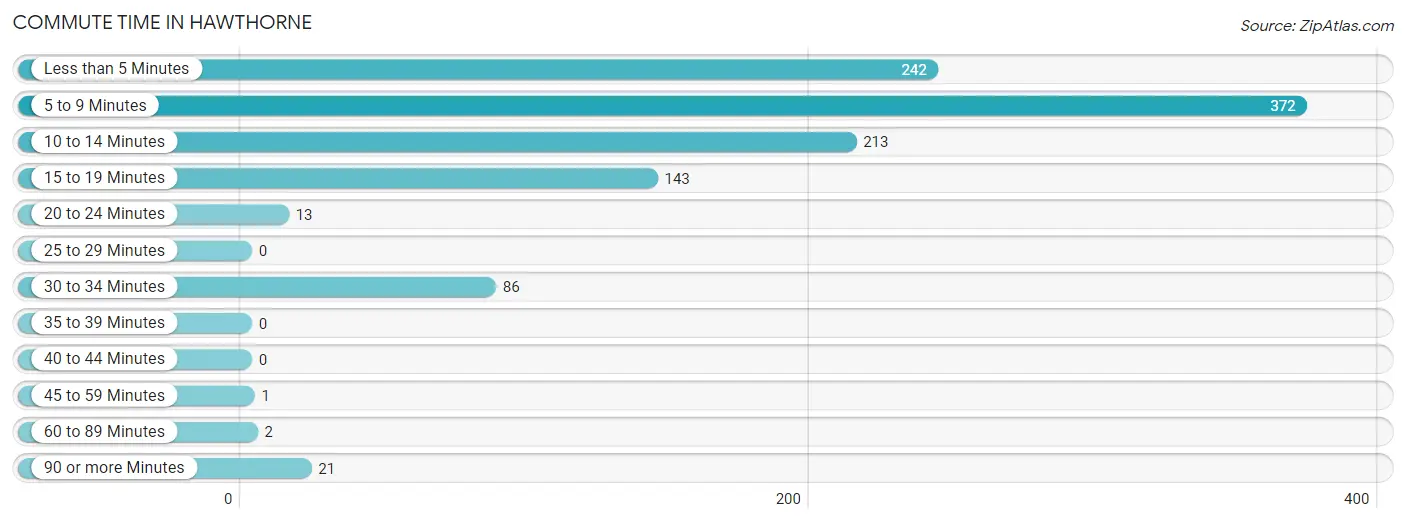
| Commute Time | # Commuters | % Commuters |
| Less than 5 Minutes | 242 | 22.1% |
| 5 to 9 Minutes | 372 | 34.0% |
| 10 to 14 Minutes | 213 | 19.5% |
| 15 to 19 Minutes | 143 | 13.1% |
| 20 to 24 Minutes | 13 | 1.2% |
| 25 to 29 Minutes | 0 | 0.0% |
| 30 to 34 Minutes | 86 | 7.9% |
| 35 to 39 Minutes | 0 | 0.0% |
| 40 to 44 Minutes | 0 | 0.0% |
| 45 to 59 Minutes | 1 | 0.1% |
| 60 to 89 Minutes | 2 | 0.2% |
| 90 or more Minutes | 21 | 1.9% |
Commute Time by Sex in Hawthorne
The most common commute times in Hawthorne are 10 to 14 minutes (158 commuters, 30.4%) for males and 5 to 9 minutes (245 commuters, 42.7%) for females.
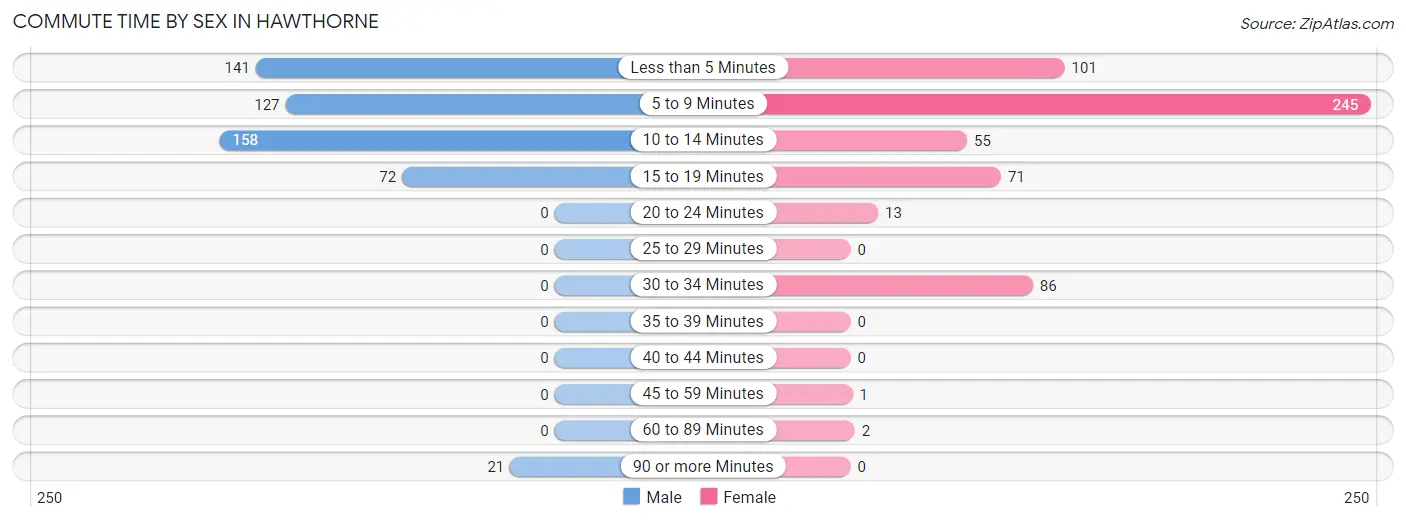
| Commute Time | Male | Female |
| Less than 5 Minutes | 141 (27.2%) | 101 (17.6%) |
| 5 to 9 Minutes | 127 (24.5%) | 245 (42.7%) |
| 10 to 14 Minutes | 158 (30.4%) | 55 (9.6%) |
| 15 to 19 Minutes | 72 (13.9%) | 71 (12.4%) |
| 20 to 24 Minutes | 0 (0.0%) | 13 (2.3%) |
| 25 to 29 Minutes | 0 (0.0%) | 0 (0.0%) |
| 30 to 34 Minutes | 0 (0.0%) | 86 (15.0%) |
| 35 to 39 Minutes | 0 (0.0%) | 0 (0.0%) |
| 40 to 44 Minutes | 0 (0.0%) | 0 (0.0%) |
| 45 to 59 Minutes | 0 (0.0%) | 1 (0.2%) |
| 60 to 89 Minutes | 0 (0.0%) | 2 (0.4%) |
| 90 or more Minutes | 21 (4.1%) | 0 (0.0%) |
Time of Departure to Work by Sex in Hawthorne
The most frequent times of departure to work in Hawthorne are 6:00 AM to 6:29 AM (195, 37.6%) for males and 7:30 AM to 7:59 AM (107, 18.6%) for females.
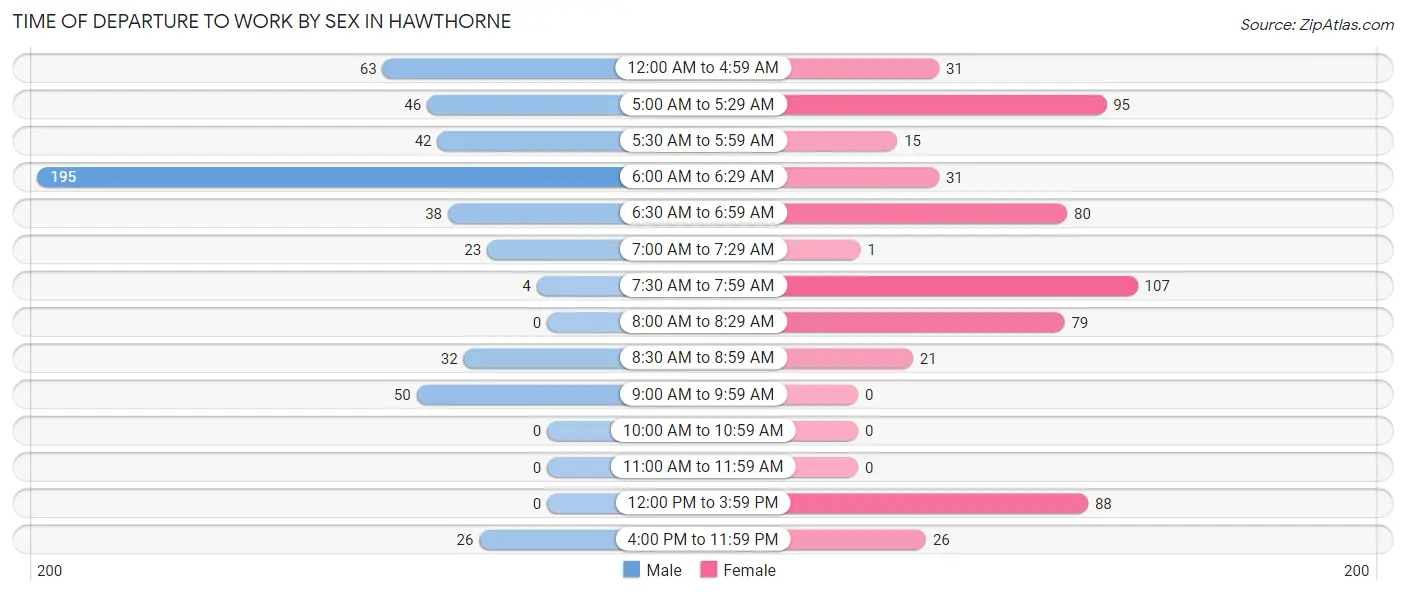
| Time of Departure | Male | Female |
| 12:00 AM to 4:59 AM | 63 (12.1%) | 31 (5.4%) |
| 5:00 AM to 5:29 AM | 46 (8.9%) | 95 (16.6%) |
| 5:30 AM to 5:59 AM | 42 (8.1%) | 15 (2.6%) |
| 6:00 AM to 6:29 AM | 195 (37.6%) | 31 (5.4%) |
| 6:30 AM to 6:59 AM | 38 (7.3%) | 80 (13.9%) |
| 7:00 AM to 7:29 AM | 23 (4.4%) | 1 (0.2%) |
| 7:30 AM to 7:59 AM | 4 (0.8%) | 107 (18.6%) |
| 8:00 AM to 8:29 AM | 0 (0.0%) | 79 (13.8%) |
| 8:30 AM to 8:59 AM | 32 (6.2%) | 21 (3.7%) |
| 9:00 AM to 9:59 AM | 50 (9.6%) | 0 (0.0%) |
| 10:00 AM to 10:59 AM | 0 (0.0%) | 0 (0.0%) |
| 11:00 AM to 11:59 AM | 0 (0.0%) | 0 (0.0%) |
| 12:00 PM to 3:59 PM | 0 (0.0%) | 88 (15.3%) |
| 4:00 PM to 11:59 PM | 26 (5.0%) | 26 (4.5%) |
| Total | 519 (100.0%) | 574 (100.0%) |
Housing Occupancy in Hawthorne
Occupancy by Ownership in Hawthorne
Of the total 1,120 dwellings in Hawthorne, owner-occupied units account for 819 (73.1%), while renter-occupied units make up 301 (26.9%).
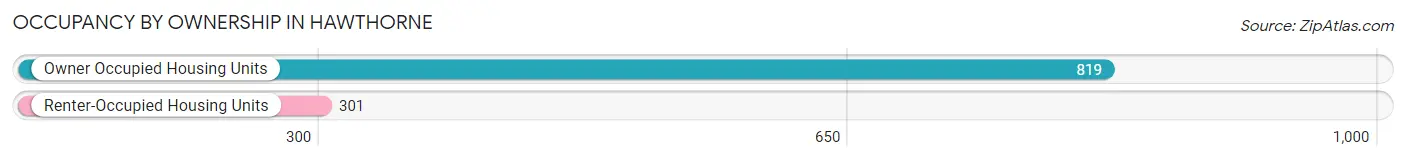
| Occupancy | # Housing Units | % Housing Units |
| Owner Occupied Housing Units | 819 | 73.1% |
| Renter-Occupied Housing Units | 301 | 26.9% |
| Total Occupied Housing Units | 1,120 | 100.0% |
Occupancy by Household Size in Hawthorne
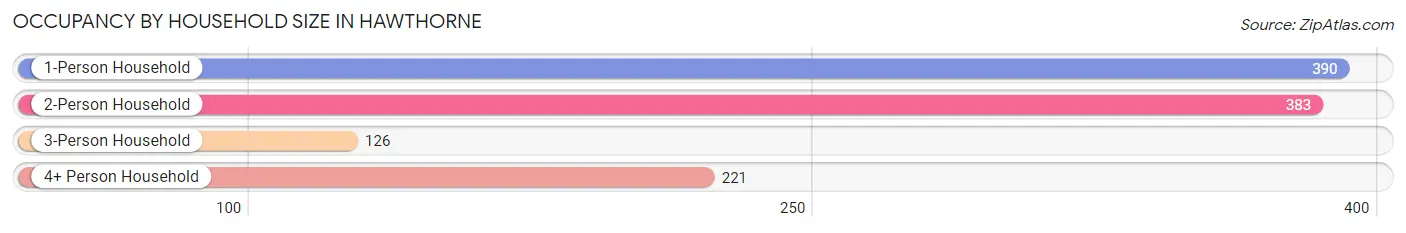
| Household Size | # Housing Units | % Housing Units |
| 1-Person Household | 390 | 34.8% |
| 2-Person Household | 383 | 34.2% |
| 3-Person Household | 126 | 11.3% |
| 4+ Person Household | 221 | 19.7% |
| Total Housing Units | 1,120 | 100.0% |
Occupancy by Ownership by Household Size in Hawthorne
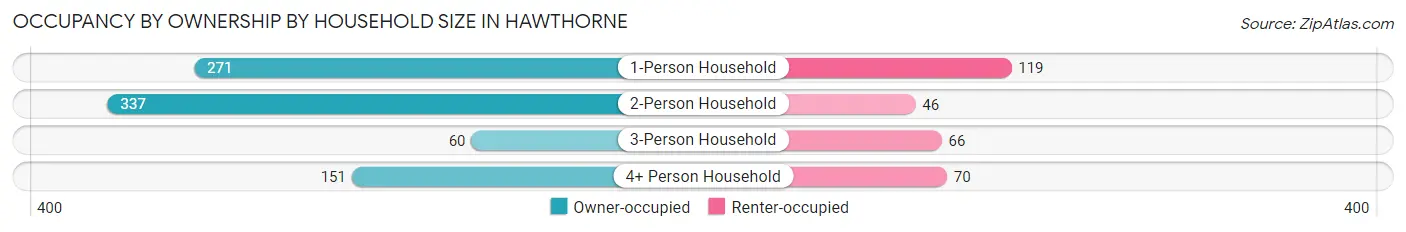
| Household Size | Owner-occupied | Renter-occupied |
| 1-Person Household | 271 (69.5%) | 119 (30.5%) |
| 2-Person Household | 337 (88.0%) | 46 (12.0%) |
| 3-Person Household | 60 (47.6%) | 66 (52.4%) |
| 4+ Person Household | 151 (68.3%) | 70 (31.7%) |
| Total Housing Units | 819 (73.1%) | 301 (26.9%) |
Occupancy by Educational Attainment in Hawthorne
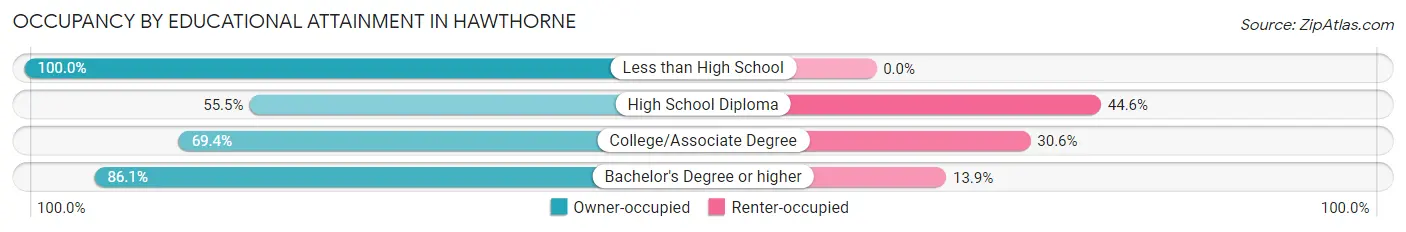
| Household Size | Owner-occupied | Renter-occupied |
| Less than High School | 128 (100.0%) | 0 (0.0%) |
| High School Diploma | 168 (55.4%) | 135 (44.6%) |
| College/Associate Degree | 293 (69.4%) | 129 (30.6%) |
| Bachelor's Degree or higher | 230 (86.1%) | 37 (13.9%) |
Occupancy by Age of Householder in Hawthorne
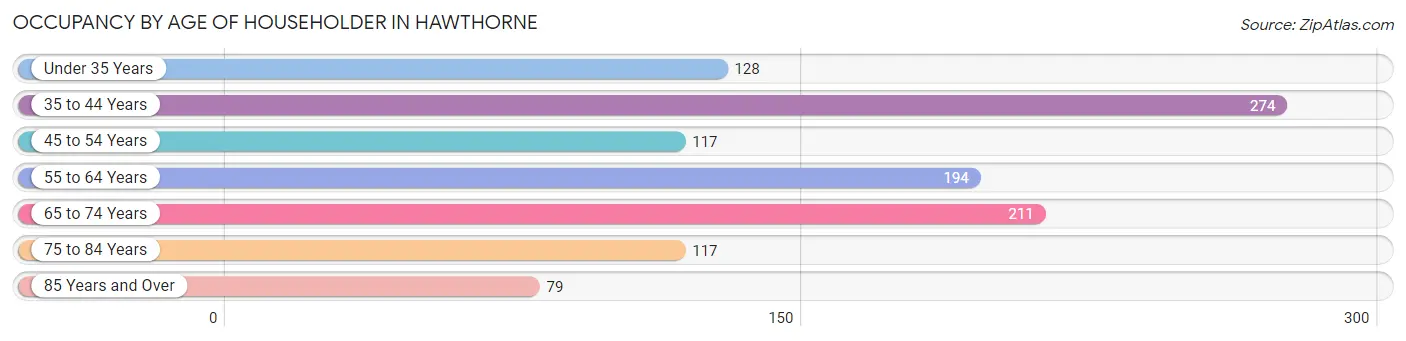
| Age Bracket | # Households | % Households |
| Under 35 Years | 128 | 11.4% |
| 35 to 44 Years | 274 | 24.5% |
| 45 to 54 Years | 117 | 10.4% |
| 55 to 64 Years | 194 | 17.3% |
| 65 to 74 Years | 211 | 18.8% |
| 75 to 84 Years | 117 | 10.4% |
| 85 Years and Over | 79 | 7.0% |
| Total | 1,120 | 100.0% |
Housing Finances in Hawthorne
Median Income by Occupancy in Hawthorne
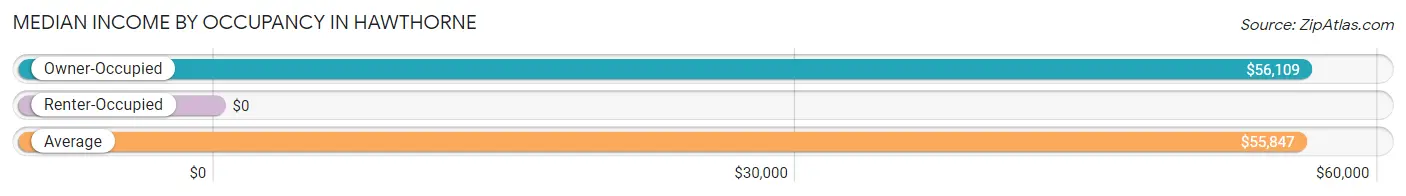
| Occupancy Type | # Households | Median Income |
| Owner-Occupied | 819 (73.1%) | $56,109 |
| Renter-Occupied | 301 (26.9%) | $0 |
| Average | 1,120 (100.0%) | $55,847 |
Occupancy by Householder Income Bracket in Hawthorne
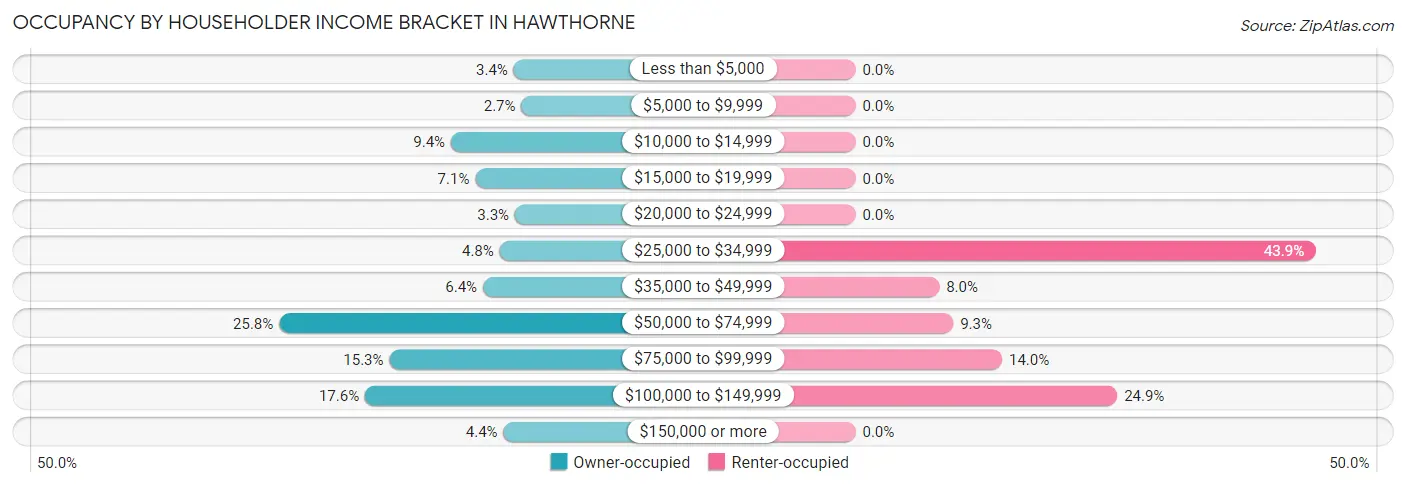
| Income Bracket | Owner-occupied | Renter-occupied |
| Less than $5,000 | 28 (3.4%) | 0 (0.0%) |
| $5,000 to $9,999 | 22 (2.7%) | 0 (0.0%) |
| $10,000 to $14,999 | 77 (9.4%) | 0 (0.0%) |
| $15,000 to $19,999 | 58 (7.1%) | 0 (0.0%) |
| $20,000 to $24,999 | 27 (3.3%) | 0 (0.0%) |
| $25,000 to $34,999 | 39 (4.8%) | 132 (43.9%) |
| $35,000 to $49,999 | 52 (6.4%) | 24 (8.0%) |
| $50,000 to $74,999 | 211 (25.8%) | 28 (9.3%) |
| $75,000 to $99,999 | 125 (15.3%) | 42 (14.0%) |
| $100,000 to $149,999 | 144 (17.6%) | 75 (24.9%) |
| $150,000 or more | 36 (4.4%) | 0 (0.0%) |
| Total | 819 (100.0%) | 301 (100.0%) |
Monthly Housing Cost Tiers in Hawthorne
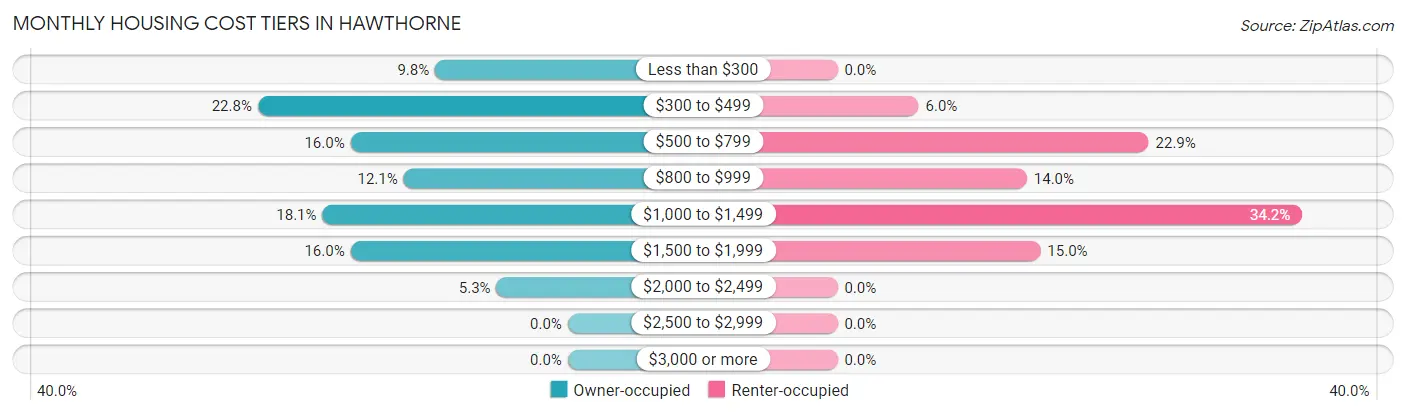
| Monthly Cost | Owner-occupied | Renter-occupied |
| Less than $300 | 80 (9.8%) | 0 (0.0%) |
| $300 to $499 | 187 (22.8%) | 18 (6.0%) |
| $500 to $799 | 131 (16.0%) | 69 (22.9%) |
| $800 to $999 | 99 (12.1%) | 42 (14.0%) |
| $1,000 to $1,499 | 148 (18.1%) | 103 (34.2%) |
| $1,500 to $1,999 | 131 (16.0%) | 45 (14.9%) |
| $2,000 to $2,499 | 43 (5.2%) | 0 (0.0%) |
| $2,500 to $2,999 | 0 (0.0%) | 0 (0.0%) |
| $3,000 or more | 0 (0.0%) | 0 (0.0%) |
| Total | 819 (100.0%) | 301 (100.0%) |
Physical Housing Characteristics in Hawthorne
Housing Structures in Hawthorne
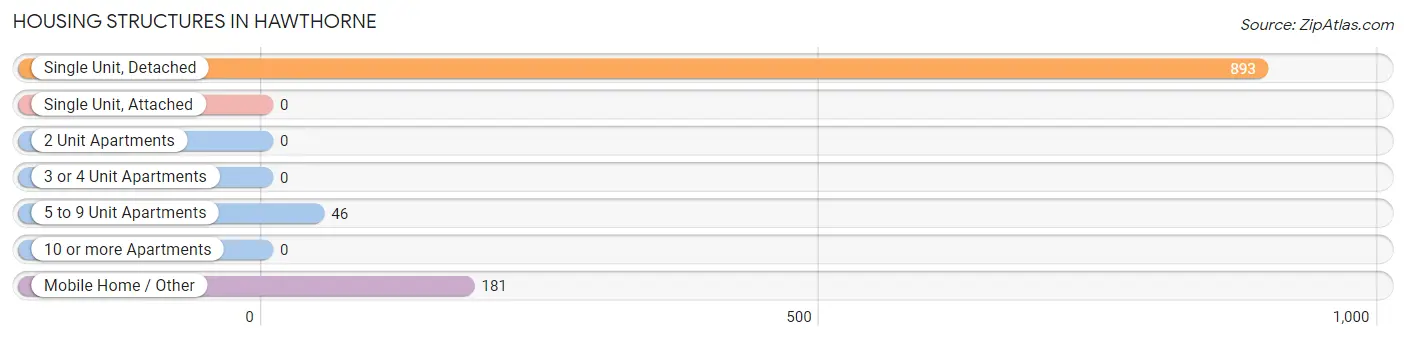
| Structure Type | # Housing Units | % Housing Units |
| Single Unit, Detached | 893 | 79.7% |
| Single Unit, Attached | 0 | 0.0% |
| 2 Unit Apartments | 0 | 0.0% |
| 3 or 4 Unit Apartments | 0 | 0.0% |
| 5 to 9 Unit Apartments | 46 | 4.1% |
| 10 or more Apartments | 0 | 0.0% |
| Mobile Home / Other | 181 | 16.2% |
| Total | 1,120 | 100.0% |
Housing Structures by Occupancy in Hawthorne
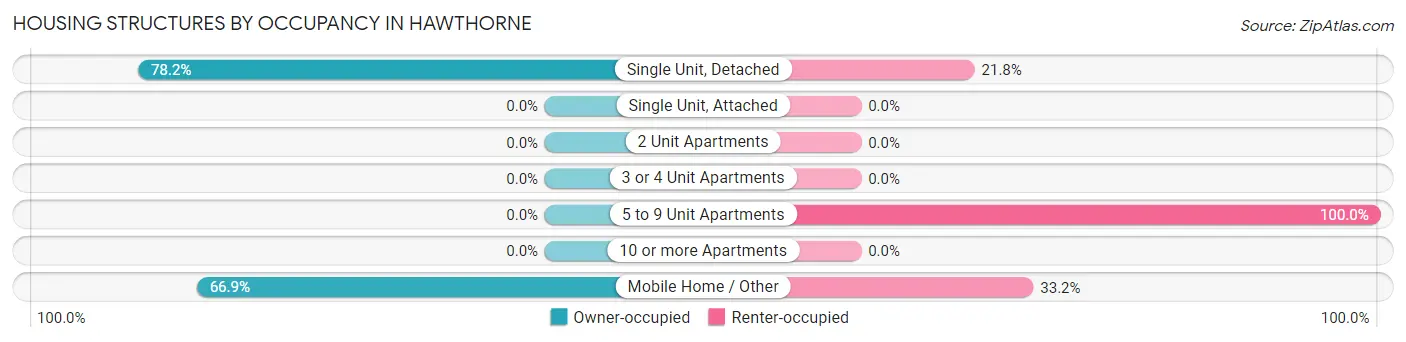
| Structure Type | Owner-occupied | Renter-occupied |
| Single Unit, Detached | 698 (78.2%) | 195 (21.8%) |
| Single Unit, Attached | 0 (0.0%) | 0 (0.0%) |
| 2 Unit Apartments | 0 (0.0%) | 0 (0.0%) |
| 3 or 4 Unit Apartments | 0 (0.0%) | 0 (0.0%) |
| 5 to 9 Unit Apartments | 0 (0.0%) | 46 (100.0%) |
| 10 or more Apartments | 0 (0.0%) | 0 (0.0%) |
| Mobile Home / Other | 121 (66.8%) | 60 (33.2%) |
| Total | 819 (73.1%) | 301 (26.9%) |
Housing Structures by Number of Rooms in Hawthorne
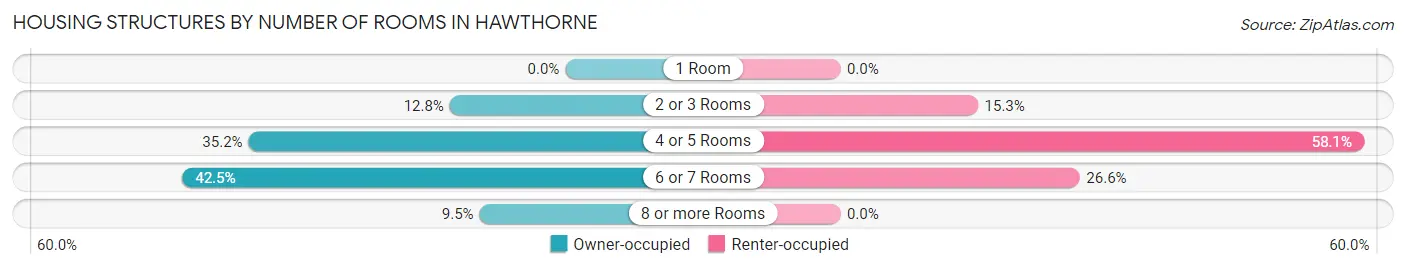
| Number of Rooms | Owner-occupied | Renter-occupied |
| 1 Room | 0 (0.0%) | 0 (0.0%) |
| 2 or 3 Rooms | 105 (12.8%) | 46 (15.3%) |
| 4 or 5 Rooms | 288 (35.2%) | 175 (58.1%) |
| 6 or 7 Rooms | 348 (42.5%) | 80 (26.6%) |
| 8 or more Rooms | 78 (9.5%) | 0 (0.0%) |
| Total | 819 (100.0%) | 301 (100.0%) |
Housing Structure by Heating Type in Hawthorne
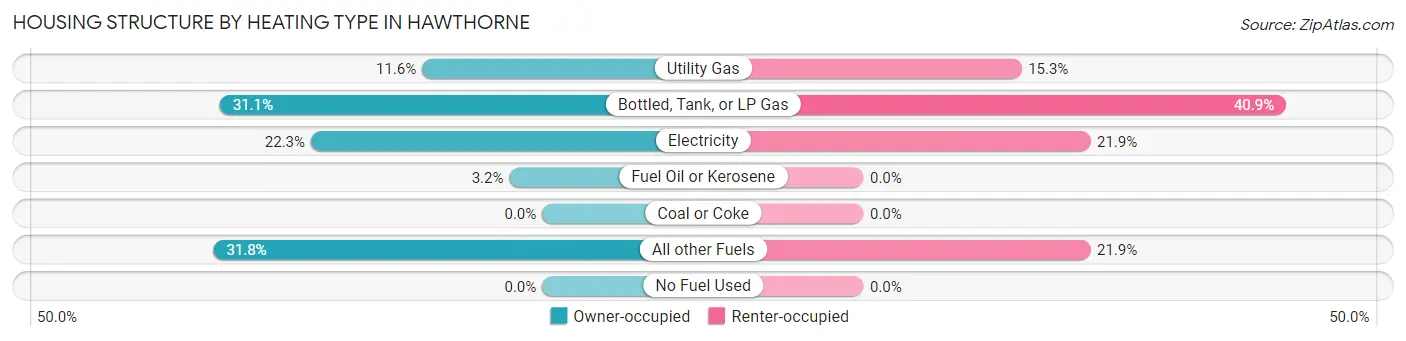
| Heating Type | Owner-occupied | Renter-occupied |
| Utility Gas | 95 (11.6%) | 46 (15.3%) |
| Bottled, Tank, or LP Gas | 255 (31.1%) | 123 (40.9%) |
| Electricity | 183 (22.3%) | 66 (21.9%) |
| Fuel Oil or Kerosene | 26 (3.2%) | 0 (0.0%) |
| Coal or Coke | 0 (0.0%) | 0 (0.0%) |
| All other Fuels | 260 (31.8%) | 66 (21.9%) |
| No Fuel Used | 0 (0.0%) | 0 (0.0%) |
| Total | 819 (100.0%) | 301 (100.0%) |
Household Vehicle Usage in Hawthorne
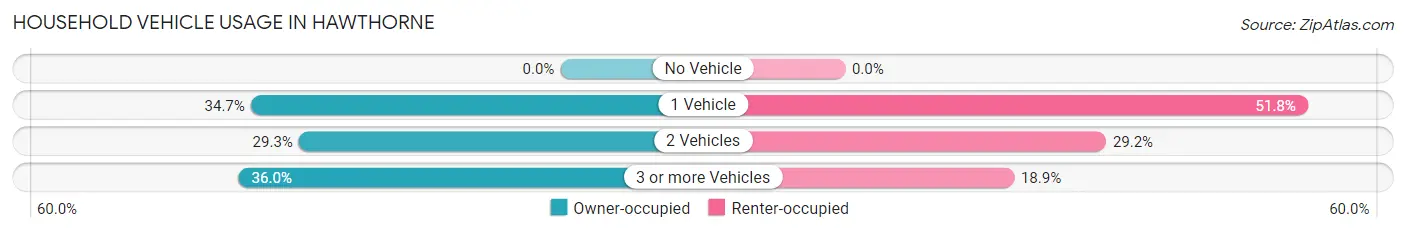
| Vehicles per Household | Owner-occupied | Renter-occupied |
| No Vehicle | 0 (0.0%) | 0 (0.0%) |
| 1 Vehicle | 284 (34.7%) | 156 (51.8%) |
| 2 Vehicles | 240 (29.3%) | 88 (29.2%) |
| 3 or more Vehicles | 295 (36.0%) | 57 (18.9%) |
| Total | 819 (100.0%) | 301 (100.0%) |
Real Estate & Mortgages in Hawthorne
Real Estate and Mortgage Overview in Hawthorne
| Characteristic | Without Mortgage | With Mortgage |
| Housing Units | 334 | 485 |
| Median Property Value | $167,300 | $170,200 |
| Median Household Income | $40,726 | $36 |
| Monthly Housing Costs | $331 | $0 |
| Real Estate Taxes | $1,146 | $0 |
Property Value by Mortgage Status in Hawthorne
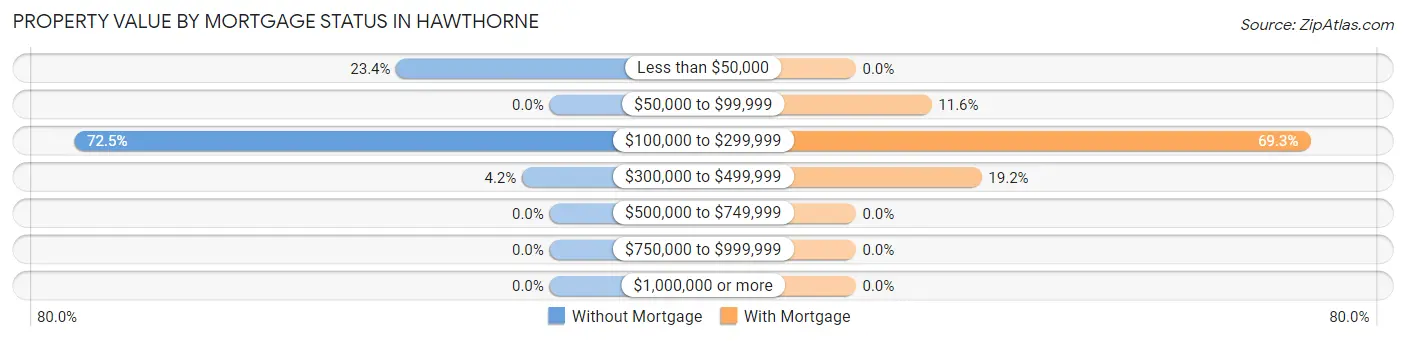
| Property Value | Without Mortgage | With Mortgage |
| Less than $50,000 | 78 (23.4%) | 0 (0.0%) |
| $50,000 to $99,999 | 0 (0.0%) | 56 (11.6%) |
| $100,000 to $299,999 | 242 (72.5%) | 336 (69.3%) |
| $300,000 to $499,999 | 14 (4.2%) | 93 (19.2%) |
| $500,000 to $749,999 | 0 (0.0%) | 0 (0.0%) |
| $750,000 to $999,999 | 0 (0.0%) | 0 (0.0%) |
| $1,000,000 or more | 0 (0.0%) | 0 (0.0%) |
| Total | 334 (100.0%) | 485 (100.0%) |
Household Income by Mortgage Status in Hawthorne
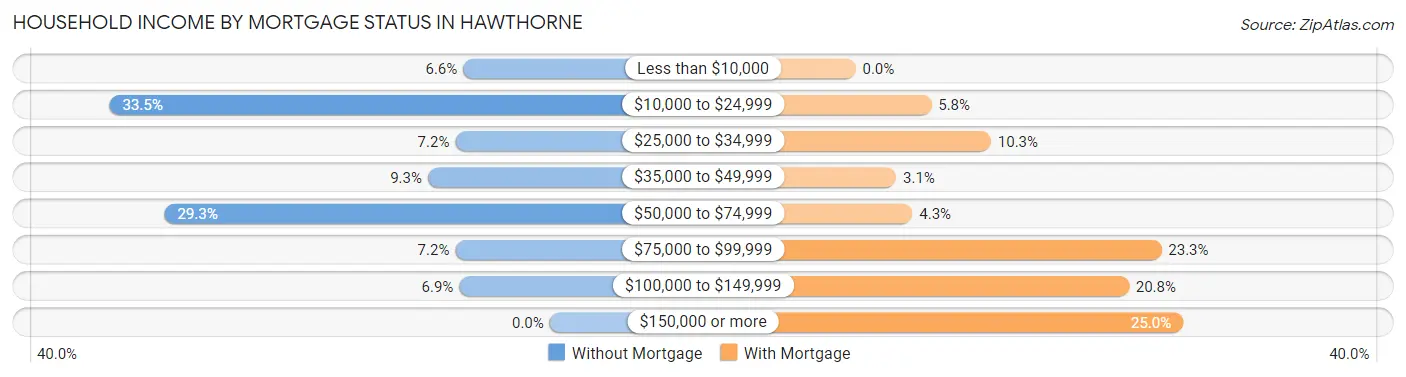
| Household Income | Without Mortgage | With Mortgage |
| Less than $10,000 | 22 (6.6%) | 0 (0.0%) |
| $10,000 to $24,999 | 112 (33.5%) | 28 (5.8%) |
| $25,000 to $34,999 | 24 (7.2%) | 50 (10.3%) |
| $35,000 to $49,999 | 31 (9.3%) | 15 (3.1%) |
| $50,000 to $74,999 | 98 (29.3%) | 21 (4.3%) |
| $75,000 to $99,999 | 24 (7.2%) | 113 (23.3%) |
| $100,000 to $149,999 | 23 (6.9%) | 101 (20.8%) |
| $150,000 or more | 0 (0.0%) | 121 (24.9%) |
| Total | 334 (100.0%) | 485 (100.0%) |
Property Value to Household Income Ratio in Hawthorne
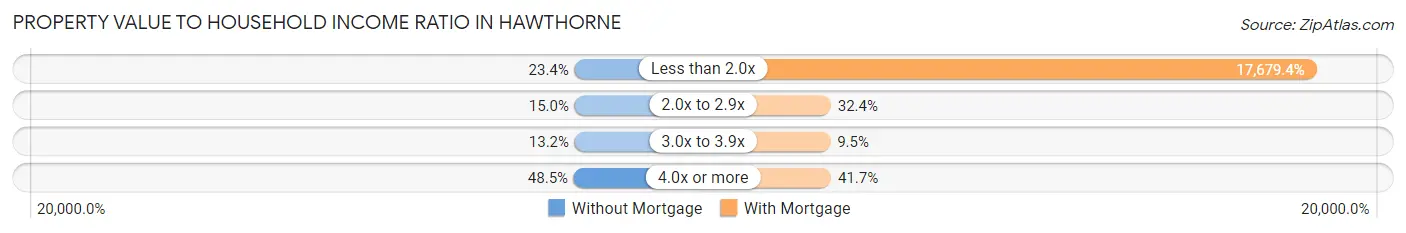
| Value-to-Income Ratio | Without Mortgage | With Mortgage |
| Less than 2.0x | 78 (23.4%) | 85,745 (17,679.4%) |
| 2.0x to 2.9x | 50 (15.0%) | 157 (32.4%) |
| 3.0x to 3.9x | 44 (13.2%) | 46 (9.5%) |
| 4.0x or more | 162 (48.5%) | 202 (41.6%) |
| Total | 334 (100.0%) | 485 (100.0%) |
Real Estate Taxes by Mortgage Status in Hawthorne
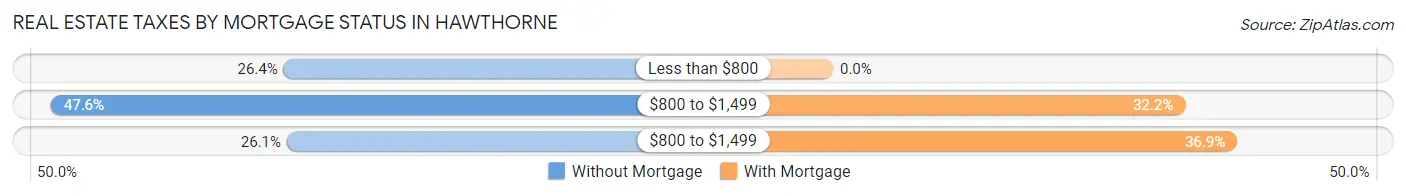
| Property Taxes | Without Mortgage | With Mortgage |
| Less than $800 | 88 (26.4%) | 0 (0.0%) |
| $800 to $1,499 | 159 (47.6%) | 156 (32.2%) |
| $800 to $1,499 | 87 (26.1%) | 179 (36.9%) |
| Total | 334 (100.0%) | 485 (100.0%) |
Health & Disability in Hawthorne
Health Insurance Coverage by Age in Hawthorne
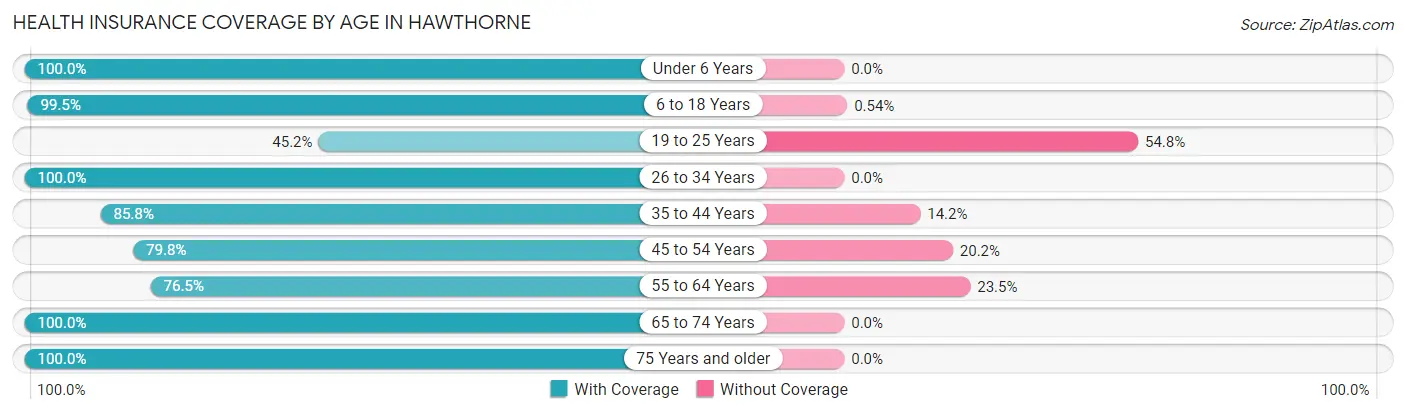
| Age Bracket | With Coverage | Without Coverage |
| Under 6 Years | 215 (100.0%) | 0 (0.0%) |
| 6 to 18 Years | 366 (99.5%) | 2 (0.5%) |
| 19 to 25 Years | 71 (45.2%) | 86 (54.8%) |
| 26 to 34 Years | 321 (100.0%) | 0 (0.0%) |
| 35 to 44 Years | 412 (85.8%) | 68 (14.2%) |
| 45 to 54 Years | 134 (79.8%) | 34 (20.2%) |
| 55 to 64 Years | 166 (76.5%) | 51 (23.5%) |
| 65 to 74 Years | 427 (100.0%) | 0 (0.0%) |
| 75 Years and older | 300 (100.0%) | 0 (0.0%) |
| Total | 2,412 (90.9%) | 241 (9.1%) |
Health Insurance Coverage by Citizenship Status in Hawthorne
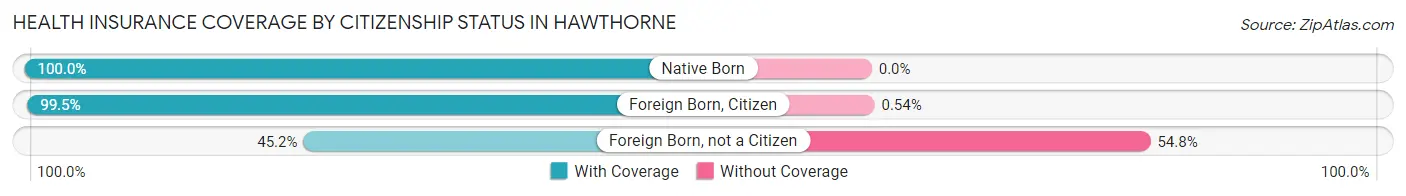
| Citizenship Status | With Coverage | Without Coverage |
| Native Born | 215 (100.0%) | 0 (0.0%) |
| Foreign Born, Citizen | 366 (99.5%) | 2 (0.5%) |
| Foreign Born, not a Citizen | 71 (45.2%) | 86 (54.8%) |
Health Insurance Coverage by Household Income in Hawthorne
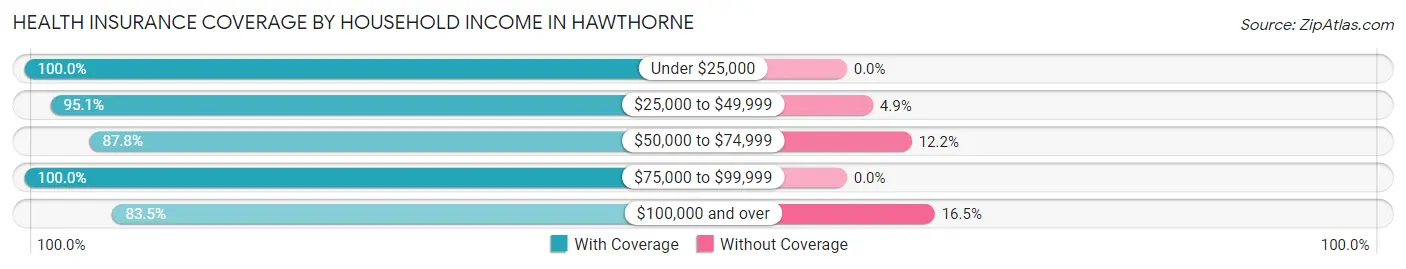
| Household Income | With Coverage | Without Coverage |
| Under $25,000 | 269 (100.0%) | 0 (0.0%) |
| $25,000 to $49,999 | 389 (95.1%) | 20 (4.9%) |
| $50,000 to $74,999 | 866 (87.8%) | 120 (12.2%) |
| $75,000 to $99,999 | 376 (100.0%) | 0 (0.0%) |
| $100,000 and over | 512 (83.5%) | 101 (16.5%) |
Public vs Private Health Insurance Coverage by Age in Hawthorne
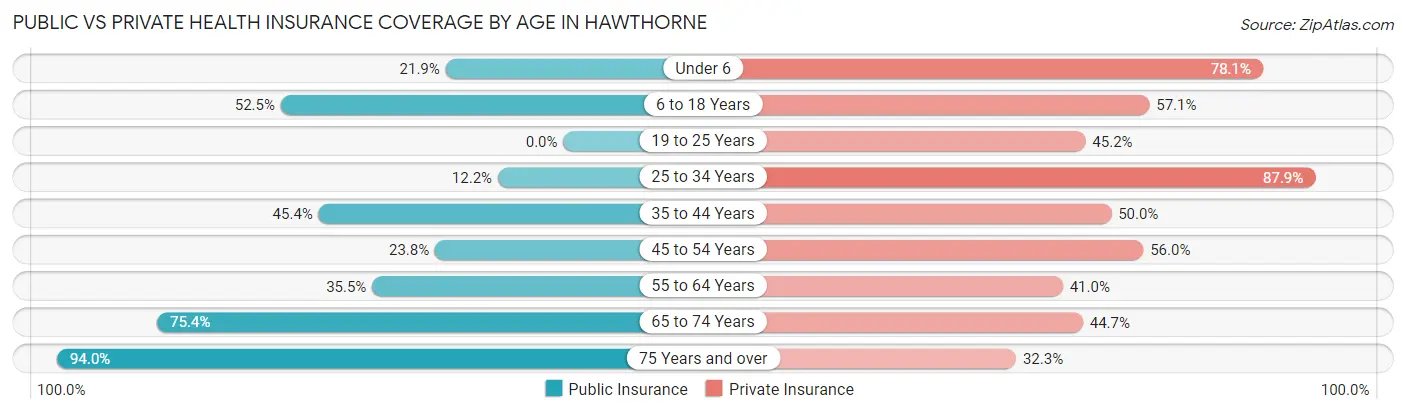
| Age Bracket | Public Insurance | Private Insurance |
| Under 6 | 47 (21.9%) | 168 (78.1%) |
| 6 to 18 Years | 193 (52.4%) | 210 (57.1%) |
| 19 to 25 Years | 0 (0.0%) | 71 (45.2%) |
| 25 to 34 Years | 39 (12.1%) | 282 (87.8%) |
| 35 to 44 Years | 218 (45.4%) | 240 (50.0%) |
| 45 to 54 Years | 40 (23.8%) | 94 (55.9%) |
| 55 to 64 Years | 77 (35.5%) | 89 (41.0%) |
| 65 to 74 Years | 322 (75.4%) | 191 (44.7%) |
| 75 Years and over | 282 (94.0%) | 97 (32.3%) |
| Total | 1,218 (45.9%) | 1,442 (54.3%) |
Disability Status by Sex by Age in Hawthorne
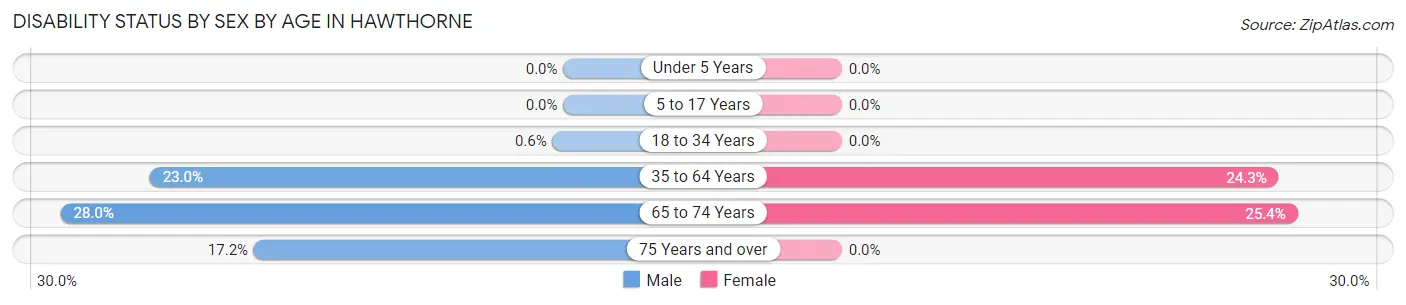
| Age Bracket | Male | Female |
| Under 5 Years | 0 (0.0%) | 0 (0.0%) |
| 5 to 17 Years | 0 (0.0%) | 0 (0.0%) |
| 18 to 34 Years | 1 (0.6%) | 0 (0.0%) |
| 35 to 64 Years | 114 (23.0%) | 90 (24.3%) |
| 65 to 74 Years | 28 (28.0%) | 83 (25.4%) |
| 75 Years and over | 41 (17.2%) | 0 (0.0%) |
Disability Class by Sex by Age in Hawthorne
Disability Class: Hearing Difficulty
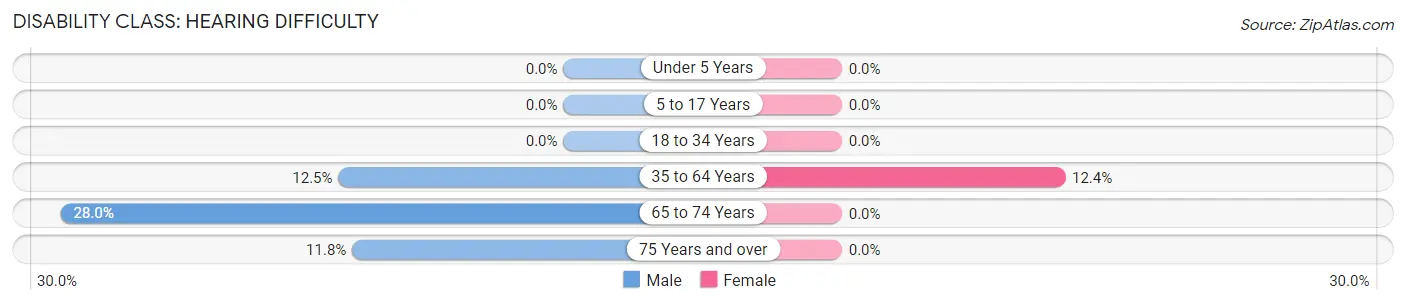
| Age Bracket | Male | Female |
| Under 5 Years | 0 (0.0%) | 0 (0.0%) |
| 5 to 17 Years | 0 (0.0%) | 0 (0.0%) |
| 18 to 34 Years | 0 (0.0%) | 0 (0.0%) |
| 35 to 64 Years | 62 (12.5%) | 46 (12.4%) |
| 65 to 74 Years | 28 (28.0%) | 0 (0.0%) |
| 75 Years and over | 28 (11.8%) | 0 (0.0%) |
Disability Class: Vision Difficulty
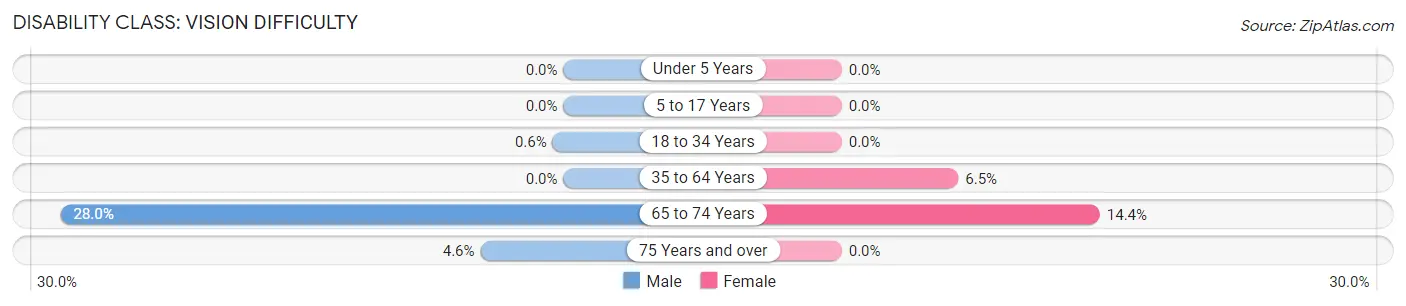
| Age Bracket | Male | Female |
| Under 5 Years | 0 (0.0%) | 0 (0.0%) |
| 5 to 17 Years | 0 (0.0%) | 0 (0.0%) |
| 18 to 34 Years | 1 (0.6%) | 0 (0.0%) |
| 35 to 64 Years | 0 (0.0%) | 24 (6.5%) |
| 65 to 74 Years | 28 (28.0%) | 47 (14.4%) |
| 75 Years and over | 11 (4.6%) | 0 (0.0%) |
Disability Class: Cognitive Difficulty
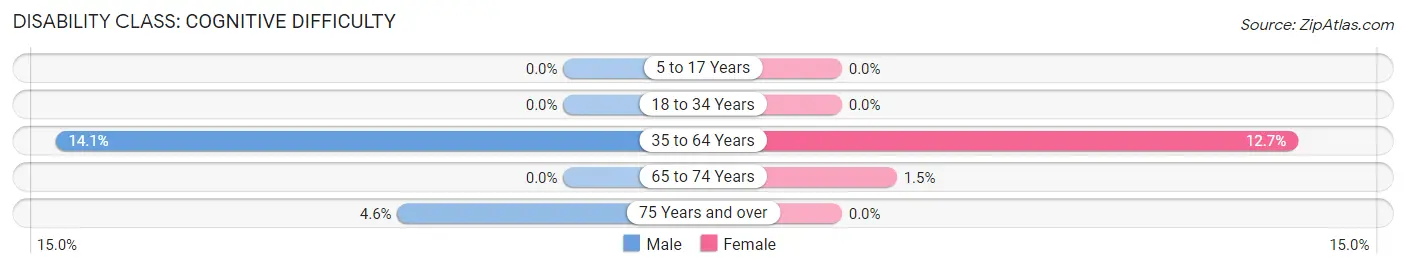
| Age Bracket | Male | Female |
| 5 to 17 Years | 0 (0.0%) | 0 (0.0%) |
| 18 to 34 Years | 0 (0.0%) | 0 (0.0%) |
| 35 to 64 Years | 70 (14.1%) | 47 (12.7%) |
| 65 to 74 Years | 0 (0.0%) | 5 (1.5%) |
| 75 Years and over | 11 (4.6%) | 0 (0.0%) |
Disability Class: Ambulatory Difficulty
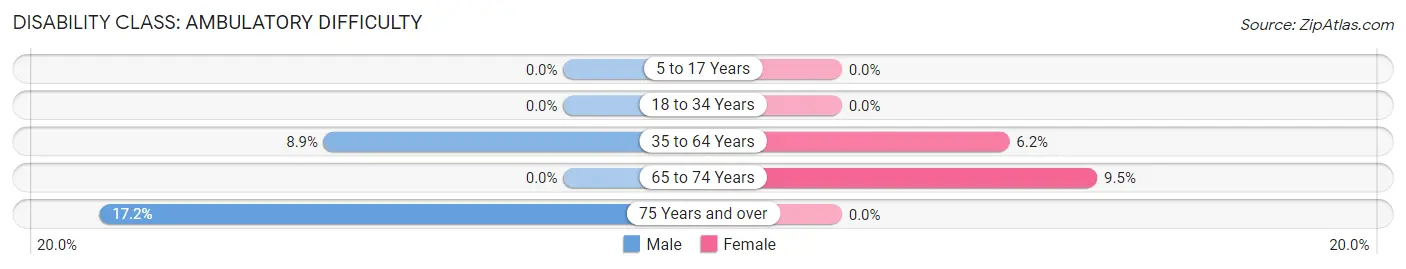
| Age Bracket | Male | Female |
| 5 to 17 Years | 0 (0.0%) | 0 (0.0%) |
| 18 to 34 Years | 0 (0.0%) | 0 (0.0%) |
| 35 to 64 Years | 44 (8.9%) | 23 (6.2%) |
| 65 to 74 Years | 0 (0.0%) | 31 (9.5%) |
| 75 Years and over | 41 (17.2%) | 0 (0.0%) |
Disability Class: Self-Care Difficulty
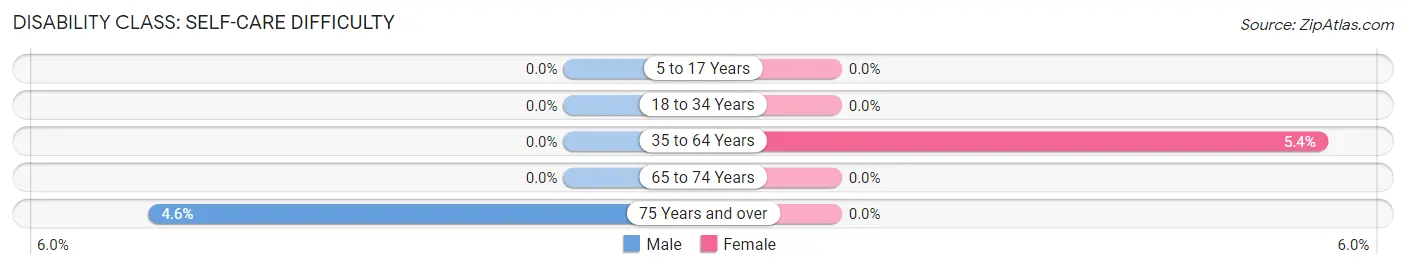
| Age Bracket | Male | Female |
| 5 to 17 Years | 0 (0.0%) | 0 (0.0%) |
| 18 to 34 Years | 0 (0.0%) | 0 (0.0%) |
| 35 to 64 Years | 0 (0.0%) | 20 (5.4%) |
| 65 to 74 Years | 0 (0.0%) | 0 (0.0%) |
| 75 Years and over | 11 (4.6%) | 0 (0.0%) |
Technology Access in Hawthorne
Computing Device Access in Hawthorne
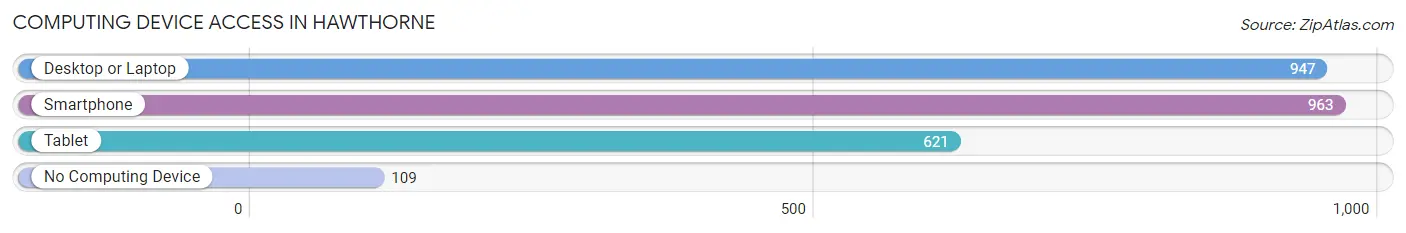
| Device Type | # Households | % Households |
| Desktop or Laptop | 947 | 84.6% |
| Smartphone | 963 | 86.0% |
| Tablet | 621 | 55.4% |
| No Computing Device | 109 | 9.7% |
| Total | 1,120 | 100.0% |
Internet Access in Hawthorne
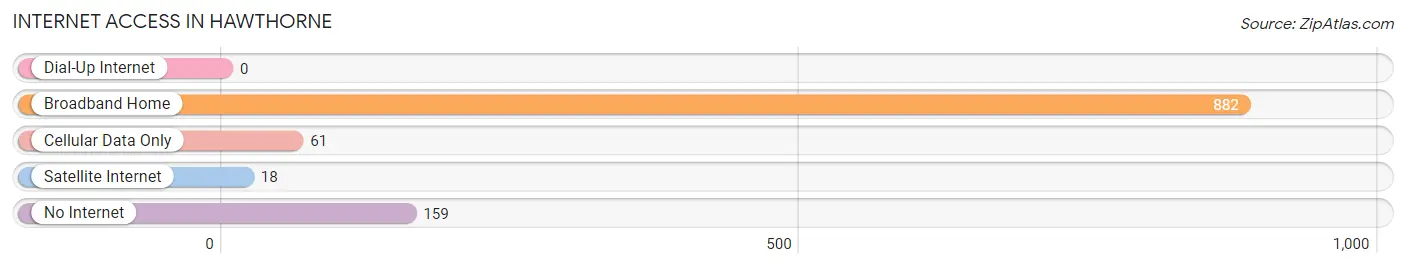
| Internet Type | # Households | % Households |
| Dial-Up Internet | 0 | 0.0% |
| Broadband Home | 882 | 78.7% |
| Cellular Data Only | 61 | 5.4% |
| Satellite Internet | 18 | 1.6% |
| No Internet | 159 | 14.2% |
| Total | 1,120 | 100.0% |
Hawthorne Summary
Hawthorne is a small town located in Mineral County, Nevada, United States. It is situated in the western part of the state, approximately halfway between Reno and Las Vegas. The town is located in the Walker River Valley, and is surrounded by the Toiyabe National Forest. The population of Hawthorne was 3,269 at the 2010 census.
History
Hawthorne was founded in 1883 by the Nevada Central Railroad. The town was named after the Hawthorne family, who owned the land on which the town was built. The railroad was built to connect the mining towns of Austin and Belmont, and Hawthorne was established as a stop along the route.
In the early 1900s, Hawthorne was a bustling mining town, with a population of over 5,000. The town was home to several mines, including the Hawthorne Mine, which was the largest producer of silver and lead in the state. The town also had a number of saloons, hotels, and other businesses.
In the 1920s, the mining industry began to decline, and the population of Hawthorne began to dwindle. By the 1940s, the population had dropped to just over 1,000. The town was able to survive, however, due to its location along the main highway between Reno and Las Vegas.
Geography
Hawthorne is located in the Walker River Valley, at the base of the Toiyabe National Forest. The town is situated at an elevation of 4,890 feet (1,490 m). The Walker River flows through the town, and is a popular destination for fishing and other recreational activities.
The climate in Hawthorne is semi-arid, with hot summers and cold winters. The average high temperature in July is 92°F (33°C), and the average low temperature in January is 24°F (-4°C). The average annual precipitation is 8.5 inches (216 mm).
Economy
The economy of Hawthorne is largely based on tourism and the military. The town is home to the Hawthorne Army Depot, which is the largest ammunition storage facility in the United States. The depot is a major employer in the area, and provides jobs for many of the town’s residents.
The town is also a popular destination for tourists, who come to enjoy the area’s natural beauty and recreational activities. The Walker River is a popular destination for fishing, and the nearby Toiyabe National Forest offers a variety of outdoor activities, including camping, hiking, and horseback riding.
Demographics
As of the 2010 census, the population of Hawthorne was 3,269. The racial makeup of the town was 75.3% White, 0.7% African American, 1.2% Native American, 0.3% Asian, 0.1% Pacific Islander, 19.2% from other races, and 3.4% from two or more races. Hispanic or Latino of any race were 28.2% of the population.
The median income for a household in Hawthorne was $31,250, and the median income for a family was $35,000. The per capita income for the town was $14,945. About 17.2% of families and 20.3% of the population were below the poverty line, including 28.2% of those under age 18 and 8.3% of those age 65 or over.
Common Questions
What is Per Capita Income in Hawthorne?
Per Capita income in Hawthorne is $27,593.
What is the Median Family Income in Hawthorne?
Median Family Income in Hawthorne is $65,744.
What is the Median Household income in Hawthorne?
Median Household Income in Hawthorne is $55,847.
What is Income or Wage Gap in Hawthorne?
Income or Wage Gap in Hawthorne is 48.6%.
Women in Hawthorne earn 51.4 cents for every dollar earned by a man.
What is Family Income Deficit in Hawthorne?
Family Income Deficit in Hawthorne is $4,580.
Families that are below poverty line in Hawthorne earn $4,580 less on average than the poverty threshold level.
What is Inequality or Gini Index in Hawthorne?
Inequality or Gini Index in Hawthorne is 0.39.
What is the Total Population of Hawthorne?
Total Population of Hawthorne is 2,739.
What is the Total Male Population of Hawthorne?
Total Male Population of Hawthorne is 1,269.
What is the Total Female Population of Hawthorne?
Total Female Population of Hawthorne is 1,470.
What is the Ratio of Males per 100 Females in Hawthorne?
There are 86.33 Males per 100 Females in Hawthorne.
What is the Ratio of Females per 100 Males in Hawthorne?
There are 115.84 Females per 100 Males in Hawthorne.
What is the Median Population Age in Hawthorne?
Median Population Age in Hawthorne is 38.6 Years.
What is the Average Family Size in Hawthorne
Average Family Size in Hawthorne is 2.9 People.
What is the Average Household Size in Hawthorne
Average Household Size in Hawthorne is 2.4 People.
How Large is the Labor Force in Hawthorne?
There are 1,143 People in the Labor Forcein in Hawthorne.
What is the Percentage of People in the Labor Force in Hawthorne?
50.9% of People are in the Labor Force in Hawthorne.
What is the Unemployment Rate in Hawthorne?
Unemployment Rate in Hawthorne is 2.3%.