Cheneyville, LA Map & Demographics
Cheneyville Map
Cheneyville Overview
$18,553
PER CAPITA INCOME
$45,625
AVG FAMILY INCOME
$17,917
AVG HOUSEHOLD INCOME
0.56
INEQUALITY / GINI INDEX
679
TOTAL POPULATION
260
MALE POPULATION
419
FEMALE POPULATION
62.05
MALES / 100 FEMALES
161.15
FEMALES / 100 MALES
48.3
MEDIAN AGE
3.5
AVG FAMILY SIZE
2.1
AVG HOUSEHOLD SIZE
221
LABOR FORCE [ PEOPLE ]
39.5%
PERCENT IN LABOR FORCE
4.5%
UNEMPLOYMENT RATE
Cheneyville Zip Codes
Income in Cheneyville
Income Overview in Cheneyville
Per Capita Income in Cheneyville is $18,553, while median incomes of families and households are $45,625 and $17,917 respectively.
| Characteristic | Number | Measure |
| Per Capita Income | 679 | $18,553 |
| Median Family Income | 119 | $45,625 |
| Mean Family Income | 119 | $68,829 |
| Median Household Income | 310 | $17,917 |
| Mean Household Income | 310 | $37,155 |
| Income Deficit | 119 | $0 |
| Wage / Income Gap (%) | 679 | 0.00% |
| Wage / Income Gap ($) | 679 | 100.00¢ per $1 |
| Gini / Inequality Index | 679 | 0.56 |
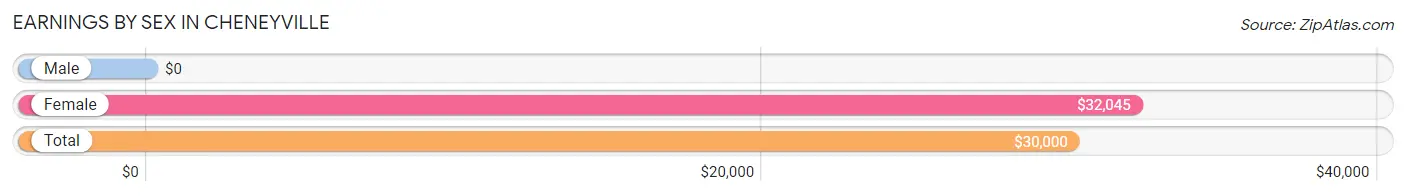
Earnings by Sex in Cheneyville
| Sex | Number | Average Earnings |
| Male | 80 (35.1%) | $0 |
| Female | 148 (64.9%) | $32,045 |
| Total | 228 (100.0%) | $30,000 |
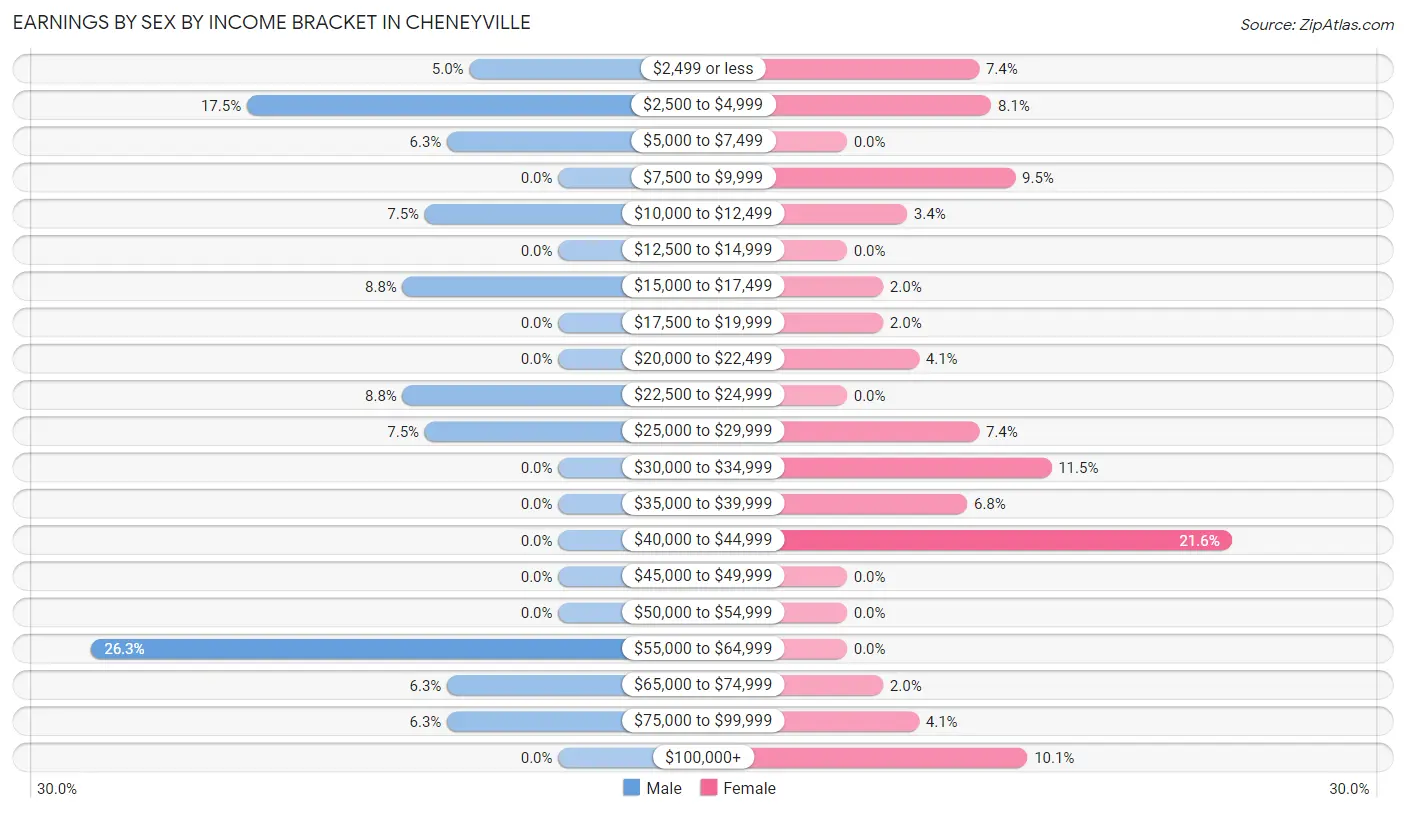
Earnings by Sex by Income Bracket in Cheneyville
The most common earnings brackets in Cheneyville are $55,000 to $64,999 for men (21 | 26.3%) and $40,000 to $44,999 for women (32 | 21.6%).
| Income | Male | Female |
| $2,499 or less | 4 (5.0%) | 11 (7.4%) |
| $2,500 to $4,999 | 14 (17.5%) | 12 (8.1%) |
| $5,000 to $7,499 | 5 (6.2%) | 0 (0.0%) |
| $7,500 to $9,999 | 0 (0.0%) | 14 (9.5%) |
| $10,000 to $12,499 | 6 (7.5%) | 5 (3.4%) |
| $12,500 to $14,999 | 0 (0.0%) | 0 (0.0%) |
| $15,000 to $17,499 | 7 (8.7%) | 3 (2.0%) |
| $17,500 to $19,999 | 0 (0.0%) | 3 (2.0%) |
| $20,000 to $22,499 | 0 (0.0%) | 6 (4.1%) |
| $22,500 to $24,999 | 7 (8.7%) | 0 (0.0%) |
| $25,000 to $29,999 | 6 (7.5%) | 11 (7.4%) |
| $30,000 to $34,999 | 0 (0.0%) | 17 (11.5%) |
| $35,000 to $39,999 | 0 (0.0%) | 10 (6.8%) |
| $40,000 to $44,999 | 0 (0.0%) | 32 (21.6%) |
| $45,000 to $49,999 | 0 (0.0%) | 0 (0.0%) |
| $50,000 to $54,999 | 0 (0.0%) | 0 (0.0%) |
| $55,000 to $64,999 | 21 (26.3%) | 0 (0.0%) |
| $65,000 to $74,999 | 5 (6.2%) | 3 (2.0%) |
| $75,000 to $99,999 | 5 (6.2%) | 6 (4.1%) |
| $100,000+ | 0 (0.0%) | 15 (10.1%) |
| Total | 80 (100.0%) | 148 (100.0%) |
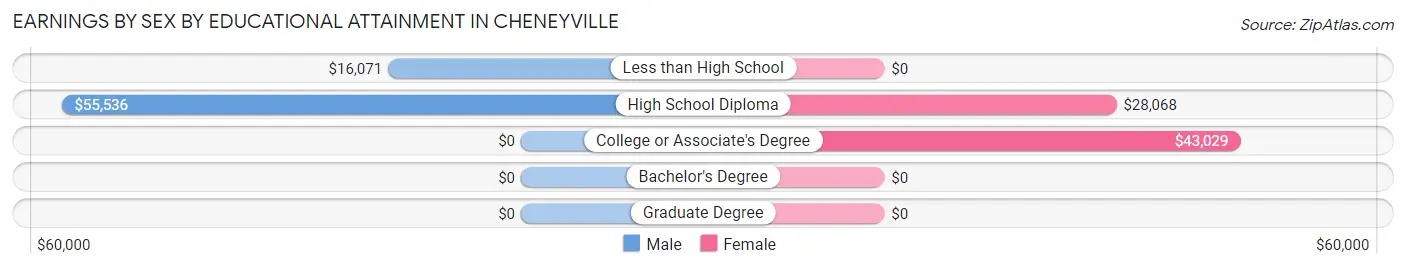
Earnings by Sex by Educational Attainment in Cheneyville
| Educational Attainment | Male Income | Female Income |
| Less than High School | $16,071 | $0 |
| High School Diploma | $55,536 | $28,068 |
| College or Associate's Degree | - | - |
| Bachelor's Degree | - | - |
| Graduate Degree | - | - |
| Total | - | - |
Family Income in Cheneyville
Family Income Brackets in Cheneyville
According to the Cheneyville family income data, there are 25 families falling into the $150,000 to $199,999 income range, which is the most common income bracket and makes up 21.0% of all families.
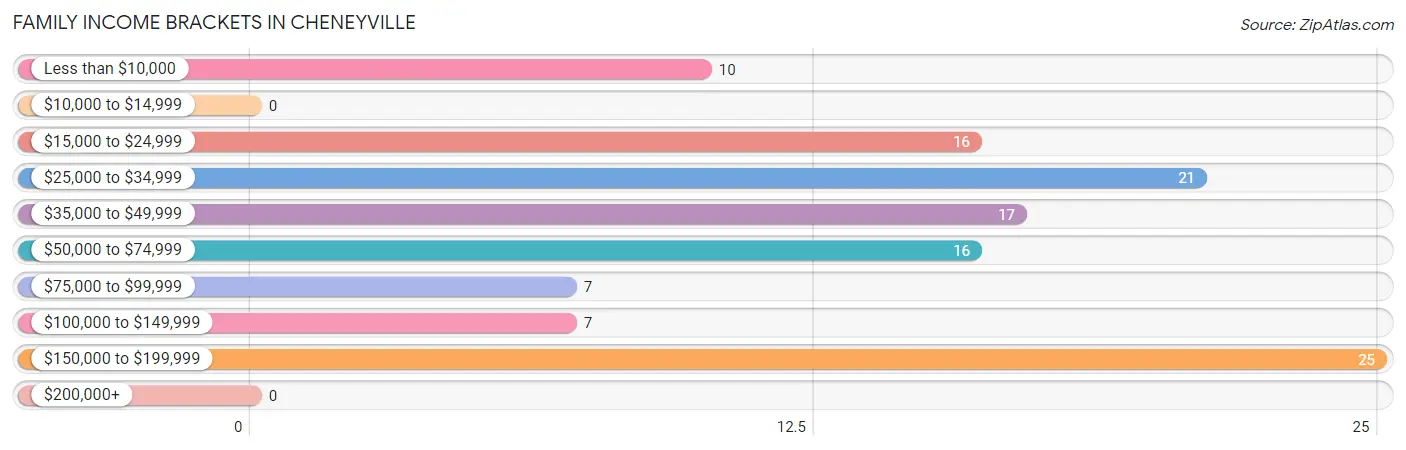
| Income Bracket | # Families | % Families |
| Less than $10,000 | 10 | 8.4% |
| $10,000 to $14,999 | 0 | 0.0% |
| $15,000 to $24,999 | 16 | 13.4% |
| $25,000 to $34,999 | 21 | 17.6% |
| $35,000 to $49,999 | 17 | 14.3% |
| $50,000 to $74,999 | 16 | 13.4% |
| $75,000 to $99,999 | 7 | 5.9% |
| $100,000 to $149,999 | 7 | 5.9% |
| $150,000 to $199,999 | 25 | 21.0% |
| $200,000+ | 0 | 0.0% |
Family Income by Famaliy Size in Cheneyville
4-person families (25 | 21.0%) account for the highest median family income in Cheneyville with $170,417 per family, while 4-person families (25 | 21.0%) have the highest median income of $42,604 per family member.
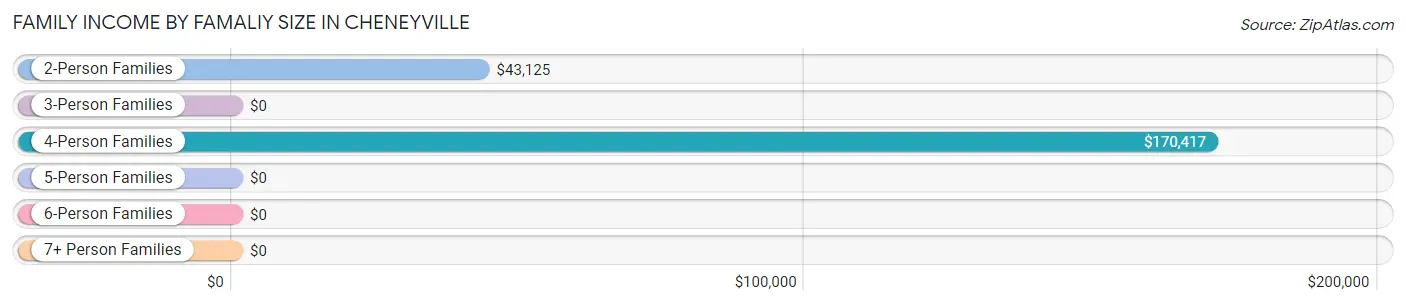
| Income Bracket | # Families | Median Income |
| 2-Person Families | 57 (47.9%) | $43,125 |
| 3-Person Families | 19 (16.0%) | $0 |
| 4-Person Families | 25 (21.0%) | $170,417 |
| 5-Person Families | 6 (5.0%) | $0 |
| 6-Person Families | 12 (10.1%) | $0 |
| 7+ Person Families | 0 (0.0%) | $0 |
| Total | 119 (100.0%) | $45,625 |
Family Income by Number of Earners in Cheneyville
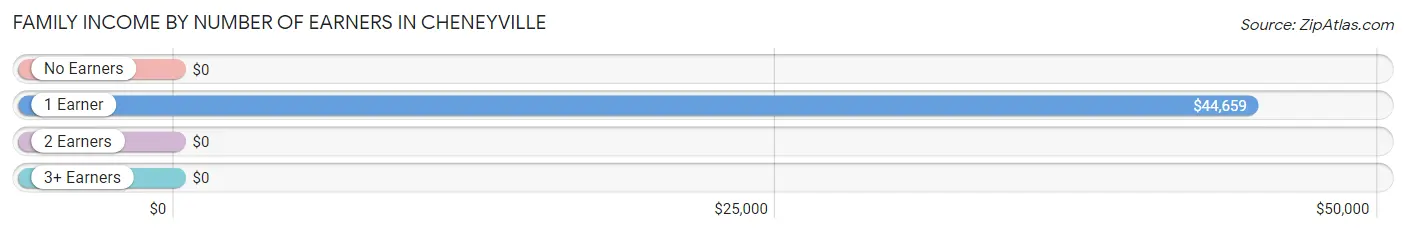
| Number of Earners | # Families | Median Income |
| No Earners | 16 (13.5%) | $0 |
| 1 Earner | 49 (41.2%) | $44,659 |
| 2 Earners | 54 (45.4%) | $0 |
| 3+ Earners | 0 (0.0%) | $0 |
| Total | 119 (100.0%) | $45,625 |
Household Income in Cheneyville
Household Income Brackets in Cheneyville
With 78 households falling in the category, the $10,000 to $14,999 income range is the most frequent in Cheneyville, accounting for 25.2% of all households.
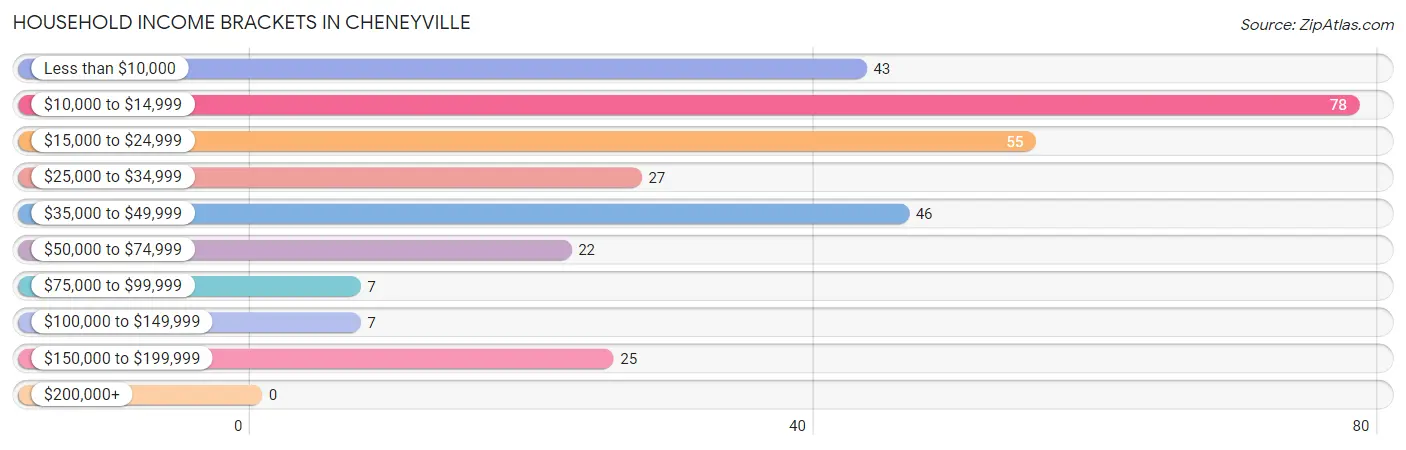
| Income Bracket | # Households | % Households |
| Less than $10,000 | 43 | 13.9% |
| $10,000 to $14,999 | 78 | 25.2% |
| $15,000 to $24,999 | 55 | 17.7% |
| $25,000 to $34,999 | 27 | 8.7% |
| $35,000 to $49,999 | 46 | 14.8% |
| $50,000 to $74,999 | 22 | 7.1% |
| $75,000 to $99,999 | 7 | 2.3% |
| $100,000 to $149,999 | 7 | 2.3% |
| $150,000 to $199,999 | 25 | 8.1% |
| $200,000+ | 0 | 0.0% |
Household Income by Householder Age in Cheneyville
The median household income in Cheneyville is $17,917, with the highest median household income of $15,789 found in the 65+ years age bracket for the primary householder. A total of 162 households (52.3%) fall into this category.
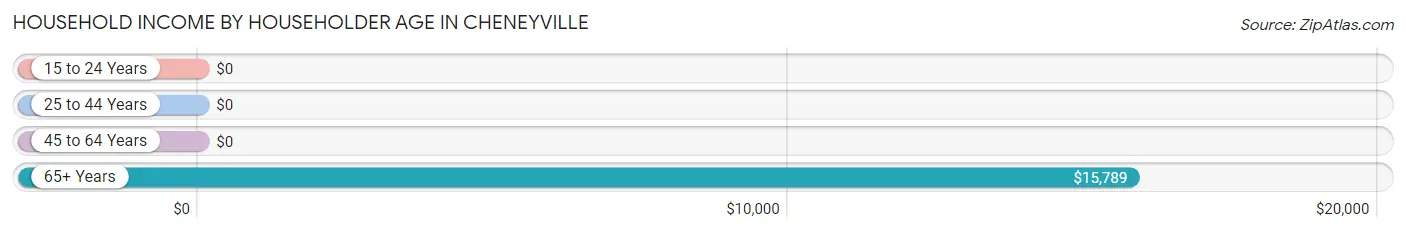
| Income Bracket | # Households | Median Income |
| 15 to 24 Years | 0 (0.0%) | $0 |
| 25 to 44 Years | 48 (15.5%) | $0 |
| 45 to 64 Years | 100 (32.3%) | $0 |
| 65+ Years | 162 (52.3%) | $15,789 |
| Total | 310 (100.0%) | $17,917 |
Poverty in Cheneyville
Income Below Poverty by Sex and Age in Cheneyville
With 35.8% poverty level for males and 44.9% for females among the residents of Cheneyville, 16 and 17 year old males and 12 to 14 year old females are the most vulnerable to poverty, with 6 males (100.0%) and 12 females (100.0%) in their respective age groups living below the poverty level.
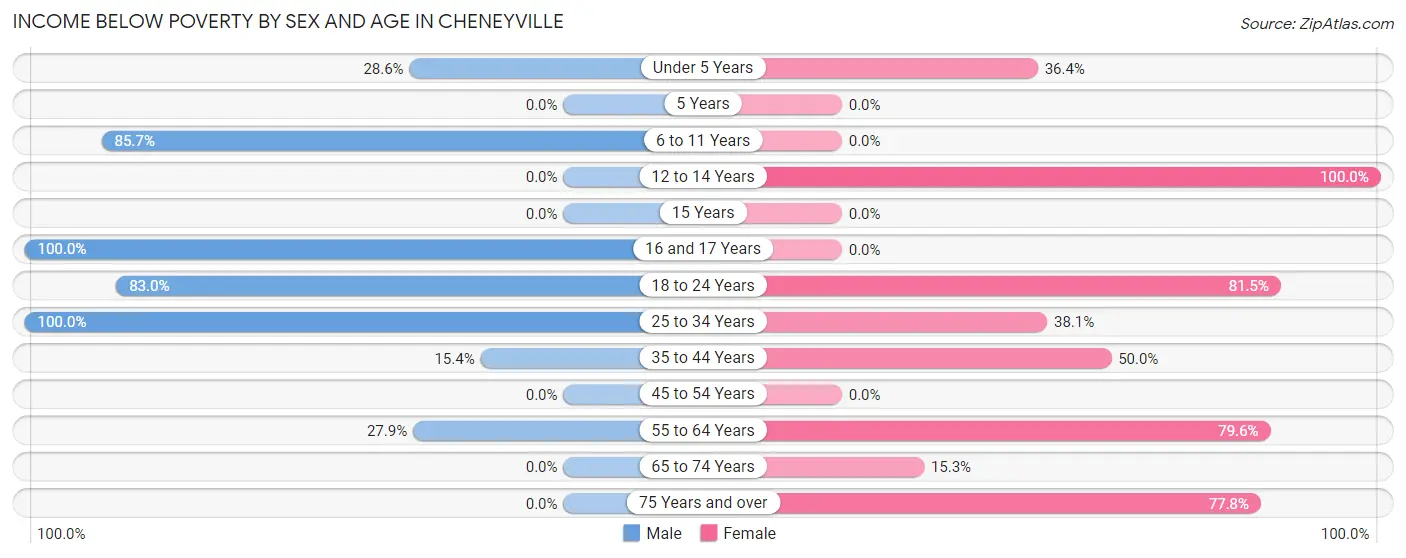
| Age Bracket | Male | Female |
| Under 5 Years | 12 (28.6%) | 12 (36.4%) |
| 5 Years | 0 (0.0%) | 0 (0.0%) |
| 6 to 11 Years | 12 (85.7%) | 0 (0.0%) |
| 12 to 14 Years | 0 (0.0%) | 12 (100.0%) |
| 15 Years | 0 (0.0%) | 0 (0.0%) |
| 16 and 17 Years | 6 (100.0%) | 0 (0.0%) |
| 18 to 24 Years | 39 (83.0%) | 22 (81.5%) |
| 25 to 34 Years | 6 (100.0%) | 16 (38.1%) |
| 35 to 44 Years | 6 (15.4%) | 12 (50.0%) |
| 45 to 54 Years | 0 (0.0%) | 0 (0.0%) |
| 55 to 64 Years | 12 (27.9%) | 35 (79.5%) |
| 65 to 74 Years | 0 (0.0%) | 9 (15.2%) |
| 75 Years and over | 0 (0.0%) | 70 (77.8%) |
| Total | 93 (35.8%) | 188 (44.9%) |
Income Above Poverty by Sex and Age in Cheneyville
According to the poverty statistics in Cheneyville, males aged 5 years and females aged 6 to 11 years are the age groups that are most secure financially, with 100.0% of males and 100.0% of females in these age groups living above the poverty line.
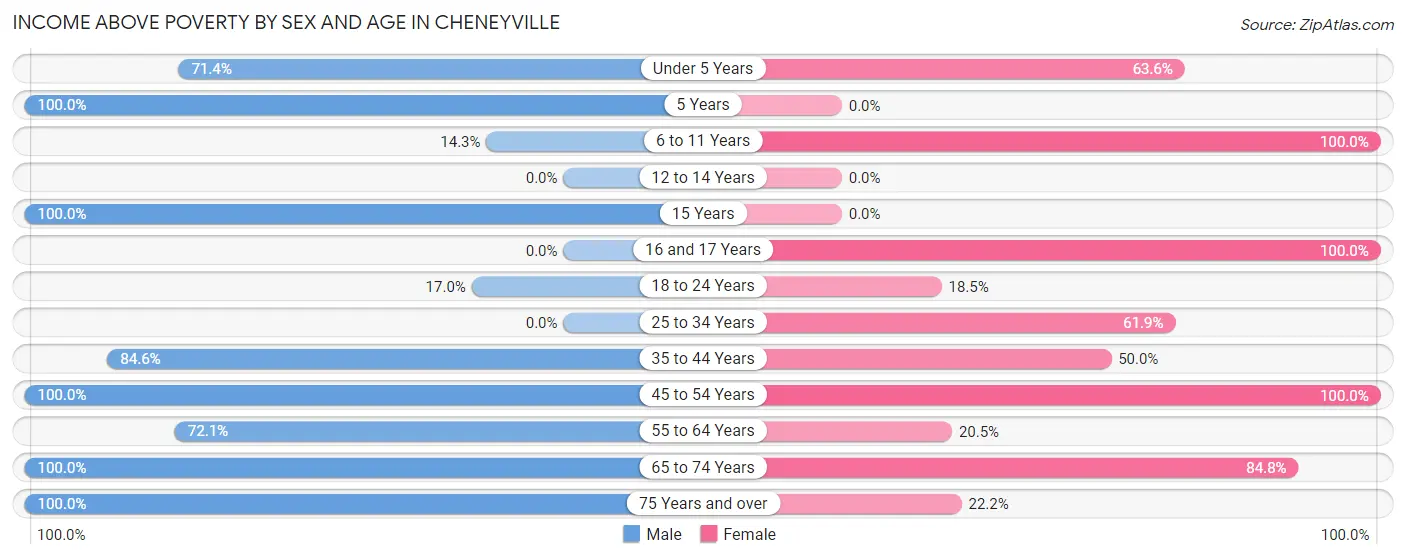
| Age Bracket | Male | Female |
| Under 5 Years | 30 (71.4%) | 21 (63.6%) |
| 5 Years | 6 (100.0%) | 0 (0.0%) |
| 6 to 11 Years | 2 (14.3%) | 7 (100.0%) |
| 12 to 14 Years | 0 (0.0%) | 0 (0.0%) |
| 15 Years | 6 (100.0%) | 0 (0.0%) |
| 16 and 17 Years | 0 (0.0%) | 6 (100.0%) |
| 18 to 24 Years | 8 (17.0%) | 5 (18.5%) |
| 25 to 34 Years | 0 (0.0%) | 26 (61.9%) |
| 35 to 44 Years | 33 (84.6%) | 12 (50.0%) |
| 45 to 54 Years | 9 (100.0%) | 75 (100.0%) |
| 55 to 64 Years | 31 (72.1%) | 9 (20.4%) |
| 65 to 74 Years | 28 (100.0%) | 50 (84.8%) |
| 75 Years and over | 14 (100.0%) | 20 (22.2%) |
| Total | 167 (64.2%) | 231 (55.1%) |
Income Below Poverty Among Married-Couple Families in Cheneyville
The poverty statistics for married-couple families in Cheneyville show that 15.0% or 12 of the total 80 families live below the poverty line. Families with 3 or 4 children have the highest poverty rate of 100.0%, comprising of 12 families. On the other hand, families with no children have the lowest poverty rate of 0.0%, which includes 0 families.
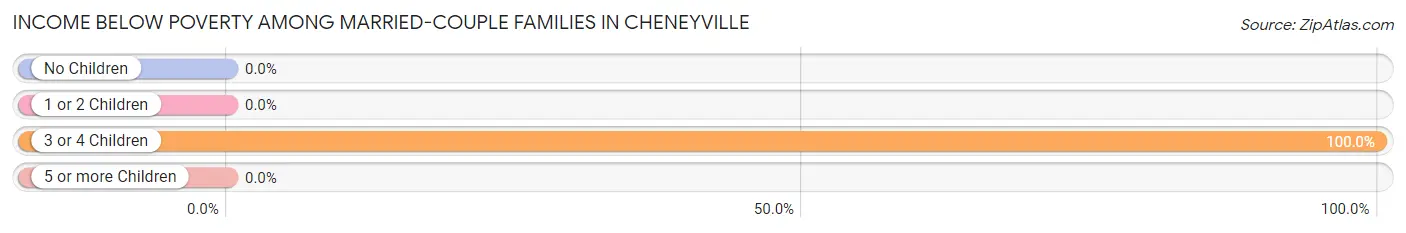
| Children | Above Poverty | Below Poverty |
| No Children | 40 (100.0%) | 0 (0.0%) |
| 1 or 2 Children | 28 (100.0%) | 0 (0.0%) |
| 3 or 4 Children | 0 (0.0%) | 12 (100.0%) |
| 5 or more Children | 0 (0.0%) | 0 (0.0%) |
| Total | 68 (85.0%) | 12 (15.0%) |
Income Below Poverty Among Single-Parent Households in Cheneyville
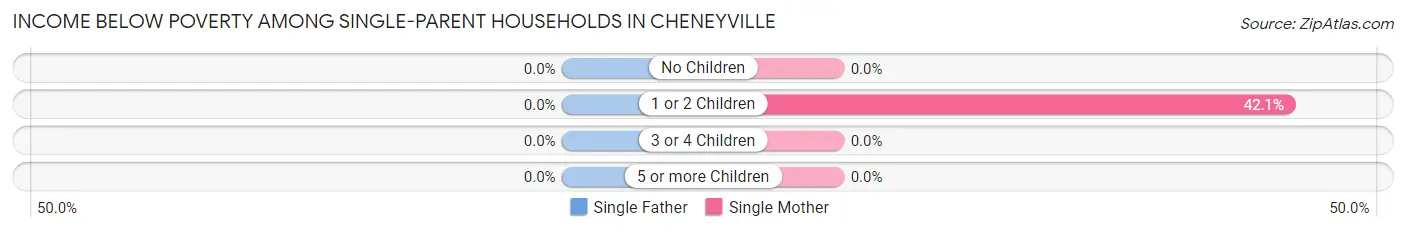
| Children | Single Father | Single Mother |
| No Children | 0 (0.0%) | 0 (0.0%) |
| 1 or 2 Children | 0 (0.0%) | 8 (42.1%) |
| 3 or 4 Children | 0 (0.0%) | 0 (0.0%) |
| 5 or more Children | 0 (0.0%) | 0 (0.0%) |
| Total | 0 (0.0%) | 8 (25.0%) |
Income Below Poverty Among Married-Couple vs Single-Parent Households in Cheneyville
The poverty data for Cheneyville shows that 12 of the married-couple family households (15.0%) and 8 of the single-parent households (20.5%) are living below the poverty level. Within the married-couple family households, those with 3 or 4 children have the highest poverty rate, with 12 households (100.0%) falling below the poverty line. Among the single-parent households, those with 1 or 2 children have the highest poverty rate, with 8 household (42.1%) living below poverty.
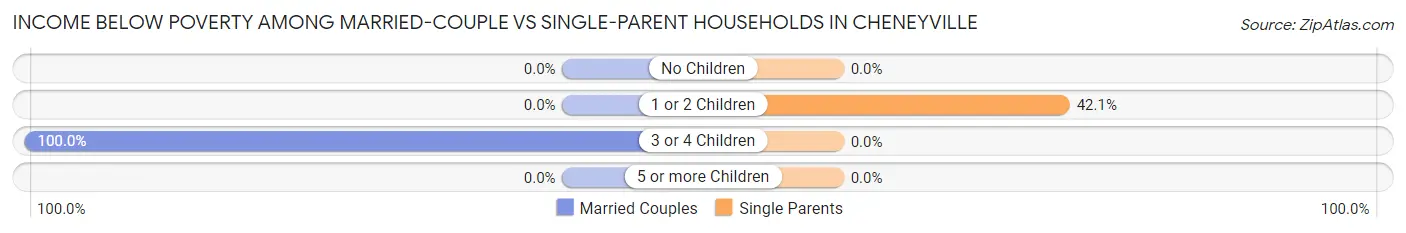
| Children | Married-Couple Families | Single-Parent Households |
| No Children | 0 (0.0%) | 0 (0.0%) |
| 1 or 2 Children | 0 (0.0%) | 8 (42.1%) |
| 3 or 4 Children | 12 (100.0%) | 0 (0.0%) |
| 5 or more Children | 0 (0.0%) | 0 (0.0%) |
| Total | 12 (15.0%) | 8 (20.5%) |
Race in Cheneyville
The most populous races in Cheneyville are Black / African American (325 | 47.9%), White / Caucasian (310 | 45.7%), and Two or more Races (44 | 6.5%).
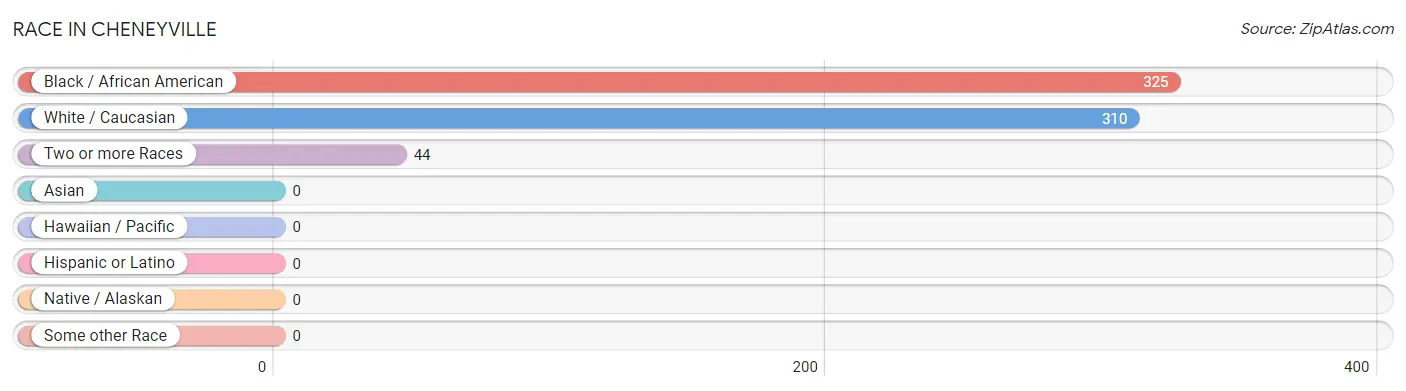
| Race | # Population | % Population |
| Asian | 0 | 0.0% |
| Black / African American | 325 | 47.9% |
| Hawaiian / Pacific | 0 | 0.0% |
| Hispanic or Latino | 0 | 0.0% |
| Native / Alaskan | 0 | 0.0% |
| White / Caucasian | 310 | 45.7% |
| Two or more Races | 44 | 6.5% |
| Some other Race | 0 | 0.0% |
| Total | 679 | 100.0% |
Ancestry in Cheneyville
The most populous ancestries reported in Cheneyville are French (120 | 17.7%), Irish (42 | 6.2%), American (34 | 5.0%), Haitian (34 | 5.0%), and Italian (27 | 4.0%), together accounting for 37.9% of all Cheneyville residents.
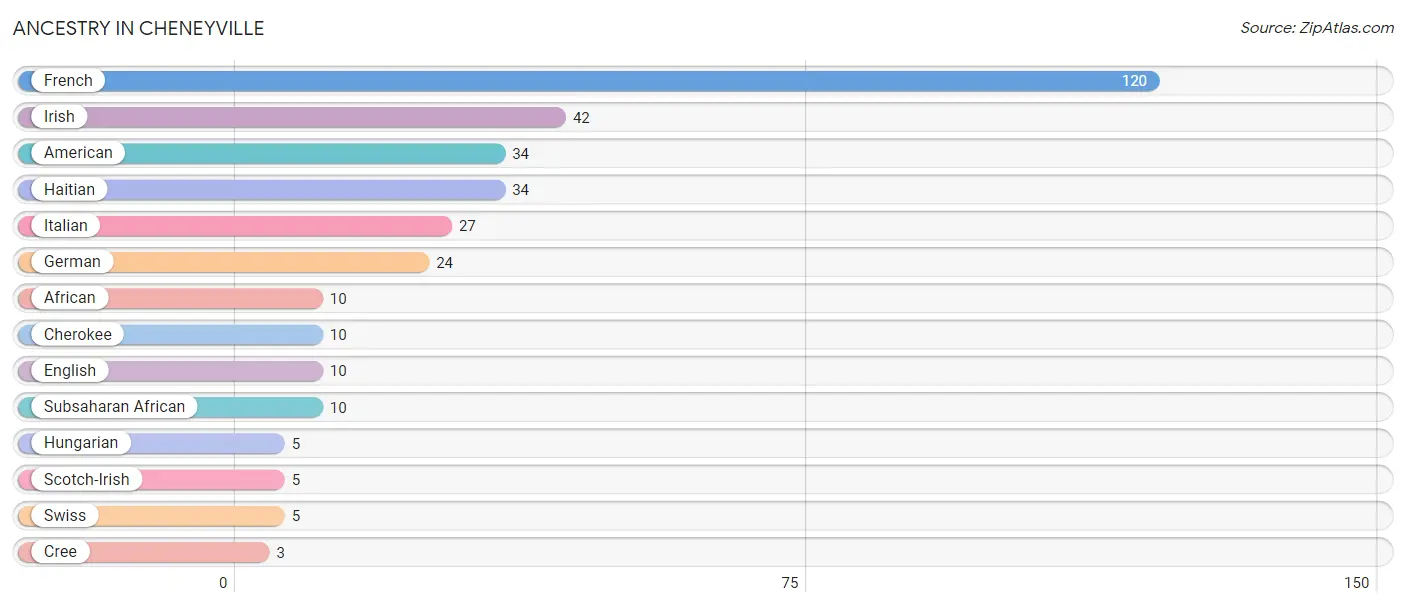
| Ancestry | # Population | % Population |
| African | 10 | 1.5% |
| American | 34 | 5.0% |
| Cherokee | 10 | 1.5% |
| Cree | 3 | 0.4% |
| English | 10 | 1.5% |
| French | 120 | 17.7% |
| German | 24 | 3.5% |
| Haitian | 34 | 5.0% |
| Hungarian | 5 | 0.7% |
| Irish | 42 | 6.2% |
| Italian | 27 | 4.0% |
| Scotch-Irish | 5 | 0.7% |
| Subsaharan African | 10 | 1.5% |
| Swiss | 5 | 0.7% | View All 14 Rows |
Immigrants in Cheneyville

| Immigration Origin | # Population | % Population | View All 0 Rows |
Sex and Age in Cheneyville
Sex and Age in Cheneyville
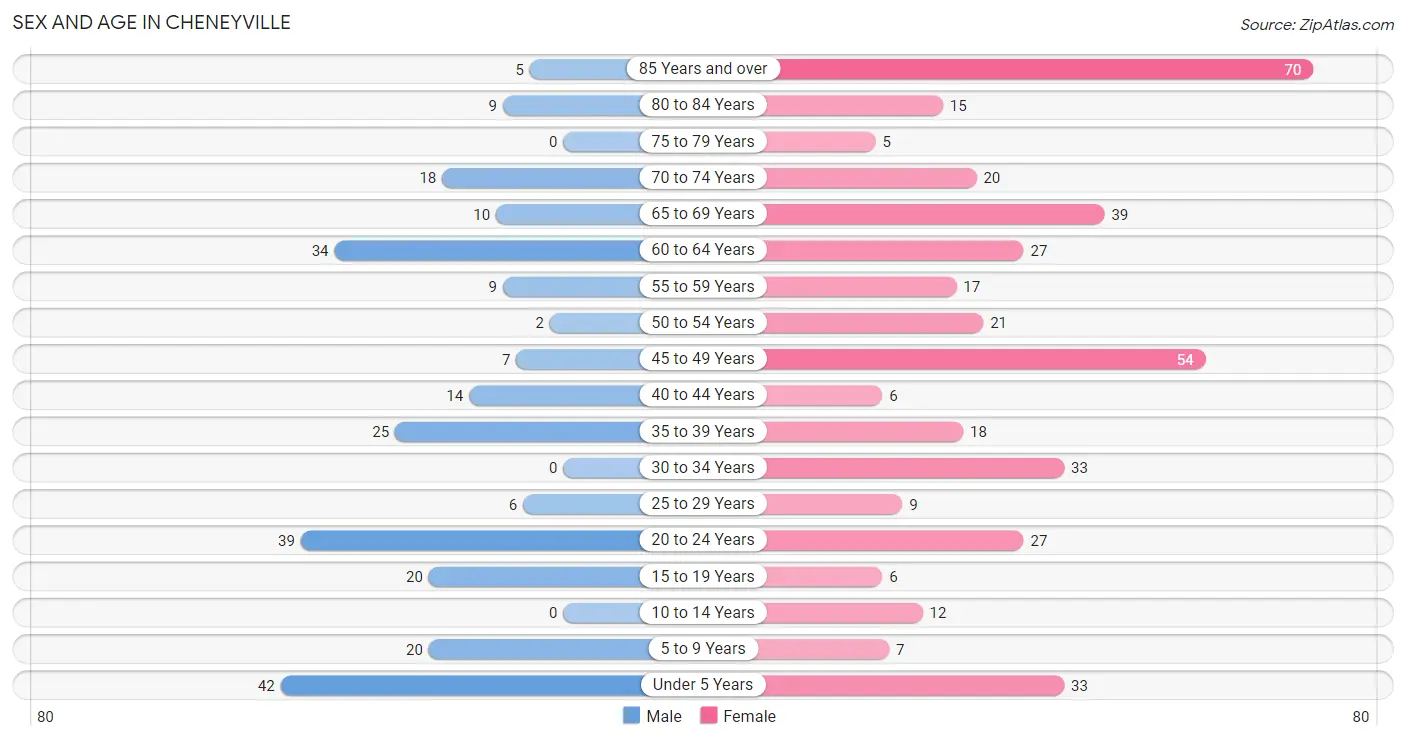
The most populous age groups in Cheneyville are Under 5 Years (42 | 16.2%) for men and 85 Years and over (70 | 16.7%) for women.
| Age Bracket | Male | Female |
| Under 5 Years | 42 (16.2%) | 33 (7.9%) |
| 5 to 9 Years | 20 (7.7%) | 7 (1.7%) |
| 10 to 14 Years | 0 (0.0%) | 12 (2.9%) |
| 15 to 19 Years | 20 (7.7%) | 6 (1.4%) |
| 20 to 24 Years | 39 (15.0%) | 27 (6.4%) |
| 25 to 29 Years | 6 (2.3%) | 9 (2.1%) |
| 30 to 34 Years | 0 (0.0%) | 33 (7.9%) |
| 35 to 39 Years | 25 (9.6%) | 18 (4.3%) |
| 40 to 44 Years | 14 (5.4%) | 6 (1.4%) |
| 45 to 49 Years | 7 (2.7%) | 54 (12.9%) |
| 50 to 54 Years | 2 (0.8%) | 21 (5.0%) |
| 55 to 59 Years | 9 (3.5%) | 17 (4.1%) |
| 60 to 64 Years | 34 (13.1%) | 27 (6.4%) |
| 65 to 69 Years | 10 (3.8%) | 39 (9.3%) |
| 70 to 74 Years | 18 (6.9%) | 20 (4.8%) |
| 75 to 79 Years | 0 (0.0%) | 5 (1.2%) |
| 80 to 84 Years | 9 (3.5%) | 15 (3.6%) |
| 85 Years and over | 5 (1.9%) | 70 (16.7%) |
| Total | 260 (100.0%) | 419 (100.0%) |
Families and Households in Cheneyville
Median Family Size in Cheneyville
The median family size in Cheneyville is 3.53 persons per family, with married-couple families (80 | 67.2%) accounting for the largest median family size of 3.7 persons per family. On the other hand, single male/father families (7 | 5.9%) represent the smallest median family size with 1.71 persons per family.
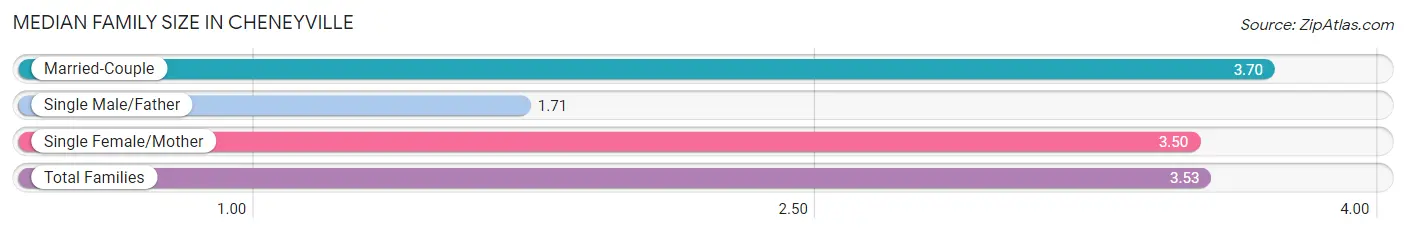
| Family Type | # Families | Family Size |
| Married-Couple | 80 (67.2%) | 3.70 |
| Single Male/Father | 7 (5.9%) | 1.71 |
| Single Female/Mother | 32 (26.9%) | 3.50 |
| Total Families | 119 (100.0%) | 3.53 |
Median Household Size in Cheneyville
The median household size in Cheneyville is 2.15 persons per household, with married-couple households (80 | 25.8%) accounting for the largest median household size of 3.7 persons per household. non-family households (191 | 61.6%) represent the smallest median household size with 1.28 persons per household.
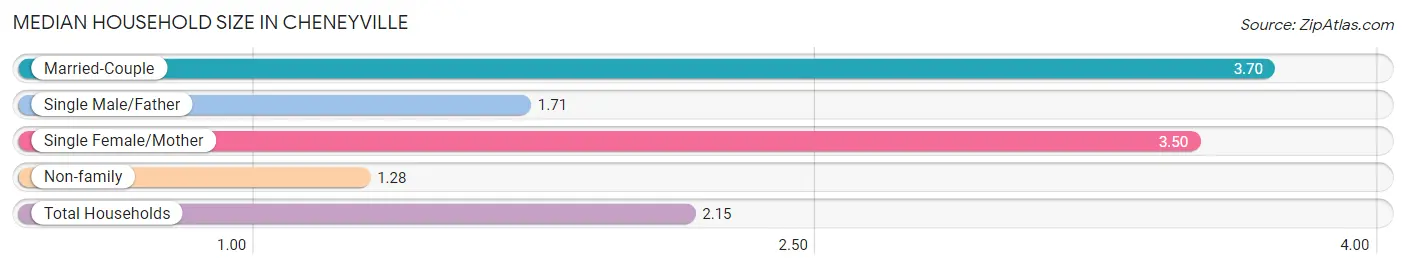
| Household Type | # Households | Household Size |
| Married-Couple | 80 (25.8%) | 3.70 |
| Single Male/Father | 7 (2.3%) | 1.71 |
| Single Female/Mother | 32 (10.3%) | 3.50 |
| Non-family | 191 (61.6%) | 1.28 |
| Total Households | 310 (100.0%) | 2.15 |
Household Size by Marriage Status in Cheneyville
Out of a total of 310 households in Cheneyville, 119 (38.4%) are family households, while 191 (61.6%) are nonfamily households. The most numerous type of family households are 2-person households, comprising 57, and the most common type of nonfamily households are 1-person households, comprising 155.
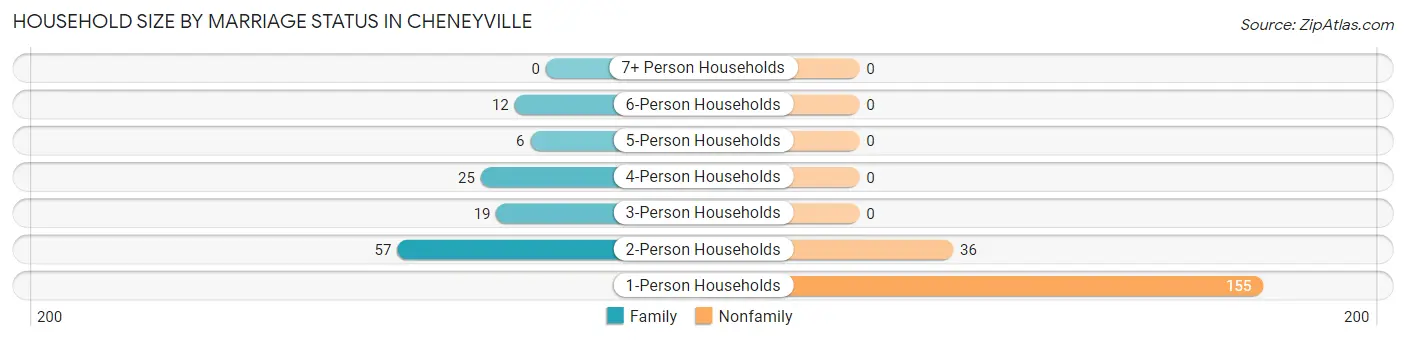
| Household Size | Family Households | Nonfamily Households |
| 1-Person Households | - | 155 (50.0%) |
| 2-Person Households | 57 (18.4%) | 36 (11.6%) |
| 3-Person Households | 19 (6.1%) | 0 (0.0%) |
| 4-Person Households | 25 (8.1%) | 0 (0.0%) |
| 5-Person Households | 6 (1.9%) | 0 (0.0%) |
| 6-Person Households | 12 (3.9%) | 0 (0.0%) |
| 7+ Person Households | 0 (0.0%) | 0 (0.0%) |
| Total | 119 (38.4%) | 191 (61.6%) |
Female Fertility in Cheneyville
Fertility by Age in Cheneyville
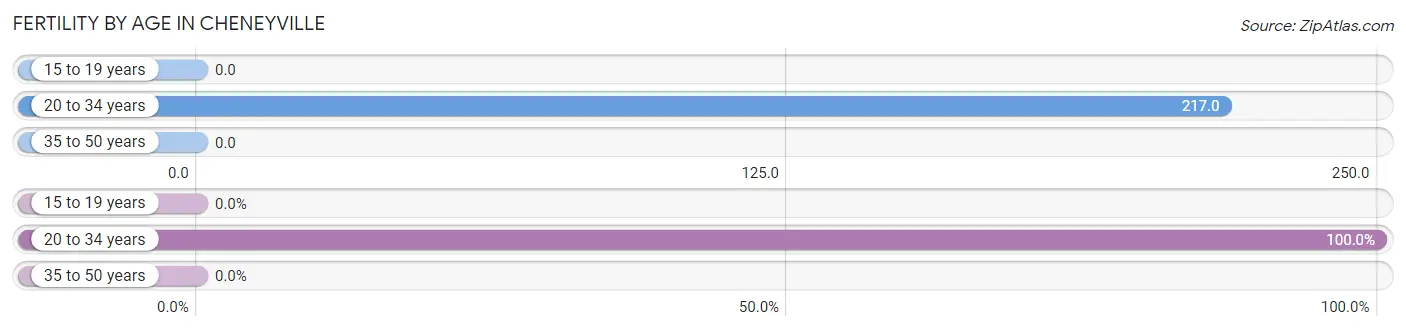
Average fertility rate in Cheneyville is 98.0 births per 1,000 women. Women in the age bracket of 20 to 34 years have the highest fertility rate with 217.0 births per 1,000 women. Women in the age bracket of 20 to 34 years acount for 100.0% of all women with births.
| Age Bracket | Women with Births | Births / 1,000 Women |
| 15 to 19 years | 0 (0.0%) | 0.0 |
| 20 to 34 years | 15 (100.0%) | 217.0 |
| 35 to 50 years | 0 (0.0%) | 0.0 |
| Total | 15 (100.0%) | 98.0 |
Fertility by Age by Marriage Status in Cheneyville
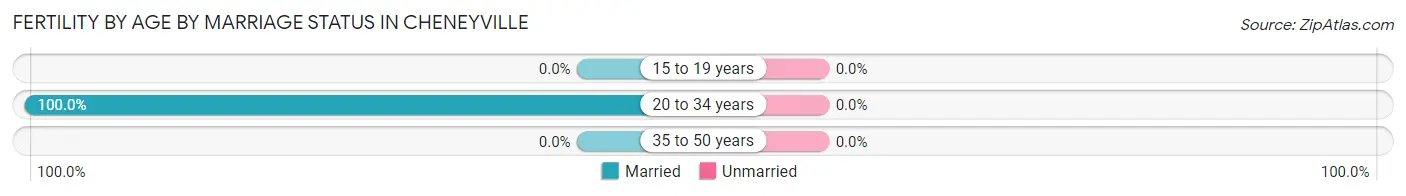
| Age Bracket | Married | Unmarried |
| 15 to 19 years | 0 (0.0%) | 0 (0.0%) |
| 20 to 34 years | 15 (100.0%) | 0 (0.0%) |
| 35 to 50 years | 0 (0.0%) | 0 (0.0%) |
| Total | 15 (100.0%) | 0 (0.0%) |
Fertility by Education in Cheneyville
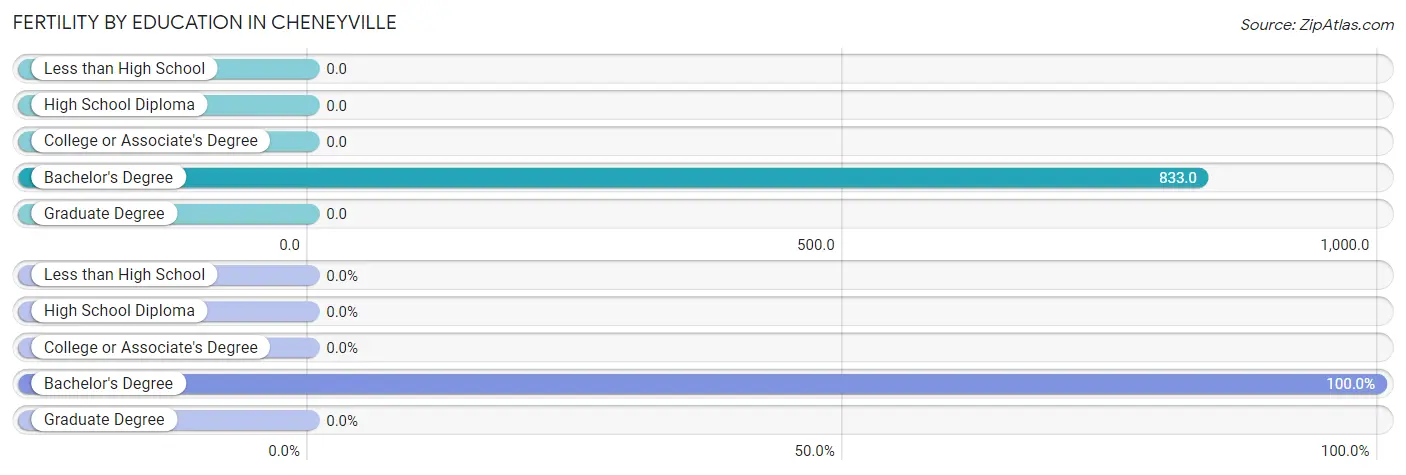
| Educational Attainment | Women with Births | Births / 1,000 Women |
| Less than High School | 0 (0.0%) | 0.0 |
| High School Diploma | 0 (0.0%) | 0.0 |
| College or Associate's Degree | 0 (0.0%) | 0.0 |
| Bachelor's Degree | 15 (100.0%) | 833.0 |
| Graduate Degree | 0 (0.0%) | 0.0 |
| Total | 15 (100.0%) | 98.0 |
Fertility by Education by Marriage Status in Cheneyville
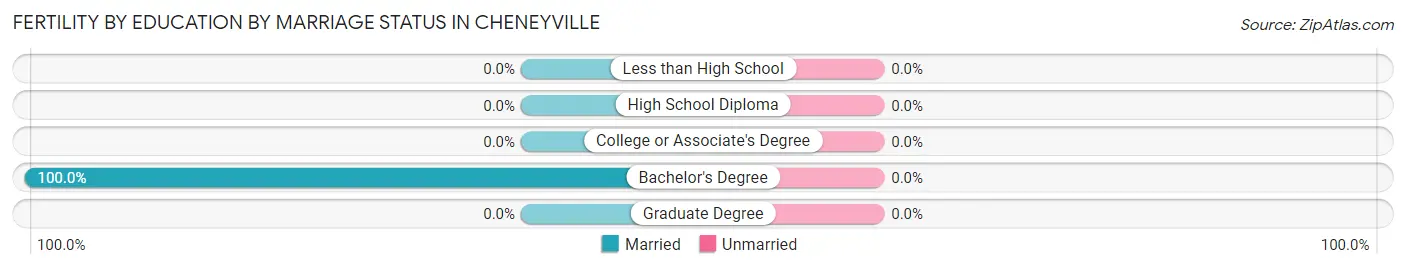
| Educational Attainment | Married | Unmarried |
| Less than High School | 0 (0.0%) | 0 (0.0%) |
| High School Diploma | 0 (0.0%) | 0 (0.0%) |
| College or Associate's Degree | 0 (0.0%) | 0 (0.0%) |
| Bachelor's Degree | 15 (100.0%) | 0 (0.0%) |
| Graduate Degree | 0 (0.0%) | 0 (0.0%) |
| Total | 15 (100.0%) | 0 (0.0%) |
Employment Characteristics in Cheneyville
Employment by Class of Employer in Cheneyville
Among the 211 employed individuals in Cheneyville, private company employees (130 | 61.6%), local government employees (32 | 15.2%), and state government employees (27 | 12.8%) make up the most common classes of employment.
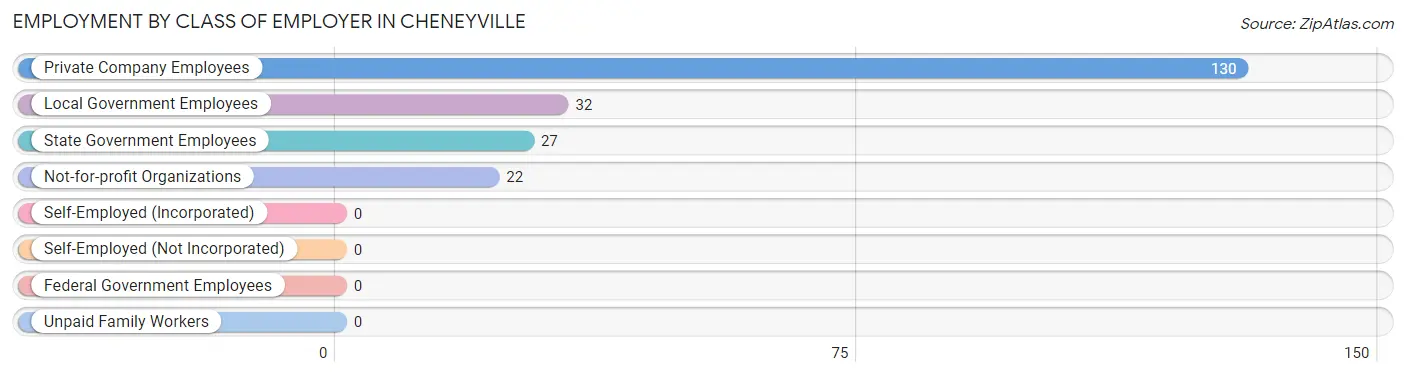
| Employer Class | # Employees | % Employees |
| Private Company Employees | 130 | 61.6% |
| Self-Employed (Incorporated) | 0 | 0.0% |
| Self-Employed (Not Incorporated) | 0 | 0.0% |
| Not-for-profit Organizations | 22 | 10.4% |
| Local Government Employees | 32 | 15.2% |
| State Government Employees | 27 | 12.8% |
| Federal Government Employees | 0 | 0.0% |
| Unpaid Family Workers | 0 | 0.0% |
| Total | 211 | 100.0% |
Employment Status by Age in Cheneyville
According to the labor force statistics for Cheneyville, out of the total population over 16 years of age (559), 39.5% or 221 individuals are in the labor force, with 4.5% or 10 of them unemployed. The age group with the highest labor force participation rate is 25 to 29 years, with 100.0% or 15 individuals in the labor force. Within the labor force, the 60 to 64 years age range has the highest percentage of unemployed individuals, with 100.0% or 10 of them being unemployed.
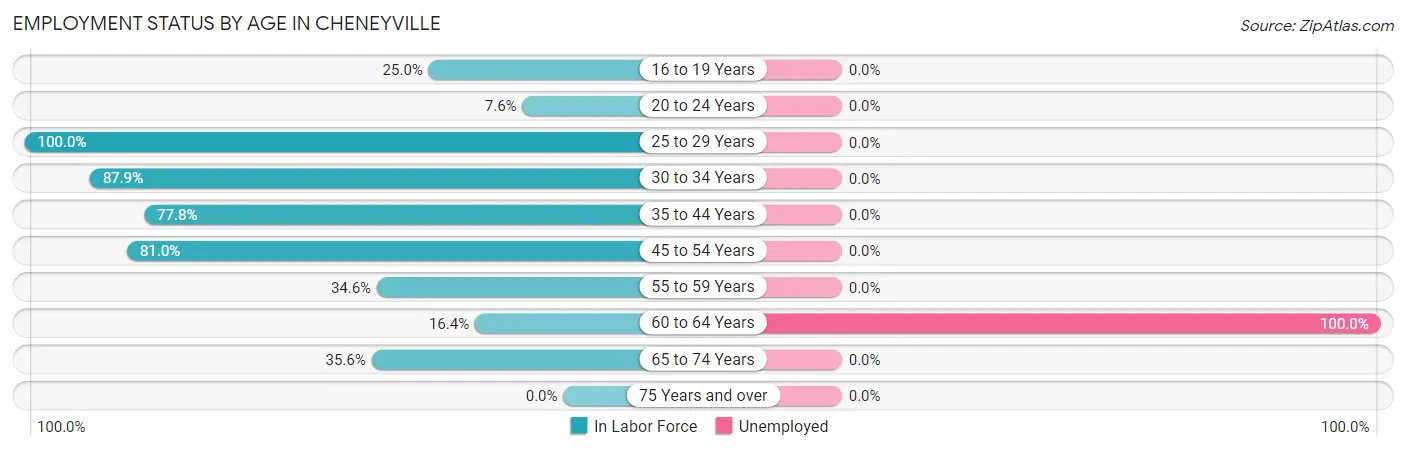
| Age Bracket | In Labor Force | Unemployed |
| 16 to 19 Years | 5 (25.0%) | 0 (0.0%) |
| 20 to 24 Years | 5 (7.6%) | 0 (0.0%) |
| 25 to 29 Years | 15 (100.0%) | 0 (0.0%) |
| 30 to 34 Years | 29 (87.9%) | 0 (0.0%) |
| 35 to 44 Years | 49 (77.8%) | 0 (0.0%) |
| 45 to 54 Years | 68 (81.0%) | 0 (0.0%) |
| 55 to 59 Years | 9 (34.6%) | 0 (0.0%) |
| 60 to 64 Years | 10 (16.4%) | 10 (100.0%) |
| 65 to 74 Years | 31 (35.6%) | 0 (0.0%) |
| 75 Years and over | 0 (0.0%) | 0 (0.0%) |
| Total | 221 (39.5%) | 10 (4.5%) |
Employment Status by Educational Attainment in Cheneyville
According to labor force statistics for Cheneyville, 63.8% of individuals (180) out of the total population between 25 and 64 years of age (282) are in the labor force, with 5.6% or 10 of them being unemployed. The group with the highest labor force participation rate are those with the educational attainment of bachelor's degree or higher, with 100.0% or 24 individuals in the labor force. Within the labor force, individuals with college / associate degree education have the highest percentage of unemployment, with 17.5% or 10 of them being unemployed.
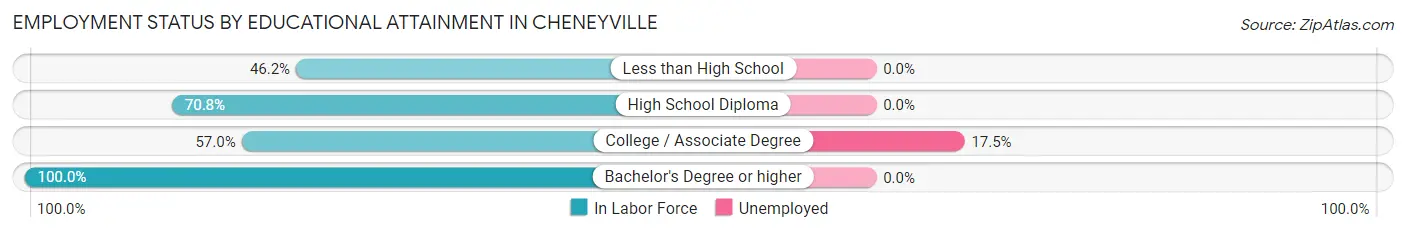
| Educational Attainment | In Labor Force | Unemployed |
| Less than High School | 24 (46.2%) | 0 (0.0%) |
| High School Diploma | 75 (70.8%) | 0 (0.0%) |
| College / Associate Degree | 57 (57.0%) | 18 (17.5%) |
| Bachelor's Degree or higher | 24 (100.0%) | 0 (0.0%) |
| Total | 180 (63.8%) | 16 (5.6%) |
Employment Occupations by Sex in Cheneyville
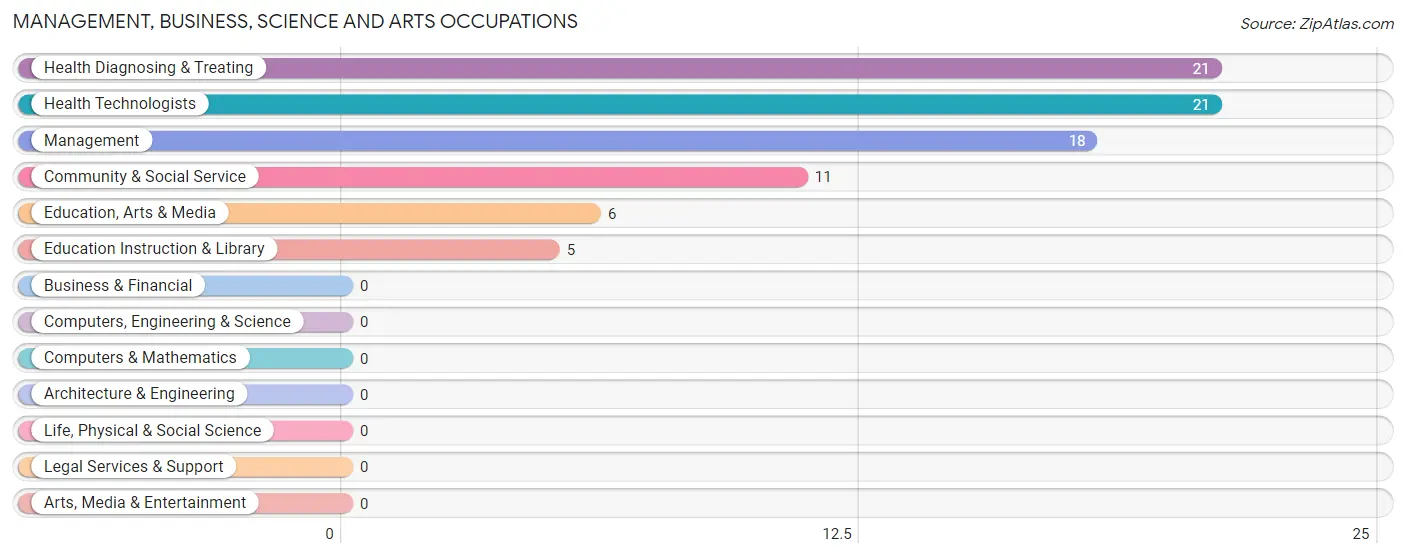
Management, Business, Science and Arts Occupations
The most common Management, Business, Science and Arts occupations in Cheneyville are Health Diagnosing & Treating (21 | 10.0%), Health Technologists (21 | 10.0%), Management (18 | 8.5%), Community & Social Service (11 | 5.2%), and Education, Arts & Media (6 | 2.8%).
Management, Business, Science and Arts Occupations by Sex
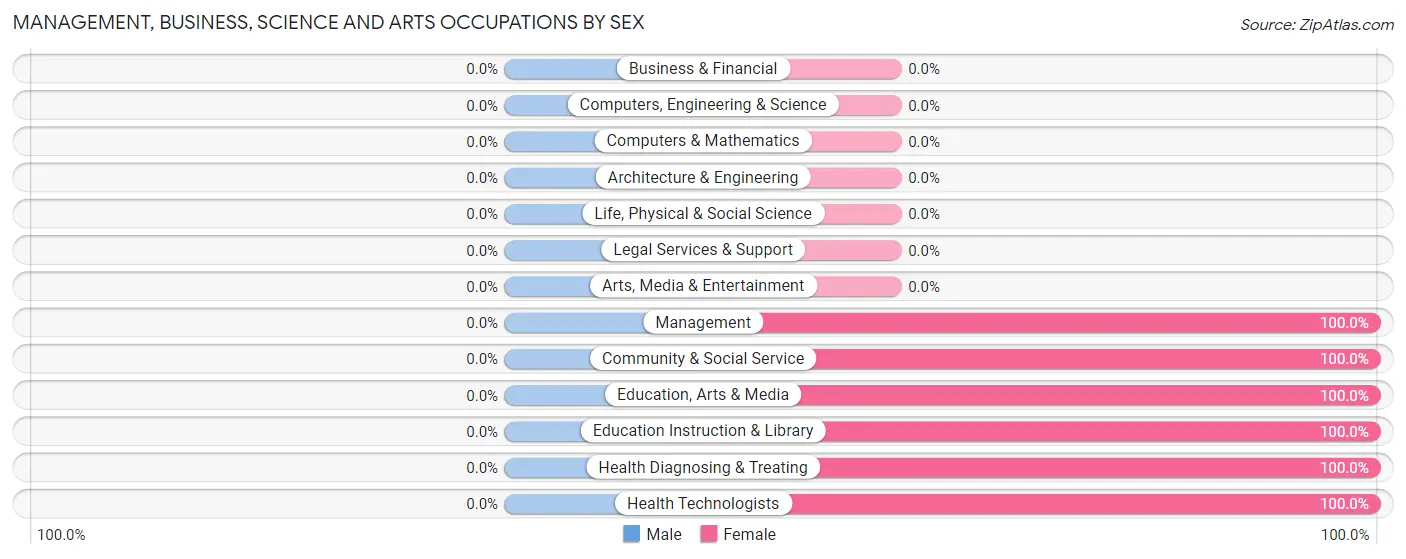
| Occupation | Male | Female |
| Management | 0 (0.0%) | 18 (100.0%) |
| Business & Financial | 0 (0.0%) | 0 (0.0%) |
| Computers, Engineering & Science | 0 (0.0%) | 0 (0.0%) |
| Computers & Mathematics | 0 (0.0%) | 0 (0.0%) |
| Architecture & Engineering | 0 (0.0%) | 0 (0.0%) |
| Life, Physical & Social Science | 0 (0.0%) | 0 (0.0%) |
| Community & Social Service | 0 (0.0%) | 11 (100.0%) |
| Education, Arts & Media | 0 (0.0%) | 6 (100.0%) |
| Legal Services & Support | 0 (0.0%) | 0 (0.0%) |
| Education Instruction & Library | 0 (0.0%) | 5 (100.0%) |
| Arts, Media & Entertainment | 0 (0.0%) | 0 (0.0%) |
| Health Diagnosing & Treating | 0 (0.0%) | 21 (100.0%) |
| Health Technologists | 0 (0.0%) | 21 (100.0%) |
| Total (Category) | 0 (0.0%) | 50 (100.0%) |
| Total (Overall) | 73 (34.6%) | 138 (65.4%) |
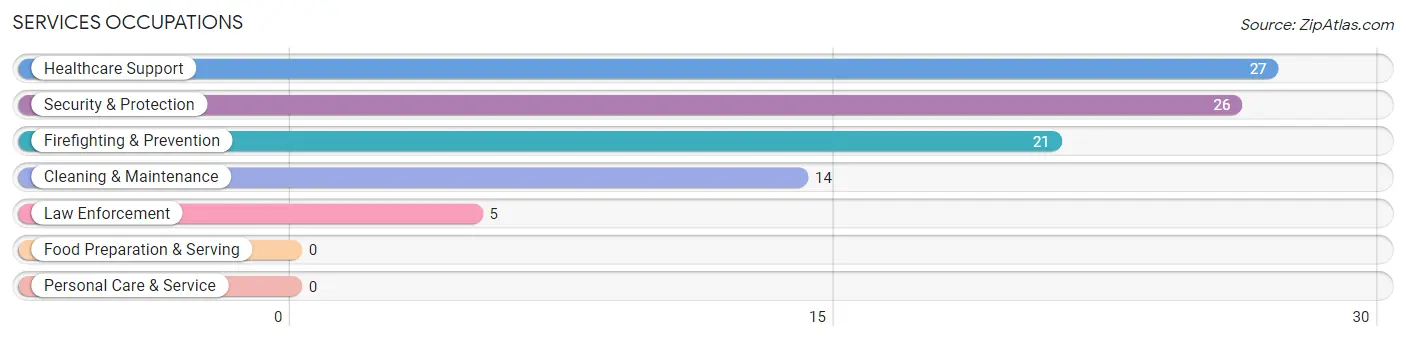
Services Occupations
The most common Services occupations in Cheneyville are Healthcare Support (27 | 12.8%), Security & Protection (26 | 12.3%), Firefighting & Prevention (21 | 10.0%), Cleaning & Maintenance (14 | 6.6%), and Law Enforcement (5 | 2.4%).
Services Occupations by Sex
Within the Services occupations in Cheneyville, the most male-oriented occupations are Security & Protection (100.0%), Firefighting & Prevention (100.0%), and Law Enforcement (100.0%), while the most female-oriented occupations are Healthcare Support (100.0%), and Cleaning & Maintenance (57.1%).
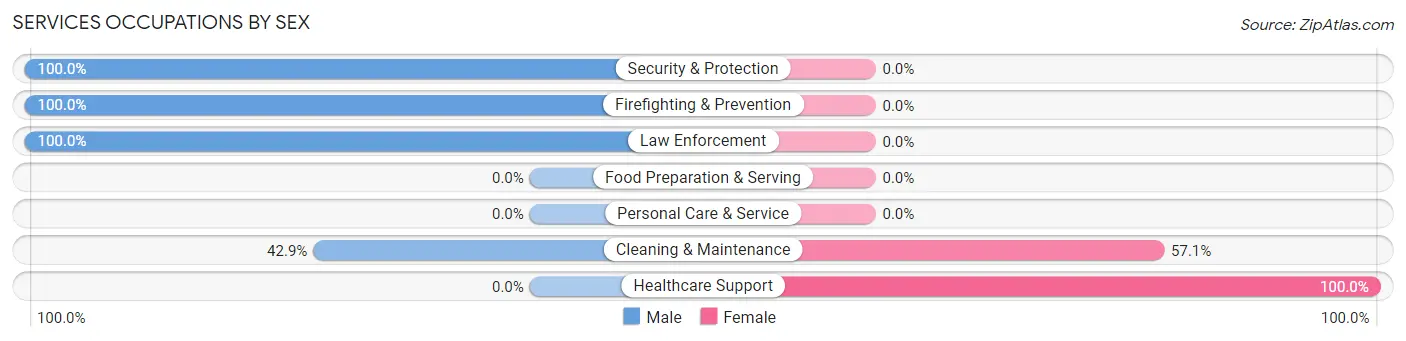
| Occupation | Male | Female |
| Healthcare Support | 0 (0.0%) | 27 (100.0%) |
| Security & Protection | 26 (100.0%) | 0 (0.0%) |
| Firefighting & Prevention | 21 (100.0%) | 0 (0.0%) |
| Law Enforcement | 5 (100.0%) | 0 (0.0%) |
| Food Preparation & Serving | 0 (0.0%) | 0 (0.0%) |
| Cleaning & Maintenance | 6 (42.9%) | 8 (57.1%) |
| Personal Care & Service | 0 (0.0%) | 0 (0.0%) |
| Total (Category) | 32 (47.8%) | 35 (52.2%) |
| Total (Overall) | 73 (34.6%) | 138 (65.4%) |
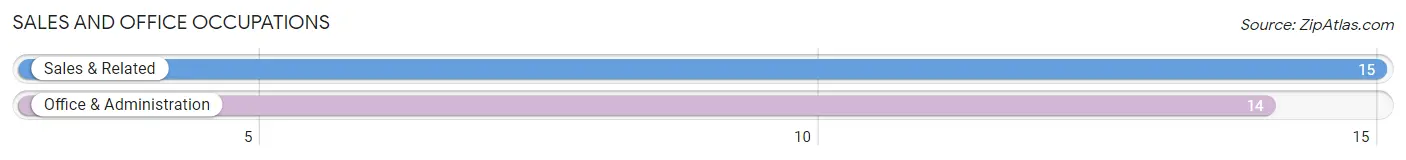
Sales and Office Occupations
The most common Sales and Office occupations in Cheneyville are Sales & Related (15 | 7.1%), and Office & Administration (14 | 6.6%).
Sales and Office Occupations by Sex
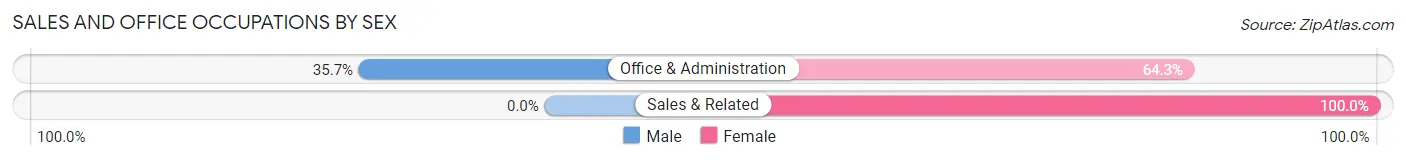
| Occupation | Male | Female |
| Sales & Related | 0 (0.0%) | 15 (100.0%) |
| Office & Administration | 5 (35.7%) | 9 (64.3%) |
| Total (Category) | 5 (17.2%) | 24 (82.8%) |
| Total (Overall) | 73 (34.6%) | 138 (65.4%) |
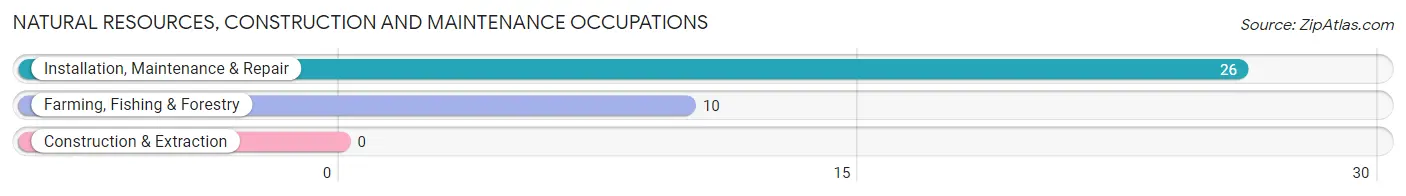
Natural Resources, Construction and Maintenance Occupations
The most common Natural Resources, Construction and Maintenance occupations in Cheneyville are Installation, Maintenance & Repair (26 | 12.3%), and Farming, Fishing & Forestry (10 | 4.7%).
Natural Resources, Construction and Maintenance Occupations by Sex
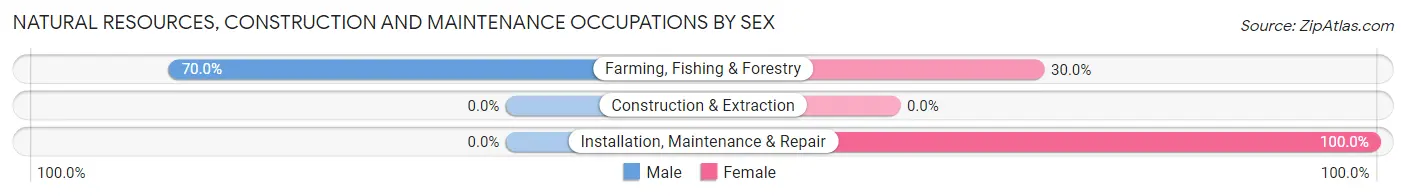
| Occupation | Male | Female |
| Farming, Fishing & Forestry | 7 (70.0%) | 3 (30.0%) |
| Construction & Extraction | 0 (0.0%) | 0 (0.0%) |
| Installation, Maintenance & Repair | 0 (0.0%) | 26 (100.0%) |
| Total (Category) | 7 (19.4%) | 29 (80.6%) |
| Total (Overall) | 73 (34.6%) | 138 (65.4%) |
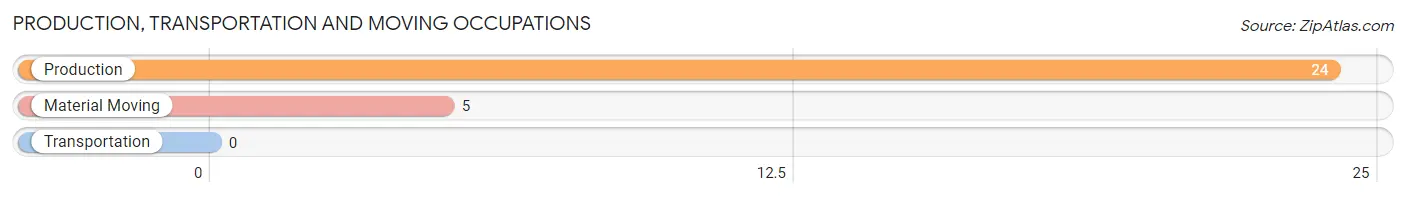
Production, Transportation and Moving Occupations
The most common Production, Transportation and Moving occupations in Cheneyville are Production (24 | 11.4%), and Material Moving (5 | 2.4%).
Production, Transportation and Moving Occupations by Sex
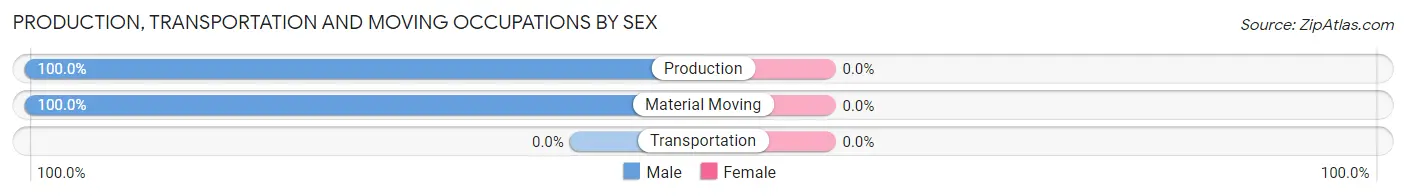
| Occupation | Male | Female |
| Production | 24 (100.0%) | 0 (0.0%) |
| Transportation | 0 (0.0%) | 0 (0.0%) |
| Material Moving | 5 (100.0%) | 0 (0.0%) |
| Total (Category) | 29 (100.0%) | 0 (0.0%) |
| Total (Overall) | 73 (34.6%) | 138 (65.4%) |
Employment Industries by Sex in Cheneyville
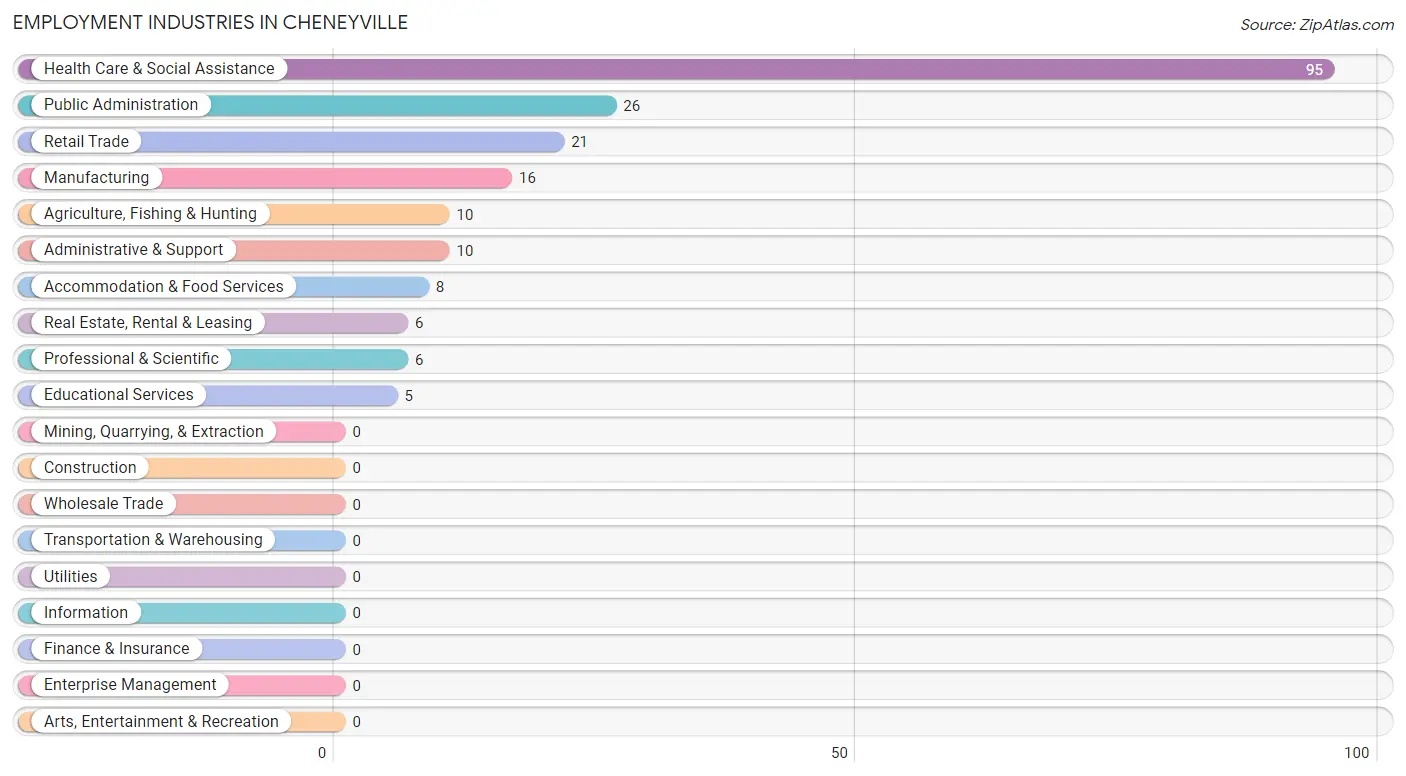
Employment Industries in Cheneyville
The major employment industries in Cheneyville include Health Care & Social Assistance (95 | 45.0%), Public Administration (26 | 12.3%), Retail Trade (21 | 10.0%), Manufacturing (16 | 7.6%), and Agriculture, Fishing & Hunting (10 | 4.7%).
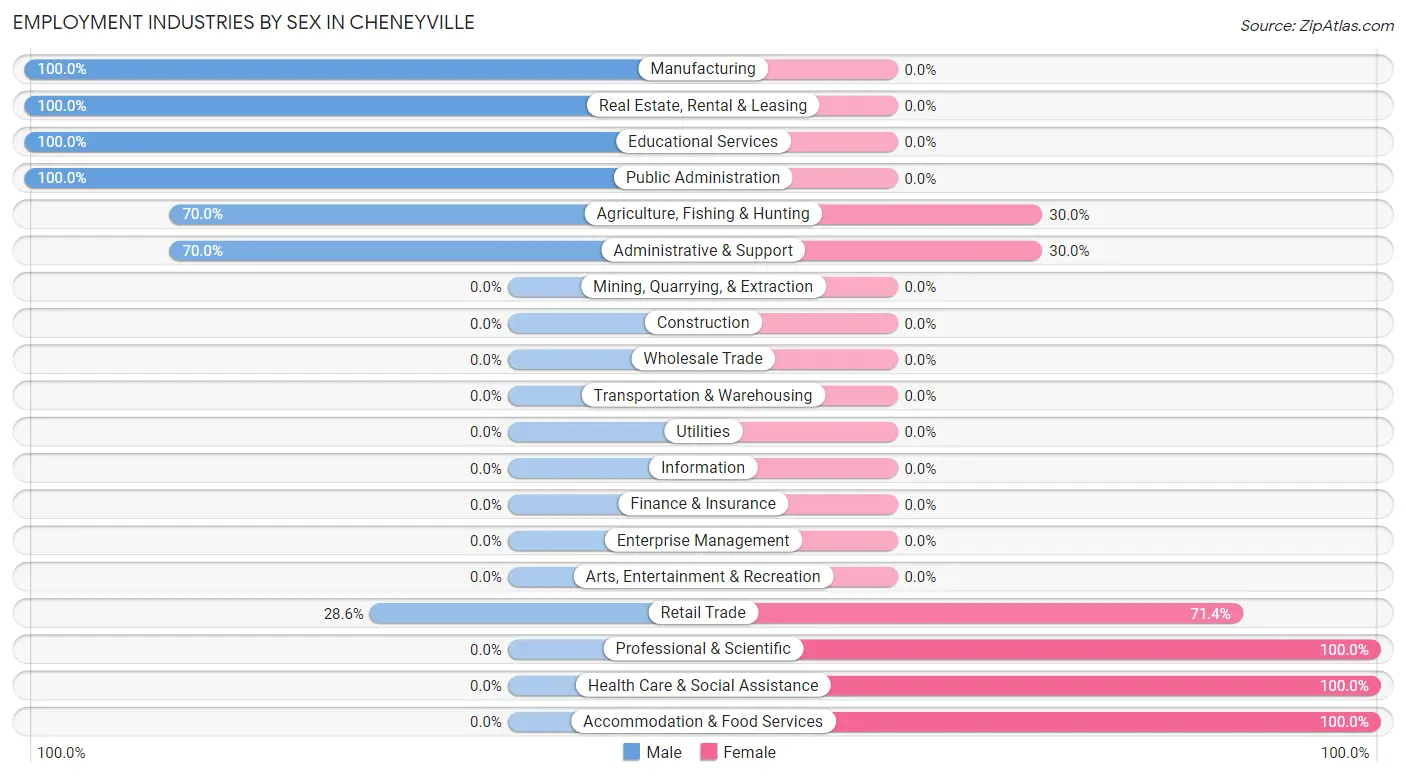
Employment Industries by Sex in Cheneyville
The Cheneyville industries that see more men than women are Manufacturing (100.0%), Real Estate, Rental & Leasing (100.0%), and Educational Services (100.0%), whereas the industries that tend to have a higher number of women are Professional & Scientific (100.0%), Health Care & Social Assistance (100.0%), and Accommodation & Food Services (100.0%).
| Industry | Male | Female |
| Agriculture, Fishing & Hunting | 7 (70.0%) | 3 (30.0%) |
| Mining, Quarrying, & Extraction | 0 (0.0%) | 0 (0.0%) |
| Construction | 0 (0.0%) | 0 (0.0%) |
| Manufacturing | 16 (100.0%) | 0 (0.0%) |
| Wholesale Trade | 0 (0.0%) | 0 (0.0%) |
| Retail Trade | 6 (28.6%) | 15 (71.4%) |
| Transportation & Warehousing | 0 (0.0%) | 0 (0.0%) |
| Utilities | 0 (0.0%) | 0 (0.0%) |
| Information | 0 (0.0%) | 0 (0.0%) |
| Finance & Insurance | 0 (0.0%) | 0 (0.0%) |
| Real Estate, Rental & Leasing | 6 (100.0%) | 0 (0.0%) |
| Professional & Scientific | 0 (0.0%) | 6 (100.0%) |
| Enterprise Management | 0 (0.0%) | 0 (0.0%) |
| Administrative & Support | 7 (70.0%) | 3 (30.0%) |
| Educational Services | 5 (100.0%) | 0 (0.0%) |
| Health Care & Social Assistance | 0 (0.0%) | 95 (100.0%) |
| Arts, Entertainment & Recreation | 0 (0.0%) | 0 (0.0%) |
| Accommodation & Food Services | 0 (0.0%) | 8 (100.0%) |
| Public Administration | 26 (100.0%) | 0 (0.0%) |
| Total | 73 (34.6%) | 138 (65.4%) |
Education in Cheneyville
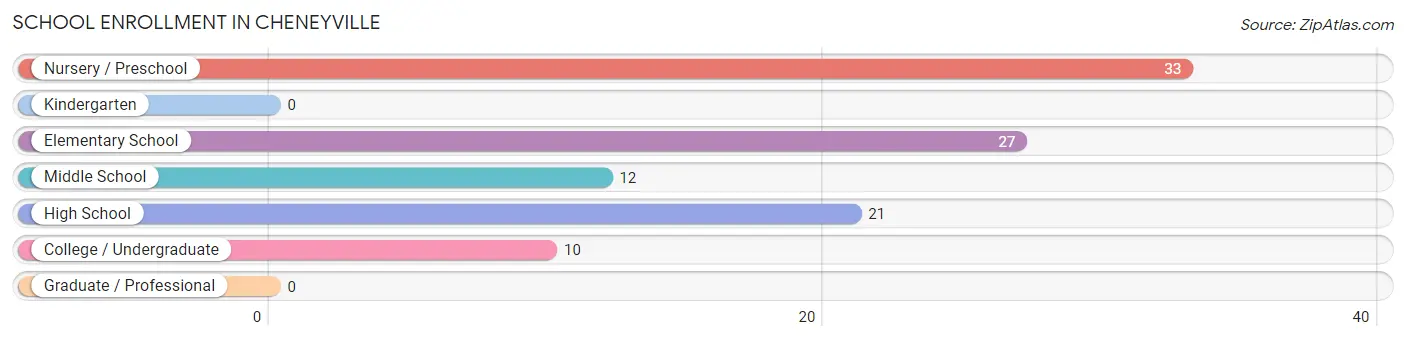
School Enrollment in Cheneyville
The most common levels of schooling among the 103 students in Cheneyville are nursery / preschool (33 | 32.0%), elementary school (27 | 26.2%), and high school (21 | 20.4%).
| School Level | # Students | % Students |
| Nursery / Preschool | 33 | 32.0% |
| Kindergarten | 0 | 0.0% |
| Elementary School | 27 | 26.2% |
| Middle School | 12 | 11.7% |
| High School | 21 | 20.4% |
| College / Undergraduate | 10 | 9.7% |
| Graduate / Professional | 0 | 0.0% |
| Total | 103 | 100.0% |
School Enrollment by Age by Funding Source in Cheneyville
Out of a total of 103 students who are enrolled in schools in Cheneyville, 12 (11.7%) attend a private institution, while the remaining 91 (88.3%) are enrolled in public schools. The age group of 15 to 17 year olds has the highest likelihood of being enrolled in private schools, with 12 (66.7% in the age bracket) enrolled. Conversely, the age group of 3 to 4 year olds has the lowest likelihood of being enrolled in a private school, with 33 (100.0% in the age bracket) attending a public institution.
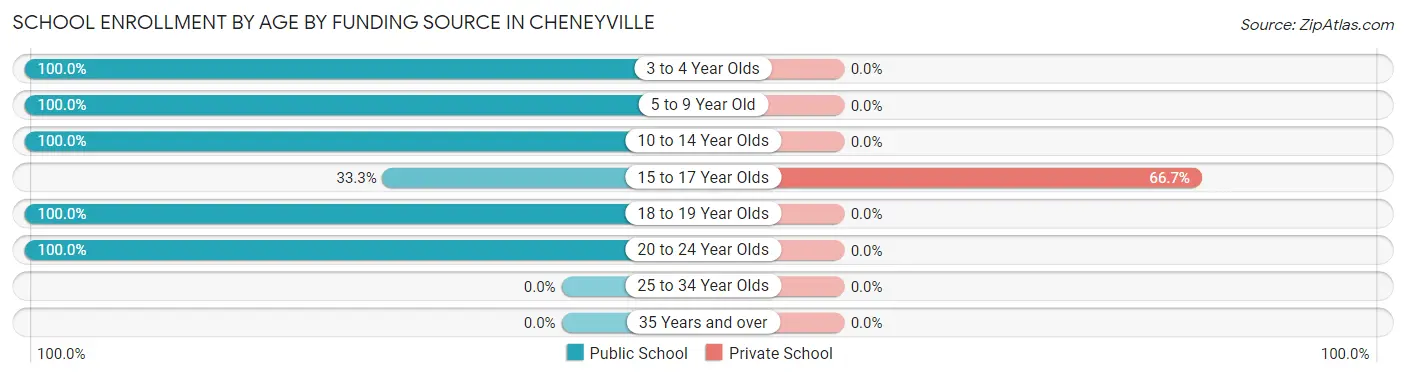
| Age Bracket | Public School | Private School |
| 3 to 4 Year Olds | 33 (100.0%) | 0 (0.0%) |
| 5 to 9 Year Old | 27 (100.0%) | 0 (0.0%) |
| 10 to 14 Year Olds | 12 (100.0%) | 0 (0.0%) |
| 15 to 17 Year Olds | 6 (33.3%) | 12 (66.7%) |
| 18 to 19 Year Olds | 8 (100.0%) | 0 (0.0%) |
| 20 to 24 Year Olds | 5 (100.0%) | 0 (0.0%) |
| 25 to 34 Year Olds | 0 (0.0%) | 0 (0.0%) |
| 35 Years and over | 0 (0.0%) | 0 (0.0%) |
| Total | 91 (88.3%) | 12 (11.7%) |
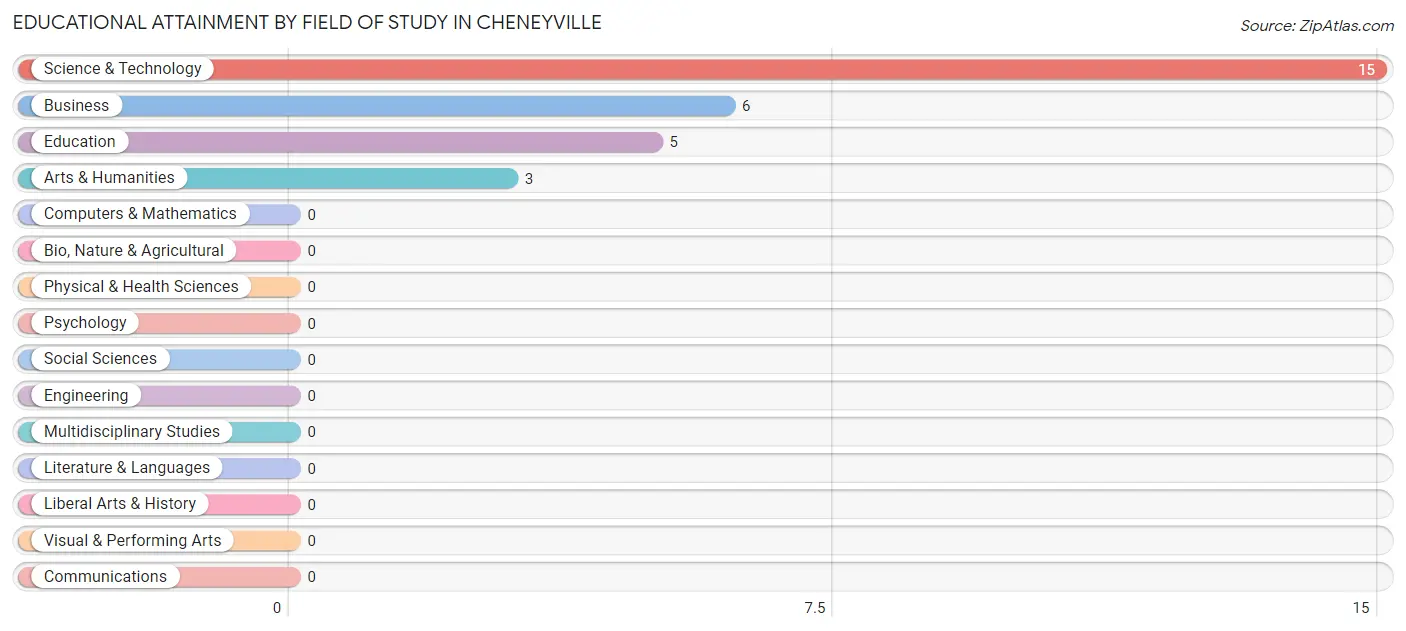
Educational Attainment by Field of Study in Cheneyville
Science & technology (15 | 51.7%), business (6 | 20.7%), education (5 | 17.2%), and arts & humanities (3 | 10.3%) are the most common fields of study among 29 individuals in Cheneyville who have obtained a bachelor's degree or higher.
| Field of Study | # Graduates | % Graduates |
| Computers & Mathematics | 0 | 0.0% |
| Bio, Nature & Agricultural | 0 | 0.0% |
| Physical & Health Sciences | 0 | 0.0% |
| Psychology | 0 | 0.0% |
| Social Sciences | 0 | 0.0% |
| Engineering | 0 | 0.0% |
| Multidisciplinary Studies | 0 | 0.0% |
| Science & Technology | 15 | 51.7% |
| Business | 6 | 20.7% |
| Education | 5 | 17.2% |
| Literature & Languages | 0 | 0.0% |
| Liberal Arts & History | 0 | 0.0% |
| Visual & Performing Arts | 0 | 0.0% |
| Communications | 0 | 0.0% |
| Arts & Humanities | 3 | 10.3% |
| Total | 29 | 100.0% |
Transportation & Commute in Cheneyville
Vehicle Availability by Sex in Cheneyville
The most prevalent vehicle ownership categories in Cheneyville are males with 2 vehicles (55, accounting for 75.3%) and females with 2 vehicles (43, making up 40.7%).
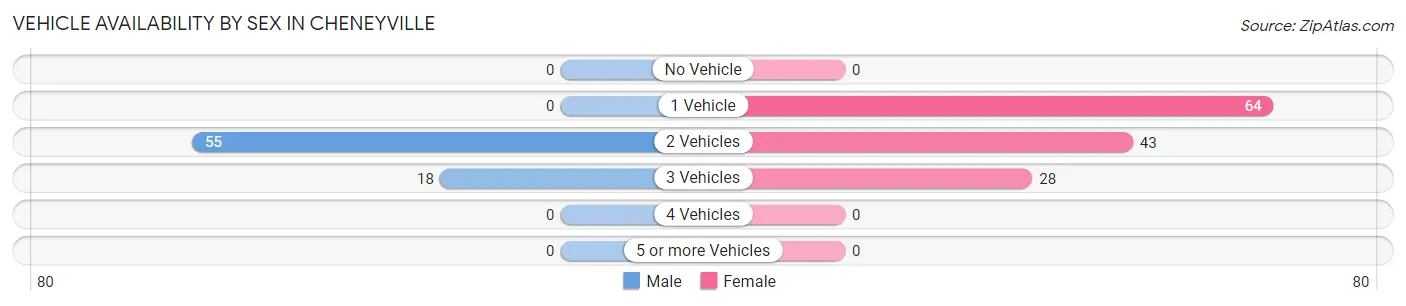
| Vehicles Available | Male | Female |
| No Vehicle | 0 (0.0%) | 0 (0.0%) |
| 1 Vehicle | 0 (0.0%) | 64 (47.4%) |
| 2 Vehicles | 55 (75.3%) | 43 (31.9%) |
| 3 Vehicles | 18 (24.7%) | 28 (20.7%) |
| 4 Vehicles | 0 (0.0%) | 0 (0.0%) |
| 5 or more Vehicles | 0 (0.0%) | 0 (0.0%) |
| Total | 73 (100.0%) | 135 (100.0%) |
Commute Time in Cheneyville
The most frequently occuring commute durations in Cheneyville are 30 to 34 minutes (104 commuters, 49.3%), 15 to 19 minutes (31 commuters, 14.7%), and 45 to 59 minutes (25 commuters, 11.8%).
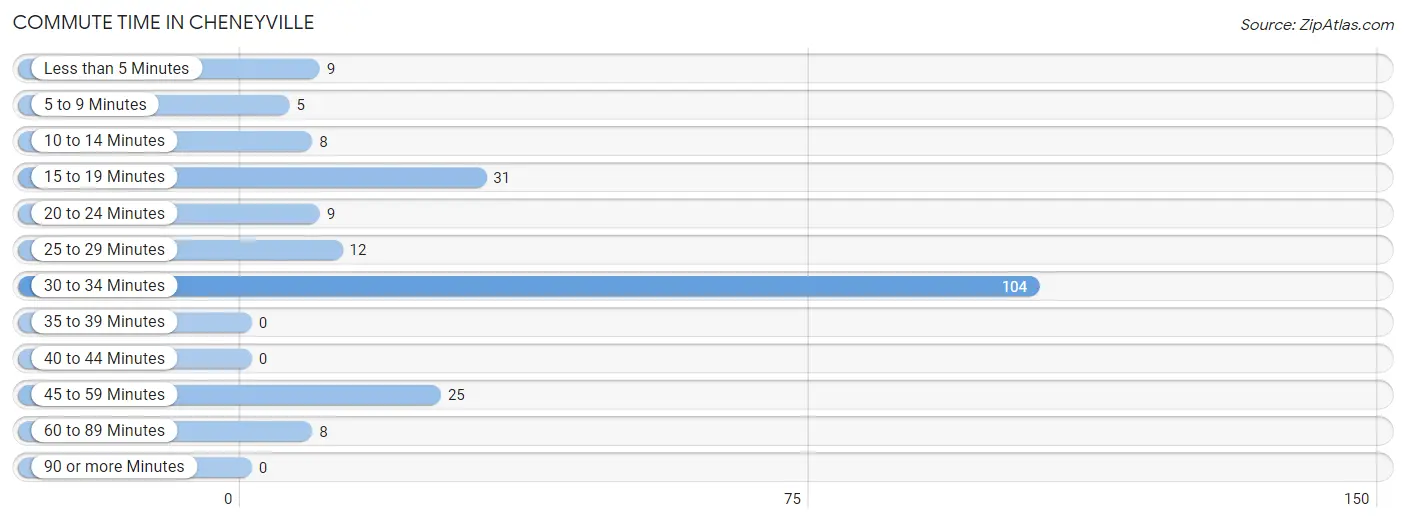
| Commute Time | # Commuters | % Commuters |
| Less than 5 Minutes | 9 | 4.3% |
| 5 to 9 Minutes | 5 | 2.4% |
| 10 to 14 Minutes | 8 | 3.8% |
| 15 to 19 Minutes | 31 | 14.7% |
| 20 to 24 Minutes | 9 | 4.3% |
| 25 to 29 Minutes | 12 | 5.7% |
| 30 to 34 Minutes | 104 | 49.3% |
| 35 to 39 Minutes | 0 | 0.0% |
| 40 to 44 Minutes | 0 | 0.0% |
| 45 to 59 Minutes | 25 | 11.8% |
| 60 to 89 Minutes | 8 | 3.8% |
| 90 or more Minutes | 0 | 0.0% |
Commute Time by Sex in Cheneyville
The most common commute times in Cheneyville are 30 to 34 minutes (33 commuters, 45.2%) for males and 30 to 34 minutes (71 commuters, 51.4%) for females.
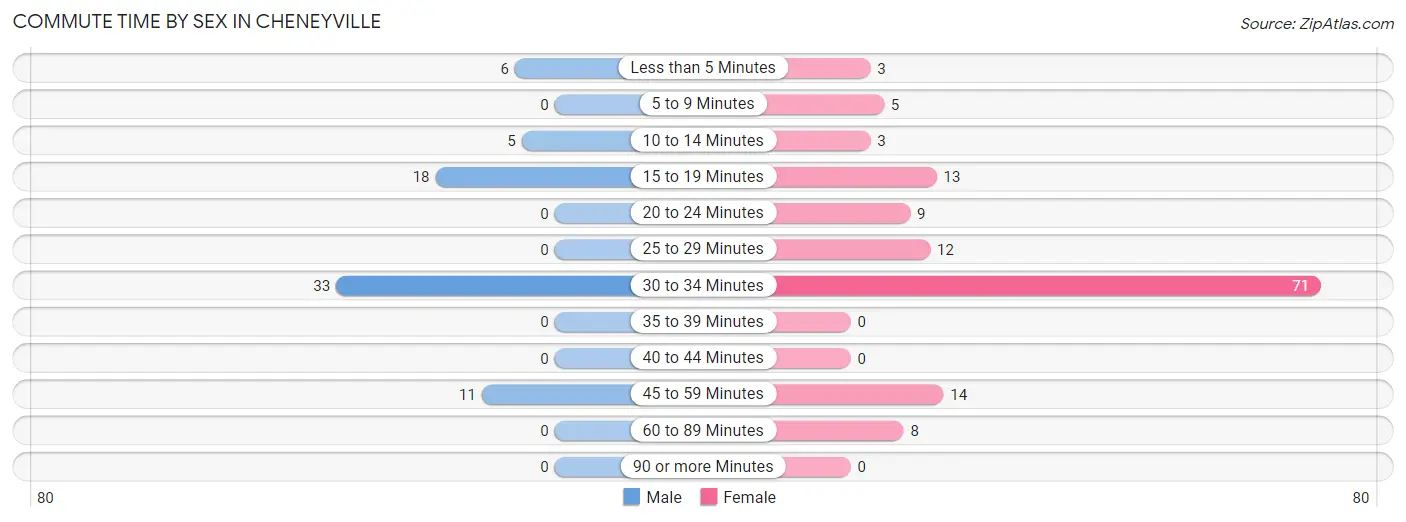
| Commute Time | Male | Female |
| Less than 5 Minutes | 6 (8.2%) | 3 (2.2%) |
| 5 to 9 Minutes | 0 (0.0%) | 5 (3.6%) |
| 10 to 14 Minutes | 5 (6.9%) | 3 (2.2%) |
| 15 to 19 Minutes | 18 (24.7%) | 13 (9.4%) |
| 20 to 24 Minutes | 0 (0.0%) | 9 (6.5%) |
| 25 to 29 Minutes | 0 (0.0%) | 12 (8.7%) |
| 30 to 34 Minutes | 33 (45.2%) | 71 (51.4%) |
| 35 to 39 Minutes | 0 (0.0%) | 0 (0.0%) |
| 40 to 44 Minutes | 0 (0.0%) | 0 (0.0%) |
| 45 to 59 Minutes | 11 (15.1%) | 14 (10.1%) |
| 60 to 89 Minutes | 0 (0.0%) | 8 (5.8%) |
| 90 or more Minutes | 0 (0.0%) | 0 (0.0%) |
Time of Departure to Work by Sex in Cheneyville
The most frequent times of departure to work in Cheneyville are 5:30 AM to 5:59 AM (27, 37.0%) for males and 6:00 AM to 6:29 AM (48, 34.8%) for females.
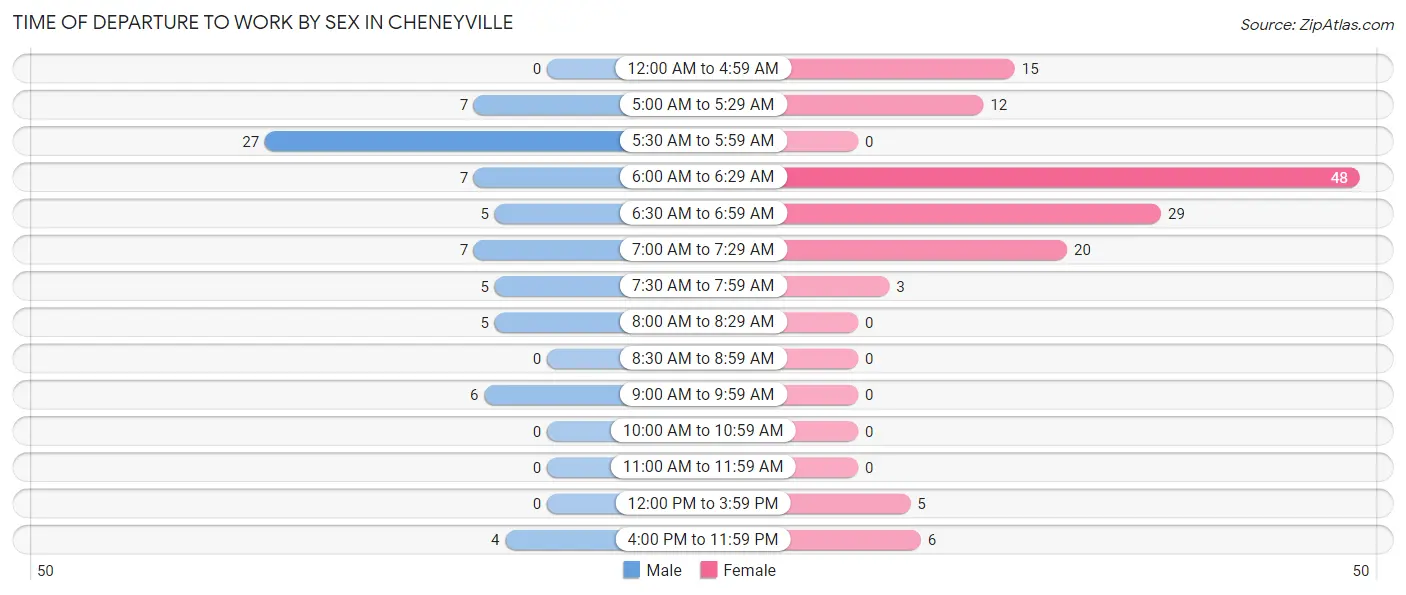
| Time of Departure | Male | Female |
| 12:00 AM to 4:59 AM | 0 (0.0%) | 15 (10.9%) |
| 5:00 AM to 5:29 AM | 7 (9.6%) | 12 (8.7%) |
| 5:30 AM to 5:59 AM | 27 (37.0%) | 0 (0.0%) |
| 6:00 AM to 6:29 AM | 7 (9.6%) | 48 (34.8%) |
| 6:30 AM to 6:59 AM | 5 (6.9%) | 29 (21.0%) |
| 7:00 AM to 7:29 AM | 7 (9.6%) | 20 (14.5%) |
| 7:30 AM to 7:59 AM | 5 (6.9%) | 3 (2.2%) |
| 8:00 AM to 8:29 AM | 5 (6.9%) | 0 (0.0%) |
| 8:30 AM to 8:59 AM | 0 (0.0%) | 0 (0.0%) |
| 9:00 AM to 9:59 AM | 6 (8.2%) | 0 (0.0%) |
| 10:00 AM to 10:59 AM | 0 (0.0%) | 0 (0.0%) |
| 11:00 AM to 11:59 AM | 0 (0.0%) | 0 (0.0%) |
| 12:00 PM to 3:59 PM | 0 (0.0%) | 5 (3.6%) |
| 4:00 PM to 11:59 PM | 4 (5.5%) | 6 (4.3%) |
| Total | 73 (100.0%) | 138 (100.0%) |
Housing Occupancy in Cheneyville
Occupancy by Ownership in Cheneyville
Of the total 310 dwellings in Cheneyville, owner-occupied units account for 214 (69.0%), while renter-occupied units make up 96 (31.0%).
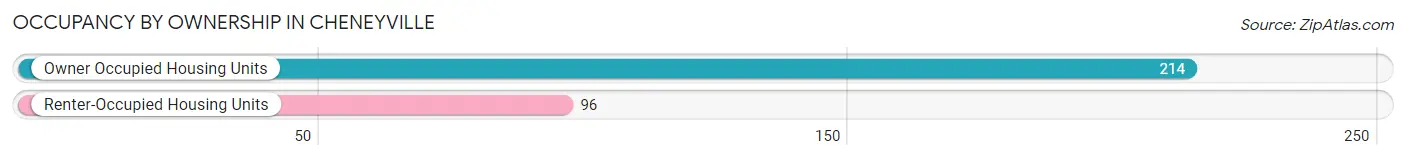
| Occupancy | # Housing Units | % Housing Units |
| Owner Occupied Housing Units | 214 | 69.0% |
| Renter-Occupied Housing Units | 96 | 31.0% |
| Total Occupied Housing Units | 310 | 100.0% |
Occupancy by Household Size in Cheneyville
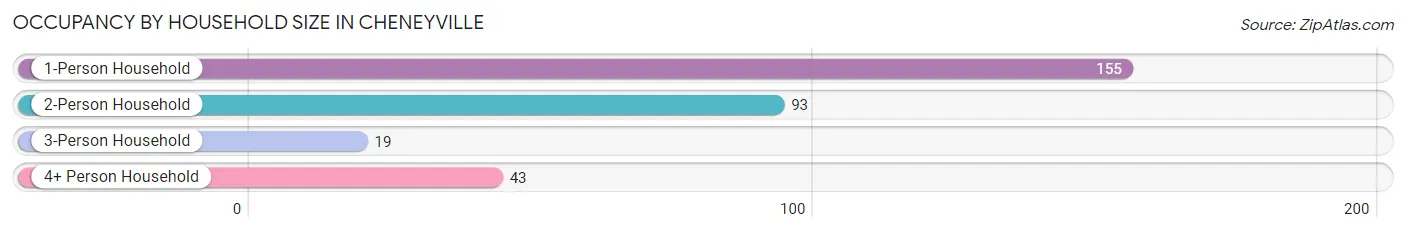
| Household Size | # Housing Units | % Housing Units |
| 1-Person Household | 155 | 50.0% |
| 2-Person Household | 93 | 30.0% |
| 3-Person Household | 19 | 6.1% |
| 4+ Person Household | 43 | 13.9% |
| Total Housing Units | 310 | 100.0% |
Occupancy by Ownership by Household Size in Cheneyville
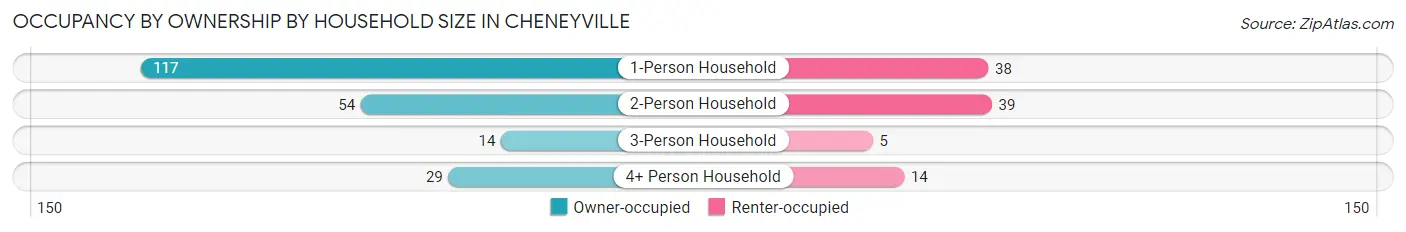
| Household Size | Owner-occupied | Renter-occupied |
| 1-Person Household | 117 (75.5%) | 38 (24.5%) |
| 2-Person Household | 54 (58.1%) | 39 (41.9%) |
| 3-Person Household | 14 (73.7%) | 5 (26.3%) |
| 4+ Person Household | 29 (67.4%) | 14 (32.6%) |
| Total Housing Units | 214 (69.0%) | 96 (31.0%) |
Occupancy by Educational Attainment in Cheneyville
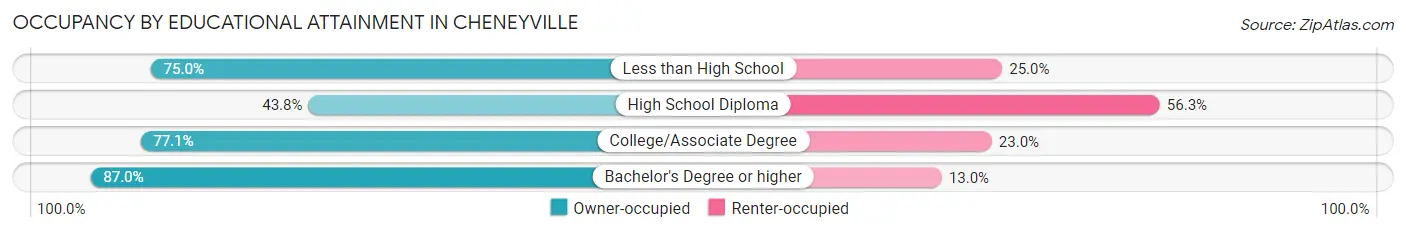
| Household Size | Owner-occupied | Renter-occupied |
| Less than High School | 18 (75.0%) | 6 (25.0%) |
| High School Diploma | 35 (43.8%) | 45 (56.2%) |
| College/Associate Degree | 141 (77.0%) | 42 (23.0%) |
| Bachelor's Degree or higher | 20 (87.0%) | 3 (13.0%) |
Occupancy by Age of Householder in Cheneyville
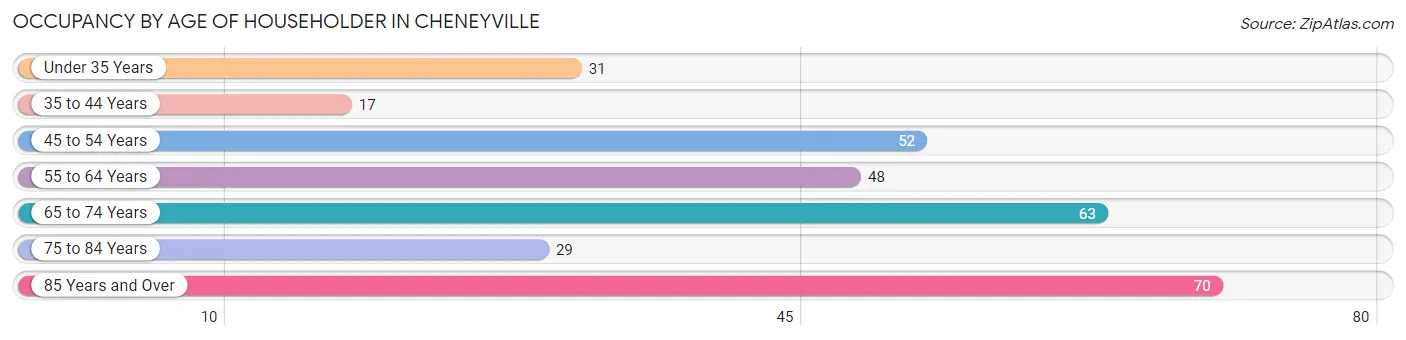
| Age Bracket | # Households | % Households |
| Under 35 Years | 31 | 10.0% |
| 35 to 44 Years | 17 | 5.5% |
| 45 to 54 Years | 52 | 16.8% |
| 55 to 64 Years | 48 | 15.5% |
| 65 to 74 Years | 63 | 20.3% |
| 75 to 84 Years | 29 | 9.3% |
| 85 Years and Over | 70 | 22.6% |
| Total | 310 | 100.0% |
Housing Finances in Cheneyville
Median Income by Occupancy in Cheneyville
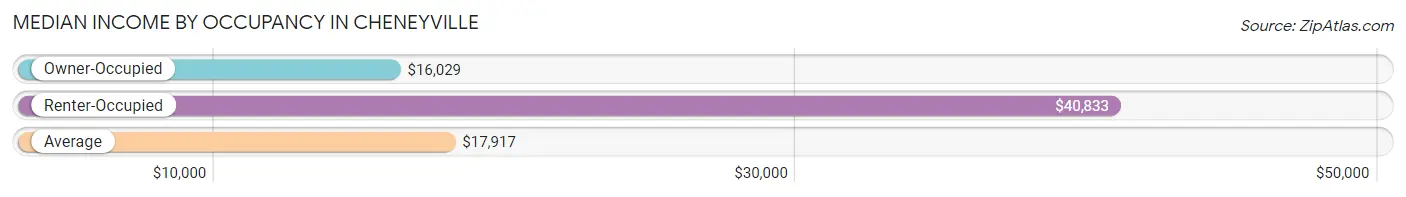
| Occupancy Type | # Households | Median Income |
| Owner-Occupied | 214 (69.0%) | $16,029 |
| Renter-Occupied | 96 (31.0%) | $40,833 |
| Average | 310 (100.0%) | $17,917 |
Occupancy by Householder Income Bracket in Cheneyville
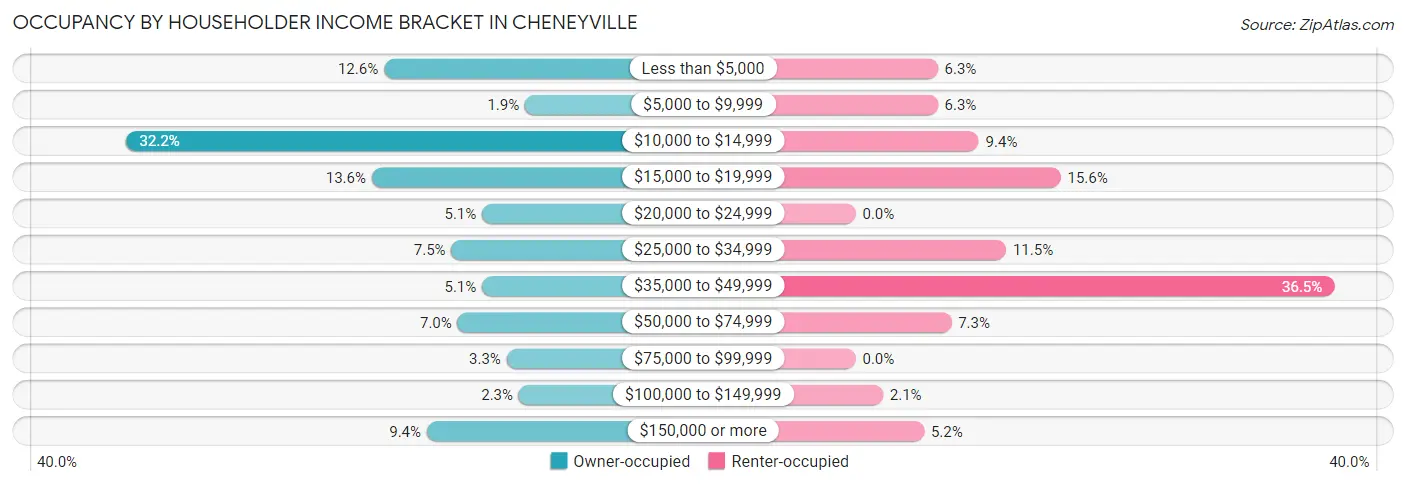
| Income Bracket | Owner-occupied | Renter-occupied |
| Less than $5,000 | 27 (12.6%) | 6 (6.2%) |
| $5,000 to $9,999 | 4 (1.9%) | 6 (6.2%) |
| $10,000 to $14,999 | 69 (32.2%) | 9 (9.4%) |
| $15,000 to $19,999 | 29 (13.6%) | 15 (15.6%) |
| $20,000 to $24,999 | 11 (5.1%) | 0 (0.0%) |
| $25,000 to $34,999 | 16 (7.5%) | 11 (11.5%) |
| $35,000 to $49,999 | 11 (5.1%) | 35 (36.5%) |
| $50,000 to $74,999 | 15 (7.0%) | 7 (7.3%) |
| $75,000 to $99,999 | 7 (3.3%) | 0 (0.0%) |
| $100,000 to $149,999 | 5 (2.3%) | 2 (2.1%) |
| $150,000 or more | 20 (9.3%) | 5 (5.2%) |
| Total | 214 (100.0%) | 96 (100.0%) |
Monthly Housing Cost Tiers in Cheneyville
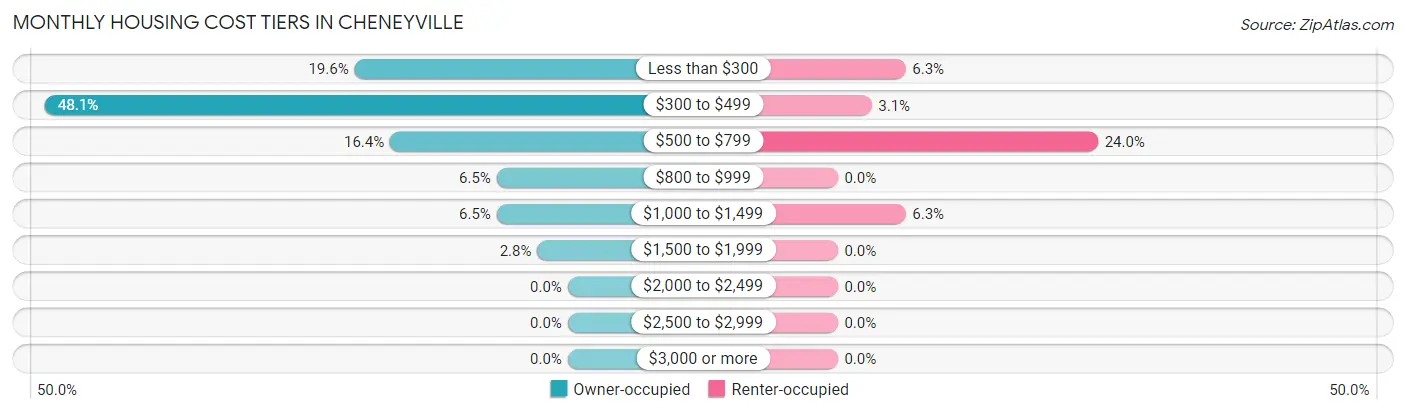
| Monthly Cost | Owner-occupied | Renter-occupied |
| Less than $300 | 42 (19.6%) | 6 (6.2%) |
| $300 to $499 | 103 (48.1%) | 3 (3.1%) |
| $500 to $799 | 35 (16.4%) | 23 (24.0%) |
| $800 to $999 | 14 (6.5%) | 0 (0.0%) |
| $1,000 to $1,499 | 14 (6.5%) | 6 (6.2%) |
| $1,500 to $1,999 | 6 (2.8%) | 0 (0.0%) |
| $2,000 to $2,499 | 0 (0.0%) | 0 (0.0%) |
| $2,500 to $2,999 | 0 (0.0%) | 0 (0.0%) |
| $3,000 or more | 0 (0.0%) | 0 (0.0%) |
| Total | 214 (100.0%) | 96 (100.0%) |
Physical Housing Characteristics in Cheneyville
Housing Structures in Cheneyville
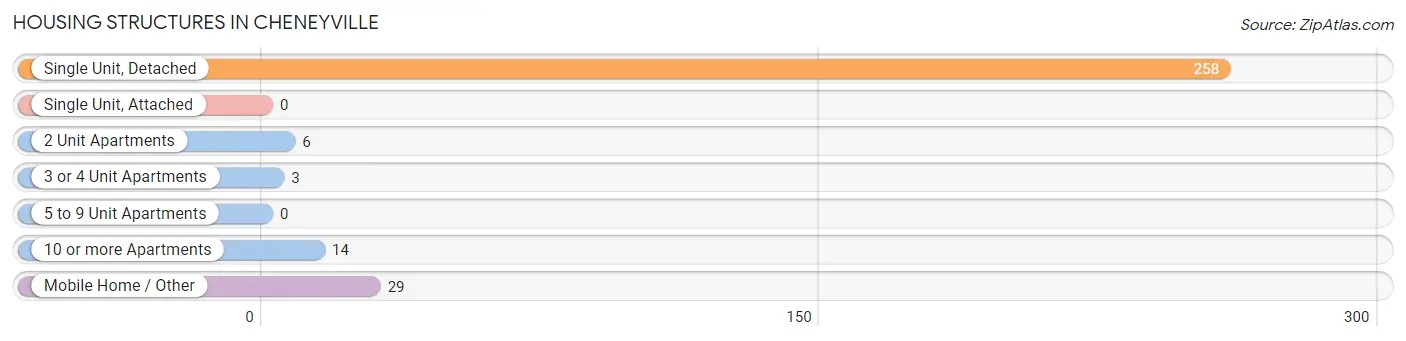
| Structure Type | # Housing Units | % Housing Units |
| Single Unit, Detached | 258 | 83.2% |
| Single Unit, Attached | 0 | 0.0% |
| 2 Unit Apartments | 6 | 1.9% |
| 3 or 4 Unit Apartments | 3 | 1.0% |
| 5 to 9 Unit Apartments | 0 | 0.0% |
| 10 or more Apartments | 14 | 4.5% |
| Mobile Home / Other | 29 | 9.3% |
| Total | 310 | 100.0% |
Housing Structures by Occupancy in Cheneyville
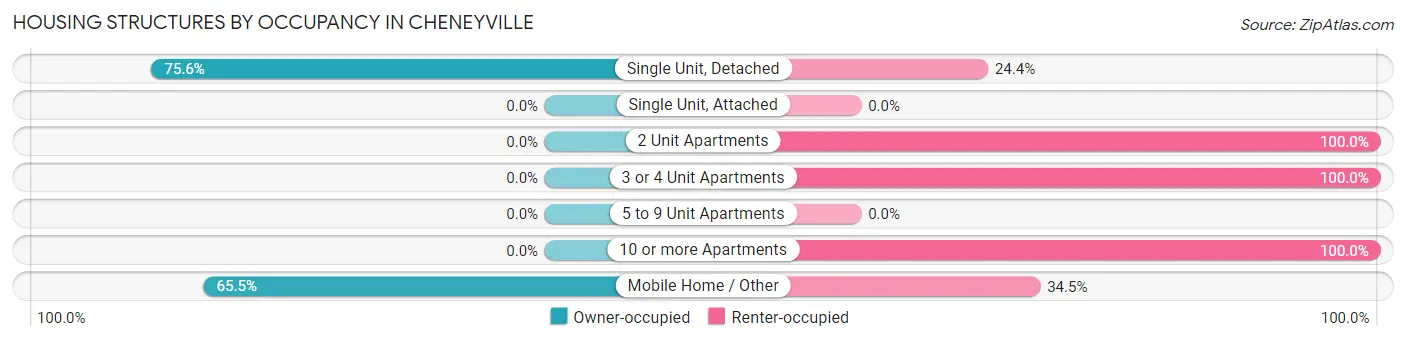
| Structure Type | Owner-occupied | Renter-occupied |
| Single Unit, Detached | 195 (75.6%) | 63 (24.4%) |
| Single Unit, Attached | 0 (0.0%) | 0 (0.0%) |
| 2 Unit Apartments | 0 (0.0%) | 6 (100.0%) |
| 3 or 4 Unit Apartments | 0 (0.0%) | 3 (100.0%) |
| 5 to 9 Unit Apartments | 0 (0.0%) | 0 (0.0%) |
| 10 or more Apartments | 0 (0.0%) | 14 (100.0%) |
| Mobile Home / Other | 19 (65.5%) | 10 (34.5%) |
| Total | 214 (69.0%) | 96 (31.0%) |
Housing Structures by Number of Rooms in Cheneyville
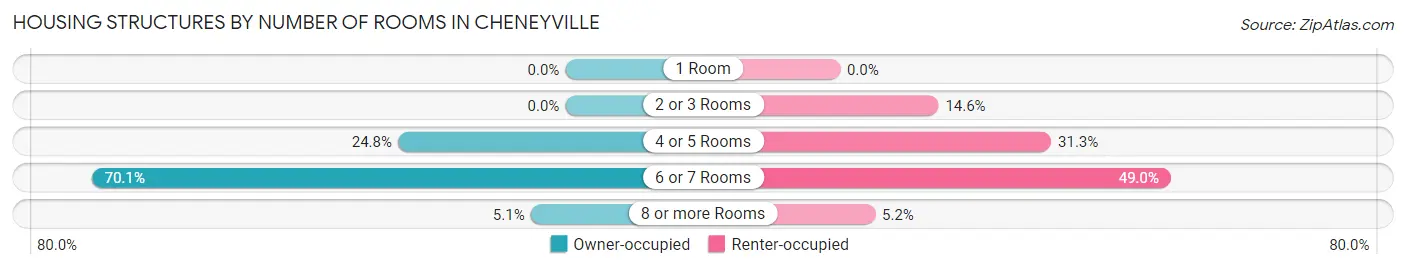
| Number of Rooms | Owner-occupied | Renter-occupied |
| 1 Room | 0 (0.0%) | 0 (0.0%) |
| 2 or 3 Rooms | 0 (0.0%) | 14 (14.6%) |
| 4 or 5 Rooms | 53 (24.8%) | 30 (31.2%) |
| 6 or 7 Rooms | 150 (70.1%) | 47 (49.0%) |
| 8 or more Rooms | 11 (5.1%) | 5 (5.2%) |
| Total | 214 (100.0%) | 96 (100.0%) |
Housing Structure by Heating Type in Cheneyville
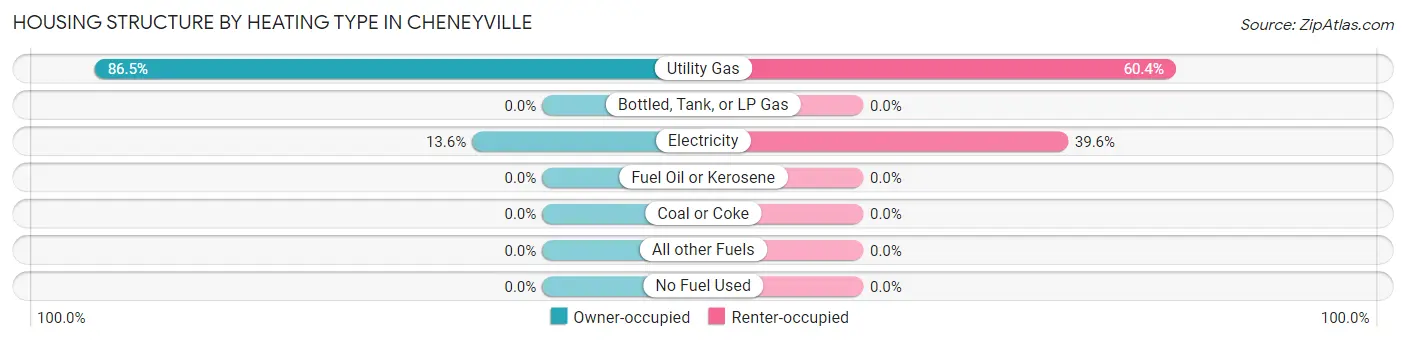
| Heating Type | Owner-occupied | Renter-occupied |
| Utility Gas | 185 (86.5%) | 58 (60.4%) |
| Bottled, Tank, or LP Gas | 0 (0.0%) | 0 (0.0%) |
| Electricity | 29 (13.6%) | 38 (39.6%) |
| Fuel Oil or Kerosene | 0 (0.0%) | 0 (0.0%) |
| Coal or Coke | 0 (0.0%) | 0 (0.0%) |
| All other Fuels | 0 (0.0%) | 0 (0.0%) |
| No Fuel Used | 0 (0.0%) | 0 (0.0%) |
| Total | 214 (100.0%) | 96 (100.0%) |
Household Vehicle Usage in Cheneyville
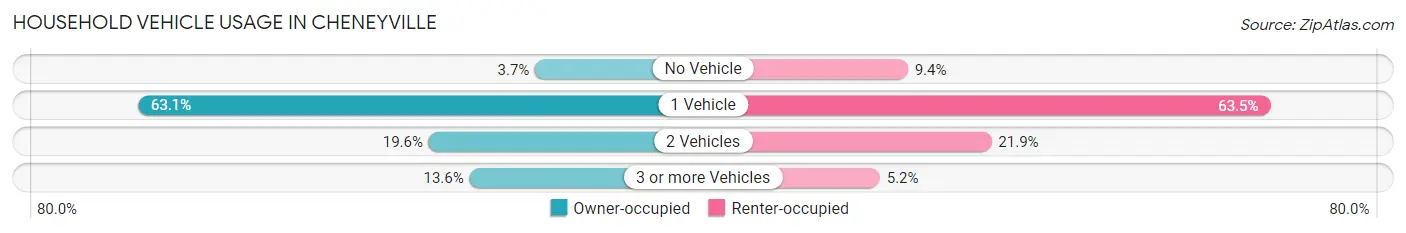
| Vehicles per Household | Owner-occupied | Renter-occupied |
| No Vehicle | 8 (3.7%) | 9 (9.4%) |
| 1 Vehicle | 135 (63.1%) | 61 (63.5%) |
| 2 Vehicles | 42 (19.6%) | 21 (21.9%) |
| 3 or more Vehicles | 29 (13.6%) | 5 (5.2%) |
| Total | 214 (100.0%) | 96 (100.0%) |
Real Estate & Mortgages in Cheneyville
Real Estate and Mortgage Overview in Cheneyville
| Characteristic | Without Mortgage | With Mortgage |
| Housing Units | 168 | 46 |
| Median Property Value | - | - |
| Median Household Income | $11,920 | $5 |
| Monthly Housing Costs | $372 | $0 |
| Real Estate Taxes | $199 | $10 |
Property Value by Mortgage Status in Cheneyville
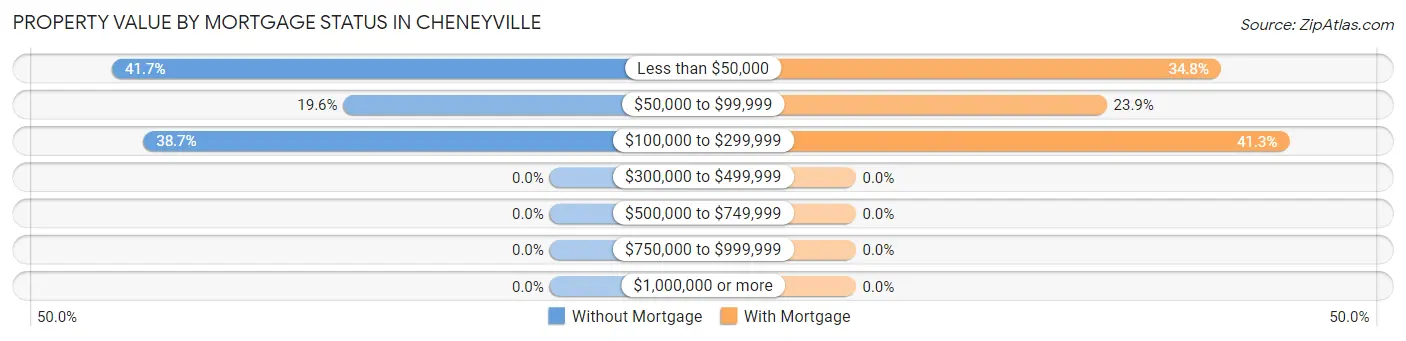
| Property Value | Without Mortgage | With Mortgage |
| Less than $50,000 | 70 (41.7%) | 16 (34.8%) |
| $50,000 to $99,999 | 33 (19.6%) | 11 (23.9%) |
| $100,000 to $299,999 | 65 (38.7%) | 19 (41.3%) |
| $300,000 to $499,999 | 0 (0.0%) | 0 (0.0%) |
| $500,000 to $749,999 | 0 (0.0%) | 0 (0.0%) |
| $750,000 to $999,999 | 0 (0.0%) | 0 (0.0%) |
| $1,000,000 or more | 0 (0.0%) | 0 (0.0%) |
| Total | 168 (100.0%) | 46 (100.0%) |
Household Income by Mortgage Status in Cheneyville
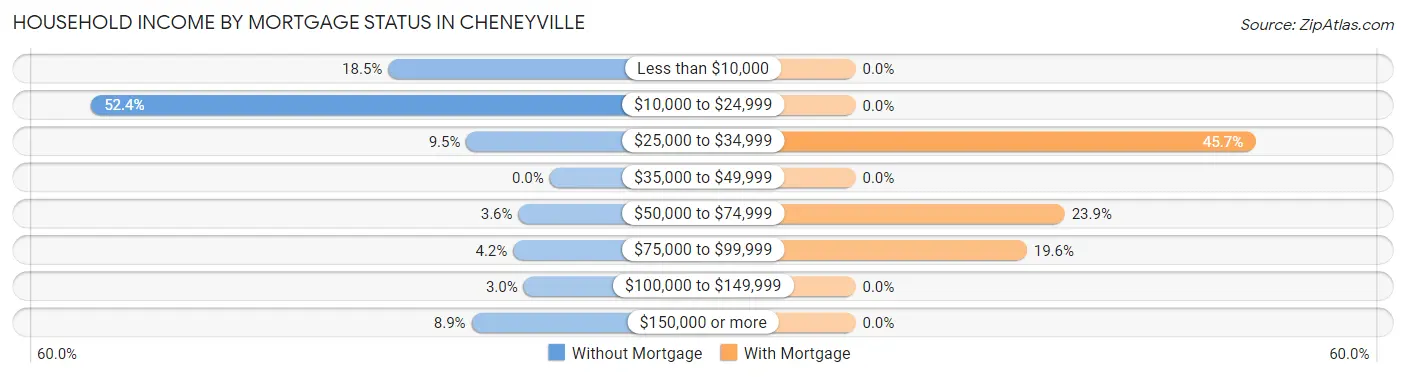
| Household Income | Without Mortgage | With Mortgage |
| Less than $10,000 | 31 (18.4%) | 0 (0.0%) |
| $10,000 to $24,999 | 88 (52.4%) | 0 (0.0%) |
| $25,000 to $34,999 | 16 (9.5%) | 21 (45.7%) |
| $35,000 to $49,999 | 0 (0.0%) | 0 (0.0%) |
| $50,000 to $74,999 | 6 (3.6%) | 11 (23.9%) |
| $75,000 to $99,999 | 7 (4.2%) | 9 (19.6%) |
| $100,000 to $149,999 | 5 (3.0%) | 0 (0.0%) |
| $150,000 or more | 15 (8.9%) | 0 (0.0%) |
| Total | 168 (100.0%) | 46 (100.0%) |
Property Value to Household Income Ratio in Cheneyville
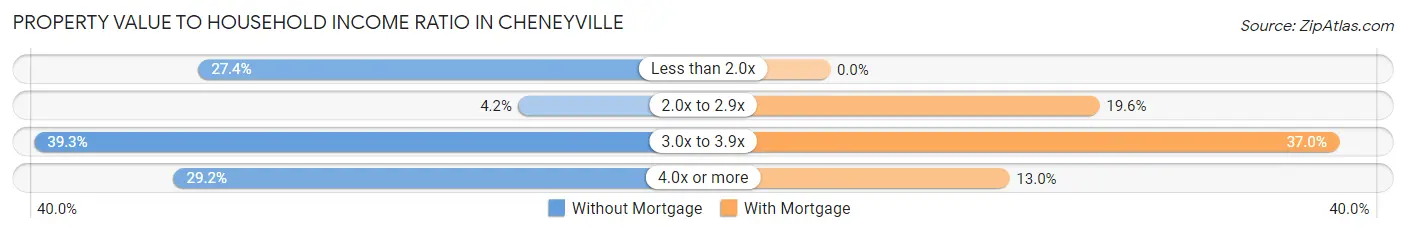
| Value-to-Income Ratio | Without Mortgage | With Mortgage |
| Less than 2.0x | 46 (27.4%) | 0 (0.0%) |
| 2.0x to 2.9x | 7 (4.2%) | 9 (19.6%) |
| 3.0x to 3.9x | 66 (39.3%) | 17 (37.0%) |
| 4.0x or more | 49 (29.2%) | 6 (13.0%) |
| Total | 168 (100.0%) | 46 (100.0%) |
Real Estate Taxes by Mortgage Status in Cheneyville
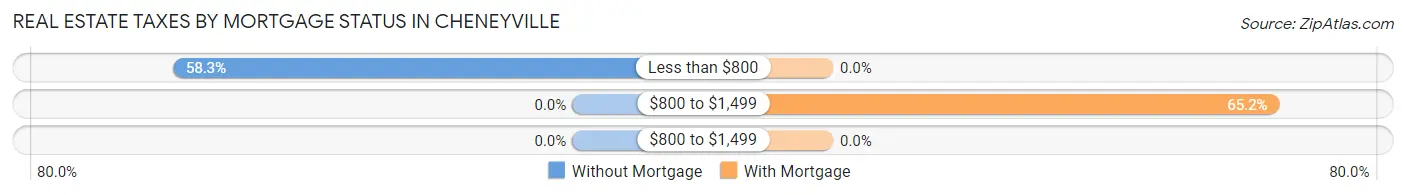
| Property Taxes | Without Mortgage | With Mortgage |
| Less than $800 | 98 (58.3%) | 0 (0.0%) |
| $800 to $1,499 | 0 (0.0%) | 30 (65.2%) |
| $800 to $1,499 | 0 (0.0%) | 0 (0.0%) |
| Total | 168 (100.0%) | 46 (100.0%) |
Health & Disability in Cheneyville
Health Insurance Coverage by Age in Cheneyville
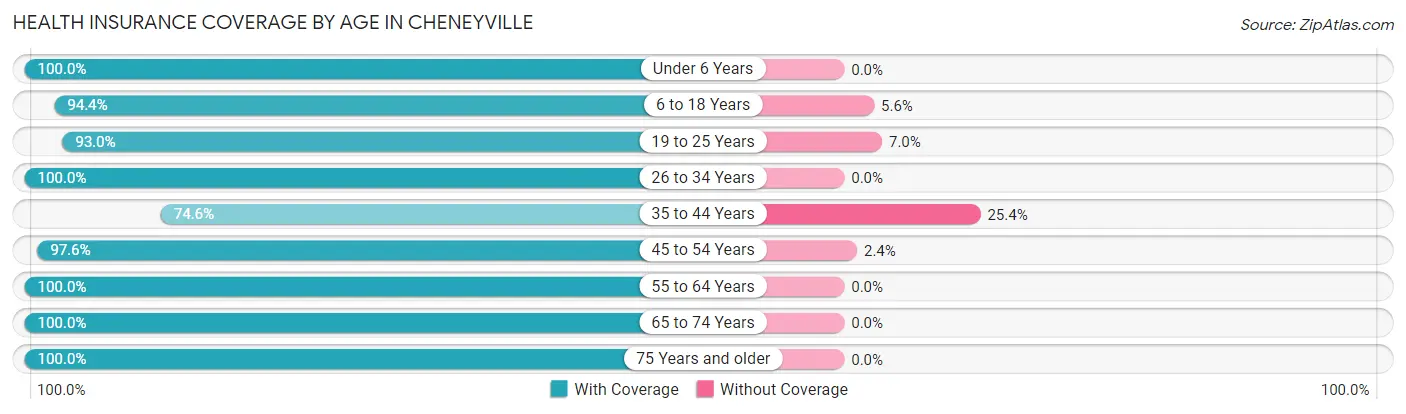
| Age Bracket | With Coverage | Without Coverage |
| Under 6 Years | 81 (100.0%) | 0 (0.0%) |
| 6 to 18 Years | 51 (94.4%) | 3 (5.6%) |
| 19 to 25 Years | 66 (93.0%) | 5 (7.0%) |
| 26 to 34 Years | 48 (100.0%) | 0 (0.0%) |
| 35 to 44 Years | 47 (74.6%) | 16 (25.4%) |
| 45 to 54 Years | 82 (97.6%) | 2 (2.4%) |
| 55 to 64 Years | 87 (100.0%) | 0 (0.0%) |
| 65 to 74 Years | 87 (100.0%) | 0 (0.0%) |
| 75 Years and older | 104 (100.0%) | 0 (0.0%) |
| Total | 653 (96.2%) | 26 (3.8%) |
Health Insurance Coverage by Citizenship Status in Cheneyville
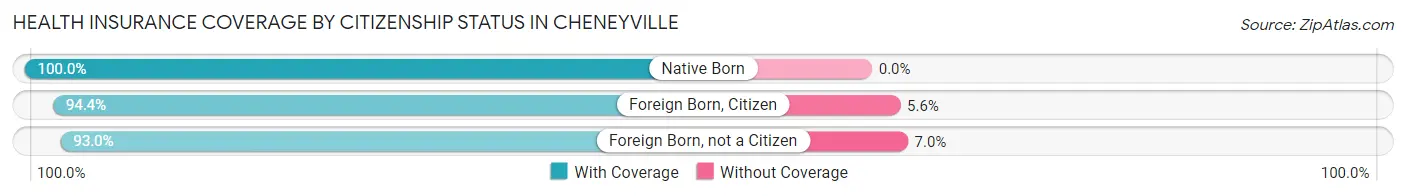
| Citizenship Status | With Coverage | Without Coverage |
| Native Born | 81 (100.0%) | 0 (0.0%) |
| Foreign Born, Citizen | 51 (94.4%) | 3 (5.6%) |
| Foreign Born, not a Citizen | 66 (93.0%) | 5 (7.0%) |
Health Insurance Coverage by Household Income in Cheneyville
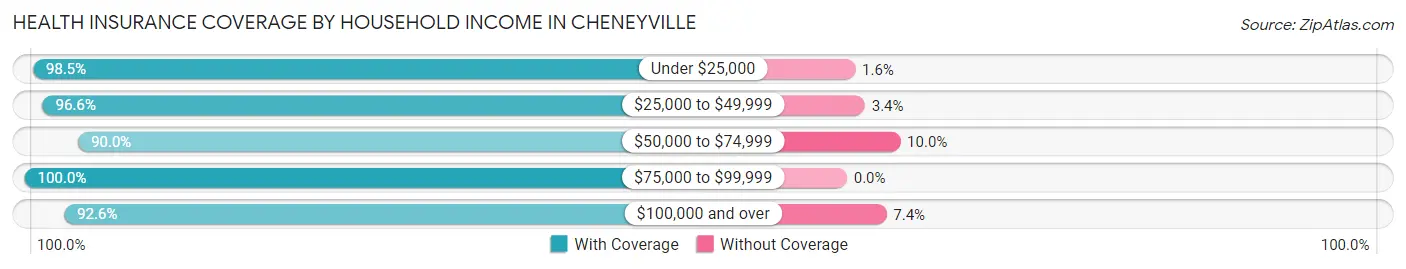
| Household Income | With Coverage | Without Coverage |
| Under $25,000 | 254 (98.5%) | 4 (1.5%) |
| $25,000 to $49,999 | 201 (96.6%) | 7 (3.4%) |
| $50,000 to $74,999 | 45 (90.0%) | 5 (10.0%) |
| $75,000 to $99,999 | 14 (100.0%) | 0 (0.0%) |
| $100,000 and over | 125 (92.6%) | 10 (7.4%) |
Public vs Private Health Insurance Coverage by Age in Cheneyville
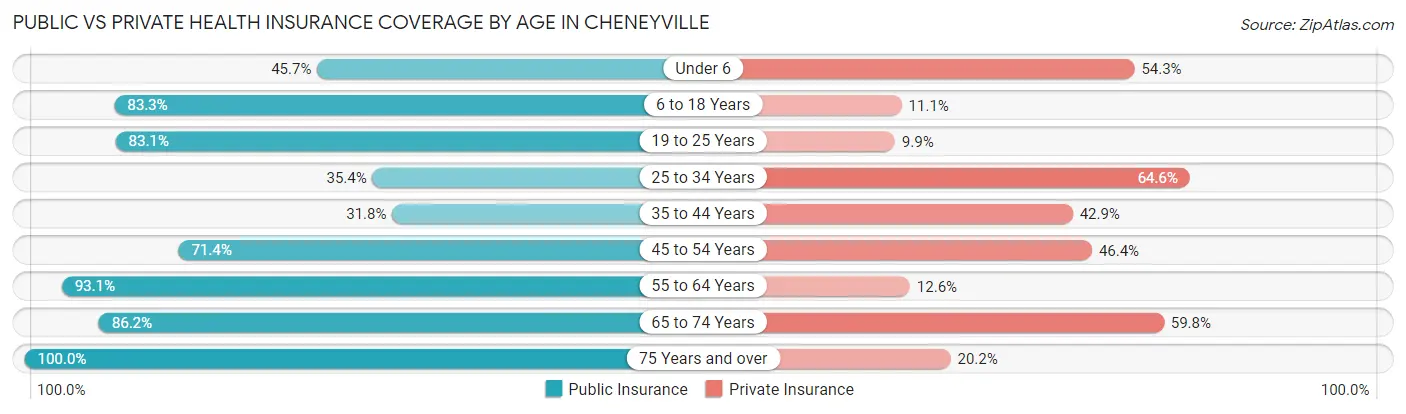
| Age Bracket | Public Insurance | Private Insurance |
| Under 6 | 37 (45.7%) | 44 (54.3%) |
| 6 to 18 Years | 45 (83.3%) | 6 (11.1%) |
| 19 to 25 Years | 59 (83.1%) | 7 (9.9%) |
| 25 to 34 Years | 17 (35.4%) | 31 (64.6%) |
| 35 to 44 Years | 20 (31.8%) | 27 (42.9%) |
| 45 to 54 Years | 60 (71.4%) | 39 (46.4%) |
| 55 to 64 Years | 81 (93.1%) | 11 (12.6%) |
| 65 to 74 Years | 75 (86.2%) | 52 (59.8%) |
| 75 Years and over | 104 (100.0%) | 21 (20.2%) |
| Total | 498 (73.3%) | 238 (35.0%) |
Disability Status by Sex by Age in Cheneyville
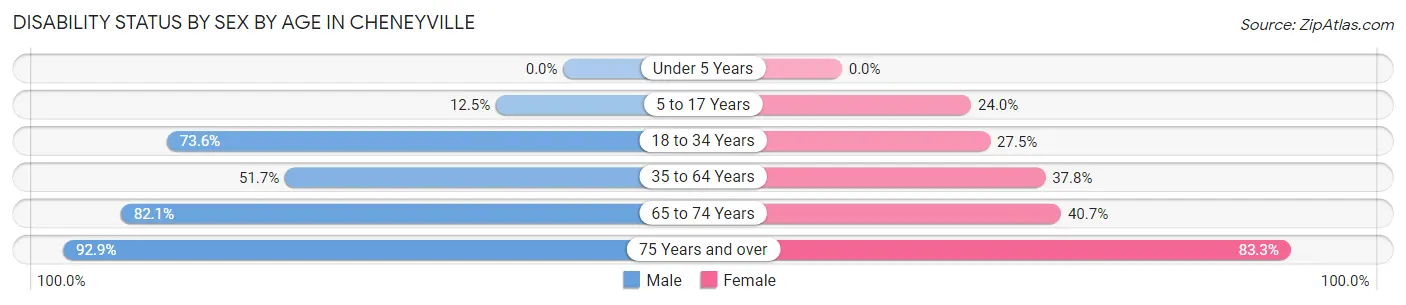
| Age Bracket | Male | Female |
| Under 5 Years | 0 (0.0%) | 0 (0.0%) |
| 5 to 17 Years | 4 (12.5%) | 6 (24.0%) |
| 18 to 34 Years | 39 (73.6%) | 19 (27.5%) |
| 35 to 64 Years | 47 (51.6%) | 54 (37.8%) |
| 65 to 74 Years | 23 (82.1%) | 24 (40.7%) |
| 75 Years and over | 13 (92.9%) | 75 (83.3%) |
Disability Class by Sex by Age in Cheneyville
Disability Class: Hearing Difficulty
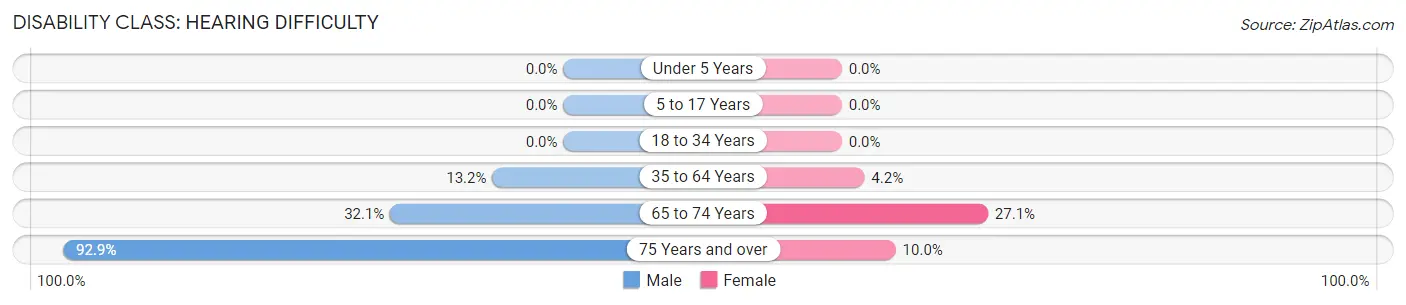
| Age Bracket | Male | Female |
| Under 5 Years | 0 (0.0%) | 0 (0.0%) |
| 5 to 17 Years | 0 (0.0%) | 0 (0.0%) |
| 18 to 34 Years | 0 (0.0%) | 0 (0.0%) |
| 35 to 64 Years | 12 (13.2%) | 6 (4.2%) |
| 65 to 74 Years | 9 (32.1%) | 16 (27.1%) |
| 75 Years and over | 13 (92.9%) | 9 (10.0%) |
Disability Class: Vision Difficulty
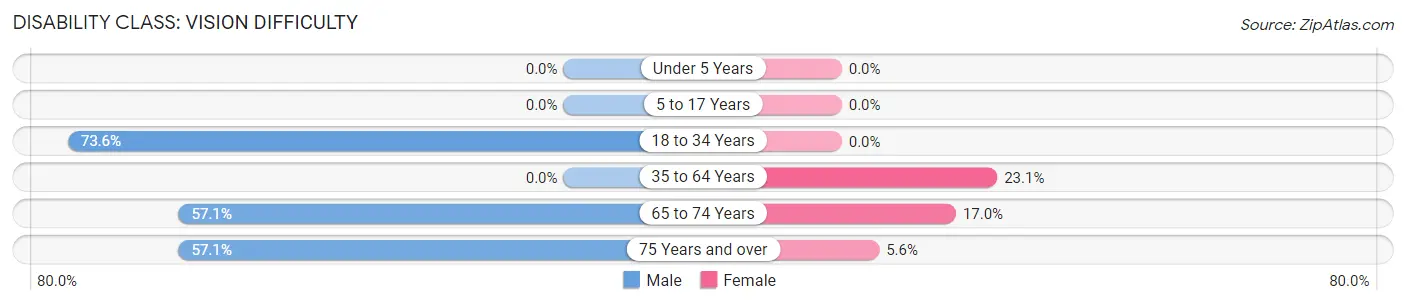
| Age Bracket | Male | Female |
| Under 5 Years | 0 (0.0%) | 0 (0.0%) |
| 5 to 17 Years | 0 (0.0%) | 0 (0.0%) |
| 18 to 34 Years | 39 (73.6%) | 0 (0.0%) |
| 35 to 64 Years | 0 (0.0%) | 33 (23.1%) |
| 65 to 74 Years | 16 (57.1%) | 10 (17.0%) |
| 75 Years and over | 8 (57.1%) | 5 (5.6%) |
Disability Class: Cognitive Difficulty
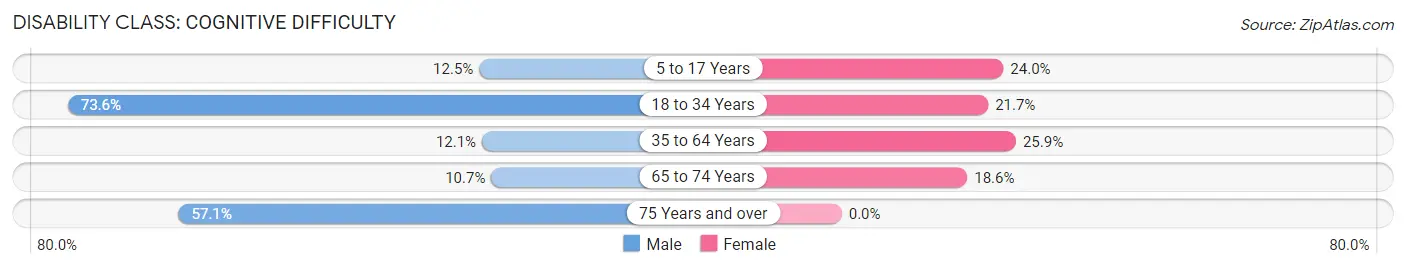
| Age Bracket | Male | Female |
| 5 to 17 Years | 4 (12.5%) | 6 (24.0%) |
| 18 to 34 Years | 39 (73.6%) | 15 (21.7%) |
| 35 to 64 Years | 11 (12.1%) | 37 (25.9%) |
| 65 to 74 Years | 3 (10.7%) | 11 (18.6%) |
| 75 Years and over | 8 (57.1%) | 0 (0.0%) |
Disability Class: Ambulatory Difficulty
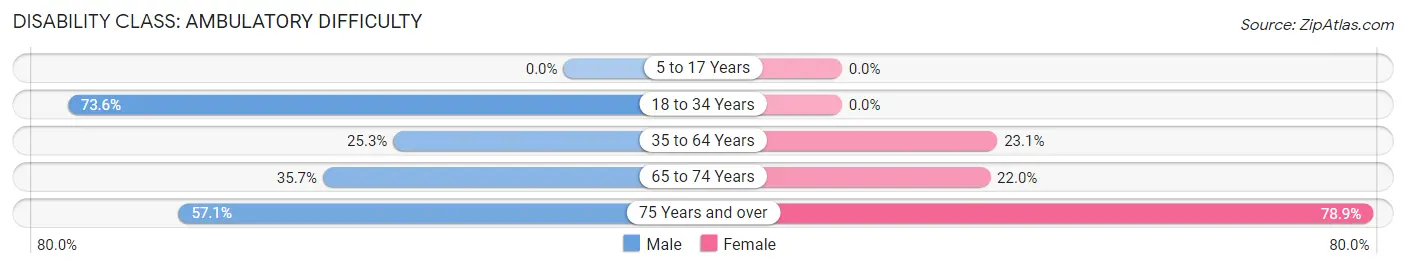
| Age Bracket | Male | Female |
| 5 to 17 Years | 0 (0.0%) | 0 (0.0%) |
| 18 to 34 Years | 39 (73.6%) | 0 (0.0%) |
| 35 to 64 Years | 23 (25.3%) | 33 (23.1%) |
| 65 to 74 Years | 10 (35.7%) | 13 (22.0%) |
| 75 Years and over | 8 (57.1%) | 71 (78.9%) |
Disability Class: Self-Care Difficulty
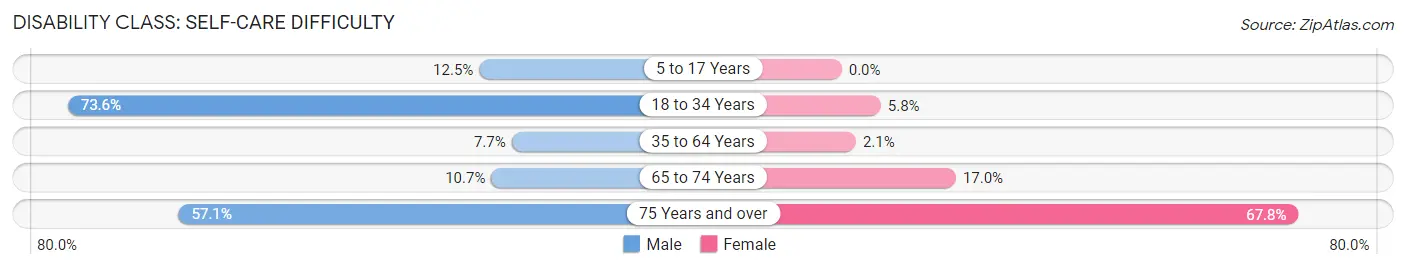
| Age Bracket | Male | Female |
| 5 to 17 Years | 4 (12.5%) | 0 (0.0%) |
| 18 to 34 Years | 39 (73.6%) | 4 (5.8%) |
| 35 to 64 Years | 7 (7.7%) | 3 (2.1%) |
| 65 to 74 Years | 3 (10.7%) | 10 (17.0%) |
| 75 Years and over | 8 (57.1%) | 61 (67.8%) |
Technology Access in Cheneyville
Computing Device Access in Cheneyville
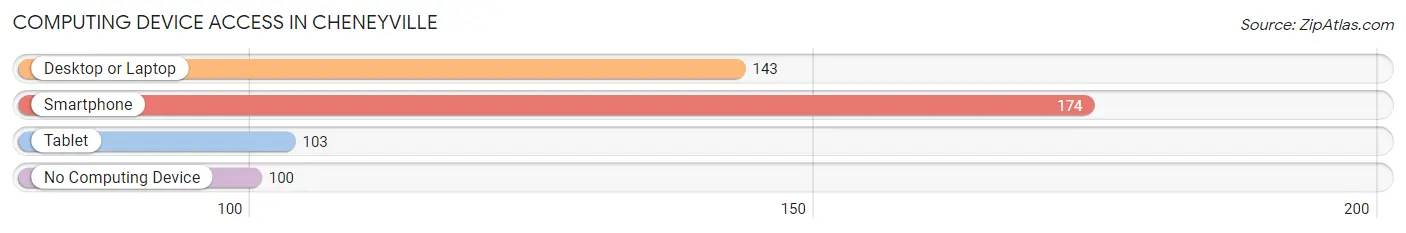
| Device Type | # Households | % Households |
| Desktop or Laptop | 143 | 46.1% |
| Smartphone | 174 | 56.1% |
| Tablet | 103 | 33.2% |
| No Computing Device | 100 | 32.3% |
| Total | 310 | 100.0% |
Internet Access in Cheneyville
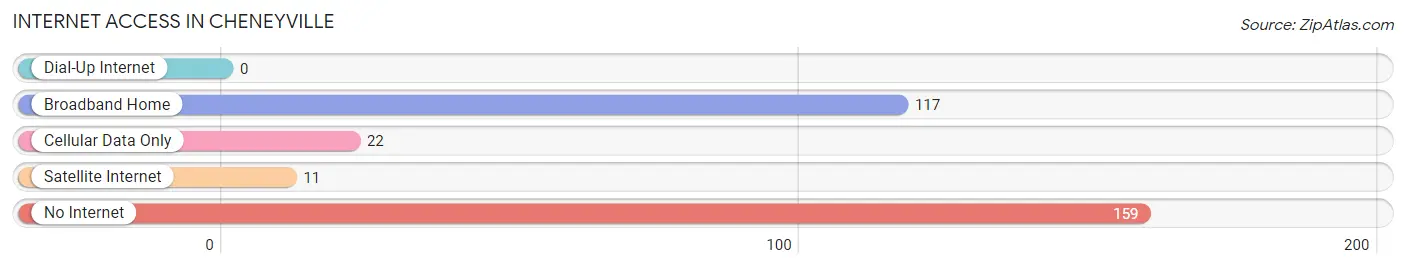
| Internet Type | # Households | % Households |
| Dial-Up Internet | 0 | 0.0% |
| Broadband Home | 117 | 37.7% |
| Cellular Data Only | 22 | 7.1% |
| Satellite Internet | 11 | 3.5% |
| No Internet | 159 | 51.3% |
| Total | 310 | 100.0% |
Cheneyville Summary
Cheneyville is a small town located in Rapides Parish, Louisiana. It is situated on the banks of the Red River, approximately 30 miles south of Alexandria. The town was founded in 1831 by William Cheney, a wealthy planter from Virginia. The town was named after him and has remained a small, rural community ever since.
Geography
Cheneyville is located in the Central Louisiana region of the state. It is situated on the banks of the Red River, approximately 30 miles south of Alexandria. The town is surrounded by rolling hills and farmland, with the Red River providing a scenic backdrop. The town is located in a humid subtropical climate zone, with hot summers and mild winters. The average annual temperature is around 70 degrees Fahrenheit.
Economy
Cheneyville’s economy is largely based on agriculture. The town is home to several farms, which produce a variety of crops, including cotton, corn, soybeans, and wheat. The town also has a few small businesses, including a grocery store, a hardware store, and a few restaurants.
Demographics
As of the 2010 census, Cheneyville had a population of 1,092. The racial makeup of the town was 79.3% White, 19.2% African American, 0.3% Native American, 0.2% Asian, and 0.9% from other races. The median household income was $30,938, and the median family income was $37,813.
History
Cheneyville was founded in 1831 by William Cheney, a wealthy planter from Virginia. The town was named after him and has remained a small, rural community ever since. During the Civil War, the town was occupied by Union forces and served as a supply depot. After the war, the town experienced a period of growth and prosperity. In the late 19th century, the town was home to several cotton gins, a sawmill, and a gristmill.
In the early 20th century, the town experienced a period of decline. The Great Depression hit the town hard, and many of the businesses closed. In the 1950s, the town began to experience a resurgence, as new businesses opened and the population began to grow. Today, Cheneyville is a small, rural community with a population of just over 1,000. The town is home to several small businesses, including a grocery store, a hardware store, and a few restaurants.
Common Questions
What is Per Capita Income in Cheneyville?
Per Capita income in Cheneyville is $18,553.
What is the Median Family Income in Cheneyville?
Median Family Income in Cheneyville is $45,625.
What is the Median Household income in Cheneyville?
Median Household Income in Cheneyville is $17,917.
What is Inequality or Gini Index in Cheneyville?
Inequality or Gini Index in Cheneyville is 0.56.
What is the Total Population of Cheneyville?
Total Population of Cheneyville is 679.
What is the Total Male Population of Cheneyville?
Total Male Population of Cheneyville is 260.
What is the Total Female Population of Cheneyville?
Total Female Population of Cheneyville is 419.
What is the Ratio of Males per 100 Females in Cheneyville?
There are 62.05 Males per 100 Females in Cheneyville.
What is the Ratio of Females per 100 Males in Cheneyville?
There are 161.15 Females per 100 Males in Cheneyville.
What is the Median Population Age in Cheneyville?
Median Population Age in Cheneyville is 48.3 Years.
What is the Average Family Size in Cheneyville
Average Family Size in Cheneyville is 3.5 People.
What is the Average Household Size in Cheneyville
Average Household Size in Cheneyville is 2.1 People.
How Large is the Labor Force in Cheneyville?
There are 221 People in the Labor Forcein in Cheneyville.
What is the Percentage of People in the Labor Force in Cheneyville?
39.5% of People are in the Labor Force in Cheneyville.
What is the Unemployment Rate in Cheneyville?
Unemployment Rate in Cheneyville is 4.5%.