Spencer, TN Map & Demographics
Spencer Map
Spencer Overview
$21,210
PER CAPITA INCOME
$56,875
AVG FAMILY INCOME
$41,042
AVG HOUSEHOLD INCOME
44.8%
WAGE / INCOME GAP [ % ]
55.2¢/ $1
WAGE / INCOME GAP [ $ ]
0.42
INEQUALITY / GINI INDEX
1,469
TOTAL POPULATION
647
MALE POPULATION
822
FEMALE POPULATION
78.71
MALES / 100 FEMALES
127.05
FEMALES / 100 MALES
47.7
MEDIAN AGE
3.2
AVG FAMILY SIZE
2.5
AVG HOUSEHOLD SIZE
534
LABOR FORCE [ PEOPLE ]
42.5%
PERCENT IN LABOR FORCE
0.2%
UNEMPLOYMENT RATE
Spencer Zip Codes
Income in Spencer
Income Overview in Spencer
Per Capita Income in Spencer is $21,210, while median incomes of families and households are $56,875 and $41,042 respectively.
| Characteristic | Number | Measure |
| Per Capita Income | 1,469 | $21,210 |
| Median Family Income | 351 | $56,875 |
| Mean Family Income | 351 | $64,126 |
| Median Household Income | 555 | $41,042 |
| Mean Household Income | 555 | $52,046 |
| Income Deficit | 351 | $0 |
| Wage / Income Gap (%) | 1,469 | 44.77% |
| Wage / Income Gap ($) | 1,469 | 55.23¢ per $1 |
| Gini / Inequality Index | 1,469 | 0.42 |
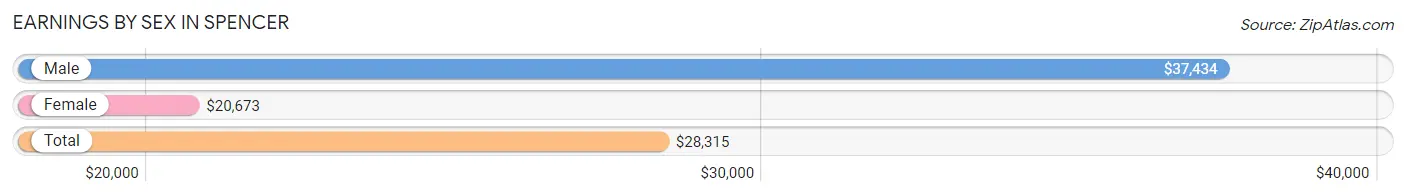
Earnings by Sex in Spencer
Average Earnings in Spencer are $28,315, $37,434 for men and $20,673 for women, a difference of 44.8%.
| Sex | Number | Average Earnings |
| Male | 263 (44.8%) | $37,434 |
| Female | 324 (55.2%) | $20,673 |
| Total | 587 (100.0%) | $28,315 |
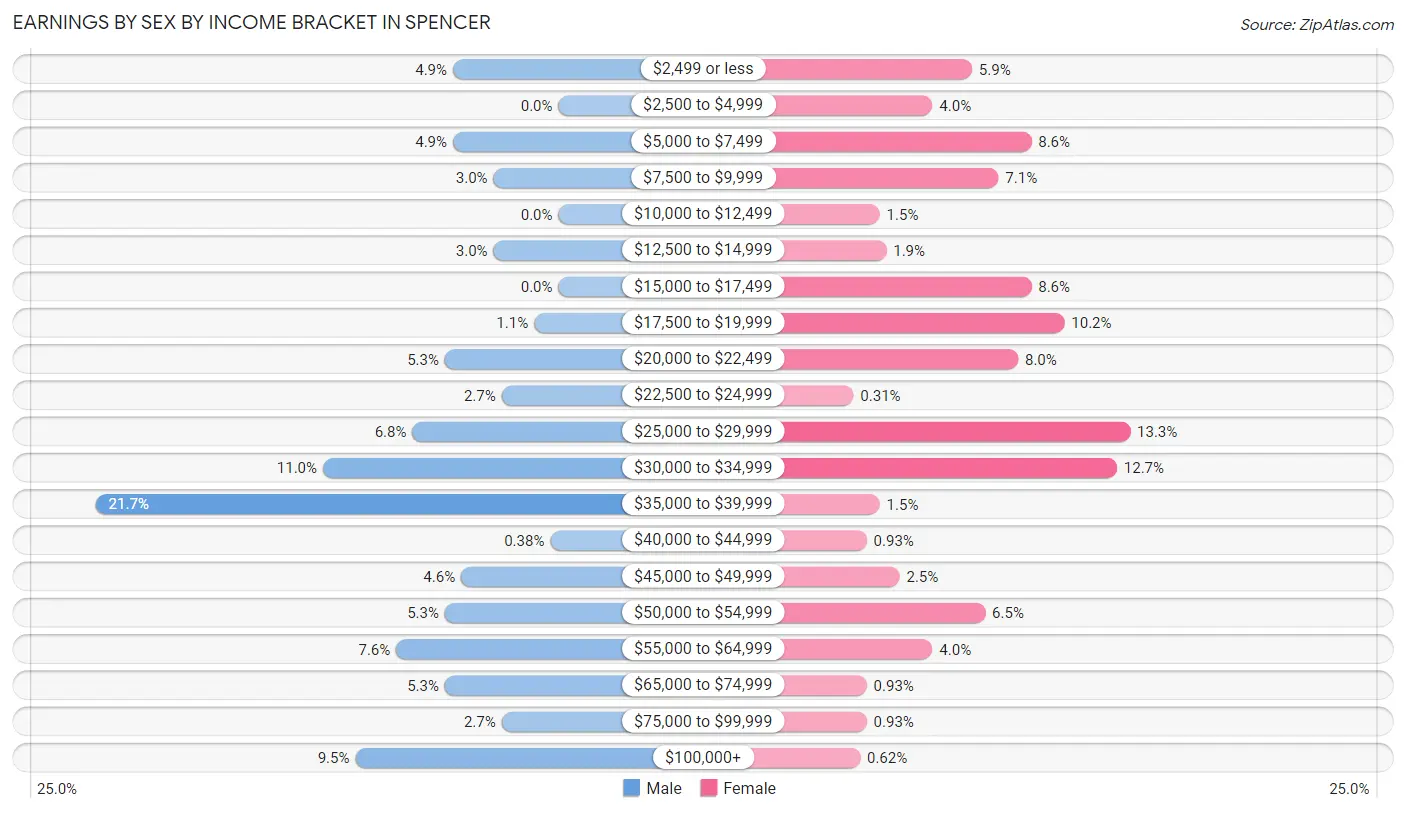
Earnings by Sex by Income Bracket in Spencer
The most common earnings brackets in Spencer are $35,000 to $39,999 for men (57 | 21.7%) and $25,000 to $29,999 for women (43 | 13.3%).
| Income | Male | Female |
| $2,499 or less | 13 (4.9%) | 19 (5.9%) |
| $2,500 to $4,999 | 0 (0.0%) | 13 (4.0%) |
| $5,000 to $7,499 | 13 (4.9%) | 28 (8.6%) |
| $7,500 to $9,999 | 8 (3.0%) | 23 (7.1%) |
| $10,000 to $12,499 | 0 (0.0%) | 5 (1.5%) |
| $12,500 to $14,999 | 8 (3.0%) | 6 (1.8%) |
| $15,000 to $17,499 | 0 (0.0%) | 28 (8.6%) |
| $17,500 to $19,999 | 3 (1.1%) | 33 (10.2%) |
| $20,000 to $22,499 | 14 (5.3%) | 26 (8.0%) |
| $22,500 to $24,999 | 7 (2.7%) | 1 (0.3%) |
| $25,000 to $29,999 | 18 (6.8%) | 43 (13.3%) |
| $30,000 to $34,999 | 29 (11.0%) | 41 (12.7%) |
| $35,000 to $39,999 | 57 (21.7%) | 5 (1.5%) |
| $40,000 to $44,999 | 1 (0.4%) | 3 (0.9%) |
| $45,000 to $49,999 | 12 (4.6%) | 8 (2.5%) |
| $50,000 to $54,999 | 14 (5.3%) | 21 (6.5%) |
| $55,000 to $64,999 | 20 (7.6%) | 13 (4.0%) |
| $65,000 to $74,999 | 14 (5.3%) | 3 (0.9%) |
| $75,000 to $99,999 | 7 (2.7%) | 3 (0.9%) |
| $100,000+ | 25 (9.5%) | 2 (0.6%) |
| Total | 263 (100.0%) | 324 (100.0%) |
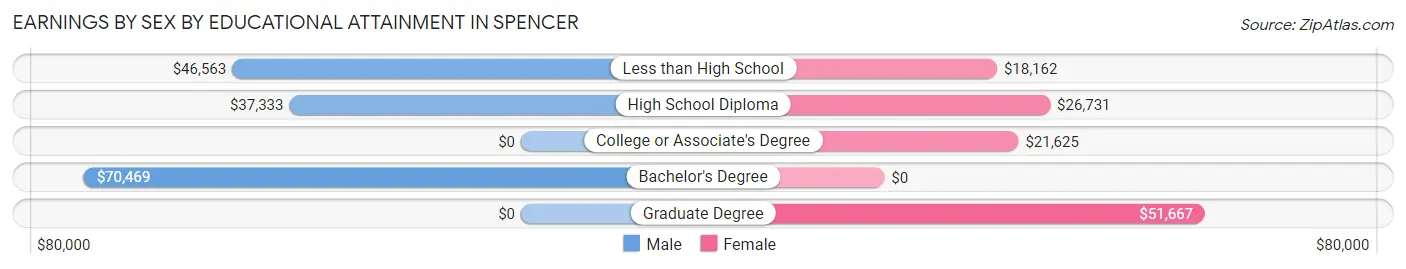
Earnings by Sex by Educational Attainment in Spencer
Average earnings in Spencer are $37,993 for men and $25,741 for women, a difference of 32.3%. Men with an educational attainment of bachelor's degree enjoy the highest average annual earnings of $70,469, while those with high school diploma education earn the least with $37,333. Women with an educational attainment of graduate degree earn the most with the average annual earnings of $51,667, while those with less than high school education have the smallest earnings of $18,162.
| Educational Attainment | Male Income | Female Income |
| Less than High School | $46,563 | $18,162 |
| High School Diploma | $37,333 | $26,731 |
| College or Associate's Degree | - | - |
| Bachelor's Degree | $70,469 | $0 |
| Graduate Degree | - | - |
| Total | $37,993 | $25,741 |
Family Income in Spencer
Family Income Brackets in Spencer
According to the Spencer family income data, there are 108 families falling into the $50,000 to $74,999 income range, which is the most common income bracket and makes up 30.8% of all families.
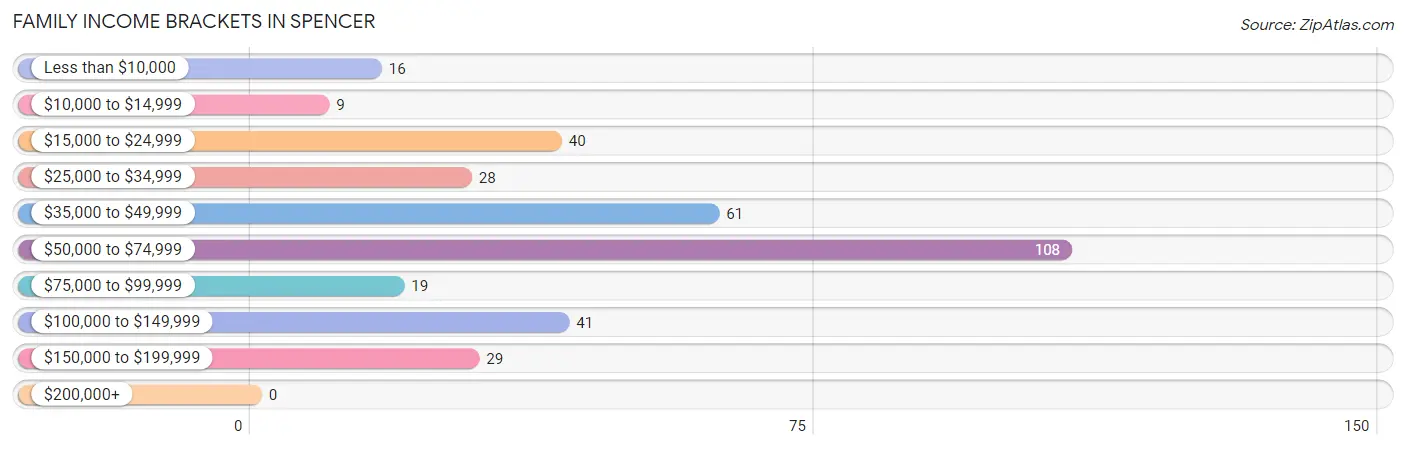
| Income Bracket | # Families | % Families |
| Less than $10,000 | 16 | 4.6% |
| $10,000 to $14,999 | 9 | 2.6% |
| $15,000 to $24,999 | 40 | 11.4% |
| $25,000 to $34,999 | 28 | 8.0% |
| $35,000 to $49,999 | 61 | 17.4% |
| $50,000 to $74,999 | 108 | 30.8% |
| $75,000 to $99,999 | 19 | 5.4% |
| $100,000 to $149,999 | 41 | 11.7% |
| $150,000 to $199,999 | 29 | 8.3% |
| $200,000+ | 0 | 0.0% |
Family Income by Famaliy Size in Spencer
4-person families (75 | 21.4%) account for the highest median family income in Spencer with $69,940 per family, while 2-person families (149 | 42.4%) have the highest median income of $21,562 per family member.
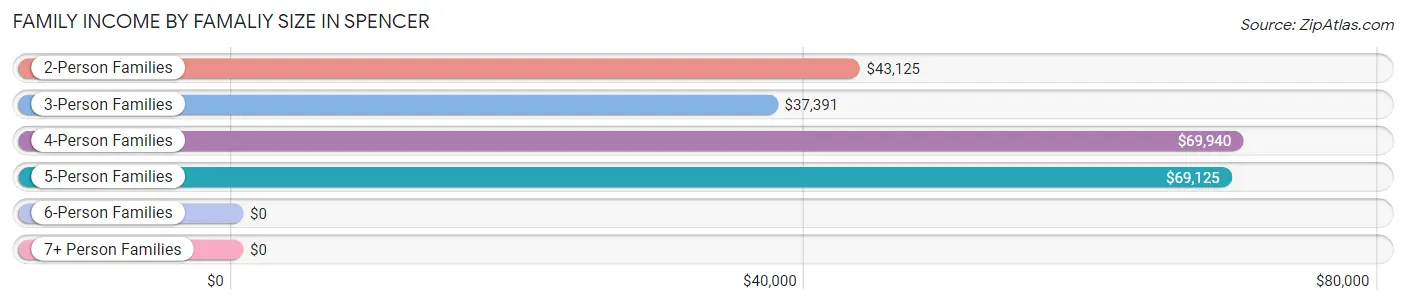
| Income Bracket | # Families | Median Income |
| 2-Person Families | 149 (42.4%) | $43,125 |
| 3-Person Families | 92 (26.2%) | $37,391 |
| 4-Person Families | 75 (21.4%) | $69,940 |
| 5-Person Families | 13 (3.7%) | $69,125 |
| 6-Person Families | 11 (3.1%) | $0 |
| 7+ Person Families | 11 (3.1%) | $0 |
| Total | 351 (100.0%) | $56,875 |
Family Income by Number of Earners in Spencer
The median family income in Spencer is $56,875, with families comprising 3+ earners (53) having the highest median family income of $108,942, while families with no earners (99) have the lowest median family income of $29,688, accounting for 15.1% and 28.2% of families, respectively.
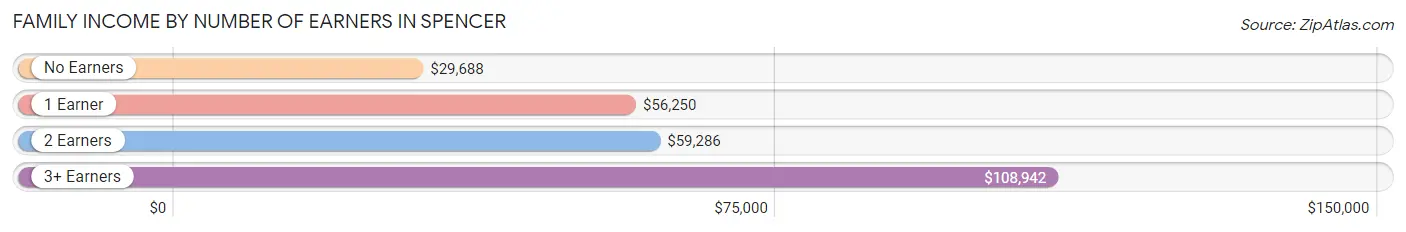
| Number of Earners | # Families | Median Income |
| No Earners | 99 (28.2%) | $29,688 |
| 1 Earner | 115 (32.8%) | $56,250 |
| 2 Earners | 84 (23.9%) | $59,286 |
| 3+ Earners | 53 (15.1%) | $108,942 |
| Total | 351 (100.0%) | $56,875 |
Household Income in Spencer
Household Income Brackets in Spencer
With 127 households falling in the category, the $50,000 to $74,999 income range is the most frequent in Spencer, accounting for 22.9% of all households.
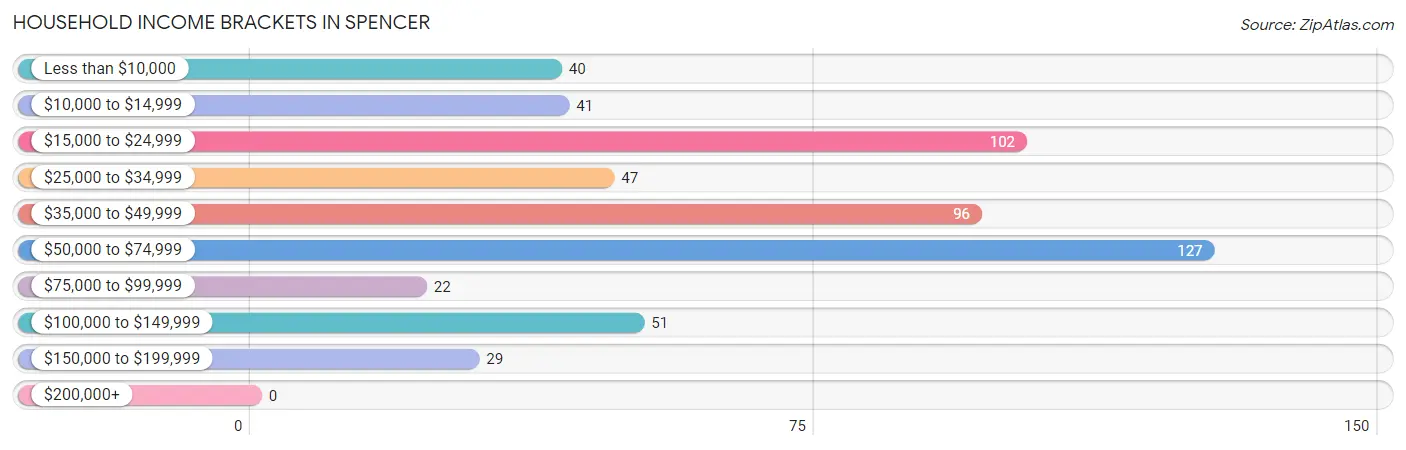
| Income Bracket | # Households | % Households |
| Less than $10,000 | 40 | 7.2% |
| $10,000 to $14,999 | 41 | 7.4% |
| $15,000 to $24,999 | 102 | 18.4% |
| $25,000 to $34,999 | 47 | 8.5% |
| $35,000 to $49,999 | 96 | 17.3% |
| $50,000 to $74,999 | 127 | 22.9% |
| $75,000 to $99,999 | 22 | 4.0% |
| $100,000 to $149,999 | 51 | 9.2% |
| $150,000 to $199,999 | 29 | 5.2% |
| $200,000+ | 0 | 0.0% |
Household Income by Householder Age in Spencer
The median household income in Spencer is $41,042, with the highest median household income of $57,857 found in the 25 to 44 years age bracket for the primary householder. A total of 106 households (19.1%) fall into this category. Meanwhile, the 15 to 24 years age bracket for the primary householder has the lowest median household income of $0, with 4 households (0.7%) in this group.
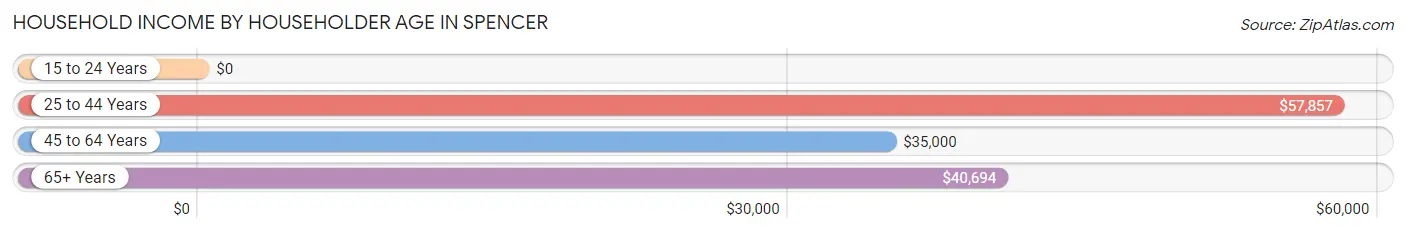
| Income Bracket | # Households | Median Income |
| 15 to 24 Years | 4 (0.7%) | $0 |
| 25 to 44 Years | 106 (19.1%) | $57,857 |
| 45 to 64 Years | 210 (37.8%) | $35,000 |
| 65+ Years | 235 (42.3%) | $40,694 |
| Total | 555 (100.0%) | $41,042 |
Poverty in Spencer
Income Below Poverty by Sex and Age in Spencer
With 15.6% poverty level for males and 11.7% for females among the residents of Spencer, 45 to 54 year old males and under 5 year old females are the most vulnerable to poverty, with 44 males (44.9%) and 4 females (40.0%) in their respective age groups living below the poverty level.
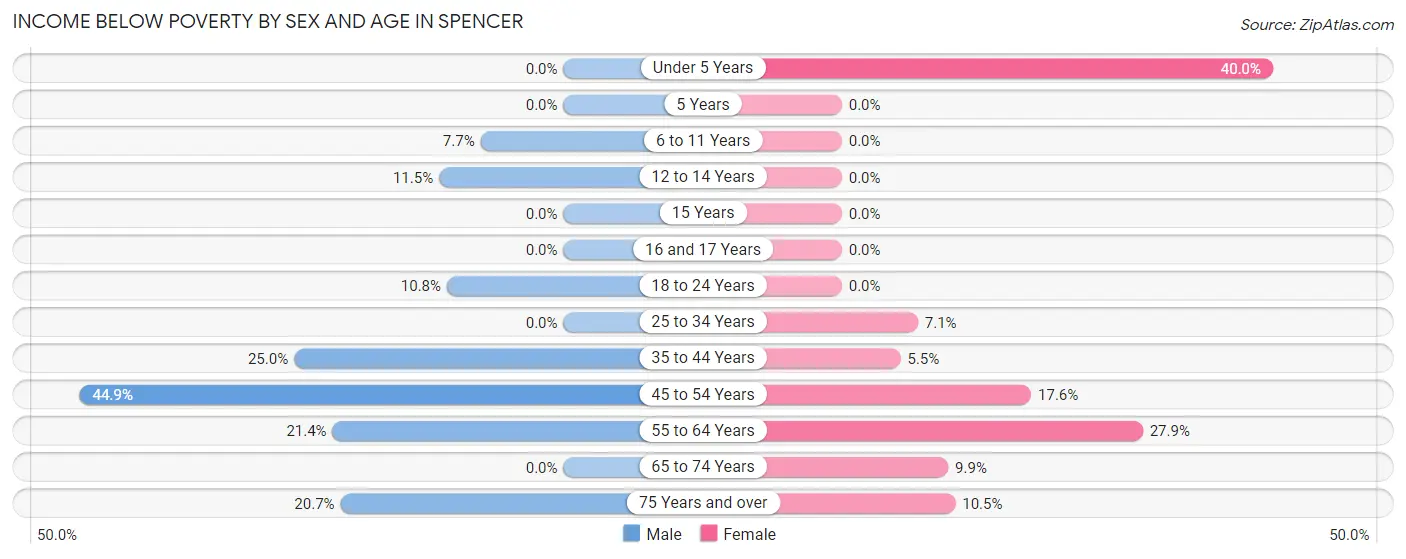
| Age Bracket | Male | Female |
| Under 5 Years | 0 (0.0%) | 4 (40.0%) |
| 5 Years | 0 (0.0%) | 0 (0.0%) |
| 6 to 11 Years | 3 (7.7%) | 0 (0.0%) |
| 12 to 14 Years | 3 (11.5%) | 0 (0.0%) |
| 15 Years | 0 (0.0%) | 0 (0.0%) |
| 16 and 17 Years | 0 (0.0%) | 0 (0.0%) |
| 18 to 24 Years | 4 (10.8%) | 0 (0.0%) |
| 25 to 34 Years | 0 (0.0%) | 6 (7.1%) |
| 35 to 44 Years | 13 (25.0%) | 3 (5.4%) |
| 45 to 54 Years | 44 (44.9%) | 26 (17.6%) |
| 55 to 64 Years | 15 (21.4%) | 31 (27.9%) |
| 65 to 74 Years | 0 (0.0%) | 15 (9.9%) |
| 75 Years and over | 12 (20.7%) | 4 (10.5%) |
| Total | 94 (15.6%) | 89 (11.7%) |
Income Above Poverty by Sex and Age in Spencer
According to the poverty statistics in Spencer, males aged under 5 years and females aged 5 years are the age groups that are most secure financially, with 100.0% of males and 100.0% of females in these age groups living above the poverty line.
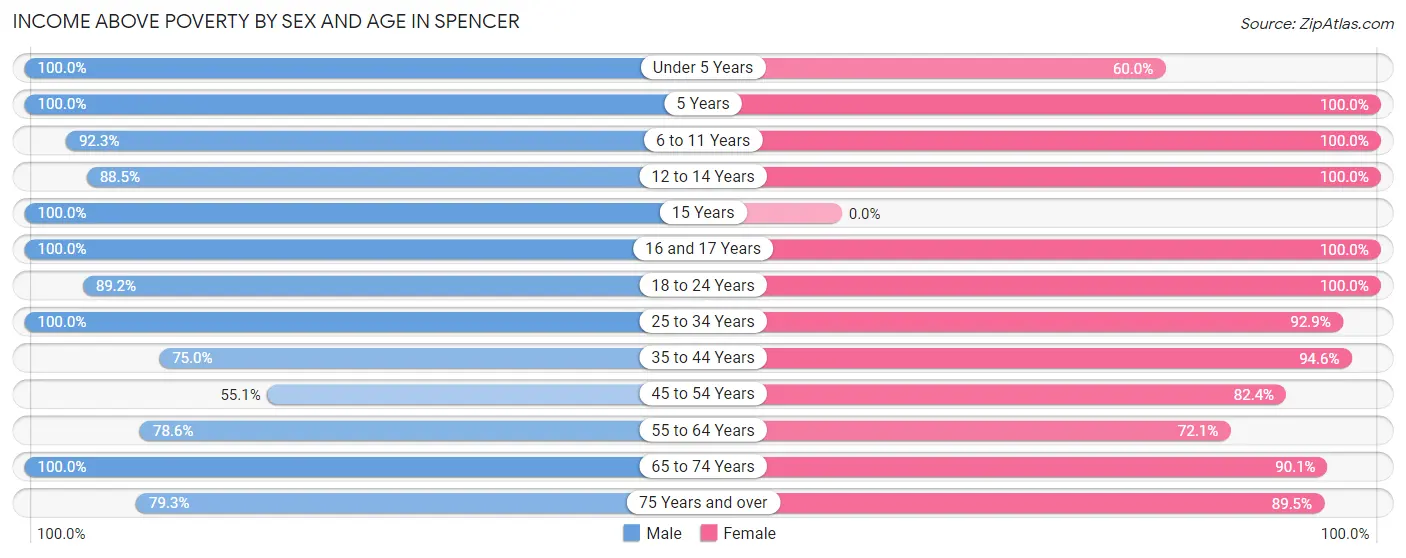
| Age Bracket | Male | Female |
| Under 5 Years | 35 (100.0%) | 6 (60.0%) |
| 5 Years | 2 (100.0%) | 7 (100.0%) |
| 6 to 11 Years | 36 (92.3%) | 51 (100.0%) |
| 12 to 14 Years | 23 (88.5%) | 22 (100.0%) |
| 15 Years | 21 (100.0%) | 0 (0.0%) |
| 16 and 17 Years | 16 (100.0%) | 27 (100.0%) |
| 18 to 24 Years | 33 (89.2%) | 55 (100.0%) |
| 25 to 34 Years | 91 (100.0%) | 79 (92.9%) |
| 35 to 44 Years | 39 (75.0%) | 52 (94.6%) |
| 45 to 54 Years | 54 (55.1%) | 122 (82.4%) |
| 55 to 64 Years | 55 (78.6%) | 80 (72.1%) |
| 65 to 74 Years | 58 (100.0%) | 137 (90.1%) |
| 75 Years and over | 46 (79.3%) | 34 (89.5%) |
| Total | 509 (84.4%) | 672 (88.3%) |
Income Below Poverty Among Married-Couple Families in Spencer
The poverty statistics for married-couple families in Spencer show that 12.0% or 27 of the total 225 families live below the poverty line. Families with no children have the highest poverty rate of 16.4%, comprising of 24 families. On the other hand, families with 3 or 4 children have the lowest poverty rate of 0.0%, which includes 0 families.
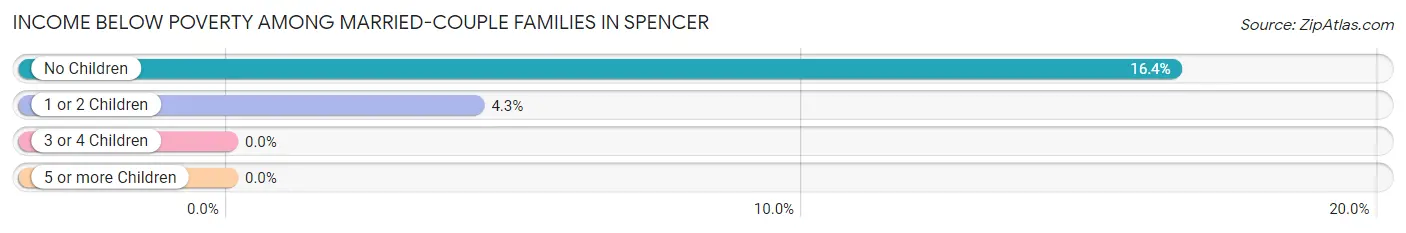
| Children | Above Poverty | Below Poverty |
| No Children | 122 (83.6%) | 24 (16.4%) |
| 1 or 2 Children | 67 (95.7%) | 3 (4.3%) |
| 3 or 4 Children | 9 (100.0%) | 0 (0.0%) |
| 5 or more Children | 0 (0.0%) | 0 (0.0%) |
| Total | 198 (88.0%) | 27 (12.0%) |
Income Below Poverty Among Single-Parent Households in Spencer
According to the poverty data in Spencer, 60.0% or 12 single-father households and 5.7% or 6 single-mother households are living below the poverty line. Among single-father households, those with no children have the highest poverty rate, with 12 households (75.0%) experiencing poverty. Likewise, among single-mother households, those with 1 or 2 children have the highest poverty rate, with 6 households (9.1%) falling below the poverty line.
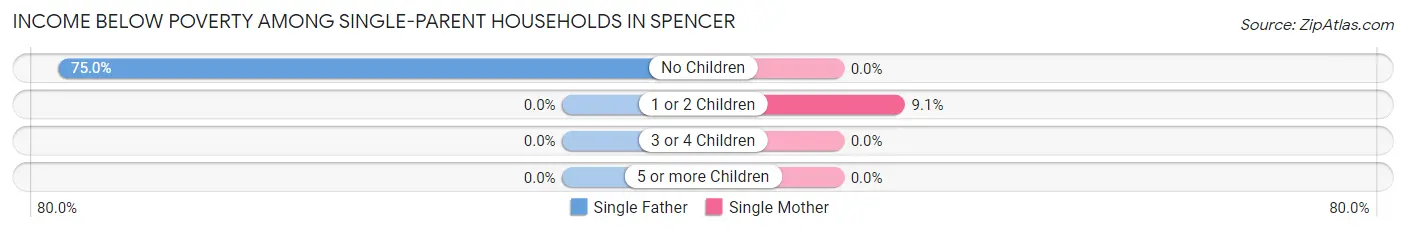
| Children | Single Father | Single Mother |
| No Children | 12 (75.0%) | 0 (0.0%) |
| 1 or 2 Children | 0 (0.0%) | 6 (9.1%) |
| 3 or 4 Children | 0 (0.0%) | 0 (0.0%) |
| 5 or more Children | 0 (0.0%) | 0 (0.0%) |
| Total | 12 (60.0%) | 6 (5.7%) |
Income Below Poverty Among Married-Couple vs Single-Parent Households in Spencer
The poverty data for Spencer shows that 27 of the married-couple family households (12.0%) and 18 of the single-parent households (14.3%) are living below the poverty level. Within the married-couple family households, those with no children have the highest poverty rate, with 24 households (16.4%) falling below the poverty line. Among the single-parent households, those with no children have the highest poverty rate, with 12 household (24.0%) living below poverty.
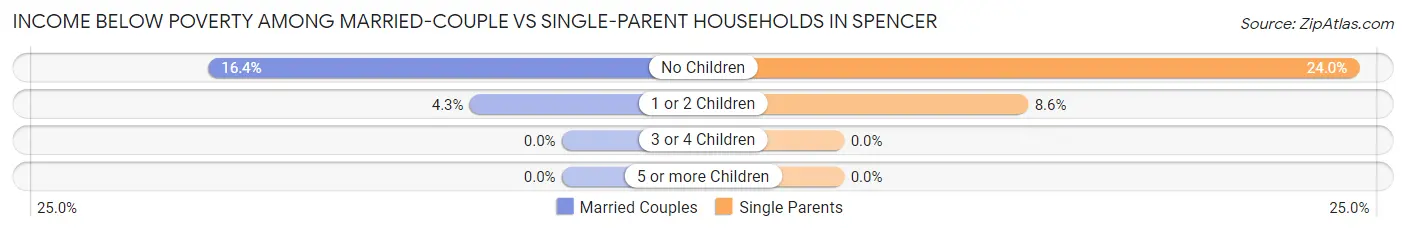
| Children | Married-Couple Families | Single-Parent Households |
| No Children | 24 (16.4%) | 12 (24.0%) |
| 1 or 2 Children | 3 (4.3%) | 6 (8.6%) |
| 3 or 4 Children | 0 (0.0%) | 0 (0.0%) |
| 5 or more Children | 0 (0.0%) | 0 (0.0%) |
| Total | 27 (12.0%) | 18 (14.3%) |
Race in Spencer
The most populous races in Spencer are White / Caucasian (1,362 | 92.7%), Two or more Races (99 | 6.7%), and Black / African American (8 | 0.5%).
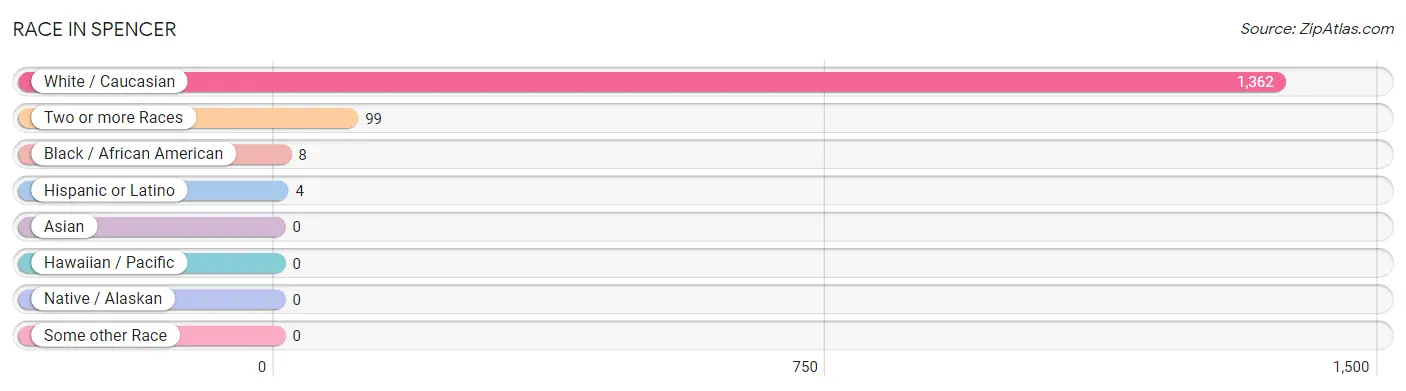
| Race | # Population | % Population |
| Asian | 0 | 0.0% |
| Black / African American | 8 | 0.5% |
| Hawaiian / Pacific | 0 | 0.0% |
| Hispanic or Latino | 4 | 0.3% |
| Native / Alaskan | 0 | 0.0% |
| White / Caucasian | 1,362 | 92.7% |
| Two or more Races | 99 | 6.7% |
| Some other Race | 0 | 0.0% |
| Total | 1,469 | 100.0% |
Ancestry in Spencer
The most populous ancestries reported in Spencer are American (242 | 16.5%), Irish (236 | 16.1%), English (163 | 11.1%), German (45 | 3.1%), and Cree (35 | 2.4%), together accounting for 49.1% of all Spencer residents.
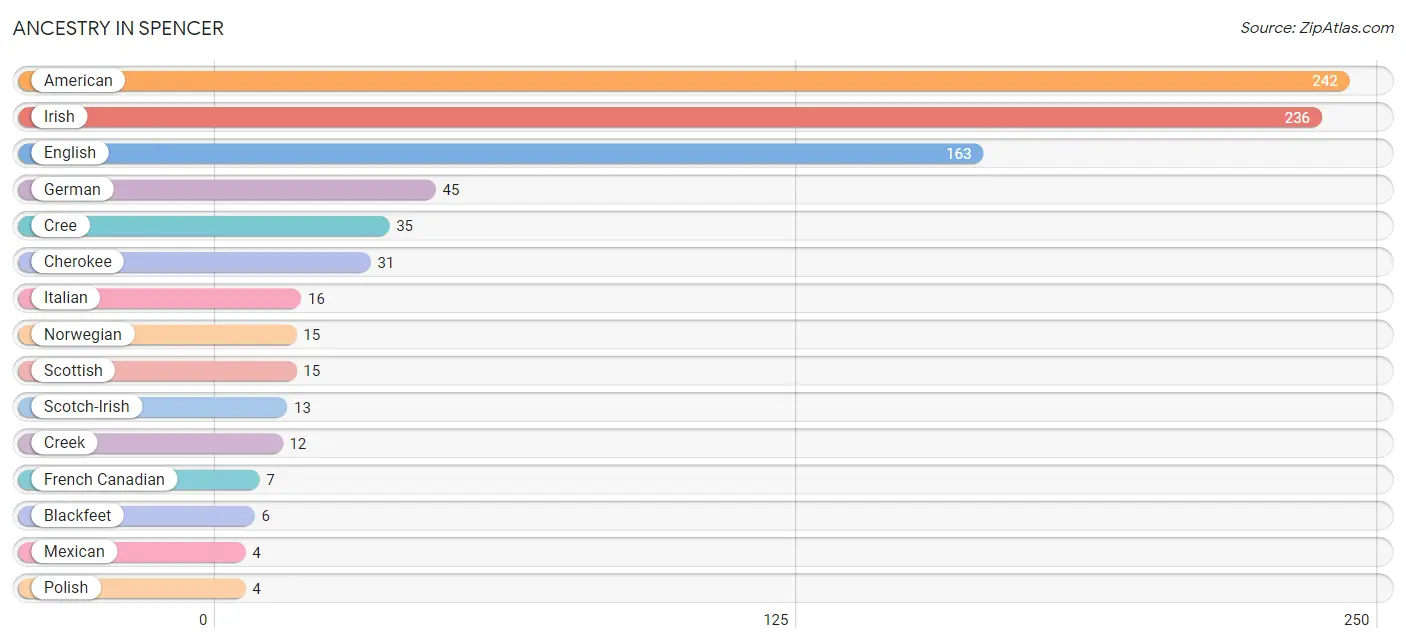
| Ancestry | # Population | % Population |
| American | 242 | 16.5% |
| Blackfeet | 6 | 0.4% |
| Cherokee | 31 | 2.1% |
| Cree | 35 | 2.4% |
| Creek | 12 | 0.8% |
| English | 163 | 11.1% |
| French Canadian | 7 | 0.5% |
| German | 45 | 3.1% |
| Irish | 236 | 16.1% |
| Italian | 16 | 1.1% |
| Mexican | 4 | 0.3% |
| Norwegian | 15 | 1.0% |
| Polish | 4 | 0.3% |
| Scotch-Irish | 13 | 0.9% |
| Scottish | 15 | 1.0% |
| Welsh | 2 | 0.1% | View All 16 Rows |
Immigrants in Spencer

| Immigration Origin | # Population | % Population | View All 0 Rows |
Sex and Age in Spencer
Sex and Age in Spencer
The most populous age groups in Spencer are 45 to 49 Years (69 | 10.7%) for men and 70 to 74 Years (105 | 12.8%) for women.
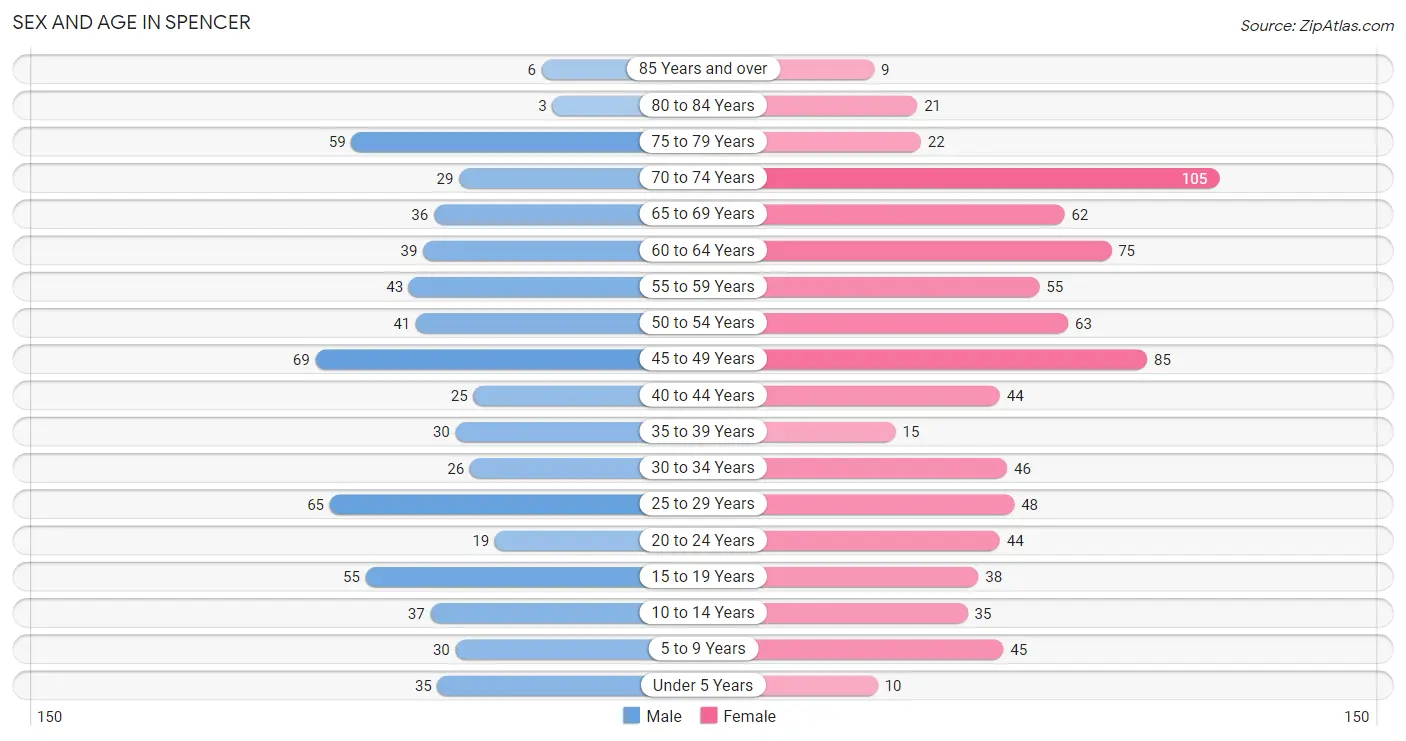
| Age Bracket | Male | Female |
| Under 5 Years | 35 (5.4%) | 10 (1.2%) |
| 5 to 9 Years | 30 (4.6%) | 45 (5.5%) |
| 10 to 14 Years | 37 (5.7%) | 35 (4.3%) |
| 15 to 19 Years | 55 (8.5%) | 38 (4.6%) |
| 20 to 24 Years | 19 (2.9%) | 44 (5.3%) |
| 25 to 29 Years | 65 (10.1%) | 48 (5.8%) |
| 30 to 34 Years | 26 (4.0%) | 46 (5.6%) |
| 35 to 39 Years | 30 (4.6%) | 15 (1.8%) |
| 40 to 44 Years | 25 (3.9%) | 44 (5.3%) |
| 45 to 49 Years | 69 (10.7%) | 85 (10.3%) |
| 50 to 54 Years | 41 (6.3%) | 63 (7.7%) |
| 55 to 59 Years | 43 (6.7%) | 55 (6.7%) |
| 60 to 64 Years | 39 (6.0%) | 75 (9.1%) |
| 65 to 69 Years | 36 (5.6%) | 62 (7.5%) |
| 70 to 74 Years | 29 (4.5%) | 105 (12.8%) |
| 75 to 79 Years | 59 (9.1%) | 22 (2.7%) |
| 80 to 84 Years | 3 (0.5%) | 21 (2.5%) |
| 85 Years and over | 6 (0.9%) | 9 (1.1%) |
| Total | 647 (100.0%) | 822 (100.0%) |
Families and Households in Spencer
Median Family Size in Spencer
The median family size in Spencer is 3.19 persons per family, with single female/mother families (106 | 30.2%) accounting for the largest median family size of 3.85 persons per family. On the other hand, married-couple families (225 | 64.1%) represent the smallest median family size with 2.89 persons per family.
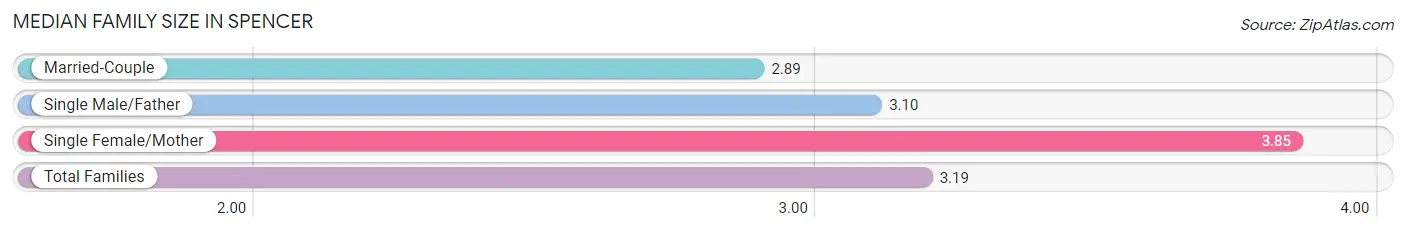
| Family Type | # Families | Family Size |
| Married-Couple | 225 (64.1%) | 2.89 |
| Single Male/Father | 20 (5.7%) | 3.10 |
| Single Female/Mother | 106 (30.2%) | 3.85 |
| Total Families | 351 (100.0%) | 3.19 |
Median Household Size in Spencer
The median household size in Spencer is 2.46 persons per household, with single female/mother households (106 | 19.1%) accounting for the largest median household size of 4.07 persons per household. non-family households (204 | 36.8%) represent the smallest median household size with 1.08 persons per household.
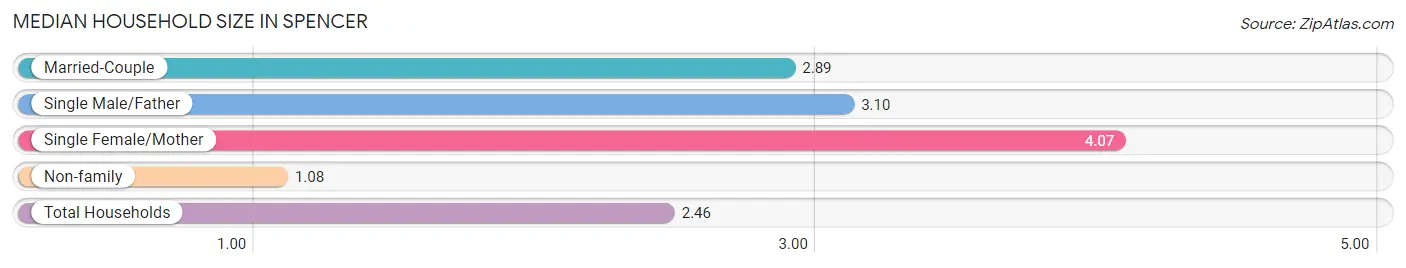
| Household Type | # Households | Household Size |
| Married-Couple | 225 (40.5%) | 2.89 |
| Single Male/Father | 20 (3.6%) | 3.10 |
| Single Female/Mother | 106 (19.1%) | 4.07 |
| Non-family | 204 (36.8%) | 1.08 |
| Total Households | 555 (100.0%) | 2.46 |
Household Size by Marriage Status in Spencer
Out of a total of 555 households in Spencer, 351 (63.2%) are family households, while 204 (36.8%) are nonfamily households. The most numerous type of family households are 2-person households, comprising 146, and the most common type of nonfamily households are 1-person households, comprising 193.
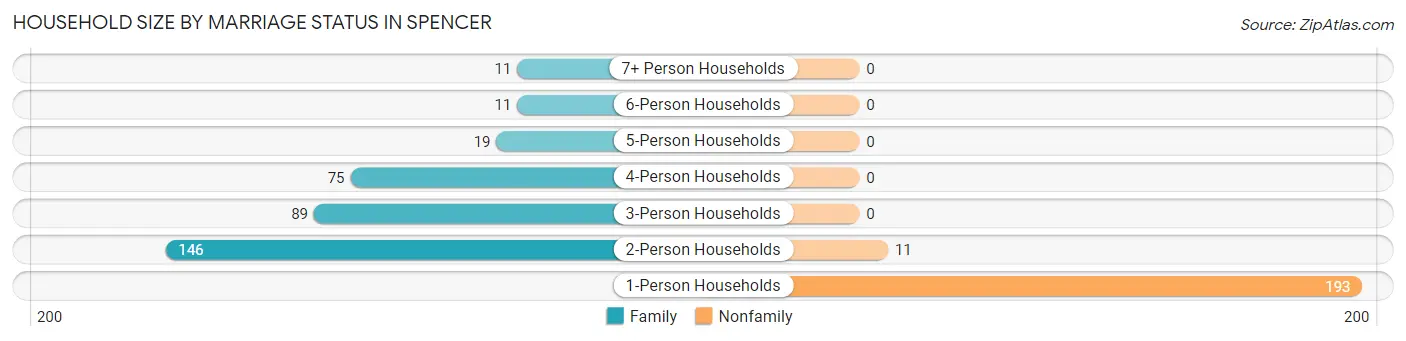
| Household Size | Family Households | Nonfamily Households |
| 1-Person Households | - | 193 (34.8%) |
| 2-Person Households | 146 (26.3%) | 11 (2.0%) |
| 3-Person Households | 89 (16.0%) | 0 (0.0%) |
| 4-Person Households | 75 (13.5%) | 0 (0.0%) |
| 5-Person Households | 19 (3.4%) | 0 (0.0%) |
| 6-Person Households | 11 (2.0%) | 0 (0.0%) |
| 7+ Person Households | 11 (2.0%) | 0 (0.0%) |
| Total | 351 (63.2%) | 204 (36.8%) |
Female Fertility in Spencer
Fertility by Age in Spencer
Average fertility rate in Spencer is 16.0 births per 1,000 women. Women in the age bracket of 20 to 34 years have the highest fertility rate with 36.0 births per 1,000 women. Women in the age bracket of 20 to 34 years acount for 100.0% of all women with births.
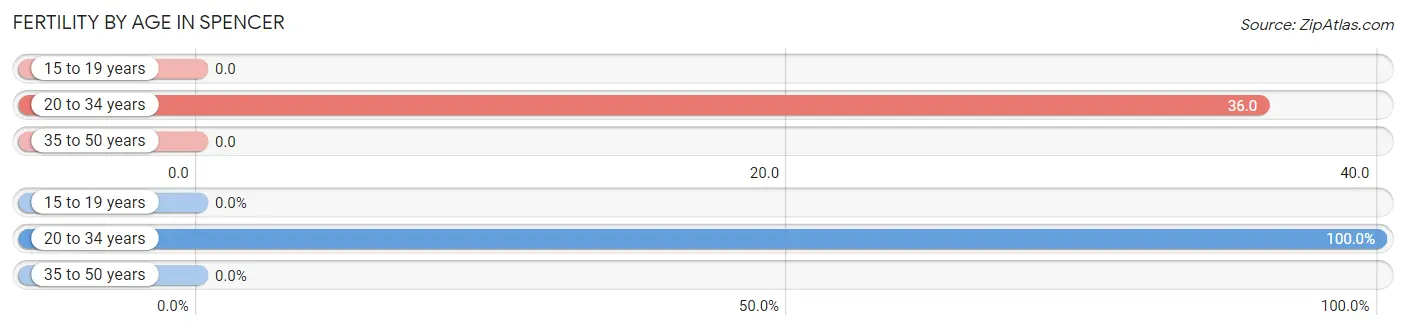
| Age Bracket | Women with Births | Births / 1,000 Women |
| 15 to 19 years | 0 (0.0%) | 0.0 |
| 20 to 34 years | 5 (100.0%) | 36.0 |
| 35 to 50 years | 0 (0.0%) | 0.0 |
| Total | 5 (100.0%) | 16.0 |
Fertility by Age by Marriage Status in Spencer
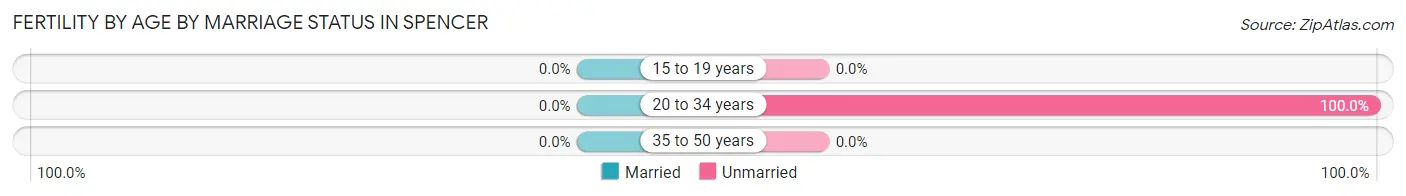
| Age Bracket | Married | Unmarried |
| 15 to 19 years | 0 (0.0%) | 0 (0.0%) |
| 20 to 34 years | 0 (0.0%) | 5 (100.0%) |
| 35 to 50 years | 0 (0.0%) | 0 (0.0%) |
| Total | 0 (0.0%) | 5 (100.0%) |
Fertility by Education in Spencer
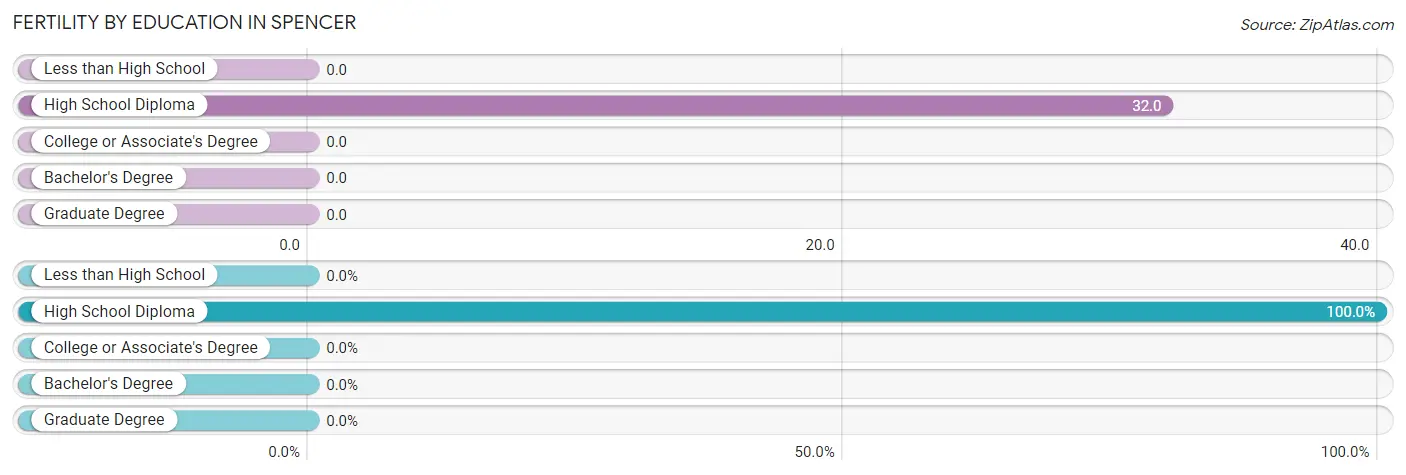
| Educational Attainment | Women with Births | Births / 1,000 Women |
| Less than High School | 0 (0.0%) | 0.0 |
| High School Diploma | 5 (100.0%) | 32.0 |
| College or Associate's Degree | 0 (0.0%) | 0.0 |
| Bachelor's Degree | 0 (0.0%) | 0.0 |
| Graduate Degree | 0 (0.0%) | 0.0 |
| Total | 5 (100.0%) | 16.0 |
Fertility by Education by Marriage Status in Spencer
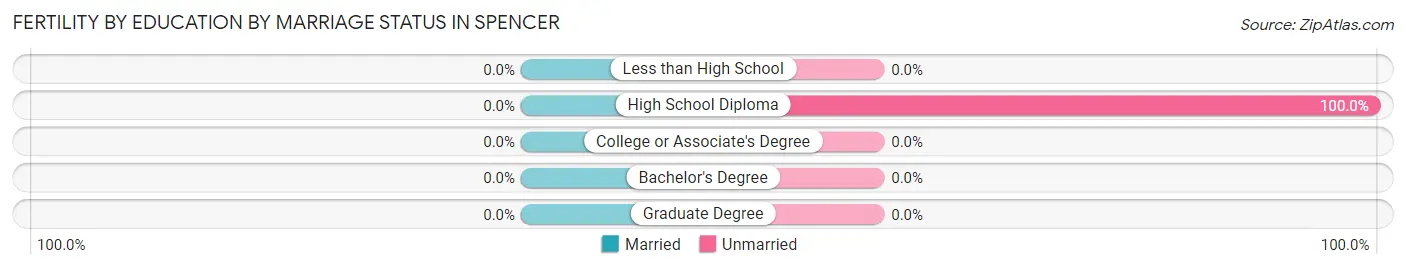
| Educational Attainment | Married | Unmarried |
| Less than High School | 0 (0.0%) | 0 (0.0%) |
| High School Diploma | 0 (0.0%) | 5 (100.0%) |
| College or Associate's Degree | 0 (0.0%) | 0 (0.0%) |
| Bachelor's Degree | 0 (0.0%) | 0 (0.0%) |
| Graduate Degree | 0 (0.0%) | 0 (0.0%) |
| Total | 0 (0.0%) | 5 (100.0%) |
Employment Characteristics in Spencer
Employment by Class of Employer in Spencer
Among the 506 employed individuals in Spencer, private company employees (389 | 76.9%), local government employees (67 | 13.2%), and state government employees (29 | 5.7%) make up the most common classes of employment.
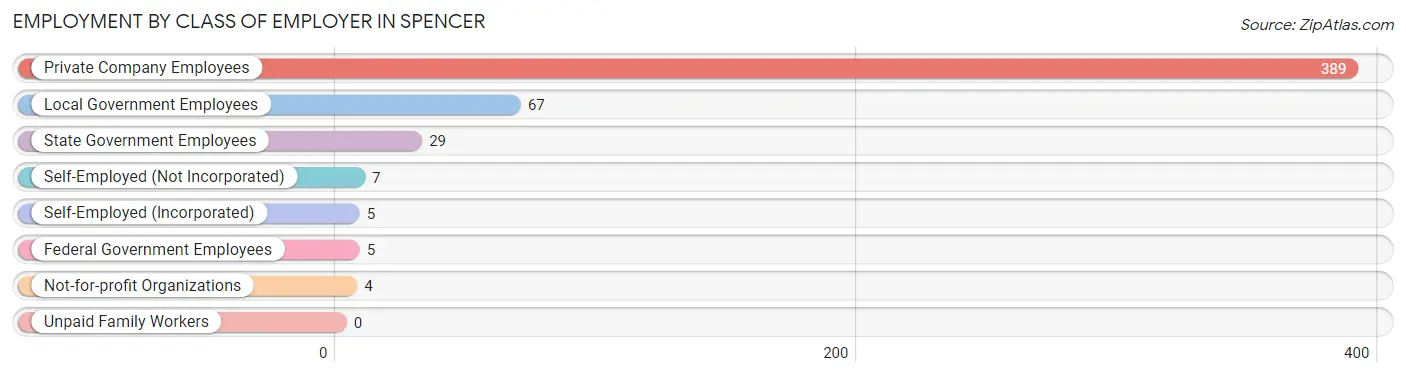
| Employer Class | # Employees | % Employees |
| Private Company Employees | 389 | 76.9% |
| Self-Employed (Incorporated) | 5 | 1.0% |
| Self-Employed (Not Incorporated) | 7 | 1.4% |
| Not-for-profit Organizations | 4 | 0.8% |
| Local Government Employees | 67 | 13.2% |
| State Government Employees | 29 | 5.7% |
| Federal Government Employees | 5 | 1.0% |
| Unpaid Family Workers | 0 | 0.0% |
| Total | 506 | 100.0% |
Employment Status by Age in Spencer
According to the labor force statistics for Spencer, out of the total population over 16 years of age (1,256), 42.5% or 534 individuals are in the labor force, with 0.2% or 1 of them unemployed. The age group with the highest labor force participation rate is 25 to 29 years, with 100.0% or 113 individuals in the labor force. Within the labor force, the 16 to 19 years age range has the highest percentage of unemployed individuals, with 4.5% or 1 of them being unemployed.
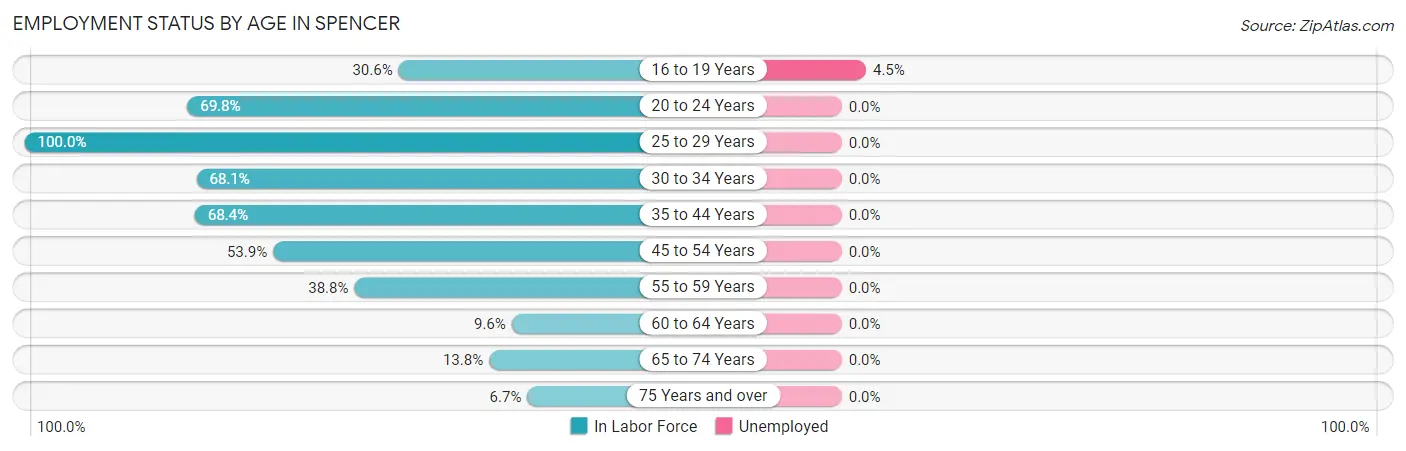
| Age Bracket | In Labor Force | Unemployed |
| 16 to 19 Years | 22 (30.6%) | 1 (4.5%) |
| 20 to 24 Years | 44 (69.8%) | 0 (0.0%) |
| 25 to 29 Years | 113 (100.0%) | 0 (0.0%) |
| 30 to 34 Years | 49 (68.1%) | 0 (0.0%) |
| 35 to 44 Years | 78 (68.4%) | 0 (0.0%) |
| 45 to 54 Years | 139 (53.9%) | 0 (0.0%) |
| 55 to 59 Years | 38 (38.8%) | 0 (0.0%) |
| 60 to 64 Years | 11 (9.6%) | 0 (0.0%) |
| 65 to 74 Years | 32 (13.8%) | 0 (0.0%) |
| 75 Years and over | 8 (6.7%) | 0 (0.0%) |
| Total | 534 (42.5%) | 1 (0.2%) |
Employment Status by Educational Attainment in Spencer
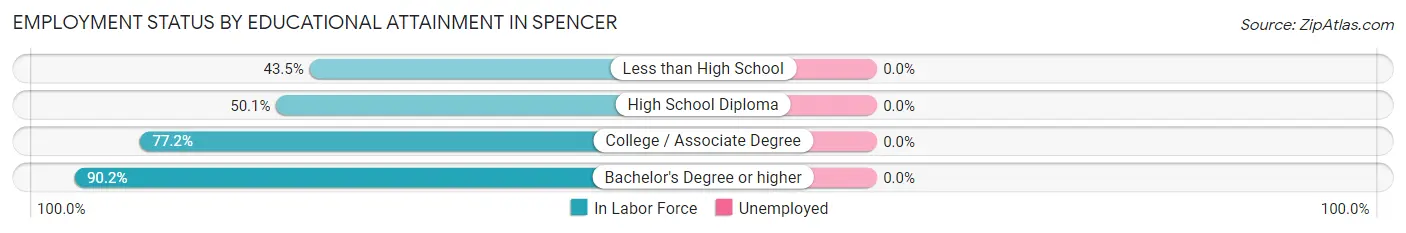
| Educational Attainment | In Labor Force | Unemployed |
| Less than High School | 73 (43.5%) | 0 (0.0%) |
| High School Diploma | 214 (50.1%) | 0 (0.0%) |
| College / Associate Degree | 95 (77.2%) | 0 (0.0%) |
| Bachelor's Degree or higher | 46 (90.2%) | 0 (0.0%) |
| Total | 428 (55.7%) | 0 (0.0%) |
Employment Occupations by Sex in Spencer
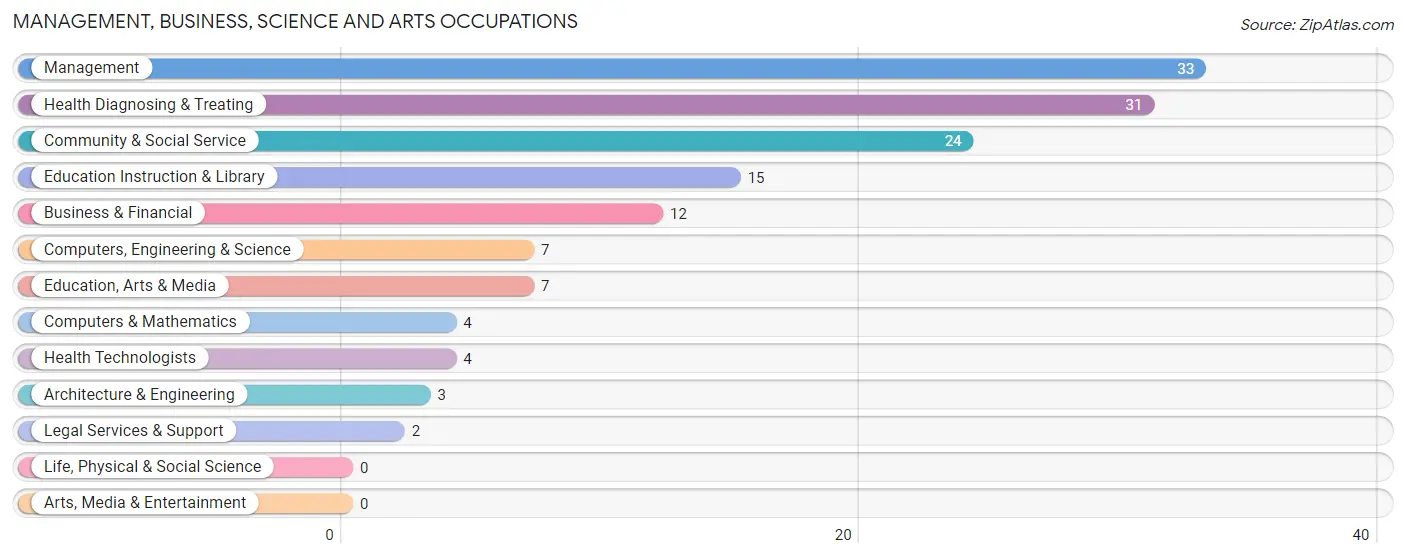
Management, Business, Science and Arts Occupations
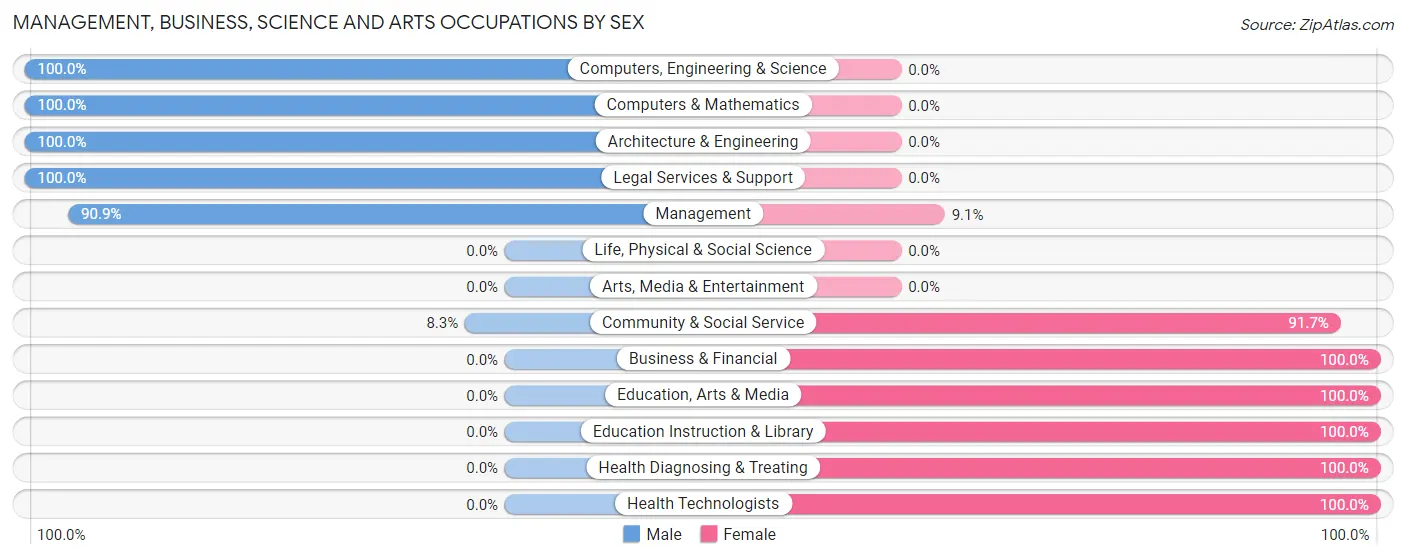
The most common Management, Business, Science and Arts occupations in Spencer are Management (33 | 6.2%), Health Diagnosing & Treating (31 | 5.8%), Community & Social Service (24 | 4.5%), Education Instruction & Library (15 | 2.8%), and Business & Financial (12 | 2.2%).
Management, Business, Science and Arts Occupations by Sex
Within the Management, Business, Science and Arts occupations in Spencer, the most male-oriented occupations are Computers, Engineering & Science (100.0%), Computers & Mathematics (100.0%), and Architecture & Engineering (100.0%), while the most female-oriented occupations are Business & Financial (100.0%), Education, Arts & Media (100.0%), and Education Instruction & Library (100.0%).
| Occupation | Male | Female |
| Management | 30 (90.9%) | 3 (9.1%) |
| Business & Financial | 0 (0.0%) | 12 (100.0%) |
| Computers, Engineering & Science | 7 (100.0%) | 0 (0.0%) |
| Computers & Mathematics | 4 (100.0%) | 0 (0.0%) |
| Architecture & Engineering | 3 (100.0%) | 0 (0.0%) |
| Life, Physical & Social Science | 0 (0.0%) | 0 (0.0%) |
| Community & Social Service | 2 (8.3%) | 22 (91.7%) |
| Education, Arts & Media | 0 (0.0%) | 7 (100.0%) |
| Legal Services & Support | 2 (100.0%) | 0 (0.0%) |
| Education Instruction & Library | 0 (0.0%) | 15 (100.0%) |
| Arts, Media & Entertainment | 0 (0.0%) | 0 (0.0%) |
| Health Diagnosing & Treating | 0 (0.0%) | 31 (100.0%) |
| Health Technologists | 0 (0.0%) | 4 (100.0%) |
| Total (Category) | 39 (36.4%) | 68 (63.5%) |
| Total (Overall) | 247 (46.3%) | 286 (53.7%) |
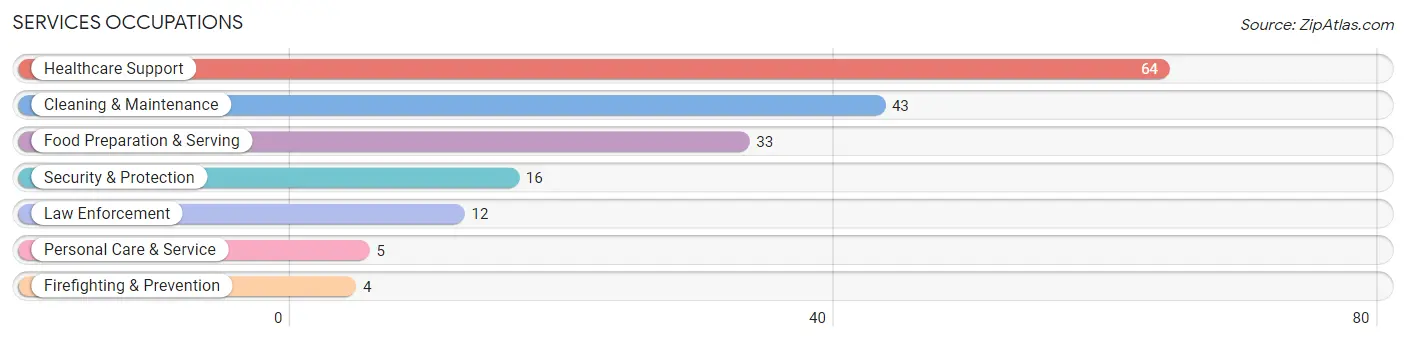
Services Occupations
The most common Services occupations in Spencer are Healthcare Support (64 | 12.0%), Cleaning & Maintenance (43 | 8.1%), Food Preparation & Serving (33 | 6.2%), Security & Protection (16 | 3.0%), and Law Enforcement (12 | 2.2%).
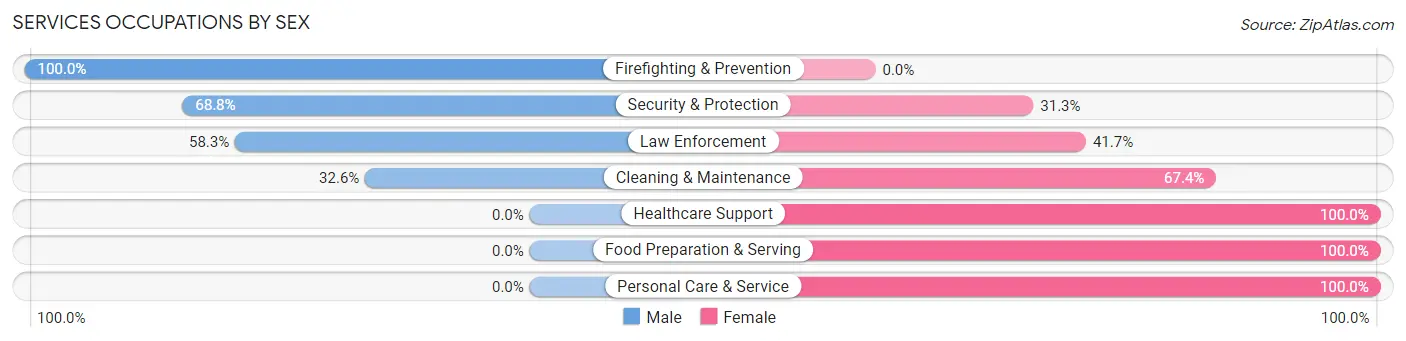
Services Occupations by Sex
Within the Services occupations in Spencer, the most male-oriented occupations are Firefighting & Prevention (100.0%), Security & Protection (68.8%), and Law Enforcement (58.3%), while the most female-oriented occupations are Healthcare Support (100.0%), Food Preparation & Serving (100.0%), and Personal Care & Service (100.0%).
| Occupation | Male | Female |
| Healthcare Support | 0 (0.0%) | 64 (100.0%) |
| Security & Protection | 11 (68.8%) | 5 (31.2%) |
| Firefighting & Prevention | 4 (100.0%) | 0 (0.0%) |
| Law Enforcement | 7 (58.3%) | 5 (41.7%) |
| Food Preparation & Serving | 0 (0.0%) | 33 (100.0%) |
| Cleaning & Maintenance | 14 (32.6%) | 29 (67.4%) |
| Personal Care & Service | 0 (0.0%) | 5 (100.0%) |
| Total (Category) | 25 (15.5%) | 136 (84.5%) |
| Total (Overall) | 247 (46.3%) | 286 (53.7%) |
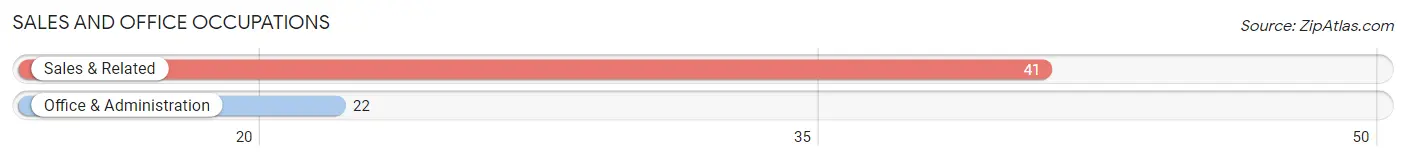
Sales and Office Occupations
The most common Sales and Office occupations in Spencer are Sales & Related (41 | 7.7%), and Office & Administration (22 | 4.1%).
Sales and Office Occupations by Sex
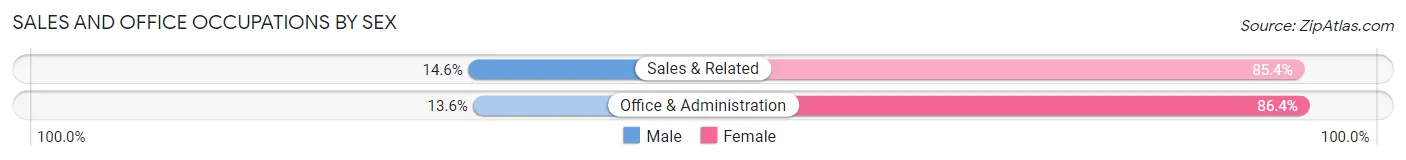
| Occupation | Male | Female |
| Sales & Related | 6 (14.6%) | 35 (85.4%) |
| Office & Administration | 3 (13.6%) | 19 (86.4%) |
| Total (Category) | 9 (14.3%) | 54 (85.7%) |
| Total (Overall) | 247 (46.3%) | 286 (53.7%) |
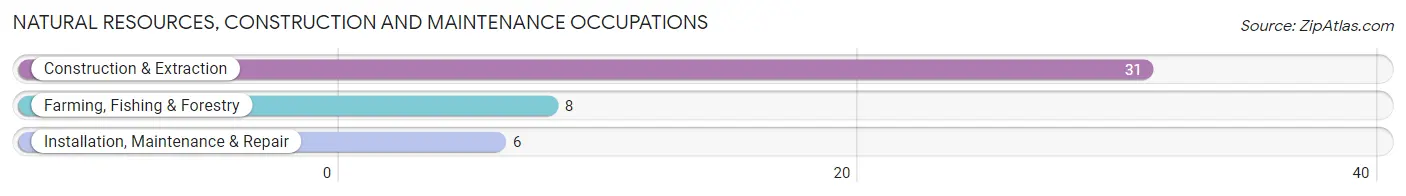
Natural Resources, Construction and Maintenance Occupations
The most common Natural Resources, Construction and Maintenance occupations in Spencer are Construction & Extraction (31 | 5.8%), Farming, Fishing & Forestry (8 | 1.5%), and Installation, Maintenance & Repair (6 | 1.1%).
Natural Resources, Construction and Maintenance Occupations by Sex
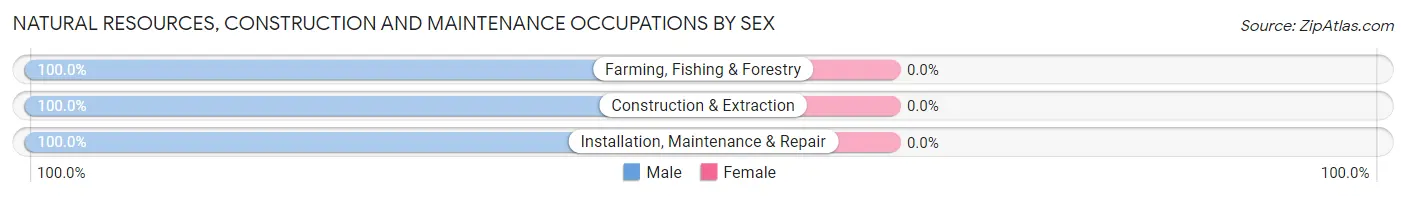
| Occupation | Male | Female |
| Farming, Fishing & Forestry | 8 (100.0%) | 0 (0.0%) |
| Construction & Extraction | 31 (100.0%) | 0 (0.0%) |
| Installation, Maintenance & Repair | 6 (100.0%) | 0 (0.0%) |
| Total (Category) | 45 (100.0%) | 0 (0.0%) |
| Total (Overall) | 247 (46.3%) | 286 (53.7%) |
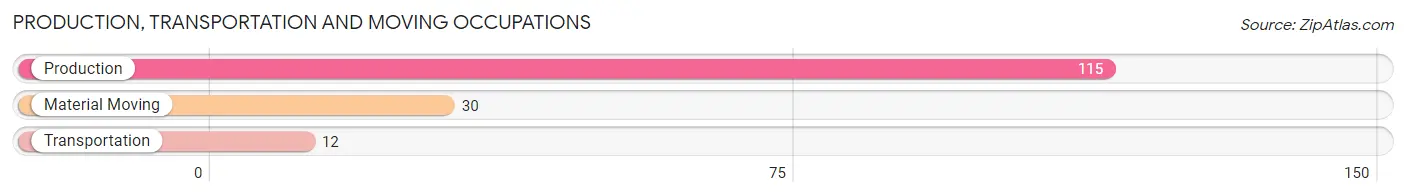
Production, Transportation and Moving Occupations
The most common Production, Transportation and Moving occupations in Spencer are Production (115 | 21.6%), Material Moving (30 | 5.6%), and Transportation (12 | 2.2%).
Production, Transportation and Moving Occupations by Sex
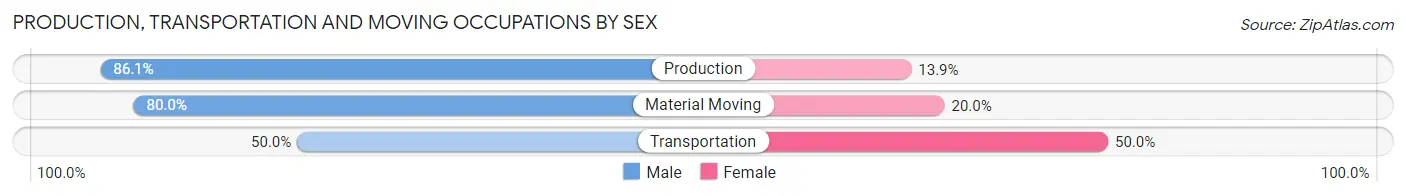
| Occupation | Male | Female |
| Production | 99 (86.1%) | 16 (13.9%) |
| Transportation | 6 (50.0%) | 6 (50.0%) |
| Material Moving | 24 (80.0%) | 6 (20.0%) |
| Total (Category) | 129 (82.2%) | 28 (17.8%) |
| Total (Overall) | 247 (46.3%) | 286 (53.7%) |
Employment Industries by Sex in Spencer
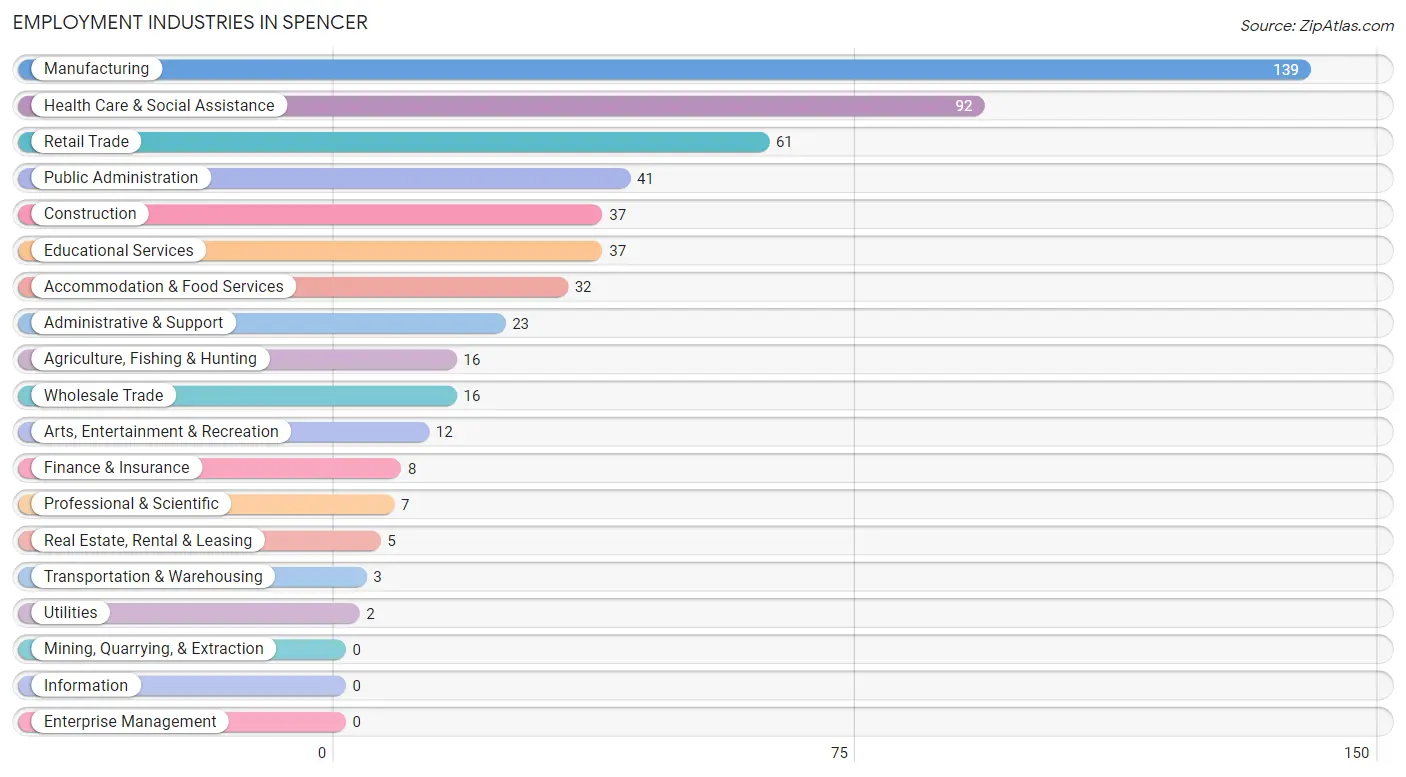
Employment Industries in Spencer
The major employment industries in Spencer include Manufacturing (139 | 26.1%), Health Care & Social Assistance (92 | 17.3%), Retail Trade (61 | 11.4%), Public Administration (41 | 7.7%), and Construction (37 | 6.9%).
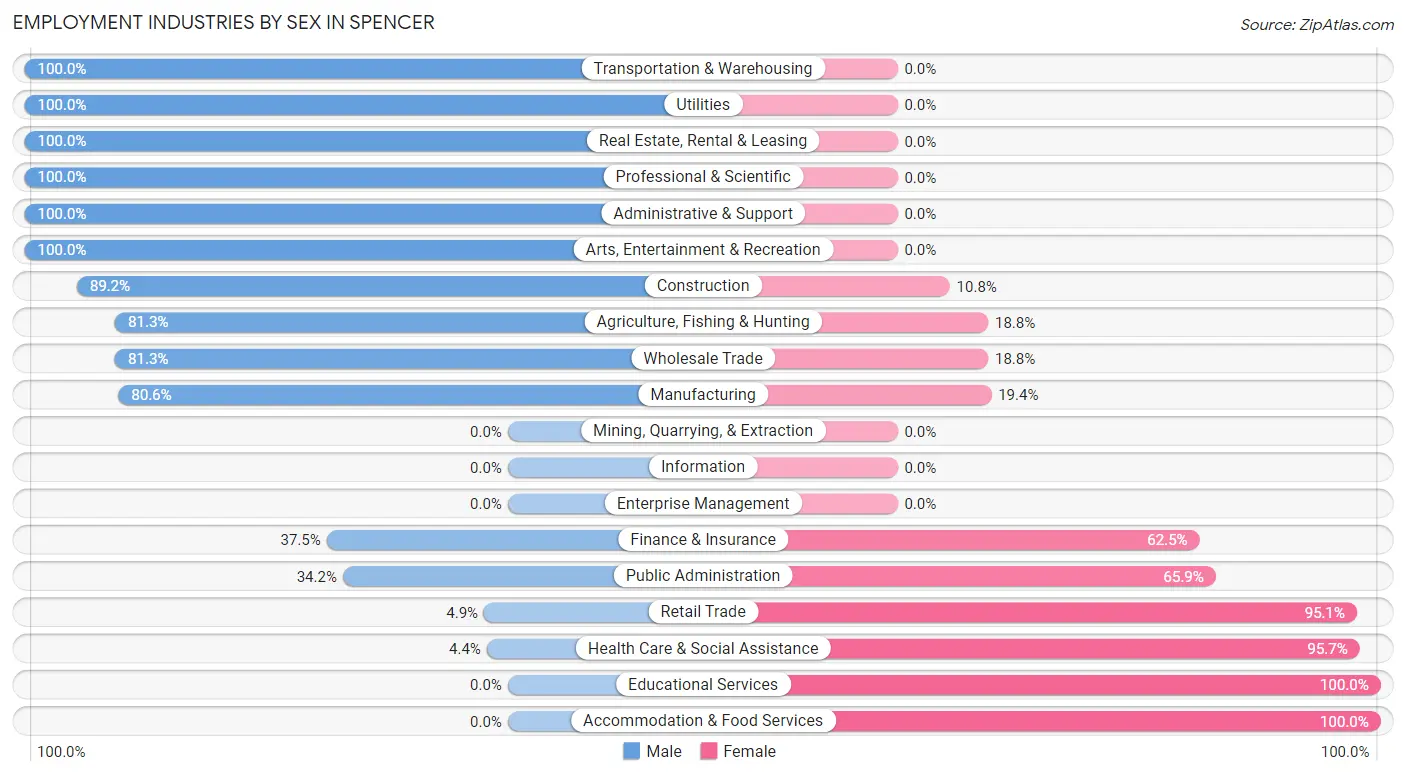
Employment Industries by Sex in Spencer
The Spencer industries that see more men than women are Transportation & Warehousing (100.0%), Utilities (100.0%), and Real Estate, Rental & Leasing (100.0%), whereas the industries that tend to have a higher number of women are Educational Services (100.0%), Accommodation & Food Services (100.0%), and Health Care & Social Assistance (95.7%).
| Industry | Male | Female |
| Agriculture, Fishing & Hunting | 13 (81.2%) | 3 (18.8%) |
| Mining, Quarrying, & Extraction | 0 (0.0%) | 0 (0.0%) |
| Construction | 33 (89.2%) | 4 (10.8%) |
| Manufacturing | 112 (80.6%) | 27 (19.4%) |
| Wholesale Trade | 13 (81.2%) | 3 (18.8%) |
| Retail Trade | 3 (4.9%) | 58 (95.1%) |
| Transportation & Warehousing | 3 (100.0%) | 0 (0.0%) |
| Utilities | 2 (100.0%) | 0 (0.0%) |
| Information | 0 (0.0%) | 0 (0.0%) |
| Finance & Insurance | 3 (37.5%) | 5 (62.5%) |
| Real Estate, Rental & Leasing | 5 (100.0%) | 0 (0.0%) |
| Professional & Scientific | 7 (100.0%) | 0 (0.0%) |
| Enterprise Management | 0 (0.0%) | 0 (0.0%) |
| Administrative & Support | 23 (100.0%) | 0 (0.0%) |
| Educational Services | 0 (0.0%) | 37 (100.0%) |
| Health Care & Social Assistance | 4 (4.3%) | 88 (95.7%) |
| Arts, Entertainment & Recreation | 12 (100.0%) | 0 (0.0%) |
| Accommodation & Food Services | 0 (0.0%) | 32 (100.0%) |
| Public Administration | 14 (34.2%) | 27 (65.8%) |
| Total | 247 (46.3%) | 286 (53.7%) |
Education in Spencer
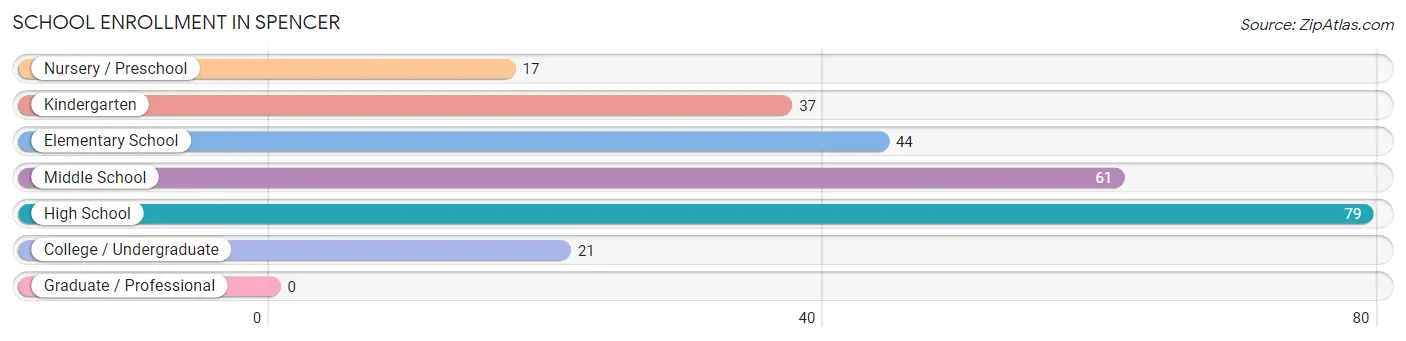
School Enrollment in Spencer
The most common levels of schooling among the 259 students in Spencer are high school (79 | 30.5%), middle school (61 | 23.5%), and elementary school (44 | 17.0%).
| School Level | # Students | % Students |
| Nursery / Preschool | 17 | 6.6% |
| Kindergarten | 37 | 14.3% |
| Elementary School | 44 | 17.0% |
| Middle School | 61 | 23.5% |
| High School | 79 | 30.5% |
| College / Undergraduate | 21 | 8.1% |
| Graduate / Professional | 0 | 0.0% |
| Total | 259 | 100.0% |
School Enrollment by Age by Funding Source in Spencer
Out of a total of 259 students who are enrolled in schools in Spencer, 5 (1.9%) attend a private institution, while the remaining 254 (98.1%) are enrolled in public schools. The age group of 10 to 14 year olds has the highest likelihood of being enrolled in private schools, with 3 (4.2% in the age bracket) enrolled. Conversely, the age group of 3 to 4 year olds has the lowest likelihood of being enrolled in a private school, with 17 (100.0% in the age bracket) attending a public institution.
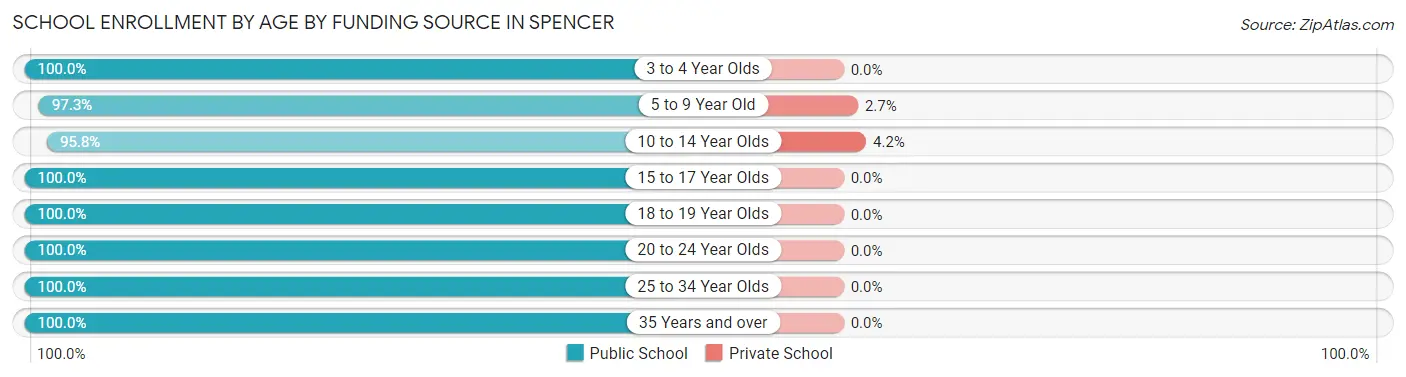
| Age Bracket | Public School | Private School |
| 3 to 4 Year Olds | 17 (100.0%) | 0 (0.0%) |
| 5 to 9 Year Old | 73 (97.3%) | 2 (2.7%) |
| 10 to 14 Year Olds | 69 (95.8%) | 3 (4.2%) |
| 15 to 17 Year Olds | 64 (100.0%) | 0 (0.0%) |
| 18 to 19 Year Olds | 10 (100.0%) | 0 (0.0%) |
| 20 to 24 Year Olds | 1 (100.0%) | 0 (0.0%) |
| 25 to 34 Year Olds | 13 (100.0%) | 0 (0.0%) |
| 35 Years and over | 7 (100.0%) | 0 (0.0%) |
| Total | 254 (98.1%) | 5 (1.9%) |
Educational Attainment by Field of Study in Spencer
Education (26 | 33.3%), arts & humanities (14 | 17.9%), business (13 | 16.7%), social sciences (11 | 14.1%), and engineering (7 | 9.0%) are the most common fields of study among 78 individuals in Spencer who have obtained a bachelor's degree or higher.
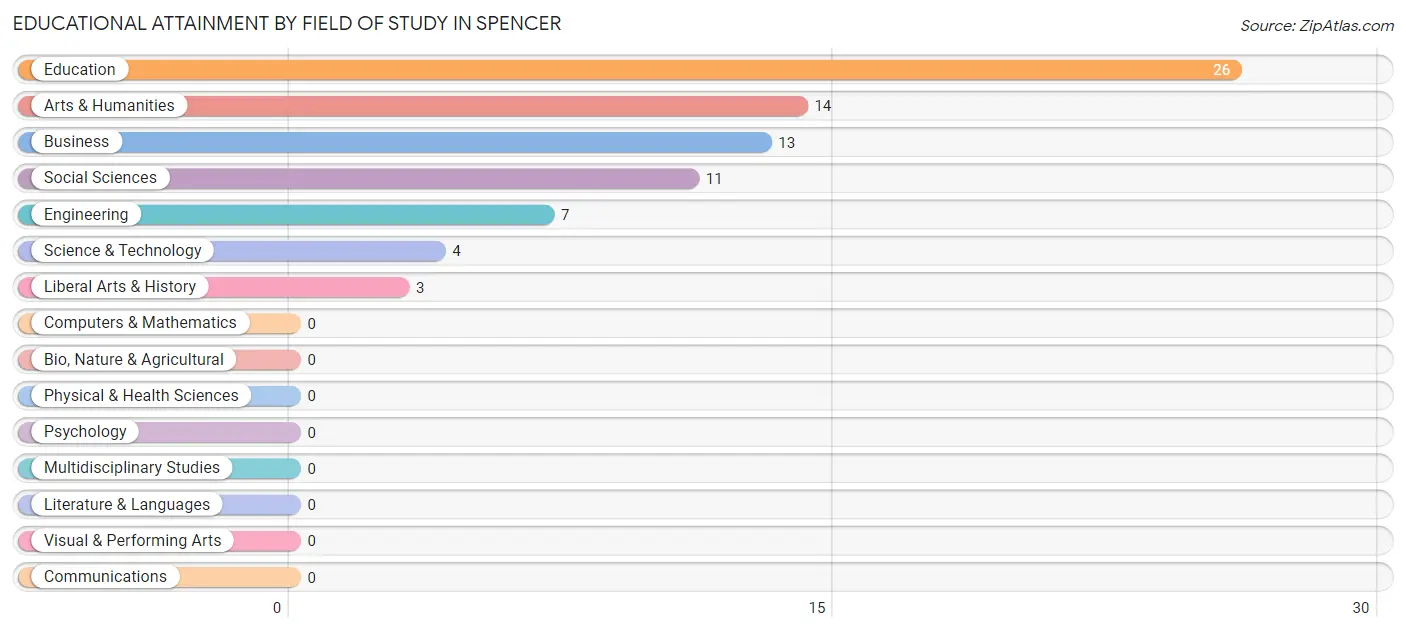
| Field of Study | # Graduates | % Graduates |
| Computers & Mathematics | 0 | 0.0% |
| Bio, Nature & Agricultural | 0 | 0.0% |
| Physical & Health Sciences | 0 | 0.0% |
| Psychology | 0 | 0.0% |
| Social Sciences | 11 | 14.1% |
| Engineering | 7 | 9.0% |
| Multidisciplinary Studies | 0 | 0.0% |
| Science & Technology | 4 | 5.1% |
| Business | 13 | 16.7% |
| Education | 26 | 33.3% |
| Literature & Languages | 0 | 0.0% |
| Liberal Arts & History | 3 | 3.8% |
| Visual & Performing Arts | 0 | 0.0% |
| Communications | 0 | 0.0% |
| Arts & Humanities | 14 | 17.9% |
| Total | 78 | 100.0% |
Transportation & Commute in Spencer
Vehicle Availability by Sex in Spencer
The most prevalent vehicle ownership categories in Spencer are males with 2 vehicles (96, accounting for 39.5%) and females with 2 vehicles (77, making up 36.5%).
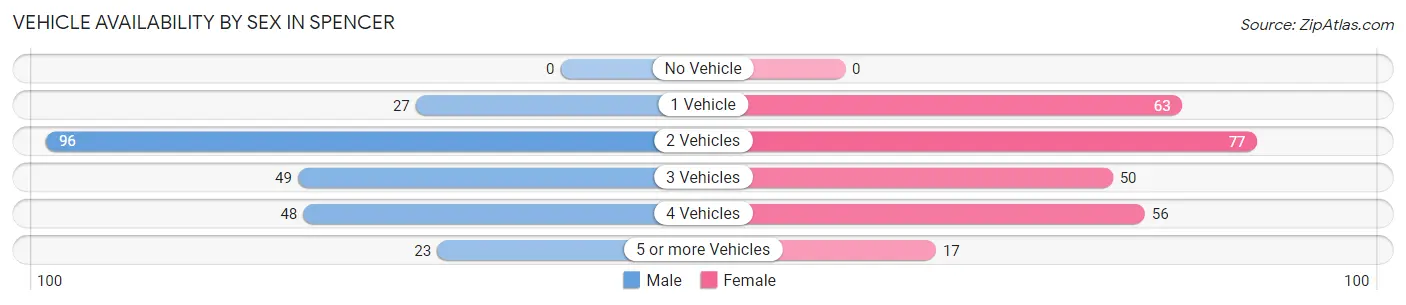
| Vehicles Available | Male | Female |
| No Vehicle | 0 (0.0%) | 0 (0.0%) |
| 1 Vehicle | 27 (11.1%) | 63 (23.9%) |
| 2 Vehicles | 96 (39.5%) | 77 (29.3%) |
| 3 Vehicles | 49 (20.2%) | 50 (19.0%) |
| 4 Vehicles | 48 (19.8%) | 56 (21.3%) |
| 5 or more Vehicles | 23 (9.5%) | 17 (6.5%) |
| Total | 243 (100.0%) | 263 (100.0%) |
Commute Time in Spencer
The most frequently occuring commute durations in Spencer are 30 to 34 minutes (122 commuters, 24.4%), 5 to 9 minutes (74 commuters, 14.8%), and less than 5 minutes (67 commuters, 13.4%).
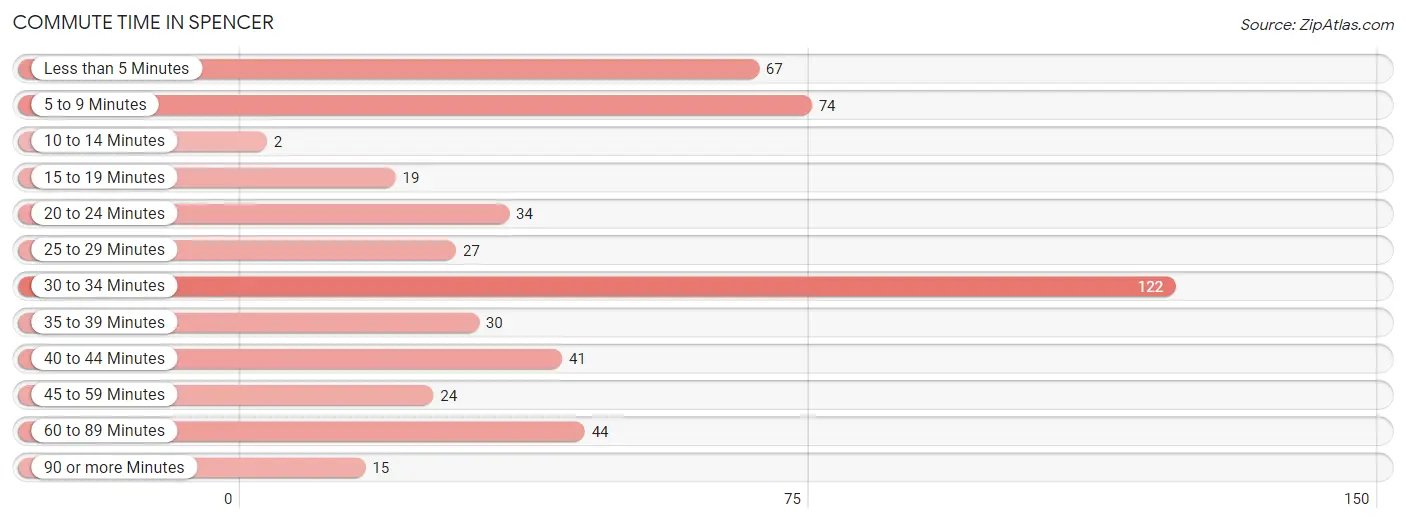
| Commute Time | # Commuters | % Commuters |
| Less than 5 Minutes | 67 | 13.4% |
| 5 to 9 Minutes | 74 | 14.8% |
| 10 to 14 Minutes | 2 | 0.4% |
| 15 to 19 Minutes | 19 | 3.8% |
| 20 to 24 Minutes | 34 | 6.8% |
| 25 to 29 Minutes | 27 | 5.4% |
| 30 to 34 Minutes | 122 | 24.4% |
| 35 to 39 Minutes | 30 | 6.0% |
| 40 to 44 Minutes | 41 | 8.2% |
| 45 to 59 Minutes | 24 | 4.8% |
| 60 to 89 Minutes | 44 | 8.8% |
| 90 or more Minutes | 15 | 3.0% |
Commute Time by Sex in Spencer
The most common commute times in Spencer are 30 to 34 minutes (60 commuters, 25.1%) for males and 30 to 34 minutes (62 commuters, 23.8%) for females.
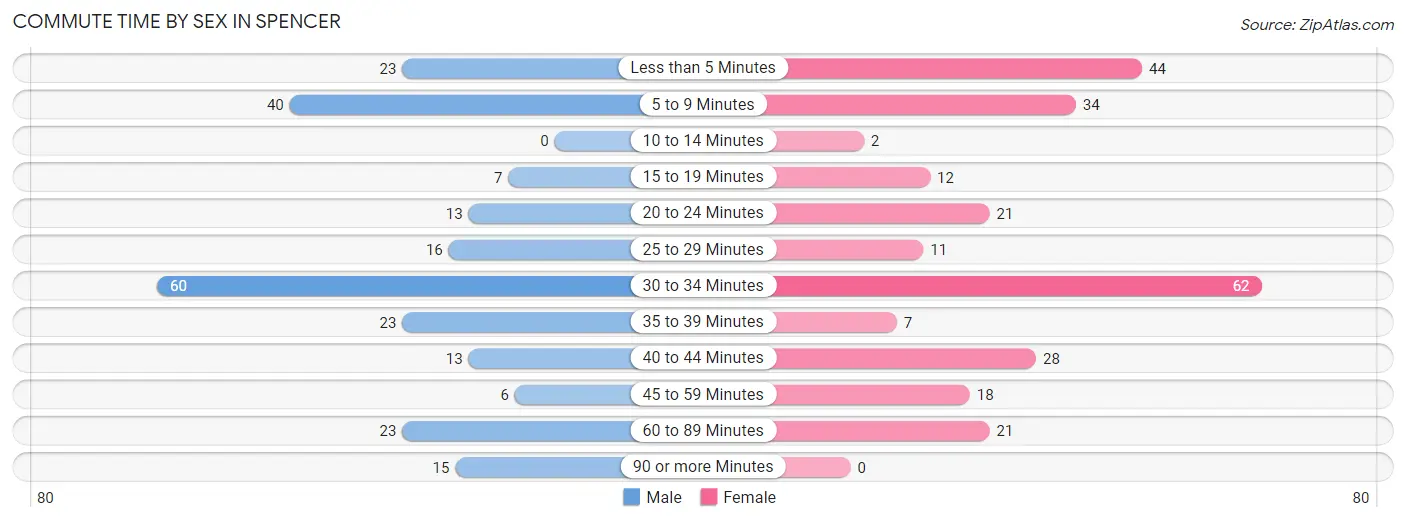
| Commute Time | Male | Female |
| Less than 5 Minutes | 23 (9.6%) | 44 (16.9%) |
| 5 to 9 Minutes | 40 (16.7%) | 34 (13.1%) |
| 10 to 14 Minutes | 0 (0.0%) | 2 (0.8%) |
| 15 to 19 Minutes | 7 (2.9%) | 12 (4.6%) |
| 20 to 24 Minutes | 13 (5.4%) | 21 (8.1%) |
| 25 to 29 Minutes | 16 (6.7%) | 11 (4.2%) |
| 30 to 34 Minutes | 60 (25.1%) | 62 (23.8%) |
| 35 to 39 Minutes | 23 (9.6%) | 7 (2.7%) |
| 40 to 44 Minutes | 13 (5.4%) | 28 (10.8%) |
| 45 to 59 Minutes | 6 (2.5%) | 18 (6.9%) |
| 60 to 89 Minutes | 23 (9.6%) | 21 (8.1%) |
| 90 or more Minutes | 15 (6.3%) | 0 (0.0%) |
Time of Departure to Work by Sex in Spencer
The most frequent times of departure to work in Spencer are 6:00 AM to 6:29 AM (68, 28.4%) for males and 12:00 PM to 3:59 PM (78, 30.0%) for females.
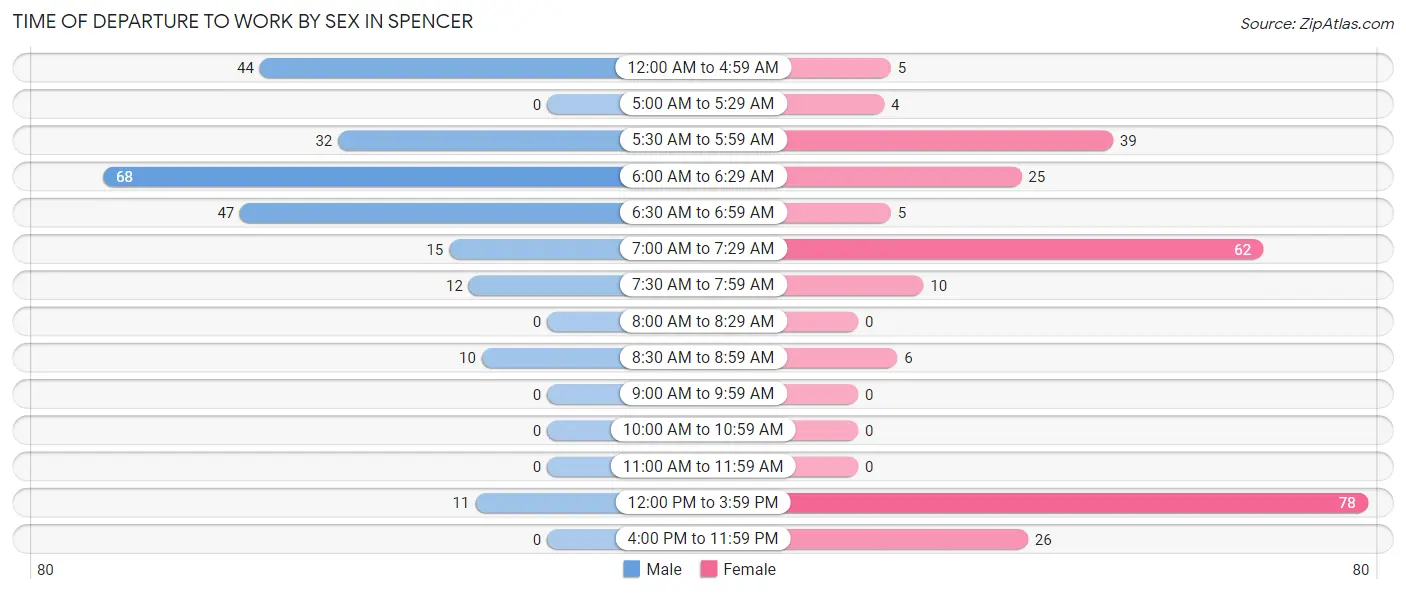
| Time of Departure | Male | Female |
| 12:00 AM to 4:59 AM | 44 (18.4%) | 5 (1.9%) |
| 5:00 AM to 5:29 AM | 0 (0.0%) | 4 (1.5%) |
| 5:30 AM to 5:59 AM | 32 (13.4%) | 39 (15.0%) |
| 6:00 AM to 6:29 AM | 68 (28.4%) | 25 (9.6%) |
| 6:30 AM to 6:59 AM | 47 (19.7%) | 5 (1.9%) |
| 7:00 AM to 7:29 AM | 15 (6.3%) | 62 (23.8%) |
| 7:30 AM to 7:59 AM | 12 (5.0%) | 10 (3.8%) |
| 8:00 AM to 8:29 AM | 0 (0.0%) | 0 (0.0%) |
| 8:30 AM to 8:59 AM | 10 (4.2%) | 6 (2.3%) |
| 9:00 AM to 9:59 AM | 0 (0.0%) | 0 (0.0%) |
| 10:00 AM to 10:59 AM | 0 (0.0%) | 0 (0.0%) |
| 11:00 AM to 11:59 AM | 0 (0.0%) | 0 (0.0%) |
| 12:00 PM to 3:59 PM | 11 (4.6%) | 78 (30.0%) |
| 4:00 PM to 11:59 PM | 0 (0.0%) | 26 (10.0%) |
| Total | 239 (100.0%) | 260 (100.0%) |
Housing Occupancy in Spencer
Occupancy by Ownership in Spencer
Of the total 555 dwellings in Spencer, owner-occupied units account for 357 (64.3%), while renter-occupied units make up 198 (35.7%).
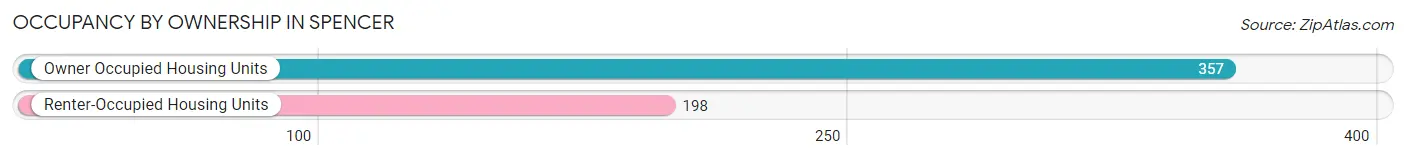
| Occupancy | # Housing Units | % Housing Units |
| Owner Occupied Housing Units | 357 | 64.3% |
| Renter-Occupied Housing Units | 198 | 35.7% |
| Total Occupied Housing Units | 555 | 100.0% |
Occupancy by Household Size in Spencer
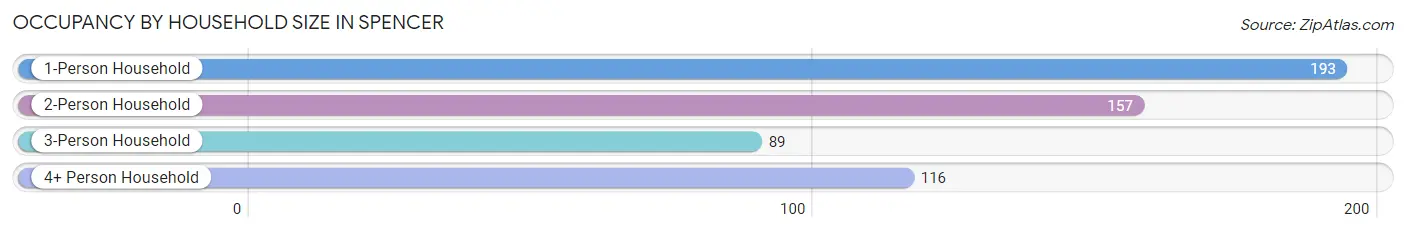
| Household Size | # Housing Units | % Housing Units |
| 1-Person Household | 193 | 34.8% |
| 2-Person Household | 157 | 28.3% |
| 3-Person Household | 89 | 16.0% |
| 4+ Person Household | 116 | 20.9% |
| Total Housing Units | 555 | 100.0% |
Occupancy by Ownership by Household Size in Spencer
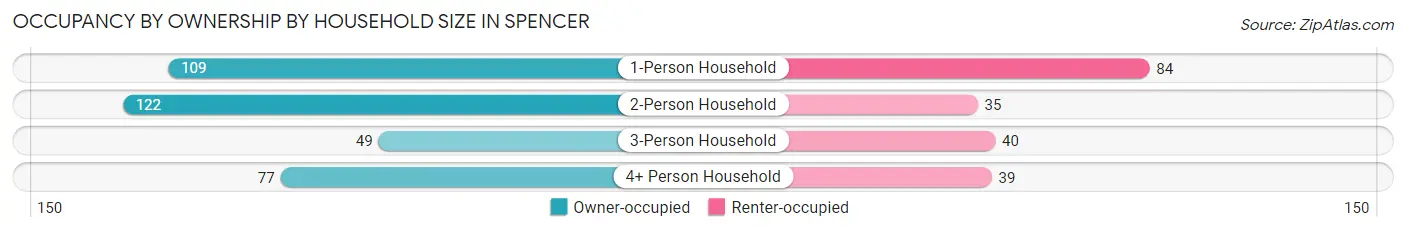
| Household Size | Owner-occupied | Renter-occupied |
| 1-Person Household | 109 (56.5%) | 84 (43.5%) |
| 2-Person Household | 122 (77.7%) | 35 (22.3%) |
| 3-Person Household | 49 (55.1%) | 40 (44.9%) |
| 4+ Person Household | 77 (66.4%) | 39 (33.6%) |
| Total Housing Units | 357 (64.3%) | 198 (35.7%) |
Occupancy by Educational Attainment in Spencer
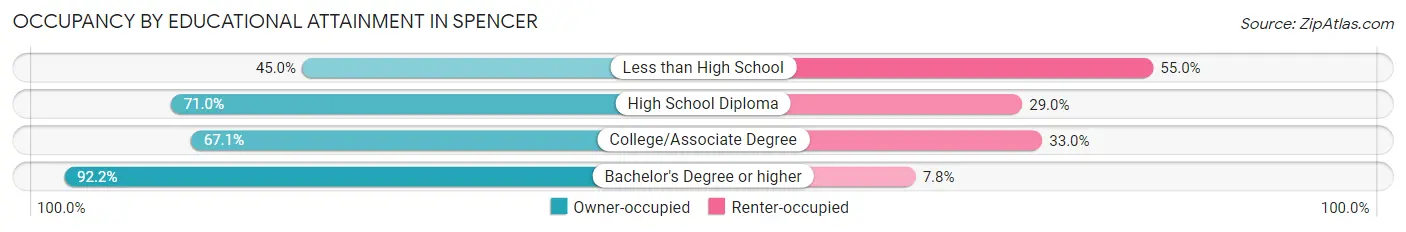
| Household Size | Owner-occupied | Renter-occupied |
| Less than High School | 77 (45.0%) | 94 (55.0%) |
| High School Diploma | 174 (71.0%) | 71 (29.0%) |
| College/Associate Degree | 59 (67.0%) | 29 (33.0%) |
| Bachelor's Degree or higher | 47 (92.2%) | 4 (7.8%) |
Occupancy by Age of Householder in Spencer
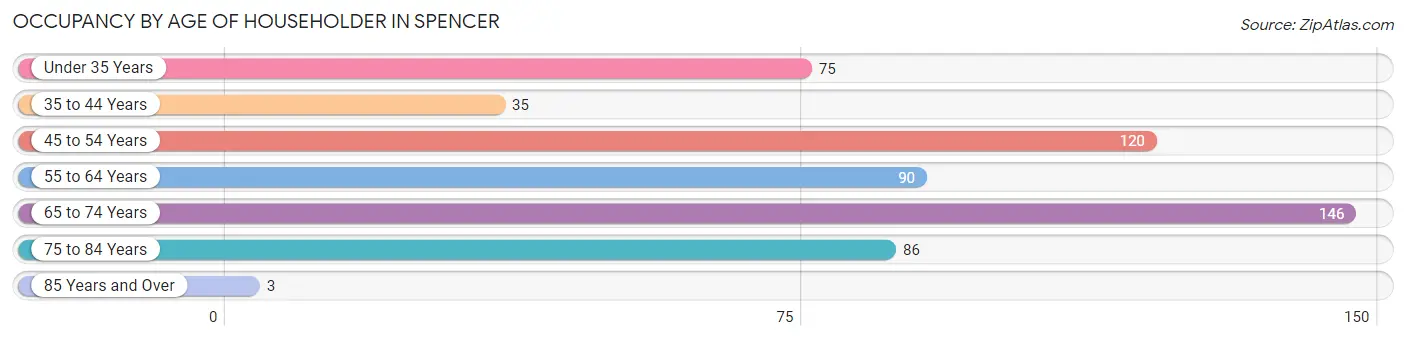
| Age Bracket | # Households | % Households |
| Under 35 Years | 75 | 13.5% |
| 35 to 44 Years | 35 | 6.3% |
| 45 to 54 Years | 120 | 21.6% |
| 55 to 64 Years | 90 | 16.2% |
| 65 to 74 Years | 146 | 26.3% |
| 75 to 84 Years | 86 | 15.5% |
| 85 Years and Over | 3 | 0.5% |
| Total | 555 | 100.0% |
Housing Finances in Spencer
Median Income by Occupancy in Spencer
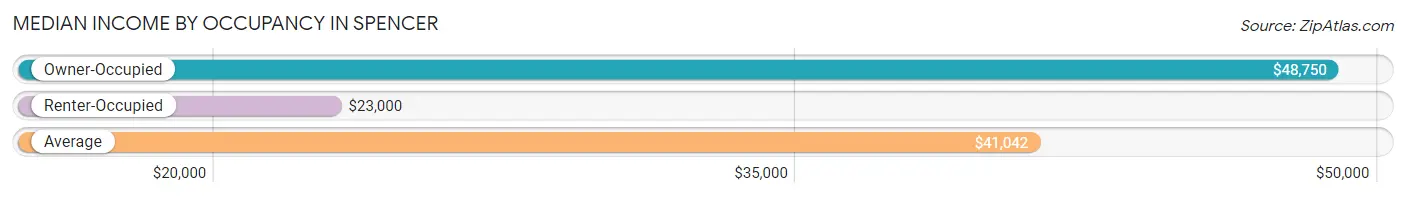
| Occupancy Type | # Households | Median Income |
| Owner-Occupied | 357 (64.3%) | $48,750 |
| Renter-Occupied | 198 (35.7%) | $23,000 |
| Average | 555 (100.0%) | $41,042 |
Occupancy by Householder Income Bracket in Spencer
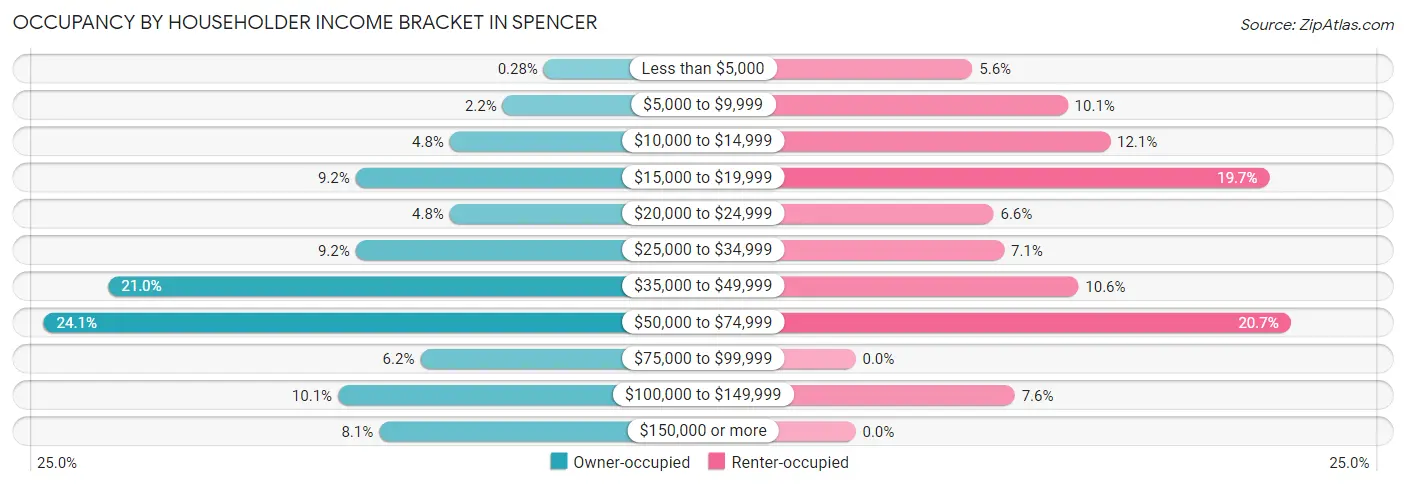
| Income Bracket | Owner-occupied | Renter-occupied |
| Less than $5,000 | 1 (0.3%) | 11 (5.6%) |
| $5,000 to $9,999 | 8 (2.2%) | 20 (10.1%) |
| $10,000 to $14,999 | 17 (4.8%) | 24 (12.1%) |
| $15,000 to $19,999 | 33 (9.2%) | 39 (19.7%) |
| $20,000 to $24,999 | 17 (4.8%) | 13 (6.6%) |
| $25,000 to $34,999 | 33 (9.2%) | 14 (7.1%) |
| $35,000 to $49,999 | 75 (21.0%) | 21 (10.6%) |
| $50,000 to $74,999 | 86 (24.1%) | 41 (20.7%) |
| $75,000 to $99,999 | 22 (6.2%) | 0 (0.0%) |
| $100,000 to $149,999 | 36 (10.1%) | 15 (7.6%) |
| $150,000 or more | 29 (8.1%) | 0 (0.0%) |
| Total | 357 (100.0%) | 198 (100.0%) |
Monthly Housing Cost Tiers in Spencer
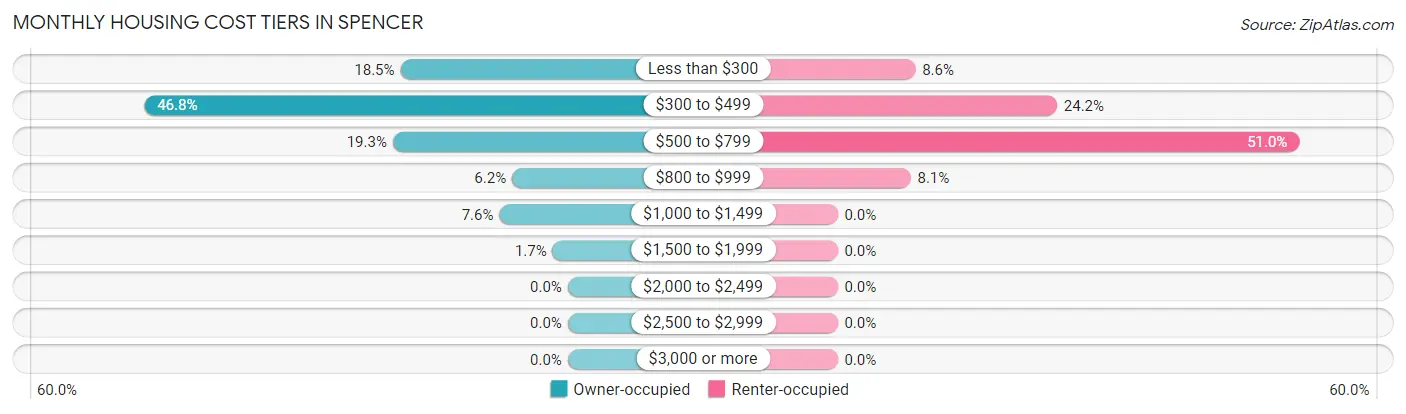
| Monthly Cost | Owner-occupied | Renter-occupied |
| Less than $300 | 66 (18.5%) | 17 (8.6%) |
| $300 to $499 | 167 (46.8%) | 48 (24.2%) |
| $500 to $799 | 69 (19.3%) | 101 (51.0%) |
| $800 to $999 | 22 (6.2%) | 16 (8.1%) |
| $1,000 to $1,499 | 27 (7.6%) | 0 (0.0%) |
| $1,500 to $1,999 | 6 (1.7%) | 0 (0.0%) |
| $2,000 to $2,499 | 0 (0.0%) | 0 (0.0%) |
| $2,500 to $2,999 | 0 (0.0%) | 0 (0.0%) |
| $3,000 or more | 0 (0.0%) | 0 (0.0%) |
| Total | 357 (100.0%) | 198 (100.0%) |
Physical Housing Characteristics in Spencer
Housing Structures in Spencer
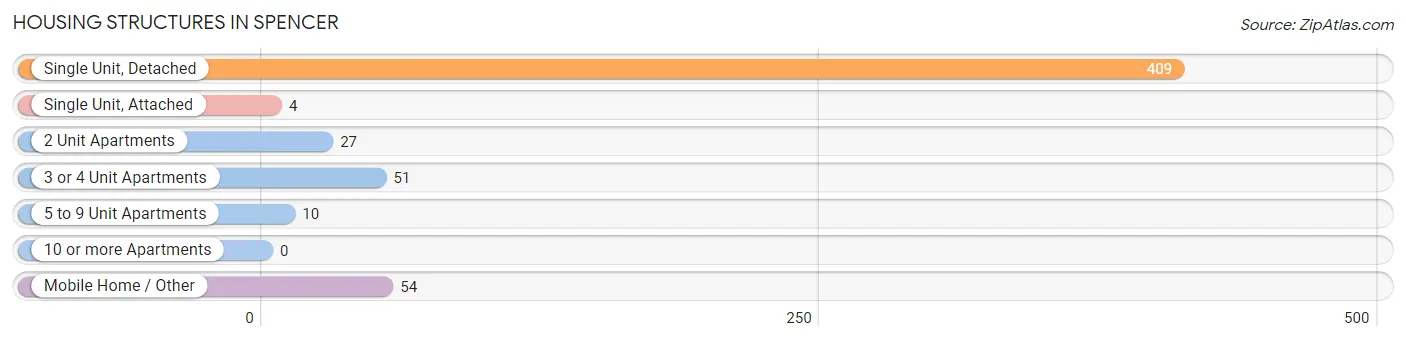
| Structure Type | # Housing Units | % Housing Units |
| Single Unit, Detached | 409 | 73.7% |
| Single Unit, Attached | 4 | 0.7% |
| 2 Unit Apartments | 27 | 4.9% |
| 3 or 4 Unit Apartments | 51 | 9.2% |
| 5 to 9 Unit Apartments | 10 | 1.8% |
| 10 or more Apartments | 0 | 0.0% |
| Mobile Home / Other | 54 | 9.7% |
| Total | 555 | 100.0% |
Housing Structures by Occupancy in Spencer
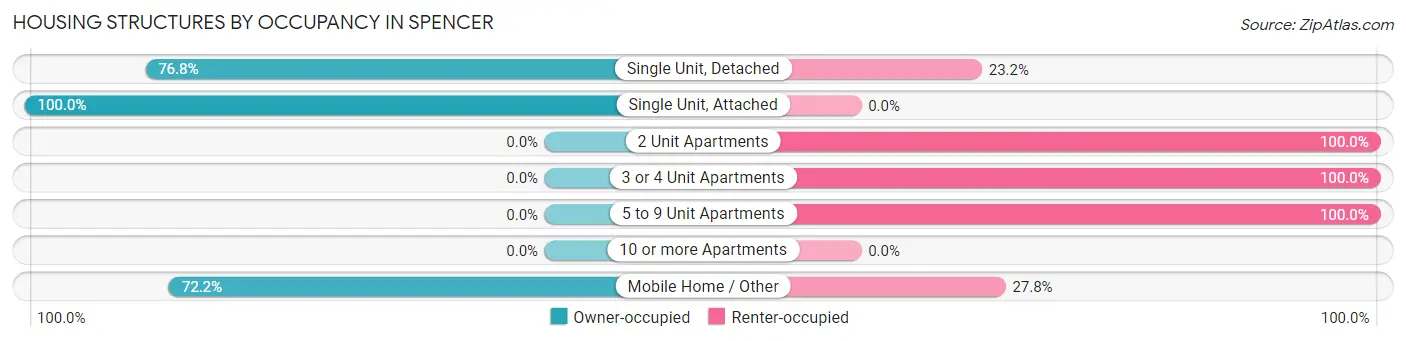
| Structure Type | Owner-occupied | Renter-occupied |
| Single Unit, Detached | 314 (76.8%) | 95 (23.2%) |
| Single Unit, Attached | 4 (100.0%) | 0 (0.0%) |
| 2 Unit Apartments | 0 (0.0%) | 27 (100.0%) |
| 3 or 4 Unit Apartments | 0 (0.0%) | 51 (100.0%) |
| 5 to 9 Unit Apartments | 0 (0.0%) | 10 (100.0%) |
| 10 or more Apartments | 0 (0.0%) | 0 (0.0%) |
| Mobile Home / Other | 39 (72.2%) | 15 (27.8%) |
| Total | 357 (64.3%) | 198 (35.7%) |
Housing Structures by Number of Rooms in Spencer
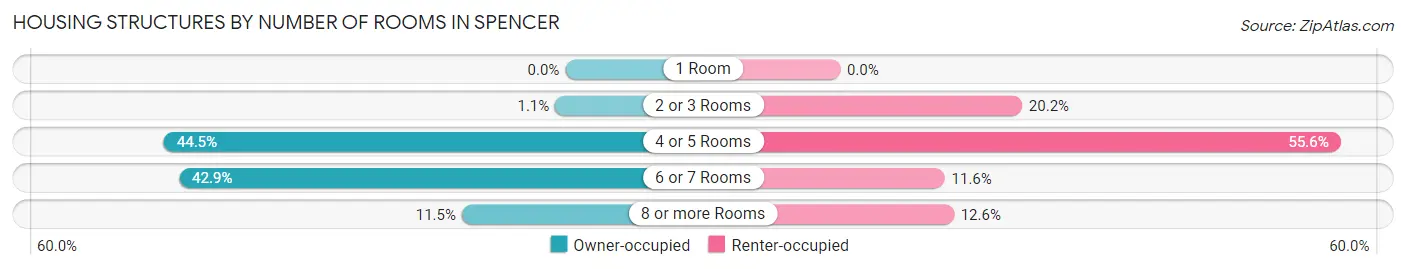
| Number of Rooms | Owner-occupied | Renter-occupied |
| 1 Room | 0 (0.0%) | 0 (0.0%) |
| 2 or 3 Rooms | 4 (1.1%) | 40 (20.2%) |
| 4 or 5 Rooms | 159 (44.5%) | 110 (55.6%) |
| 6 or 7 Rooms | 153 (42.9%) | 23 (11.6%) |
| 8 or more Rooms | 41 (11.5%) | 25 (12.6%) |
| Total | 357 (100.0%) | 198 (100.0%) |
Housing Structure by Heating Type in Spencer
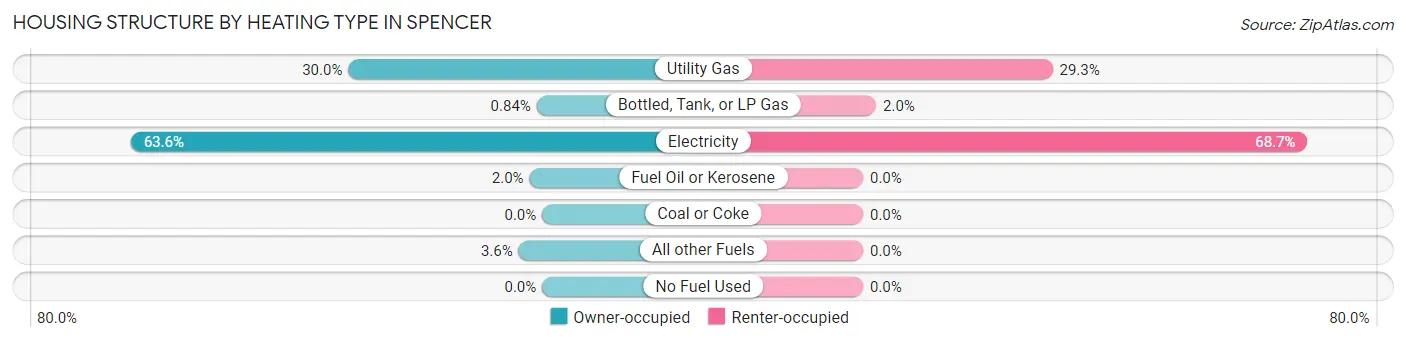
| Heating Type | Owner-occupied | Renter-occupied |
| Utility Gas | 107 (30.0%) | 58 (29.3%) |
| Bottled, Tank, or LP Gas | 3 (0.8%) | 4 (2.0%) |
| Electricity | 227 (63.6%) | 136 (68.7%) |
| Fuel Oil or Kerosene | 7 (2.0%) | 0 (0.0%) |
| Coal or Coke | 0 (0.0%) | 0 (0.0%) |
| All other Fuels | 13 (3.6%) | 0 (0.0%) |
| No Fuel Used | 0 (0.0%) | 0 (0.0%) |
| Total | 357 (100.0%) | 198 (100.0%) |
Household Vehicle Usage in Spencer
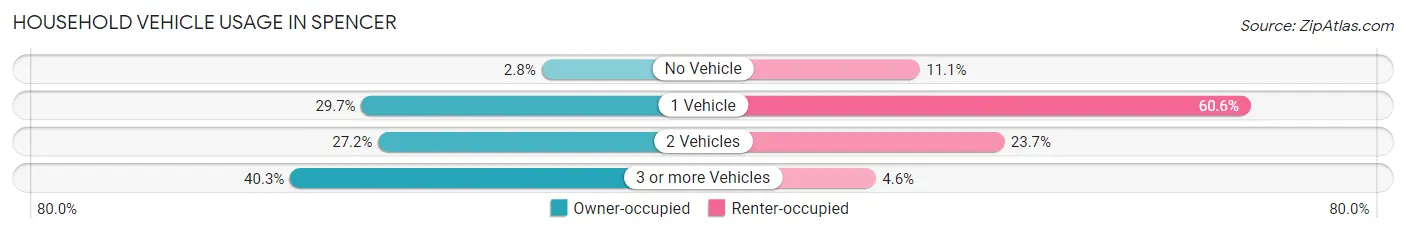
| Vehicles per Household | Owner-occupied | Renter-occupied |
| No Vehicle | 10 (2.8%) | 22 (11.1%) |
| 1 Vehicle | 106 (29.7%) | 120 (60.6%) |
| 2 Vehicles | 97 (27.2%) | 47 (23.7%) |
| 3 or more Vehicles | 144 (40.3%) | 9 (4.5%) |
| Total | 357 (100.0%) | 198 (100.0%) |
Real Estate & Mortgages in Spencer
Real Estate and Mortgage Overview in Spencer
| Characteristic | Without Mortgage | With Mortgage |
| Housing Units | 282 | 75 |
| Median Property Value | $114,300 | $139,800 |
| Median Household Income | $43,667 | $13 |
| Monthly Housing Costs | $373 | $0 |
| Real Estate Taxes | $467 | $0 |
Property Value by Mortgage Status in Spencer
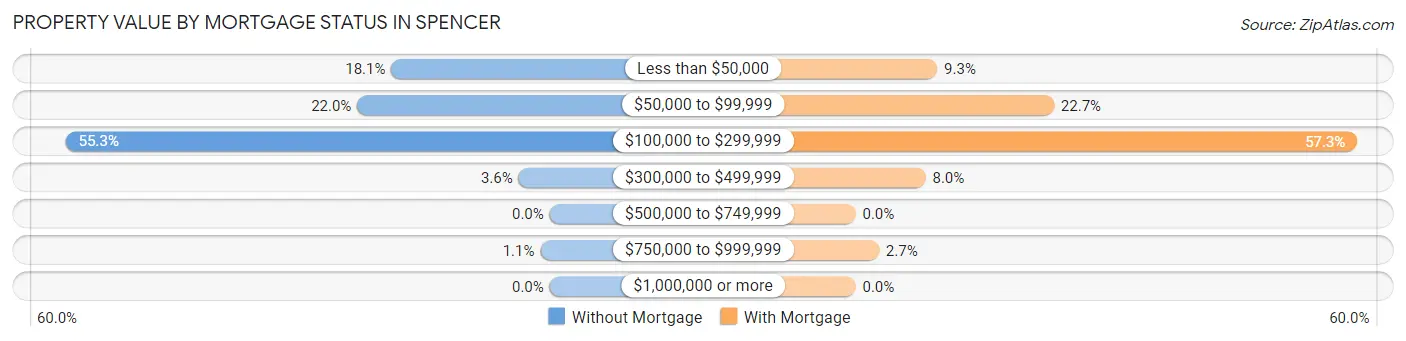
| Property Value | Without Mortgage | With Mortgage |
| Less than $50,000 | 51 (18.1%) | 7 (9.3%) |
| $50,000 to $99,999 | 62 (22.0%) | 17 (22.7%) |
| $100,000 to $299,999 | 156 (55.3%) | 43 (57.3%) |
| $300,000 to $499,999 | 10 (3.5%) | 6 (8.0%) |
| $500,000 to $749,999 | 0 (0.0%) | 0 (0.0%) |
| $750,000 to $999,999 | 3 (1.1%) | 2 (2.7%) |
| $1,000,000 or more | 0 (0.0%) | 0 (0.0%) |
| Total | 282 (100.0%) | 75 (100.0%) |
Household Income by Mortgage Status in Spencer
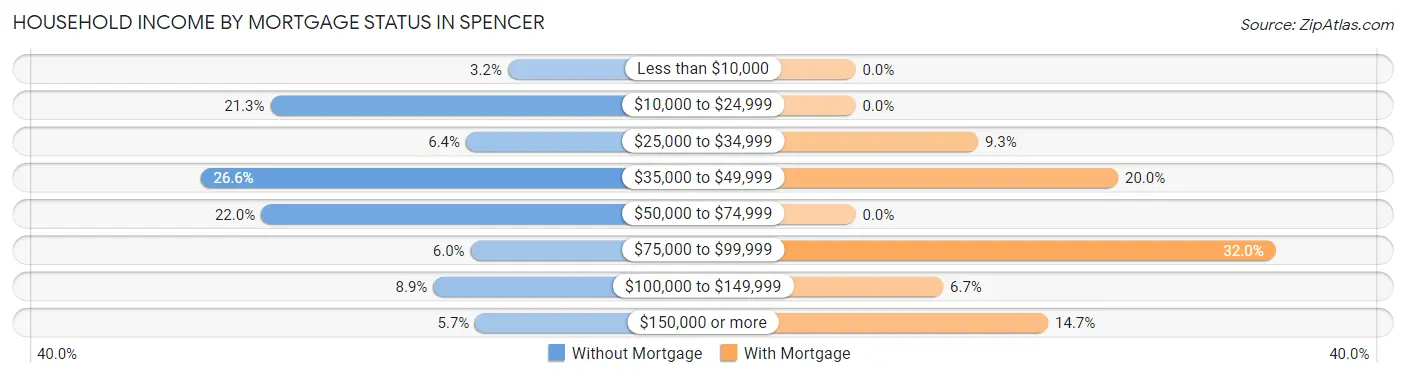
| Household Income | Without Mortgage | With Mortgage |
| Less than $10,000 | 9 (3.2%) | 0 (0.0%) |
| $10,000 to $24,999 | 60 (21.3%) | 0 (0.0%) |
| $25,000 to $34,999 | 18 (6.4%) | 7 (9.3%) |
| $35,000 to $49,999 | 75 (26.6%) | 15 (20.0%) |
| $50,000 to $74,999 | 62 (22.0%) | 0 (0.0%) |
| $75,000 to $99,999 | 17 (6.0%) | 24 (32.0%) |
| $100,000 to $149,999 | 25 (8.9%) | 5 (6.7%) |
| $150,000 or more | 16 (5.7%) | 11 (14.7%) |
| Total | 282 (100.0%) | 75 (100.0%) |
Property Value to Household Income Ratio in Spencer
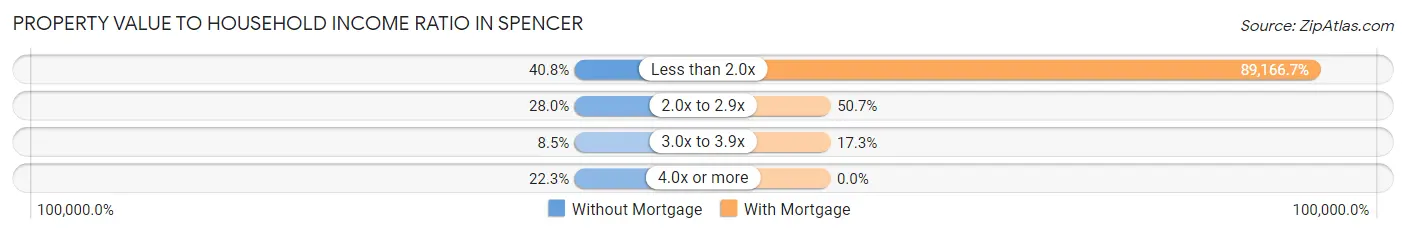
| Value-to-Income Ratio | Without Mortgage | With Mortgage |
| Less than 2.0x | 115 (40.8%) | 66,875 (89,166.7%) |
| 2.0x to 2.9x | 79 (28.0%) | 38 (50.7%) |
| 3.0x to 3.9x | 24 (8.5%) | 13 (17.3%) |
| 4.0x or more | 63 (22.3%) | 0 (0.0%) |
| Total | 282 (100.0%) | 75 (100.0%) |
Real Estate Taxes by Mortgage Status in Spencer
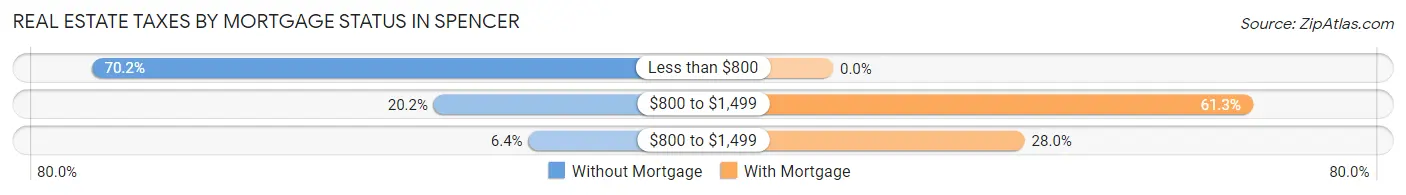
| Property Taxes | Without Mortgage | With Mortgage |
| Less than $800 | 198 (70.2%) | 0 (0.0%) |
| $800 to $1,499 | 57 (20.2%) | 46 (61.3%) |
| $800 to $1,499 | 18 (6.4%) | 21 (28.0%) |
| Total | 282 (100.0%) | 75 (100.0%) |
Health & Disability in Spencer
Health Insurance Coverage by Age in Spencer
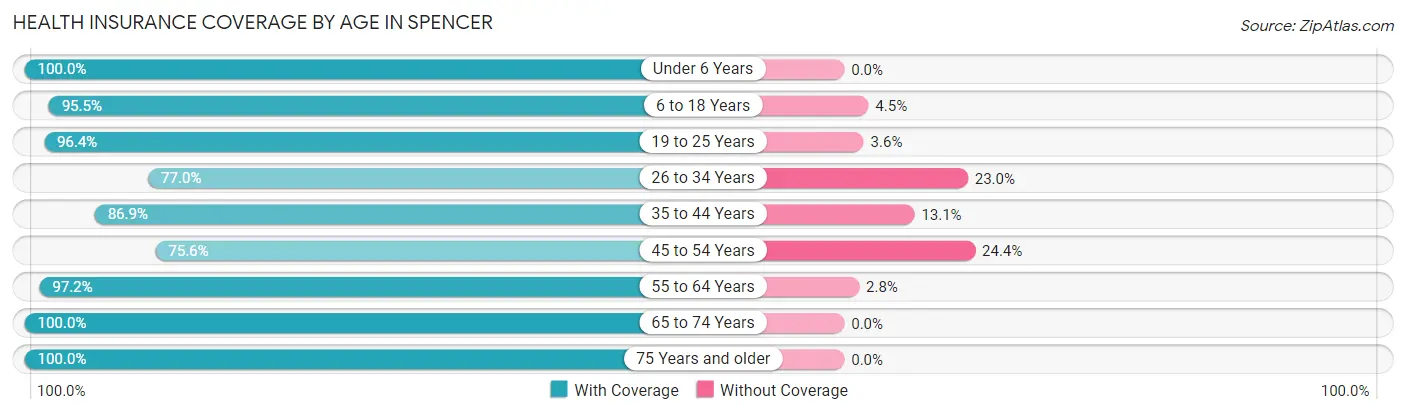
| Age Bracket | With Coverage | Without Coverage |
| Under 6 Years | 54 (100.0%) | 0 (0.0%) |
| 6 to 18 Years | 212 (95.5%) | 10 (4.5%) |
| 19 to 25 Years | 80 (96.4%) | 3 (3.6%) |
| 26 to 34 Years | 127 (77.0%) | 38 (23.0%) |
| 35 to 44 Years | 93 (86.9%) | 14 (13.1%) |
| 45 to 54 Years | 186 (75.6%) | 60 (24.4%) |
| 55 to 64 Years | 176 (97.2%) | 5 (2.8%) |
| 65 to 74 Years | 210 (100.0%) | 0 (0.0%) |
| 75 Years and older | 96 (100.0%) | 0 (0.0%) |
| Total | 1,234 (90.5%) | 130 (9.5%) |
Health Insurance Coverage by Citizenship Status in Spencer
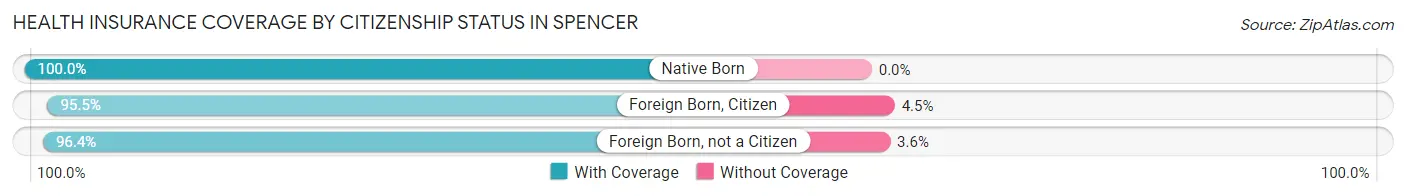
| Citizenship Status | With Coverage | Without Coverage |
| Native Born | 54 (100.0%) | 0 (0.0%) |
| Foreign Born, Citizen | 212 (95.5%) | 10 (4.5%) |
| Foreign Born, not a Citizen | 80 (96.4%) | 3 (3.6%) |
Health Insurance Coverage by Household Income in Spencer
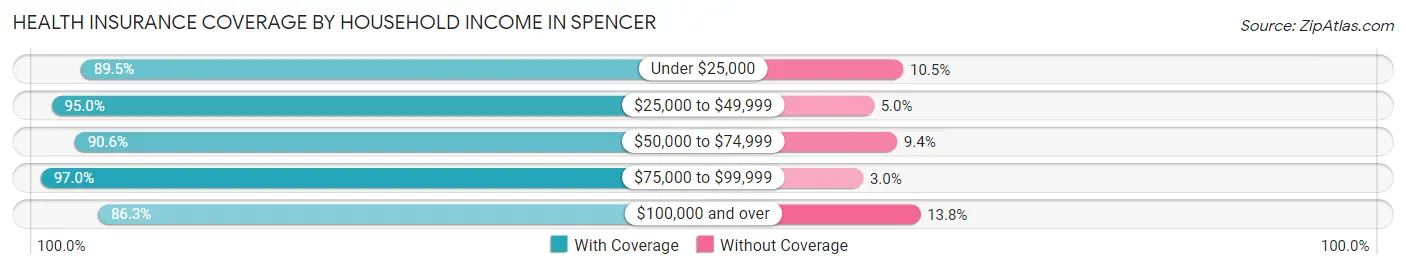
| Household Income | With Coverage | Without Coverage |
| Under $25,000 | 263 (89.5%) | 31 (10.5%) |
| $25,000 to $49,999 | 245 (95.0%) | 13 (5.0%) |
| $50,000 to $74,999 | 386 (90.6%) | 40 (9.4%) |
| $75,000 to $99,999 | 64 (97.0%) | 2 (3.0%) |
| $100,000 and over | 276 (86.3%) | 44 (13.8%) |
Public vs Private Health Insurance Coverage by Age in Spencer
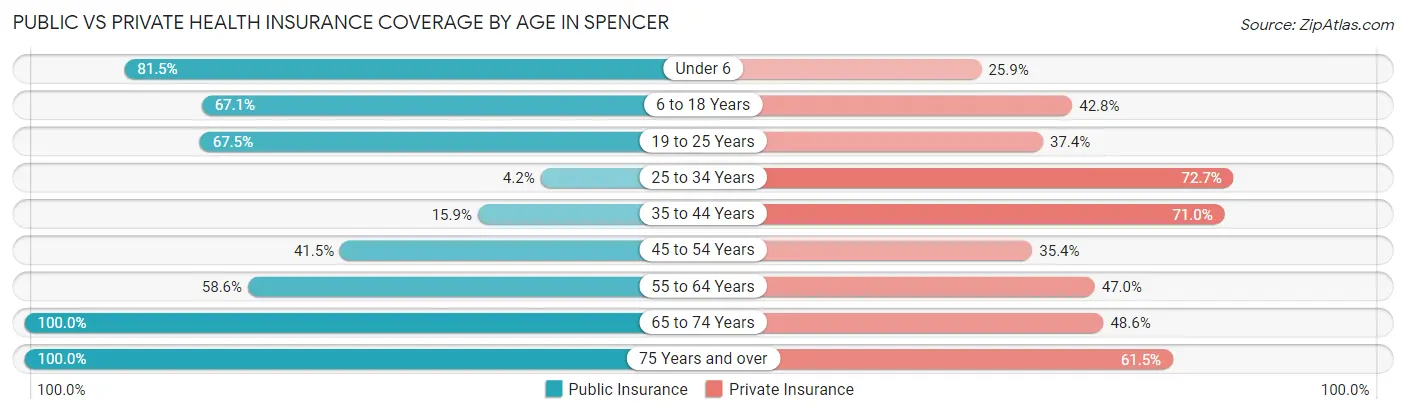
| Age Bracket | Public Insurance | Private Insurance |
| Under 6 | 44 (81.5%) | 14 (25.9%) |
| 6 to 18 Years | 149 (67.1%) | 95 (42.8%) |
| 19 to 25 Years | 56 (67.5%) | 31 (37.3%) |
| 25 to 34 Years | 7 (4.2%) | 120 (72.7%) |
| 35 to 44 Years | 17 (15.9%) | 76 (71.0%) |
| 45 to 54 Years | 102 (41.5%) | 87 (35.4%) |
| 55 to 64 Years | 106 (58.6%) | 85 (47.0%) |
| 65 to 74 Years | 210 (100.0%) | 102 (48.6%) |
| 75 Years and over | 96 (100.0%) | 59 (61.5%) |
| Total | 787 (57.7%) | 669 (49.0%) |
Disability Status by Sex by Age in Spencer
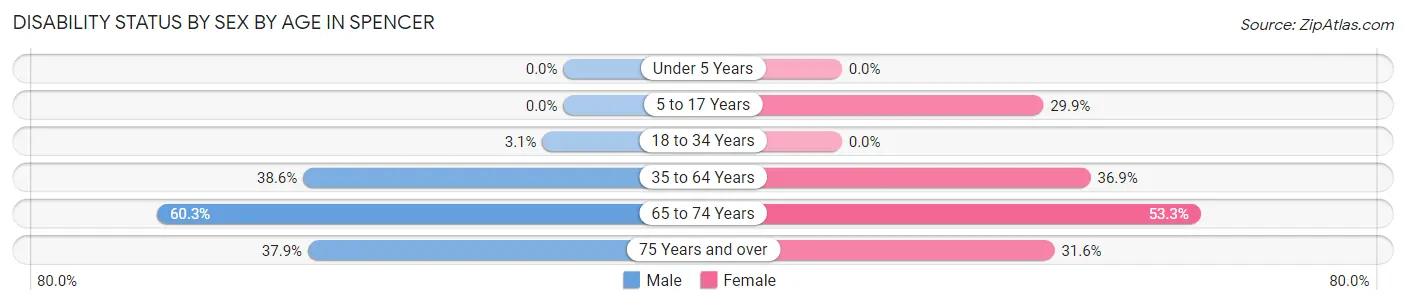
| Age Bracket | Male | Female |
| Under 5 Years | 0 (0.0%) | 0 (0.0%) |
| 5 to 17 Years | 0 (0.0%) | 32 (29.9%) |
| 18 to 34 Years | 4 (3.1%) | 0 (0.0%) |
| 35 to 64 Years | 85 (38.6%) | 116 (36.9%) |
| 65 to 74 Years | 35 (60.3%) | 81 (53.3%) |
| 75 Years and over | 22 (37.9%) | 12 (31.6%) |
Disability Class by Sex by Age in Spencer
Disability Class: Hearing Difficulty
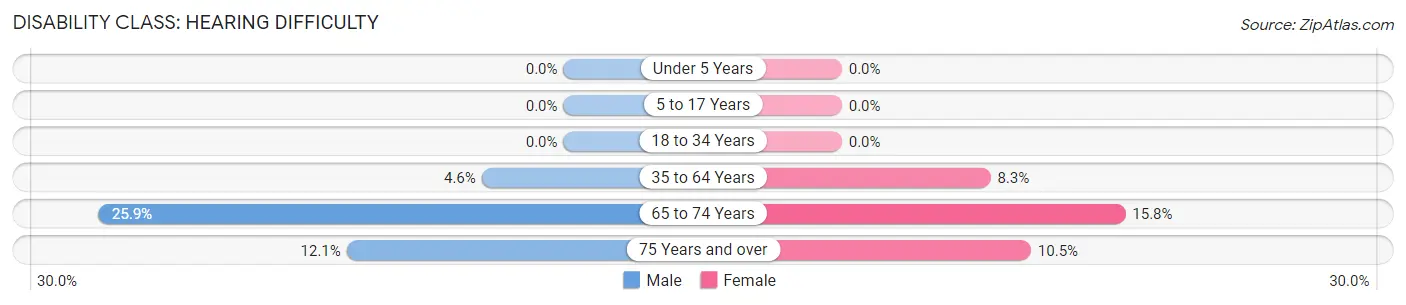
| Age Bracket | Male | Female |
| Under 5 Years | 0 (0.0%) | 0 (0.0%) |
| 5 to 17 Years | 0 (0.0%) | 0 (0.0%) |
| 18 to 34 Years | 0 (0.0%) | 0 (0.0%) |
| 35 to 64 Years | 10 (4.5%) | 26 (8.3%) |
| 65 to 74 Years | 15 (25.9%) | 24 (15.8%) |
| 75 Years and over | 7 (12.1%) | 4 (10.5%) |
Disability Class: Vision Difficulty
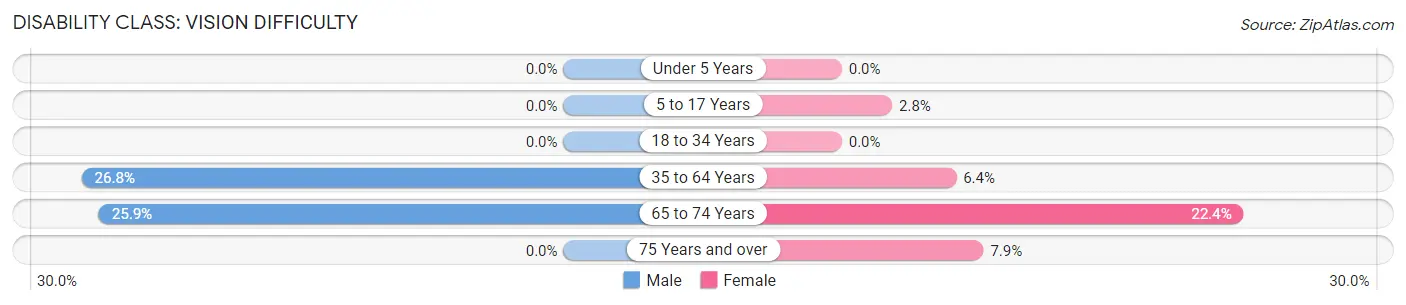
| Age Bracket | Male | Female |
| Under 5 Years | 0 (0.0%) | 0 (0.0%) |
| 5 to 17 Years | 0 (0.0%) | 3 (2.8%) |
| 18 to 34 Years | 0 (0.0%) | 0 (0.0%) |
| 35 to 64 Years | 59 (26.8%) | 20 (6.4%) |
| 65 to 74 Years | 15 (25.9%) | 34 (22.4%) |
| 75 Years and over | 0 (0.0%) | 3 (7.9%) |
Disability Class: Cognitive Difficulty
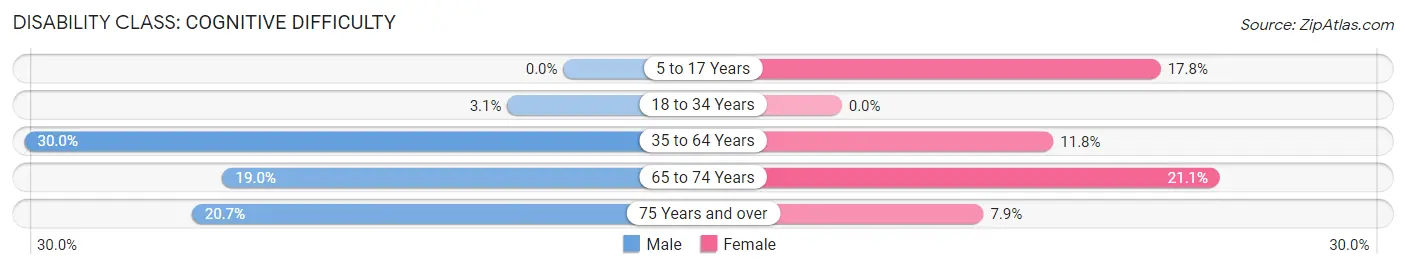
| Age Bracket | Male | Female |
| 5 to 17 Years | 0 (0.0%) | 19 (17.8%) |
| 18 to 34 Years | 4 (3.1%) | 0 (0.0%) |
| 35 to 64 Years | 66 (30.0%) | 37 (11.8%) |
| 65 to 74 Years | 11 (19.0%) | 32 (21.0%) |
| 75 Years and over | 12 (20.7%) | 3 (7.9%) |
Disability Class: Ambulatory Difficulty
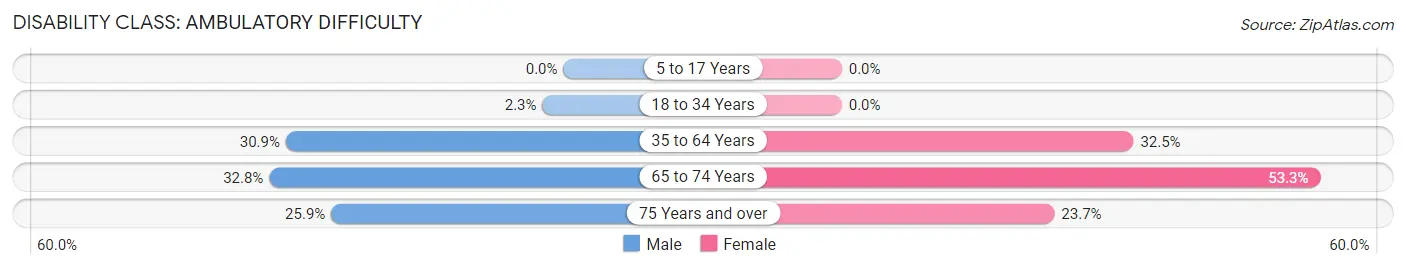
| Age Bracket | Male | Female |
| 5 to 17 Years | 0 (0.0%) | 0 (0.0%) |
| 18 to 34 Years | 3 (2.3%) | 0 (0.0%) |
| 35 to 64 Years | 68 (30.9%) | 102 (32.5%) |
| 65 to 74 Years | 19 (32.8%) | 81 (53.3%) |
| 75 Years and over | 15 (25.9%) | 9 (23.7%) |
Disability Class: Self-Care Difficulty
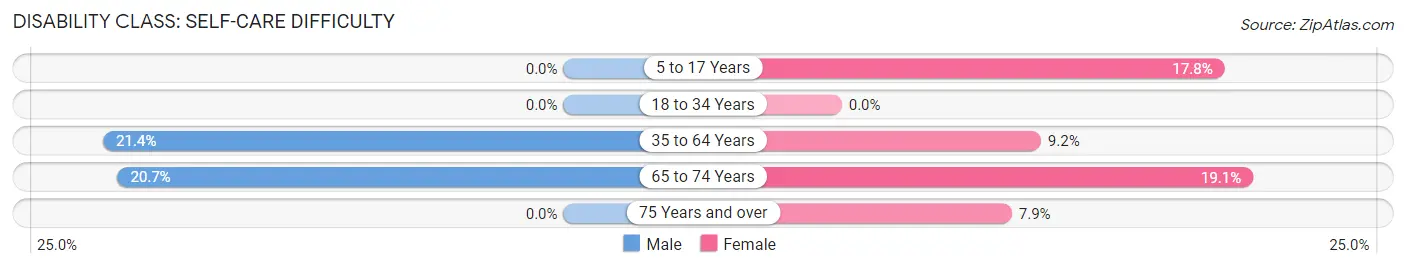
| Age Bracket | Male | Female |
| 5 to 17 Years | 0 (0.0%) | 19 (17.8%) |
| 18 to 34 Years | 0 (0.0%) | 0 (0.0%) |
| 35 to 64 Years | 47 (21.4%) | 29 (9.2%) |
| 65 to 74 Years | 12 (20.7%) | 29 (19.1%) |
| 75 Years and over | 0 (0.0%) | 3 (7.9%) |
Technology Access in Spencer
Computing Device Access in Spencer
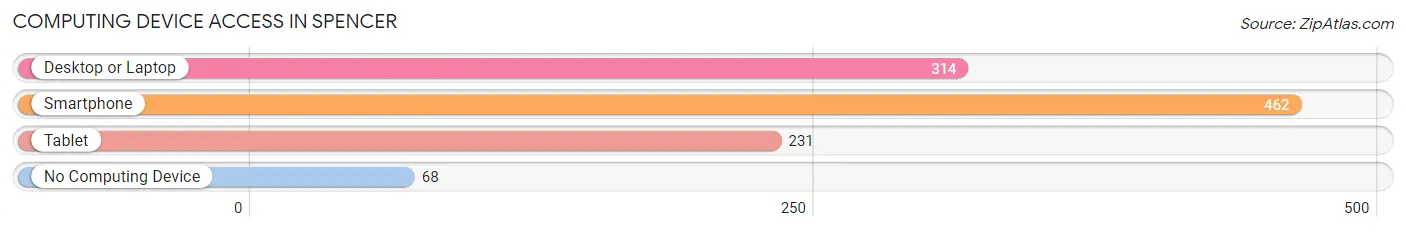
| Device Type | # Households | % Households |
| Desktop or Laptop | 314 | 56.6% |
| Smartphone | 462 | 83.2% |
| Tablet | 231 | 41.6% |
| No Computing Device | 68 | 12.2% |
| Total | 555 | 100.0% |
Internet Access in Spencer
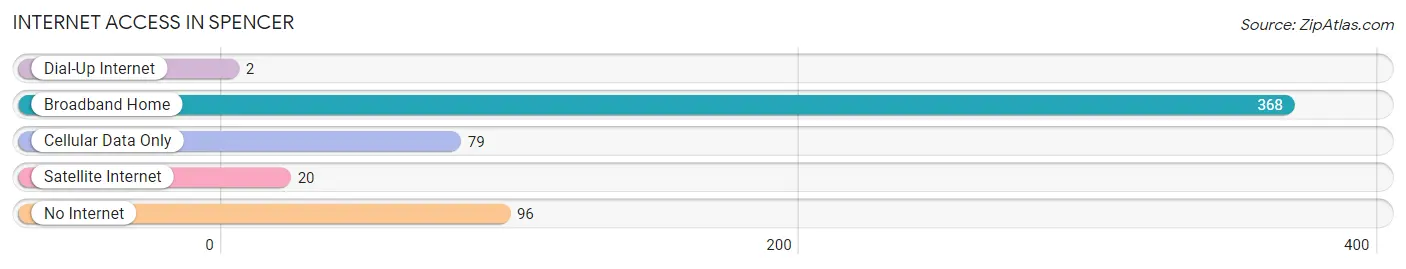
| Internet Type | # Households | % Households |
| Dial-Up Internet | 2 | 0.4% |
| Broadband Home | 368 | 66.3% |
| Cellular Data Only | 79 | 14.2% |
| Satellite Internet | 20 | 3.6% |
| No Internet | 96 | 17.3% |
| Total | 555 | 100.0% |
Spencer Summary
Spencer is a small town located in Van Buren County, Tennessee. It is situated in the foothills of the Cumberland Mountains, approximately 30 miles east of Nashville. The town has a population of approximately 1,000 people and is known for its rural charm and friendly atmosphere.
History
Spencer was founded in 1820 by a group of settlers from North Carolina. The town was named after Spencer County, Kentucky, which was the home of many of the settlers. The town was originally a farming community, but in the late 19th century, the railroad came to town and the economy shifted to timber and coal mining. The town was also home to a number of small businesses, including a sawmill, a gristmill, and a general store.
In the early 20th century, the town experienced a period of growth and prosperity. The population increased from 500 in 1900 to 1,000 in 1930. During this time, the town was home to a number of businesses, including a bank, a hotel, a movie theater, and a number of stores.
Geography
Spencer is located in the foothills of the Cumberland Mountains in Van Buren County, Tennessee. The town is situated at an elevation of 1,000 feet and is surrounded by rolling hills and forests. The town is located approximately 30 miles east of Nashville and is accessible via State Route 111.
Economy
Spencer’s economy is largely based on agriculture and tourism. The town is home to a number of farms, which produce a variety of crops, including corn, soybeans, and hay. The town is also home to a number of tourist attractions, including the Cumberland Mountain State Park, which offers camping, hiking, and fishing opportunities.
In addition to agriculture and tourism, Spencer is home to a number of small businesses, including a grocery store, a hardware store, and a number of restaurants. The town is also home to a number of manufacturing companies, which produce a variety of products, including furniture, clothing, and automotive parts.
Demographics
As of the 2010 census, Spencer had a population of 1,000 people. The racial makeup of the town was 97.2% White, 0.7% African American, 0.2% Native American, 0.2% Asian, 0.2% from other races, and 1.7% from two or more races. Hispanic or Latino of any race were 0.7% of the population.
The median income for a household in Spencer was $30,000, and the median income for a family was $35,000. The per capita income for the town was $15,000. About 15.7% of families and 18.7% of the population were below the poverty line, including 25.7% of those under age 18 and 10.7% of those age 65 or over.
Common Questions
What is Per Capita Income in Spencer?
Per Capita income in Spencer is $21,210.
What is the Median Family Income in Spencer?
Median Family Income in Spencer is $56,875.
What is the Median Household income in Spencer?
Median Household Income in Spencer is $41,042.
What is Income or Wage Gap in Spencer?
Income or Wage Gap in Spencer is 44.8%.
Women in Spencer earn 55.2 cents for every dollar earned by a man.
What is Inequality or Gini Index in Spencer?
Inequality or Gini Index in Spencer is 0.42.
What is the Total Population of Spencer?
Total Population of Spencer is 1,469.
What is the Total Male Population of Spencer?
Total Male Population of Spencer is 647.
What is the Total Female Population of Spencer?
Total Female Population of Spencer is 822.
What is the Ratio of Males per 100 Females in Spencer?
There are 78.71 Males per 100 Females in Spencer.
What is the Ratio of Females per 100 Males in Spencer?
There are 127.05 Females per 100 Males in Spencer.
What is the Median Population Age in Spencer?
Median Population Age in Spencer is 47.7 Years.
What is the Average Family Size in Spencer
Average Family Size in Spencer is 3.2 People.
What is the Average Household Size in Spencer
Average Household Size in Spencer is 2.5 People.
How Large is the Labor Force in Spencer?
There are 534 People in the Labor Forcein in Spencer.
What is the Percentage of People in the Labor Force in Spencer?
42.5% of People are in the Labor Force in Spencer.
What is the Unemployment Rate in Spencer?
Unemployment Rate in Spencer is 0.2%.