Hana, HI Map & Demographics
Hana Map
Hana Overview
$31,013
PER CAPITA INCOME
$72,083
AVG FAMILY INCOME
$51,188
AVG HOUSEHOLD INCOME
8.0%
WAGE / INCOME GAP [ % ]
92.0¢/ $1
WAGE / INCOME GAP [ $ ]
0.41
INEQUALITY / GINI INDEX
731
TOTAL POPULATION
326
MALE POPULATION
405
FEMALE POPULATION
80.49
MALES / 100 FEMALES
124.23
FEMALES / 100 MALES
51.5
MEDIAN AGE
3.5
AVG FAMILY SIZE
2.4
AVG HOUSEHOLD SIZE
406
LABOR FORCE [ PEOPLE ]
62.8%
PERCENT IN LABOR FORCE
17.0%
UNEMPLOYMENT RATE
Hana Zip Codes
Hana Area Codes
Income in Hana
Income Overview in Hana
Per Capita Income in Hana is $31,013, while median incomes of families and households are $72,083 and $51,188 respectively.
| Characteristic | Number | Measure |
| Per Capita Income | 731 | $31,013 |
| Median Family Income | 123 | $72,083 |
| Mean Family Income | 123 | $96,043 |
| Median Household Income | 311 | $51,188 |
| Mean Household Income | 311 | $71,913 |
| Income Deficit | 123 | $0 |
| Wage / Income Gap (%) | 731 | 7.98% |
| Wage / Income Gap ($) | 731 | 92.02¢ per $1 |
| Gini / Inequality Index | 731 | 0.41 |
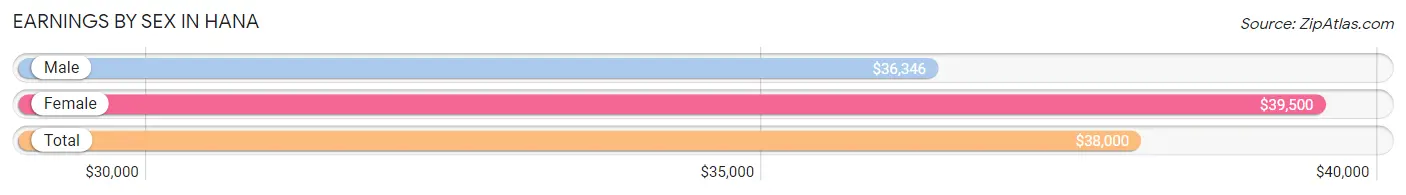
Earnings by Sex in Hana
Average Earnings in Hana are $38,000, $36,346 for men and $39,500 for women, a difference of 8.0%.
| Sex | Number | Average Earnings |
| Male | 146 (35.1%) | $36,346 |
| Female | 270 (64.9%) | $39,500 |
| Total | 416 (100.0%) | $38,000 |
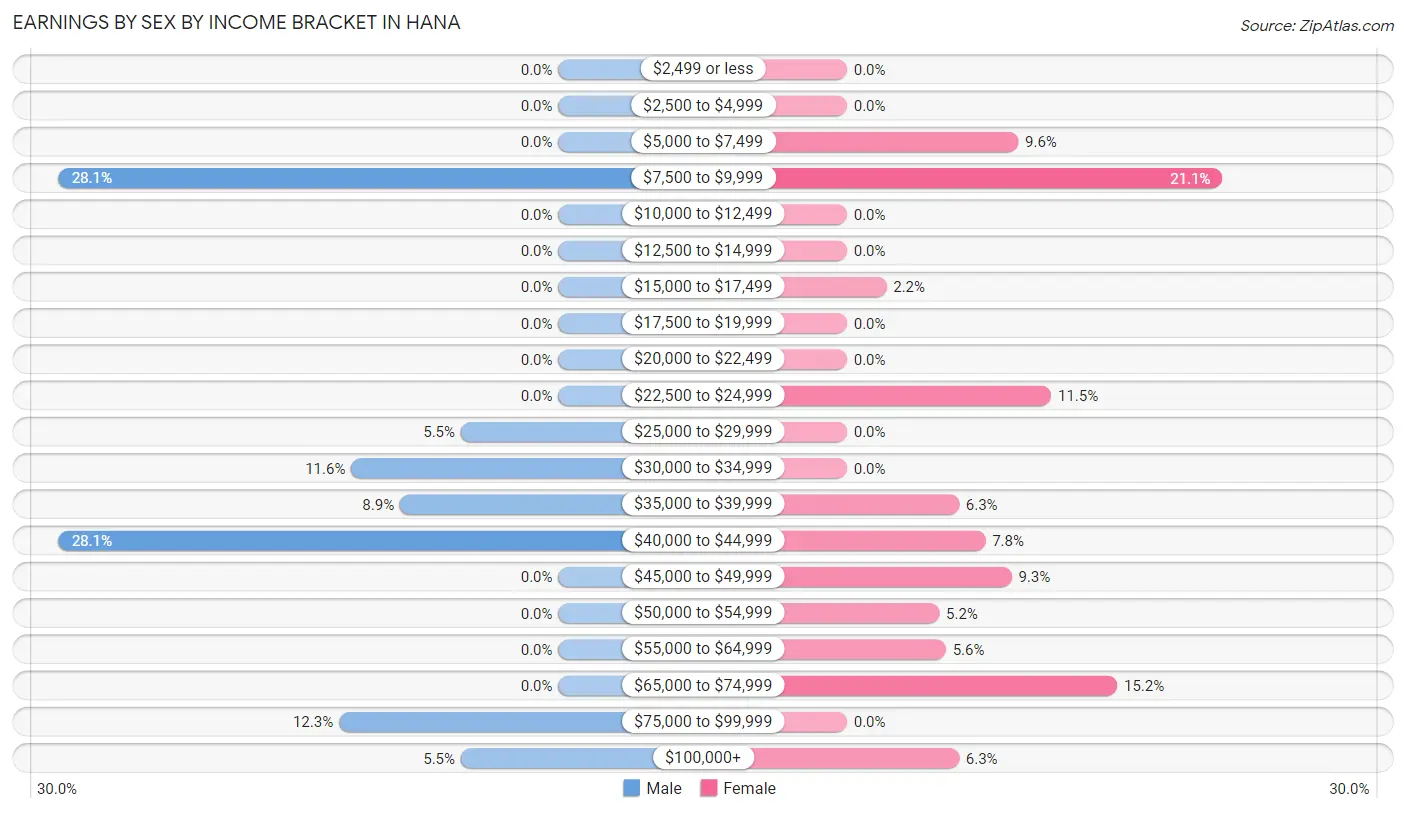
Earnings by Sex by Income Bracket in Hana
The most common earnings brackets in Hana are $7,500 to $9,999 for men (41 | 28.1%) and $7,500 to $9,999 for women (57 | 21.1%).
| Income | Male | Female |
| $2,499 or less | 0 (0.0%) | 0 (0.0%) |
| $2,500 to $4,999 | 0 (0.0%) | 0 (0.0%) |
| $5,000 to $7,499 | 0 (0.0%) | 26 (9.6%) |
| $7,500 to $9,999 | 41 (28.1%) | 57 (21.1%) |
| $10,000 to $12,499 | 0 (0.0%) | 0 (0.0%) |
| $12,500 to $14,999 | 0 (0.0%) | 0 (0.0%) |
| $15,000 to $17,499 | 0 (0.0%) | 6 (2.2%) |
| $17,500 to $19,999 | 0 (0.0%) | 0 (0.0%) |
| $20,000 to $22,499 | 0 (0.0%) | 0 (0.0%) |
| $22,500 to $24,999 | 0 (0.0%) | 31 (11.5%) |
| $25,000 to $29,999 | 8 (5.5%) | 0 (0.0%) |
| $30,000 to $34,999 | 17 (11.6%) | 0 (0.0%) |
| $35,000 to $39,999 | 13 (8.9%) | 17 (6.3%) |
| $40,000 to $44,999 | 41 (28.1%) | 21 (7.8%) |
| $45,000 to $49,999 | 0 (0.0%) | 25 (9.3%) |
| $50,000 to $54,999 | 0 (0.0%) | 14 (5.2%) |
| $55,000 to $64,999 | 0 (0.0%) | 15 (5.6%) |
| $65,000 to $74,999 | 0 (0.0%) | 41 (15.2%) |
| $75,000 to $99,999 | 18 (12.3%) | 0 (0.0%) |
| $100,000+ | 8 (5.5%) | 17 (6.3%) |
| Total | 146 (100.0%) | 270 (100.0%) |
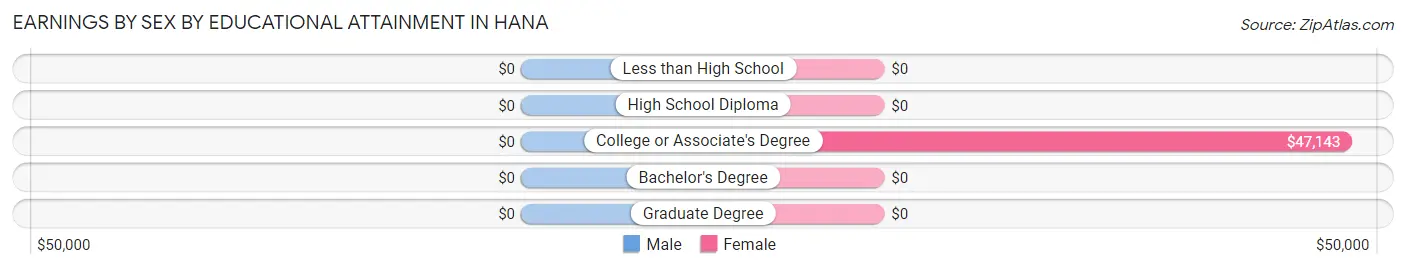
Earnings by Sex by Educational Attainment in Hana
| Educational Attainment | Male Income | Female Income |
| Less than High School | - | - |
| High School Diploma | - | - |
| College or Associate's Degree | - | - |
| Bachelor's Degree | - | - |
| Graduate Degree | - | - |
| Total | $40,038 | $41,607 |
Family Income in Hana
Family Income Brackets in Hana
According to the Hana family income data, there are 35 families falling into the $50,000 to $74,999 income range, which is the most common income bracket and makes up 28.5% of all families.
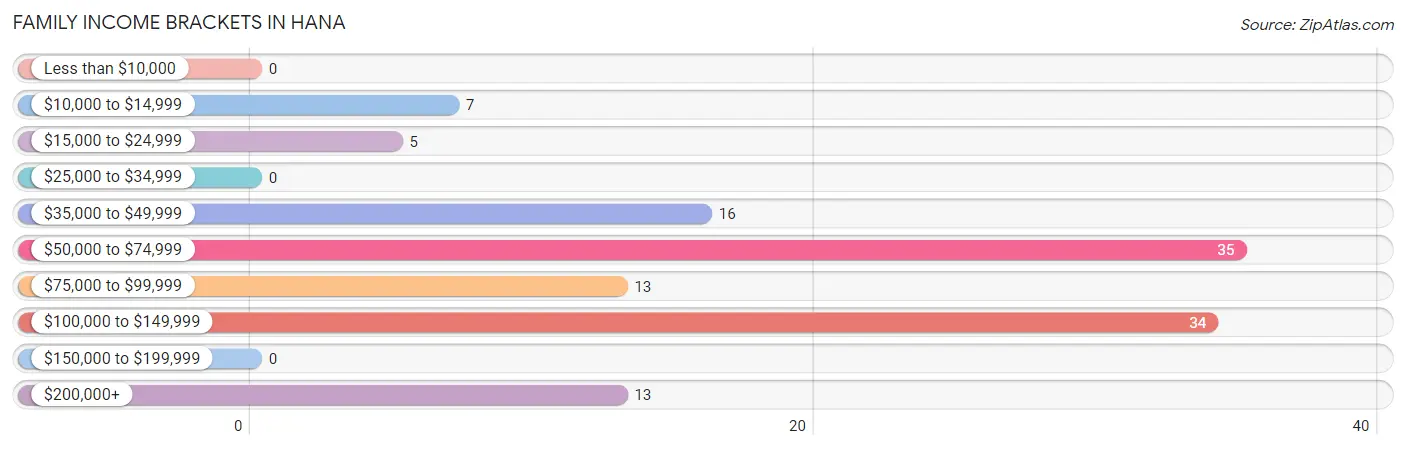
| Income Bracket | # Families | % Families |
| Less than $10,000 | 0 | 0.0% |
| $10,000 to $14,999 | 7 | 5.7% |
| $15,000 to $24,999 | 5 | 4.1% |
| $25,000 to $34,999 | 0 | 0.0% |
| $35,000 to $49,999 | 16 | 13.0% |
| $50,000 to $74,999 | 35 | 28.5% |
| $75,000 to $99,999 | 13 | 10.6% |
| $100,000 to $149,999 | 34 | 27.6% |
| $150,000 to $199,999 | 0 | 0.0% |
| $200,000+ | 13 | 10.6% |
Family Income by Famaliy Size in Hana
4-person families (19 | 15.4%) account for the highest median family income in Hana with $119,107 per family, while 2-person families (64 | 52.0%) have the highest median income of $30,000 per family member.
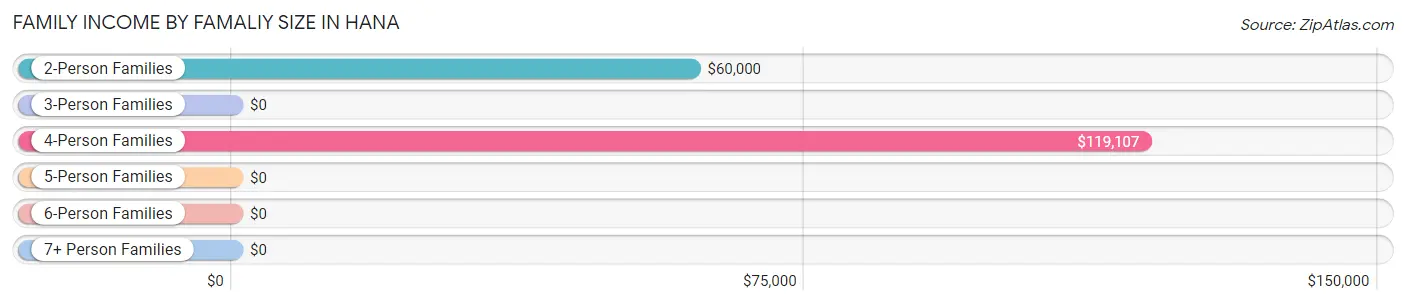
| Income Bracket | # Families | Median Income |
| 2-Person Families | 64 (52.0%) | $60,000 |
| 3-Person Families | 9 (7.3%) | $0 |
| 4-Person Families | 19 (15.4%) | $119,107 |
| 5-Person Families | 15 (12.2%) | $0 |
| 6-Person Families | 16 (13.0%) | $0 |
| 7+ Person Families | 0 (0.0%) | $0 |
| Total | 123 (100.0%) | $72,083 |
Family Income by Number of Earners in Hana
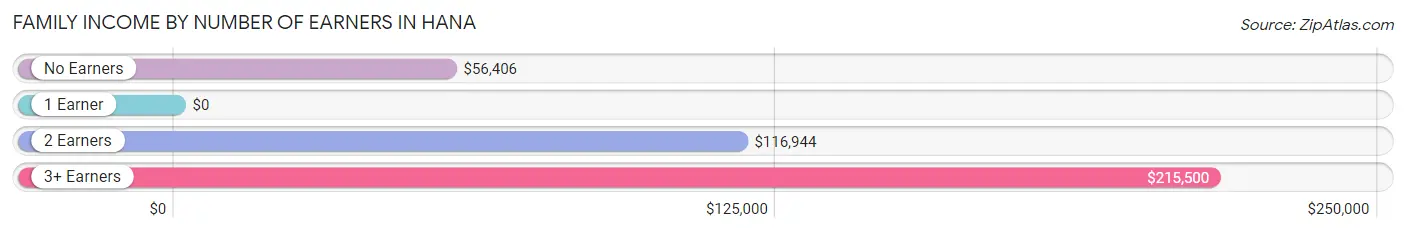
| Number of Earners | # Families | Median Income |
| No Earners | 34 (27.6%) | $56,406 |
| 1 Earner | 33 (26.8%) | $0 |
| 2 Earners | 32 (26.0%) | $116,944 |
| 3+ Earners | 24 (19.5%) | $215,500 |
| Total | 123 (100.0%) | $72,083 |
Household Income in Hana
Household Income Brackets in Hana
With 82 households falling in the category, the $35,000 to $49,999 income range is the most frequent in Hana, accounting for 26.4% of all households.
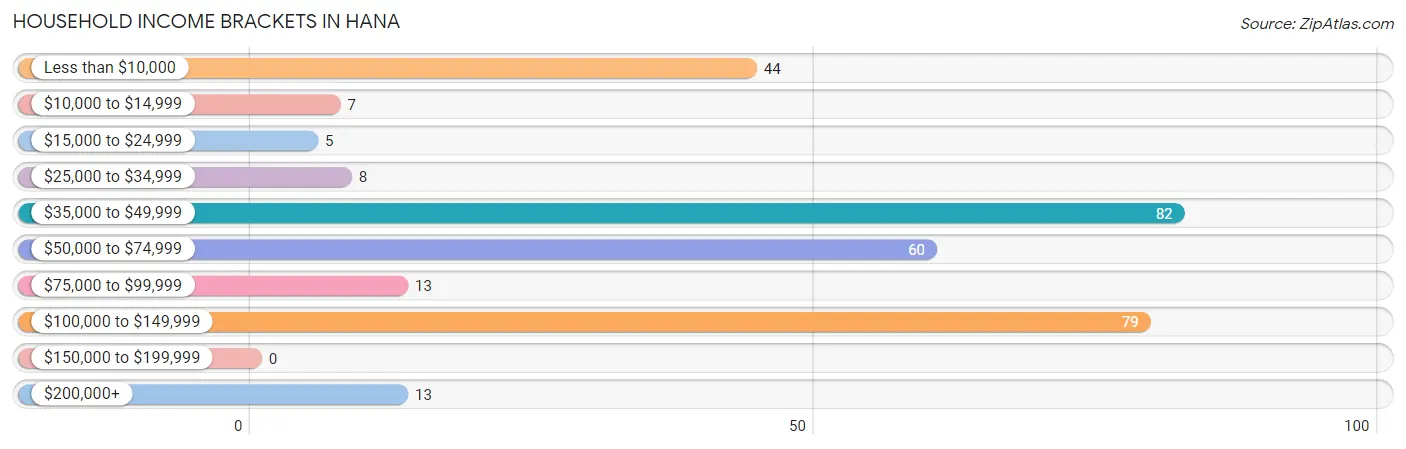
| Income Bracket | # Households | % Households |
| Less than $10,000 | 44 | 14.1% |
| $10,000 to $14,999 | 7 | 2.3% |
| $15,000 to $24,999 | 5 | 1.6% |
| $25,000 to $34,999 | 8 | 2.6% |
| $35,000 to $49,999 | 82 | 26.4% |
| $50,000 to $74,999 | 60 | 19.3% |
| $75,000 to $99,999 | 13 | 4.2% |
| $100,000 to $149,999 | 79 | 25.4% |
| $150,000 to $199,999 | 0 | 0.0% |
| $200,000+ | 13 | 4.2% |
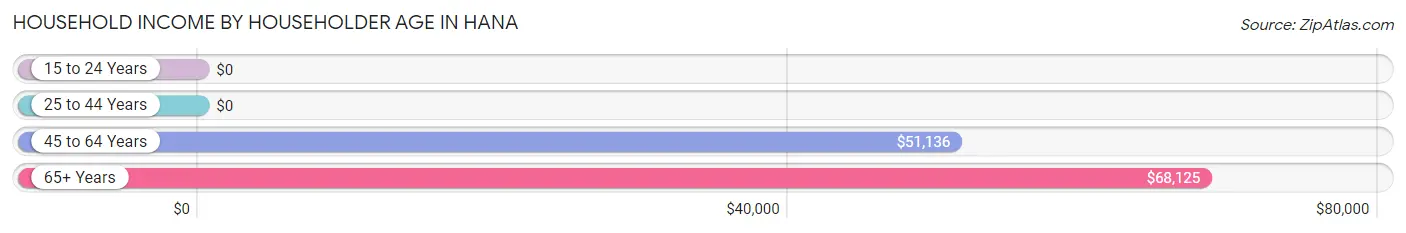
Household Income by Householder Age in Hana
The median household income in Hana is $51,188, with the highest median household income of $68,125 found in the 65+ years age bracket for the primary householder. A total of 131 households (42.1%) fall into this category.
| Income Bracket | # Households | Median Income |
| 15 to 24 Years | 0 (0.0%) | $0 |
| 25 to 44 Years | 68 (21.9%) | $0 |
| 45 to 64 Years | 112 (36.0%) | $51,136 |
| 65+ Years | 131 (42.1%) | $68,125 |
| Total | 311 (100.0%) | $51,188 |
Poverty in Hana
Income Below Poverty by Sex and Age in Hana
With 20.8% poverty level for males and 28.6% for females among the residents of Hana, 18 to 24 year old males and 15 year old females are the most vulnerable to poverty, with 14 males (51.8%) and 14 females (100.0%) in their respective age groups living below the poverty level.
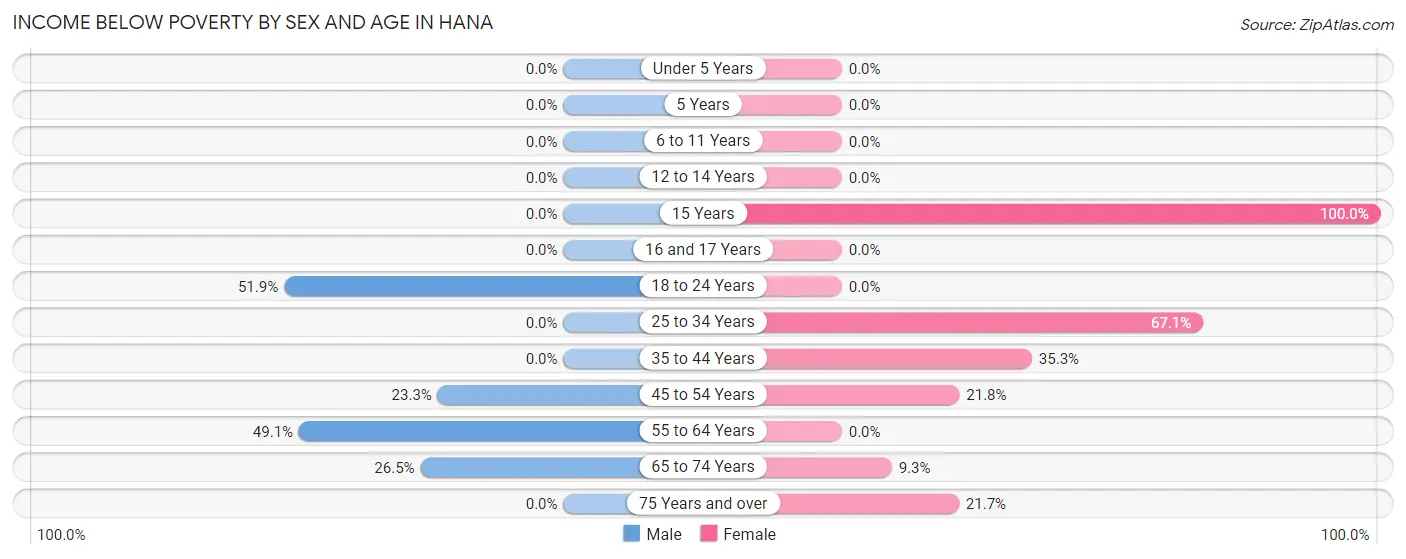
| Age Bracket | Male | Female |
| Under 5 Years | 0 (0.0%) | 0 (0.0%) |
| 5 Years | 0 (0.0%) | 0 (0.0%) |
| 6 to 11 Years | 0 (0.0%) | 0 (0.0%) |
| 12 to 14 Years | 0 (0.0%) | 0 (0.0%) |
| 15 Years | 0 (0.0%) | 14 (100.0%) |
| 16 and 17 Years | 0 (0.0%) | 0 (0.0%) |
| 18 to 24 Years | 14 (51.8%) | 0 (0.0%) |
| 25 to 34 Years | 0 (0.0%) | 57 (67.1%) |
| 35 to 44 Years | 0 (0.0%) | 6 (35.3%) |
| 45 to 54 Years | 7 (23.3%) | 24 (21.8%) |
| 55 to 64 Years | 27 (49.1%) | 0 (0.0%) |
| 65 to 74 Years | 13 (26.5%) | 5 (9.3%) |
| 75 Years and over | 0 (0.0%) | 10 (21.7%) |
| Total | 61 (20.8%) | 116 (28.6%) |
Income Above Poverty by Sex and Age in Hana
According to the poverty statistics in Hana, males aged under 5 years and females aged under 5 years are the age groups that are most secure financially, with 100.0% of males and 100.0% of females in these age groups living above the poverty line.
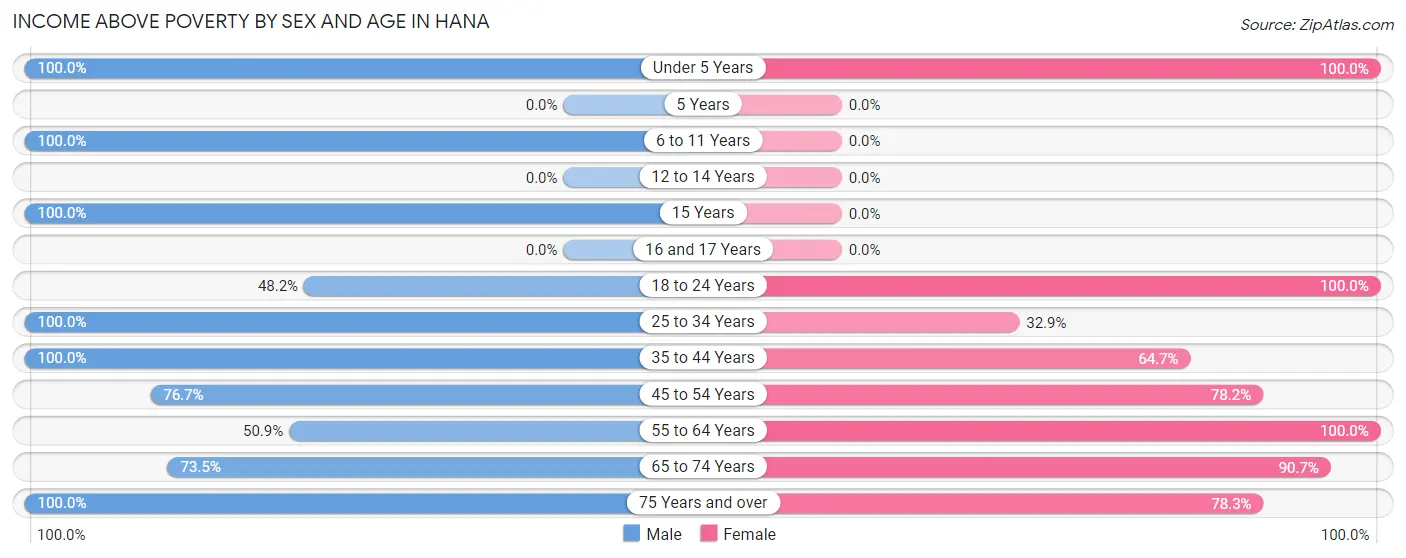
| Age Bracket | Male | Female |
| Under 5 Years | 6 (100.0%) | 6 (100.0%) |
| 5 Years | 0 (0.0%) | 0 (0.0%) |
| 6 to 11 Years | 16 (100.0%) | 0 (0.0%) |
| 12 to 14 Years | 0 (0.0%) | 0 (0.0%) |
| 15 Years | 9 (100.0%) | 0 (0.0%) |
| 16 and 17 Years | 0 (0.0%) | 0 (0.0%) |
| 18 to 24 Years | 13 (48.1%) | 31 (100.0%) |
| 25 to 34 Years | 24 (100.0%) | 28 (32.9%) |
| 35 to 44 Years | 39 (100.0%) | 11 (64.7%) |
| 45 to 54 Years | 23 (76.7%) | 86 (78.2%) |
| 55 to 64 Years | 28 (50.9%) | 42 (100.0%) |
| 65 to 74 Years | 36 (73.5%) | 49 (90.7%) |
| 75 Years and over | 38 (100.0%) | 36 (78.3%) |
| Total | 232 (79.2%) | 289 (71.4%) |
Income Below Poverty Among Married-Couple Families in Hana
The poverty statistics for married-couple families in Hana show that 12.8% or 12 of the total 94 families live below the poverty line. Families with 1 or 2 children have the highest poverty rate of 58.3%, comprising of 7 families. On the other hand, families with 3 or 4 children have the lowest poverty rate of 0.0%, which includes 0 families.
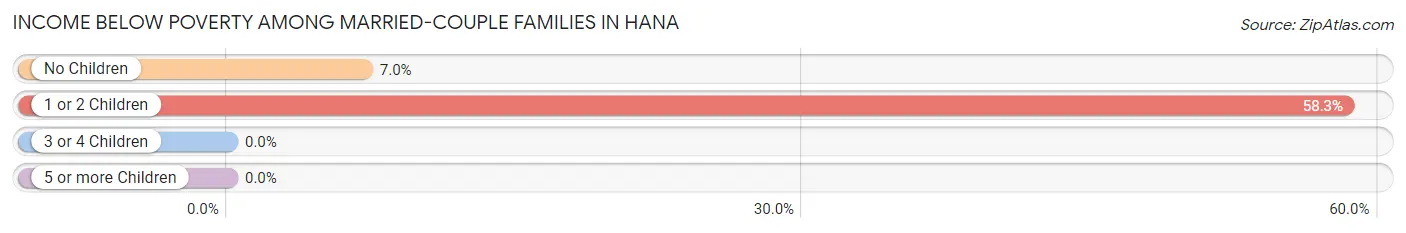
| Children | Above Poverty | Below Poverty |
| No Children | 66 (93.0%) | 5 (7.0%) |
| 1 or 2 Children | 5 (41.7%) | 7 (58.3%) |
| 3 or 4 Children | 11 (100.0%) | 0 (0.0%) |
| 5 or more Children | 0 (0.0%) | 0 (0.0%) |
| Total | 82 (87.2%) | 12 (12.8%) |
Income Below Poverty Among Single-Parent Households in Hana
| Children | Single Father | Single Mother |
| No Children | 0 (0.0%) | 0 (0.0%) |
| 1 or 2 Children | 0 (0.0%) | 0 (0.0%) |
| 3 or 4 Children | 0 (0.0%) | 0 (0.0%) |
| 5 or more Children | 0 (0.0%) | 0 (0.0%) |
| Total | 0 (0.0%) | 0 (0.0%) |
Income Below Poverty Among Married-Couple vs Single-Parent Households in Hana
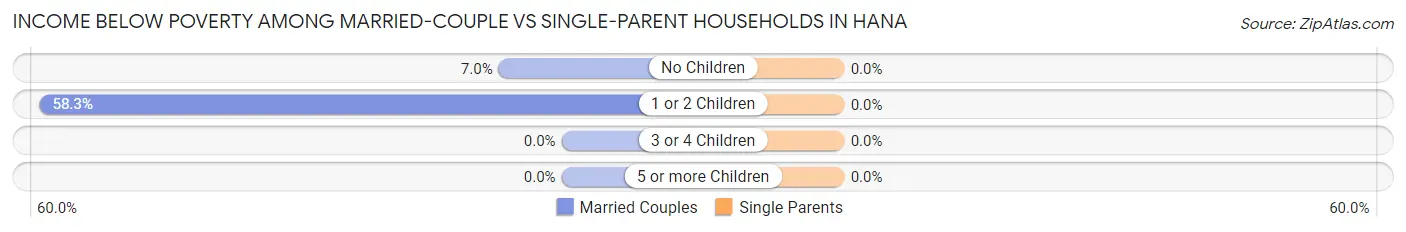
| Children | Married-Couple Families | Single-Parent Households |
| No Children | 5 (7.0%) | 0 (0.0%) |
| 1 or 2 Children | 7 (58.3%) | 0 (0.0%) |
| 3 or 4 Children | 0 (0.0%) | 0 (0.0%) |
| 5 or more Children | 0 (0.0%) | 0 (0.0%) |
| Total | 12 (12.8%) | 0 (0.0%) |
Race in Hana
The most populous races in Hana are Hawaiian / Pacific (269 | 36.8%), White / Caucasian (266 | 36.4%), and Two or more Races (169 | 23.1%).
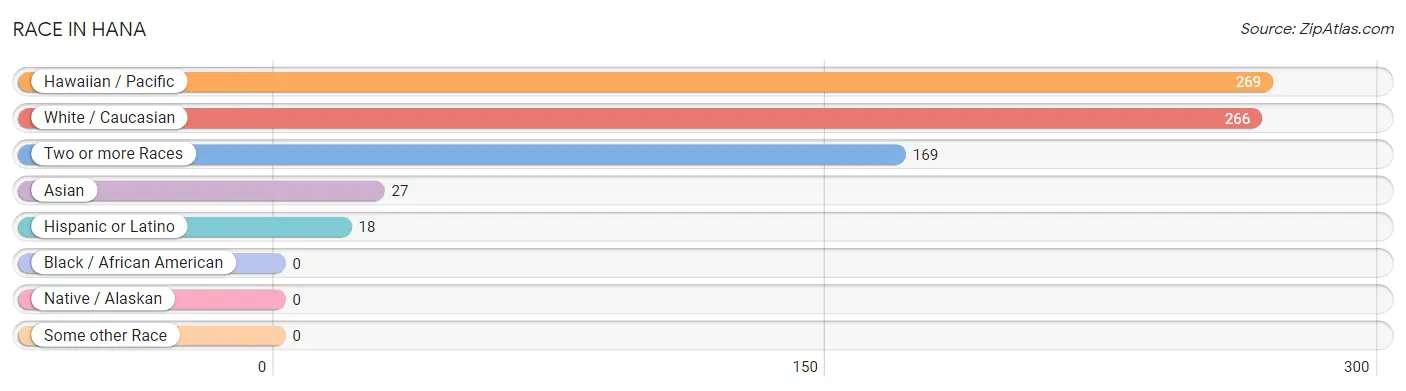
| Race | # Population | % Population |
| Asian | 27 | 3.7% |
| Black / African American | 0 | 0.0% |
| Hawaiian / Pacific | 269 | 36.8% |
| Hispanic or Latino | 18 | 2.5% |
| Native / Alaskan | 0 | 0.0% |
| White / Caucasian | 266 | 36.4% |
| Two or more Races | 169 | 23.1% |
| Some other Race | 0 | 0.0% |
| Total | 731 | 100.0% |
Ancestry in Hana
The most populous ancestries reported in Hana are Native Hawaiian (420 | 57.5%), German (74 | 10.1%), Korean (56 | 7.7%), Bhutanese (55 | 7.5%), and Indian (Asian) (53 | 7.2%), together accounting for 90.0% of all Hana residents.
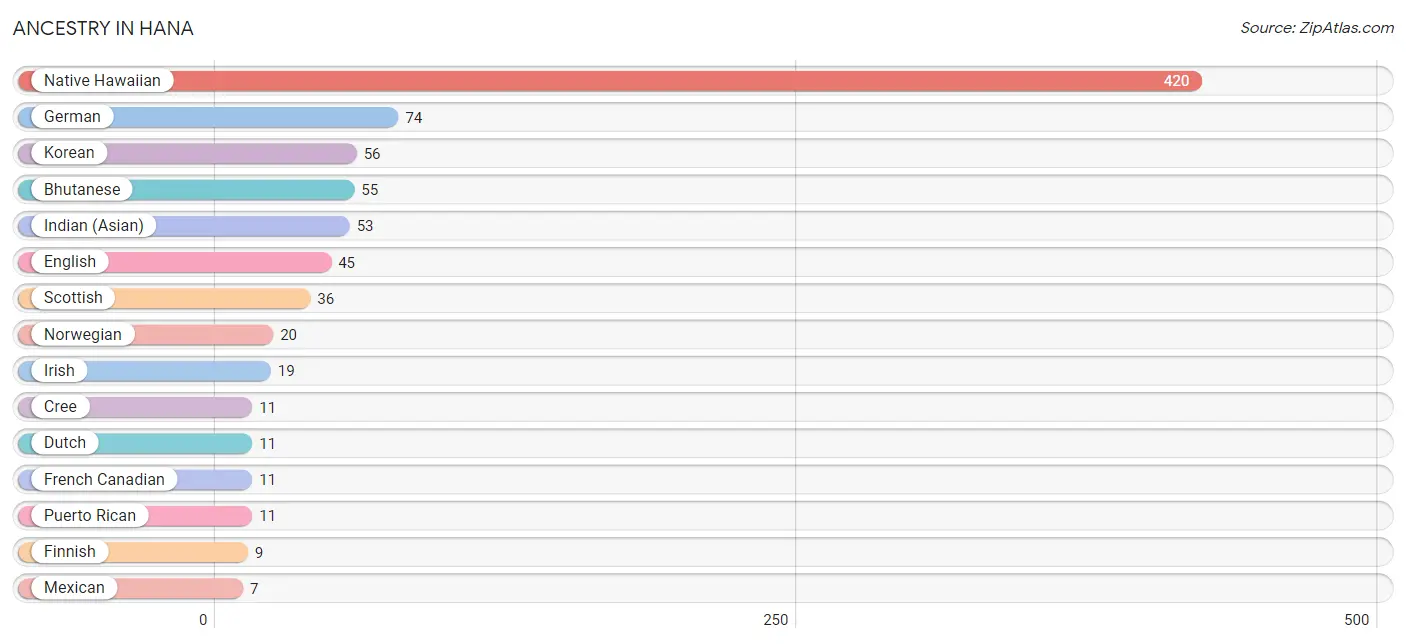
| Ancestry | # Population | % Population |
| Bhutanese | 55 | 7.5% |
| Cree | 11 | 1.5% |
| Dutch | 11 | 1.5% |
| English | 45 | 6.2% |
| Finnish | 9 | 1.2% |
| French Canadian | 11 | 1.5% |
| German | 74 | 10.1% |
| Indian (Asian) | 53 | 7.2% |
| Irish | 19 | 2.6% |
| Korean | 56 | 7.7% |
| Mexican | 7 | 1.0% |
| Native Hawaiian | 420 | 57.5% |
| Norwegian | 20 | 2.7% |
| Puerto Rican | 11 | 1.5% |
| Scottish | 36 | 4.9% |
| Slovak | 6 | 0.8% |
| Welsh | 4 | 0.5% | View All 17 Rows |
Immigrants in Hana
The most numerous immigrant groups reported in Hana came from Europe (20 | 2.7%), and Northern Europe (20 | 2.7%), together accounting for 5.5% of all Hana residents.
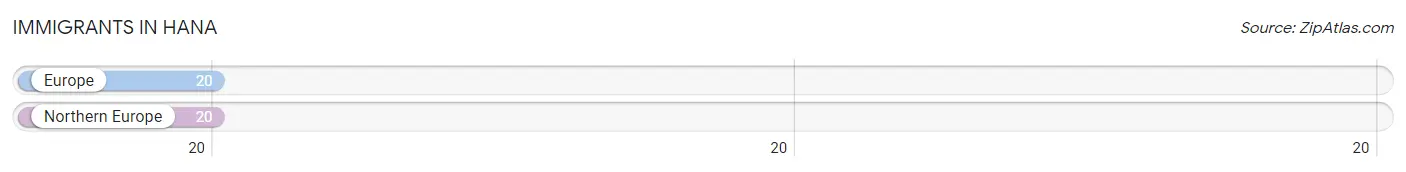
| Immigration Origin | # Population | % Population |
| Europe | 20 | 2.7% |
| Northern Europe | 20 | 2.7% | View All 2 Rows |
Sex and Age in Hana
Sex and Age in Hana
The most populous age groups in Hana are 55 to 59 Years (45 | 13.8%) for men and 30 to 34 Years (85 | 21.0%) for women.
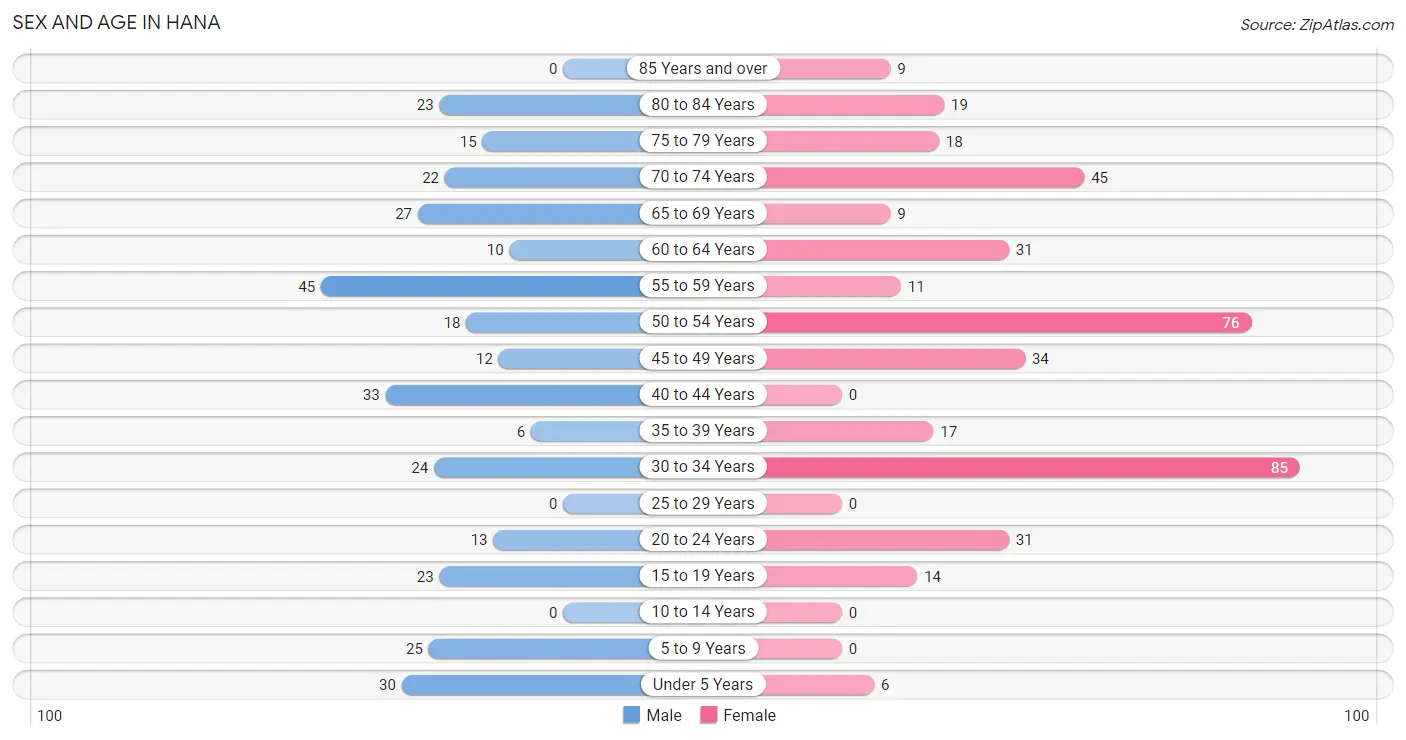
| Age Bracket | Male | Female |
| Under 5 Years | 30 (9.2%) | 6 (1.5%) |
| 5 to 9 Years | 25 (7.7%) | 0 (0.0%) |
| 10 to 14 Years | 0 (0.0%) | 0 (0.0%) |
| 15 to 19 Years | 23 (7.1%) | 14 (3.5%) |
| 20 to 24 Years | 13 (4.0%) | 31 (7.6%) |
| 25 to 29 Years | 0 (0.0%) | 0 (0.0%) |
| 30 to 34 Years | 24 (7.4%) | 85 (21.0%) |
| 35 to 39 Years | 6 (1.8%) | 17 (4.2%) |
| 40 to 44 Years | 33 (10.1%) | 0 (0.0%) |
| 45 to 49 Years | 12 (3.7%) | 34 (8.4%) |
| 50 to 54 Years | 18 (5.5%) | 76 (18.8%) |
| 55 to 59 Years | 45 (13.8%) | 11 (2.7%) |
| 60 to 64 Years | 10 (3.1%) | 31 (7.6%) |
| 65 to 69 Years | 27 (8.3%) | 9 (2.2%) |
| 70 to 74 Years | 22 (6.8%) | 45 (11.1%) |
| 75 to 79 Years | 15 (4.6%) | 18 (4.4%) |
| 80 to 84 Years | 23 (7.1%) | 19 (4.7%) |
| 85 Years and over | 0 (0.0%) | 9 (2.2%) |
| Total | 326 (100.0%) | 405 (100.0%) |
Families and Households in Hana
Median Family Size in Hana
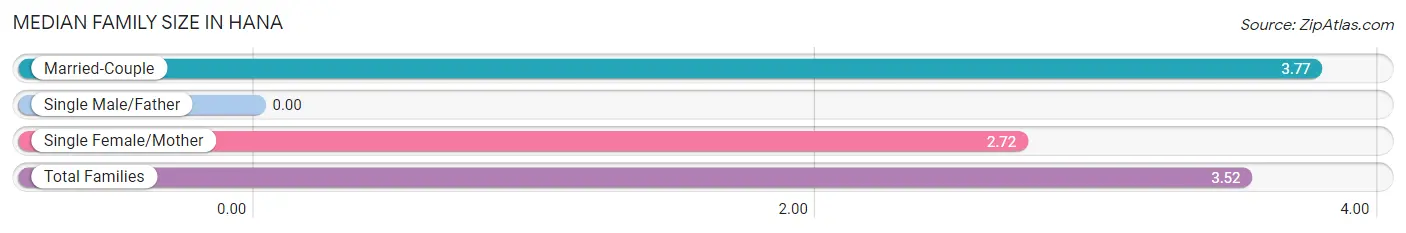
| Family Type | # Families | Family Size |
| Married-Couple | 94 (76.4%) | 3.77 |
| Single Male/Father | 0 (0.0%) | - |
| Single Female/Mother | 29 (23.6%) | 2.72 |
| Total Families | 123 (100.0%) | 3.52 |
Median Household Size in Hana
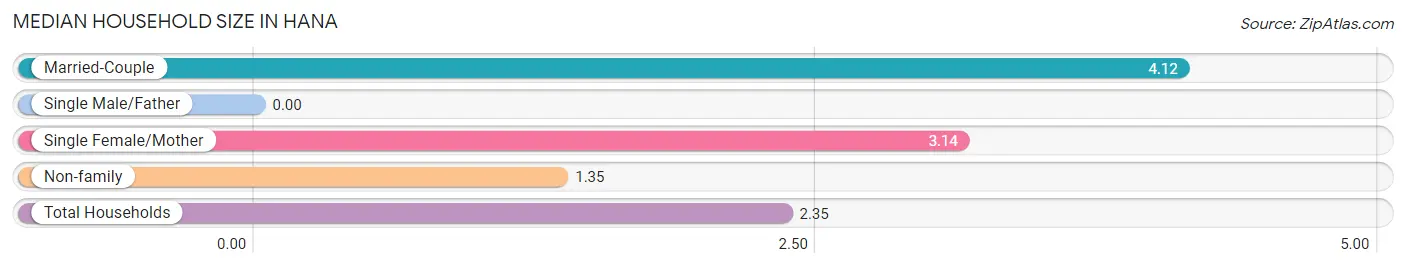
| Household Type | # Households | Household Size |
| Married-Couple | 94 (30.2%) | 4.12 |
| Single Male/Father | 0 (0.0%) | - |
| Single Female/Mother | 29 (9.3%) | 3.14 |
| Non-family | 188 (60.5%) | 1.35 |
| Total Households | 311 (100.0%) | 2.35 |
Household Size by Marriage Status in Hana
Out of a total of 311 households in Hana, 123 (39.6%) are family households, while 188 (60.5%) are nonfamily households. The most numerous type of family households are 2-person households, comprising 64, and the most common type of nonfamily households are 2-person households, comprising 97.
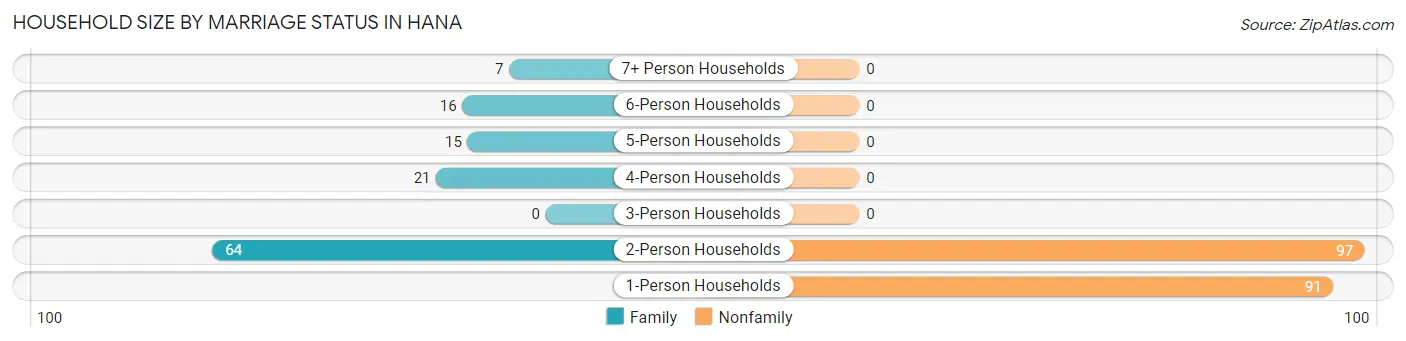
| Household Size | Family Households | Nonfamily Households |
| 1-Person Households | - | 91 (29.3%) |
| 2-Person Households | 64 (20.6%) | 97 (31.2%) |
| 3-Person Households | 0 (0.0%) | 0 (0.0%) |
| 4-Person Households | 21 (6.8%) | 0 (0.0%) |
| 5-Person Households | 15 (4.8%) | 0 (0.0%) |
| 6-Person Households | 16 (5.1%) | 0 (0.0%) |
| 7+ Person Households | 7 (2.2%) | 0 (0.0%) |
| Total | 123 (39.6%) | 188 (60.5%) |
Female Fertility in Hana
Fertility by Age in Hana
Average fertility rate in Hana is 39.0 births per 1,000 women. Women in the age bracket of 20 to 34 years have the highest fertility rate with 60.0 births per 1,000 women. Women in the age bracket of 20 to 34 years acount for 100.0% of all women with births.
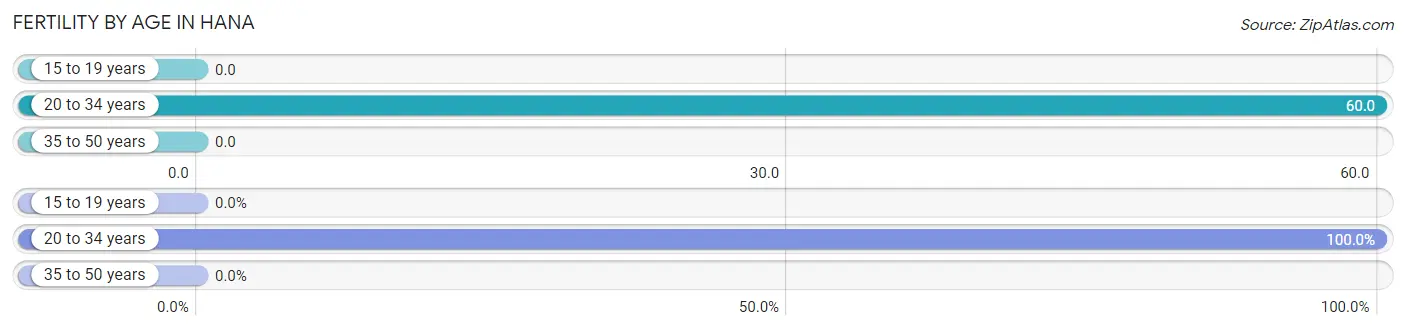
| Age Bracket | Women with Births | Births / 1,000 Women |
| 15 to 19 years | 0 (0.0%) | 0.0 |
| 20 to 34 years | 7 (100.0%) | 60.0 |
| 35 to 50 years | 0 (0.0%) | 0.0 |
| Total | 7 (100.0%) | 39.0 |
Fertility by Age by Marriage Status in Hana
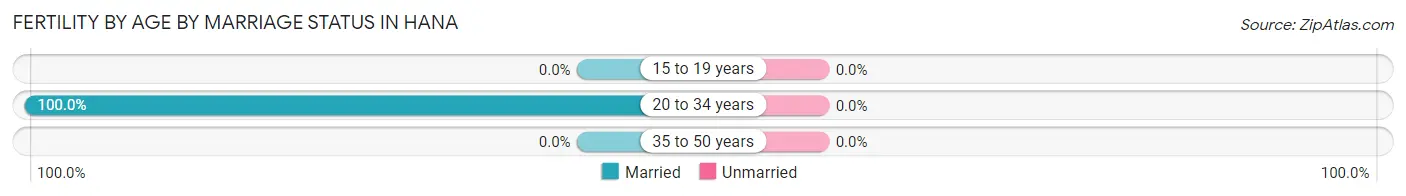
| Age Bracket | Married | Unmarried |
| 15 to 19 years | 0 (0.0%) | 0 (0.0%) |
| 20 to 34 years | 7 (100.0%) | 0 (0.0%) |
| 35 to 50 years | 0 (0.0%) | 0 (0.0%) |
| Total | 7 (100.0%) | 0 (0.0%) |
Fertility by Education in Hana
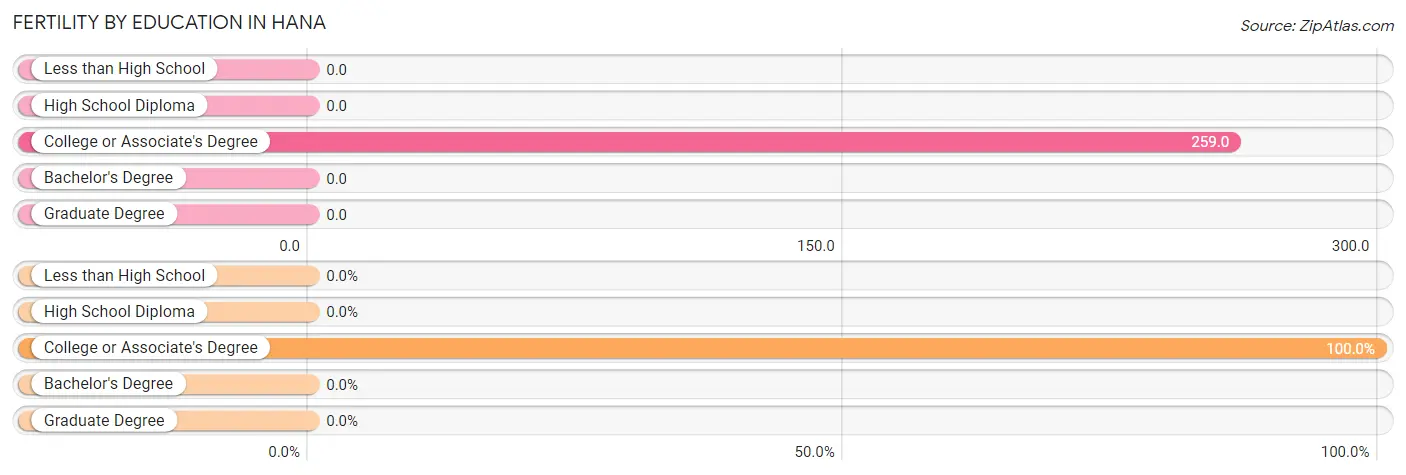
| Educational Attainment | Women with Births | Births / 1,000 Women |
| Less than High School | 0 (0.0%) | 0.0 |
| High School Diploma | 0 (0.0%) | 0.0 |
| College or Associate's Degree | 7 (100.0%) | 259.0 |
| Bachelor's Degree | 0 (0.0%) | 0.0 |
| Graduate Degree | 0 (0.0%) | 0.0 |
| Total | 7 (100.0%) | 39.0 |
Fertility by Education by Marriage Status in Hana
| Educational Attainment | Married | Unmarried |
| Less than High School | 0 (0.0%) | 0 (0.0%) |
| High School Diploma | 0 (0.0%) | 0 (0.0%) |
| College or Associate's Degree | 7 (100.0%) | 0 (0.0%) |
| Bachelor's Degree | 0 (0.0%) | 0 (0.0%) |
| Graduate Degree | 0 (0.0%) | 0 (0.0%) |
| Total | 7 (100.0%) | 0 (0.0%) |
Employment Characteristics in Hana
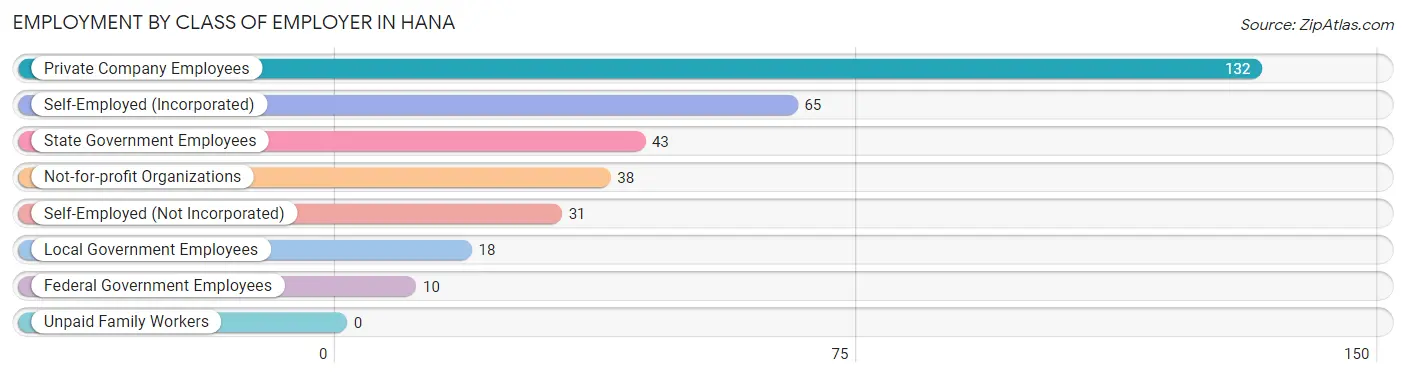
Employment by Class of Employer in Hana
Among the 337 employed individuals in Hana, private company employees (132 | 39.2%), self-employed (incorporated) (65 | 19.3%), and state government employees (43 | 12.8%) make up the most common classes of employment.
| Employer Class | # Employees | % Employees |
| Private Company Employees | 132 | 39.2% |
| Self-Employed (Incorporated) | 65 | 19.3% |
| Self-Employed (Not Incorporated) | 31 | 9.2% |
| Not-for-profit Organizations | 38 | 11.3% |
| Local Government Employees | 18 | 5.3% |
| State Government Employees | 43 | 12.8% |
| Federal Government Employees | 10 | 3.0% |
| Unpaid Family Workers | 0 | 0.0% |
| Total | 337 | 100.0% |
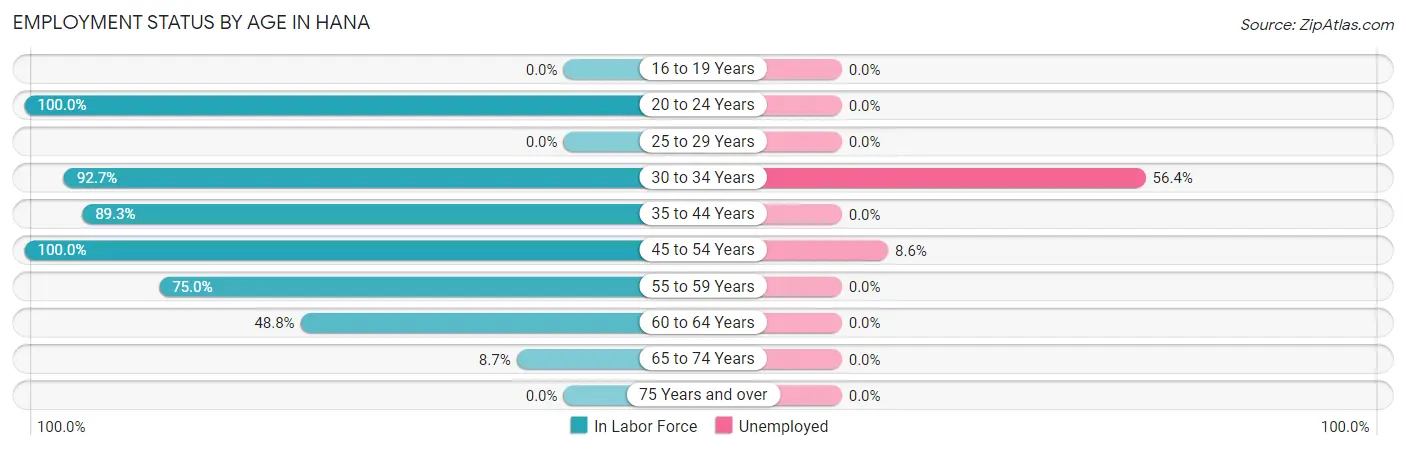
Employment Status by Age in Hana
According to the labor force statistics for Hana, out of the total population over 16 years of age (647), 62.8% or 406 individuals are in the labor force, with 17.0% or 69 of them unemployed. The age group with the highest labor force participation rate is 20 to 24 years, with 100.0% or 44 individuals in the labor force. Within the labor force, the 30 to 34 years age range has the highest percentage of unemployed individuals, with 56.4% or 57 of them being unemployed.
| Age Bracket | In Labor Force | Unemployed |
| 16 to 19 Years | 0 (0.0%) | 0 (0.0%) |
| 20 to 24 Years | 44 (100.0%) | 0 (0.0%) |
| 25 to 29 Years | 0 (0.0%) | 0 (0.0%) |
| 30 to 34 Years | 101 (92.7%) | 57 (56.4%) |
| 35 to 44 Years | 50 (89.3%) | 0 (0.0%) |
| 45 to 54 Years | 140 (100.0%) | 12 (8.6%) |
| 55 to 59 Years | 42 (75.0%) | 0 (0.0%) |
| 60 to 64 Years | 20 (48.8%) | 0 (0.0%) |
| 65 to 74 Years | 9 (8.7%) | 0 (0.0%) |
| 75 Years and over | 0 (0.0%) | 0 (0.0%) |
| Total | 406 (62.8%) | 69 (17.0%) |
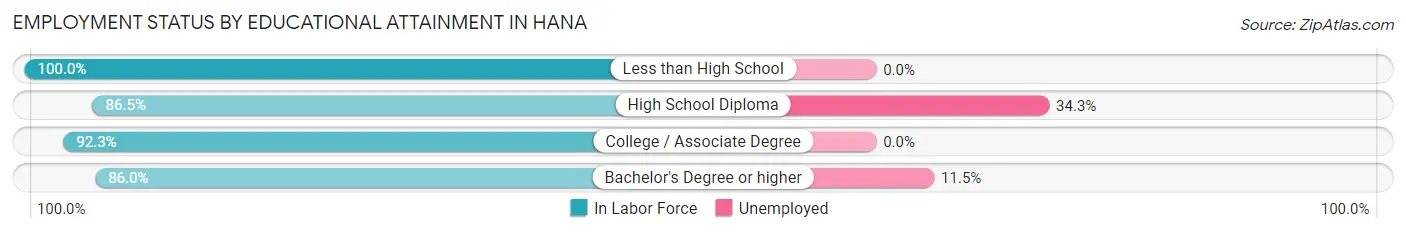
Employment Status by Educational Attainment in Hana
According to labor force statistics for Hana, 87.8% of individuals (353) out of the total population between 25 and 64 years of age (402) are in the labor force, with 19.5% or 69 of them being unemployed. The group with the highest labor force participation rate are those with the educational attainment of less than high school, with 100.0% or 11 individuals in the labor force. Within the labor force, individuals with high school diploma education have the highest percentage of unemployment, with 34.3% or 57 of them being unemployed.
| Educational Attainment | In Labor Force | Unemployed |
| Less than High School | 11 (100.0%) | 0 (0.0%) |
| High School Diploma | 166 (86.5%) | 66 (34.3%) |
| College / Associate Degree | 72 (92.3%) | 0 (0.0%) |
| Bachelor's Degree or higher | 104 (86.0%) | 14 (11.5%) |
| Total | 353 (87.8%) | 78 (19.5%) |
Employment Occupations by Sex in Hana
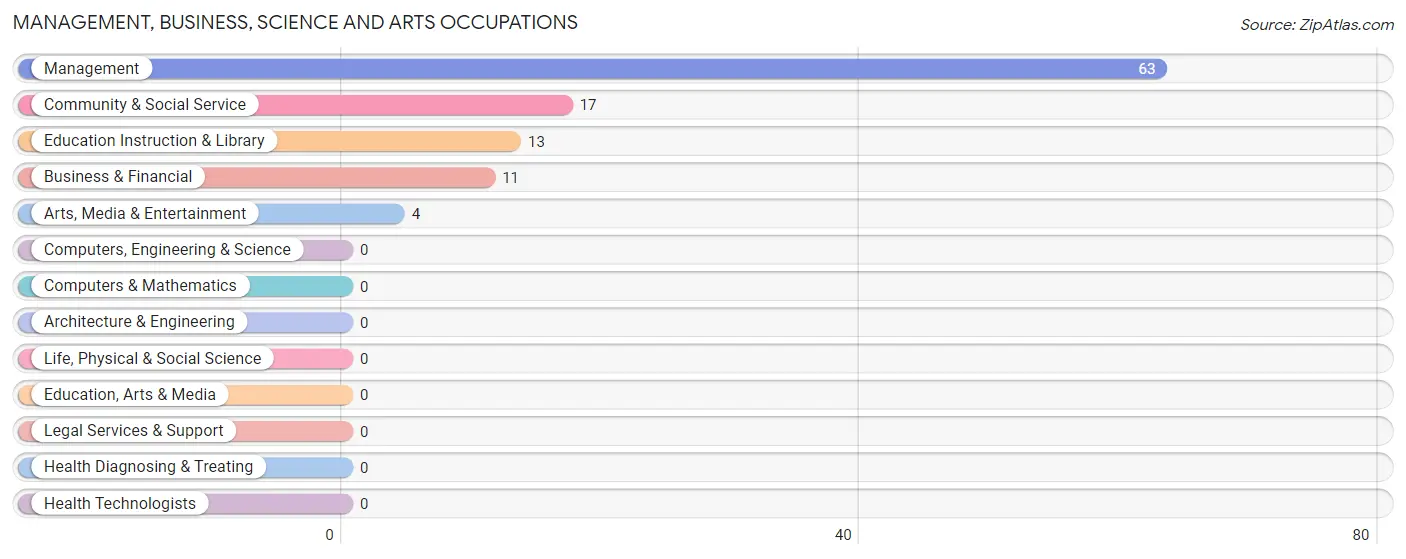
Management, Business, Science and Arts Occupations
The most common Management, Business, Science and Arts occupations in Hana are Management (63 | 18.7%), Community & Social Service (17 | 5.0%), Education Instruction & Library (13 | 3.9%), Business & Financial (11 | 3.3%), and Arts, Media & Entertainment (4 | 1.2%).
Management, Business, Science and Arts Occupations by Sex
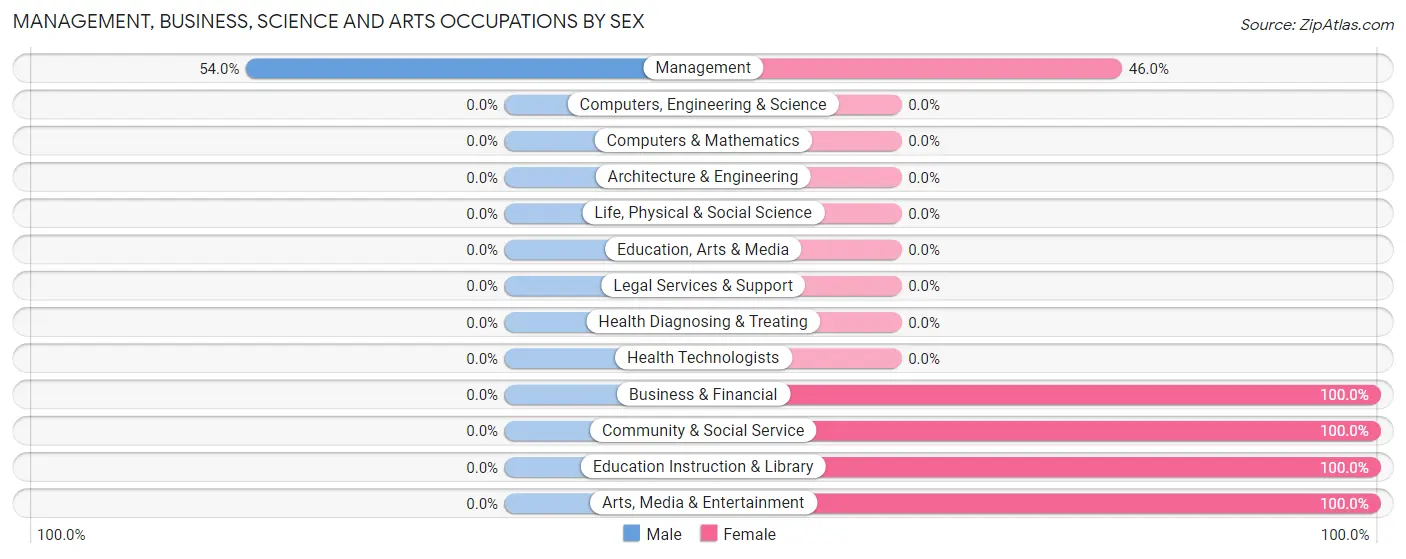
| Occupation | Male | Female |
| Management | 34 (54.0%) | 29 (46.0%) |
| Business & Financial | 0 (0.0%) | 11 (100.0%) |
| Computers, Engineering & Science | 0 (0.0%) | 0 (0.0%) |
| Computers & Mathematics | 0 (0.0%) | 0 (0.0%) |
| Architecture & Engineering | 0 (0.0%) | 0 (0.0%) |
| Life, Physical & Social Science | 0 (0.0%) | 0 (0.0%) |
| Community & Social Service | 0 (0.0%) | 17 (100.0%) |
| Education, Arts & Media | 0 (0.0%) | 0 (0.0%) |
| Legal Services & Support | 0 (0.0%) | 0 (0.0%) |
| Education Instruction & Library | 0 (0.0%) | 13 (100.0%) |
| Arts, Media & Entertainment | 0 (0.0%) | 4 (100.0%) |
| Health Diagnosing & Treating | 0 (0.0%) | 0 (0.0%) |
| Health Technologists | 0 (0.0%) | 0 (0.0%) |
| Total (Category) | 34 (37.4%) | 57 (62.6%) |
| Total (Overall) | 138 (40.9%) | 199 (59.1%) |
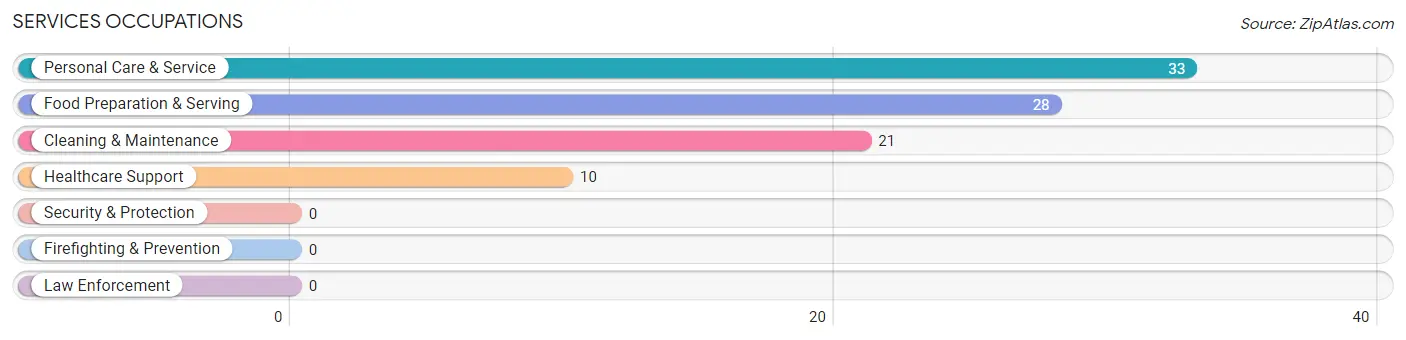
Services Occupations
The most common Services occupations in Hana are Personal Care & Service (33 | 9.8%), Food Preparation & Serving (28 | 8.3%), Cleaning & Maintenance (21 | 6.2%), and Healthcare Support (10 | 3.0%).
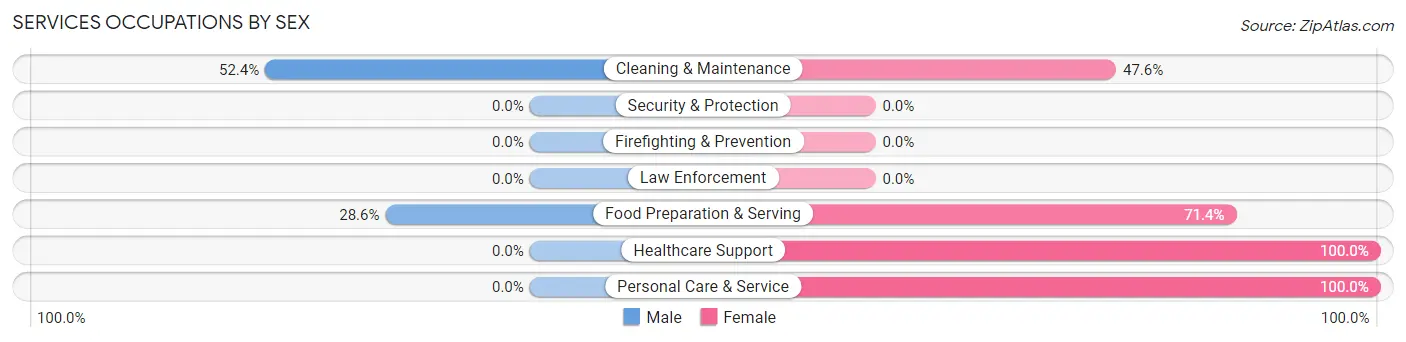
Services Occupations by Sex
Within the Services occupations in Hana, the most male-oriented occupations are Cleaning & Maintenance (52.4%), and Food Preparation & Serving (28.6%), while the most female-oriented occupations are Healthcare Support (100.0%), Personal Care & Service (100.0%), and Food Preparation & Serving (71.4%).
| Occupation | Male | Female |
| Healthcare Support | 0 (0.0%) | 10 (100.0%) |
| Security & Protection | 0 (0.0%) | 0 (0.0%) |
| Firefighting & Prevention | 0 (0.0%) | 0 (0.0%) |
| Law Enforcement | 0 (0.0%) | 0 (0.0%) |
| Food Preparation & Serving | 8 (28.6%) | 20 (71.4%) |
| Cleaning & Maintenance | 11 (52.4%) | 10 (47.6%) |
| Personal Care & Service | 0 (0.0%) | 33 (100.0%) |
| Total (Category) | 19 (20.6%) | 73 (79.3%) |
| Total (Overall) | 138 (40.9%) | 199 (59.1%) |
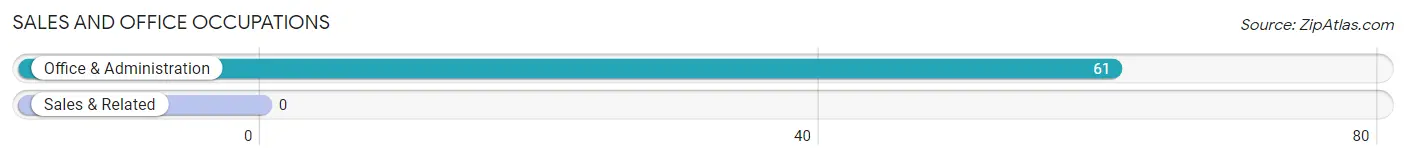
Sales and Office Occupations
The most common Sales and Office occupations in Hana are , and Office & Administration (61 | 18.1%).
Sales and Office Occupations by Sex
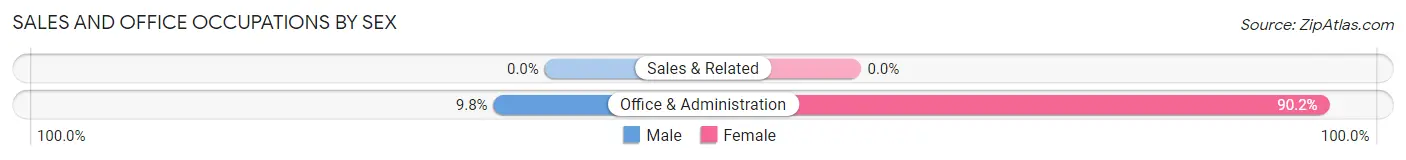
| Occupation | Male | Female |
| Sales & Related | 0 (0.0%) | 0 (0.0%) |
| Office & Administration | 6 (9.8%) | 55 (90.2%) |
| Total (Category) | 6 (9.8%) | 55 (90.2%) |
| Total (Overall) | 138 (40.9%) | 199 (59.1%) |
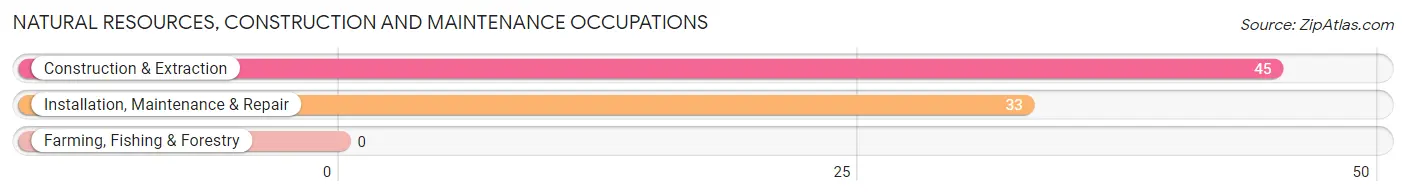
Natural Resources, Construction and Maintenance Occupations
The most common Natural Resources, Construction and Maintenance occupations in Hana are Construction & Extraction (45 | 13.4%), and Installation, Maintenance & Repair (33 | 9.8%).
Natural Resources, Construction and Maintenance Occupations by Sex
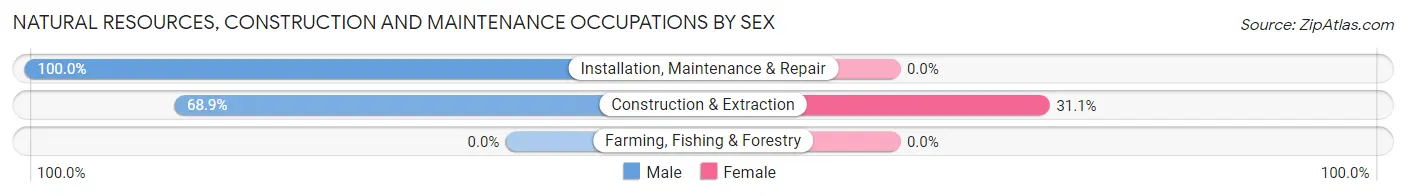
| Occupation | Male | Female |
| Farming, Fishing & Forestry | 0 (0.0%) | 0 (0.0%) |
| Construction & Extraction | 31 (68.9%) | 14 (31.1%) |
| Installation, Maintenance & Repair | 33 (100.0%) | 0 (0.0%) |
| Total (Category) | 64 (82.1%) | 14 (17.9%) |
| Total (Overall) | 138 (40.9%) | 199 (59.1%) |
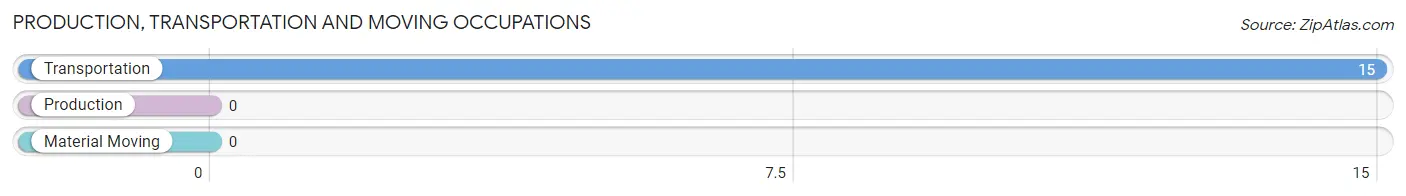
Production, Transportation and Moving Occupations
The most common Production, Transportation and Moving occupations in Hana are , and Transportation (15 | 4.4%).
Production, Transportation and Moving Occupations by Sex
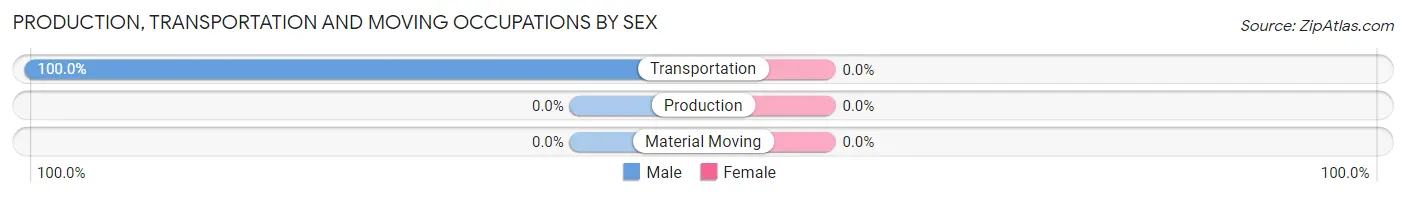
| Occupation | Male | Female |
| Production | 0 (0.0%) | 0 (0.0%) |
| Transportation | 15 (100.0%) | 0 (0.0%) |
| Material Moving | 0 (0.0%) | 0 (0.0%) |
| Total (Category) | 15 (100.0%) | 0 (0.0%) |
| Total (Overall) | 138 (40.9%) | 199 (59.1%) |
Employment Industries by Sex in Hana
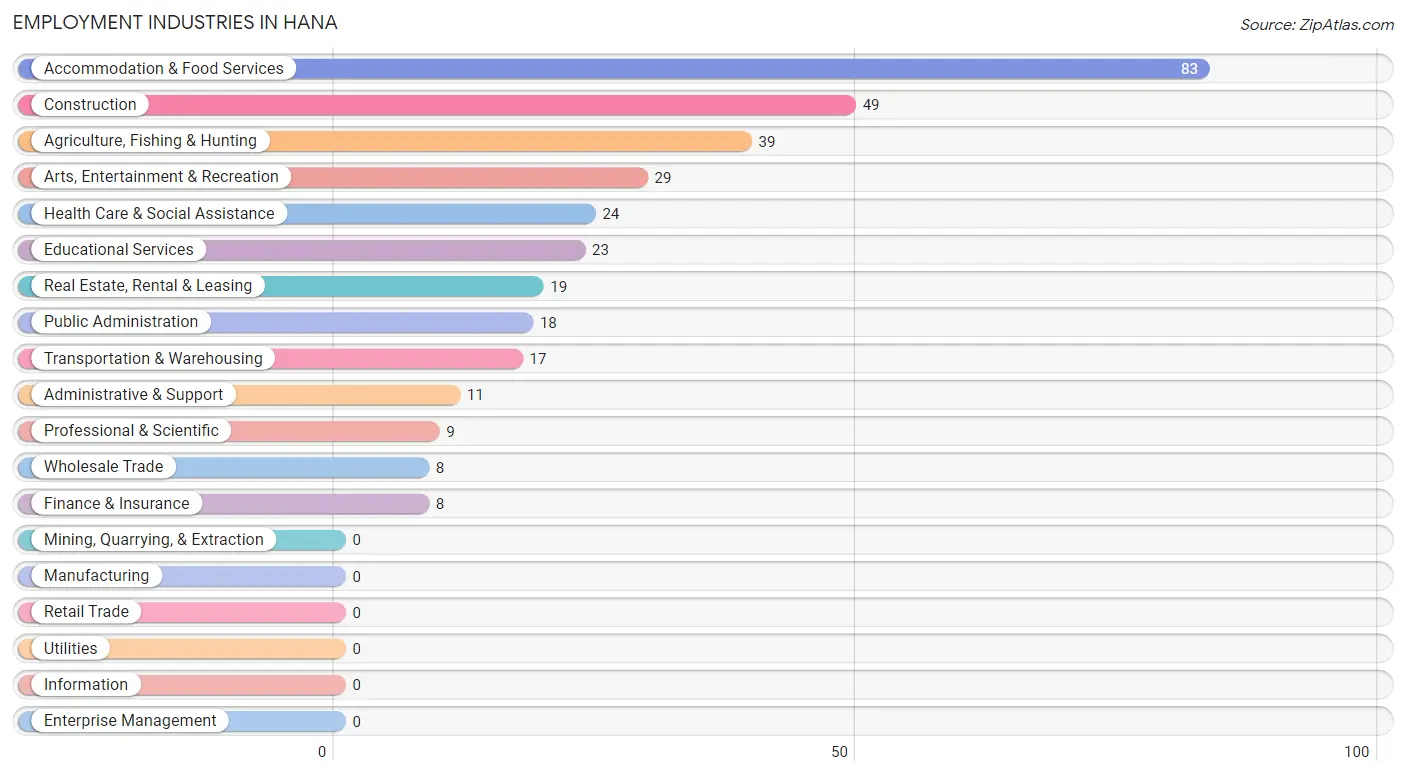
Employment Industries in Hana
The major employment industries in Hana include Accommodation & Food Services (83 | 24.6%), Construction (49 | 14.5%), Agriculture, Fishing & Hunting (39 | 11.6%), Arts, Entertainment & Recreation (29 | 8.6%), and Health Care & Social Assistance (24 | 7.1%).
Employment Industries by Sex in Hana
The Hana industries that see more men than women are Wholesale Trade (100.0%), Real Estate, Rental & Leasing (100.0%), and Administrative & Support (100.0%), whereas the industries that tend to have a higher number of women are Finance & Insurance (100.0%), Professional & Scientific (100.0%), and Health Care & Social Assistance (100.0%).
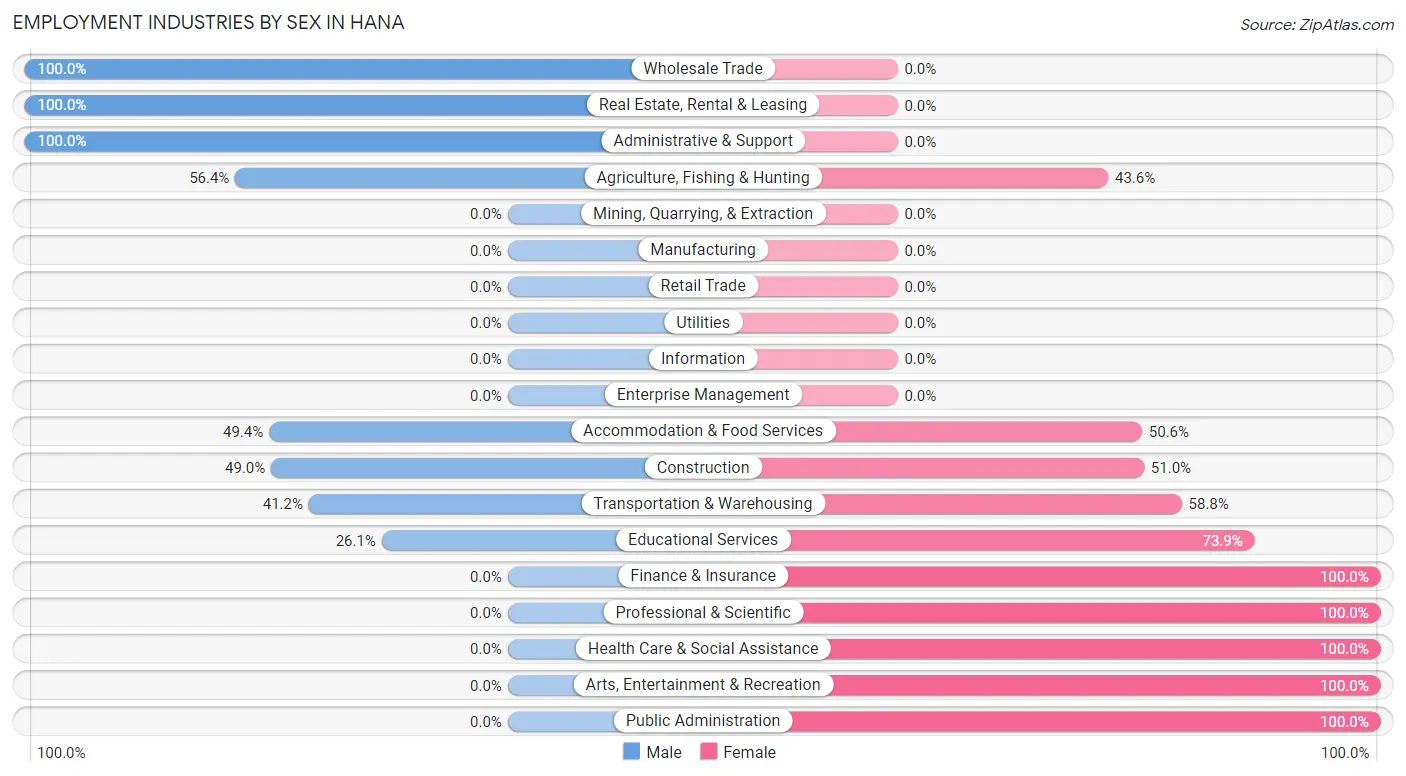
| Industry | Male | Female |
| Agriculture, Fishing & Hunting | 22 (56.4%) | 17 (43.6%) |
| Mining, Quarrying, & Extraction | 0 (0.0%) | 0 (0.0%) |
| Construction | 24 (49.0%) | 25 (51.0%) |
| Manufacturing | 0 (0.0%) | 0 (0.0%) |
| Wholesale Trade | 8 (100.0%) | 0 (0.0%) |
| Retail Trade | 0 (0.0%) | 0 (0.0%) |
| Transportation & Warehousing | 7 (41.2%) | 10 (58.8%) |
| Utilities | 0 (0.0%) | 0 (0.0%) |
| Information | 0 (0.0%) | 0 (0.0%) |
| Finance & Insurance | 0 (0.0%) | 8 (100.0%) |
| Real Estate, Rental & Leasing | 19 (100.0%) | 0 (0.0%) |
| Professional & Scientific | 0 (0.0%) | 9 (100.0%) |
| Enterprise Management | 0 (0.0%) | 0 (0.0%) |
| Administrative & Support | 11 (100.0%) | 0 (0.0%) |
| Educational Services | 6 (26.1%) | 17 (73.9%) |
| Health Care & Social Assistance | 0 (0.0%) | 24 (100.0%) |
| Arts, Entertainment & Recreation | 0 (0.0%) | 29 (100.0%) |
| Accommodation & Food Services | 41 (49.4%) | 42 (50.6%) |
| Public Administration | 0 (0.0%) | 18 (100.0%) |
| Total | 138 (40.9%) | 199 (59.1%) |
Education in Hana
School Enrollment in Hana
The most common levels of schooling among the 62 students in Hana are high school (23 | 37.1%), elementary school (16 | 25.8%), and nursery / preschool (12 | 19.4%).
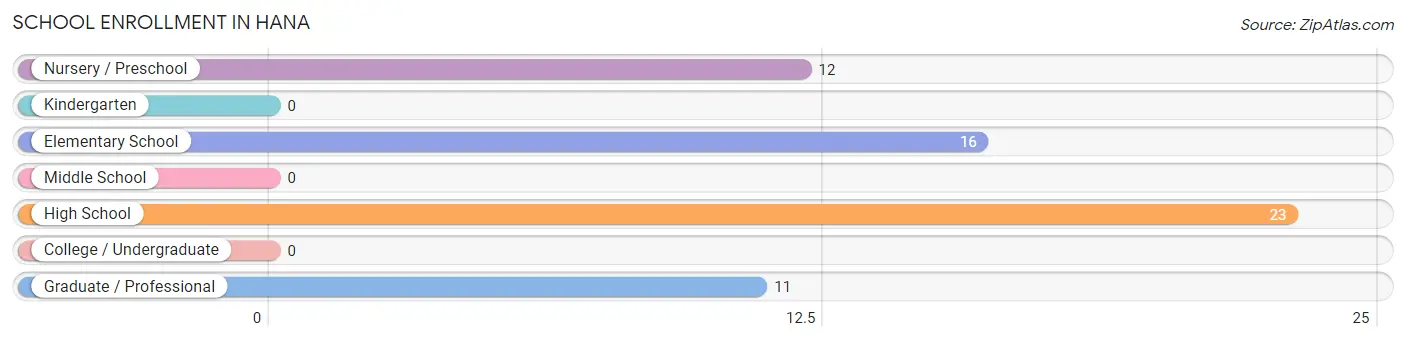
| School Level | # Students | % Students |
| Nursery / Preschool | 12 | 19.4% |
| Kindergarten | 0 | 0.0% |
| Elementary School | 16 | 25.8% |
| Middle School | 0 | 0.0% |
| High School | 23 | 37.1% |
| College / Undergraduate | 0 | 0.0% |
| Graduate / Professional | 11 | 17.7% |
| Total | 62 | 100.0% |
School Enrollment by Age by Funding Source in Hana
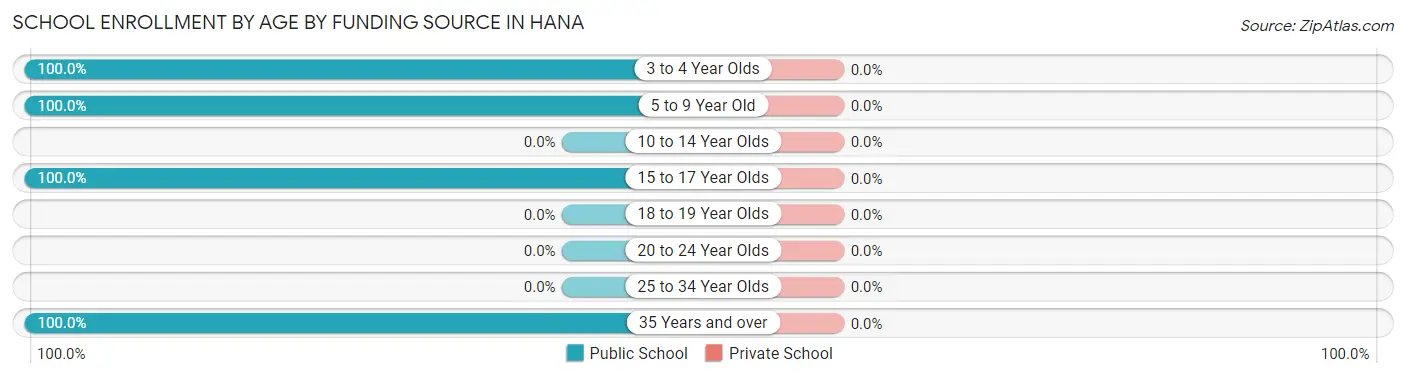
| Age Bracket | Public School | Private School |
| 3 to 4 Year Olds | 12 (100.0%) | 0 (0.0%) |
| 5 to 9 Year Old | 16 (100.0%) | 0 (0.0%) |
| 10 to 14 Year Olds | 0 (0.0%) | 0 (0.0%) |
| 15 to 17 Year Olds | 23 (100.0%) | 0 (0.0%) |
| 18 to 19 Year Olds | 0 (0.0%) | 0 (0.0%) |
| 20 to 24 Year Olds | 0 (0.0%) | 0 (0.0%) |
| 25 to 34 Year Olds | 0 (0.0%) | 0 (0.0%) |
| 35 Years and over | 11 (100.0%) | 0 (0.0%) |
| Total | 62 (100.0%) | 0 (0.0%) |
Educational Attainment by Field of Study in Hana
Arts & humanities (47 | 26.6%), education (37 | 20.9%), liberal arts & history (23 | 13.0%), engineering (15 | 8.5%), and computers & mathematics (12 | 6.8%) are the most common fields of study among 177 individuals in Hana who have obtained a bachelor's degree or higher.
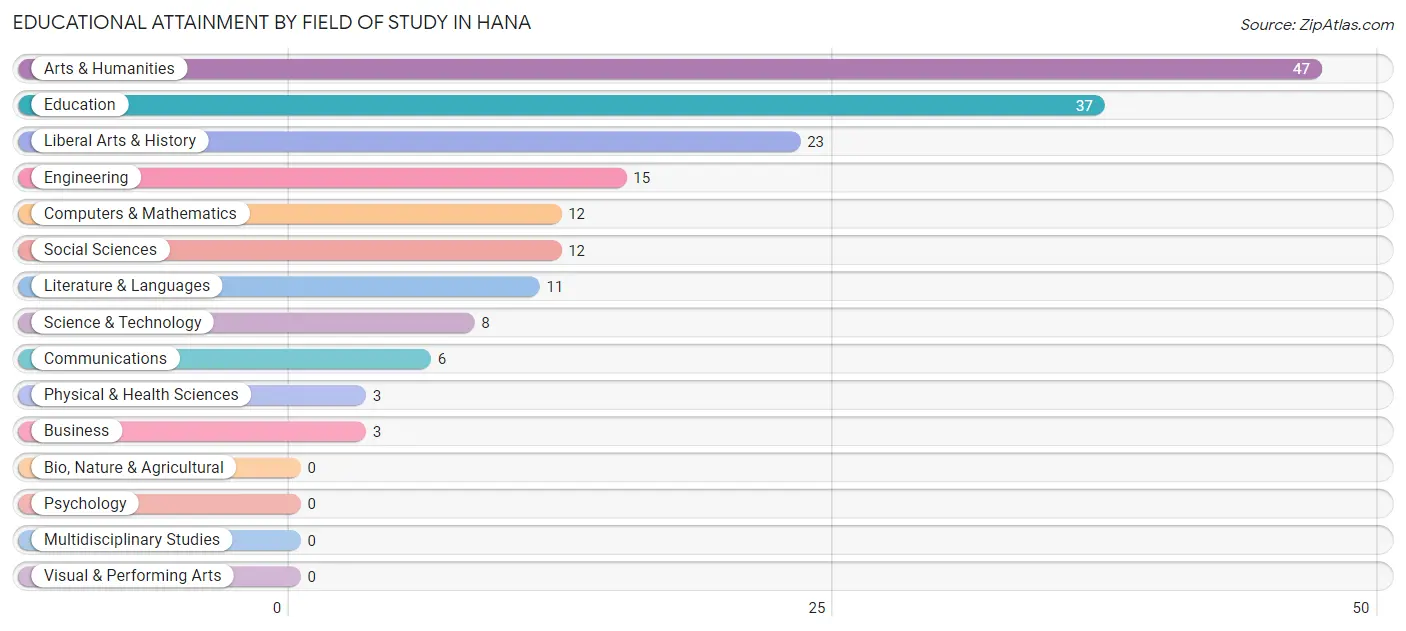
| Field of Study | # Graduates | % Graduates |
| Computers & Mathematics | 12 | 6.8% |
| Bio, Nature & Agricultural | 0 | 0.0% |
| Physical & Health Sciences | 3 | 1.7% |
| Psychology | 0 | 0.0% |
| Social Sciences | 12 | 6.8% |
| Engineering | 15 | 8.5% |
| Multidisciplinary Studies | 0 | 0.0% |
| Science & Technology | 8 | 4.5% |
| Business | 3 | 1.7% |
| Education | 37 | 20.9% |
| Literature & Languages | 11 | 6.2% |
| Liberal Arts & History | 23 | 13.0% |
| Visual & Performing Arts | 0 | 0.0% |
| Communications | 6 | 3.4% |
| Arts & Humanities | 47 | 26.6% |
| Total | 177 | 100.0% |
Transportation & Commute in Hana
Vehicle Availability by Sex in Hana
The most prevalent vehicle ownership categories in Hana are males with 3 vehicles (55, accounting for 39.9%) and females with 3 vehicles (59, making up 27.6%).
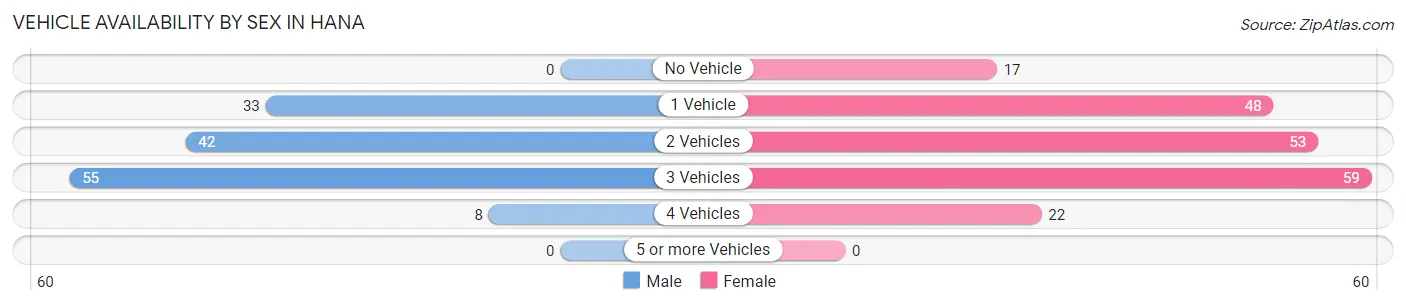
| Vehicles Available | Male | Female |
| No Vehicle | 0 (0.0%) | 17 (8.5%) |
| 1 Vehicle | 33 (23.9%) | 48 (24.1%) |
| 2 Vehicles | 42 (30.4%) | 53 (26.6%) |
| 3 Vehicles | 55 (39.9%) | 59 (29.6%) |
| 4 Vehicles | 8 (5.8%) | 22 (11.1%) |
| 5 or more Vehicles | 0 (0.0%) | 0 (0.0%) |
| Total | 138 (100.0%) | 199 (100.0%) |
Commute Time in Hana
The most frequently occuring commute durations in Hana are 5 to 9 minutes (94 commuters, 32.1%), 10 to 14 minutes (79 commuters, 27.0%), and less than 5 minutes (57 commuters, 19.5%).
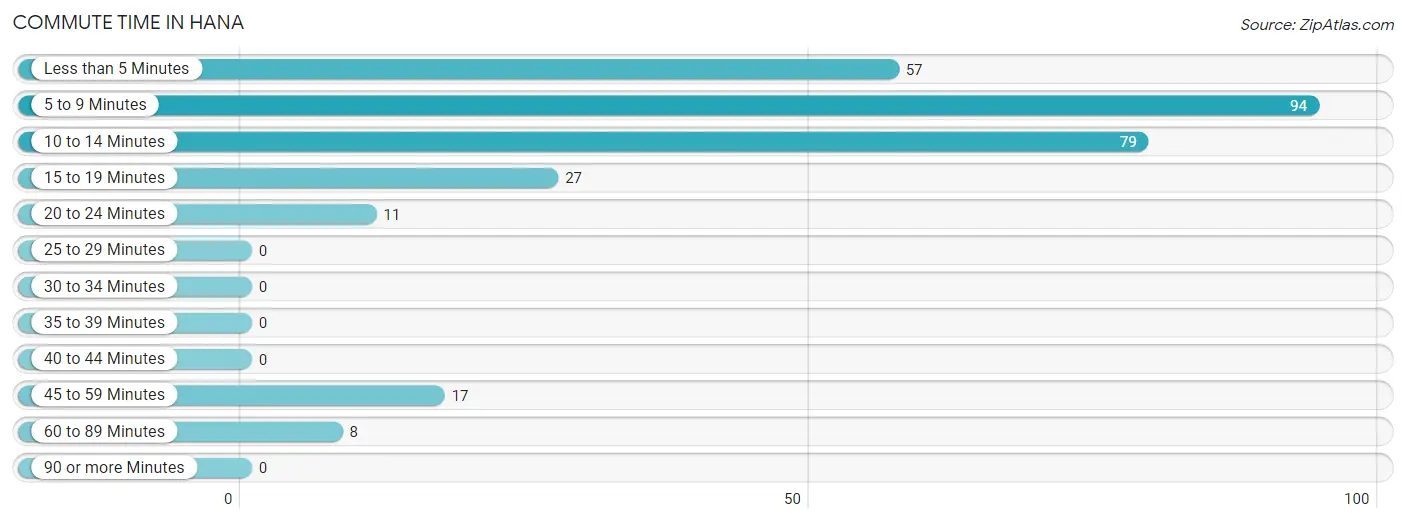
| Commute Time | # Commuters | % Commuters |
| Less than 5 Minutes | 57 | 19.5% |
| 5 to 9 Minutes | 94 | 32.1% |
| 10 to 14 Minutes | 79 | 27.0% |
| 15 to 19 Minutes | 27 | 9.2% |
| 20 to 24 Minutes | 11 | 3.7% |
| 25 to 29 Minutes | 0 | 0.0% |
| 30 to 34 Minutes | 0 | 0.0% |
| 35 to 39 Minutes | 0 | 0.0% |
| 40 to 44 Minutes | 0 | 0.0% |
| 45 to 59 Minutes | 17 | 5.8% |
| 60 to 89 Minutes | 8 | 2.7% |
| 90 or more Minutes | 0 | 0.0% |
Commute Time by Sex in Hana
The most common commute times in Hana are 5 to 9 minutes (40 commuters, 34.2%) for males and 5 to 9 minutes (54 commuters, 30.7%) for females.
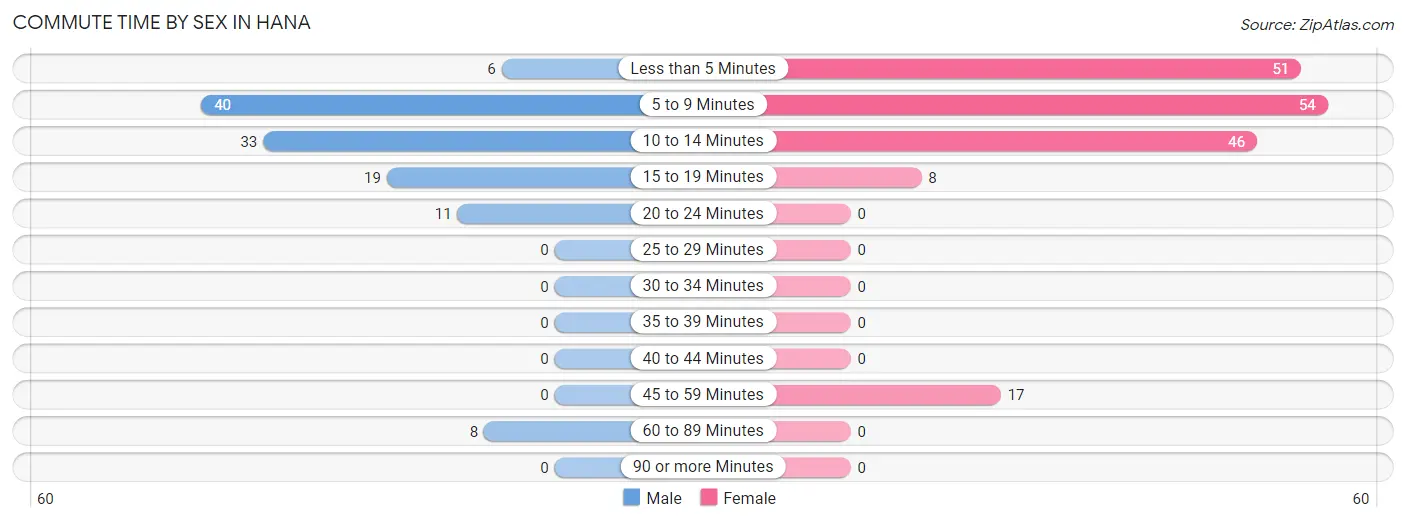
| Commute Time | Male | Female |
| Less than 5 Minutes | 6 (5.1%) | 51 (29.0%) |
| 5 to 9 Minutes | 40 (34.2%) | 54 (30.7%) |
| 10 to 14 Minutes | 33 (28.2%) | 46 (26.1%) |
| 15 to 19 Minutes | 19 (16.2%) | 8 (4.5%) |
| 20 to 24 Minutes | 11 (9.4%) | 0 (0.0%) |
| 25 to 29 Minutes | 0 (0.0%) | 0 (0.0%) |
| 30 to 34 Minutes | 0 (0.0%) | 0 (0.0%) |
| 35 to 39 Minutes | 0 (0.0%) | 0 (0.0%) |
| 40 to 44 Minutes | 0 (0.0%) | 0 (0.0%) |
| 45 to 59 Minutes | 0 (0.0%) | 17 (9.7%) |
| 60 to 89 Minutes | 8 (6.8%) | 0 (0.0%) |
| 90 or more Minutes | 0 (0.0%) | 0 (0.0%) |
Time of Departure to Work by Sex in Hana
The most frequent times of departure to work in Hana are 7:00 AM to 7:29 AM (88, 75.2%) for males and 7:00 AM to 7:29 AM (72, 40.9%) for females.
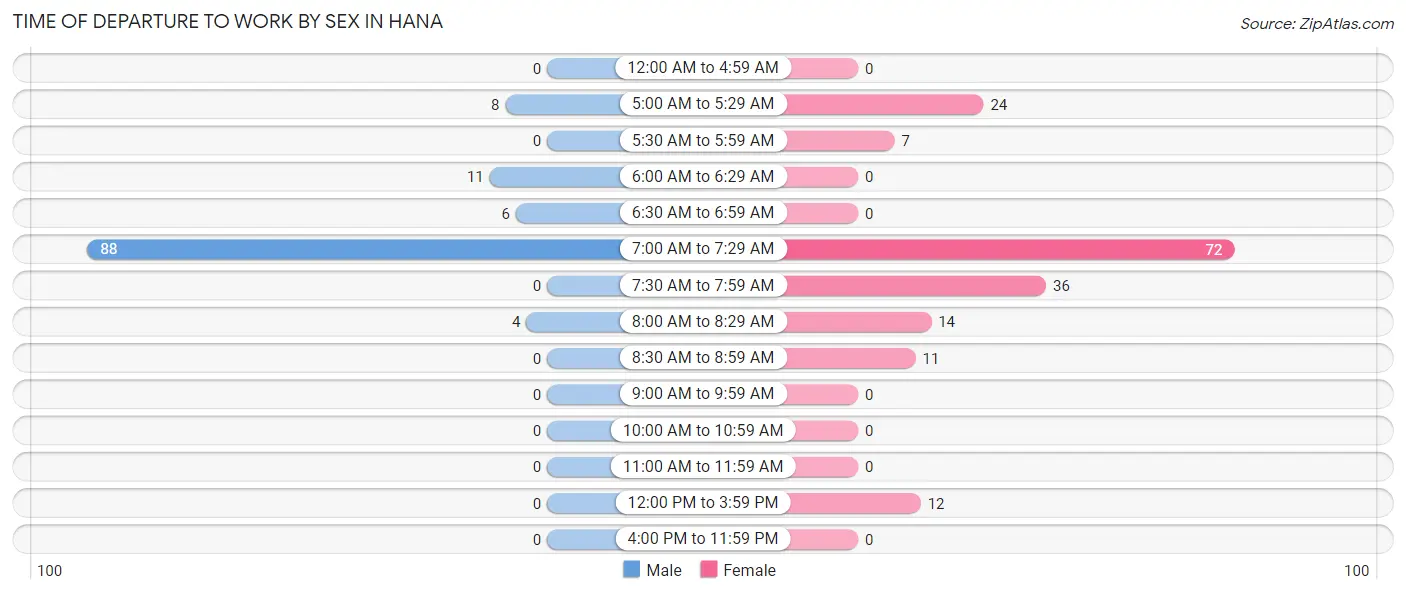
| Time of Departure | Male | Female |
| 12:00 AM to 4:59 AM | 0 (0.0%) | 0 (0.0%) |
| 5:00 AM to 5:29 AM | 8 (6.8%) | 24 (13.6%) |
| 5:30 AM to 5:59 AM | 0 (0.0%) | 7 (4.0%) |
| 6:00 AM to 6:29 AM | 11 (9.4%) | 0 (0.0%) |
| 6:30 AM to 6:59 AM | 6 (5.1%) | 0 (0.0%) |
| 7:00 AM to 7:29 AM | 88 (75.2%) | 72 (40.9%) |
| 7:30 AM to 7:59 AM | 0 (0.0%) | 36 (20.4%) |
| 8:00 AM to 8:29 AM | 4 (3.4%) | 14 (8.0%) |
| 8:30 AM to 8:59 AM | 0 (0.0%) | 11 (6.2%) |
| 9:00 AM to 9:59 AM | 0 (0.0%) | 0 (0.0%) |
| 10:00 AM to 10:59 AM | 0 (0.0%) | 0 (0.0%) |
| 11:00 AM to 11:59 AM | 0 (0.0%) | 0 (0.0%) |
| 12:00 PM to 3:59 PM | 0 (0.0%) | 12 (6.8%) |
| 4:00 PM to 11:59 PM | 0 (0.0%) | 0 (0.0%) |
| Total | 117 (100.0%) | 176 (100.0%) |
Housing Occupancy in Hana
Occupancy by Ownership in Hana
Of the total 311 dwellings in Hana, owner-occupied units account for 174 (55.9%), while renter-occupied units make up 137 (44.1%).
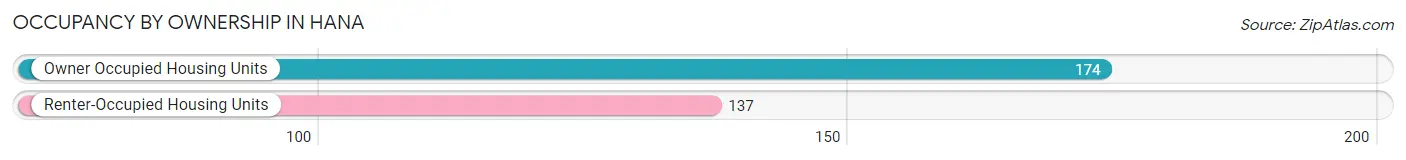
| Occupancy | # Housing Units | % Housing Units |
| Owner Occupied Housing Units | 174 | 55.9% |
| Renter-Occupied Housing Units | 137 | 44.1% |
| Total Occupied Housing Units | 311 | 100.0% |
Occupancy by Household Size in Hana
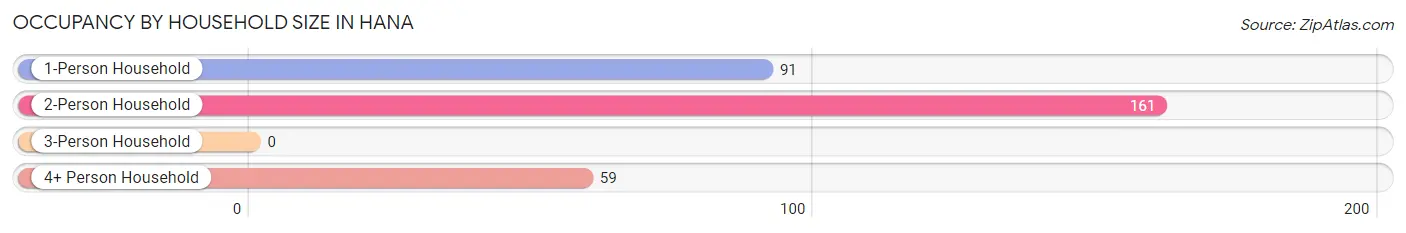
| Household Size | # Housing Units | % Housing Units |
| 1-Person Household | 91 | 29.3% |
| 2-Person Household | 161 | 51.8% |
| 3-Person Household | 0 | 0.0% |
| 4+ Person Household | 59 | 19.0% |
| Total Housing Units | 311 | 100.0% |
Occupancy by Ownership by Household Size in Hana
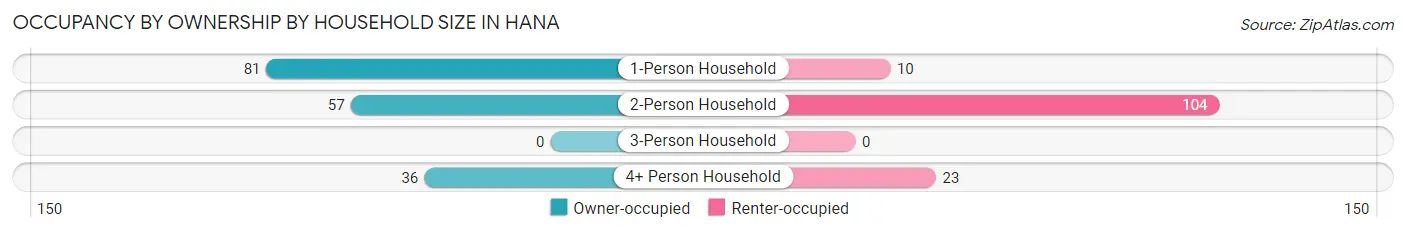
| Household Size | Owner-occupied | Renter-occupied |
| 1-Person Household | 81 (89.0%) | 10 (11.0%) |
| 2-Person Household | 57 (35.4%) | 104 (64.6%) |
| 3-Person Household | 0 (0.0%) | 0 (0.0%) |
| 4+ Person Household | 36 (61.0%) | 23 (39.0%) |
| Total Housing Units | 174 (55.9%) | 137 (44.1%) |
Occupancy by Educational Attainment in Hana
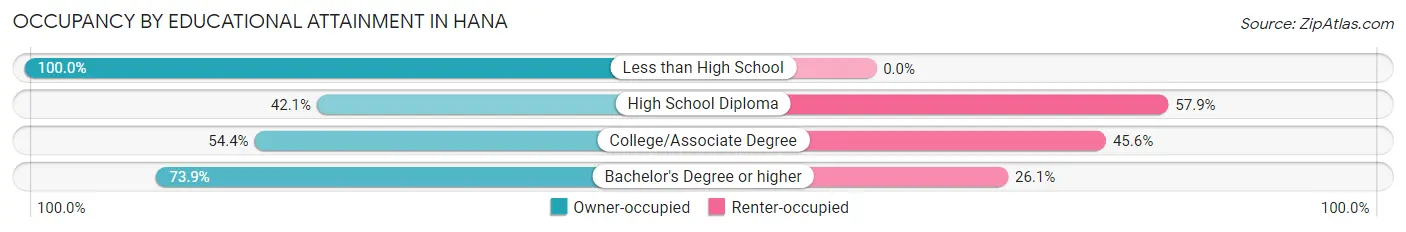
| Household Size | Owner-occupied | Renter-occupied |
| Less than High School | 7 (100.0%) | 0 (0.0%) |
| High School Diploma | 53 (42.1%) | 73 (57.9%) |
| College/Associate Degree | 49 (54.4%) | 41 (45.6%) |
| Bachelor's Degree or higher | 65 (73.9%) | 23 (26.1%) |
Occupancy by Age of Householder in Hana
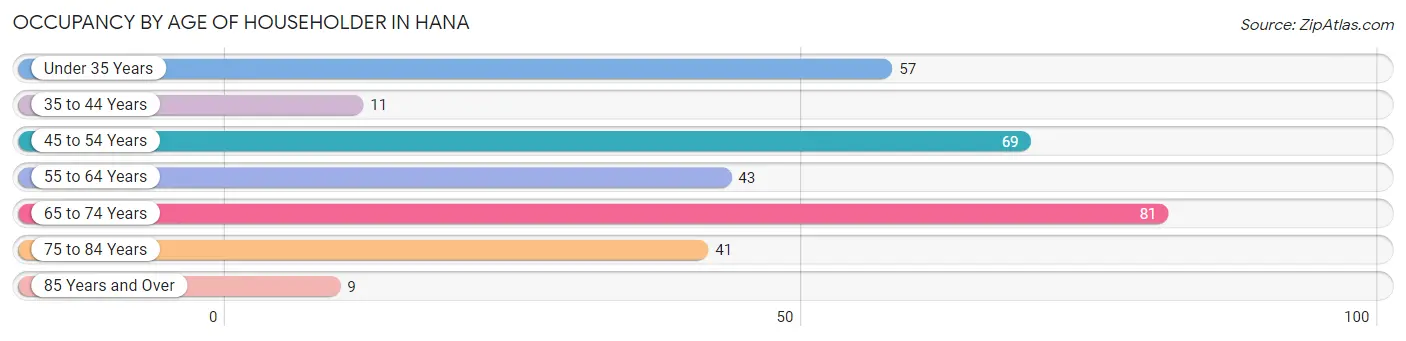
| Age Bracket | # Households | % Households |
| Under 35 Years | 57 | 18.3% |
| 35 to 44 Years | 11 | 3.5% |
| 45 to 54 Years | 69 | 22.2% |
| 55 to 64 Years | 43 | 13.8% |
| 65 to 74 Years | 81 | 26.1% |
| 75 to 84 Years | 41 | 13.2% |
| 85 Years and Over | 9 | 2.9% |
| Total | 311 | 100.0% |
Housing Finances in Hana
Median Income by Occupancy in Hana
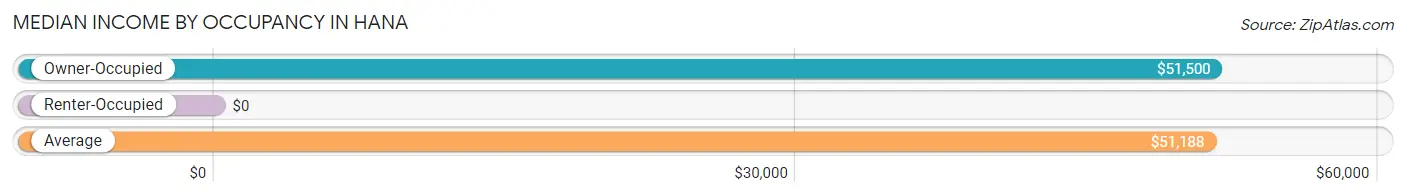
| Occupancy Type | # Households | Median Income |
| Owner-Occupied | 174 (55.9%) | $51,500 |
| Renter-Occupied | 137 (44.1%) | $0 |
| Average | 311 (100.0%) | $51,188 |
Occupancy by Householder Income Bracket in Hana
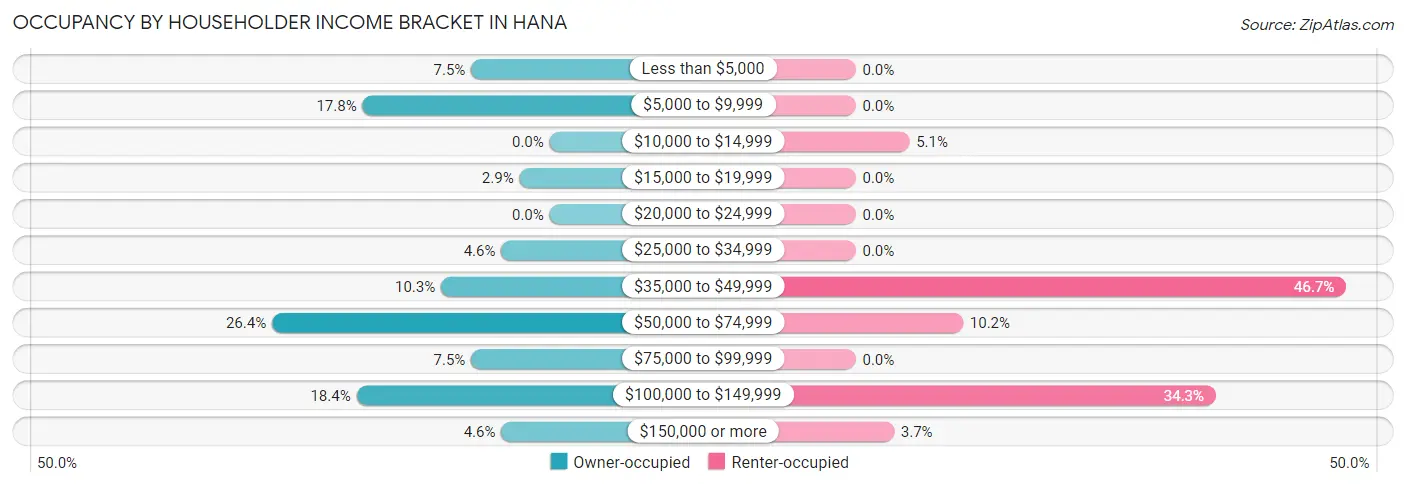
| Income Bracket | Owner-occupied | Renter-occupied |
| Less than $5,000 | 13 (7.5%) | 0 (0.0%) |
| $5,000 to $9,999 | 31 (17.8%) | 0 (0.0%) |
| $10,000 to $14,999 | 0 (0.0%) | 7 (5.1%) |
| $15,000 to $19,999 | 5 (2.9%) | 0 (0.0%) |
| $20,000 to $24,999 | 0 (0.0%) | 0 (0.0%) |
| $25,000 to $34,999 | 8 (4.6%) | 0 (0.0%) |
| $35,000 to $49,999 | 18 (10.3%) | 64 (46.7%) |
| $50,000 to $74,999 | 46 (26.4%) | 14 (10.2%) |
| $75,000 to $99,999 | 13 (7.5%) | 0 (0.0%) |
| $100,000 to $149,999 | 32 (18.4%) | 47 (34.3%) |
| $150,000 or more | 8 (4.6%) | 5 (3.6%) |
| Total | 174 (100.0%) | 137 (100.0%) |
Monthly Housing Cost Tiers in Hana
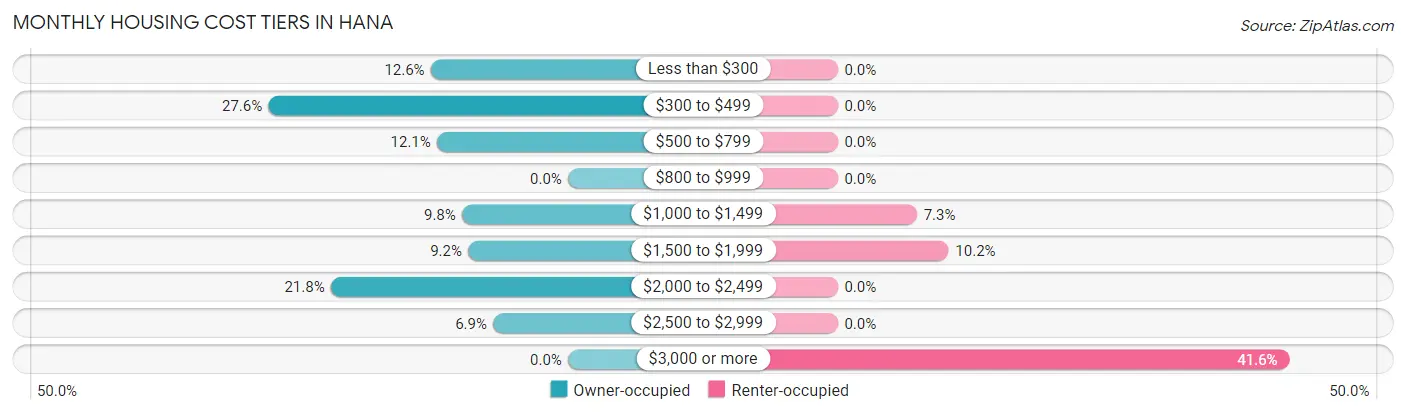
| Monthly Cost | Owner-occupied | Renter-occupied |
| Less than $300 | 22 (12.6%) | 0 (0.0%) |
| $300 to $499 | 48 (27.6%) | 0 (0.0%) |
| $500 to $799 | 21 (12.1%) | 0 (0.0%) |
| $800 to $999 | 0 (0.0%) | 0 (0.0%) |
| $1,000 to $1,499 | 17 (9.8%) | 10 (7.3%) |
| $1,500 to $1,999 | 16 (9.2%) | 14 (10.2%) |
| $2,000 to $2,499 | 38 (21.8%) | 0 (0.0%) |
| $2,500 to $2,999 | 12 (6.9%) | 0 (0.0%) |
| $3,000 or more | 0 (0.0%) | 57 (41.6%) |
| Total | 174 (100.0%) | 137 (100.0%) |
Physical Housing Characteristics in Hana
Housing Structures in Hana
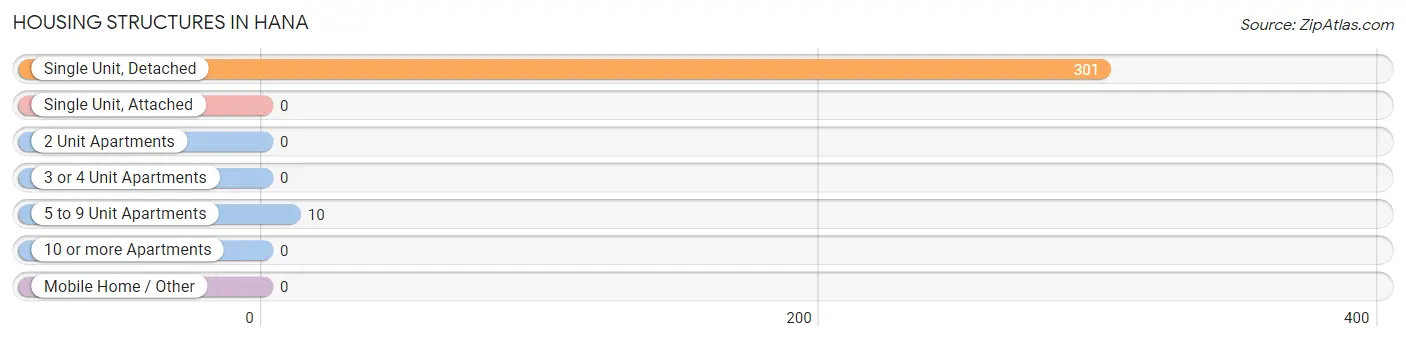
| Structure Type | # Housing Units | % Housing Units |
| Single Unit, Detached | 301 | 96.8% |
| Single Unit, Attached | 0 | 0.0% |
| 2 Unit Apartments | 0 | 0.0% |
| 3 or 4 Unit Apartments | 0 | 0.0% |
| 5 to 9 Unit Apartments | 10 | 3.2% |
| 10 or more Apartments | 0 | 0.0% |
| Mobile Home / Other | 0 | 0.0% |
| Total | 311 | 100.0% |
Housing Structures by Occupancy in Hana
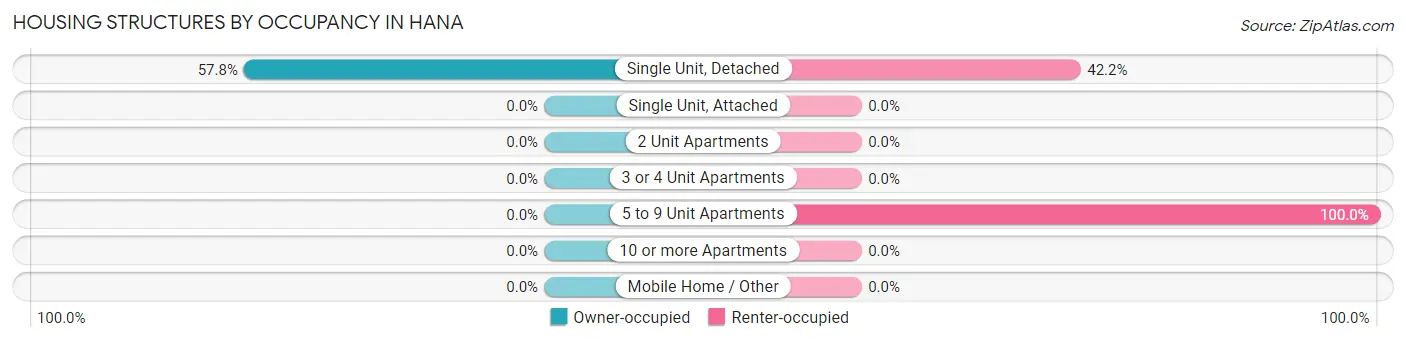
| Structure Type | Owner-occupied | Renter-occupied |
| Single Unit, Detached | 174 (57.8%) | 127 (42.2%) |
| Single Unit, Attached | 0 (0.0%) | 0 (0.0%) |
| 2 Unit Apartments | 0 (0.0%) | 0 (0.0%) |
| 3 or 4 Unit Apartments | 0 (0.0%) | 0 (0.0%) |
| 5 to 9 Unit Apartments | 0 (0.0%) | 10 (100.0%) |
| 10 or more Apartments | 0 (0.0%) | 0 (0.0%) |
| Mobile Home / Other | 0 (0.0%) | 0 (0.0%) |
| Total | 174 (55.9%) | 137 (44.1%) |
Housing Structures by Number of Rooms in Hana
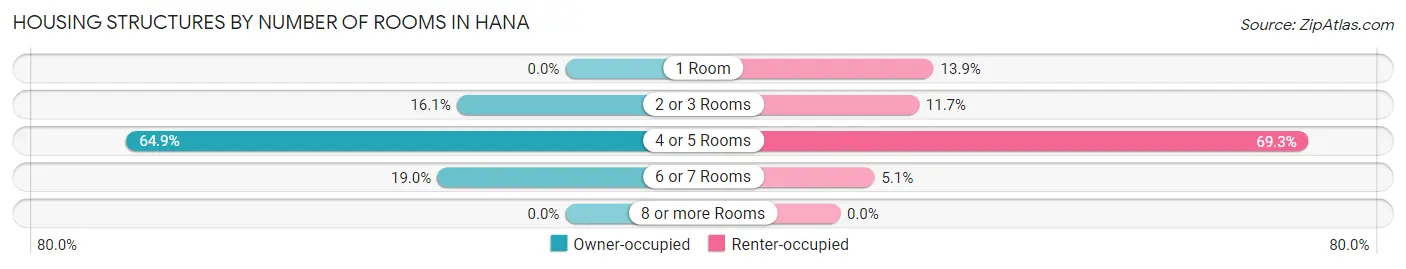
| Number of Rooms | Owner-occupied | Renter-occupied |
| 1 Room | 0 (0.0%) | 19 (13.9%) |
| 2 or 3 Rooms | 28 (16.1%) | 16 (11.7%) |
| 4 or 5 Rooms | 113 (64.9%) | 95 (69.3%) |
| 6 or 7 Rooms | 33 (19.0%) | 7 (5.1%) |
| 8 or more Rooms | 0 (0.0%) | 0 (0.0%) |
| Total | 174 (100.0%) | 137 (100.0%) |
Housing Structure by Heating Type in Hana
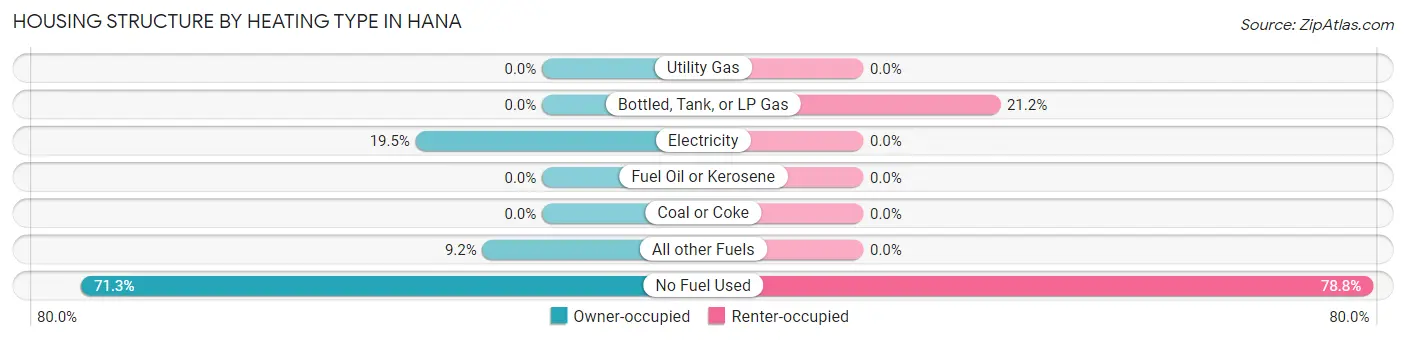
| Heating Type | Owner-occupied | Renter-occupied |
| Utility Gas | 0 (0.0%) | 0 (0.0%) |
| Bottled, Tank, or LP Gas | 0 (0.0%) | 29 (21.2%) |
| Electricity | 34 (19.5%) | 0 (0.0%) |
| Fuel Oil or Kerosene | 0 (0.0%) | 0 (0.0%) |
| Coal or Coke | 0 (0.0%) | 0 (0.0%) |
| All other Fuels | 16 (9.2%) | 0 (0.0%) |
| No Fuel Used | 124 (71.3%) | 108 (78.8%) |
| Total | 174 (100.0%) | 137 (100.0%) |
Household Vehicle Usage in Hana
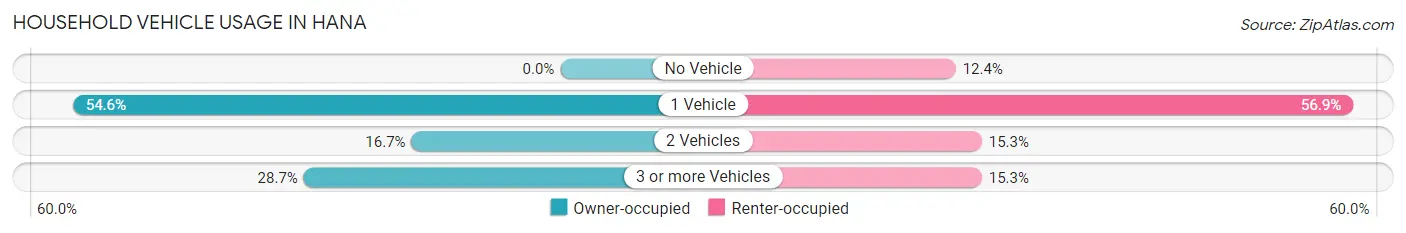
| Vehicles per Household | Owner-occupied | Renter-occupied |
| No Vehicle | 0 (0.0%) | 17 (12.4%) |
| 1 Vehicle | 95 (54.6%) | 78 (56.9%) |
| 2 Vehicles | 29 (16.7%) | 21 (15.3%) |
| 3 or more Vehicles | 50 (28.7%) | 21 (15.3%) |
| Total | 174 (100.0%) | 137 (100.0%) |
Real Estate & Mortgages in Hana
Real Estate and Mortgage Overview in Hana
| Characteristic | Without Mortgage | With Mortgage |
| Housing Units | 95 | 79 |
| Median Property Value | $612,800 | $397,400 |
| Median Household Income | $50,972 | $0 |
| Monthly Housing Costs | $360 | $0 |
| Real Estate Taxes | - | - |
Property Value by Mortgage Status in Hana
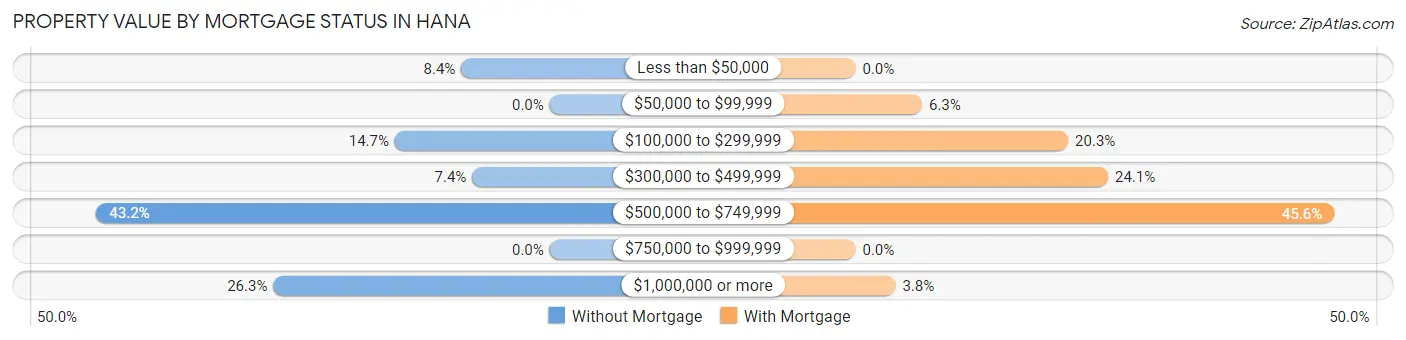
| Property Value | Without Mortgage | With Mortgage |
| Less than $50,000 | 8 (8.4%) | 0 (0.0%) |
| $50,000 to $99,999 | 0 (0.0%) | 5 (6.3%) |
| $100,000 to $299,999 | 14 (14.7%) | 16 (20.3%) |
| $300,000 to $499,999 | 7 (7.4%) | 19 (24.0%) |
| $500,000 to $749,999 | 41 (43.2%) | 36 (45.6%) |
| $750,000 to $999,999 | 0 (0.0%) | 0 (0.0%) |
| $1,000,000 or more | 25 (26.3%) | 3 (3.8%) |
| Total | 95 (100.0%) | 79 (100.0%) |
Household Income by Mortgage Status in Hana
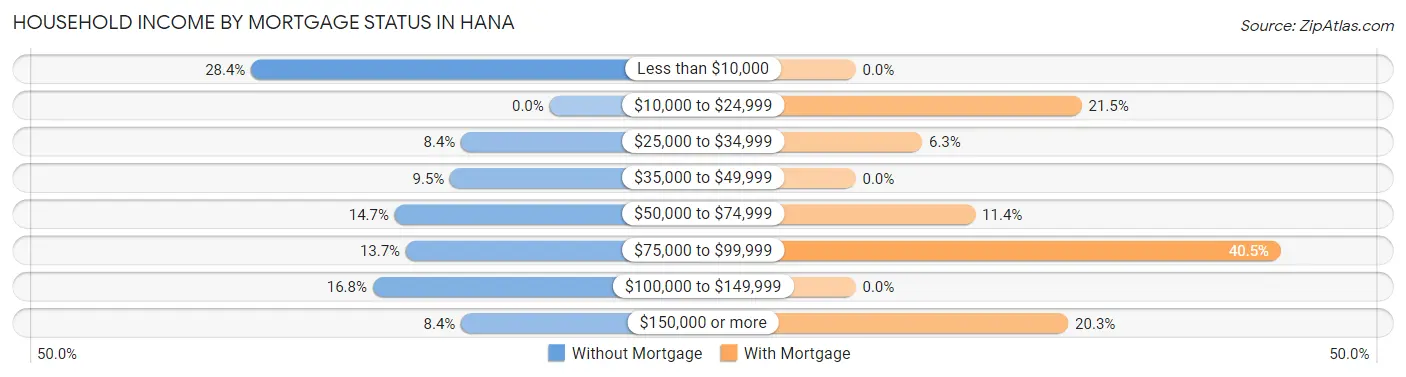
| Household Income | Without Mortgage | With Mortgage |
| Less than $10,000 | 27 (28.4%) | 0 (0.0%) |
| $10,000 to $24,999 | 0 (0.0%) | 17 (21.5%) |
| $25,000 to $34,999 | 8 (8.4%) | 5 (6.3%) |
| $35,000 to $49,999 | 9 (9.5%) | 0 (0.0%) |
| $50,000 to $74,999 | 14 (14.7%) | 9 (11.4%) |
| $75,000 to $99,999 | 13 (13.7%) | 32 (40.5%) |
| $100,000 to $149,999 | 16 (16.8%) | 0 (0.0%) |
| $150,000 or more | 8 (8.4%) | 16 (20.3%) |
| Total | 95 (100.0%) | 79 (100.0%) |
Property Value to Household Income Ratio in Hana
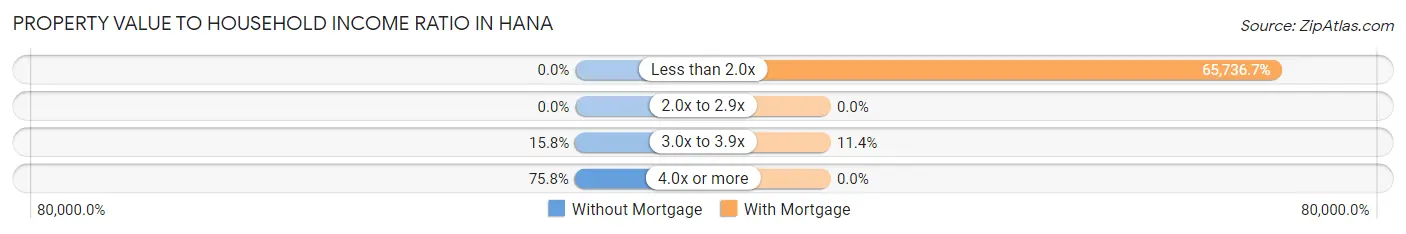
| Value-to-Income Ratio | Without Mortgage | With Mortgage |
| Less than 2.0x | 0 (0.0%) | 51,932 (65,736.7%) |
| 2.0x to 2.9x | 0 (0.0%) | 0 (0.0%) |
| 3.0x to 3.9x | 15 (15.8%) | 9 (11.4%) |
| 4.0x or more | 72 (75.8%) | 0 (0.0%) |
| Total | 95 (100.0%) | 79 (100.0%) |
Real Estate Taxes by Mortgage Status in Hana
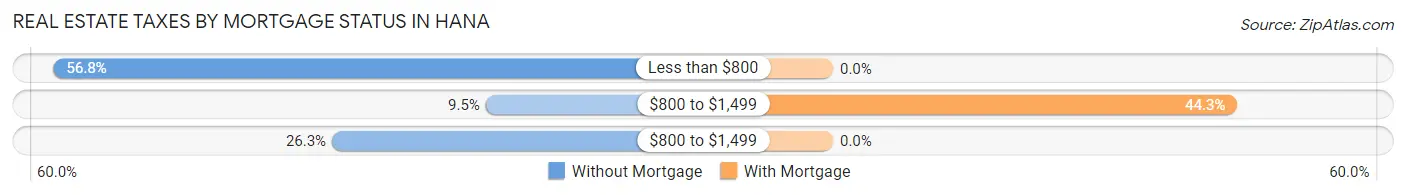
| Property Taxes | Without Mortgage | With Mortgage |
| Less than $800 | 54 (56.8%) | 0 (0.0%) |
| $800 to $1,499 | 9 (9.5%) | 35 (44.3%) |
| $800 to $1,499 | 25 (26.3%) | 0 (0.0%) |
| Total | 95 (100.0%) | 79 (100.0%) |
Health & Disability in Hana
Health Insurance Coverage by Age in Hana
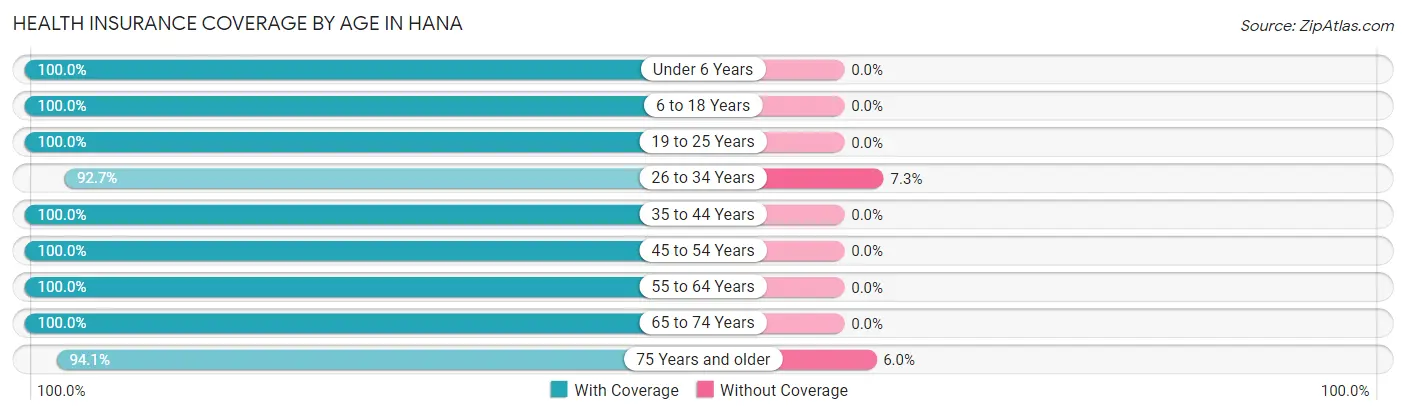
| Age Bracket | With Coverage | Without Coverage |
| Under 6 Years | 36 (100.0%) | 0 (0.0%) |
| 6 to 18 Years | 62 (100.0%) | 0 (0.0%) |
| 19 to 25 Years | 44 (100.0%) | 0 (0.0%) |
| 26 to 34 Years | 101 (92.7%) | 8 (7.3%) |
| 35 to 44 Years | 56 (100.0%) | 0 (0.0%) |
| 45 to 54 Years | 140 (100.0%) | 0 (0.0%) |
| 55 to 64 Years | 97 (100.0%) | 0 (0.0%) |
| 65 to 74 Years | 103 (100.0%) | 0 (0.0%) |
| 75 Years and older | 79 (94.1%) | 5 (5.9%) |
| Total | 718 (98.2%) | 13 (1.8%) |
Health Insurance Coverage by Citizenship Status in Hana
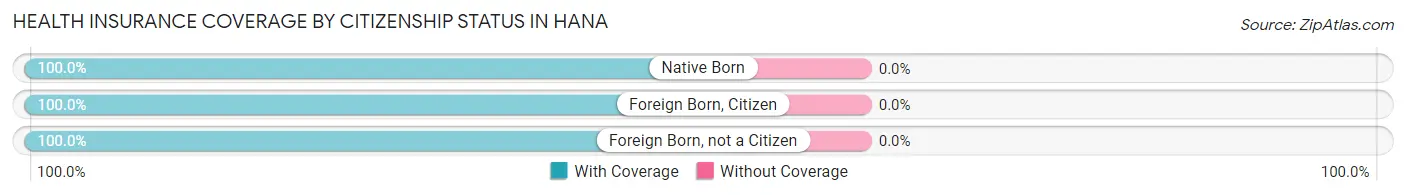
| Citizenship Status | With Coverage | Without Coverage |
| Native Born | 36 (100.0%) | 0 (0.0%) |
| Foreign Born, Citizen | 62 (100.0%) | 0 (0.0%) |
| Foreign Born, not a Citizen | 44 (100.0%) | 0 (0.0%) |
Health Insurance Coverage by Household Income in Hana
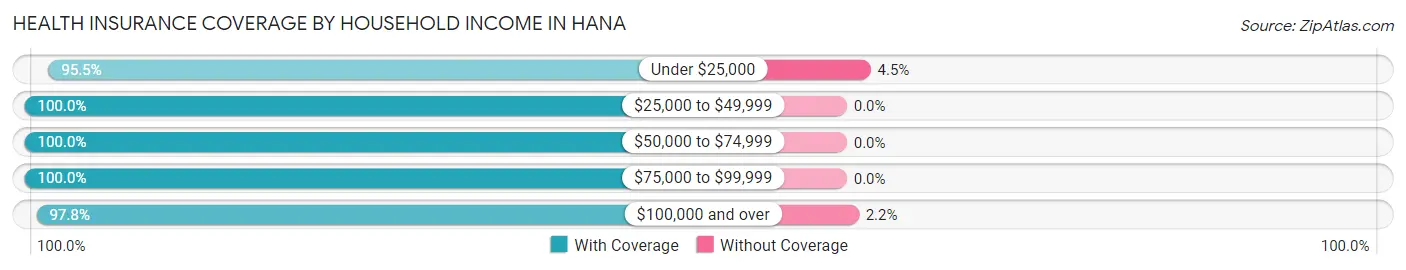
| Household Income | With Coverage | Without Coverage |
| Under $25,000 | 107 (95.5%) | 5 (4.5%) |
| $25,000 to $49,999 | 136 (100.0%) | 0 (0.0%) |
| $50,000 to $74,999 | 98 (100.0%) | 0 (0.0%) |
| $75,000 to $99,999 | 27 (100.0%) | 0 (0.0%) |
| $100,000 and over | 350 (97.8%) | 8 (2.2%) |
Public vs Private Health Insurance Coverage by Age in Hana
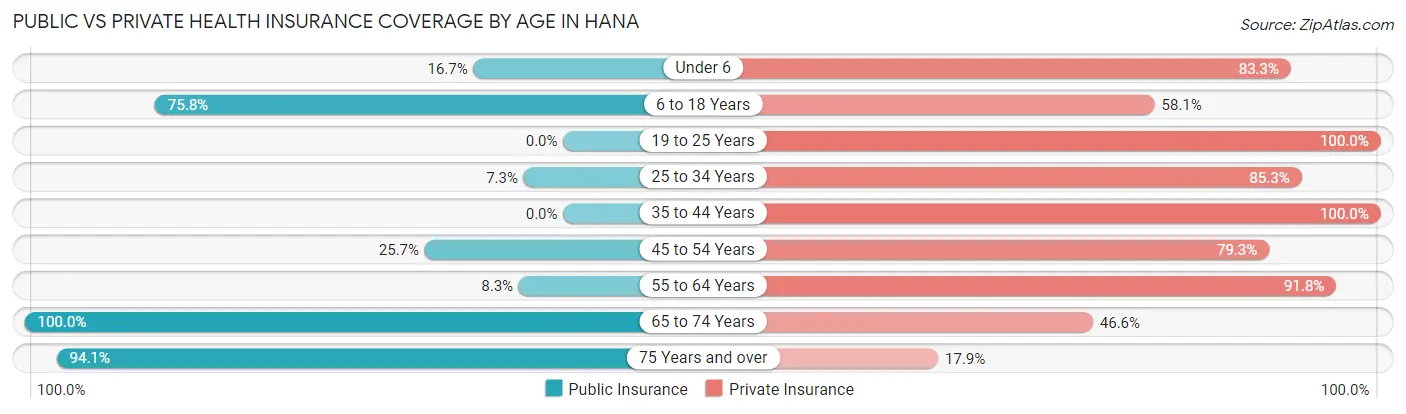
| Age Bracket | Public Insurance | Private Insurance |
| Under 6 | 6 (16.7%) | 30 (83.3%) |
| 6 to 18 Years | 47 (75.8%) | 36 (58.1%) |
| 19 to 25 Years | 0 (0.0%) | 44 (100.0%) |
| 25 to 34 Years | 8 (7.3%) | 93 (85.3%) |
| 35 to 44 Years | 0 (0.0%) | 56 (100.0%) |
| 45 to 54 Years | 36 (25.7%) | 111 (79.3%) |
| 55 to 64 Years | 8 (8.3%) | 89 (91.7%) |
| 65 to 74 Years | 103 (100.0%) | 48 (46.6%) |
| 75 Years and over | 79 (94.1%) | 15 (17.9%) |
| Total | 287 (39.3%) | 522 (71.4%) |
Disability Status by Sex by Age in Hana
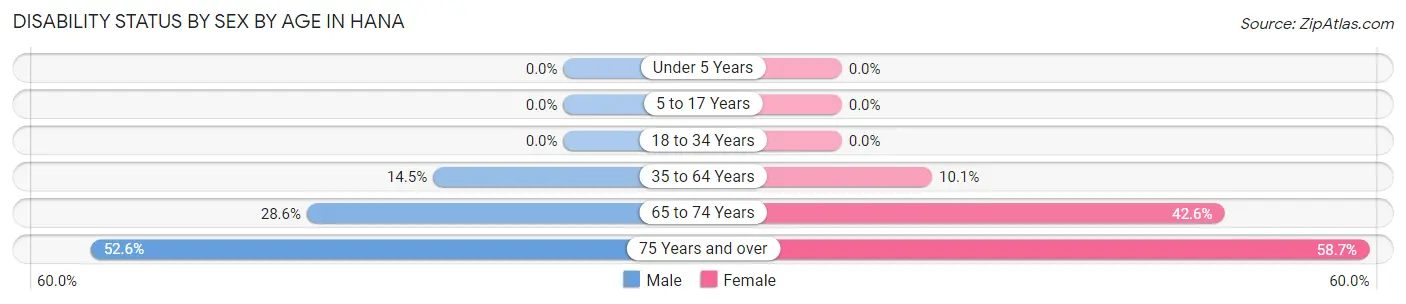
| Age Bracket | Male | Female |
| Under 5 Years | 0 (0.0%) | 0 (0.0%) |
| 5 to 17 Years | 0 (0.0%) | 0 (0.0%) |
| 18 to 34 Years | 0 (0.0%) | 0 (0.0%) |
| 35 to 64 Years | 18 (14.5%) | 17 (10.1%) |
| 65 to 74 Years | 14 (28.6%) | 23 (42.6%) |
| 75 Years and over | 20 (52.6%) | 27 (58.7%) |
Disability Class by Sex by Age in Hana
Disability Class: Hearing Difficulty
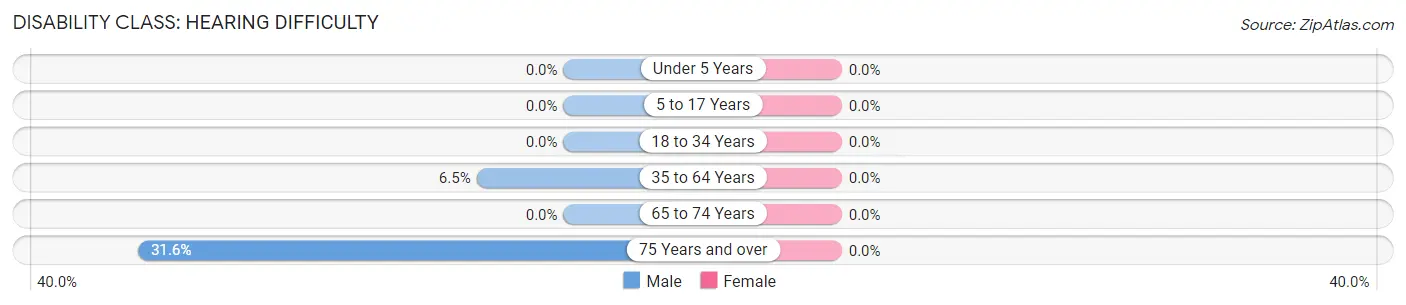
| Age Bracket | Male | Female |
| Under 5 Years | 0 (0.0%) | 0 (0.0%) |
| 5 to 17 Years | 0 (0.0%) | 0 (0.0%) |
| 18 to 34 Years | 0 (0.0%) | 0 (0.0%) |
| 35 to 64 Years | 8 (6.5%) | 0 (0.0%) |
| 65 to 74 Years | 0 (0.0%) | 0 (0.0%) |
| 75 Years and over | 12 (31.6%) | 0 (0.0%) |
Disability Class: Vision Difficulty
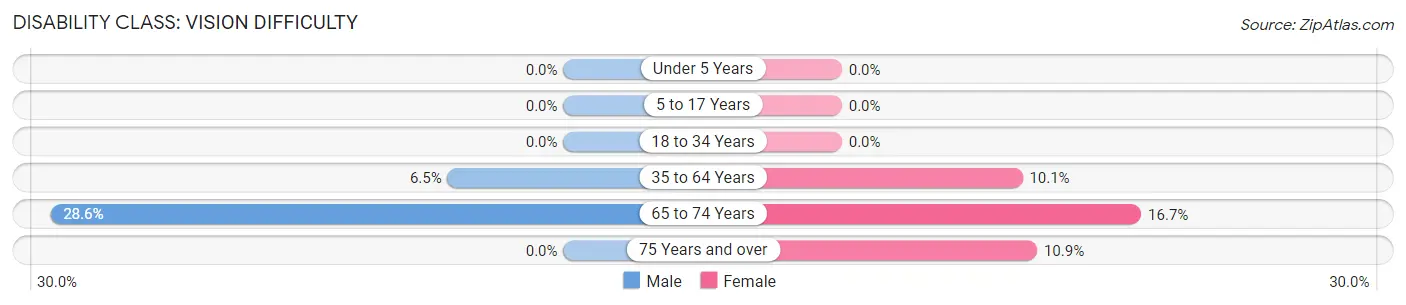
| Age Bracket | Male | Female |
| Under 5 Years | 0 (0.0%) | 0 (0.0%) |
| 5 to 17 Years | 0 (0.0%) | 0 (0.0%) |
| 18 to 34 Years | 0 (0.0%) | 0 (0.0%) |
| 35 to 64 Years | 8 (6.5%) | 17 (10.1%) |
| 65 to 74 Years | 14 (28.6%) | 9 (16.7%) |
| 75 Years and over | 0 (0.0%) | 5 (10.9%) |
Disability Class: Cognitive Difficulty
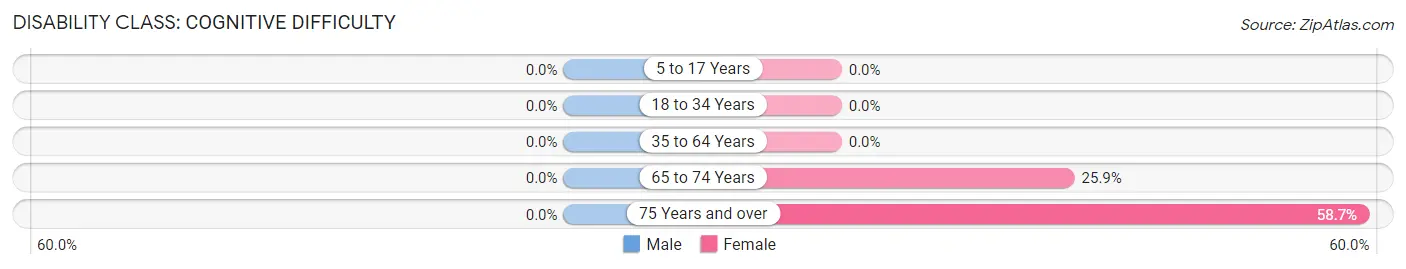
| Age Bracket | Male | Female |
| 5 to 17 Years | 0 (0.0%) | 0 (0.0%) |
| 18 to 34 Years | 0 (0.0%) | 0 (0.0%) |
| 35 to 64 Years | 0 (0.0%) | 0 (0.0%) |
| 65 to 74 Years | 0 (0.0%) | 14 (25.9%) |
| 75 Years and over | 0 (0.0%) | 27 (58.7%) |
Disability Class: Ambulatory Difficulty
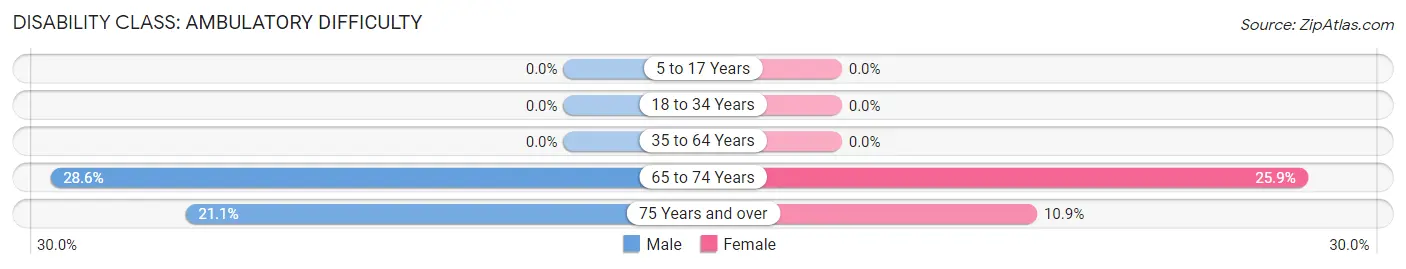
| Age Bracket | Male | Female |
| 5 to 17 Years | 0 (0.0%) | 0 (0.0%) |
| 18 to 34 Years | 0 (0.0%) | 0 (0.0%) |
| 35 to 64 Years | 0 (0.0%) | 0 (0.0%) |
| 65 to 74 Years | 14 (28.6%) | 14 (25.9%) |
| 75 Years and over | 8 (21.0%) | 5 (10.9%) |
Disability Class: Self-Care Difficulty
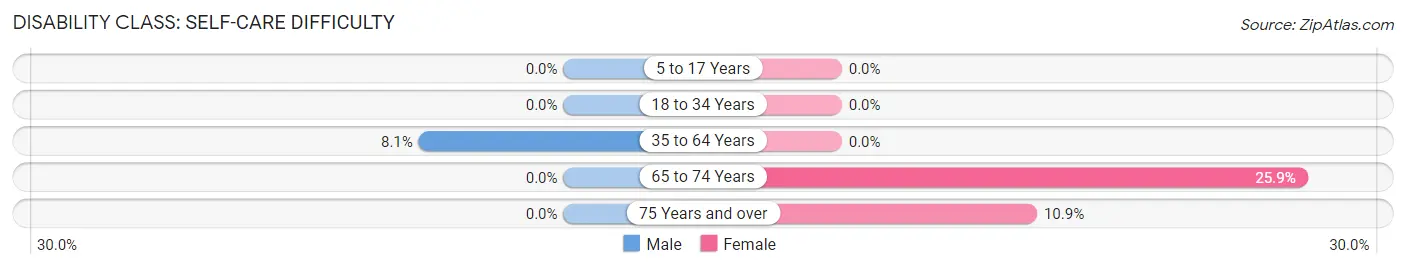
| Age Bracket | Male | Female |
| 5 to 17 Years | 0 (0.0%) | 0 (0.0%) |
| 18 to 34 Years | 0 (0.0%) | 0 (0.0%) |
| 35 to 64 Years | 10 (8.1%) | 0 (0.0%) |
| 65 to 74 Years | 0 (0.0%) | 14 (25.9%) |
| 75 Years and over | 0 (0.0%) | 5 (10.9%) |
Technology Access in Hana
Computing Device Access in Hana
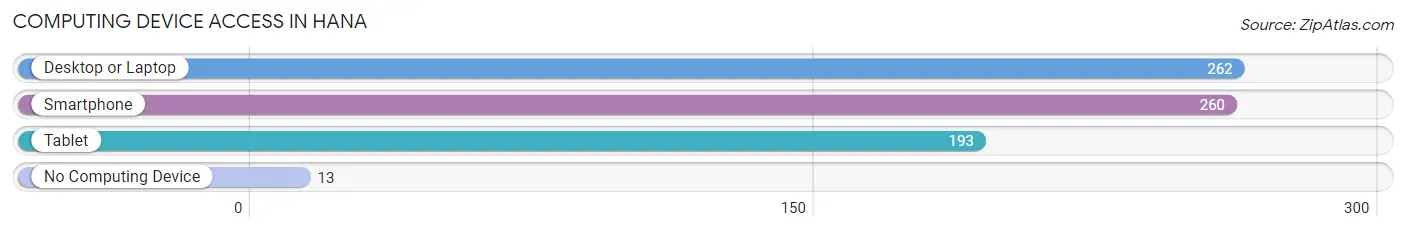
| Device Type | # Households | % Households |
| Desktop or Laptop | 262 | 84.2% |
| Smartphone | 260 | 83.6% |
| Tablet | 193 | 62.1% |
| No Computing Device | 13 | 4.2% |
| Total | 311 | 100.0% |
Internet Access in Hana
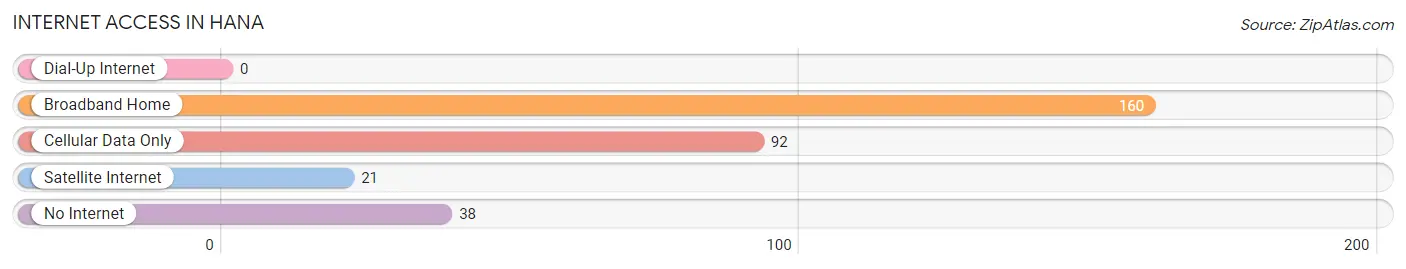
| Internet Type | # Households | % Households |
| Dial-Up Internet | 0 | 0.0% |
| Broadband Home | 160 | 51.4% |
| Cellular Data Only | 92 | 29.6% |
| Satellite Internet | 21 | 6.8% |
| No Internet | 38 | 12.2% |
| Total | 311 | 100.0% |
Hana Summary
Hana is a small town located on the eastern side of the Hawaiian island of Maui. It is known for its stunning natural beauty, its laid-back atmosphere, and its rich cultural heritage. Hana is located on the eastern side of Maui, approximately 50 miles from Kahului, the island’s largest city. The town is situated on the Hana Highway, a winding road that runs along the eastern coast of the island.
Geography
Hana is located on the eastern side of Maui, approximately 50 miles from Kahului, the island’s largest city. The town is situated on the Hana Highway, a winding road that runs along the eastern coast of the island. The town is surrounded by lush tropical rainforest and is home to numerous waterfalls, streams, and beaches. The town is also home to the Hana Bay, a popular spot for swimming, snorkeling, and kayaking.
Economy
Hana’s economy is largely based on tourism. The town is home to numerous resorts, hotels, and vacation rentals, as well as restaurants, shops, and other businesses catering to visitors. The town is also home to a number of small farms and ranches, which produce a variety of fruits, vegetables, and livestock.
Demographics
As of the 2010 census, the population of Hana was 1,235. The population is predominantly Native Hawaiian, with a small percentage of other ethnicities. The median age of the population is 44. The median household income is $45,000, and the median home value is $400,000.
History
Hana has a long and rich history. The area was first settled by Polynesian voyagers in the 13th century. The town was later settled by Europeans in the early 19th century, and the area was used for sugarcane and pineapple plantations. In the late 19th century, the town was home to a thriving whaling industry. In the early 20th century, the town was home to a large Japanese population, and the area was used for farming and ranching. In the 1950s, the town began to attract tourists, and the area has since become a popular destination for visitors from around the world.
Common Questions
What is Per Capita Income in Hana?
Per Capita income in Hana is $31,013.
What is the Median Family Income in Hana?
Median Family Income in Hana is $72,083.
What is the Median Household income in Hana?
Median Household Income in Hana is $51,188.
What is Income or Wage Gap in Hana?
Income or Wage Gap in Hana is 8.0%.
Women in Hana earn 92.0 cents for every dollar earned by a man.
What is Inequality or Gini Index in Hana?
Inequality or Gini Index in Hana is 0.41.
What is the Total Population of Hana?
Total Population of Hana is 731.
What is the Total Male Population of Hana?
Total Male Population of Hana is 326.
What is the Total Female Population of Hana?
Total Female Population of Hana is 405.
What is the Ratio of Males per 100 Females in Hana?
There are 80.49 Males per 100 Females in Hana.
What is the Ratio of Females per 100 Males in Hana?
There are 124.23 Females per 100 Males in Hana.
What is the Median Population Age in Hana?
Median Population Age in Hana is 51.5 Years.
What is the Average Family Size in Hana
Average Family Size in Hana is 3.5 People.
What is the Average Household Size in Hana
Average Household Size in Hana is 2.4 People.
How Large is the Labor Force in Hana?
There are 406 People in the Labor Forcein in Hana.
What is the Percentage of People in the Labor Force in Hana?
62.8% of People are in the Labor Force in Hana.
What is the Unemployment Rate in Hana?
Unemployment Rate in Hana is 17.0%.