Auburn, MI Map & Demographics
Auburn Map
Auburn Overview
$38,634
PER CAPITA INCOME
$72,583
AVG FAMILY INCOME
$62,589
AVG HOUSEHOLD INCOME
17.1%
WAGE / INCOME GAP [ % ]
82.9¢/ $1
WAGE / INCOME GAP [ $ ]
0.37
INEQUALITY / GINI INDEX
1,921
TOTAL POPULATION
942
MALE POPULATION
979
FEMALE POPULATION
96.22
MALES / 100 FEMALES
103.93
FEMALES / 100 MALES
46.8
MEDIAN AGE
2.5
AVG FAMILY SIZE
1.9
AVG HOUSEHOLD SIZE
1,059
LABOR FORCE [ PEOPLE ]
63.7%
PERCENT IN LABOR FORCE
2.7%
UNEMPLOYMENT RATE
Auburn Zip Codes
Auburn Area Codes
Income in Auburn
Income Overview in Auburn
Per Capita Income in Auburn is $38,634, while median incomes of families and households are $72,583 and $62,589 respectively.
| Characteristic | Number | Measure |
| Per Capita Income | 1,921 | $38,634 |
| Median Family Income | 515 | $72,583 |
| Mean Family Income | 515 | $87,784 |
| Median Household Income | 1,010 | $62,589 |
| Mean Household Income | 1,010 | $72,503 |
| Income Deficit | 515 | $0 |
| Wage / Income Gap (%) | 1,921 | 17.14% |
| Wage / Income Gap ($) | 1,921 | 82.86¢ per $1 |
| Gini / Inequality Index | 1,921 | 0.37 |
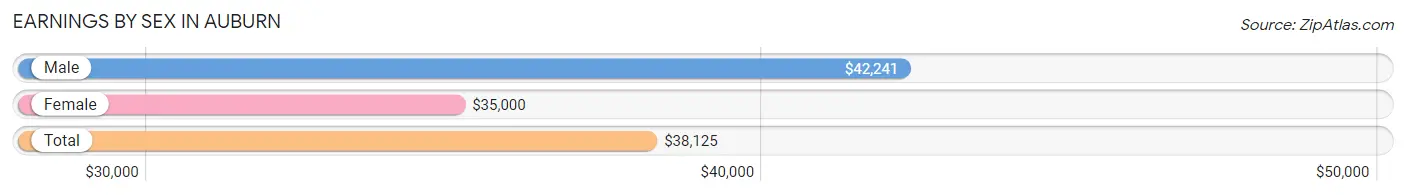
Earnings by Sex in Auburn
Average Earnings in Auburn are $38,125, $42,241 for men and $35,000 for women, a difference of 17.1%.
| Sex | Number | Average Earnings |
| Male | 556 (50.1%) | $42,241 |
| Female | 554 (49.9%) | $35,000 |
| Total | 1,110 (100.0%) | $38,125 |
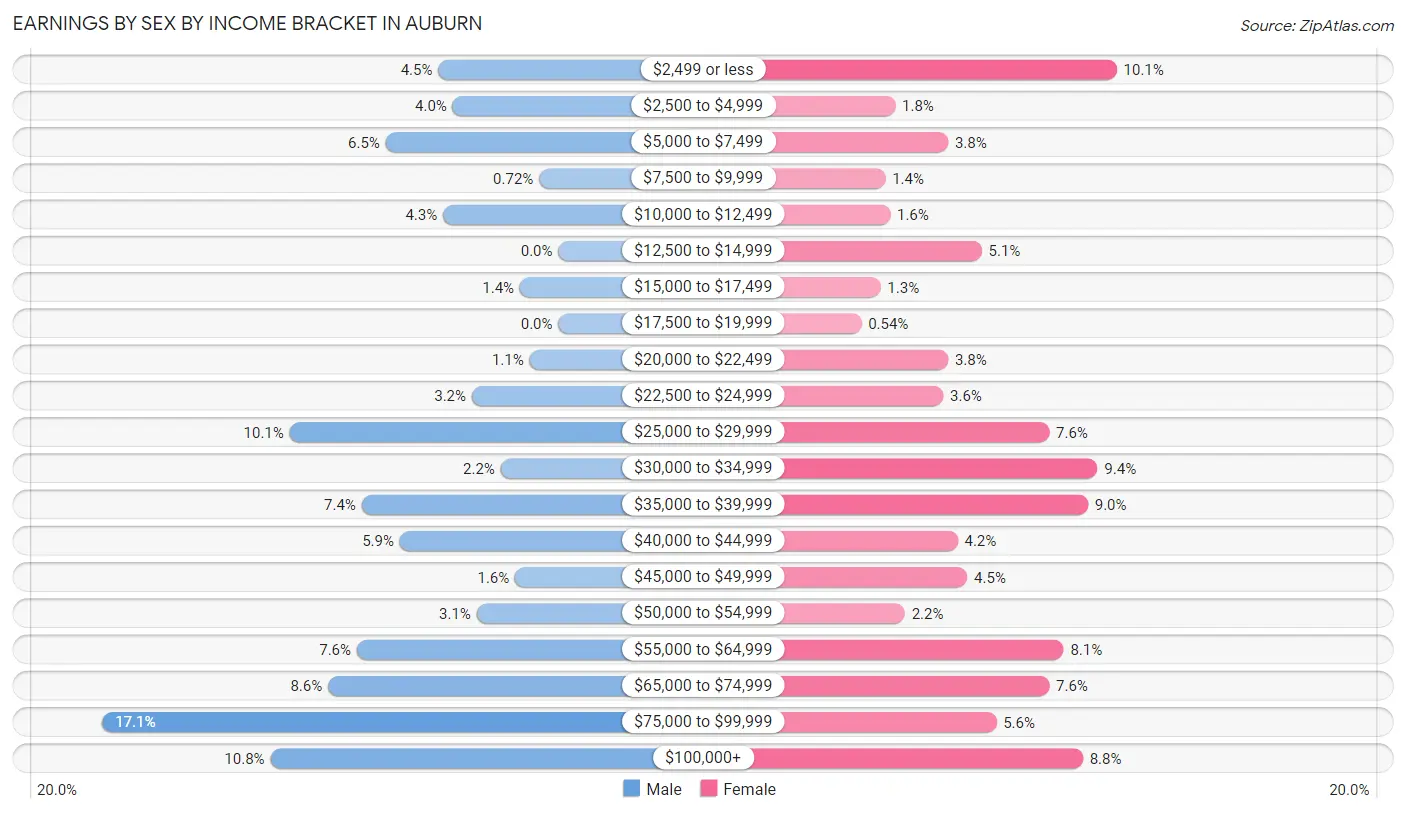
Earnings by Sex by Income Bracket in Auburn
The most common earnings brackets in Auburn are $75,000 to $99,999 for men (95 | 17.1%) and $2,499 or less for women (56 | 10.1%).
| Income | Male | Female |
| $2,499 or less | 25 (4.5%) | 56 (10.1%) |
| $2,500 to $4,999 | 22 (4.0%) | 10 (1.8%) |
| $5,000 to $7,499 | 36 (6.5%) | 21 (3.8%) |
| $7,500 to $9,999 | 4 (0.7%) | 8 (1.4%) |
| $10,000 to $12,499 | 24 (4.3%) | 9 (1.6%) |
| $12,500 to $14,999 | 0 (0.0%) | 28 (5.1%) |
| $15,000 to $17,499 | 8 (1.4%) | 7 (1.3%) |
| $17,500 to $19,999 | 0 (0.0%) | 3 (0.5%) |
| $20,000 to $22,499 | 6 (1.1%) | 21 (3.8%) |
| $22,500 to $24,999 | 18 (3.2%) | 20 (3.6%) |
| $25,000 to $29,999 | 56 (10.1%) | 42 (7.6%) |
| $30,000 to $34,999 | 12 (2.2%) | 52 (9.4%) |
| $35,000 to $39,999 | 41 (7.4%) | 50 (9.0%) |
| $40,000 to $44,999 | 33 (5.9%) | 23 (4.2%) |
| $45,000 to $49,999 | 9 (1.6%) | 25 (4.5%) |
| $50,000 to $54,999 | 17 (3.1%) | 12 (2.2%) |
| $55,000 to $64,999 | 42 (7.5%) | 45 (8.1%) |
| $65,000 to $74,999 | 48 (8.6%) | 42 (7.6%) |
| $75,000 to $99,999 | 95 (17.1%) | 31 (5.6%) |
| $100,000+ | 60 (10.8%) | 49 (8.8%) |
| Total | 556 (100.0%) | 554 (100.0%) |
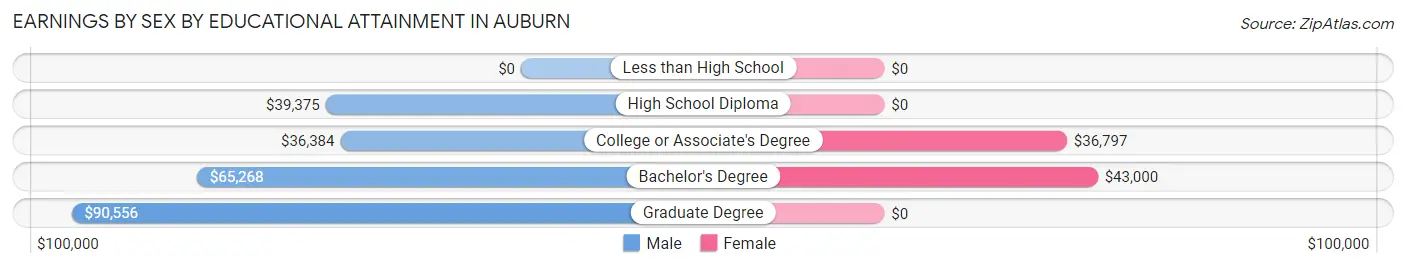
Earnings by Sex by Educational Attainment in Auburn
Average earnings in Auburn are $54,191 for men and $36,635 for women, a difference of 32.4%. Men with an educational attainment of graduate degree enjoy the highest average annual earnings of $90,556, while those with college or associate's degree education earn the least with $36,384. Women with an educational attainment of bachelor's degree earn the most with the average annual earnings of $43,000, while those with college or associate's degree education have the smallest earnings of $36,797.
| Educational Attainment | Male Income | Female Income |
| Less than High School | - | - |
| High School Diploma | $39,375 | $0 |
| College or Associate's Degree | $36,384 | $36,797 |
| Bachelor's Degree | $65,268 | $43,000 |
| Graduate Degree | $90,556 | $0 |
| Total | $54,191 | $36,635 |
Family Income in Auburn
Family Income Brackets in Auburn
According to the Auburn family income data, there are 130 families falling into the $100,000 to $149,999 income range, which is the most common income bracket and makes up 25.2% of all families.
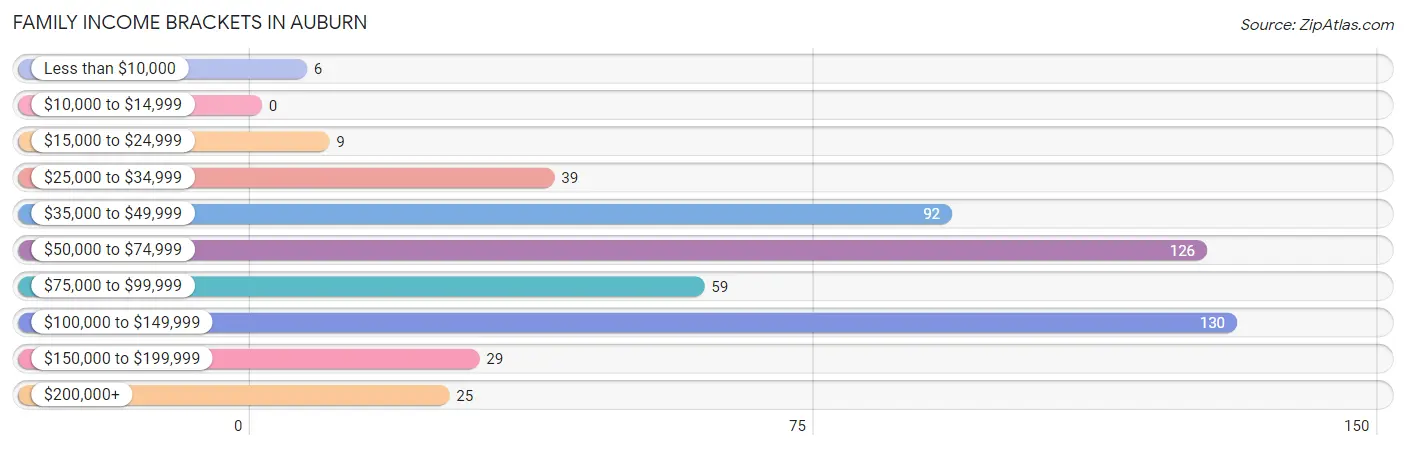
| Income Bracket | # Families | % Families |
| Less than $10,000 | 6 | 1.2% |
| $10,000 to $14,999 | 0 | 0.0% |
| $15,000 to $24,999 | 9 | 1.7% |
| $25,000 to $34,999 | 39 | 7.6% |
| $35,000 to $49,999 | 92 | 17.9% |
| $50,000 to $74,999 | 126 | 24.5% |
| $75,000 to $99,999 | 59 | 11.5% |
| $100,000 to $149,999 | 130 | 25.2% |
| $150,000 to $199,999 | 29 | 5.6% |
| $200,000+ | 25 | 4.9% |
Family Income by Famaliy Size in Auburn
4-person families (84 | 16.3%) account for the highest median family income in Auburn with $76,912 per family, while 2-person families (326 | 63.3%) have the highest median income of $30,178 per family member.
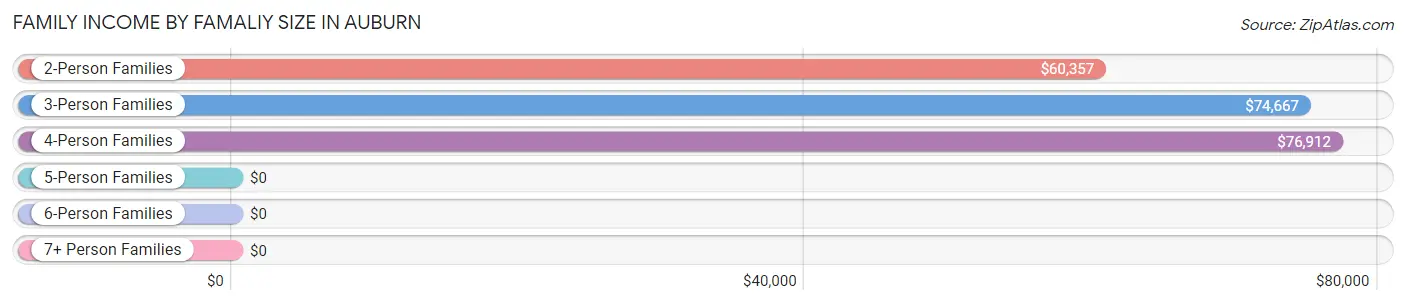
| Income Bracket | # Families | Median Income |
| 2-Person Families | 326 (63.3%) | $60,357 |
| 3-Person Families | 80 (15.5%) | $74,667 |
| 4-Person Families | 84 (16.3%) | $76,912 |
| 5-Person Families | 16 (3.1%) | $0 |
| 6-Person Families | 1 (0.2%) | $0 |
| 7+ Person Families | 8 (1.5%) | $0 |
| Total | 515 (100.0%) | $72,583 |
Family Income by Number of Earners in Auburn
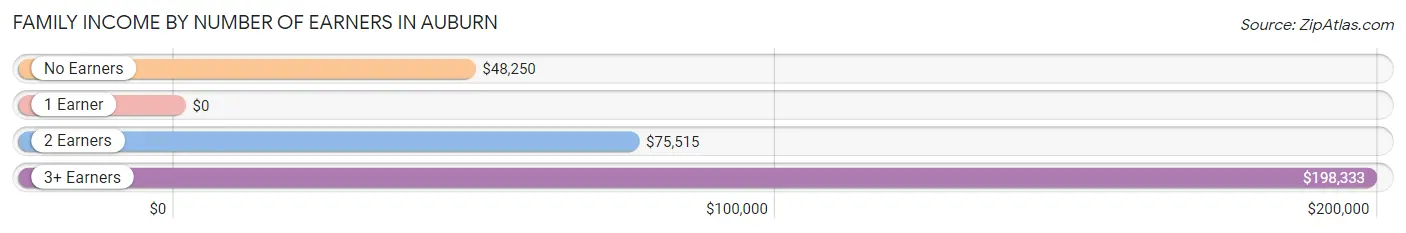
| Number of Earners | # Families | Median Income |
| No Earners | 135 (26.2%) | $48,250 |
| 1 Earner | 101 (19.6%) | $0 |
| 2 Earners | 231 (44.9%) | $75,515 |
| 3+ Earners | 48 (9.3%) | $198,333 |
| Total | 515 (100.0%) | $72,583 |
Household Income in Auburn
Household Income Brackets in Auburn
With 193 households falling in the category, the $35,000 to $49,999 income range is the most frequent in Auburn, accounting for 19.1% of all households. In contrast, only 14 households (1.4%) fall into the $10,000 to $14,999 income bracket, making it the least populous group.
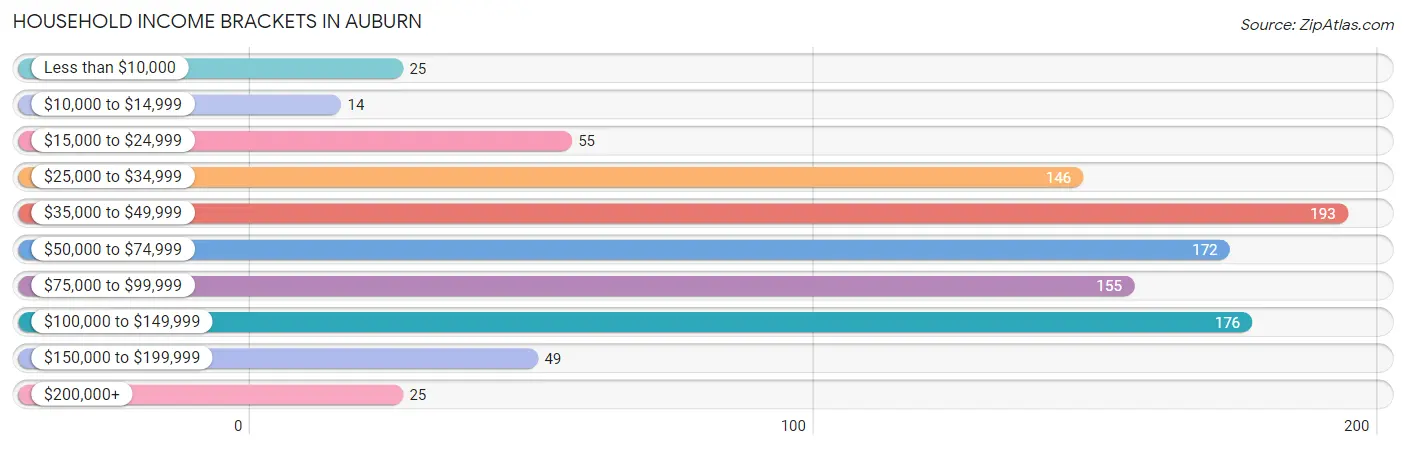
| Income Bracket | # Households | % Households |
| Less than $10,000 | 25 | 2.5% |
| $10,000 to $14,999 | 14 | 1.4% |
| $15,000 to $24,999 | 55 | 5.4% |
| $25,000 to $34,999 | 146 | 14.5% |
| $35,000 to $49,999 | 193 | 19.1% |
| $50,000 to $74,999 | 172 | 17.0% |
| $75,000 to $99,999 | 155 | 15.3% |
| $100,000 to $149,999 | 176 | 17.4% |
| $150,000 to $199,999 | 49 | 4.9% |
| $200,000+ | 25 | 2.5% |
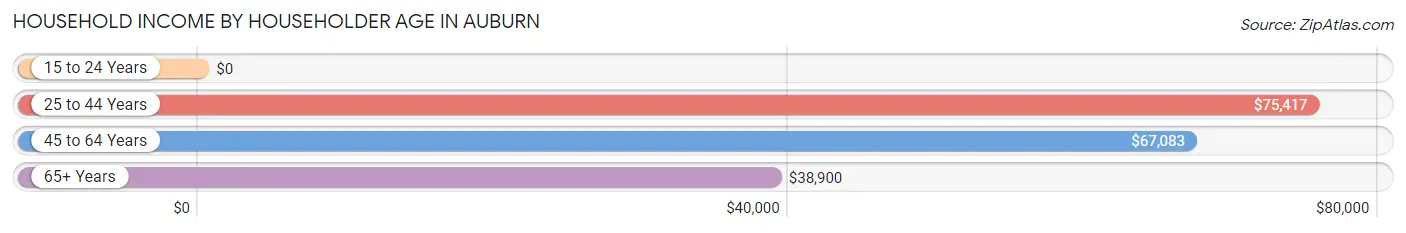
Household Income by Householder Age in Auburn
The median household income in Auburn is $62,589, with the highest median household income of $75,417 found in the 25 to 44 years age bracket for the primary householder. A total of 338 households (33.5%) fall into this category. Meanwhile, the 15 to 24 years age bracket for the primary householder has the lowest median household income of $0, with 29 households (2.9%) in this group.
| Income Bracket | # Households | Median Income |
| 15 to 24 Years | 29 (2.9%) | $0 |
| 25 to 44 Years | 338 (33.5%) | $75,417 |
| 45 to 64 Years | 313 (31.0%) | $67,083 |
| 65+ Years | 330 (32.7%) | $38,900 |
| Total | 1,010 (100.0%) | $62,589 |
Poverty in Auburn
Income Below Poverty by Sex and Age in Auburn
With 5.5% poverty level for males and 6.6% for females among the residents of Auburn, 15 year old males and 55 to 64 year old females are the most vulnerable to poverty, with 7 males (100.0%) and 18 females (18.0%) in their respective age groups living below the poverty level.
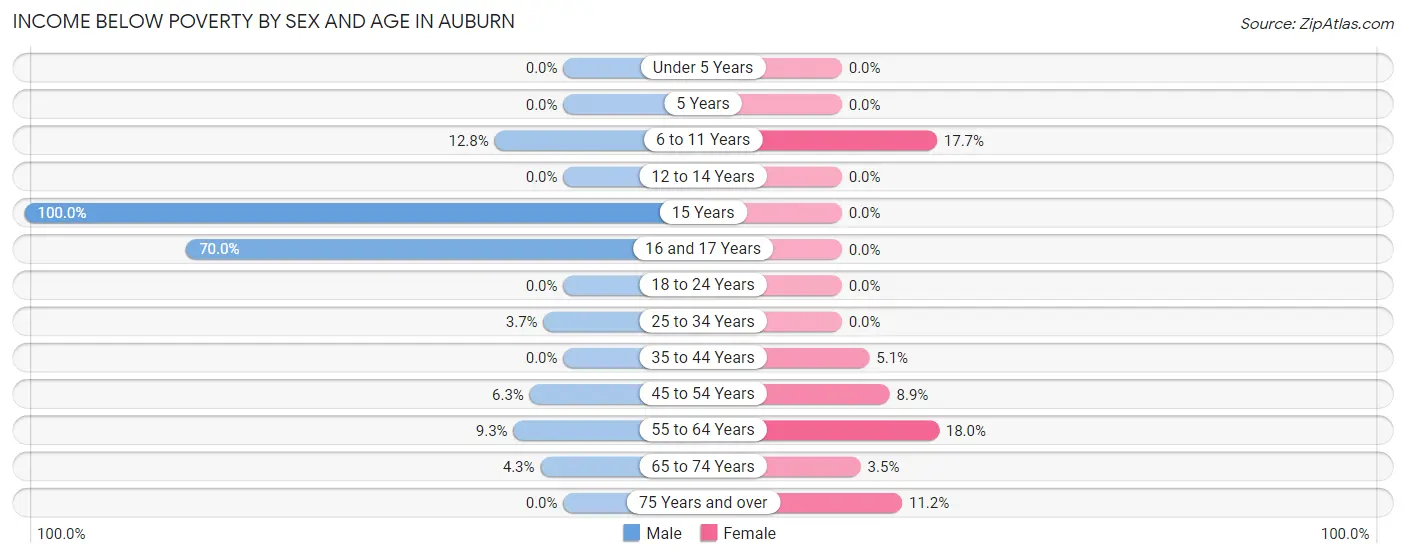
| Age Bracket | Male | Female |
| Under 5 Years | 0 (0.0%) | 0 (0.0%) |
| 5 Years | 0 (0.0%) | 0 (0.0%) |
| 6 to 11 Years | 6 (12.8%) | 6 (17.6%) |
| 12 to 14 Years | 0 (0.0%) | 0 (0.0%) |
| 15 Years | 7 (100.0%) | 0 (0.0%) |
| 16 and 17 Years | 7 (70.0%) | 0 (0.0%) |
| 18 to 24 Years | 0 (0.0%) | 0 (0.0%) |
| 25 to 34 Years | 6 (3.7%) | 0 (0.0%) |
| 35 to 44 Years | 0 (0.0%) | 7 (5.1%) |
| 45 to 54 Years | 7 (6.2%) | 11 (8.9%) |
| 55 to 64 Years | 15 (9.3%) | 18 (18.0%) |
| 65 to 74 Years | 4 (4.3%) | 5 (3.5%) |
| 75 Years and over | 0 (0.0%) | 18 (11.2%) |
| Total | 52 (5.5%) | 65 (6.6%) |
Income Above Poverty by Sex and Age in Auburn
According to the poverty statistics in Auburn, males aged under 5 years and females aged under 5 years are the age groups that are most secure financially, with 100.0% of males and 100.0% of females in these age groups living above the poverty line.
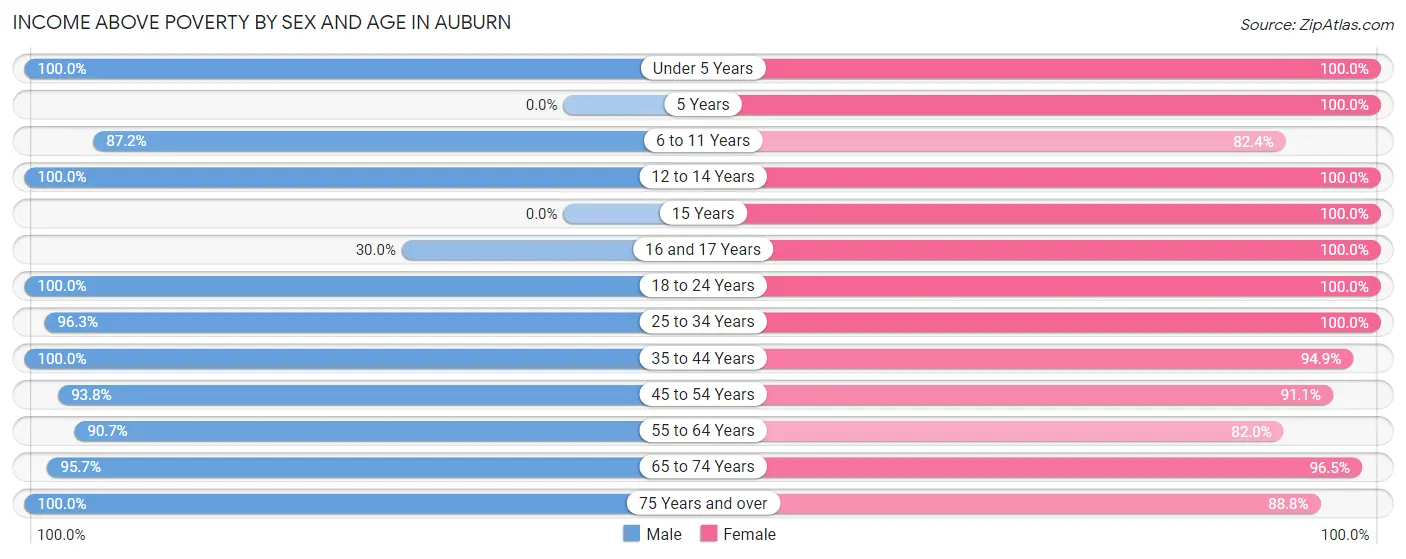
| Age Bracket | Male | Female |
| Under 5 Years | 76 (100.0%) | 26 (100.0%) |
| 5 Years | 0 (0.0%) | 11 (100.0%) |
| 6 to 11 Years | 41 (87.2%) | 28 (82.4%) |
| 12 to 14 Years | 19 (100.0%) | 29 (100.0%) |
| 15 Years | 0 (0.0%) | 10 (100.0%) |
| 16 and 17 Years | 3 (30.0%) | 16 (100.0%) |
| 18 to 24 Years | 57 (100.0%) | 69 (100.0%) |
| 25 to 34 Years | 156 (96.3%) | 119 (100.0%) |
| 35 to 44 Years | 94 (100.0%) | 130 (94.9%) |
| 45 to 54 Years | 105 (93.8%) | 113 (91.1%) |
| 55 to 64 Years | 147 (90.7%) | 82 (82.0%) |
| 65 to 74 Years | 90 (95.7%) | 138 (96.5%) |
| 75 Years and over | 102 (100.0%) | 143 (88.8%) |
| Total | 890 (94.5%) | 914 (93.4%) |
Income Below Poverty Among Married-Couple Families in Auburn
The poverty statistics for married-couple families in Auburn show that 1.1% or 4 of the total 368 families live below the poverty line. Families with no children have the highest poverty rate of 1.5%, comprising of 4 families. On the other hand, families with 1 or 2 children have the lowest poverty rate of 0.0%, which includes 0 families.
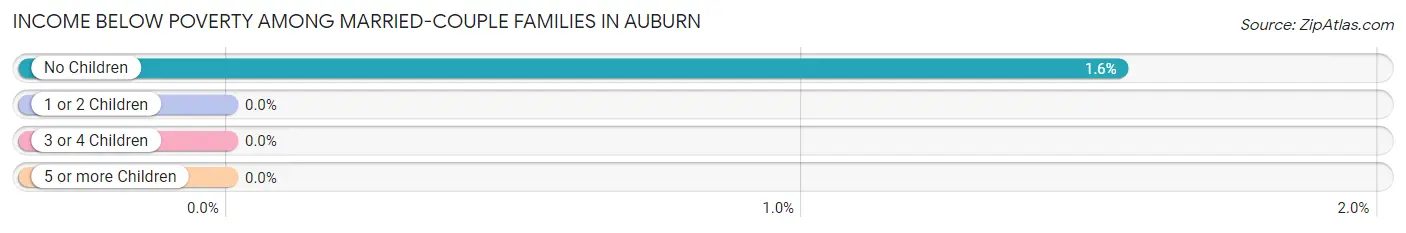
| Children | Above Poverty | Below Poverty |
| No Children | 254 (98.5%) | 4 (1.5%) |
| 1 or 2 Children | 101 (100.0%) | 0 (0.0%) |
| 3 or 4 Children | 9 (100.0%) | 0 (0.0%) |
| 5 or more Children | 0 (0.0%) | 0 (0.0%) |
| Total | 364 (98.9%) | 4 (1.1%) |
Income Below Poverty Among Single-Parent Households in Auburn
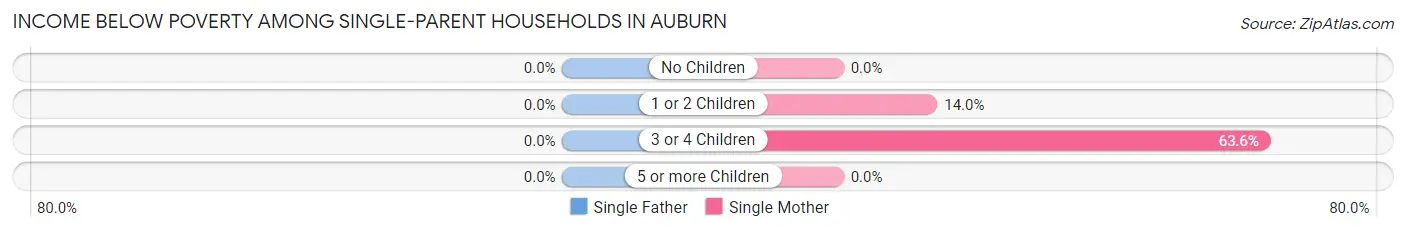
| Children | Single Father | Single Mother |
| No Children | 0 (0.0%) | 0 (0.0%) |
| 1 or 2 Children | 0 (0.0%) | 6 (14.0%) |
| 3 or 4 Children | 0 (0.0%) | 7 (63.6%) |
| 5 or more Children | 0 (0.0%) | 0 (0.0%) |
| Total | 0 (0.0%) | 13 (12.6%) |
Income Below Poverty Among Married-Couple vs Single-Parent Households in Auburn
The poverty data for Auburn shows that 4 of the married-couple family households (1.1%) and 13 of the single-parent households (8.8%) are living below the poverty level. Within the married-couple family households, those with no children have the highest poverty rate, with 4 households (1.5%) falling below the poverty line. Among the single-parent households, those with 3 or 4 children have the highest poverty rate, with 7 household (63.6%) living below poverty.
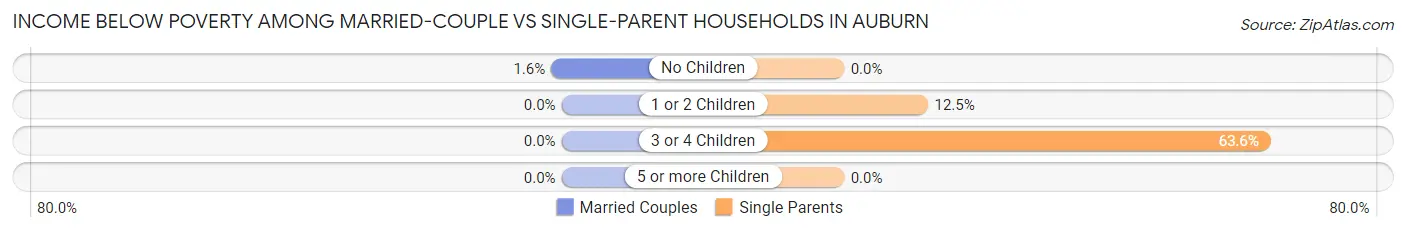
| Children | Married-Couple Families | Single-Parent Households |
| No Children | 4 (1.5%) | 0 (0.0%) |
| 1 or 2 Children | 0 (0.0%) | 6 (12.5%) |
| 3 or 4 Children | 0 (0.0%) | 7 (63.6%) |
| 5 or more Children | 0 (0.0%) | 0 (0.0%) |
| Total | 4 (1.1%) | 13 (8.8%) |
Race in Auburn
The most populous races in Auburn are White / Caucasian (1,803 | 93.9%), Two or more Races (75 | 3.9%), and Black / African American (39 | 2.0%).
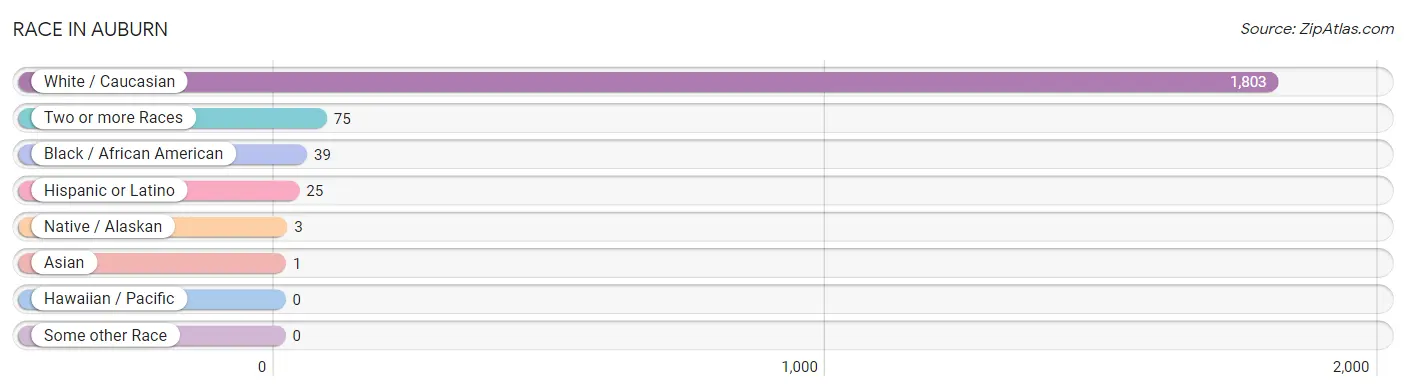
| Race | # Population | % Population |
| Asian | 1 | 0.1% |
| Black / African American | 39 | 2.0% |
| Hawaiian / Pacific | 0 | 0.0% |
| Hispanic or Latino | 25 | 1.3% |
| Native / Alaskan | 3 | 0.2% |
| White / Caucasian | 1,803 | 93.9% |
| Two or more Races | 75 | 3.9% |
| Some other Race | 0 | 0.0% |
| Total | 1,921 | 100.0% |
Ancestry in Auburn
The most populous ancestries reported in Auburn are German (646 | 33.6%), Polish (268 | 14.0%), Irish (226 | 11.8%), English (176 | 9.2%), and French (125 | 6.5%), together accounting for 75.0% of all Auburn residents.
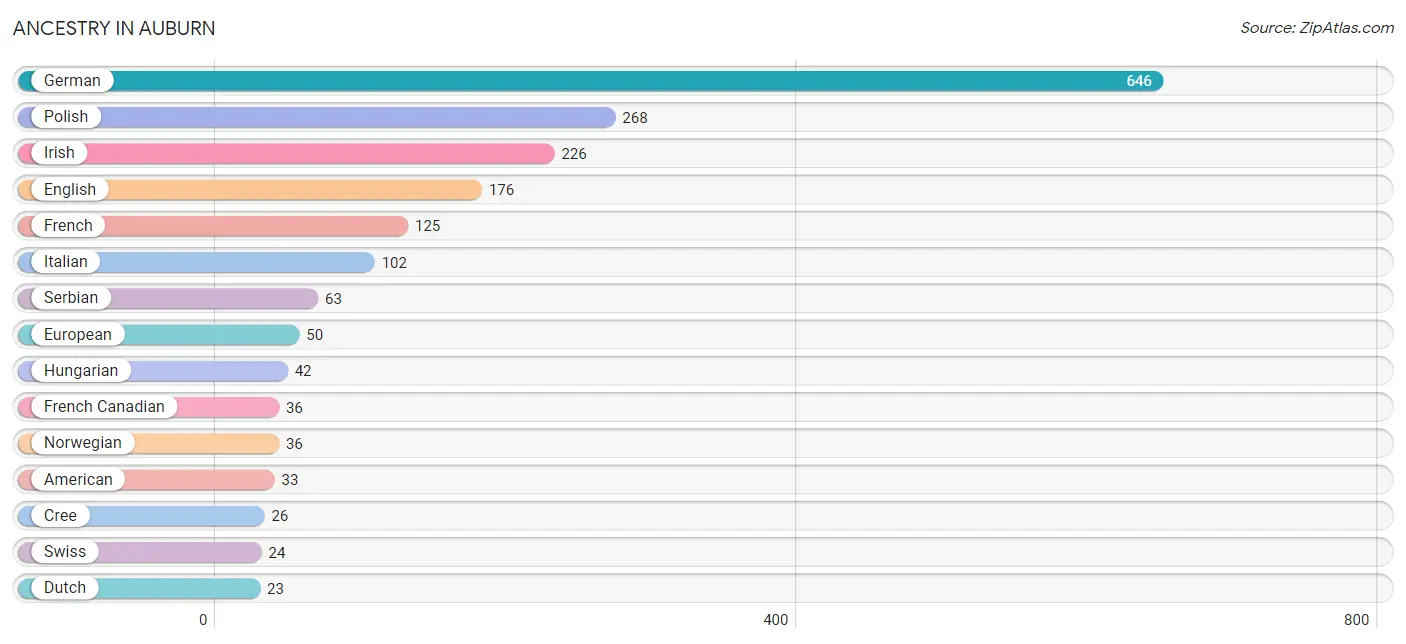
| Ancestry | # Population | % Population |
| American | 33 | 1.7% |
| Apache | 6 | 0.3% |
| Belgian | 7 | 0.4% |
| Bhutanese | 17 | 0.9% |
| British | 4 | 0.2% |
| Canadian | 9 | 0.5% |
| Central American | 6 | 0.3% |
| Cherokee | 6 | 0.3% |
| Chippewa | 3 | 0.2% |
| Costa Rican | 6 | 0.3% |
| Cree | 26 | 1.3% |
| Czech | 12 | 0.6% |
| Dutch | 23 | 1.2% |
| Eastern European | 6 | 0.3% |
| Ecuadorian | 5 | 0.3% |
| English | 176 | 9.2% |
| European | 50 | 2.6% |
| French | 125 | 6.5% |
| French Canadian | 36 | 1.9% |
| German | 646 | 33.6% |
| Greek | 14 | 0.7% |
| Hungarian | 42 | 2.2% |
| Indian (Asian) | 1 | 0.1% |
| Irish | 226 | 11.8% |
| Italian | 102 | 5.3% |
| Mexican | 14 | 0.7% |
| Norwegian | 36 | 1.9% |
| Polish | 268 | 14.0% |
| Russian | 22 | 1.1% |
| Scandinavian | 5 | 0.3% |
| Scotch-Irish | 8 | 0.4% |
| Scottish | 22 | 1.1% |
| Serbian | 63 | 3.3% |
| South American | 5 | 0.3% |
| South American Indian | 3 | 0.2% |
| Swiss | 24 | 1.3% | View All 36 Rows |
Immigrants in Auburn
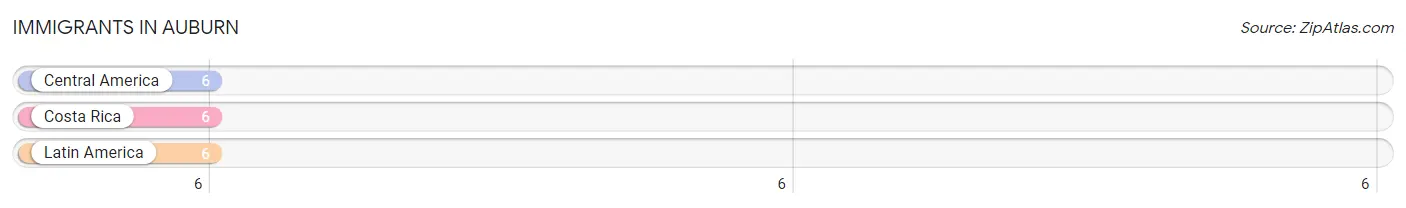
The most numerous immigrant groups reported in Auburn came from Central America (6 | 0.3%), Costa Rica (6 | 0.3%), and Latin America (6 | 0.3%), together accounting for 0.9% of all Auburn residents.
| Immigration Origin | # Population | % Population |
| Central America | 6 | 0.3% |
| Costa Rica | 6 | 0.3% |
| Latin America | 6 | 0.3% | View All 3 Rows |
Sex and Age in Auburn
Sex and Age in Auburn
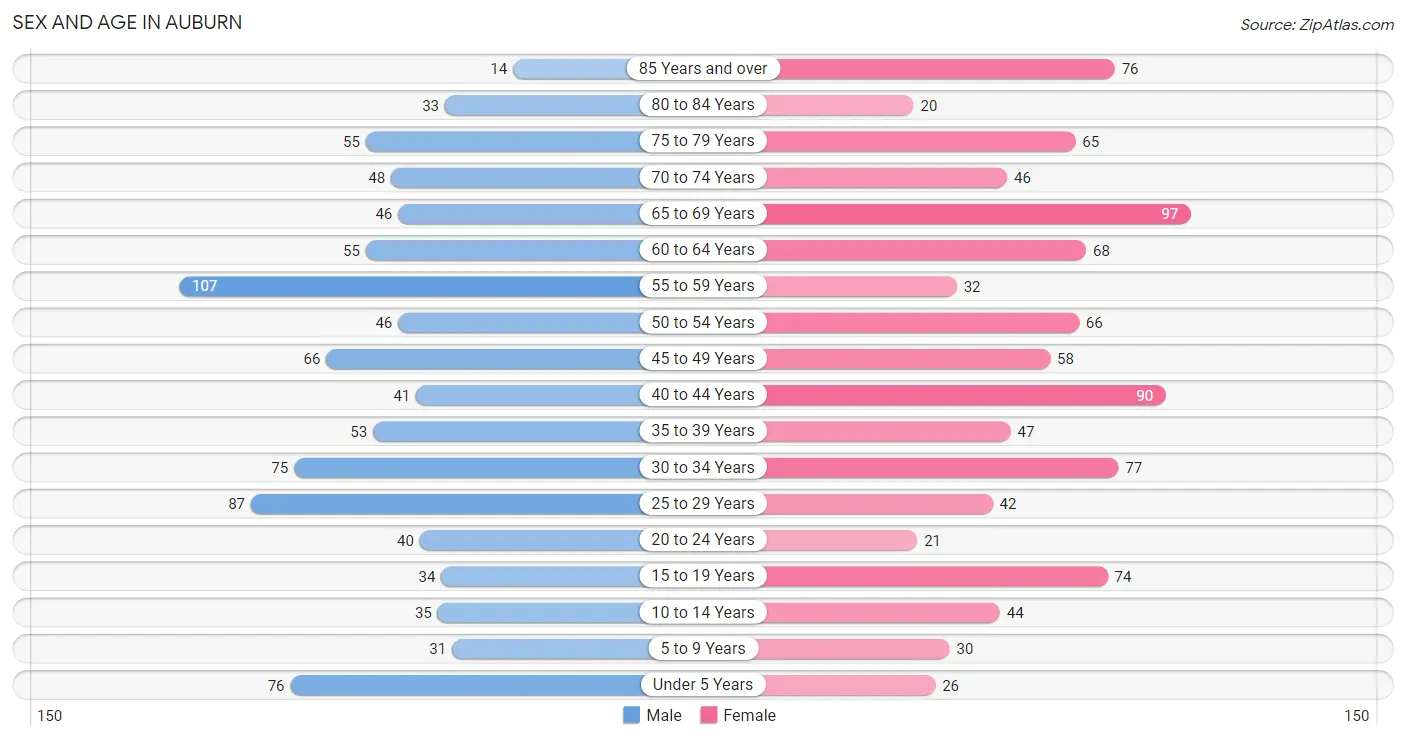
The most populous age groups in Auburn are 55 to 59 Years (107 | 11.4%) for men and 65 to 69 Years (97 | 9.9%) for women.
| Age Bracket | Male | Female |
| Under 5 Years | 76 (8.1%) | 26 (2.7%) |
| 5 to 9 Years | 31 (3.3%) | 30 (3.1%) |
| 10 to 14 Years | 35 (3.7%) | 44 (4.5%) |
| 15 to 19 Years | 34 (3.6%) | 74 (7.6%) |
| 20 to 24 Years | 40 (4.3%) | 21 (2.1%) |
| 25 to 29 Years | 87 (9.2%) | 42 (4.3%) |
| 30 to 34 Years | 75 (8.0%) | 77 (7.9%) |
| 35 to 39 Years | 53 (5.6%) | 47 (4.8%) |
| 40 to 44 Years | 41 (4.3%) | 90 (9.2%) |
| 45 to 49 Years | 66 (7.0%) | 58 (5.9%) |
| 50 to 54 Years | 46 (4.9%) | 66 (6.7%) |
| 55 to 59 Years | 107 (11.4%) | 32 (3.3%) |
| 60 to 64 Years | 55 (5.8%) | 68 (7.0%) |
| 65 to 69 Years | 46 (4.9%) | 97 (9.9%) |
| 70 to 74 Years | 48 (5.1%) | 46 (4.7%) |
| 75 to 79 Years | 55 (5.8%) | 65 (6.6%) |
| 80 to 84 Years | 33 (3.5%) | 20 (2.0%) |
| 85 Years and over | 14 (1.5%) | 76 (7.8%) |
| Total | 942 (100.0%) | 979 (100.0%) |
Families and Households in Auburn
Median Family Size in Auburn
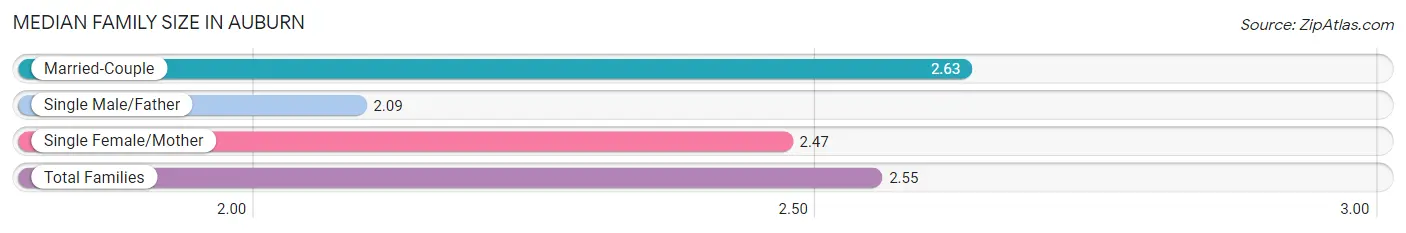
The median family size in Auburn is 2.55 persons per family, with married-couple families (368 | 71.5%) accounting for the largest median family size of 2.63 persons per family. On the other hand, single male/father families (44 | 8.5%) represent the smallest median family size with 2.09 persons per family.
| Family Type | # Families | Family Size |
| Married-Couple | 368 (71.5%) | 2.63 |
| Single Male/Father | 44 (8.5%) | 2.09 |
| Single Female/Mother | 103 (20.0%) | 2.47 |
| Total Families | 515 (100.0%) | 2.55 |
Median Household Size in Auburn
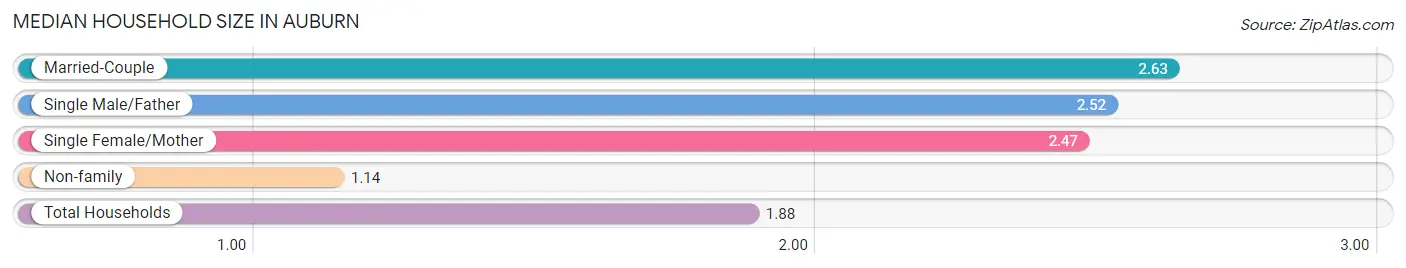
The median household size in Auburn is 1.88 persons per household, with married-couple households (368 | 36.4%) accounting for the largest median household size of 2.63 persons per household. non-family households (495 | 49.0%) represent the smallest median household size with 1.14 persons per household.
| Household Type | # Households | Household Size |
| Married-Couple | 368 (36.4%) | 2.63 |
| Single Male/Father | 44 (4.4%) | 2.52 |
| Single Female/Mother | 103 (10.2%) | 2.47 |
| Non-family | 495 (49.0%) | 1.14 |
| Total Households | 1,010 (100.0%) | 1.88 |
Household Size by Marriage Status in Auburn
Out of a total of 1,010 households in Auburn, 515 (51.0%) are family households, while 495 (49.0%) are nonfamily households. The most numerous type of family households are 2-person households, comprising 304, and the most common type of nonfamily households are 1-person households, comprising 430.
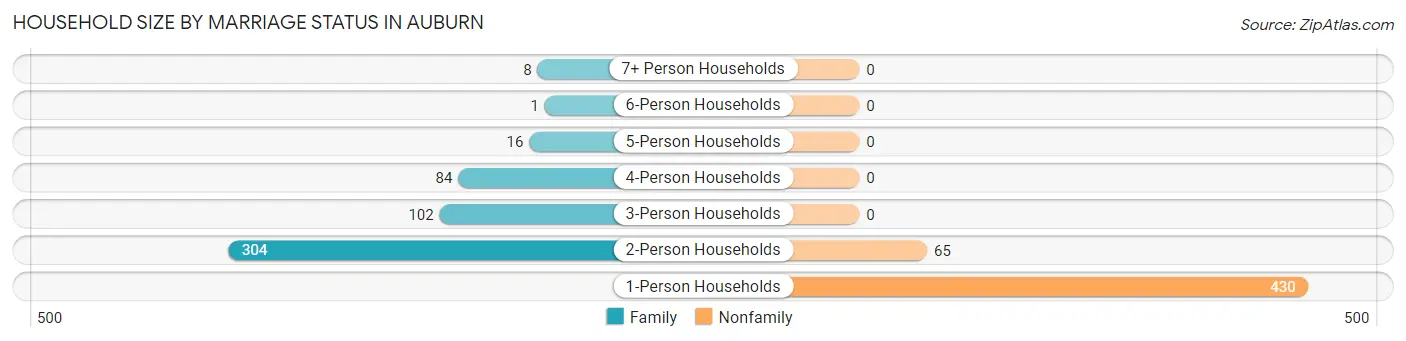
| Household Size | Family Households | Nonfamily Households |
| 1-Person Households | - | 430 (42.6%) |
| 2-Person Households | 304 (30.1%) | 65 (6.4%) |
| 3-Person Households | 102 (10.1%) | 0 (0.0%) |
| 4-Person Households | 84 (8.3%) | 0 (0.0%) |
| 5-Person Households | 16 (1.6%) | 0 (0.0%) |
| 6-Person Households | 1 (0.1%) | 0 (0.0%) |
| 7+ Person Households | 8 (0.8%) | 0 (0.0%) |
| Total | 515 (51.0%) | 495 (49.0%) |
Female Fertility in Auburn
Fertility by Age in Auburn
Average fertility rate in Auburn is 57.0 births per 1,000 women. Women in the age bracket of 20 to 34 years have the highest fertility rate with 171.0 births per 1,000 women. Women in the age bracket of 20 to 34 years acount for 100.0% of all women with births.
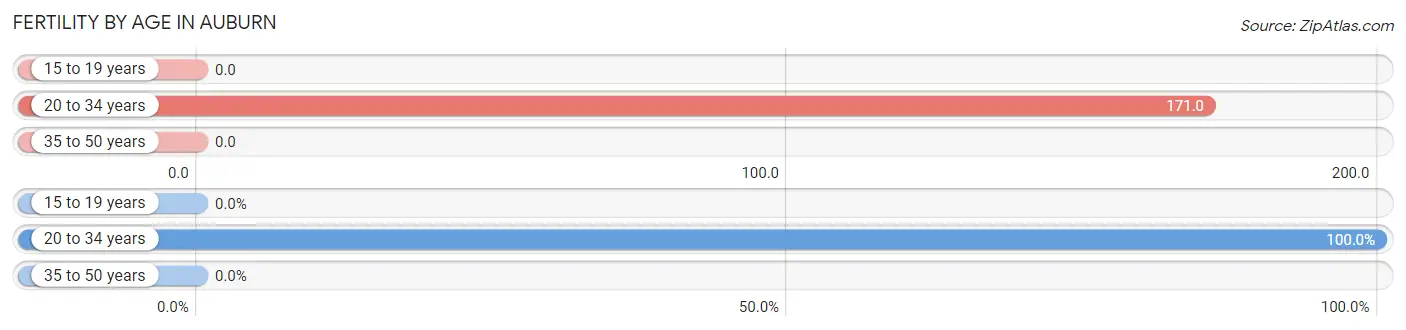
| Age Bracket | Women with Births | Births / 1,000 Women |
| 15 to 19 years | 0 (0.0%) | 0.0 |
| 20 to 34 years | 24 (100.0%) | 171.0 |
| 35 to 50 years | 0 (0.0%) | 0.0 |
| Total | 24 (100.0%) | 57.0 |
Fertility by Age by Marriage Status in Auburn
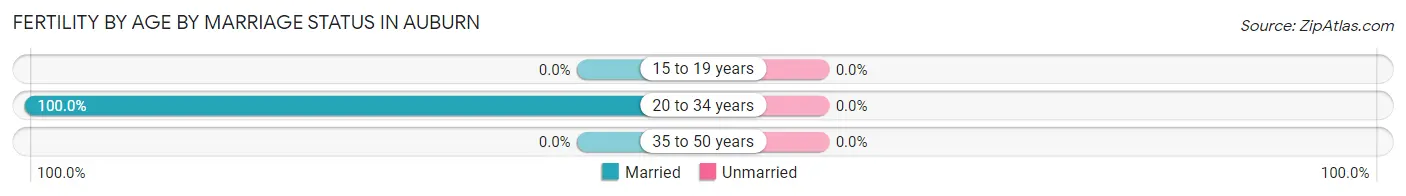
| Age Bracket | Married | Unmarried |
| 15 to 19 years | 0 (0.0%) | 0 (0.0%) |
| 20 to 34 years | 24 (100.0%) | 0 (0.0%) |
| 35 to 50 years | 0 (0.0%) | 0 (0.0%) |
| Total | 24 (100.0%) | 0 (0.0%) |
Fertility by Education in Auburn
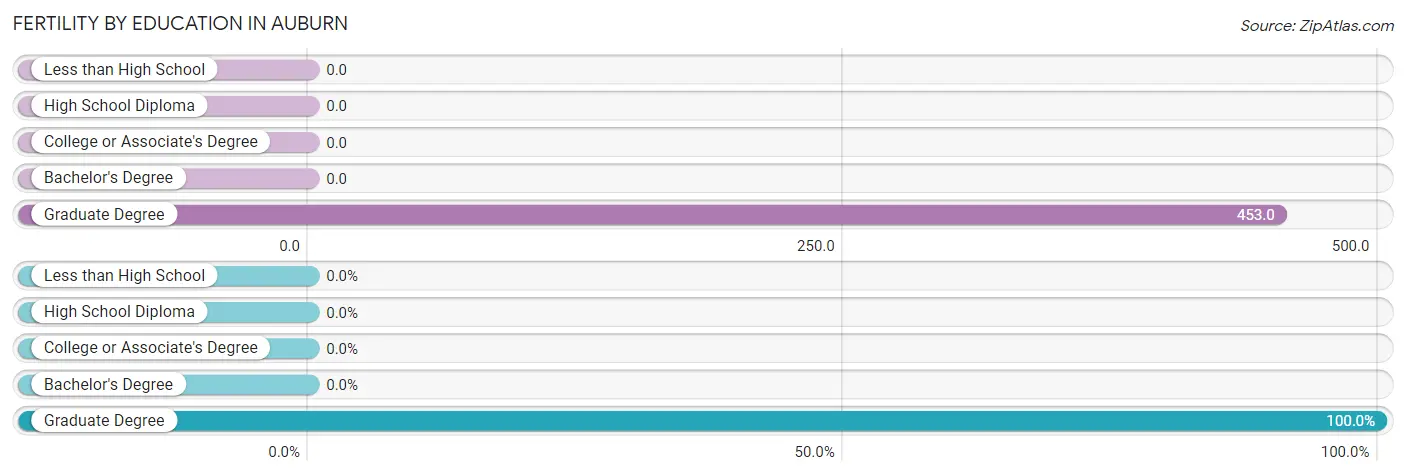
| Educational Attainment | Women with Births | Births / 1,000 Women |
| Less than High School | 0 (0.0%) | 0.0 |
| High School Diploma | 0 (0.0%) | 0.0 |
| College or Associate's Degree | 0 (0.0%) | 0.0 |
| Bachelor's Degree | 0 (0.0%) | 0.0 |
| Graduate Degree | 24 (100.0%) | 453.0 |
| Total | 24 (100.0%) | 57.0 |
Fertility by Education by Marriage Status in Auburn
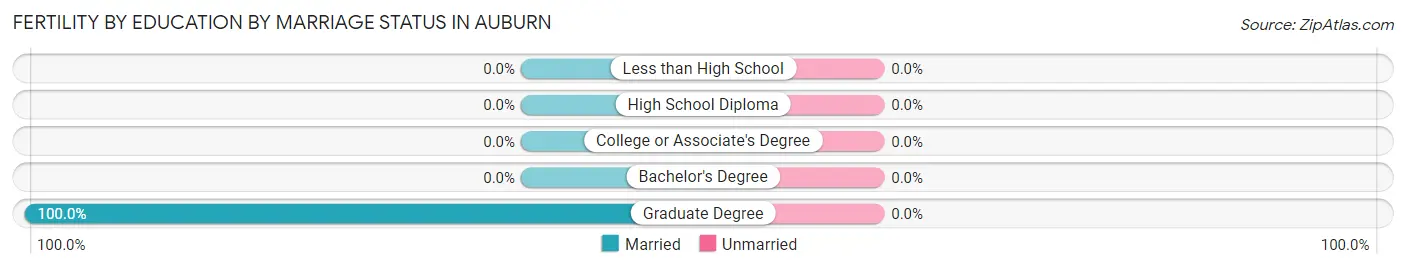
| Educational Attainment | Married | Unmarried |
| Less than High School | 0 (0.0%) | 0 (0.0%) |
| High School Diploma | 0 (0.0%) | 0 (0.0%) |
| College or Associate's Degree | 0 (0.0%) | 0 (0.0%) |
| Bachelor's Degree | 0 (0.0%) | 0 (0.0%) |
| Graduate Degree | 24 (100.0%) | 0 (0.0%) |
| Total | 24 (100.0%) | 0 (0.0%) |
Employment Characteristics in Auburn
Employment by Class of Employer in Auburn
Among the 1,005 employed individuals in Auburn, private company employees (661 | 65.8%), not-for-profit organizations (97 | 9.7%), and state government employees (89 | 8.9%) make up the most common classes of employment.
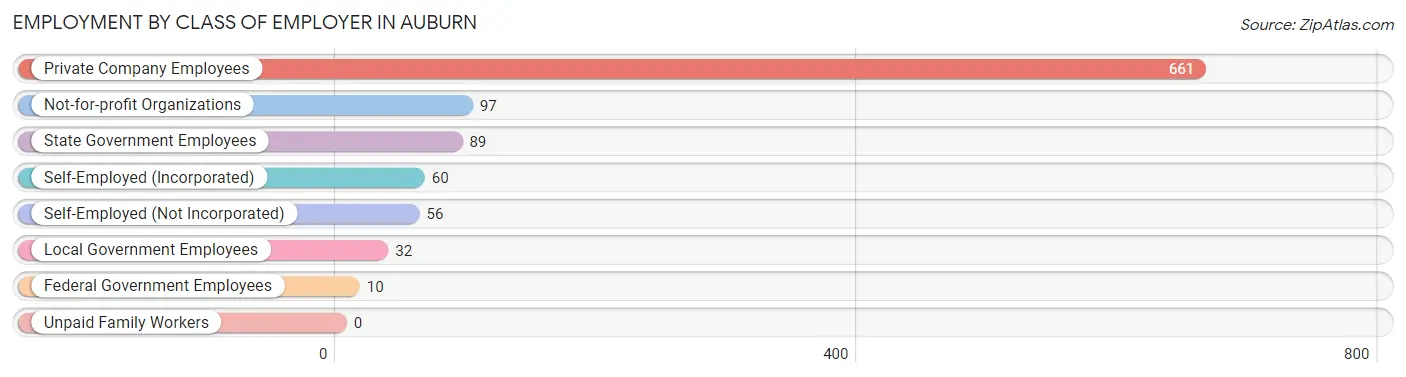
| Employer Class | # Employees | % Employees |
| Private Company Employees | 661 | 65.8% |
| Self-Employed (Incorporated) | 60 | 6.0% |
| Self-Employed (Not Incorporated) | 56 | 5.6% |
| Not-for-profit Organizations | 97 | 9.7% |
| Local Government Employees | 32 | 3.2% |
| State Government Employees | 89 | 8.9% |
| Federal Government Employees | 10 | 1.0% |
| Unpaid Family Workers | 0 | 0.0% |
| Total | 1,005 | 100.0% |
Employment Status by Age in Auburn
According to the labor force statistics for Auburn, out of the total population over 16 years of age (1,662), 63.7% or 1,059 individuals are in the labor force, with 2.7% or 29 of them unemployed. The age group with the highest labor force participation rate is 20 to 24 years, with 100.0% or 61 individuals in the labor force. Within the labor force, the 16 to 19 years age range has the highest percentage of unemployed individuals, with 8.6% or 5 of them being unemployed.
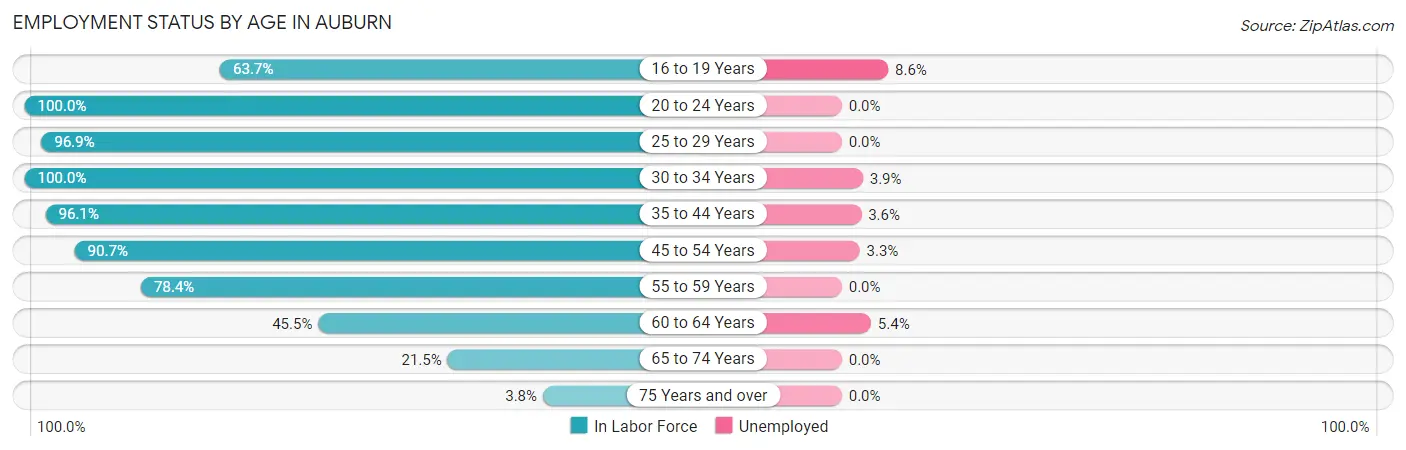
| Age Bracket | In Labor Force | Unemployed |
| 16 to 19 Years | 58 (63.7%) | 5 (8.6%) |
| 20 to 24 Years | 61 (100.0%) | 0 (0.0%) |
| 25 to 29 Years | 125 (96.9%) | 0 (0.0%) |
| 30 to 34 Years | 152 (100.0%) | 6 (3.9%) |
| 35 to 44 Years | 222 (96.1%) | 8 (3.6%) |
| 45 to 54 Years | 214 (90.7%) | 7 (3.3%) |
| 55 to 59 Years | 109 (78.4%) | 0 (0.0%) |
| 60 to 64 Years | 56 (45.5%) | 3 (5.4%) |
| 65 to 74 Years | 51 (21.5%) | 0 (0.0%) |
| 75 Years and over | 10 (3.8%) | 0 (0.0%) |
| Total | 1,059 (63.7%) | 29 (2.7%) |
Employment Status by Educational Attainment in Auburn
According to labor force statistics for Auburn, 86.9% of individuals (878) out of the total population between 25 and 64 years of age (1,010) are in the labor force, with 2.7% or 24 of them being unemployed. The group with the highest labor force participation rate are those with the educational attainment of bachelor's degree or higher, with 94.0% or 359 individuals in the labor force. Within the labor force, individuals with college / associate degree education have the highest percentage of unemployment, with 4.8% or 17 of them being unemployed.
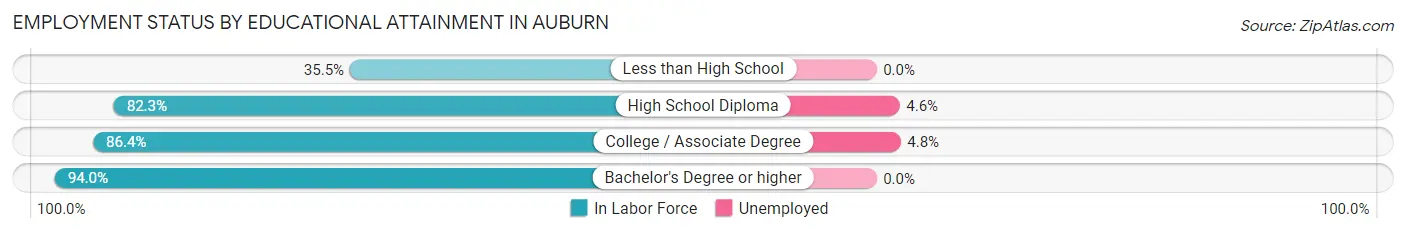
| Educational Attainment | In Labor Force | Unemployed |
| Less than High School | 11 (35.5%) | 0 (0.0%) |
| High School Diploma | 153 (82.3%) | 9 (4.6%) |
| College / Associate Degree | 355 (86.4%) | 20 (4.8%) |
| Bachelor's Degree or higher | 359 (94.0%) | 0 (0.0%) |
| Total | 878 (86.9%) | 27 (2.7%) |
Employment Occupations by Sex in Auburn
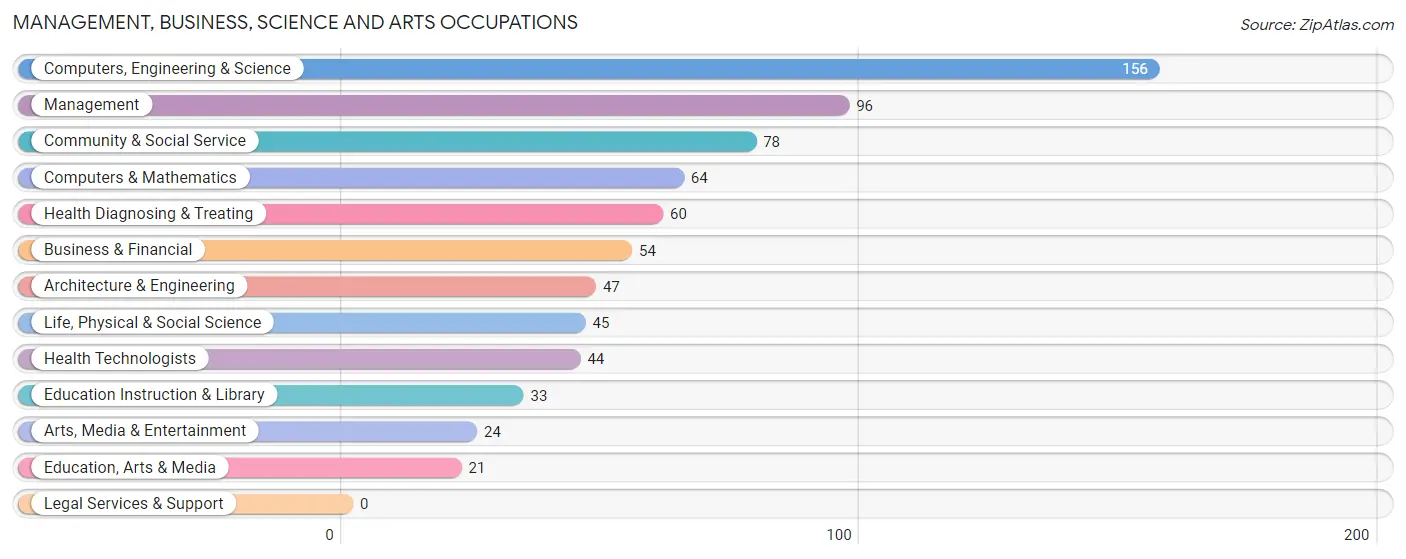
Management, Business, Science and Arts Occupations
The most common Management, Business, Science and Arts occupations in Auburn are Computers, Engineering & Science (156 | 15.2%), Management (96 | 9.3%), Community & Social Service (78 | 7.6%), Computers & Mathematics (64 | 6.2%), and Health Diagnosing & Treating (60 | 5.8%).
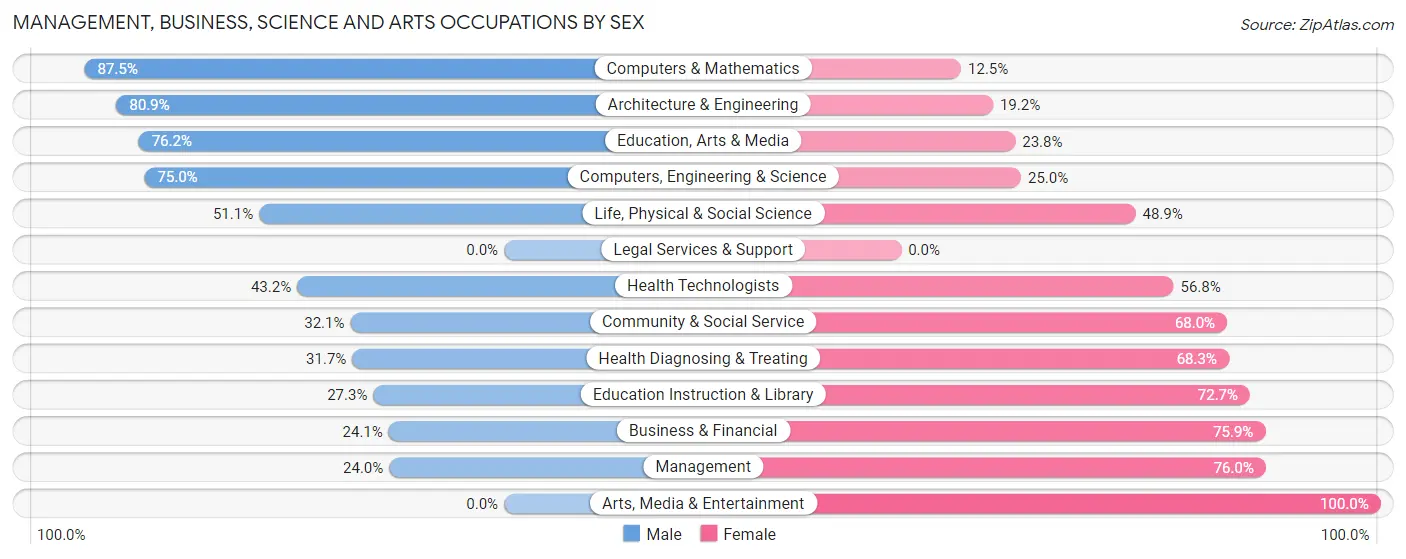
Management, Business, Science and Arts Occupations by Sex
Within the Management, Business, Science and Arts occupations in Auburn, the most male-oriented occupations are Computers & Mathematics (87.5%), Architecture & Engineering (80.8%), and Education, Arts & Media (76.2%), while the most female-oriented occupations are Arts, Media & Entertainment (100.0%), Management (76.0%), and Business & Financial (75.9%).
| Occupation | Male | Female |
| Management | 23 (24.0%) | 73 (76.0%) |
| Business & Financial | 13 (24.1%) | 41 (75.9%) |
| Computers, Engineering & Science | 117 (75.0%) | 39 (25.0%) |
| Computers & Mathematics | 56 (87.5%) | 8 (12.5%) |
| Architecture & Engineering | 38 (80.8%) | 9 (19.2%) |
| Life, Physical & Social Science | 23 (51.1%) | 22 (48.9%) |
| Community & Social Service | 25 (32.1%) | 53 (67.9%) |
| Education, Arts & Media | 16 (76.2%) | 5 (23.8%) |
| Legal Services & Support | 0 (0.0%) | 0 (0.0%) |
| Education Instruction & Library | 9 (27.3%) | 24 (72.7%) |
| Arts, Media & Entertainment | 0 (0.0%) | 24 (100.0%) |
| Health Diagnosing & Treating | 19 (31.7%) | 41 (68.3%) |
| Health Technologists | 19 (43.2%) | 25 (56.8%) |
| Total (Category) | 197 (44.4%) | 247 (55.6%) |
| Total (Overall) | 517 (50.2%) | 512 (49.8%) |
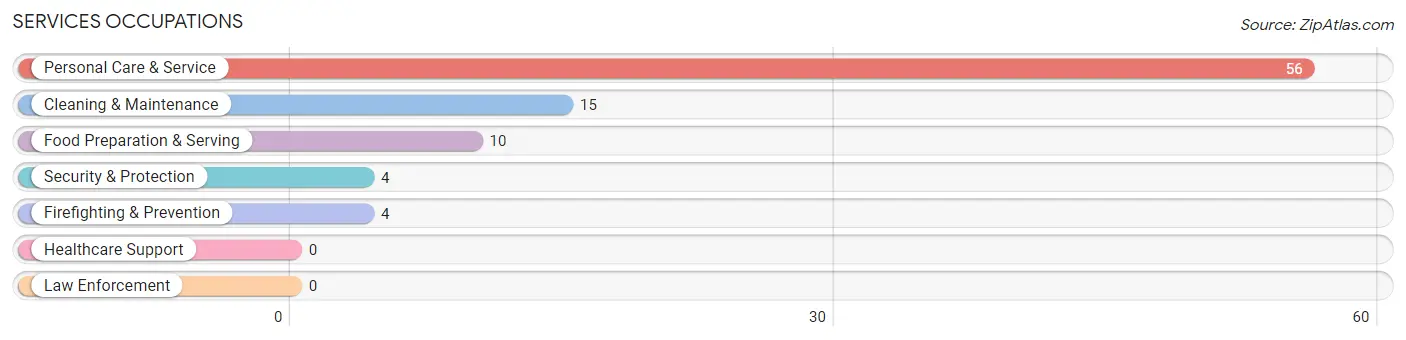
Services Occupations
The most common Services occupations in Auburn are Personal Care & Service (56 | 5.4%), Cleaning & Maintenance (15 | 1.5%), Food Preparation & Serving (10 | 1.0%), Security & Protection (4 | 0.4%), and Firefighting & Prevention (4 | 0.4%).
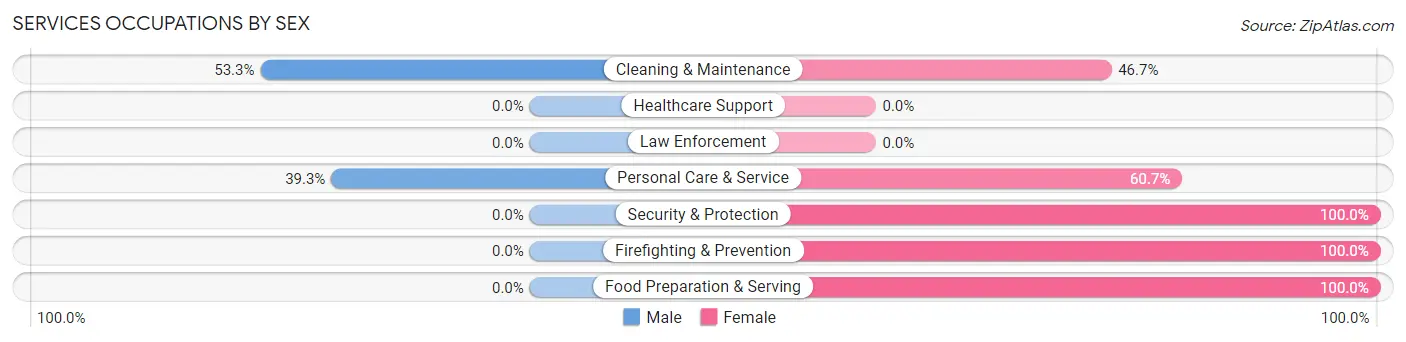
Services Occupations by Sex
Within the Services occupations in Auburn, the most male-oriented occupations are Cleaning & Maintenance (53.3%), and Personal Care & Service (39.3%), while the most female-oriented occupations are Security & Protection (100.0%), Firefighting & Prevention (100.0%), and Food Preparation & Serving (100.0%).
| Occupation | Male | Female |
| Healthcare Support | 0 (0.0%) | 0 (0.0%) |
| Security & Protection | 0 (0.0%) | 4 (100.0%) |
| Firefighting & Prevention | 0 (0.0%) | 4 (100.0%) |
| Law Enforcement | 0 (0.0%) | 0 (0.0%) |
| Food Preparation & Serving | 0 (0.0%) | 10 (100.0%) |
| Cleaning & Maintenance | 8 (53.3%) | 7 (46.7%) |
| Personal Care & Service | 22 (39.3%) | 34 (60.7%) |
| Total (Category) | 30 (35.3%) | 55 (64.7%) |
| Total (Overall) | 517 (50.2%) | 512 (49.8%) |
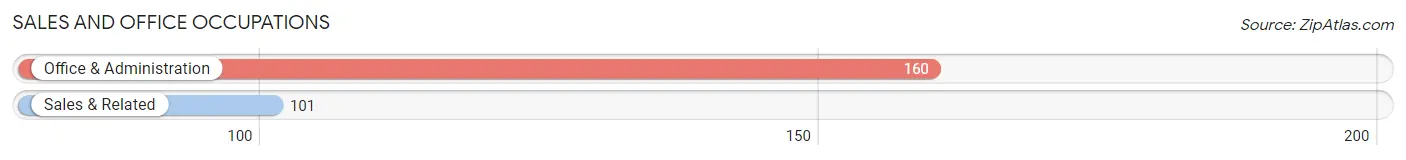
Sales and Office Occupations
The most common Sales and Office occupations in Auburn are Office & Administration (160 | 15.5%), and Sales & Related (101 | 9.8%).
Sales and Office Occupations by Sex
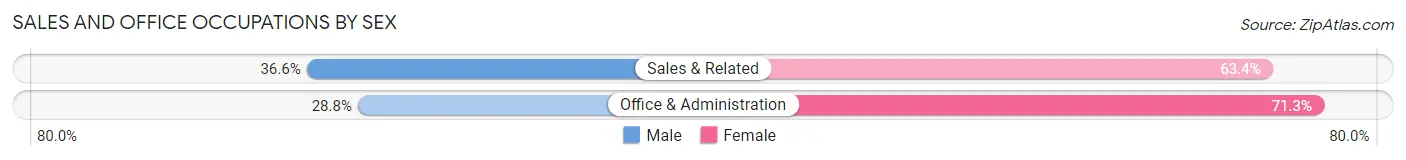
| Occupation | Male | Female |
| Sales & Related | 37 (36.6%) | 64 (63.4%) |
| Office & Administration | 46 (28.7%) | 114 (71.3%) |
| Total (Category) | 83 (31.8%) | 178 (68.2%) |
| Total (Overall) | 517 (50.2%) | 512 (49.8%) |
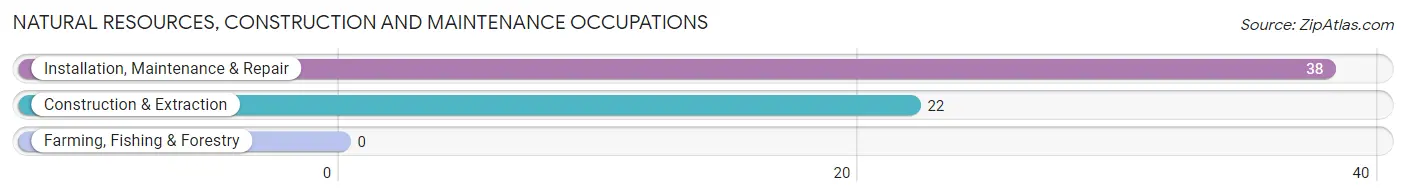
Natural Resources, Construction and Maintenance Occupations
The most common Natural Resources, Construction and Maintenance occupations in Auburn are Installation, Maintenance & Repair (38 | 3.7%), and Construction & Extraction (22 | 2.1%).
Natural Resources, Construction and Maintenance Occupations by Sex
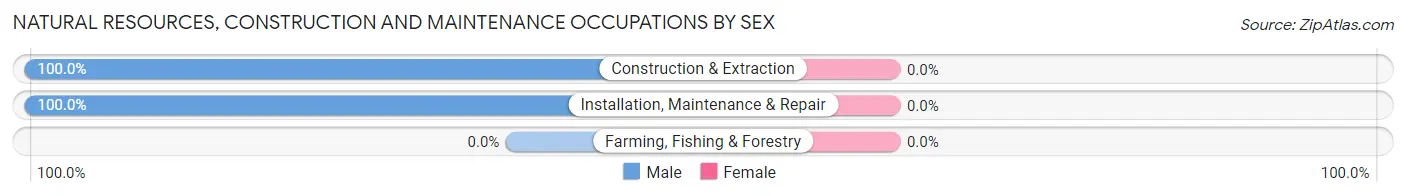
| Occupation | Male | Female |
| Farming, Fishing & Forestry | 0 (0.0%) | 0 (0.0%) |
| Construction & Extraction | 22 (100.0%) | 0 (0.0%) |
| Installation, Maintenance & Repair | 38 (100.0%) | 0 (0.0%) |
| Total (Category) | 60 (100.0%) | 0 (0.0%) |
| Total (Overall) | 517 (50.2%) | 512 (49.8%) |
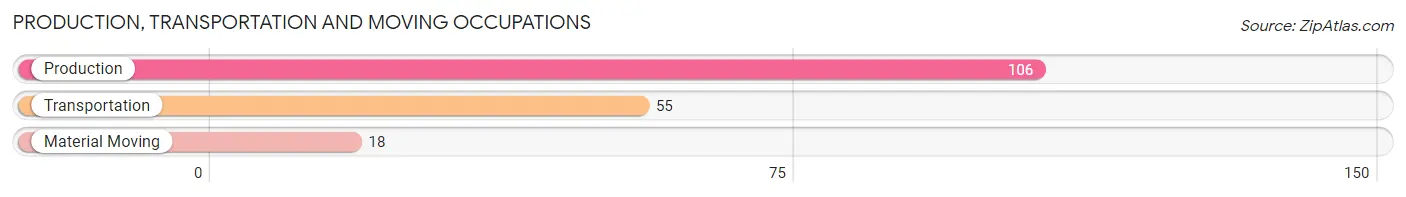
Production, Transportation and Moving Occupations
The most common Production, Transportation and Moving occupations in Auburn are Production (106 | 10.3%), Transportation (55 | 5.3%), and Material Moving (18 | 1.8%).
Production, Transportation and Moving Occupations by Sex
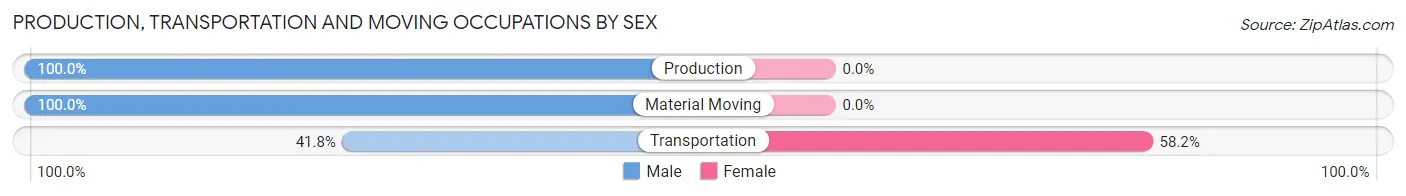
| Occupation | Male | Female |
| Production | 106 (100.0%) | 0 (0.0%) |
| Transportation | 23 (41.8%) | 32 (58.2%) |
| Material Moving | 18 (100.0%) | 0 (0.0%) |
| Total (Category) | 147 (82.1%) | 32 (17.9%) |
| Total (Overall) | 517 (50.2%) | 512 (49.8%) |
Employment Industries by Sex in Auburn
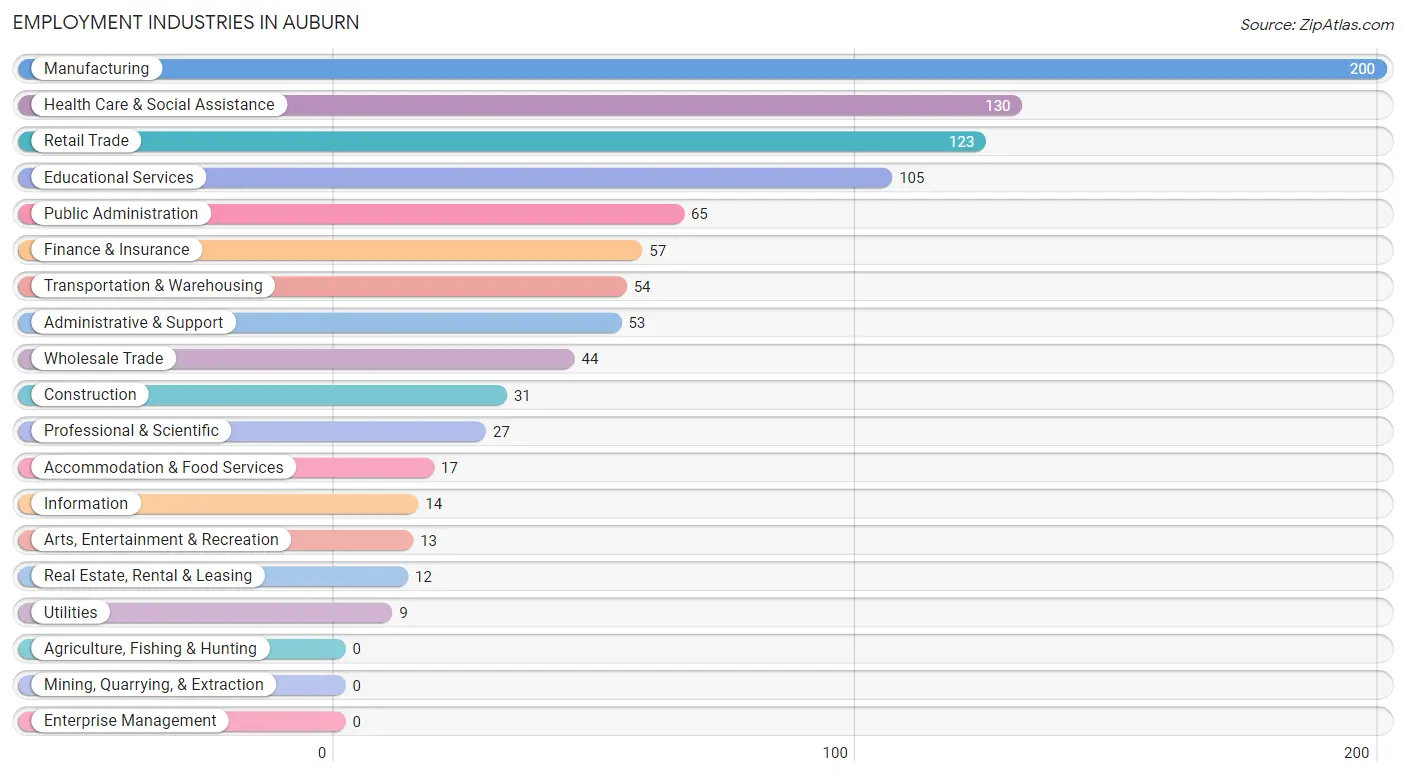
Employment Industries in Auburn
The major employment industries in Auburn include Manufacturing (200 | 19.4%), Health Care & Social Assistance (130 | 12.6%), Retail Trade (123 | 11.9%), Educational Services (105 | 10.2%), and Public Administration (65 | 6.3%).
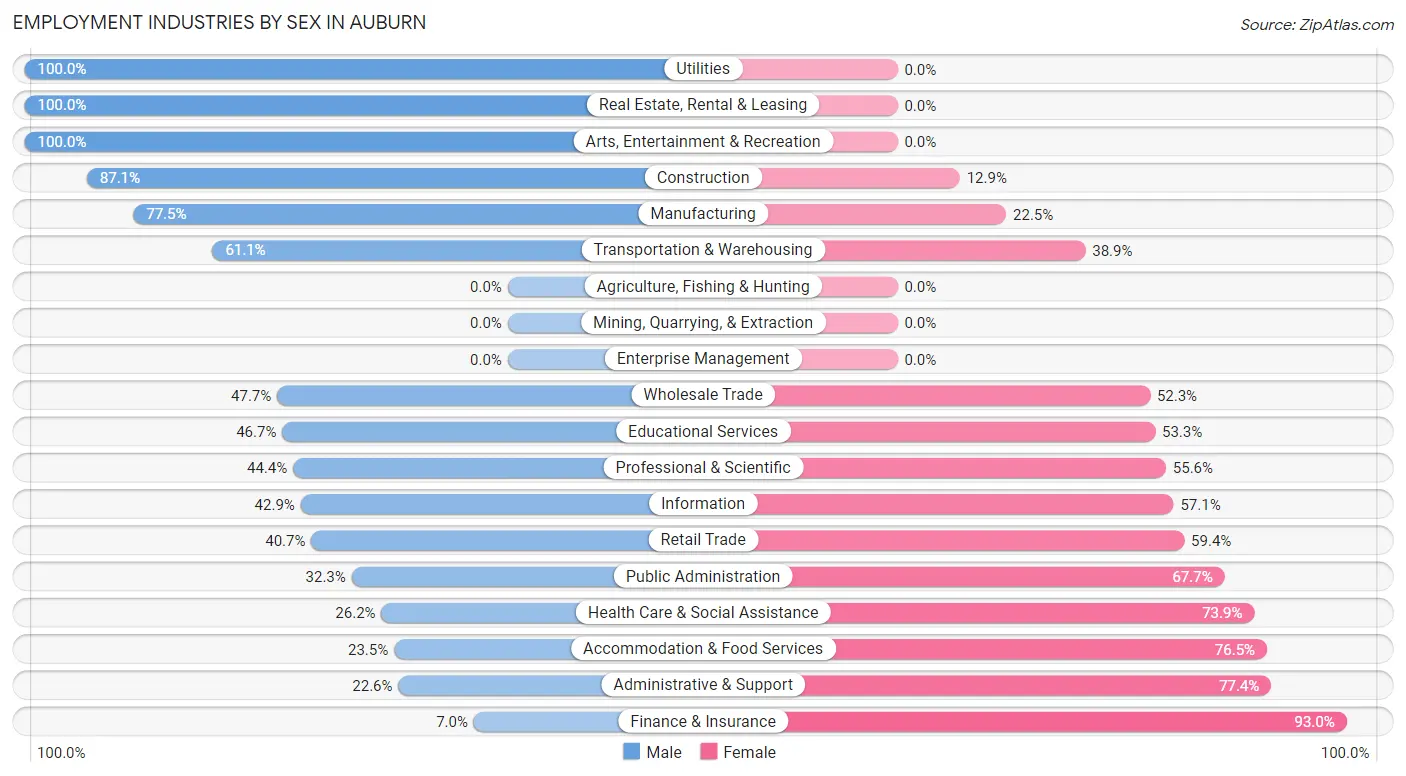
Employment Industries by Sex in Auburn
The Auburn industries that see more men than women are Utilities (100.0%), Real Estate, Rental & Leasing (100.0%), and Arts, Entertainment & Recreation (100.0%), whereas the industries that tend to have a higher number of women are Finance & Insurance (93.0%), Administrative & Support (77.4%), and Accommodation & Food Services (76.5%).
| Industry | Male | Female |
| Agriculture, Fishing & Hunting | 0 (0.0%) | 0 (0.0%) |
| Mining, Quarrying, & Extraction | 0 (0.0%) | 0 (0.0%) |
| Construction | 27 (87.1%) | 4 (12.9%) |
| Manufacturing | 155 (77.5%) | 45 (22.5%) |
| Wholesale Trade | 21 (47.7%) | 23 (52.3%) |
| Retail Trade | 50 (40.6%) | 73 (59.4%) |
| Transportation & Warehousing | 33 (61.1%) | 21 (38.9%) |
| Utilities | 9 (100.0%) | 0 (0.0%) |
| Information | 6 (42.9%) | 8 (57.1%) |
| Finance & Insurance | 4 (7.0%) | 53 (93.0%) |
| Real Estate, Rental & Leasing | 12 (100.0%) | 0 (0.0%) |
| Professional & Scientific | 12 (44.4%) | 15 (55.6%) |
| Enterprise Management | 0 (0.0%) | 0 (0.0%) |
| Administrative & Support | 12 (22.6%) | 41 (77.4%) |
| Educational Services | 49 (46.7%) | 56 (53.3%) |
| Health Care & Social Assistance | 34 (26.2%) | 96 (73.9%) |
| Arts, Entertainment & Recreation | 13 (100.0%) | 0 (0.0%) |
| Accommodation & Food Services | 4 (23.5%) | 13 (76.5%) |
| Public Administration | 21 (32.3%) | 44 (67.7%) |
| Total | 517 (50.2%) | 512 (49.8%) |
Education in Auburn
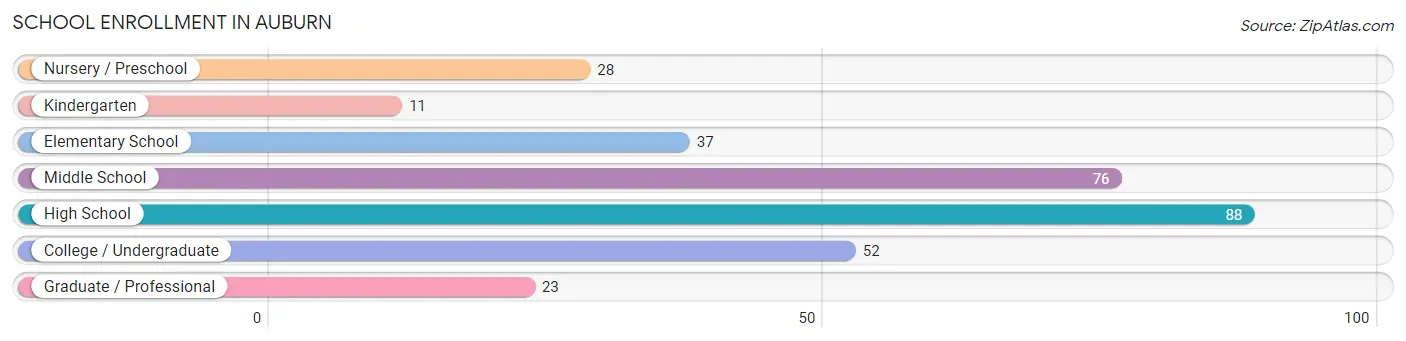
School Enrollment in Auburn
The most common levels of schooling among the 315 students in Auburn are high school (88 | 27.9%), middle school (76 | 24.1%), and college / undergraduate (52 | 16.5%).
| School Level | # Students | % Students |
| Nursery / Preschool | 28 | 8.9% |
| Kindergarten | 11 | 3.5% |
| Elementary School | 37 | 11.7% |
| Middle School | 76 | 24.1% |
| High School | 88 | 27.9% |
| College / Undergraduate | 52 | 16.5% |
| Graduate / Professional | 23 | 7.3% |
| Total | 315 | 100.0% |
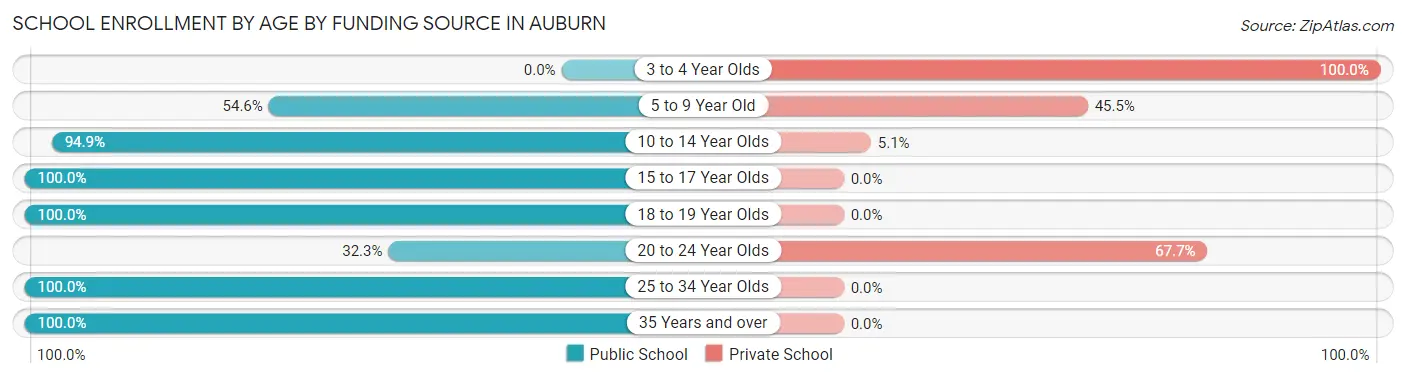
School Enrollment by Age by Funding Source in Auburn
Out of a total of 315 students who are enrolled in schools in Auburn, 78 (24.8%) attend a private institution, while the remaining 237 (75.2%) are enrolled in public schools. The age group of 3 to 4 year olds has the highest likelihood of being enrolled in private schools, with 28 (100.0% in the age bracket) enrolled. Conversely, the age group of 15 to 17 year olds has the lowest likelihood of being enrolled in a private school, with 43 (100.0% in the age bracket) attending a public institution.
| Age Bracket | Public School | Private School |
| 3 to 4 Year Olds | 0 (0.0%) | 28 (100.0%) |
| 5 to 9 Year Old | 30 (54.5%) | 25 (45.5%) |
| 10 to 14 Year Olds | 75 (94.9%) | 4 (5.1%) |
| 15 to 17 Year Olds | 43 (100.0%) | 0 (0.0%) |
| 18 to 19 Year Olds | 52 (100.0%) | 0 (0.0%) |
| 20 to 24 Year Olds | 10 (32.3%) | 21 (67.7%) |
| 25 to 34 Year Olds | 15 (100.0%) | 0 (0.0%) |
| 35 Years and over | 12 (100.0%) | 0 (0.0%) |
| Total | 237 (75.2%) | 78 (24.8%) |
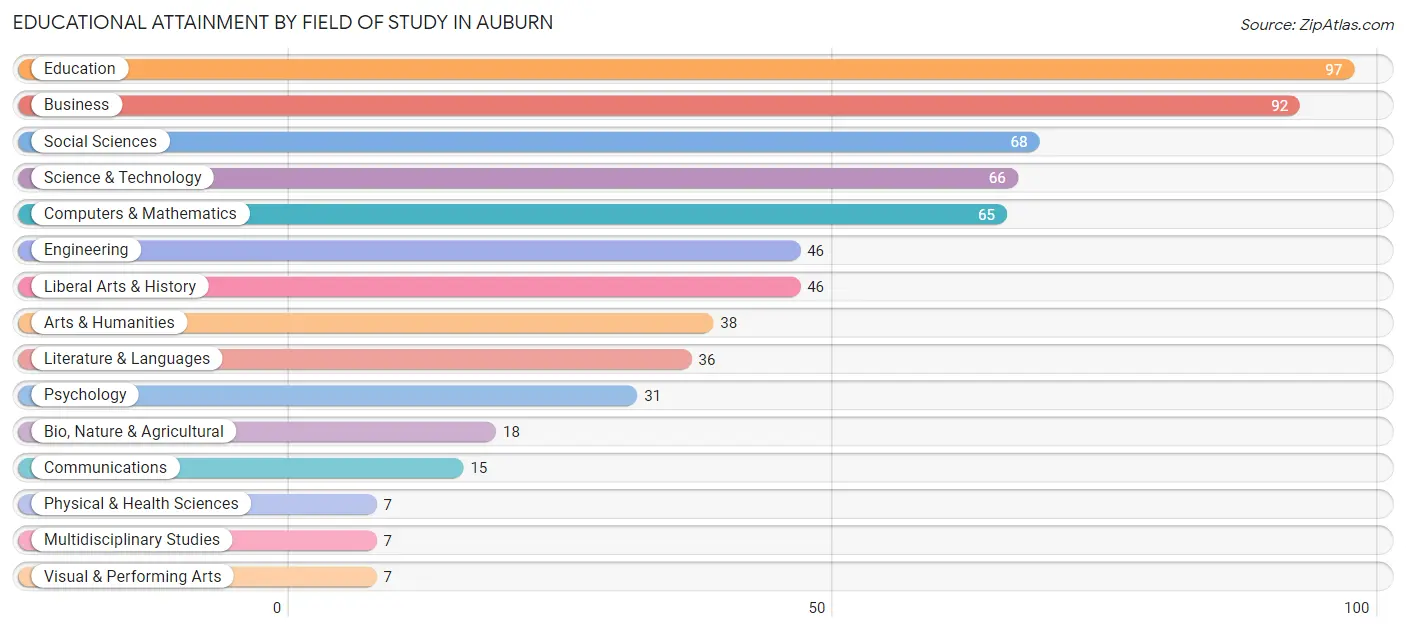
Educational Attainment by Field of Study in Auburn
Education (97 | 15.2%), business (92 | 14.4%), social sciences (68 | 10.6%), science & technology (66 | 10.3%), and computers & mathematics (65 | 10.2%) are the most common fields of study among 639 individuals in Auburn who have obtained a bachelor's degree or higher.
| Field of Study | # Graduates | % Graduates |
| Computers & Mathematics | 65 | 10.2% |
| Bio, Nature & Agricultural | 18 | 2.8% |
| Physical & Health Sciences | 7 | 1.1% |
| Psychology | 31 | 4.9% |
| Social Sciences | 68 | 10.6% |
| Engineering | 46 | 7.2% |
| Multidisciplinary Studies | 7 | 1.1% |
| Science & Technology | 66 | 10.3% |
| Business | 92 | 14.4% |
| Education | 97 | 15.2% |
| Literature & Languages | 36 | 5.6% |
| Liberal Arts & History | 46 | 7.2% |
| Visual & Performing Arts | 7 | 1.1% |
| Communications | 15 | 2.4% |
| Arts & Humanities | 38 | 5.9% |
| Total | 639 | 100.0% |
Transportation & Commute in Auburn
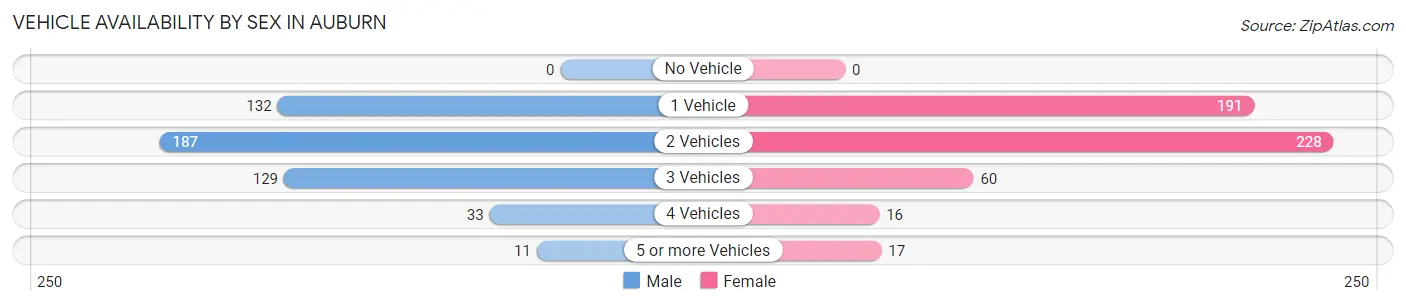
Vehicle Availability by Sex in Auburn
The most prevalent vehicle ownership categories in Auburn are males with 2 vehicles (187, accounting for 38.0%) and females with 2 vehicles (228, making up 36.5%).
| Vehicles Available | Male | Female |
| No Vehicle | 0 (0.0%) | 0 (0.0%) |
| 1 Vehicle | 132 (26.8%) | 191 (37.3%) |
| 2 Vehicles | 187 (38.0%) | 228 (44.5%) |
| 3 Vehicles | 129 (26.2%) | 60 (11.7%) |
| 4 Vehicles | 33 (6.7%) | 16 (3.1%) |
| 5 or more Vehicles | 11 (2.2%) | 17 (3.3%) |
| Total | 492 (100.0%) | 512 (100.0%) |
Commute Time in Auburn
The most frequently occuring commute durations in Auburn are 20 to 24 minutes (241 commuters, 28.0%), 15 to 19 minutes (199 commuters, 23.1%), and 25 to 29 minutes (79 commuters, 9.2%).
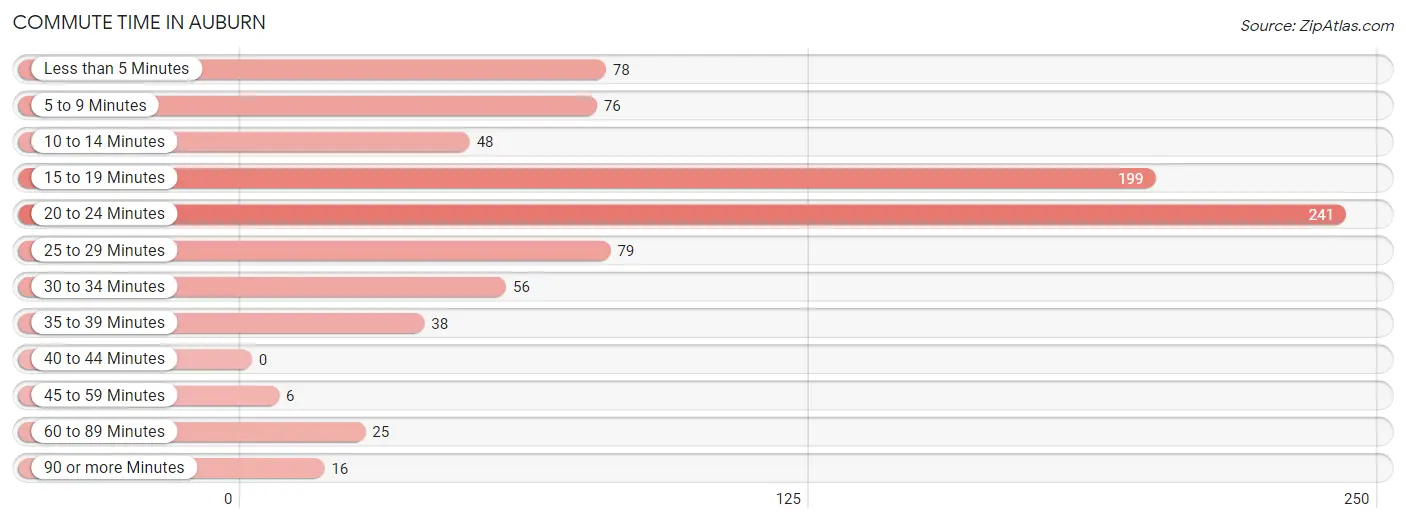
| Commute Time | # Commuters | % Commuters |
| Less than 5 Minutes | 78 | 9.0% |
| 5 to 9 Minutes | 76 | 8.8% |
| 10 to 14 Minutes | 48 | 5.6% |
| 15 to 19 Minutes | 199 | 23.1% |
| 20 to 24 Minutes | 241 | 28.0% |
| 25 to 29 Minutes | 79 | 9.2% |
| 30 to 34 Minutes | 56 | 6.5% |
| 35 to 39 Minutes | 38 | 4.4% |
| 40 to 44 Minutes | 0 | 0.0% |
| 45 to 59 Minutes | 6 | 0.7% |
| 60 to 89 Minutes | 25 | 2.9% |
| 90 or more Minutes | 16 | 1.9% |
Commute Time by Sex in Auburn
The most common commute times in Auburn are 20 to 24 minutes (169 commuters, 36.0%) for males and 15 to 19 minutes (113 commuters, 28.8%) for females.
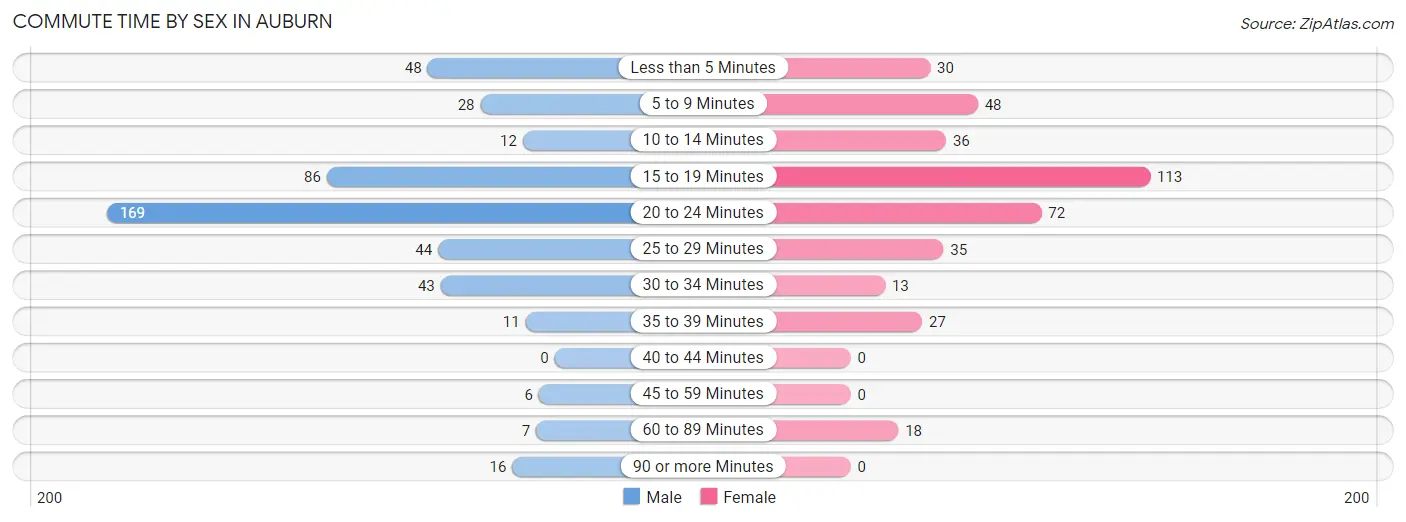
| Commute Time | Male | Female |
| Less than 5 Minutes | 48 (10.2%) | 30 (7.6%) |
| 5 to 9 Minutes | 28 (6.0%) | 48 (12.2%) |
| 10 to 14 Minutes | 12 (2.5%) | 36 (9.2%) |
| 15 to 19 Minutes | 86 (18.3%) | 113 (28.8%) |
| 20 to 24 Minutes | 169 (36.0%) | 72 (18.4%) |
| 25 to 29 Minutes | 44 (9.4%) | 35 (8.9%) |
| 30 to 34 Minutes | 43 (9.1%) | 13 (3.3%) |
| 35 to 39 Minutes | 11 (2.3%) | 27 (6.9%) |
| 40 to 44 Minutes | 0 (0.0%) | 0 (0.0%) |
| 45 to 59 Minutes | 6 (1.3%) | 0 (0.0%) |
| 60 to 89 Minutes | 7 (1.5%) | 18 (4.6%) |
| 90 or more Minutes | 16 (3.4%) | 0 (0.0%) |
Time of Departure to Work by Sex in Auburn
The most frequent times of departure to work in Auburn are 7:00 AM to 7:29 AM (85, 18.1%) for males and 7:00 AM to 7:29 AM (84, 21.4%) for females.
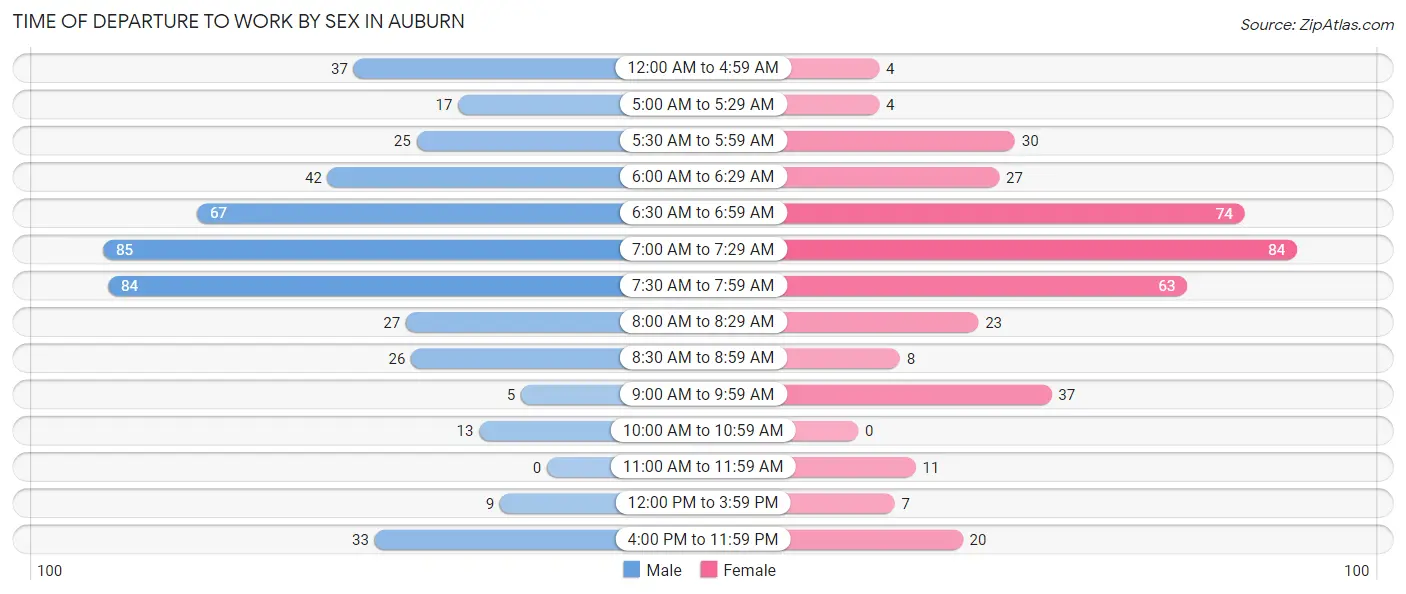
| Time of Departure | Male | Female |
| 12:00 AM to 4:59 AM | 37 (7.9%) | 4 (1.0%) |
| 5:00 AM to 5:29 AM | 17 (3.6%) | 4 (1.0%) |
| 5:30 AM to 5:59 AM | 25 (5.3%) | 30 (7.6%) |
| 6:00 AM to 6:29 AM | 42 (8.9%) | 27 (6.9%) |
| 6:30 AM to 6:59 AM | 67 (14.3%) | 74 (18.9%) |
| 7:00 AM to 7:29 AM | 85 (18.1%) | 84 (21.4%) |
| 7:30 AM to 7:59 AM | 84 (17.9%) | 63 (16.1%) |
| 8:00 AM to 8:29 AM | 27 (5.7%) | 23 (5.9%) |
| 8:30 AM to 8:59 AM | 26 (5.5%) | 8 (2.0%) |
| 9:00 AM to 9:59 AM | 5 (1.1%) | 37 (9.4%) |
| 10:00 AM to 10:59 AM | 13 (2.8%) | 0 (0.0%) |
| 11:00 AM to 11:59 AM | 0 (0.0%) | 11 (2.8%) |
| 12:00 PM to 3:59 PM | 9 (1.9%) | 7 (1.8%) |
| 4:00 PM to 11:59 PM | 33 (7.0%) | 20 (5.1%) |
| Total | 470 (100.0%) | 392 (100.0%) |
Housing Occupancy in Auburn
Occupancy by Ownership in Auburn
Of the total 1,010 dwellings in Auburn, owner-occupied units account for 704 (69.7%), while renter-occupied units make up 306 (30.3%).
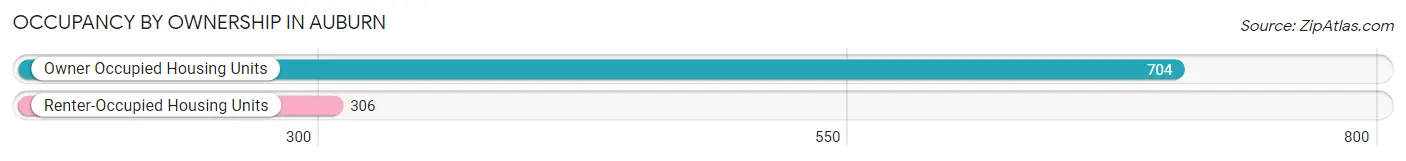
| Occupancy | # Housing Units | % Housing Units |
| Owner Occupied Housing Units | 704 | 69.7% |
| Renter-Occupied Housing Units | 306 | 30.3% |
| Total Occupied Housing Units | 1,010 | 100.0% |
Occupancy by Household Size in Auburn
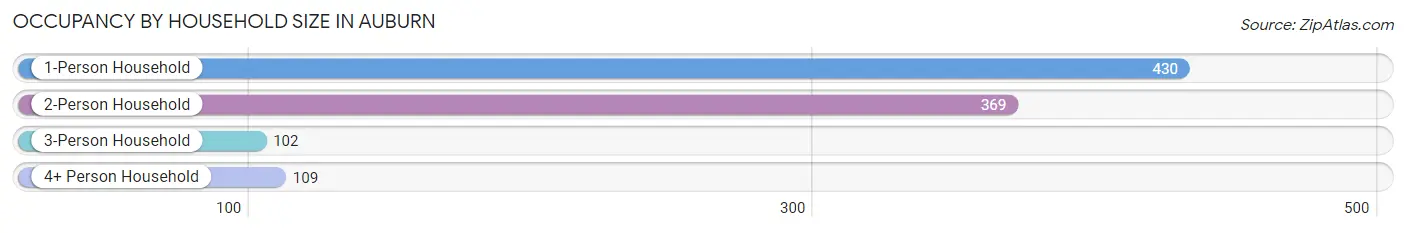
| Household Size | # Housing Units | % Housing Units |
| 1-Person Household | 430 | 42.6% |
| 2-Person Household | 369 | 36.5% |
| 3-Person Household | 102 | 10.1% |
| 4+ Person Household | 109 | 10.8% |
| Total Housing Units | 1,010 | 100.0% |
Occupancy by Ownership by Household Size in Auburn
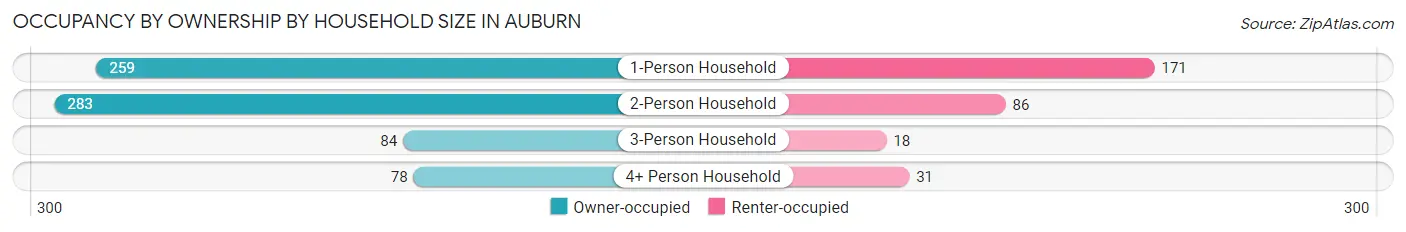
| Household Size | Owner-occupied | Renter-occupied |
| 1-Person Household | 259 (60.2%) | 171 (39.8%) |
| 2-Person Household | 283 (76.7%) | 86 (23.3%) |
| 3-Person Household | 84 (82.4%) | 18 (17.6%) |
| 4+ Person Household | 78 (71.6%) | 31 (28.4%) |
| Total Housing Units | 704 (69.7%) | 306 (30.3%) |
Occupancy by Educational Attainment in Auburn
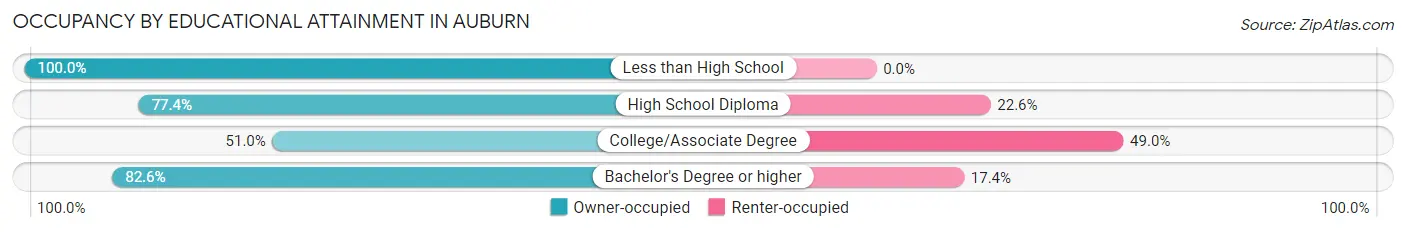
| Household Size | Owner-occupied | Renter-occupied |
| Less than High School | 19 (100.0%) | 0 (0.0%) |
| High School Diploma | 164 (77.4%) | 48 (22.6%) |
| College/Associate Degree | 198 (51.0%) | 190 (49.0%) |
| Bachelor's Degree or higher | 323 (82.6%) | 68 (17.4%) |
Occupancy by Age of Householder in Auburn
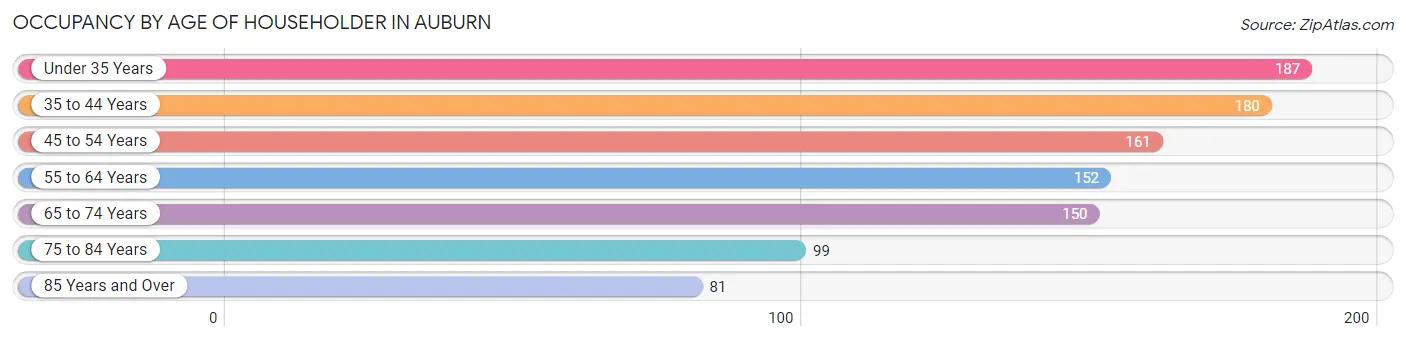
| Age Bracket | # Households | % Households |
| Under 35 Years | 187 | 18.5% |
| 35 to 44 Years | 180 | 17.8% |
| 45 to 54 Years | 161 | 15.9% |
| 55 to 64 Years | 152 | 15.0% |
| 65 to 74 Years | 150 | 14.8% |
| 75 to 84 Years | 99 | 9.8% |
| 85 Years and Over | 81 | 8.0% |
| Total | 1,010 | 100.0% |
Housing Finances in Auburn
Median Income by Occupancy in Auburn
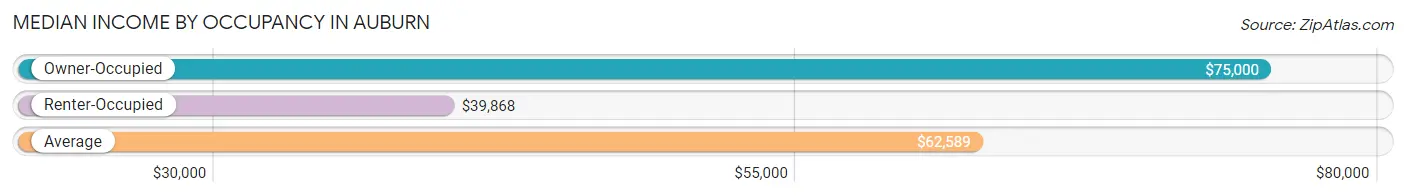
| Occupancy Type | # Households | Median Income |
| Owner-Occupied | 704 (69.7%) | $75,000 |
| Renter-Occupied | 306 (30.3%) | $39,868 |
| Average | 1,010 (100.0%) | $62,589 |
Occupancy by Householder Income Bracket in Auburn
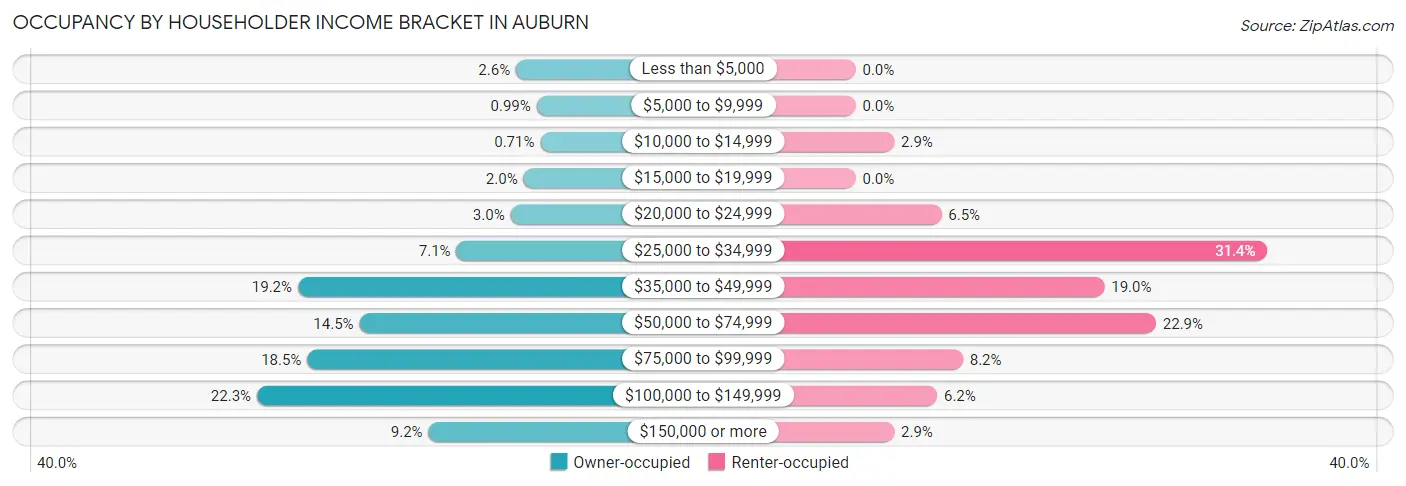
| Income Bracket | Owner-occupied | Renter-occupied |
| Less than $5,000 | 18 (2.6%) | 0 (0.0%) |
| $5,000 to $9,999 | 7 (1.0%) | 0 (0.0%) |
| $10,000 to $14,999 | 5 (0.7%) | 9 (2.9%) |
| $15,000 to $19,999 | 14 (2.0%) | 0 (0.0%) |
| $20,000 to $24,999 | 21 (3.0%) | 20 (6.5%) |
| $25,000 to $34,999 | 50 (7.1%) | 96 (31.4%) |
| $35,000 to $49,999 | 135 (19.2%) | 58 (19.0%) |
| $50,000 to $74,999 | 102 (14.5%) | 70 (22.9%) |
| $75,000 to $99,999 | 130 (18.5%) | 25 (8.2%) |
| $100,000 to $149,999 | 157 (22.3%) | 19 (6.2%) |
| $150,000 or more | 65 (9.2%) | 9 (2.9%) |
| Total | 704 (100.0%) | 306 (100.0%) |
Monthly Housing Cost Tiers in Auburn
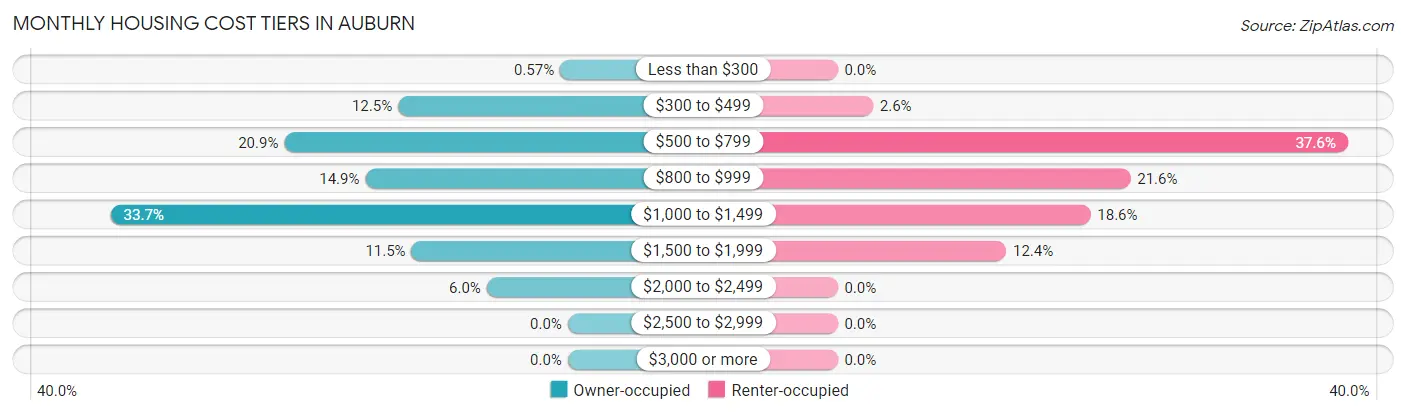
| Monthly Cost | Owner-occupied | Renter-occupied |
| Less than $300 | 4 (0.6%) | 0 (0.0%) |
| $300 to $499 | 88 (12.5%) | 8 (2.6%) |
| $500 to $799 | 147 (20.9%) | 115 (37.6%) |
| $800 to $999 | 105 (14.9%) | 66 (21.6%) |
| $1,000 to $1,499 | 237 (33.7%) | 57 (18.6%) |
| $1,500 to $1,999 | 81 (11.5%) | 38 (12.4%) |
| $2,000 to $2,499 | 42 (6.0%) | 0 (0.0%) |
| $2,500 to $2,999 | 0 (0.0%) | 0 (0.0%) |
| $3,000 or more | 0 (0.0%) | 0 (0.0%) |
| Total | 704 (100.0%) | 306 (100.0%) |
Physical Housing Characteristics in Auburn
Housing Structures in Auburn
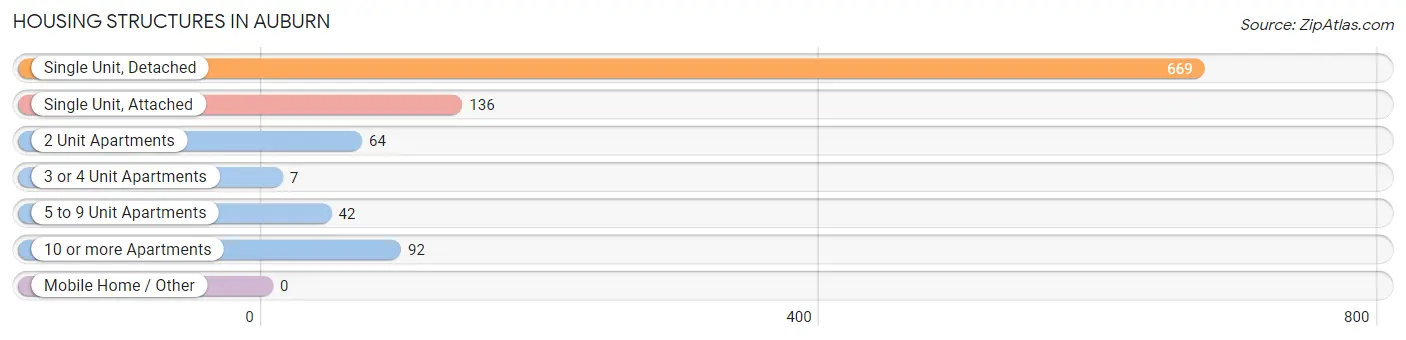
| Structure Type | # Housing Units | % Housing Units |
| Single Unit, Detached | 669 | 66.2% |
| Single Unit, Attached | 136 | 13.5% |
| 2 Unit Apartments | 64 | 6.3% |
| 3 or 4 Unit Apartments | 7 | 0.7% |
| 5 to 9 Unit Apartments | 42 | 4.2% |
| 10 or more Apartments | 92 | 9.1% |
| Mobile Home / Other | 0 | 0.0% |
| Total | 1,010 | 100.0% |
Housing Structures by Occupancy in Auburn
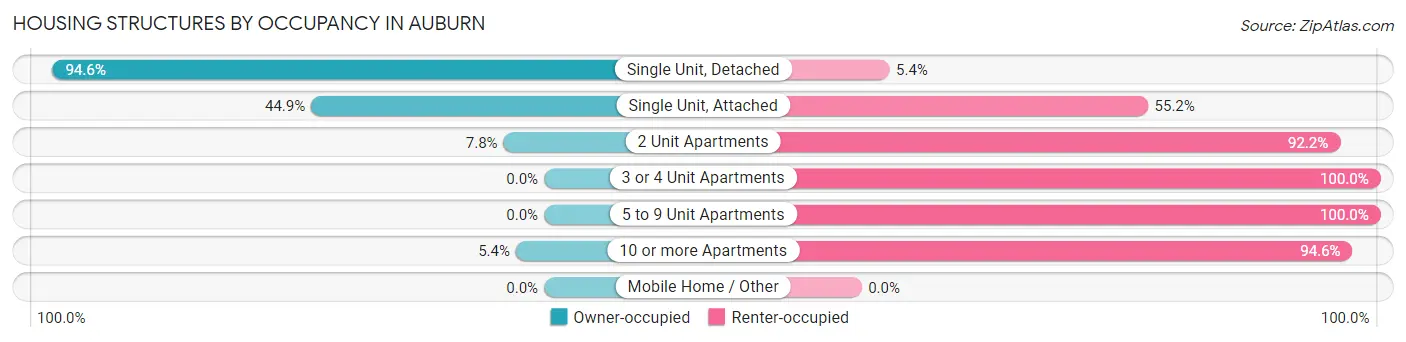
| Structure Type | Owner-occupied | Renter-occupied |
| Single Unit, Detached | 633 (94.6%) | 36 (5.4%) |
| Single Unit, Attached | 61 (44.9%) | 75 (55.1%) |
| 2 Unit Apartments | 5 (7.8%) | 59 (92.2%) |
| 3 or 4 Unit Apartments | 0 (0.0%) | 7 (100.0%) |
| 5 to 9 Unit Apartments | 0 (0.0%) | 42 (100.0%) |
| 10 or more Apartments | 5 (5.4%) | 87 (94.6%) |
| Mobile Home / Other | 0 (0.0%) | 0 (0.0%) |
| Total | 704 (69.7%) | 306 (30.3%) |
Housing Structures by Number of Rooms in Auburn
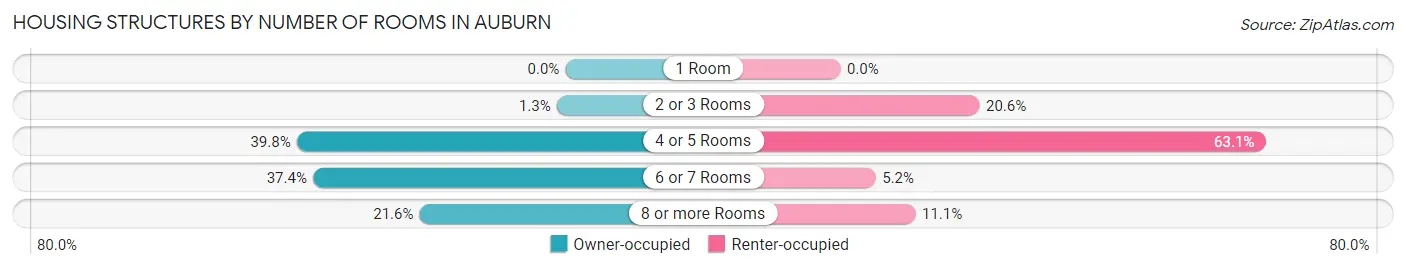
| Number of Rooms | Owner-occupied | Renter-occupied |
| 1 Room | 0 (0.0%) | 0 (0.0%) |
| 2 or 3 Rooms | 9 (1.3%) | 63 (20.6%) |
| 4 or 5 Rooms | 280 (39.8%) | 193 (63.1%) |
| 6 or 7 Rooms | 263 (37.4%) | 16 (5.2%) |
| 8 or more Rooms | 152 (21.6%) | 34 (11.1%) |
| Total | 704 (100.0%) | 306 (100.0%) |
Housing Structure by Heating Type in Auburn
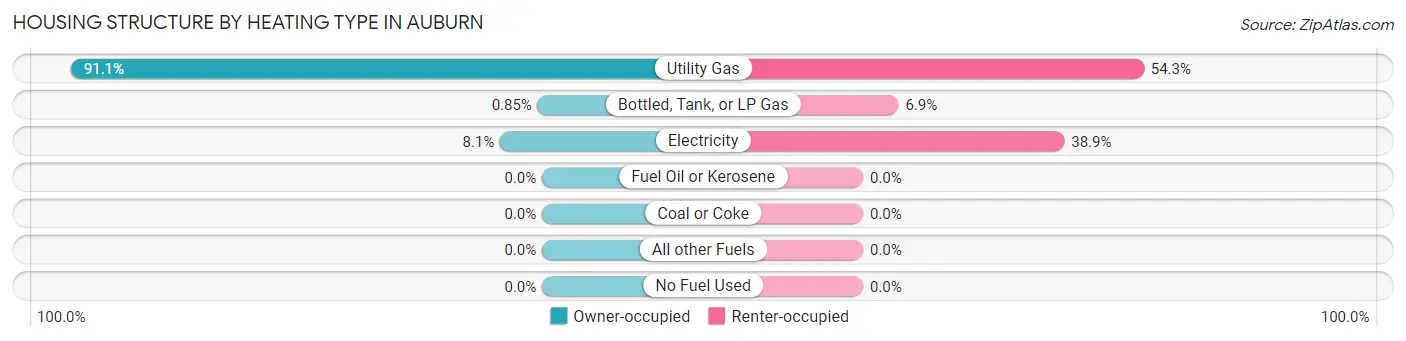
| Heating Type | Owner-occupied | Renter-occupied |
| Utility Gas | 641 (91.0%) | 166 (54.2%) |
| Bottled, Tank, or LP Gas | 6 (0.9%) | 21 (6.9%) |
| Electricity | 57 (8.1%) | 119 (38.9%) |
| Fuel Oil or Kerosene | 0 (0.0%) | 0 (0.0%) |
| Coal or Coke | 0 (0.0%) | 0 (0.0%) |
| All other Fuels | 0 (0.0%) | 0 (0.0%) |
| No Fuel Used | 0 (0.0%) | 0 (0.0%) |
| Total | 704 (100.0%) | 306 (100.0%) |
Household Vehicle Usage in Auburn
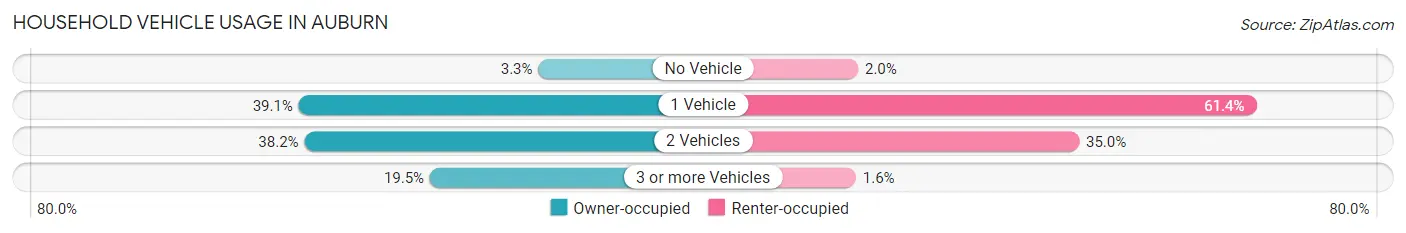
| Vehicles per Household | Owner-occupied | Renter-occupied |
| No Vehicle | 23 (3.3%) | 6 (2.0%) |
| 1 Vehicle | 275 (39.1%) | 188 (61.4%) |
| 2 Vehicles | 269 (38.2%) | 107 (35.0%) |
| 3 or more Vehicles | 137 (19.5%) | 5 (1.6%) |
| Total | 704 (100.0%) | 306 (100.0%) |
Real Estate & Mortgages in Auburn
Real Estate and Mortgage Overview in Auburn
| Characteristic | Without Mortgage | With Mortgage |
| Housing Units | 245 | 459 |
| Median Property Value | $152,800 | $159,200 |
| Median Household Income | $50,329 | $41 |
| Monthly Housing Costs | $552 | $0 |
| Real Estate Taxes | $2,679 | $6 |
Property Value by Mortgage Status in Auburn
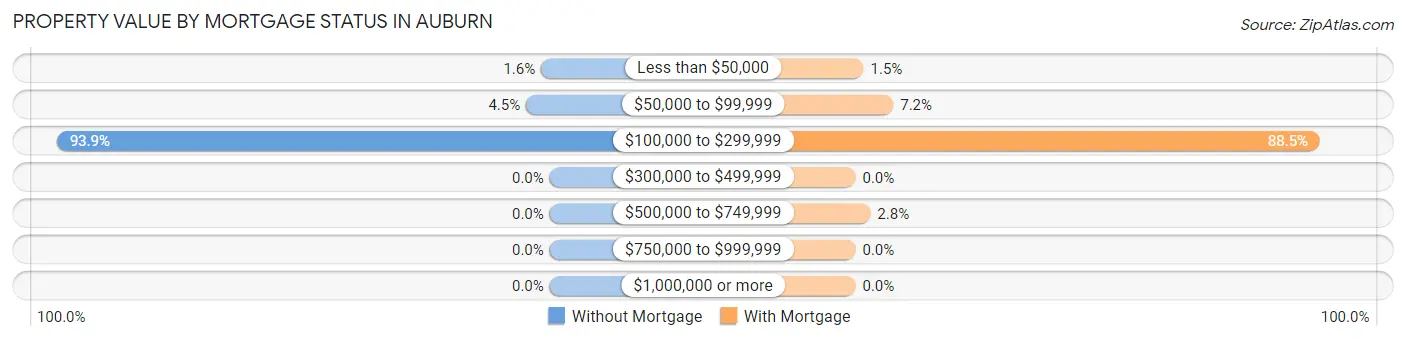
| Property Value | Without Mortgage | With Mortgage |
| Less than $50,000 | 4 (1.6%) | 7 (1.5%) |
| $50,000 to $99,999 | 11 (4.5%) | 33 (7.2%) |
| $100,000 to $299,999 | 230 (93.9%) | 406 (88.4%) |
| $300,000 to $499,999 | 0 (0.0%) | 0 (0.0%) |
| $500,000 to $749,999 | 0 (0.0%) | 13 (2.8%) |
| $750,000 to $999,999 | 0 (0.0%) | 0 (0.0%) |
| $1,000,000 or more | 0 (0.0%) | 0 (0.0%) |
| Total | 245 (100.0%) | 459 (100.0%) |
Household Income by Mortgage Status in Auburn
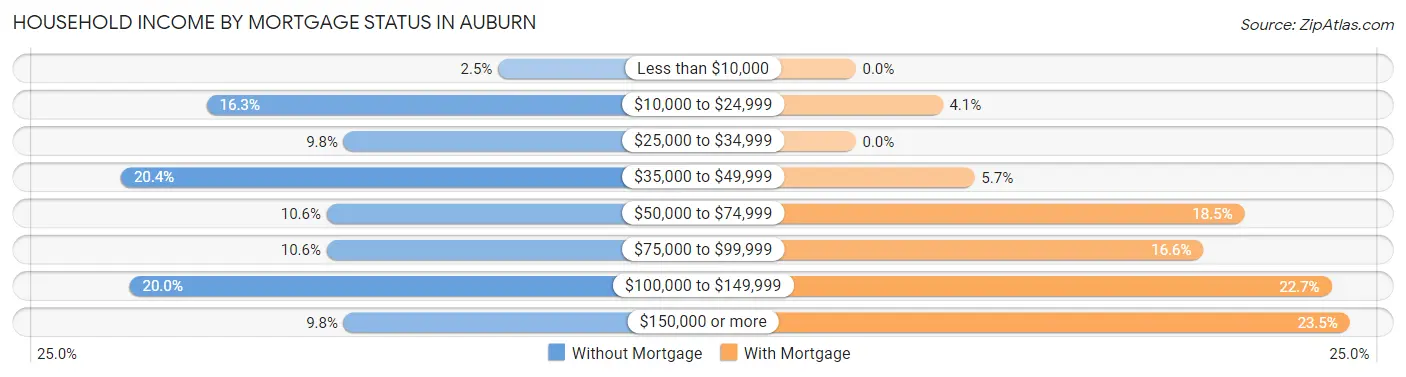
| Household Income | Without Mortgage | With Mortgage |
| Less than $10,000 | 6 (2.5%) | 0 (0.0%) |
| $10,000 to $24,999 | 40 (16.3%) | 19 (4.1%) |
| $25,000 to $34,999 | 24 (9.8%) | 0 (0.0%) |
| $35,000 to $49,999 | 50 (20.4%) | 26 (5.7%) |
| $50,000 to $74,999 | 26 (10.6%) | 85 (18.5%) |
| $75,000 to $99,999 | 26 (10.6%) | 76 (16.6%) |
| $100,000 to $149,999 | 49 (20.0%) | 104 (22.7%) |
| $150,000 or more | 24 (9.8%) | 108 (23.5%) |
| Total | 245 (100.0%) | 459 (100.0%) |
Property Value to Household Income Ratio in Auburn
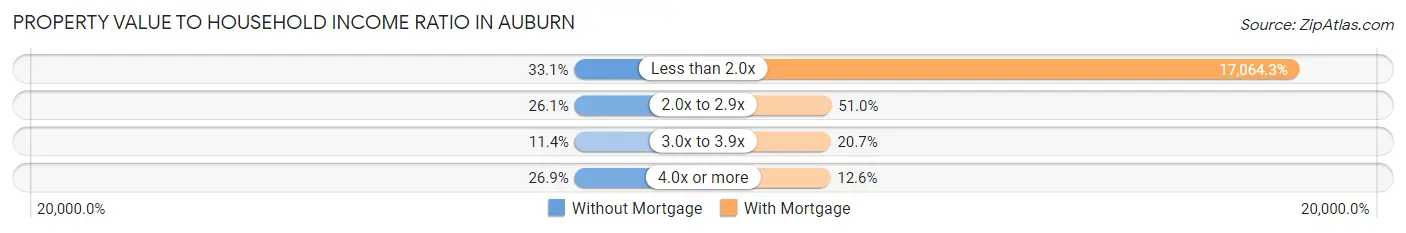
| Value-to-Income Ratio | Without Mortgage | With Mortgage |
| Less than 2.0x | 81 (33.1%) | 78,325 (17,064.3%) |
| 2.0x to 2.9x | 64 (26.1%) | 234 (51.0%) |
| 3.0x to 3.9x | 28 (11.4%) | 95 (20.7%) |
| 4.0x or more | 66 (26.9%) | 58 (12.6%) |
| Total | 245 (100.0%) | 459 (100.0%) |
Real Estate Taxes by Mortgage Status in Auburn
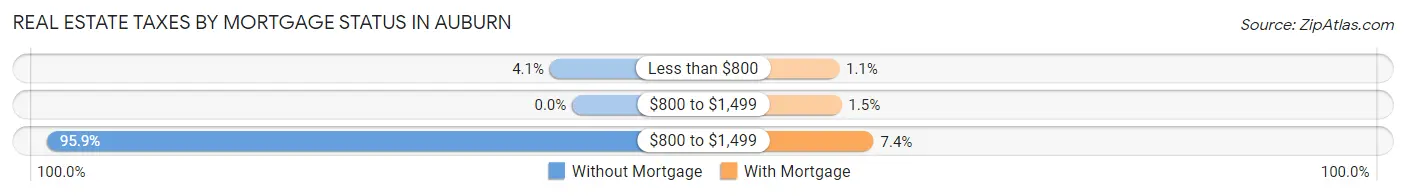
| Property Taxes | Without Mortgage | With Mortgage |
| Less than $800 | 10 (4.1%) | 5 (1.1%) |
| $800 to $1,499 | 0 (0.0%) | 7 (1.5%) |
| $800 to $1,499 | 235 (95.9%) | 34 (7.4%) |
| Total | 245 (100.0%) | 459 (100.0%) |
Health & Disability in Auburn
Health Insurance Coverage by Age in Auburn
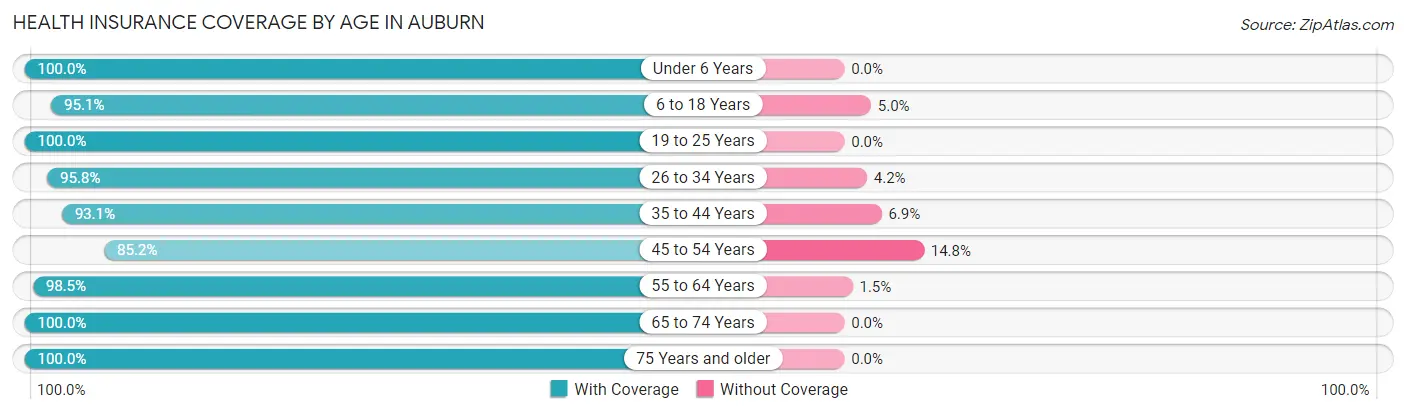
| Age Bracket | With Coverage | Without Coverage |
| Under 6 Years | 113 (100.0%) | 0 (0.0%) |
| 6 to 18 Years | 192 (95.1%) | 10 (5.0%) |
| 19 to 25 Years | 116 (100.0%) | 0 (0.0%) |
| 26 to 34 Years | 250 (95.8%) | 11 (4.2%) |
| 35 to 44 Years | 215 (93.1%) | 16 (6.9%) |
| 45 to 54 Years | 201 (85.2%) | 35 (14.8%) |
| 55 to 64 Years | 258 (98.5%) | 4 (1.5%) |
| 65 to 74 Years | 237 (100.0%) | 0 (0.0%) |
| 75 Years and older | 263 (100.0%) | 0 (0.0%) |
| Total | 1,845 (96.0%) | 76 (4.0%) |
Health Insurance Coverage by Citizenship Status in Auburn
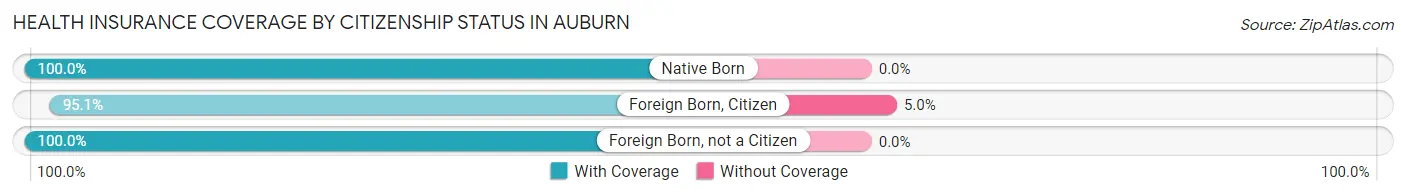
| Citizenship Status | With Coverage | Without Coverage |
| Native Born | 113 (100.0%) | 0 (0.0%) |
| Foreign Born, Citizen | 192 (95.1%) | 10 (5.0%) |
| Foreign Born, not a Citizen | 116 (100.0%) | 0 (0.0%) |
Health Insurance Coverage by Household Income in Auburn
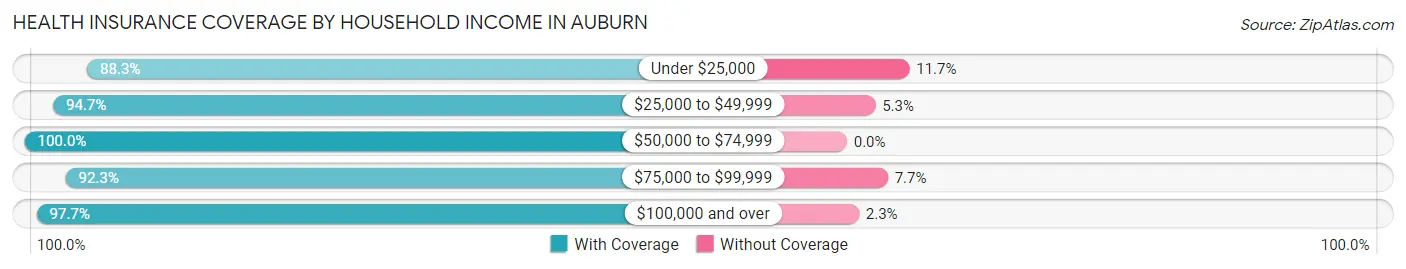
| Household Income | With Coverage | Without Coverage |
| Under $25,000 | 98 (88.3%) | 13 (11.7%) |
| $25,000 to $49,999 | 480 (94.7%) | 27 (5.3%) |
| $50,000 to $74,999 | 372 (100.0%) | 0 (0.0%) |
| $75,000 to $99,999 | 265 (92.3%) | 22 (7.7%) |
| $100,000 and over | 605 (97.7%) | 14 (2.3%) |
Public vs Private Health Insurance Coverage by Age in Auburn
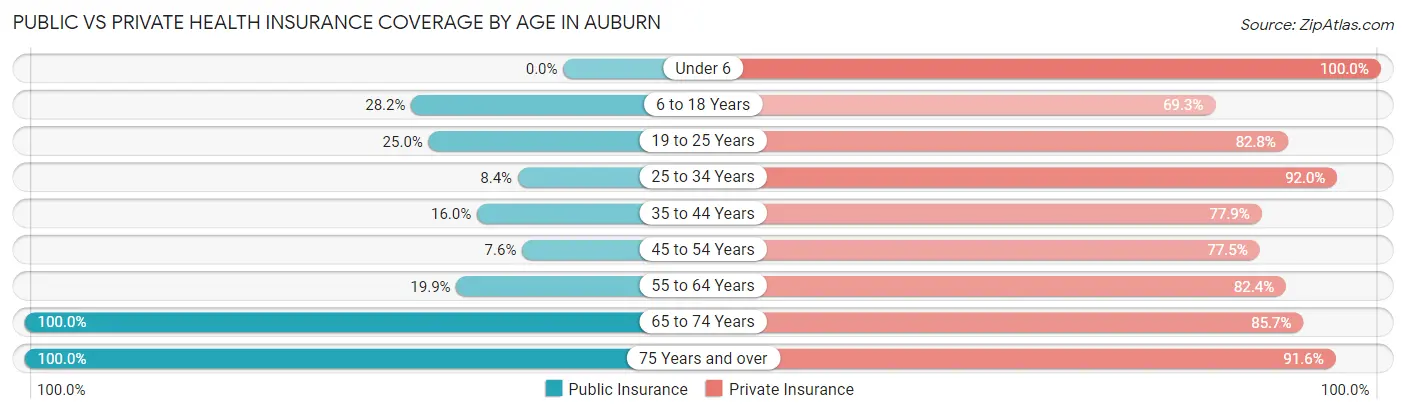
| Age Bracket | Public Insurance | Private Insurance |
| Under 6 | 0 (0.0%) | 113 (100.0%) |
| 6 to 18 Years | 57 (28.2%) | 140 (69.3%) |
| 19 to 25 Years | 29 (25.0%) | 96 (82.8%) |
| 25 to 34 Years | 22 (8.4%) | 240 (91.9%) |
| 35 to 44 Years | 37 (16.0%) | 180 (77.9%) |
| 45 to 54 Years | 18 (7.6%) | 183 (77.5%) |
| 55 to 64 Years | 52 (19.9%) | 216 (82.4%) |
| 65 to 74 Years | 237 (100.0%) | 203 (85.7%) |
| 75 Years and over | 263 (100.0%) | 241 (91.6%) |
| Total | 715 (37.2%) | 1,612 (83.9%) |
Disability Status by Sex by Age in Auburn
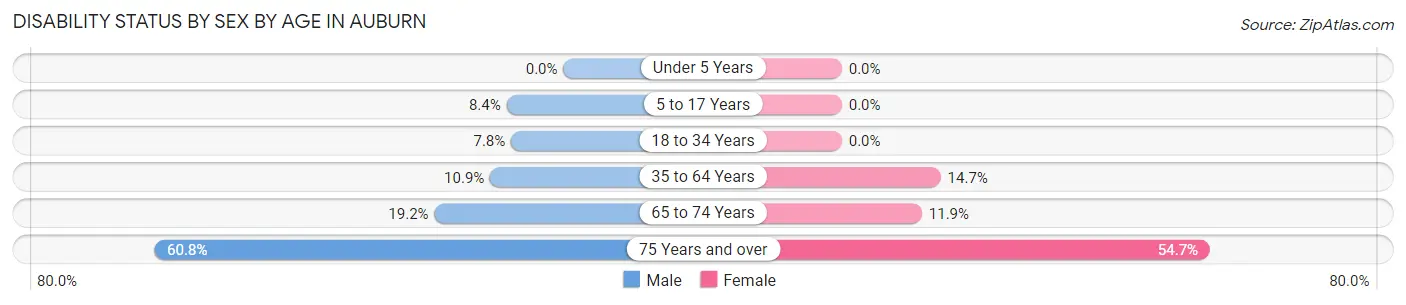
| Age Bracket | Male | Female |
| Under 5 Years | 0 (0.0%) | 0 (0.0%) |
| 5 to 17 Years | 7 (8.4%) | 0 (0.0%) |
| 18 to 34 Years | 17 (7.8%) | 0 (0.0%) |
| 35 to 64 Years | 40 (10.9%) | 53 (14.7%) |
| 65 to 74 Years | 18 (19.2%) | 17 (11.9%) |
| 75 Years and over | 62 (60.8%) | 88 (54.7%) |
Disability Class by Sex by Age in Auburn
Disability Class: Hearing Difficulty
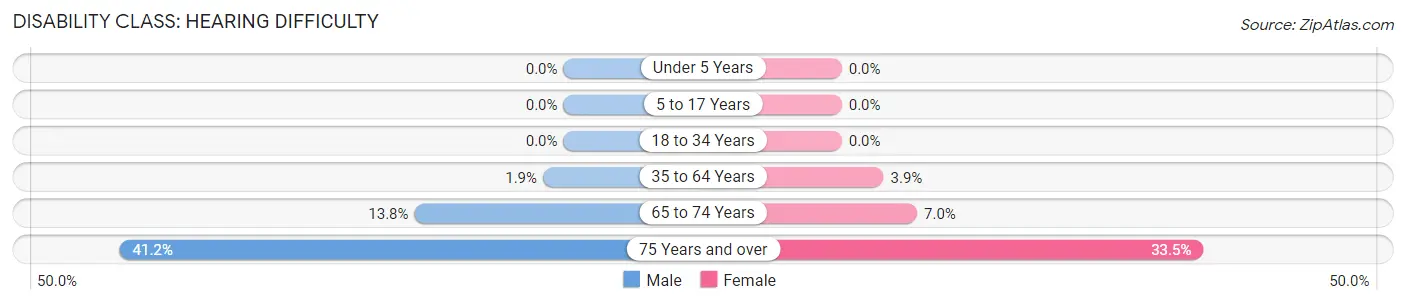
| Age Bracket | Male | Female |
| Under 5 Years | 0 (0.0%) | 0 (0.0%) |
| 5 to 17 Years | 0 (0.0%) | 0 (0.0%) |
| 18 to 34 Years | 0 (0.0%) | 0 (0.0%) |
| 35 to 64 Years | 7 (1.9%) | 14 (3.9%) |
| 65 to 74 Years | 13 (13.8%) | 10 (7.0%) |
| 75 Years and over | 42 (41.2%) | 54 (33.5%) |
Disability Class: Vision Difficulty
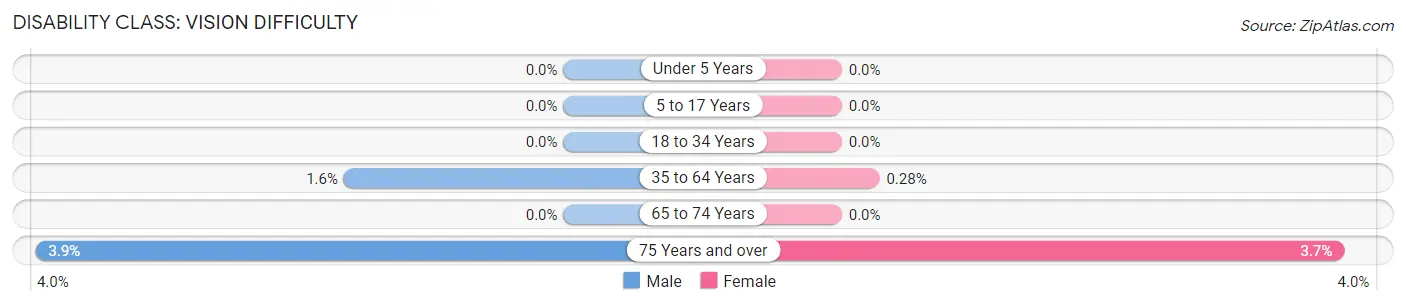
| Age Bracket | Male | Female |
| Under 5 Years | 0 (0.0%) | 0 (0.0%) |
| 5 to 17 Years | 0 (0.0%) | 0 (0.0%) |
| 18 to 34 Years | 0 (0.0%) | 0 (0.0%) |
| 35 to 64 Years | 6 (1.6%) | 1 (0.3%) |
| 65 to 74 Years | 0 (0.0%) | 0 (0.0%) |
| 75 Years and over | 4 (3.9%) | 6 (3.7%) |
Disability Class: Cognitive Difficulty
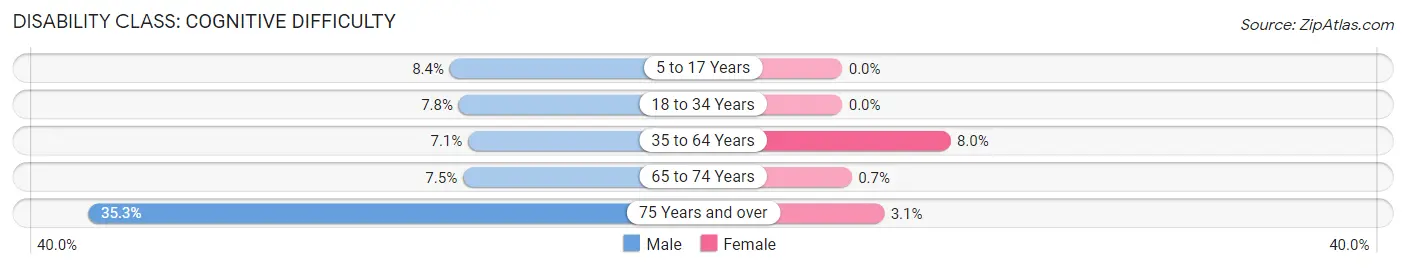
| Age Bracket | Male | Female |
| 5 to 17 Years | 7 (8.4%) | 0 (0.0%) |
| 18 to 34 Years | 17 (7.8%) | 0 (0.0%) |
| 35 to 64 Years | 26 (7.1%) | 29 (8.0%) |
| 65 to 74 Years | 7 (7.4%) | 1 (0.7%) |
| 75 Years and over | 36 (35.3%) | 5 (3.1%) |
Disability Class: Ambulatory Difficulty
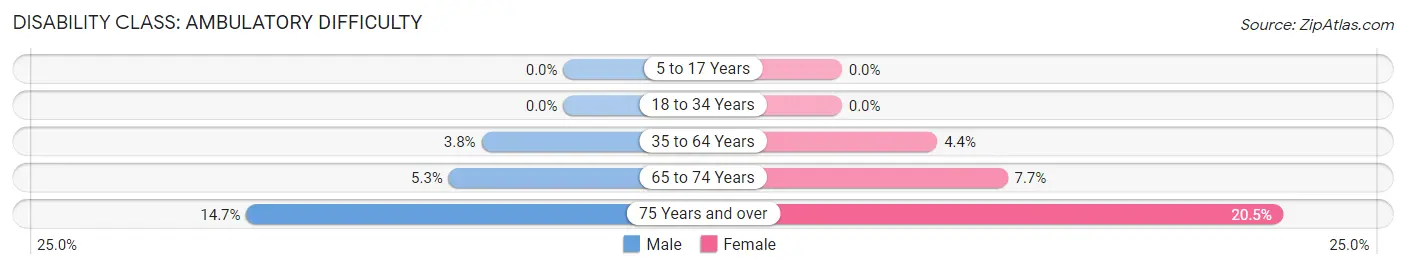
| Age Bracket | Male | Female |
| 5 to 17 Years | 0 (0.0%) | 0 (0.0%) |
| 18 to 34 Years | 0 (0.0%) | 0 (0.0%) |
| 35 to 64 Years | 14 (3.8%) | 16 (4.4%) |
| 65 to 74 Years | 5 (5.3%) | 11 (7.7%) |
| 75 Years and over | 15 (14.7%) | 33 (20.5%) |
Disability Class: Self-Care Difficulty
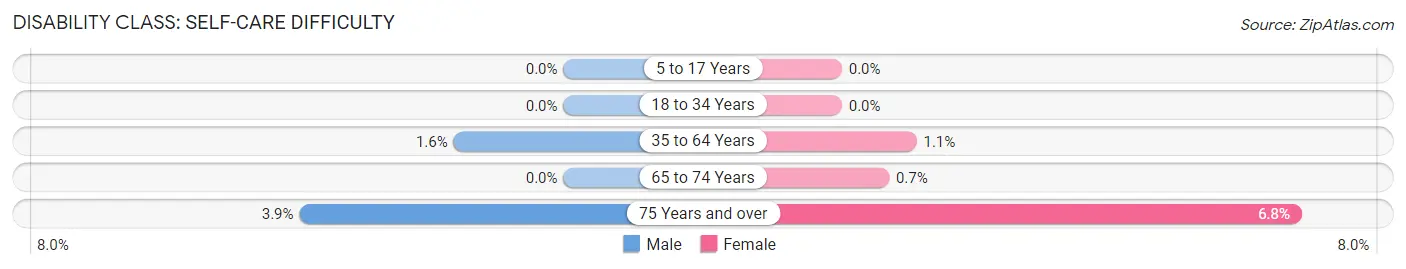
| Age Bracket | Male | Female |
| 5 to 17 Years | 0 (0.0%) | 0 (0.0%) |
| 18 to 34 Years | 0 (0.0%) | 0 (0.0%) |
| 35 to 64 Years | 6 (1.6%) | 4 (1.1%) |
| 65 to 74 Years | 0 (0.0%) | 1 (0.7%) |
| 75 Years and over | 4 (3.9%) | 11 (6.8%) |
Technology Access in Auburn
Computing Device Access in Auburn
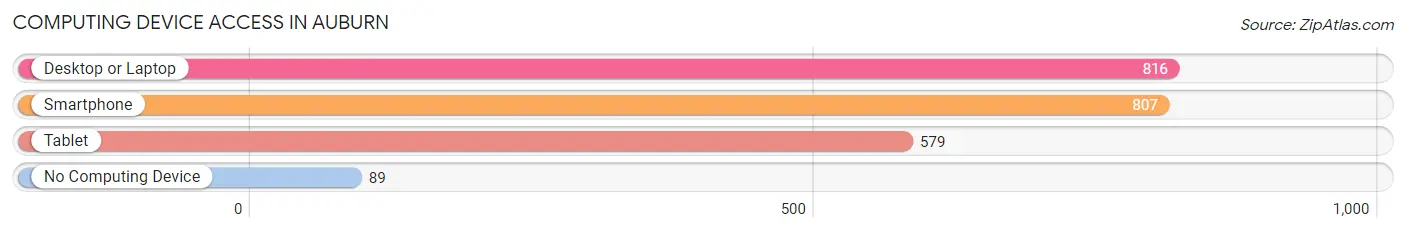
| Device Type | # Households | % Households |
| Desktop or Laptop | 816 | 80.8% |
| Smartphone | 807 | 79.9% |
| Tablet | 579 | 57.3% |
| No Computing Device | 89 | 8.8% |
| Total | 1,010 | 100.0% |
Internet Access in Auburn
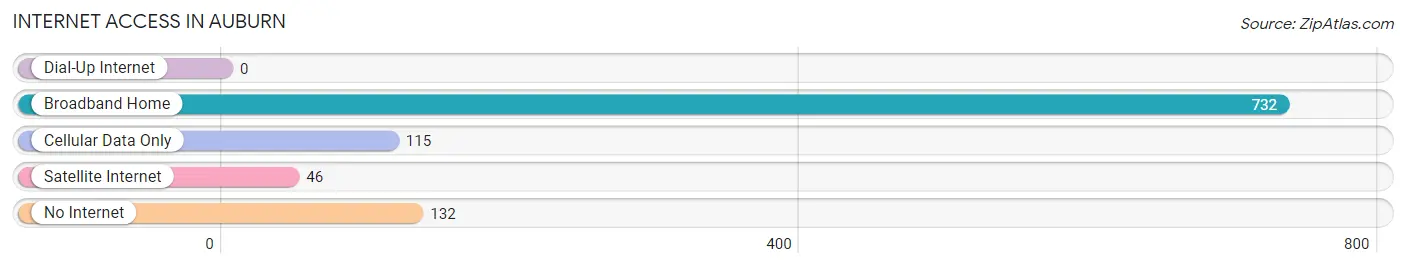
| Internet Type | # Households | % Households |
| Dial-Up Internet | 0 | 0.0% |
| Broadband Home | 732 | 72.5% |
| Cellular Data Only | 115 | 11.4% |
| Satellite Internet | 46 | 4.5% |
| No Internet | 132 | 13.1% |
| Total | 1,010 | 100.0% |
Auburn Summary
Auburn, Michigan is a small city located in Bay County, Michigan. It is situated on the Saginaw Bay of Lake Huron, approximately 10 miles east of Bay City. The city has a population of approximately 2,000 people and is part of the Bay City Metropolitan Statistical Area.
History
Auburn was first settled in 1837 by a group of settlers from New York. The settlement was originally known as “Auburnville” and was located on the banks of the Saginaw River. The settlement was later renamed “Auburn” in 1845. The city was officially incorporated in 1867.
In the late 19th century, Auburn was a major lumbering center. The city was home to several sawmills and lumber yards. The lumber industry was the primary source of employment for the city’s residents.
In the early 20th century, Auburn began to transition away from its reliance on the lumber industry. The city began to attract new industries, such as a paper mill, a canning factory, and a furniture factory. These new industries provided employment for the city’s residents and helped to diversify the local economy.
Geography
Auburn is located in Bay County, Michigan. The city is situated on the Saginaw Bay of Lake Huron, approximately 10 miles east of Bay City. The city has a total area of 1.7 square miles, all of which is land.
The city is located in a flat, low-lying area. The terrain is mostly flat, with some rolling hills in the northern part of the city. The city is located in a humid continental climate zone, with warm summers and cold winters.
Economy
Auburn’s economy is largely based on manufacturing and services. The city is home to several manufacturing companies, including a paper mill, a canning factory, and a furniture factory. The city is also home to several service-based businesses, such as restaurants, retail stores, and medical offices.
The city’s largest employer is the Bay County Health Department, which employs over 500 people. Other major employers in the city include the Bay County Sheriff’s Office, the Bay County Public Schools, and the Bay County Library System.
Demographics
As of the 2010 census, Auburn had a population of 2,000 people. The racial makeup of the city was 95.2% White, 0.7% African American, 0.3% Native American, 0.7% Asian, 0.1% Pacific Islander, 0.7% from other races, and 2.1% from two or more races. Hispanic or Latino of any race were 2.3% of the population.
The median household income in Auburn was $37,917, and the median family income was $45,625. The per capita income for the city was $19,945. About 11.2% of families and 14.2% of the population were below the poverty line, including 19.2% of those under age 18 and 8.3% of those age 65 or over.
Common Questions
What is Per Capita Income in Auburn?
Per Capita income in Auburn is $38,634.
What is the Median Family Income in Auburn?
Median Family Income in Auburn is $72,583.
What is the Median Household income in Auburn?
Median Household Income in Auburn is $62,589.
What is Income or Wage Gap in Auburn?
Income or Wage Gap in Auburn is 17.1%.
Women in Auburn earn 82.9 cents for every dollar earned by a man.
What is Inequality or Gini Index in Auburn?
Inequality or Gini Index in Auburn is 0.37.
What is the Total Population of Auburn?
Total Population of Auburn is 1,921.
What is the Total Male Population of Auburn?
Total Male Population of Auburn is 942.
What is the Total Female Population of Auburn?
Total Female Population of Auburn is 979.
What is the Ratio of Males per 100 Females in Auburn?
There are 96.22 Males per 100 Females in Auburn.
What is the Ratio of Females per 100 Males in Auburn?
There are 103.93 Females per 100 Males in Auburn.
What is the Median Population Age in Auburn?
Median Population Age in Auburn is 46.8 Years.
What is the Average Family Size in Auburn
Average Family Size in Auburn is 2.5 People.
What is the Average Household Size in Auburn
Average Household Size in Auburn is 1.9 People.
How Large is the Labor Force in Auburn?
There are 1,059 People in the Labor Forcein in Auburn.
What is the Percentage of People in the Labor Force in Auburn?
63.7% of People are in the Labor Force in Auburn.
What is the Unemployment Rate in Auburn?
Unemployment Rate in Auburn is 2.7%.