Cantwell, AK Map & Demographics
Cantwell Map
Cantwell Overview
$32,399
PER CAPITA INCOME
$61,250
AVG FAMILY INCOME
$36,500
AVG HOUSEHOLD INCOME
0.36
INEQUALITY / GINI INDEX
117
TOTAL POPULATION
75
MALE POPULATION
42
FEMALE POPULATION
178.57
MALES / 100 FEMALES
56.00
FEMALES / 100 MALES
65.4
MEDIAN AGE
2.3
AVG FAMILY SIZE
1.3
AVG HOUSEHOLD SIZE
39
LABOR FORCE [ PEOPLE ]
34.2%
PERCENT IN LABOR FORCE
17.9%
UNEMPLOYMENT RATE
Cantwell Zip Codes
Cantwell Area Codes
Income in Cantwell
Income Overview in Cantwell
Per Capita Income in Cantwell is $32,399, while median incomes of families and households are $61,250 and $36,500 respectively.
| Characteristic | Number | Measure |
| Per Capita Income | 117 | $32,399 |
| Median Family Income | 16 | $61,250 |
| Mean Family Income | 16 | $70,931 |
| Median Household Income | 90 | $36,500 |
| Mean Household Income | 90 | $44,192 |
| Income Deficit | 16 | $0 |
| Wage / Income Gap (%) | 117 | 0.00% |
| Wage / Income Gap ($) | 117 | 100.00¢ per $1 |
| Gini / Inequality Index | 117 | 0.36 |
Earnings by Sex in Cantwell
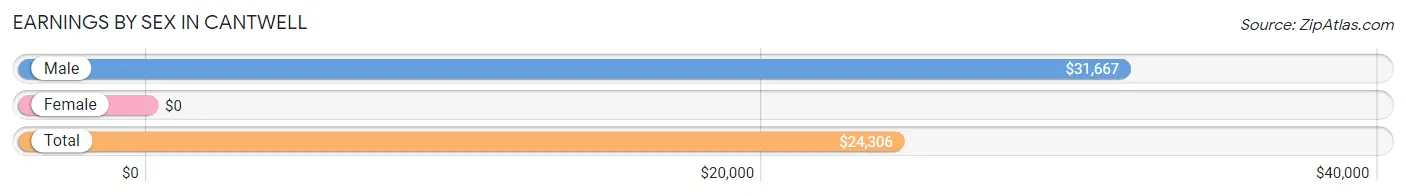
| Sex | Number | Average Earnings |
| Male | 26 (49.1%) | $31,667 |
| Female | 27 (50.9%) | $0 |
| Total | 53 (100.0%) | $24,306 |
Earnings by Sex by Income Bracket in Cantwell
The most common earnings brackets in Cantwell are $15,000 to $17,499 for men (5 | 19.2%) and $2,499 or less for women (6 | 22.2%).
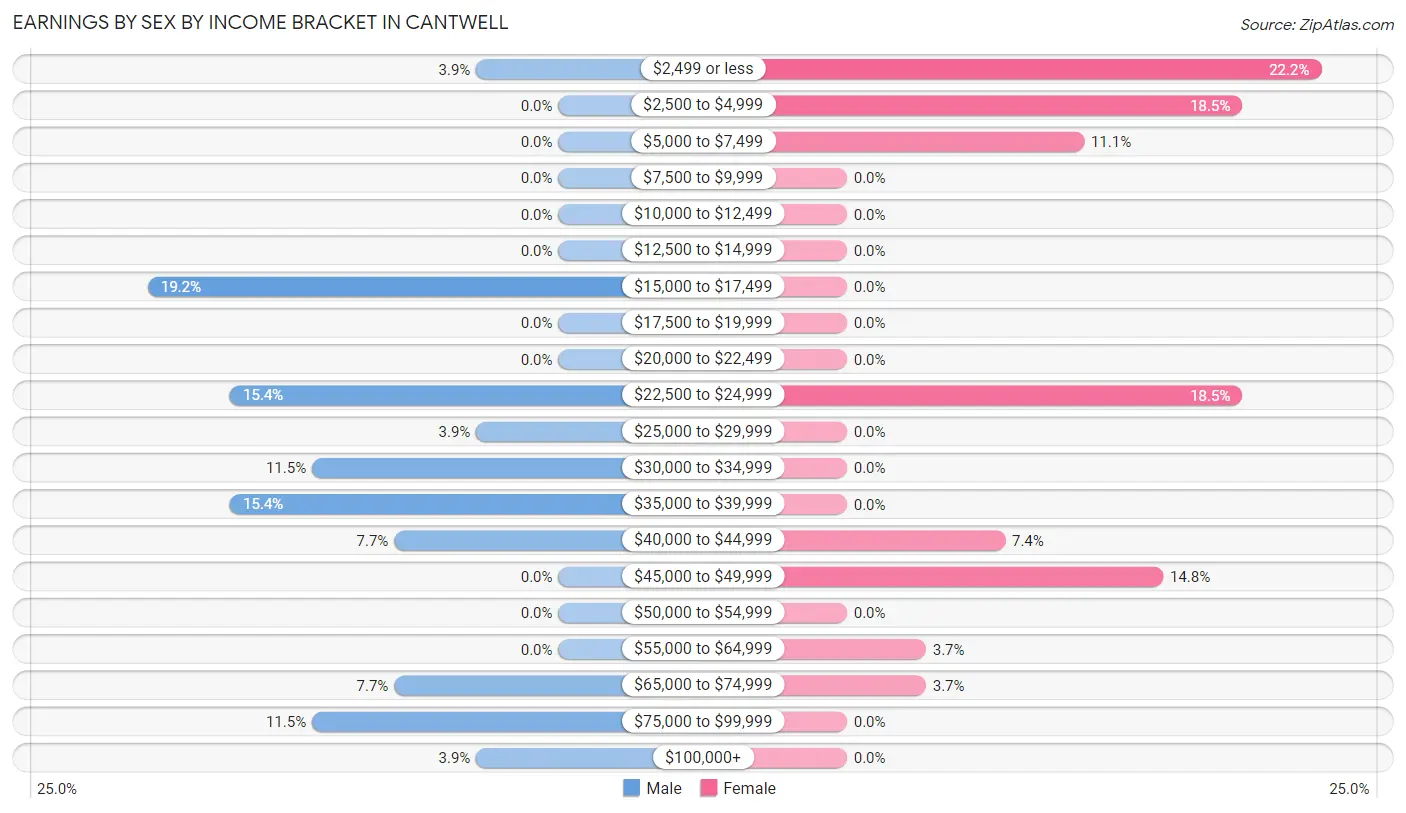
| Income | Male | Female |
| $2,499 or less | 1 (3.8%) | 6 (22.2%) |
| $2,500 to $4,999 | 0 (0.0%) | 5 (18.5%) |
| $5,000 to $7,499 | 0 (0.0%) | 3 (11.1%) |
| $7,500 to $9,999 | 0 (0.0%) | 0 (0.0%) |
| $10,000 to $12,499 | 0 (0.0%) | 0 (0.0%) |
| $12,500 to $14,999 | 0 (0.0%) | 0 (0.0%) |
| $15,000 to $17,499 | 5 (19.2%) | 0 (0.0%) |
| $17,500 to $19,999 | 0 (0.0%) | 0 (0.0%) |
| $20,000 to $22,499 | 0 (0.0%) | 0 (0.0%) |
| $22,500 to $24,999 | 4 (15.4%) | 5 (18.5%) |
| $25,000 to $29,999 | 1 (3.8%) | 0 (0.0%) |
| $30,000 to $34,999 | 3 (11.5%) | 0 (0.0%) |
| $35,000 to $39,999 | 4 (15.4%) | 0 (0.0%) |
| $40,000 to $44,999 | 2 (7.7%) | 2 (7.4%) |
| $45,000 to $49,999 | 0 (0.0%) | 4 (14.8%) |
| $50,000 to $54,999 | 0 (0.0%) | 0 (0.0%) |
| $55,000 to $64,999 | 0 (0.0%) | 1 (3.7%) |
| $65,000 to $74,999 | 2 (7.7%) | 1 (3.7%) |
| $75,000 to $99,999 | 3 (11.5%) | 0 (0.0%) |
| $100,000+ | 1 (3.8%) | 0 (0.0%) |
| Total | 26 (100.0%) | 27 (100.0%) |
Earnings by Sex by Educational Attainment in Cantwell
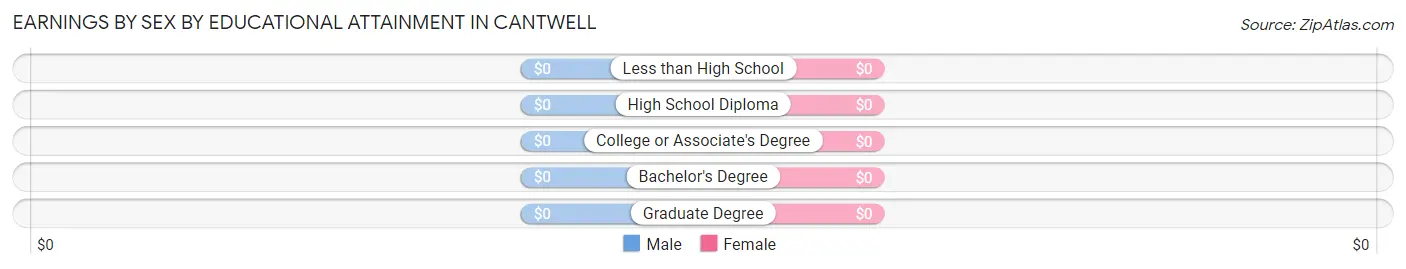
| Educational Attainment | Male Income | Female Income |
| Less than High School | - | - |
| High School Diploma | - | - |
| College or Associate's Degree | - | - |
| Bachelor's Degree | - | - |
| Graduate Degree | - | - |
| Total | $35,625 | $0 |
Family Income in Cantwell
Family Income Brackets in Cantwell
According to the Cantwell family income data, there are 8 families falling into the $50,000 to $74,999 income range, which is the most common income bracket and makes up 50.0% of all families.
| Income Bracket | # Families | % Families |
| Less than $10,000 | 0 | 0.0% |
| $10,000 to $14,999 | 0 | 0.0% |
| $15,000 to $24,999 | 0 | 0.0% |
| $25,000 to $34,999 | 2 | 12.5% |
| $35,000 to $49,999 | 1 | 6.3% |
| $50,000 to $74,999 | 8 | 50.0% |
| $75,000 to $99,999 | 1 | 6.3% |
| $100,000 to $149,999 | 4 | 25.0% |
| $150,000 to $199,999 | 0 | 0.0% |
| $200,000+ | 0 | 0.0% |
Family Income by Famaliy Size in Cantwell
2-person families (13 | 81.2%) account for the highest median family income in Cantwell with $51,750 per family, while 2-person families (13 | 81.2%) have the highest median income of $25,875 per family member.
| Income Bracket | # Families | Median Income |
| 2-Person Families | 13 (81.2%) | $51,750 |
| 3-Person Families | 0 (0.0%) | $0 |
| 4-Person Families | 0 (0.0%) | $0 |
| 5-Person Families | 3 (18.8%) | $0 |
| 6-Person Families | 0 (0.0%) | $0 |
| 7+ Person Families | 0 (0.0%) | $0 |
| Total | 16 (100.0%) | $61,250 |
Family Income by Number of Earners in Cantwell
| Number of Earners | # Families | Median Income |
| No Earners | 9 (56.2%) | $50,750 |
| 1 Earner | 0 (0.0%) | $0 |
| 2 Earners | 4 (25.0%) | $0 |
| 3+ Earners | 3 (18.8%) | $0 |
| Total | 16 (100.0%) | $61,250 |
Household Income in Cantwell
Household Income Brackets in Cantwell
With 31 households falling in the category, the $15,000 to $24,999 income range is the most frequent in Cantwell, accounting for 34.4% of all households.
| Income Bracket | # Households | % Households |
| Less than $10,000 | 3 | 3.3% |
| $10,000 to $14,999 | 4 | 4.4% |
| $15,000 to $24,999 | 31 | 34.4% |
| $25,000 to $34,999 | 4 | 4.4% |
| $35,000 to $49,999 | 19 | 21.1% |
| $50,000 to $74,999 | 16 | 17.8% |
| $75,000 to $99,999 | 7 | 7.8% |
| $100,000 to $149,999 | 6 | 6.7% |
| $150,000 to $199,999 | 0 | 0.0% |
| $200,000+ | 0 | 0.0% |
Household Income by Householder Age in Cantwell
The median household income in Cantwell is $36,500, with the highest median household income of $71,563 found in the 25 to 44 years age bracket for the primary householder. A total of 15 households (16.7%) fall into this category.
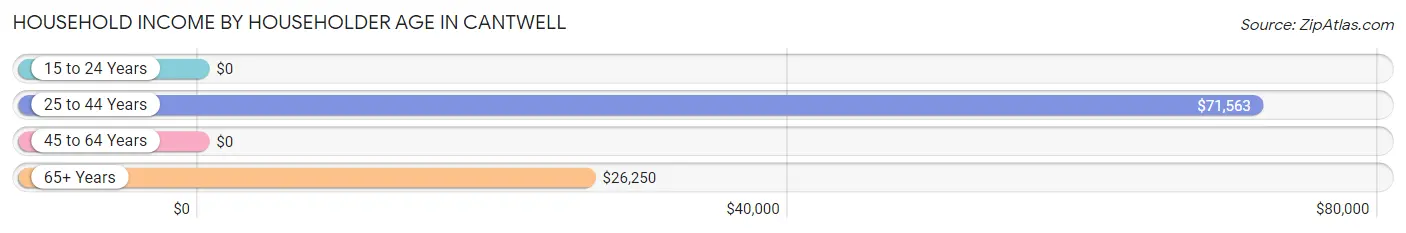
| Income Bracket | # Households | Median Income |
| 15 to 24 Years | 0 (0.0%) | $0 |
| 25 to 44 Years | 15 (16.7%) | $71,563 |
| 45 to 64 Years | 23 (25.6%) | $0 |
| 65+ Years | 52 (57.8%) | $26,250 |
| Total | 90 (100.0%) | $36,500 |
Poverty in Cantwell
Income Below Poverty by Sex and Age in Cantwell
With 2.7% poverty level for males and 11.9% for females among the residents of Cantwell, 65 to 74 year old males and 55 to 64 year old females are the most vulnerable to poverty, with 2 males (15.4%) and 2 females (50.0%) in their respective age groups living below the poverty level.
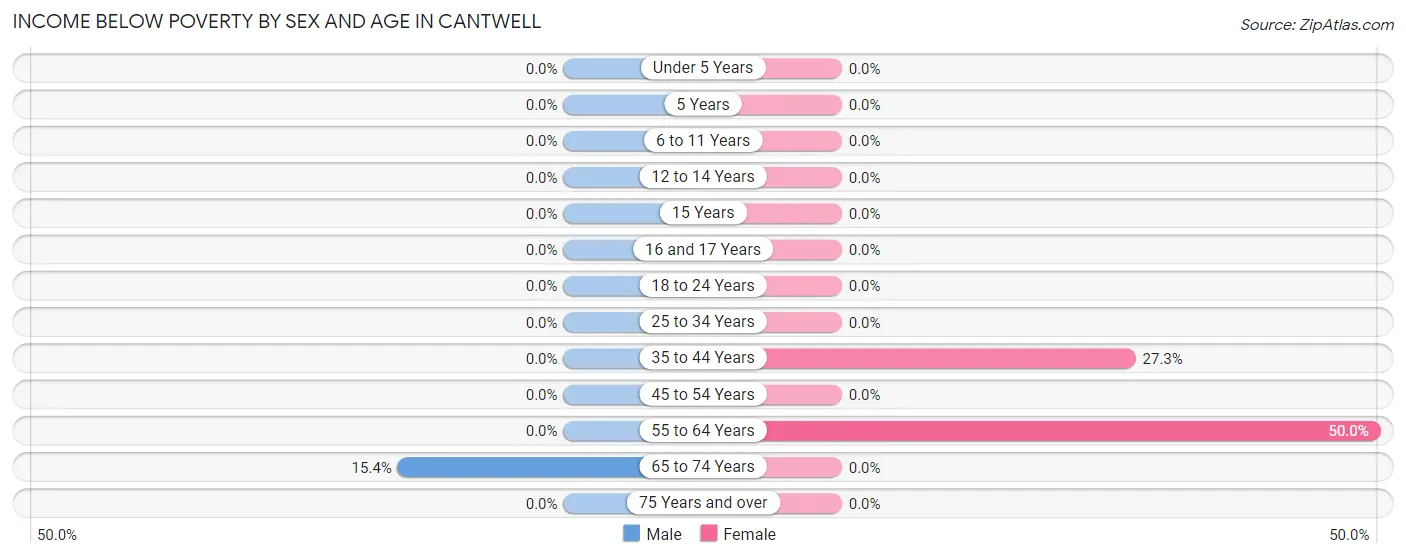
| Age Bracket | Male | Female |
| Under 5 Years | 0 (0.0%) | 0 (0.0%) |
| 5 Years | 0 (0.0%) | 0 (0.0%) |
| 6 to 11 Years | 0 (0.0%) | 0 (0.0%) |
| 12 to 14 Years | 0 (0.0%) | 0 (0.0%) |
| 15 Years | 0 (0.0%) | 0 (0.0%) |
| 16 and 17 Years | 0 (0.0%) | 0 (0.0%) |
| 18 to 24 Years | 0 (0.0%) | 0 (0.0%) |
| 25 to 34 Years | 0 (0.0%) | 0 (0.0%) |
| 35 to 44 Years | 0 (0.0%) | 3 (27.3%) |
| 45 to 54 Years | 0 (0.0%) | 0 (0.0%) |
| 55 to 64 Years | 0 (0.0%) | 2 (50.0%) |
| 65 to 74 Years | 2 (15.4%) | 0 (0.0%) |
| 75 Years and over | 0 (0.0%) | 0 (0.0%) |
| Total | 2 (2.7%) | 5 (11.9%) |
Income Above Poverty by Sex and Age in Cantwell
According to the poverty statistics in Cantwell, males aged 12 to 14 years and females aged 25 to 34 years are the age groups that are most secure financially, with 100.0% of males and 100.0% of females in these age groups living above the poverty line.
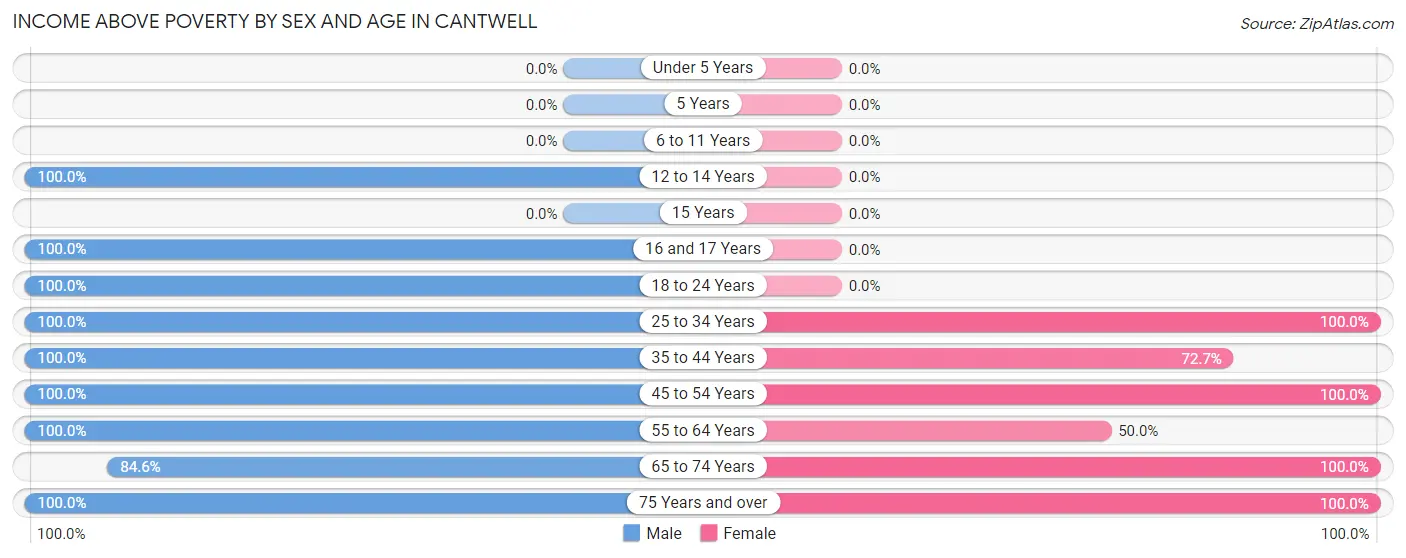
| Age Bracket | Male | Female |
| Under 5 Years | 0 (0.0%) | 0 (0.0%) |
| 5 Years | 0 (0.0%) | 0 (0.0%) |
| 6 to 11 Years | 0 (0.0%) | 0 (0.0%) |
| 12 to 14 Years | 3 (100.0%) | 0 (0.0%) |
| 15 Years | 0 (0.0%) | 0 (0.0%) |
| 16 and 17 Years | 1 (100.0%) | 0 (0.0%) |
| 18 to 24 Years | 3 (100.0%) | 0 (0.0%) |
| 25 to 34 Years | 4 (100.0%) | 4 (100.0%) |
| 35 to 44 Years | 2 (100.0%) | 8 (72.7%) |
| 45 to 54 Years | 10 (100.0%) | 3 (100.0%) |
| 55 to 64 Years | 11 (100.0%) | 2 (50.0%) |
| 65 to 74 Years | 11 (84.6%) | 6 (100.0%) |
| 75 Years and over | 28 (100.0%) | 14 (100.0%) |
| Total | 73 (97.3%) | 37 (88.1%) |
Income Below Poverty Among Married-Couple Families in Cantwell
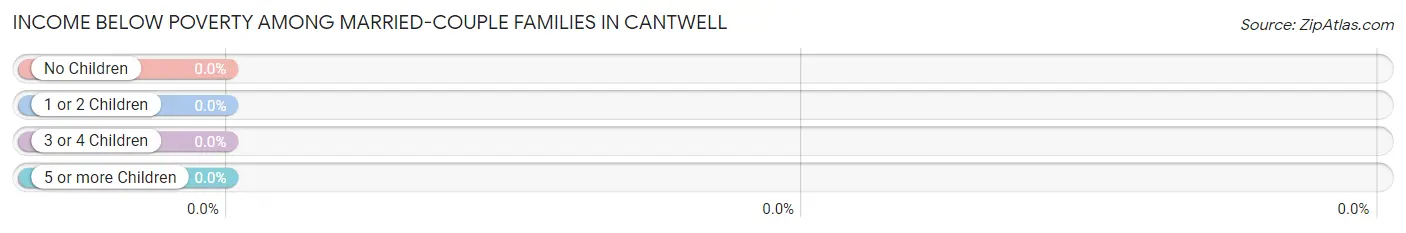
| Children | Above Poverty | Below Poverty |
| No Children | 11 (100.0%) | 0 (0.0%) |
| 1 or 2 Children | 3 (100.0%) | 0 (0.0%) |
| 3 or 4 Children | 0 (0.0%) | 0 (0.0%) |
| 5 or more Children | 0 (0.0%) | 0 (0.0%) |
| Total | 14 (100.0%) | 0 (0.0%) |
Income Below Poverty Among Single-Parent Households in Cantwell
| Children | Single Father | Single Mother |
| No Children | 0 (0.0%) | 0 (0.0%) |
| 1 or 2 Children | 0 (0.0%) | 0 (0.0%) |
| 3 or 4 Children | 0 (0.0%) | 0 (0.0%) |
| 5 or more Children | 0 (0.0%) | 0 (0.0%) |
| Total | 0 (0.0%) | 0 (0.0%) |
Income Below Poverty Among Married-Couple vs Single-Parent Households in Cantwell
| Children | Married-Couple Families | Single-Parent Households |
| No Children | 0 (0.0%) | 0 (0.0%) |
| 1 or 2 Children | 0 (0.0%) | 0 (0.0%) |
| 3 or 4 Children | 0 (0.0%) | 0 (0.0%) |
| 5 or more Children | 0 (0.0%) | 0 (0.0%) |
| Total | 0 (0.0%) | 0 (0.0%) |
Race in Cantwell
The most populous races in Cantwell are White / Caucasian (92 | 78.6%), Native / Alaskan (16 | 13.7%), and Two or more Races (9 | 7.7%).
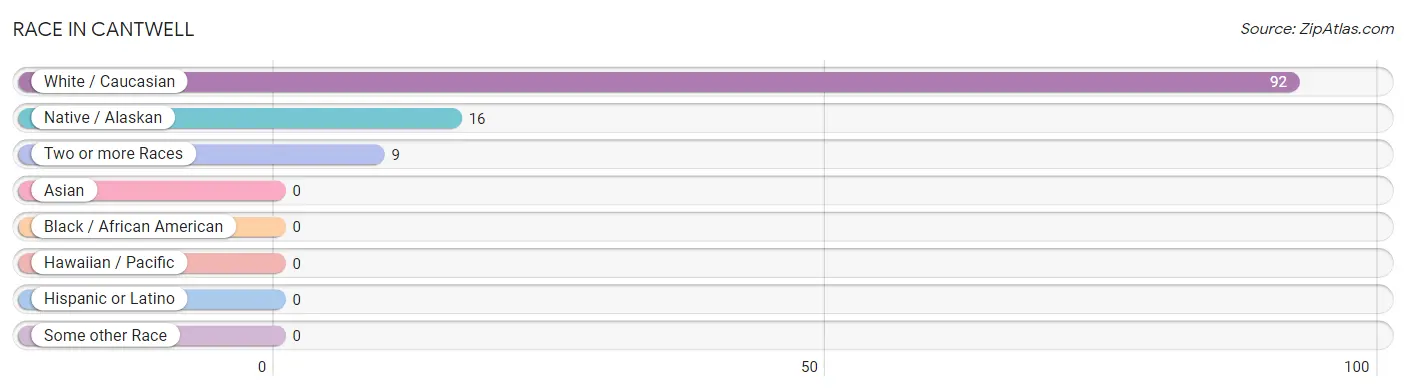
| Race | # Population | % Population |
| Asian | 0 | 0.0% |
| Black / African American | 0 | 0.0% |
| Hawaiian / Pacific | 0 | 0.0% |
| Hispanic or Latino | 0 | 0.0% |
| Native / Alaskan | 16 | 13.7% |
| White / Caucasian | 92 | 78.6% |
| Two or more Races | 9 | 7.7% |
| Some other Race | 0 | 0.0% |
| Total | 117 | 100.0% |
Ancestry in Cantwell
The most populous ancestries reported in Cantwell are German (40 | 34.2%), Lithuanian (19 | 16.2%), Alaskan Athabascan (14 | 12.0%), American (12 | 10.3%), and Irish (10 | 8.6%), together accounting for 81.2% of all Cantwell residents.
| Ancestry | # Population | % Population |
| Alaska Native | 6 | 5.1% |
| Alaskan Athabascan | 14 | 12.0% |
| American | 12 | 10.3% |
| Apache | 2 | 1.7% |
| Cree | 3 | 2.6% |
| Czech | 3 | 2.6% |
| Danish | 2 | 1.7% |
| English | 9 | 7.7% |
| French | 7 | 6.0% |
| French Canadian | 5 | 4.3% |
| German | 40 | 34.2% |
| Greek | 2 | 1.7% |
| Inupiat | 2 | 1.7% |
| Irish | 10 | 8.6% |
| Italian | 9 | 7.7% |
| Lithuanian | 19 | 16.2% |
| Northern European | 2 | 1.7% |
| Norwegian | 2 | 1.7% |
| Russian | 1 | 0.9% |
| Scandinavian | 2 | 1.7% |
| Scottish | 2 | 1.7% |
| Seminole | 2 | 1.7% | View All 22 Rows |
Immigrants in Cantwell

| Immigration Origin | # Population | % Population | View All 0 Rows |
Sex and Age in Cantwell
Sex and Age in Cantwell
The most populous age groups in Cantwell are 80 to 84 Years (19 | 25.3%) for men and 75 to 79 Years (9 | 21.4%) for women.
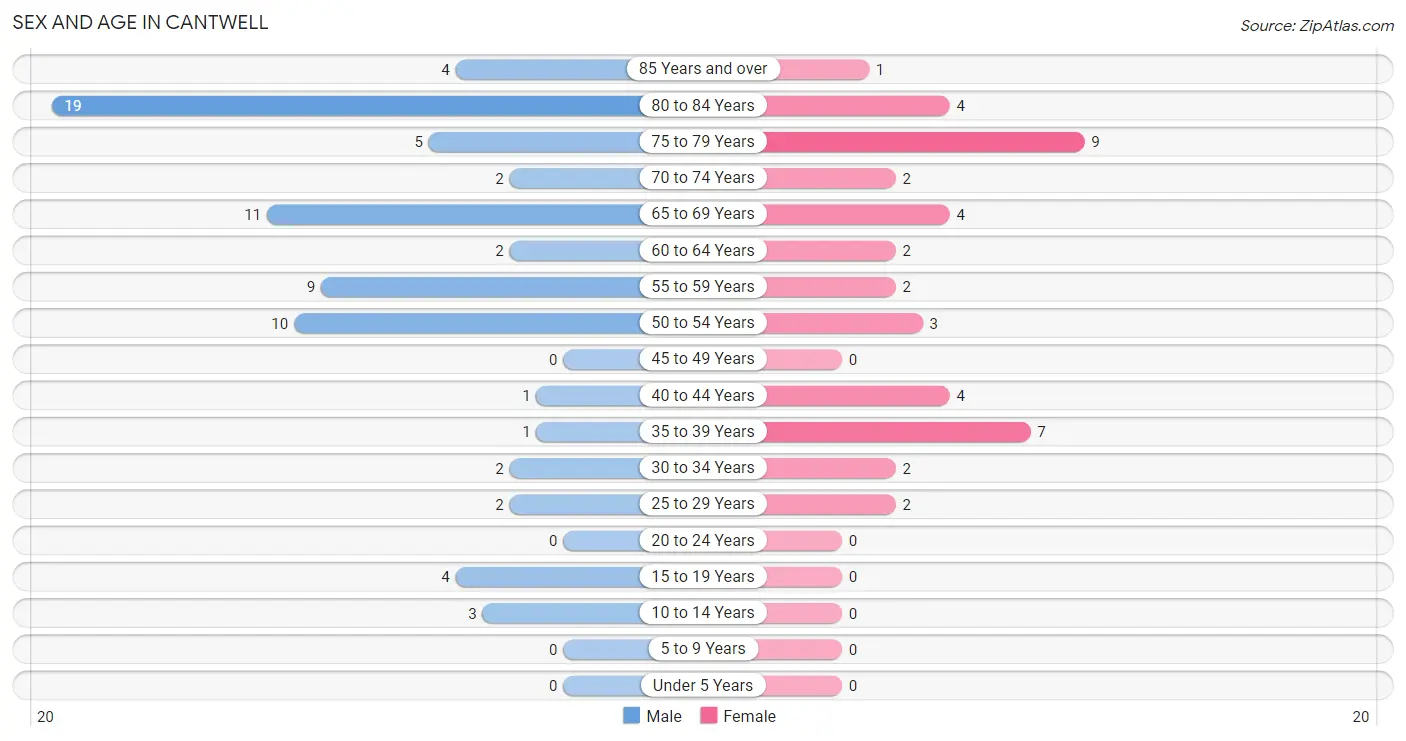
| Age Bracket | Male | Female |
| Under 5 Years | 0 (0.0%) | 0 (0.0%) |
| 5 to 9 Years | 0 (0.0%) | 0 (0.0%) |
| 10 to 14 Years | 3 (4.0%) | 0 (0.0%) |
| 15 to 19 Years | 4 (5.3%) | 0 (0.0%) |
| 20 to 24 Years | 0 (0.0%) | 0 (0.0%) |
| 25 to 29 Years | 2 (2.7%) | 2 (4.8%) |
| 30 to 34 Years | 2 (2.7%) | 2 (4.8%) |
| 35 to 39 Years | 1 (1.3%) | 7 (16.7%) |
| 40 to 44 Years | 1 (1.3%) | 4 (9.5%) |
| 45 to 49 Years | 0 (0.0%) | 0 (0.0%) |
| 50 to 54 Years | 10 (13.3%) | 3 (7.1%) |
| 55 to 59 Years | 9 (12.0%) | 2 (4.8%) |
| 60 to 64 Years | 2 (2.7%) | 2 (4.8%) |
| 65 to 69 Years | 11 (14.7%) | 4 (9.5%) |
| 70 to 74 Years | 2 (2.7%) | 2 (4.8%) |
| 75 to 79 Years | 5 (6.7%) | 9 (21.4%) |
| 80 to 84 Years | 19 (25.3%) | 4 (9.5%) |
| 85 Years and over | 4 (5.3%) | 1 (2.4%) |
| Total | 75 (100.0%) | 42 (100.0%) |
Families and Households in Cantwell
Median Family Size in Cantwell
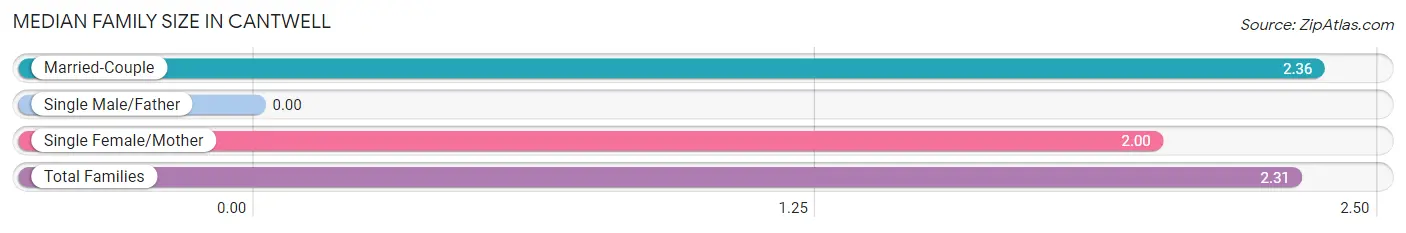
| Family Type | # Families | Family Size |
| Married-Couple | 14 (87.5%) | 2.36 |
| Single Male/Father | 0 (0.0%) | - |
| Single Female/Mother | 2 (12.5%) | 2.00 |
| Total Families | 16 (100.0%) | 2.31 |
Median Household Size in Cantwell
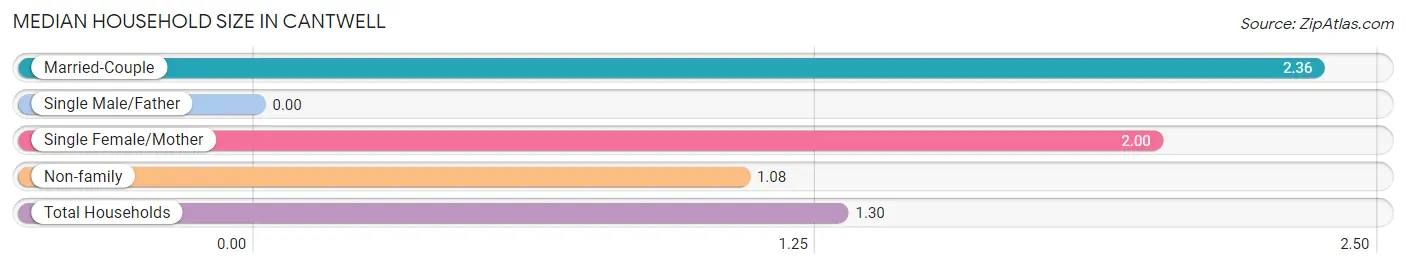
| Household Type | # Households | Household Size |
| Married-Couple | 14 (15.6%) | 2.36 |
| Single Male/Father | 0 (0.0%) | - |
| Single Female/Mother | 2 (2.2%) | 2.00 |
| Non-family | 74 (82.2%) | 1.08 |
| Total Households | 90 (100.0%) | 1.30 |
Household Size by Marriage Status in Cantwell
Out of a total of 90 households in Cantwell, 16 (17.8%) are family households, while 74 (82.2%) are nonfamily households. The most numerous type of family households are 2-person households, comprising 13, and the most common type of nonfamily households are 1-person households, comprising 67.
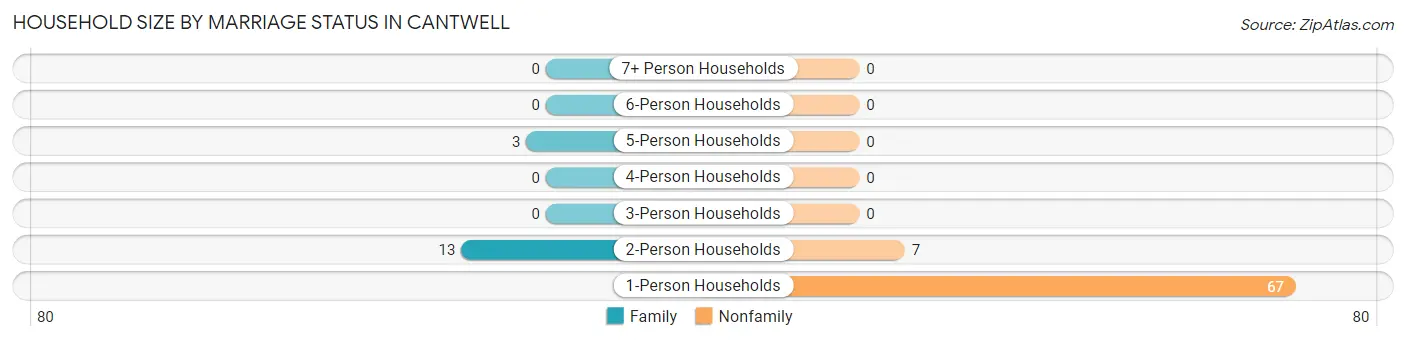
| Household Size | Family Households | Nonfamily Households |
| 1-Person Households | - | 67 (74.4%) |
| 2-Person Households | 13 (14.4%) | 7 (7.8%) |
| 3-Person Households | 0 (0.0%) | 0 (0.0%) |
| 4-Person Households | 0 (0.0%) | 0 (0.0%) |
| 5-Person Households | 3 (3.3%) | 0 (0.0%) |
| 6-Person Households | 0 (0.0%) | 0 (0.0%) |
| 7+ Person Households | 0 (0.0%) | 0 (0.0%) |
| Total | 16 (17.8%) | 74 (82.2%) |
Female Fertility in Cantwell
Fertility by Age in Cantwell
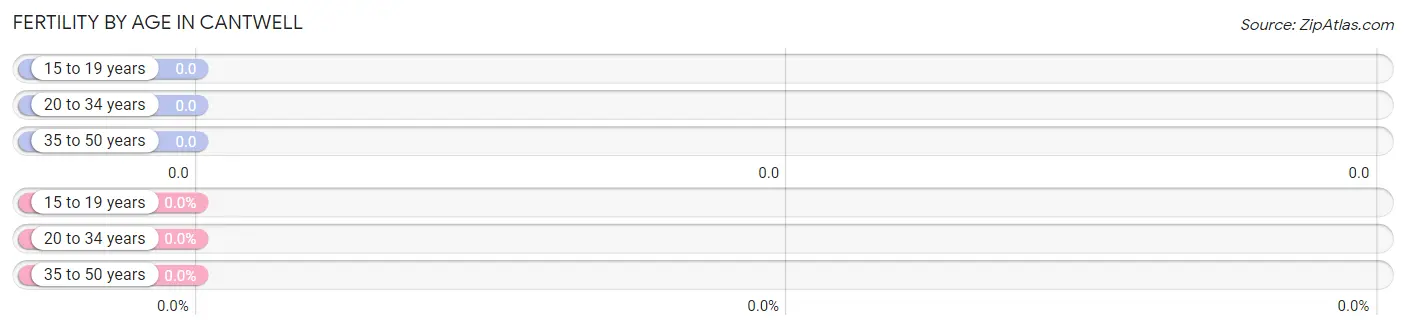
| Age Bracket | Women with Births | Births / 1,000 Women |
| 15 to 19 years | 0 (0.0%) | 0.0 |
| 20 to 34 years | 0 (0.0%) | 0.0 |
| 35 to 50 years | 0 (0.0%) | 0.0 |
| Total | 0 (0.0%) | 0.0 |
Fertility by Age by Marriage Status in Cantwell
| Age Bracket | Married | Unmarried |
| 15 to 19 years | 0 (0.0%) | 0 (0.0%) |
| 20 to 34 years | 0 (0.0%) | 0 (0.0%) |
| 35 to 50 years | 0 (0.0%) | 0 (0.0%) |
| Total | 0 (0.0%) | 0 (0.0%) |
Fertility by Education in Cantwell
| Educational Attainment | Women with Births | Births / 1,000 Women |
| Less than High School | 0 (0.0%) | 0.0 |
| High School Diploma | 0 (0.0%) | 0.0 |
| College or Associate's Degree | 0 (0.0%) | 0.0 |
| Bachelor's Degree | 0 (0.0%) | 0.0 |
| Graduate Degree | 0 (0.0%) | 0.0 |
| Total | 0 (0.0%) | 0.0 |
Fertility by Education by Marriage Status in Cantwell
| Educational Attainment | Married | Unmarried |
| Less than High School | 0 (0.0%) | 0 (0.0%) |
| High School Diploma | 0 (0.0%) | 0 (0.0%) |
| College or Associate's Degree | 0 (0.0%) | 0 (0.0%) |
| Bachelor's Degree | 0 (0.0%) | 0 (0.0%) |
| Graduate Degree | 0 (0.0%) | 0 (0.0%) |
| Total | 0 (0.0%) | 0 (0.0%) |
Employment Characteristics in Cantwell
Employment by Class of Employer in Cantwell
Among the 32 employed individuals in Cantwell, private company employees (14 | 43.8%), not-for-profit organizations (4 | 12.5%), and federal government employees (4 | 12.5%) make up the most common classes of employment.
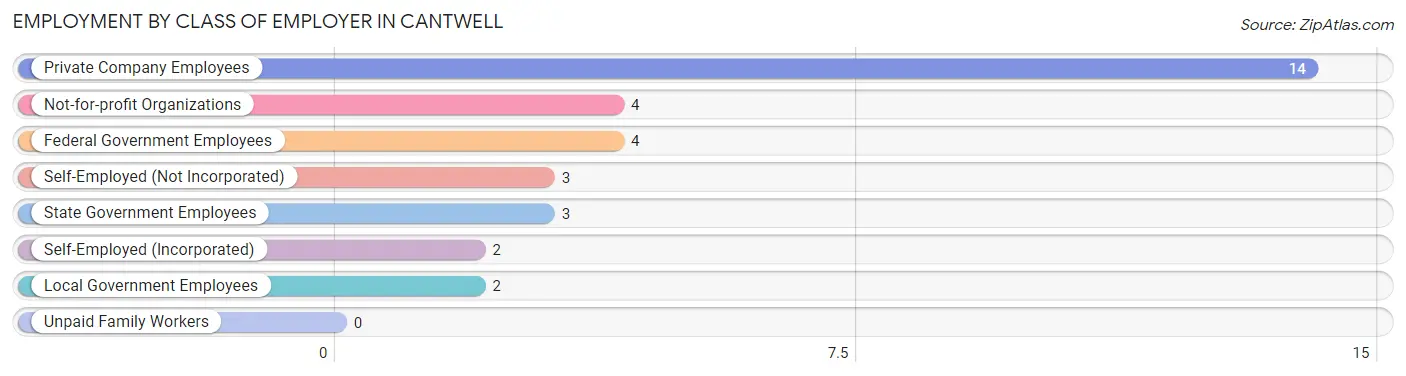
| Employer Class | # Employees | % Employees |
| Private Company Employees | 14 | 43.8% |
| Self-Employed (Incorporated) | 2 | 6.2% |
| Self-Employed (Not Incorporated) | 3 | 9.4% |
| Not-for-profit Organizations | 4 | 12.5% |
| Local Government Employees | 2 | 6.2% |
| State Government Employees | 3 | 9.4% |
| Federal Government Employees | 4 | 12.5% |
| Unpaid Family Workers | 0 | 0.0% |
| Total | 32 | 100.0% |
Employment Status by Age in Cantwell
According to the labor force statistics for Cantwell, out of the total population over 16 years of age (114), 34.2% or 39 individuals are in the labor force, with 17.9% or 7 of them unemployed. The age group with the highest labor force participation rate is 25 to 29 years, with 100.0% or 4 individuals in the labor force. Within the labor force, the 30 to 34 years age range has the highest percentage of unemployed individuals, with 50.0% or 2 of them being unemployed.
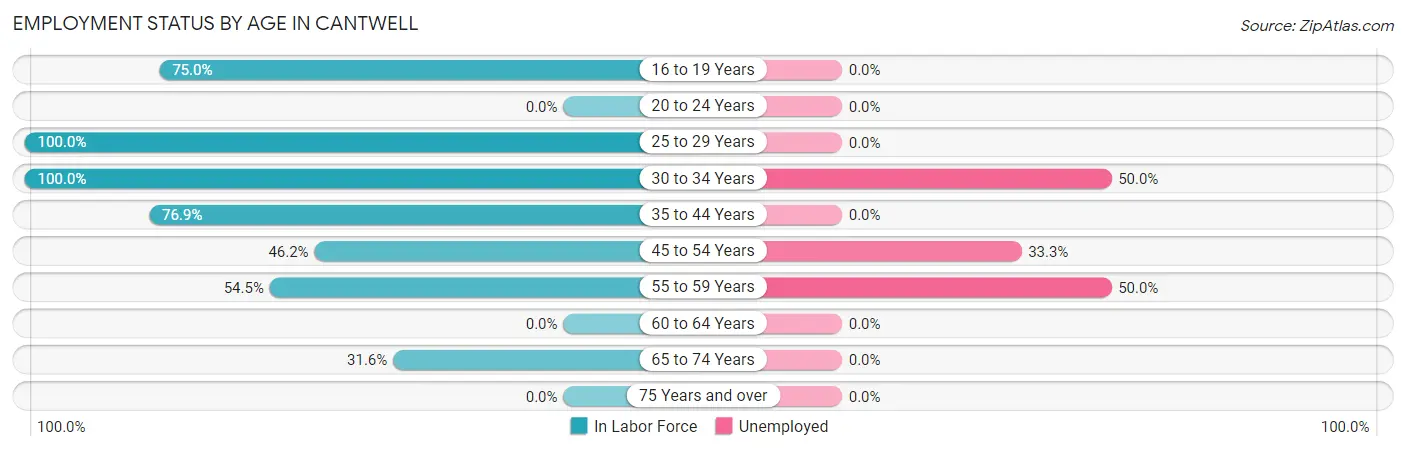
| Age Bracket | In Labor Force | Unemployed |
| 16 to 19 Years | 3 (75.0%) | 0 (0.0%) |
| 20 to 24 Years | 0 (0.0%) | 0 (0.0%) |
| 25 to 29 Years | 4 (100.0%) | 0 (0.0%) |
| 30 to 34 Years | 4 (100.0%) | 2 (50.0%) |
| 35 to 44 Years | 10 (76.9%) | 0 (0.0%) |
| 45 to 54 Years | 6 (46.2%) | 2 (33.3%) |
| 55 to 59 Years | 6 (54.5%) | 3 (50.0%) |
| 60 to 64 Years | 0 (0.0%) | 0 (0.0%) |
| 65 to 74 Years | 6 (31.6%) | 0 (0.0%) |
| 75 Years and over | 0 (0.0%) | 0 (0.0%) |
| Total | 39 (34.2%) | 7 (17.9%) |
Employment Status by Educational Attainment in Cantwell
According to labor force statistics for Cantwell, 61.2% of individuals (30) out of the total population between 25 and 64 years of age (49) are in the labor force, with 23.3% or 7 of them being unemployed. The group with the highest labor force participation rate are those with the educational attainment of less than high school, with 100.0% or 3 individuals in the labor force. Within the labor force, individuals with less than high school education have the highest percentage of unemployment, with 66.7% or 2 of them being unemployed.
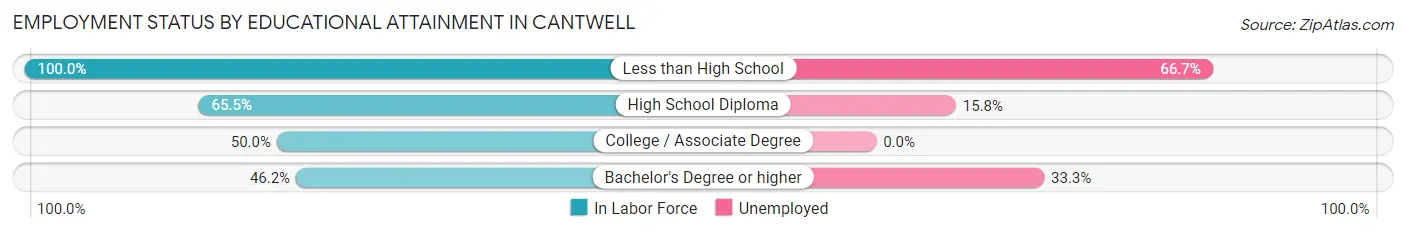
| Educational Attainment | In Labor Force | Unemployed |
| Less than High School | 3 (100.0%) | 2 (66.7%) |
| High School Diploma | 19 (65.5%) | 5 (15.8%) |
| College / Associate Degree | 2 (50.0%) | 0 (0.0%) |
| Bachelor's Degree or higher | 6 (46.2%) | 4 (33.3%) |
| Total | 30 (61.2%) | 11 (23.3%) |
Employment Occupations by Sex in Cantwell
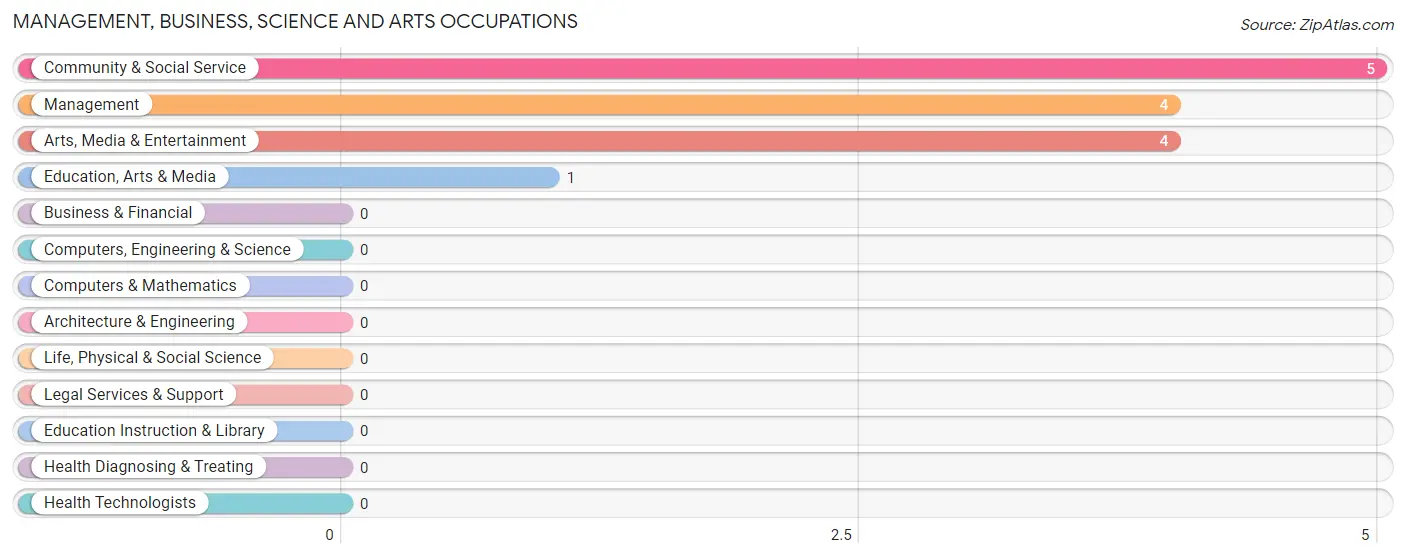
Management, Business, Science and Arts Occupations
The most common Management, Business, Science and Arts occupations in Cantwell are Community & Social Service (5 | 15.6%), Management (4 | 12.5%), Arts, Media & Entertainment (4 | 12.5%), and Education, Arts & Media (1 | 3.1%).
Management, Business, Science and Arts Occupations by Sex
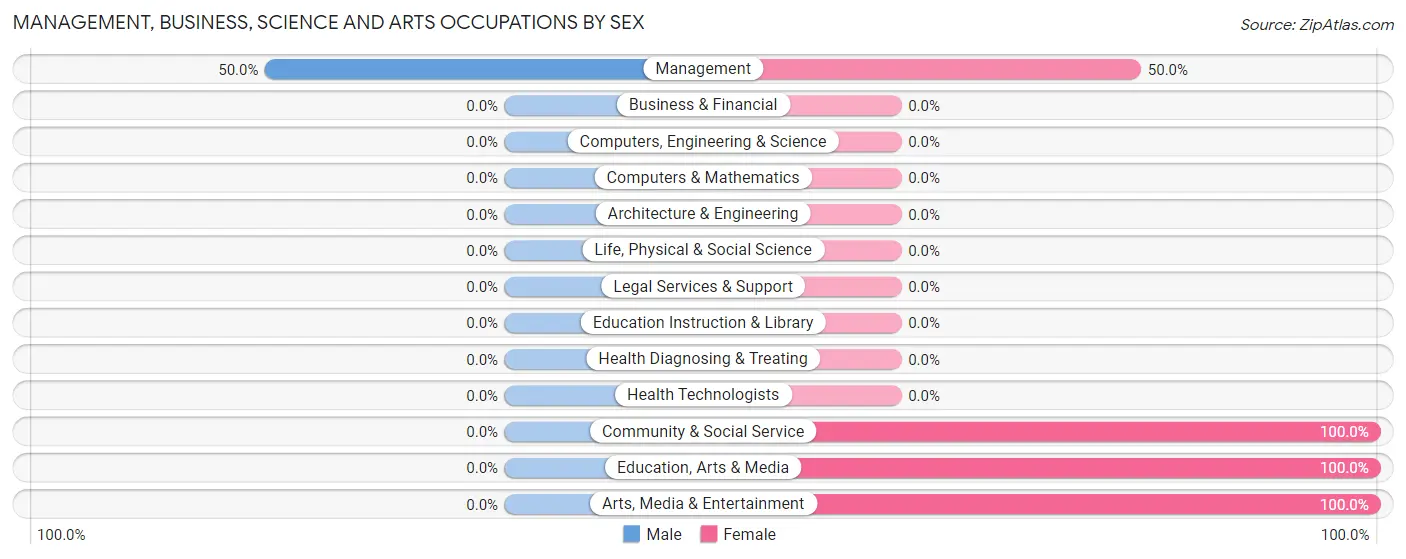
| Occupation | Male | Female |
| Management | 2 (50.0%) | 2 (50.0%) |
| Business & Financial | 0 (0.0%) | 0 (0.0%) |
| Computers, Engineering & Science | 0 (0.0%) | 0 (0.0%) |
| Computers & Mathematics | 0 (0.0%) | 0 (0.0%) |
| Architecture & Engineering | 0 (0.0%) | 0 (0.0%) |
| Life, Physical & Social Science | 0 (0.0%) | 0 (0.0%) |
| Community & Social Service | 0 (0.0%) | 5 (100.0%) |
| Education, Arts & Media | 0 (0.0%) | 1 (100.0%) |
| Legal Services & Support | 0 (0.0%) | 0 (0.0%) |
| Education Instruction & Library | 0 (0.0%) | 0 (0.0%) |
| Arts, Media & Entertainment | 0 (0.0%) | 4 (100.0%) |
| Health Diagnosing & Treating | 0 (0.0%) | 0 (0.0%) |
| Health Technologists | 0 (0.0%) | 0 (0.0%) |
| Total (Category) | 2 (22.2%) | 7 (77.8%) |
| Total (Overall) | 13 (40.6%) | 19 (59.4%) |
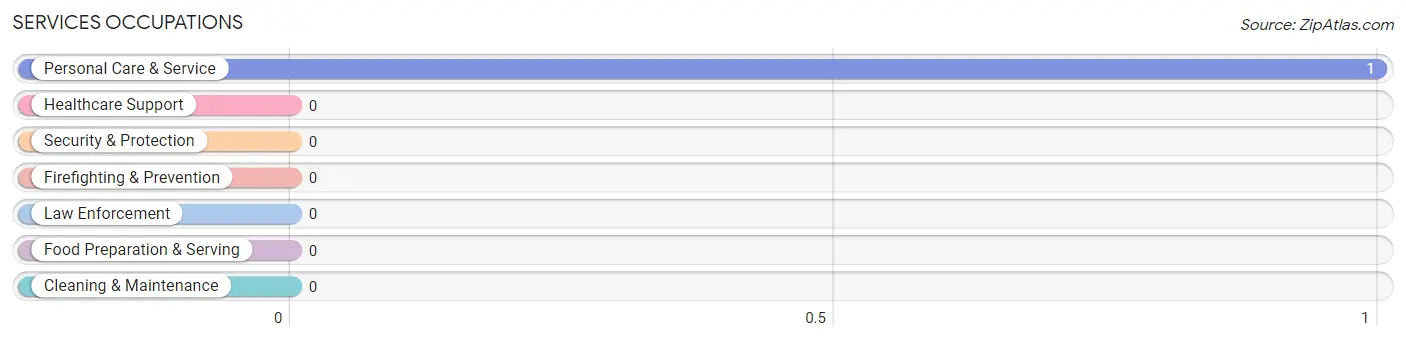
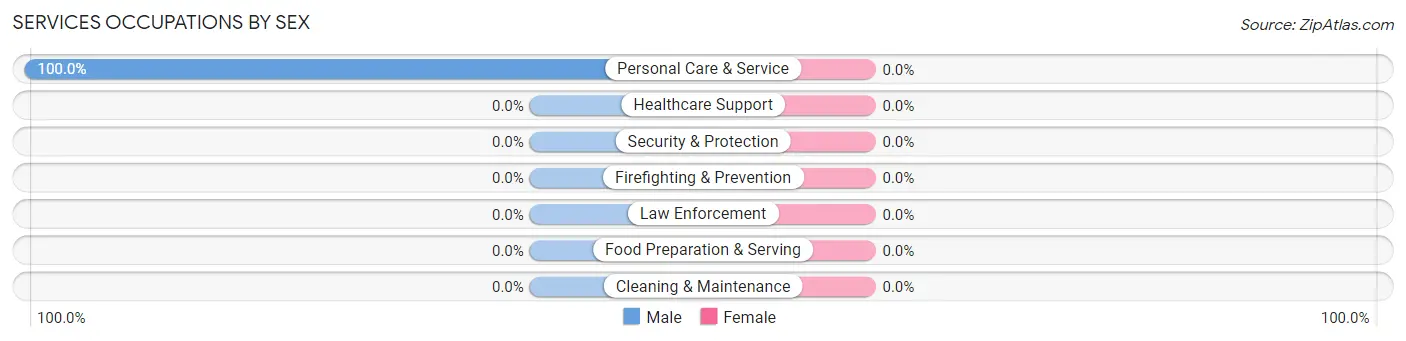
Services Occupations
The most common Services occupations in Cantwell are , and Personal Care & Service (1 | 3.1%).
Services Occupations by Sex
| Occupation | Male | Female |
| Healthcare Support | 0 (0.0%) | 0 (0.0%) |
| Security & Protection | 0 (0.0%) | 0 (0.0%) |
| Firefighting & Prevention | 0 (0.0%) | 0 (0.0%) |
| Law Enforcement | 0 (0.0%) | 0 (0.0%) |
| Food Preparation & Serving | 0 (0.0%) | 0 (0.0%) |
| Cleaning & Maintenance | 0 (0.0%) | 0 (0.0%) |
| Personal Care & Service | 1 (100.0%) | 0 (0.0%) |
| Total (Category) | 1 (100.0%) | 0 (0.0%) |
| Total (Overall) | 13 (40.6%) | 19 (59.4%) |
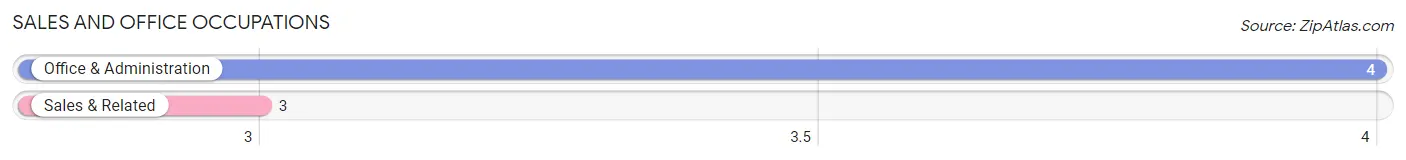
Sales and Office Occupations
The most common Sales and Office occupations in Cantwell are Office & Administration (4 | 12.5%), and Sales & Related (3 | 9.4%).
Sales and Office Occupations by Sex
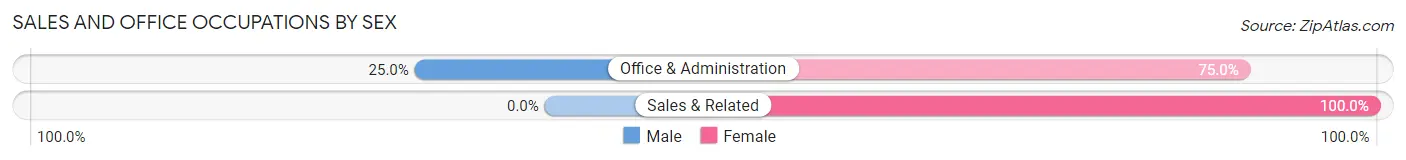
| Occupation | Male | Female |
| Sales & Related | 0 (0.0%) | 3 (100.0%) |
| Office & Administration | 1 (25.0%) | 3 (75.0%) |
| Total (Category) | 1 (14.3%) | 6 (85.7%) |
| Total (Overall) | 13 (40.6%) | 19 (59.4%) |
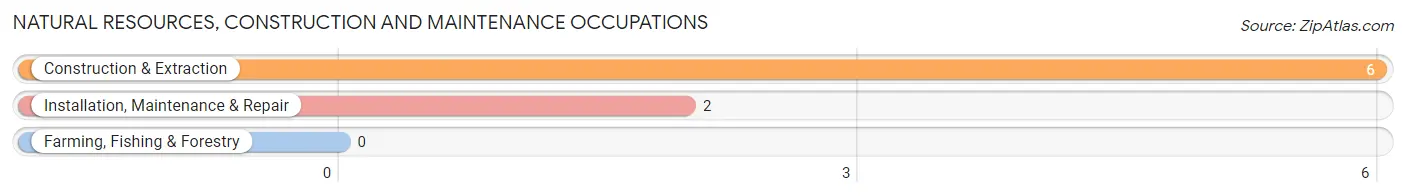
Natural Resources, Construction and Maintenance Occupations
The most common Natural Resources, Construction and Maintenance occupations in Cantwell are Construction & Extraction (6 | 18.8%), and Installation, Maintenance & Repair (2 | 6.2%).
Natural Resources, Construction and Maintenance Occupations by Sex
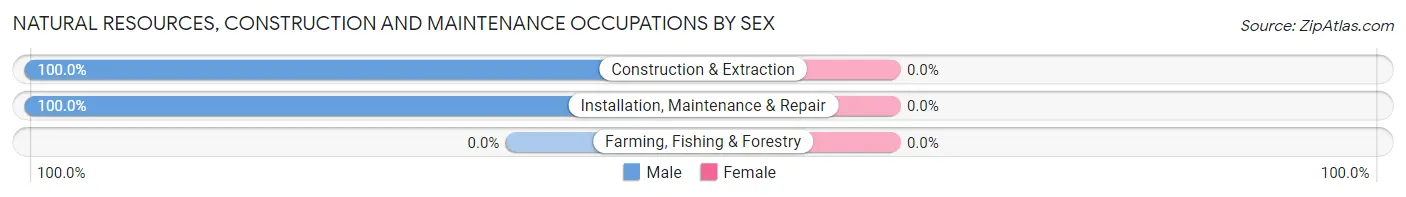
| Occupation | Male | Female |
| Farming, Fishing & Forestry | 0 (0.0%) | 0 (0.0%) |
| Construction & Extraction | 6 (100.0%) | 0 (0.0%) |
| Installation, Maintenance & Repair | 2 (100.0%) | 0 (0.0%) |
| Total (Category) | 8 (100.0%) | 0 (0.0%) |
| Total (Overall) | 13 (40.6%) | 19 (59.4%) |
Production, Transportation and Moving Occupations
The most common Production, Transportation and Moving occupations in Cantwell are Transportation (4 | 12.5%), Material Moving (2 | 6.2%), and Production (1 | 3.1%).
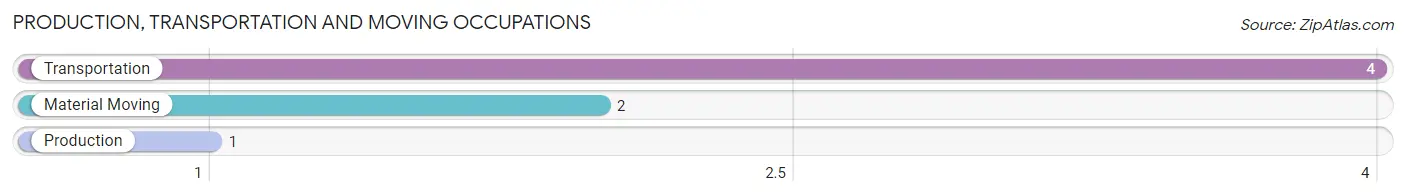
Production, Transportation and Moving Occupations by Sex
| Occupation | Male | Female |
| Production | 1 (100.0%) | 0 (0.0%) |
| Transportation | 0 (0.0%) | 4 (100.0%) |
| Material Moving | 0 (0.0%) | 2 (100.0%) |
| Total (Category) | 1 (14.3%) | 6 (85.7%) |
| Total (Overall) | 13 (40.6%) | 19 (59.4%) |
Employment Industries by Sex in Cantwell
Employment Industries in Cantwell
The major employment industries in Cantwell include Retail Trade (7 | 21.9%), Construction (6 | 18.8%), Arts, Entertainment & Recreation (6 | 18.8%), Public Administration (5 | 15.6%), and Administrative & Support (3 | 9.4%).
Employment Industries by Sex in Cantwell
The Cantwell industries that see more men than women are Construction (100.0%), Manufacturing (100.0%), and Arts, Entertainment & Recreation (50.0%), whereas the industries that tend to have a higher number of women are Administrative & Support (100.0%), Health Care & Social Assistance (100.0%), and Accommodation & Food Services (100.0%).
| Industry | Male | Female |
| Agriculture, Fishing & Hunting | 0 (0.0%) | 0 (0.0%) |
| Mining, Quarrying, & Extraction | 0 (0.0%) | 0 (0.0%) |
| Construction | 6 (100.0%) | 0 (0.0%) |
| Manufacturing | 1 (100.0%) | 0 (0.0%) |
| Wholesale Trade | 0 (0.0%) | 0 (0.0%) |
| Retail Trade | 1 (14.3%) | 6 (85.7%) |
| Transportation & Warehousing | 0 (0.0%) | 0 (0.0%) |
| Utilities | 0 (0.0%) | 0 (0.0%) |
| Information | 0 (0.0%) | 0 (0.0%) |
| Finance & Insurance | 0 (0.0%) | 0 (0.0%) |
| Real Estate, Rental & Leasing | 0 (0.0%) | 0 (0.0%) |
| Professional & Scientific | 0 (0.0%) | 0 (0.0%) |
| Enterprise Management | 0 (0.0%) | 0 (0.0%) |
| Administrative & Support | 0 (0.0%) | 3 (100.0%) |
| Educational Services | 0 (0.0%) | 0 (0.0%) |
| Health Care & Social Assistance | 0 (0.0%) | 2 (100.0%) |
| Arts, Entertainment & Recreation | 3 (50.0%) | 3 (50.0%) |
| Accommodation & Food Services | 0 (0.0%) | 2 (100.0%) |
| Public Administration | 2 (40.0%) | 3 (60.0%) |
| Total | 13 (40.6%) | 19 (59.4%) |
Education in Cantwell
School Enrollment in Cantwell
The most common levels of schooling among the 4 students in Cantwell are middle school (3 | 75.0%), and high school (1 | 25.0%).
| School Level | # Students | % Students |
| Nursery / Preschool | 0 | 0.0% |
| Kindergarten | 0 | 0.0% |
| Elementary School | 0 | 0.0% |
| Middle School | 3 | 75.0% |
| High School | 1 | 25.0% |
| College / Undergraduate | 0 | 0.0% |
| Graduate / Professional | 0 | 0.0% |
| Total | 4 | 100.0% |
School Enrollment by Age by Funding Source in Cantwell
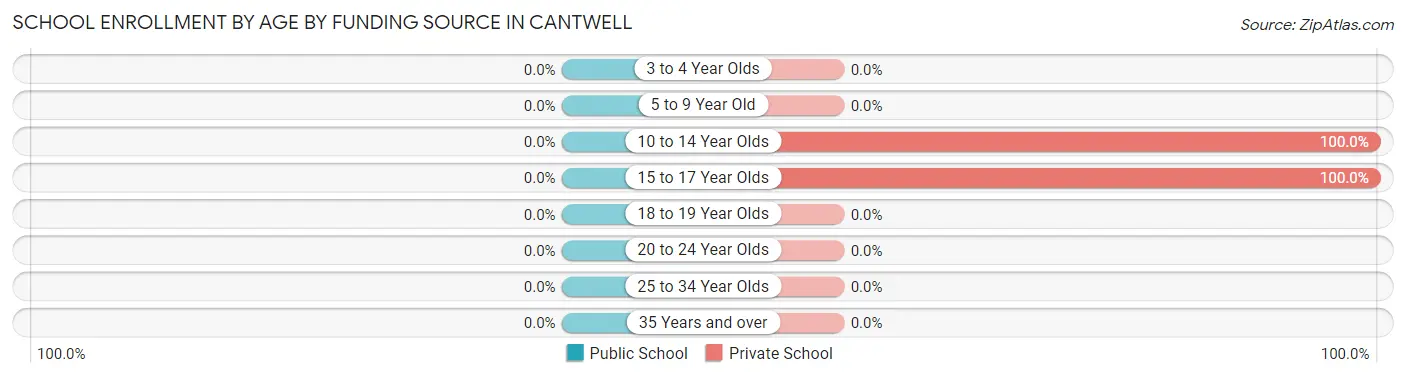
| Age Bracket | Public School | Private School |
| 3 to 4 Year Olds | 0 (0.0%) | 0 (0.0%) |
| 5 to 9 Year Old | 0 (0.0%) | 0 (0.0%) |
| 10 to 14 Year Olds | 0 (0.0%) | 3 (100.0%) |
| 15 to 17 Year Olds | 0 (0.0%) | 1 (100.0%) |
| 18 to 19 Year Olds | 0 (0.0%) | 0 (0.0%) |
| 20 to 24 Year Olds | 0 (0.0%) | 0 (0.0%) |
| 25 to 34 Year Olds | 0 (0.0%) | 0 (0.0%) |
| 35 Years and over | 0 (0.0%) | 0 (0.0%) |
| Total | 0 (0.0%) | 4 (100.0%) |
Educational Attainment by Field of Study in Cantwell
Bio, nature & agricultural (7 | 28.0%), business (4 | 16.0%), psychology (3 | 12.0%), science & technology (3 | 12.0%), and social sciences (2 | 8.0%) are the most common fields of study among 25 individuals in Cantwell who have obtained a bachelor's degree or higher.
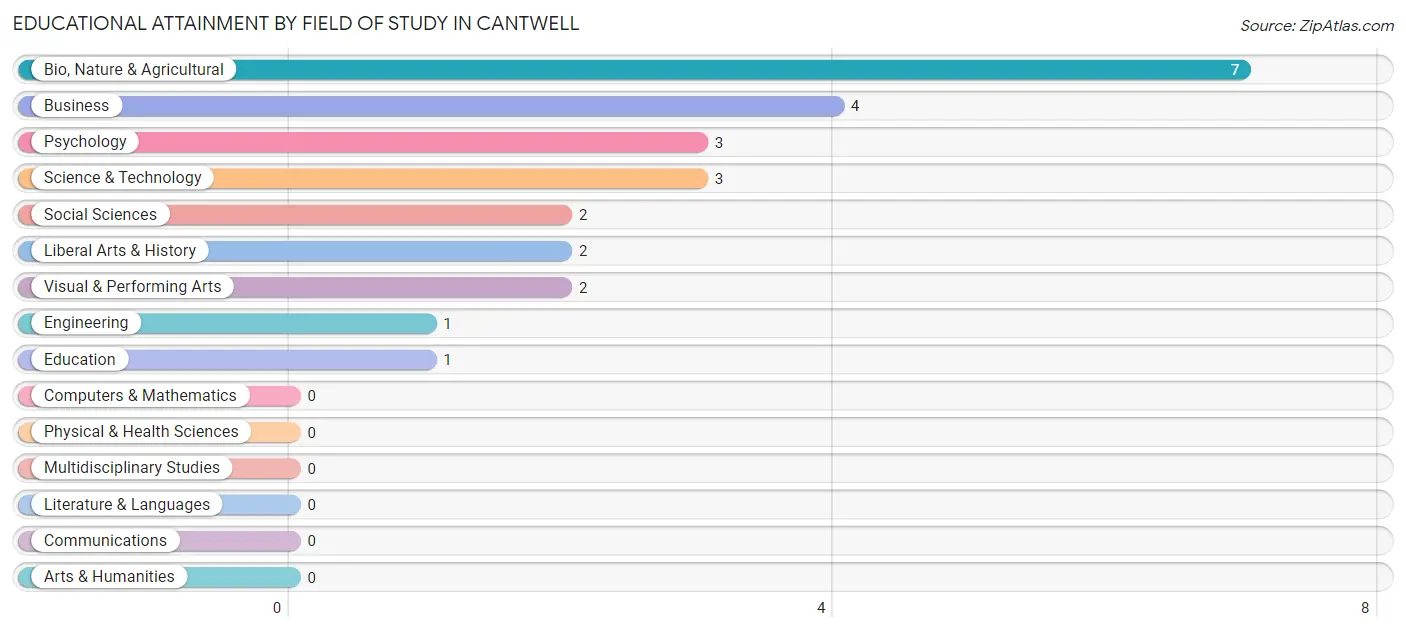
| Field of Study | # Graduates | % Graduates |
| Computers & Mathematics | 0 | 0.0% |
| Bio, Nature & Agricultural | 7 | 28.0% |
| Physical & Health Sciences | 0 | 0.0% |
| Psychology | 3 | 12.0% |
| Social Sciences | 2 | 8.0% |
| Engineering | 1 | 4.0% |
| Multidisciplinary Studies | 0 | 0.0% |
| Science & Technology | 3 | 12.0% |
| Business | 4 | 16.0% |
| Education | 1 | 4.0% |
| Literature & Languages | 0 | 0.0% |
| Liberal Arts & History | 2 | 8.0% |
| Visual & Performing Arts | 2 | 8.0% |
| Communications | 0 | 0.0% |
| Arts & Humanities | 0 | 0.0% |
| Total | 25 | 100.0% |
Transportation & Commute in Cantwell
Vehicle Availability by Sex in Cantwell
The most prevalent vehicle ownership categories in Cantwell are males with 5 or more vehicles (9, accounting for 69.2%) and females with 5 or more vehicles (2, making up 47.4%).
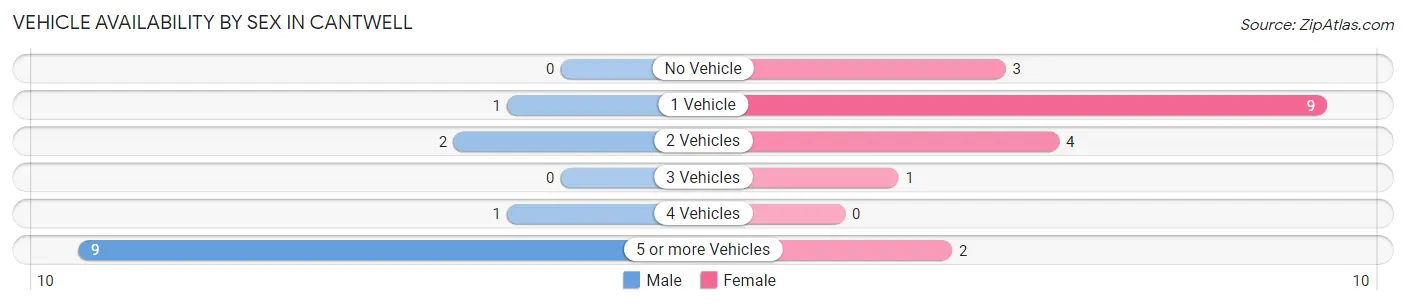
| Vehicles Available | Male | Female |
| No Vehicle | 0 (0.0%) | 3 (15.8%) |
| 1 Vehicle | 1 (7.7%) | 9 (47.4%) |
| 2 Vehicles | 2 (15.4%) | 4 (21.0%) |
| 3 Vehicles | 0 (0.0%) | 1 (5.3%) |
| 4 Vehicles | 1 (7.7%) | 0 (0.0%) |
| 5 or more Vehicles | 9 (69.2%) | 2 (10.5%) |
| Total | 13 (100.0%) | 19 (100.0%) |
Commute Time in Cantwell
The most frequently occuring commute durations in Cantwell are less than 5 minutes (7 commuters, 24.1%), 10 to 14 minutes (5 commuters, 17.2%), and 20 to 24 minutes (5 commuters, 17.2%).
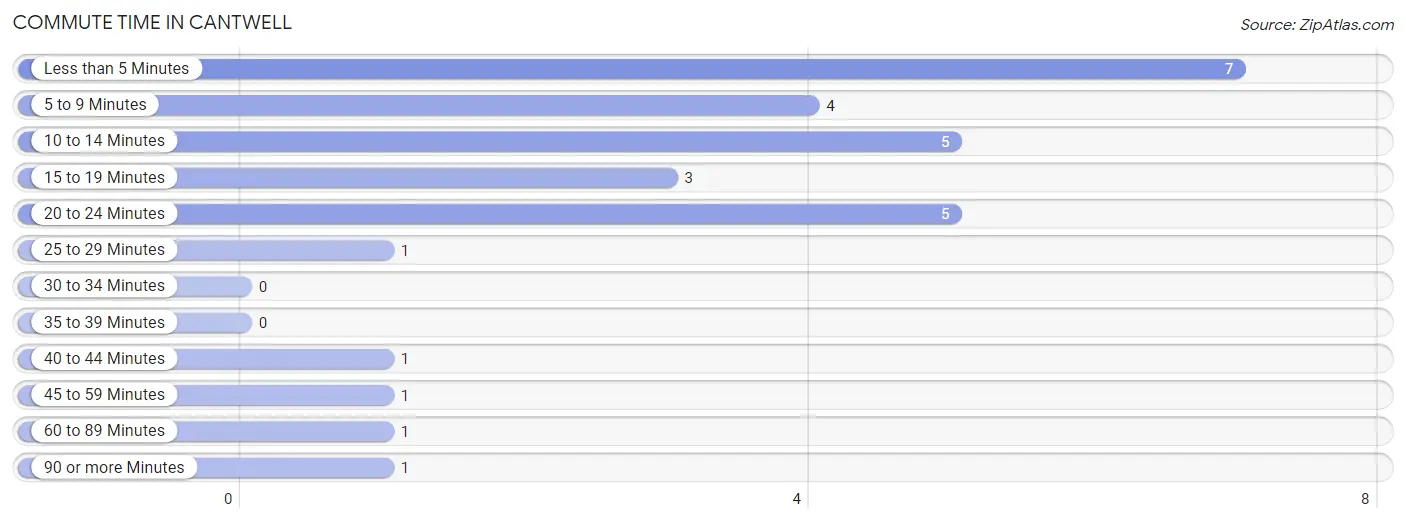
| Commute Time | # Commuters | % Commuters |
| Less than 5 Minutes | 7 | 24.1% |
| 5 to 9 Minutes | 4 | 13.8% |
| 10 to 14 Minutes | 5 | 17.2% |
| 15 to 19 Minutes | 3 | 10.3% |
| 20 to 24 Minutes | 5 | 17.2% |
| 25 to 29 Minutes | 1 | 3.5% |
| 30 to 34 Minutes | 0 | 0.0% |
| 35 to 39 Minutes | 0 | 0.0% |
| 40 to 44 Minutes | 1 | 3.5% |
| 45 to 59 Minutes | 1 | 3.5% |
| 60 to 89 Minutes | 1 | 3.5% |
| 90 or more Minutes | 1 | 3.5% |
Commute Time by Sex in Cantwell
The most common commute times in Cantwell are 20 to 24 minutes (5 commuters, 38.5%) for males and 5 to 9 minutes (4 commuters, 25.0%) for females.
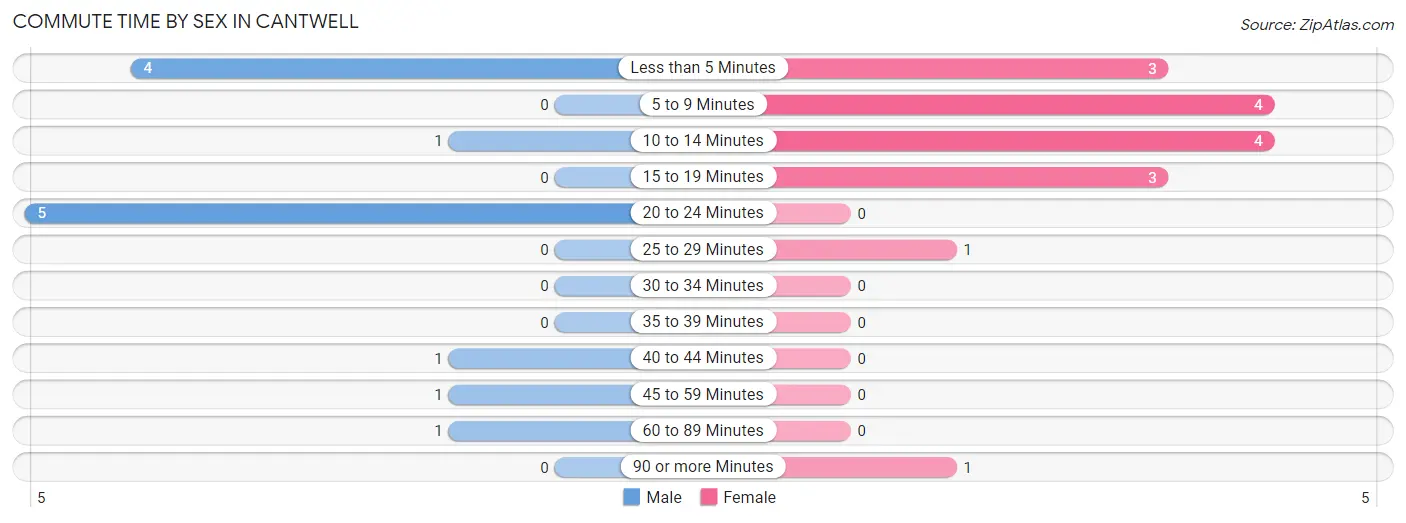
| Commute Time | Male | Female |
| Less than 5 Minutes | 4 (30.8%) | 3 (18.8%) |
| 5 to 9 Minutes | 0 (0.0%) | 4 (25.0%) |
| 10 to 14 Minutes | 1 (7.7%) | 4 (25.0%) |
| 15 to 19 Minutes | 0 (0.0%) | 3 (18.8%) |
| 20 to 24 Minutes | 5 (38.5%) | 0 (0.0%) |
| 25 to 29 Minutes | 0 (0.0%) | 1 (6.2%) |
| 30 to 34 Minutes | 0 (0.0%) | 0 (0.0%) |
| 35 to 39 Minutes | 0 (0.0%) | 0 (0.0%) |
| 40 to 44 Minutes | 1 (7.7%) | 0 (0.0%) |
| 45 to 59 Minutes | 1 (7.7%) | 0 (0.0%) |
| 60 to 89 Minutes | 1 (7.7%) | 0 (0.0%) |
| 90 or more Minutes | 0 (0.0%) | 1 (6.2%) |
Time of Departure to Work by Sex in Cantwell
The most frequent times of departure to work in Cantwell are 6:00 AM to 6:29 AM (6, 46.2%) for males and 5:00 AM to 5:29 AM (4, 25.0%) for females.
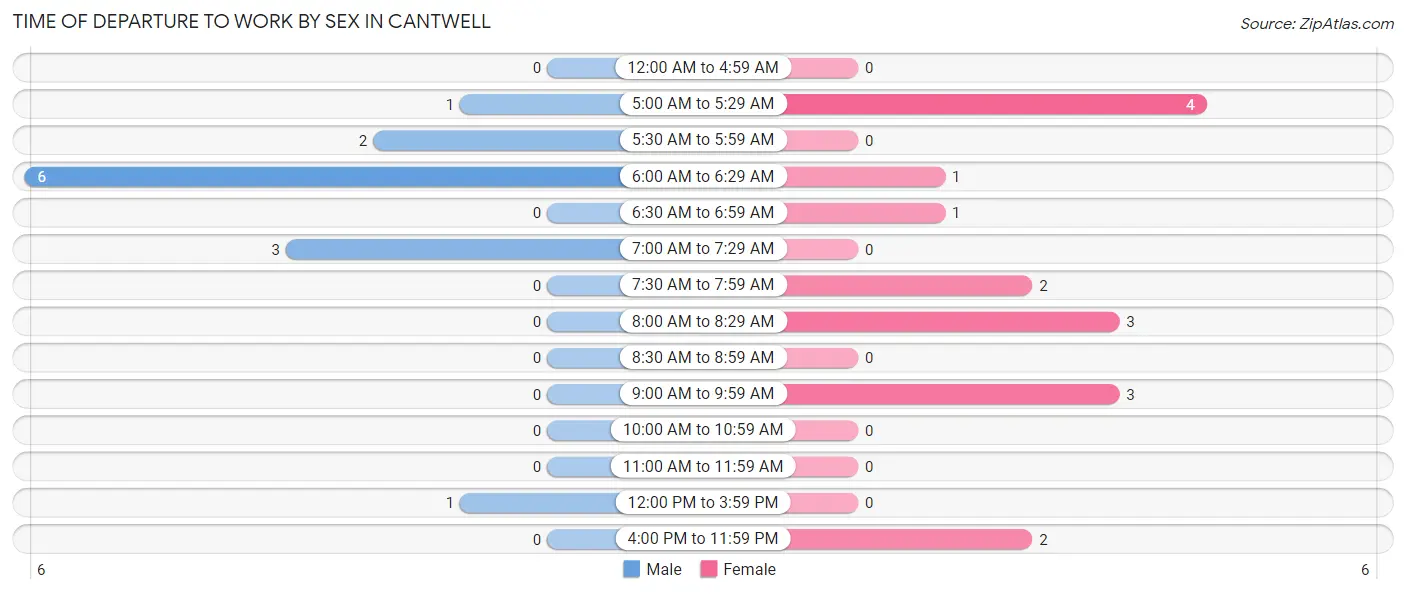
| Time of Departure | Male | Female |
| 12:00 AM to 4:59 AM | 0 (0.0%) | 0 (0.0%) |
| 5:00 AM to 5:29 AM | 1 (7.7%) | 4 (25.0%) |
| 5:30 AM to 5:59 AM | 2 (15.4%) | 0 (0.0%) |
| 6:00 AM to 6:29 AM | 6 (46.2%) | 1 (6.2%) |
| 6:30 AM to 6:59 AM | 0 (0.0%) | 1 (6.2%) |
| 7:00 AM to 7:29 AM | 3 (23.1%) | 0 (0.0%) |
| 7:30 AM to 7:59 AM | 0 (0.0%) | 2 (12.5%) |
| 8:00 AM to 8:29 AM | 0 (0.0%) | 3 (18.8%) |
| 8:30 AM to 8:59 AM | 0 (0.0%) | 0 (0.0%) |
| 9:00 AM to 9:59 AM | 0 (0.0%) | 3 (18.8%) |
| 10:00 AM to 10:59 AM | 0 (0.0%) | 0 (0.0%) |
| 11:00 AM to 11:59 AM | 0 (0.0%) | 0 (0.0%) |
| 12:00 PM to 3:59 PM | 1 (7.7%) | 0 (0.0%) |
| 4:00 PM to 11:59 PM | 0 (0.0%) | 2 (12.5%) |
| Total | 13 (100.0%) | 16 (100.0%) |
Housing Occupancy in Cantwell
Occupancy by Ownership in Cantwell
Of the total 90 dwellings in Cantwell, owner-occupied units account for 76 (84.4%), while renter-occupied units make up 14 (15.6%).
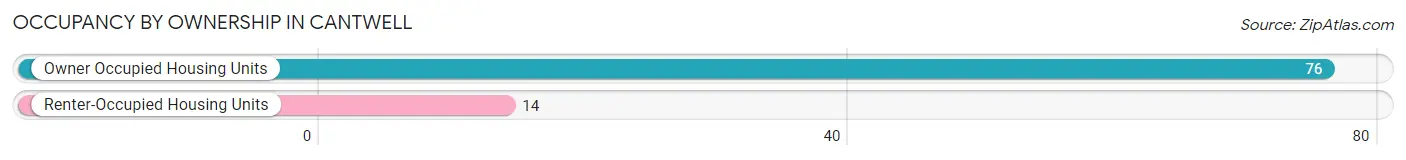
| Occupancy | # Housing Units | % Housing Units |
| Owner Occupied Housing Units | 76 | 84.4% |
| Renter-Occupied Housing Units | 14 | 15.6% |
| Total Occupied Housing Units | 90 | 100.0% |
Occupancy by Household Size in Cantwell
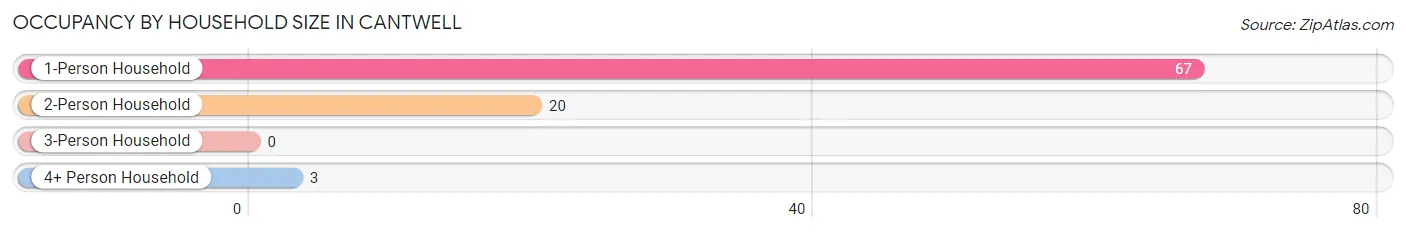
| Household Size | # Housing Units | % Housing Units |
| 1-Person Household | 67 | 74.4% |
| 2-Person Household | 20 | 22.2% |
| 3-Person Household | 0 | 0.0% |
| 4+ Person Household | 3 | 3.3% |
| Total Housing Units | 90 | 100.0% |
Occupancy by Ownership by Household Size in Cantwell
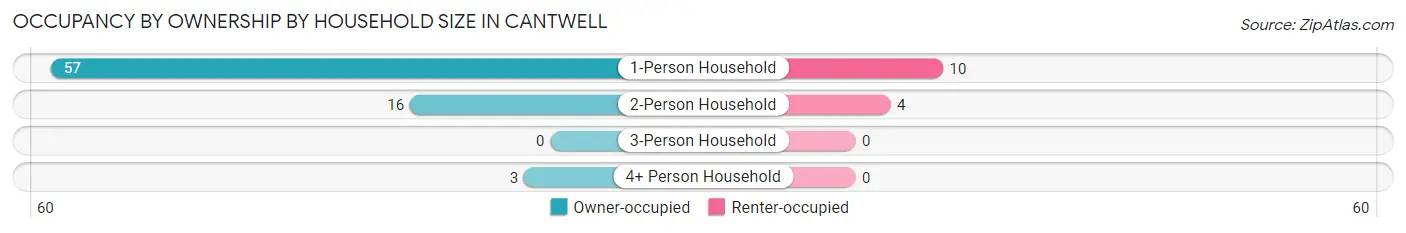
| Household Size | Owner-occupied | Renter-occupied |
| 1-Person Household | 57 (85.1%) | 10 (14.9%) |
| 2-Person Household | 16 (80.0%) | 4 (20.0%) |
| 3-Person Household | 0 (0.0%) | 0 (0.0%) |
| 4+ Person Household | 3 (100.0%) | 0 (0.0%) |
| Total Housing Units | 76 (84.4%) | 14 (15.6%) |
Occupancy by Educational Attainment in Cantwell
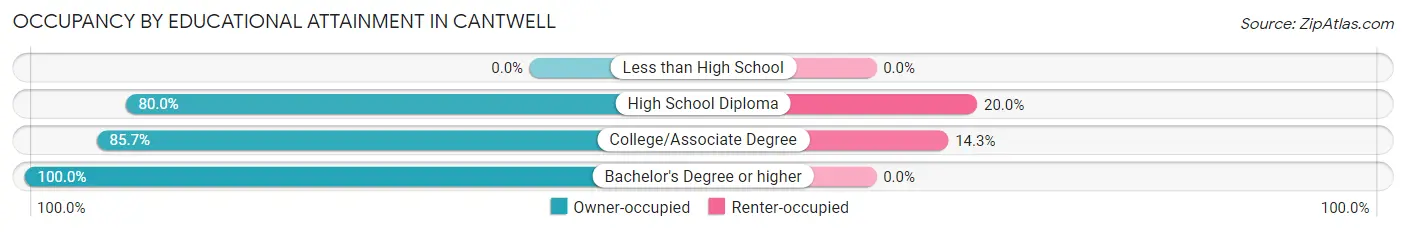
| Household Size | Owner-occupied | Renter-occupied |
| Less than High School | 0 (0.0%) | 0 (0.0%) |
| High School Diploma | 48 (80.0%) | 12 (20.0%) |
| College/Associate Degree | 12 (85.7%) | 2 (14.3%) |
| Bachelor's Degree or higher | 16 (100.0%) | 0 (0.0%) |
Occupancy by Age of Householder in Cantwell
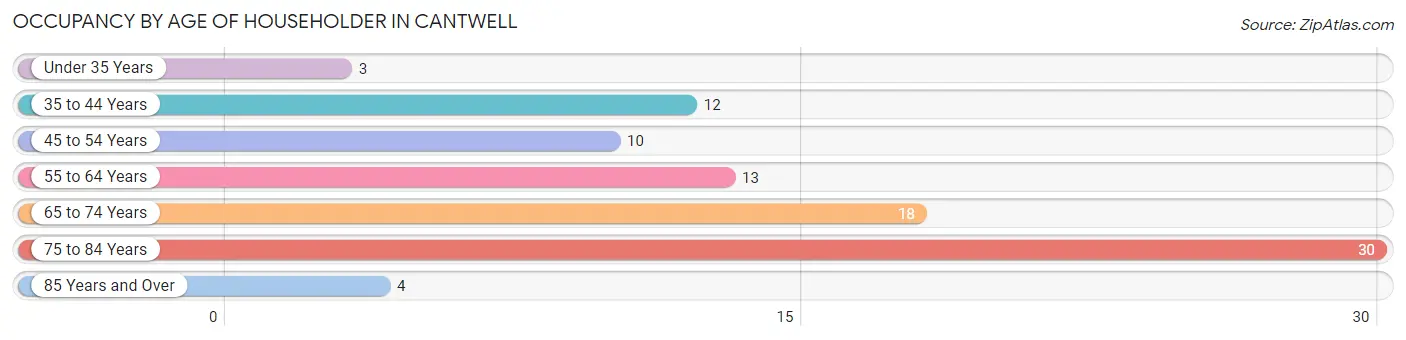
| Age Bracket | # Households | % Households |
| Under 35 Years | 3 | 3.3% |
| 35 to 44 Years | 12 | 13.3% |
| 45 to 54 Years | 10 | 11.1% |
| 55 to 64 Years | 13 | 14.4% |
| 65 to 74 Years | 18 | 20.0% |
| 75 to 84 Years | 30 | 33.3% |
| 85 Years and Over | 4 | 4.4% |
| Total | 90 | 100.0% |
Housing Finances in Cantwell
Median Income by Occupancy in Cantwell
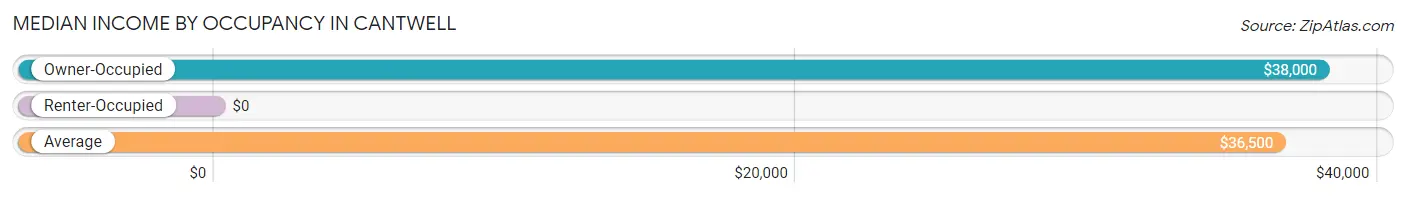
| Occupancy Type | # Households | Median Income |
| Owner-Occupied | 76 (84.4%) | $38,000 |
| Renter-Occupied | 14 (15.6%) | $0 |
| Average | 90 (100.0%) | $36,500 |
Occupancy by Householder Income Bracket in Cantwell
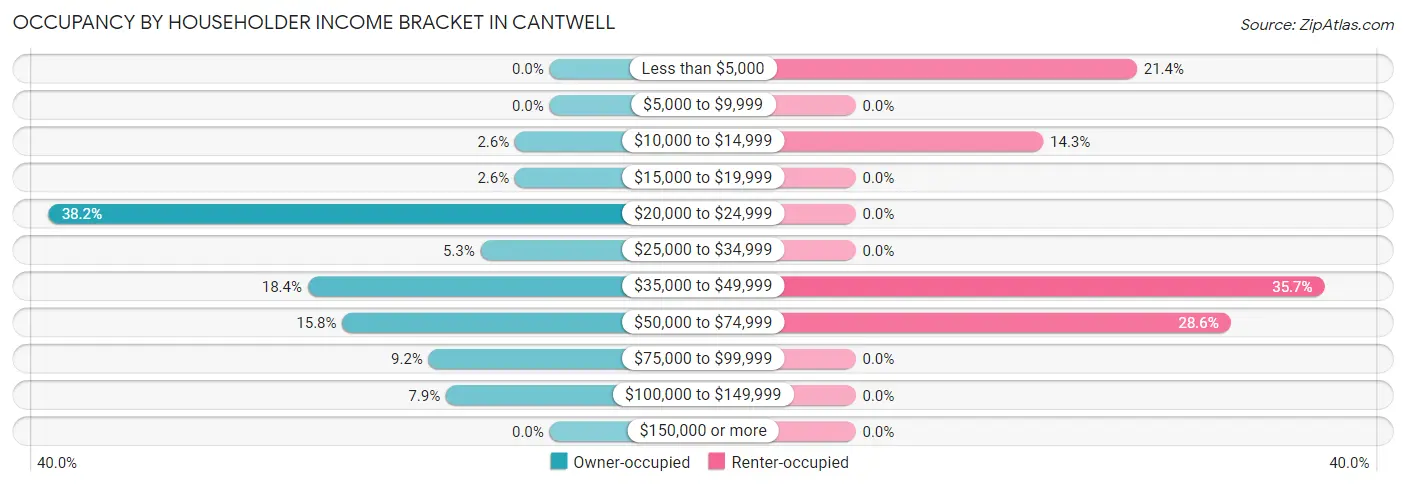
| Income Bracket | Owner-occupied | Renter-occupied |
| Less than $5,000 | 0 (0.0%) | 3 (21.4%) |
| $5,000 to $9,999 | 0 (0.0%) | 0 (0.0%) |
| $10,000 to $14,999 | 2 (2.6%) | 2 (14.3%) |
| $15,000 to $19,999 | 2 (2.6%) | 0 (0.0%) |
| $20,000 to $24,999 | 29 (38.2%) | 0 (0.0%) |
| $25,000 to $34,999 | 4 (5.3%) | 0 (0.0%) |
| $35,000 to $49,999 | 14 (18.4%) | 5 (35.7%) |
| $50,000 to $74,999 | 12 (15.8%) | 4 (28.6%) |
| $75,000 to $99,999 | 7 (9.2%) | 0 (0.0%) |
| $100,000 to $149,999 | 6 (7.9%) | 0 (0.0%) |
| $150,000 or more | 0 (0.0%) | 0 (0.0%) |
| Total | 76 (100.0%) | 14 (100.0%) |
Monthly Housing Cost Tiers in Cantwell
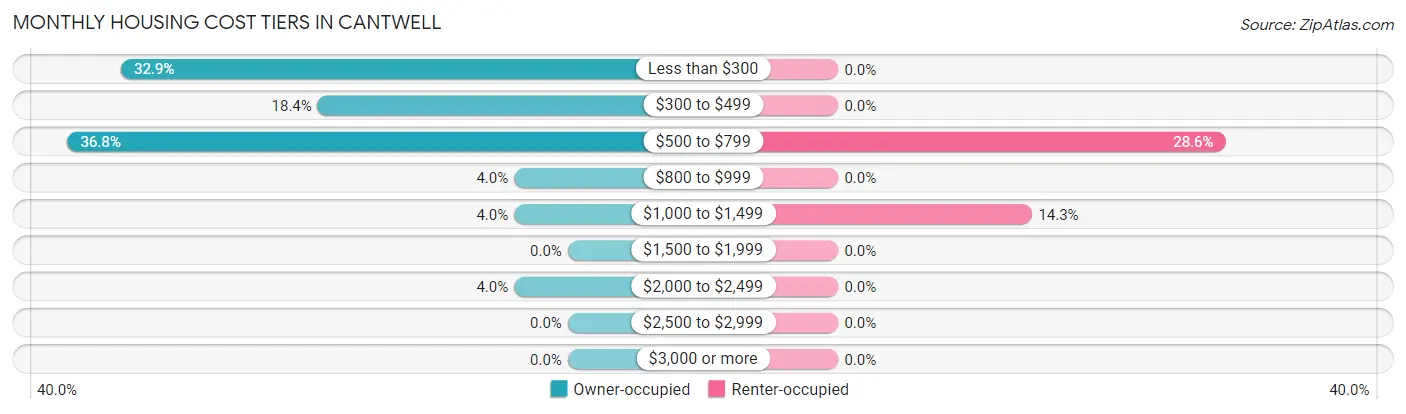
| Monthly Cost | Owner-occupied | Renter-occupied |
| Less than $300 | 25 (32.9%) | 0 (0.0%) |
| $300 to $499 | 14 (18.4%) | 0 (0.0%) |
| $500 to $799 | 28 (36.8%) | 4 (28.6%) |
| $800 to $999 | 3 (4.0%) | 0 (0.0%) |
| $1,000 to $1,499 | 3 (4.0%) | 2 (14.3%) |
| $1,500 to $1,999 | 0 (0.0%) | 0 (0.0%) |
| $2,000 to $2,499 | 3 (4.0%) | 0 (0.0%) |
| $2,500 to $2,999 | 0 (0.0%) | 0 (0.0%) |
| $3,000 or more | 0 (0.0%) | 0 (0.0%) |
| Total | 76 (100.0%) | 14 (100.0%) |
Physical Housing Characteristics in Cantwell
Housing Structures in Cantwell
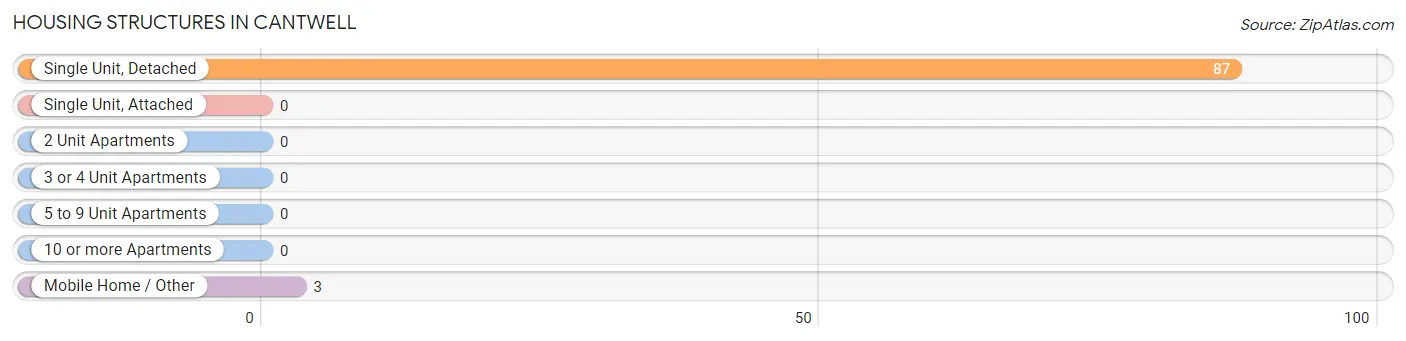
| Structure Type | # Housing Units | % Housing Units |
| Single Unit, Detached | 87 | 96.7% |
| Single Unit, Attached | 0 | 0.0% |
| 2 Unit Apartments | 0 | 0.0% |
| 3 or 4 Unit Apartments | 0 | 0.0% |
| 5 to 9 Unit Apartments | 0 | 0.0% |
| 10 or more Apartments | 0 | 0.0% |
| Mobile Home / Other | 3 | 3.3% |
| Total | 90 | 100.0% |
Housing Structures by Occupancy in Cantwell
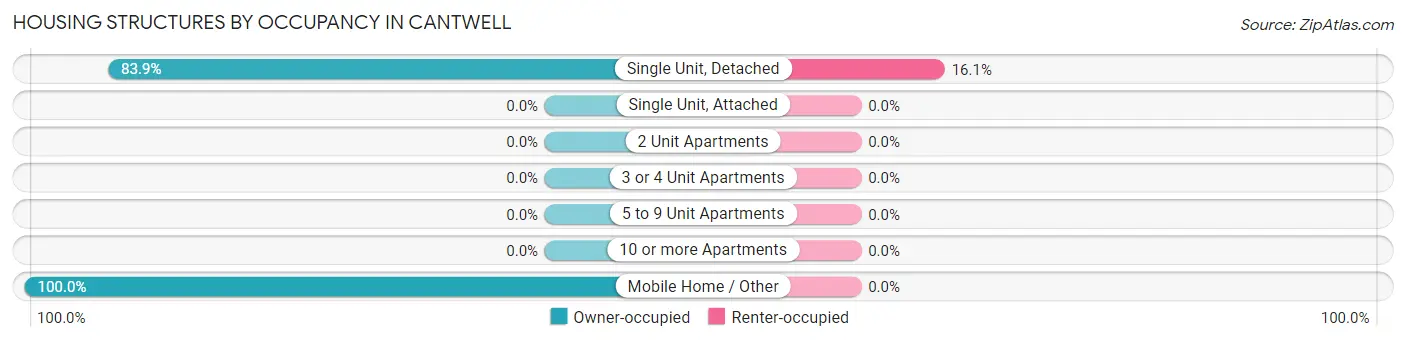
| Structure Type | Owner-occupied | Renter-occupied |
| Single Unit, Detached | 73 (83.9%) | 14 (16.1%) |
| Single Unit, Attached | 0 (0.0%) | 0 (0.0%) |
| 2 Unit Apartments | 0 (0.0%) | 0 (0.0%) |
| 3 or 4 Unit Apartments | 0 (0.0%) | 0 (0.0%) |
| 5 to 9 Unit Apartments | 0 (0.0%) | 0 (0.0%) |
| 10 or more Apartments | 0 (0.0%) | 0 (0.0%) |
| Mobile Home / Other | 3 (100.0%) | 0 (0.0%) |
| Total | 76 (84.4%) | 14 (15.6%) |
Housing Structures by Number of Rooms in Cantwell
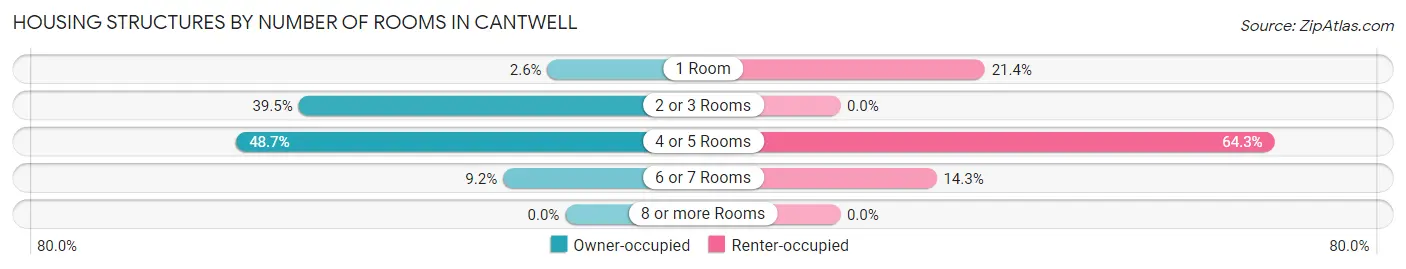
| Number of Rooms | Owner-occupied | Renter-occupied |
| 1 Room | 2 (2.6%) | 3 (21.4%) |
| 2 or 3 Rooms | 30 (39.5%) | 0 (0.0%) |
| 4 or 5 Rooms | 37 (48.7%) | 9 (64.3%) |
| 6 or 7 Rooms | 7 (9.2%) | 2 (14.3%) |
| 8 or more Rooms | 0 (0.0%) | 0 (0.0%) |
| Total | 76 (100.0%) | 14 (100.0%) |
Housing Structure by Heating Type in Cantwell
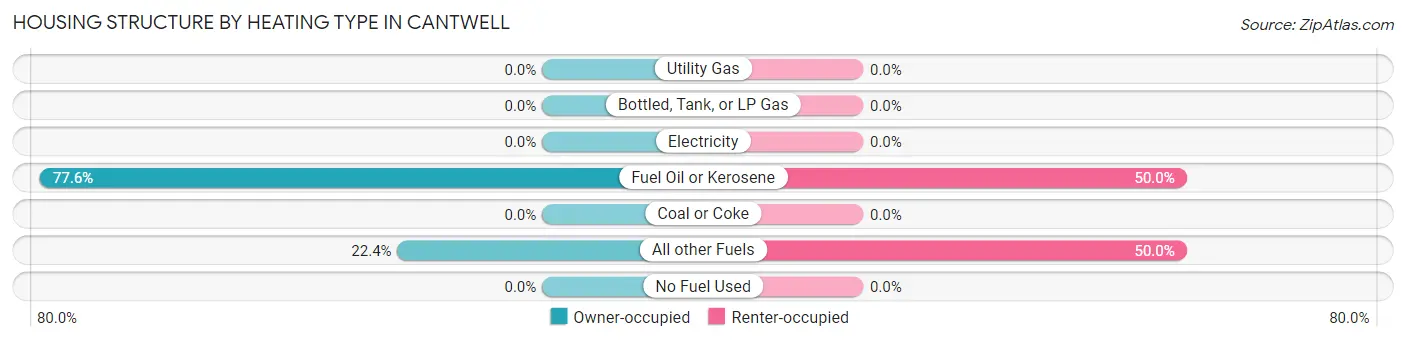
| Heating Type | Owner-occupied | Renter-occupied |
| Utility Gas | 0 (0.0%) | 0 (0.0%) |
| Bottled, Tank, or LP Gas | 0 (0.0%) | 0 (0.0%) |
| Electricity | 0 (0.0%) | 0 (0.0%) |
| Fuel Oil or Kerosene | 59 (77.6%) | 7 (50.0%) |
| Coal or Coke | 0 (0.0%) | 0 (0.0%) |
| All other Fuels | 17 (22.4%) | 7 (50.0%) |
| No Fuel Used | 0 (0.0%) | 0 (0.0%) |
| Total | 76 (100.0%) | 14 (100.0%) |
Household Vehicle Usage in Cantwell
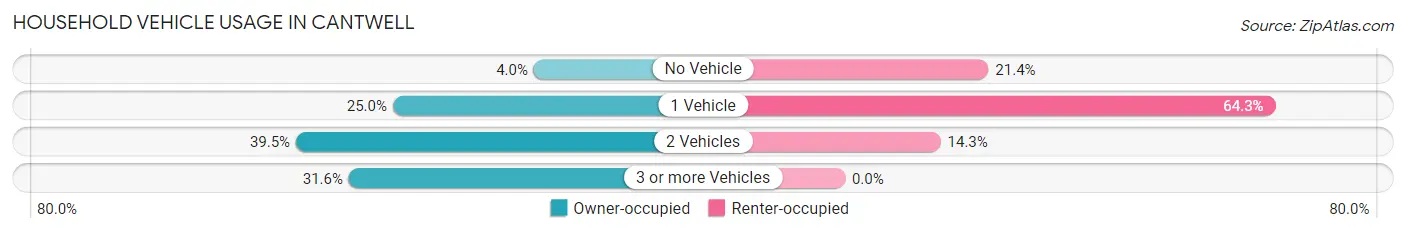
| Vehicles per Household | Owner-occupied | Renter-occupied |
| No Vehicle | 3 (4.0%) | 3 (21.4%) |
| 1 Vehicle | 19 (25.0%) | 9 (64.3%) |
| 2 Vehicles | 30 (39.5%) | 2 (14.3%) |
| 3 or more Vehicles | 24 (31.6%) | 0 (0.0%) |
| Total | 76 (100.0%) | 14 (100.0%) |
Real Estate & Mortgages in Cantwell
Real Estate and Mortgage Overview in Cantwell
| Characteristic | Without Mortgage | With Mortgage |
| Housing Units | 61 | 15 |
| Median Property Value | $205,000 | $220,800 |
| Median Household Income | $24,716 | $0 |
| Monthly Housing Costs | $375 | $0 |
| Real Estate Taxes | - | - |
Property Value by Mortgage Status in Cantwell
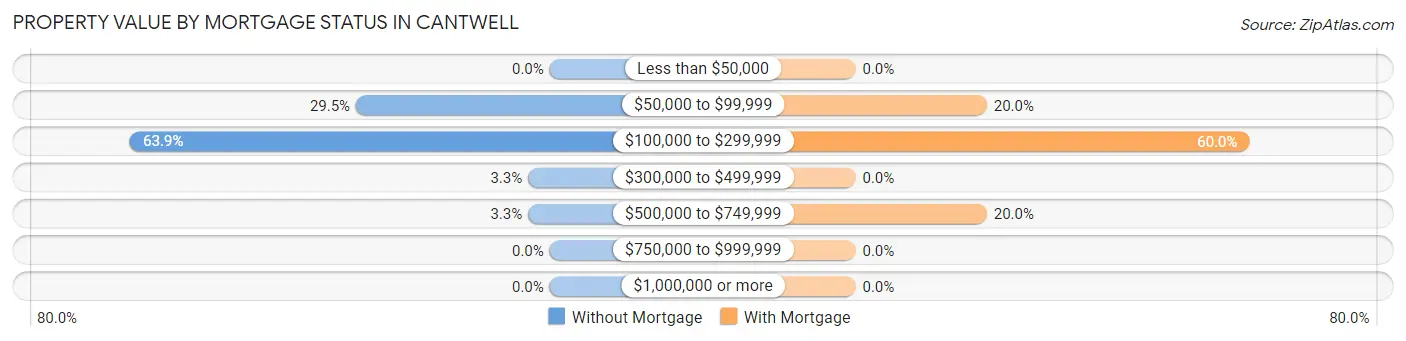
| Property Value | Without Mortgage | With Mortgage |
| Less than $50,000 | 0 (0.0%) | 0 (0.0%) |
| $50,000 to $99,999 | 18 (29.5%) | 3 (20.0%) |
| $100,000 to $299,999 | 39 (63.9%) | 9 (60.0%) |
| $300,000 to $499,999 | 2 (3.3%) | 0 (0.0%) |
| $500,000 to $749,999 | 2 (3.3%) | 3 (20.0%) |
| $750,000 to $999,999 | 0 (0.0%) | 0 (0.0%) |
| $1,000,000 or more | 0 (0.0%) | 0 (0.0%) |
| Total | 61 (100.0%) | 15 (100.0%) |
Household Income by Mortgage Status in Cantwell
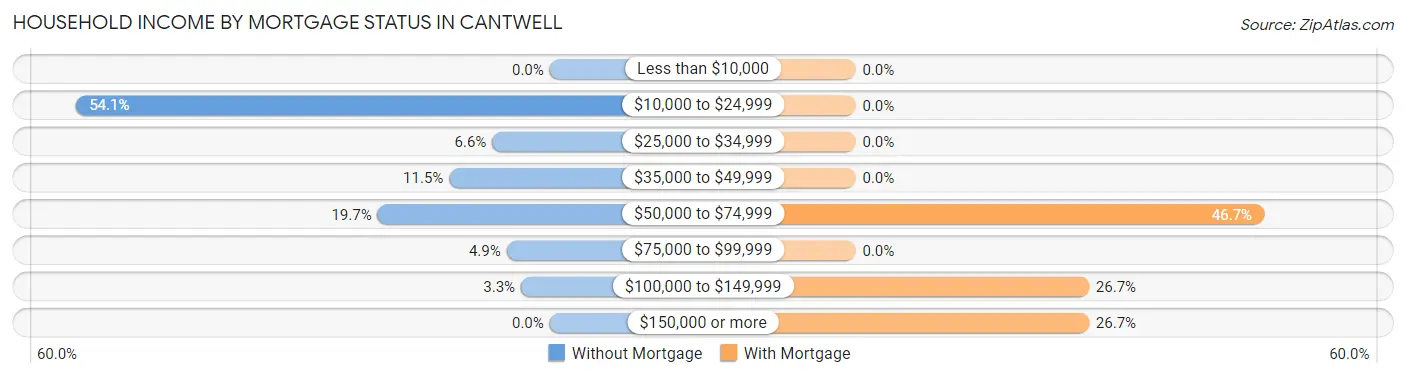
| Household Income | Without Mortgage | With Mortgage |
| Less than $10,000 | 0 (0.0%) | 0 (0.0%) |
| $10,000 to $24,999 | 33 (54.1%) | 0 (0.0%) |
| $25,000 to $34,999 | 4 (6.6%) | 0 (0.0%) |
| $35,000 to $49,999 | 7 (11.5%) | 0 (0.0%) |
| $50,000 to $74,999 | 12 (19.7%) | 7 (46.7%) |
| $75,000 to $99,999 | 3 (4.9%) | 0 (0.0%) |
| $100,000 to $149,999 | 2 (3.3%) | 4 (26.7%) |
| $150,000 or more | 0 (0.0%) | 4 (26.7%) |
| Total | 61 (100.0%) | 15 (100.0%) |
Property Value to Household Income Ratio in Cantwell
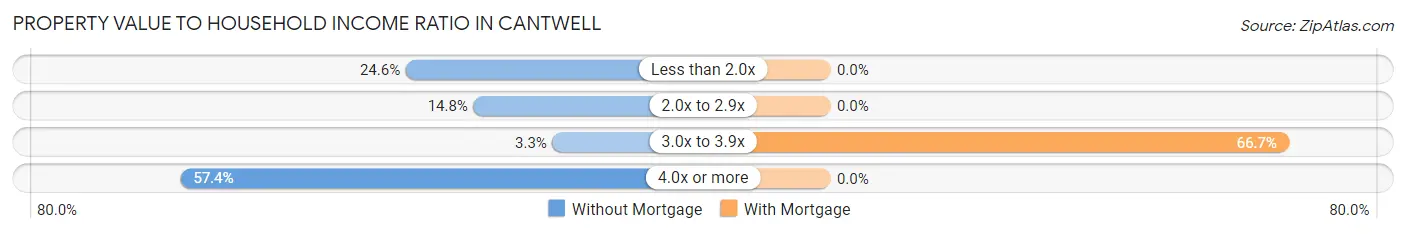
| Value-to-Income Ratio | Without Mortgage | With Mortgage |
| Less than 2.0x | 15 (24.6%) | 0 (0.0%) |
| 2.0x to 2.9x | 9 (14.7%) | 0 (0.0%) |
| 3.0x to 3.9x | 2 (3.3%) | 10 (66.7%) |
| 4.0x or more | 35 (57.4%) | 0 (0.0%) |
| Total | 61 (100.0%) | 15 (100.0%) |
Real Estate Taxes by Mortgage Status in Cantwell
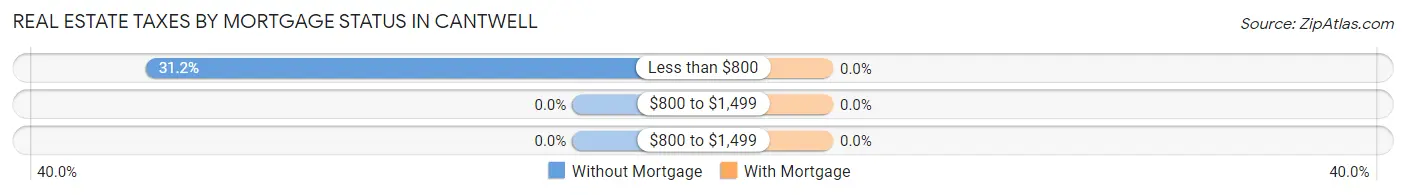
| Property Taxes | Without Mortgage | With Mortgage |
| Less than $800 | 19 (31.1%) | 0 (0.0%) |
| $800 to $1,499 | 0 (0.0%) | 0 (0.0%) |
| $800 to $1,499 | 0 (0.0%) | 0 (0.0%) |
| Total | 61 (100.0%) | 15 (100.0%) |
Health & Disability in Cantwell
Health Insurance Coverage by Age in Cantwell
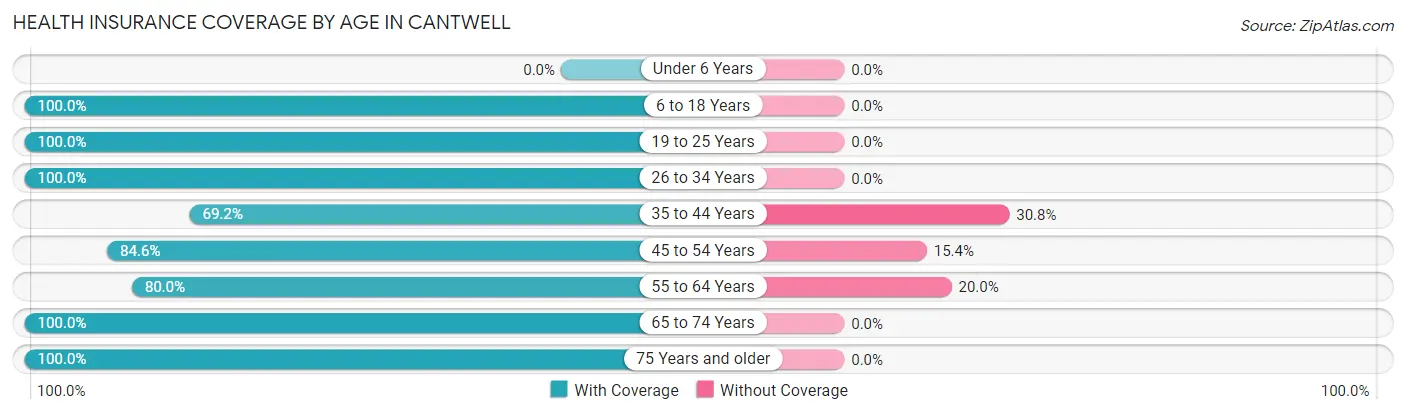
| Age Bracket | With Coverage | Without Coverage |
| Under 6 Years | 0 (0.0%) | 0 (0.0%) |
| 6 to 18 Years | 4 (100.0%) | 0 (0.0%) |
| 19 to 25 Years | 3 (100.0%) | 0 (0.0%) |
| 26 to 34 Years | 8 (100.0%) | 0 (0.0%) |
| 35 to 44 Years | 9 (69.2%) | 4 (30.8%) |
| 45 to 54 Years | 11 (84.6%) | 2 (15.4%) |
| 55 to 64 Years | 12 (80.0%) | 3 (20.0%) |
| 65 to 74 Years | 19 (100.0%) | 0 (0.0%) |
| 75 Years and older | 42 (100.0%) | 0 (0.0%) |
| Total | 108 (92.3%) | 9 (7.7%) |
Health Insurance Coverage by Citizenship Status in Cantwell
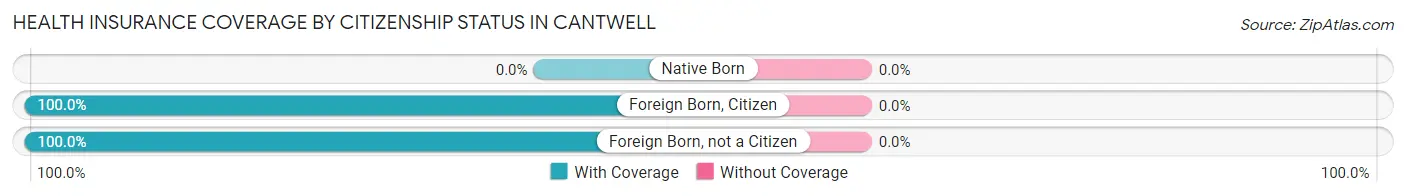
| Citizenship Status | With Coverage | Without Coverage |
| Native Born | 0 (0.0%) | 0 (0.0%) |
| Foreign Born, Citizen | 4 (100.0%) | 0 (0.0%) |
| Foreign Born, not a Citizen | 3 (100.0%) | 0 (0.0%) |
Health Insurance Coverage by Household Income in Cantwell
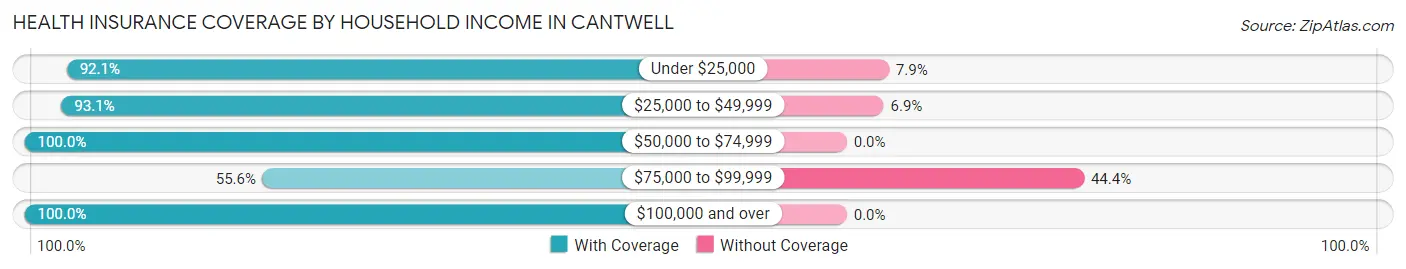
| Household Income | With Coverage | Without Coverage |
| Under $25,000 | 35 (92.1%) | 3 (7.9%) |
| $25,000 to $49,999 | 27 (93.1%) | 2 (6.9%) |
| $50,000 to $74,999 | 24 (100.0%) | 0 (0.0%) |
| $75,000 to $99,999 | 5 (55.6%) | 4 (44.4%) |
| $100,000 and over | 17 (100.0%) | 0 (0.0%) |
Public vs Private Health Insurance Coverage by Age in Cantwell
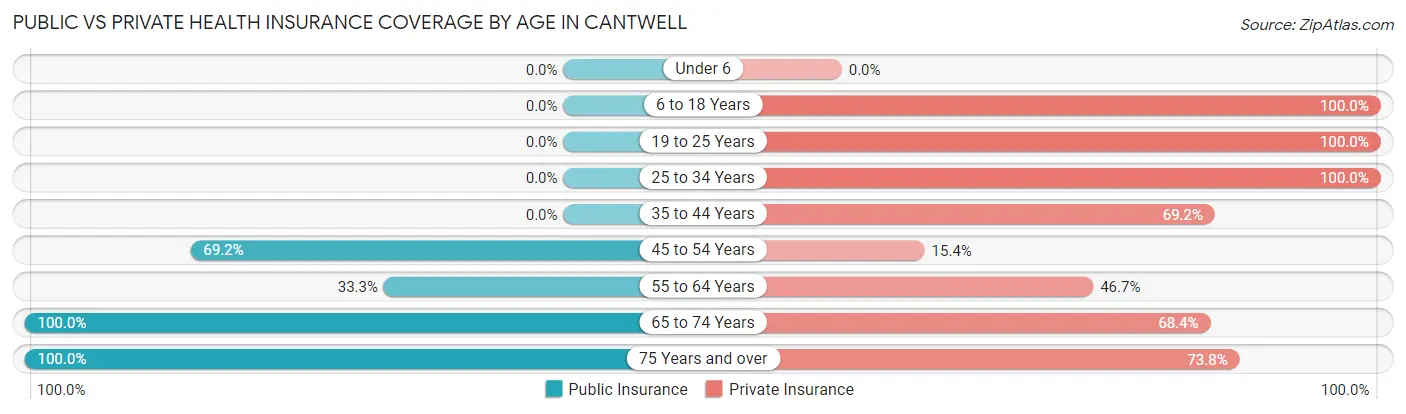
| Age Bracket | Public Insurance | Private Insurance |
| Under 6 | 0 (0.0%) | 0 (0.0%) |
| 6 to 18 Years | 0 (0.0%) | 4 (100.0%) |
| 19 to 25 Years | 0 (0.0%) | 3 (100.0%) |
| 25 to 34 Years | 0 (0.0%) | 8 (100.0%) |
| 35 to 44 Years | 0 (0.0%) | 9 (69.2%) |
| 45 to 54 Years | 9 (69.2%) | 2 (15.4%) |
| 55 to 64 Years | 5 (33.3%) | 7 (46.7%) |
| 65 to 74 Years | 19 (100.0%) | 13 (68.4%) |
| 75 Years and over | 42 (100.0%) | 31 (73.8%) |
| Total | 75 (64.1%) | 77 (65.8%) |
Disability Status by Sex by Age in Cantwell
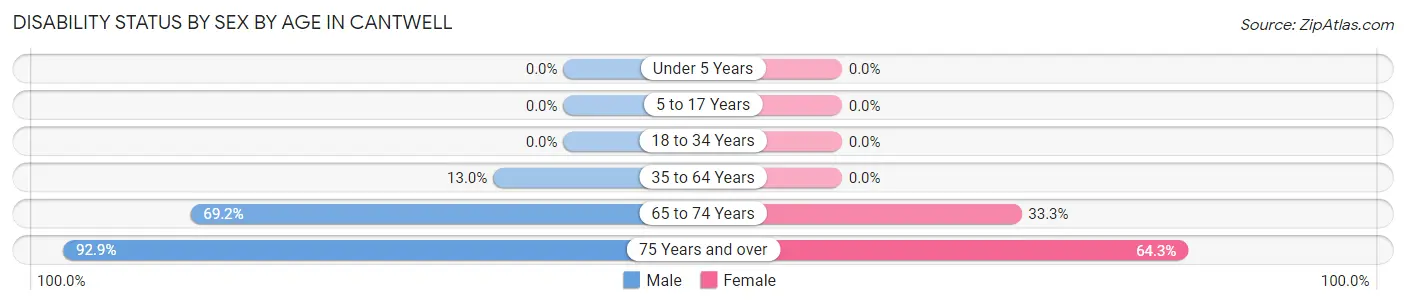
| Age Bracket | Male | Female |
| Under 5 Years | 0 (0.0%) | 0 (0.0%) |
| 5 to 17 Years | 0 (0.0%) | 0 (0.0%) |
| 18 to 34 Years | 0 (0.0%) | 0 (0.0%) |
| 35 to 64 Years | 3 (13.0%) | 0 (0.0%) |
| 65 to 74 Years | 9 (69.2%) | 2 (33.3%) |
| 75 Years and over | 26 (92.9%) | 9 (64.3%) |
Disability Class by Sex by Age in Cantwell
Disability Class: Hearing Difficulty
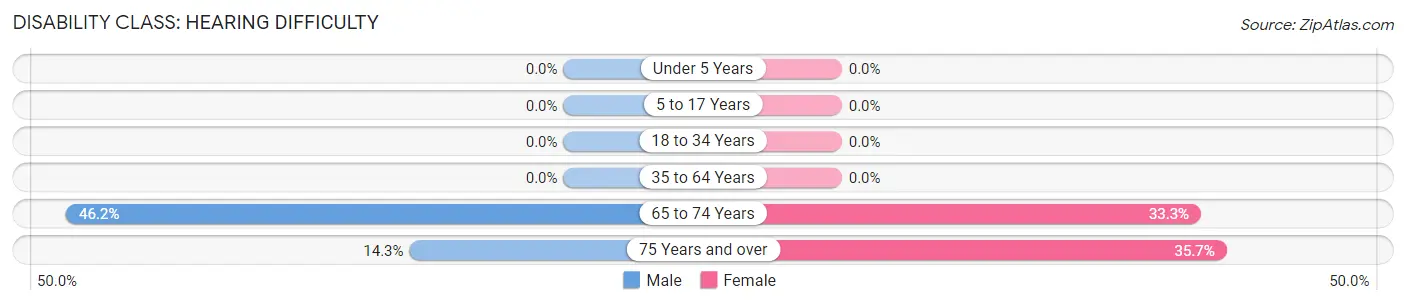
| Age Bracket | Male | Female |
| Under 5 Years | 0 (0.0%) | 0 (0.0%) |
| 5 to 17 Years | 0 (0.0%) | 0 (0.0%) |
| 18 to 34 Years | 0 (0.0%) | 0 (0.0%) |
| 35 to 64 Years | 0 (0.0%) | 0 (0.0%) |
| 65 to 74 Years | 6 (46.2%) | 2 (33.3%) |
| 75 Years and over | 4 (14.3%) | 5 (35.7%) |
Disability Class: Vision Difficulty
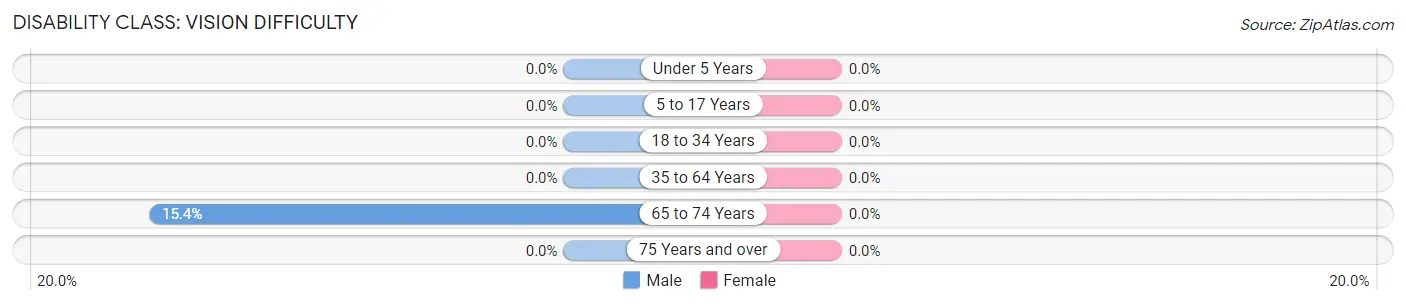
| Age Bracket | Male | Female |
| Under 5 Years | 0 (0.0%) | 0 (0.0%) |
| 5 to 17 Years | 0 (0.0%) | 0 (0.0%) |
| 18 to 34 Years | 0 (0.0%) | 0 (0.0%) |
| 35 to 64 Years | 0 (0.0%) | 0 (0.0%) |
| 65 to 74 Years | 2 (15.4%) | 0 (0.0%) |
| 75 Years and over | 0 (0.0%) | 0 (0.0%) |
Disability Class: Cognitive Difficulty
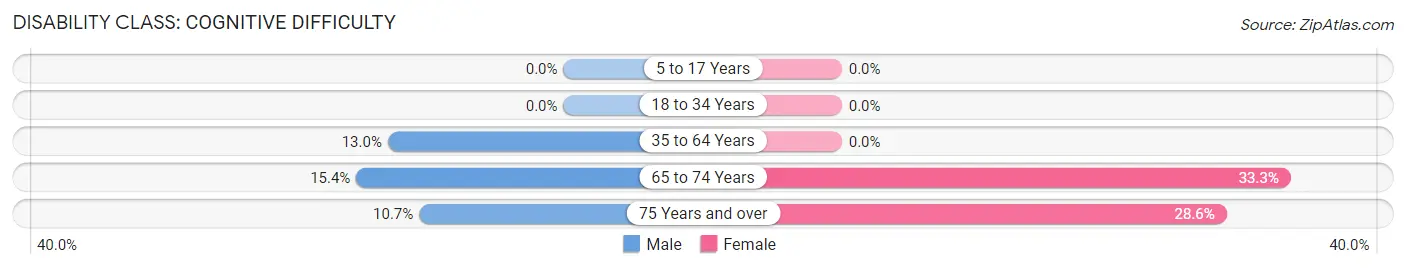
| Age Bracket | Male | Female |
| 5 to 17 Years | 0 (0.0%) | 0 (0.0%) |
| 18 to 34 Years | 0 (0.0%) | 0 (0.0%) |
| 35 to 64 Years | 3 (13.0%) | 0 (0.0%) |
| 65 to 74 Years | 2 (15.4%) | 2 (33.3%) |
| 75 Years and over | 3 (10.7%) | 4 (28.6%) |
Disability Class: Ambulatory Difficulty
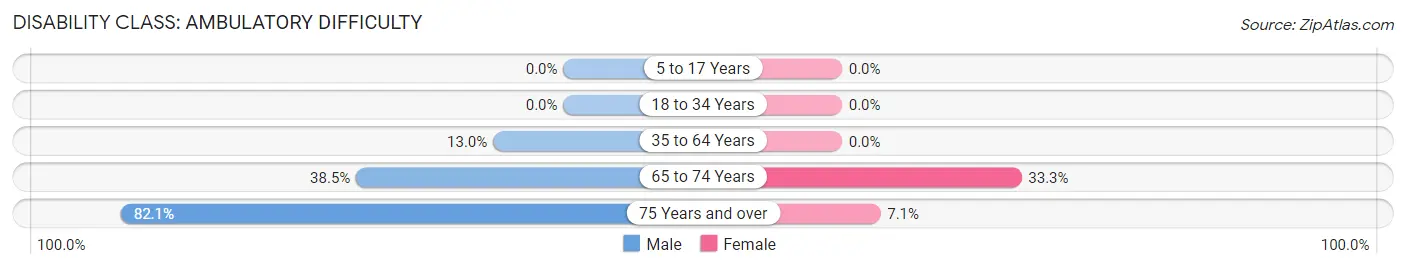
| Age Bracket | Male | Female |
| 5 to 17 Years | 0 (0.0%) | 0 (0.0%) |
| 18 to 34 Years | 0 (0.0%) | 0 (0.0%) |
| 35 to 64 Years | 3 (13.0%) | 0 (0.0%) |
| 65 to 74 Years | 5 (38.5%) | 2 (33.3%) |
| 75 Years and over | 23 (82.1%) | 1 (7.1%) |
Disability Class: Self-Care Difficulty
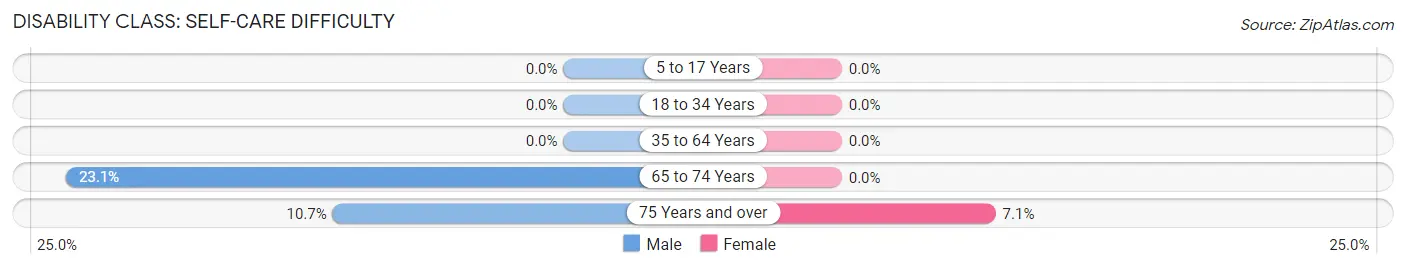
| Age Bracket | Male | Female |
| 5 to 17 Years | 0 (0.0%) | 0 (0.0%) |
| 18 to 34 Years | 0 (0.0%) | 0 (0.0%) |
| 35 to 64 Years | 0 (0.0%) | 0 (0.0%) |
| 65 to 74 Years | 3 (23.1%) | 0 (0.0%) |
| 75 Years and over | 3 (10.7%) | 1 (7.1%) |
Technology Access in Cantwell
Computing Device Access in Cantwell
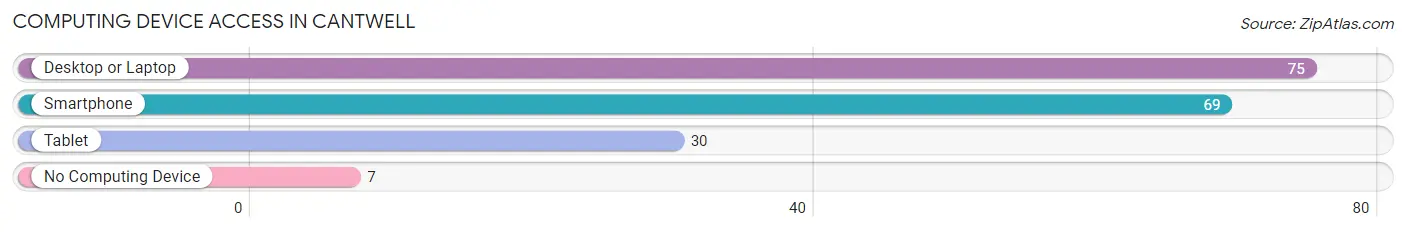
| Device Type | # Households | % Households |
| Desktop or Laptop | 75 | 83.3% |
| Smartphone | 69 | 76.7% |
| Tablet | 30 | 33.3% |
| No Computing Device | 7 | 7.8% |
| Total | 90 | 100.0% |
Internet Access in Cantwell
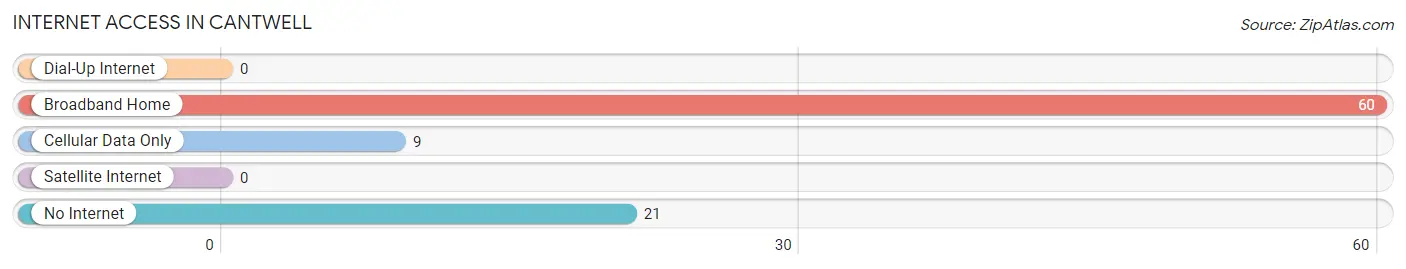
| Internet Type | # Households | % Households |
| Dial-Up Internet | 0 | 0.0% |
| Broadband Home | 60 | 66.7% |
| Cellular Data Only | 9 | 10.0% |
| Satellite Internet | 0 | 0.0% |
| No Internet | 21 | 23.3% |
| Total | 90 | 100.0% |
Cantwell Summary
Cantwell, Alaska is a small unincorporated community located in the Denali Borough of the state of Alaska. It is situated on the south bank of the Nenana River, approximately 100 miles south of Fairbanks. The population of Cantwell was estimated to be around 200 people in 2020.
History
Cantwell was originally established in the early 1900s as a trading post for the Alaska Railroad. The town was named after William Cantwell, a railroad engineer who worked on the Alaska Railroad. The town was officially incorporated in 1947.
In the 1950s, Cantwell became a popular tourist destination due to its proximity to Denali National Park and Preserve. The town was also home to a number of businesses, including a hotel, a general store, and a post office.
Geography
Cantwell is located in the Denali Borough of Alaska, approximately 100 miles south of Fairbanks. The town is situated on the south bank of the Nenana River, which is a major tributary of the Tanana River. The town is surrounded by the Alaska Range to the north and the Talkeetna Mountains to the south.
The climate in Cantwell is generally cold and dry, with temperatures ranging from -20°F in the winter to 70°F in the summer. The town receives an average of 20 inches of snowfall each year.
Economy
Cantwell’s economy is largely based on tourism. The town is a popular destination for visitors to Denali National Park and Preserve, and it is home to a number of businesses that cater to tourists, including hotels, restaurants, and souvenir shops.
The town is also home to a number of small businesses, including a general store, a post office, and a gas station. The town is also home to a number of small-scale farms and ranches.
Demographics
As of 2020, the population of Cantwell was estimated to be around 200 people. The town is predominantly white, with a small Native American population. The median household income in Cantwell is $45,000, and the median home value is $150,000.
Conclusion
Cantwell, Alaska is a small unincorporated community located in the Denali Borough of the state of Alaska. It is situated on the south bank of the Nenana River, approximately 100 miles south of Fairbanks. The town was originally established in the early 1900s as a trading post for the Alaska Railroad, and it has since become a popular tourist destination due to its proximity to Denali National Park and Preserve. The town’s economy is largely based on tourism, and it is home to a number of small businesses, including a general store, a post office, and a gas station. The population of Cantwell was estimated to be around 200 people in 2020, and the town is predominantly white, with a small Native American population.
Common Questions
What is Per Capita Income in Cantwell?
Per Capita income in Cantwell is $32,399.
What is the Median Family Income in Cantwell?
Median Family Income in Cantwell is $61,250.
What is the Median Household income in Cantwell?
Median Household Income in Cantwell is $36,500.
What is Inequality or Gini Index in Cantwell?
Inequality or Gini Index in Cantwell is 0.36.
What is the Total Population of Cantwell?
Total Population of Cantwell is 117.
What is the Total Male Population of Cantwell?
Total Male Population of Cantwell is 75.
What is the Total Female Population of Cantwell?
Total Female Population of Cantwell is 42.
What is the Ratio of Males per 100 Females in Cantwell?
There are 178.57 Males per 100 Females in Cantwell.
What is the Ratio of Females per 100 Males in Cantwell?
There are 56.00 Females per 100 Males in Cantwell.
What is the Median Population Age in Cantwell?
Median Population Age in Cantwell is 65.4 Years.
What is the Average Family Size in Cantwell
Average Family Size in Cantwell is 2.3 People.
What is the Average Household Size in Cantwell
Average Household Size in Cantwell is 1.3 People.
How Large is the Labor Force in Cantwell?
There are 39 People in the Labor Forcein in Cantwell.
What is the Percentage of People in the Labor Force in Cantwell?
34.2% of People are in the Labor Force in Cantwell.
What is the Unemployment Rate in Cantwell?
Unemployment Rate in Cantwell is 17.9%.