Browning, MT Map & Demographics
Browning Map
Browning Overview
$14,695
PER CAPITA INCOME
$34,750
AVG FAMILY INCOME
$41,250
AVG HOUSEHOLD INCOME
21.9%
WAGE / INCOME GAP [ % ]
78.1¢/ $1
WAGE / INCOME GAP [ $ ]
$12,267
FAMILY INCOME DEFICIT
0.44
INEQUALITY / GINI INDEX
871
TOTAL POPULATION
419
MALE POPULATION
452
FEMALE POPULATION
92.70
MALES / 100 FEMALES
107.88
FEMALES / 100 MALES
29.3
MEDIAN AGE
3.9
AVG FAMILY SIZE
3.1
AVG HOUSEHOLD SIZE
359
LABOR FORCE [ PEOPLE ]
60.0%
PERCENT IN LABOR FORCE
16.4%
UNEMPLOYMENT RATE
Browning Zip Codes
Browning Area Codes
Income in Browning
Income Overview in Browning
Per Capita Income in Browning is $14,695, while median incomes of families and households are $34,750 and $41,250 respectively.
| Characteristic | Number | Measure |
| Per Capita Income | 871 | $14,695 |
| Median Family Income | 184 | $34,750 |
| Mean Family Income | 184 | $44,961 |
| Median Household Income | 282 | $41,250 |
| Mean Household Income | 282 | $43,167 |
| Income Deficit | 184 | $12,267 |
| Wage / Income Gap (%) | 871 | 21.90% |
| Wage / Income Gap ($) | 871 | 78.10¢ per $1 |
| Gini / Inequality Index | 871 | 0.44 |
Earnings by Sex in Browning
Average Earnings in Browning are $22,344, $20,893 for men and $26,750 for women, a difference of 21.9%.
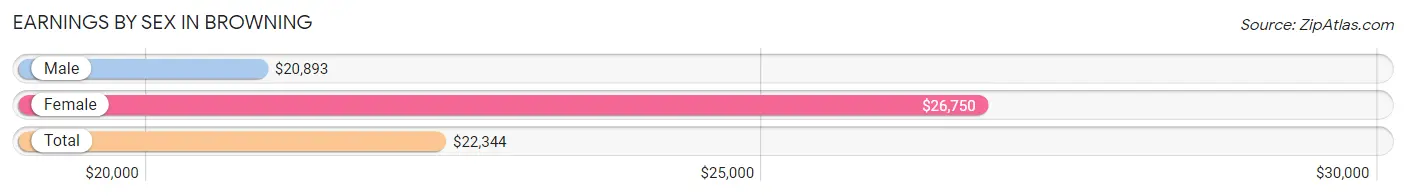
| Sex | Number | Average Earnings |
| Male | 167 (48.0%) | $20,893 |
| Female | 181 (52.0%) | $26,750 |
| Total | 348 (100.0%) | $22,344 |
Earnings by Sex by Income Bracket in Browning
The most common earnings brackets in Browning are $12,500 to $14,999 for men (28 | 16.8%) and $35,000 to $39,999 for women (29 | 16.0%).
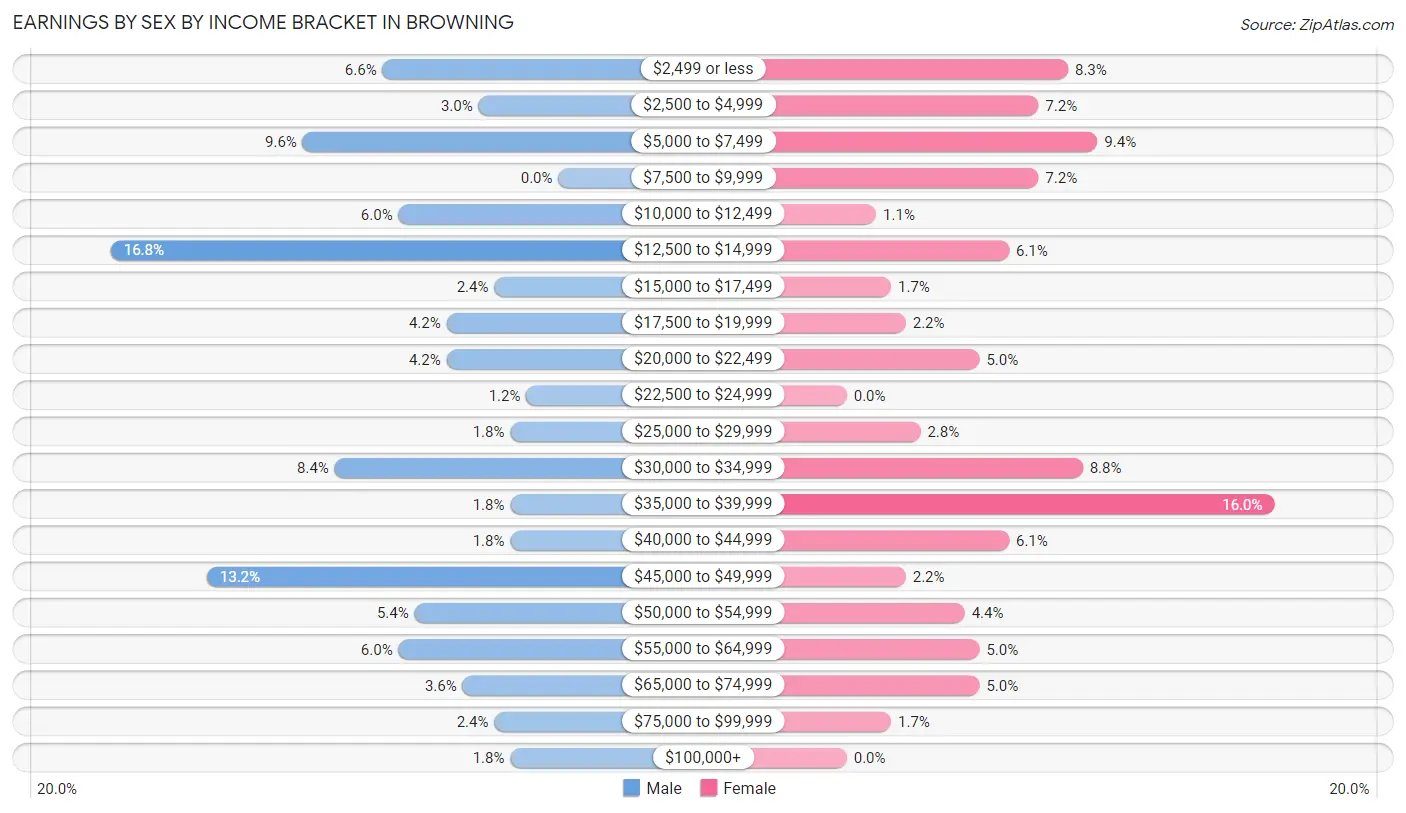
| Income | Male | Female |
| $2,499 or less | 11 (6.6%) | 15 (8.3%) |
| $2,500 to $4,999 | 5 (3.0%) | 13 (7.2%) |
| $5,000 to $7,499 | 16 (9.6%) | 17 (9.4%) |
| $7,500 to $9,999 | 0 (0.0%) | 13 (7.2%) |
| $10,000 to $12,499 | 10 (6.0%) | 2 (1.1%) |
| $12,500 to $14,999 | 28 (16.8%) | 11 (6.1%) |
| $15,000 to $17,499 | 4 (2.4%) | 3 (1.7%) |
| $17,500 to $19,999 | 7 (4.2%) | 4 (2.2%) |
| $20,000 to $22,499 | 7 (4.2%) | 9 (5.0%) |
| $22,500 to $24,999 | 2 (1.2%) | 0 (0.0%) |
| $25,000 to $29,999 | 3 (1.8%) | 5 (2.8%) |
| $30,000 to $34,999 | 14 (8.4%) | 16 (8.8%) |
| $35,000 to $39,999 | 3 (1.8%) | 29 (16.0%) |
| $40,000 to $44,999 | 3 (1.8%) | 11 (6.1%) |
| $45,000 to $49,999 | 22 (13.2%) | 4 (2.2%) |
| $50,000 to $54,999 | 9 (5.4%) | 8 (4.4%) |
| $55,000 to $64,999 | 10 (6.0%) | 9 (5.0%) |
| $65,000 to $74,999 | 6 (3.6%) | 9 (5.0%) |
| $75,000 to $99,999 | 4 (2.4%) | 3 (1.7%) |
| $100,000+ | 3 (1.8%) | 0 (0.0%) |
| Total | 167 (100.0%) | 181 (100.0%) |
Earnings by Sex by Educational Attainment in Browning
Average earnings in Browning are $33,750 for men and $33,438 for women, a difference of 0.9%. Men with an educational attainment of bachelor's degree enjoy the highest average annual earnings of $49,167, while those with high school diploma education earn the least with $29,583. Women with an educational attainment of graduate degree earn the most with the average annual earnings of $51,875, while those with less than high school education have the smallest earnings of $7,500.
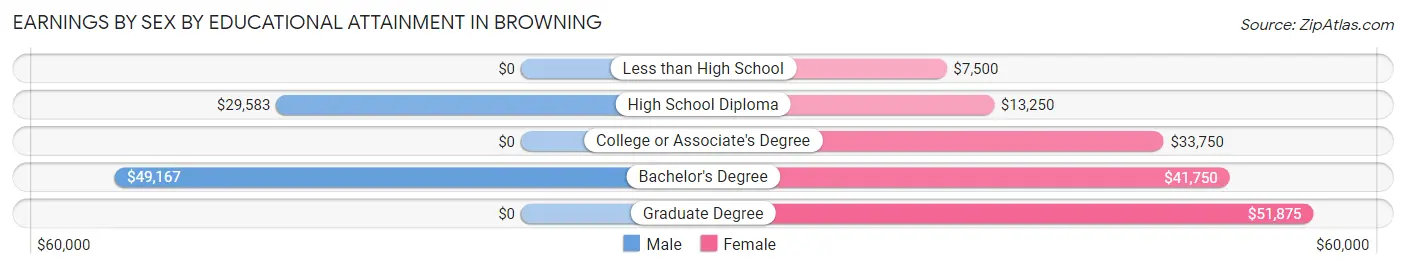
| Educational Attainment | Male Income | Female Income |
| Less than High School | - | - |
| High School Diploma | $29,583 | $13,250 |
| College or Associate's Degree | - | - |
| Bachelor's Degree | $49,167 | $41,750 |
| Graduate Degree | - | - |
| Total | $33,750 | $33,438 |
Family Income in Browning
Family Income Brackets in Browning
According to the Browning family income data, there are 47 families falling into the $50,000 to $74,999 income range, which is the most common income bracket and makes up 25.5% of all families.
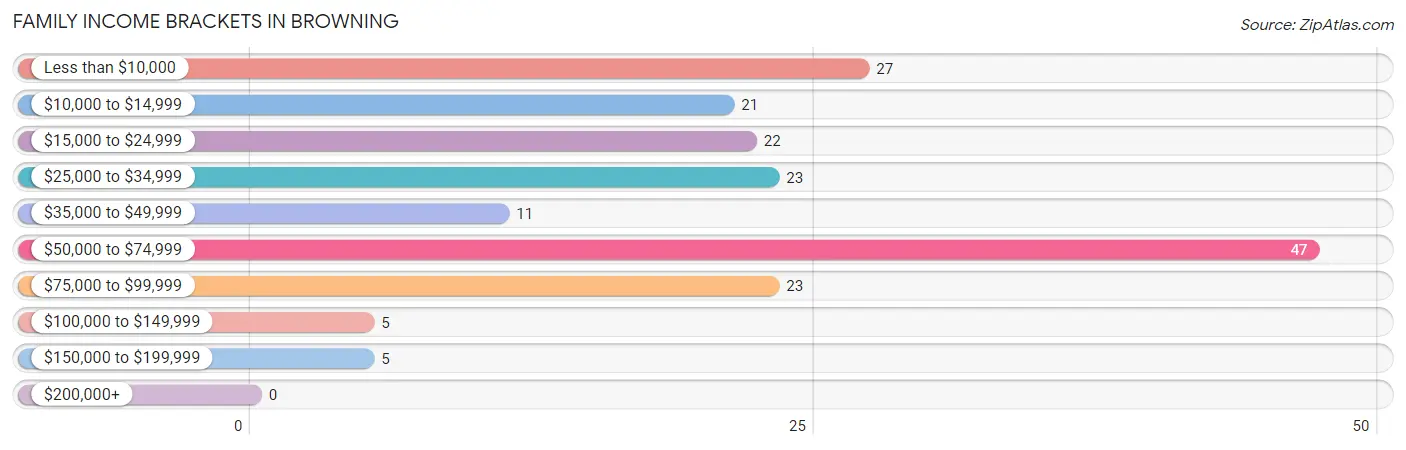
| Income Bracket | # Families | % Families |
| Less than $10,000 | 27 | 14.7% |
| $10,000 to $14,999 | 21 | 11.4% |
| $15,000 to $24,999 | 22 | 12.0% |
| $25,000 to $34,999 | 23 | 12.5% |
| $35,000 to $49,999 | 11 | 6.0% |
| $50,000 to $74,999 | 47 | 25.5% |
| $75,000 to $99,999 | 23 | 12.5% |
| $100,000 to $149,999 | 5 | 2.7% |
| $150,000 to $199,999 | 5 | 2.7% |
| $200,000+ | 0 | 0.0% |
Family Income by Famaliy Size in Browning
4-person families (42 | 22.8%) account for the highest median family income in Browning with $58,056 per family, while 4-person families (42 | 22.8%) have the highest median income of $14,514 per family member.
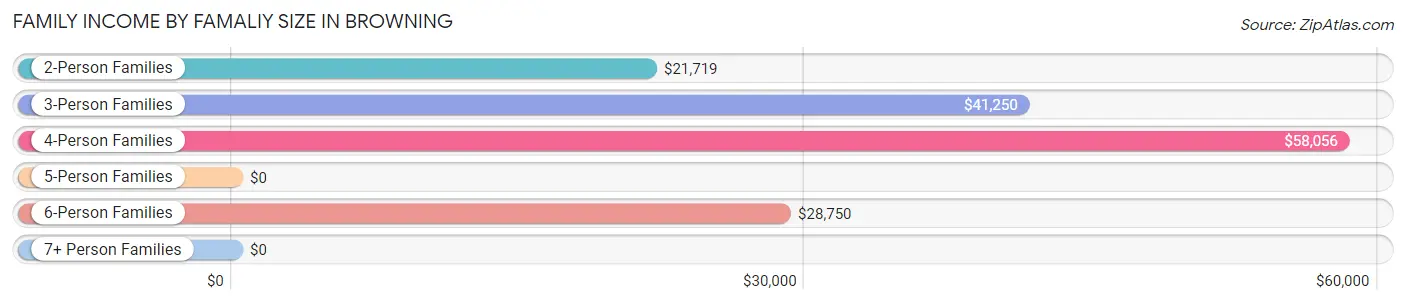
| Income Bracket | # Families | Median Income |
| 2-Person Families | 55 (29.9%) | $21,719 |
| 3-Person Families | 60 (32.6%) | $41,250 |
| 4-Person Families | 42 (22.8%) | $58,056 |
| 5-Person Families | 14 (7.6%) | $0 |
| 6-Person Families | 9 (4.9%) | $28,750 |
| 7+ Person Families | 4 (2.2%) | $0 |
| Total | 184 (100.0%) | $34,750 |
Family Income by Number of Earners in Browning
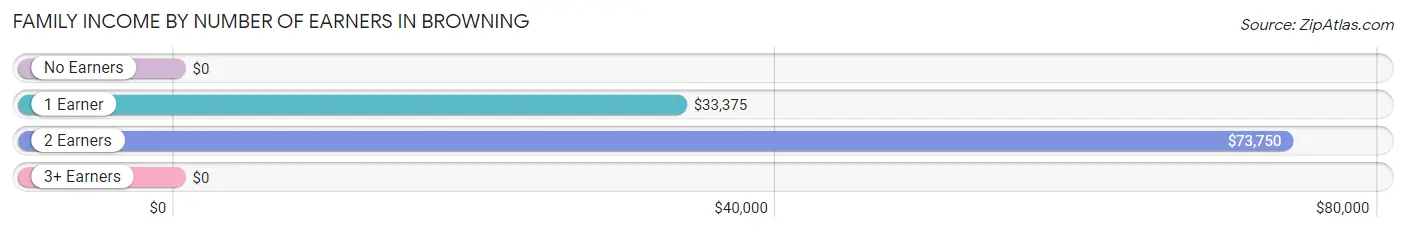
| Number of Earners | # Families | Median Income |
| No Earners | 32 (17.4%) | $0 |
| 1 Earner | 91 (49.5%) | $33,375 |
| 2 Earners | 54 (29.3%) | $73,750 |
| 3+ Earners | 7 (3.8%) | $0 |
| Total | 184 (100.0%) | $34,750 |
Household Income in Browning
Household Income Brackets in Browning
With 72 households falling in the category, the $50,000 to $74,999 income range is the most frequent in Browning, accounting for 25.5% of all households. In contrast, only 2 households (0.7%) fall into the $150,000 to $199,999 income bracket, making it the least populous group.
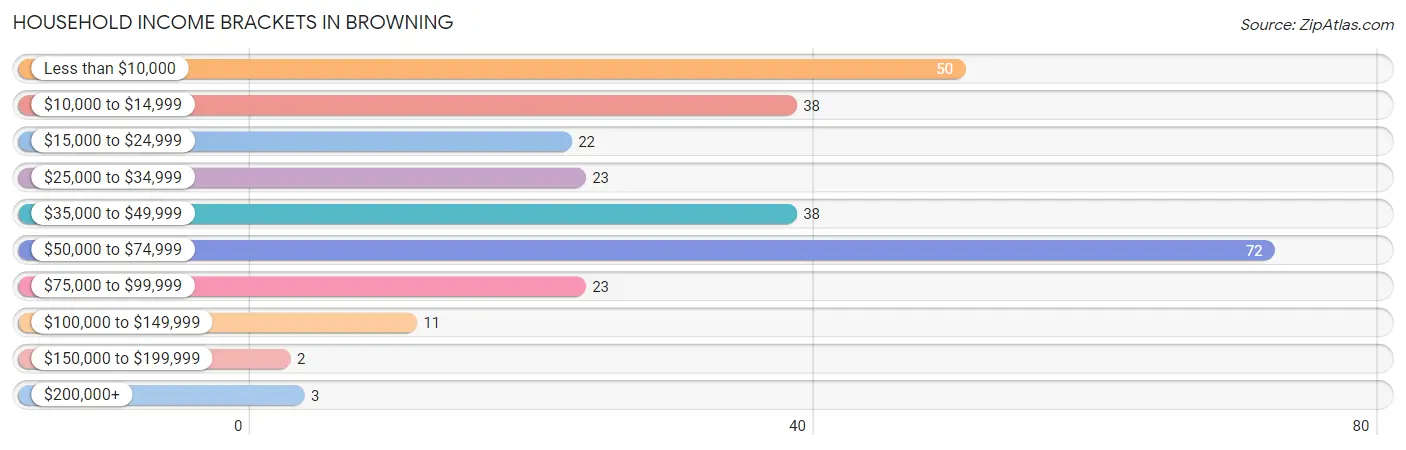
| Income Bracket | # Households | % Households |
| Less than $10,000 | 50 | 17.7% |
| $10,000 to $14,999 | 38 | 13.5% |
| $15,000 to $24,999 | 22 | 7.8% |
| $25,000 to $34,999 | 23 | 8.2% |
| $35,000 to $49,999 | 38 | 13.5% |
| $50,000 to $74,999 | 72 | 25.5% |
| $75,000 to $99,999 | 23 | 8.2% |
| $100,000 to $149,999 | 11 | 3.9% |
| $150,000 to $199,999 | 2 | 0.7% |
| $200,000+ | 3 | 1.1% |
Household Income by Householder Age in Browning
The median household income in Browning is $41,250, with the highest median household income of $52,583 found in the 45 to 64 years age bracket for the primary householder. A total of 111 households (39.4%) fall into this category. Meanwhile, the 15 to 24 years age bracket for the primary householder has the lowest median household income of $0, with 21 households (7.4%) in this group.
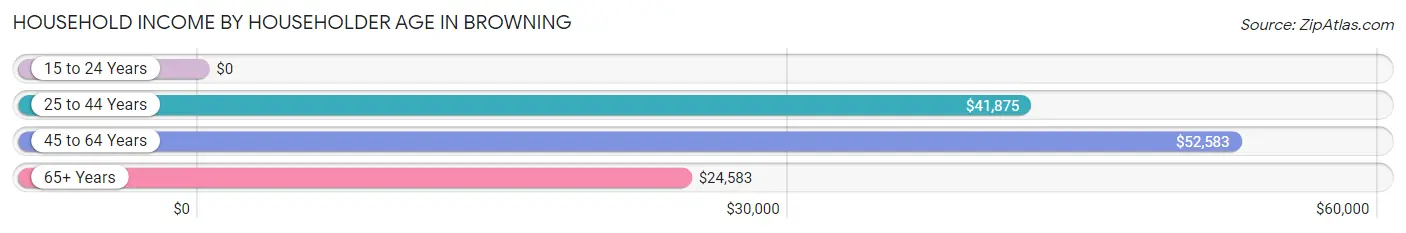
| Income Bracket | # Households | Median Income |
| 15 to 24 Years | 21 (7.4%) | $0 |
| 25 to 44 Years | 107 (37.9%) | $41,875 |
| 45 to 64 Years | 111 (39.4%) | $52,583 |
| 65+ Years | 43 (15.2%) | $24,583 |
| Total | 282 (100.0%) | $41,250 |
Poverty in Browning
Income Below Poverty by Sex and Age in Browning
With 39.4% poverty level for males and 40.5% for females among the residents of Browning, 15 year old males and 15 year old females are the most vulnerable to poverty, with 4 males (100.0%) and 6 females (100.0%) in their respective age groups living below the poverty level.
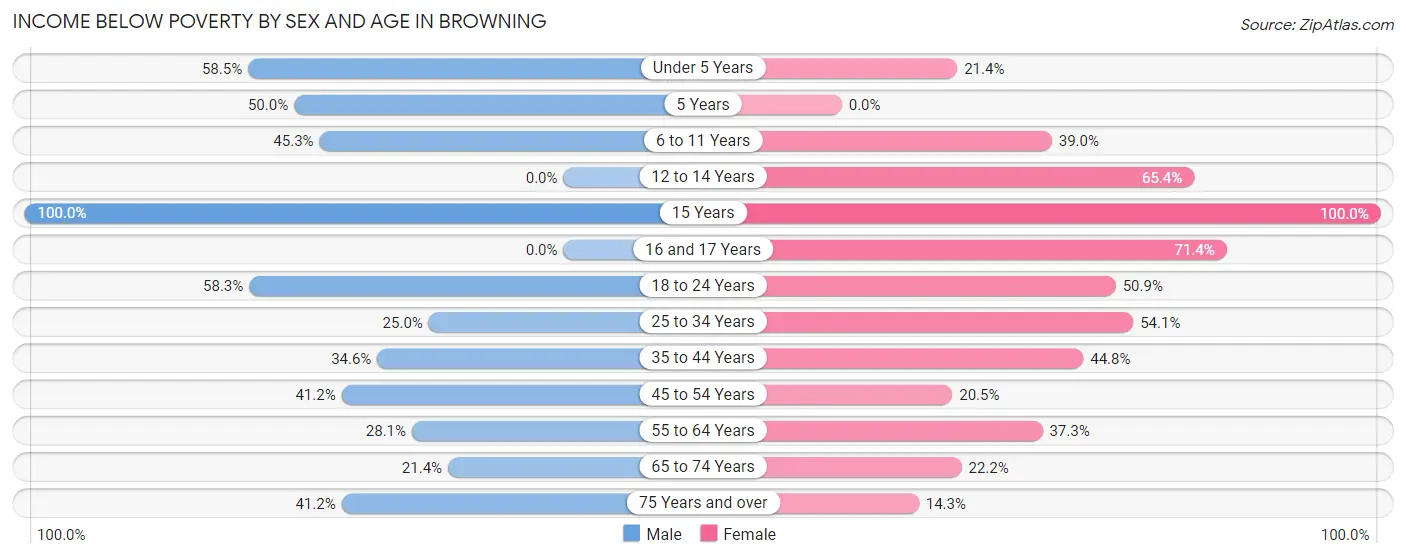
| Age Bracket | Male | Female |
| Under 5 Years | 24 (58.5%) | 6 (21.4%) |
| 5 Years | 5 (50.0%) | 0 (0.0%) |
| 6 to 11 Years | 24 (45.3%) | 23 (39.0%) |
| 12 to 14 Years | 0 (0.0%) | 17 (65.4%) |
| 15 Years | 4 (100.0%) | 6 (100.0%) |
| 16 and 17 Years | 0 (0.0%) | 5 (71.4%) |
| 18 to 24 Years | 35 (58.3%) | 30 (50.8%) |
| 25 to 34 Years | 11 (25.0%) | 33 (54.1%) |
| 35 to 44 Years | 19 (34.5%) | 26 (44.8%) |
| 45 to 54 Years | 21 (41.2%) | 8 (20.5%) |
| 55 to 64 Years | 9 (28.1%) | 19 (37.2%) |
| 65 to 74 Years | 3 (21.4%) | 6 (22.2%) |
| 75 Years and over | 7 (41.2%) | 2 (14.3%) |
| Total | 162 (39.4%) | 181 (40.5%) |
Income Above Poverty by Sex and Age in Browning
According to the poverty statistics in Browning, males aged 12 to 14 years and females aged 5 years are the age groups that are most secure financially, with 100.0% of males and 100.0% of females in these age groups living above the poverty line.
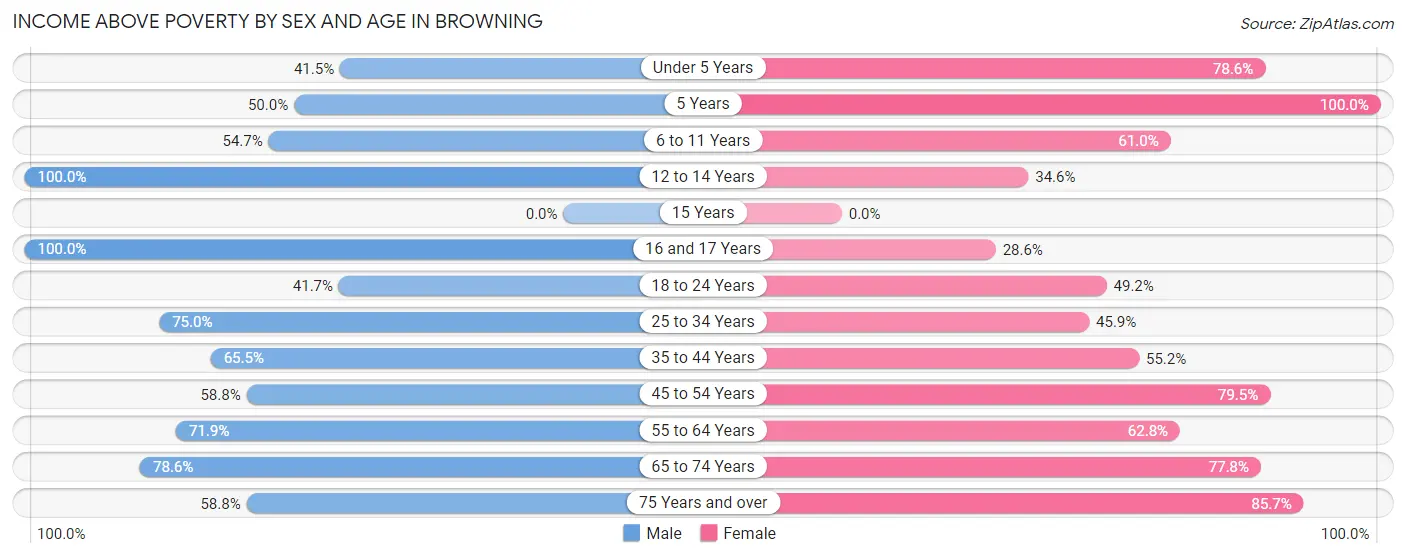
| Age Bracket | Male | Female |
| Under 5 Years | 17 (41.5%) | 22 (78.6%) |
| 5 Years | 5 (50.0%) | 12 (100.0%) |
| 6 to 11 Years | 29 (54.7%) | 36 (61.0%) |
| 12 to 14 Years | 21 (100.0%) | 9 (34.6%) |
| 15 Years | 0 (0.0%) | 0 (0.0%) |
| 16 and 17 Years | 9 (100.0%) | 2 (28.6%) |
| 18 to 24 Years | 25 (41.7%) | 29 (49.1%) |
| 25 to 34 Years | 33 (75.0%) | 28 (45.9%) |
| 35 to 44 Years | 36 (65.4%) | 32 (55.2%) |
| 45 to 54 Years | 30 (58.8%) | 31 (79.5%) |
| 55 to 64 Years | 23 (71.9%) | 32 (62.7%) |
| 65 to 74 Years | 11 (78.6%) | 21 (77.8%) |
| 75 Years and over | 10 (58.8%) | 12 (85.7%) |
| Total | 249 (60.6%) | 266 (59.5%) |
Income Below Poverty Among Married-Couple Families in Browning
The poverty statistics for married-couple families in Browning show that 23.5% or 20 of the total 85 families live below the poverty line. Families with no children have the highest poverty rate of 41.5%, comprising of 17 families. On the other hand, families with 1 or 2 children have the lowest poverty rate of 0.0%, which includes 0 families.
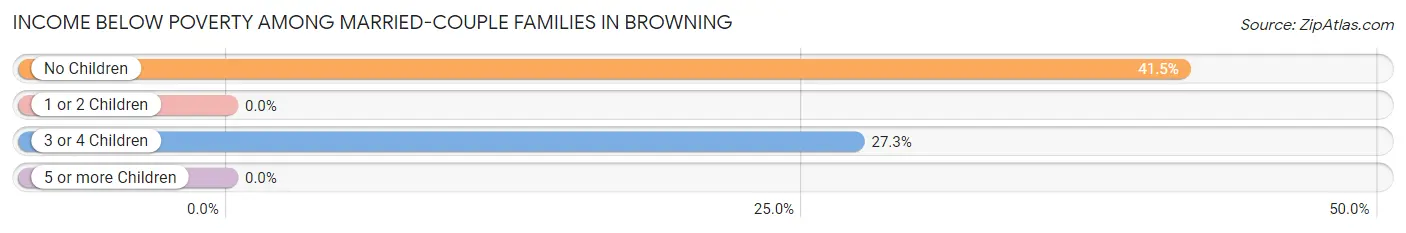
| Children | Above Poverty | Below Poverty |
| No Children | 24 (58.5%) | 17 (41.5%) |
| 1 or 2 Children | 33 (100.0%) | 0 (0.0%) |
| 3 or 4 Children | 8 (72.7%) | 3 (27.3%) |
| 5 or more Children | 0 (0.0%) | 0 (0.0%) |
| Total | 65 (76.5%) | 20 (23.5%) |
Income Below Poverty Among Single-Parent Households in Browning
According to the poverty data in Browning, 45.0% or 9 single-father households and 46.8% or 37 single-mother households are living below the poverty line. Among single-father households, those with 1 or 2 children have the highest poverty rate, with 6 households (66.7%) experiencing poverty. Likewise, among single-mother households, those with 1 or 2 children have the highest poverty rate, with 25 households (47.2%) falling below the poverty line.
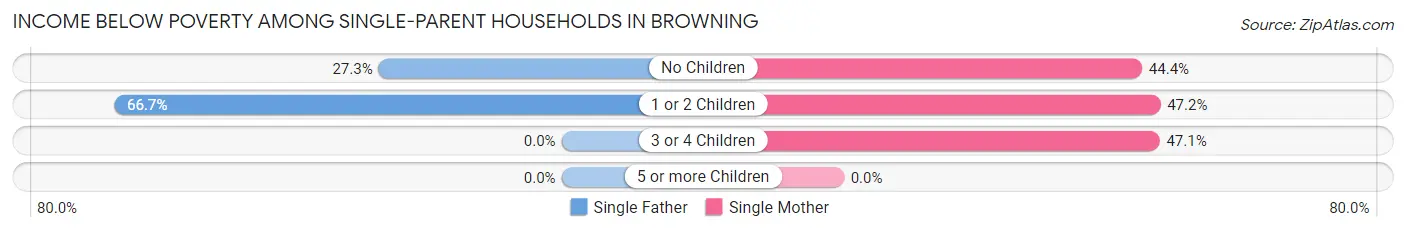
| Children | Single Father | Single Mother |
| No Children | 3 (27.3%) | 4 (44.4%) |
| 1 or 2 Children | 6 (66.7%) | 25 (47.2%) |
| 3 or 4 Children | 0 (0.0%) | 8 (47.1%) |
| 5 or more Children | 0 (0.0%) | 0 (0.0%) |
| Total | 9 (45.0%) | 37 (46.8%) |
Income Below Poverty Among Married-Couple vs Single-Parent Households in Browning
The poverty data for Browning shows that 20 of the married-couple family households (23.5%) and 46 of the single-parent households (46.5%) are living below the poverty level. Within the married-couple family households, those with no children have the highest poverty rate, with 17 households (41.5%) falling below the poverty line. Among the single-parent households, those with 1 or 2 children have the highest poverty rate, with 31 household (50.0%) living below poverty.
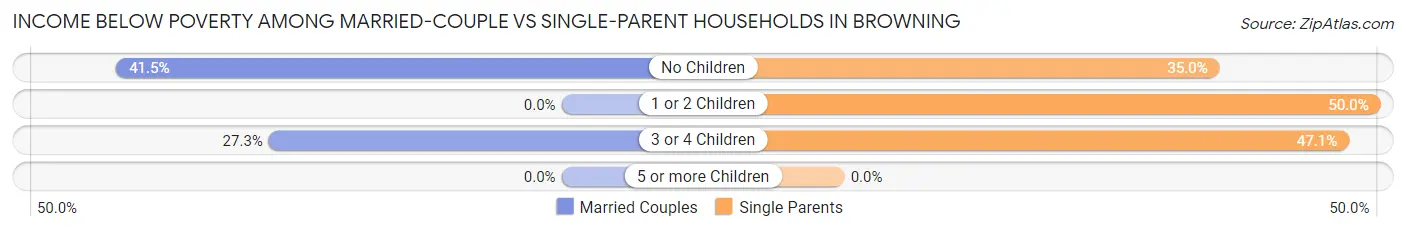
| Children | Married-Couple Families | Single-Parent Households |
| No Children | 17 (41.5%) | 7 (35.0%) |
| 1 or 2 Children | 0 (0.0%) | 31 (50.0%) |
| 3 or 4 Children | 3 (27.3%) | 8 (47.1%) |
| 5 or more Children | 0 (0.0%) | 0 (0.0%) |
| Total | 20 (23.5%) | 46 (46.5%) |
Race in Browning
The most populous races in Browning are Native / Alaskan (834 | 95.8%), White / Caucasian (30 | 3.4%), and Asian (5 | 0.6%).
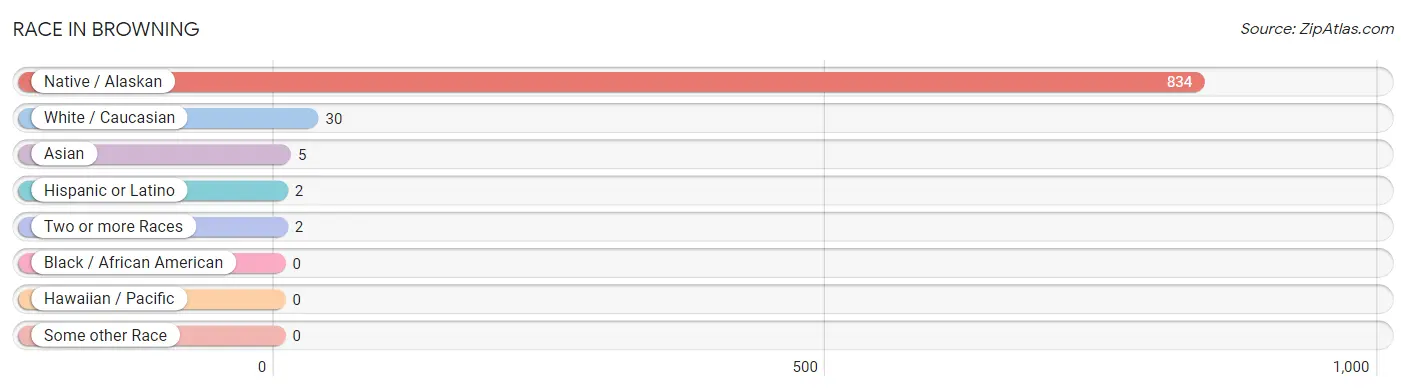
| Race | # Population | % Population |
| Asian | 5 | 0.6% |
| Black / African American | 0 | 0.0% |
| Hawaiian / Pacific | 0 | 0.0% |
| Hispanic or Latino | 2 | 0.2% |
| Native / Alaskan | 834 | 95.8% |
| White / Caucasian | 30 | 3.4% |
| Two or more Races | 2 | 0.2% |
| Some other Race | 0 | 0.0% |
| Total | 871 | 100.0% |
Ancestry in Browning
The most populous ancestries reported in Browning are Blackfeet (746 | 85.7%), Chippewa (24 | 2.8%), Cree (24 | 2.8%), Navajo (21 | 2.4%), and Sioux (21 | 2.4%), together accounting for 96.0% of all Browning residents.
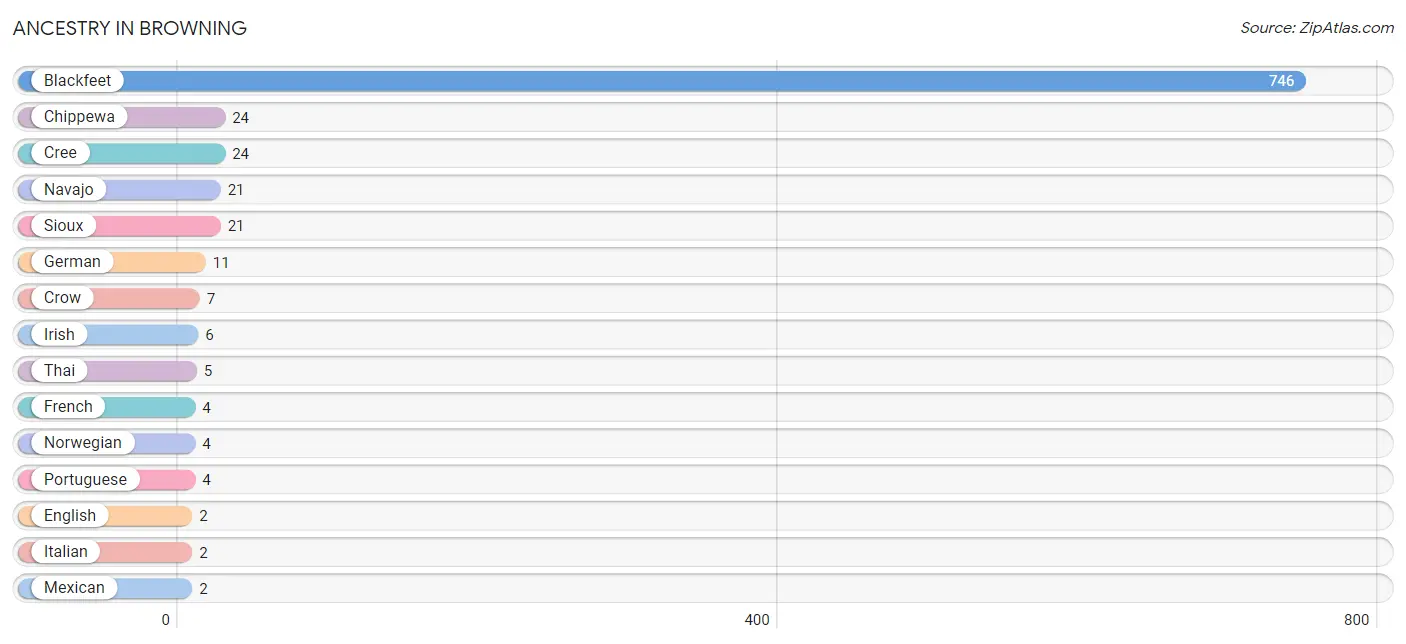
| Ancestry | # Population | % Population |
| Blackfeet | 746 | 85.7% |
| Chippewa | 24 | 2.8% |
| Cree | 24 | 2.8% |
| Crow | 7 | 0.8% |
| English | 2 | 0.2% |
| French | 4 | 0.5% |
| German | 11 | 1.3% |
| Irish | 6 | 0.7% |
| Italian | 2 | 0.2% |
| Mexican | 2 | 0.2% |
| Navajo | 21 | 2.4% |
| Norwegian | 4 | 0.5% |
| Portuguese | 4 | 0.5% |
| Scottish | 2 | 0.2% |
| Sioux | 21 | 2.4% |
| Thai | 5 | 0.6% |
| Tlingit-Haida | 2 | 0.2% | View All 17 Rows |
Immigrants in Browning
The most numerous immigrant groups reported in Browning came from , and Canada (3 | 0.3%), together accounting for 0.3% of all Browning residents.

| Immigration Origin | # Population | % Population |
| Canada | 3 | 0.3% | View All 1 Rows |
Sex and Age in Browning
Sex and Age in Browning
The most populous age groups in Browning are 20 to 24 Years (53 | 12.7%) for men and 20 to 24 Years (54 | 11.9%) for women.
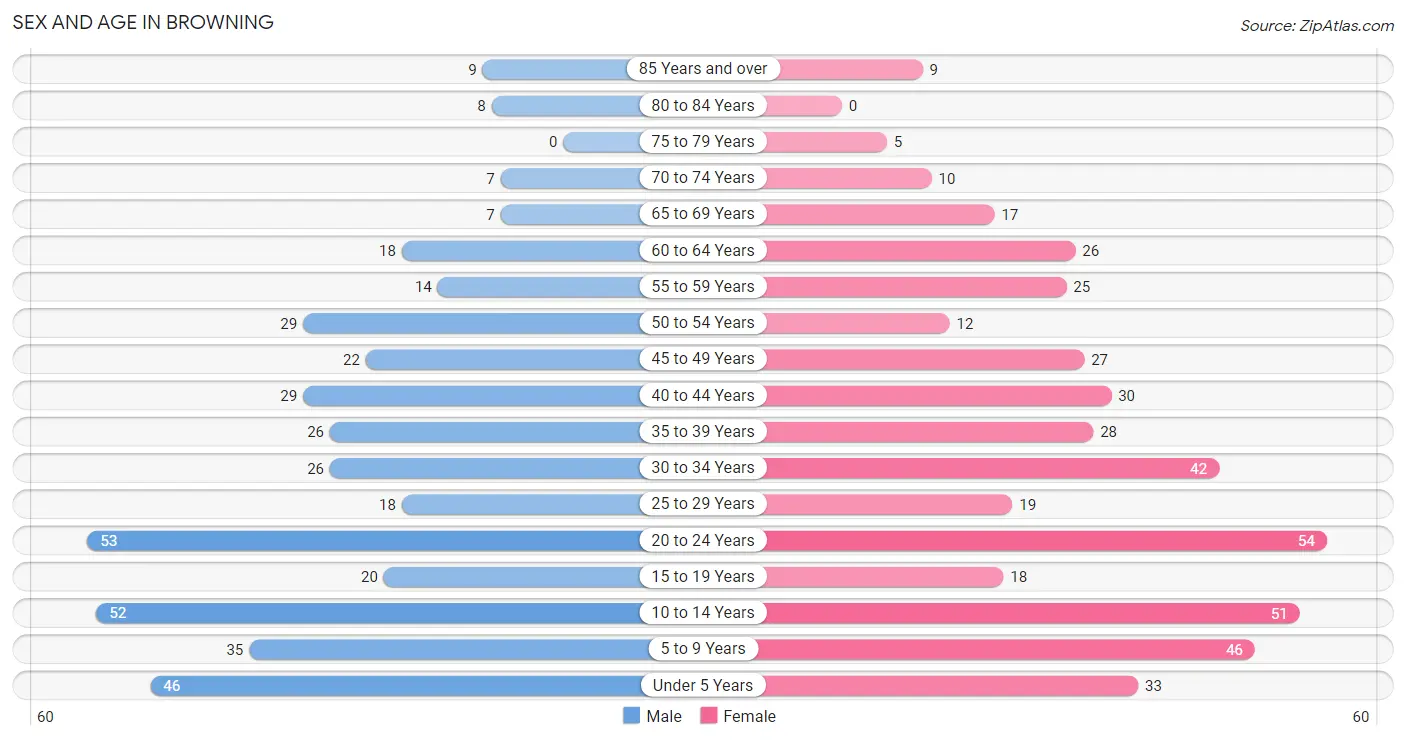
| Age Bracket | Male | Female |
| Under 5 Years | 46 (11.0%) | 33 (7.3%) |
| 5 to 9 Years | 35 (8.4%) | 46 (10.2%) |
| 10 to 14 Years | 52 (12.4%) | 51 (11.3%) |
| 15 to 19 Years | 20 (4.8%) | 18 (4.0%) |
| 20 to 24 Years | 53 (12.7%) | 54 (11.9%) |
| 25 to 29 Years | 18 (4.3%) | 19 (4.2%) |
| 30 to 34 Years | 26 (6.2%) | 42 (9.3%) |
| 35 to 39 Years | 26 (6.2%) | 28 (6.2%) |
| 40 to 44 Years | 29 (6.9%) | 30 (6.6%) |
| 45 to 49 Years | 22 (5.2%) | 27 (6.0%) |
| 50 to 54 Years | 29 (6.9%) | 12 (2.6%) |
| 55 to 59 Years | 14 (3.3%) | 25 (5.5%) |
| 60 to 64 Years | 18 (4.3%) | 26 (5.8%) |
| 65 to 69 Years | 7 (1.7%) | 17 (3.8%) |
| 70 to 74 Years | 7 (1.7%) | 10 (2.2%) |
| 75 to 79 Years | 0 (0.0%) | 5 (1.1%) |
| 80 to 84 Years | 8 (1.9%) | 0 (0.0%) |
| 85 Years and over | 9 (2.1%) | 9 (2.0%) |
| Total | 419 (100.0%) | 452 (100.0%) |
Families and Households in Browning
Median Family Size in Browning
The median family size in Browning is 3.94 persons per family, with single female/mother families (79 | 42.9%) accounting for the largest median family size of 4.16 persons per family. On the other hand, single male/father families (20 | 10.9%) represent the smallest median family size with 3.65 persons per family.
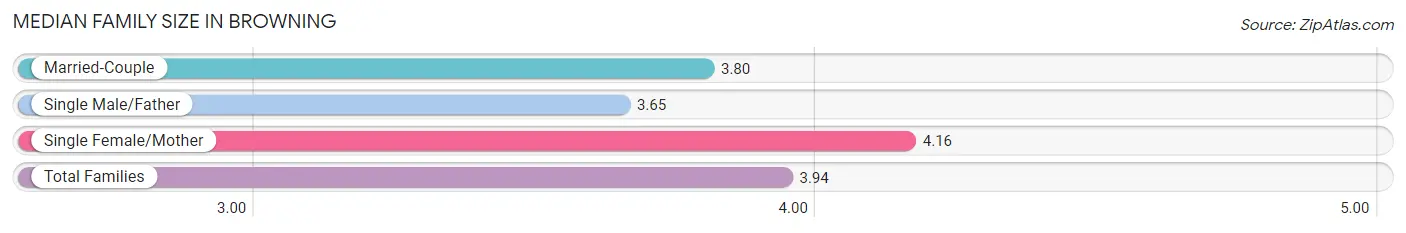
| Family Type | # Families | Family Size |
| Married-Couple | 85 (46.2%) | 3.80 |
| Single Male/Father | 20 (10.9%) | 3.65 |
| Single Female/Mother | 79 (42.9%) | 4.16 |
| Total Families | 184 (100.0%) | 3.94 |
Median Household Size in Browning
The median household size in Browning is 3.09 persons per household, with single female/mother households (79 | 28.0%) accounting for the largest median household size of 4.32 persons per household. non-family households (98 | 34.7%) represent the smallest median household size with 1.09 persons per household.
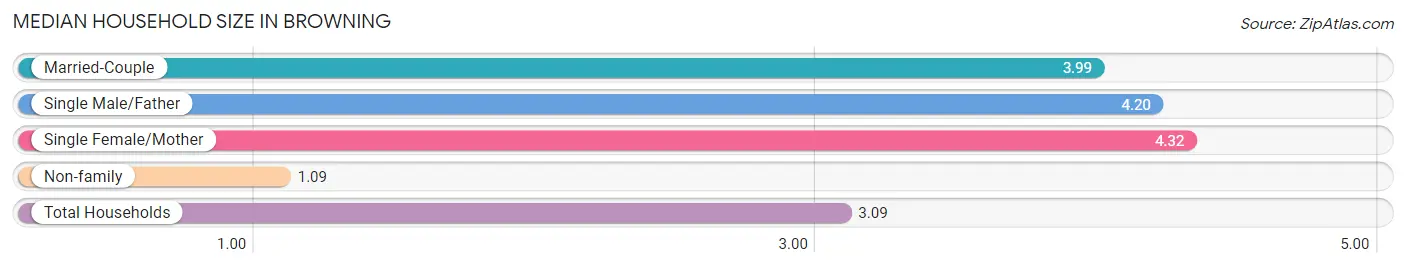
| Household Type | # Households | Household Size |
| Married-Couple | 85 (30.1%) | 3.99 |
| Single Male/Father | 20 (7.1%) | 4.20 |
| Single Female/Mother | 79 (28.0%) | 4.32 |
| Non-family | 98 (34.7%) | 1.09 |
| Total Households | 282 (100.0%) | 3.09 |
Household Size by Marriage Status in Browning
Out of a total of 282 households in Browning, 184 (65.2%) are family households, while 98 (34.7%) are nonfamily households. The most numerous type of family households are 3-person households, comprising 53, and the most common type of nonfamily households are 1-person households, comprising 90.
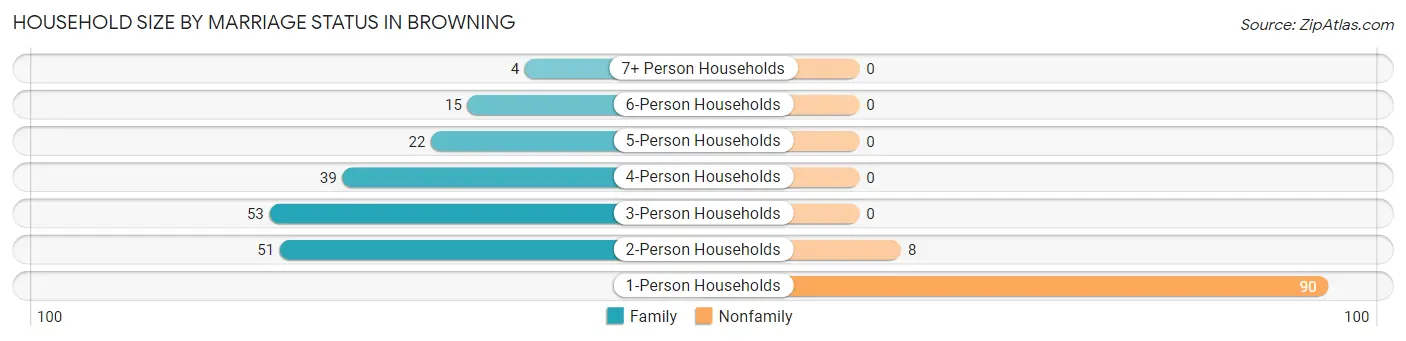
| Household Size | Family Households | Nonfamily Households |
| 1-Person Households | - | 90 (31.9%) |
| 2-Person Households | 51 (18.1%) | 8 (2.8%) |
| 3-Person Households | 53 (18.8%) | 0 (0.0%) |
| 4-Person Households | 39 (13.8%) | 0 (0.0%) |
| 5-Person Households | 22 (7.8%) | 0 (0.0%) |
| 6-Person Households | 15 (5.3%) | 0 (0.0%) |
| 7+ Person Households | 4 (1.4%) | 0 (0.0%) |
| Total | 184 (65.2%) | 98 (34.7%) |
Female Fertility in Browning
Fertility by Age in Browning
Average fertility rate in Browning is 46.0 births per 1,000 women. Women in the age bracket of 20 to 34 years have the highest fertility rate with 87.0 births per 1,000 women. Women in the age bracket of 20 to 34 years acount for 100.0% of all women with births.
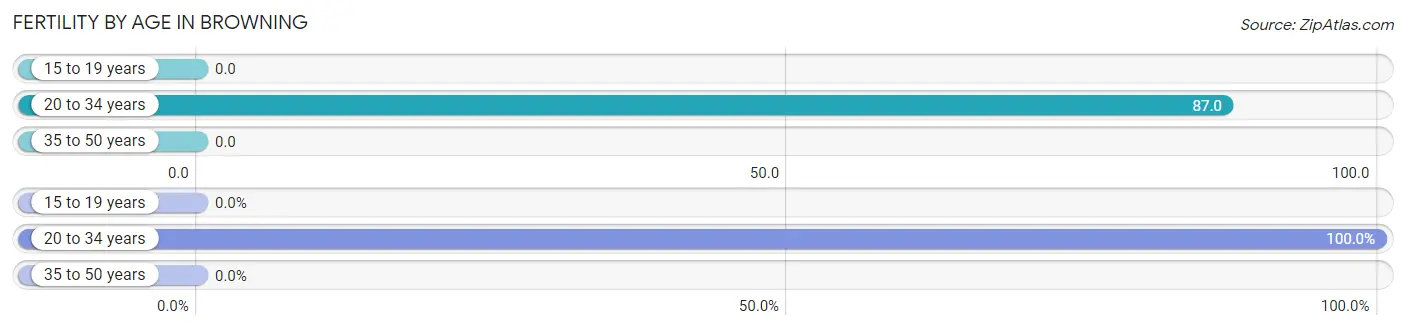
| Age Bracket | Women with Births | Births / 1,000 Women |
| 15 to 19 years | 0 (0.0%) | 0.0 |
| 20 to 34 years | 10 (100.0%) | 87.0 |
| 35 to 50 years | 0 (0.0%) | 0.0 |
| Total | 10 (100.0%) | 46.0 |
Fertility by Age by Marriage Status in Browning
40.0% of women with births (10) in Browning are married. The highest percentage of unmarried women with births falls into 20 to 34 years age bracket with 60.0% of them unmarried at the time of birth, while the lowest percentage of unmarried women with births belong to 20 to 34 years age bracket with 60.0% of them unmarried.
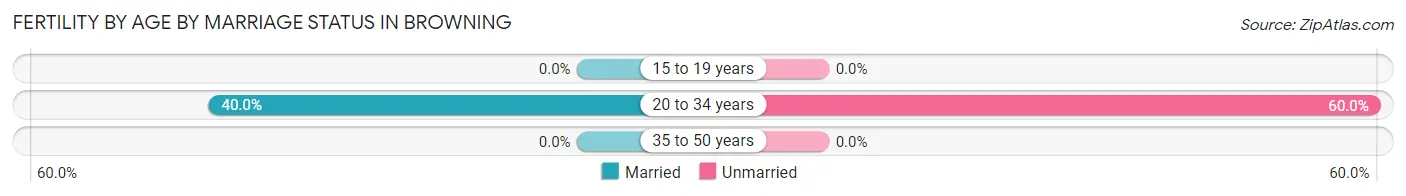
| Age Bracket | Married | Unmarried |
| 15 to 19 years | 0 (0.0%) | 0 (0.0%) |
| 20 to 34 years | 4 (40.0%) | 6 (60.0%) |
| 35 to 50 years | 0 (0.0%) | 0 (0.0%) |
| Total | 4 (40.0%) | 6 (60.0%) |
Fertility by Education in Browning
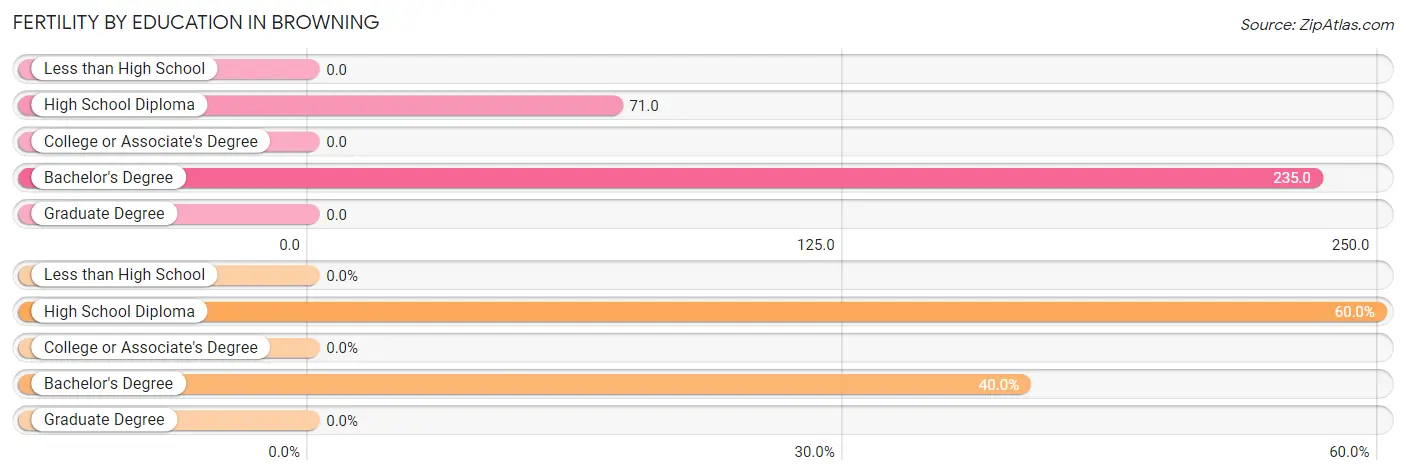
| Educational Attainment | Women with Births | Births / 1,000 Women |
| Less than High School | 0 (0.0%) | 0.0 |
| High School Diploma | 6 (60.0%) | 71.0 |
| College or Associate's Degree | 0 (0.0%) | 0.0 |
| Bachelor's Degree | 4 (40.0%) | 235.0 |
| Graduate Degree | 0 (0.0%) | 0.0 |
| Total | 10 (100.0%) | 46.0 |
Fertility by Education by Marriage Status in Browning
60.0% of women with births in Browning are unmarried. Women with the educational attainment of bachelor's degree are most likely to be married with 100.0% of them married at childbirth, while women with the educational attainment of high school diploma are least likely to be married with 100.0% of them unmarried at childbirth.
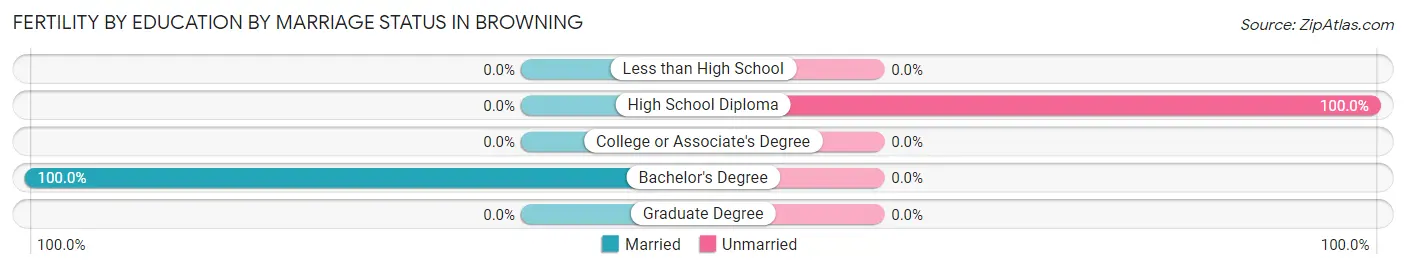
| Educational Attainment | Married | Unmarried |
| Less than High School | 0 (0.0%) | 0 (0.0%) |
| High School Diploma | 0 (0.0%) | 6 (100.0%) |
| College or Associate's Degree | 0 (0.0%) | 0 (0.0%) |
| Bachelor's Degree | 4 (100.0%) | 0 (0.0%) |
| Graduate Degree | 0 (0.0%) | 0 (0.0%) |
| Total | 4 (40.0%) | 6 (60.0%) |
Employment Characteristics in Browning
Employment by Class of Employer in Browning
Among the 300 employed individuals in Browning, private company employees (118 | 39.3%), federal government employees (90 | 30.0%), and local government employees (32 | 10.7%) make up the most common classes of employment.
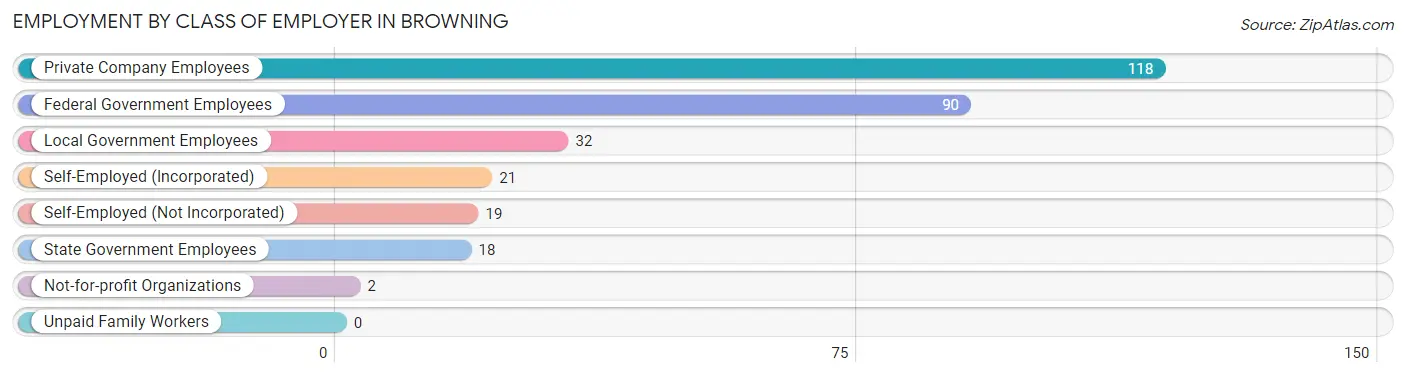
| Employer Class | # Employees | % Employees |
| Private Company Employees | 118 | 39.3% |
| Self-Employed (Incorporated) | 21 | 7.0% |
| Self-Employed (Not Incorporated) | 19 | 6.3% |
| Not-for-profit Organizations | 2 | 0.7% |
| Local Government Employees | 32 | 10.7% |
| State Government Employees | 18 | 6.0% |
| Federal Government Employees | 90 | 30.0% |
| Unpaid Family Workers | 0 | 0.0% |
| Total | 300 | 100.0% |
Employment Status by Age in Browning
According to the labor force statistics for Browning, out of the total population over 16 years of age (598), 60.0% or 359 individuals are in the labor force, with 16.4% or 59 of them unemployed. The age group with the highest labor force participation rate is 55 to 59 years, with 79.5% or 31 individuals in the labor force. Within the labor force, the 20 to 24 years age range has the highest percentage of unemployed individuals, with 31.9% or 23 of them being unemployed.
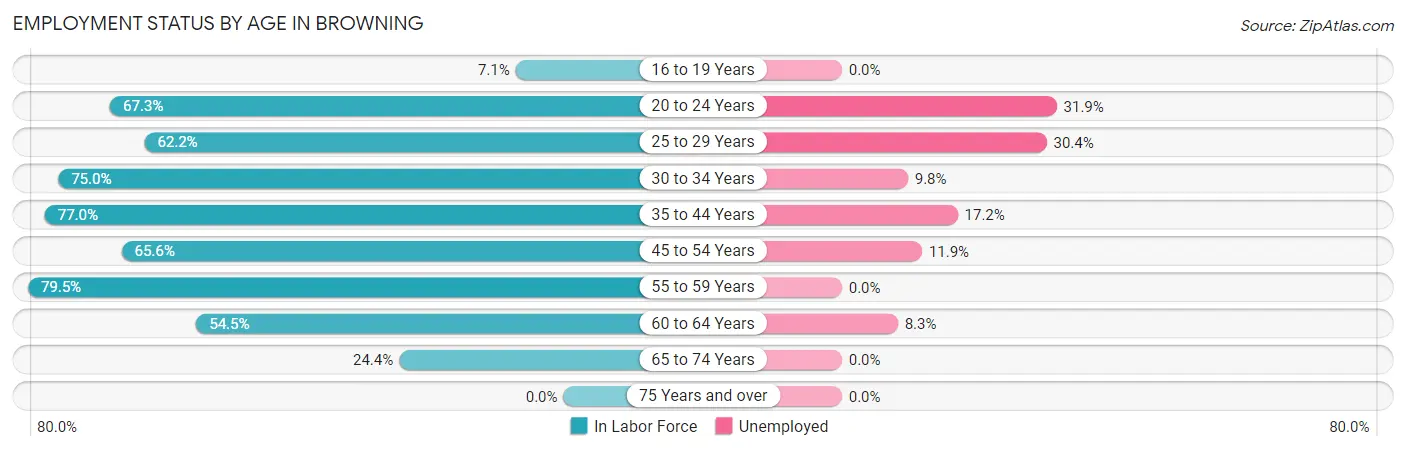
| Age Bracket | In Labor Force | Unemployed |
| 16 to 19 Years | 2 (7.1%) | 0 (0.0%) |
| 20 to 24 Years | 72 (67.3%) | 23 (31.9%) |
| 25 to 29 Years | 23 (62.2%) | 7 (30.4%) |
| 30 to 34 Years | 51 (75.0%) | 5 (9.8%) |
| 35 to 44 Years | 87 (77.0%) | 15 (17.2%) |
| 45 to 54 Years | 59 (65.6%) | 7 (11.9%) |
| 55 to 59 Years | 31 (79.5%) | 0 (0.0%) |
| 60 to 64 Years | 24 (54.5%) | 2 (8.3%) |
| 65 to 74 Years | 10 (24.4%) | 0 (0.0%) |
| 75 Years and over | 0 (0.0%) | 0 (0.0%) |
| Total | 359 (60.0%) | 59 (16.4%) |
Employment Status by Educational Attainment in Browning
According to labor force statistics for Browning, 70.3% of individuals (275) out of the total population between 25 and 64 years of age (391) are in the labor force, with 13.1% or 36 of them being unemployed. The group with the highest labor force participation rate are those with the educational attainment of bachelor's degree or higher, with 100.0% or 56 individuals in the labor force. Within the labor force, individuals with less than high school education have the highest percentage of unemployment, with 20.0% or 6 of them being unemployed.
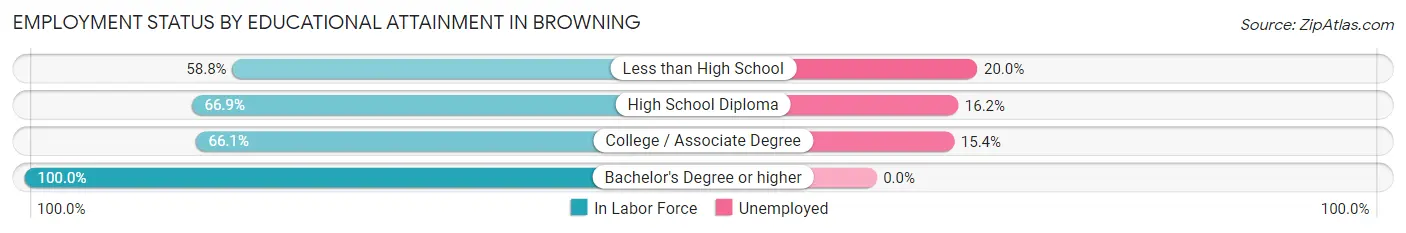
| Educational Attainment | In Labor Force | Unemployed |
| Less than High School | 30 (58.8%) | 10 (20.0%) |
| High School Diploma | 111 (66.9%) | 27 (16.2%) |
| College / Associate Degree | 78 (66.1%) | 18 (15.4%) |
| Bachelor's Degree or higher | 56 (100.0%) | 0 (0.0%) |
| Total | 275 (70.3%) | 51 (13.1%) |
Employment Occupations by Sex in Browning
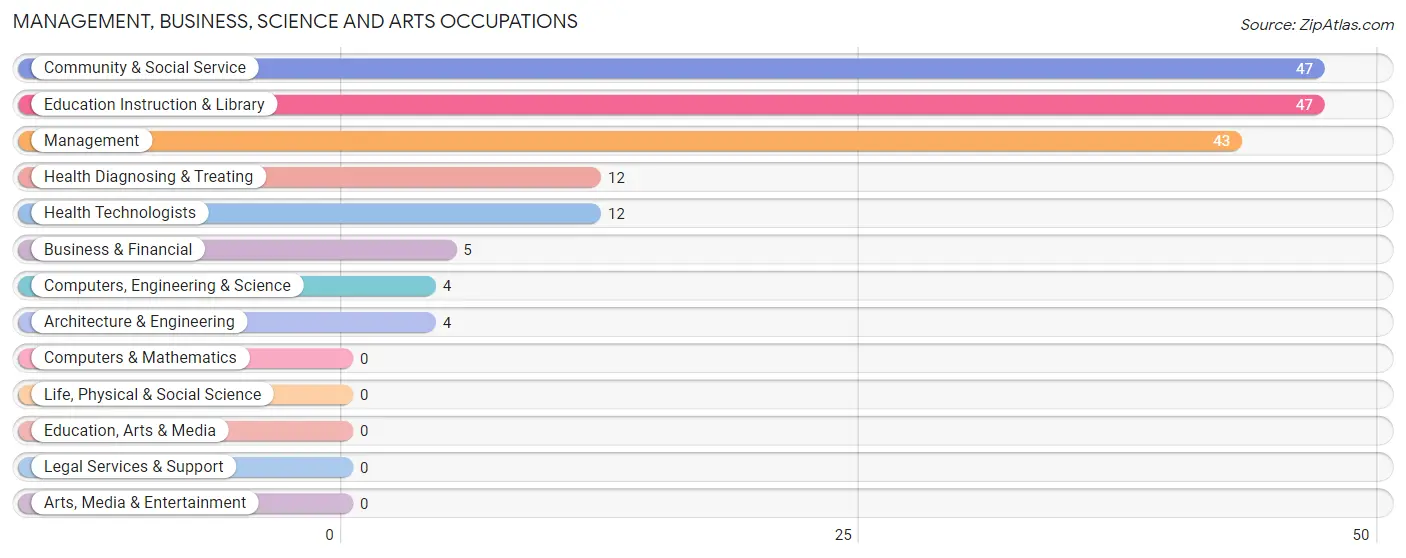
Management, Business, Science and Arts Occupations
The most common Management, Business, Science and Arts occupations in Browning are Community & Social Service (47 | 15.7%), Education Instruction & Library (47 | 15.7%), Management (43 | 14.3%), Health Diagnosing & Treating (12 | 4.0%), and Health Technologists (12 | 4.0%).
Management, Business, Science and Arts Occupations by Sex
Within the Management, Business, Science and Arts occupations in Browning, the most male-oriented occupations are Computers, Engineering & Science (100.0%), Architecture & Engineering (100.0%), and Management (67.4%), while the most female-oriented occupations are Business & Financial (100.0%), Health Diagnosing & Treating (100.0%), and Health Technologists (100.0%).
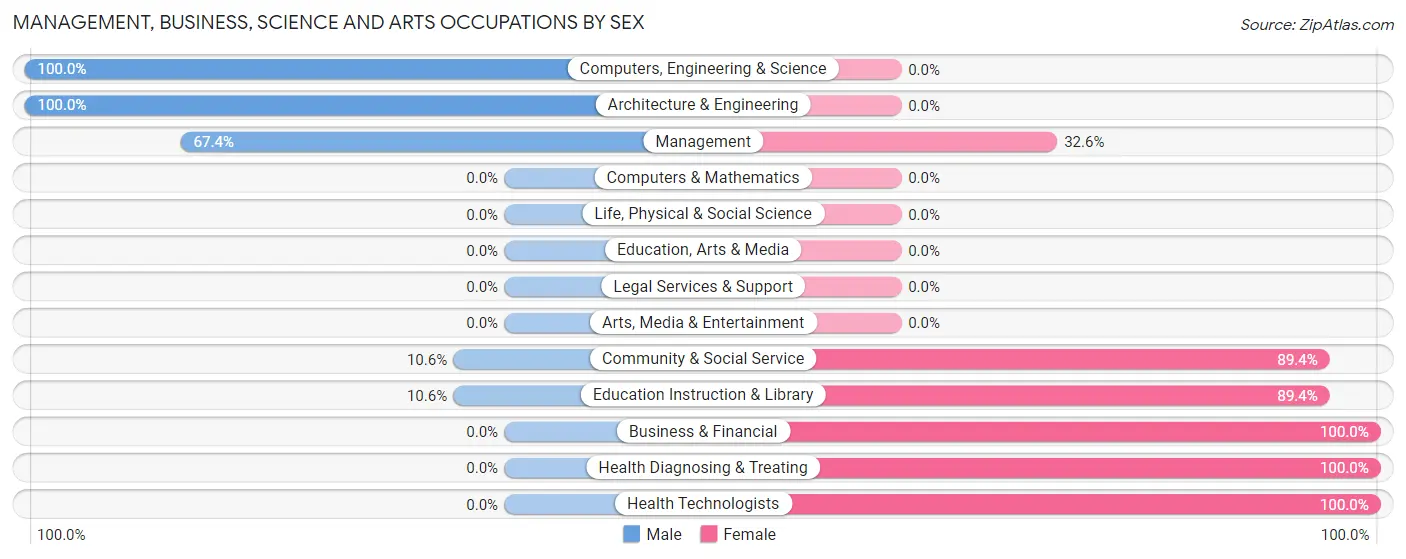
| Occupation | Male | Female |
| Management | 29 (67.4%) | 14 (32.6%) |
| Business & Financial | 0 (0.0%) | 5 (100.0%) |
| Computers, Engineering & Science | 4 (100.0%) | 0 (0.0%) |
| Computers & Mathematics | 0 (0.0%) | 0 (0.0%) |
| Architecture & Engineering | 4 (100.0%) | 0 (0.0%) |
| Life, Physical & Social Science | 0 (0.0%) | 0 (0.0%) |
| Community & Social Service | 5 (10.6%) | 42 (89.4%) |
| Education, Arts & Media | 0 (0.0%) | 0 (0.0%) |
| Legal Services & Support | 0 (0.0%) | 0 (0.0%) |
| Education Instruction & Library | 5 (10.6%) | 42 (89.4%) |
| Arts, Media & Entertainment | 0 (0.0%) | 0 (0.0%) |
| Health Diagnosing & Treating | 0 (0.0%) | 12 (100.0%) |
| Health Technologists | 0 (0.0%) | 12 (100.0%) |
| Total (Category) | 38 (34.2%) | 73 (65.8%) |
| Total (Overall) | 138 (46.0%) | 162 (54.0%) |
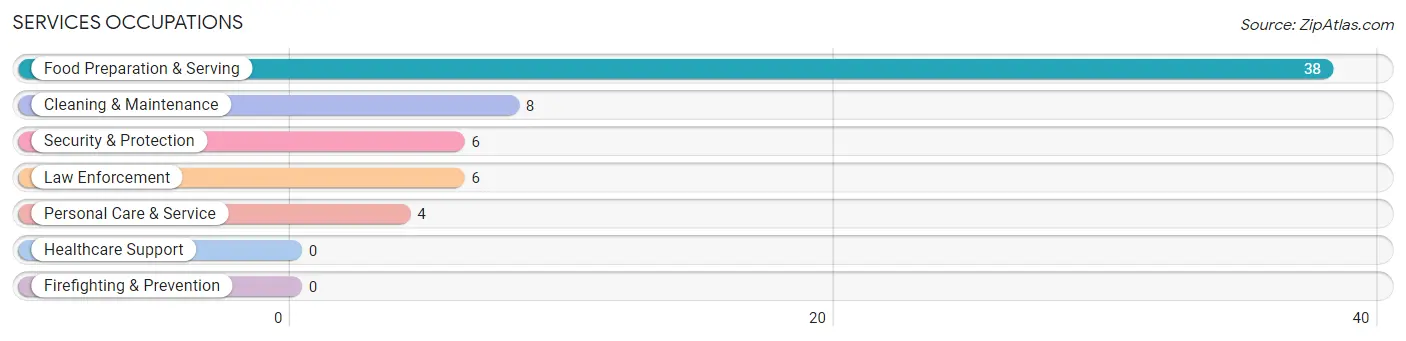
Services Occupations
The most common Services occupations in Browning are Food Preparation & Serving (38 | 12.7%), Cleaning & Maintenance (8 | 2.7%), Security & Protection (6 | 2.0%), Law Enforcement (6 | 2.0%), and Personal Care & Service (4 | 1.3%).
Services Occupations by Sex
Within the Services occupations in Browning, the most male-oriented occupations are Cleaning & Maintenance (100.0%), Security & Protection (66.7%), and Law Enforcement (66.7%), while the most female-oriented occupations are Personal Care & Service (100.0%), Food Preparation & Serving (36.8%), and Security & Protection (33.3%).
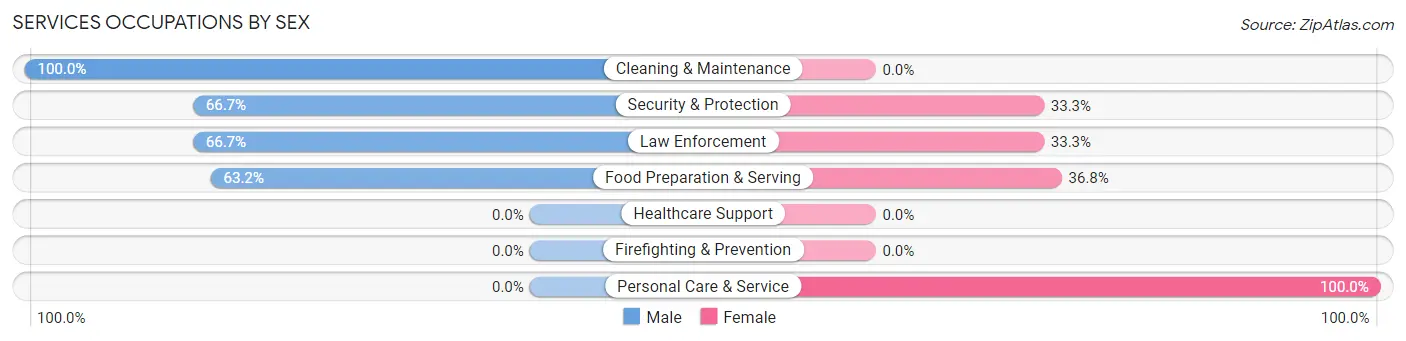
| Occupation | Male | Female |
| Healthcare Support | 0 (0.0%) | 0 (0.0%) |
| Security & Protection | 4 (66.7%) | 2 (33.3%) |
| Firefighting & Prevention | 0 (0.0%) | 0 (0.0%) |
| Law Enforcement | 4 (66.7%) | 2 (33.3%) |
| Food Preparation & Serving | 24 (63.2%) | 14 (36.8%) |
| Cleaning & Maintenance | 8 (100.0%) | 0 (0.0%) |
| Personal Care & Service | 0 (0.0%) | 4 (100.0%) |
| Total (Category) | 36 (64.3%) | 20 (35.7%) |
| Total (Overall) | 138 (46.0%) | 162 (54.0%) |
Sales and Office Occupations
The most common Sales and Office occupations in Browning are Sales & Related (50 | 16.7%), and Office & Administration (27 | 9.0%).
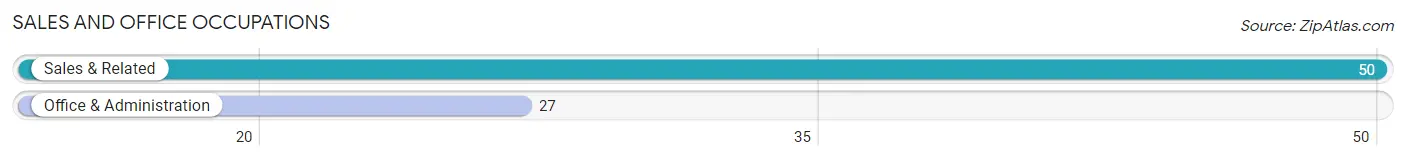
Sales and Office Occupations by Sex
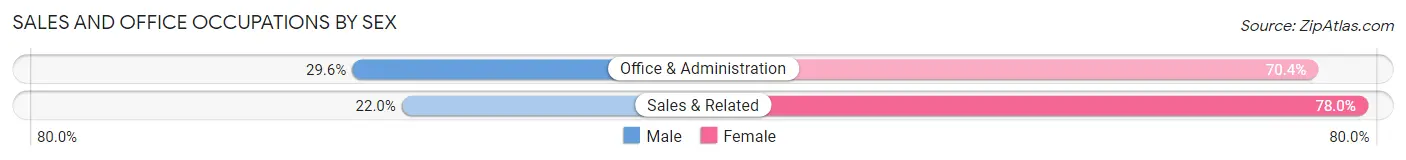
| Occupation | Male | Female |
| Sales & Related | 11 (22.0%) | 39 (78.0%) |
| Office & Administration | 8 (29.6%) | 19 (70.4%) |
| Total (Category) | 19 (24.7%) | 58 (75.3%) |
| Total (Overall) | 138 (46.0%) | 162 (54.0%) |
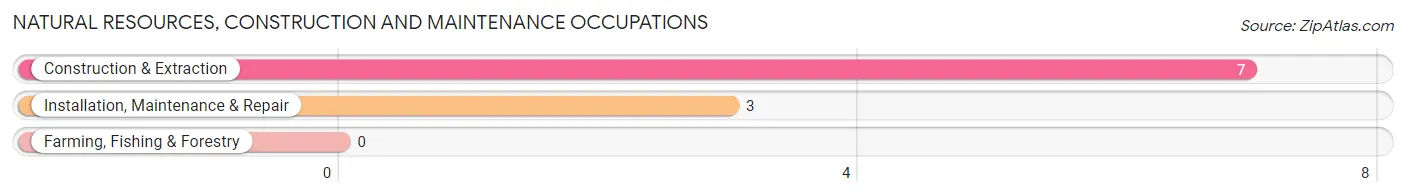
Natural Resources, Construction and Maintenance Occupations
The most common Natural Resources, Construction and Maintenance occupations in Browning are Construction & Extraction (7 | 2.3%), and Installation, Maintenance & Repair (3 | 1.0%).
Natural Resources, Construction and Maintenance Occupations by Sex
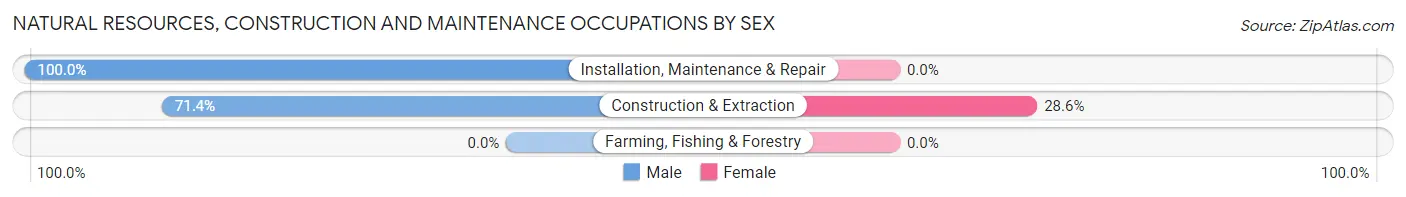
| Occupation | Male | Female |
| Farming, Fishing & Forestry | 0 (0.0%) | 0 (0.0%) |
| Construction & Extraction | 5 (71.4%) | 2 (28.6%) |
| Installation, Maintenance & Repair | 3 (100.0%) | 0 (0.0%) |
| Total (Category) | 8 (80.0%) | 2 (20.0%) |
| Total (Overall) | 138 (46.0%) | 162 (54.0%) |
Production, Transportation and Moving Occupations
The most common Production, Transportation and Moving occupations in Browning are Material Moving (33 | 11.0%), Transportation (12 | 4.0%), and Production (1 | 0.3%).
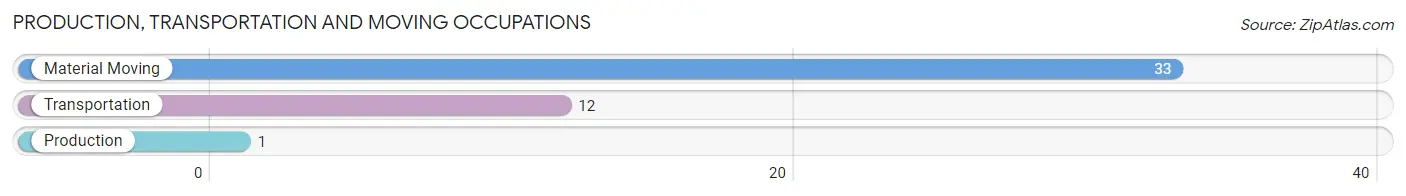
Production, Transportation and Moving Occupations by Sex
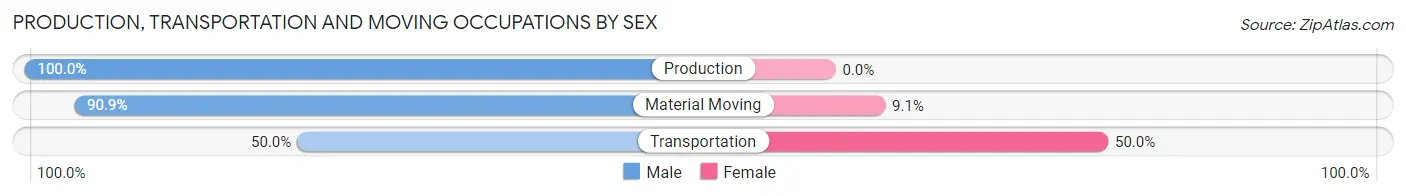
| Occupation | Male | Female |
| Production | 1 (100.0%) | 0 (0.0%) |
| Transportation | 6 (50.0%) | 6 (50.0%) |
| Material Moving | 30 (90.9%) | 3 (9.1%) |
| Total (Category) | 37 (80.4%) | 9 (19.6%) |
| Total (Overall) | 138 (46.0%) | 162 (54.0%) |
Employment Industries by Sex in Browning
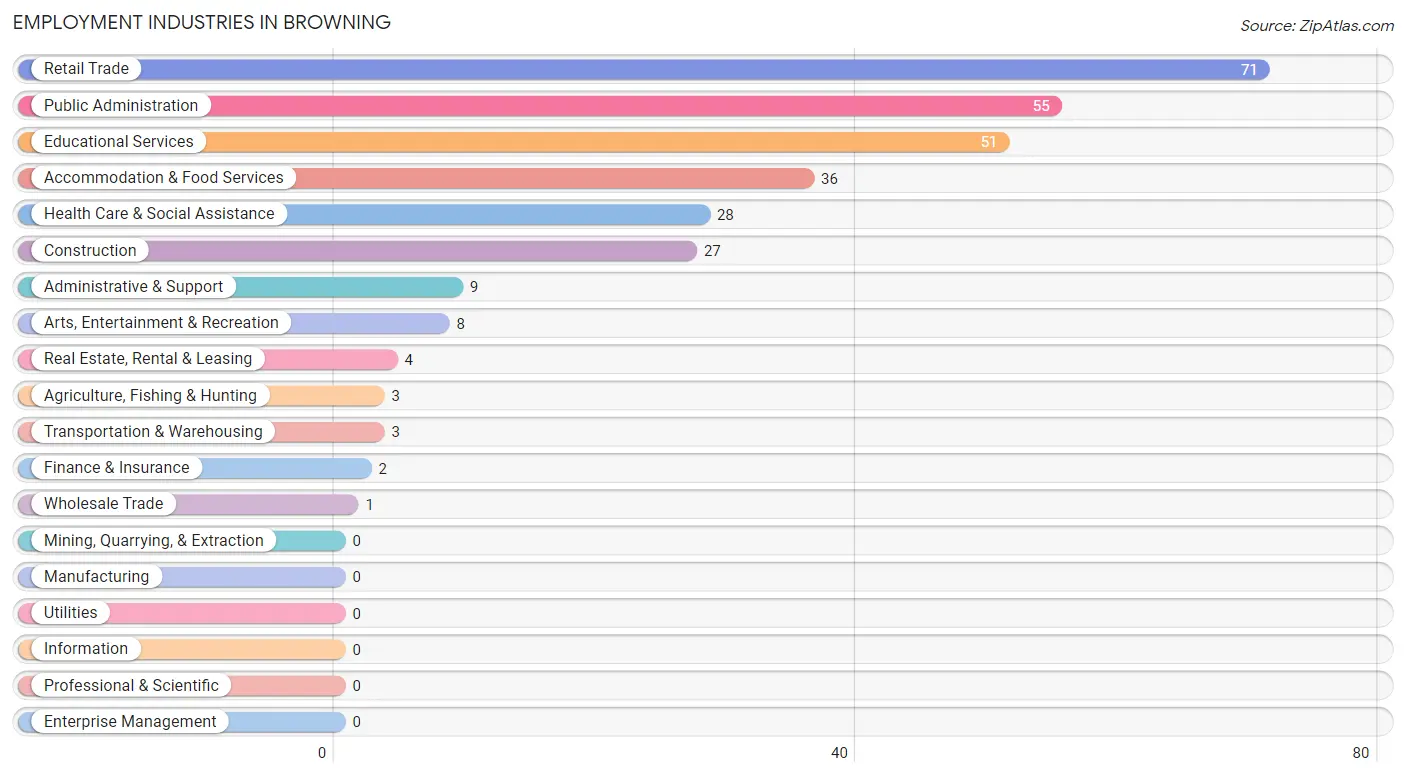
Employment Industries in Browning
The major employment industries in Browning include Retail Trade (71 | 23.7%), Public Administration (55 | 18.3%), Educational Services (51 | 17.0%), Accommodation & Food Services (36 | 12.0%), and Health Care & Social Assistance (28 | 9.3%).
Employment Industries by Sex in Browning
The Browning industries that see more men than women are Wholesale Trade (100.0%), Transportation & Warehousing (100.0%), and Real Estate, Rental & Leasing (100.0%), whereas the industries that tend to have a higher number of women are Agriculture, Fishing & Hunting (100.0%), Finance & Insurance (100.0%), and Health Care & Social Assistance (100.0%).
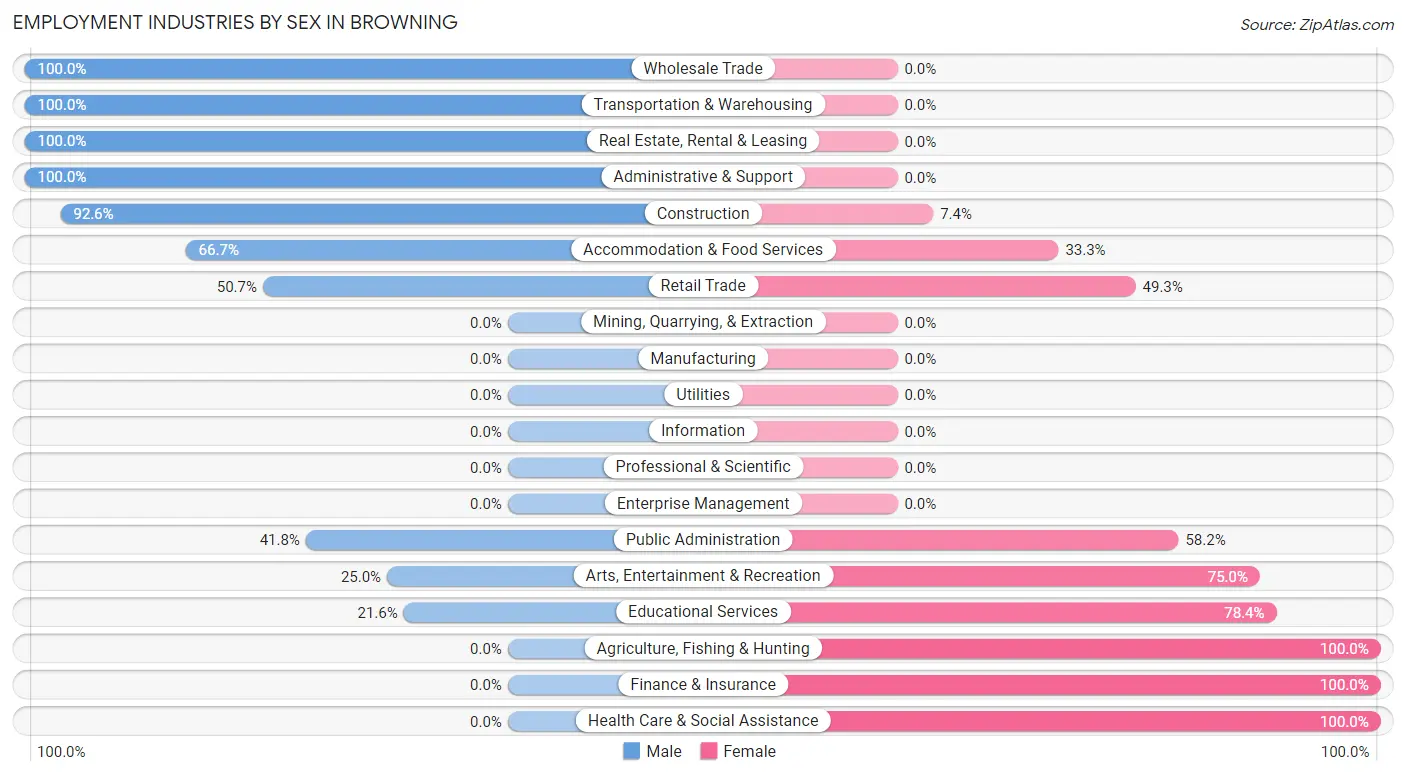
| Industry | Male | Female |
| Agriculture, Fishing & Hunting | 0 (0.0%) | 3 (100.0%) |
| Mining, Quarrying, & Extraction | 0 (0.0%) | 0 (0.0%) |
| Construction | 25 (92.6%) | 2 (7.4%) |
| Manufacturing | 0 (0.0%) | 0 (0.0%) |
| Wholesale Trade | 1 (100.0%) | 0 (0.0%) |
| Retail Trade | 36 (50.7%) | 35 (49.3%) |
| Transportation & Warehousing | 3 (100.0%) | 0 (0.0%) |
| Utilities | 0 (0.0%) | 0 (0.0%) |
| Information | 0 (0.0%) | 0 (0.0%) |
| Finance & Insurance | 0 (0.0%) | 2 (100.0%) |
| Real Estate, Rental & Leasing | 4 (100.0%) | 0 (0.0%) |
| Professional & Scientific | 0 (0.0%) | 0 (0.0%) |
| Enterprise Management | 0 (0.0%) | 0 (0.0%) |
| Administrative & Support | 9 (100.0%) | 0 (0.0%) |
| Educational Services | 11 (21.6%) | 40 (78.4%) |
| Health Care & Social Assistance | 0 (0.0%) | 28 (100.0%) |
| Arts, Entertainment & Recreation | 2 (25.0%) | 6 (75.0%) |
| Accommodation & Food Services | 24 (66.7%) | 12 (33.3%) |
| Public Administration | 23 (41.8%) | 32 (58.2%) |
| Total | 138 (46.0%) | 162 (54.0%) |
Education in Browning
School Enrollment in Browning
The most common levels of schooling among the 249 students in Browning are middle school (73 | 29.3%), elementary school (47 | 18.9%), and high school (47 | 18.9%).
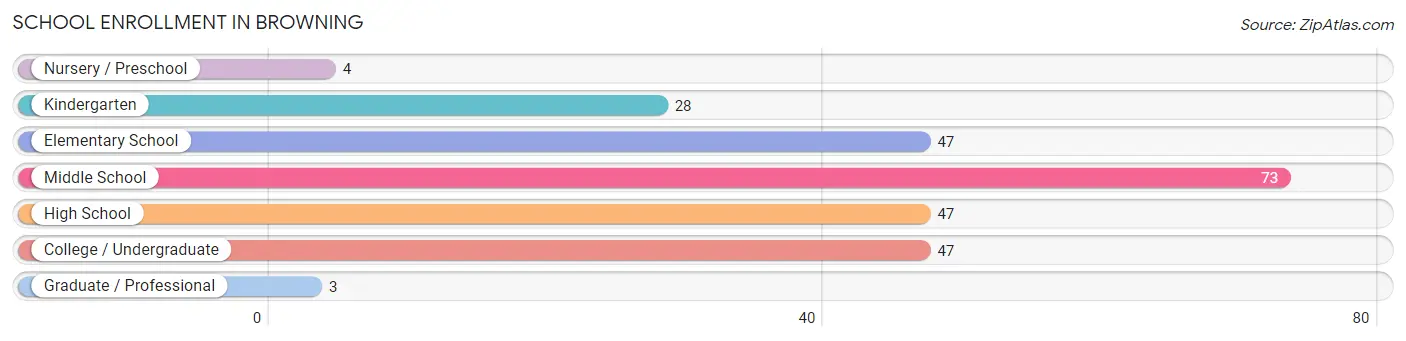
| School Level | # Students | % Students |
| Nursery / Preschool | 4 | 1.6% |
| Kindergarten | 28 | 11.2% |
| Elementary School | 47 | 18.9% |
| Middle School | 73 | 29.3% |
| High School | 47 | 18.9% |
| College / Undergraduate | 47 | 18.9% |
| Graduate / Professional | 3 | 1.2% |
| Total | 249 | 100.0% |
School Enrollment by Age by Funding Source in Browning
Out of a total of 249 students who are enrolled in schools in Browning, 10 (4.0%) attend a private institution, while the remaining 239 (96.0%) are enrolled in public schools. The age group of 20 to 24 year olds has the highest likelihood of being enrolled in private schools, with 8 (32.0% in the age bracket) enrolled. Conversely, the age group of 5 to 9 year old has the lowest likelihood of being enrolled in a private school, with 76 (100.0% in the age bracket) attending a public institution.
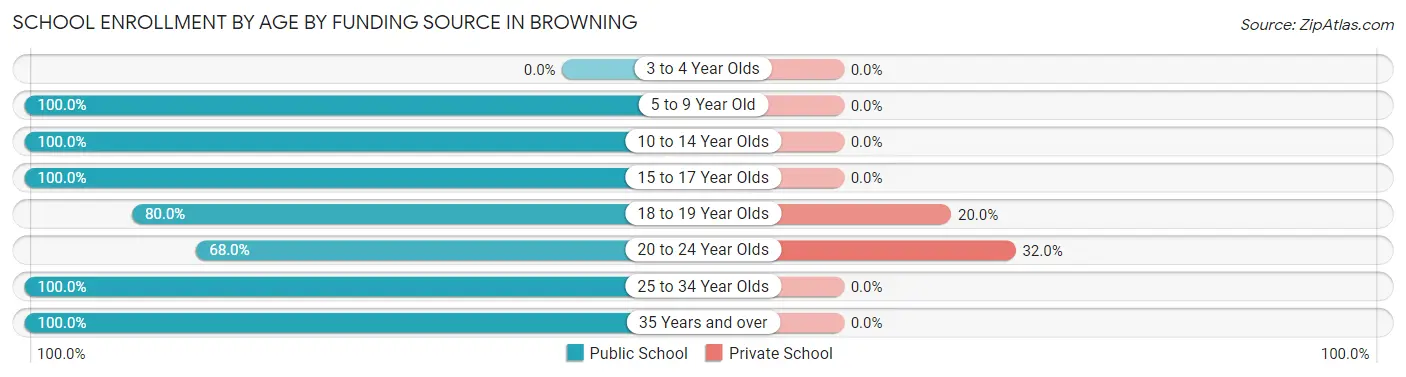
| Age Bracket | Public School | Private School |
| 3 to 4 Year Olds | 0 (0.0%) | 0 (0.0%) |
| 5 to 9 Year Old | 76 (100.0%) | 0 (0.0%) |
| 10 to 14 Year Olds | 92 (100.0%) | 0 (0.0%) |
| 15 to 17 Year Olds | 26 (100.0%) | 0 (0.0%) |
| 18 to 19 Year Olds | 8 (80.0%) | 2 (20.0%) |
| 20 to 24 Year Olds | 17 (68.0%) | 8 (32.0%) |
| 25 to 34 Year Olds | 12 (100.0%) | 0 (0.0%) |
| 35 Years and over | 8 (100.0%) | 0 (0.0%) |
| Total | 239 (96.0%) | 10 (4.0%) |
Educational Attainment by Field of Study in Browning
Education (40 | 49.4%), science & technology (11 | 13.6%), business (5 | 6.2%), physical & health sciences (4 | 4.9%), and psychology (4 | 4.9%) are the most common fields of study among 81 individuals in Browning who have obtained a bachelor's degree or higher.
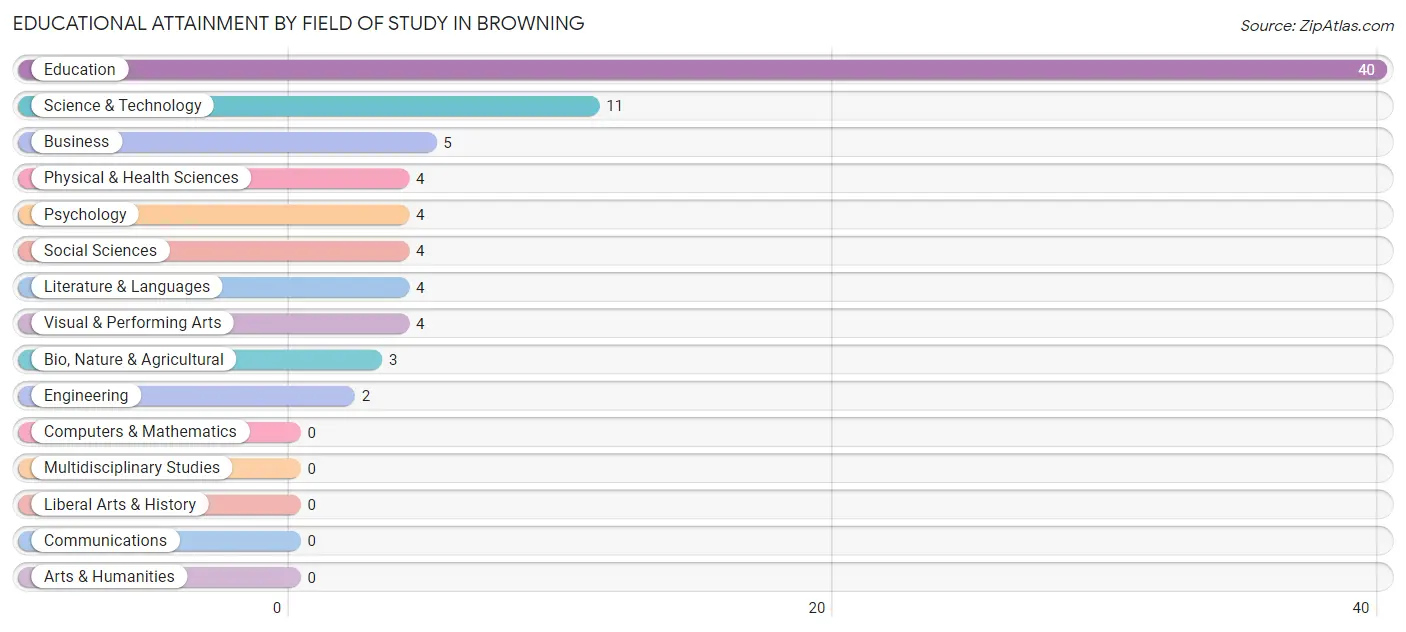
| Field of Study | # Graduates | % Graduates |
| Computers & Mathematics | 0 | 0.0% |
| Bio, Nature & Agricultural | 3 | 3.7% |
| Physical & Health Sciences | 4 | 4.9% |
| Psychology | 4 | 4.9% |
| Social Sciences | 4 | 4.9% |
| Engineering | 2 | 2.5% |
| Multidisciplinary Studies | 0 | 0.0% |
| Science & Technology | 11 | 13.6% |
| Business | 5 | 6.2% |
| Education | 40 | 49.4% |
| Literature & Languages | 4 | 4.9% |
| Liberal Arts & History | 0 | 0.0% |
| Visual & Performing Arts | 4 | 4.9% |
| Communications | 0 | 0.0% |
| Arts & Humanities | 0 | 0.0% |
| Total | 81 | 100.0% |
Transportation & Commute in Browning
Vehicle Availability by Sex in Browning
The most prevalent vehicle ownership categories in Browning are males with 2 vehicles (53, accounting for 38.4%) and females with 2 vehicles (52, making up 32.7%).
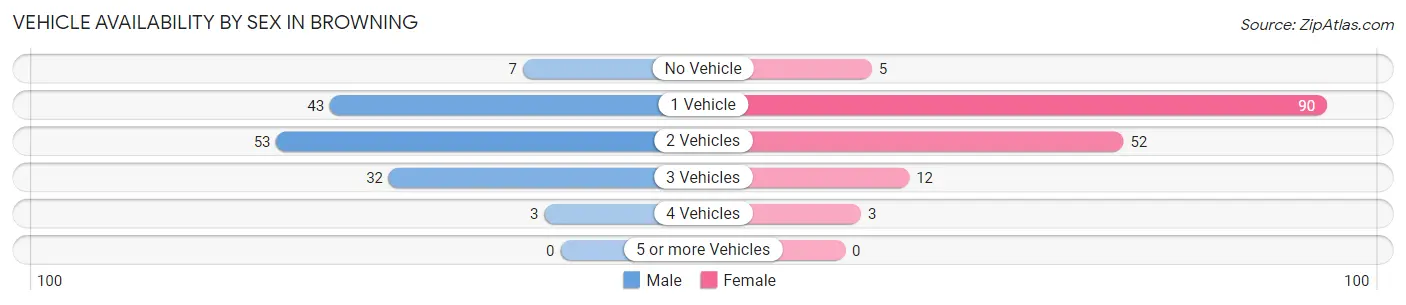
| Vehicles Available | Male | Female |
| No Vehicle | 7 (5.1%) | 5 (3.1%) |
| 1 Vehicle | 43 (31.2%) | 90 (55.6%) |
| 2 Vehicles | 53 (38.4%) | 52 (32.1%) |
| 3 Vehicles | 32 (23.2%) | 12 (7.4%) |
| 4 Vehicles | 3 (2.2%) | 3 (1.8%) |
| 5 or more Vehicles | 0 (0.0%) | 0 (0.0%) |
| Total | 138 (100.0%) | 162 (100.0%) |
Commute Time in Browning
The most frequently occuring commute durations in Browning are 10 to 14 minutes (104 commuters, 37.0%), 5 to 9 minutes (40 commuters, 14.2%), and 15 to 19 minutes (38 commuters, 13.5%).
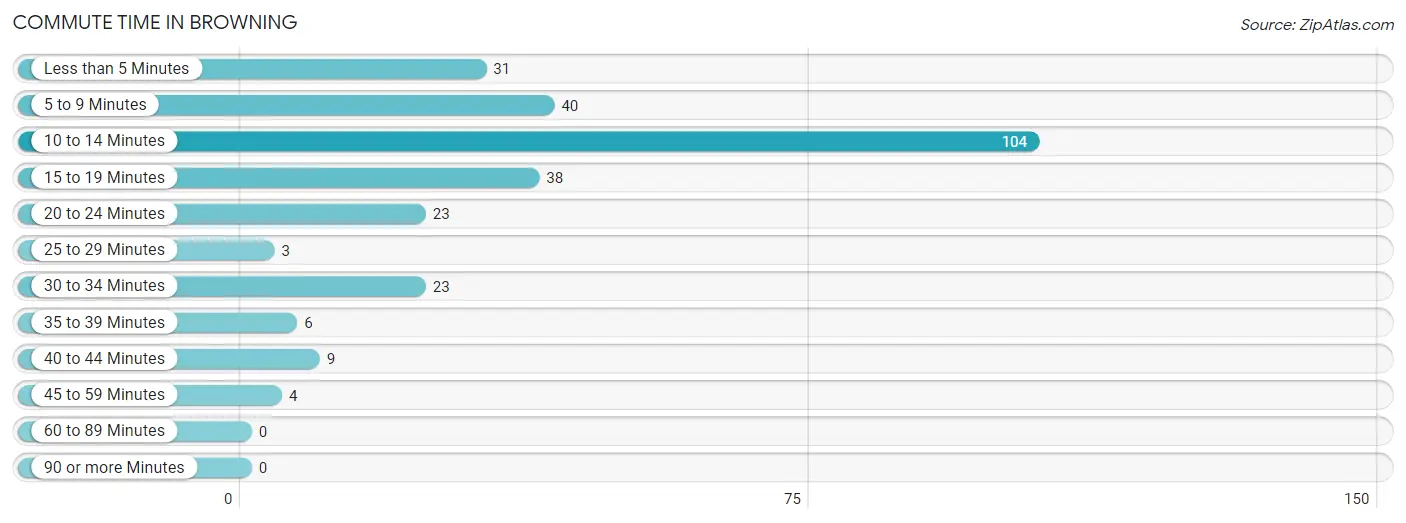
| Commute Time | # Commuters | % Commuters |
| Less than 5 Minutes | 31 | 11.0% |
| 5 to 9 Minutes | 40 | 14.2% |
| 10 to 14 Minutes | 104 | 37.0% |
| 15 to 19 Minutes | 38 | 13.5% |
| 20 to 24 Minutes | 23 | 8.2% |
| 25 to 29 Minutes | 3 | 1.1% |
| 30 to 34 Minutes | 23 | 8.2% |
| 35 to 39 Minutes | 6 | 2.1% |
| 40 to 44 Minutes | 9 | 3.2% |
| 45 to 59 Minutes | 4 | 1.4% |
| 60 to 89 Minutes | 0 | 0.0% |
| 90 or more Minutes | 0 | 0.0% |
Commute Time by Sex in Browning
The most common commute times in Browning are 10 to 14 minutes (54 commuters, 42.5%) for males and 10 to 14 minutes (50 commuters, 32.5%) for females.
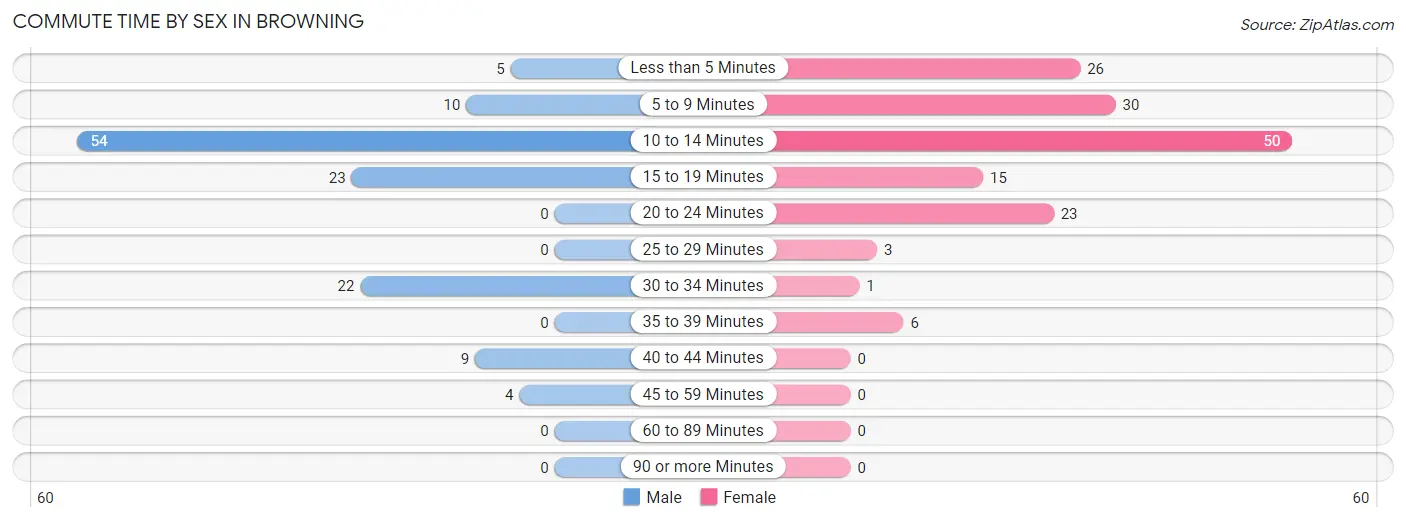
| Commute Time | Male | Female |
| Less than 5 Minutes | 5 (3.9%) | 26 (16.9%) |
| 5 to 9 Minutes | 10 (7.9%) | 30 (19.5%) |
| 10 to 14 Minutes | 54 (42.5%) | 50 (32.5%) |
| 15 to 19 Minutes | 23 (18.1%) | 15 (9.7%) |
| 20 to 24 Minutes | 0 (0.0%) | 23 (14.9%) |
| 25 to 29 Minutes | 0 (0.0%) | 3 (1.9%) |
| 30 to 34 Minutes | 22 (17.3%) | 1 (0.6%) |
| 35 to 39 Minutes | 0 (0.0%) | 6 (3.9%) |
| 40 to 44 Minutes | 9 (7.1%) | 0 (0.0%) |
| 45 to 59 Minutes | 4 (3.2%) | 0 (0.0%) |
| 60 to 89 Minutes | 0 (0.0%) | 0 (0.0%) |
| 90 or more Minutes | 0 (0.0%) | 0 (0.0%) |
Time of Departure to Work by Sex in Browning
The most frequent times of departure to work in Browning are 8:00 AM to 8:29 AM (31, 24.4%) for males and 7:30 AM to 7:59 AM (56, 36.4%) for females.
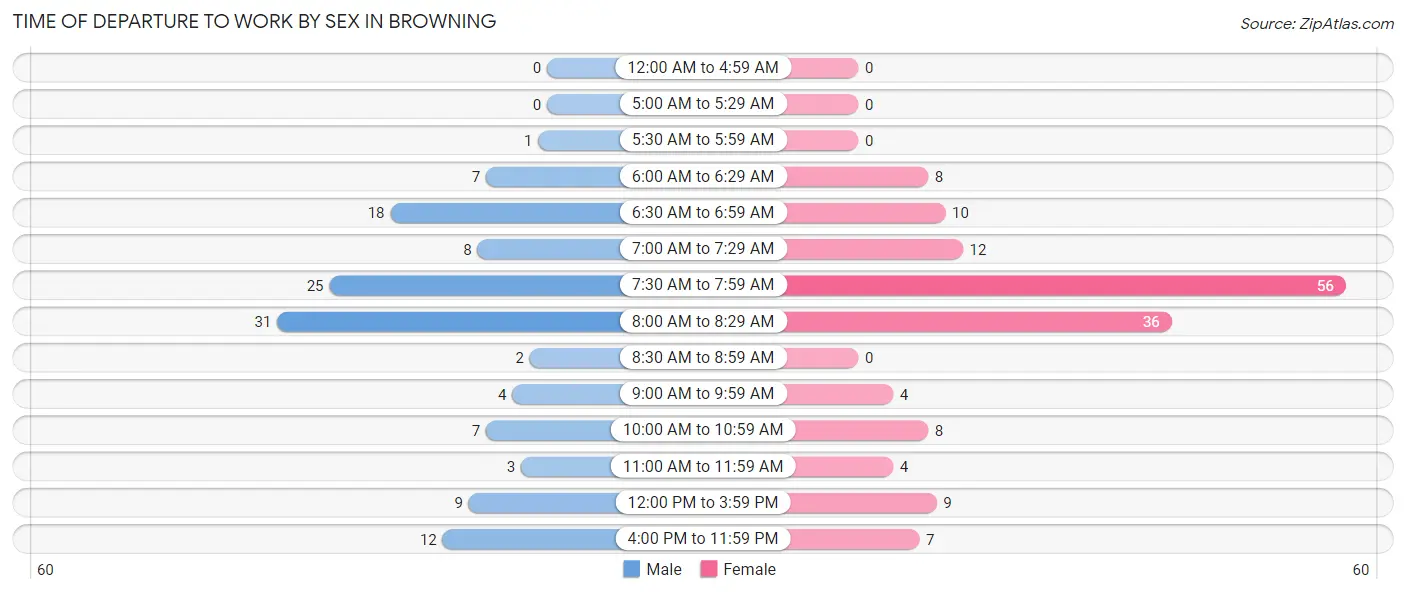
| Time of Departure | Male | Female |
| 12:00 AM to 4:59 AM | 0 (0.0%) | 0 (0.0%) |
| 5:00 AM to 5:29 AM | 0 (0.0%) | 0 (0.0%) |
| 5:30 AM to 5:59 AM | 1 (0.8%) | 0 (0.0%) |
| 6:00 AM to 6:29 AM | 7 (5.5%) | 8 (5.2%) |
| 6:30 AM to 6:59 AM | 18 (14.2%) | 10 (6.5%) |
| 7:00 AM to 7:29 AM | 8 (6.3%) | 12 (7.8%) |
| 7:30 AM to 7:59 AM | 25 (19.7%) | 56 (36.4%) |
| 8:00 AM to 8:29 AM | 31 (24.4%) | 36 (23.4%) |
| 8:30 AM to 8:59 AM | 2 (1.6%) | 0 (0.0%) |
| 9:00 AM to 9:59 AM | 4 (3.2%) | 4 (2.6%) |
| 10:00 AM to 10:59 AM | 7 (5.5%) | 8 (5.2%) |
| 11:00 AM to 11:59 AM | 3 (2.4%) | 4 (2.6%) |
| 12:00 PM to 3:59 PM | 9 (7.1%) | 9 (5.8%) |
| 4:00 PM to 11:59 PM | 12 (9.5%) | 7 (4.5%) |
| Total | 127 (100.0%) | 154 (100.0%) |
Housing Occupancy in Browning
Occupancy by Ownership in Browning
Of the total 282 dwellings in Browning, owner-occupied units account for 172 (61.0%), while renter-occupied units make up 110 (39.0%).
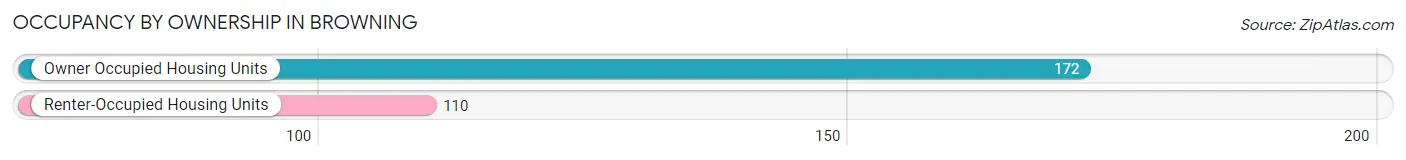
| Occupancy | # Housing Units | % Housing Units |
| Owner Occupied Housing Units | 172 | 61.0% |
| Renter-Occupied Housing Units | 110 | 39.0% |
| Total Occupied Housing Units | 282 | 100.0% |
Occupancy by Household Size in Browning
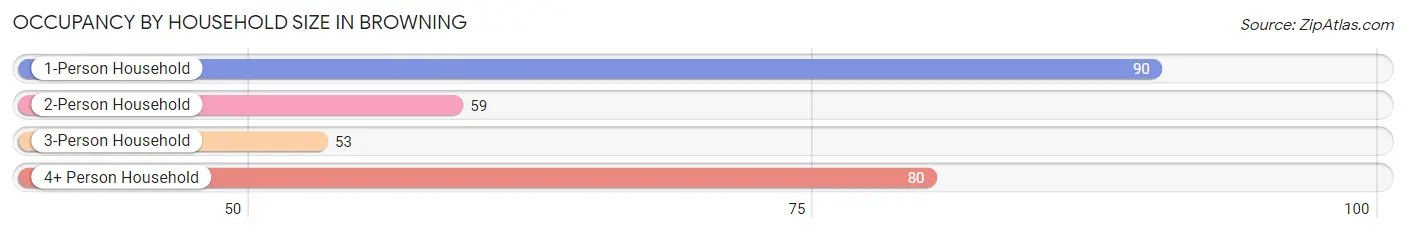
| Household Size | # Housing Units | % Housing Units |
| 1-Person Household | 90 | 31.9% |
| 2-Person Household | 59 | 20.9% |
| 3-Person Household | 53 | 18.8% |
| 4+ Person Household | 80 | 28.4% |
| Total Housing Units | 282 | 100.0% |
Occupancy by Ownership by Household Size in Browning
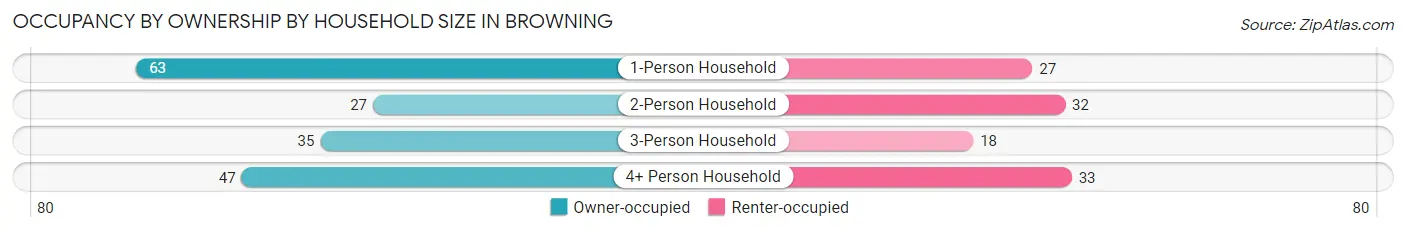
| Household Size | Owner-occupied | Renter-occupied |
| 1-Person Household | 63 (70.0%) | 27 (30.0%) |
| 2-Person Household | 27 (45.8%) | 32 (54.2%) |
| 3-Person Household | 35 (66.0%) | 18 (34.0%) |
| 4+ Person Household | 47 (58.8%) | 33 (41.2%) |
| Total Housing Units | 172 (61.0%) | 110 (39.0%) |
Occupancy by Educational Attainment in Browning
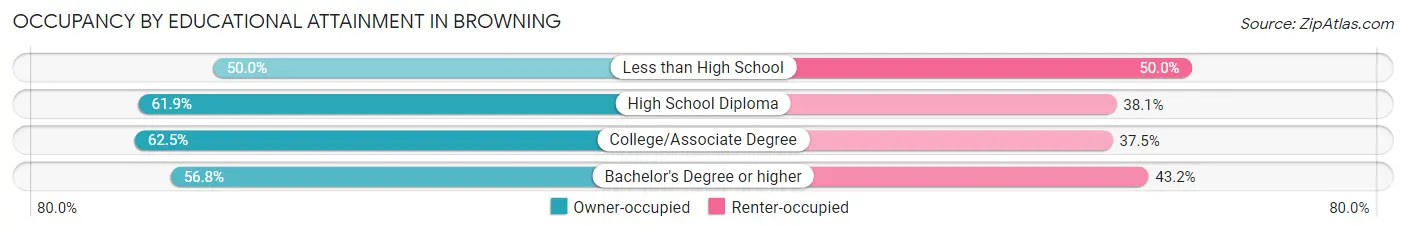
| Household Size | Owner-occupied | Renter-occupied |
| Less than High School | 4 (50.0%) | 4 (50.0%) |
| High School Diploma | 78 (61.9%) | 48 (38.1%) |
| College/Associate Degree | 65 (62.5%) | 39 (37.5%) |
| Bachelor's Degree or higher | 25 (56.8%) | 19 (43.2%) |
Occupancy by Age of Householder in Browning
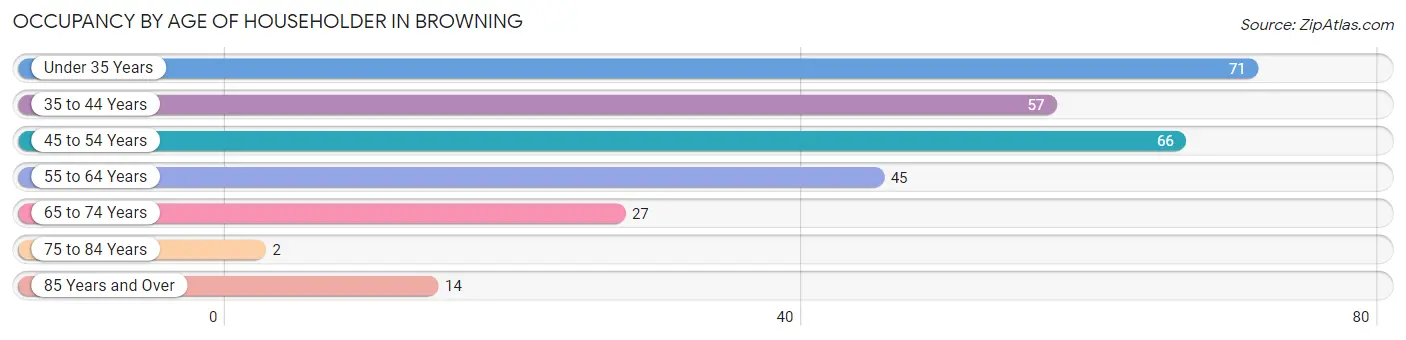
| Age Bracket | # Households | % Households |
| Under 35 Years | 71 | 25.2% |
| 35 to 44 Years | 57 | 20.2% |
| 45 to 54 Years | 66 | 23.4% |
| 55 to 64 Years | 45 | 16.0% |
| 65 to 74 Years | 27 | 9.6% |
| 75 to 84 Years | 2 | 0.7% |
| 85 Years and Over | 14 | 5.0% |
| Total | 282 | 100.0% |
Housing Finances in Browning
Median Income by Occupancy in Browning
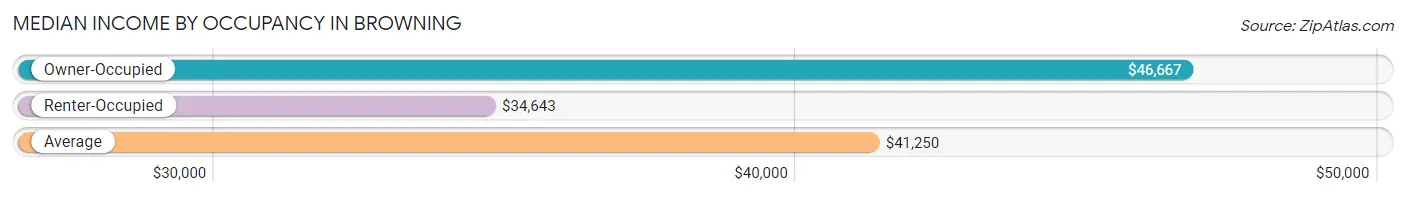
| Occupancy Type | # Households | Median Income |
| Owner-Occupied | 172 (61.0%) | $46,667 |
| Renter-Occupied | 110 (39.0%) | $34,643 |
| Average | 282 (100.0%) | $41,250 |
Occupancy by Householder Income Bracket in Browning
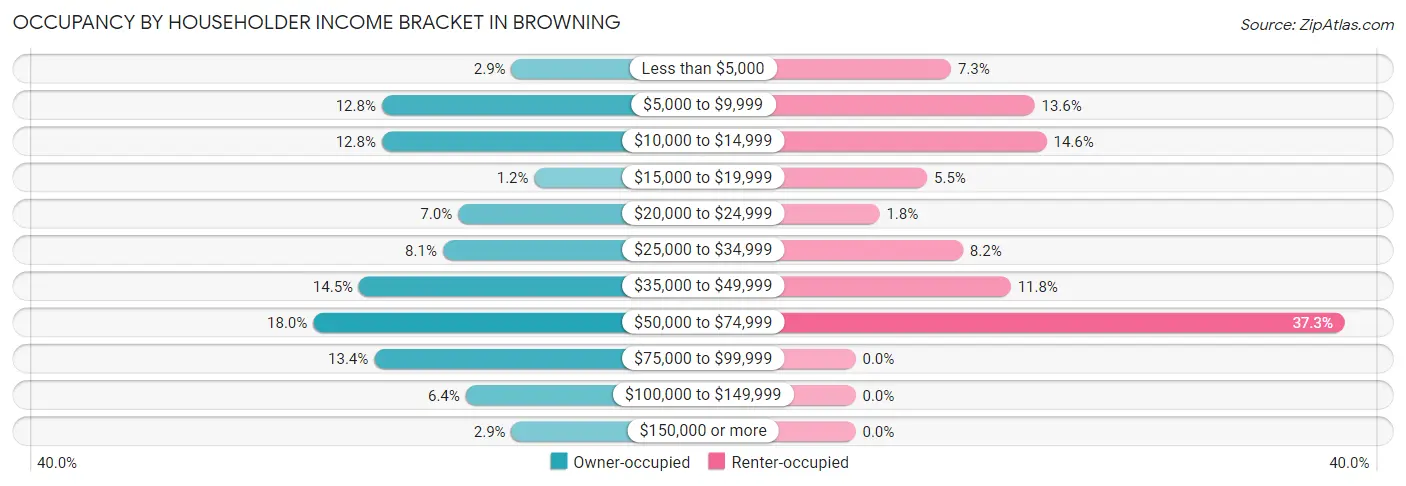
| Income Bracket | Owner-occupied | Renter-occupied |
| Less than $5,000 | 5 (2.9%) | 8 (7.3%) |
| $5,000 to $9,999 | 22 (12.8%) | 15 (13.6%) |
| $10,000 to $14,999 | 22 (12.8%) | 16 (14.5%) |
| $15,000 to $19,999 | 2 (1.2%) | 6 (5.4%) |
| $20,000 to $24,999 | 12 (7.0%) | 2 (1.8%) |
| $25,000 to $34,999 | 14 (8.1%) | 9 (8.2%) |
| $35,000 to $49,999 | 25 (14.5%) | 13 (11.8%) |
| $50,000 to $74,999 | 31 (18.0%) | 41 (37.3%) |
| $75,000 to $99,999 | 23 (13.4%) | 0 (0.0%) |
| $100,000 to $149,999 | 11 (6.4%) | 0 (0.0%) |
| $150,000 or more | 5 (2.9%) | 0 (0.0%) |
| Total | 172 (100.0%) | 110 (100.0%) |
Monthly Housing Cost Tiers in Browning
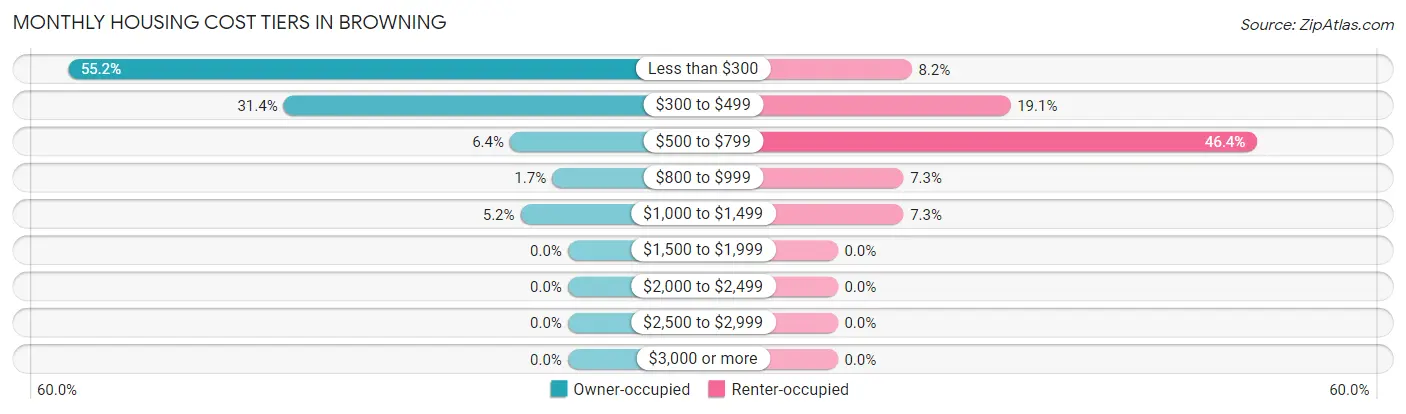
| Monthly Cost | Owner-occupied | Renter-occupied |
| Less than $300 | 95 (55.2%) | 9 (8.2%) |
| $300 to $499 | 54 (31.4%) | 21 (19.1%) |
| $500 to $799 | 11 (6.4%) | 51 (46.4%) |
| $800 to $999 | 3 (1.7%) | 8 (7.3%) |
| $1,000 to $1,499 | 9 (5.2%) | 8 (7.3%) |
| $1,500 to $1,999 | 0 (0.0%) | 0 (0.0%) |
| $2,000 to $2,499 | 0 (0.0%) | 0 (0.0%) |
| $2,500 to $2,999 | 0 (0.0%) | 0 (0.0%) |
| $3,000 or more | 0 (0.0%) | 0 (0.0%) |
| Total | 172 (100.0%) | 110 (100.0%) |
Physical Housing Characteristics in Browning
Housing Structures in Browning
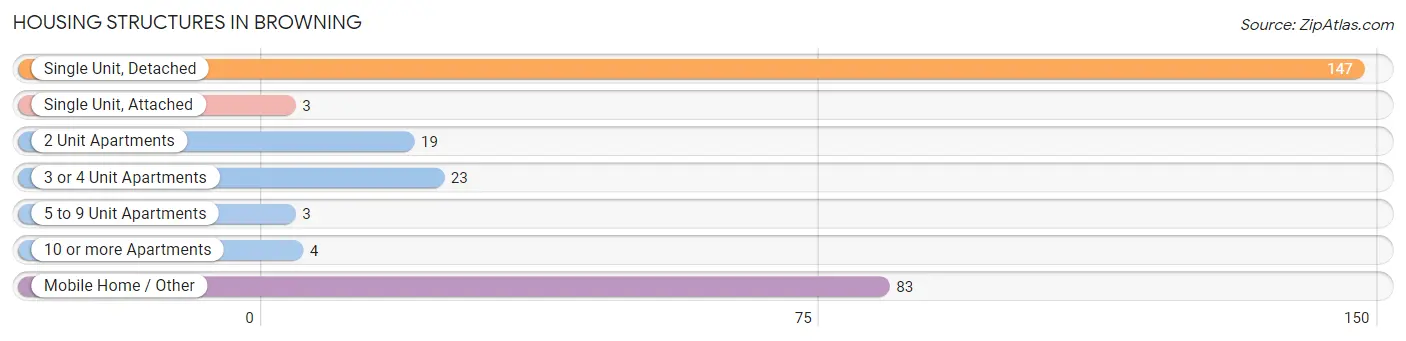
| Structure Type | # Housing Units | % Housing Units |
| Single Unit, Detached | 147 | 52.1% |
| Single Unit, Attached | 3 | 1.1% |
| 2 Unit Apartments | 19 | 6.7% |
| 3 or 4 Unit Apartments | 23 | 8.2% |
| 5 to 9 Unit Apartments | 3 | 1.1% |
| 10 or more Apartments | 4 | 1.4% |
| Mobile Home / Other | 83 | 29.4% |
| Total | 282 | 100.0% |
Housing Structures by Occupancy in Browning
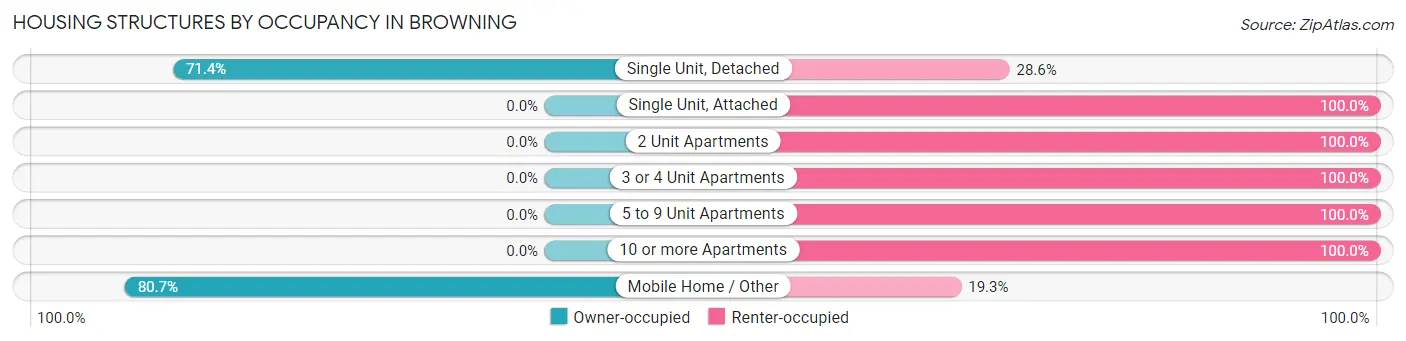
| Structure Type | Owner-occupied | Renter-occupied |
| Single Unit, Detached | 105 (71.4%) | 42 (28.6%) |
| Single Unit, Attached | 0 (0.0%) | 3 (100.0%) |
| 2 Unit Apartments | 0 (0.0%) | 19 (100.0%) |
| 3 or 4 Unit Apartments | 0 (0.0%) | 23 (100.0%) |
| 5 to 9 Unit Apartments | 0 (0.0%) | 3 (100.0%) |
| 10 or more Apartments | 0 (0.0%) | 4 (100.0%) |
| Mobile Home / Other | 67 (80.7%) | 16 (19.3%) |
| Total | 172 (61.0%) | 110 (39.0%) |
Housing Structures by Number of Rooms in Browning
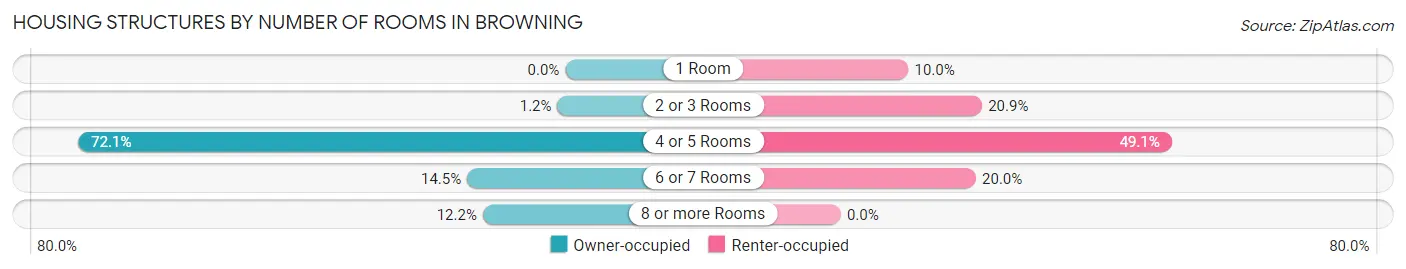
| Number of Rooms | Owner-occupied | Renter-occupied |
| 1 Room | 0 (0.0%) | 11 (10.0%) |
| 2 or 3 Rooms | 2 (1.2%) | 23 (20.9%) |
| 4 or 5 Rooms | 124 (72.1%) | 54 (49.1%) |
| 6 or 7 Rooms | 25 (14.5%) | 22 (20.0%) |
| 8 or more Rooms | 21 (12.2%) | 0 (0.0%) |
| Total | 172 (100.0%) | 110 (100.0%) |
Housing Structure by Heating Type in Browning
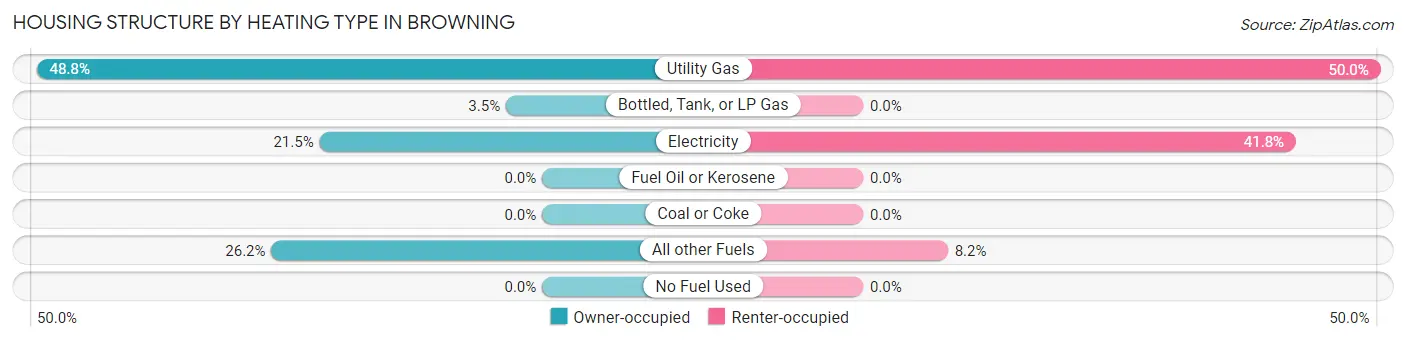
| Heating Type | Owner-occupied | Renter-occupied |
| Utility Gas | 84 (48.8%) | 55 (50.0%) |
| Bottled, Tank, or LP Gas | 6 (3.5%) | 0 (0.0%) |
| Electricity | 37 (21.5%) | 46 (41.8%) |
| Fuel Oil or Kerosene | 0 (0.0%) | 0 (0.0%) |
| Coal or Coke | 0 (0.0%) | 0 (0.0%) |
| All other Fuels | 45 (26.2%) | 9 (8.2%) |
| No Fuel Used | 0 (0.0%) | 0 (0.0%) |
| Total | 172 (100.0%) | 110 (100.0%) |
Household Vehicle Usage in Browning
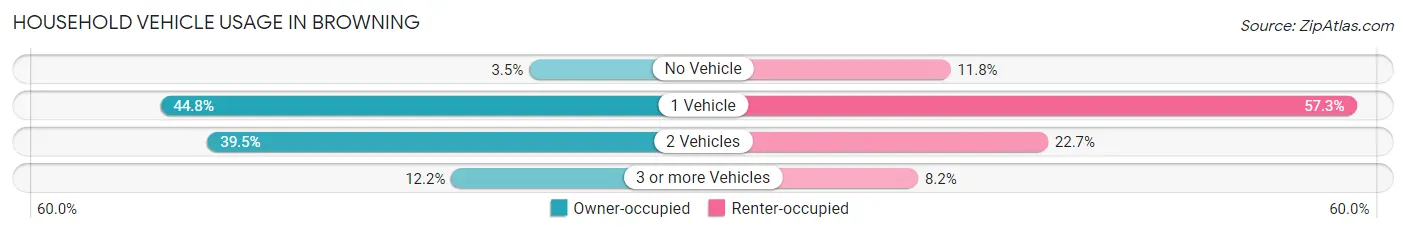
| Vehicles per Household | Owner-occupied | Renter-occupied |
| No Vehicle | 6 (3.5%) | 13 (11.8%) |
| 1 Vehicle | 77 (44.8%) | 63 (57.3%) |
| 2 Vehicles | 68 (39.5%) | 25 (22.7%) |
| 3 or more Vehicles | 21 (12.2%) | 9 (8.2%) |
| Total | 172 (100.0%) | 110 (100.0%) |
Real Estate & Mortgages in Browning
Real Estate and Mortgage Overview in Browning
| Characteristic | Without Mortgage | With Mortgage |
| Housing Units | 160 | 12 |
| Median Property Value | $121,900 | $110,700 |
| Median Household Income | $36,500 | $2 |
| Monthly Housing Costs | $283 | $0 |
| Real Estate Taxes | $756 | $0 |
Property Value by Mortgage Status in Browning
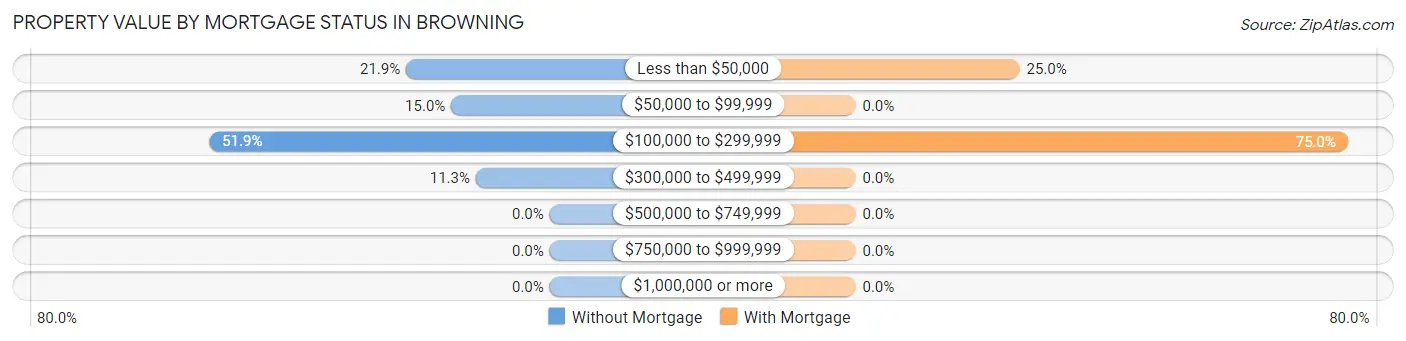
| Property Value | Without Mortgage | With Mortgage |
| Less than $50,000 | 35 (21.9%) | 3 (25.0%) |
| $50,000 to $99,999 | 24 (15.0%) | 0 (0.0%) |
| $100,000 to $299,999 | 83 (51.9%) | 9 (75.0%) |
| $300,000 to $499,999 | 18 (11.3%) | 0 (0.0%) |
| $500,000 to $749,999 | 0 (0.0%) | 0 (0.0%) |
| $750,000 to $999,999 | 0 (0.0%) | 0 (0.0%) |
| $1,000,000 or more | 0 (0.0%) | 0 (0.0%) |
| Total | 160 (100.0%) | 12 (100.0%) |
Household Income by Mortgage Status in Browning
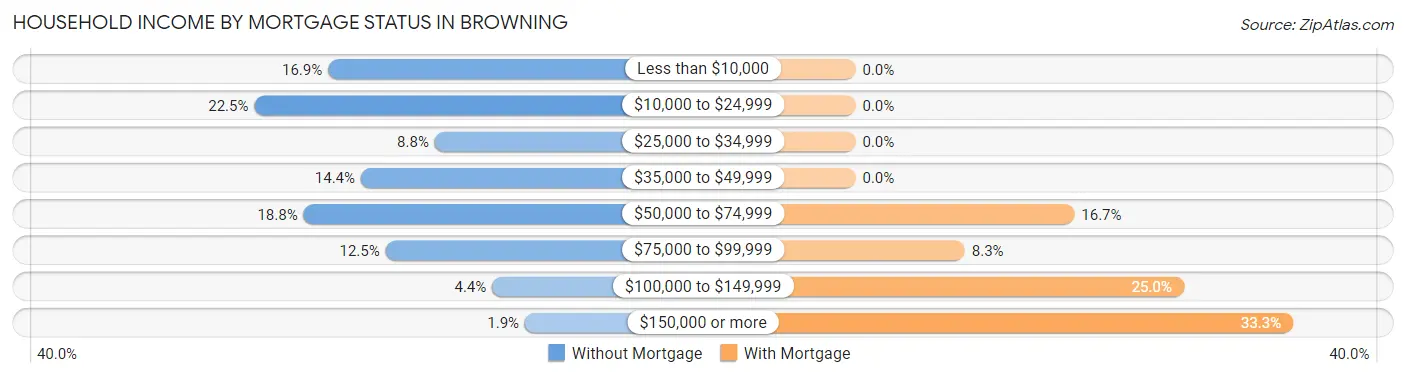
| Household Income | Without Mortgage | With Mortgage |
| Less than $10,000 | 27 (16.9%) | 0 (0.0%) |
| $10,000 to $24,999 | 36 (22.5%) | 0 (0.0%) |
| $25,000 to $34,999 | 14 (8.7%) | 0 (0.0%) |
| $35,000 to $49,999 | 23 (14.4%) | 0 (0.0%) |
| $50,000 to $74,999 | 30 (18.8%) | 2 (16.7%) |
| $75,000 to $99,999 | 20 (12.5%) | 1 (8.3%) |
| $100,000 to $149,999 | 7 (4.4%) | 3 (25.0%) |
| $150,000 or more | 3 (1.9%) | 4 (33.3%) |
| Total | 160 (100.0%) | 12 (100.0%) |
Property Value to Household Income Ratio in Browning
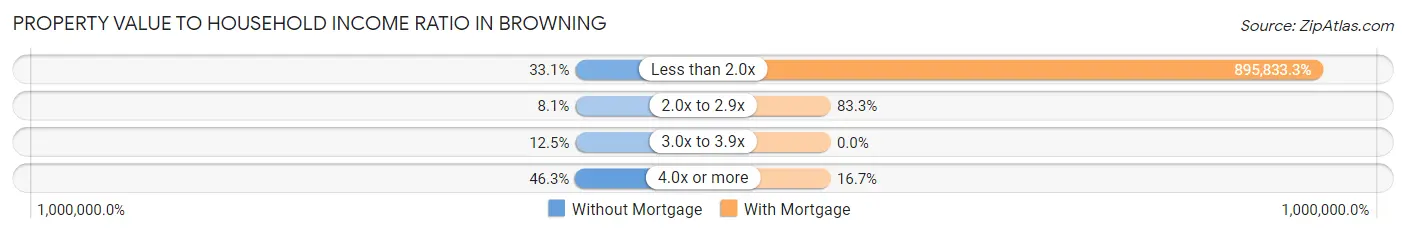
| Value-to-Income Ratio | Without Mortgage | With Mortgage |
| Less than 2.0x | 53 (33.1%) | 107,500 (895,833.3%) |
| 2.0x to 2.9x | 13 (8.1%) | 10 (83.3%) |
| 3.0x to 3.9x | 20 (12.5%) | 0 (0.0%) |
| 4.0x or more | 74 (46.3%) | 2 (16.7%) |
| Total | 160 (100.0%) | 12 (100.0%) |
Real Estate Taxes by Mortgage Status in Browning
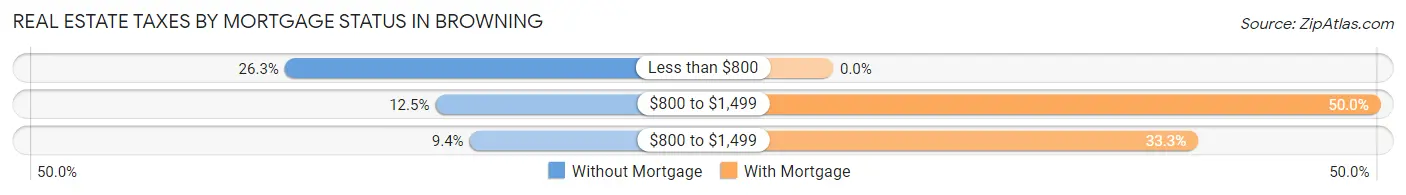
| Property Taxes | Without Mortgage | With Mortgage |
| Less than $800 | 42 (26.3%) | 0 (0.0%) |
| $800 to $1,499 | 20 (12.5%) | 6 (50.0%) |
| $800 to $1,499 | 15 (9.4%) | 4 (33.3%) |
| Total | 160 (100.0%) | 12 (100.0%) |
Health & Disability in Browning
Health Insurance Coverage by Age in Browning
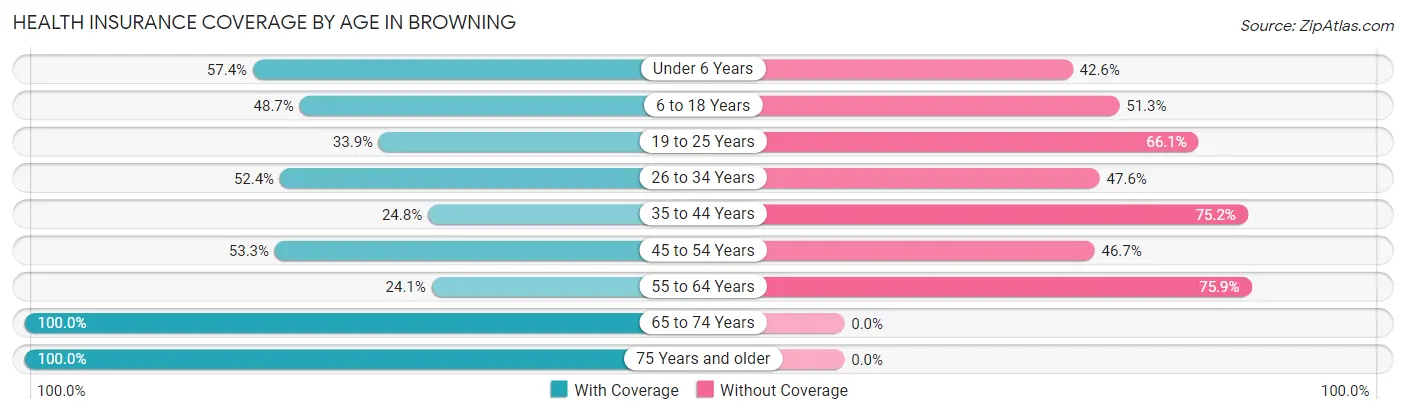
| Age Bracket | With Coverage | Without Coverage |
| Under 6 Years | 58 (57.4%) | 43 (42.6%) |
| 6 to 18 Years | 95 (48.7%) | 100 (51.3%) |
| 19 to 25 Years | 38 (33.9%) | 74 (66.1%) |
| 26 to 34 Years | 55 (52.4%) | 50 (47.6%) |
| 35 to 44 Years | 28 (24.8%) | 85 (75.2%) |
| 45 to 54 Years | 48 (53.3%) | 42 (46.7%) |
| 55 to 64 Years | 20 (24.1%) | 63 (75.9%) |
| 65 to 74 Years | 41 (100.0%) | 0 (0.0%) |
| 75 Years and older | 31 (100.0%) | 0 (0.0%) |
| Total | 414 (47.5%) | 457 (52.5%) |
Health Insurance Coverage by Citizenship Status in Browning
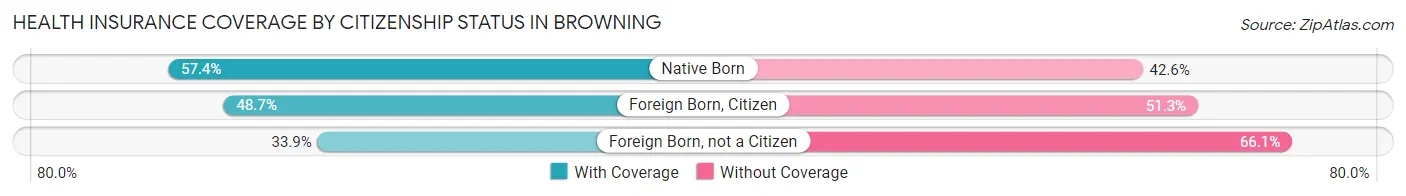
| Citizenship Status | With Coverage | Without Coverage |
| Native Born | 58 (57.4%) | 43 (42.6%) |
| Foreign Born, Citizen | 95 (48.7%) | 100 (51.3%) |
| Foreign Born, not a Citizen | 38 (33.9%) | 74 (66.1%) |
Health Insurance Coverage by Household Income in Browning
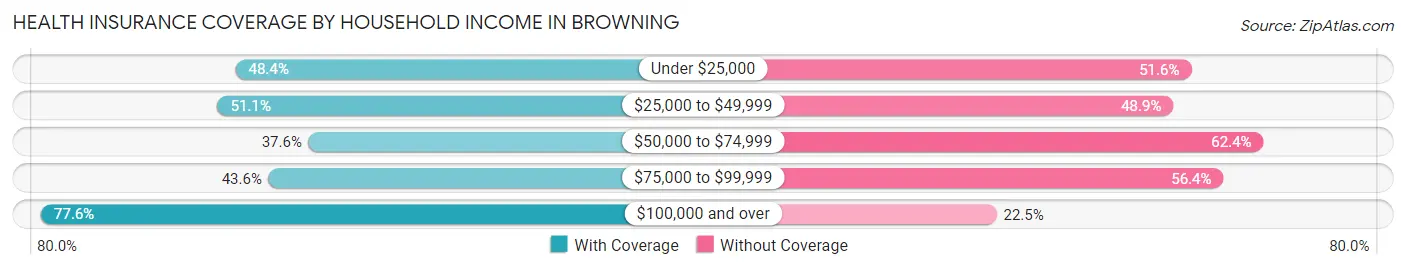
| Household Income | With Coverage | Without Coverage |
| Under $25,000 | 134 (48.4%) | 143 (51.6%) |
| $25,000 to $49,999 | 118 (51.1%) | 113 (48.9%) |
| $50,000 to $74,999 | 80 (37.6%) | 133 (62.4%) |
| $75,000 to $99,999 | 44 (43.6%) | 57 (56.4%) |
| $100,000 and over | 38 (77.5%) | 11 (22.5%) |
Public vs Private Health Insurance Coverage by Age in Browning
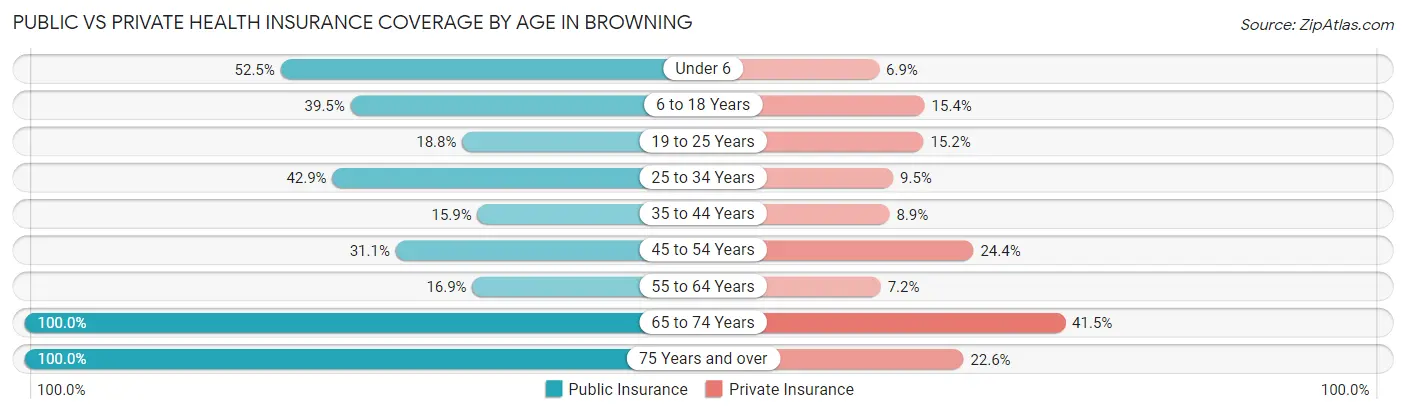
| Age Bracket | Public Insurance | Private Insurance |
| Under 6 | 53 (52.5%) | 7 (6.9%) |
| 6 to 18 Years | 77 (39.5%) | 30 (15.4%) |
| 19 to 25 Years | 21 (18.8%) | 17 (15.2%) |
| 25 to 34 Years | 45 (42.9%) | 10 (9.5%) |
| 35 to 44 Years | 18 (15.9%) | 10 (8.8%) |
| 45 to 54 Years | 28 (31.1%) | 22 (24.4%) |
| 55 to 64 Years | 14 (16.9%) | 6 (7.2%) |
| 65 to 74 Years | 41 (100.0%) | 17 (41.5%) |
| 75 Years and over | 31 (100.0%) | 7 (22.6%) |
| Total | 328 (37.7%) | 126 (14.5%) |
Disability Status by Sex by Age in Browning
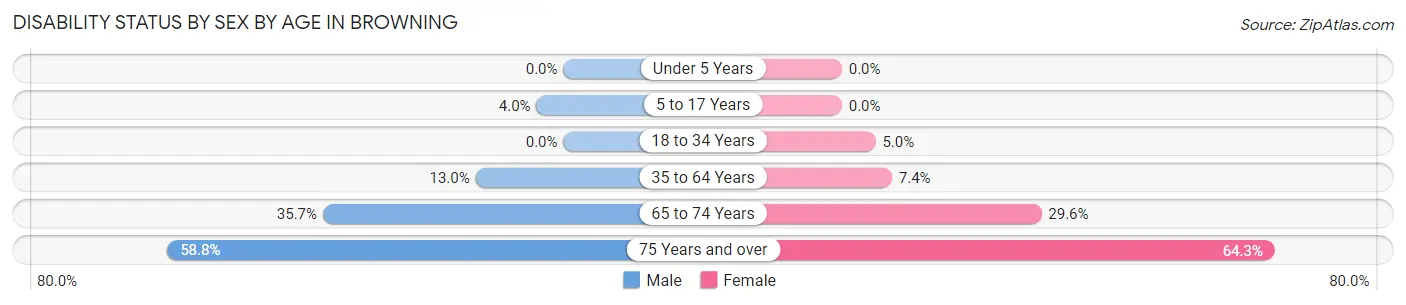
| Age Bracket | Male | Female |
| Under 5 Years | 0 (0.0%) | 0 (0.0%) |
| 5 to 17 Years | 4 (4.0%) | 0 (0.0%) |
| 18 to 34 Years | 0 (0.0%) | 6 (5.0%) |
| 35 to 64 Years | 18 (13.0%) | 11 (7.4%) |
| 65 to 74 Years | 5 (35.7%) | 8 (29.6%) |
| 75 Years and over | 10 (58.8%) | 9 (64.3%) |
Disability Class by Sex by Age in Browning
Disability Class: Hearing Difficulty
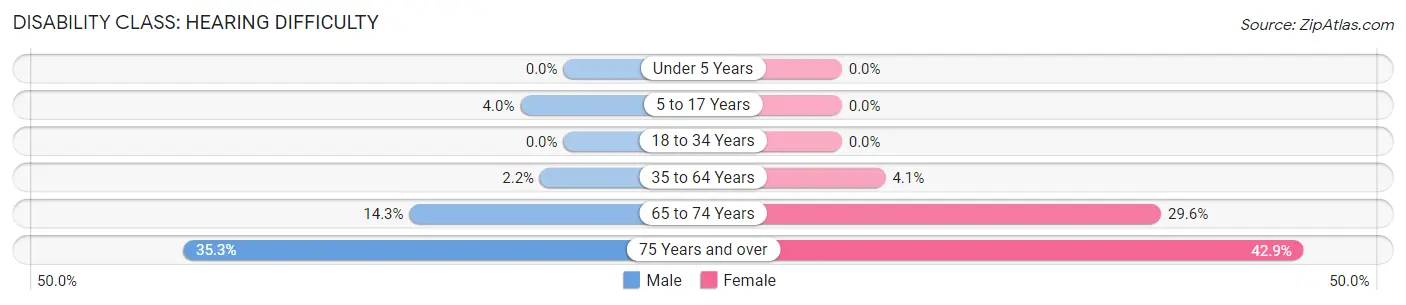
| Age Bracket | Male | Female |
| Under 5 Years | 0 (0.0%) | 0 (0.0%) |
| 5 to 17 Years | 4 (4.0%) | 0 (0.0%) |
| 18 to 34 Years | 0 (0.0%) | 0 (0.0%) |
| 35 to 64 Years | 3 (2.2%) | 6 (4.1%) |
| 65 to 74 Years | 2 (14.3%) | 8 (29.6%) |
| 75 Years and over | 6 (35.3%) | 6 (42.9%) |
Disability Class: Vision Difficulty
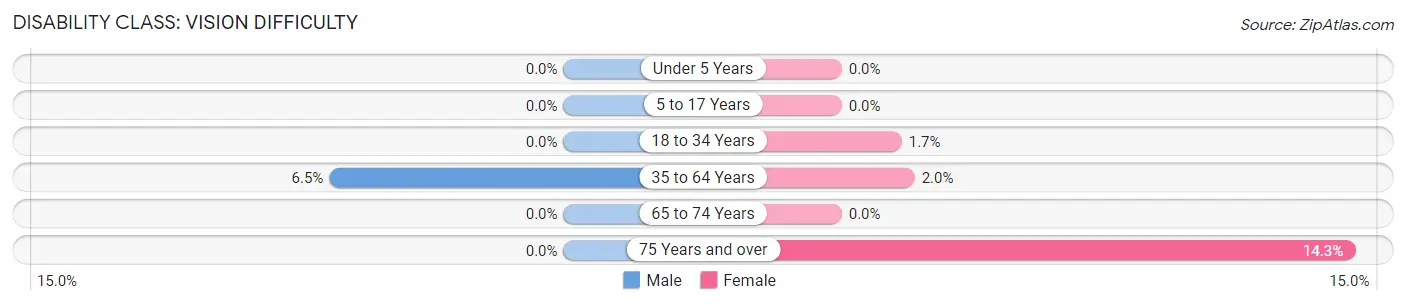
| Age Bracket | Male | Female |
| Under 5 Years | 0 (0.0%) | 0 (0.0%) |
| 5 to 17 Years | 0 (0.0%) | 0 (0.0%) |
| 18 to 34 Years | 0 (0.0%) | 2 (1.7%) |
| 35 to 64 Years | 9 (6.5%) | 3 (2.0%) |
| 65 to 74 Years | 0 (0.0%) | 0 (0.0%) |
| 75 Years and over | 0 (0.0%) | 2 (14.3%) |
Disability Class: Cognitive Difficulty
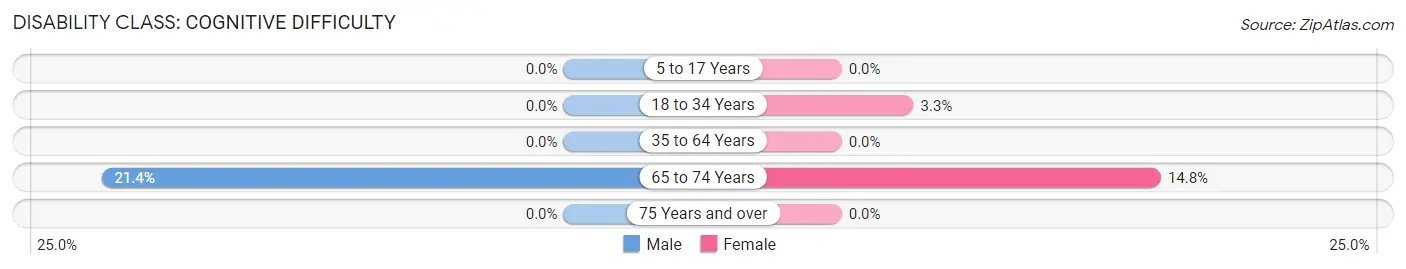
| Age Bracket | Male | Female |
| 5 to 17 Years | 0 (0.0%) | 0 (0.0%) |
| 18 to 34 Years | 0 (0.0%) | 4 (3.3%) |
| 35 to 64 Years | 0 (0.0%) | 0 (0.0%) |
| 65 to 74 Years | 3 (21.4%) | 4 (14.8%) |
| 75 Years and over | 0 (0.0%) | 0 (0.0%) |
Disability Class: Ambulatory Difficulty
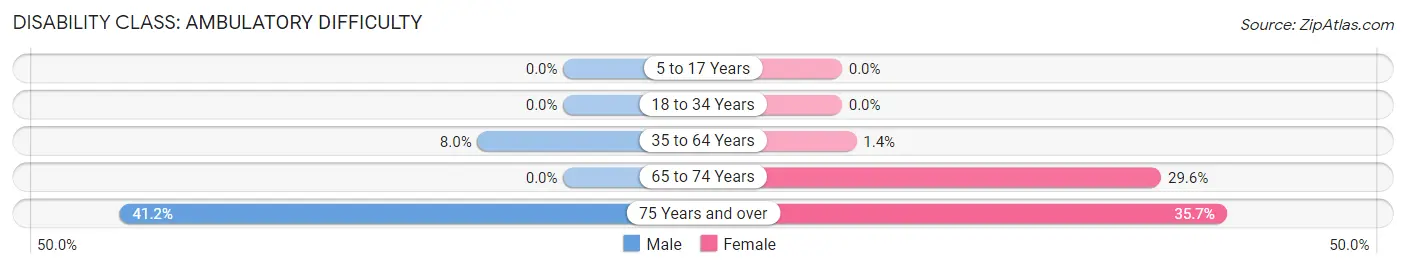
| Age Bracket | Male | Female |
| 5 to 17 Years | 0 (0.0%) | 0 (0.0%) |
| 18 to 34 Years | 0 (0.0%) | 0 (0.0%) |
| 35 to 64 Years | 11 (8.0%) | 2 (1.3%) |
| 65 to 74 Years | 0 (0.0%) | 8 (29.6%) |
| 75 Years and over | 7 (41.2%) | 5 (35.7%) |
Disability Class: Self-Care Difficulty
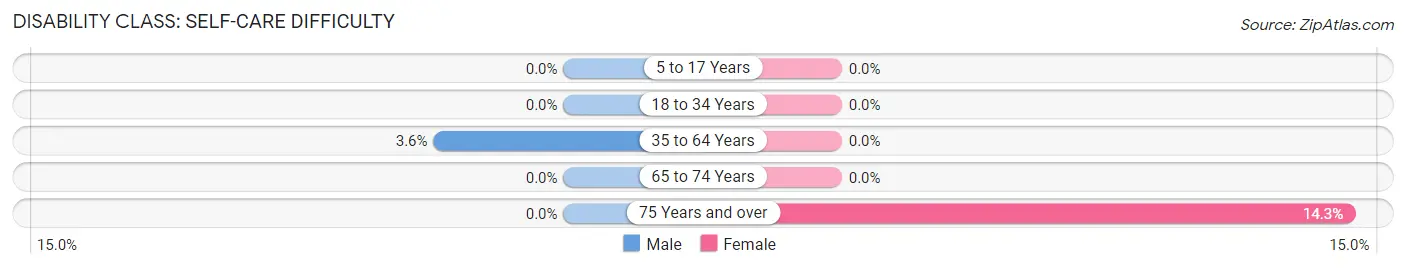
| Age Bracket | Male | Female |
| 5 to 17 Years | 0 (0.0%) | 0 (0.0%) |
| 18 to 34 Years | 0 (0.0%) | 0 (0.0%) |
| 35 to 64 Years | 5 (3.6%) | 0 (0.0%) |
| 65 to 74 Years | 0 (0.0%) | 0 (0.0%) |
| 75 Years and over | 0 (0.0%) | 2 (14.3%) |
Technology Access in Browning
Computing Device Access in Browning
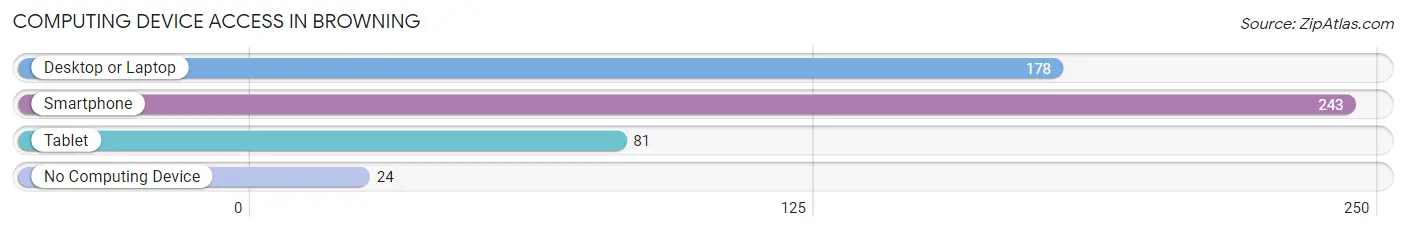
| Device Type | # Households | % Households |
| Desktop or Laptop | 178 | 63.1% |
| Smartphone | 243 | 86.2% |
| Tablet | 81 | 28.7% |
| No Computing Device | 24 | 8.5% |
| Total | 282 | 100.0% |
Internet Access in Browning
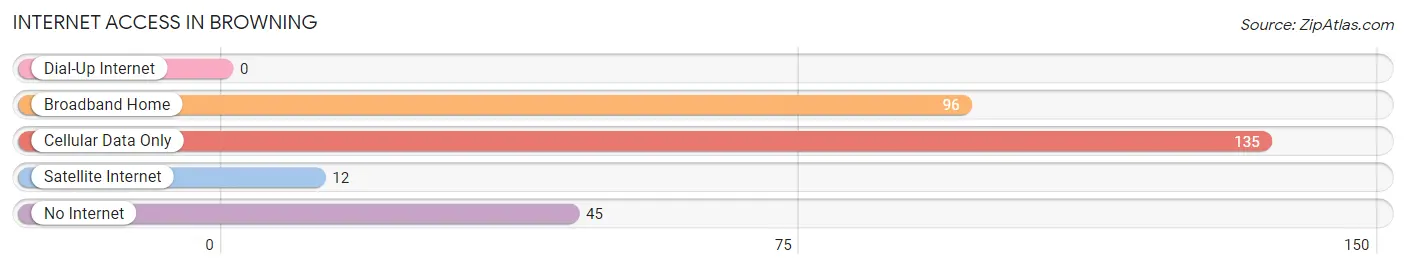
| Internet Type | # Households | % Households |
| Dial-Up Internet | 0 | 0.0% |
| Broadband Home | 96 | 34.0% |
| Cellular Data Only | 135 | 47.9% |
| Satellite Internet | 12 | 4.3% |
| No Internet | 45 | 16.0% |
| Total | 282 | 100.0% |
Browning Summary
Browning, Montana is a small town located in the Blackfeet Indian Reservation in Glacier County. It is the tribal headquarters of the Blackfeet Nation and is the largest town in the reservation. The town was founded in 1885 and is named after the Blackfeet chief, Chief Browning. The town is located in the Rocky Mountains and is surrounded by mountains, forests, and rivers.
Geography
Browning is located in the Rocky Mountains of Montana, in the Blackfeet Indian Reservation. The town is situated at an elevation of 4,400 feet and is surrounded by mountains, forests, and rivers. The town is located in the middle of the reservation, and is the largest town in the area. The town is located near the eastern edge of Glacier National Park, and is close to the Canadian border. The town is located on the Blackfeet Indian Reservation, which is a large area of land that is owned and managed by the Blackfeet Nation.
The town is located in a valley, and is surrounded by mountains on all sides. The mountains are part of the Rocky Mountain range, and are covered in forests and rivers. The town is located near the Two Medicine River, which is a popular spot for fishing and camping. The town is also close to the Blackfeet National Forest, which is a large area of land that is managed by the Blackfeet Nation.
Economy
The economy of Browning is largely based on tourism and the Blackfeet Nation. The town is a popular destination for tourists, who come to visit the nearby Glacier National Park and the Blackfeet National Forest. The town is also home to several businesses, including restaurants, hotels, and stores. The town is also home to the Blackfeet Tribal College, which offers courses in Native American studies, business, and other subjects.
The town is also home to several industries, including logging, mining, and oil and gas. The town is also home to several manufacturing companies, which produce a variety of products, including furniture, clothing, and electronics. The town is also home to several agricultural businesses, which produce a variety of crops, including wheat, barley, and hay.
Demographics
As of the 2010 census, the population of Browning was 1,016. The town is predominantly Native American, with the majority of the population being members of the Blackfeet Nation. The town is also home to a small population of non-Native Americans, including Hispanics, Asians, and African Americans. The town has a median household income of $25,000, and the median age is 33.
Conclusion
Browning, Montana is a small town located in the Blackfeet Indian Reservation in Glacier County. The town is the tribal headquarters of the Blackfeet Nation and is the largest town in the reservation. The town is surrounded by mountains, forests, and rivers, and is close to the Canadian border. The economy of the town is largely based on tourism and the Blackfeet Nation, and the town is home to several businesses, industries, and agricultural businesses. The population of the town is predominantly Native American, with the majority of the population being members of the Blackfeet Nation.
Common Questions
What is Per Capita Income in Browning?
Per Capita income in Browning is $14,695.
What is the Median Family Income in Browning?
Median Family Income in Browning is $34,750.
What is the Median Household income in Browning?
Median Household Income in Browning is $41,250.
What is Income or Wage Gap in Browning?
Income or Wage Gap in Browning is 21.9%.
Women in Browning earn 78.1 cents for every dollar earned by a man.
What is Family Income Deficit in Browning?
Family Income Deficit in Browning is $12,267.
Families that are below poverty line in Browning earn $12,267 less on average than the poverty threshold level.
What is Inequality or Gini Index in Browning?
Inequality or Gini Index in Browning is 0.44.
What is the Total Population of Browning?
Total Population of Browning is 871.
What is the Total Male Population of Browning?
Total Male Population of Browning is 419.
What is the Total Female Population of Browning?
Total Female Population of Browning is 452.
What is the Ratio of Males per 100 Females in Browning?
There are 92.70 Males per 100 Females in Browning.
What is the Ratio of Females per 100 Males in Browning?
There are 107.88 Females per 100 Males in Browning.
What is the Median Population Age in Browning?
Median Population Age in Browning is 29.3 Years.
What is the Average Family Size in Browning
Average Family Size in Browning is 3.9 People.
What is the Average Household Size in Browning
Average Household Size in Browning is 3.1 People.
How Large is the Labor Force in Browning?
There are 359 People in the Labor Forcein in Browning.
What is the Percentage of People in the Labor Force in Browning?
60.0% of People are in the Labor Force in Browning.
What is the Unemployment Rate in Browning?
Unemployment Rate in Browning is 16.4%.