Grainfield, KS Map & Demographics
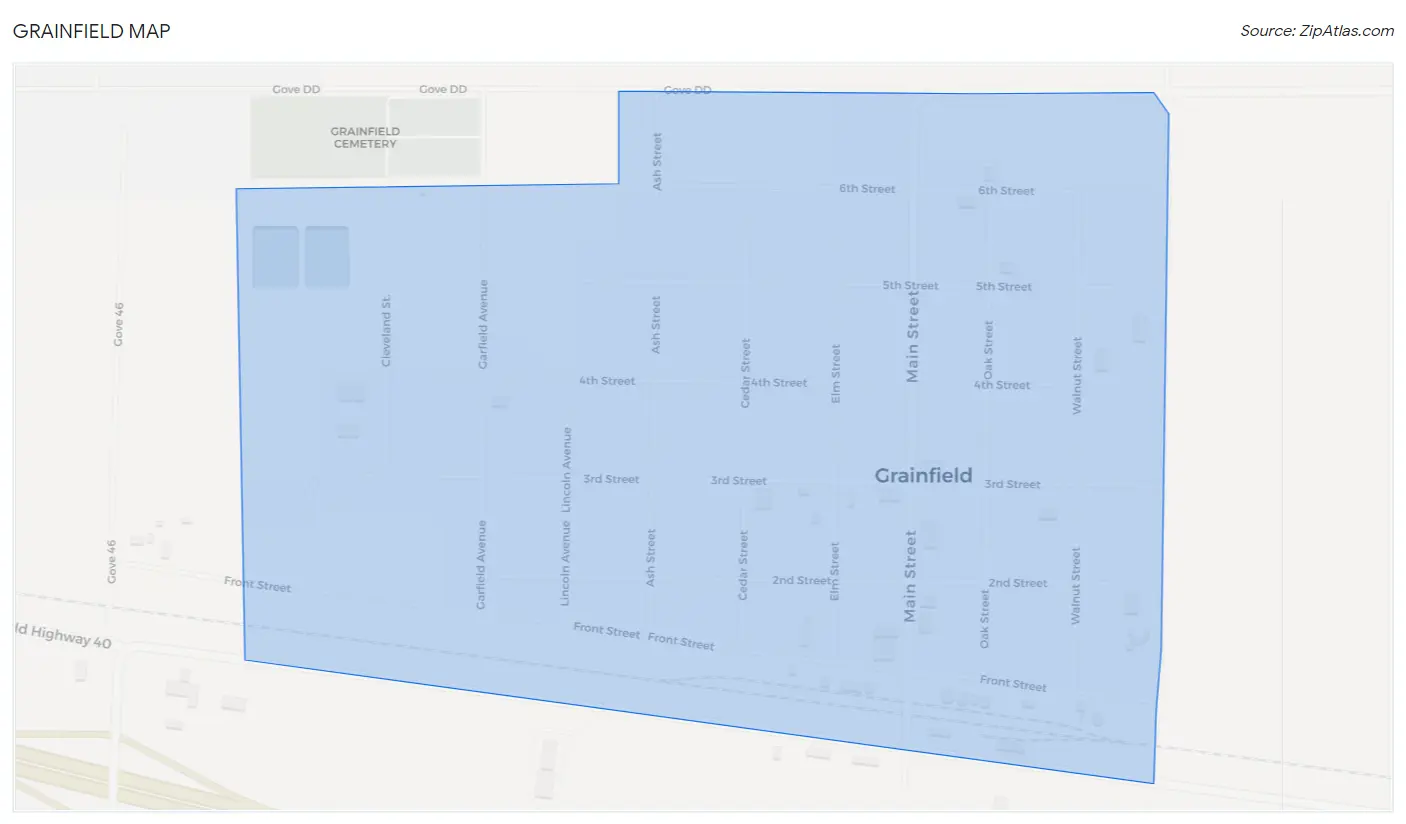
Grainfield Map
Grainfield Overview
$34,795
PER CAPITA INCOME
$76,250
AVG FAMILY INCOME
$43,571
AVG HOUSEHOLD INCOME
3.8%
WAGE / INCOME GAP [ % ]
96.2¢/ $1
WAGE / INCOME GAP [ $ ]
0.49
INEQUALITY / GINI INDEX
250
TOTAL POPULATION
144
MALE POPULATION
106
FEMALE POPULATION
135.85
MALES / 100 FEMALES
73.61
FEMALES / 100 MALES
41.0
MEDIAN AGE
3.1
AVG FAMILY SIZE
2.0
AVG HOUSEHOLD SIZE
143
LABOR FORCE [ PEOPLE ]
74.9%
PERCENT IN LABOR FORCE
11.2%
UNEMPLOYMENT RATE
Grainfield Zip Codes
Grainfield Area Codes
Income in Grainfield
Income Overview in Grainfield
Per Capita Income in Grainfield is $34,795, while median incomes of families and households are $76,250 and $43,571 respectively.
| Characteristic | Number | Measure |
| Per Capita Income | 250 | $34,795 |
| Median Family Income | 54 | $76,250 |
| Mean Family Income | 54 | $116,269 |
| Median Household Income | 126 | $43,571 |
| Mean Household Income | 126 | $71,223 |
| Income Deficit | 54 | $0 |
| Wage / Income Gap (%) | 250 | 3.85% |
| Wage / Income Gap ($) | 250 | 96.15¢ per $1 |
| Gini / Inequality Index | 250 | 0.49 |
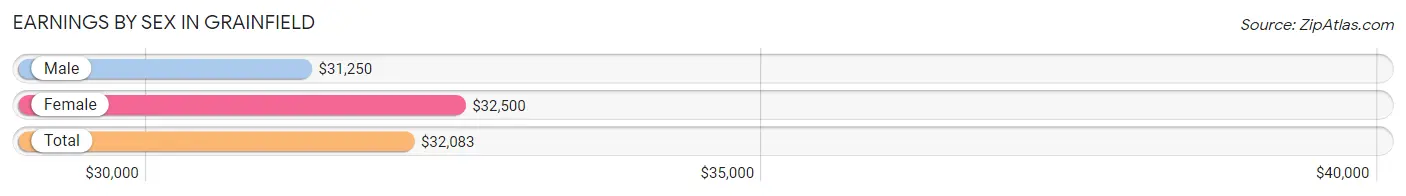
Earnings by Sex in Grainfield
Average Earnings in Grainfield are $32,083, $31,250 for men and $32,500 for women, a difference of 3.8%.
| Sex | Number | Average Earnings |
| Male | 87 (60.8%) | $31,250 |
| Female | 56 (39.2%) | $32,500 |
| Total | 143 (100.0%) | $32,083 |
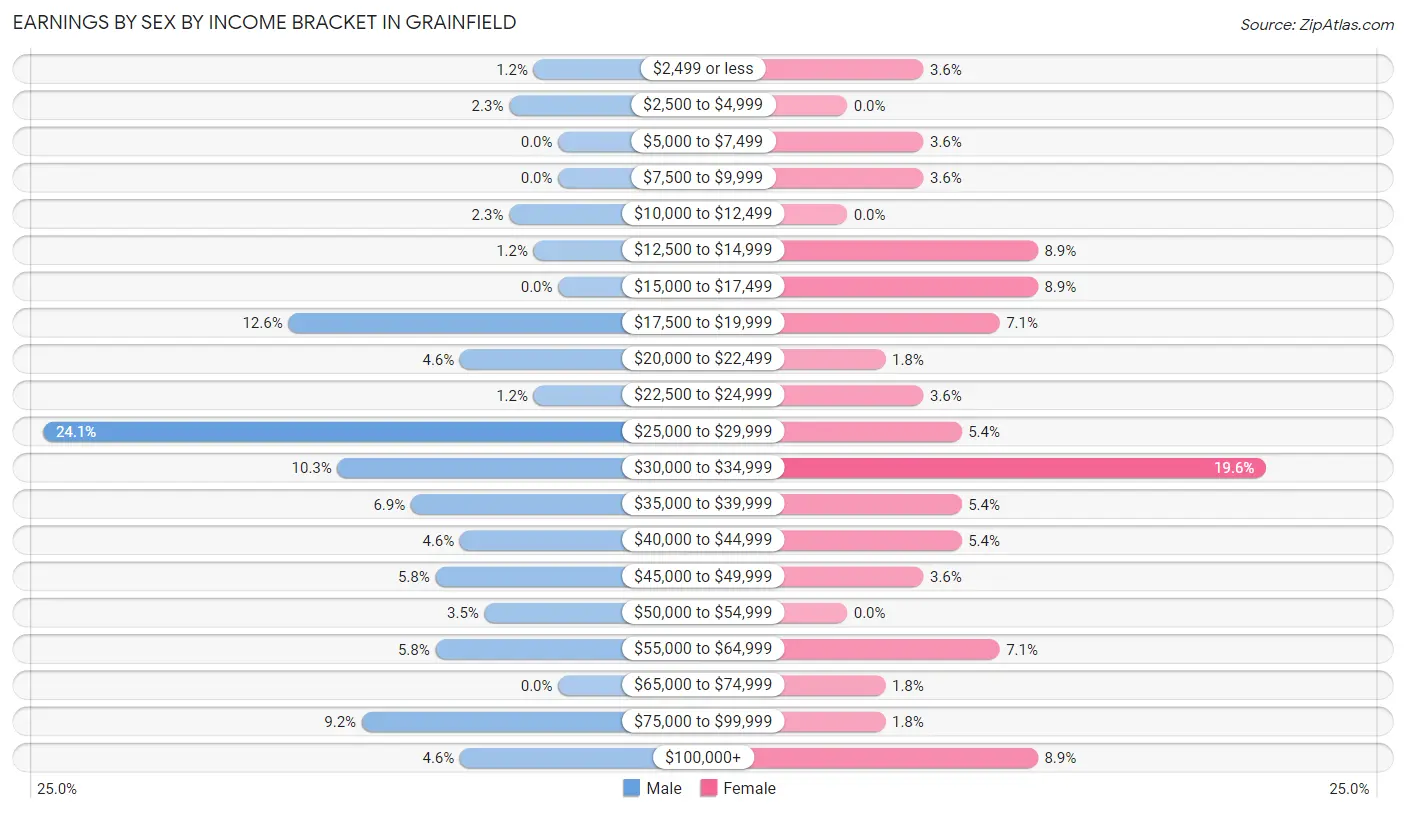
Earnings by Sex by Income Bracket in Grainfield
The most common earnings brackets in Grainfield are $25,000 to $29,999 for men (21 | 24.1%) and $30,000 to $34,999 for women (11 | 19.6%).
| Income | Male | Female |
| $2,499 or less | 1 (1.1%) | 2 (3.6%) |
| $2,500 to $4,999 | 2 (2.3%) | 0 (0.0%) |
| $5,000 to $7,499 | 0 (0.0%) | 2 (3.6%) |
| $7,500 to $9,999 | 0 (0.0%) | 2 (3.6%) |
| $10,000 to $12,499 | 2 (2.3%) | 0 (0.0%) |
| $12,500 to $14,999 | 1 (1.1%) | 5 (8.9%) |
| $15,000 to $17,499 | 0 (0.0%) | 5 (8.9%) |
| $17,500 to $19,999 | 11 (12.6%) | 4 (7.1%) |
| $20,000 to $22,499 | 4 (4.6%) | 1 (1.8%) |
| $22,500 to $24,999 | 1 (1.1%) | 2 (3.6%) |
| $25,000 to $29,999 | 21 (24.1%) | 3 (5.4%) |
| $30,000 to $34,999 | 9 (10.3%) | 11 (19.6%) |
| $35,000 to $39,999 | 6 (6.9%) | 3 (5.4%) |
| $40,000 to $44,999 | 4 (4.6%) | 3 (5.4%) |
| $45,000 to $49,999 | 5 (5.8%) | 2 (3.6%) |
| $50,000 to $54,999 | 3 (3.5%) | 0 (0.0%) |
| $55,000 to $64,999 | 5 (5.8%) | 4 (7.1%) |
| $65,000 to $74,999 | 0 (0.0%) | 1 (1.8%) |
| $75,000 to $99,999 | 8 (9.2%) | 1 (1.8%) |
| $100,000+ | 4 (4.6%) | 5 (8.9%) |
| Total | 87 (100.0%) | 56 (100.0%) |
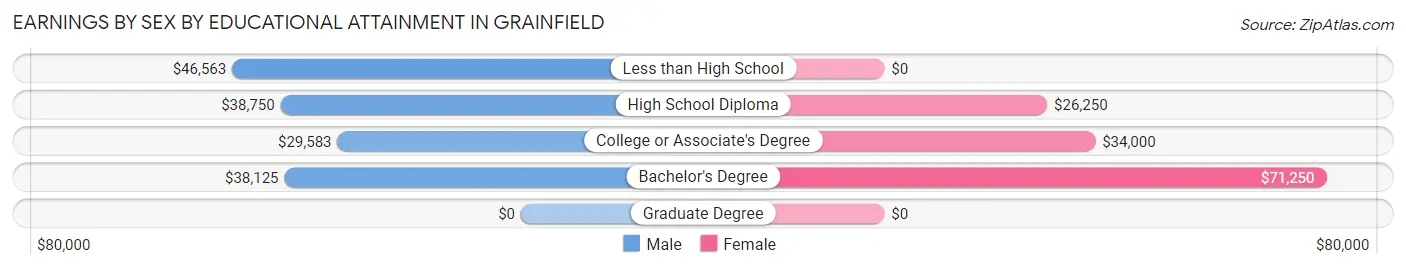
Earnings by Sex by Educational Attainment in Grainfield
Average earnings in Grainfield are $34,063 for men and $33,056 for women, a difference of 3.0%. Men with an educational attainment of less than high school enjoy the highest average annual earnings of $46,563, while those with college or associate's degree education earn the least with $29,583. Women with an educational attainment of bachelor's degree earn the most with the average annual earnings of $71,250, while those with high school diploma education have the smallest earnings of $26,250.
| Educational Attainment | Male Income | Female Income |
| Less than High School | $46,563 | $0 |
| High School Diploma | $38,750 | $26,250 |
| College or Associate's Degree | $29,583 | $34,000 |
| Bachelor's Degree | $38,125 | $71,250 |
| Graduate Degree | - | - |
| Total | $34,063 | $33,056 |
Family Income in Grainfield
Family Income Brackets in Grainfield
According to the Grainfield family income data, there are 15 families falling into the $35,000 to $49,999 income range, which is the most common income bracket and makes up 27.8% of all families.
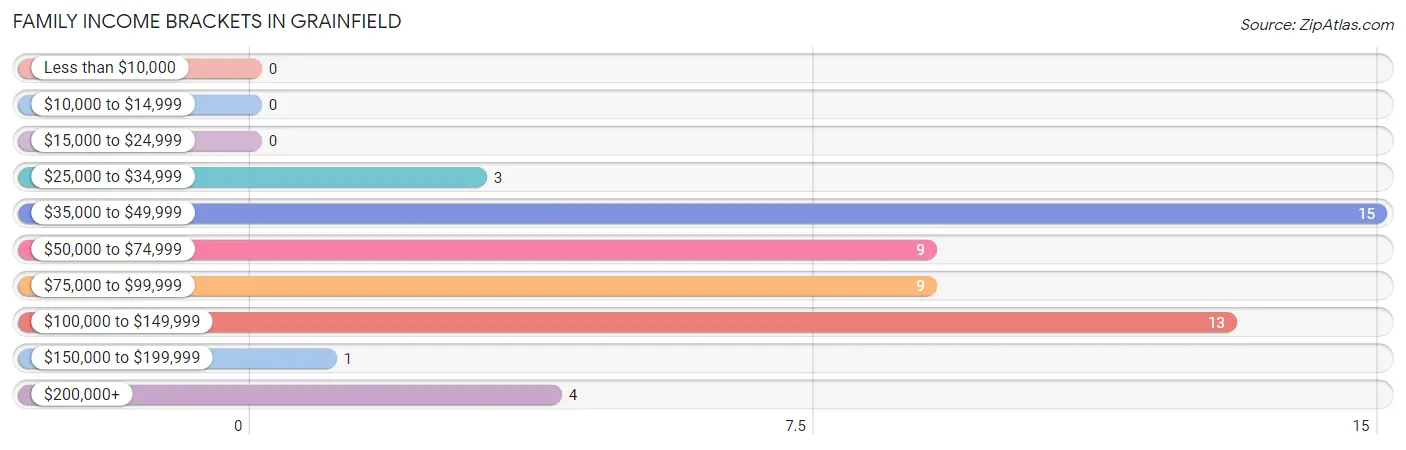
| Income Bracket | # Families | % Families |
| Less than $10,000 | 0 | 0.0% |
| $10,000 to $14,999 | 0 | 0.0% |
| $15,000 to $24,999 | 0 | 0.0% |
| $25,000 to $34,999 | 3 | 5.6% |
| $35,000 to $49,999 | 15 | 27.8% |
| $50,000 to $74,999 | 9 | 16.7% |
| $75,000 to $99,999 | 9 | 16.7% |
| $100,000 to $149,999 | 13 | 24.1% |
| $150,000 to $199,999 | 1 | 1.9% |
| $200,000+ | 4 | 7.4% |
Family Income by Famaliy Size in Grainfield
2-person families (29 | 53.7%) account for the highest median family income in Grainfield with $86,250 per family, while 2-person families (29 | 53.7%) have the highest median income of $43,125 per family member.
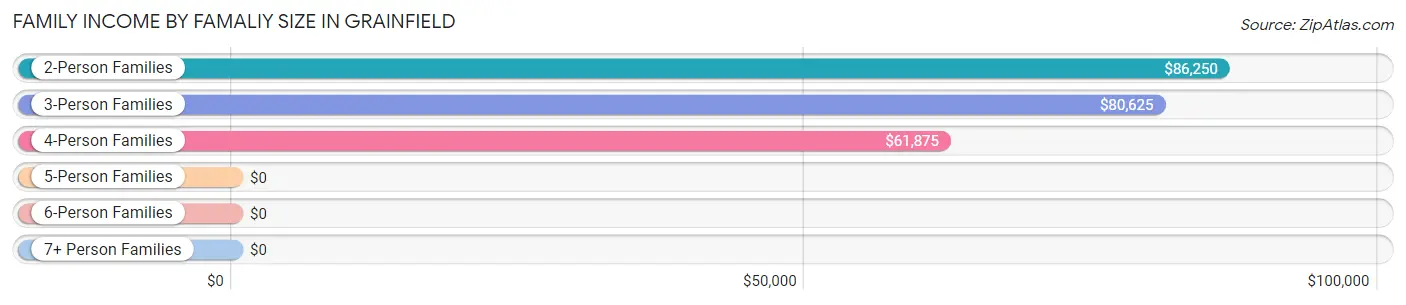
| Income Bracket | # Families | Median Income |
| 2-Person Families | 29 (53.7%) | $86,250 |
| 3-Person Families | 7 (13.0%) | $80,625 |
| 4-Person Families | 11 (20.4%) | $61,875 |
| 5-Person Families | 6 (11.1%) | $0 |
| 6-Person Families | 1 (1.8%) | $0 |
| 7+ Person Families | 0 (0.0%) | $0 |
| Total | 54 (100.0%) | $76,250 |
Family Income by Number of Earners in Grainfield
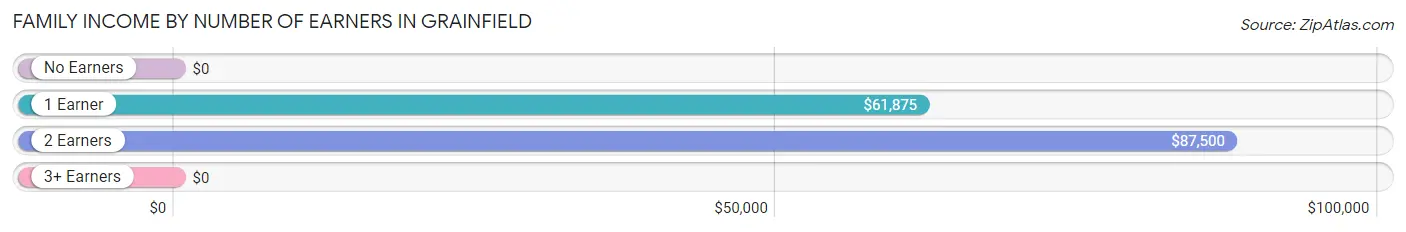
| Number of Earners | # Families | Median Income |
| No Earners | 13 (24.1%) | $0 |
| 1 Earner | 7 (13.0%) | $61,875 |
| 2 Earners | 30 (55.6%) | $87,500 |
| 3+ Earners | 4 (7.4%) | $0 |
| Total | 54 (100.0%) | $76,250 |
Household Income in Grainfield
Household Income Brackets in Grainfield
With 30 households falling in the category, the $15,000 to $24,999 income range is the most frequent in Grainfield, accounting for 23.8% of all households.

| Income Bracket | # Households | % Households |
| Less than $10,000 | 3 | 2.4% |
| $10,000 to $14,999 | 0 | 0.0% |
| $15,000 to $24,999 | 30 | 23.8% |
| $25,000 to $34,999 | 21 | 16.7% |
| $35,000 to $49,999 | 22 | 17.5% |
| $50,000 to $74,999 | 12 | 9.5% |
| $75,000 to $99,999 | 18 | 14.3% |
| $100,000 to $149,999 | 15 | 11.9% |
| $150,000 to $199,999 | 1 | 0.8% |
| $200,000+ | 4 | 3.2% |
Household Income by Householder Age in Grainfield
The median household income in Grainfield is $43,571, with the highest median household income of $58,125 found in the 65+ years age bracket for the primary householder. A total of 37 households (29.4%) fall into this category. Meanwhile, the 15 to 24 years age bracket for the primary householder has the lowest median household income of $29,500, with 8 households (6.4%) in this group.
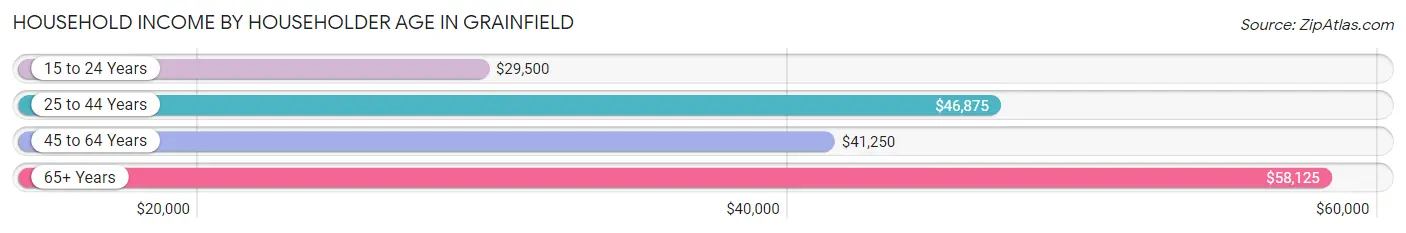
| Income Bracket | # Households | Median Income |
| 15 to 24 Years | 8 (6.4%) | $29,500 |
| 25 to 44 Years | 41 (32.5%) | $46,875 |
| 45 to 64 Years | 40 (31.8%) | $41,250 |
| 65+ Years | 37 (29.4%) | $58,125 |
| Total | 126 (100.0%) | $43,571 |
Poverty in Grainfield
Income Below Poverty by Sex and Age in Grainfield
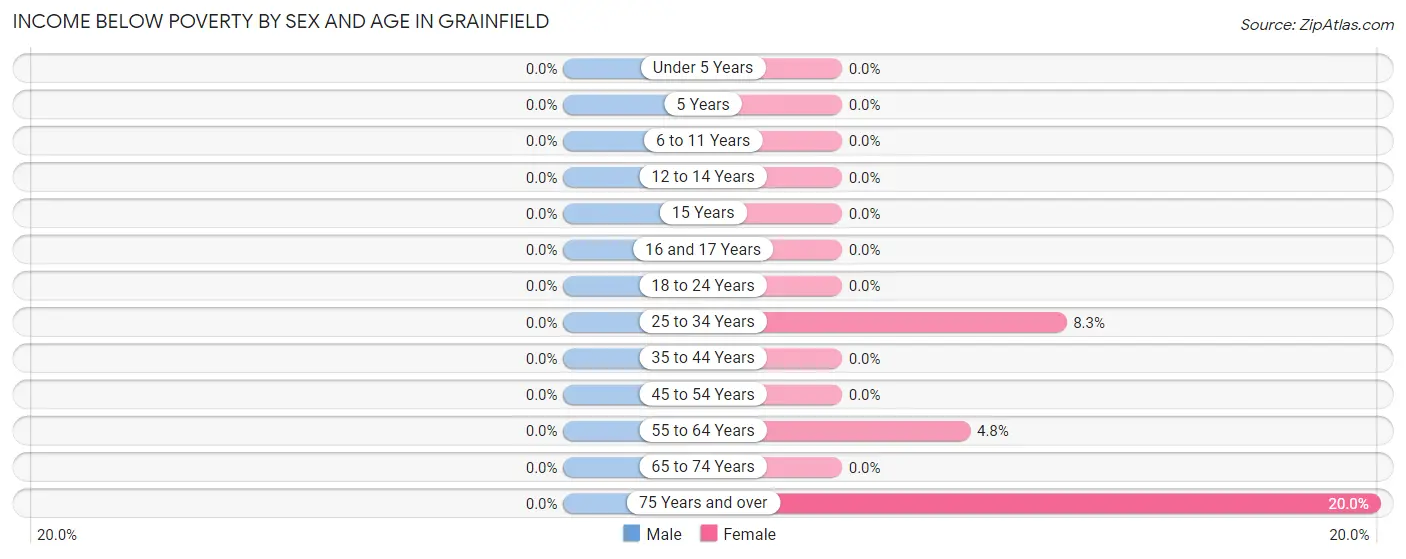
| Age Bracket | Male | Female |
| Under 5 Years | 0 (0.0%) | 0 (0.0%) |
| 5 Years | 0 (0.0%) | 0 (0.0%) |
| 6 to 11 Years | 0 (0.0%) | 0 (0.0%) |
| 12 to 14 Years | 0 (0.0%) | 0 (0.0%) |
| 15 Years | 0 (0.0%) | 0 (0.0%) |
| 16 and 17 Years | 0 (0.0%) | 0 (0.0%) |
| 18 to 24 Years | 0 (0.0%) | 0 (0.0%) |
| 25 to 34 Years | 0 (0.0%) | 1 (8.3%) |
| 35 to 44 Years | 0 (0.0%) | 0 (0.0%) |
| 45 to 54 Years | 0 (0.0%) | 0 (0.0%) |
| 55 to 64 Years | 0 (0.0%) | 1 (4.8%) |
| 65 to 74 Years | 0 (0.0%) | 0 (0.0%) |
| 75 Years and over | 0 (0.0%) | 2 (20.0%) |
| Total | 0 (0.0%) | 4 (3.8%) |
Income Above Poverty by Sex and Age in Grainfield
According to the poverty statistics in Grainfield, males aged under 5 years and females aged under 5 years are the age groups that are most secure financially, with 100.0% of males and 100.0% of females in these age groups living above the poverty line.
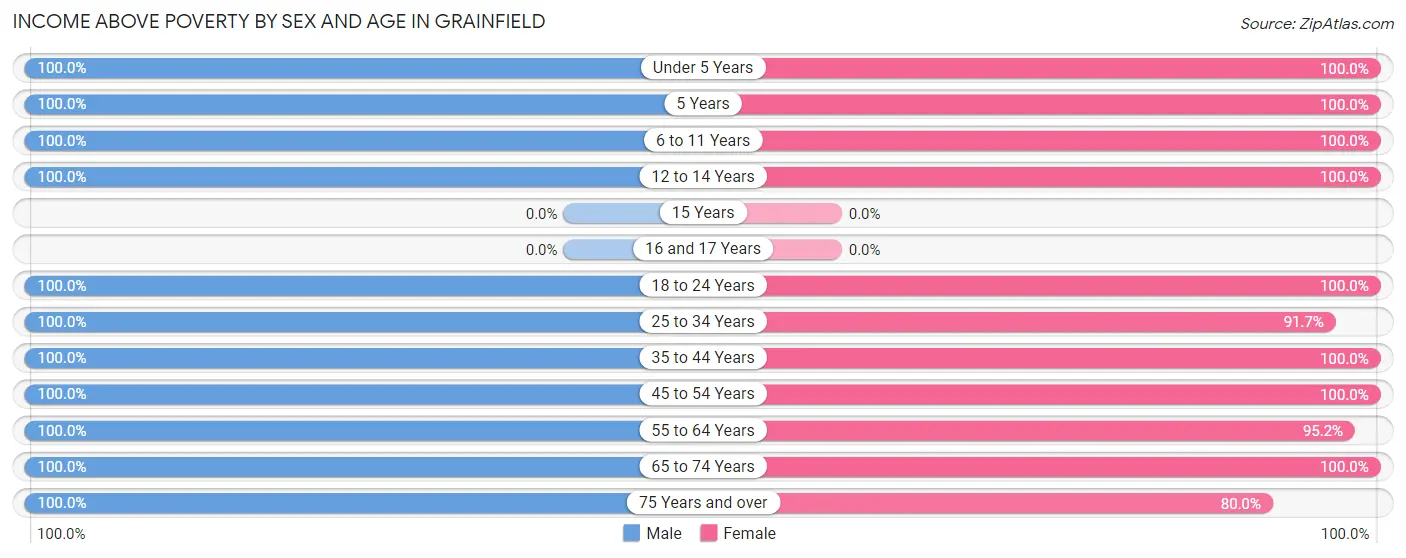
| Age Bracket | Male | Female |
| Under 5 Years | 12 (100.0%) | 2 (100.0%) |
| 5 Years | 1 (100.0%) | 1 (100.0%) |
| 6 to 11 Years | 19 (100.0%) | 8 (100.0%) |
| 12 to 14 Years | 6 (100.0%) | 4 (100.0%) |
| 15 Years | 0 (0.0%) | 0 (0.0%) |
| 16 and 17 Years | 0 (0.0%) | 0 (0.0%) |
| 18 to 24 Years | 13 (100.0%) | 4 (100.0%) |
| 25 to 34 Years | 27 (100.0%) | 11 (91.7%) |
| 35 to 44 Years | 18 (100.0%) | 7 (100.0%) |
| 45 to 54 Years | 8 (100.0%) | 10 (100.0%) |
| 55 to 64 Years | 17 (100.0%) | 20 (95.2%) |
| 65 to 74 Years | 13 (100.0%) | 25 (100.0%) |
| 75 Years and over | 6 (100.0%) | 8 (80.0%) |
| Total | 140 (100.0%) | 100 (96.2%) |
Income Below Poverty Among Married-Couple Families in Grainfield
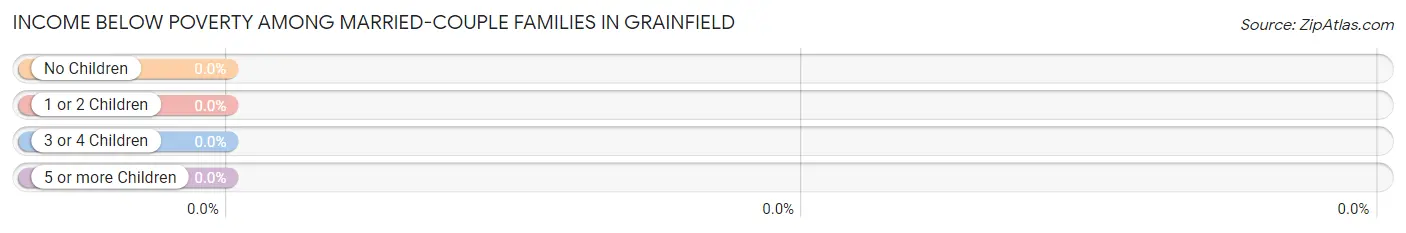
| Children | Above Poverty | Below Poverty |
| No Children | 28 (100.0%) | 0 (0.0%) |
| 1 or 2 Children | 11 (100.0%) | 0 (0.0%) |
| 3 or 4 Children | 7 (100.0%) | 0 (0.0%) |
| 5 or more Children | 0 (0.0%) | 0 (0.0%) |
| Total | 46 (100.0%) | 0 (0.0%) |
Income Below Poverty Among Single-Parent Households in Grainfield
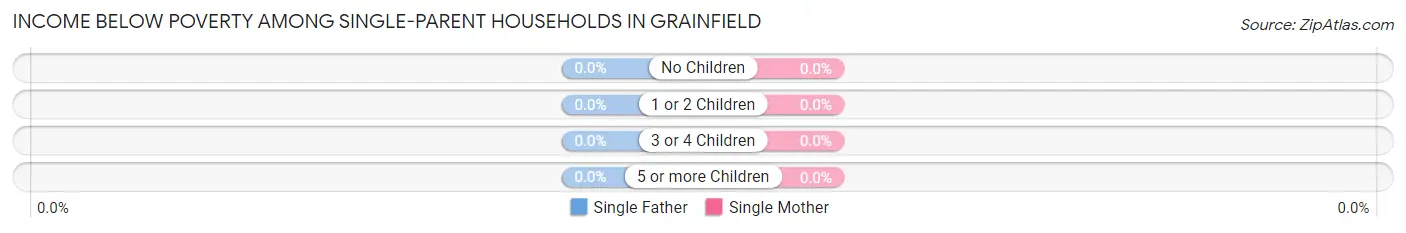
| Children | Single Father | Single Mother |
| No Children | 0 (0.0%) | 0 (0.0%) |
| 1 or 2 Children | 0 (0.0%) | 0 (0.0%) |
| 3 or 4 Children | 0 (0.0%) | 0 (0.0%) |
| 5 or more Children | 0 (0.0%) | 0 (0.0%) |
| Total | 0 (0.0%) | 0 (0.0%) |
Income Below Poverty Among Married-Couple vs Single-Parent Households in Grainfield
| Children | Married-Couple Families | Single-Parent Households |
| No Children | 0 (0.0%) | 0 (0.0%) |
| 1 or 2 Children | 0 (0.0%) | 0 (0.0%) |
| 3 or 4 Children | 0 (0.0%) | 0 (0.0%) |
| 5 or more Children | 0 (0.0%) | 0 (0.0%) |
| Total | 0 (0.0%) | 0 (0.0%) |
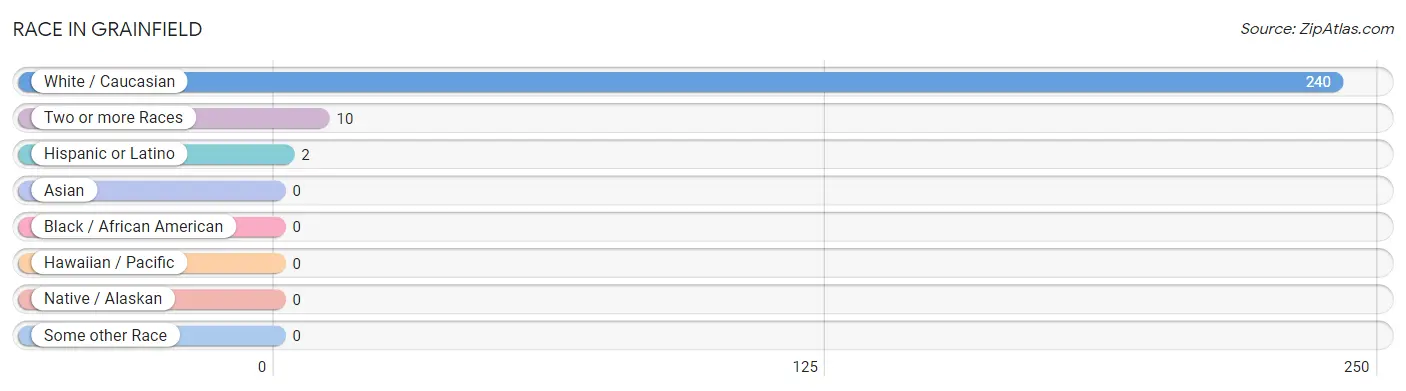
Race in Grainfield
The most populous races in Grainfield are White / Caucasian (240 | 96.0%), Two or more Races (10 | 4.0%), and Hispanic or Latino (2 | 0.8%).
| Race | # Population | % Population |
| Asian | 0 | 0.0% |
| Black / African American | 0 | 0.0% |
| Hawaiian / Pacific | 0 | 0.0% |
| Hispanic or Latino | 2 | 0.8% |
| Native / Alaskan | 0 | 0.0% |
| White / Caucasian | 240 | 96.0% |
| Two or more Races | 10 | 4.0% |
| Some other Race | 0 | 0.0% |
| Total | 250 | 100.0% |
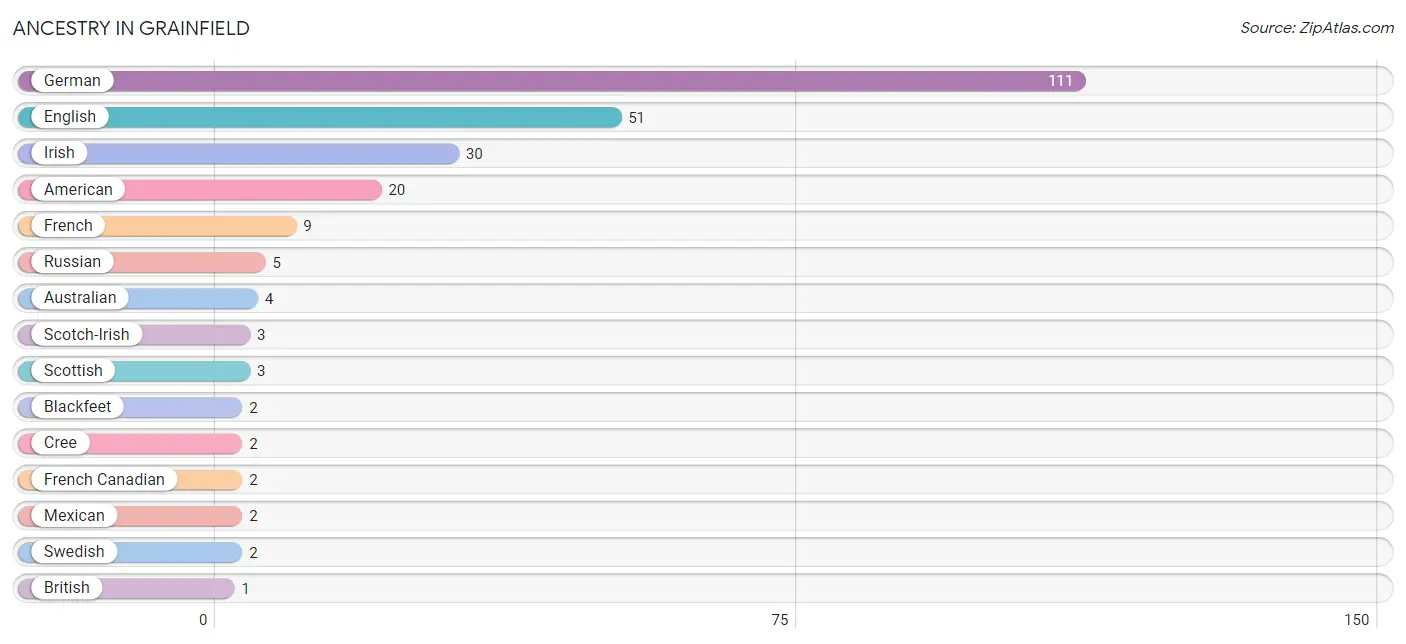
Ancestry in Grainfield
The most populous ancestries reported in Grainfield are German (111 | 44.4%), English (51 | 20.4%), Irish (30 | 12.0%), American (20 | 8.0%), and French (9 | 3.6%), together accounting for 88.4% of all Grainfield residents.
| Ancestry | # Population | % Population |
| American | 20 | 8.0% |
| Australian | 4 | 1.6% |
| Blackfeet | 2 | 0.8% |
| British | 1 | 0.4% |
| Cree | 2 | 0.8% |
| English | 51 | 20.4% |
| French | 9 | 3.6% |
| French Canadian | 2 | 0.8% |
| German | 111 | 44.4% |
| German Russian | 1 | 0.4% |
| Irish | 30 | 12.0% |
| Italian | 1 | 0.4% |
| Mexican | 2 | 0.8% |
| Russian | 5 | 2.0% |
| Scotch-Irish | 3 | 1.2% |
| Scottish | 3 | 1.2% |
| Swedish | 2 | 0.8% | View All 17 Rows |
Immigrants in Grainfield

| Immigration Origin | # Population | % Population | View All 0 Rows |
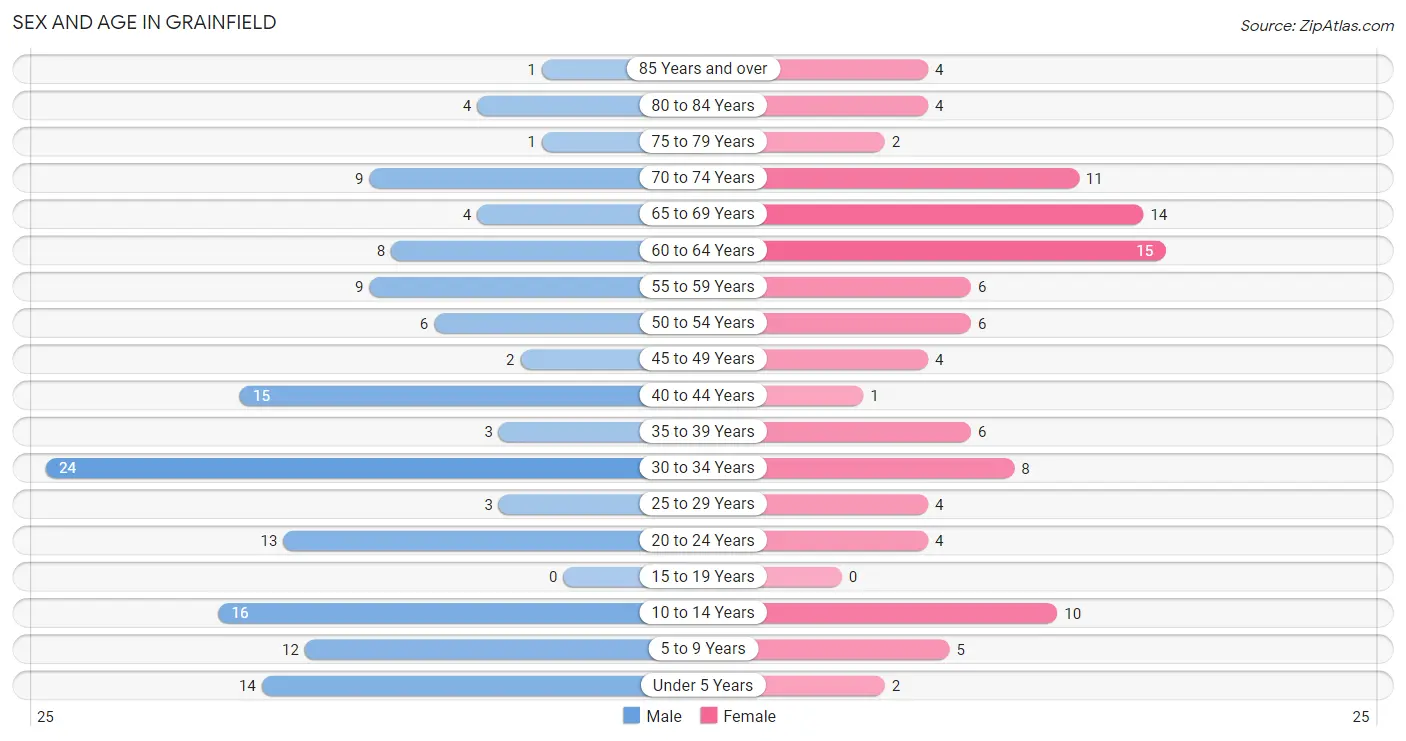
Sex and Age in Grainfield
Sex and Age in Grainfield
The most populous age groups in Grainfield are 30 to 34 Years (24 | 16.7%) for men and 60 to 64 Years (15 | 14.1%) for women.
| Age Bracket | Male | Female |
| Under 5 Years | 14 (9.7%) | 2 (1.9%) |
| 5 to 9 Years | 12 (8.3%) | 5 (4.7%) |
| 10 to 14 Years | 16 (11.1%) | 10 (9.4%) |
| 15 to 19 Years | 0 (0.0%) | 0 (0.0%) |
| 20 to 24 Years | 13 (9.0%) | 4 (3.8%) |
| 25 to 29 Years | 3 (2.1%) | 4 (3.8%) |
| 30 to 34 Years | 24 (16.7%) | 8 (7.5%) |
| 35 to 39 Years | 3 (2.1%) | 6 (5.7%) |
| 40 to 44 Years | 15 (10.4%) | 1 (0.9%) |
| 45 to 49 Years | 2 (1.4%) | 4 (3.8%) |
| 50 to 54 Years | 6 (4.2%) | 6 (5.7%) |
| 55 to 59 Years | 9 (6.2%) | 6 (5.7%) |
| 60 to 64 Years | 8 (5.6%) | 15 (14.1%) |
| 65 to 69 Years | 4 (2.8%) | 14 (13.2%) |
| 70 to 74 Years | 9 (6.2%) | 11 (10.4%) |
| 75 to 79 Years | 1 (0.7%) | 2 (1.9%) |
| 80 to 84 Years | 4 (2.8%) | 4 (3.8%) |
| 85 Years and over | 1 (0.7%) | 4 (3.8%) |
| Total | 144 (100.0%) | 106 (100.0%) |
Families and Households in Grainfield
Median Family Size in Grainfield
The median family size in Grainfield is 3.07 persons per family, with single male/father families (2 | 3.7%) accounting for the largest median family size of 4 persons per family. On the other hand, married-couple families (46 | 85.2%) represent the smallest median family size with 2.96 persons per family.
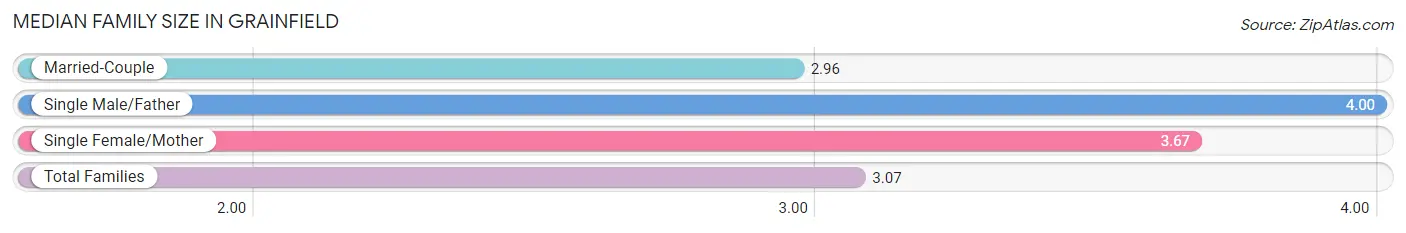
| Family Type | # Families | Family Size |
| Married-Couple | 46 (85.2%) | 2.96 |
| Single Male/Father | 2 (3.7%) | 4.00 |
| Single Female/Mother | 6 (11.1%) | 3.67 |
| Total Families | 54 (100.0%) | 3.07 |
Median Household Size in Grainfield
The median household size in Grainfield is 1.98 persons per household, with single female/mother households (6 | 4.8%) accounting for the largest median household size of 4.67 persons per household. non-family households (72 | 57.1%) represent the smallest median household size with 1.08 persons per household.
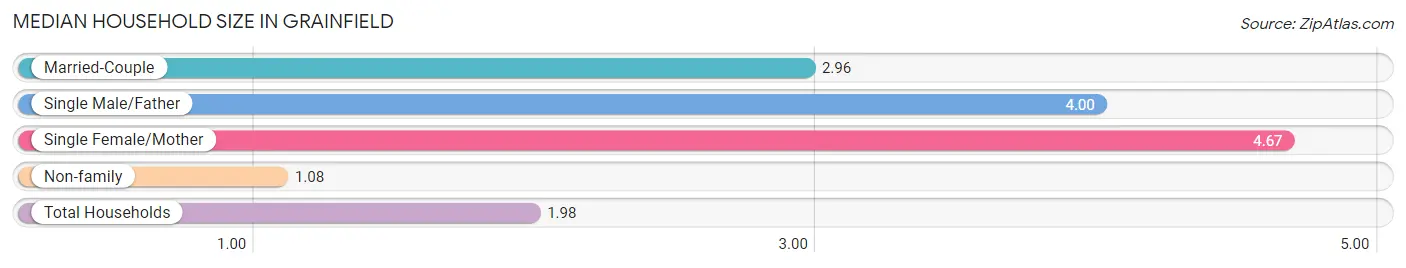
| Household Type | # Households | Household Size |
| Married-Couple | 46 (36.5%) | 2.96 |
| Single Male/Father | 2 (1.6%) | 4.00 |
| Single Female/Mother | 6 (4.8%) | 4.67 |
| Non-family | 72 (57.1%) | 1.08 |
| Total Households | 126 (100.0%) | 1.98 |
Household Size by Marriage Status in Grainfield
Out of a total of 126 households in Grainfield, 54 (42.9%) are family households, while 72 (57.1%) are nonfamily households. The most numerous type of family households are 2-person households, comprising 29, and the most common type of nonfamily households are 1-person households, comprising 68.
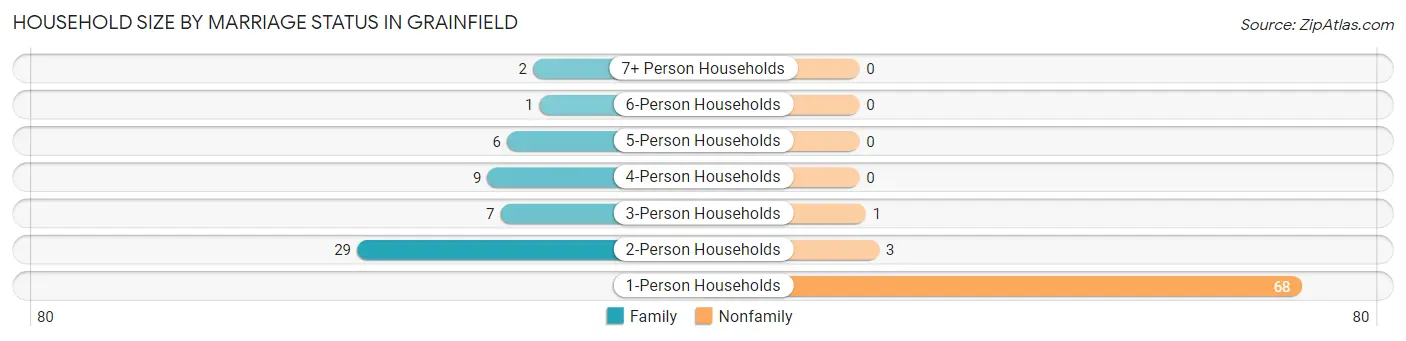
| Household Size | Family Households | Nonfamily Households |
| 1-Person Households | - | 68 (54.0%) |
| 2-Person Households | 29 (23.0%) | 3 (2.4%) |
| 3-Person Households | 7 (5.6%) | 1 (0.8%) |
| 4-Person Households | 9 (7.1%) | 0 (0.0%) |
| 5-Person Households | 6 (4.8%) | 0 (0.0%) |
| 6-Person Households | 1 (0.8%) | 0 (0.0%) |
| 7+ Person Households | 2 (1.6%) | 0 (0.0%) |
| Total | 54 (42.9%) | 72 (57.1%) |
Female Fertility in Grainfield
Fertility by Age in Grainfield
Average fertility rate in Grainfield is 36.0 births per 1,000 women. Women in the age bracket of 20 to 34 years have the highest fertility rate with 63.0 births per 1,000 women. Women in the age bracket of 20 to 34 years acount for 100.0% of all women with births.
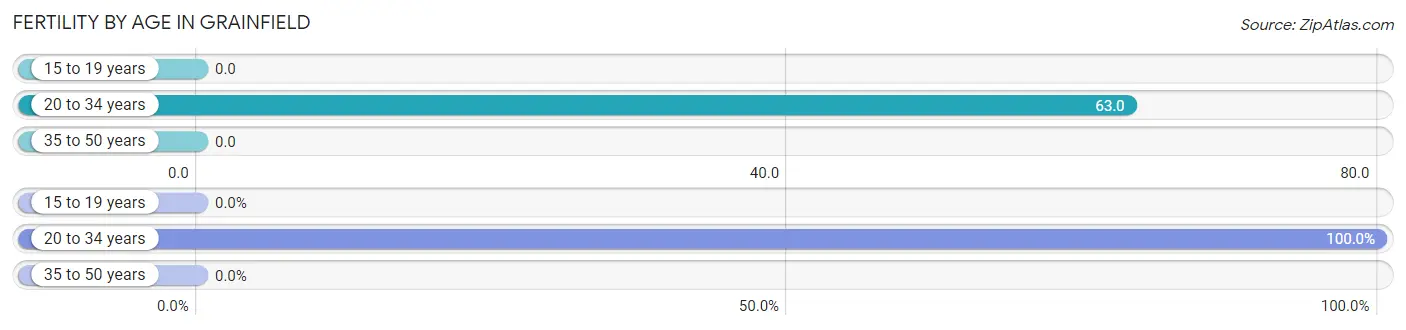
| Age Bracket | Women with Births | Births / 1,000 Women |
| 15 to 19 years | 0 (0.0%) | 0.0 |
| 20 to 34 years | 1 (100.0%) | 63.0 |
| 35 to 50 years | 0 (0.0%) | 0.0 |
| Total | 1 (100.0%) | 36.0 |
Fertility by Age by Marriage Status in Grainfield
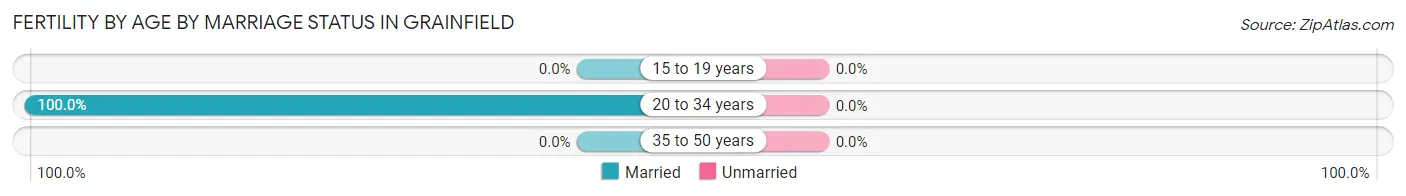
| Age Bracket | Married | Unmarried |
| 15 to 19 years | 0 (0.0%) | 0 (0.0%) |
| 20 to 34 years | 1 (100.0%) | 0 (0.0%) |
| 35 to 50 years | 0 (0.0%) | 0 (0.0%) |
| Total | 1 (100.0%) | 0 (0.0%) |
Fertility by Education in Grainfield
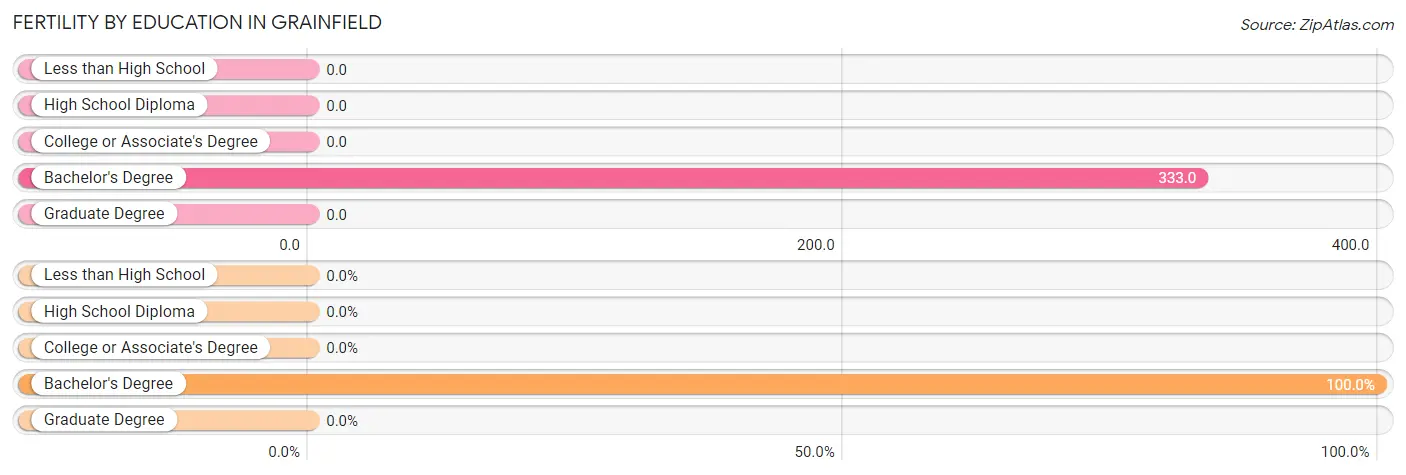
| Educational Attainment | Women with Births | Births / 1,000 Women |
| Less than High School | 0 (0.0%) | 0.0 |
| High School Diploma | 0 (0.0%) | 0.0 |
| College or Associate's Degree | 0 (0.0%) | 0.0 |
| Bachelor's Degree | 1 (100.0%) | 333.0 |
| Graduate Degree | 0 (0.0%) | 0.0 |
| Total | 1 (100.0%) | 36.0 |
Fertility by Education by Marriage Status in Grainfield
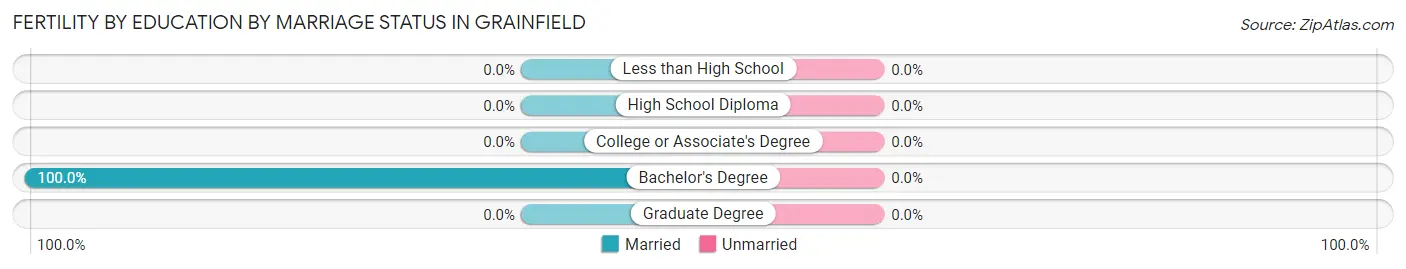
| Educational Attainment | Married | Unmarried |
| Less than High School | 0 (0.0%) | 0 (0.0%) |
| High School Diploma | 0 (0.0%) | 0 (0.0%) |
| College or Associate's Degree | 0 (0.0%) | 0 (0.0%) |
| Bachelor's Degree | 1 (100.0%) | 0 (0.0%) |
| Graduate Degree | 0 (0.0%) | 0 (0.0%) |
| Total | 1 (100.0%) | 0 (0.0%) |
Employment Characteristics in Grainfield
Employment by Class of Employer in Grainfield
Among the 124 employed individuals in Grainfield, private company employees (65 | 52.4%), self-employed (not incorporated) (22 | 17.7%), and local government employees (17 | 13.7%) make up the most common classes of employment.
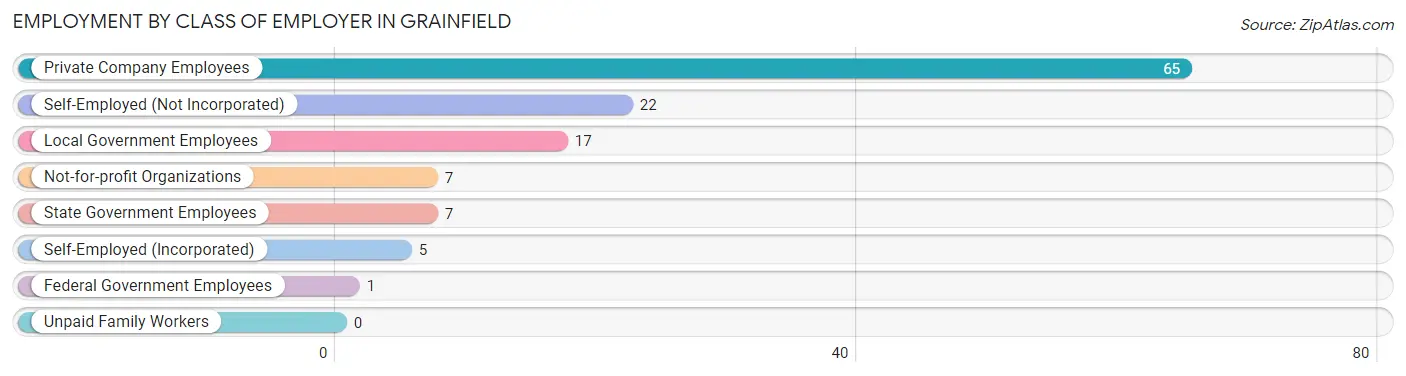
| Employer Class | # Employees | % Employees |
| Private Company Employees | 65 | 52.4% |
| Self-Employed (Incorporated) | 5 | 4.0% |
| Self-Employed (Not Incorporated) | 22 | 17.7% |
| Not-for-profit Organizations | 7 | 5.7% |
| Local Government Employees | 17 | 13.7% |
| State Government Employees | 7 | 5.7% |
| Federal Government Employees | 1 | 0.8% |
| Unpaid Family Workers | 0 | 0.0% |
| Total | 124 | 100.0% |
Employment Status by Age in Grainfield
According to the labor force statistics for Grainfield, out of the total population over 16 years of age (191), 74.9% or 143 individuals are in the labor force, with 11.2% or 16 of them unemployed. The age group with the highest labor force participation rate is 20 to 24 years, with 100.0% or 17 individuals in the labor force. Within the labor force, the 30 to 34 years age range has the highest percentage of unemployed individuals, with 34.4% or 11 of them being unemployed.
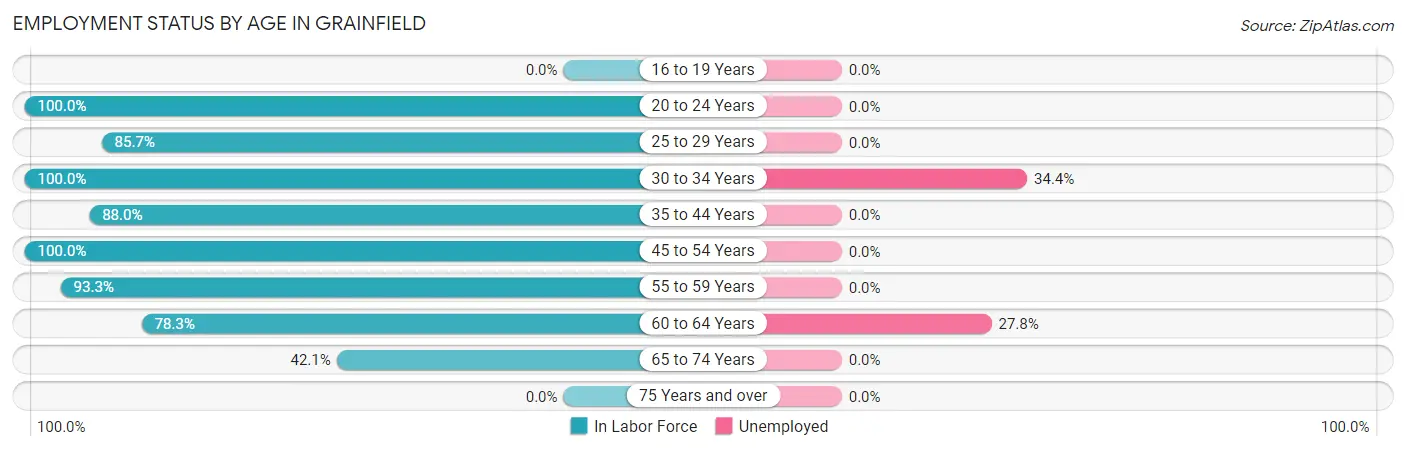
| Age Bracket | In Labor Force | Unemployed |
| 16 to 19 Years | 0 (0.0%) | 0 (0.0%) |
| 20 to 24 Years | 17 (100.0%) | 0 (0.0%) |
| 25 to 29 Years | 6 (85.7%) | 0 (0.0%) |
| 30 to 34 Years | 32 (100.0%) | 11 (34.4%) |
| 35 to 44 Years | 22 (88.0%) | 0 (0.0%) |
| 45 to 54 Years | 18 (100.0%) | 0 (0.0%) |
| 55 to 59 Years | 14 (93.3%) | 0 (0.0%) |
| 60 to 64 Years | 18 (78.3%) | 5 (27.8%) |
| 65 to 74 Years | 16 (42.1%) | 0 (0.0%) |
| 75 Years and over | 0 (0.0%) | 0 (0.0%) |
| Total | 143 (74.9%) | 16 (11.2%) |
Employment Status by Educational Attainment in Grainfield
According to labor force statistics for Grainfield, 91.7% of individuals (110) out of the total population between 25 and 64 years of age (120) are in the labor force, with 14.5% or 16 of them being unemployed. The group with the highest labor force participation rate are those with the educational attainment of less than high school, with 100.0% or 10 individuals in the labor force. Within the labor force, individuals with college / associate degree education have the highest percentage of unemployment, with 27.1% or 16 of them being unemployed.
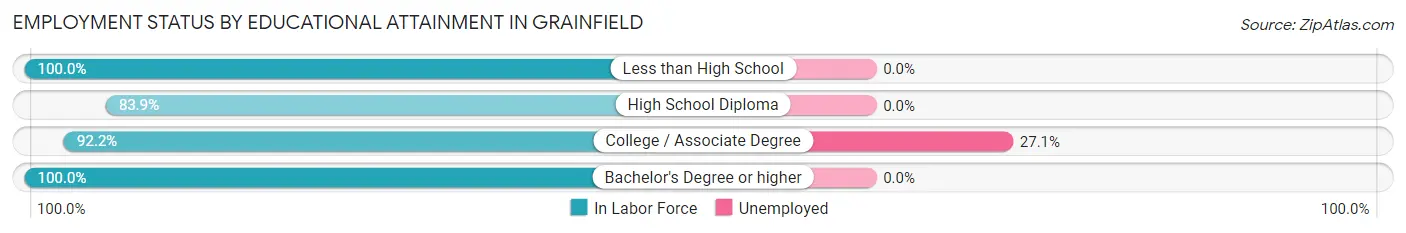
| Educational Attainment | In Labor Force | Unemployed |
| Less than High School | 10 (100.0%) | 0 (0.0%) |
| High School Diploma | 26 (83.9%) | 0 (0.0%) |
| College / Associate Degree | 59 (92.2%) | 17 (27.1%) |
| Bachelor's Degree or higher | 15 (100.0%) | 0 (0.0%) |
| Total | 110 (91.7%) | 17 (14.5%) |
Employment Occupations by Sex in Grainfield
Management, Business, Science and Arts Occupations
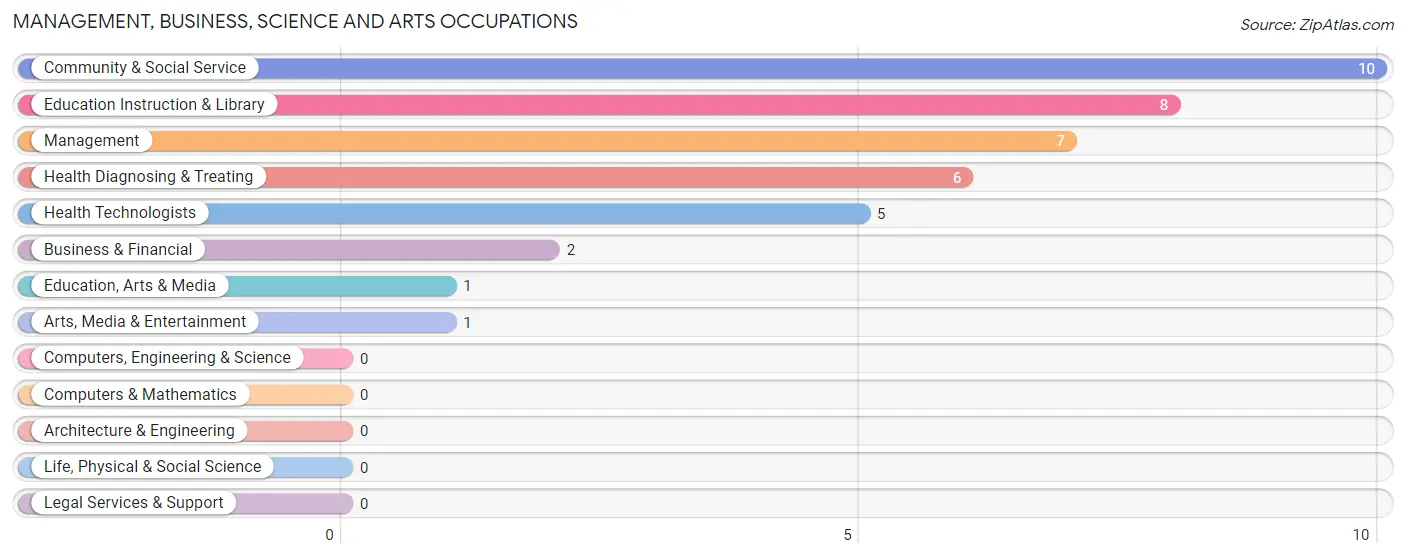
The most common Management, Business, Science and Arts occupations in Grainfield are Community & Social Service (10 | 7.9%), Education Instruction & Library (8 | 6.3%), Management (7 | 5.5%), Health Diagnosing & Treating (6 | 4.7%), and Health Technologists (5 | 3.9%).
Management, Business, Science and Arts Occupations by Sex
Within the Management, Business, Science and Arts occupations in Grainfield, the most male-oriented occupations are Education, Arts & Media (100.0%), Arts, Media & Entertainment (100.0%), and Management (71.4%), while the most female-oriented occupations are Business & Financial (100.0%), Health Diagnosing & Treating (100.0%), and Health Technologists (100.0%).
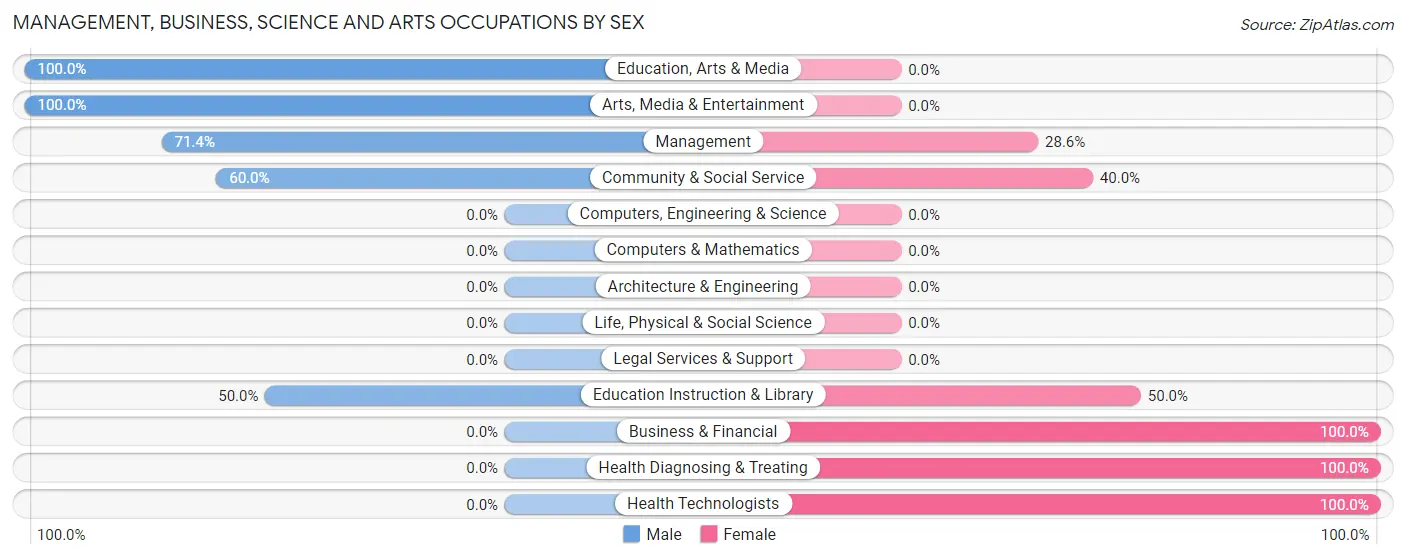
| Occupation | Male | Female |
| Management | 5 (71.4%) | 2 (28.6%) |
| Business & Financial | 0 (0.0%) | 2 (100.0%) |
| Computers, Engineering & Science | 0 (0.0%) | 0 (0.0%) |
| Computers & Mathematics | 0 (0.0%) | 0 (0.0%) |
| Architecture & Engineering | 0 (0.0%) | 0 (0.0%) |
| Life, Physical & Social Science | 0 (0.0%) | 0 (0.0%) |
| Community & Social Service | 6 (60.0%) | 4 (40.0%) |
| Education, Arts & Media | 1 (100.0%) | 0 (0.0%) |
| Legal Services & Support | 0 (0.0%) | 0 (0.0%) |
| Education Instruction & Library | 4 (50.0%) | 4 (50.0%) |
| Arts, Media & Entertainment | 1 (100.0%) | 0 (0.0%) |
| Health Diagnosing & Treating | 0 (0.0%) | 6 (100.0%) |
| Health Technologists | 0 (0.0%) | 5 (100.0%) |
| Total (Category) | 11 (44.0%) | 14 (56.0%) |
| Total (Overall) | 75 (59.1%) | 52 (40.9%) |
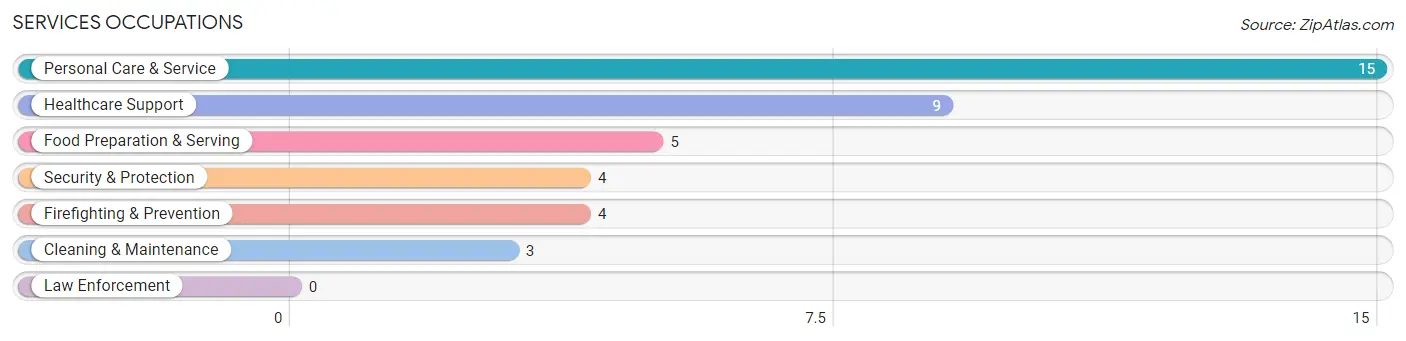
Services Occupations
The most common Services occupations in Grainfield are Personal Care & Service (15 | 11.8%), Healthcare Support (9 | 7.1%), Food Preparation & Serving (5 | 3.9%), Security & Protection (4 | 3.2%), and Firefighting & Prevention (4 | 3.2%).
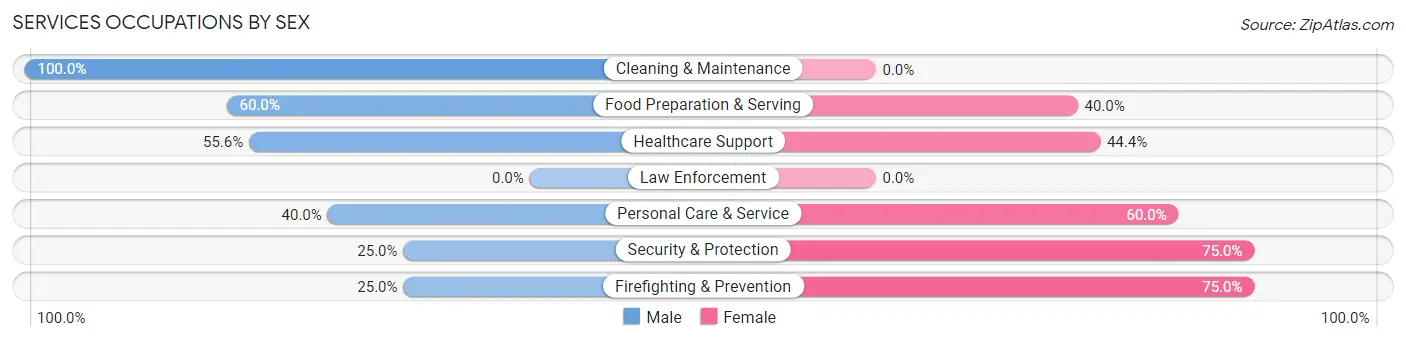
Services Occupations by Sex
Within the Services occupations in Grainfield, the most male-oriented occupations are Cleaning & Maintenance (100.0%), Food Preparation & Serving (60.0%), and Healthcare Support (55.6%), while the most female-oriented occupations are Security & Protection (75.0%), Firefighting & Prevention (75.0%), and Personal Care & Service (60.0%).
| Occupation | Male | Female |
| Healthcare Support | 5 (55.6%) | 4 (44.4%) |
| Security & Protection | 1 (25.0%) | 3 (75.0%) |
| Firefighting & Prevention | 1 (25.0%) | 3 (75.0%) |
| Law Enforcement | 0 (0.0%) | 0 (0.0%) |
| Food Preparation & Serving | 3 (60.0%) | 2 (40.0%) |
| Cleaning & Maintenance | 3 (100.0%) | 0 (0.0%) |
| Personal Care & Service | 6 (40.0%) | 9 (60.0%) |
| Total (Category) | 18 (50.0%) | 18 (50.0%) |
| Total (Overall) | 75 (59.1%) | 52 (40.9%) |
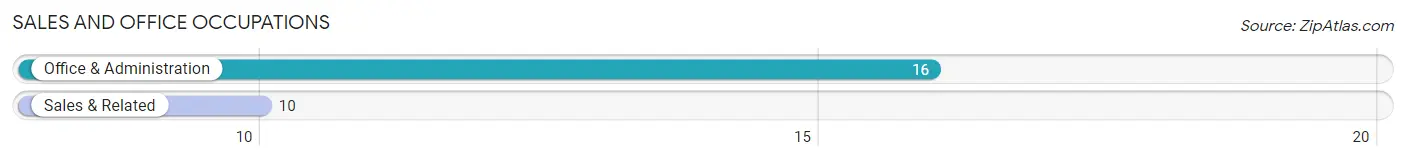
Sales and Office Occupations
The most common Sales and Office occupations in Grainfield are Office & Administration (16 | 12.6%), and Sales & Related (10 | 7.9%).
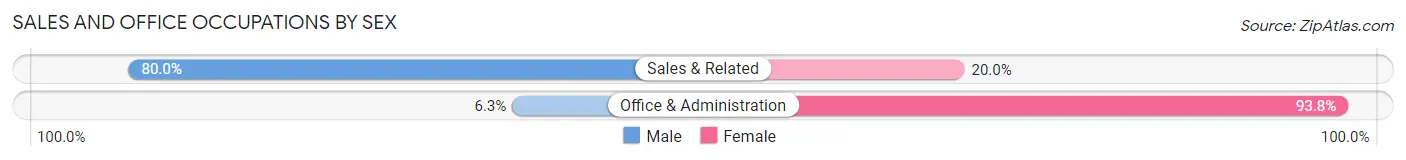
Sales and Office Occupations by Sex
| Occupation | Male | Female |
| Sales & Related | 8 (80.0%) | 2 (20.0%) |
| Office & Administration | 1 (6.2%) | 15 (93.8%) |
| Total (Category) | 9 (34.6%) | 17 (65.4%) |
| Total (Overall) | 75 (59.1%) | 52 (40.9%) |
Natural Resources, Construction and Maintenance Occupations
The most common Natural Resources, Construction and Maintenance occupations in Grainfield are Installation, Maintenance & Repair (10 | 7.9%), Construction & Extraction (8 | 6.3%), and Farming, Fishing & Forestry (4 | 3.2%).
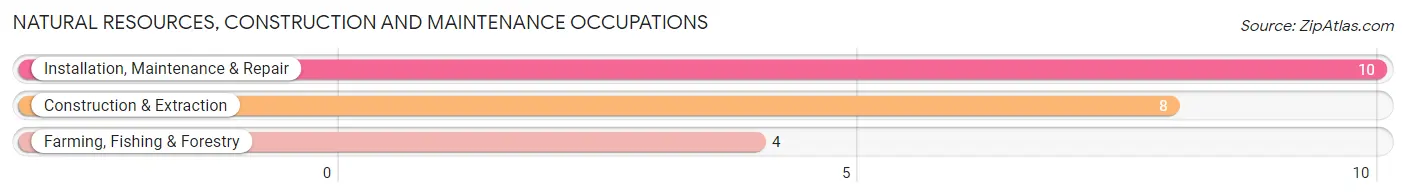
Natural Resources, Construction and Maintenance Occupations by Sex
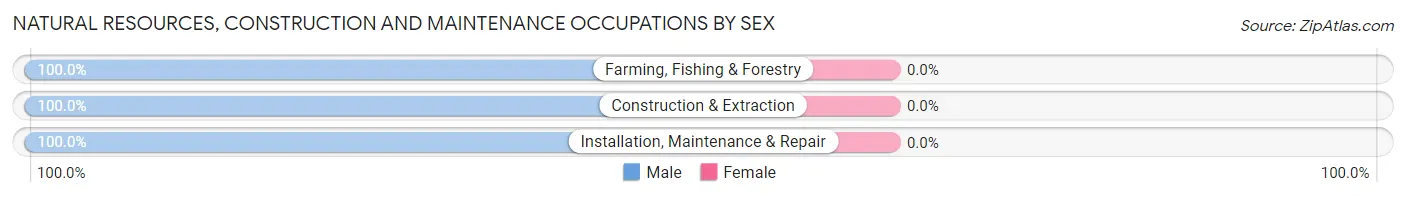
| Occupation | Male | Female |
| Farming, Fishing & Forestry | 4 (100.0%) | 0 (0.0%) |
| Construction & Extraction | 8 (100.0%) | 0 (0.0%) |
| Installation, Maintenance & Repair | 10 (100.0%) | 0 (0.0%) |
| Total (Category) | 22 (100.0%) | 0 (0.0%) |
| Total (Overall) | 75 (59.1%) | 52 (40.9%) |
Production, Transportation and Moving Occupations
The most common Production, Transportation and Moving occupations in Grainfield are Production (7 | 5.5%), Transportation (6 | 4.7%), and Material Moving (5 | 3.9%).
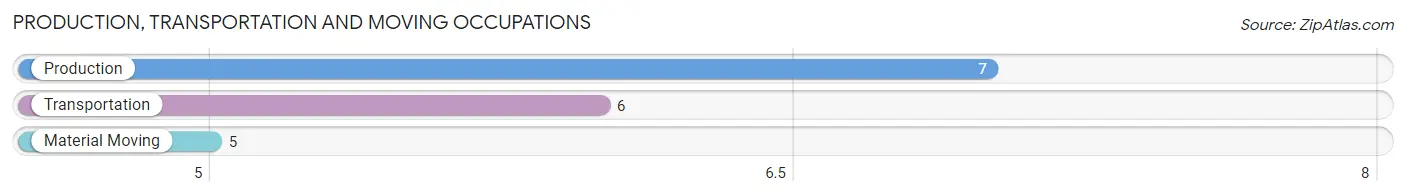
Production, Transportation and Moving Occupations by Sex
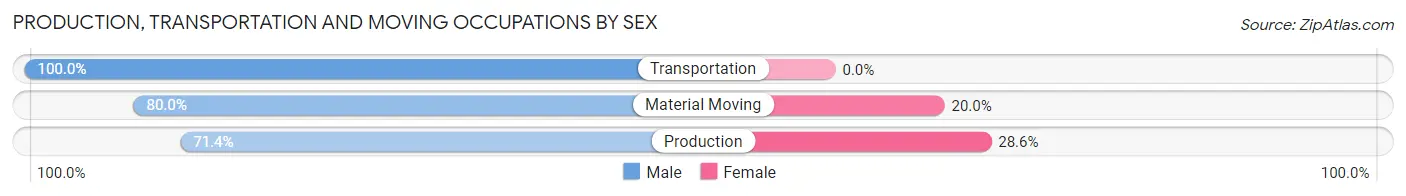
| Occupation | Male | Female |
| Production | 5 (71.4%) | 2 (28.6%) |
| Transportation | 6 (100.0%) | 0 (0.0%) |
| Material Moving | 4 (80.0%) | 1 (20.0%) |
| Total (Category) | 15 (83.3%) | 3 (16.7%) |
| Total (Overall) | 75 (59.1%) | 52 (40.9%) |
Employment Industries by Sex in Grainfield
Employment Industries in Grainfield
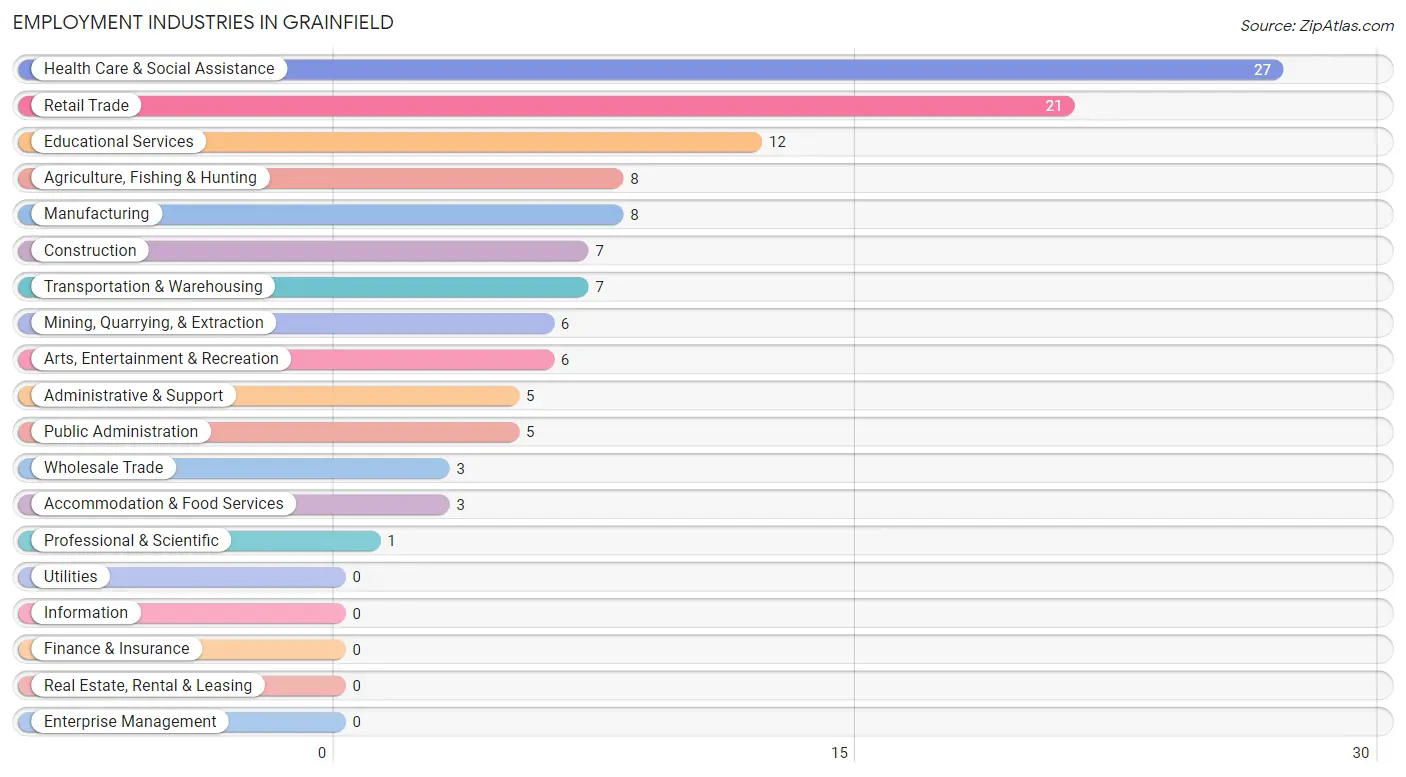
The major employment industries in Grainfield include Health Care & Social Assistance (27 | 21.3%), Retail Trade (21 | 16.5%), Educational Services (12 | 9.5%), Agriculture, Fishing & Hunting (8 | 6.3%), and Manufacturing (8 | 6.3%).
Employment Industries by Sex in Grainfield
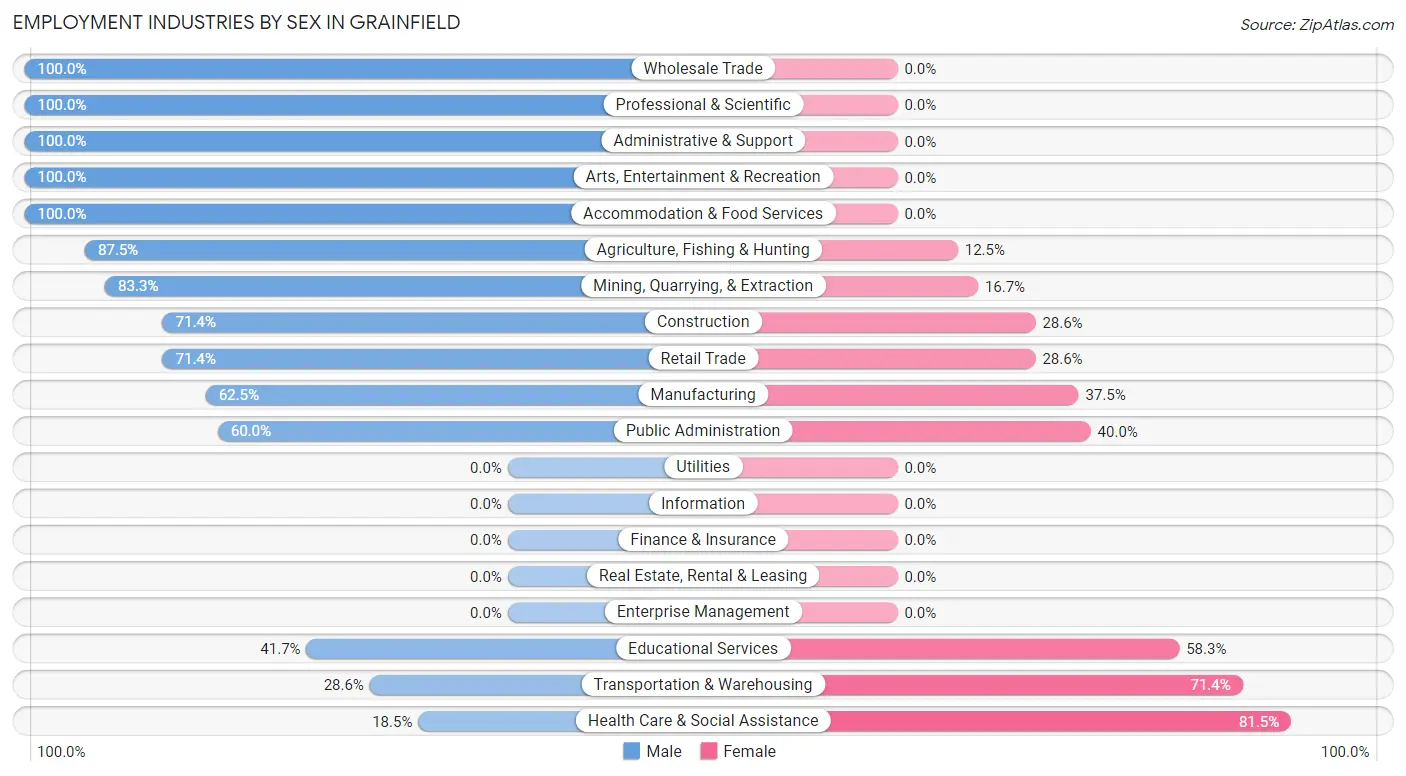
The Grainfield industries that see more men than women are Wholesale Trade (100.0%), Professional & Scientific (100.0%), and Administrative & Support (100.0%), whereas the industries that tend to have a higher number of women are Health Care & Social Assistance (81.5%), Transportation & Warehousing (71.4%), and Educational Services (58.3%).
| Industry | Male | Female |
| Agriculture, Fishing & Hunting | 7 (87.5%) | 1 (12.5%) |
| Mining, Quarrying, & Extraction | 5 (83.3%) | 1 (16.7%) |
| Construction | 5 (71.4%) | 2 (28.6%) |
| Manufacturing | 5 (62.5%) | 3 (37.5%) |
| Wholesale Trade | 3 (100.0%) | 0 (0.0%) |
| Retail Trade | 15 (71.4%) | 6 (28.6%) |
| Transportation & Warehousing | 2 (28.6%) | 5 (71.4%) |
| Utilities | 0 (0.0%) | 0 (0.0%) |
| Information | 0 (0.0%) | 0 (0.0%) |
| Finance & Insurance | 0 (0.0%) | 0 (0.0%) |
| Real Estate, Rental & Leasing | 0 (0.0%) | 0 (0.0%) |
| Professional & Scientific | 1 (100.0%) | 0 (0.0%) |
| Enterprise Management | 0 (0.0%) | 0 (0.0%) |
| Administrative & Support | 5 (100.0%) | 0 (0.0%) |
| Educational Services | 5 (41.7%) | 7 (58.3%) |
| Health Care & Social Assistance | 5 (18.5%) | 22 (81.5%) |
| Arts, Entertainment & Recreation | 6 (100.0%) | 0 (0.0%) |
| Accommodation & Food Services | 3 (100.0%) | 0 (0.0%) |
| Public Administration | 3 (60.0%) | 2 (40.0%) |
| Total | 75 (59.1%) | 52 (40.9%) |
Education in Grainfield
School Enrollment in Grainfield
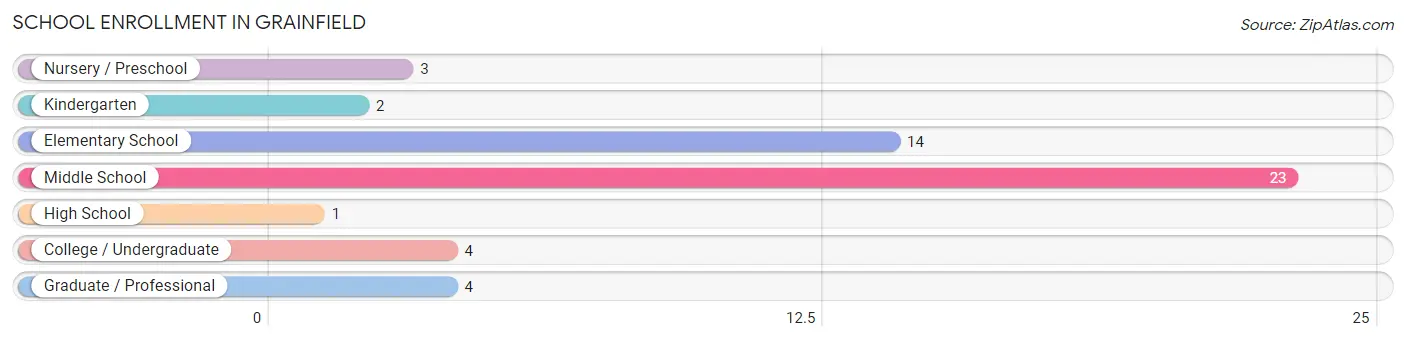
The most common levels of schooling among the 51 students in Grainfield are middle school (23 | 45.1%), elementary school (14 | 27.5%), and college / undergraduate (4 | 7.8%).
| School Level | # Students | % Students |
| Nursery / Preschool | 3 | 5.9% |
| Kindergarten | 2 | 3.9% |
| Elementary School | 14 | 27.5% |
| Middle School | 23 | 45.1% |
| High School | 1 | 2.0% |
| College / Undergraduate | 4 | 7.8% |
| Graduate / Professional | 4 | 7.8% |
| Total | 51 | 100.0% |
School Enrollment by Age by Funding Source in Grainfield
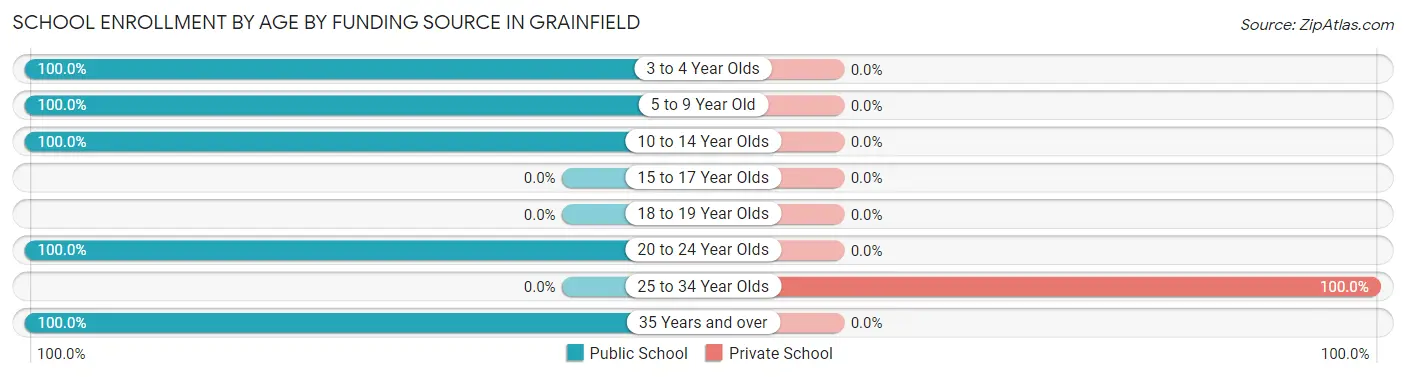
Out of a total of 51 students who are enrolled in schools in Grainfield, 4 (7.8%) attend a private institution, while the remaining 47 (92.2%) are enrolled in public schools. The age group of 25 to 34 year olds has the highest likelihood of being enrolled in private schools, with 4 (100.0% in the age bracket) enrolled. Conversely, the age group of 3 to 4 year olds has the lowest likelihood of being enrolled in a private school, with 3 (100.0% in the age bracket) attending a public institution.
| Age Bracket | Public School | Private School |
| 3 to 4 Year Olds | 3 (100.0%) | 0 (0.0%) |
| 5 to 9 Year Old | 15 (100.0%) | 0 (0.0%) |
| 10 to 14 Year Olds | 25 (100.0%) | 0 (0.0%) |
| 15 to 17 Year Olds | 0 (0.0%) | 0 (0.0%) |
| 18 to 19 Year Olds | 0 (0.0%) | 0 (0.0%) |
| 20 to 24 Year Olds | 2 (100.0%) | 0 (0.0%) |
| 25 to 34 Year Olds | 0 (0.0%) | 4 (100.0%) |
| 35 Years and over | 2 (100.0%) | 0 (0.0%) |
| Total | 47 (92.2%) | 4 (7.8%) |
Educational Attainment by Field of Study in Grainfield
Business (9 | 37.5%), education (5 | 20.8%), social sciences (3 | 12.5%), arts & humanities (3 | 12.5%), and science & technology (2 | 8.3%) are the most common fields of study among 24 individuals in Grainfield who have obtained a bachelor's degree or higher.
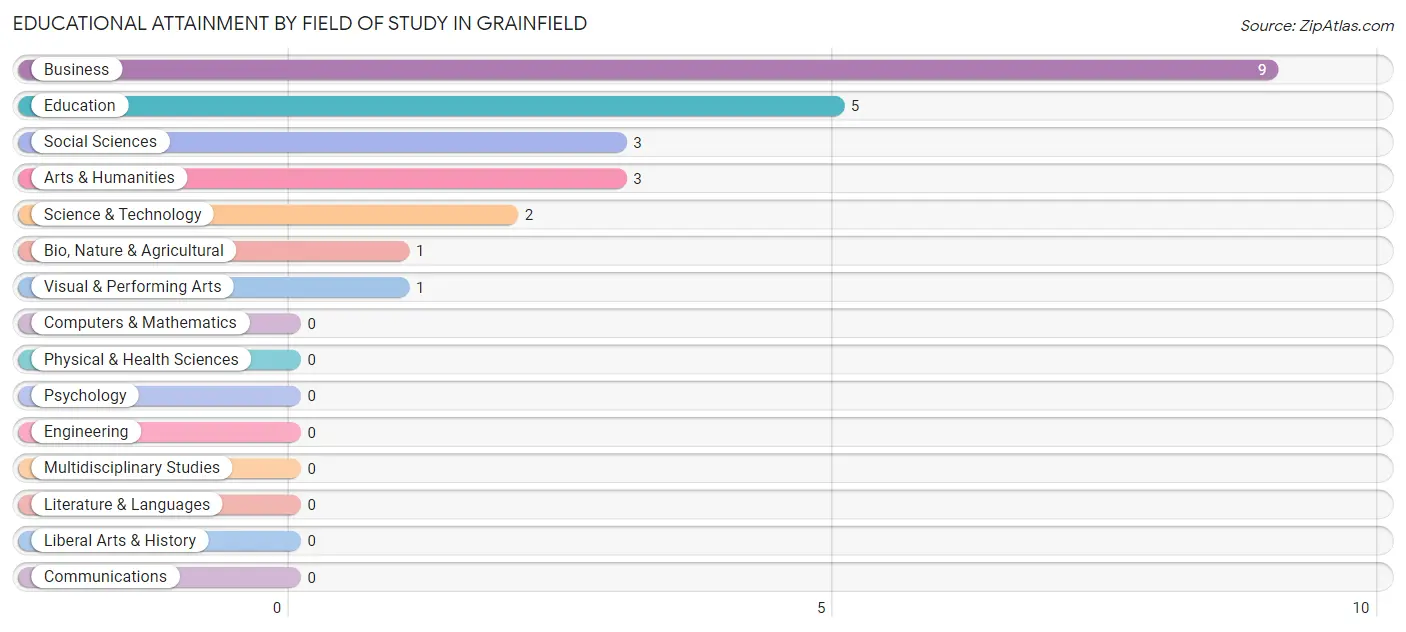
| Field of Study | # Graduates | % Graduates |
| Computers & Mathematics | 0 | 0.0% |
| Bio, Nature & Agricultural | 1 | 4.2% |
| Physical & Health Sciences | 0 | 0.0% |
| Psychology | 0 | 0.0% |
| Social Sciences | 3 | 12.5% |
| Engineering | 0 | 0.0% |
| Multidisciplinary Studies | 0 | 0.0% |
| Science & Technology | 2 | 8.3% |
| Business | 9 | 37.5% |
| Education | 5 | 20.8% |
| Literature & Languages | 0 | 0.0% |
| Liberal Arts & History | 0 | 0.0% |
| Visual & Performing Arts | 1 | 4.2% |
| Communications | 0 | 0.0% |
| Arts & Humanities | 3 | 12.5% |
| Total | 24 | 100.0% |
Transportation & Commute in Grainfield
Vehicle Availability by Sex in Grainfield
The most prevalent vehicle ownership categories in Grainfield are males with 2 vehicles (46, accounting for 61.3%) and females with 2 vehicles (17, making up 93.9%).
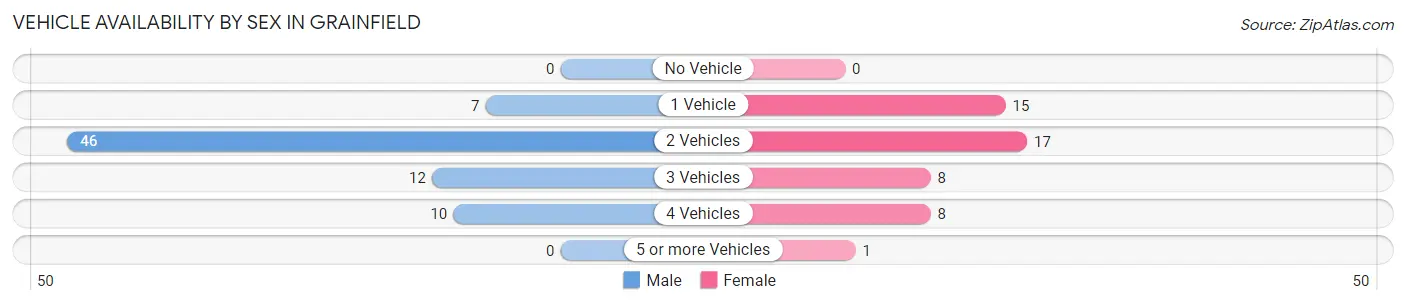
| Vehicles Available | Male | Female |
| No Vehicle | 0 (0.0%) | 0 (0.0%) |
| 1 Vehicle | 7 (9.3%) | 15 (30.6%) |
| 2 Vehicles | 46 (61.3%) | 17 (34.7%) |
| 3 Vehicles | 12 (16.0%) | 8 (16.3%) |
| 4 Vehicles | 10 (13.3%) | 8 (16.3%) |
| 5 or more Vehicles | 0 (0.0%) | 1 (2.0%) |
| Total | 75 (100.0%) | 49 (100.0%) |
Commute Time in Grainfield
The most frequently occuring commute durations in Grainfield are 5 to 9 minutes (31 commuters, 27.9%), less than 5 minutes (24 commuters, 21.6%), and 20 to 24 minutes (19 commuters, 17.1%).
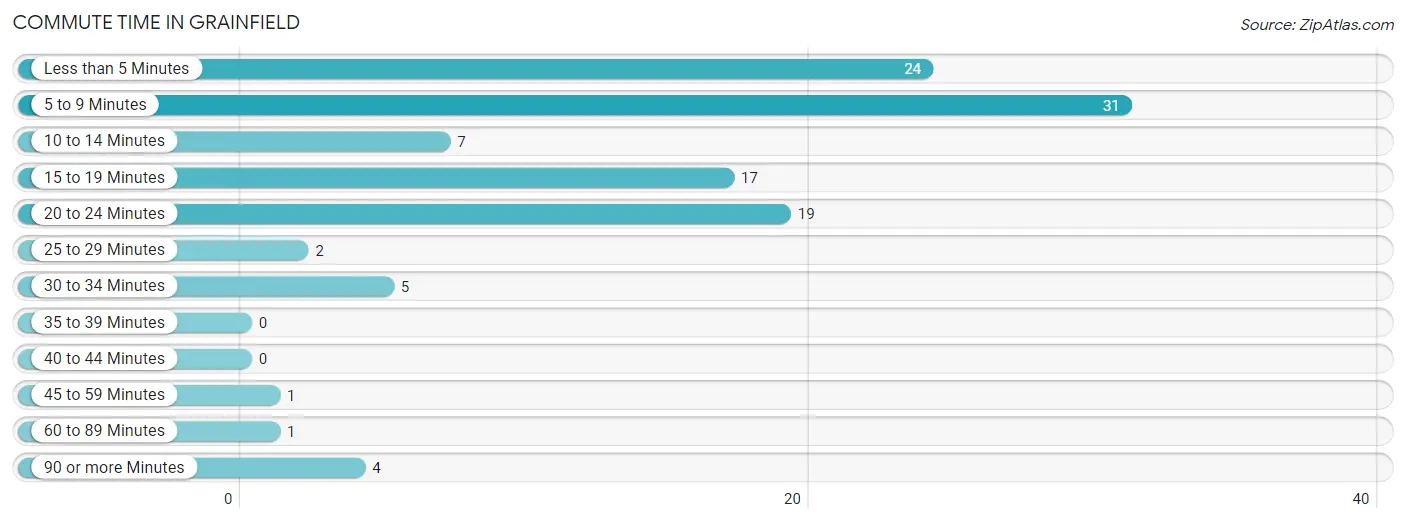
| Commute Time | # Commuters | % Commuters |
| Less than 5 Minutes | 24 | 21.6% |
| 5 to 9 Minutes | 31 | 27.9% |
| 10 to 14 Minutes | 7 | 6.3% |
| 15 to 19 Minutes | 17 | 15.3% |
| 20 to 24 Minutes | 19 | 17.1% |
| 25 to 29 Minutes | 2 | 1.8% |
| 30 to 34 Minutes | 5 | 4.5% |
| 35 to 39 Minutes | 0 | 0.0% |
| 40 to 44 Minutes | 0 | 0.0% |
| 45 to 59 Minutes | 1 | 0.9% |
| 60 to 89 Minutes | 1 | 0.9% |
| 90 or more Minutes | 4 | 3.6% |
Commute Time by Sex in Grainfield
The most common commute times in Grainfield are 5 to 9 minutes (24 commuters, 33.8%) for males and 20 to 24 minutes (11 commuters, 27.5%) for females.
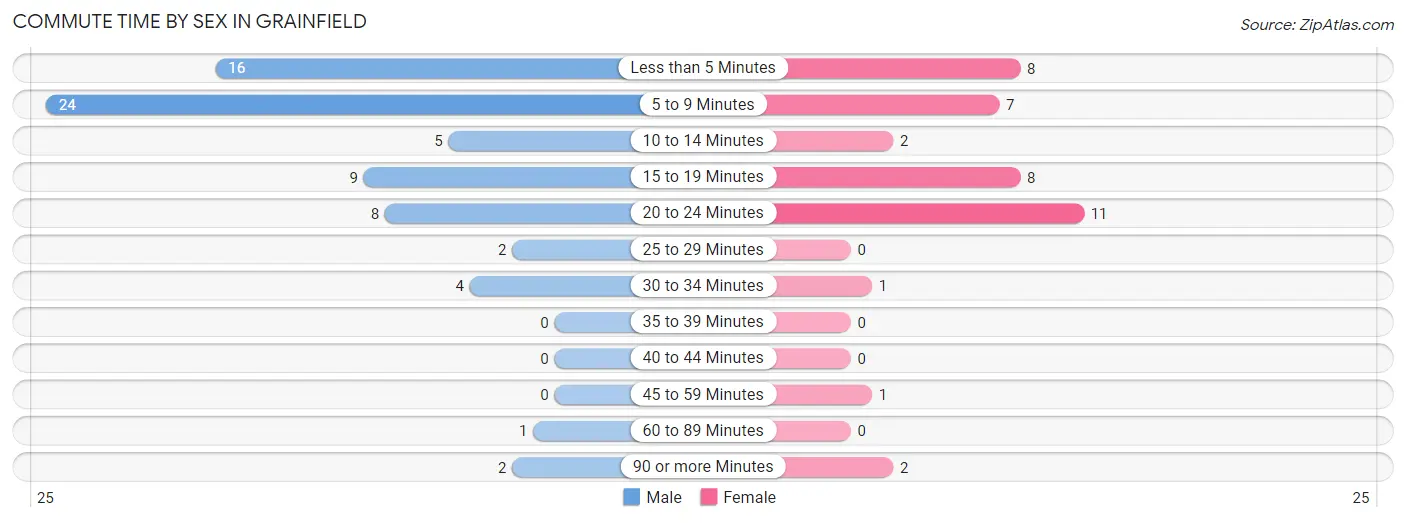
| Commute Time | Male | Female |
| Less than 5 Minutes | 16 (22.5%) | 8 (20.0%) |
| 5 to 9 Minutes | 24 (33.8%) | 7 (17.5%) |
| 10 to 14 Minutes | 5 (7.0%) | 2 (5.0%) |
| 15 to 19 Minutes | 9 (12.7%) | 8 (20.0%) |
| 20 to 24 Minutes | 8 (11.3%) | 11 (27.5%) |
| 25 to 29 Minutes | 2 (2.8%) | 0 (0.0%) |
| 30 to 34 Minutes | 4 (5.6%) | 1 (2.5%) |
| 35 to 39 Minutes | 0 (0.0%) | 0 (0.0%) |
| 40 to 44 Minutes | 0 (0.0%) | 0 (0.0%) |
| 45 to 59 Minutes | 0 (0.0%) | 1 (2.5%) |
| 60 to 89 Minutes | 1 (1.4%) | 0 (0.0%) |
| 90 or more Minutes | 2 (2.8%) | 2 (5.0%) |
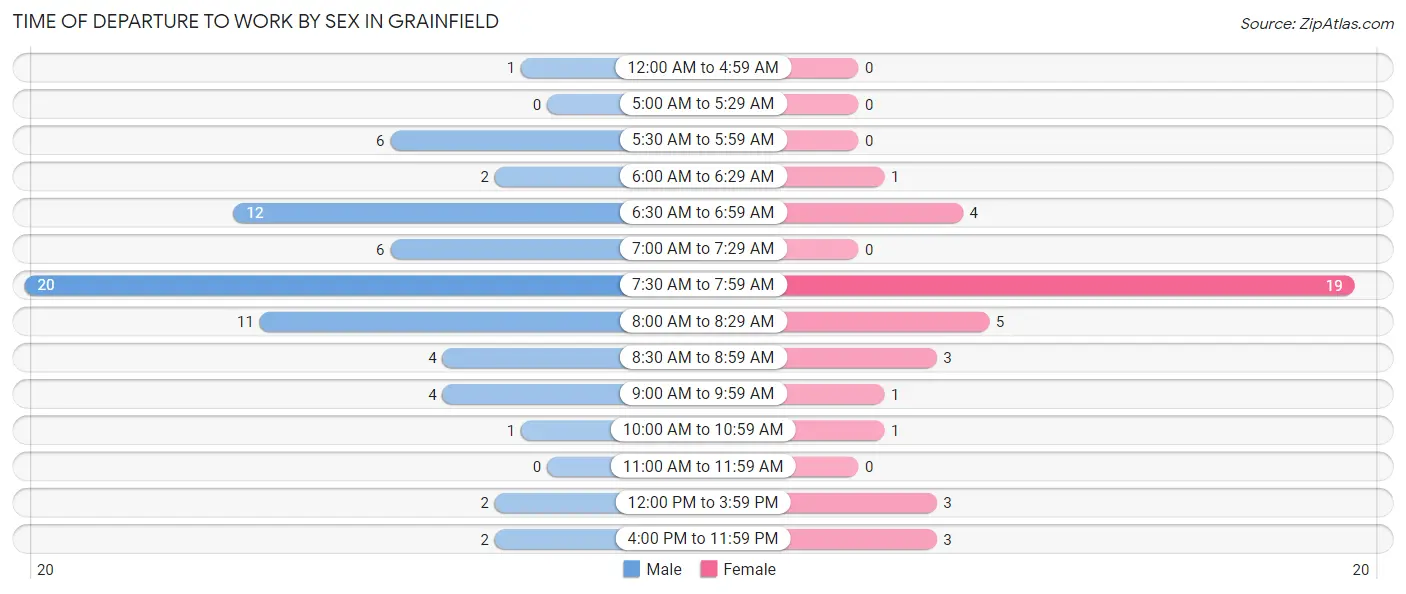
Time of Departure to Work by Sex in Grainfield
The most frequent times of departure to work in Grainfield are 7:30 AM to 7:59 AM (20, 28.2%) for males and 7:30 AM to 7:59 AM (19, 47.5%) for females.
| Time of Departure | Male | Female |
| 12:00 AM to 4:59 AM | 1 (1.4%) | 0 (0.0%) |
| 5:00 AM to 5:29 AM | 0 (0.0%) | 0 (0.0%) |
| 5:30 AM to 5:59 AM | 6 (8.5%) | 0 (0.0%) |
| 6:00 AM to 6:29 AM | 2 (2.8%) | 1 (2.5%) |
| 6:30 AM to 6:59 AM | 12 (16.9%) | 4 (10.0%) |
| 7:00 AM to 7:29 AM | 6 (8.5%) | 0 (0.0%) |
| 7:30 AM to 7:59 AM | 20 (28.2%) | 19 (47.5%) |
| 8:00 AM to 8:29 AM | 11 (15.5%) | 5 (12.5%) |
| 8:30 AM to 8:59 AM | 4 (5.6%) | 3 (7.5%) |
| 9:00 AM to 9:59 AM | 4 (5.6%) | 1 (2.5%) |
| 10:00 AM to 10:59 AM | 1 (1.4%) | 1 (2.5%) |
| 11:00 AM to 11:59 AM | 0 (0.0%) | 0 (0.0%) |
| 12:00 PM to 3:59 PM | 2 (2.8%) | 3 (7.5%) |
| 4:00 PM to 11:59 PM | 2 (2.8%) | 3 (7.5%) |
| Total | 71 (100.0%) | 40 (100.0%) |
Housing Occupancy in Grainfield
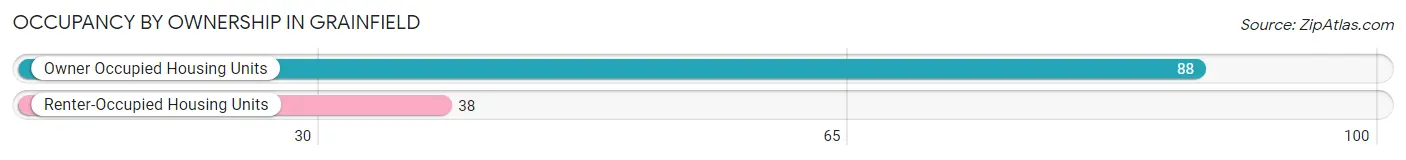
Occupancy by Ownership in Grainfield
Of the total 126 dwellings in Grainfield, owner-occupied units account for 88 (69.8%), while renter-occupied units make up 38 (30.2%).
| Occupancy | # Housing Units | % Housing Units |
| Owner Occupied Housing Units | 88 | 69.8% |
| Renter-Occupied Housing Units | 38 | 30.2% |
| Total Occupied Housing Units | 126 | 100.0% |
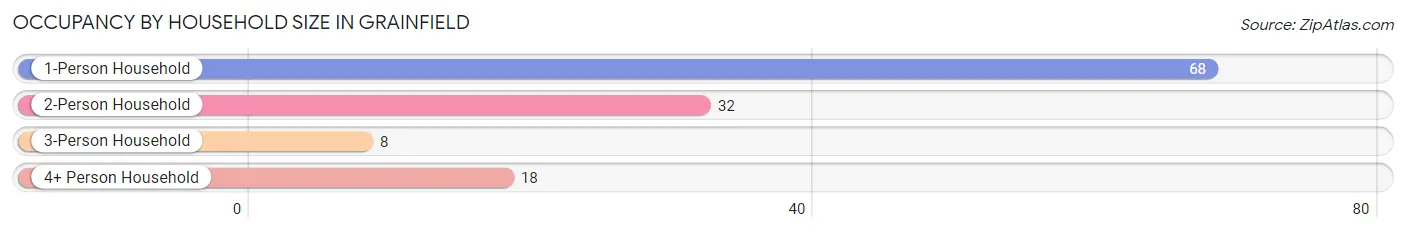
Occupancy by Household Size in Grainfield
| Household Size | # Housing Units | % Housing Units |
| 1-Person Household | 68 | 54.0% |
| 2-Person Household | 32 | 25.4% |
| 3-Person Household | 8 | 6.4% |
| 4+ Person Household | 18 | 14.3% |
| Total Housing Units | 126 | 100.0% |
Occupancy by Ownership by Household Size in Grainfield
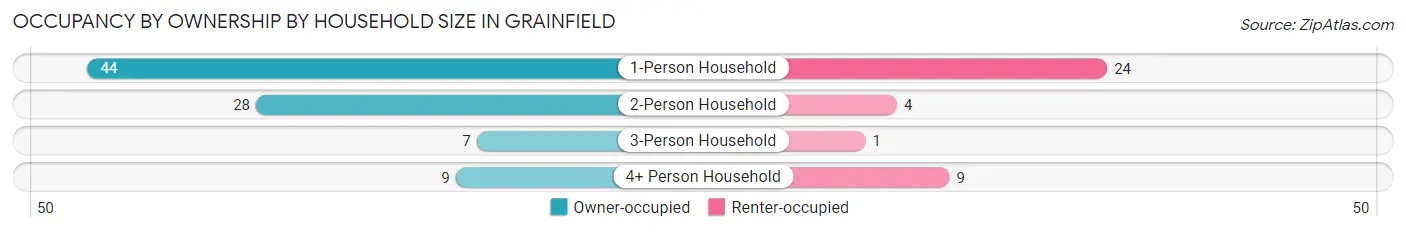
| Household Size | Owner-occupied | Renter-occupied |
| 1-Person Household | 44 (64.7%) | 24 (35.3%) |
| 2-Person Household | 28 (87.5%) | 4 (12.5%) |
| 3-Person Household | 7 (87.5%) | 1 (12.5%) |
| 4+ Person Household | 9 (50.0%) | 9 (50.0%) |
| Total Housing Units | 88 (69.8%) | 38 (30.2%) |
Occupancy by Educational Attainment in Grainfield
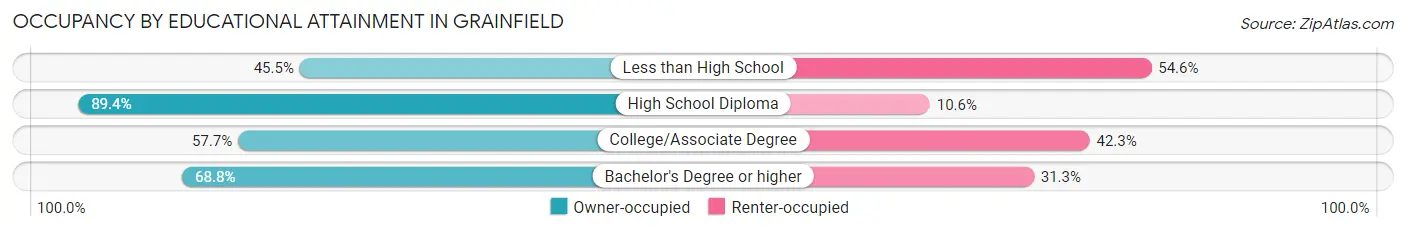
| Household Size | Owner-occupied | Renter-occupied |
| Less than High School | 5 (45.5%) | 6 (54.5%) |
| High School Diploma | 42 (89.4%) | 5 (10.6%) |
| College/Associate Degree | 30 (57.7%) | 22 (42.3%) |
| Bachelor's Degree or higher | 11 (68.8%) | 5 (31.2%) |
Occupancy by Age of Householder in Grainfield
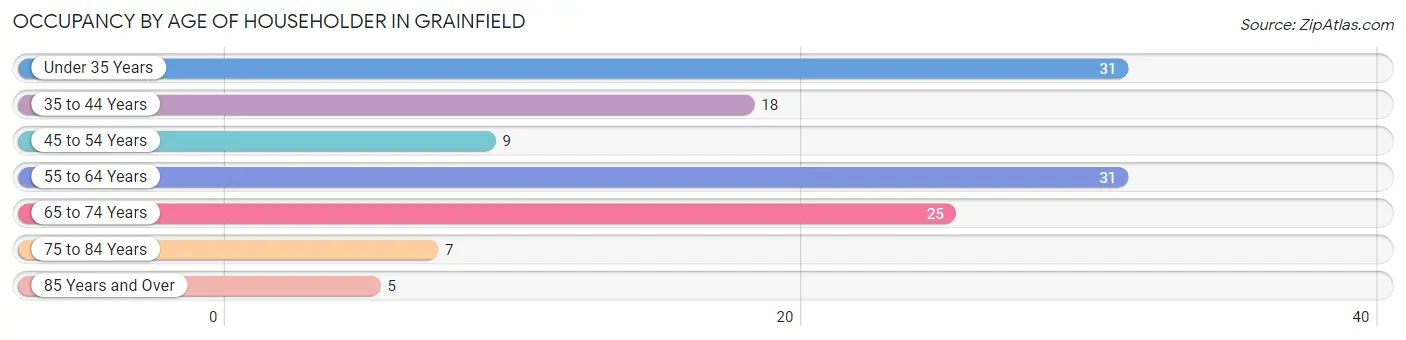
| Age Bracket | # Households | % Households |
| Under 35 Years | 31 | 24.6% |
| 35 to 44 Years | 18 | 14.3% |
| 45 to 54 Years | 9 | 7.1% |
| 55 to 64 Years | 31 | 24.6% |
| 65 to 74 Years | 25 | 19.8% |
| 75 to 84 Years | 7 | 5.6% |
| 85 Years and Over | 5 | 4.0% |
| Total | 126 | 100.0% |
Housing Finances in Grainfield
Median Income by Occupancy in Grainfield
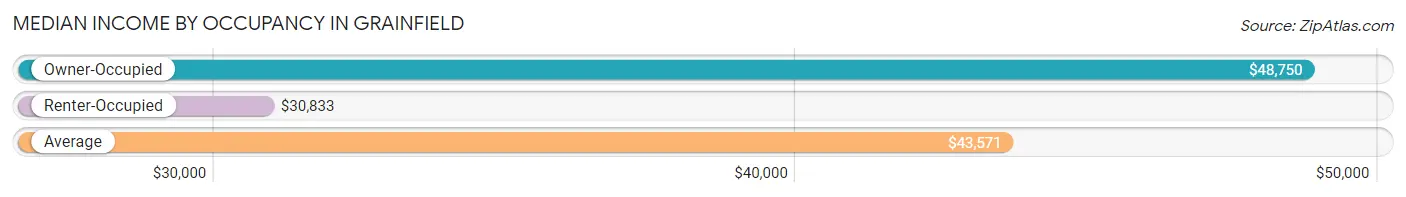
| Occupancy Type | # Households | Median Income |
| Owner-Occupied | 88 (69.8%) | $48,750 |
| Renter-Occupied | 38 (30.2%) | $30,833 |
| Average | 126 (100.0%) | $43,571 |
Occupancy by Householder Income Bracket in Grainfield
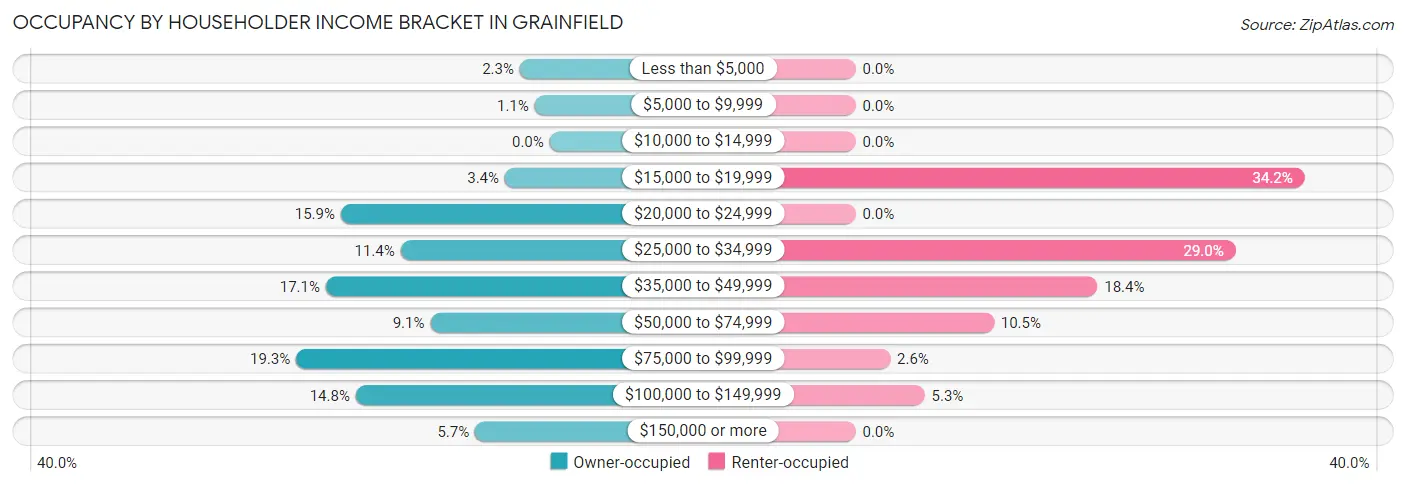
| Income Bracket | Owner-occupied | Renter-occupied |
| Less than $5,000 | 2 (2.3%) | 0 (0.0%) |
| $5,000 to $9,999 | 1 (1.1%) | 0 (0.0%) |
| $10,000 to $14,999 | 0 (0.0%) | 0 (0.0%) |
| $15,000 to $19,999 | 3 (3.4%) | 13 (34.2%) |
| $20,000 to $24,999 | 14 (15.9%) | 0 (0.0%) |
| $25,000 to $34,999 | 10 (11.4%) | 11 (28.9%) |
| $35,000 to $49,999 | 15 (17.1%) | 7 (18.4%) |
| $50,000 to $74,999 | 8 (9.1%) | 4 (10.5%) |
| $75,000 to $99,999 | 17 (19.3%) | 1 (2.6%) |
| $100,000 to $149,999 | 13 (14.8%) | 2 (5.3%) |
| $150,000 or more | 5 (5.7%) | 0 (0.0%) |
| Total | 88 (100.0%) | 38 (100.0%) |
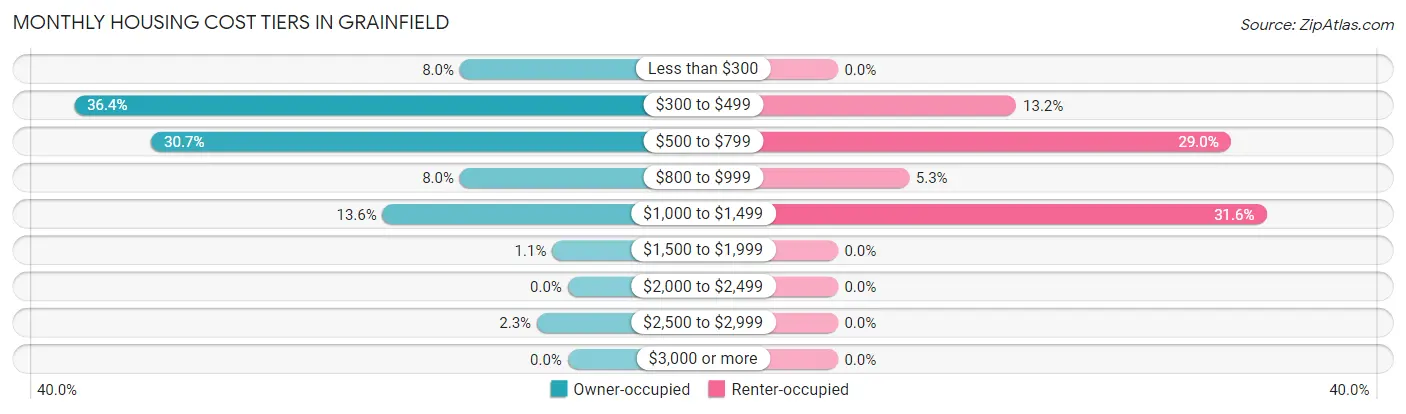
Monthly Housing Cost Tiers in Grainfield
| Monthly Cost | Owner-occupied | Renter-occupied |
| Less than $300 | 7 (8.0%) | 0 (0.0%) |
| $300 to $499 | 32 (36.4%) | 5 (13.2%) |
| $500 to $799 | 27 (30.7%) | 11 (28.9%) |
| $800 to $999 | 7 (8.0%) | 2 (5.3%) |
| $1,000 to $1,499 | 12 (13.6%) | 12 (31.6%) |
| $1,500 to $1,999 | 1 (1.1%) | 0 (0.0%) |
| $2,000 to $2,499 | 0 (0.0%) | 0 (0.0%) |
| $2,500 to $2,999 | 2 (2.3%) | 0 (0.0%) |
| $3,000 or more | 0 (0.0%) | 0 (0.0%) |
| Total | 88 (100.0%) | 38 (100.0%) |
Physical Housing Characteristics in Grainfield
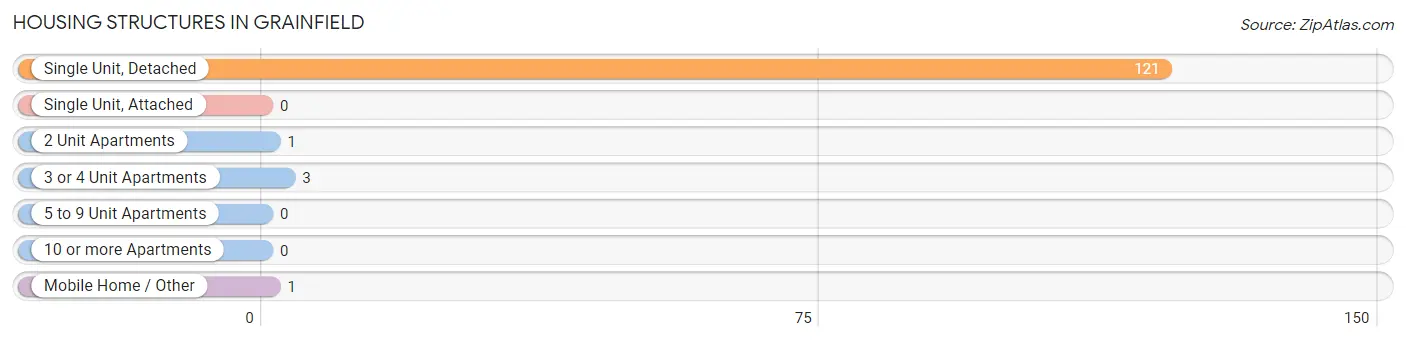
Housing Structures in Grainfield
| Structure Type | # Housing Units | % Housing Units |
| Single Unit, Detached | 121 | 96.0% |
| Single Unit, Attached | 0 | 0.0% |
| 2 Unit Apartments | 1 | 0.8% |
| 3 or 4 Unit Apartments | 3 | 2.4% |
| 5 to 9 Unit Apartments | 0 | 0.0% |
| 10 or more Apartments | 0 | 0.0% |
| Mobile Home / Other | 1 | 0.8% |
| Total | 126 | 100.0% |
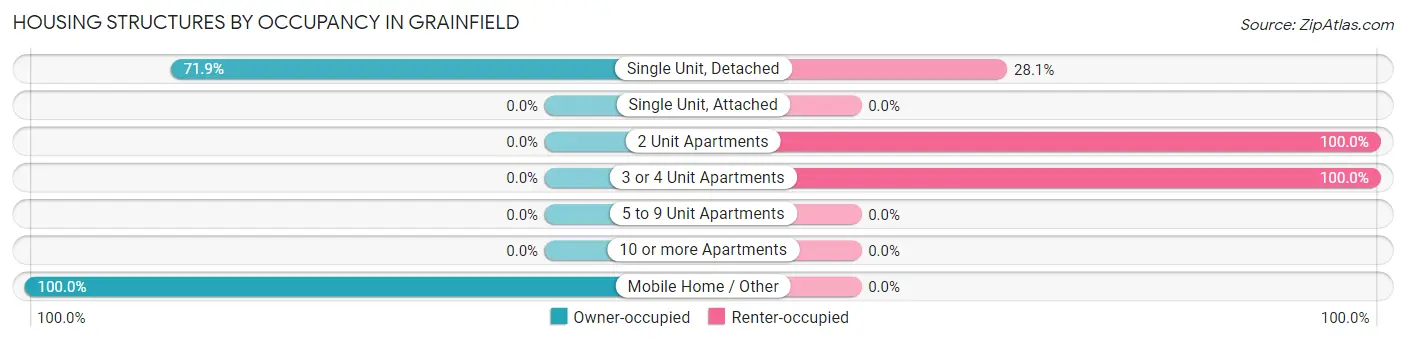
Housing Structures by Occupancy in Grainfield
| Structure Type | Owner-occupied | Renter-occupied |
| Single Unit, Detached | 87 (71.9%) | 34 (28.1%) |
| Single Unit, Attached | 0 (0.0%) | 0 (0.0%) |
| 2 Unit Apartments | 0 (0.0%) | 1 (100.0%) |
| 3 or 4 Unit Apartments | 0 (0.0%) | 3 (100.0%) |
| 5 to 9 Unit Apartments | 0 (0.0%) | 0 (0.0%) |
| 10 or more Apartments | 0 (0.0%) | 0 (0.0%) |
| Mobile Home / Other | 1 (100.0%) | 0 (0.0%) |
| Total | 88 (69.8%) | 38 (30.2%) |
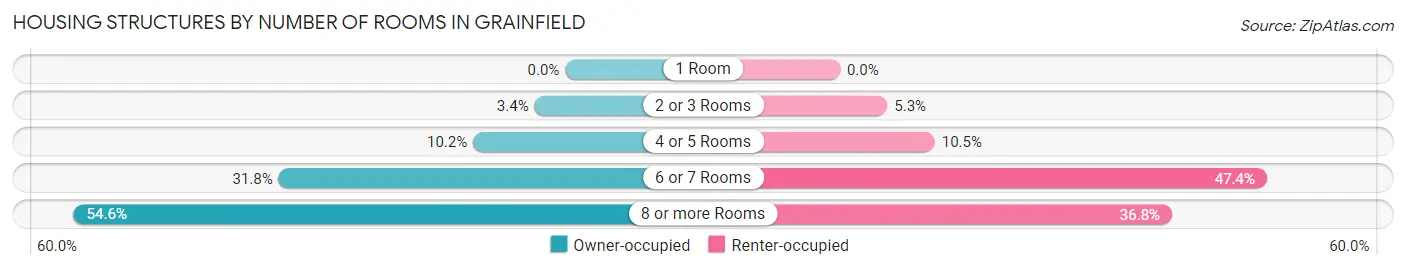
Housing Structures by Number of Rooms in Grainfield
| Number of Rooms | Owner-occupied | Renter-occupied |
| 1 Room | 0 (0.0%) | 0 (0.0%) |
| 2 or 3 Rooms | 3 (3.4%) | 2 (5.3%) |
| 4 or 5 Rooms | 9 (10.2%) | 4 (10.5%) |
| 6 or 7 Rooms | 28 (31.8%) | 18 (47.4%) |
| 8 or more Rooms | 48 (54.5%) | 14 (36.8%) |
| Total | 88 (100.0%) | 38 (100.0%) |
Housing Structure by Heating Type in Grainfield
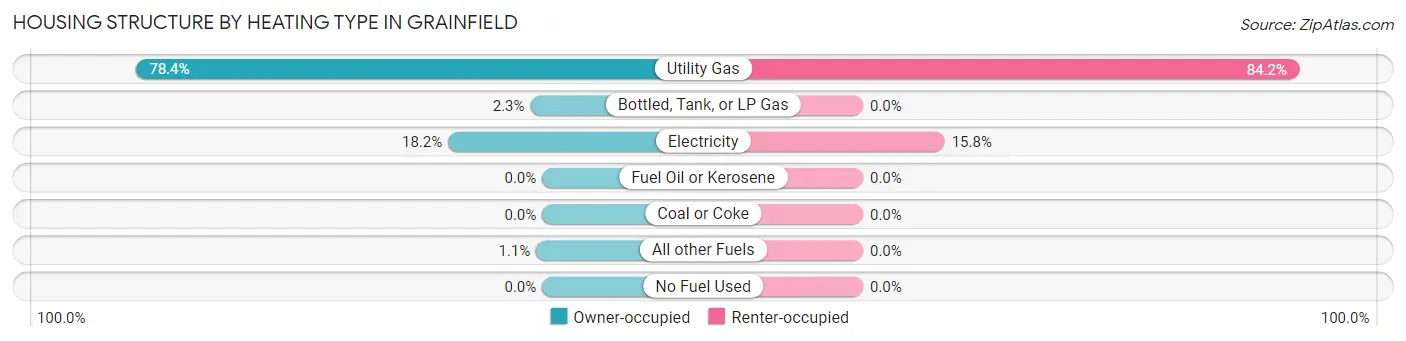
| Heating Type | Owner-occupied | Renter-occupied |
| Utility Gas | 69 (78.4%) | 32 (84.2%) |
| Bottled, Tank, or LP Gas | 2 (2.3%) | 0 (0.0%) |
| Electricity | 16 (18.2%) | 6 (15.8%) |
| Fuel Oil or Kerosene | 0 (0.0%) | 0 (0.0%) |
| Coal or Coke | 0 (0.0%) | 0 (0.0%) |
| All other Fuels | 1 (1.1%) | 0 (0.0%) |
| No Fuel Used | 0 (0.0%) | 0 (0.0%) |
| Total | 88 (100.0%) | 38 (100.0%) |
Household Vehicle Usage in Grainfield
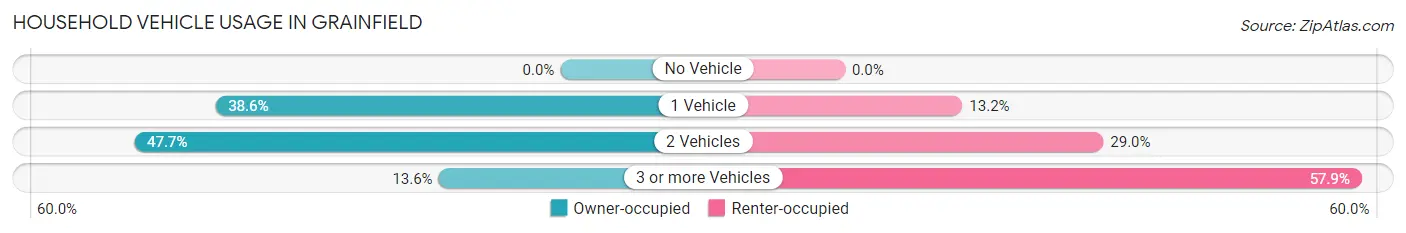
| Vehicles per Household | Owner-occupied | Renter-occupied |
| No Vehicle | 0 (0.0%) | 0 (0.0%) |
| 1 Vehicle | 34 (38.6%) | 5 (13.2%) |
| 2 Vehicles | 42 (47.7%) | 11 (28.9%) |
| 3 or more Vehicles | 12 (13.6%) | 22 (57.9%) |
| Total | 88 (100.0%) | 38 (100.0%) |
Real Estate & Mortgages in Grainfield
Real Estate and Mortgage Overview in Grainfield
| Characteristic | Without Mortgage | With Mortgage |
| Housing Units | 69 | 19 |
| Median Property Value | $100,800 | $75,000 |
| Median Household Income | $43,036 | $0 |
| Monthly Housing Costs | $471 | $0 |
| Real Estate Taxes | $1,404 | $1 |
Property Value by Mortgage Status in Grainfield
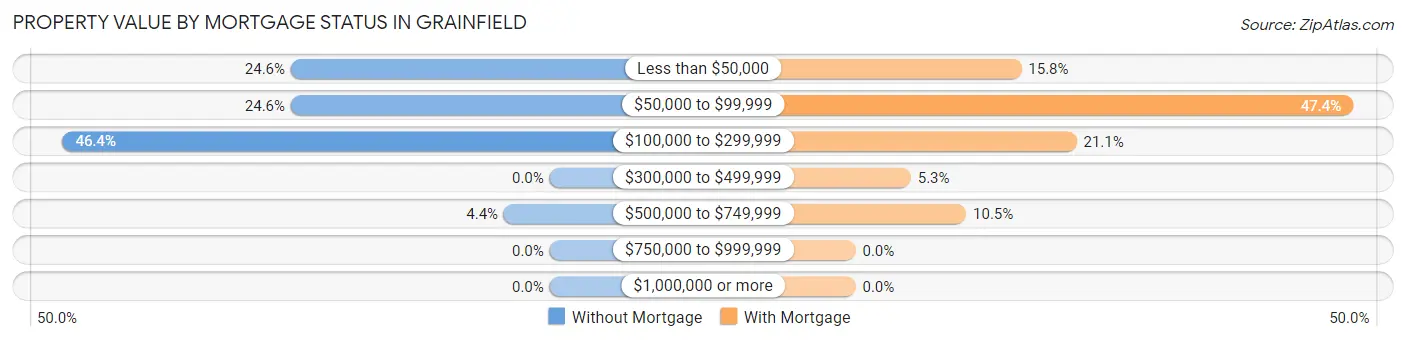
| Property Value | Without Mortgage | With Mortgage |
| Less than $50,000 | 17 (24.6%) | 3 (15.8%) |
| $50,000 to $99,999 | 17 (24.6%) | 9 (47.4%) |
| $100,000 to $299,999 | 32 (46.4%) | 4 (21.0%) |
| $300,000 to $499,999 | 0 (0.0%) | 1 (5.3%) |
| $500,000 to $749,999 | 3 (4.3%) | 2 (10.5%) |
| $750,000 to $999,999 | 0 (0.0%) | 0 (0.0%) |
| $1,000,000 or more | 0 (0.0%) | 0 (0.0%) |
| Total | 69 (100.0%) | 19 (100.0%) |
Household Income by Mortgage Status in Grainfield
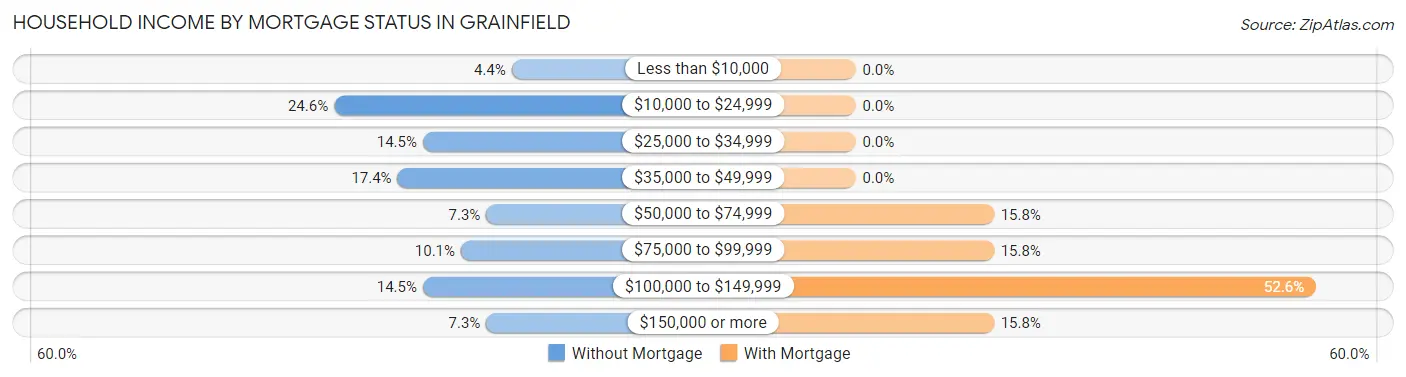
| Household Income | Without Mortgage | With Mortgage |
| Less than $10,000 | 3 (4.3%) | 0 (0.0%) |
| $10,000 to $24,999 | 17 (24.6%) | 0 (0.0%) |
| $25,000 to $34,999 | 10 (14.5%) | 0 (0.0%) |
| $35,000 to $49,999 | 12 (17.4%) | 0 (0.0%) |
| $50,000 to $74,999 | 5 (7.2%) | 3 (15.8%) |
| $75,000 to $99,999 | 7 (10.1%) | 3 (15.8%) |
| $100,000 to $149,999 | 10 (14.5%) | 10 (52.6%) |
| $150,000 or more | 5 (7.2%) | 3 (15.8%) |
| Total | 69 (100.0%) | 19 (100.0%) |
Property Value to Household Income Ratio in Grainfield
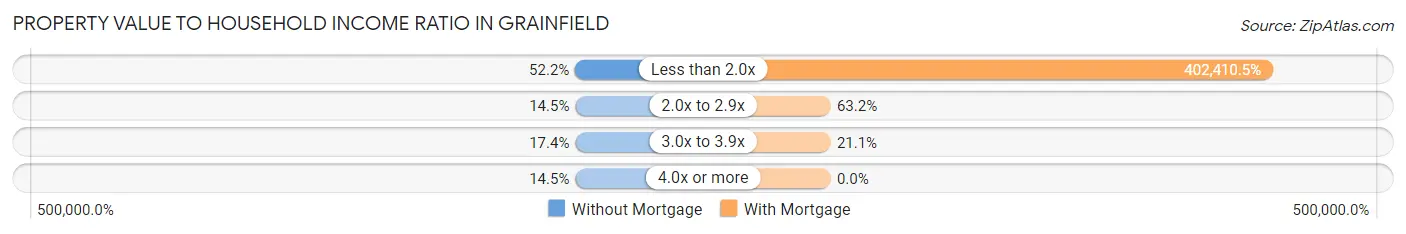
| Value-to-Income Ratio | Without Mortgage | With Mortgage |
| Less than 2.0x | 36 (52.2%) | 76,458 (402,410.5%) |
| 2.0x to 2.9x | 10 (14.5%) | 12 (63.2%) |
| 3.0x to 3.9x | 12 (17.4%) | 4 (21.0%) |
| 4.0x or more | 10 (14.5%) | 0 (0.0%) |
| Total | 69 (100.0%) | 19 (100.0%) |
Real Estate Taxes by Mortgage Status in Grainfield
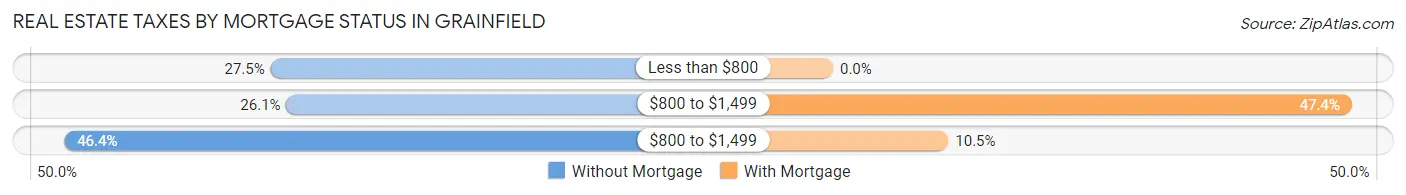
| Property Taxes | Without Mortgage | With Mortgage |
| Less than $800 | 19 (27.5%) | 0 (0.0%) |
| $800 to $1,499 | 18 (26.1%) | 9 (47.4%) |
| $800 to $1,499 | 32 (46.4%) | 2 (10.5%) |
| Total | 69 (100.0%) | 19 (100.0%) |
Health & Disability in Grainfield
Health Insurance Coverage by Age in Grainfield
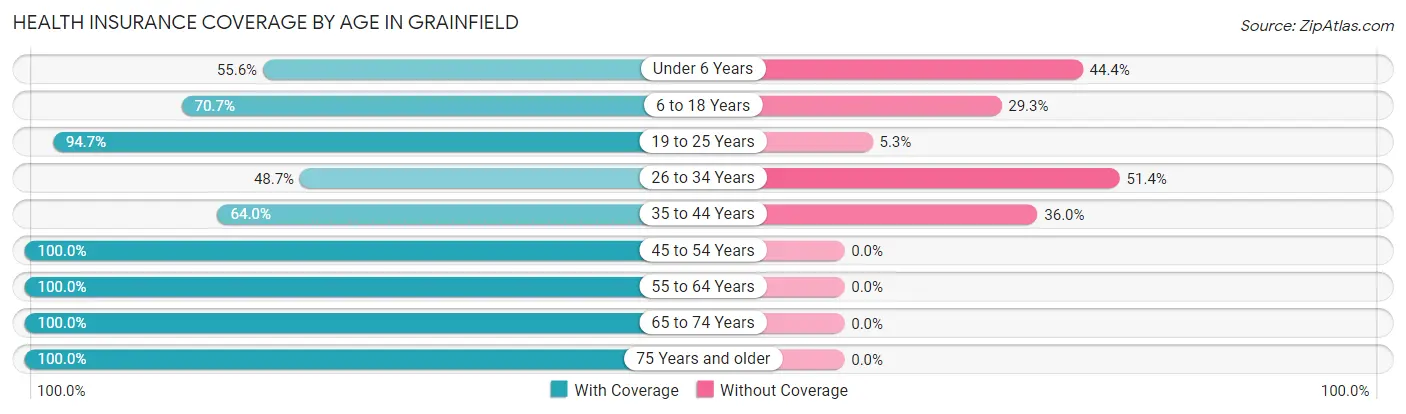
| Age Bracket | With Coverage | Without Coverage |
| Under 6 Years | 10 (55.6%) | 8 (44.4%) |
| 6 to 18 Years | 29 (70.7%) | 12 (29.3%) |
| 19 to 25 Years | 18 (94.7%) | 1 (5.3%) |
| 26 to 34 Years | 18 (48.6%) | 19 (51.3%) |
| 35 to 44 Years | 16 (64.0%) | 9 (36.0%) |
| 45 to 54 Years | 18 (100.0%) | 0 (0.0%) |
| 55 to 64 Years | 38 (100.0%) | 0 (0.0%) |
| 65 to 74 Years | 38 (100.0%) | 0 (0.0%) |
| 75 Years and older | 16 (100.0%) | 0 (0.0%) |
| Total | 201 (80.4%) | 49 (19.6%) |
Health Insurance Coverage by Citizenship Status in Grainfield
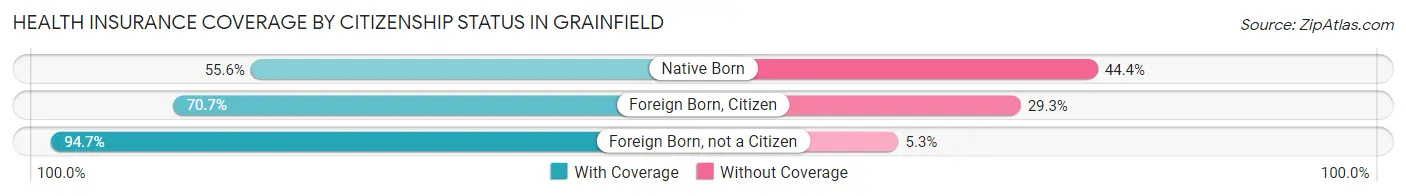
| Citizenship Status | With Coverage | Without Coverage |
| Native Born | 10 (55.6%) | 8 (44.4%) |
| Foreign Born, Citizen | 29 (70.7%) | 12 (29.3%) |
| Foreign Born, not a Citizen | 18 (94.7%) | 1 (5.3%) |
Health Insurance Coverage by Household Income in Grainfield
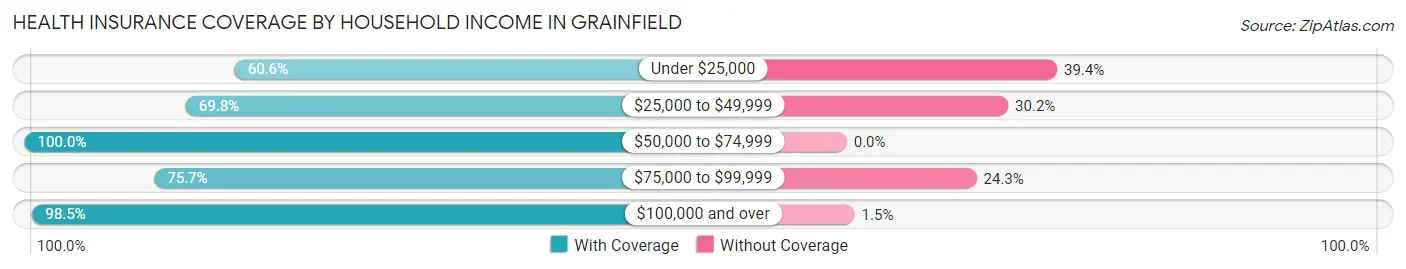
| Household Income | With Coverage | Without Coverage |
| Under $25,000 | 20 (60.6%) | 13 (39.4%) |
| $25,000 to $49,999 | 60 (69.8%) | 26 (30.2%) |
| $50,000 to $74,999 | 26 (100.0%) | 0 (0.0%) |
| $75,000 to $99,999 | 28 (75.7%) | 9 (24.3%) |
| $100,000 and over | 67 (98.5%) | 1 (1.5%) |
Public vs Private Health Insurance Coverage by Age in Grainfield
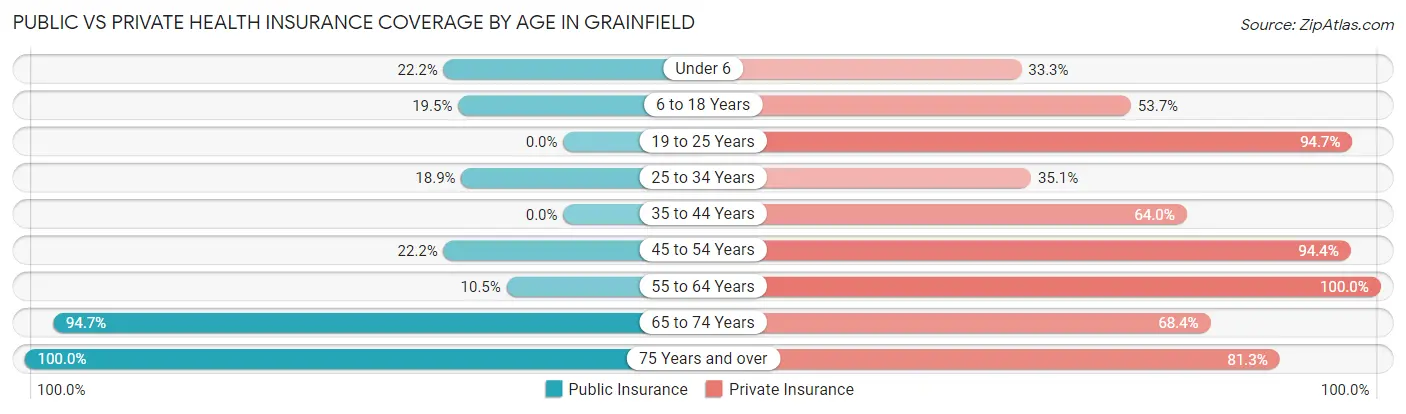
| Age Bracket | Public Insurance | Private Insurance |
| Under 6 | 4 (22.2%) | 6 (33.3%) |
| 6 to 18 Years | 8 (19.5%) | 22 (53.7%) |
| 19 to 25 Years | 0 (0.0%) | 18 (94.7%) |
| 25 to 34 Years | 7 (18.9%) | 13 (35.1%) |
| 35 to 44 Years | 0 (0.0%) | 16 (64.0%) |
| 45 to 54 Years | 4 (22.2%) | 17 (94.4%) |
| 55 to 64 Years | 4 (10.5%) | 38 (100.0%) |
| 65 to 74 Years | 36 (94.7%) | 26 (68.4%) |
| 75 Years and over | 16 (100.0%) | 13 (81.2%) |
| Total | 79 (31.6%) | 169 (67.6%) |
Disability Status by Sex by Age in Grainfield
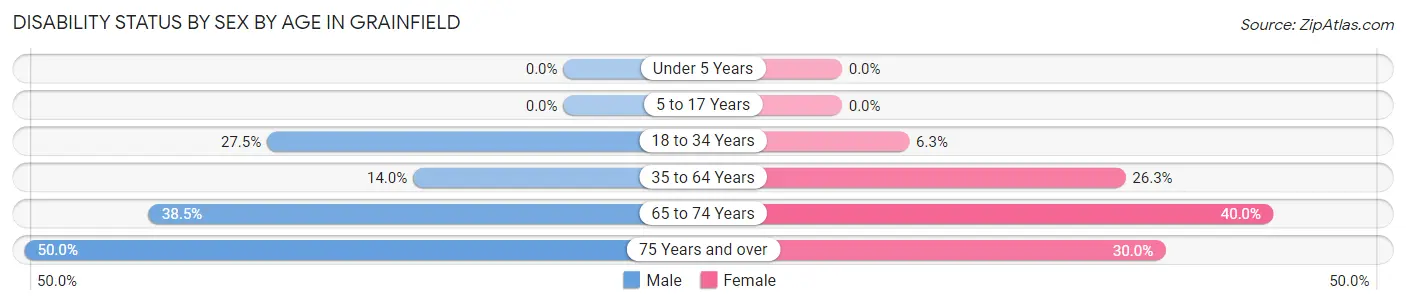
| Age Bracket | Male | Female |
| Under 5 Years | 0 (0.0%) | 0 (0.0%) |
| 5 to 17 Years | 0 (0.0%) | 0 (0.0%) |
| 18 to 34 Years | 11 (27.5%) | 1 (6.2%) |
| 35 to 64 Years | 6 (14.0%) | 10 (26.3%) |
| 65 to 74 Years | 5 (38.5%) | 10 (40.0%) |
| 75 Years and over | 3 (50.0%) | 3 (30.0%) |
Disability Class by Sex by Age in Grainfield
Disability Class: Hearing Difficulty
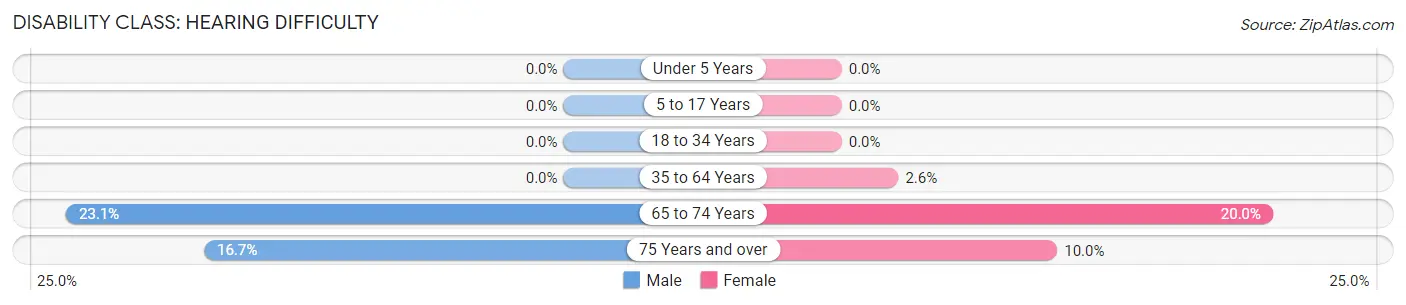
| Age Bracket | Male | Female |
| Under 5 Years | 0 (0.0%) | 0 (0.0%) |
| 5 to 17 Years | 0 (0.0%) | 0 (0.0%) |
| 18 to 34 Years | 0 (0.0%) | 0 (0.0%) |
| 35 to 64 Years | 0 (0.0%) | 1 (2.6%) |
| 65 to 74 Years | 3 (23.1%) | 5 (20.0%) |
| 75 Years and over | 1 (16.7%) | 1 (10.0%) |
Disability Class: Vision Difficulty
| Age Bracket | Male | Female |
| Under 5 Years | 0 (0.0%) | 0 (0.0%) |
| 5 to 17 Years | 0 (0.0%) | 0 (0.0%) |
| 18 to 34 Years | 0 (0.0%) | 0 (0.0%) |
| 35 to 64 Years | 0 (0.0%) | 0 (0.0%) |
| 65 to 74 Years | 0 (0.0%) | 0 (0.0%) |
| 75 Years and over | 0 (0.0%) | 0 (0.0%) |
Disability Class: Cognitive Difficulty
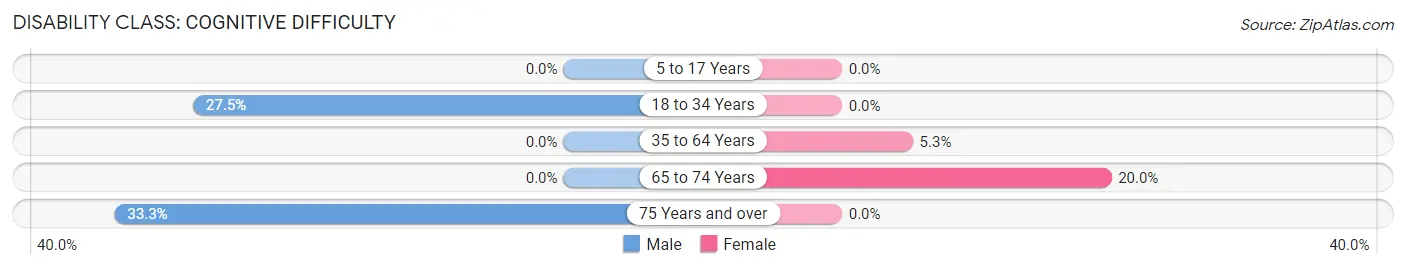
| Age Bracket | Male | Female |
| 5 to 17 Years | 0 (0.0%) | 0 (0.0%) |
| 18 to 34 Years | 11 (27.5%) | 0 (0.0%) |
| 35 to 64 Years | 0 (0.0%) | 2 (5.3%) |
| 65 to 74 Years | 0 (0.0%) | 5 (20.0%) |
| 75 Years and over | 2 (33.3%) | 0 (0.0%) |
Disability Class: Ambulatory Difficulty
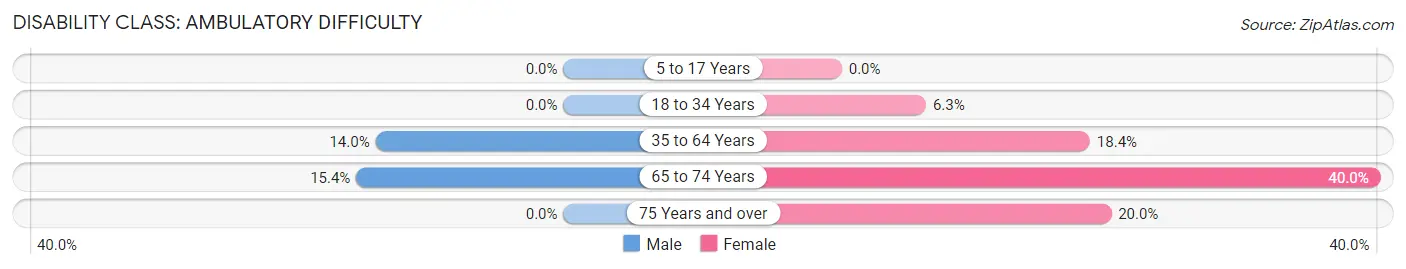
| Age Bracket | Male | Female |
| 5 to 17 Years | 0 (0.0%) | 0 (0.0%) |
| 18 to 34 Years | 0 (0.0%) | 1 (6.2%) |
| 35 to 64 Years | 6 (14.0%) | 7 (18.4%) |
| 65 to 74 Years | 2 (15.4%) | 10 (40.0%) |
| 75 Years and over | 0 (0.0%) | 2 (20.0%) |
Disability Class: Self-Care Difficulty
| Age Bracket | Male | Female |
| 5 to 17 Years | 0 (0.0%) | 0 (0.0%) |
| 18 to 34 Years | 0 (0.0%) | 0 (0.0%) |
| 35 to 64 Years | 0 (0.0%) | 0 (0.0%) |
| 65 to 74 Years | 0 (0.0%) | 0 (0.0%) |
| 75 Years and over | 0 (0.0%) | 0 (0.0%) |
Technology Access in Grainfield
Computing Device Access in Grainfield
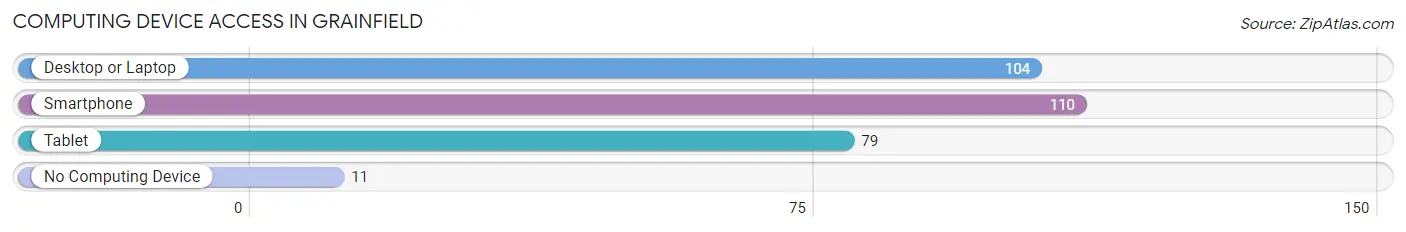
| Device Type | # Households | % Households |
| Desktop or Laptop | 104 | 82.5% |
| Smartphone | 110 | 87.3% |
| Tablet | 79 | 62.7% |
| No Computing Device | 11 | 8.7% |
| Total | 126 | 100.0% |
Internet Access in Grainfield
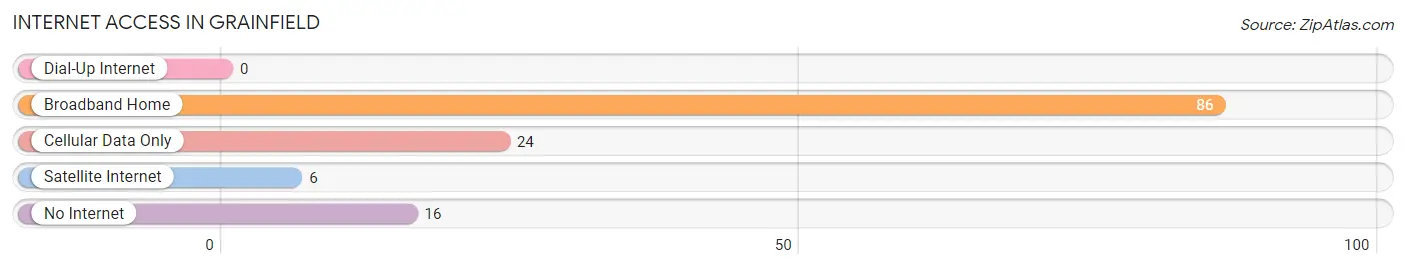
| Internet Type | # Households | % Households |
| Dial-Up Internet | 0 | 0.0% |
| Broadband Home | 86 | 68.2% |
| Cellular Data Only | 24 | 19.1% |
| Satellite Internet | 6 | 4.8% |
| No Internet | 16 | 12.7% |
| Total | 126 | 100.0% |
Grainfield Summary
Grainfield is a small town located in the northwest corner of Kansas, in the county of Gove. It is situated on the banks of the Smoky Hill River, and is surrounded by rolling hills and prairies. The town has a population of approximately 500 people, and is home to a variety of businesses, including a grain elevator, a feed store, a hardware store, a grocery store, and a few restaurants.
Grainfield was founded in 1885, when the Union Pacific Railroad was extended to the area. The town was named after the abundance of grain that was grown in the area. The town quickly grew, and by the turn of the century, it had become a thriving agricultural center. The town was also home to a number of businesses, including a bank, a hotel, a blacksmith shop, and a livery stable.
Grainfield's economy is largely based on agriculture. The town is home to a number of grain elevators, which store and process grain for sale. The town is also home to a number of feed stores, which provide feed for livestock. In addition, the town is home to a number of businesses that provide services to the agricultural industry, such as equipment repair and maintenance, and crop insurance.
The town is also home to a number of small businesses, such as restaurants, grocery stores, and hardware stores. These businesses provide goods and services to the local community, and help to support the local economy.
Grainfield is served by the Gove County School District, which includes a high school, a middle school, and an elementary school. The town is also home to a number of churches, including the First United Methodist Church, the First Baptist Church, and the Church of the Nazarene.
Grainfield is a predominantly white town, with a population that is approximately 95% white. The town has a median household income of $37,000, and a poverty rate of 15%. The town has a low crime rate, and is considered to be a safe place to live.
Grainfield is a small town with a rich history and a strong sense of community. The town is home to a variety of businesses, and is a great place to live and work. The town is also home to a number of churches, and is a great place to raise a family.
Common Questions
What is Per Capita Income in Grainfield?
Per Capita income in Grainfield is $34,795.
What is the Median Family Income in Grainfield?
Median Family Income in Grainfield is $76,250.
What is the Median Household income in Grainfield?
Median Household Income in Grainfield is $43,571.
What is Income or Wage Gap in Grainfield?
Income or Wage Gap in Grainfield is 3.8%.
Women in Grainfield earn 96.2 cents for every dollar earned by a man.
What is Inequality or Gini Index in Grainfield?
Inequality or Gini Index in Grainfield is 0.49.
What is the Total Population of Grainfield?
Total Population of Grainfield is 250.
What is the Total Male Population of Grainfield?
Total Male Population of Grainfield is 144.
What is the Total Female Population of Grainfield?
Total Female Population of Grainfield is 106.
What is the Ratio of Males per 100 Females in Grainfield?
There are 135.85 Males per 100 Females in Grainfield.
What is the Ratio of Females per 100 Males in Grainfield?
There are 73.61 Females per 100 Males in Grainfield.
What is the Median Population Age in Grainfield?
Median Population Age in Grainfield is 41.0 Years.
What is the Average Family Size in Grainfield
Average Family Size in Grainfield is 3.1 People.
What is the Average Household Size in Grainfield
Average Household Size in Grainfield is 2.0 People.
How Large is the Labor Force in Grainfield?
There are 143 People in the Labor Forcein in Grainfield.
What is the Percentage of People in the Labor Force in Grainfield?
74.9% of People are in the Labor Force in Grainfield.
What is the Unemployment Rate in Grainfield?
Unemployment Rate in Grainfield is 11.2%.