Farmington, WA Map & Demographics
Farmington Map
Farmington Overview
$30,760
PER CAPITA INCOME
$61,563
AVG FAMILY INCOME
$52,917
AVG HOUSEHOLD INCOME
13.4%
WAGE / INCOME GAP [ % ]
86.6¢/ $1
WAGE / INCOME GAP [ $ ]
0.49
INEQUALITY / GINI INDEX
144
TOTAL POPULATION
88
MALE POPULATION
56
FEMALE POPULATION
157.14
MALES / 100 FEMALES
63.64
FEMALES / 100 MALES
55.8
MEDIAN AGE
2.8
AVG FAMILY SIZE
1.8
AVG HOUSEHOLD SIZE
60
LABOR FORCE [ PEOPLE ]
44.8%
PERCENT IN LABOR FORCE
6.7%
UNEMPLOYMENT RATE
Farmington Zip Codes
Farmington Area Codes
Income in Farmington
Income Overview in Farmington
Per Capita Income in Farmington is $30,760, while median incomes of families and households are $61,563 and $52,917 respectively.
| Characteristic | Number | Measure |
| Per Capita Income | 144 | $30,760 |
| Median Family Income | 37 | $61,563 |
| Mean Family Income | 37 | $90,995 |
| Median Household Income | 79 | $52,917 |
| Mean Household Income | 79 | $54,894 |
| Income Deficit | 37 | $0 |
| Wage / Income Gap (%) | 144 | 13.44% |
| Wage / Income Gap ($) | 144 | 86.56¢ per $1 |
| Gini / Inequality Index | 144 | 0.49 |
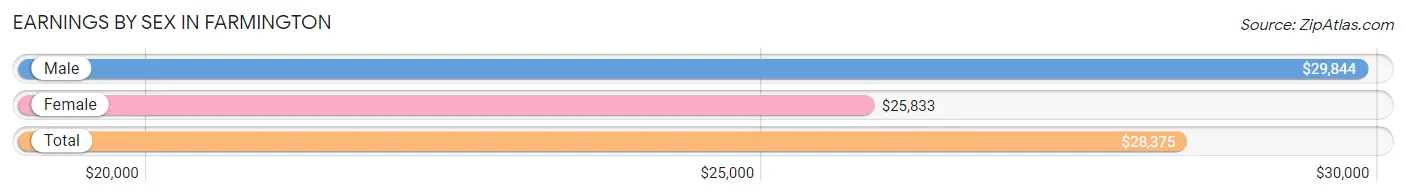
Earnings by Sex in Farmington
Average Earnings in Farmington are $28,375, $29,844 for men and $25,833 for women, a difference of 13.4%.
| Sex | Number | Average Earnings |
| Male | 39 (61.9%) | $29,844 |
| Female | 24 (38.1%) | $25,833 |
| Total | 63 (100.0%) | $28,375 |
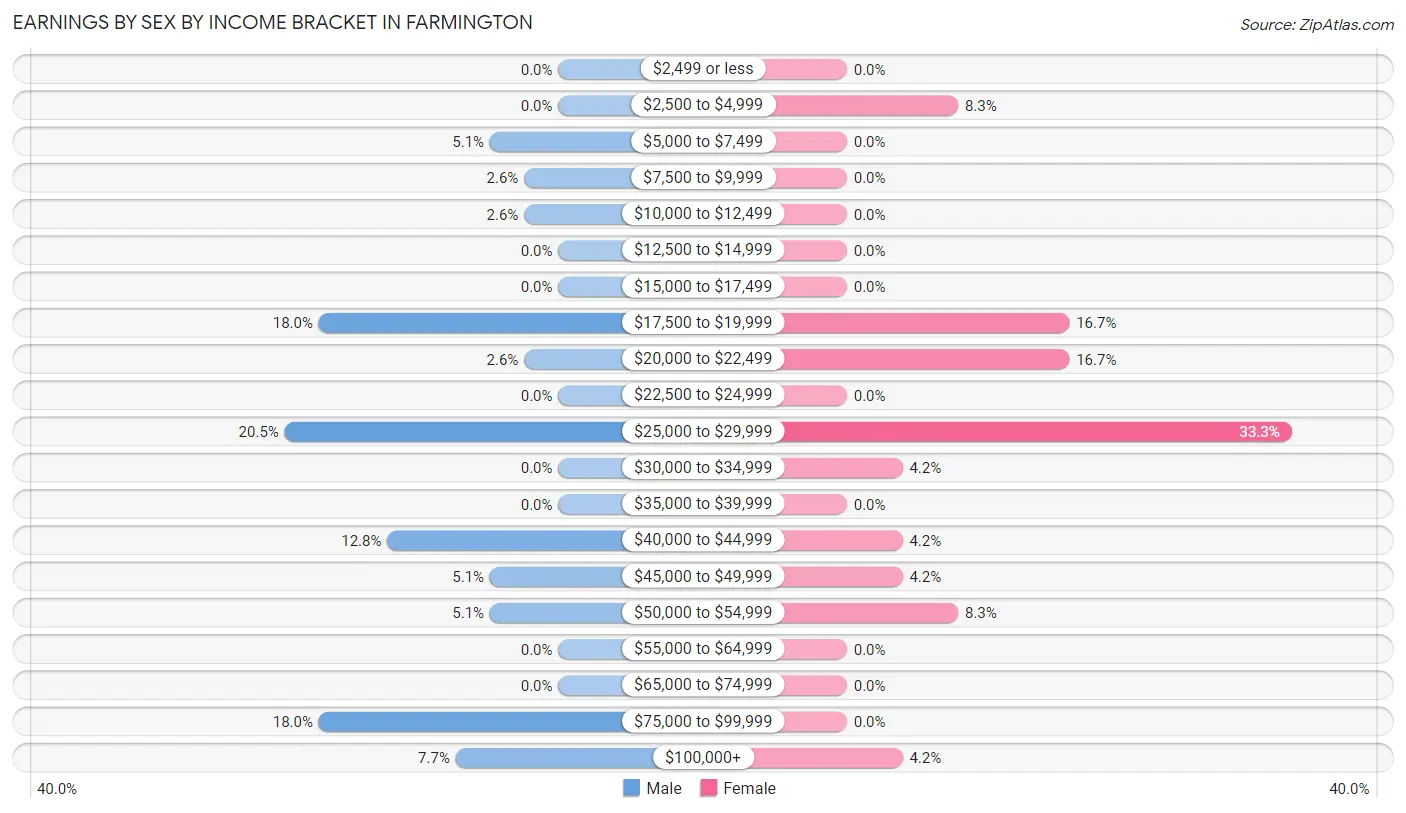
Earnings by Sex by Income Bracket in Farmington
The most common earnings brackets in Farmington are $25,000 to $29,999 for men (8 | 20.5%) and $25,000 to $29,999 for women (8 | 33.3%).
| Income | Male | Female |
| $2,499 or less | 0 (0.0%) | 0 (0.0%) |
| $2,500 to $4,999 | 0 (0.0%) | 2 (8.3%) |
| $5,000 to $7,499 | 2 (5.1%) | 0 (0.0%) |
| $7,500 to $9,999 | 1 (2.6%) | 0 (0.0%) |
| $10,000 to $12,499 | 1 (2.6%) | 0 (0.0%) |
| $12,500 to $14,999 | 0 (0.0%) | 0 (0.0%) |
| $15,000 to $17,499 | 0 (0.0%) | 0 (0.0%) |
| $17,500 to $19,999 | 7 (17.9%) | 4 (16.7%) |
| $20,000 to $22,499 | 1 (2.6%) | 4 (16.7%) |
| $22,500 to $24,999 | 0 (0.0%) | 0 (0.0%) |
| $25,000 to $29,999 | 8 (20.5%) | 8 (33.3%) |
| $30,000 to $34,999 | 0 (0.0%) | 1 (4.2%) |
| $35,000 to $39,999 | 0 (0.0%) | 0 (0.0%) |
| $40,000 to $44,999 | 5 (12.8%) | 1 (4.2%) |
| $45,000 to $49,999 | 2 (5.1%) | 1 (4.2%) |
| $50,000 to $54,999 | 2 (5.1%) | 2 (8.3%) |
| $55,000 to $64,999 | 0 (0.0%) | 0 (0.0%) |
| $65,000 to $74,999 | 0 (0.0%) | 0 (0.0%) |
| $75,000 to $99,999 | 7 (17.9%) | 0 (0.0%) |
| $100,000+ | 3 (7.7%) | 1 (4.2%) |
| Total | 39 (100.0%) | 24 (100.0%) |
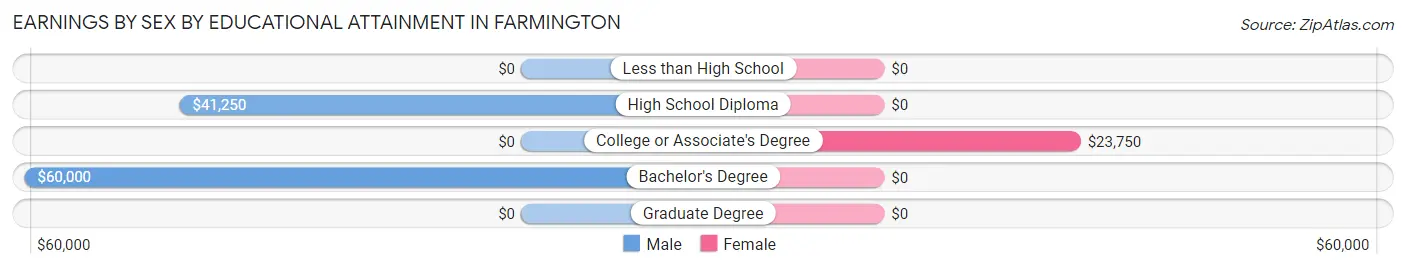
Earnings by Sex by Educational Attainment in Farmington
Average earnings in Farmington are $43,750 for men and $25,833 for women, a difference of 40.9%. Men with an educational attainment of bachelor's degree enjoy the highest average annual earnings of $60,000, while those with high school diploma education earn the least with $41,250. Women with an educational attainment of college or associate's degree earn the most with the average annual earnings of $23,750, while those with college or associate's degree education have the smallest earnings of $23,750.
| Educational Attainment | Male Income | Female Income |
| Less than High School | - | - |
| High School Diploma | $41,250 | $0 |
| College or Associate's Degree | - | - |
| Bachelor's Degree | $60,000 | $0 |
| Graduate Degree | - | - |
| Total | $43,750 | $25,833 |
Family Income in Farmington
Family Income Brackets in Farmington
According to the Farmington family income data, there are 18 families falling into the $50,000 to $74,999 income range, which is the most common income bracket and makes up 48.6% of all families.
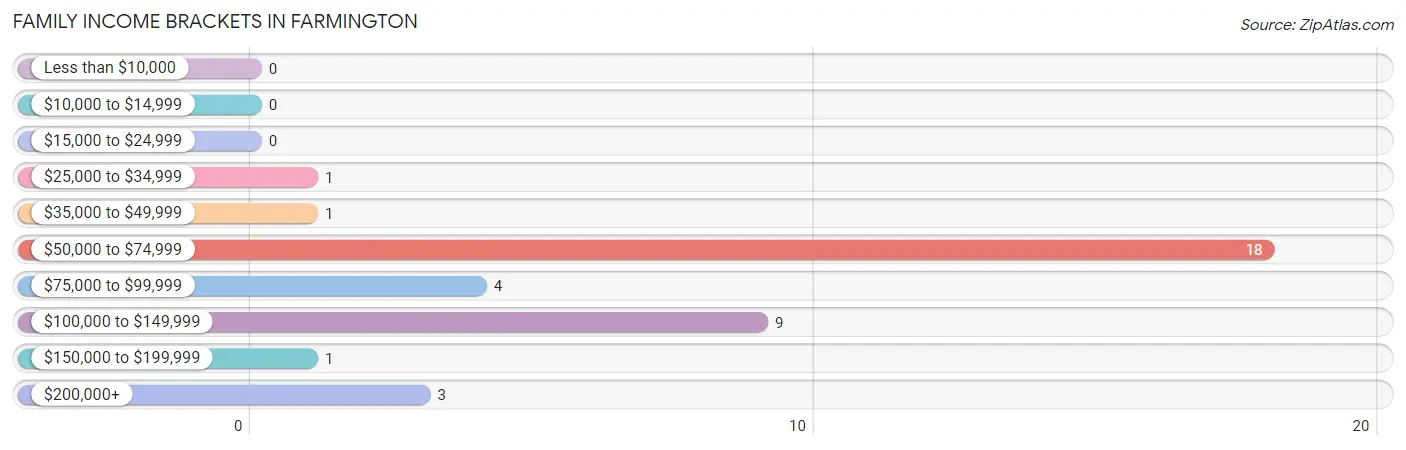
| Income Bracket | # Families | % Families |
| Less than $10,000 | 0 | 0.0% |
| $10,000 to $14,999 | 0 | 0.0% |
| $15,000 to $24,999 | 0 | 0.0% |
| $25,000 to $34,999 | 1 | 2.7% |
| $35,000 to $49,999 | 1 | 2.7% |
| $50,000 to $74,999 | 18 | 48.6% |
| $75,000 to $99,999 | 4 | 10.8% |
| $100,000 to $149,999 | 9 | 24.3% |
| $150,000 to $199,999 | 1 | 2.7% |
| $200,000+ | 3 | 8.1% |
Family Income by Famaliy Size in Farmington
2-person families (26 | 70.3%) account for the highest median family income in Farmington with $60,000 per family, while 2-person families (26 | 70.3%) have the highest median income of $30,000 per family member.
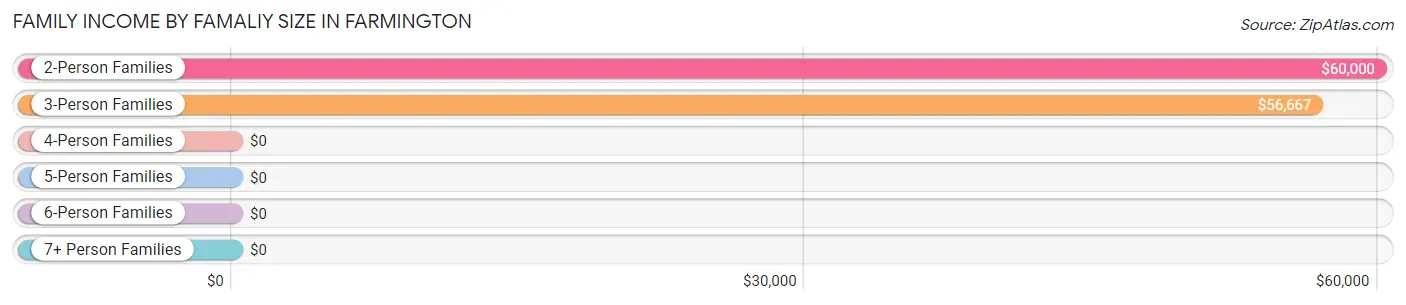
| Income Bracket | # Families | Median Income |
| 2-Person Families | 26 (70.3%) | $60,000 |
| 3-Person Families | 4 (10.8%) | $56,667 |
| 4-Person Families | 7 (18.9%) | $0 |
| 5-Person Families | 0 (0.0%) | $0 |
| 6-Person Families | 0 (0.0%) | $0 |
| 7+ Person Families | 0 (0.0%) | $0 |
| Total | 37 (100.0%) | $61,563 |
Family Income by Number of Earners in Farmington
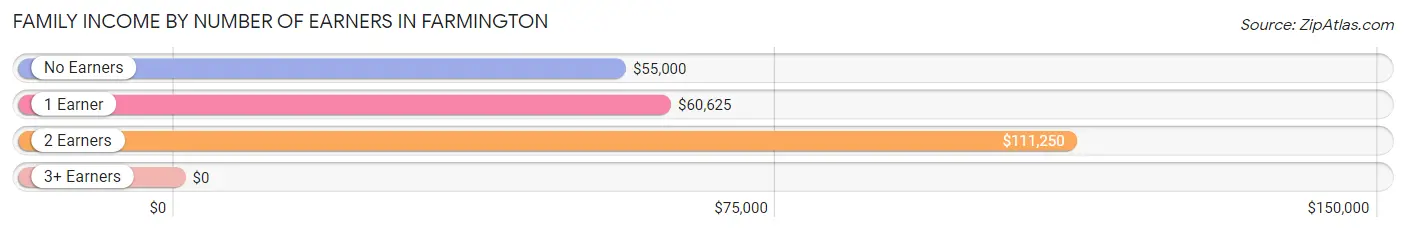
| Number of Earners | # Families | Median Income |
| No Earners | 10 (27.0%) | $55,000 |
| 1 Earner | 12 (32.4%) | $60,625 |
| 2 Earners | 15 (40.5%) | $111,250 |
| 3+ Earners | 0 (0.0%) | $0 |
| Total | 37 (100.0%) | $61,563 |
Household Income in Farmington
Household Income Brackets in Farmington
With 19 households falling in the category, the less than $10,000 income range is the most frequent in Farmington, accounting for 24.0% of all households. In contrast, only 1 households (1.3%) fall into the $150,000 to $199,999 income bracket, making it the least populous group.
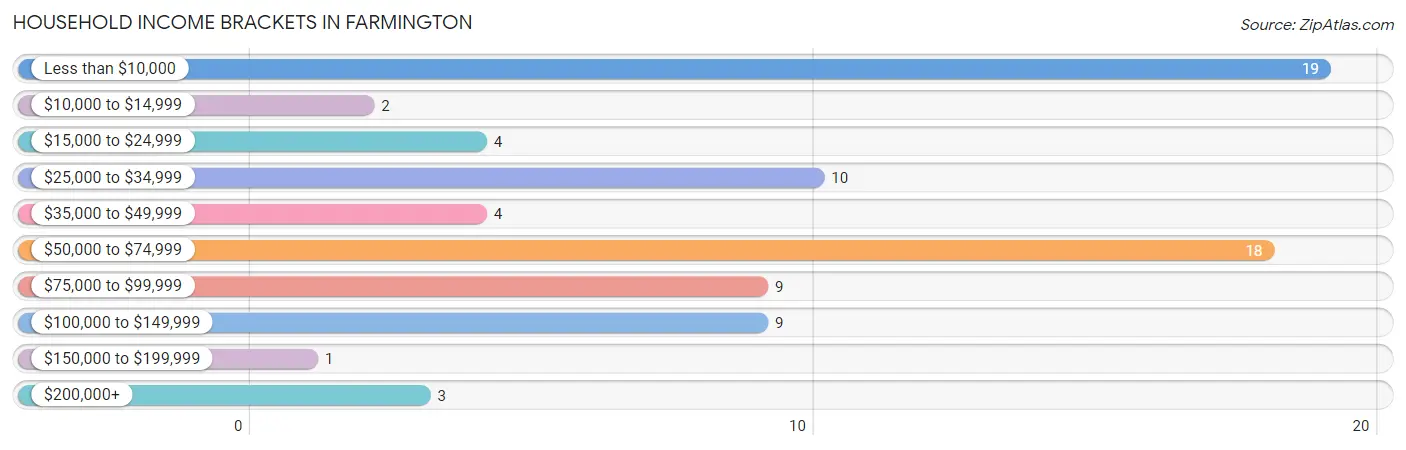
| Income Bracket | # Households | % Households |
| Less than $10,000 | 19 | 24.1% |
| $10,000 to $14,999 | 2 | 2.5% |
| $15,000 to $24,999 | 4 | 5.1% |
| $25,000 to $34,999 | 10 | 12.7% |
| $35,000 to $49,999 | 4 | 5.1% |
| $50,000 to $74,999 | 18 | 22.8% |
| $75,000 to $99,999 | 9 | 11.4% |
| $100,000 to $149,999 | 9 | 11.4% |
| $150,000 to $199,999 | 1 | 1.3% |
| $200,000+ | 3 | 3.8% |
Household Income by Householder Age in Farmington
The median household income in Farmington is $52,917, with the highest median household income of $55,938 found in the 65+ years age bracket for the primary householder. A total of 29 households (36.7%) fall into this category.
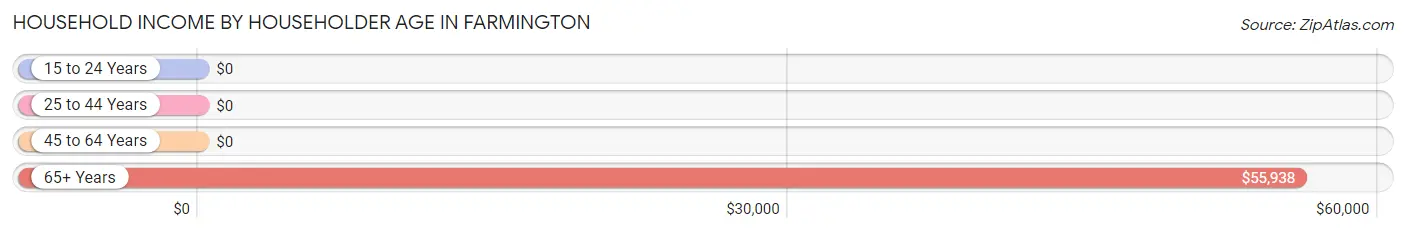
| Income Bracket | # Households | Median Income |
| 15 to 24 Years | 0 (0.0%) | $0 |
| 25 to 44 Years | 1 (1.3%) | $0 |
| 45 to 64 Years | 49 (62.0%) | $0 |
| 65+ Years | 29 (36.7%) | $55,938 |
| Total | 79 (100.0%) | $52,917 |
Poverty in Farmington
Income Below Poverty by Sex and Age in Farmington
With 20.4% poverty level for males and 5.4% for females among the residents of Farmington, 55 to 64 year old males and 75 year old and over females are the most vulnerable to poverty, with 13 males (46.4%) and 1 females (14.3%) in their respective age groups living below the poverty level.
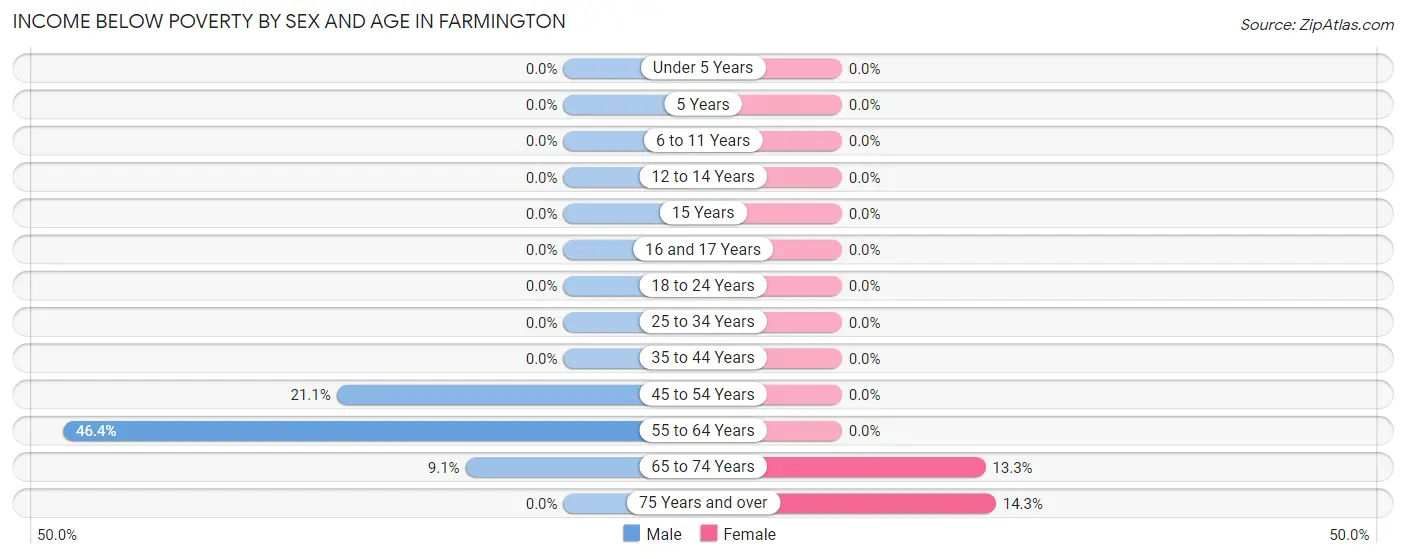
| Age Bracket | Male | Female |
| Under 5 Years | 0 (0.0%) | 0 (0.0%) |
| 5 Years | 0 (0.0%) | 0 (0.0%) |
| 6 to 11 Years | 0 (0.0%) | 0 (0.0%) |
| 12 to 14 Years | 0 (0.0%) | 0 (0.0%) |
| 15 Years | 0 (0.0%) | 0 (0.0%) |
| 16 and 17 Years | 0 (0.0%) | 0 (0.0%) |
| 18 to 24 Years | 0 (0.0%) | 0 (0.0%) |
| 25 to 34 Years | 0 (0.0%) | 0 (0.0%) |
| 35 to 44 Years | 0 (0.0%) | 0 (0.0%) |
| 45 to 54 Years | 4 (21.0%) | 0 (0.0%) |
| 55 to 64 Years | 13 (46.4%) | 0 (0.0%) |
| 65 to 74 Years | 1 (9.1%) | 2 (13.3%) |
| 75 Years and over | 0 (0.0%) | 1 (14.3%) |
| Total | 18 (20.4%) | 3 (5.4%) |
Income Above Poverty by Sex and Age in Farmington
According to the poverty statistics in Farmington, males aged under 5 years and females aged 15 years are the age groups that are most secure financially, with 100.0% of males and 100.0% of females in these age groups living above the poverty line.
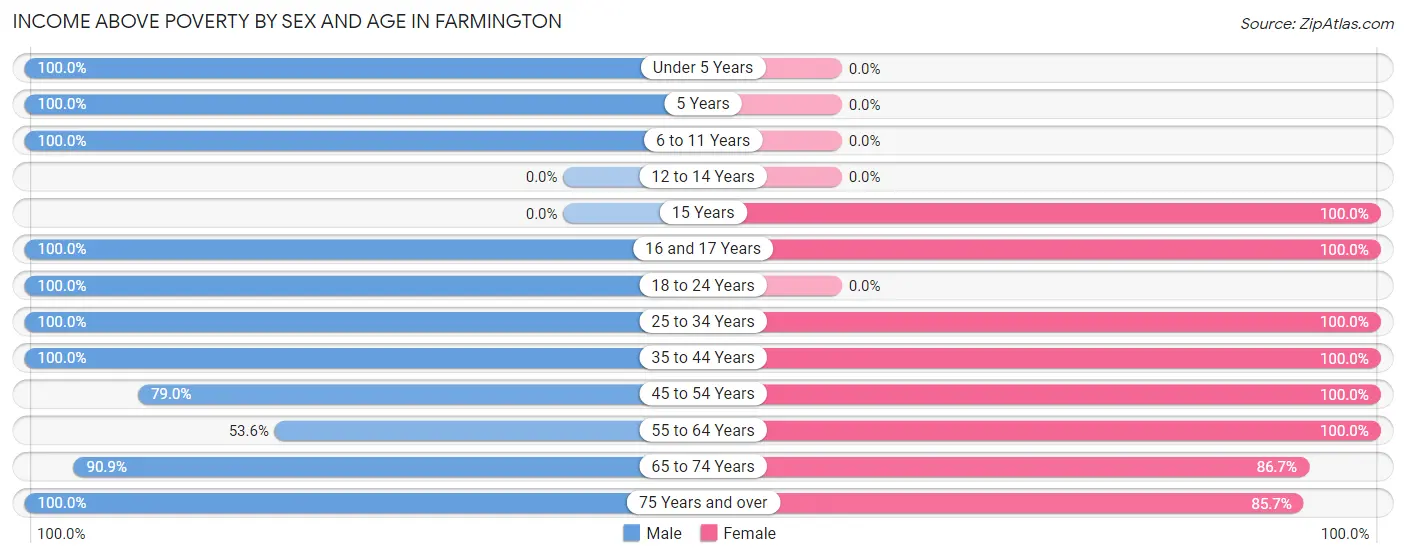
| Age Bracket | Male | Female |
| Under 5 Years | 2 (100.0%) | 0 (0.0%) |
| 5 Years | 2 (100.0%) | 0 (0.0%) |
| 6 to 11 Years | 4 (100.0%) | 0 (0.0%) |
| 12 to 14 Years | 0 (0.0%) | 0 (0.0%) |
| 15 Years | 0 (0.0%) | 2 (100.0%) |
| 16 and 17 Years | 6 (100.0%) | 1 (100.0%) |
| 18 to 24 Years | 7 (100.0%) | 0 (0.0%) |
| 25 to 34 Years | 1 (100.0%) | 7 (100.0%) |
| 35 to 44 Years | 2 (100.0%) | 10 (100.0%) |
| 45 to 54 Years | 15 (78.9%) | 6 (100.0%) |
| 55 to 64 Years | 15 (53.6%) | 8 (100.0%) |
| 65 to 74 Years | 10 (90.9%) | 13 (86.7%) |
| 75 Years and over | 6 (100.0%) | 6 (85.7%) |
| Total | 70 (79.5%) | 53 (94.6%) |
Income Below Poverty Among Married-Couple Families in Farmington
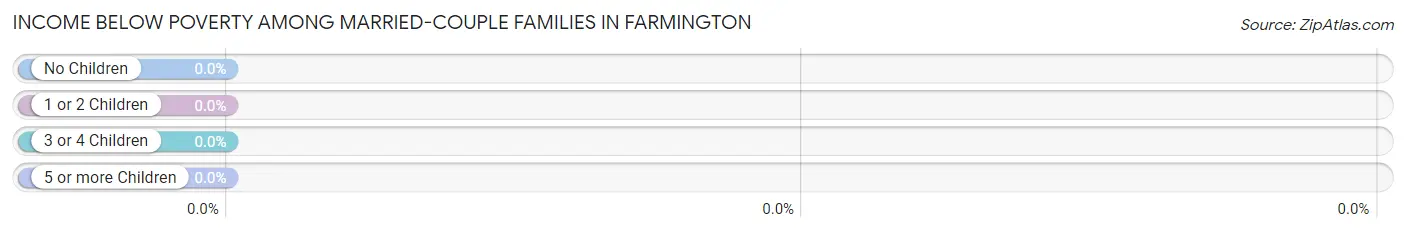
| Children | Above Poverty | Below Poverty |
| No Children | 22 (100.0%) | 0 (0.0%) |
| 1 or 2 Children | 10 (100.0%) | 0 (0.0%) |
| 3 or 4 Children | 0 (0.0%) | 0 (0.0%) |
| 5 or more Children | 0 (0.0%) | 0 (0.0%) |
| Total | 32 (100.0%) | 0 (0.0%) |
Income Below Poverty Among Single-Parent Households in Farmington
| Children | Single Father | Single Mother |
| No Children | 0 (0.0%) | 0 (0.0%) |
| 1 or 2 Children | 0 (0.0%) | 0 (0.0%) |
| 3 or 4 Children | 0 (0.0%) | 0 (0.0%) |
| 5 or more Children | 0 (0.0%) | 0 (0.0%) |
| Total | 0 (0.0%) | 0 (0.0%) |
Income Below Poverty Among Married-Couple vs Single-Parent Households in Farmington
| Children | Married-Couple Families | Single-Parent Households |
| No Children | 0 (0.0%) | 0 (0.0%) |
| 1 or 2 Children | 0 (0.0%) | 0 (0.0%) |
| 3 or 4 Children | 0 (0.0%) | 0 (0.0%) |
| 5 or more Children | 0 (0.0%) | 0 (0.0%) |
| Total | 0 (0.0%) | 0 (0.0%) |
Race in Farmington
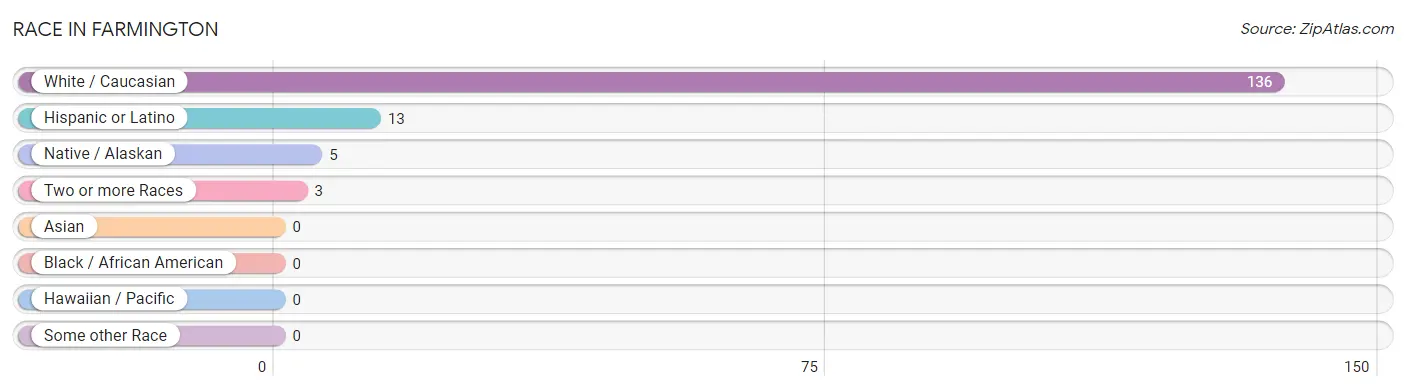
The most populous races in Farmington are White / Caucasian (136 | 94.4%), Hispanic or Latino (13 | 9.0%), and Native / Alaskan (5 | 3.5%).
| Race | # Population | % Population |
| Asian | 0 | 0.0% |
| Black / African American | 0 | 0.0% |
| Hawaiian / Pacific | 0 | 0.0% |
| Hispanic or Latino | 13 | 9.0% |
| Native / Alaskan | 5 | 3.5% |
| White / Caucasian | 136 | 94.4% |
| Two or more Races | 3 | 2.1% |
| Some other Race | 0 | 0.0% |
| Total | 144 | 100.0% |
Ancestry in Farmington
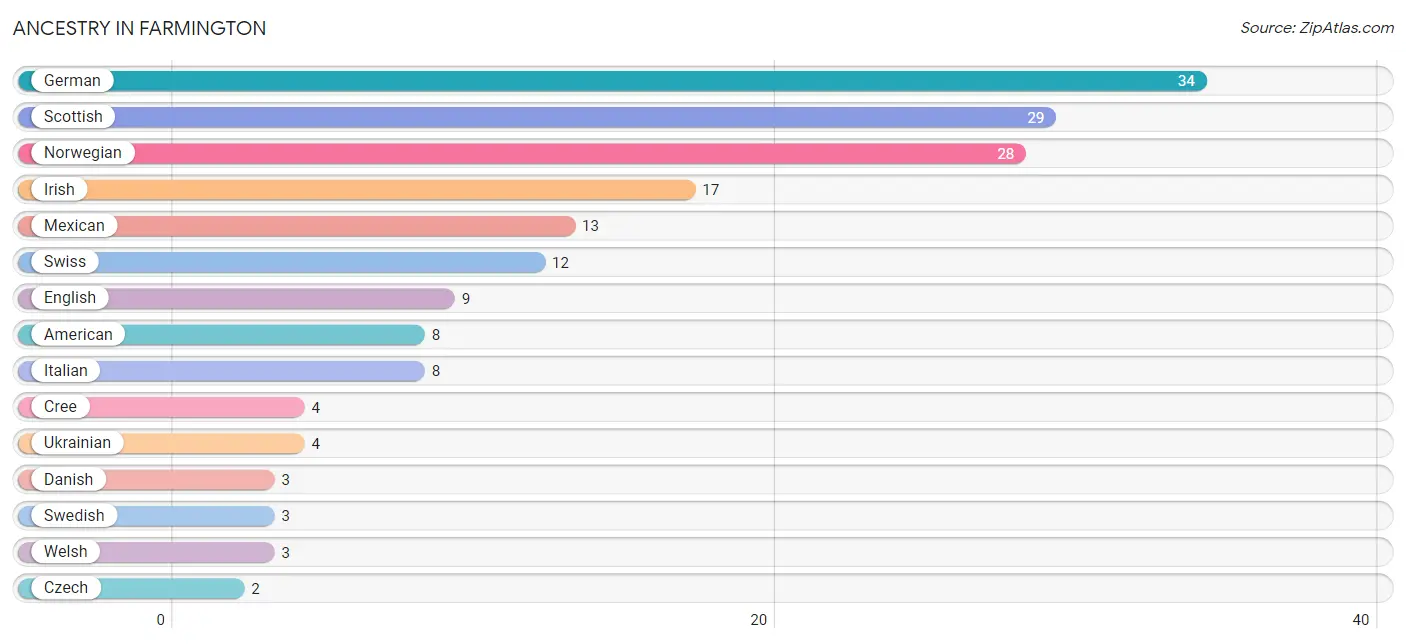
The most populous ancestries reported in Farmington are German (34 | 23.6%), Scottish (29 | 20.1%), Norwegian (28 | 19.4%), Irish (17 | 11.8%), and Mexican (13 | 9.0%), together accounting for 84.0% of all Farmington residents.
| Ancestry | # Population | % Population |
| American | 8 | 5.6% |
| Apache | 1 | 0.7% |
| Cree | 4 | 2.8% |
| Czech | 2 | 1.4% |
| Danish | 3 | 2.1% |
| English | 9 | 6.2% |
| German | 34 | 23.6% |
| Irish | 17 | 11.8% |
| Italian | 8 | 5.6% |
| Mexican | 13 | 9.0% |
| Norwegian | 28 | 19.4% |
| Polish | 2 | 1.4% |
| Russian | 2 | 1.4% |
| Scotch-Irish | 1 | 0.7% |
| Scottish | 29 | 20.1% |
| Swedish | 3 | 2.1% |
| Swiss | 12 | 8.3% |
| Ukrainian | 4 | 2.8% |
| Welsh | 3 | 2.1% | View All 19 Rows |
Immigrants in Farmington
The most numerous immigrant groups reported in Farmington came from , and Canada (4 | 2.8%), together accounting for 2.8% of all Farmington residents.

| Immigration Origin | # Population | % Population |
| Canada | 4 | 2.8% | View All 1 Rows |
Sex and Age in Farmington
Sex and Age in Farmington
The most populous age groups in Farmington are 60 to 64 Years (16 | 18.2%) for men and 65 to 69 Years (13 | 23.2%) for women.
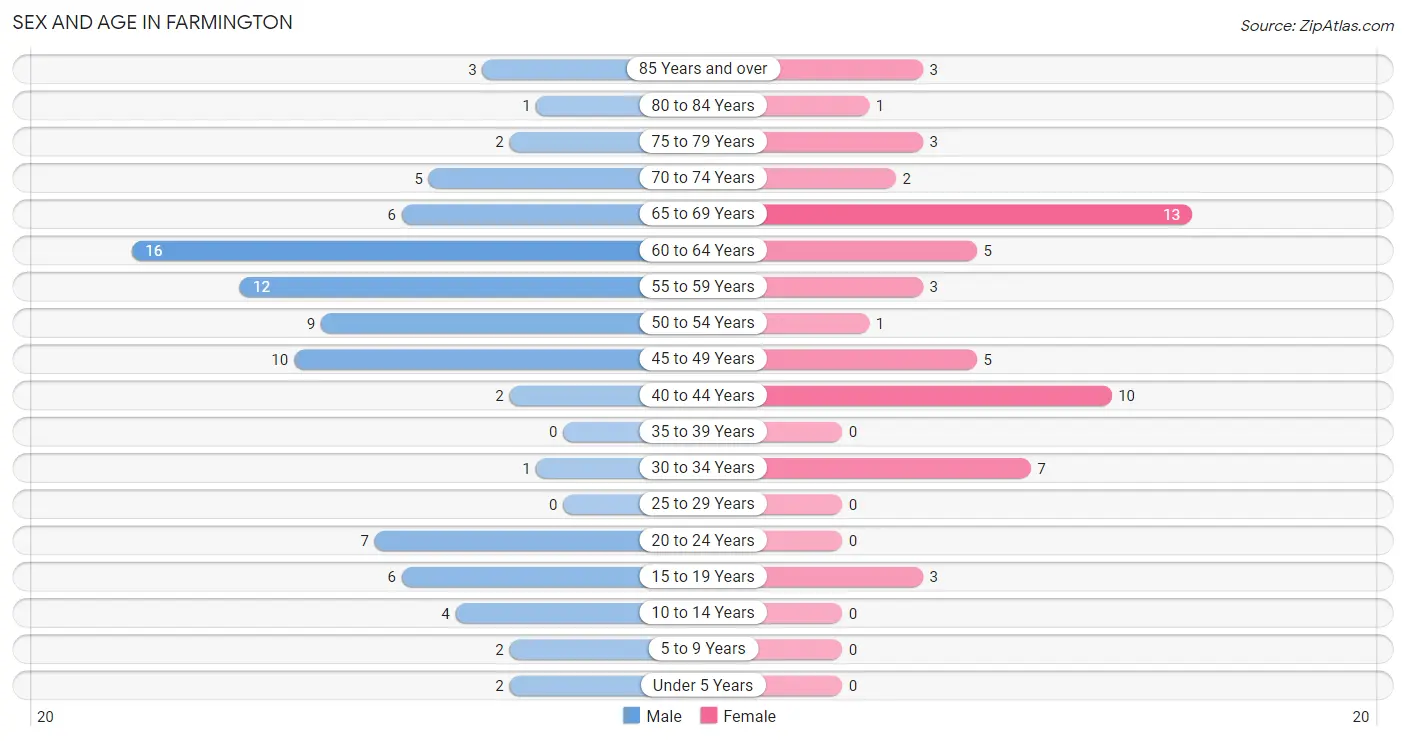
| Age Bracket | Male | Female |
| Under 5 Years | 2 (2.3%) | 0 (0.0%) |
| 5 to 9 Years | 2 (2.3%) | 0 (0.0%) |
| 10 to 14 Years | 4 (4.5%) | 0 (0.0%) |
| 15 to 19 Years | 6 (6.8%) | 3 (5.4%) |
| 20 to 24 Years | 7 (8.0%) | 0 (0.0%) |
| 25 to 29 Years | 0 (0.0%) | 0 (0.0%) |
| 30 to 34 Years | 1 (1.1%) | 7 (12.5%) |
| 35 to 39 Years | 0 (0.0%) | 0 (0.0%) |
| 40 to 44 Years | 2 (2.3%) | 10 (17.9%) |
| 45 to 49 Years | 10 (11.4%) | 5 (8.9%) |
| 50 to 54 Years | 9 (10.2%) | 1 (1.8%) |
| 55 to 59 Years | 12 (13.6%) | 3 (5.4%) |
| 60 to 64 Years | 16 (18.2%) | 5 (8.9%) |
| 65 to 69 Years | 6 (6.8%) | 13 (23.2%) |
| 70 to 74 Years | 5 (5.7%) | 2 (3.6%) |
| 75 to 79 Years | 2 (2.3%) | 3 (5.4%) |
| 80 to 84 Years | 1 (1.1%) | 1 (1.8%) |
| 85 Years and over | 3 (3.4%) | 3 (5.4%) |
| Total | 88 (100.0%) | 56 (100.0%) |
Families and Households in Farmington
Median Family Size in Farmington
The median family size in Farmington is 2.76 persons per family, with single male/father families (1 | 2.7%) accounting for the largest median family size of 3 persons per family. On the other hand, single female/mother families (4 | 10.8%) represent the smallest median family size with 2.50 persons per family.
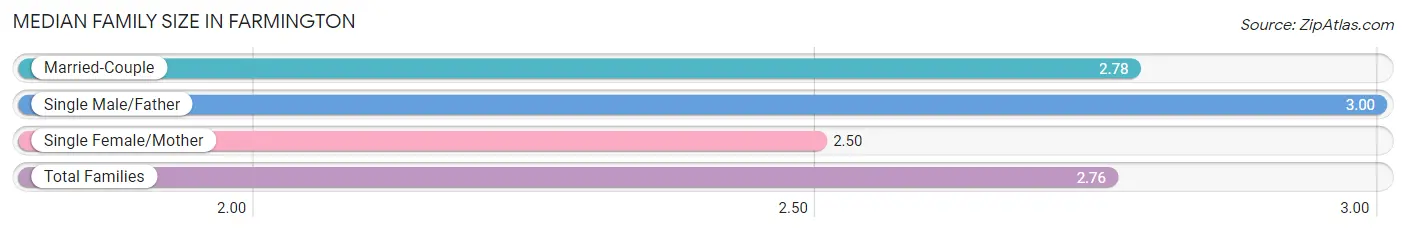
| Family Type | # Families | Family Size |
| Married-Couple | 32 (86.5%) | 2.78 |
| Single Male/Father | 1 (2.7%) | 3.00 |
| Single Female/Mother | 4 (10.8%) | 2.50 |
| Total Families | 37 (100.0%) | 2.76 |
Median Household Size in Farmington
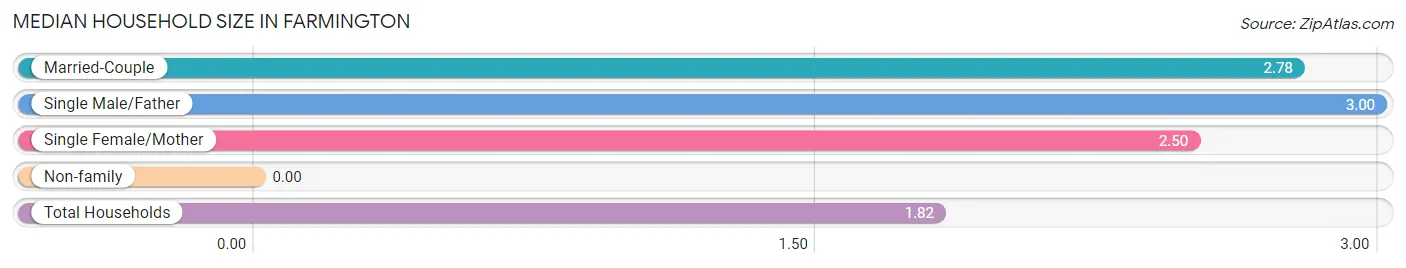
| Household Type | # Households | Household Size |
| Married-Couple | 32 (40.5%) | 2.78 |
| Single Male/Father | 1 (1.3%) | 3.00 |
| Single Female/Mother | 4 (5.1%) | 2.50 |
| Non-family | 42 (53.2%) | - |
| Total Households | 79 (100.0%) | 1.82 |
Household Size by Marriage Status in Farmington
Out of a total of 79 households in Farmington, 37 (46.8%) are family households, while 42 (53.2%) are nonfamily households. The most numerous type of family households are 2-person households, comprising 26, and the most common type of nonfamily households are 1-person households, comprising 42.
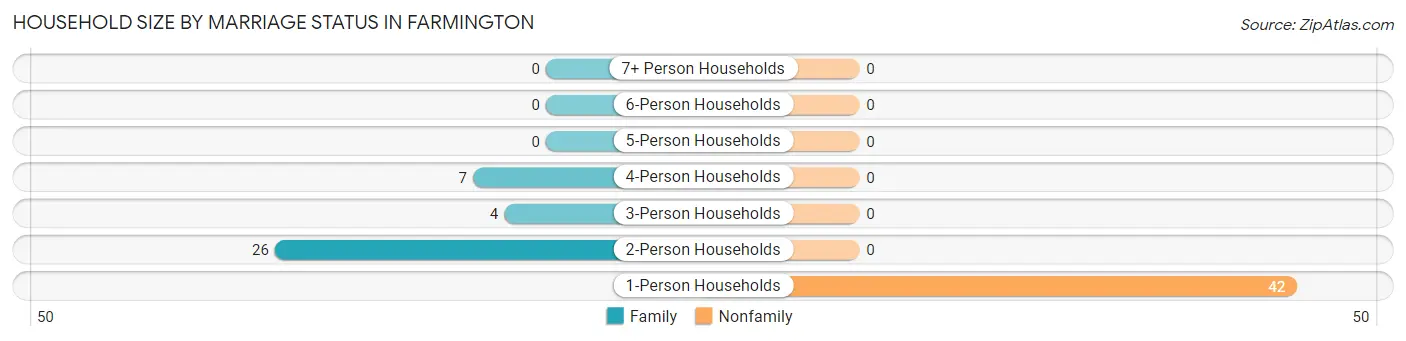
| Household Size | Family Households | Nonfamily Households |
| 1-Person Households | - | 42 (53.2%) |
| 2-Person Households | 26 (32.9%) | 0 (0.0%) |
| 3-Person Households | 4 (5.1%) | 0 (0.0%) |
| 4-Person Households | 7 (8.9%) | 0 (0.0%) |
| 5-Person Households | 0 (0.0%) | 0 (0.0%) |
| 6-Person Households | 0 (0.0%) | 0 (0.0%) |
| 7+ Person Households | 0 (0.0%) | 0 (0.0%) |
| Total | 37 (46.8%) | 42 (53.2%) |
Female Fertility in Farmington
Fertility by Age in Farmington
| Age Bracket | Women with Births | Births / 1,000 Women |
| 15 to 19 years | 0 (0.0%) | 0.0 |
| 20 to 34 years | 0 (0.0%) | 0.0 |
| 35 to 50 years | 0 (0.0%) | 0.0 |
| Total | 0 (0.0%) | 0.0 |
Fertility by Age by Marriage Status in Farmington
| Age Bracket | Married | Unmarried |
| 15 to 19 years | 0 (0.0%) | 0 (0.0%) |
| 20 to 34 years | 0 (0.0%) | 0 (0.0%) |
| 35 to 50 years | 0 (0.0%) | 0 (0.0%) |
| Total | 0 (0.0%) | 0 (0.0%) |
Fertility by Education in Farmington
| Educational Attainment | Women with Births | Births / 1,000 Women |
| Less than High School | 0 (0.0%) | 0.0 |
| High School Diploma | 0 (0.0%) | 0.0 |
| College or Associate's Degree | 0 (0.0%) | 0.0 |
| Bachelor's Degree | 0 (0.0%) | 0.0 |
| Graduate Degree | 0 (0.0%) | 0.0 |
| Total | 0 (0.0%) | 0.0 |
Fertility by Education by Marriage Status in Farmington
| Educational Attainment | Married | Unmarried |
| Less than High School | 0 (0.0%) | 0 (0.0%) |
| High School Diploma | 0 (0.0%) | 0 (0.0%) |
| College or Associate's Degree | 0 (0.0%) | 0 (0.0%) |
| Bachelor's Degree | 0 (0.0%) | 0 (0.0%) |
| Graduate Degree | 0 (0.0%) | 0 (0.0%) |
| Total | 0 (0.0%) | 0 (0.0%) |
Employment Characteristics in Farmington
Employment by Class of Employer in Farmington
Among the 55 employed individuals in Farmington, private company employees (31 | 56.4%), local government employees (17 | 30.9%), and state government employees (5 | 9.1%) make up the most common classes of employment.
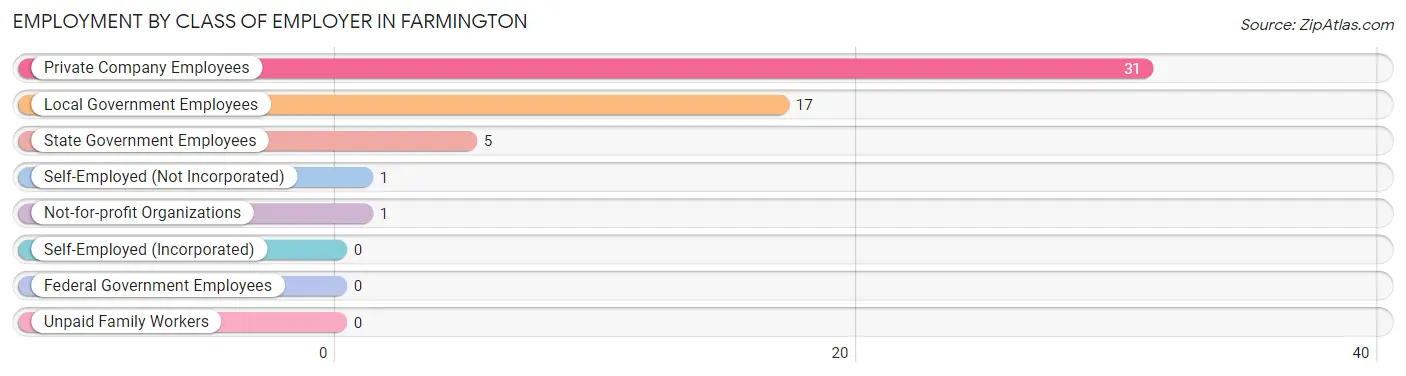
| Employer Class | # Employees | % Employees |
| Private Company Employees | 31 | 56.4% |
| Self-Employed (Incorporated) | 0 | 0.0% |
| Self-Employed (Not Incorporated) | 1 | 1.8% |
| Not-for-profit Organizations | 1 | 1.8% |
| Local Government Employees | 17 | 30.9% |
| State Government Employees | 5 | 9.1% |
| Federal Government Employees | 0 | 0.0% |
| Unpaid Family Workers | 0 | 0.0% |
| Total | 55 | 100.0% |
Employment Status by Age in Farmington
According to the labor force statistics for Farmington, out of the total population over 16 years of age (134), 44.8% or 60 individuals are in the labor force, with 6.7% or 4 of them unemployed. The age group with the highest labor force participation rate is 20 to 24 years, with 100.0% or 7 individuals in the labor force. Within the labor force, the 75 years and over age range has the highest percentage of unemployed individuals, with 100.0% or 1 of them being unemployed.
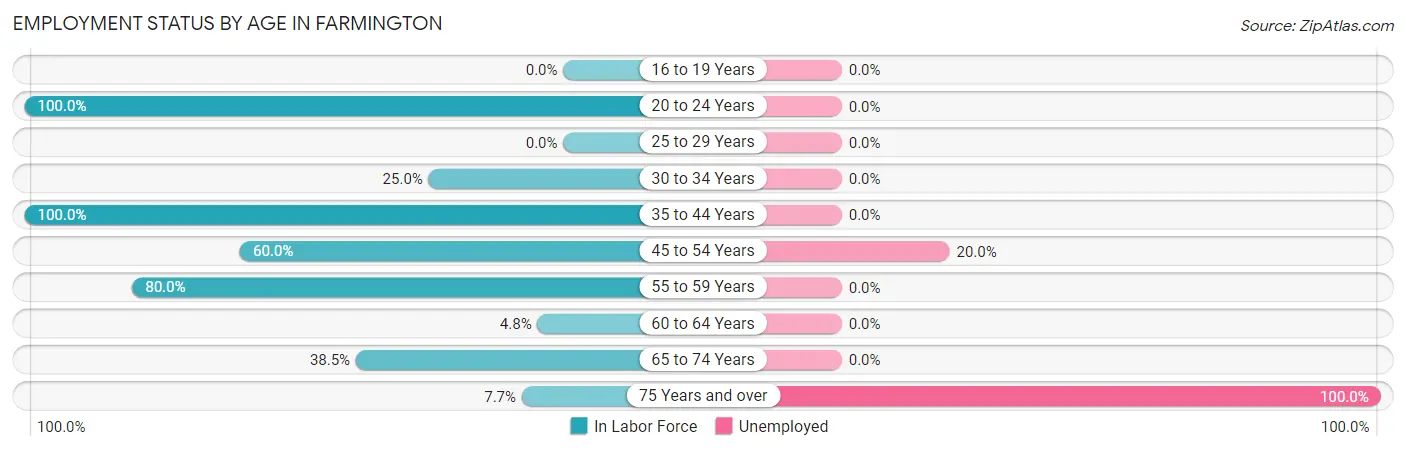
| Age Bracket | In Labor Force | Unemployed |
| 16 to 19 Years | 0 (0.0%) | 0 (0.0%) |
| 20 to 24 Years | 7 (100.0%) | 0 (0.0%) |
| 25 to 29 Years | 0 (0.0%) | 0 (0.0%) |
| 30 to 34 Years | 2 (25.0%) | 0 (0.0%) |
| 35 to 44 Years | 12 (100.0%) | 0 (0.0%) |
| 45 to 54 Years | 15 (60.0%) | 3 (20.0%) |
| 55 to 59 Years | 12 (80.0%) | 0 (0.0%) |
| 60 to 64 Years | 1 (4.8%) | 0 (0.0%) |
| 65 to 74 Years | 10 (38.5%) | 0 (0.0%) |
| 75 Years and over | 1 (7.7%) | 1 (100.0%) |
| Total | 60 (44.8%) | 4 (6.7%) |
Employment Status by Educational Attainment in Farmington
According to labor force statistics for Farmington, 51.9% of individuals (42) out of the total population between 25 and 64 years of age (81) are in the labor force, with 7.1% or 3 of them being unemployed. The group with the highest labor force participation rate are those with the educational attainment of college / associate degree, with 63.2% or 24 individuals in the labor force. Within the labor force, individuals with high school diploma education have the highest percentage of unemployment, with 25.0% or 3 of them being unemployed.
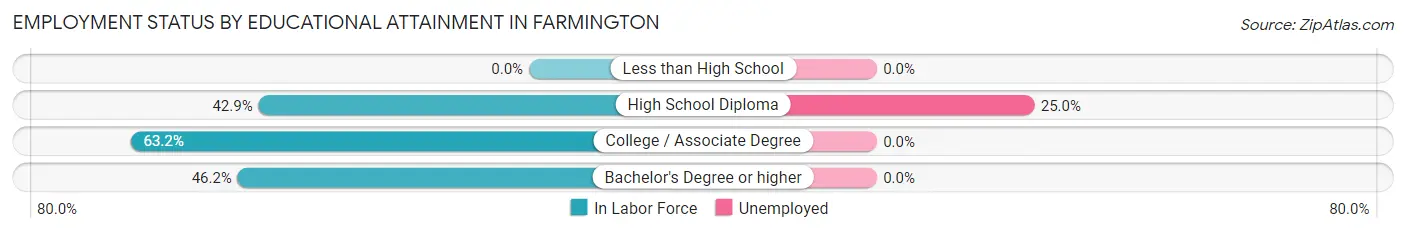
| Educational Attainment | In Labor Force | Unemployed |
| Less than High School | 0 (0.0%) | 0 (0.0%) |
| High School Diploma | 12 (42.9%) | 7 (25.0%) |
| College / Associate Degree | 24 (63.2%) | 0 (0.0%) |
| Bachelor's Degree or higher | 6 (46.2%) | 0 (0.0%) |
| Total | 42 (51.9%) | 6 (7.1%) |
Employment Occupations by Sex in Farmington
Management, Business, Science and Arts Occupations
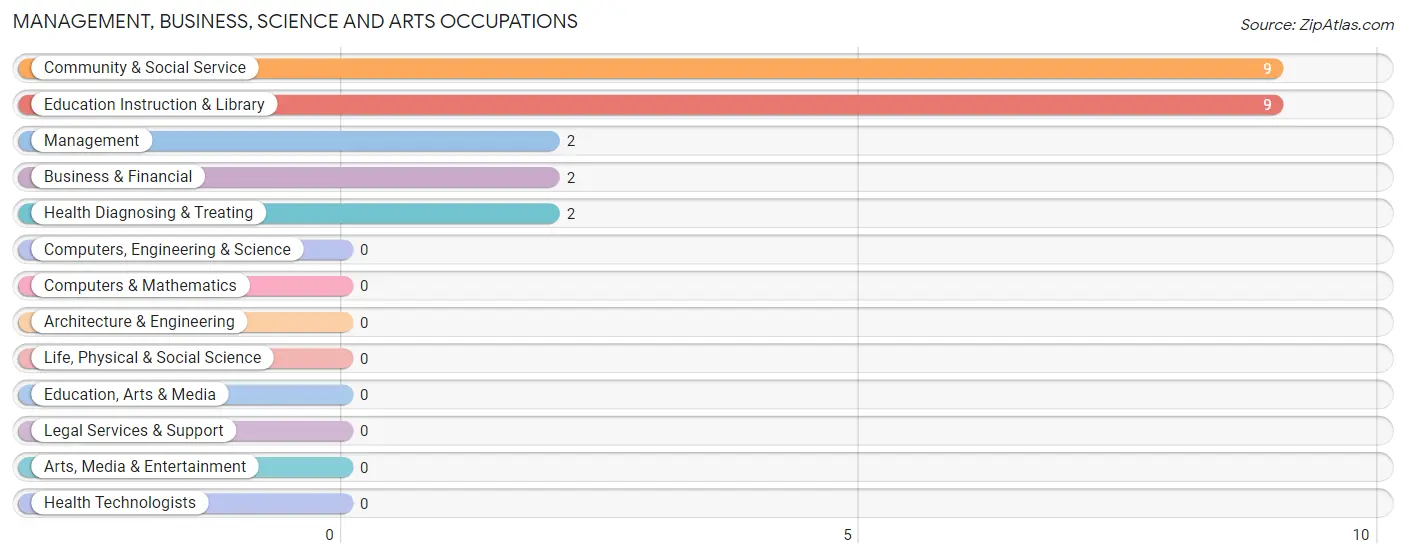
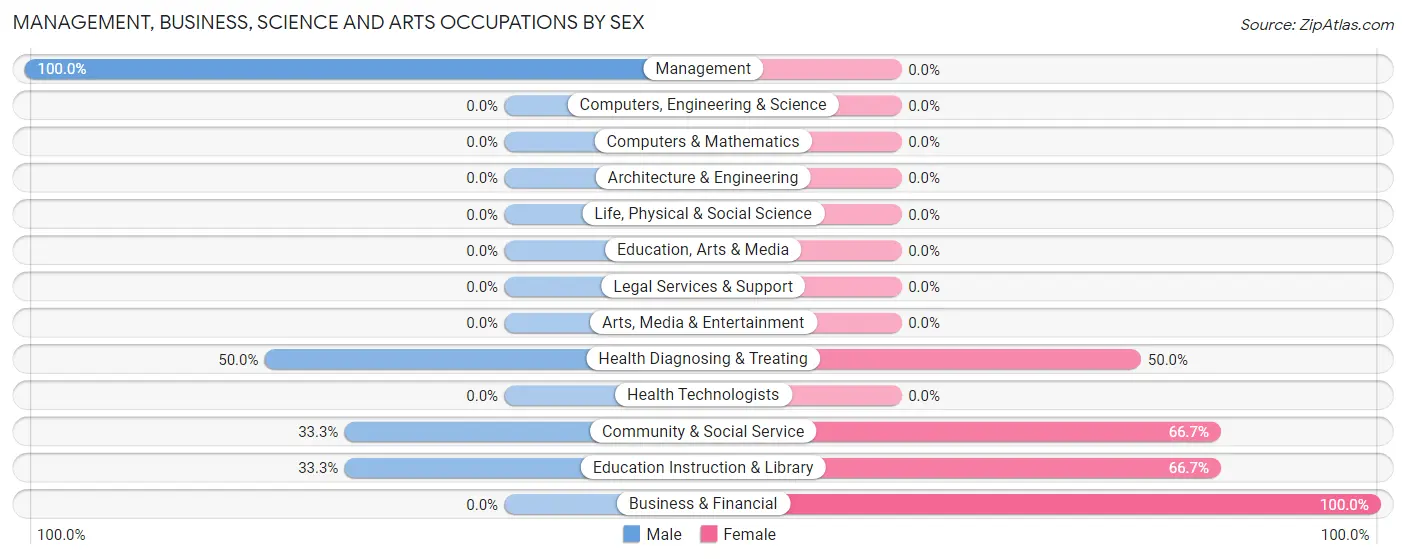
The most common Management, Business, Science and Arts occupations in Farmington are Community & Social Service (9 | 16.1%), Education Instruction & Library (9 | 16.1%), Management (2 | 3.6%), Business & Financial (2 | 3.6%), and Health Diagnosing & Treating (2 | 3.6%).
Management, Business, Science and Arts Occupations by Sex
Within the Management, Business, Science and Arts occupations in Farmington, the most male-oriented occupations are Management (100.0%), Health Diagnosing & Treating (50.0%), and Community & Social Service (33.3%), while the most female-oriented occupations are Business & Financial (100.0%), Community & Social Service (66.7%), and Education Instruction & Library (66.7%).
| Occupation | Male | Female |
| Management | 2 (100.0%) | 0 (0.0%) |
| Business & Financial | 0 (0.0%) | 2 (100.0%) |
| Computers, Engineering & Science | 0 (0.0%) | 0 (0.0%) |
| Computers & Mathematics | 0 (0.0%) | 0 (0.0%) |
| Architecture & Engineering | 0 (0.0%) | 0 (0.0%) |
| Life, Physical & Social Science | 0 (0.0%) | 0 (0.0%) |
| Community & Social Service | 3 (33.3%) | 6 (66.7%) |
| Education, Arts & Media | 0 (0.0%) | 0 (0.0%) |
| Legal Services & Support | 0 (0.0%) | 0 (0.0%) |
| Education Instruction & Library | 3 (33.3%) | 6 (66.7%) |
| Arts, Media & Entertainment | 0 (0.0%) | 0 (0.0%) |
| Health Diagnosing & Treating | 1 (50.0%) | 1 (50.0%) |
| Health Technologists | 0 (0.0%) | 0 (0.0%) |
| Total (Category) | 6 (40.0%) | 9 (60.0%) |
| Total (Overall) | 35 (62.5%) | 21 (37.5%) |
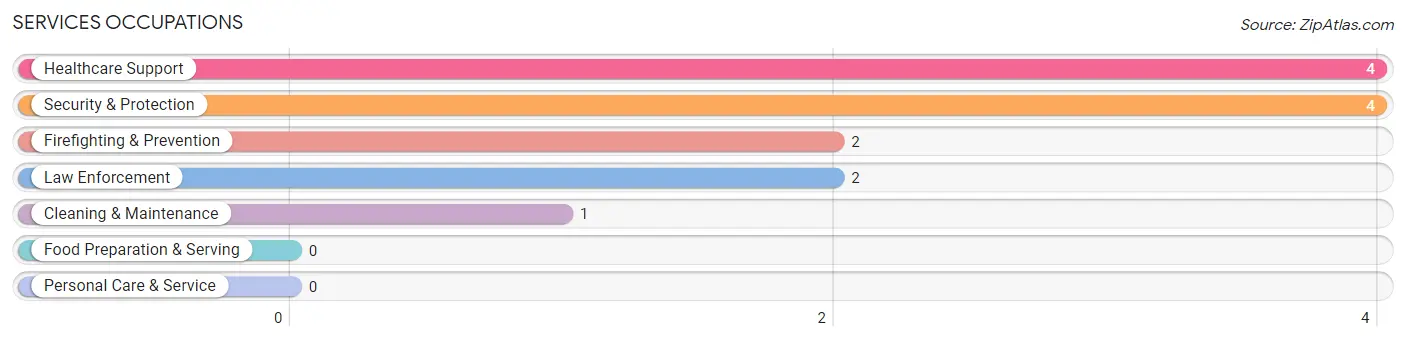
Services Occupations
The most common Services occupations in Farmington are Healthcare Support (4 | 7.1%), Security & Protection (4 | 7.1%), Firefighting & Prevention (2 | 3.6%), Law Enforcement (2 | 3.6%), and Cleaning & Maintenance (1 | 1.8%).
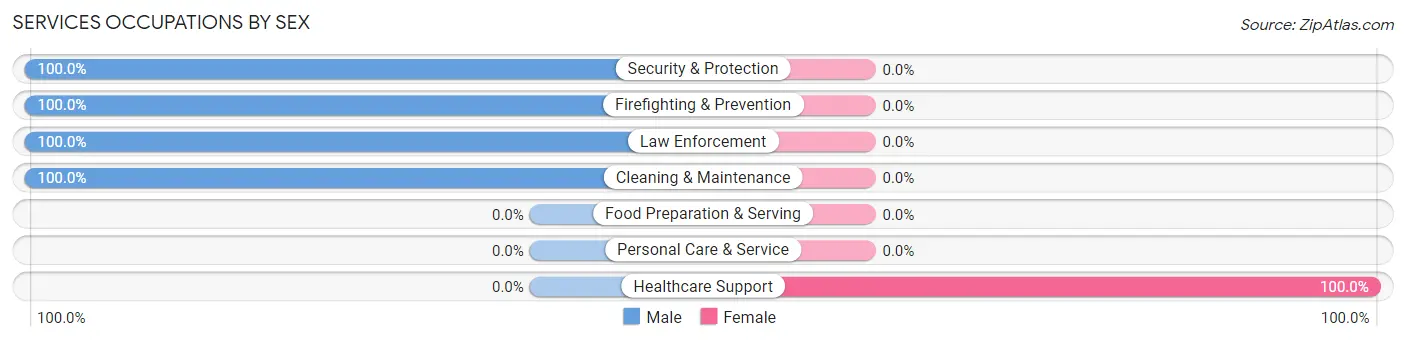
Services Occupations by Sex
| Occupation | Male | Female |
| Healthcare Support | 0 (0.0%) | 4 (100.0%) |
| Security & Protection | 4 (100.0%) | 0 (0.0%) |
| Firefighting & Prevention | 2 (100.0%) | 0 (0.0%) |
| Law Enforcement | 2 (100.0%) | 0 (0.0%) |
| Food Preparation & Serving | 0 (0.0%) | 0 (0.0%) |
| Cleaning & Maintenance | 1 (100.0%) | 0 (0.0%) |
| Personal Care & Service | 0 (0.0%) | 0 (0.0%) |
| Total (Category) | 5 (55.6%) | 4 (44.4%) |
| Total (Overall) | 35 (62.5%) | 21 (37.5%) |
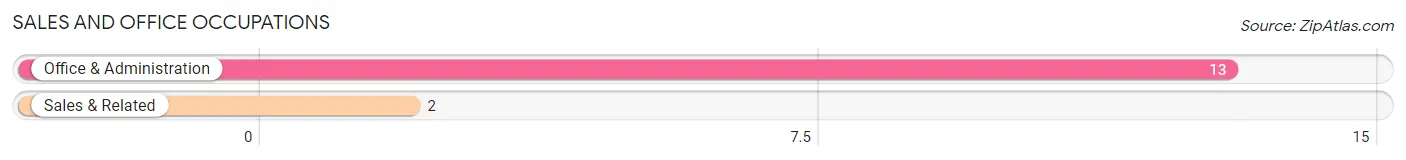
Sales and Office Occupations
The most common Sales and Office occupations in Farmington are Office & Administration (13 | 23.2%), and Sales & Related (2 | 3.6%).
Sales and Office Occupations by Sex

| Occupation | Male | Female |
| Sales & Related | 2 (100.0%) | 0 (0.0%) |
| Office & Administration | 7 (53.8%) | 6 (46.2%) |
| Total (Category) | 9 (60.0%) | 6 (40.0%) |
| Total (Overall) | 35 (62.5%) | 21 (37.5%) |
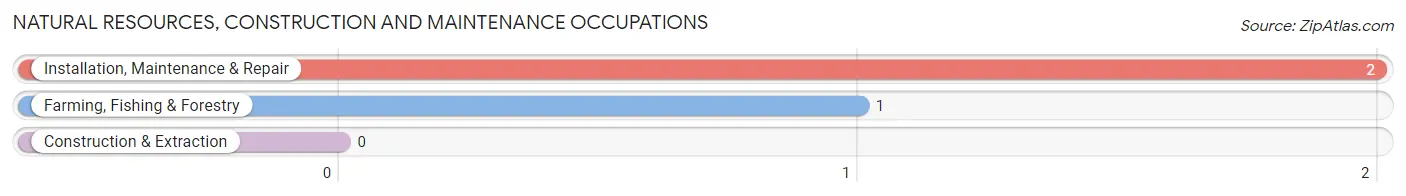
Natural Resources, Construction and Maintenance Occupations
The most common Natural Resources, Construction and Maintenance occupations in Farmington are Installation, Maintenance & Repair (2 | 3.6%), and Farming, Fishing & Forestry (1 | 1.8%).
Natural Resources, Construction and Maintenance Occupations by Sex
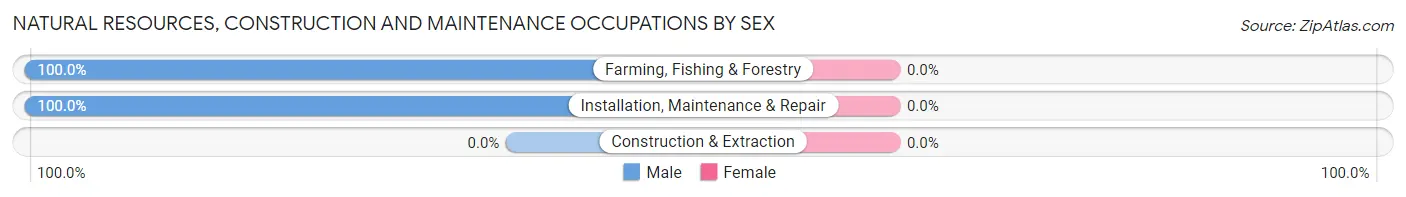
| Occupation | Male | Female |
| Farming, Fishing & Forestry | 1 (100.0%) | 0 (0.0%) |
| Construction & Extraction | 0 (0.0%) | 0 (0.0%) |
| Installation, Maintenance & Repair | 2 (100.0%) | 0 (0.0%) |
| Total (Category) | 3 (100.0%) | 0 (0.0%) |
| Total (Overall) | 35 (62.5%) | 21 (37.5%) |
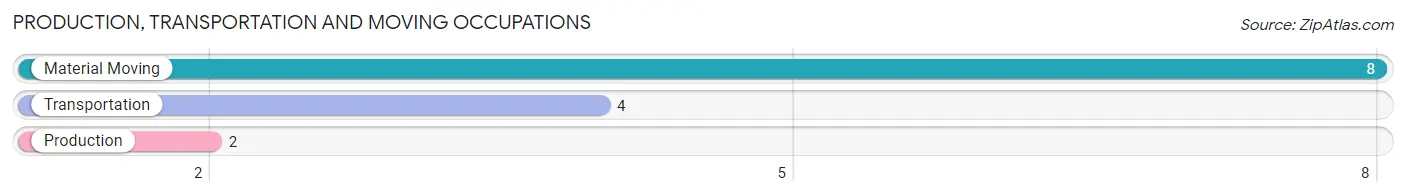
Production, Transportation and Moving Occupations
The most common Production, Transportation and Moving occupations in Farmington are Material Moving (8 | 14.3%), Transportation (4 | 7.1%), and Production (2 | 3.6%).
Production, Transportation and Moving Occupations by Sex
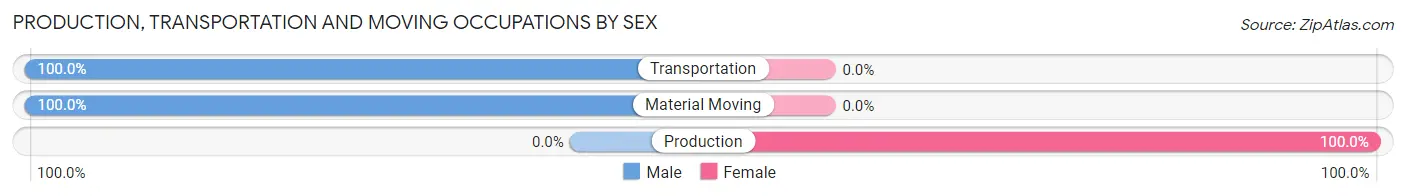
| Occupation | Male | Female |
| Production | 0 (0.0%) | 2 (100.0%) |
| Transportation | 4 (100.0%) | 0 (0.0%) |
| Material Moving | 8 (100.0%) | 0 (0.0%) |
| Total (Category) | 12 (85.7%) | 2 (14.3%) |
| Total (Overall) | 35 (62.5%) | 21 (37.5%) |
Employment Industries by Sex in Farmington
Employment Industries in Farmington
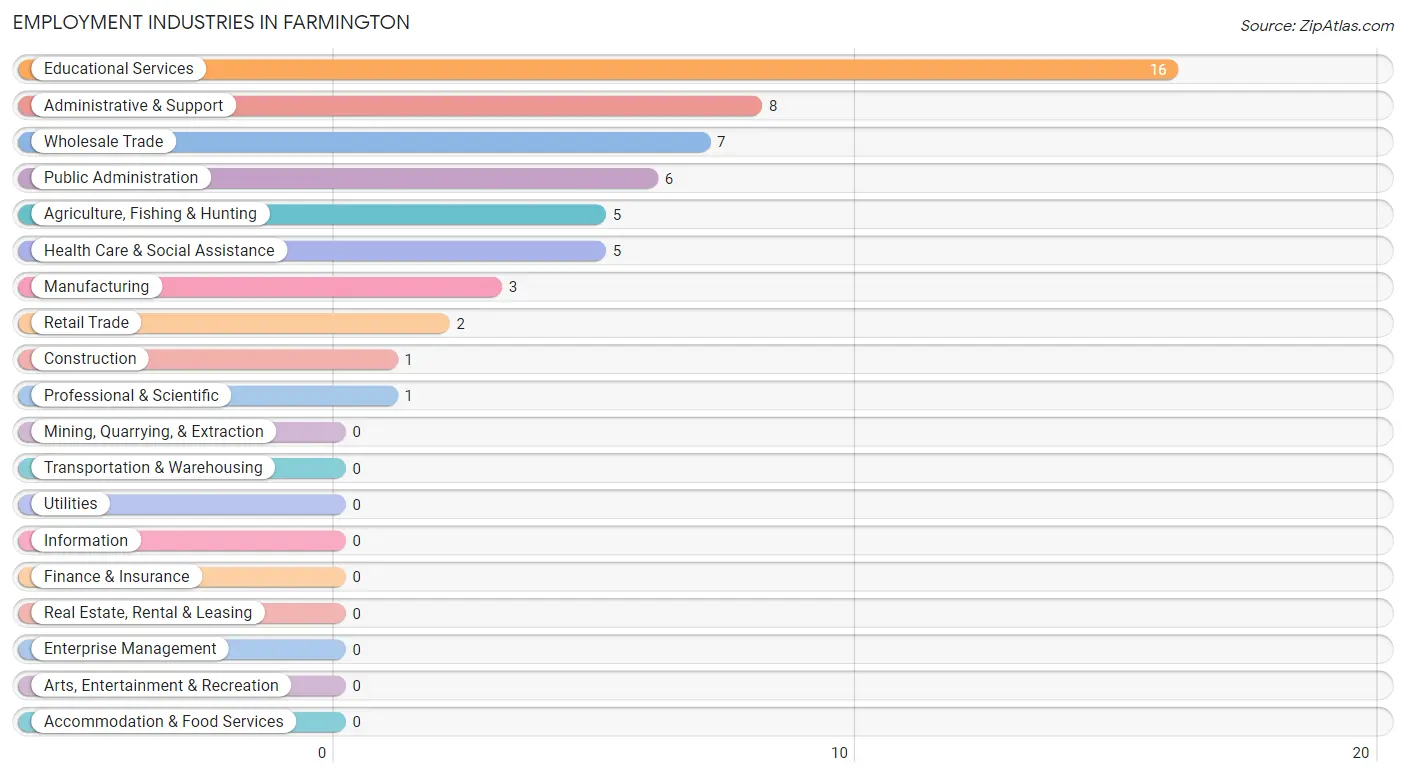
The major employment industries in Farmington include Educational Services (16 | 28.6%), Administrative & Support (8 | 14.3%), Wholesale Trade (7 | 12.5%), Public Administration (6 | 10.7%), and Agriculture, Fishing & Hunting (5 | 8.9%).
Employment Industries by Sex in Farmington
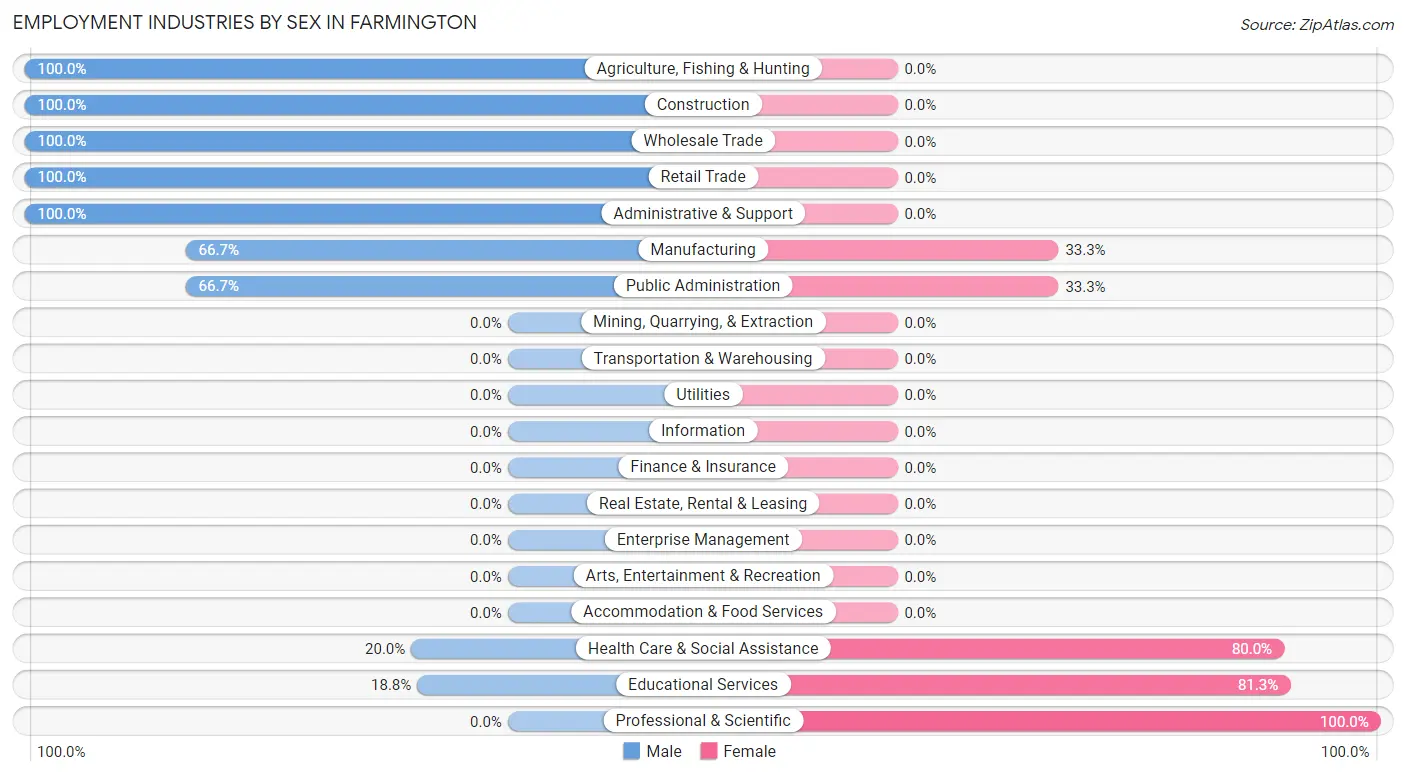
The Farmington industries that see more men than women are Agriculture, Fishing & Hunting (100.0%), Construction (100.0%), and Wholesale Trade (100.0%), whereas the industries that tend to have a higher number of women are Professional & Scientific (100.0%), Educational Services (81.2%), and Health Care & Social Assistance (80.0%).
| Industry | Male | Female |
| Agriculture, Fishing & Hunting | 5 (100.0%) | 0 (0.0%) |
| Mining, Quarrying, & Extraction | 0 (0.0%) | 0 (0.0%) |
| Construction | 1 (100.0%) | 0 (0.0%) |
| Manufacturing | 2 (66.7%) | 1 (33.3%) |
| Wholesale Trade | 7 (100.0%) | 0 (0.0%) |
| Retail Trade | 2 (100.0%) | 0 (0.0%) |
| Transportation & Warehousing | 0 (0.0%) | 0 (0.0%) |
| Utilities | 0 (0.0%) | 0 (0.0%) |
| Information | 0 (0.0%) | 0 (0.0%) |
| Finance & Insurance | 0 (0.0%) | 0 (0.0%) |
| Real Estate, Rental & Leasing | 0 (0.0%) | 0 (0.0%) |
| Professional & Scientific | 0 (0.0%) | 1 (100.0%) |
| Enterprise Management | 0 (0.0%) | 0 (0.0%) |
| Administrative & Support | 8 (100.0%) | 0 (0.0%) |
| Educational Services | 3 (18.8%) | 13 (81.2%) |
| Health Care & Social Assistance | 1 (20.0%) | 4 (80.0%) |
| Arts, Entertainment & Recreation | 0 (0.0%) | 0 (0.0%) |
| Accommodation & Food Services | 0 (0.0%) | 0 (0.0%) |
| Public Administration | 4 (66.7%) | 2 (33.3%) |
| Total | 35 (62.5%) | 21 (37.5%) |
Education in Farmington
School Enrollment in Farmington
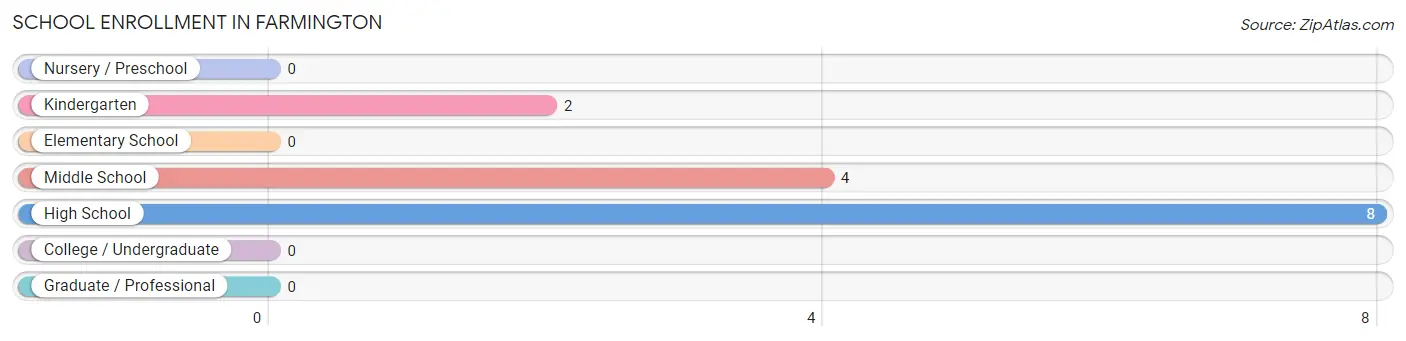
The most common levels of schooling among the 14 students in Farmington are high school (8 | 57.1%), middle school (4 | 28.6%), and kindergarten (2 | 14.3%).
| School Level | # Students | % Students |
| Nursery / Preschool | 0 | 0.0% |
| Kindergarten | 2 | 14.3% |
| Elementary School | 0 | 0.0% |
| Middle School | 4 | 28.6% |
| High School | 8 | 57.1% |
| College / Undergraduate | 0 | 0.0% |
| Graduate / Professional | 0 | 0.0% |
| Total | 14 | 100.0% |
School Enrollment by Age by Funding Source in Farmington
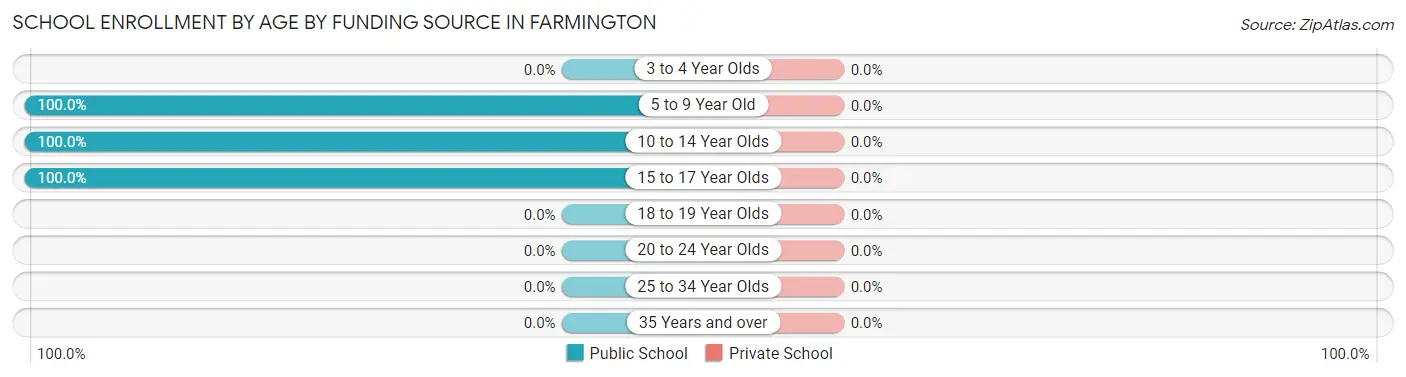
| Age Bracket | Public School | Private School |
| 3 to 4 Year Olds | 0 (0.0%) | 0 (0.0%) |
| 5 to 9 Year Old | 2 (100.0%) | 0 (0.0%) |
| 10 to 14 Year Olds | 4 (100.0%) | 0 (0.0%) |
| 15 to 17 Year Olds | 8 (100.0%) | 0 (0.0%) |
| 18 to 19 Year Olds | 0 (0.0%) | 0 (0.0%) |
| 20 to 24 Year Olds | 0 (0.0%) | 0 (0.0%) |
| 25 to 34 Year Olds | 0 (0.0%) | 0 (0.0%) |
| 35 Years and over | 0 (0.0%) | 0 (0.0%) |
| Total | 14 (100.0%) | 0 (0.0%) |
Educational Attainment by Field of Study in Farmington
Social sciences (7 | 25.0%), literature & languages (6 | 21.4%), psychology (5 | 17.9%), education (3 | 10.7%), and communications (2 | 7.1%) are the most common fields of study among 28 individuals in Farmington who have obtained a bachelor's degree or higher.
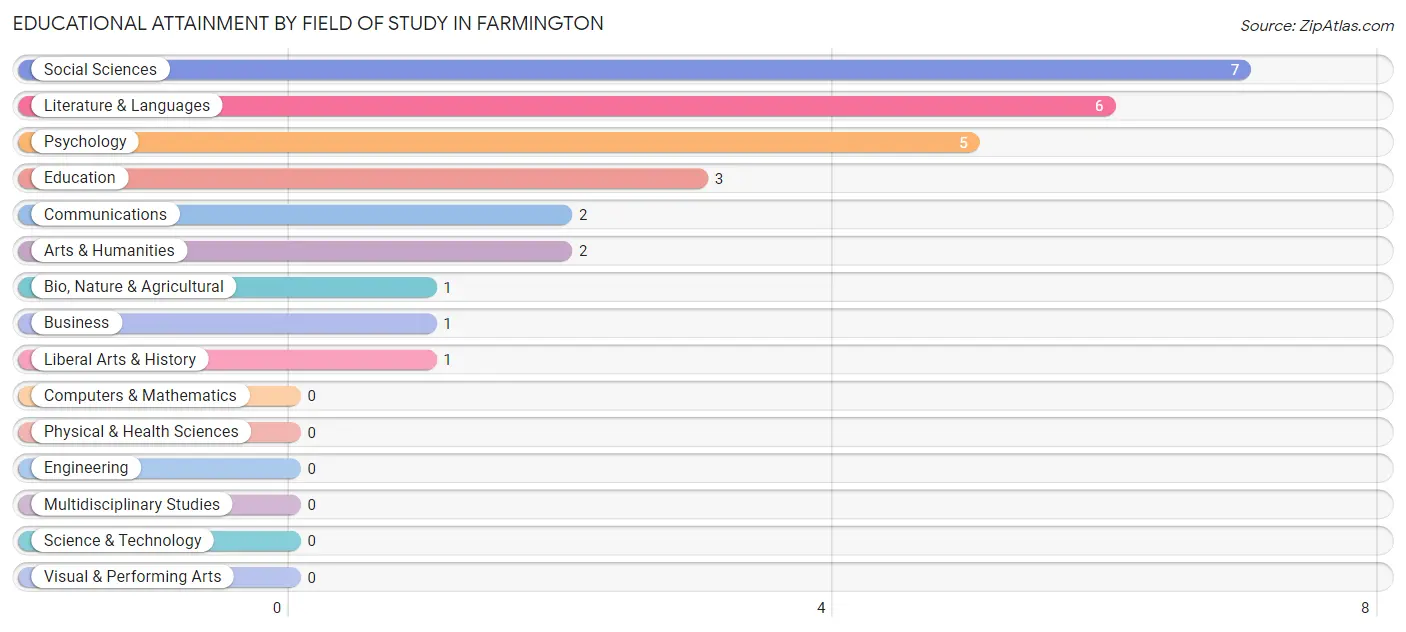
| Field of Study | # Graduates | % Graduates |
| Computers & Mathematics | 0 | 0.0% |
| Bio, Nature & Agricultural | 1 | 3.6% |
| Physical & Health Sciences | 0 | 0.0% |
| Psychology | 5 | 17.9% |
| Social Sciences | 7 | 25.0% |
| Engineering | 0 | 0.0% |
| Multidisciplinary Studies | 0 | 0.0% |
| Science & Technology | 0 | 0.0% |
| Business | 1 | 3.6% |
| Education | 3 | 10.7% |
| Literature & Languages | 6 | 21.4% |
| Liberal Arts & History | 1 | 3.6% |
| Visual & Performing Arts | 0 | 0.0% |
| Communications | 2 | 7.1% |
| Arts & Humanities | 2 | 7.1% |
| Total | 28 | 100.0% |
Transportation & Commute in Farmington
Vehicle Availability by Sex in Farmington
The most prevalent vehicle ownership categories in Farmington are males with 3 vehicles (12, accounting for 35.3%) and females with 3 vehicles (7, making up 57.1%).
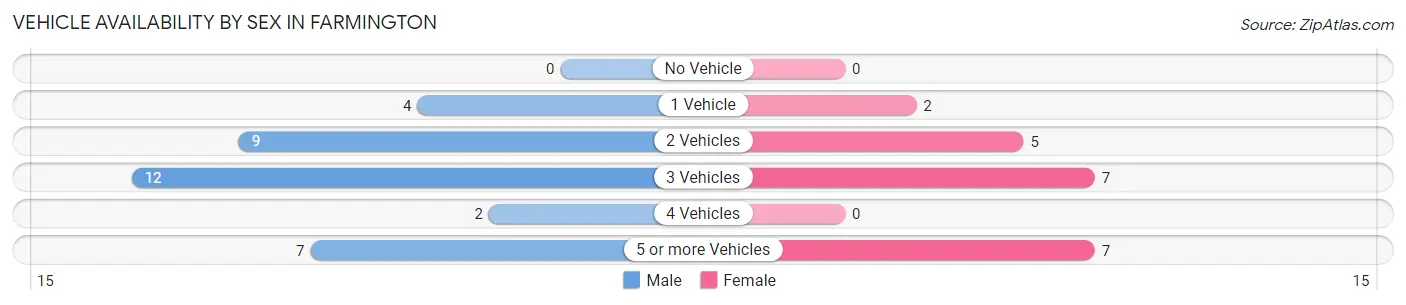
| Vehicles Available | Male | Female |
| No Vehicle | 0 (0.0%) | 0 (0.0%) |
| 1 Vehicle | 4 (11.8%) | 2 (9.5%) |
| 2 Vehicles | 9 (26.5%) | 5 (23.8%) |
| 3 Vehicles | 12 (35.3%) | 7 (33.3%) |
| 4 Vehicles | 2 (5.9%) | 0 (0.0%) |
| 5 or more Vehicles | 7 (20.6%) | 7 (33.3%) |
| Total | 34 (100.0%) | 21 (100.0%) |
Commute Time in Farmington
The most frequently occuring commute durations in Farmington are 45 to 59 minutes (10 commuters, 20.0%), 30 to 34 minutes (9 commuters, 18.0%), and 10 to 14 minutes (8 commuters, 16.0%).
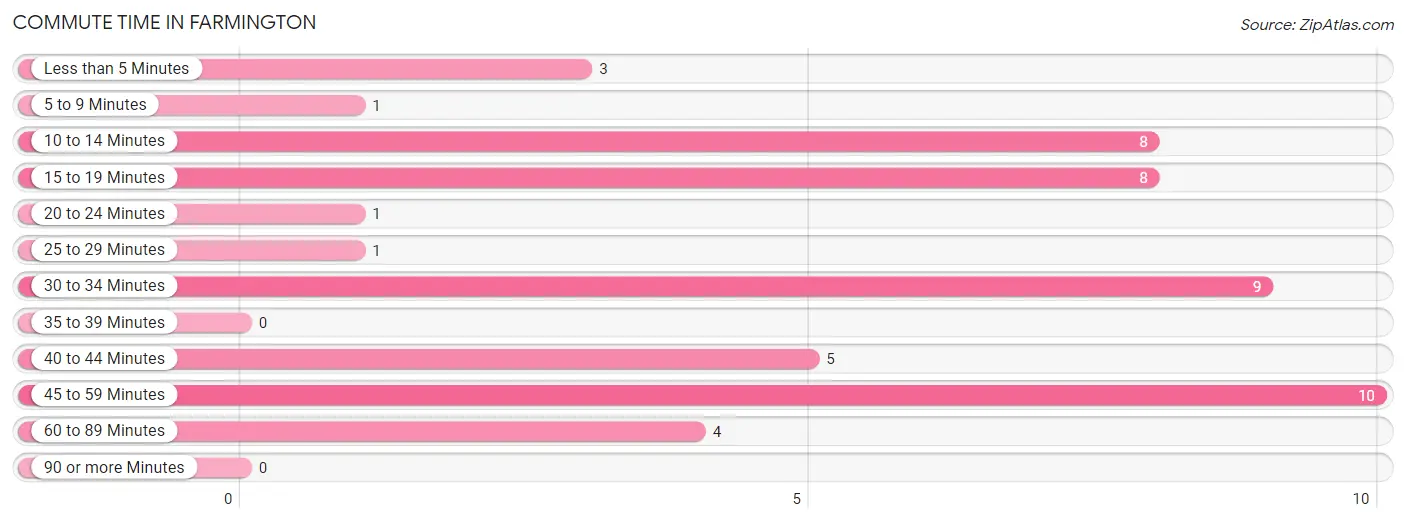
| Commute Time | # Commuters | % Commuters |
| Less than 5 Minutes | 3 | 6.0% |
| 5 to 9 Minutes | 1 | 2.0% |
| 10 to 14 Minutes | 8 | 16.0% |
| 15 to 19 Minutes | 8 | 16.0% |
| 20 to 24 Minutes | 1 | 2.0% |
| 25 to 29 Minutes | 1 | 2.0% |
| 30 to 34 Minutes | 9 | 18.0% |
| 35 to 39 Minutes | 0 | 0.0% |
| 40 to 44 Minutes | 5 | 10.0% |
| 45 to 59 Minutes | 10 | 20.0% |
| 60 to 89 Minutes | 4 | 8.0% |
| 90 or more Minutes | 0 | 0.0% |
Commute Time by Sex in Farmington
The most common commute times in Farmington are 30 to 34 minutes (8 commuters, 24.2%) for males and 10 to 14 minutes (8 commuters, 47.1%) for females.
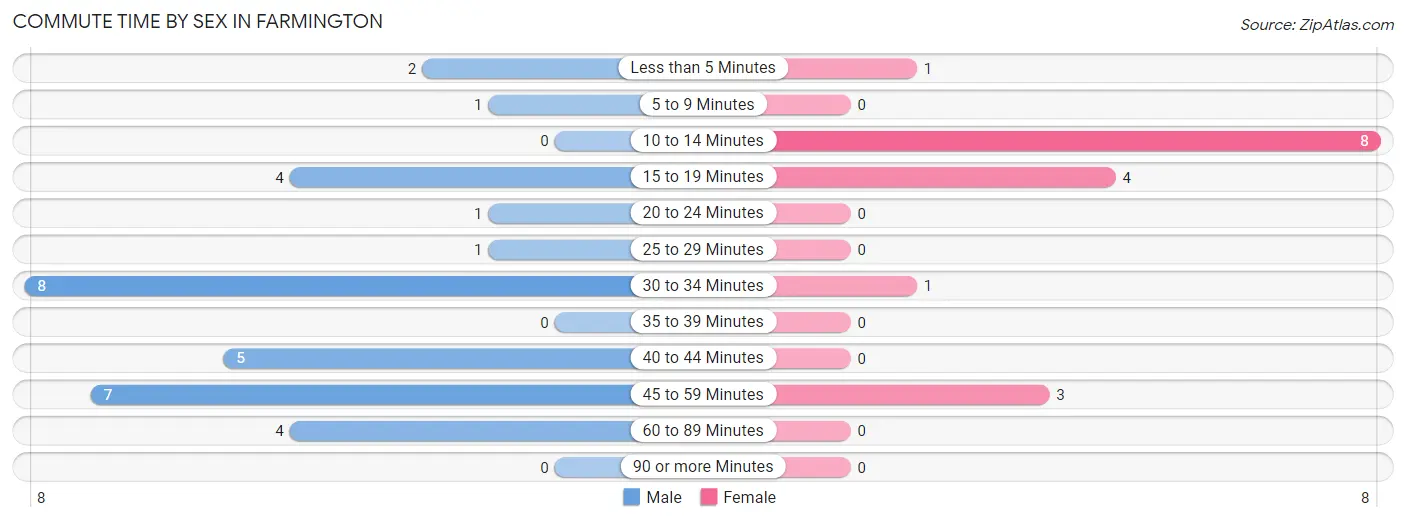
| Commute Time | Male | Female |
| Less than 5 Minutes | 2 (6.1%) | 1 (5.9%) |
| 5 to 9 Minutes | 1 (3.0%) | 0 (0.0%) |
| 10 to 14 Minutes | 0 (0.0%) | 8 (47.1%) |
| 15 to 19 Minutes | 4 (12.1%) | 4 (23.5%) |
| 20 to 24 Minutes | 1 (3.0%) | 0 (0.0%) |
| 25 to 29 Minutes | 1 (3.0%) | 0 (0.0%) |
| 30 to 34 Minutes | 8 (24.2%) | 1 (5.9%) |
| 35 to 39 Minutes | 0 (0.0%) | 0 (0.0%) |
| 40 to 44 Minutes | 5 (15.1%) | 0 (0.0%) |
| 45 to 59 Minutes | 7 (21.2%) | 3 (17.6%) |
| 60 to 89 Minutes | 4 (12.1%) | 0 (0.0%) |
| 90 or more Minutes | 0 (0.0%) | 0 (0.0%) |
Time of Departure to Work by Sex in Farmington
The most frequent times of departure to work in Farmington are 12:00 AM to 4:59 AM (13, 39.4%) for males and 6:30 AM to 6:59 AM (7, 41.2%) for females.
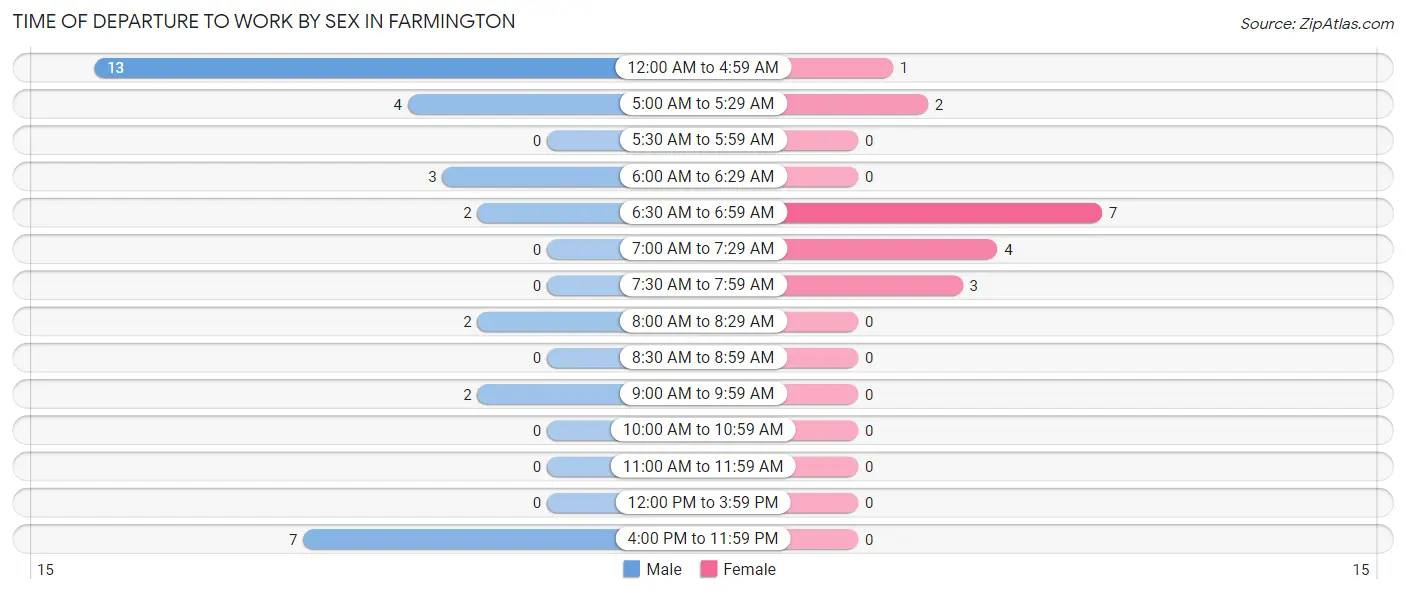
| Time of Departure | Male | Female |
| 12:00 AM to 4:59 AM | 13 (39.4%) | 1 (5.9%) |
| 5:00 AM to 5:29 AM | 4 (12.1%) | 2 (11.8%) |
| 5:30 AM to 5:59 AM | 0 (0.0%) | 0 (0.0%) |
| 6:00 AM to 6:29 AM | 3 (9.1%) | 0 (0.0%) |
| 6:30 AM to 6:59 AM | 2 (6.1%) | 7 (41.2%) |
| 7:00 AM to 7:29 AM | 0 (0.0%) | 4 (23.5%) |
| 7:30 AM to 7:59 AM | 0 (0.0%) | 3 (17.6%) |
| 8:00 AM to 8:29 AM | 2 (6.1%) | 0 (0.0%) |
| 8:30 AM to 8:59 AM | 0 (0.0%) | 0 (0.0%) |
| 9:00 AM to 9:59 AM | 2 (6.1%) | 0 (0.0%) |
| 10:00 AM to 10:59 AM | 0 (0.0%) | 0 (0.0%) |
| 11:00 AM to 11:59 AM | 0 (0.0%) | 0 (0.0%) |
| 12:00 PM to 3:59 PM | 0 (0.0%) | 0 (0.0%) |
| 4:00 PM to 11:59 PM | 7 (21.2%) | 0 (0.0%) |
| Total | 33 (100.0%) | 17 (100.0%) |
Housing Occupancy in Farmington
Occupancy by Ownership in Farmington
Of the total 79 dwellings in Farmington, owner-occupied units account for 67 (84.8%), while renter-occupied units make up 12 (15.2%).
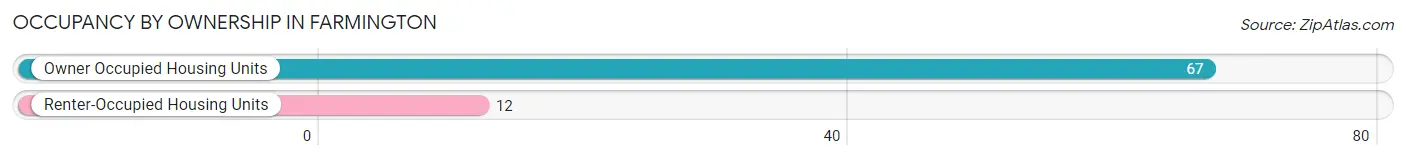
| Occupancy | # Housing Units | % Housing Units |
| Owner Occupied Housing Units | 67 | 84.8% |
| Renter-Occupied Housing Units | 12 | 15.2% |
| Total Occupied Housing Units | 79 | 100.0% |
Occupancy by Household Size in Farmington
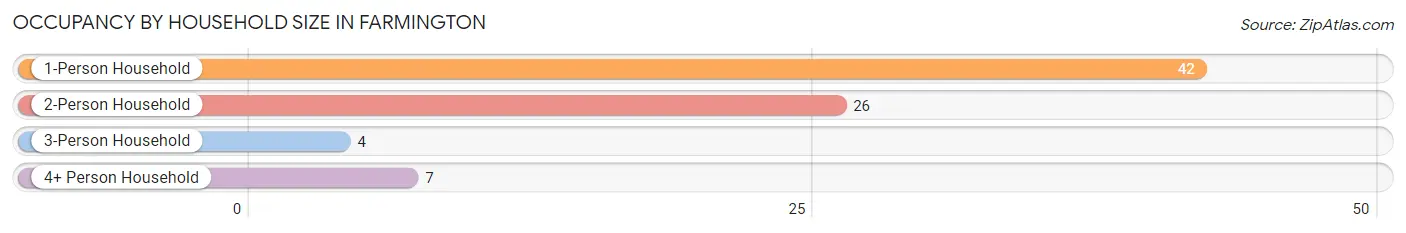
| Household Size | # Housing Units | % Housing Units |
| 1-Person Household | 42 | 53.2% |
| 2-Person Household | 26 | 32.9% |
| 3-Person Household | 4 | 5.1% |
| 4+ Person Household | 7 | 8.9% |
| Total Housing Units | 79 | 100.0% |
Occupancy by Ownership by Household Size in Farmington
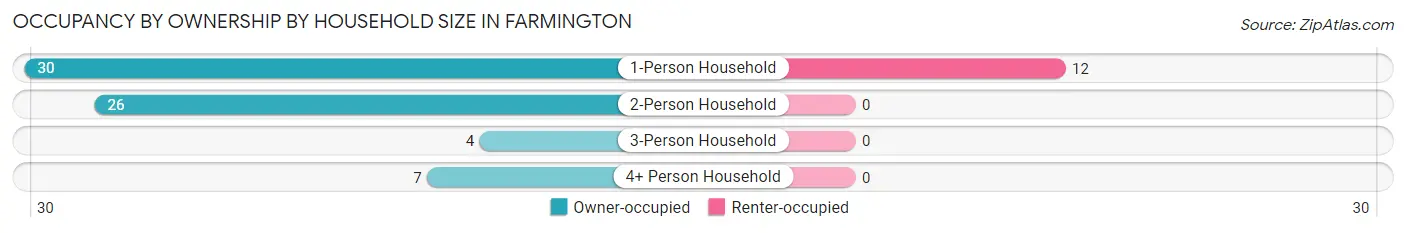
| Household Size | Owner-occupied | Renter-occupied |
| 1-Person Household | 30 (71.4%) | 12 (28.6%) |
| 2-Person Household | 26 (100.0%) | 0 (0.0%) |
| 3-Person Household | 4 (100.0%) | 0 (0.0%) |
| 4+ Person Household | 7 (100.0%) | 0 (0.0%) |
| Total Housing Units | 67 (84.8%) | 12 (15.2%) |
Occupancy by Educational Attainment in Farmington
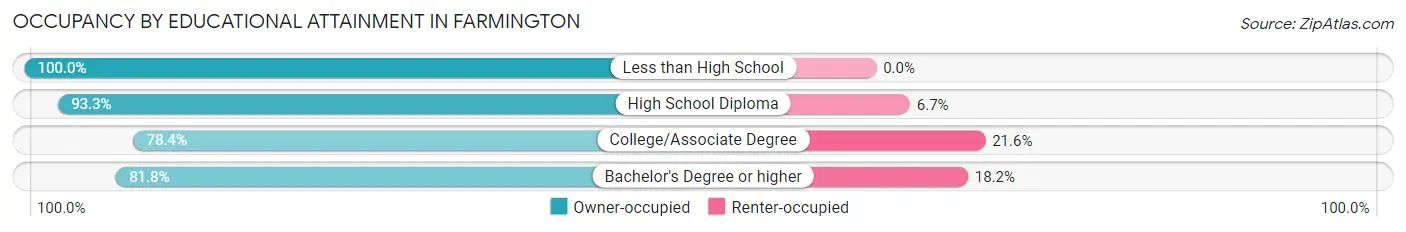
| Household Size | Owner-occupied | Renter-occupied |
| Less than High School | 1 (100.0%) | 0 (0.0%) |
| High School Diploma | 28 (93.3%) | 2 (6.7%) |
| College/Associate Degree | 29 (78.4%) | 8 (21.6%) |
| Bachelor's Degree or higher | 9 (81.8%) | 2 (18.2%) |
Occupancy by Age of Householder in Farmington
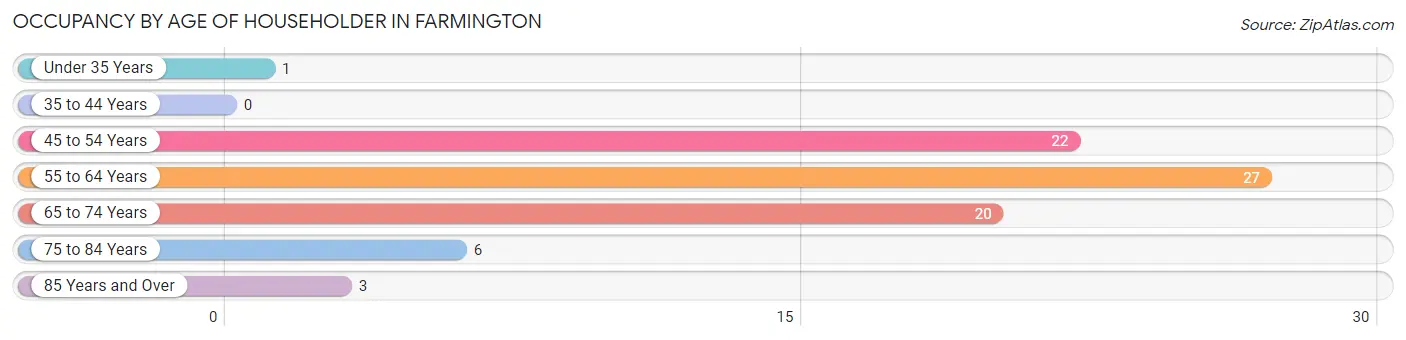
| Age Bracket | # Households | % Households |
| Under 35 Years | 1 | 1.3% |
| 35 to 44 Years | 0 | 0.0% |
| 45 to 54 Years | 22 | 27.9% |
| 55 to 64 Years | 27 | 34.2% |
| 65 to 74 Years | 20 | 25.3% |
| 75 to 84 Years | 6 | 7.6% |
| 85 Years and Over | 3 | 3.8% |
| Total | 79 | 100.0% |
Housing Finances in Farmington
Median Income by Occupancy in Farmington
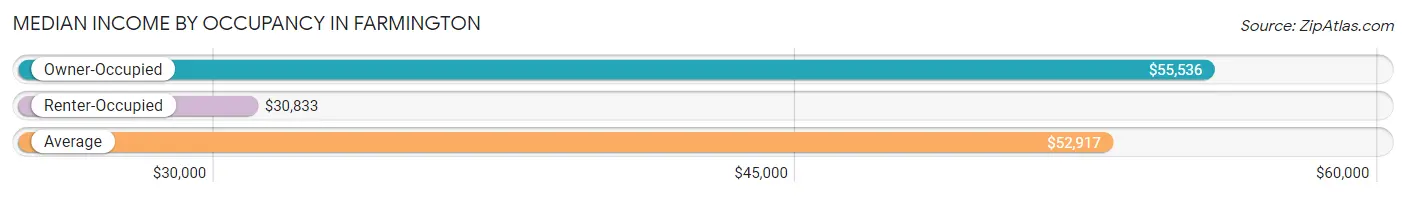
| Occupancy Type | # Households | Median Income |
| Owner-Occupied | 67 (84.8%) | $55,536 |
| Renter-Occupied | 12 (15.2%) | $30,833 |
| Average | 79 (100.0%) | $52,917 |
Occupancy by Householder Income Bracket in Farmington
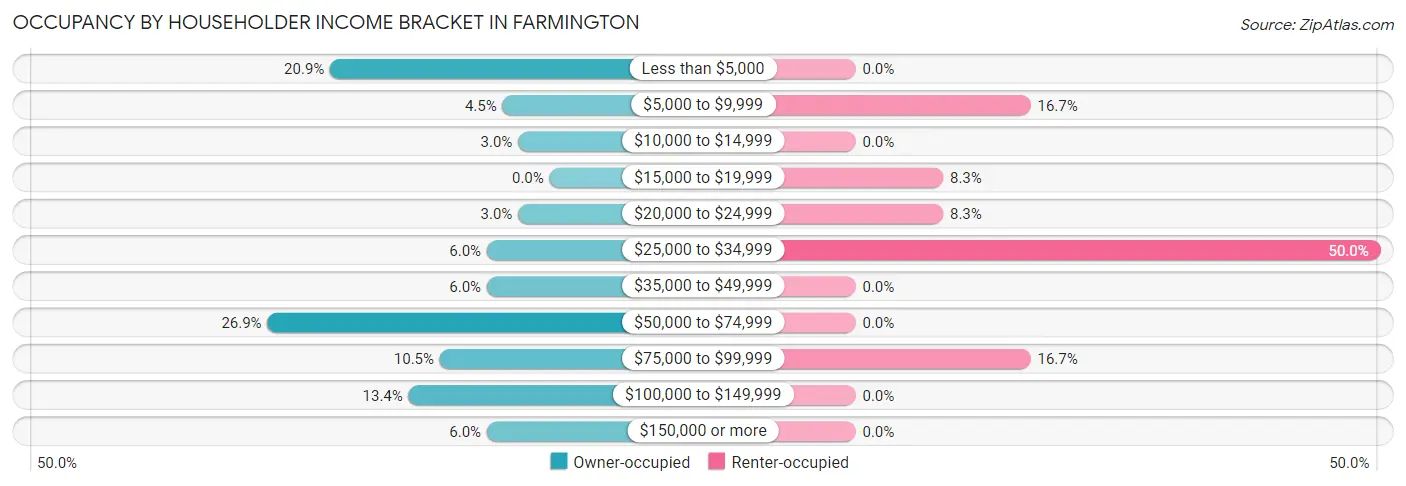
| Income Bracket | Owner-occupied | Renter-occupied |
| Less than $5,000 | 14 (20.9%) | 0 (0.0%) |
| $5,000 to $9,999 | 3 (4.5%) | 2 (16.7%) |
| $10,000 to $14,999 | 2 (3.0%) | 0 (0.0%) |
| $15,000 to $19,999 | 0 (0.0%) | 1 (8.3%) |
| $20,000 to $24,999 | 2 (3.0%) | 1 (8.3%) |
| $25,000 to $34,999 | 4 (6.0%) | 6 (50.0%) |
| $35,000 to $49,999 | 4 (6.0%) | 0 (0.0%) |
| $50,000 to $74,999 | 18 (26.9%) | 0 (0.0%) |
| $75,000 to $99,999 | 7 (10.4%) | 2 (16.7%) |
| $100,000 to $149,999 | 9 (13.4%) | 0 (0.0%) |
| $150,000 or more | 4 (6.0%) | 0 (0.0%) |
| Total | 67 (100.0%) | 12 (100.0%) |
Monthly Housing Cost Tiers in Farmington
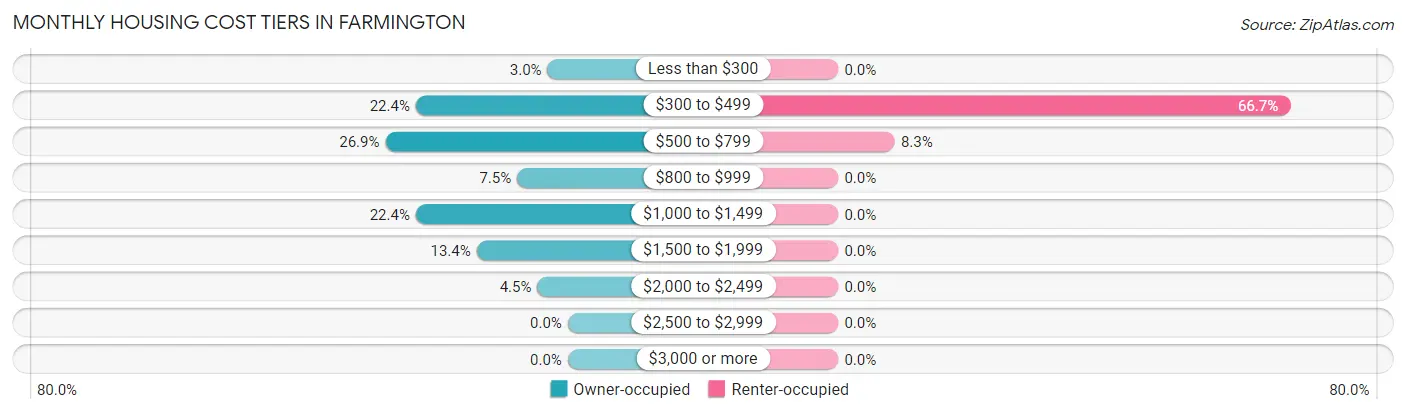
| Monthly Cost | Owner-occupied | Renter-occupied |
| Less than $300 | 2 (3.0%) | 0 (0.0%) |
| $300 to $499 | 15 (22.4%) | 8 (66.7%) |
| $500 to $799 | 18 (26.9%) | 1 (8.3%) |
| $800 to $999 | 5 (7.5%) | 0 (0.0%) |
| $1,000 to $1,499 | 15 (22.4%) | 0 (0.0%) |
| $1,500 to $1,999 | 9 (13.4%) | 0 (0.0%) |
| $2,000 to $2,499 | 3 (4.5%) | 0 (0.0%) |
| $2,500 to $2,999 | 0 (0.0%) | 0 (0.0%) |
| $3,000 or more | 0 (0.0%) | 0 (0.0%) |
| Total | 67 (100.0%) | 12 (100.0%) |
Physical Housing Characteristics in Farmington
Housing Structures in Farmington
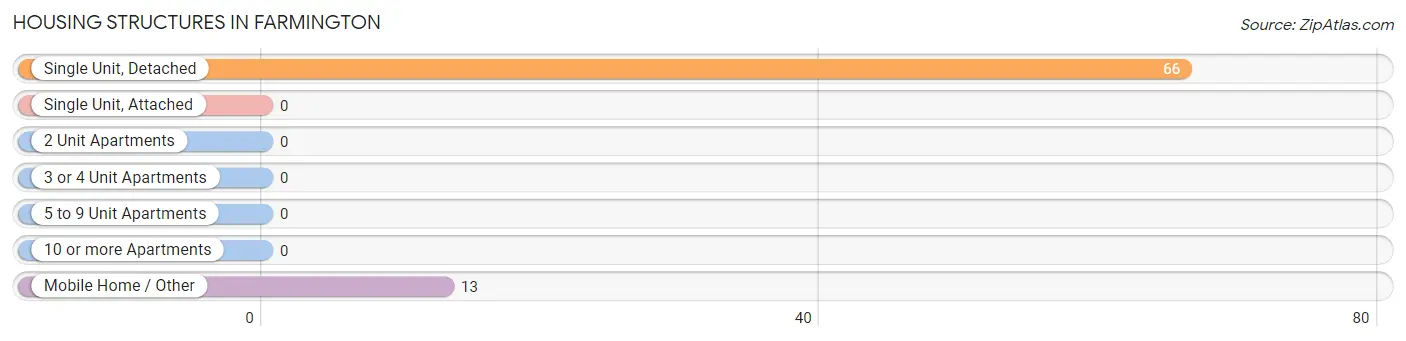
| Structure Type | # Housing Units | % Housing Units |
| Single Unit, Detached | 66 | 83.5% |
| Single Unit, Attached | 0 | 0.0% |
| 2 Unit Apartments | 0 | 0.0% |
| 3 or 4 Unit Apartments | 0 | 0.0% |
| 5 to 9 Unit Apartments | 0 | 0.0% |
| 10 or more Apartments | 0 | 0.0% |
| Mobile Home / Other | 13 | 16.5% |
| Total | 79 | 100.0% |
Housing Structures by Occupancy in Farmington
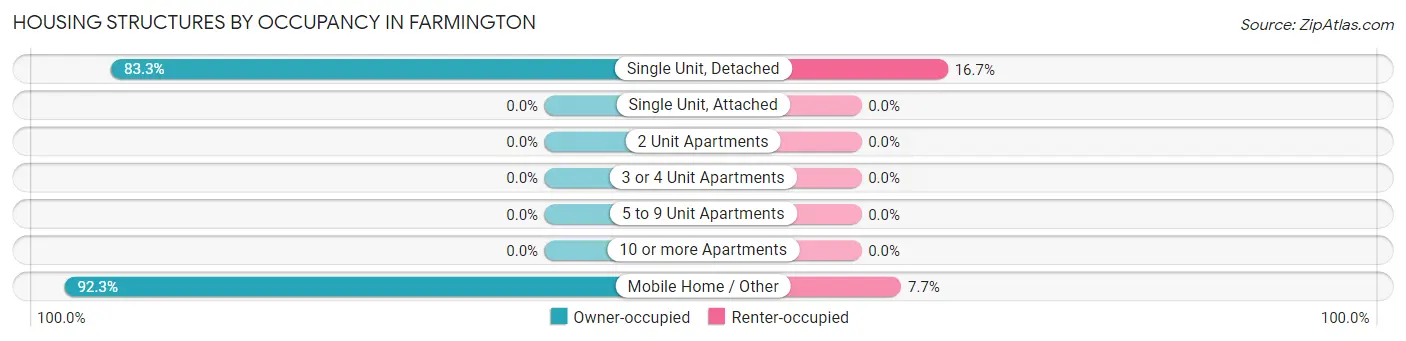
| Structure Type | Owner-occupied | Renter-occupied |
| Single Unit, Detached | 55 (83.3%) | 11 (16.7%) |
| Single Unit, Attached | 0 (0.0%) | 0 (0.0%) |
| 2 Unit Apartments | 0 (0.0%) | 0 (0.0%) |
| 3 or 4 Unit Apartments | 0 (0.0%) | 0 (0.0%) |
| 5 to 9 Unit Apartments | 0 (0.0%) | 0 (0.0%) |
| 10 or more Apartments | 0 (0.0%) | 0 (0.0%) |
| Mobile Home / Other | 12 (92.3%) | 1 (7.7%) |
| Total | 67 (84.8%) | 12 (15.2%) |
Housing Structures by Number of Rooms in Farmington
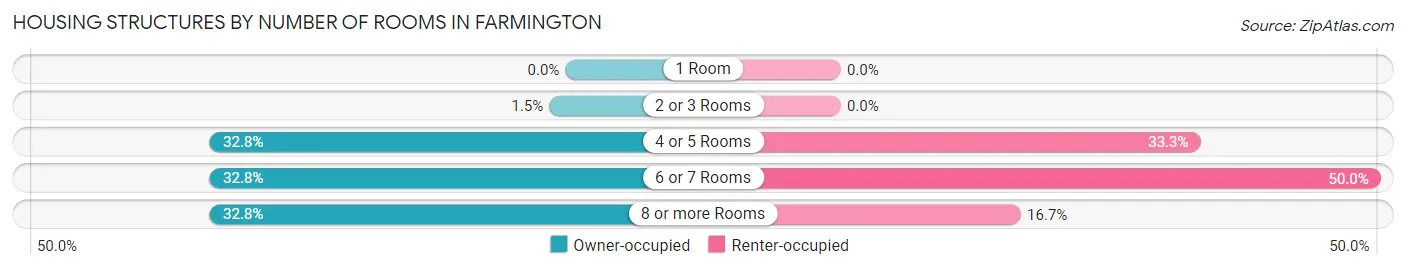
| Number of Rooms | Owner-occupied | Renter-occupied |
| 1 Room | 0 (0.0%) | 0 (0.0%) |
| 2 or 3 Rooms | 1 (1.5%) | 0 (0.0%) |
| 4 or 5 Rooms | 22 (32.8%) | 4 (33.3%) |
| 6 or 7 Rooms | 22 (32.8%) | 6 (50.0%) |
| 8 or more Rooms | 22 (32.8%) | 2 (16.7%) |
| Total | 67 (100.0%) | 12 (100.0%) |
Housing Structure by Heating Type in Farmington
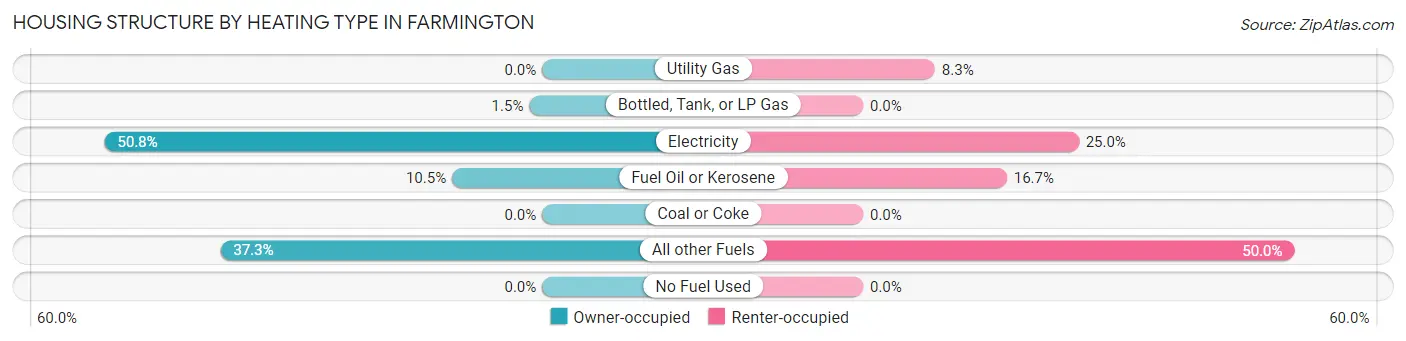
| Heating Type | Owner-occupied | Renter-occupied |
| Utility Gas | 0 (0.0%) | 1 (8.3%) |
| Bottled, Tank, or LP Gas | 1 (1.5%) | 0 (0.0%) |
| Electricity | 34 (50.7%) | 3 (25.0%) |
| Fuel Oil or Kerosene | 7 (10.4%) | 2 (16.7%) |
| Coal or Coke | 0 (0.0%) | 0 (0.0%) |
| All other Fuels | 25 (37.3%) | 6 (50.0%) |
| No Fuel Used | 0 (0.0%) | 0 (0.0%) |
| Total | 67 (100.0%) | 12 (100.0%) |
Household Vehicle Usage in Farmington
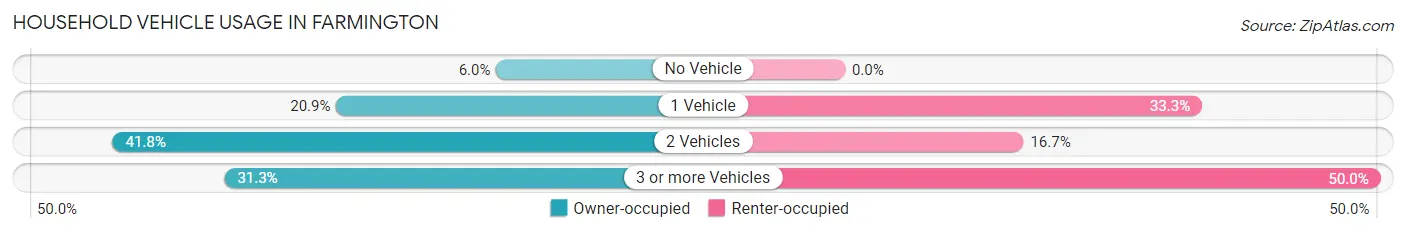
| Vehicles per Household | Owner-occupied | Renter-occupied |
| No Vehicle | 4 (6.0%) | 0 (0.0%) |
| 1 Vehicle | 14 (20.9%) | 4 (33.3%) |
| 2 Vehicles | 28 (41.8%) | 2 (16.7%) |
| 3 or more Vehicles | 21 (31.3%) | 6 (50.0%) |
| Total | 67 (100.0%) | 12 (100.0%) |
Real Estate & Mortgages in Farmington
Real Estate and Mortgage Overview in Farmington
| Characteristic | Without Mortgage | With Mortgage |
| Housing Units | 32 | 35 |
| Median Property Value | - | - |
| Median Household Income | - | - |
| Monthly Housing Costs | $492 | $0 |
| Real Estate Taxes | $750 | $2 |
Property Value by Mortgage Status in Farmington
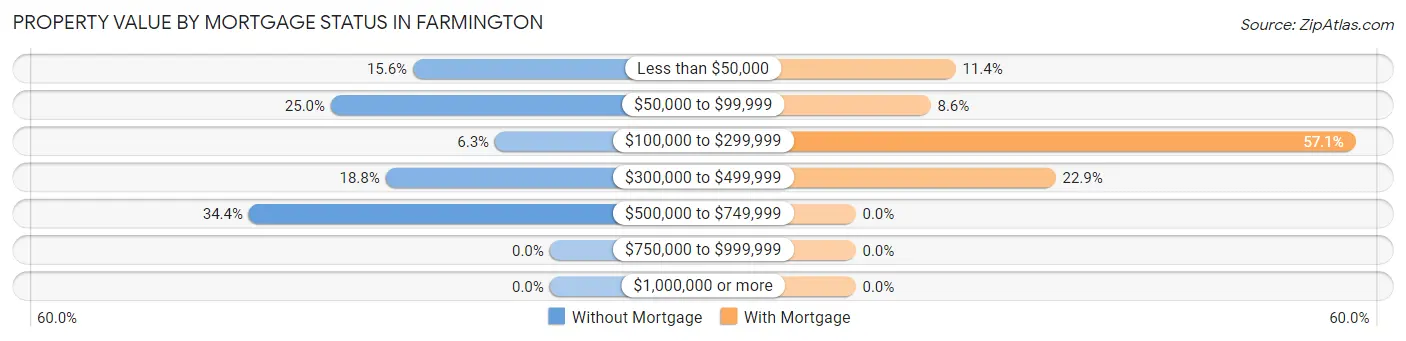
| Property Value | Without Mortgage | With Mortgage |
| Less than $50,000 | 5 (15.6%) | 4 (11.4%) |
| $50,000 to $99,999 | 8 (25.0%) | 3 (8.6%) |
| $100,000 to $299,999 | 2 (6.2%) | 20 (57.1%) |
| $300,000 to $499,999 | 6 (18.8%) | 8 (22.9%) |
| $500,000 to $749,999 | 11 (34.4%) | 0 (0.0%) |
| $750,000 to $999,999 | 0 (0.0%) | 0 (0.0%) |
| $1,000,000 or more | 0 (0.0%) | 0 (0.0%) |
| Total | 32 (100.0%) | 35 (100.0%) |
Household Income by Mortgage Status in Farmington
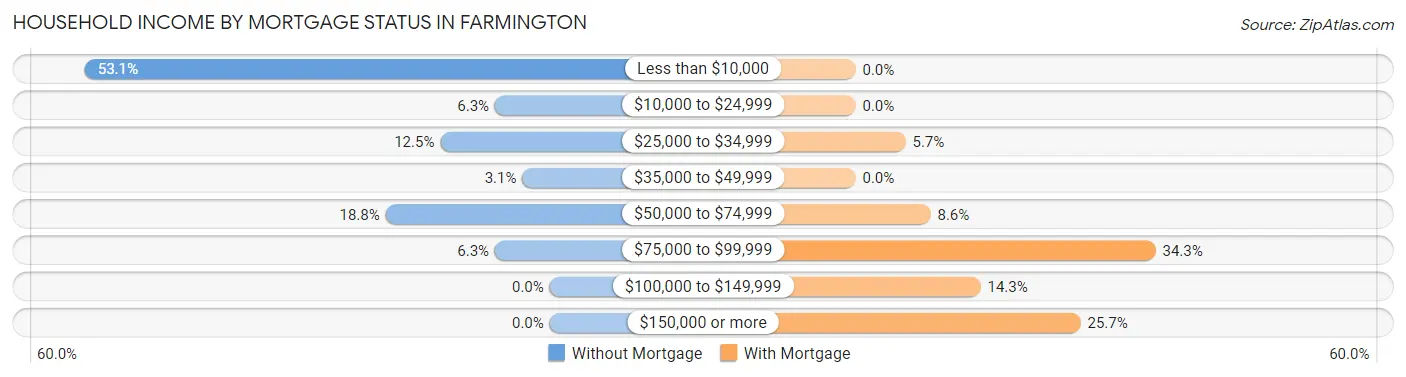
| Household Income | Without Mortgage | With Mortgage |
| Less than $10,000 | 17 (53.1%) | 0 (0.0%) |
| $10,000 to $24,999 | 2 (6.2%) | 0 (0.0%) |
| $25,000 to $34,999 | 4 (12.5%) | 2 (5.7%) |
| $35,000 to $49,999 | 1 (3.1%) | 0 (0.0%) |
| $50,000 to $74,999 | 6 (18.8%) | 3 (8.6%) |
| $75,000 to $99,999 | 2 (6.2%) | 12 (34.3%) |
| $100,000 to $149,999 | 0 (0.0%) | 5 (14.3%) |
| $150,000 or more | 0 (0.0%) | 9 (25.7%) |
| Total | 32 (100.0%) | 35 (100.0%) |
Property Value to Household Income Ratio in Farmington
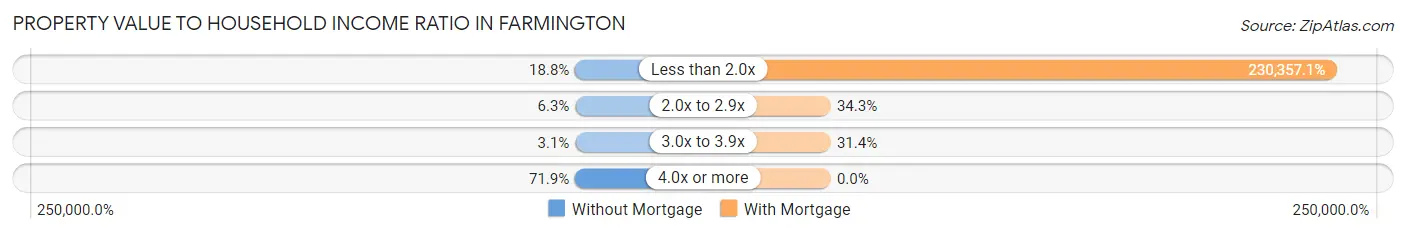
| Value-to-Income Ratio | Without Mortgage | With Mortgage |
| Less than 2.0x | 6 (18.8%) | 80,625 (230,357.1%) |
| 2.0x to 2.9x | 2 (6.2%) | 12 (34.3%) |
| 3.0x to 3.9x | 1 (3.1%) | 11 (31.4%) |
| 4.0x or more | 23 (71.9%) | 0 (0.0%) |
| Total | 32 (100.0%) | 35 (100.0%) |
Real Estate Taxes by Mortgage Status in Farmington
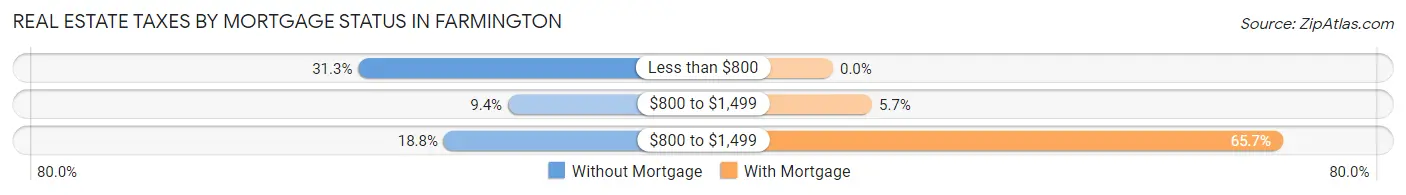
| Property Taxes | Without Mortgage | With Mortgage |
| Less than $800 | 10 (31.2%) | 0 (0.0%) |
| $800 to $1,499 | 3 (9.4%) | 2 (5.7%) |
| $800 to $1,499 | 6 (18.8%) | 23 (65.7%) |
| Total | 32 (100.0%) | 35 (100.0%) |
Health & Disability in Farmington
Health Insurance Coverage by Age in Farmington
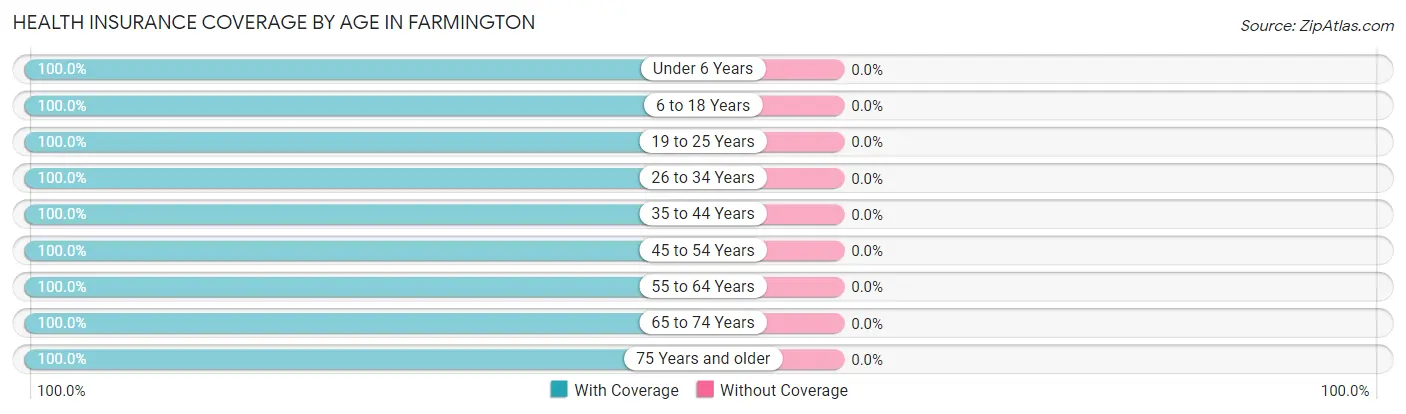
| Age Bracket | With Coverage | Without Coverage |
| Under 6 Years | 4 (100.0%) | 0 (0.0%) |
| 6 to 18 Years | 13 (100.0%) | 0 (0.0%) |
| 19 to 25 Years | 7 (100.0%) | 0 (0.0%) |
| 26 to 34 Years | 8 (100.0%) | 0 (0.0%) |
| 35 to 44 Years | 12 (100.0%) | 0 (0.0%) |
| 45 to 54 Years | 25 (100.0%) | 0 (0.0%) |
| 55 to 64 Years | 36 (100.0%) | 0 (0.0%) |
| 65 to 74 Years | 26 (100.0%) | 0 (0.0%) |
| 75 Years and older | 13 (100.0%) | 0 (0.0%) |
| Total | 144 (100.0%) | 0 (0.0%) |
Health Insurance Coverage by Citizenship Status in Farmington
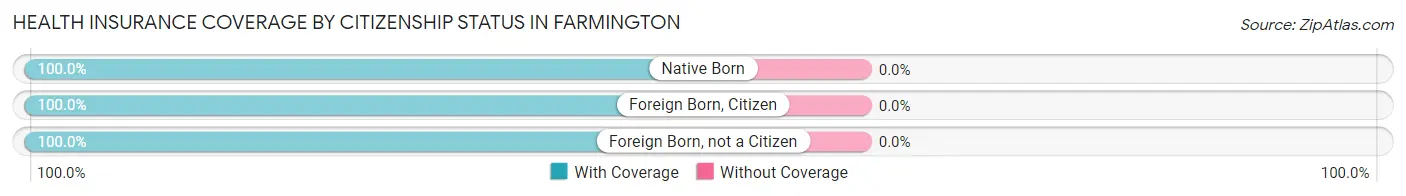
| Citizenship Status | With Coverage | Without Coverage |
| Native Born | 4 (100.0%) | 0 (0.0%) |
| Foreign Born, Citizen | 13 (100.0%) | 0 (0.0%) |
| Foreign Born, not a Citizen | 7 (100.0%) | 0 (0.0%) |
Health Insurance Coverage by Household Income in Farmington
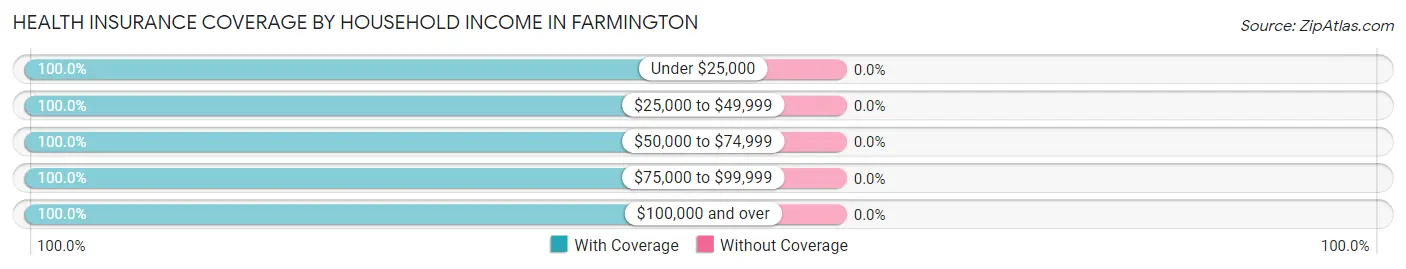
| Household Income | With Coverage | Without Coverage |
| Under $25,000 | 25 (100.0%) | 0 (0.0%) |
| $25,000 to $49,999 | 16 (100.0%) | 0 (0.0%) |
| $50,000 to $74,999 | 41 (100.0%) | 0 (0.0%) |
| $75,000 to $99,999 | 14 (100.0%) | 0 (0.0%) |
| $100,000 and over | 48 (100.0%) | 0 (0.0%) |
Public vs Private Health Insurance Coverage by Age in Farmington
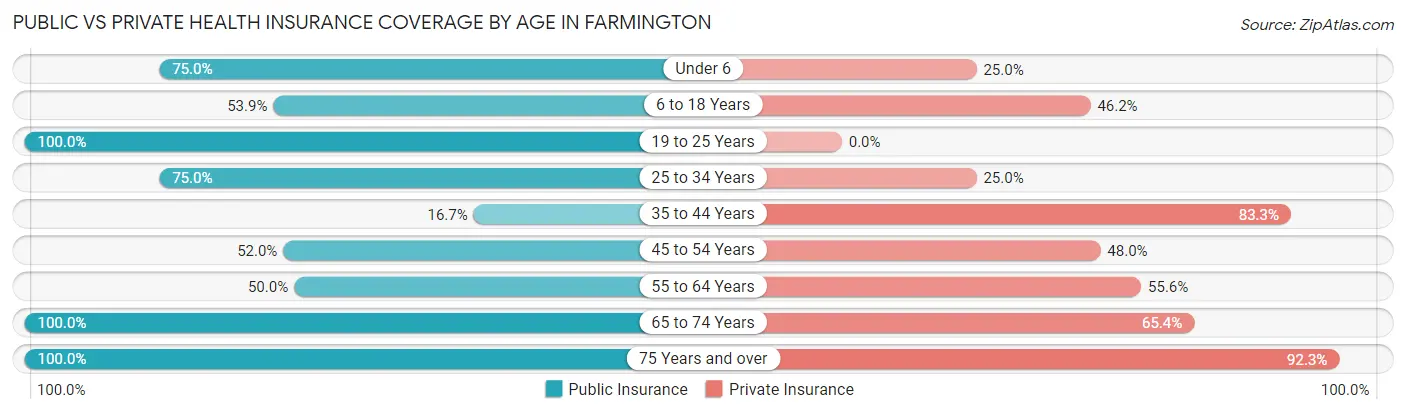
| Age Bracket | Public Insurance | Private Insurance |
| Under 6 | 3 (75.0%) | 1 (25.0%) |
| 6 to 18 Years | 7 (53.8%) | 6 (46.2%) |
| 19 to 25 Years | 7 (100.0%) | 0 (0.0%) |
| 25 to 34 Years | 6 (75.0%) | 2 (25.0%) |
| 35 to 44 Years | 2 (16.7%) | 10 (83.3%) |
| 45 to 54 Years | 13 (52.0%) | 12 (48.0%) |
| 55 to 64 Years | 18 (50.0%) | 20 (55.6%) |
| 65 to 74 Years | 26 (100.0%) | 17 (65.4%) |
| 75 Years and over | 13 (100.0%) | 12 (92.3%) |
| Total | 95 (66.0%) | 80 (55.6%) |
Disability Status by Sex by Age in Farmington
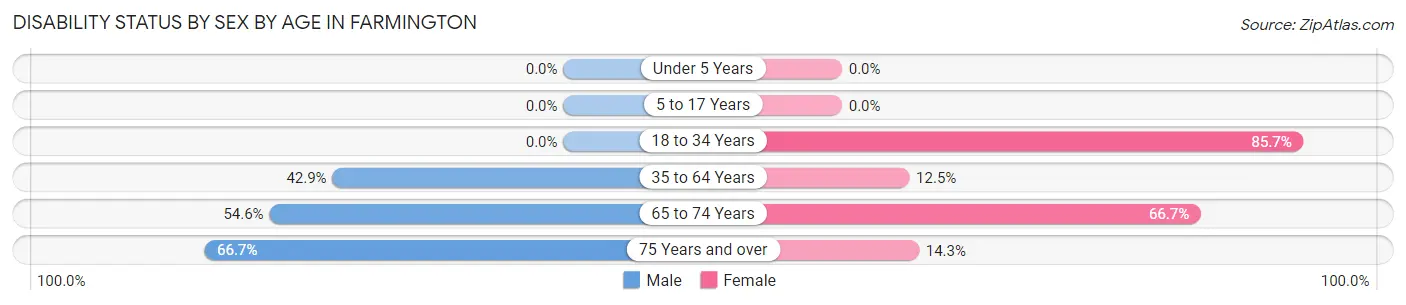
| Age Bracket | Male | Female |
| Under 5 Years | 0 (0.0%) | 0 (0.0%) |
| 5 to 17 Years | 0 (0.0%) | 0 (0.0%) |
| 18 to 34 Years | 0 (0.0%) | 6 (85.7%) |
| 35 to 64 Years | 21 (42.9%) | 3 (12.5%) |
| 65 to 74 Years | 6 (54.5%) | 10 (66.7%) |
| 75 Years and over | 4 (66.7%) | 1 (14.3%) |
Disability Class by Sex by Age in Farmington
Disability Class: Hearing Difficulty
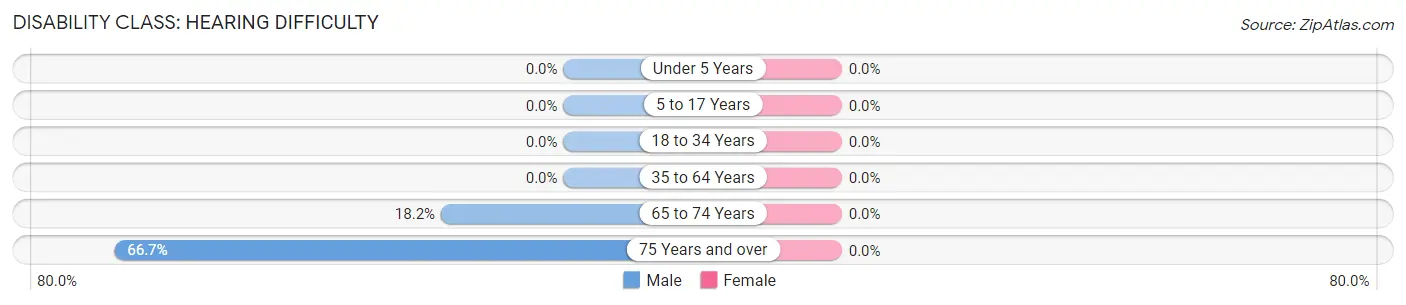
| Age Bracket | Male | Female |
| Under 5 Years | 0 (0.0%) | 0 (0.0%) |
| 5 to 17 Years | 0 (0.0%) | 0 (0.0%) |
| 18 to 34 Years | 0 (0.0%) | 0 (0.0%) |
| 35 to 64 Years | 0 (0.0%) | 0 (0.0%) |
| 65 to 74 Years | 2 (18.2%) | 0 (0.0%) |
| 75 Years and over | 4 (66.7%) | 0 (0.0%) |
Disability Class: Vision Difficulty
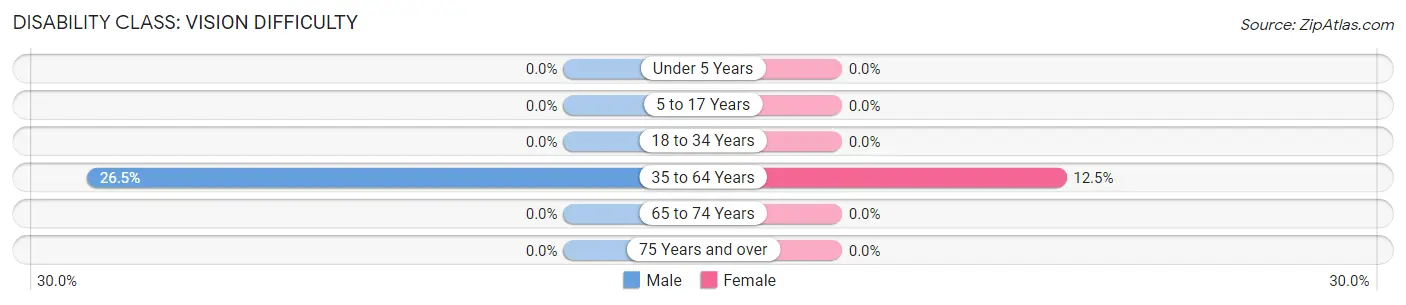
| Age Bracket | Male | Female |
| Under 5 Years | 0 (0.0%) | 0 (0.0%) |
| 5 to 17 Years | 0 (0.0%) | 0 (0.0%) |
| 18 to 34 Years | 0 (0.0%) | 0 (0.0%) |
| 35 to 64 Years | 13 (26.5%) | 3 (12.5%) |
| 65 to 74 Years | 0 (0.0%) | 0 (0.0%) |
| 75 Years and over | 0 (0.0%) | 0 (0.0%) |
Disability Class: Cognitive Difficulty
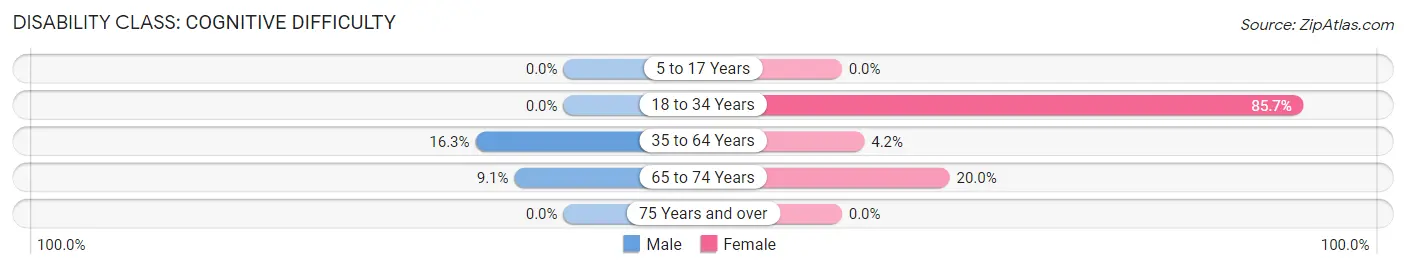
| Age Bracket | Male | Female |
| 5 to 17 Years | 0 (0.0%) | 0 (0.0%) |
| 18 to 34 Years | 0 (0.0%) | 6 (85.7%) |
| 35 to 64 Years | 8 (16.3%) | 1 (4.2%) |
| 65 to 74 Years | 1 (9.1%) | 3 (20.0%) |
| 75 Years and over | 0 (0.0%) | 0 (0.0%) |
Disability Class: Ambulatory Difficulty
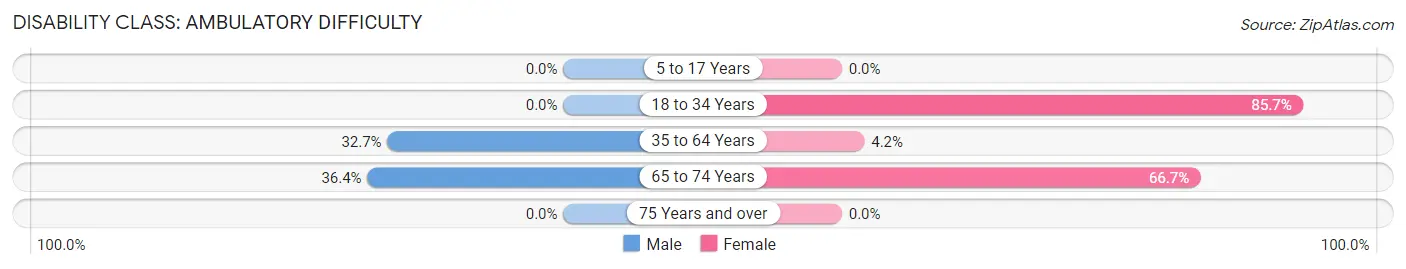
| Age Bracket | Male | Female |
| 5 to 17 Years | 0 (0.0%) | 0 (0.0%) |
| 18 to 34 Years | 0 (0.0%) | 6 (85.7%) |
| 35 to 64 Years | 16 (32.7%) | 1 (4.2%) |
| 65 to 74 Years | 4 (36.4%) | 10 (66.7%) |
| 75 Years and over | 0 (0.0%) | 0 (0.0%) |
Disability Class: Self-Care Difficulty
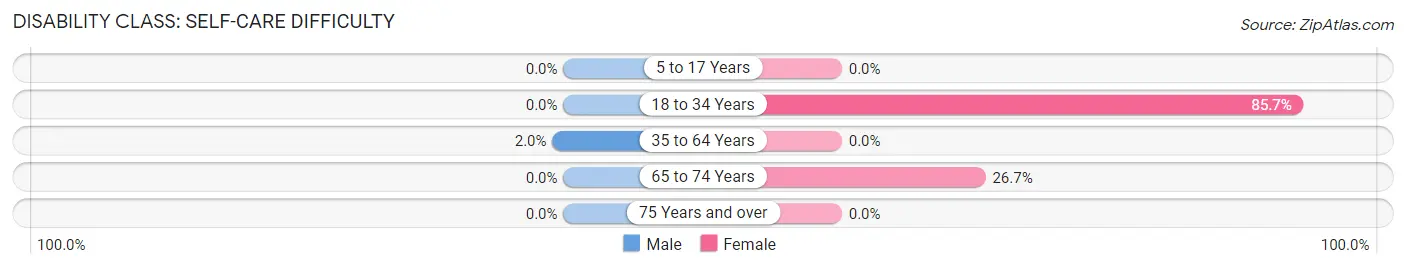
| Age Bracket | Male | Female |
| 5 to 17 Years | 0 (0.0%) | 0 (0.0%) |
| 18 to 34 Years | 0 (0.0%) | 6 (85.7%) |
| 35 to 64 Years | 1 (2.0%) | 0 (0.0%) |
| 65 to 74 Years | 0 (0.0%) | 4 (26.7%) |
| 75 Years and over | 0 (0.0%) | 0 (0.0%) |
Technology Access in Farmington
Computing Device Access in Farmington
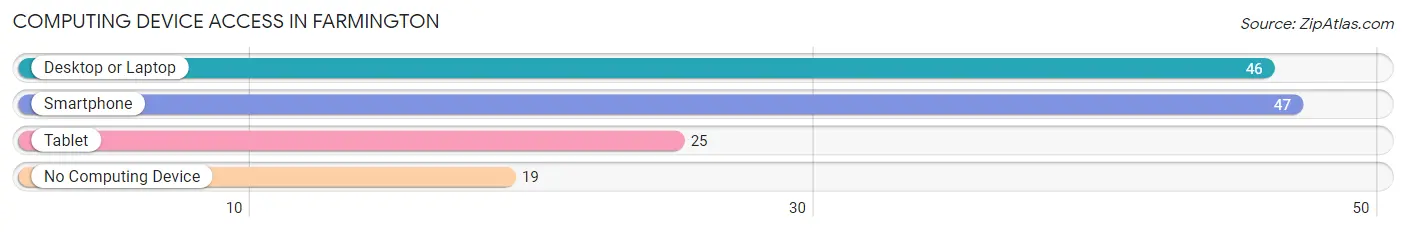
| Device Type | # Households | % Households |
| Desktop or Laptop | 46 | 58.2% |
| Smartphone | 47 | 59.5% |
| Tablet | 25 | 31.7% |
| No Computing Device | 19 | 24.0% |
| Total | 79 | 100.0% |
Internet Access in Farmington
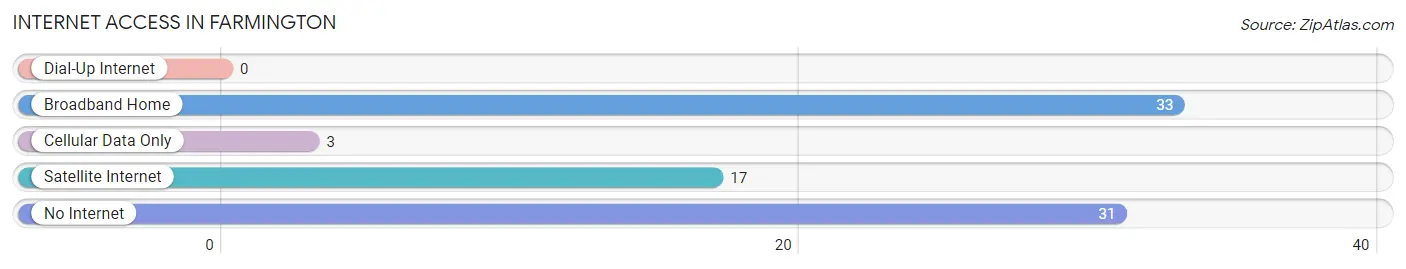
| Internet Type | # Households | % Households |
| Dial-Up Internet | 0 | 0.0% |
| Broadband Home | 33 | 41.8% |
| Cellular Data Only | 3 | 3.8% |
| Satellite Internet | 17 | 21.5% |
| No Internet | 31 | 39.2% |
| Total | 79 | 100.0% |
Farmington Summary
History
The area now known as Farmington, Washington was first inhabited by the Kalispel Tribe of Native Americans. The Kalispel Tribe was a peaceful tribe that lived off the land and fished in the Pend Oreille River. The tribe was eventually forced to move to the Colville Reservation in 1872.
In the late 1800s, the area was settled by homesteaders and farmers. The first post office was established in 1891 and the town was named Farmington. The town was named after the farming community of Farmington, Maine.
In the early 1900s, the town was a bustling logging and farming community. The town was home to several sawmills, a flour mill, a creamery, and a general store. The town also had a school, a church, and a hotel.
In the 1950s, the town began to decline as the logging industry moved away. The sawmills and other businesses closed and the population began to dwindle.
In the late 1990s, the town began to experience a resurgence. The town was revitalized by the opening of a new sawmill and the construction of a new school. The town also began to attract new businesses and residents.
Geography
Farmington is located in Pend Oreille County in the northeastern corner of Washington State. The town is situated on the banks of the Pend Oreille River, near the Idaho border.
The town is surrounded by rolling hills and forests. The nearby mountains provide a stunning backdrop to the town.
The climate in Farmington is mild and temperate. The summers are warm and the winters are cold. The average annual temperature is around 50 degrees Fahrenheit.
Economy
The economy of Farmington is largely based on agriculture and forestry. The town is home to several sawmills and logging companies. The town also has a thriving agricultural sector, with many local farmers growing hay, wheat, and other crops.
The town is also home to several small businesses including restaurants shops and services
Demographics
As of the 2010 census, the population of Farmington was 1,845. The town is predominantly white, with 92.3% of the population identifying as white. The town also has a small Hispanic population, with 4.3% of the population identifying as Hispanic or Latino.
The median household income in Farmington is $41,250. The median home value is $133,400. The town has a poverty rate of 16.3%.
Conclusion
Farmington, Washington is a small town with a rich history. The town was once a bustling logging and farming community, but has since become a quiet, rural town. The town is home to several sawmills and other businesses, as well as a thriving agricultural sector. The town has a predominantly white population, with a small Hispanic population. The median household income is $41,250 and the median home value is $133,400.
Common Questions
What is Per Capita Income in Farmington?
Per Capita income in Farmington is $30,760.
What is the Median Family Income in Farmington?
Median Family Income in Farmington is $61,563.
What is the Median Household income in Farmington?
Median Household Income in Farmington is $52,917.
What is Income or Wage Gap in Farmington?
Income or Wage Gap in Farmington is 13.4%.
Women in Farmington earn 86.6 cents for every dollar earned by a man.
What is Inequality or Gini Index in Farmington?
Inequality or Gini Index in Farmington is 0.49.
What is the Total Population of Farmington?
Total Population of Farmington is 144.
What is the Total Male Population of Farmington?
Total Male Population of Farmington is 88.
What is the Total Female Population of Farmington?
Total Female Population of Farmington is 56.
What is the Ratio of Males per 100 Females in Farmington?
There are 157.14 Males per 100 Females in Farmington.
What is the Ratio of Females per 100 Males in Farmington?
There are 63.64 Females per 100 Males in Farmington.
What is the Median Population Age in Farmington?
Median Population Age in Farmington is 55.8 Years.
What is the Average Family Size in Farmington
Average Family Size in Farmington is 2.8 People.
What is the Average Household Size in Farmington
Average Household Size in Farmington is 1.8 People.
How Large is the Labor Force in Farmington?
There are 60 People in the Labor Forcein in Farmington.
What is the Percentage of People in the Labor Force in Farmington?
44.8% of People are in the Labor Force in Farmington.
What is the Unemployment Rate in Farmington?
Unemployment Rate in Farmington is 6.7%.