Gallatin Gateway, MT Map & Demographics
Gallatin Gateway Map
Gallatin Gateway Overview
$49,248
PER CAPITA INCOME
$137,663
AVG FAMILY INCOME
$98,750
AVG HOUSEHOLD INCOME
17.8%
WAGE / INCOME GAP [ % ]
82.2¢/ $1
WAGE / INCOME GAP [ $ ]
0.42
INEQUALITY / GINI INDEX
886
TOTAL POPULATION
484
MALE POPULATION
402
FEMALE POPULATION
120.40
MALES / 100 FEMALES
83.06
FEMALES / 100 MALES
43.4
MEDIAN AGE
3.4
AVG FAMILY SIZE
2.6
AVG HOUSEHOLD SIZE
423
LABOR FORCE [ PEOPLE ]
61.2%
PERCENT IN LABOR FORCE
4.5%
UNEMPLOYMENT RATE
Gallatin Gateway Zip Codes
Gallatin Gateway Area Codes
Income in Gallatin Gateway
Income Overview in Gallatin Gateway
Per Capita Income in Gallatin Gateway is $49,248, while median incomes of families and households are $137,663 and $98,750 respectively.
| Characteristic | Number | Measure |
| Per Capita Income | 886 | $49,248 |
| Median Family Income | 209 | $137,663 |
| Mean Family Income | 209 | $138,691 |
| Median Household Income | 338 | $98,750 |
| Mean Household Income | 338 | $127,433 |
| Income Deficit | 209 | $0 |
| Wage / Income Gap (%) | 886 | 17.82% |
| Wage / Income Gap ($) | 886 | 82.18¢ per $1 |
| Gini / Inequality Index | 886 | 0.42 |
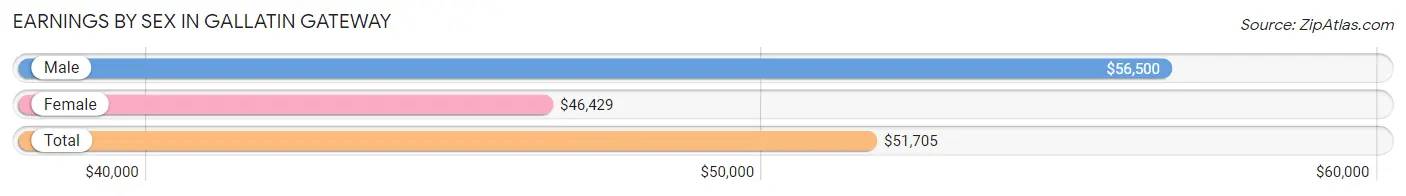
Earnings by Sex in Gallatin Gateway
Average Earnings in Gallatin Gateway are $51,705, $56,500 for men and $46,429 for women, a difference of 17.8%.
| Sex | Number | Average Earnings |
| Male | 284 (60.2%) | $56,500 |
| Female | 188 (39.8%) | $46,429 |
| Total | 472 (100.0%) | $51,705 |
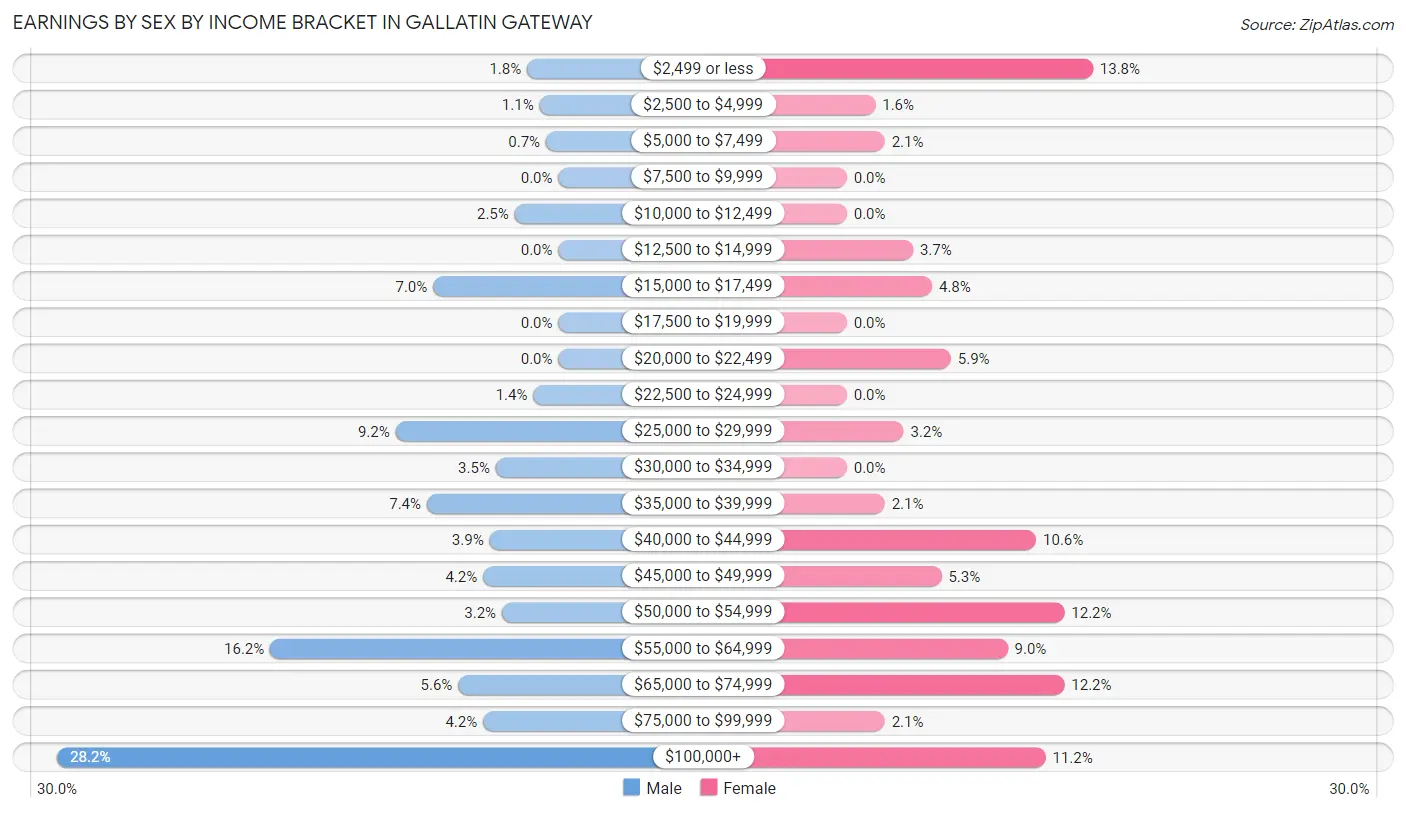
Earnings by Sex by Income Bracket in Gallatin Gateway
The most common earnings brackets in Gallatin Gateway are $100,000+ for men (80 | 28.2%) and $2,499 or less for women (26 | 13.8%).
| Income | Male | Female |
| $2,499 or less | 5 (1.8%) | 26 (13.8%) |
| $2,500 to $4,999 | 3 (1.1%) | 3 (1.6%) |
| $5,000 to $7,499 | 2 (0.7%) | 4 (2.1%) |
| $7,500 to $9,999 | 0 (0.0%) | 0 (0.0%) |
| $10,000 to $12,499 | 7 (2.5%) | 0 (0.0%) |
| $12,500 to $14,999 | 0 (0.0%) | 7 (3.7%) |
| $15,000 to $17,499 | 20 (7.0%) | 9 (4.8%) |
| $17,500 to $19,999 | 0 (0.0%) | 0 (0.0%) |
| $20,000 to $22,499 | 0 (0.0%) | 11 (5.9%) |
| $22,500 to $24,999 | 4 (1.4%) | 0 (0.0%) |
| $25,000 to $29,999 | 26 (9.1%) | 6 (3.2%) |
| $30,000 to $34,999 | 10 (3.5%) | 0 (0.0%) |
| $35,000 to $39,999 | 21 (7.4%) | 4 (2.1%) |
| $40,000 to $44,999 | 11 (3.9%) | 20 (10.6%) |
| $45,000 to $49,999 | 12 (4.2%) | 10 (5.3%) |
| $50,000 to $54,999 | 9 (3.2%) | 23 (12.2%) |
| $55,000 to $64,999 | 46 (16.2%) | 17 (9.0%) |
| $65,000 to $74,999 | 16 (5.6%) | 23 (12.2%) |
| $75,000 to $99,999 | 12 (4.2%) | 4 (2.1%) |
| $100,000+ | 80 (28.2%) | 21 (11.2%) |
| Total | 284 (100.0%) | 188 (100.0%) |
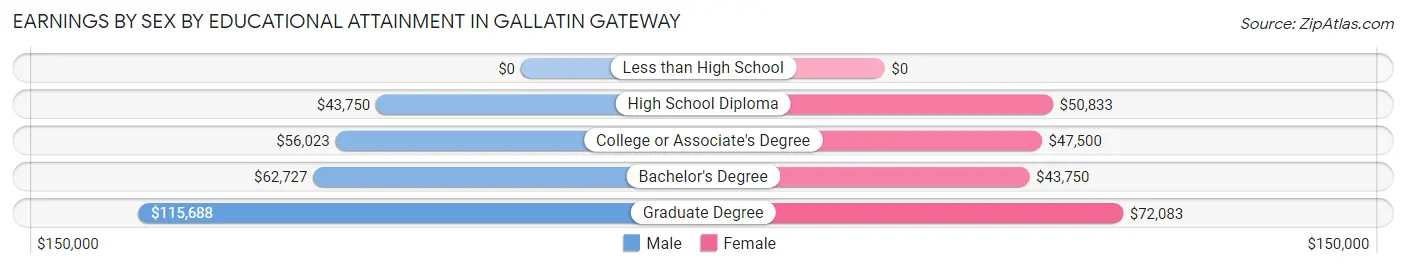
Earnings by Sex by Educational Attainment in Gallatin Gateway
Average earnings in Gallatin Gateway are $58,333 for men and $47,917 for women, a difference of 17.9%. Men with an educational attainment of graduate degree enjoy the highest average annual earnings of $115,688, while those with high school diploma education earn the least with $43,750. Women with an educational attainment of graduate degree earn the most with the average annual earnings of $72,083, while those with bachelor's degree education have the smallest earnings of $43,750.
| Educational Attainment | Male Income | Female Income |
| Less than High School | - | - |
| High School Diploma | $43,750 | $50,833 |
| College or Associate's Degree | $56,023 | $47,500 |
| Bachelor's Degree | $62,727 | $43,750 |
| Graduate Degree | $115,688 | $72,083 |
| Total | $58,333 | $47,917 |
Family Income in Gallatin Gateway
Family Income Brackets in Gallatin Gateway
According to the Gallatin Gateway family income data, there are 48 families falling into the $100,000 to $149,999 income range, which is the most common income bracket and makes up 23.0% of all families.
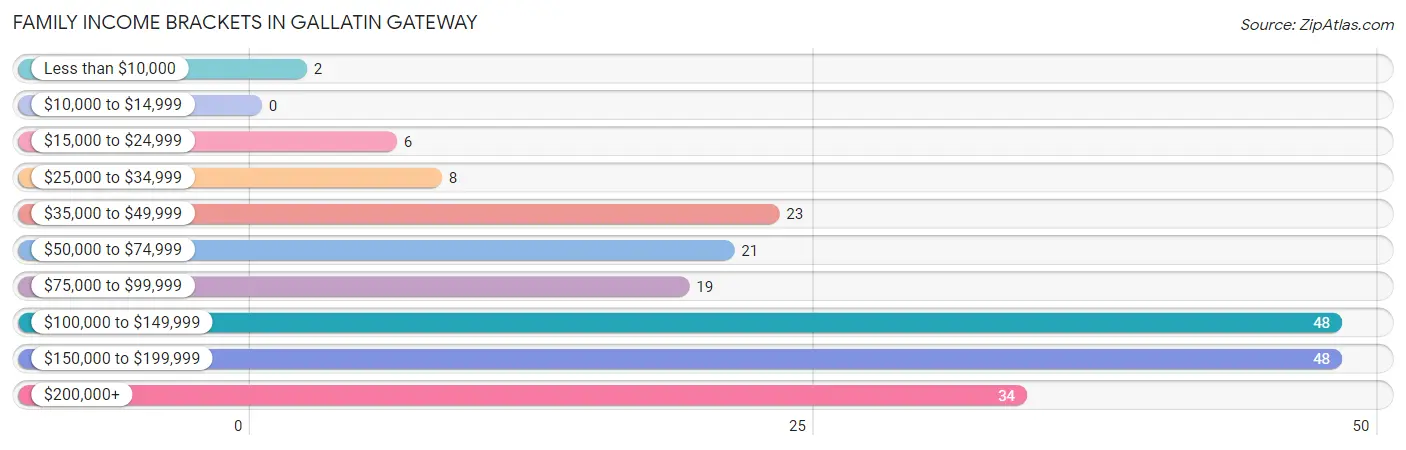
| Income Bracket | # Families | % Families |
| Less than $10,000 | 2 | 1.0% |
| $10,000 to $14,999 | 0 | 0.0% |
| $15,000 to $24,999 | 6 | 2.9% |
| $25,000 to $34,999 | 8 | 3.8% |
| $35,000 to $49,999 | 23 | 11.0% |
| $50,000 to $74,999 | 21 | 10.0% |
| $75,000 to $99,999 | 19 | 9.1% |
| $100,000 to $149,999 | 48 | 23.0% |
| $150,000 to $199,999 | 48 | 23.0% |
| $200,000+ | 34 | 16.3% |
Family Income by Famaliy Size in Gallatin Gateway
4-person families (50 | 23.9%) account for the highest median family income in Gallatin Gateway with $139,318 per family, while 2-person families (106 | 50.7%) have the highest median income of $68,854 per family member.
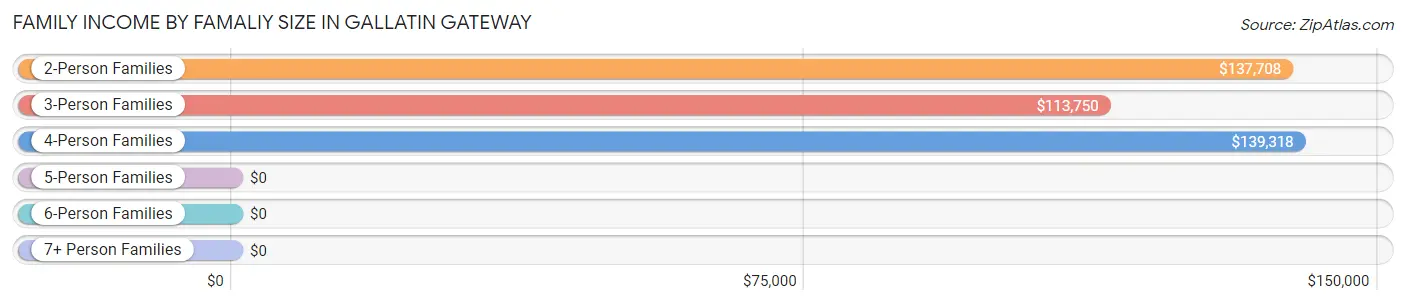
| Income Bracket | # Families | Median Income |
| 2-Person Families | 106 (50.7%) | $137,708 |
| 3-Person Families | 21 (10.1%) | $113,750 |
| 4-Person Families | 50 (23.9%) | $139,318 |
| 5-Person Families | 0 (0.0%) | $0 |
| 6-Person Families | 24 (11.5%) | $0 |
| 7+ Person Families | 8 (3.8%) | $0 |
| Total | 209 (100.0%) | $137,663 |
Family Income by Number of Earners in Gallatin Gateway
The median family income in Gallatin Gateway is $137,663, with families comprising 3+ earners (19) having the highest median family income of $182,188, while families with no earners (31) have the lowest median family income of $72,917, accounting for 9.1% and 14.8% of families, respectively.
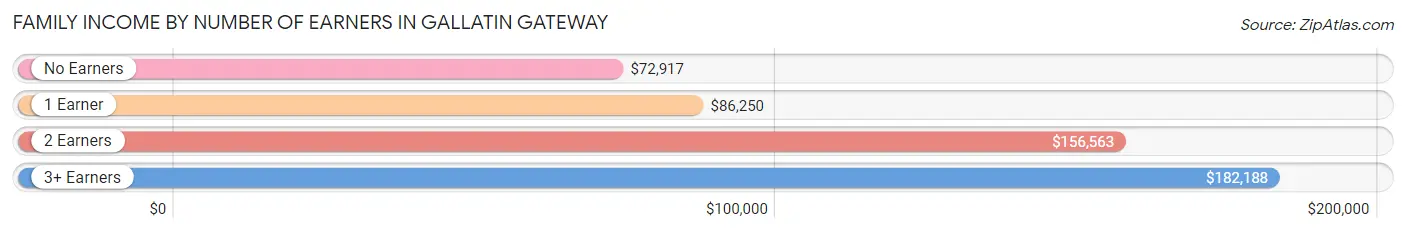
| Number of Earners | # Families | Median Income |
| No Earners | 31 (14.8%) | $72,917 |
| 1 Earner | 60 (28.7%) | $86,250 |
| 2 Earners | 99 (47.4%) | $156,563 |
| 3+ Earners | 19 (9.1%) | $182,188 |
| Total | 209 (100.0%) | $137,663 |
Household Income in Gallatin Gateway
Household Income Brackets in Gallatin Gateway
With 73 households falling in the category, the $100,000 to $149,999 income range is the most frequent in Gallatin Gateway, accounting for 21.6% of all households.
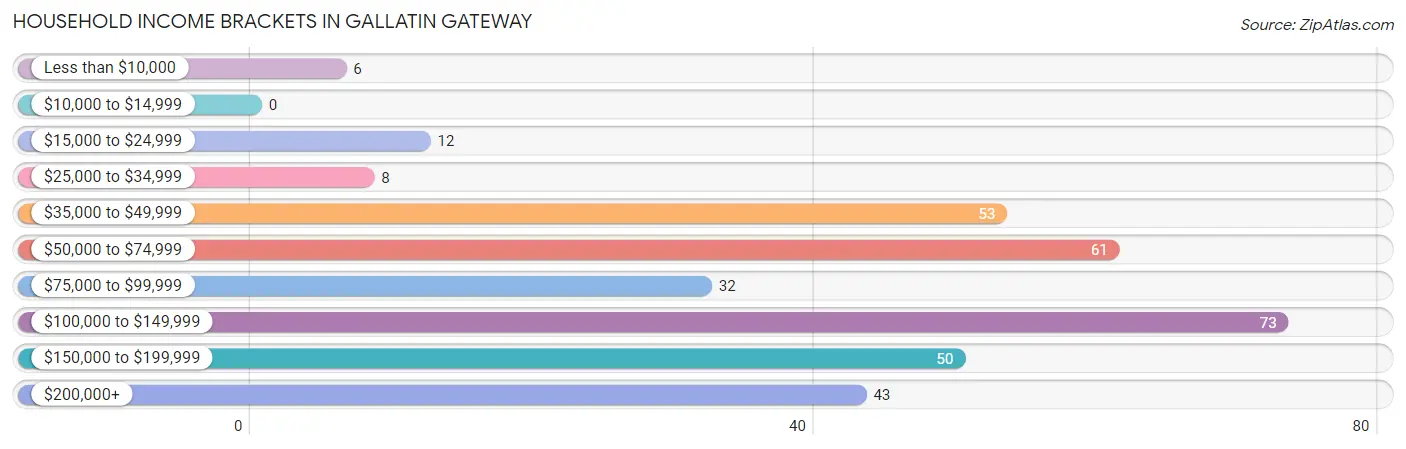
| Income Bracket | # Households | % Households |
| Less than $10,000 | 6 | 1.8% |
| $10,000 to $14,999 | 0 | 0.0% |
| $15,000 to $24,999 | 12 | 3.6% |
| $25,000 to $34,999 | 8 | 2.4% |
| $35,000 to $49,999 | 53 | 15.7% |
| $50,000 to $74,999 | 61 | 18.0% |
| $75,000 to $99,999 | 32 | 9.5% |
| $100,000 to $149,999 | 73 | 21.6% |
| $150,000 to $199,999 | 50 | 14.8% |
| $200,000+ | 43 | 12.7% |
Household Income by Householder Age in Gallatin Gateway
The median household income in Gallatin Gateway is $98,750, with the highest median household income of $124,545 found in the 45 to 64 years age bracket for the primary householder. A total of 158 households (46.8%) fall into this category. Meanwhile, the 15 to 24 years age bracket for the primary householder has the lowest median household income of $0, with 6 households (1.8%) in this group.
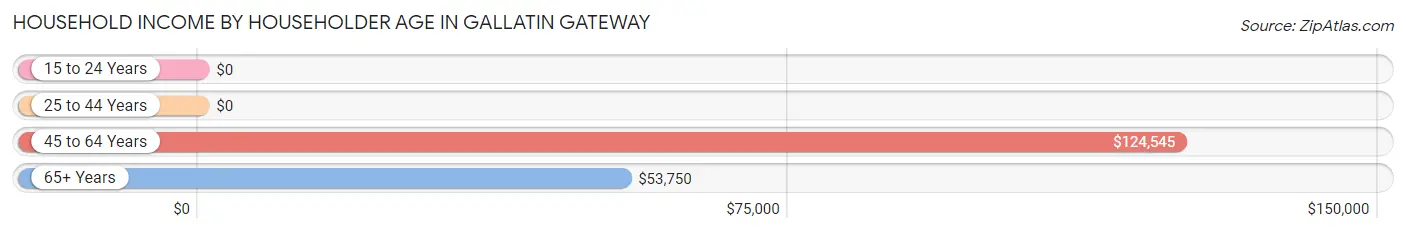
| Income Bracket | # Households | Median Income |
| 15 to 24 Years | 6 (1.8%) | $0 |
| 25 to 44 Years | 94 (27.8%) | $0 |
| 45 to 64 Years | 158 (46.8%) | $124,545 |
| 65+ Years | 80 (23.7%) | $53,750 |
| Total | 338 (100.0%) | $98,750 |
Poverty in Gallatin Gateway
Income Below Poverty by Sex and Age in Gallatin Gateway
With 4.6% poverty level for males and 6.5% for females among the residents of Gallatin Gateway, 6 to 11 year old males and 5 year old females are the most vulnerable to poverty, with 12 males (17.1%) and 6 females (35.3%) in their respective age groups living below the poverty level.
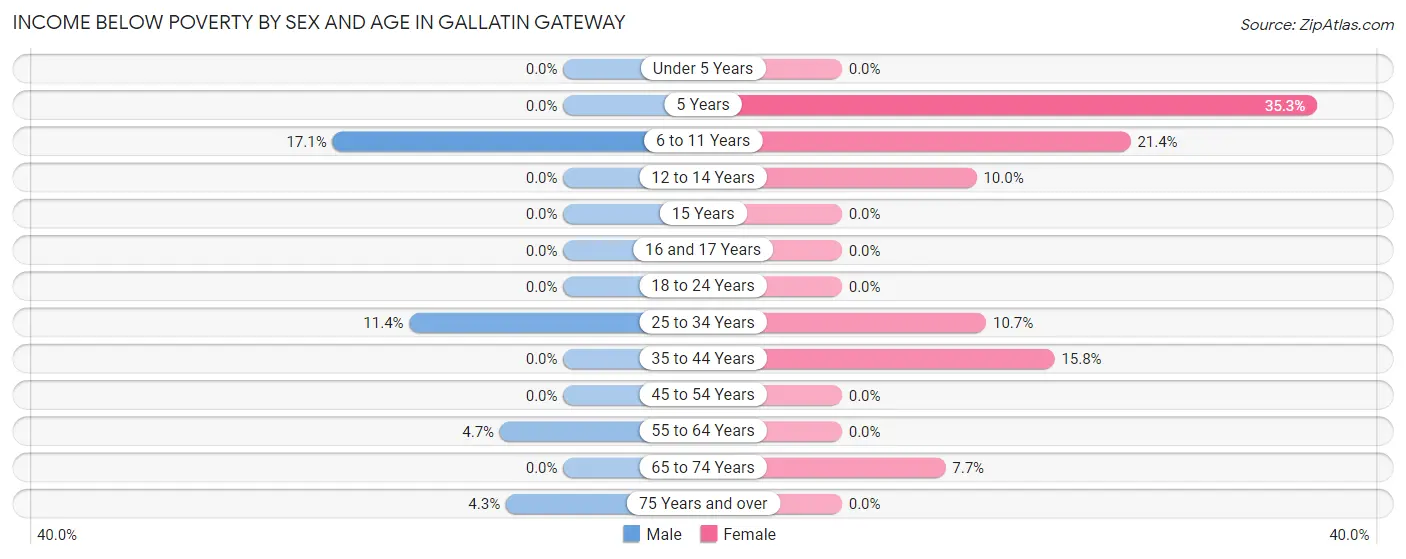
| Age Bracket | Male | Female |
| Under 5 Years | 0 (0.0%) | 0 (0.0%) |
| 5 Years | 0 (0.0%) | 6 (35.3%) |
| 6 to 11 Years | 12 (17.1%) | 3 (21.4%) |
| 12 to 14 Years | 0 (0.0%) | 2 (10.0%) |
| 15 Years | 0 (0.0%) | 0 (0.0%) |
| 16 and 17 Years | 0 (0.0%) | 0 (0.0%) |
| 18 to 24 Years | 0 (0.0%) | 0 (0.0%) |
| 25 to 34 Years | 4 (11.4%) | 6 (10.7%) |
| 35 to 44 Years | 0 (0.0%) | 6 (15.8%) |
| 45 to 54 Years | 0 (0.0%) | 0 (0.0%) |
| 55 to 64 Years | 4 (4.7%) | 0 (0.0%) |
| 65 to 74 Years | 0 (0.0%) | 3 (7.7%) |
| 75 Years and over | 2 (4.3%) | 0 (0.0%) |
| Total | 22 (4.6%) | 26 (6.5%) |
Income Above Poverty by Sex and Age in Gallatin Gateway
According to the poverty statistics in Gallatin Gateway, males aged under 5 years and females aged under 5 years are the age groups that are most secure financially, with 100.0% of males and 100.0% of females in these age groups living above the poverty line.
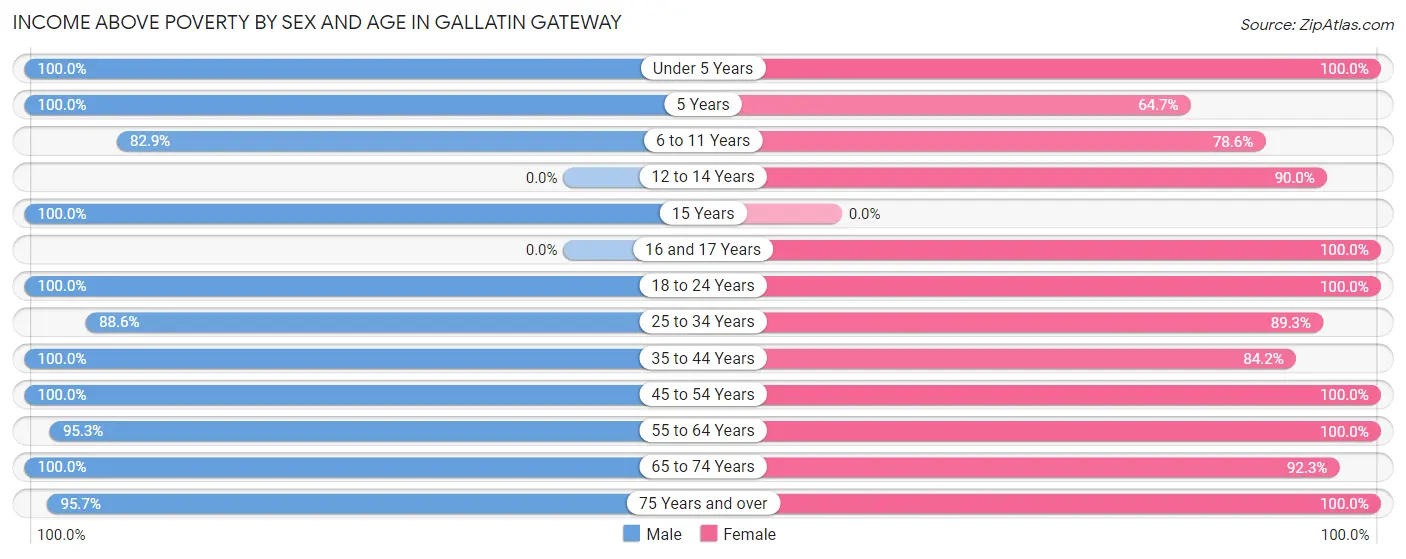
| Age Bracket | Male | Female |
| Under 5 Years | 40 (100.0%) | 16 (100.0%) |
| 5 Years | 11 (100.0%) | 11 (64.7%) |
| 6 to 11 Years | 58 (82.9%) | 11 (78.6%) |
| 12 to 14 Years | 0 (0.0%) | 18 (90.0%) |
| 15 Years | 3 (100.0%) | 0 (0.0%) |
| 16 and 17 Years | 0 (0.0%) | 13 (100.0%) |
| 18 to 24 Years | 34 (100.0%) | 7 (100.0%) |
| 25 to 34 Years | 31 (88.6%) | 50 (89.3%) |
| 35 to 44 Years | 77 (100.0%) | 32 (84.2%) |
| 45 to 54 Years | 39 (100.0%) | 71 (100.0%) |
| 55 to 64 Years | 81 (95.3%) | 88 (100.0%) |
| 65 to 74 Years | 39 (100.0%) | 36 (92.3%) |
| 75 Years and over | 45 (95.7%) | 23 (100.0%) |
| Total | 458 (95.4%) | 376 (93.5%) |
Income Below Poverty Among Married-Couple Families in Gallatin Gateway
The poverty statistics for married-couple families in Gallatin Gateway show that 1.1% or 2 of the total 191 families live below the poverty line. Families with no children have the highest poverty rate of 1.6%, comprising of 2 families. On the other hand, families with 1 or 2 children have the lowest poverty rate of 0.0%, which includes 0 families.
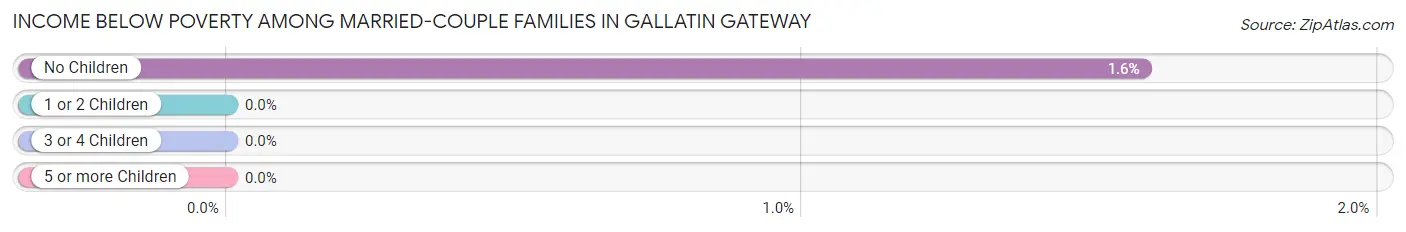
| Children | Above Poverty | Below Poverty |
| No Children | 124 (98.4%) | 2 (1.6%) |
| 1 or 2 Children | 42 (100.0%) | 0 (0.0%) |
| 3 or 4 Children | 19 (100.0%) | 0 (0.0%) |
| 5 or more Children | 4 (100.0%) | 0 (0.0%) |
| Total | 189 (99.0%) | 2 (1.1%) |
Income Below Poverty Among Single-Parent Households in Gallatin Gateway
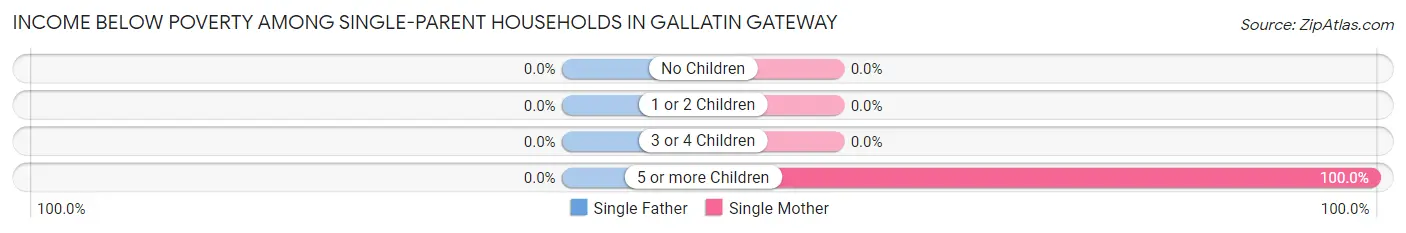
| Children | Single Father | Single Mother |
| No Children | 0 (0.0%) | 0 (0.0%) |
| 1 or 2 Children | 0 (0.0%) | 0 (0.0%) |
| 3 or 4 Children | 0 (0.0%) | 0 (0.0%) |
| 5 or more Children | 0 (0.0%) | 6 (100.0%) |
| Total | 0 (0.0%) | 6 (54.5%) |
Income Below Poverty Among Married-Couple vs Single-Parent Households in Gallatin Gateway
The poverty data for Gallatin Gateway shows that 2 of the married-couple family households (1.1%) and 6 of the single-parent households (33.3%) are living below the poverty level. Within the married-couple family households, those with no children have the highest poverty rate, with 2 households (1.6%) falling below the poverty line. Among the single-parent households, those with 5 or more children have the highest poverty rate, with 6 household (100.0%) living below poverty.
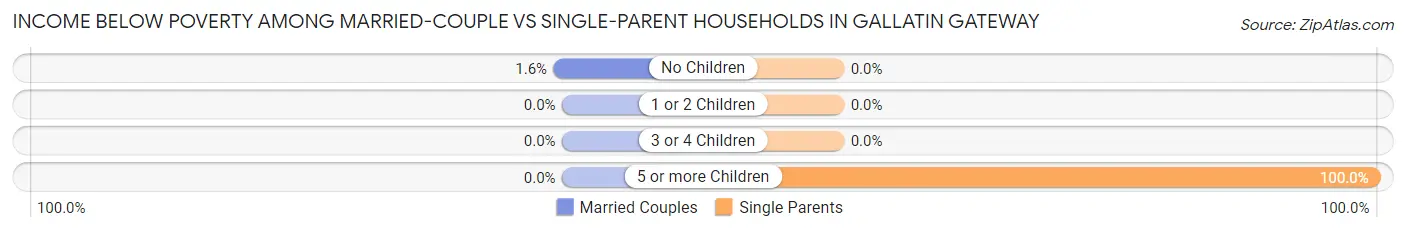
| Children | Married-Couple Families | Single-Parent Households |
| No Children | 2 (1.6%) | 0 (0.0%) |
| 1 or 2 Children | 0 (0.0%) | 0 (0.0%) |
| 3 or 4 Children | 0 (0.0%) | 0 (0.0%) |
| 5 or more Children | 0 (0.0%) | 6 (100.0%) |
| Total | 2 (1.1%) | 6 (33.3%) |
Race in Gallatin Gateway
The most populous races in Gallatin Gateway are White / Caucasian (828 | 93.4%), Two or more Races (46 | 5.2%), and Hispanic or Latino (36 | 4.1%).
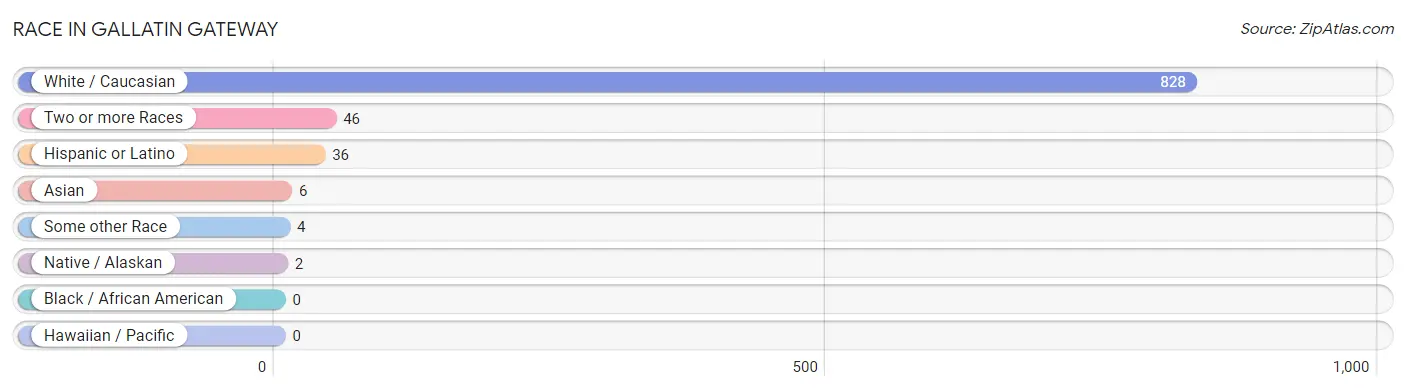
| Race | # Population | % Population |
| Asian | 6 | 0.7% |
| Black / African American | 0 | 0.0% |
| Hawaiian / Pacific | 0 | 0.0% |
| Hispanic or Latino | 36 | 4.1% |
| Native / Alaskan | 2 | 0.2% |
| White / Caucasian | 828 | 93.4% |
| Two or more Races | 46 | 5.2% |
| Some other Race | 4 | 0.4% |
| Total | 886 | 100.0% |
Ancestry in Gallatin Gateway
The most populous ancestries reported in Gallatin Gateway are German (168 | 19.0%), English (141 | 15.9%), Irish (85 | 9.6%), French Canadian (69 | 7.8%), and American (62 | 7.0%), together accounting for 59.3% of all Gallatin Gateway residents.
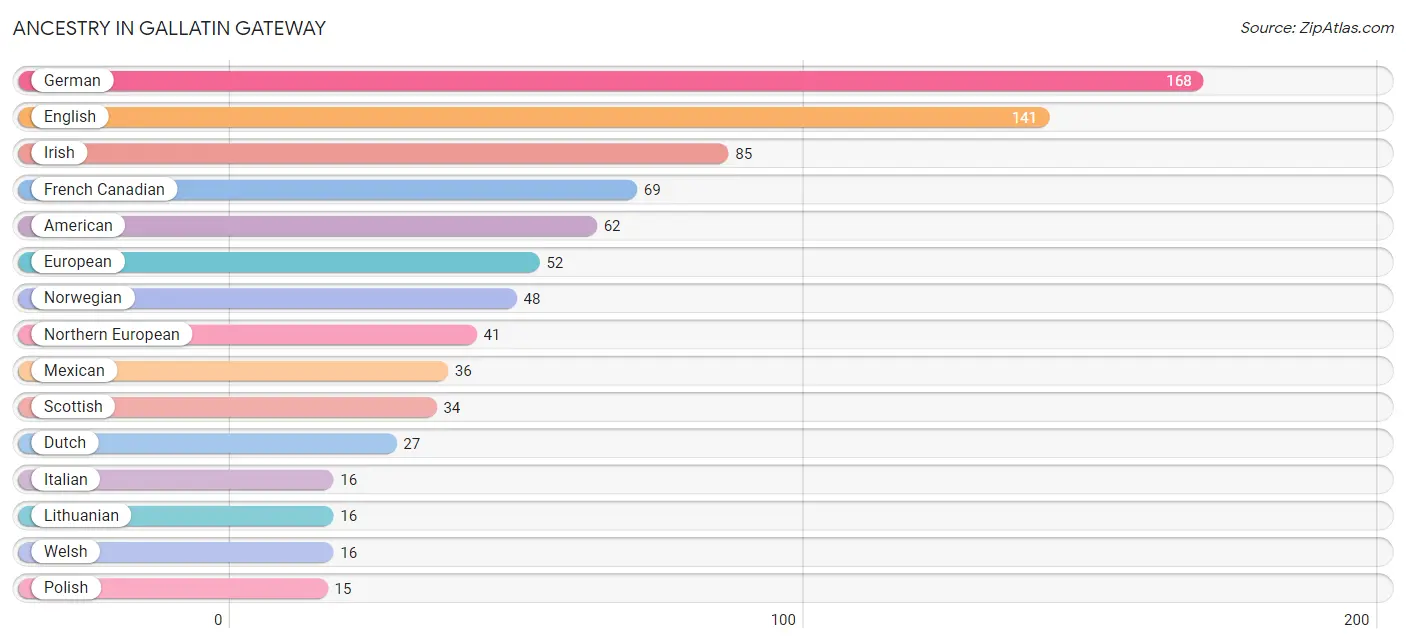
| Ancestry | # Population | % Population |
| American | 62 | 7.0% |
| Blackfeet | 5 | 0.6% |
| British | 7 | 0.8% |
| Canadian | 3 | 0.3% |
| Cree | 7 | 0.8% |
| Croatian | 13 | 1.5% |
| Czech | 5 | 0.6% |
| Danish | 7 | 0.8% |
| Dutch | 27 | 3.0% |
| English | 141 | 15.9% |
| European | 52 | 5.9% |
| Finnish | 3 | 0.3% |
| French | 14 | 1.6% |
| French Canadian | 69 | 7.8% |
| German | 168 | 19.0% |
| Greek | 8 | 0.9% |
| Hungarian | 3 | 0.3% |
| Irish | 85 | 9.6% |
| Italian | 16 | 1.8% |
| Korean | 6 | 0.7% |
| Lithuanian | 16 | 1.8% |
| Lumbee | 3 | 0.3% |
| Mexican | 36 | 4.1% |
| Northern European | 41 | 4.6% |
| Norwegian | 48 | 5.4% |
| Polish | 15 | 1.7% |
| Scandinavian | 3 | 0.3% |
| Scotch-Irish | 9 | 1.0% |
| Scottish | 34 | 3.8% |
| Slavic | 9 | 1.0% |
| Swedish | 12 | 1.3% |
| Swiss | 3 | 0.3% |
| Welsh | 16 | 1.8% | View All 33 Rows |
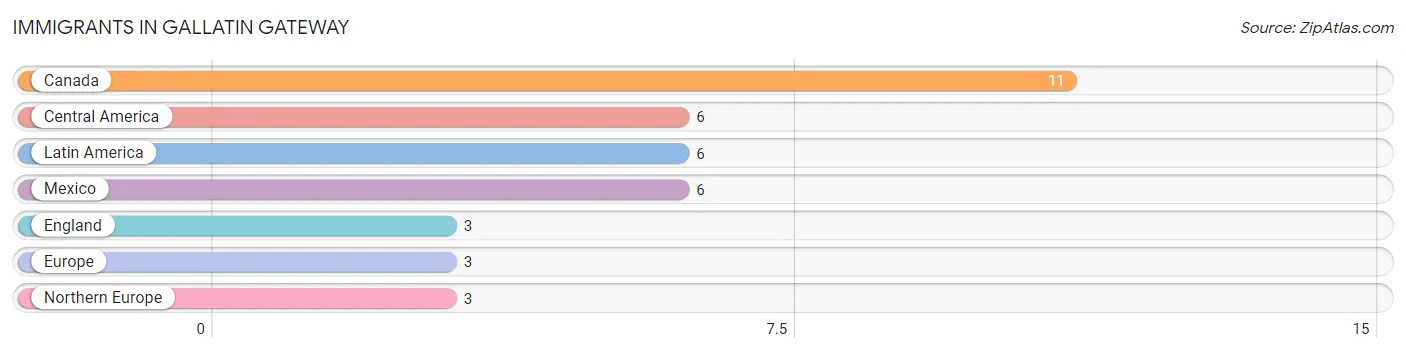
Immigrants in Gallatin Gateway
The most numerous immigrant groups reported in Gallatin Gateway came from Canada (11 | 1.2%), Central America (6 | 0.7%), Latin America (6 | 0.7%), Mexico (6 | 0.7%), and England (3 | 0.3%), together accounting for 3.6% of all Gallatin Gateway residents.
| Immigration Origin | # Population | % Population |
| Canada | 11 | 1.2% |
| Central America | 6 | 0.7% |
| England | 3 | 0.3% |
| Europe | 3 | 0.3% |
| Latin America | 6 | 0.7% |
| Mexico | 6 | 0.7% |
| Northern Europe | 3 | 0.3% | View All 7 Rows |
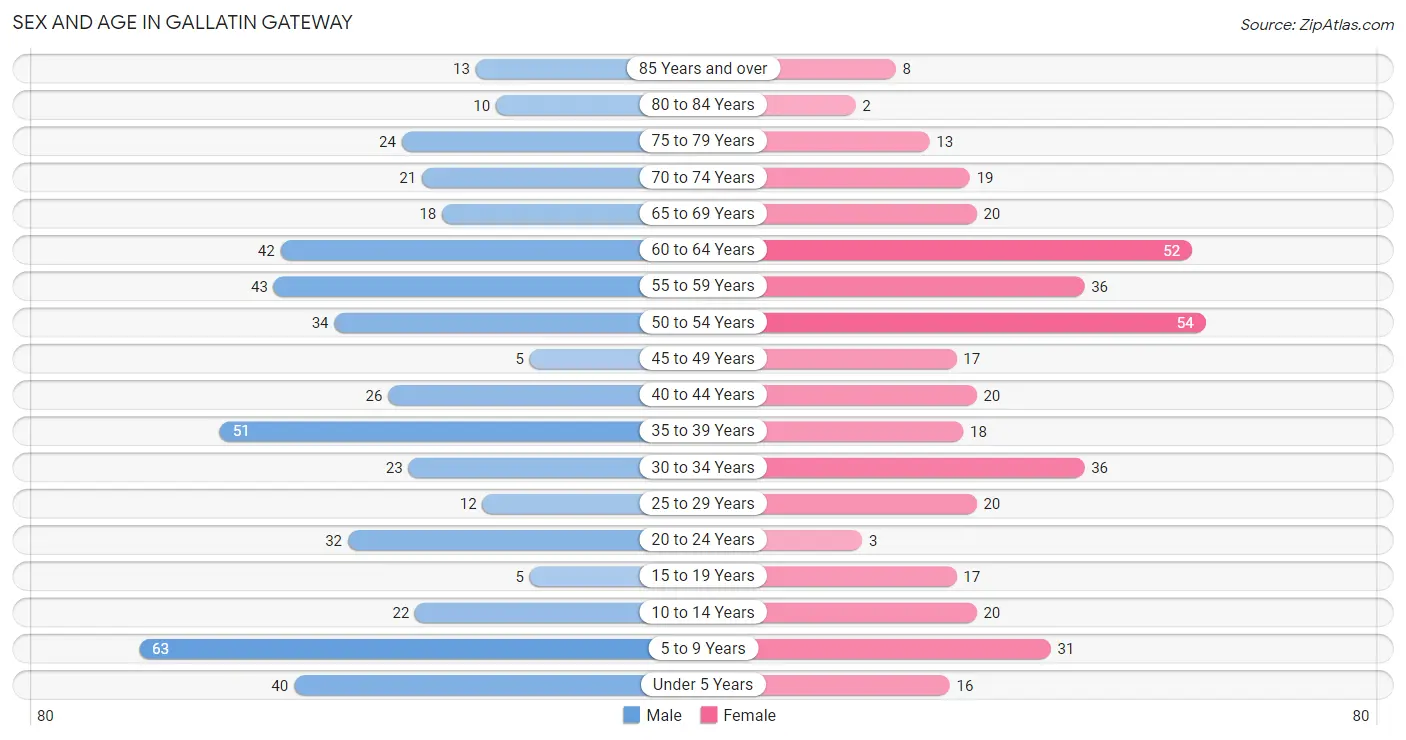
Sex and Age in Gallatin Gateway
Sex and Age in Gallatin Gateway
The most populous age groups in Gallatin Gateway are 5 to 9 Years (63 | 13.0%) for men and 50 to 54 Years (54 | 13.4%) for women.
| Age Bracket | Male | Female |
| Under 5 Years | 40 (8.3%) | 16 (4.0%) |
| 5 to 9 Years | 63 (13.0%) | 31 (7.7%) |
| 10 to 14 Years | 22 (4.5%) | 20 (5.0%) |
| 15 to 19 Years | 5 (1.0%) | 17 (4.2%) |
| 20 to 24 Years | 32 (6.6%) | 3 (0.7%) |
| 25 to 29 Years | 12 (2.5%) | 20 (5.0%) |
| 30 to 34 Years | 23 (4.8%) | 36 (9.0%) |
| 35 to 39 Years | 51 (10.5%) | 18 (4.5%) |
| 40 to 44 Years | 26 (5.4%) | 20 (5.0%) |
| 45 to 49 Years | 5 (1.0%) | 17 (4.2%) |
| 50 to 54 Years | 34 (7.0%) | 54 (13.4%) |
| 55 to 59 Years | 43 (8.9%) | 36 (9.0%) |
| 60 to 64 Years | 42 (8.7%) | 52 (12.9%) |
| 65 to 69 Years | 18 (3.7%) | 20 (5.0%) |
| 70 to 74 Years | 21 (4.3%) | 19 (4.7%) |
| 75 to 79 Years | 24 (5.0%) | 13 (3.2%) |
| 80 to 84 Years | 10 (2.1%) | 2 (0.5%) |
| 85 Years and over | 13 (2.7%) | 8 (2.0%) |
| Total | 484 (100.0%) | 402 (100.0%) |
Families and Households in Gallatin Gateway
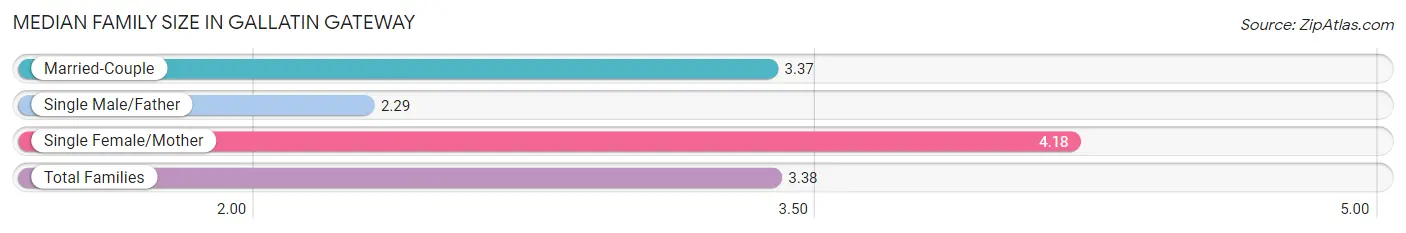
Median Family Size in Gallatin Gateway
The median family size in Gallatin Gateway is 3.38 persons per family, with single female/mother families (11 | 5.3%) accounting for the largest median family size of 4.18 persons per family. On the other hand, single male/father families (7 | 3.4%) represent the smallest median family size with 2.29 persons per family.
| Family Type | # Families | Family Size |
| Married-Couple | 191 (91.4%) | 3.37 |
| Single Male/Father | 7 (3.4%) | 2.29 |
| Single Female/Mother | 11 (5.3%) | 4.18 |
| Total Families | 209 (100.0%) | 3.38 |
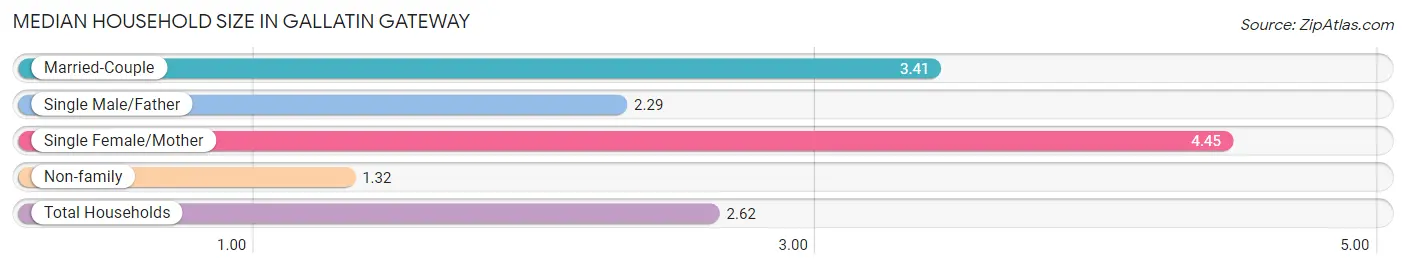
Median Household Size in Gallatin Gateway
The median household size in Gallatin Gateway is 2.62 persons per household, with single female/mother households (11 | 3.3%) accounting for the largest median household size of 4.45 persons per household. non-family households (129 | 38.2%) represent the smallest median household size with 1.32 persons per household.
| Household Type | # Households | Household Size |
| Married-Couple | 191 (56.5%) | 3.41 |
| Single Male/Father | 7 (2.1%) | 2.29 |
| Single Female/Mother | 11 (3.3%) | 4.45 |
| Non-family | 129 (38.2%) | 1.32 |
| Total Households | 338 (100.0%) | 2.62 |
Household Size by Marriage Status in Gallatin Gateway
Out of a total of 338 households in Gallatin Gateway, 209 (61.8%) are family households, while 129 (38.2%) are nonfamily households. The most numerous type of family households are 2-person households, comprising 106, and the most common type of nonfamily households are 1-person households, comprising 99.
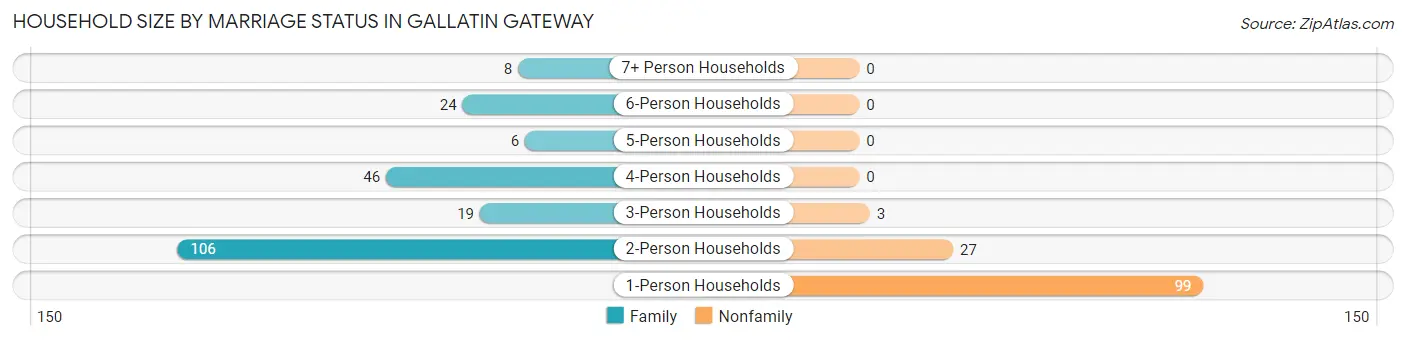
| Household Size | Family Households | Nonfamily Households |
| 1-Person Households | - | 99 (29.3%) |
| 2-Person Households | 106 (31.4%) | 27 (8.0%) |
| 3-Person Households | 19 (5.6%) | 3 (0.9%) |
| 4-Person Households | 46 (13.6%) | 0 (0.0%) |
| 5-Person Households | 6 (1.8%) | 0 (0.0%) |
| 6-Person Households | 24 (7.1%) | 0 (0.0%) |
| 7+ Person Households | 8 (2.4%) | 0 (0.0%) |
| Total | 209 (61.8%) | 129 (38.2%) |
Female Fertility in Gallatin Gateway
Fertility by Age in Gallatin Gateway
Average fertility rate in Gallatin Gateway is 74.0 births per 1,000 women. Women in the age bracket of 20 to 34 years have the highest fertility rate with 119.0 births per 1,000 women. Women in the age bracket of 20 to 34 years acount for 63.6% of all women with births.
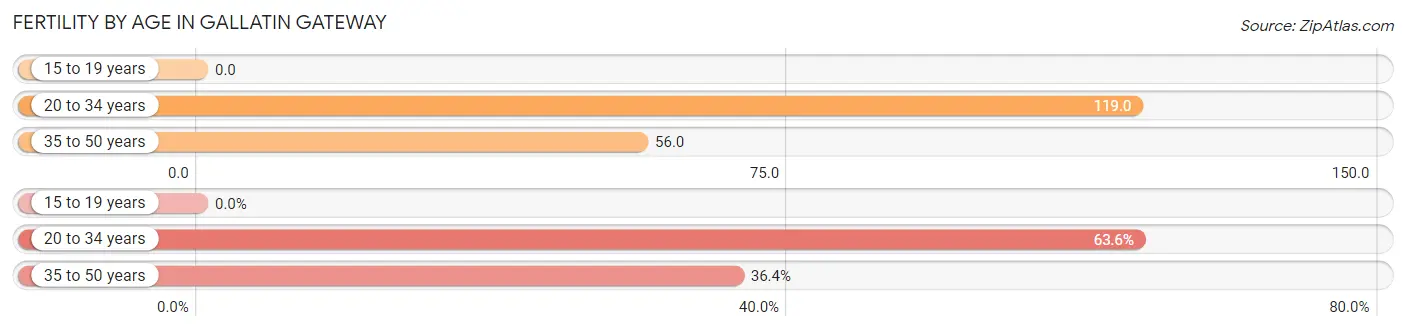
| Age Bracket | Women with Births | Births / 1,000 Women |
| 15 to 19 years | 0 (0.0%) | 0.0 |
| 20 to 34 years | 7 (63.6%) | 119.0 |
| 35 to 50 years | 4 (36.4%) | 56.0 |
| Total | 11 (100.0%) | 74.0 |
Fertility by Age by Marriage Status in Gallatin Gateway
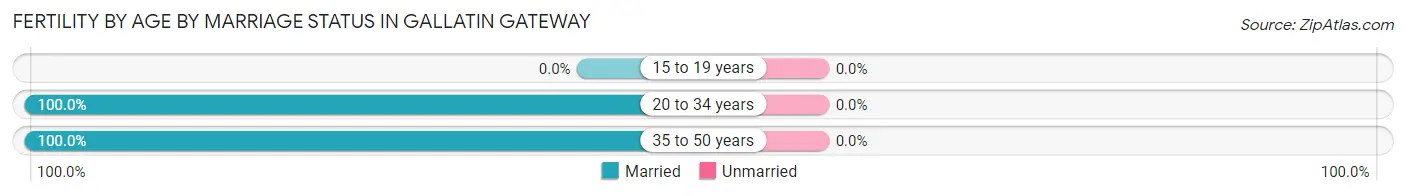
| Age Bracket | Married | Unmarried |
| 15 to 19 years | 0 (0.0%) | 0 (0.0%) |
| 20 to 34 years | 7 (100.0%) | 0 (0.0%) |
| 35 to 50 years | 4 (100.0%) | 0 (0.0%) |
| Total | 11 (100.0%) | 0 (0.0%) |
Fertility by Education in Gallatin Gateway
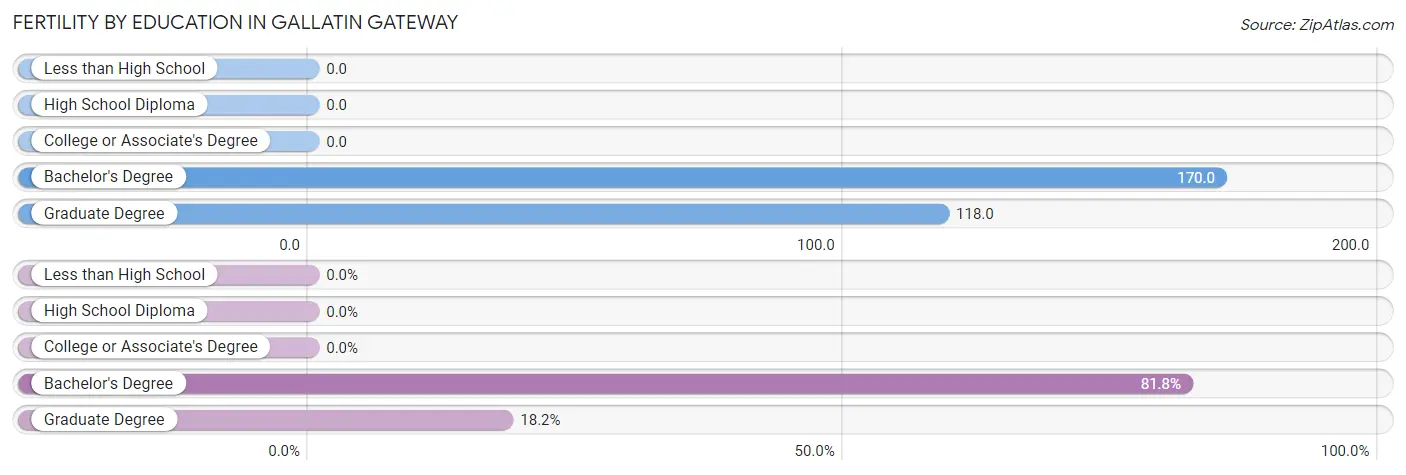
| Educational Attainment | Women with Births | Births / 1,000 Women |
| Less than High School | 0 (0.0%) | 0.0 |
| High School Diploma | 0 (0.0%) | 0.0 |
| College or Associate's Degree | 0 (0.0%) | 0.0 |
| Bachelor's Degree | 9 (81.8%) | 170.0 |
| Graduate Degree | 2 (18.2%) | 118.0 |
| Total | 11 (100.0%) | 74.0 |
Fertility by Education by Marriage Status in Gallatin Gateway
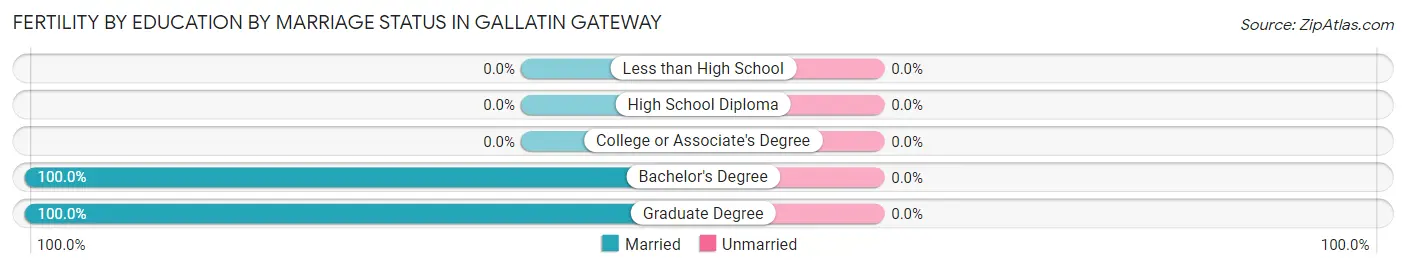
| Educational Attainment | Married | Unmarried |
| Less than High School | 0 (0.0%) | 0 (0.0%) |
| High School Diploma | 0 (0.0%) | 0 (0.0%) |
| College or Associate's Degree | 0 (0.0%) | 0 (0.0%) |
| Bachelor's Degree | 9 (100.0%) | 0 (0.0%) |
| Graduate Degree | 2 (100.0%) | 0 (0.0%) |
| Total | 11 (100.0%) | 0 (0.0%) |
Employment Characteristics in Gallatin Gateway
Employment by Class of Employer in Gallatin Gateway
Among the 404 employed individuals in Gallatin Gateway, private company employees (213 | 52.7%), self-employed (incorporated) (77 | 19.1%), and self-employed (not incorporated) (58 | 14.4%) make up the most common classes of employment.
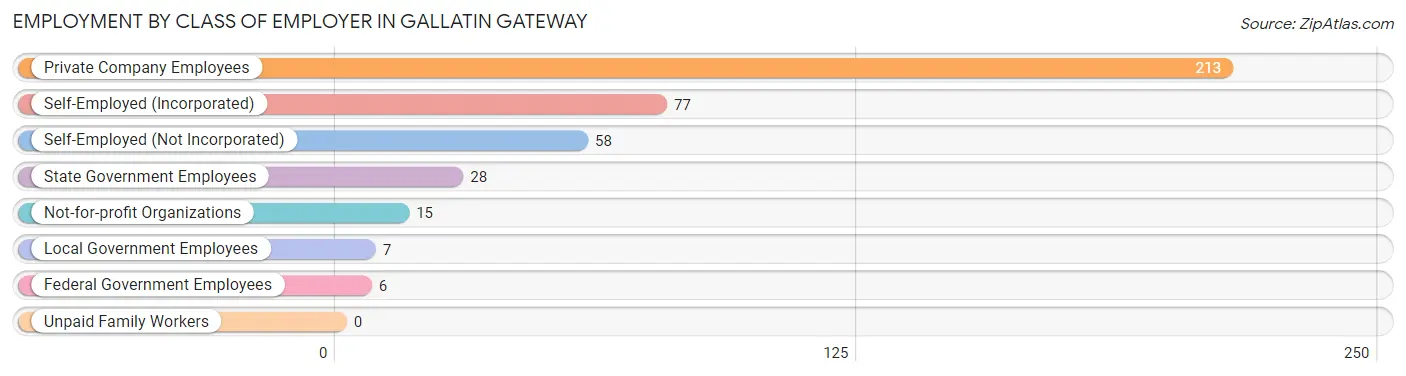
| Employer Class | # Employees | % Employees |
| Private Company Employees | 213 | 52.7% |
| Self-Employed (Incorporated) | 77 | 19.1% |
| Self-Employed (Not Incorporated) | 58 | 14.4% |
| Not-for-profit Organizations | 15 | 3.7% |
| Local Government Employees | 7 | 1.7% |
| State Government Employees | 28 | 6.9% |
| Federal Government Employees | 6 | 1.5% |
| Unpaid Family Workers | 0 | 0.0% |
| Total | 404 | 100.0% |
Employment Status by Age in Gallatin Gateway
According to the labor force statistics for Gallatin Gateway, out of the total population over 16 years of age (691), 61.2% or 423 individuals are in the labor force, with 4.5% or 19 of them unemployed. The age group with the highest labor force participation rate is 35 to 44 years, with 100.0% or 115 individuals in the labor force. Within the labor force, the 65 to 74 years age range has the highest percentage of unemployed individuals, with 47.1% or 16 of them being unemployed.
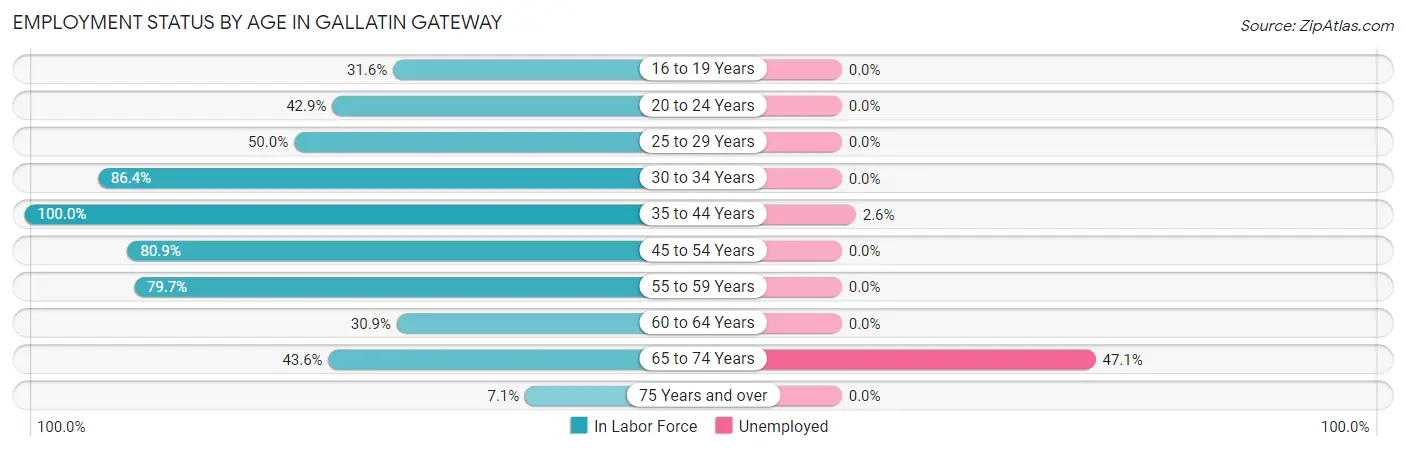
| Age Bracket | In Labor Force | Unemployed |
| 16 to 19 Years | 6 (31.6%) | 0 (0.0%) |
| 20 to 24 Years | 15 (42.9%) | 0 (0.0%) |
| 25 to 29 Years | 16 (50.0%) | 0 (0.0%) |
| 30 to 34 Years | 51 (86.4%) | 0 (0.0%) |
| 35 to 44 Years | 115 (100.0%) | 3 (2.6%) |
| 45 to 54 Years | 89 (80.9%) | 0 (0.0%) |
| 55 to 59 Years | 63 (79.7%) | 0 (0.0%) |
| 60 to 64 Years | 29 (30.9%) | 0 (0.0%) |
| 65 to 74 Years | 34 (43.6%) | 16 (47.1%) |
| 75 Years and over | 5 (7.1%) | 0 (0.0%) |
| Total | 423 (61.2%) | 19 (4.5%) |
Employment Status by Educational Attainment in Gallatin Gateway
According to labor force statistics for Gallatin Gateway, 74.2% of individuals (363) out of the total population between 25 and 64 years of age (489) are in the labor force, with 0.8% or 3 of them being unemployed. The group with the highest labor force participation rate are those with the educational attainment of less than high school, with 78.8% or 41 individuals in the labor force. Within the labor force, individuals with bachelor's degree or higher education have the highest percentage of unemployment, with 1.8% or 3 of them being unemployed.
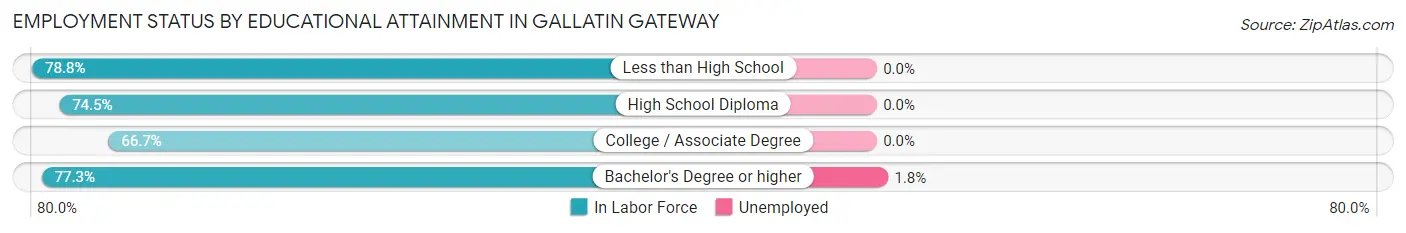
| Educational Attainment | In Labor Force | Unemployed |
| Less than High School | 41 (78.8%) | 0 (0.0%) |
| High School Diploma | 79 (74.5%) | 0 (0.0%) |
| College / Associate Degree | 80 (66.7%) | 0 (0.0%) |
| Bachelor's Degree or higher | 163 (77.3%) | 4 (1.8%) |
| Total | 363 (74.2%) | 4 (0.8%) |
Employment Occupations by Sex in Gallatin Gateway
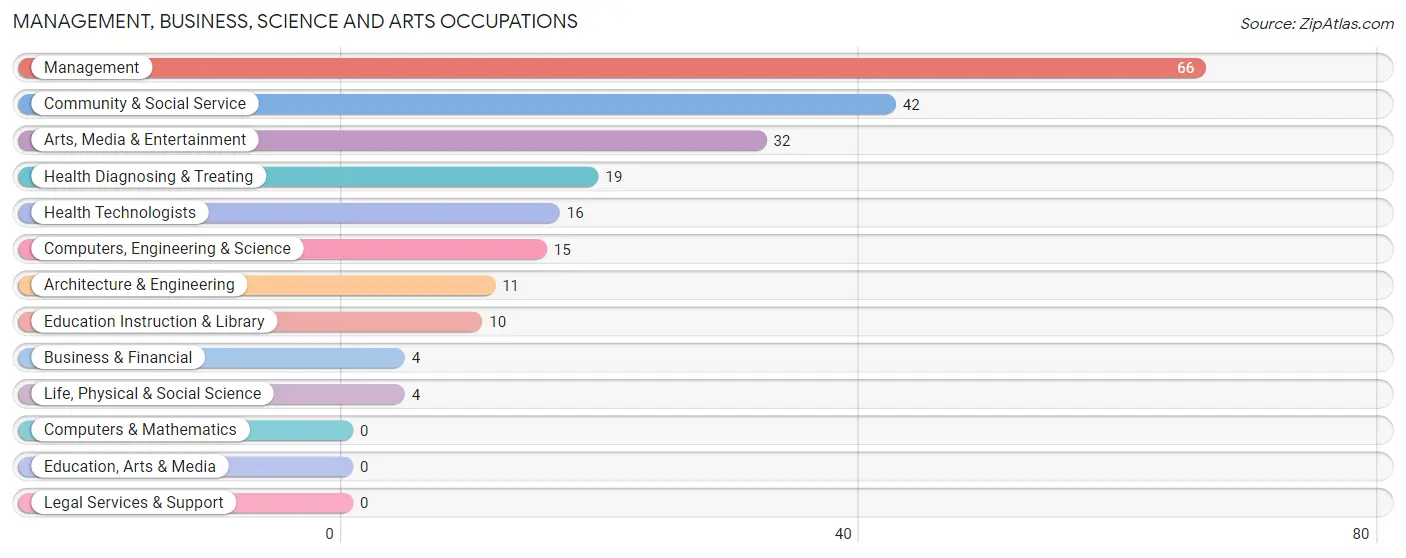
Management, Business, Science and Arts Occupations
The most common Management, Business, Science and Arts occupations in Gallatin Gateway are Management (66 | 16.3%), Community & Social Service (42 | 10.4%), Arts, Media & Entertainment (32 | 7.9%), Health Diagnosing & Treating (19 | 4.7%), and Health Technologists (16 | 4.0%).
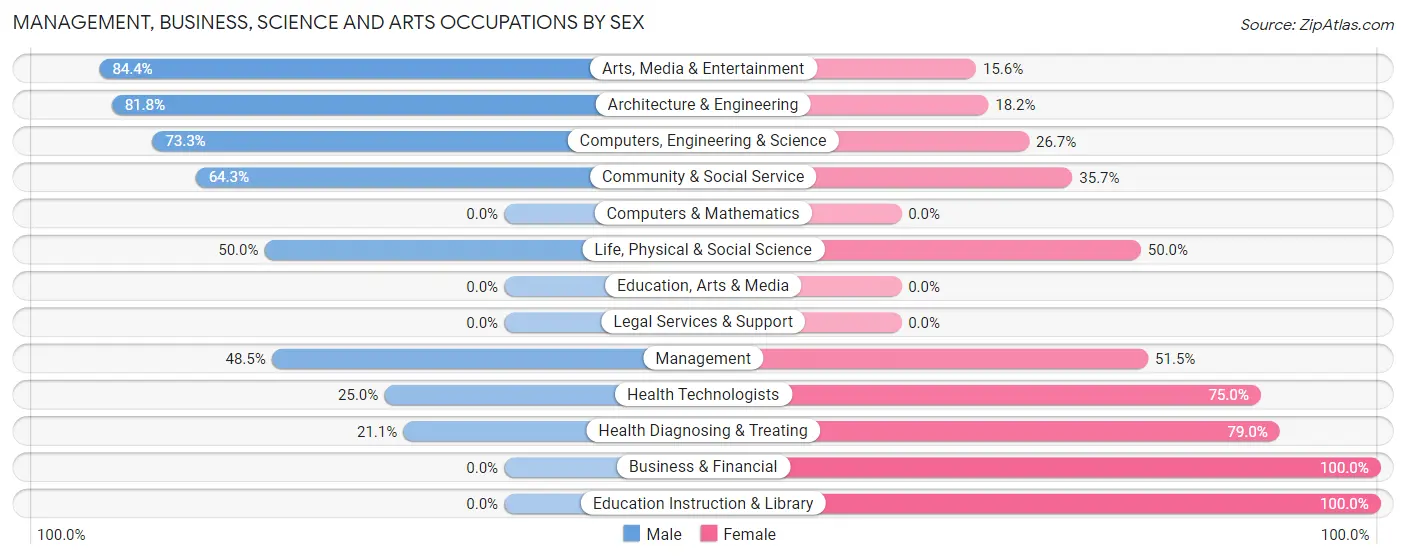
Management, Business, Science and Arts Occupations by Sex
Within the Management, Business, Science and Arts occupations in Gallatin Gateway, the most male-oriented occupations are Arts, Media & Entertainment (84.4%), Architecture & Engineering (81.8%), and Computers, Engineering & Science (73.3%), while the most female-oriented occupations are Business & Financial (100.0%), Education Instruction & Library (100.0%), and Health Diagnosing & Treating (78.9%).
| Occupation | Male | Female |
| Management | 32 (48.5%) | 34 (51.5%) |
| Business & Financial | 0 (0.0%) | 4 (100.0%) |
| Computers, Engineering & Science | 11 (73.3%) | 4 (26.7%) |
| Computers & Mathematics | 0 (0.0%) | 0 (0.0%) |
| Architecture & Engineering | 9 (81.8%) | 2 (18.2%) |
| Life, Physical & Social Science | 2 (50.0%) | 2 (50.0%) |
| Community & Social Service | 27 (64.3%) | 15 (35.7%) |
| Education, Arts & Media | 0 (0.0%) | 0 (0.0%) |
| Legal Services & Support | 0 (0.0%) | 0 (0.0%) |
| Education Instruction & Library | 0 (0.0%) | 10 (100.0%) |
| Arts, Media & Entertainment | 27 (84.4%) | 5 (15.6%) |
| Health Diagnosing & Treating | 4 (21.0%) | 15 (78.9%) |
| Health Technologists | 4 (25.0%) | 12 (75.0%) |
| Total (Category) | 74 (50.7%) | 72 (49.3%) |
| Total (Overall) | 235 (58.2%) | 169 (41.8%) |
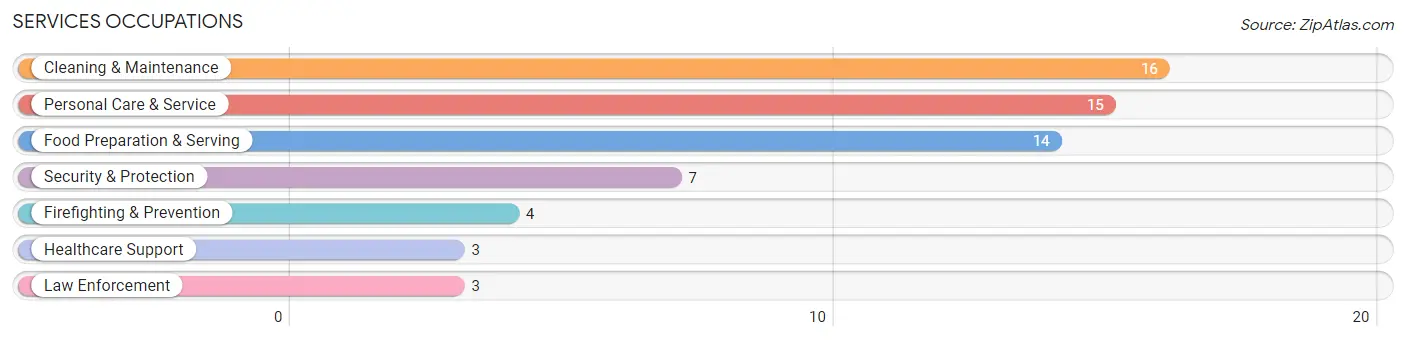
Services Occupations
The most common Services occupations in Gallatin Gateway are Cleaning & Maintenance (16 | 4.0%), Personal Care & Service (15 | 3.7%), Food Preparation & Serving (14 | 3.5%), Security & Protection (7 | 1.7%), and Firefighting & Prevention (4 | 1.0%).
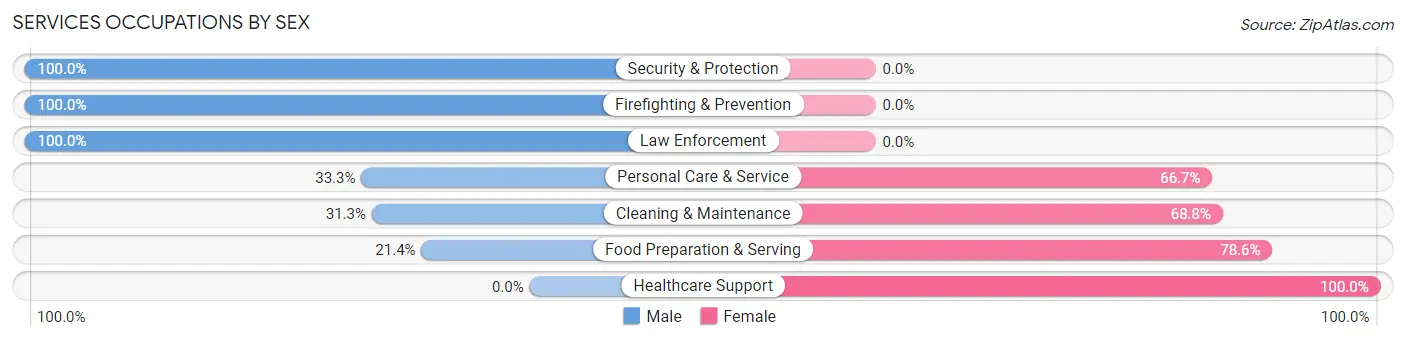
Services Occupations by Sex
Within the Services occupations in Gallatin Gateway, the most male-oriented occupations are Security & Protection (100.0%), Firefighting & Prevention (100.0%), and Law Enforcement (100.0%), while the most female-oriented occupations are Healthcare Support (100.0%), Food Preparation & Serving (78.6%), and Cleaning & Maintenance (68.8%).
| Occupation | Male | Female |
| Healthcare Support | 0 (0.0%) | 3 (100.0%) |
| Security & Protection | 7 (100.0%) | 0 (0.0%) |
| Firefighting & Prevention | 4 (100.0%) | 0 (0.0%) |
| Law Enforcement | 3 (100.0%) | 0 (0.0%) |
| Food Preparation & Serving | 3 (21.4%) | 11 (78.6%) |
| Cleaning & Maintenance | 5 (31.2%) | 11 (68.8%) |
| Personal Care & Service | 5 (33.3%) | 10 (66.7%) |
| Total (Category) | 20 (36.4%) | 35 (63.6%) |
| Total (Overall) | 235 (58.2%) | 169 (41.8%) |
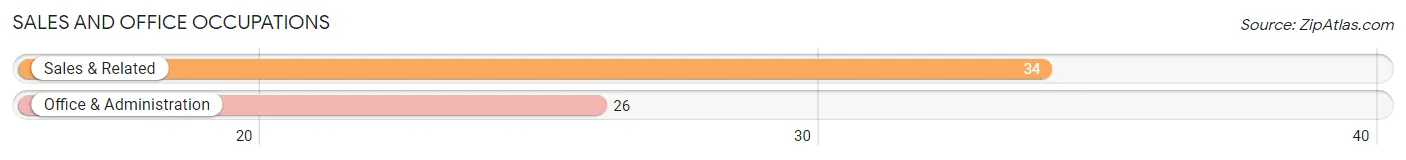
Sales and Office Occupations
The most common Sales and Office occupations in Gallatin Gateway are Sales & Related (34 | 8.4%), and Office & Administration (26 | 6.4%).
Sales and Office Occupations by Sex
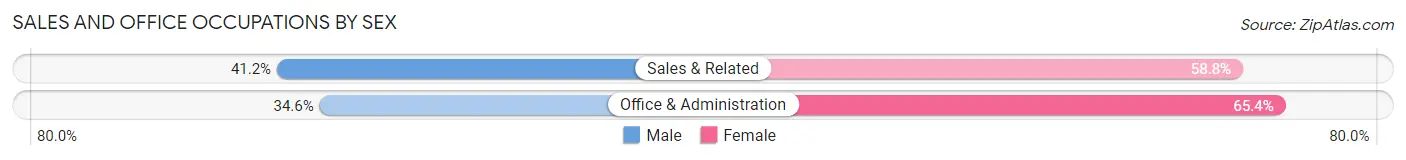
| Occupation | Male | Female |
| Sales & Related | 14 (41.2%) | 20 (58.8%) |
| Office & Administration | 9 (34.6%) | 17 (65.4%) |
| Total (Category) | 23 (38.3%) | 37 (61.7%) |
| Total (Overall) | 235 (58.2%) | 169 (41.8%) |
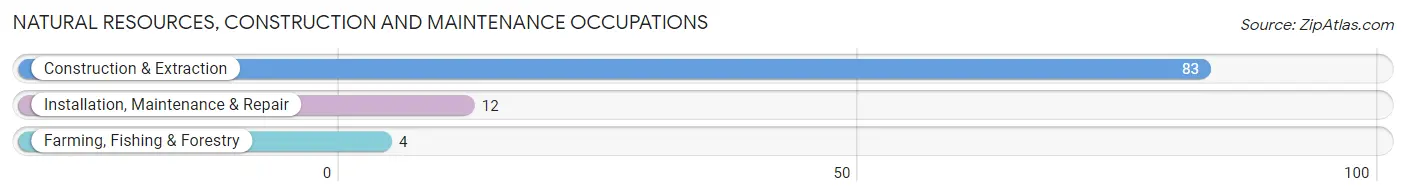
Natural Resources, Construction and Maintenance Occupations
The most common Natural Resources, Construction and Maintenance occupations in Gallatin Gateway are Construction & Extraction (83 | 20.5%), Installation, Maintenance & Repair (12 | 3.0%), and Farming, Fishing & Forestry (4 | 1.0%).
Natural Resources, Construction and Maintenance Occupations by Sex
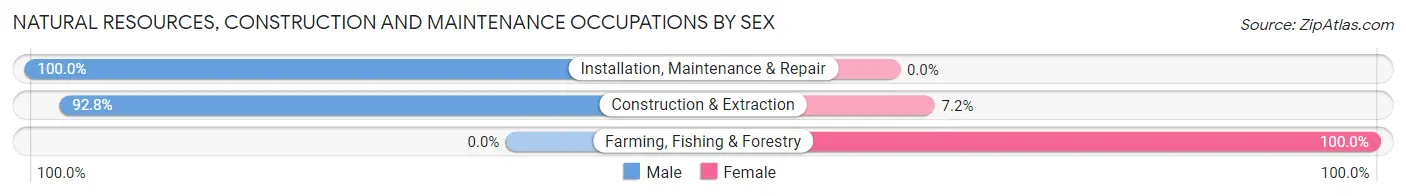
| Occupation | Male | Female |
| Farming, Fishing & Forestry | 0 (0.0%) | 4 (100.0%) |
| Construction & Extraction | 77 (92.8%) | 6 (7.2%) |
| Installation, Maintenance & Repair | 12 (100.0%) | 0 (0.0%) |
| Total (Category) | 89 (89.9%) | 10 (10.1%) |
| Total (Overall) | 235 (58.2%) | 169 (41.8%) |
Production, Transportation and Moving Occupations
The most common Production, Transportation and Moving occupations in Gallatin Gateway are Production (35 | 8.7%), and Transportation (9 | 2.2%).
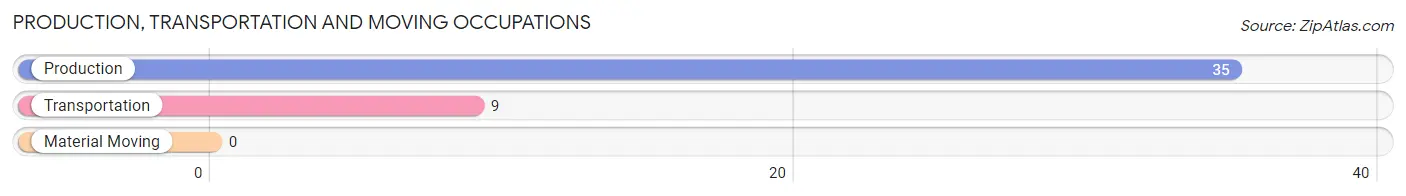
Production, Transportation and Moving Occupations by Sex
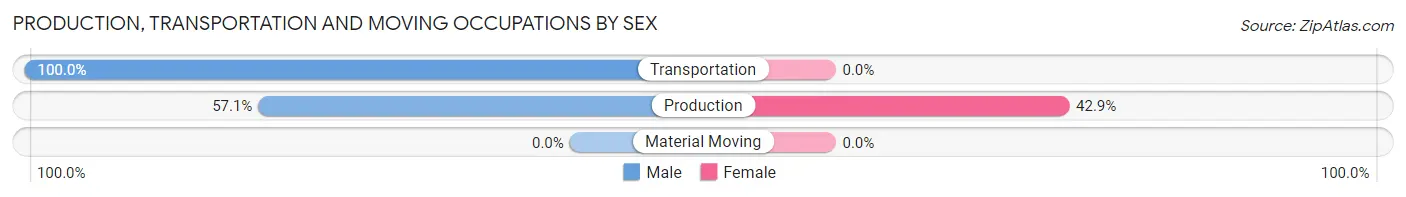
| Occupation | Male | Female |
| Production | 20 (57.1%) | 15 (42.9%) |
| Transportation | 9 (100.0%) | 0 (0.0%) |
| Material Moving | 0 (0.0%) | 0 (0.0%) |
| Total (Category) | 29 (65.9%) | 15 (34.1%) |
| Total (Overall) | 235 (58.2%) | 169 (41.8%) |
Employment Industries by Sex in Gallatin Gateway
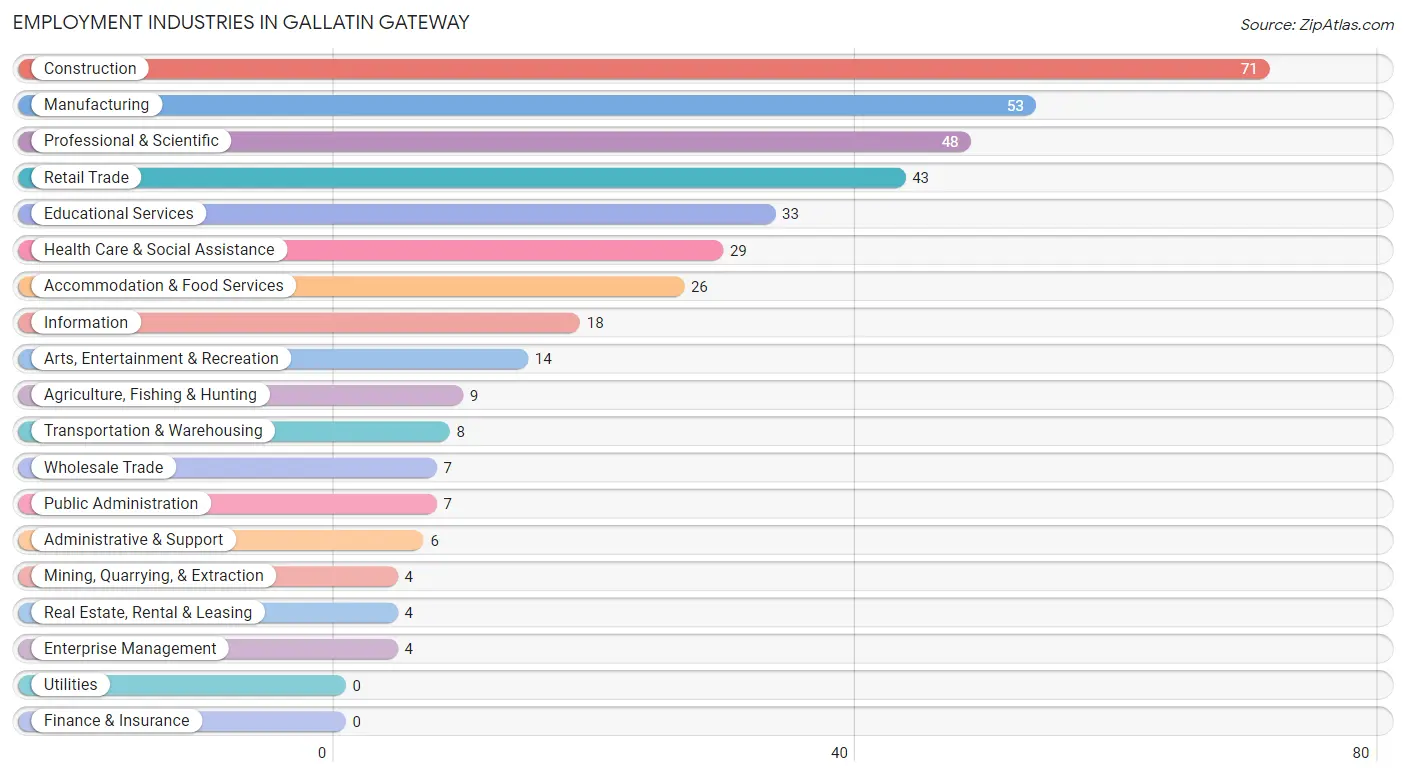
Employment Industries in Gallatin Gateway
The major employment industries in Gallatin Gateway include Construction (71 | 17.6%), Manufacturing (53 | 13.1%), Professional & Scientific (48 | 11.9%), Retail Trade (43 | 10.6%), and Educational Services (33 | 8.2%).
Employment Industries by Sex in Gallatin Gateway
The Gallatin Gateway industries that see more men than women are Wholesale Trade (100.0%), Information (100.0%), and Construction (97.2%), whereas the industries that tend to have a higher number of women are Mining, Quarrying, & Extraction (100.0%), Real Estate, Rental & Leasing (100.0%), and Enterprise Management (100.0%).
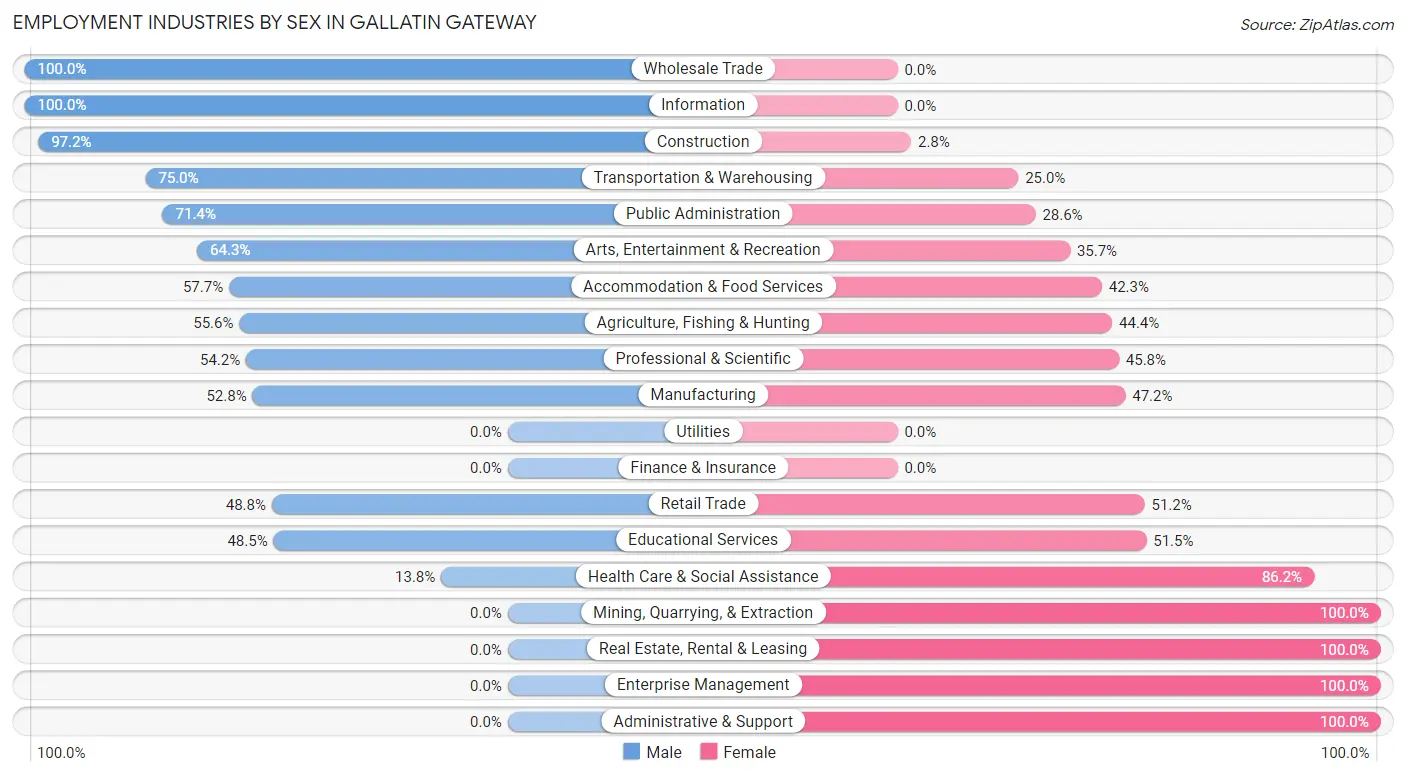
| Industry | Male | Female |
| Agriculture, Fishing & Hunting | 5 (55.6%) | 4 (44.4%) |
| Mining, Quarrying, & Extraction | 0 (0.0%) | 4 (100.0%) |
| Construction | 69 (97.2%) | 2 (2.8%) |
| Manufacturing | 28 (52.8%) | 25 (47.2%) |
| Wholesale Trade | 7 (100.0%) | 0 (0.0%) |
| Retail Trade | 21 (48.8%) | 22 (51.2%) |
| Transportation & Warehousing | 6 (75.0%) | 2 (25.0%) |
| Utilities | 0 (0.0%) | 0 (0.0%) |
| Information | 18 (100.0%) | 0 (0.0%) |
| Finance & Insurance | 0 (0.0%) | 0 (0.0%) |
| Real Estate, Rental & Leasing | 0 (0.0%) | 4 (100.0%) |
| Professional & Scientific | 26 (54.2%) | 22 (45.8%) |
| Enterprise Management | 0 (0.0%) | 4 (100.0%) |
| Administrative & Support | 0 (0.0%) | 6 (100.0%) |
| Educational Services | 16 (48.5%) | 17 (51.5%) |
| Health Care & Social Assistance | 4 (13.8%) | 25 (86.2%) |
| Arts, Entertainment & Recreation | 9 (64.3%) | 5 (35.7%) |
| Accommodation & Food Services | 15 (57.7%) | 11 (42.3%) |
| Public Administration | 5 (71.4%) | 2 (28.6%) |
| Total | 235 (58.2%) | 169 (41.8%) |
Education in Gallatin Gateway
School Enrollment in Gallatin Gateway
The most common levels of schooling among the 172 students in Gallatin Gateway are elementary school (64 | 37.2%), high school (29 | 16.9%), and college / undergraduate (28 | 16.3%).
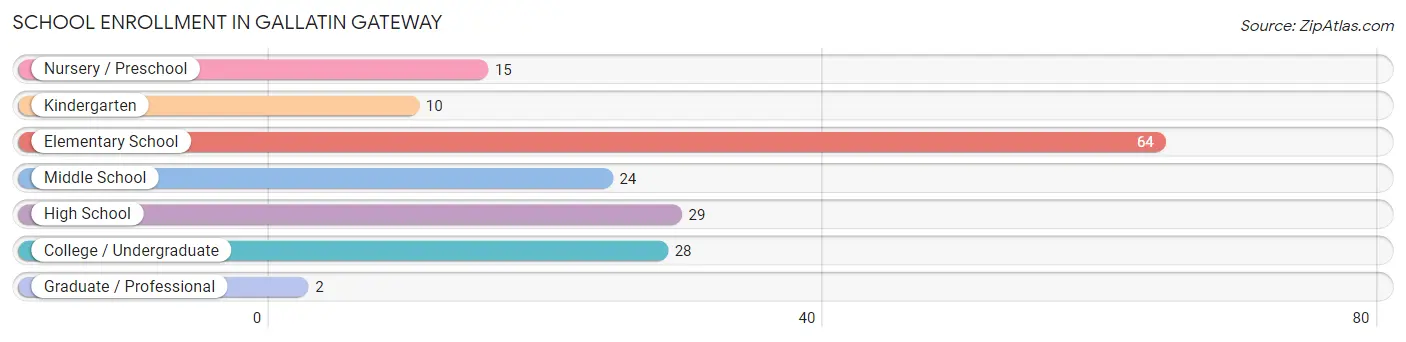
| School Level | # Students | % Students |
| Nursery / Preschool | 15 | 8.7% |
| Kindergarten | 10 | 5.8% |
| Elementary School | 64 | 37.2% |
| Middle School | 24 | 14.0% |
| High School | 29 | 16.9% |
| College / Undergraduate | 28 | 16.3% |
| Graduate / Professional | 2 | 1.2% |
| Total | 172 | 100.0% |
School Enrollment by Age by Funding Source in Gallatin Gateway
Out of a total of 172 students who are enrolled in schools in Gallatin Gateway, 22 (12.8%) attend a private institution, while the remaining 150 (87.2%) are enrolled in public schools. The age group of 3 to 4 year olds has the highest likelihood of being enrolled in private schools, with 4 (100.0% in the age bracket) enrolled. Conversely, the age group of 10 to 14 year olds has the lowest likelihood of being enrolled in a private school, with 40 (100.0% in the age bracket) attending a public institution.
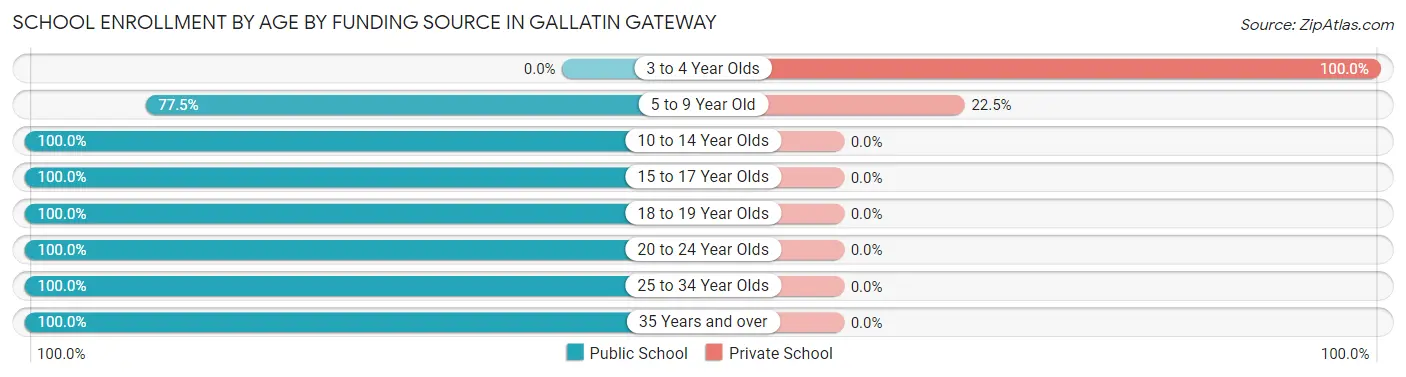
| Age Bracket | Public School | Private School |
| 3 to 4 Year Olds | 0 (0.0%) | 4 (100.0%) |
| 5 to 9 Year Old | 62 (77.5%) | 18 (22.5%) |
| 10 to 14 Year Olds | 40 (100.0%) | 0 (0.0%) |
| 15 to 17 Year Olds | 16 (100.0%) | 0 (0.0%) |
| 18 to 19 Year Olds | 6 (100.0%) | 0 (0.0%) |
| 20 to 24 Year Olds | 18 (100.0%) | 0 (0.0%) |
| 25 to 34 Year Olds | 2 (100.0%) | 0 (0.0%) |
| 35 Years and over | 6 (100.0%) | 0 (0.0%) |
| Total | 150 (87.2%) | 22 (12.8%) |
Educational Attainment by Field of Study in Gallatin Gateway
Bio, nature & agricultural (75 | 28.1%), education (57 | 21.3%), business (25 | 9.4%), physical & health sciences (21 | 7.9%), and arts & humanities (19 | 7.1%) are the most common fields of study among 267 individuals in Gallatin Gateway who have obtained a bachelor's degree or higher.
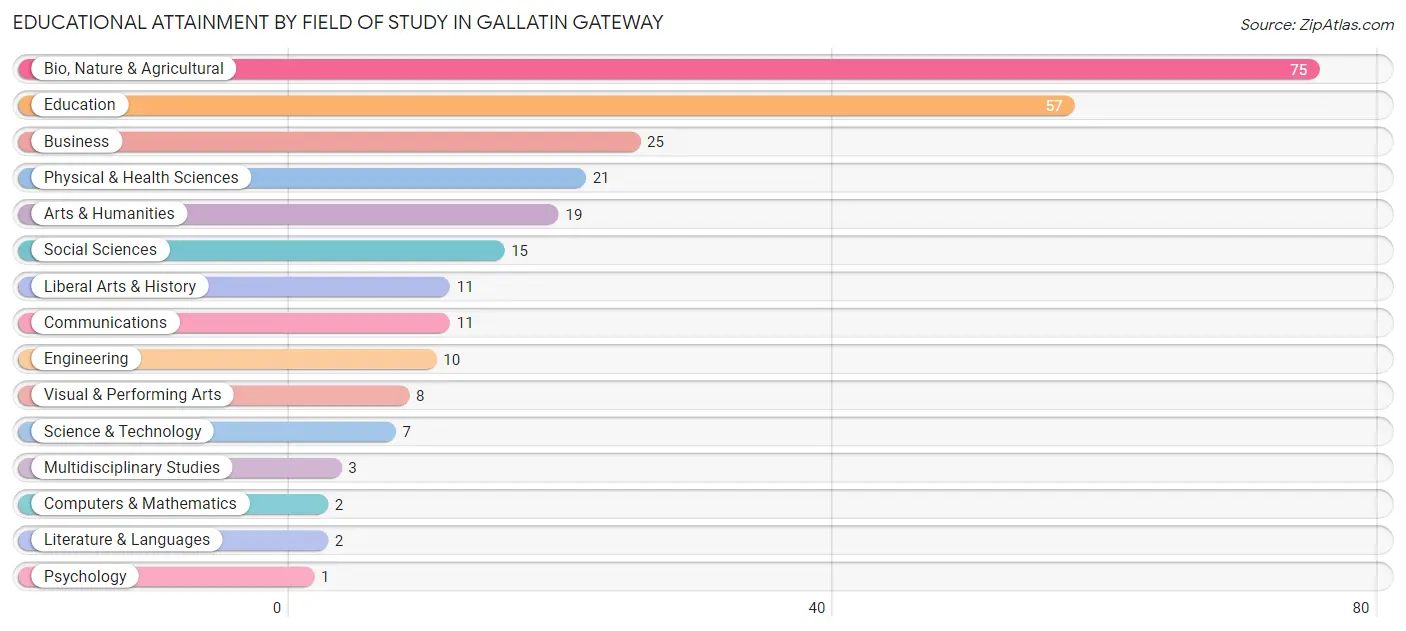
| Field of Study | # Graduates | % Graduates |
| Computers & Mathematics | 2 | 0.7% |
| Bio, Nature & Agricultural | 75 | 28.1% |
| Physical & Health Sciences | 21 | 7.9% |
| Psychology | 1 | 0.4% |
| Social Sciences | 15 | 5.6% |
| Engineering | 10 | 3.7% |
| Multidisciplinary Studies | 3 | 1.1% |
| Science & Technology | 7 | 2.6% |
| Business | 25 | 9.4% |
| Education | 57 | 21.3% |
| Literature & Languages | 2 | 0.7% |
| Liberal Arts & History | 11 | 4.1% |
| Visual & Performing Arts | 8 | 3.0% |
| Communications | 11 | 4.1% |
| Arts & Humanities | 19 | 7.1% |
| Total | 267 | 100.0% |
Transportation & Commute in Gallatin Gateway
Vehicle Availability by Sex in Gallatin Gateway
The most prevalent vehicle ownership categories in Gallatin Gateway are males with 2 vehicles (87, accounting for 37.0%) and females with 2 vehicles (40, making up 51.5%).
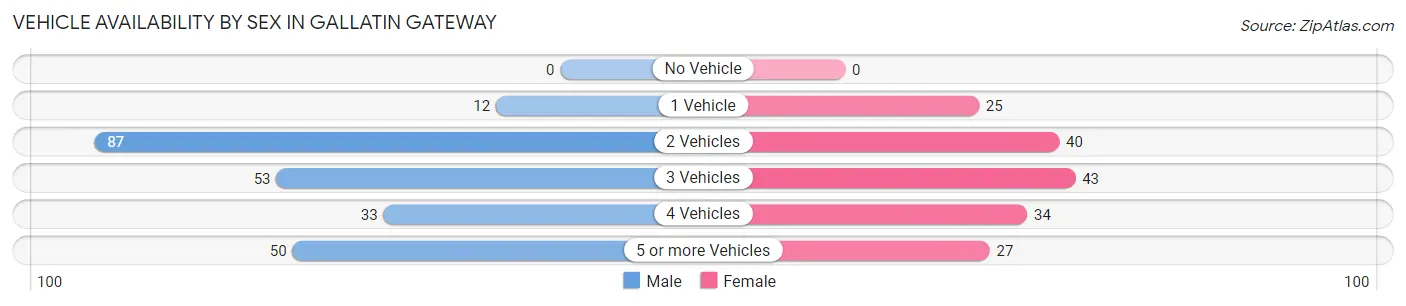
| Vehicles Available | Male | Female |
| No Vehicle | 0 (0.0%) | 0 (0.0%) |
| 1 Vehicle | 12 (5.1%) | 25 (14.8%) |
| 2 Vehicles | 87 (37.0%) | 40 (23.7%) |
| 3 Vehicles | 53 (22.6%) | 43 (25.4%) |
| 4 Vehicles | 33 (14.0%) | 34 (20.1%) |
| 5 or more Vehicles | 50 (21.3%) | 27 (16.0%) |
| Total | 235 (100.0%) | 169 (100.0%) |
Commute Time in Gallatin Gateway
The most frequently occuring commute durations in Gallatin Gateway are 20 to 24 minutes (99 commuters, 28.0%), 30 to 34 minutes (72 commuters, 20.3%), and 25 to 29 minutes (39 commuters, 11.0%).
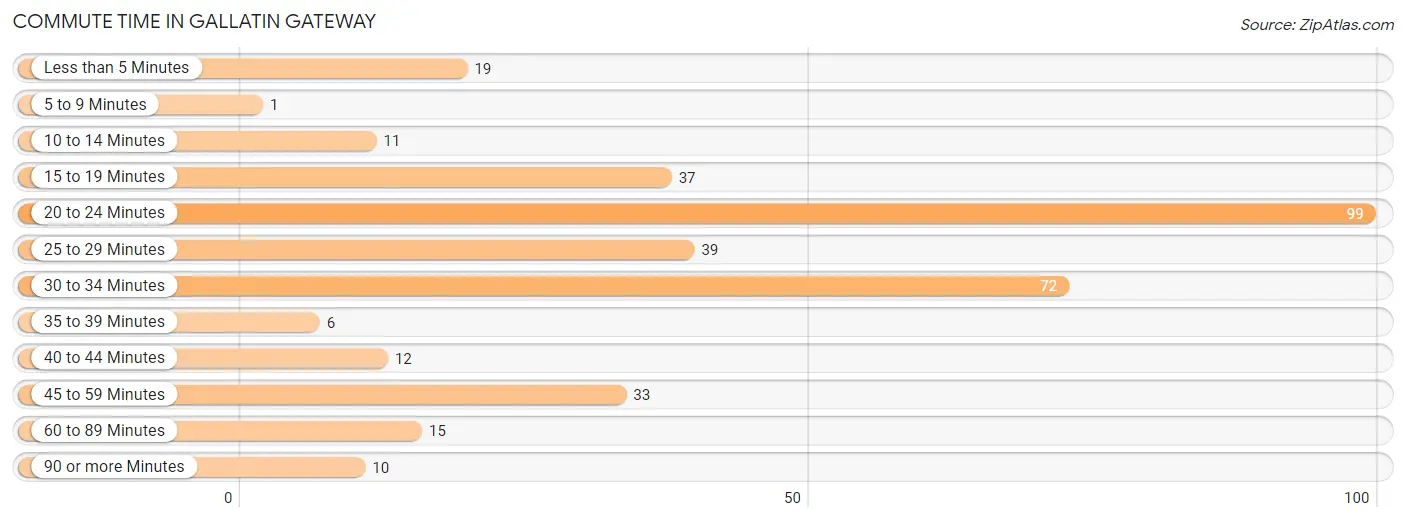
| Commute Time | # Commuters | % Commuters |
| Less than 5 Minutes | 19 | 5.4% |
| 5 to 9 Minutes | 1 | 0.3% |
| 10 to 14 Minutes | 11 | 3.1% |
| 15 to 19 Minutes | 37 | 10.4% |
| 20 to 24 Minutes | 99 | 28.0% |
| 25 to 29 Minutes | 39 | 11.0% |
| 30 to 34 Minutes | 72 | 20.3% |
| 35 to 39 Minutes | 6 | 1.7% |
| 40 to 44 Minutes | 12 | 3.4% |
| 45 to 59 Minutes | 33 | 9.3% |
| 60 to 89 Minutes | 15 | 4.2% |
| 90 or more Minutes | 10 | 2.8% |
Commute Time by Sex in Gallatin Gateway
The most common commute times in Gallatin Gateway are 20 to 24 minutes (60 commuters, 30.3%) for males and 20 to 24 minutes (39 commuters, 25.0%) for females.
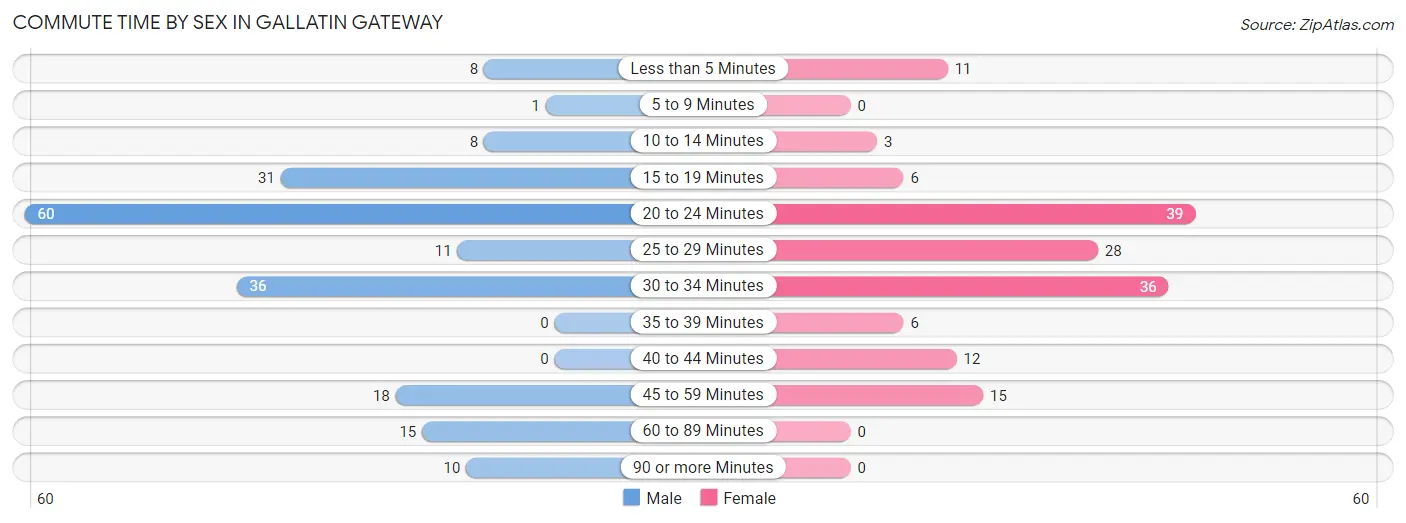
| Commute Time | Male | Female |
| Less than 5 Minutes | 8 (4.0%) | 11 (7.0%) |
| 5 to 9 Minutes | 1 (0.5%) | 0 (0.0%) |
| 10 to 14 Minutes | 8 (4.0%) | 3 (1.9%) |
| 15 to 19 Minutes | 31 (15.7%) | 6 (3.8%) |
| 20 to 24 Minutes | 60 (30.3%) | 39 (25.0%) |
| 25 to 29 Minutes | 11 (5.6%) | 28 (17.9%) |
| 30 to 34 Minutes | 36 (18.2%) | 36 (23.1%) |
| 35 to 39 Minutes | 0 (0.0%) | 6 (3.8%) |
| 40 to 44 Minutes | 0 (0.0%) | 12 (7.7%) |
| 45 to 59 Minutes | 18 (9.1%) | 15 (9.6%) |
| 60 to 89 Minutes | 15 (7.6%) | 0 (0.0%) |
| 90 or more Minutes | 10 (5.1%) | 0 (0.0%) |
Time of Departure to Work by Sex in Gallatin Gateway
The most frequent times of departure to work in Gallatin Gateway are 7:00 AM to 7:29 AM (35, 17.7%) for males and 7:00 AM to 7:29 AM (49, 31.4%) for females.
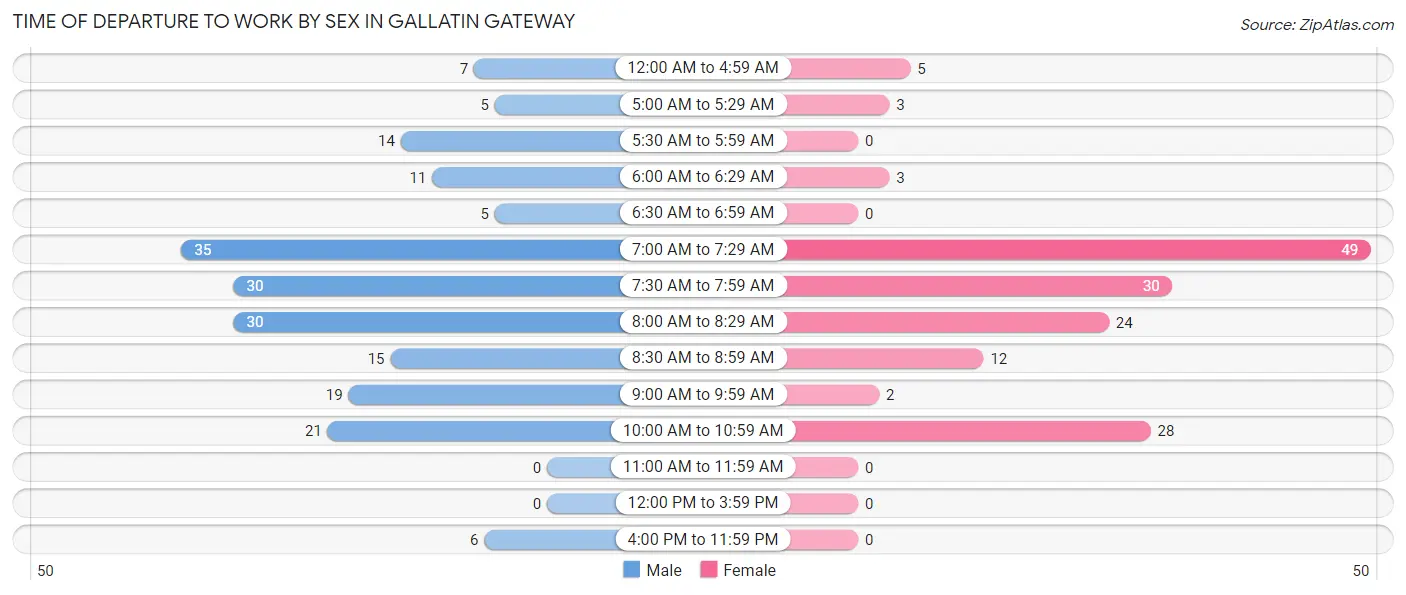
| Time of Departure | Male | Female |
| 12:00 AM to 4:59 AM | 7 (3.5%) | 5 (3.2%) |
| 5:00 AM to 5:29 AM | 5 (2.5%) | 3 (1.9%) |
| 5:30 AM to 5:59 AM | 14 (7.1%) | 0 (0.0%) |
| 6:00 AM to 6:29 AM | 11 (5.6%) | 3 (1.9%) |
| 6:30 AM to 6:59 AM | 5 (2.5%) | 0 (0.0%) |
| 7:00 AM to 7:29 AM | 35 (17.7%) | 49 (31.4%) |
| 7:30 AM to 7:59 AM | 30 (15.1%) | 30 (19.2%) |
| 8:00 AM to 8:29 AM | 30 (15.1%) | 24 (15.4%) |
| 8:30 AM to 8:59 AM | 15 (7.6%) | 12 (7.7%) |
| 9:00 AM to 9:59 AM | 19 (9.6%) | 2 (1.3%) |
| 10:00 AM to 10:59 AM | 21 (10.6%) | 28 (17.9%) |
| 11:00 AM to 11:59 AM | 0 (0.0%) | 0 (0.0%) |
| 12:00 PM to 3:59 PM | 0 (0.0%) | 0 (0.0%) |
| 4:00 PM to 11:59 PM | 6 (3.0%) | 0 (0.0%) |
| Total | 198 (100.0%) | 156 (100.0%) |
Housing Occupancy in Gallatin Gateway
Occupancy by Ownership in Gallatin Gateway
Of the total 338 dwellings in Gallatin Gateway, owner-occupied units account for 298 (88.2%), while renter-occupied units make up 40 (11.8%).
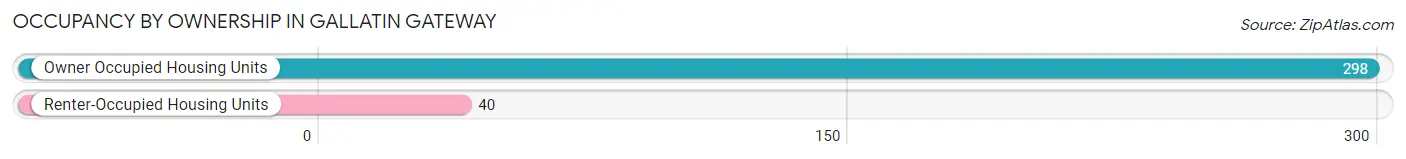
| Occupancy | # Housing Units | % Housing Units |
| Owner Occupied Housing Units | 298 | 88.2% |
| Renter-Occupied Housing Units | 40 | 11.8% |
| Total Occupied Housing Units | 338 | 100.0% |
Occupancy by Household Size in Gallatin Gateway
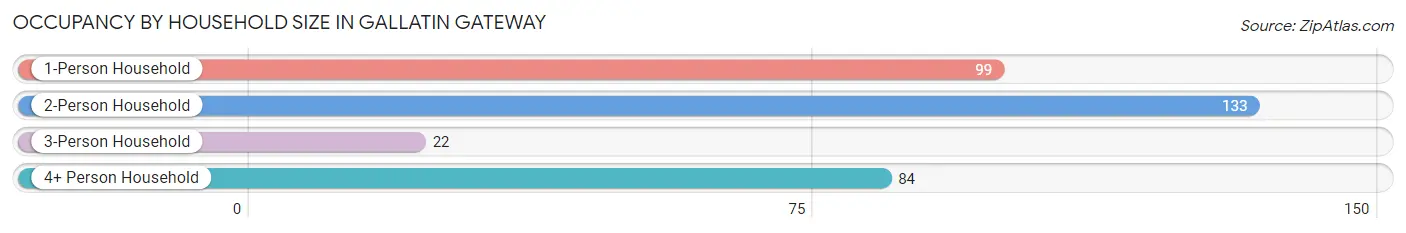
| Household Size | # Housing Units | % Housing Units |
| 1-Person Household | 99 | 29.3% |
| 2-Person Household | 133 | 39.4% |
| 3-Person Household | 22 | 6.5% |
| 4+ Person Household | 84 | 24.8% |
| Total Housing Units | 338 | 100.0% |
Occupancy by Ownership by Household Size in Gallatin Gateway
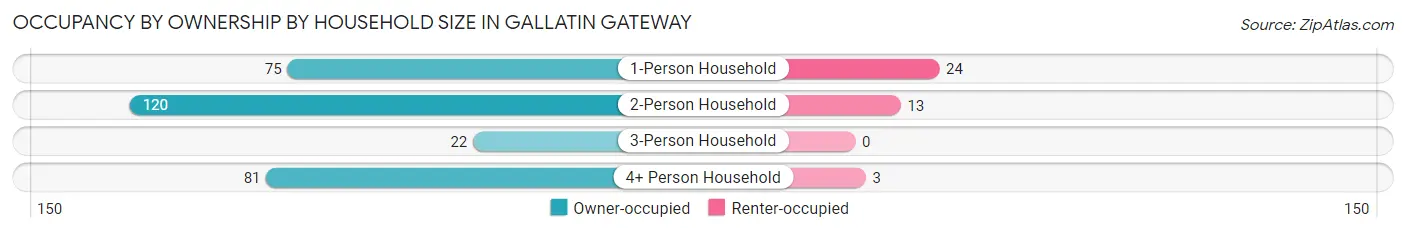
| Household Size | Owner-occupied | Renter-occupied |
| 1-Person Household | 75 (75.8%) | 24 (24.2%) |
| 2-Person Household | 120 (90.2%) | 13 (9.8%) |
| 3-Person Household | 22 (100.0%) | 0 (0.0%) |
| 4+ Person Household | 81 (96.4%) | 3 (3.6%) |
| Total Housing Units | 298 (88.2%) | 40 (11.8%) |
Occupancy by Educational Attainment in Gallatin Gateway
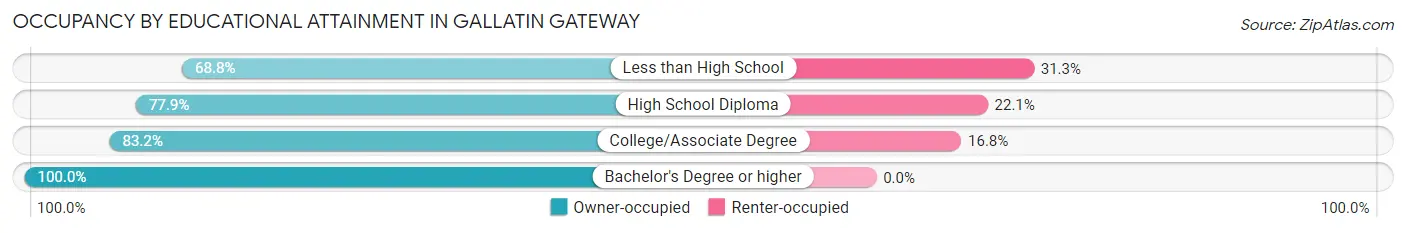
| Household Size | Owner-occupied | Renter-occupied |
| Less than High School | 11 (68.8%) | 5 (31.2%) |
| High School Diploma | 67 (77.9%) | 19 (22.1%) |
| College/Associate Degree | 79 (83.2%) | 16 (16.8%) |
| Bachelor's Degree or higher | 141 (100.0%) | 0 (0.0%) |
Occupancy by Age of Householder in Gallatin Gateway
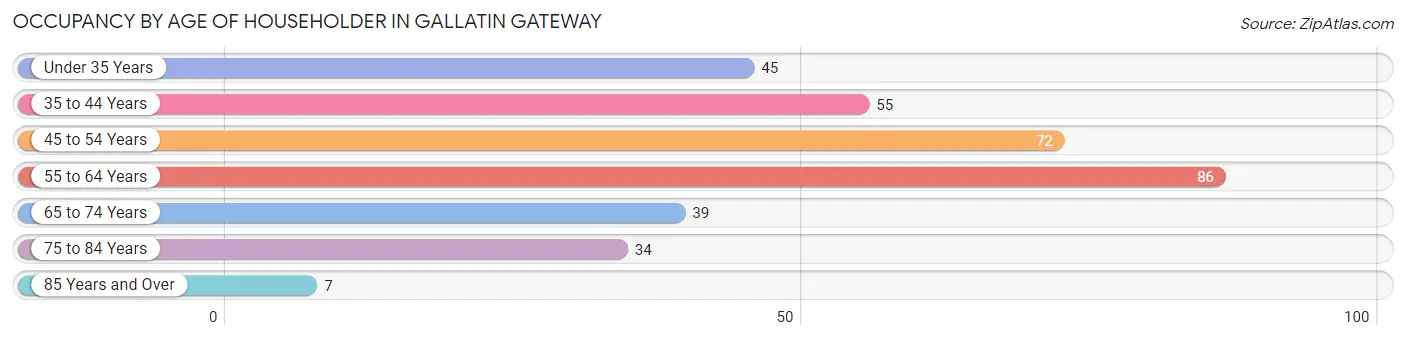
| Age Bracket | # Households | % Households |
| Under 35 Years | 45 | 13.3% |
| 35 to 44 Years | 55 | 16.3% |
| 45 to 54 Years | 72 | 21.3% |
| 55 to 64 Years | 86 | 25.4% |
| 65 to 74 Years | 39 | 11.5% |
| 75 to 84 Years | 34 | 10.1% |
| 85 Years and Over | 7 | 2.1% |
| Total | 338 | 100.0% |
Housing Finances in Gallatin Gateway
Median Income by Occupancy in Gallatin Gateway
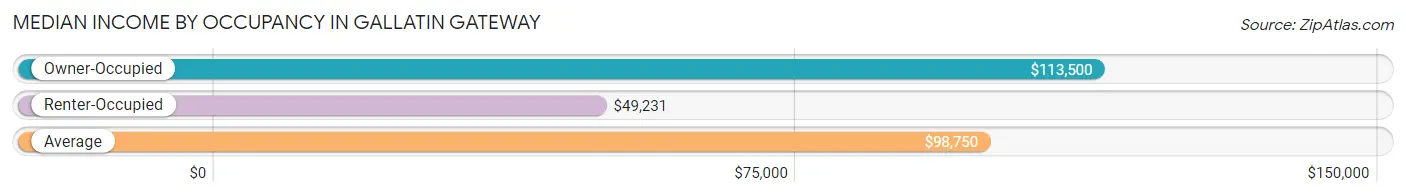
| Occupancy Type | # Households | Median Income |
| Owner-Occupied | 298 (88.2%) | $113,500 |
| Renter-Occupied | 40 (11.8%) | $49,231 |
| Average | 338 (100.0%) | $98,750 |
Occupancy by Householder Income Bracket in Gallatin Gateway
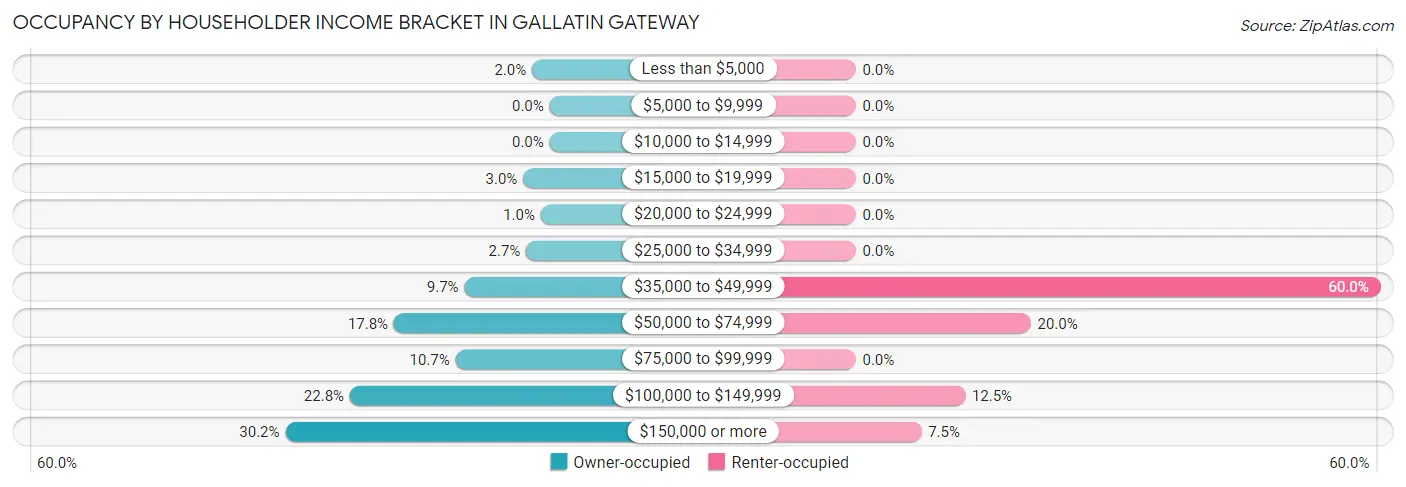
| Income Bracket | Owner-occupied | Renter-occupied |
| Less than $5,000 | 6 (2.0%) | 0 (0.0%) |
| $5,000 to $9,999 | 0 (0.0%) | 0 (0.0%) |
| $10,000 to $14,999 | 0 (0.0%) | 0 (0.0%) |
| $15,000 to $19,999 | 9 (3.0%) | 0 (0.0%) |
| $20,000 to $24,999 | 3 (1.0%) | 0 (0.0%) |
| $25,000 to $34,999 | 8 (2.7%) | 0 (0.0%) |
| $35,000 to $49,999 | 29 (9.7%) | 24 (60.0%) |
| $50,000 to $74,999 | 53 (17.8%) | 8 (20.0%) |
| $75,000 to $99,999 | 32 (10.7%) | 0 (0.0%) |
| $100,000 to $149,999 | 68 (22.8%) | 5 (12.5%) |
| $150,000 or more | 90 (30.2%) | 3 (7.5%) |
| Total | 298 (100.0%) | 40 (100.0%) |
Monthly Housing Cost Tiers in Gallatin Gateway
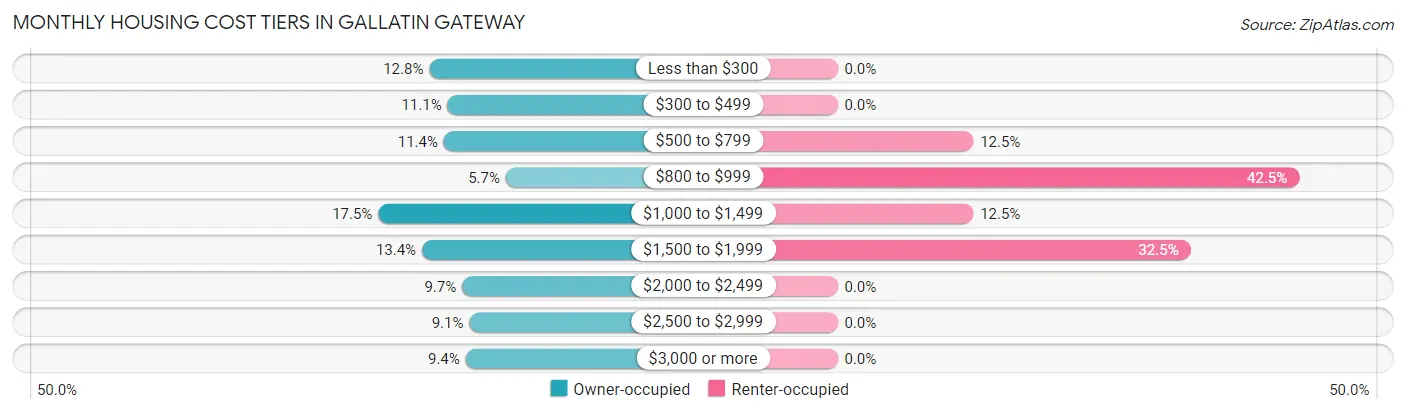
| Monthly Cost | Owner-occupied | Renter-occupied |
| Less than $300 | 38 (12.8%) | 0 (0.0%) |
| $300 to $499 | 33 (11.1%) | 0 (0.0%) |
| $500 to $799 | 34 (11.4%) | 5 (12.5%) |
| $800 to $999 | 17 (5.7%) | 17 (42.5%) |
| $1,000 to $1,499 | 52 (17.4%) | 5 (12.5%) |
| $1,500 to $1,999 | 40 (13.4%) | 13 (32.5%) |
| $2,000 to $2,499 | 29 (9.7%) | 0 (0.0%) |
| $2,500 to $2,999 | 27 (9.1%) | 0 (0.0%) |
| $3,000 or more | 28 (9.4%) | 0 (0.0%) |
| Total | 298 (100.0%) | 40 (100.0%) |
Physical Housing Characteristics in Gallatin Gateway
Housing Structures in Gallatin Gateway
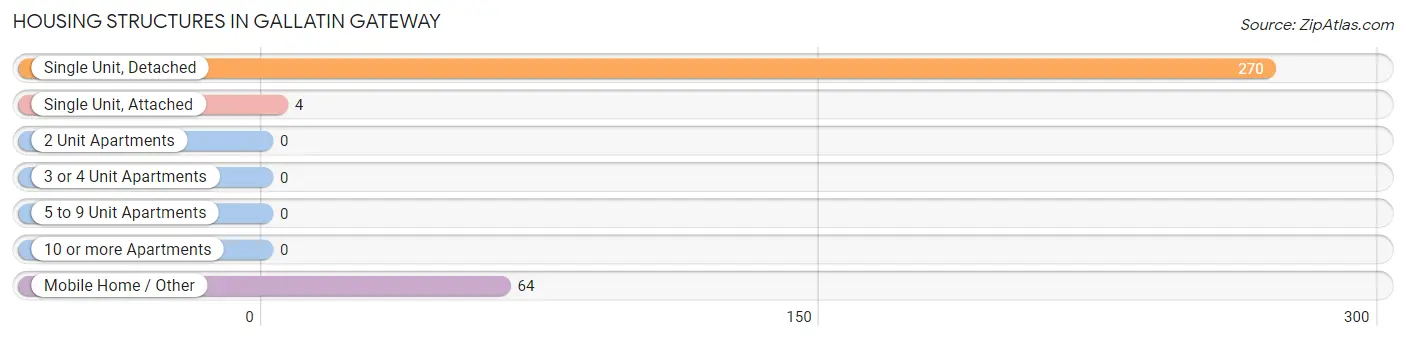
| Structure Type | # Housing Units | % Housing Units |
| Single Unit, Detached | 270 | 79.9% |
| Single Unit, Attached | 4 | 1.2% |
| 2 Unit Apartments | 0 | 0.0% |
| 3 or 4 Unit Apartments | 0 | 0.0% |
| 5 to 9 Unit Apartments | 0 | 0.0% |
| 10 or more Apartments | 0 | 0.0% |
| Mobile Home / Other | 64 | 18.9% |
| Total | 338 | 100.0% |
Housing Structures by Occupancy in Gallatin Gateway
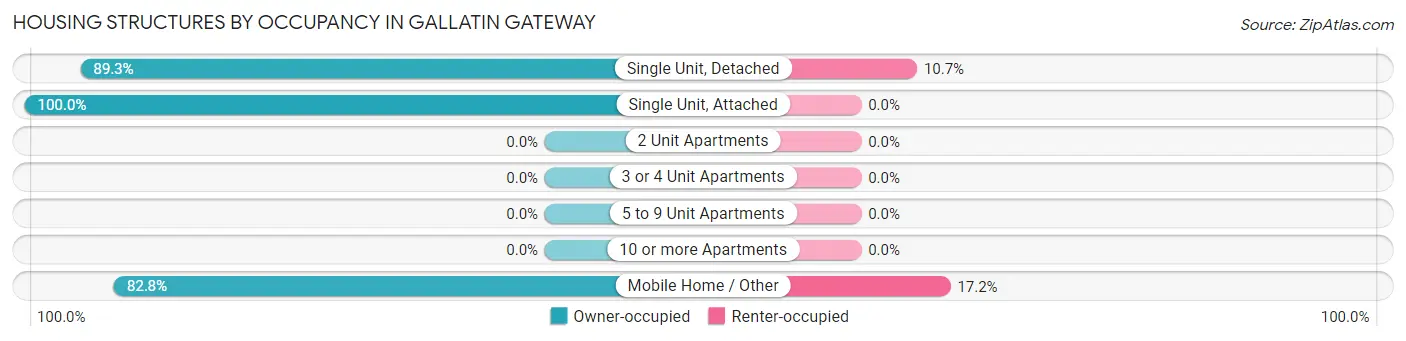
| Structure Type | Owner-occupied | Renter-occupied |
| Single Unit, Detached | 241 (89.3%) | 29 (10.7%) |
| Single Unit, Attached | 4 (100.0%) | 0 (0.0%) |
| 2 Unit Apartments | 0 (0.0%) | 0 (0.0%) |
| 3 or 4 Unit Apartments | 0 (0.0%) | 0 (0.0%) |
| 5 to 9 Unit Apartments | 0 (0.0%) | 0 (0.0%) |
| 10 or more Apartments | 0 (0.0%) | 0 (0.0%) |
| Mobile Home / Other | 53 (82.8%) | 11 (17.2%) |
| Total | 298 (88.2%) | 40 (11.8%) |
Housing Structures by Number of Rooms in Gallatin Gateway
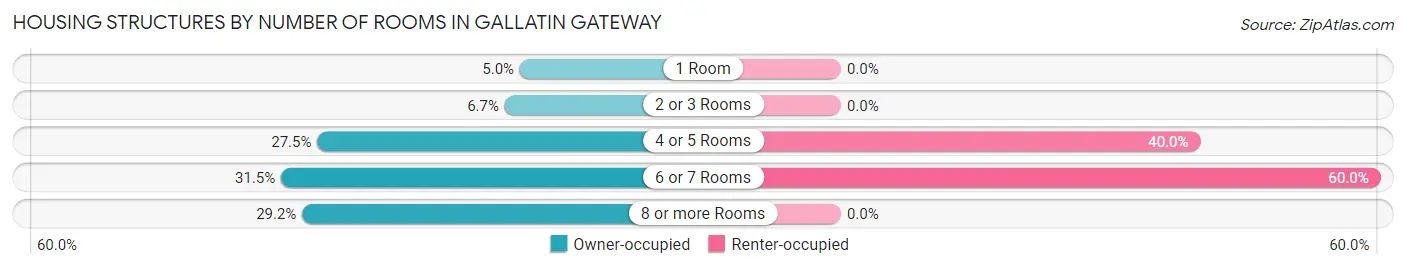
| Number of Rooms | Owner-occupied | Renter-occupied |
| 1 Room | 15 (5.0%) | 0 (0.0%) |
| 2 or 3 Rooms | 20 (6.7%) | 0 (0.0%) |
| 4 or 5 Rooms | 82 (27.5%) | 16 (40.0%) |
| 6 or 7 Rooms | 94 (31.5%) | 24 (60.0%) |
| 8 or more Rooms | 87 (29.2%) | 0 (0.0%) |
| Total | 298 (100.0%) | 40 (100.0%) |
Housing Structure by Heating Type in Gallatin Gateway
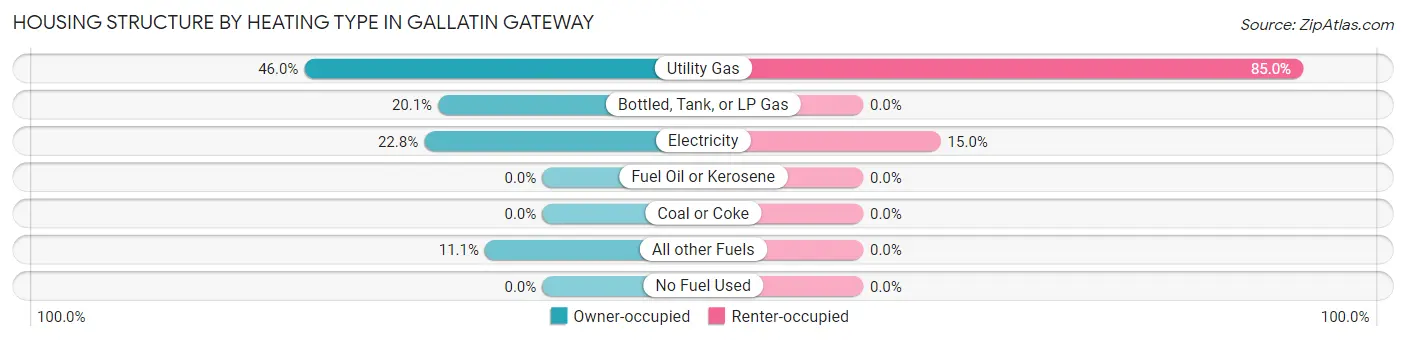
| Heating Type | Owner-occupied | Renter-occupied |
| Utility Gas | 137 (46.0%) | 34 (85.0%) |
| Bottled, Tank, or LP Gas | 60 (20.1%) | 0 (0.0%) |
| Electricity | 68 (22.8%) | 6 (15.0%) |
| Fuel Oil or Kerosene | 0 (0.0%) | 0 (0.0%) |
| Coal or Coke | 0 (0.0%) | 0 (0.0%) |
| All other Fuels | 33 (11.1%) | 0 (0.0%) |
| No Fuel Used | 0 (0.0%) | 0 (0.0%) |
| Total | 298 (100.0%) | 40 (100.0%) |
Household Vehicle Usage in Gallatin Gateway
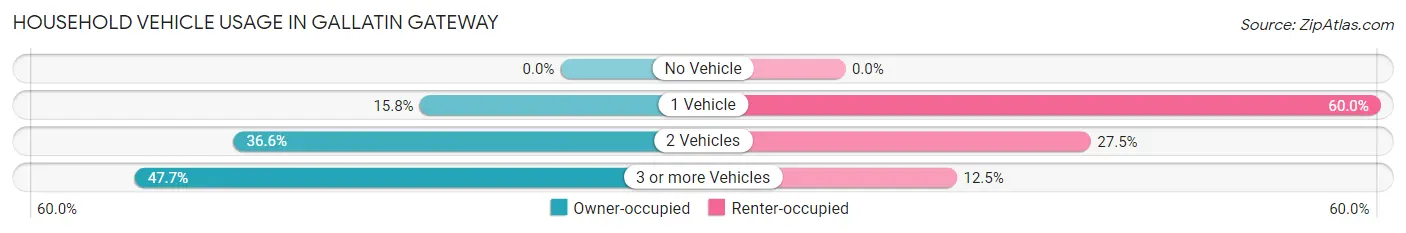
| Vehicles per Household | Owner-occupied | Renter-occupied |
| No Vehicle | 0 (0.0%) | 0 (0.0%) |
| 1 Vehicle | 47 (15.8%) | 24 (60.0%) |
| 2 Vehicles | 109 (36.6%) | 11 (27.5%) |
| 3 or more Vehicles | 142 (47.6%) | 5 (12.5%) |
| Total | 298 (100.0%) | 40 (100.0%) |
Real Estate & Mortgages in Gallatin Gateway
Real Estate and Mortgage Overview in Gallatin Gateway
| Characteristic | Without Mortgage | With Mortgage |
| Housing Units | 137 | 161 |
| Median Property Value | $504,200 | $629,200 |
| Median Household Income | $60,469 | $73 |
| Monthly Housing Costs | $517 | $28 |
| Real Estate Taxes | $2,485 | $0 |
Property Value by Mortgage Status in Gallatin Gateway
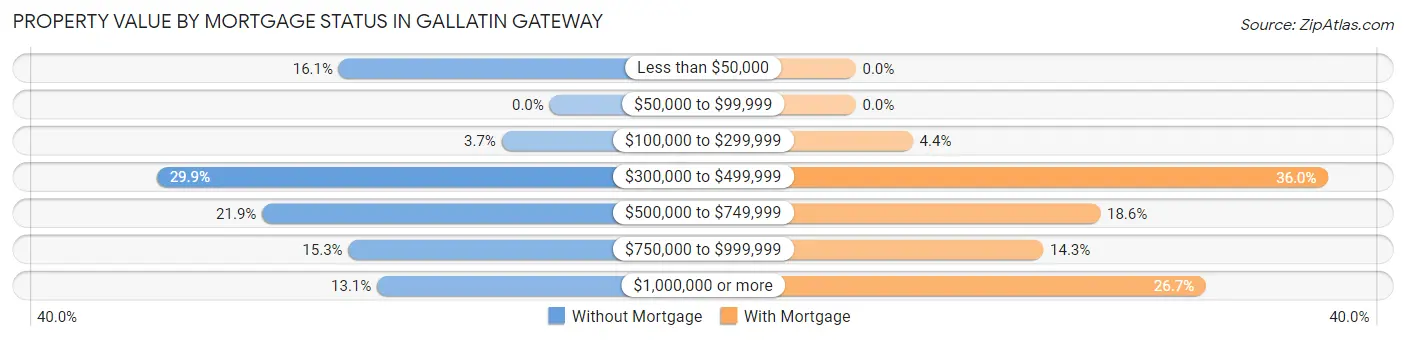
| Property Value | Without Mortgage | With Mortgage |
| Less than $50,000 | 22 (16.1%) | 0 (0.0%) |
| $50,000 to $99,999 | 0 (0.0%) | 0 (0.0%) |
| $100,000 to $299,999 | 5 (3.6%) | 7 (4.3%) |
| $300,000 to $499,999 | 41 (29.9%) | 58 (36.0%) |
| $500,000 to $749,999 | 30 (21.9%) | 30 (18.6%) |
| $750,000 to $999,999 | 21 (15.3%) | 23 (14.3%) |
| $1,000,000 or more | 18 (13.1%) | 43 (26.7%) |
| Total | 137 (100.0%) | 161 (100.0%) |
Household Income by Mortgage Status in Gallatin Gateway
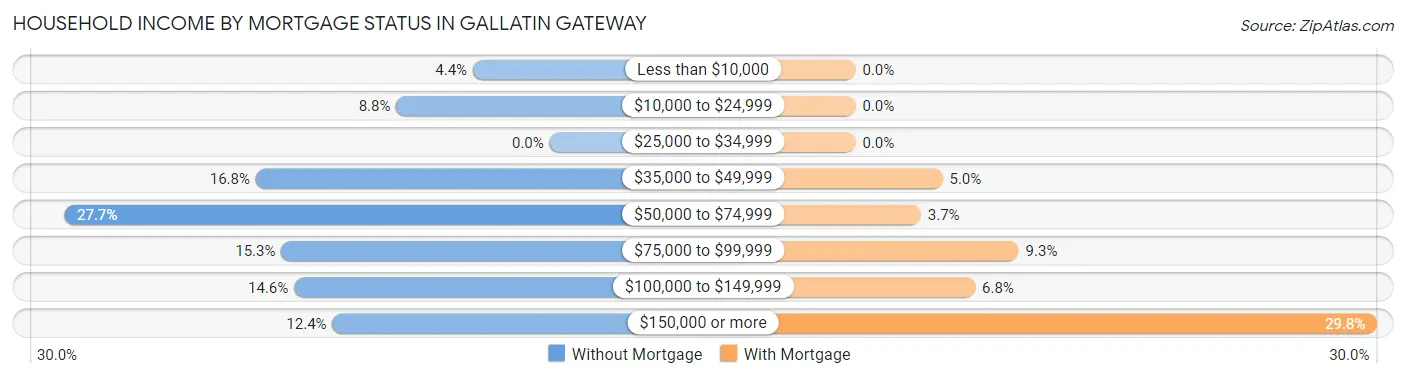
| Household Income | Without Mortgage | With Mortgage |
| Less than $10,000 | 6 (4.4%) | 0 (0.0%) |
| $10,000 to $24,999 | 12 (8.8%) | 0 (0.0%) |
| $25,000 to $34,999 | 0 (0.0%) | 0 (0.0%) |
| $35,000 to $49,999 | 23 (16.8%) | 8 (5.0%) |
| $50,000 to $74,999 | 38 (27.7%) | 6 (3.7%) |
| $75,000 to $99,999 | 21 (15.3%) | 15 (9.3%) |
| $100,000 to $149,999 | 20 (14.6%) | 11 (6.8%) |
| $150,000 or more | 17 (12.4%) | 48 (29.8%) |
| Total | 137 (100.0%) | 161 (100.0%) |
Property Value to Household Income Ratio in Gallatin Gateway
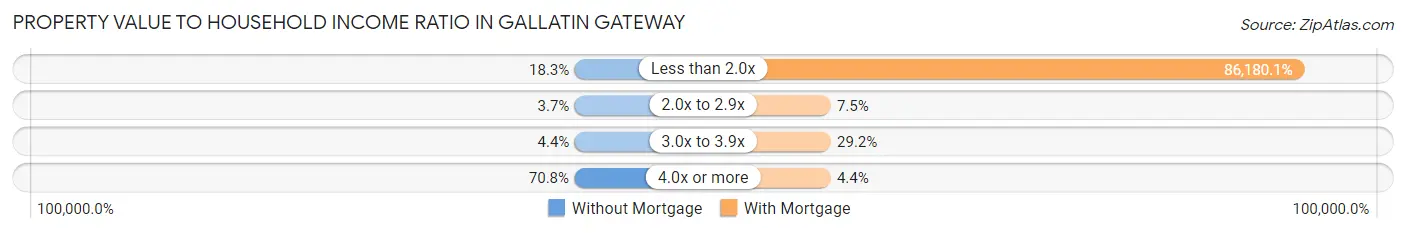
| Value-to-Income Ratio | Without Mortgage | With Mortgage |
| Less than 2.0x | 25 (18.2%) | 138,750 (86,180.1%) |
| 2.0x to 2.9x | 5 (3.6%) | 12 (7.4%) |
| 3.0x to 3.9x | 6 (4.4%) | 47 (29.2%) |
| 4.0x or more | 97 (70.8%) | 7 (4.3%) |
| Total | 137 (100.0%) | 161 (100.0%) |
Real Estate Taxes by Mortgage Status in Gallatin Gateway
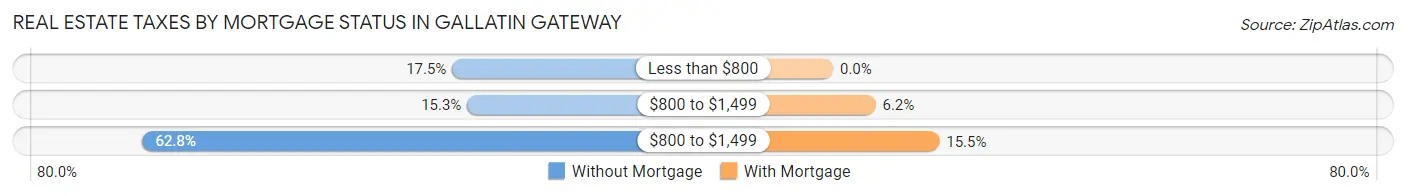
| Property Taxes | Without Mortgage | With Mortgage |
| Less than $800 | 24 (17.5%) | 0 (0.0%) |
| $800 to $1,499 | 21 (15.3%) | 10 (6.2%) |
| $800 to $1,499 | 86 (62.8%) | 25 (15.5%) |
| Total | 137 (100.0%) | 161 (100.0%) |
Health & Disability in Gallatin Gateway
Health Insurance Coverage by Age in Gallatin Gateway
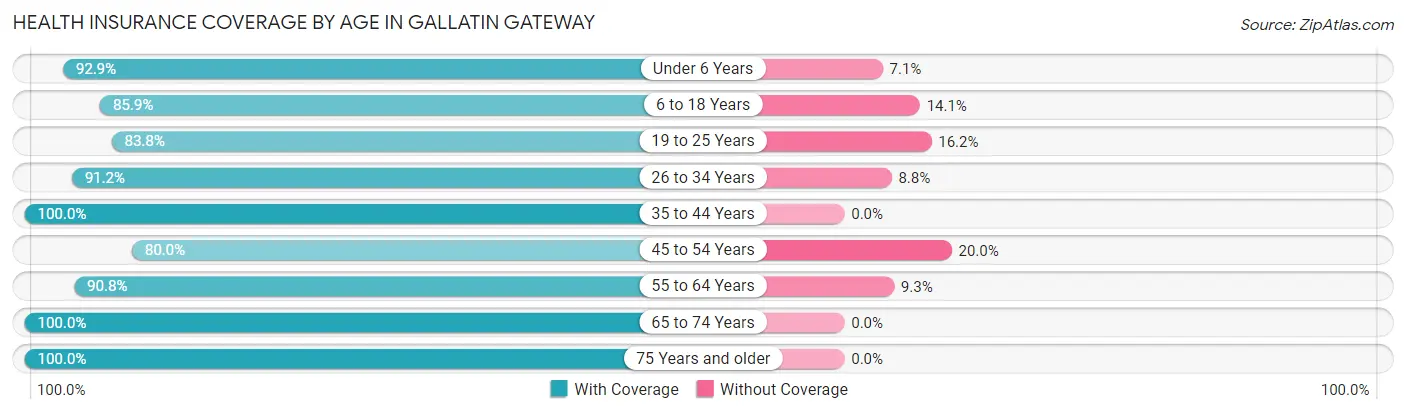
| Age Bracket | With Coverage | Without Coverage |
| Under 6 Years | 78 (92.9%) | 6 (7.1%) |
| 6 to 18 Years | 110 (85.9%) | 18 (14.1%) |
| 19 to 25 Years | 31 (83.8%) | 6 (16.2%) |
| 26 to 34 Years | 83 (91.2%) | 8 (8.8%) |
| 35 to 44 Years | 115 (100.0%) | 0 (0.0%) |
| 45 to 54 Years | 88 (80.0%) | 22 (20.0%) |
| 55 to 64 Years | 157 (90.7%) | 16 (9.2%) |
| 65 to 74 Years | 78 (100.0%) | 0 (0.0%) |
| 75 Years and older | 70 (100.0%) | 0 (0.0%) |
| Total | 810 (91.4%) | 76 (8.6%) |
Health Insurance Coverage by Citizenship Status in Gallatin Gateway
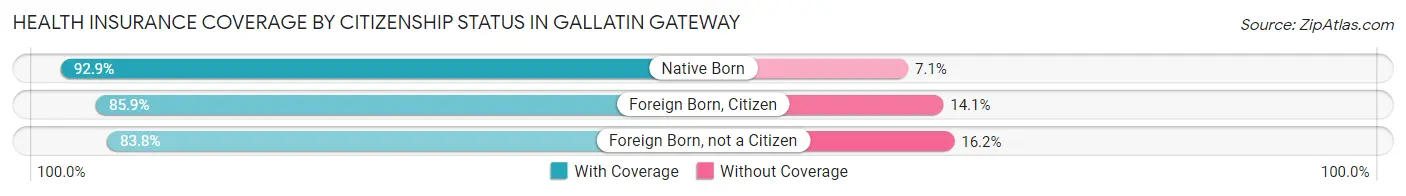
| Citizenship Status | With Coverage | Without Coverage |
| Native Born | 78 (92.9%) | 6 (7.1%) |
| Foreign Born, Citizen | 110 (85.9%) | 18 (14.1%) |
| Foreign Born, not a Citizen | 31 (83.8%) | 6 (16.2%) |
Health Insurance Coverage by Household Income in Gallatin Gateway
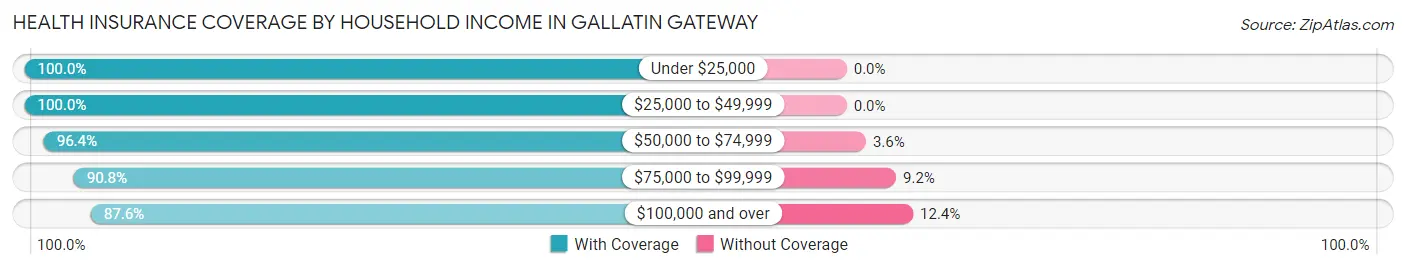
| Household Income | With Coverage | Without Coverage |
| Under $25,000 | 44 (100.0%) | 0 (0.0%) |
| $25,000 to $49,999 | 115 (100.0%) | 0 (0.0%) |
| $50,000 to $74,999 | 134 (96.4%) | 5 (3.6%) |
| $75,000 to $99,999 | 59 (90.8%) | 6 (9.2%) |
| $100,000 and over | 458 (87.6%) | 65 (12.4%) |
Public vs Private Health Insurance Coverage by Age in Gallatin Gateway
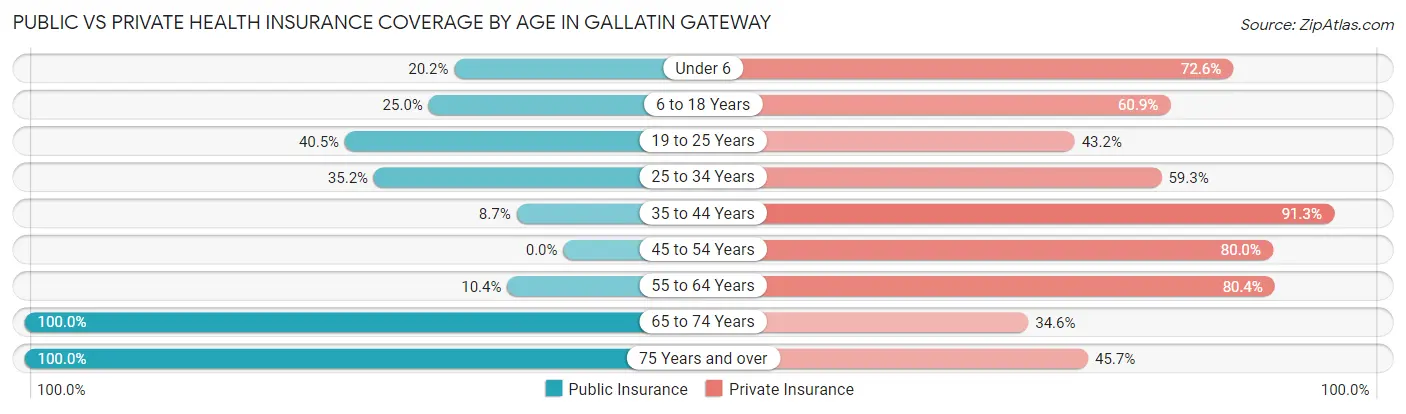
| Age Bracket | Public Insurance | Private Insurance |
| Under 6 | 17 (20.2%) | 61 (72.6%) |
| 6 to 18 Years | 32 (25.0%) | 78 (60.9%) |
| 19 to 25 Years | 15 (40.5%) | 16 (43.2%) |
| 25 to 34 Years | 32 (35.2%) | 54 (59.3%) |
| 35 to 44 Years | 10 (8.7%) | 105 (91.3%) |
| 45 to 54 Years | 0 (0.0%) | 88 (80.0%) |
| 55 to 64 Years | 18 (10.4%) | 139 (80.3%) |
| 65 to 74 Years | 78 (100.0%) | 27 (34.6%) |
| 75 Years and over | 70 (100.0%) | 32 (45.7%) |
| Total | 272 (30.7%) | 600 (67.7%) |
Disability Status by Sex by Age in Gallatin Gateway
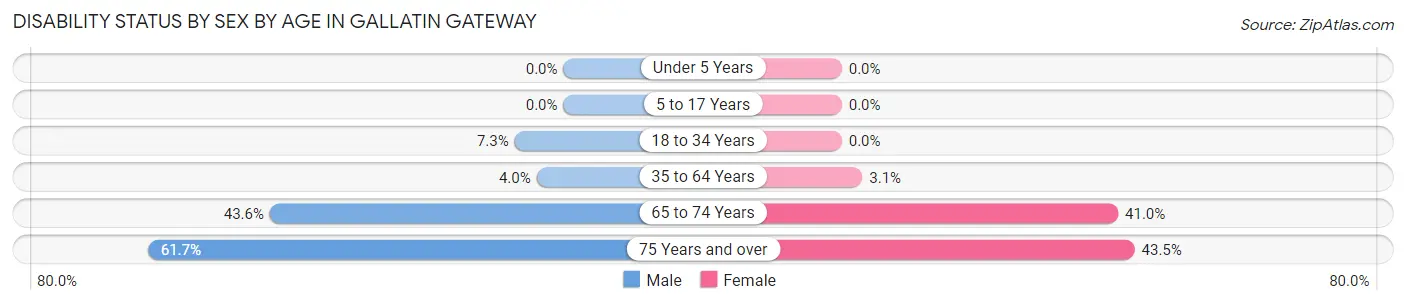
| Age Bracket | Male | Female |
| Under 5 Years | 0 (0.0%) | 0 (0.0%) |
| 5 to 17 Years | 0 (0.0%) | 0 (0.0%) |
| 18 to 34 Years | 5 (7.2%) | 0 (0.0%) |
| 35 to 64 Years | 8 (4.0%) | 6 (3.0%) |
| 65 to 74 Years | 17 (43.6%) | 16 (41.0%) |
| 75 Years and over | 29 (61.7%) | 10 (43.5%) |
Disability Class by Sex by Age in Gallatin Gateway
Disability Class: Hearing Difficulty
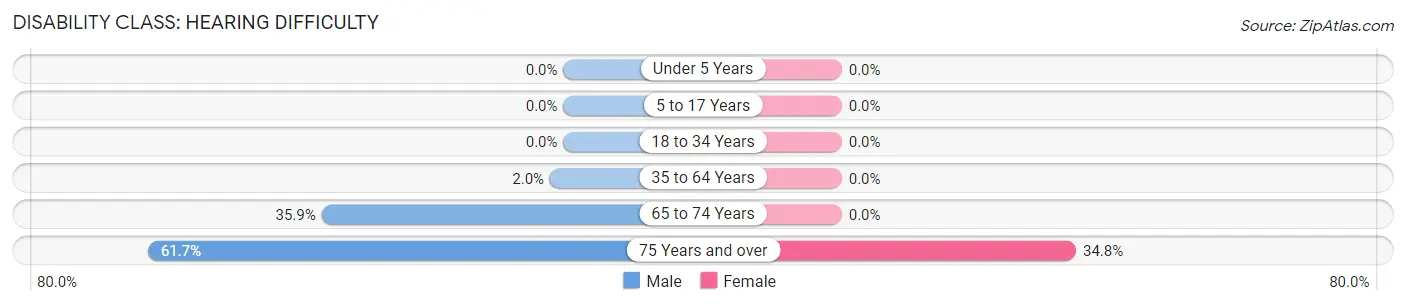
| Age Bracket | Male | Female |
| Under 5 Years | 0 (0.0%) | 0 (0.0%) |
| 5 to 17 Years | 0 (0.0%) | 0 (0.0%) |
| 18 to 34 Years | 0 (0.0%) | 0 (0.0%) |
| 35 to 64 Years | 4 (2.0%) | 0 (0.0%) |
| 65 to 74 Years | 14 (35.9%) | 0 (0.0%) |
| 75 Years and over | 29 (61.7%) | 8 (34.8%) |
Disability Class: Vision Difficulty
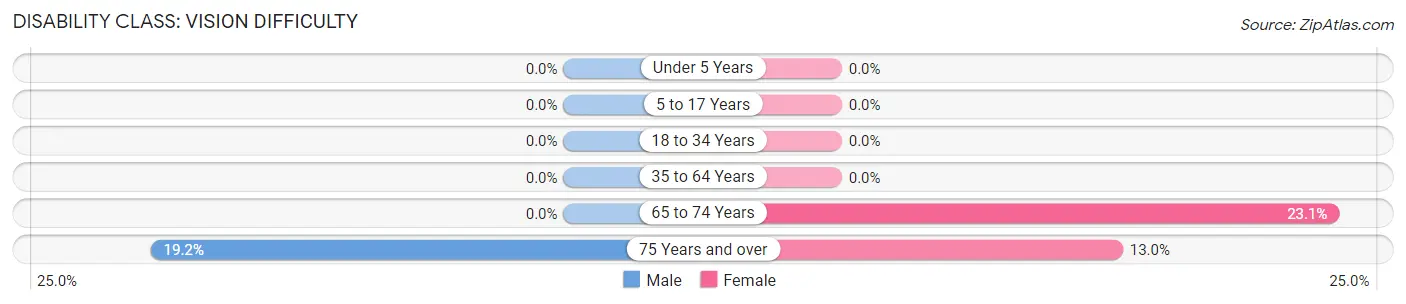
| Age Bracket | Male | Female |
| Under 5 Years | 0 (0.0%) | 0 (0.0%) |
| 5 to 17 Years | 0 (0.0%) | 0 (0.0%) |
| 18 to 34 Years | 0 (0.0%) | 0 (0.0%) |
| 35 to 64 Years | 0 (0.0%) | 0 (0.0%) |
| 65 to 74 Years | 0 (0.0%) | 9 (23.1%) |
| 75 Years and over | 9 (19.2%) | 3 (13.0%) |
Disability Class: Cognitive Difficulty
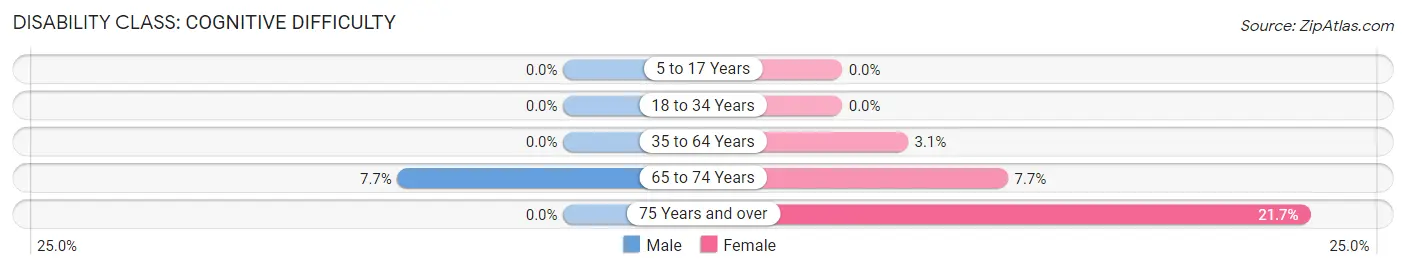
| Age Bracket | Male | Female |
| 5 to 17 Years | 0 (0.0%) | 0 (0.0%) |
| 18 to 34 Years | 0 (0.0%) | 0 (0.0%) |
| 35 to 64 Years | 0 (0.0%) | 6 (3.0%) |
| 65 to 74 Years | 3 (7.7%) | 3 (7.7%) |
| 75 Years and over | 0 (0.0%) | 5 (21.7%) |
Disability Class: Ambulatory Difficulty
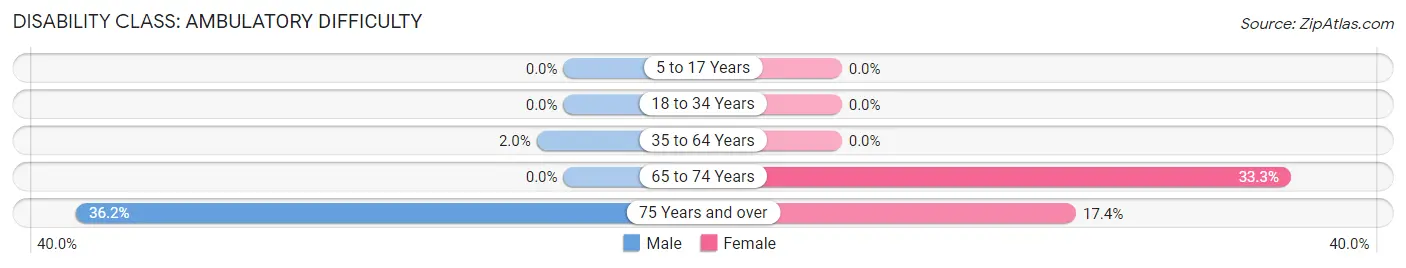
| Age Bracket | Male | Female |
| 5 to 17 Years | 0 (0.0%) | 0 (0.0%) |
| 18 to 34 Years | 0 (0.0%) | 0 (0.0%) |
| 35 to 64 Years | 4 (2.0%) | 0 (0.0%) |
| 65 to 74 Years | 0 (0.0%) | 13 (33.3%) |
| 75 Years and over | 17 (36.2%) | 4 (17.4%) |
Disability Class: Self-Care Difficulty
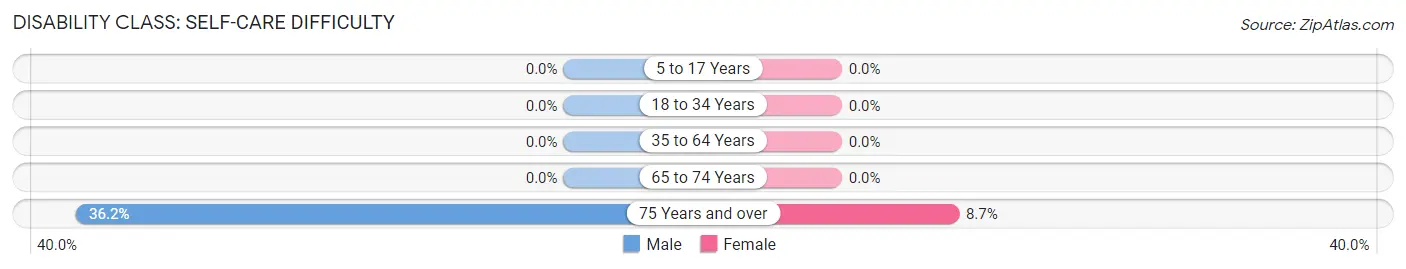
| Age Bracket | Male | Female |
| 5 to 17 Years | 0 (0.0%) | 0 (0.0%) |
| 18 to 34 Years | 0 (0.0%) | 0 (0.0%) |
| 35 to 64 Years | 0 (0.0%) | 0 (0.0%) |
| 65 to 74 Years | 0 (0.0%) | 0 (0.0%) |
| 75 Years and over | 17 (36.2%) | 2 (8.7%) |
Technology Access in Gallatin Gateway
Computing Device Access in Gallatin Gateway
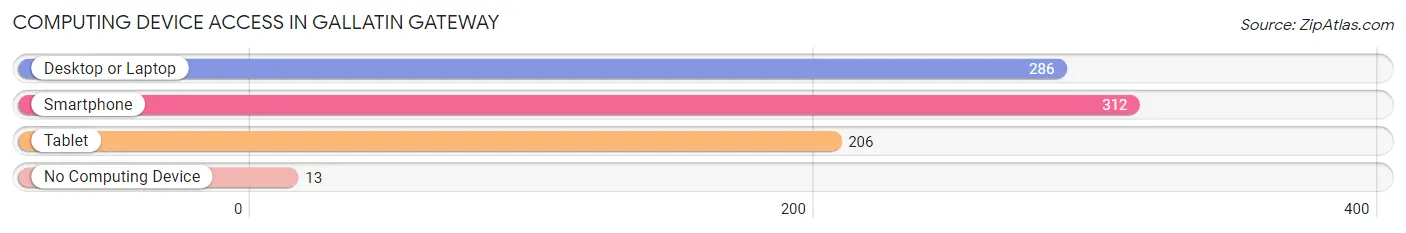
| Device Type | # Households | % Households |
| Desktop or Laptop | 286 | 84.6% |
| Smartphone | 312 | 92.3% |
| Tablet | 206 | 61.0% |
| No Computing Device | 13 | 3.8% |
| Total | 338 | 100.0% |
Internet Access in Gallatin Gateway
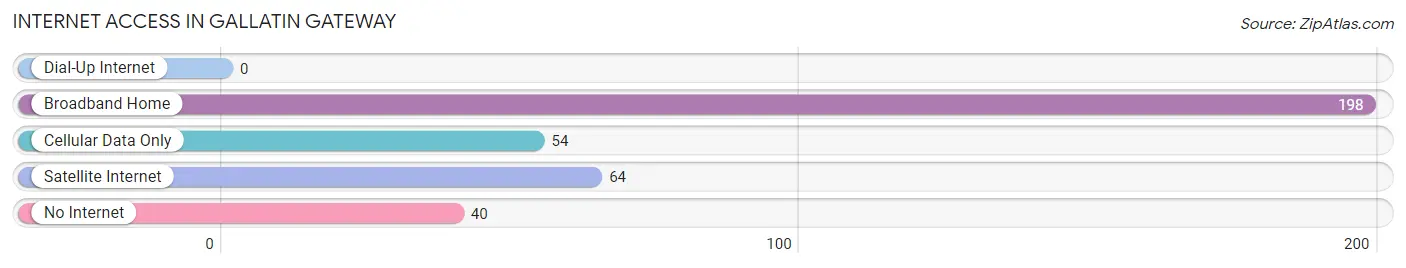
| Internet Type | # Households | % Households |
| Dial-Up Internet | 0 | 0.0% |
| Broadband Home | 198 | 58.6% |
| Cellular Data Only | 54 | 16.0% |
| Satellite Internet | 64 | 18.9% |
| No Internet | 40 | 11.8% |
| Total | 338 | 100.0% |
Gallatin Gateway Summary
History
The area now known as Gallatin Gateway, Montana was first inhabited by the Salish and Kootenai tribes. The first European settlers arrived in the area in the early 1800s, and the first permanent settlement was established in 1864. The settlement was named Gallatin Gateway after the nearby Gallatin River.
The area was originally used for ranching and farming, and the first post office was established in 1883. In the early 1900s, the area began to develop as a tourist destination, with the construction of the Yellowstone Trail, a scenic highway that ran through the area.
In the 1920s, the area began to develop as a ski resort, with the construction of the Big Sky Ski Resort. The resort was a popular destination for skiers from all over the country, and it helped to put Gallatin Gateway on the map.
In the 1950s, the area began to develop as a residential community, with the construction of several subdivisions. The population of the area began to grow, and by the 2000 census, the population was 1,845.
Geography
Gallatin Gateway is located in southwestern Montana, in the Gallatin Valley. The area is bordered by the Gallatin River to the north, the Madison River to the east, and the Yellowstone River to the south. The area is part of the Greater Yellowstone Ecosystem, and is home to a variety of wildlife, including elk, deer, bighorn sheep, and grizzly bears.
The area is characterized by rolling hills, with elevations ranging from 4,000 to 8,000 feet. The climate is semi-arid, with hot summers and cold winters. The average annual precipitation is 16 inches, and the average annual temperature is 44 degrees Fahrenheit.
Economy
The economy of Gallatin Gateway is largely based on tourism. The area is home to the Big Sky Ski Resort, which is a popular destination for skiers from all over the country. The resort also offers a variety of other activities, such as snowmobiling, snowshoeing, and hiking.
The area is also home to several other tourist attractions, including the Yellowstone National Park, the Madison River, and the Gallatin River. The area is also home to several wineries, breweries, and distilleries, which attract visitors from all over the world.
The area is also home to several businesses, including restaurants, retail stores, and lodging. The area is also home to several manufacturing companies, including a paper mill and a wood products plant.
Demographics
As of the 2000 census, the population of Gallatin Gateway was 1,845. The racial makeup of the area was 97.3% White, 0.2% African American, 0.7% Native American, 0.3% Asian, 0.1% Pacific Islander, 0.3% from other races, and 1.2% from two or more races.
The median income for a household in the area was $41,250, and the median income for a family was $50,000. The per capita income for the area was $21,945. The unemployment rate was 4.2%.
Conclusion
Gallatin Gateway, Montana is a small town located in the Gallatin Valley of southwestern Montana. The area is home to the Big Sky Ski Resort, which is a popular destination for skiers from all over the country. The area is also home to several other tourist attractions, including the Yellowstone National Park, the Madison River, and the Gallatin River. The economy of the area is largely based on tourism, and the area is also home to several businesses, including restaurants, retail stores, and lodging. The population of the area was 1,845 as of the 2000 census, and the median income for a household was $41,250.
Common Questions
What is Per Capita Income in Gallatin Gateway?
Per Capita income in Gallatin Gateway is $49,248.
What is the Median Family Income in Gallatin Gateway?
Median Family Income in Gallatin Gateway is $137,663.
What is the Median Household income in Gallatin Gateway?
Median Household Income in Gallatin Gateway is $98,750.
What is Income or Wage Gap in Gallatin Gateway?
Income or Wage Gap in Gallatin Gateway is 17.8%.
Women in Gallatin Gateway earn 82.2 cents for every dollar earned by a man.
What is Inequality or Gini Index in Gallatin Gateway?
Inequality or Gini Index in Gallatin Gateway is 0.42.
What is the Total Population of Gallatin Gateway?
Total Population of Gallatin Gateway is 886.
What is the Total Male Population of Gallatin Gateway?
Total Male Population of Gallatin Gateway is 484.
What is the Total Female Population of Gallatin Gateway?
Total Female Population of Gallatin Gateway is 402.
What is the Ratio of Males per 100 Females in Gallatin Gateway?
There are 120.40 Males per 100 Females in Gallatin Gateway.
What is the Ratio of Females per 100 Males in Gallatin Gateway?
There are 83.06 Females per 100 Males in Gallatin Gateway.
What is the Median Population Age in Gallatin Gateway?
Median Population Age in Gallatin Gateway is 43.4 Years.
What is the Average Family Size in Gallatin Gateway
Average Family Size in Gallatin Gateway is 3.4 People.
What is the Average Household Size in Gallatin Gateway
Average Household Size in Gallatin Gateway is 2.6 People.
How Large is the Labor Force in Gallatin Gateway?
There are 423 People in the Labor Forcein in Gallatin Gateway.
What is the Percentage of People in the Labor Force in Gallatin Gateway?
61.2% of People are in the Labor Force in Gallatin Gateway.
What is the Unemployment Rate in Gallatin Gateway?
Unemployment Rate in Gallatin Gateway is 4.5%.