Goldfield, NV Map & Demographics
Goldfield Map
Goldfield Overview
$41,050
PER CAPITA INCOME
$140,987
AVG FAMILY INCOME
1.7%
WAGE / INCOME GAP [ % ]
98.3¢/ $1
WAGE / INCOME GAP [ $ ]
0.36
INEQUALITY / GINI INDEX
212
TOTAL POPULATION
112
MALE POPULATION
100
FEMALE POPULATION
112.00
MALES / 100 FEMALES
89.29
FEMALES / 100 MALES
58.5
MEDIAN AGE
2.2
AVG FAMILY SIZE
1.9
AVG HOUSEHOLD SIZE
88
LABOR FORCE [ PEOPLE ]
42.3%
PERCENT IN LABOR FORCE
9.1%
UNEMPLOYMENT RATE
Goldfield Zip Codes
Goldfield Area Codes
Income in Goldfield
Income Overview in Goldfield
| Characteristic | Number | Measure |
| Per Capita Income | 212 | $41,050 |
| Median Family Income | 61 | $140,987 |
| Mean Family Income | 61 | $117,893 |
| Median Household Income | 105 | $0 |
| Mean Household Income | 105 | $84,551 |
| Income Deficit | 61 | $0 |
| Wage / Income Gap (%) | 212 | 1.66% |
| Wage / Income Gap ($) | 212 | 98.34¢ per $1 |
| Gini / Inequality Index | 212 | 0.36 |
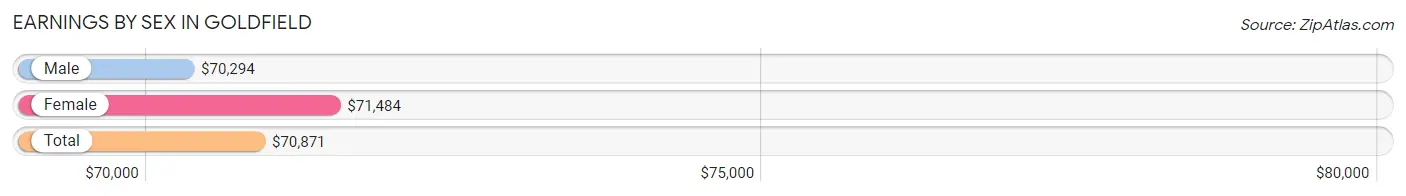
Earnings by Sex in Goldfield
Average Earnings in Goldfield are $70,871, $70,294 for men and $71,484 for women, a difference of 1.7%.
| Sex | Number | Average Earnings |
| Male | 38 (42.7%) | $70,294 |
| Female | 51 (57.3%) | $71,484 |
| Total | 89 (100.0%) | $70,871 |
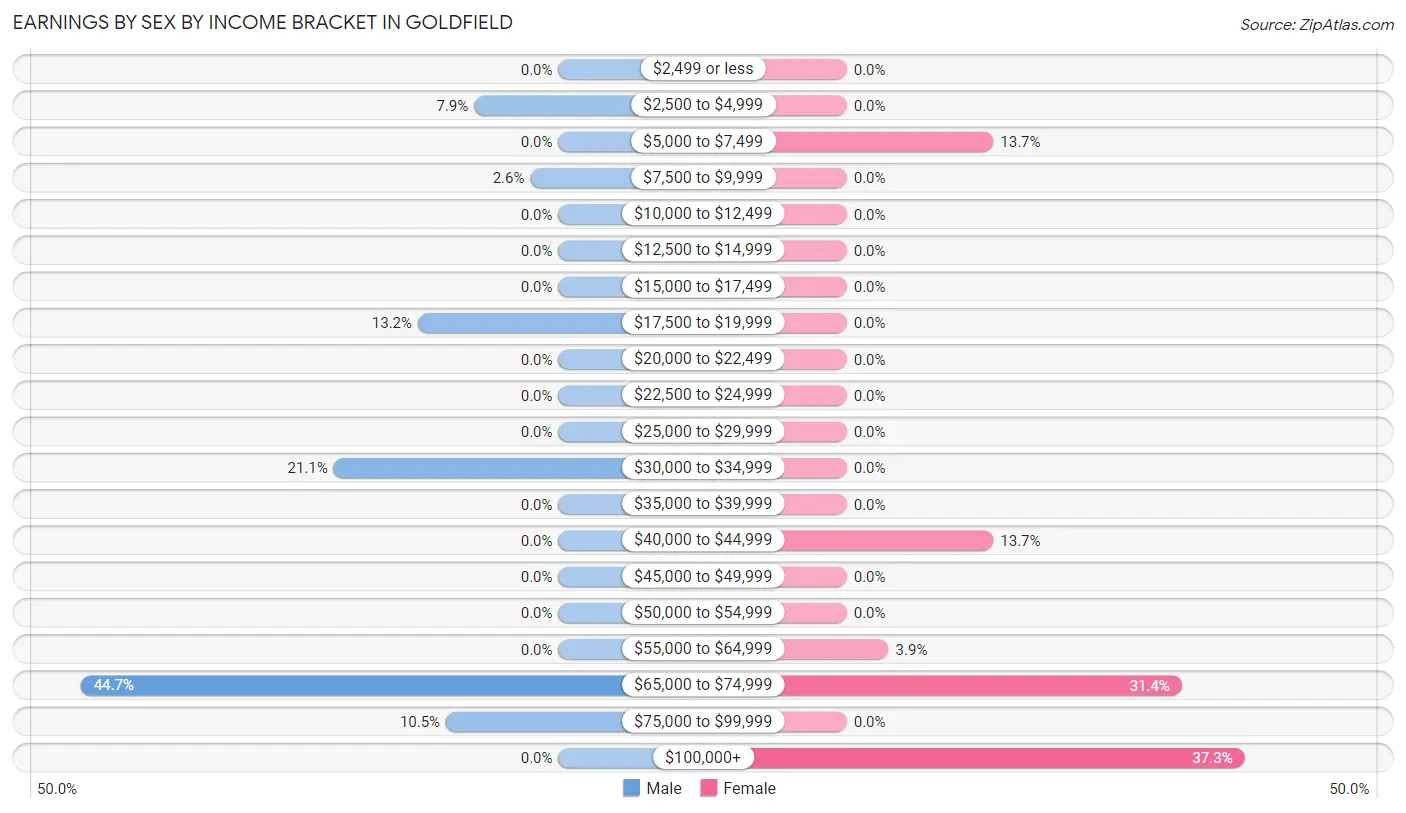
Earnings by Sex by Income Bracket in Goldfield
The most common earnings brackets in Goldfield are $65,000 to $74,999 for men (17 | 44.7%) and $100,000+ for women (19 | 37.2%).
| Income | Male | Female |
| $2,499 or less | 0 (0.0%) | 0 (0.0%) |
| $2,500 to $4,999 | 3 (7.9%) | 0 (0.0%) |
| $5,000 to $7,499 | 0 (0.0%) | 7 (13.7%) |
| $7,500 to $9,999 | 1 (2.6%) | 0 (0.0%) |
| $10,000 to $12,499 | 0 (0.0%) | 0 (0.0%) |
| $12,500 to $14,999 | 0 (0.0%) | 0 (0.0%) |
| $15,000 to $17,499 | 0 (0.0%) | 0 (0.0%) |
| $17,500 to $19,999 | 5 (13.2%) | 0 (0.0%) |
| $20,000 to $22,499 | 0 (0.0%) | 0 (0.0%) |
| $22,500 to $24,999 | 0 (0.0%) | 0 (0.0%) |
| $25,000 to $29,999 | 0 (0.0%) | 0 (0.0%) |
| $30,000 to $34,999 | 8 (21.0%) | 0 (0.0%) |
| $35,000 to $39,999 | 0 (0.0%) | 0 (0.0%) |
| $40,000 to $44,999 | 0 (0.0%) | 7 (13.7%) |
| $45,000 to $49,999 | 0 (0.0%) | 0 (0.0%) |
| $50,000 to $54,999 | 0 (0.0%) | 0 (0.0%) |
| $55,000 to $64,999 | 0 (0.0%) | 2 (3.9%) |
| $65,000 to $74,999 | 17 (44.7%) | 16 (31.4%) |
| $75,000 to $99,999 | 4 (10.5%) | 0 (0.0%) |
| $100,000+ | 0 (0.0%) | 19 (37.2%) |
| Total | 38 (100.0%) | 51 (100.0%) |
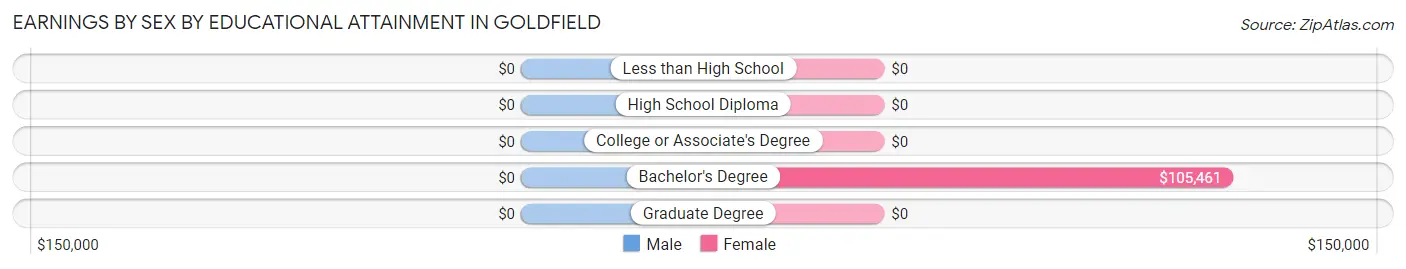
Earnings by Sex by Educational Attainment in Goldfield
| Educational Attainment | Male Income | Female Income |
| Less than High School | - | - |
| High School Diploma | - | - |
| College or Associate's Degree | - | - |
| Bachelor's Degree | - | - |
| Graduate Degree | - | - |
| Total | $70,294 | $71,484 |
Family Income in Goldfield
Family Income Brackets in Goldfield
According to the Goldfield family income data, there are 45 families falling into the $100,000 to $149,999 income range, which is the most common income bracket and makes up 73.8% of all families.
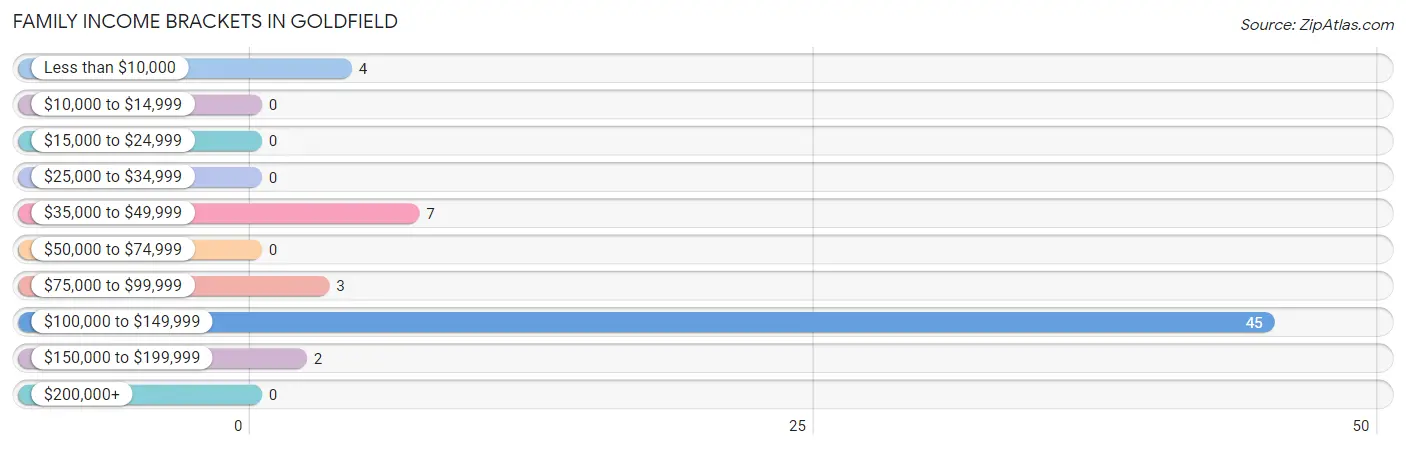
| Income Bracket | # Families | % Families |
| Less than $10,000 | 4 | 6.6% |
| $10,000 to $14,999 | 0 | 0.0% |
| $15,000 to $24,999 | 0 | 0.0% |
| $25,000 to $34,999 | 0 | 0.0% |
| $35,000 to $49,999 | 7 | 11.5% |
| $50,000 to $74,999 | 0 | 0.0% |
| $75,000 to $99,999 | 3 | 4.9% |
| $100,000 to $149,999 | 45 | 73.8% |
| $150,000 to $199,999 | 2 | 3.3% |
| $200,000+ | 0 | 0.0% |
Family Income by Famaliy Size in Goldfield
2-person families (48 | 78.7%) account for the highest median family income in Goldfield with $141,579 per family, while 2-person families (48 | 78.7%) have the highest median income of $70,790 per family member.
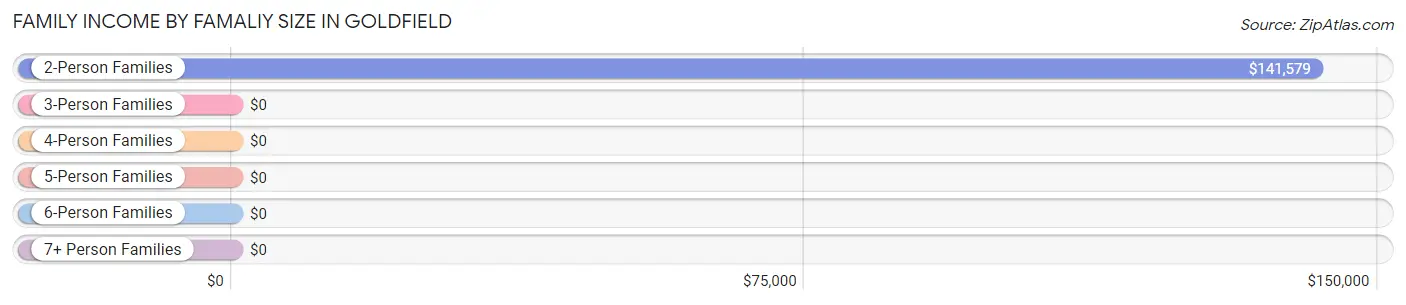
| Income Bracket | # Families | Median Income |
| 2-Person Families | 48 (78.7%) | $141,579 |
| 3-Person Families | 6 (9.8%) | $0 |
| 4-Person Families | 7 (11.5%) | $0 |
| 5-Person Families | 0 (0.0%) | $0 |
| 6-Person Families | 0 (0.0%) | $0 |
| 7+ Person Families | 0 (0.0%) | $0 |
| Total | 61 (100.0%) | $140,987 |
Family Income by Number of Earners in Goldfield
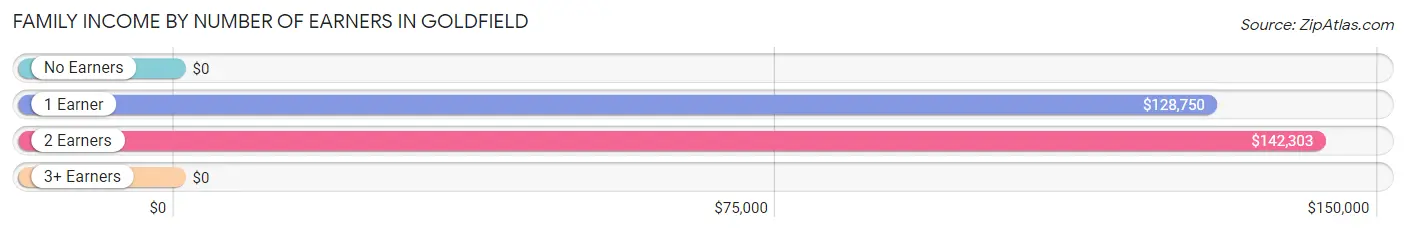
| Number of Earners | # Families | Median Income |
| No Earners | 7 (11.5%) | $0 |
| 1 Earner | 13 (21.3%) | $128,750 |
| 2 Earners | 41 (67.2%) | $142,303 |
| 3+ Earners | 0 (0.0%) | $0 |
| Total | 61 (100.0%) | $140,987 |
Household Income in Goldfield
Household Income Brackets in Goldfield
With 45 households falling in the category, the $100,000 to $149,999 income range is the most frequent in Goldfield, accounting for 42.9% of all households.
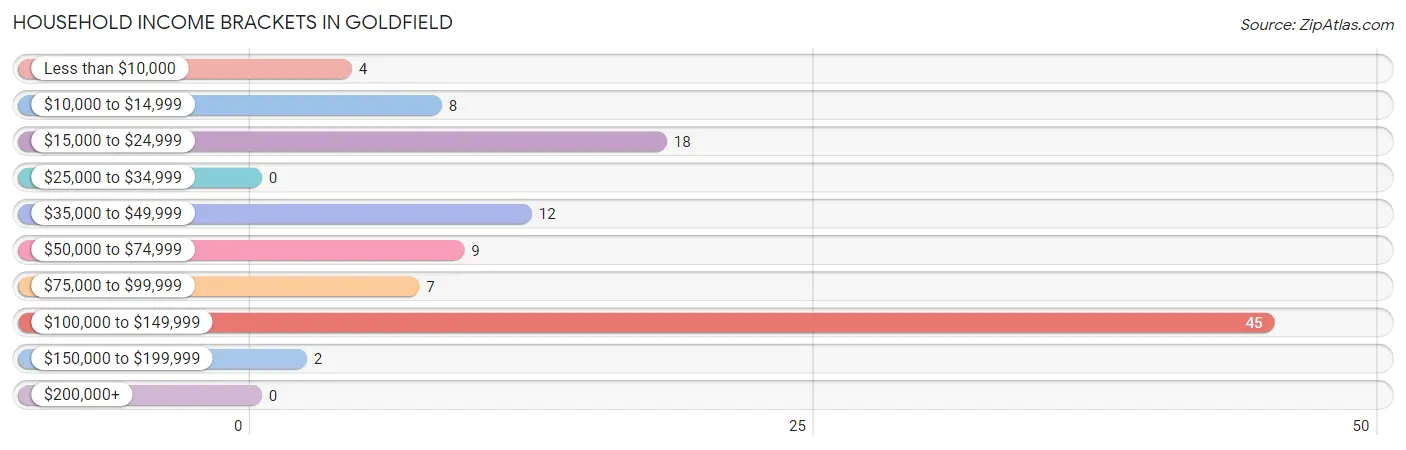
| Income Bracket | # Households | % Households |
| Less than $10,000 | 4 | 3.8% |
| $10,000 to $14,999 | 8 | 7.6% |
| $15,000 to $24,999 | 18 | 17.1% |
| $25,000 to $34,999 | 0 | 0.0% |
| $35,000 to $49,999 | 12 | 11.4% |
| $50,000 to $74,999 | 9 | 8.6% |
| $75,000 to $99,999 | 7 | 6.7% |
| $100,000 to $149,999 | 45 | 42.9% |
| $150,000 to $199,999 | 2 | 1.9% |
| $200,000+ | 0 | 0.0% |
Household Income by Householder Age in Goldfield
The median household income in Goldfield is $0, with the highest median household income of $141,447 found in the 45 to 64 years age bracket for the primary householder. A total of 50 households (47.6%) fall into this category.
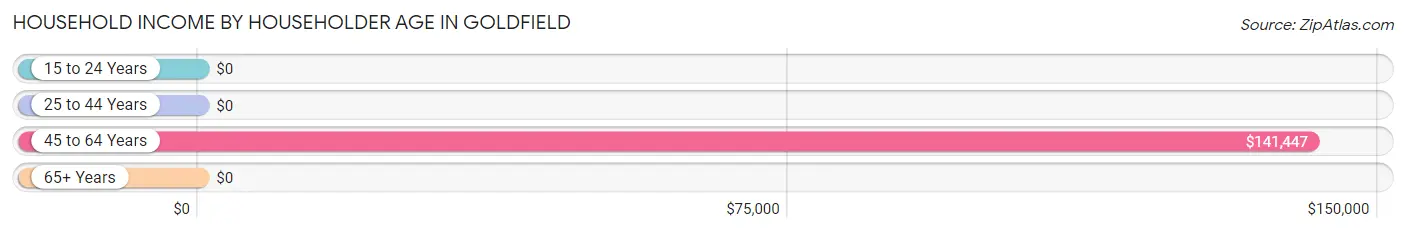
| Income Bracket | # Households | Median Income |
| 15 to 24 Years | 0 (0.0%) | $0 |
| 25 to 44 Years | 2 (1.9%) | $0 |
| 45 to 64 Years | 50 (47.6%) | $141,447 |
| 65+ Years | 53 (50.5%) | $0 |
| Total | 105 (100.0%) | $0 |
Poverty in Goldfield
Income Below Poverty by Sex and Age in Goldfield
With 15.2% poverty level for males and 8.0% for females among the residents of Goldfield, 75 year old and over males and 55 to 64 year old females are the most vulnerable to poverty, with 8 males (24.2%) and 8 females (25.8%) in their respective age groups living below the poverty level.
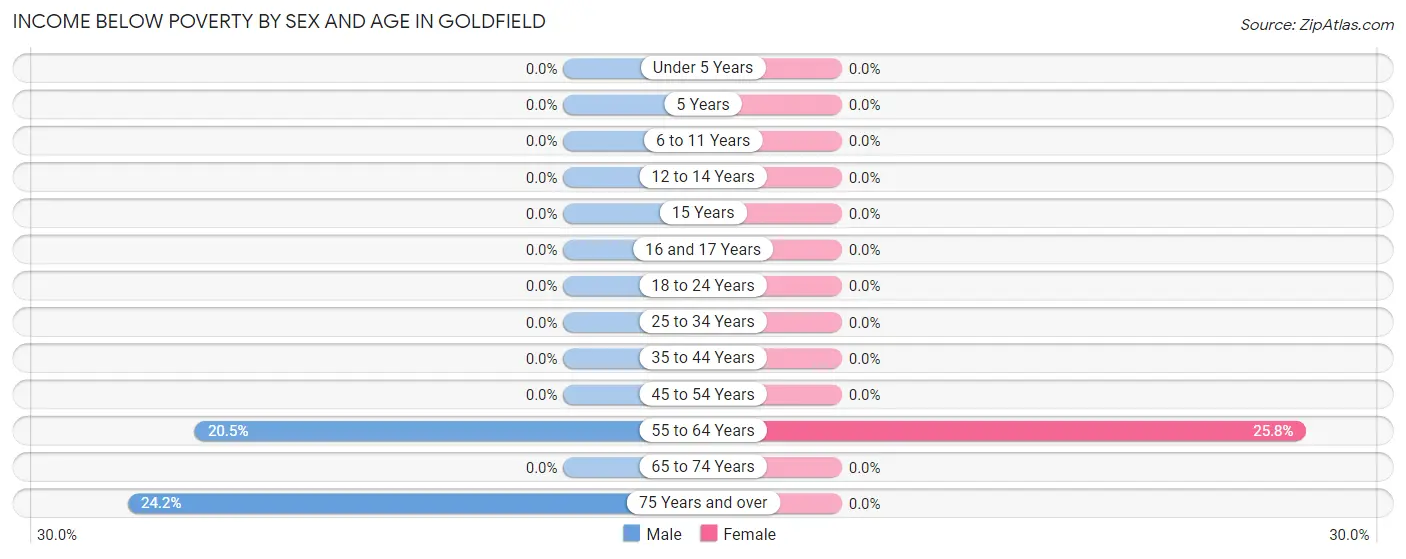
| Age Bracket | Male | Female |
| Under 5 Years | 0 (0.0%) | 0 (0.0%) |
| 5 Years | 0 (0.0%) | 0 (0.0%) |
| 6 to 11 Years | 0 (0.0%) | 0 (0.0%) |
| 12 to 14 Years | 0 (0.0%) | 0 (0.0%) |
| 15 Years | 0 (0.0%) | 0 (0.0%) |
| 16 and 17 Years | 0 (0.0%) | 0 (0.0%) |
| 18 to 24 Years | 0 (0.0%) | 0 (0.0%) |
| 25 to 34 Years | 0 (0.0%) | 0 (0.0%) |
| 35 to 44 Years | 0 (0.0%) | 0 (0.0%) |
| 45 to 54 Years | 0 (0.0%) | 0 (0.0%) |
| 55 to 64 Years | 8 (20.5%) | 8 (25.8%) |
| 65 to 74 Years | 0 (0.0%) | 0 (0.0%) |
| 75 Years and over | 8 (24.2%) | 0 (0.0%) |
| Total | 16 (15.2%) | 8 (8.0%) |
Income Above Poverty by Sex and Age in Goldfield
According to the poverty statistics in Goldfield, males aged 12 to 14 years and females aged 16 and 17 years are the age groups that are most secure financially, with 100.0% of males and 100.0% of females in these age groups living above the poverty line.
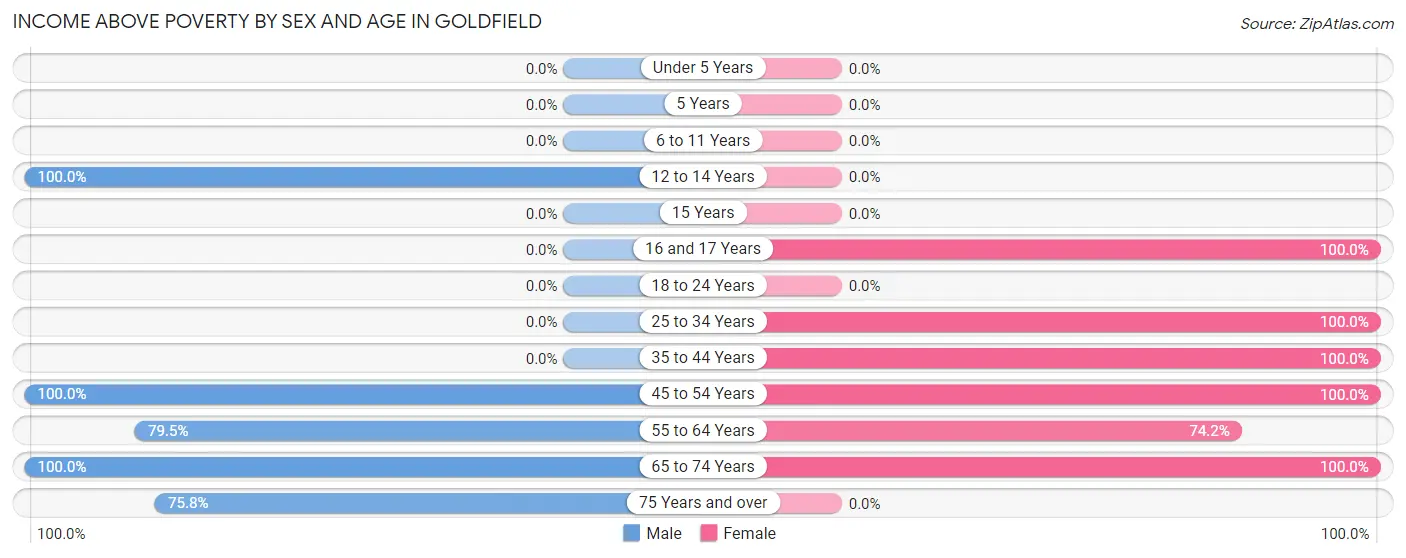
| Age Bracket | Male | Female |
| Under 5 Years | 0 (0.0%) | 0 (0.0%) |
| 5 Years | 0 (0.0%) | 0 (0.0%) |
| 6 to 11 Years | 0 (0.0%) | 0 (0.0%) |
| 12 to 14 Years | 4 (100.0%) | 0 (0.0%) |
| 15 Years | 0 (0.0%) | 0 (0.0%) |
| 16 and 17 Years | 0 (0.0%) | 6 (100.0%) |
| 18 to 24 Years | 0 (0.0%) | 0 (0.0%) |
| 25 to 34 Years | 0 (0.0%) | 5 (100.0%) |
| 35 to 44 Years | 0 (0.0%) | 2 (100.0%) |
| 45 to 54 Years | 4 (100.0%) | 31 (100.0%) |
| 55 to 64 Years | 31 (79.5%) | 23 (74.2%) |
| 65 to 74 Years | 25 (100.0%) | 25 (100.0%) |
| 75 Years and over | 25 (75.8%) | 0 (0.0%) |
| Total | 89 (84.8%) | 92 (92.0%) |
Income Below Poverty Among Married-Couple Families in Goldfield
The poverty statistics for married-couple families in Goldfield show that 6.6% or 4 of the total 61 families live below the poverty line. Families with no children have the highest poverty rate of 7.7%, comprising of 4 families. On the other hand, families with 1 or 2 children have the lowest poverty rate of 0.0%, which includes 0 families.
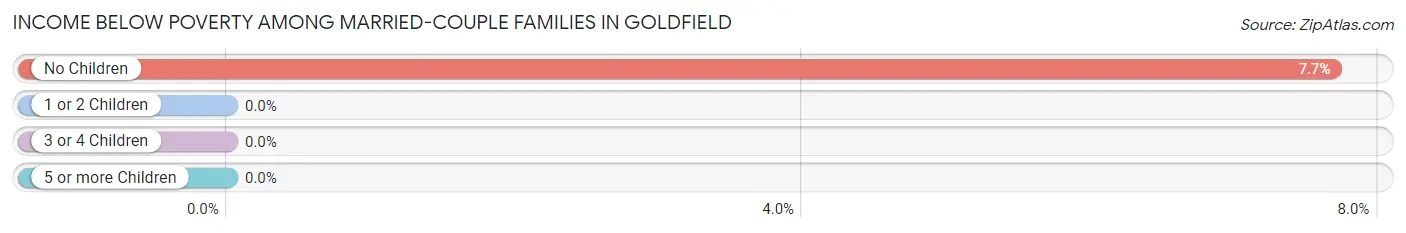
| Children | Above Poverty | Below Poverty |
| No Children | 48 (92.3%) | 4 (7.7%) |
| 1 or 2 Children | 9 (100.0%) | 0 (0.0%) |
| 3 or 4 Children | 0 (0.0%) | 0 (0.0%) |
| 5 or more Children | 0 (0.0%) | 0 (0.0%) |
| Total | 57 (93.4%) | 4 (6.6%) |
Income Below Poverty Among Single-Parent Households in Goldfield
| Children | Single Father | Single Mother |
| No Children | 0 (0.0%) | 0 (0.0%) |
| 1 or 2 Children | 0 (0.0%) | 0 (0.0%) |
| 3 or 4 Children | 0 (0.0%) | 0 (0.0%) |
| 5 or more Children | 0 (0.0%) | 0 (0.0%) |
| Total | 0 (0.0%) | 0 (0.0%) |
Income Below Poverty Among Married-Couple vs Single-Parent Households in Goldfield
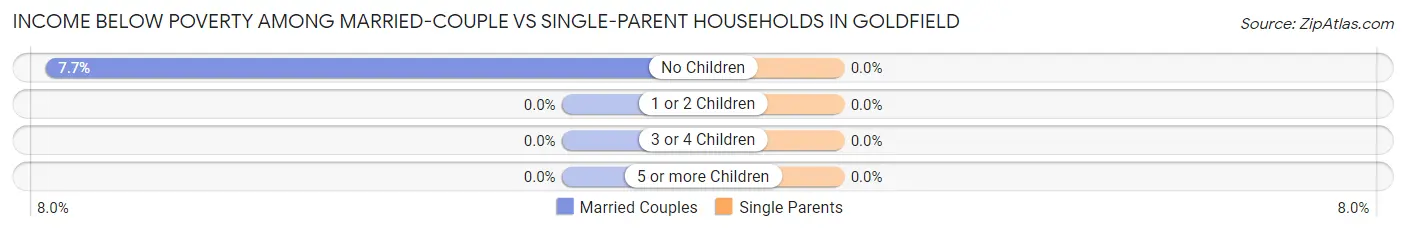
| Children | Married-Couple Families | Single-Parent Households |
| No Children | 4 (7.7%) | 0 (0.0%) |
| 1 or 2 Children | 0 (0.0%) | 0 (0.0%) |
| 3 or 4 Children | 0 (0.0%) | 0 (0.0%) |
| 5 or more Children | 0 (0.0%) | 0 (0.0%) |
| Total | 4 (6.6%) | 0 (0.0%) |
Race in Goldfield
The most populous races in Goldfield are White / Caucasian (168 | 79.2%), Hispanic or Latino (24 | 11.3%), and Asian (19 | 9.0%).
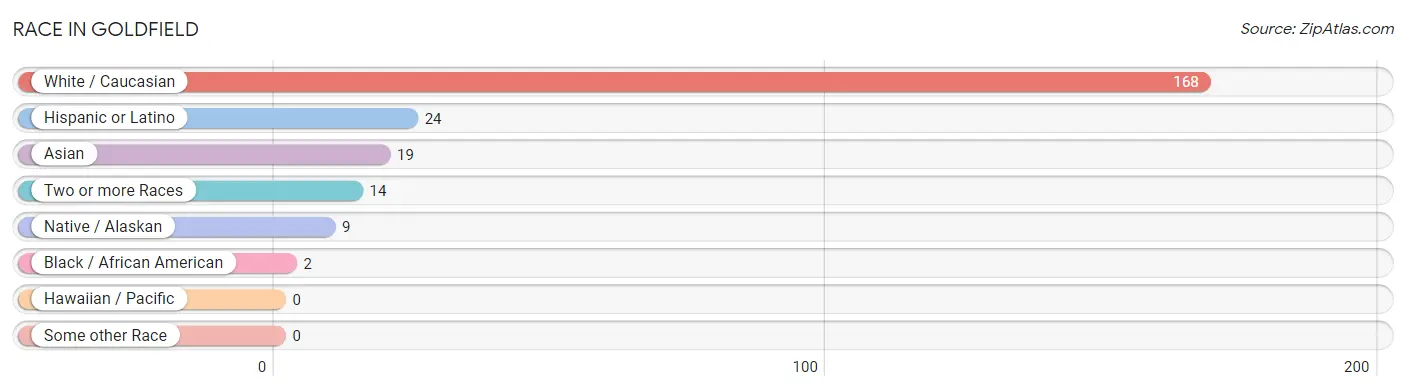
| Race | # Population | % Population |
| Asian | 19 | 9.0% |
| Black / African American | 2 | 0.9% |
| Hawaiian / Pacific | 0 | 0.0% |
| Hispanic or Latino | 24 | 11.3% |
| Native / Alaskan | 9 | 4.3% |
| White / Caucasian | 168 | 79.2% |
| Two or more Races | 14 | 6.6% |
| Some other Race | 0 | 0.0% |
| Total | 212 | 100.0% |
Ancestry in Goldfield
The most populous ancestries reported in Goldfield are German (55 | 25.9%), Irish (29 | 13.7%), English (23 | 10.8%), Italian (22 | 10.4%), and Korean (19 | 9.0%), together accounting for 69.8% of all Goldfield residents.
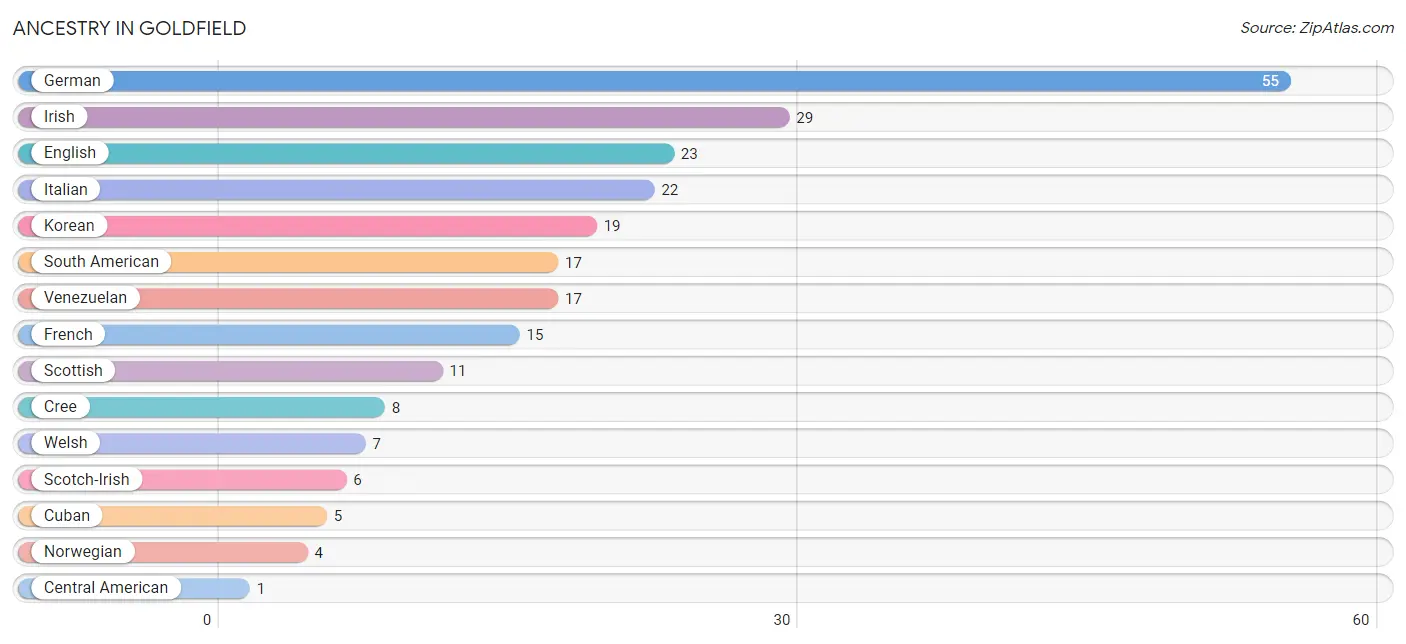
| Ancestry | # Population | % Population |
| Central American | 1 | 0.5% |
| Chippewa | 1 | 0.5% |
| Cree | 8 | 3.8% |
| Cuban | 5 | 2.4% |
| English | 23 | 10.8% |
| French | 15 | 7.1% |
| German | 55 | 25.9% |
| Honduran | 1 | 0.5% |
| Irish | 29 | 13.7% |
| Italian | 22 | 10.4% |
| Korean | 19 | 9.0% |
| Mexican | 1 | 0.5% |
| Norwegian | 4 | 1.9% |
| Russian | 1 | 0.5% |
| Scotch-Irish | 6 | 2.8% |
| Scottish | 11 | 5.2% |
| South American | 17 | 8.0% |
| Venezuelan | 17 | 8.0% |
| Welsh | 7 | 3.3% | View All 19 Rows |
Immigrants in Goldfield
The most numerous immigrant groups reported in Goldfield came from Latin America (22 | 10.4%), Asia (19 | 9.0%), Philippines (19 | 9.0%), South Eastern Asia (19 | 9.0%), and South America (17 | 8.0%), together accounting for 45.3% of all Goldfield residents.
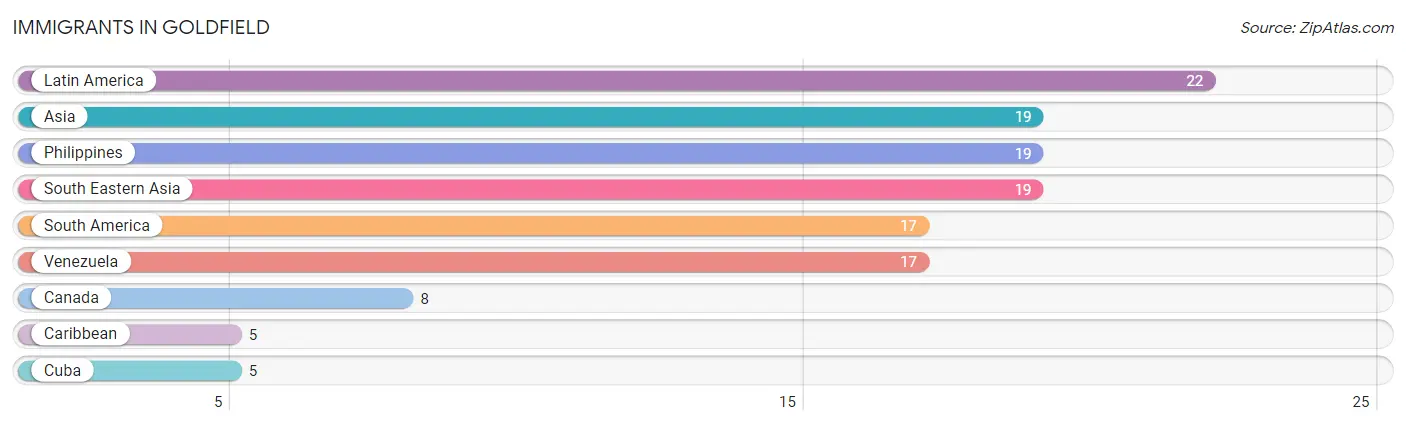
| Immigration Origin | # Population | % Population |
| Asia | 19 | 9.0% |
| Canada | 8 | 3.8% |
| Caribbean | 5 | 2.4% |
| Cuba | 5 | 2.4% |
| Latin America | 22 | 10.4% |
| Philippines | 19 | 9.0% |
| South America | 17 | 8.0% |
| South Eastern Asia | 19 | 9.0% |
| Venezuela | 17 | 8.0% | View All 9 Rows |
Sex and Age in Goldfield
Sex and Age in Goldfield
The most populous age groups in Goldfield are 55 to 59 Years (34 | 30.4%) for men and 55 to 59 Years (24 | 24.0%) for women.
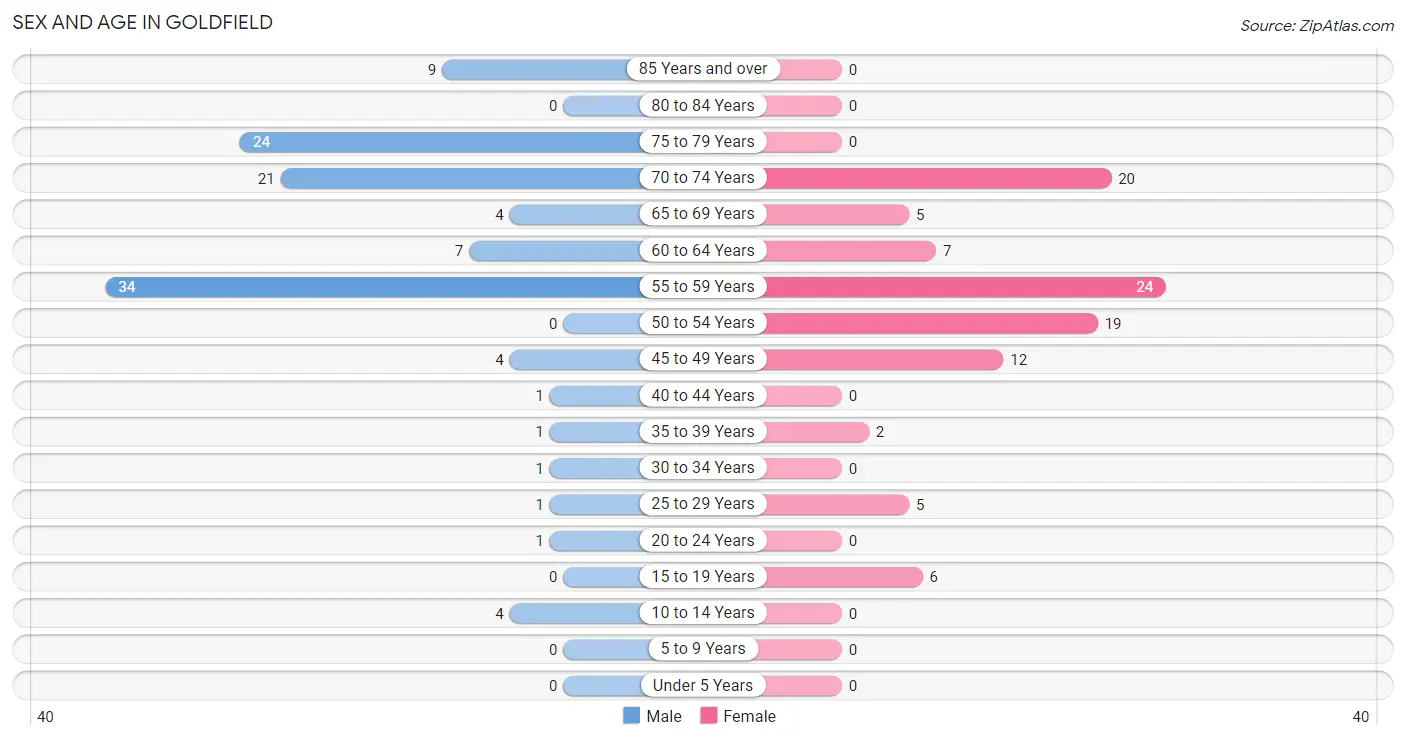
| Age Bracket | Male | Female |
| Under 5 Years | 0 (0.0%) | 0 (0.0%) |
| 5 to 9 Years | 0 (0.0%) | 0 (0.0%) |
| 10 to 14 Years | 4 (3.6%) | 0 (0.0%) |
| 15 to 19 Years | 0 (0.0%) | 6 (6.0%) |
| 20 to 24 Years | 1 (0.9%) | 0 (0.0%) |
| 25 to 29 Years | 1 (0.9%) | 5 (5.0%) |
| 30 to 34 Years | 1 (0.9%) | 0 (0.0%) |
| 35 to 39 Years | 1 (0.9%) | 2 (2.0%) |
| 40 to 44 Years | 1 (0.9%) | 0 (0.0%) |
| 45 to 49 Years | 4 (3.6%) | 12 (12.0%) |
| 50 to 54 Years | 0 (0.0%) | 19 (19.0%) |
| 55 to 59 Years | 34 (30.4%) | 24 (24.0%) |
| 60 to 64 Years | 7 (6.2%) | 7 (7.0%) |
| 65 to 69 Years | 4 (3.6%) | 5 (5.0%) |
| 70 to 74 Years | 21 (18.8%) | 20 (20.0%) |
| 75 to 79 Years | 24 (21.4%) | 0 (0.0%) |
| 80 to 84 Years | 0 (0.0%) | 0 (0.0%) |
| 85 Years and over | 9 (8.0%) | 0 (0.0%) |
| Total | 112 (100.0%) | 100 (100.0%) |
Families and Households in Goldfield
Median Family Size in Goldfield
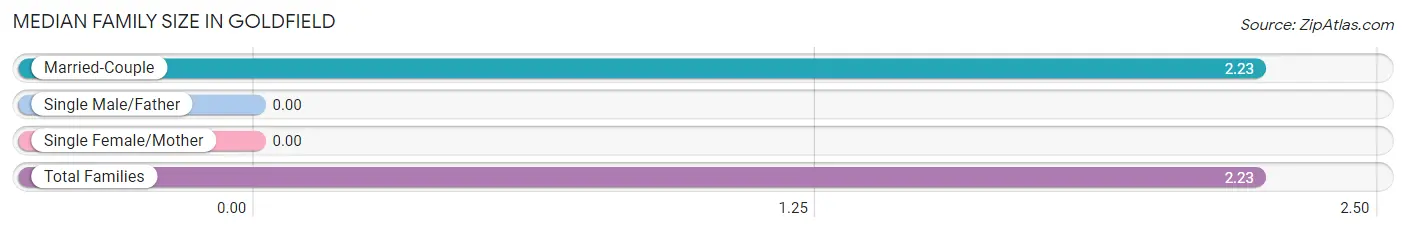
| Family Type | # Families | Family Size |
| Married-Couple | 61 (100.0%) | 2.23 |
| Single Male/Father | 0 (0.0%) | - |
| Single Female/Mother | 0 (0.0%) | - |
| Total Families | 61 (100.0%) | 2.23 |
Median Household Size in Goldfield
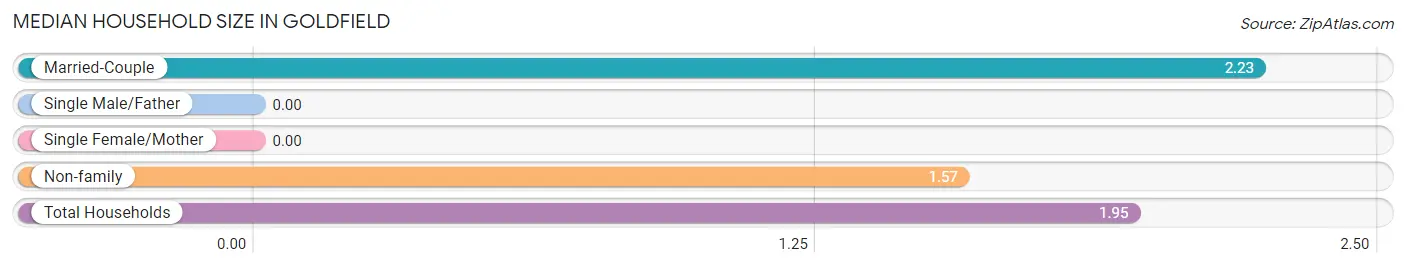
| Household Type | # Households | Household Size |
| Married-Couple | 61 (58.1%) | 2.23 |
| Single Male/Father | 0 (0.0%) | - |
| Single Female/Mother | 0 (0.0%) | - |
| Non-family | 44 (41.9%) | 1.57 |
| Total Households | 105 (100.0%) | 1.95 |
Household Size by Marriage Status in Goldfield
Out of a total of 105 households in Goldfield, 61 (58.1%) are family households, while 44 (41.9%) are nonfamily households. The most numerous type of family households are 2-person households, comprising 48, and the most common type of nonfamily households are 1-person households, comprising 26.
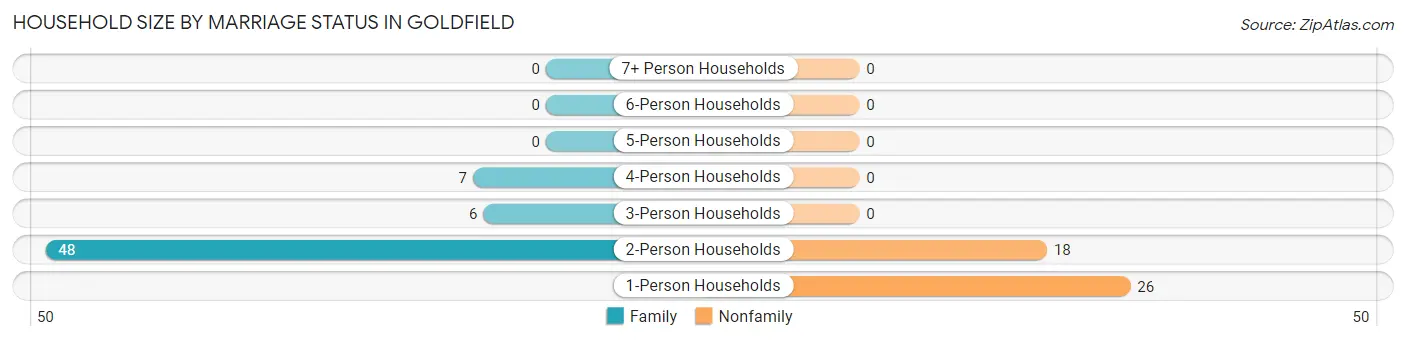
| Household Size | Family Households | Nonfamily Households |
| 1-Person Households | - | 26 (24.8%) |
| 2-Person Households | 48 (45.7%) | 18 (17.1%) |
| 3-Person Households | 6 (5.7%) | 0 (0.0%) |
| 4-Person Households | 7 (6.7%) | 0 (0.0%) |
| 5-Person Households | 0 (0.0%) | 0 (0.0%) |
| 6-Person Households | 0 (0.0%) | 0 (0.0%) |
| 7+ Person Households | 0 (0.0%) | 0 (0.0%) |
| Total | 61 (58.1%) | 44 (41.9%) |
Female Fertility in Goldfield
Fertility by Age in Goldfield
| Age Bracket | Women with Births | Births / 1,000 Women |
| 15 to 19 years | 0 (0.0%) | 0.0 |
| 20 to 34 years | 0 (0.0%) | 0.0 |
| 35 to 50 years | 0 (0.0%) | 0.0 |
| Total | 0 (0.0%) | 0.0 |
Fertility by Age by Marriage Status in Goldfield
| Age Bracket | Married | Unmarried |
| 15 to 19 years | 0 (0.0%) | 0 (0.0%) |
| 20 to 34 years | 0 (0.0%) | 0 (0.0%) |
| 35 to 50 years | 0 (0.0%) | 0 (0.0%) |
| Total | 0 (0.0%) | 0 (0.0%) |
Fertility by Education in Goldfield
| Educational Attainment | Women with Births | Births / 1,000 Women |
| Less than High School | 0 (0.0%) | 0.0 |
| High School Diploma | 0 (0.0%) | 0.0 |
| College or Associate's Degree | 0 (0.0%) | 0.0 |
| Bachelor's Degree | 0 (0.0%) | 0.0 |
| Graduate Degree | 0 (0.0%) | 0.0 |
| Total | 0 (0.0%) | 0.0 |
Fertility by Education by Marriage Status in Goldfield
| Educational Attainment | Married | Unmarried |
| Less than High School | 0 (0.0%) | 0 (0.0%) |
| High School Diploma | 0 (0.0%) | 0 (0.0%) |
| College or Associate's Degree | 0 (0.0%) | 0 (0.0%) |
| Bachelor's Degree | 0 (0.0%) | 0 (0.0%) |
| Graduate Degree | 0 (0.0%) | 0 (0.0%) |
| Total | 0 (0.0%) | 0 (0.0%) |
Employment Characteristics in Goldfield
Employment by Class of Employer in Goldfield
Among the 80 employed individuals in Goldfield, private company employees (39 | 48.7%), local government employees (37 | 46.3%), and self-employed (not incorporated) (4 | 5.0%) make up the most common classes of employment.
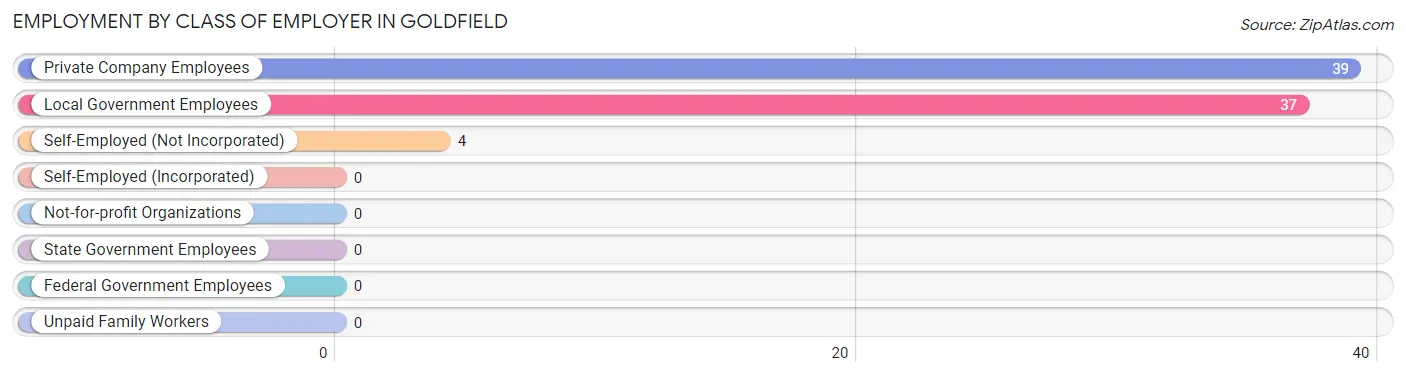
| Employer Class | # Employees | % Employees |
| Private Company Employees | 39 | 48.7% |
| Self-Employed (Incorporated) | 0 | 0.0% |
| Self-Employed (Not Incorporated) | 4 | 5.0% |
| Not-for-profit Organizations | 0 | 0.0% |
| Local Government Employees | 37 | 46.3% |
| State Government Employees | 0 | 0.0% |
| Federal Government Employees | 0 | 0.0% |
| Unpaid Family Workers | 0 | 0.0% |
| Total | 80 | 100.0% |
Employment Status by Age in Goldfield
According to the labor force statistics for Goldfield, out of the total population over 16 years of age (208), 42.3% or 88 individuals are in the labor force, with 9.1% or 8 of them unemployed. The age group with the highest labor force participation rate is 25 to 29 years, with 83.3% or 5 individuals in the labor force. Within the labor force, the 65 to 74 years age range has the highest percentage of unemployed individuals, with 100.0% or 8 of them being unemployed.
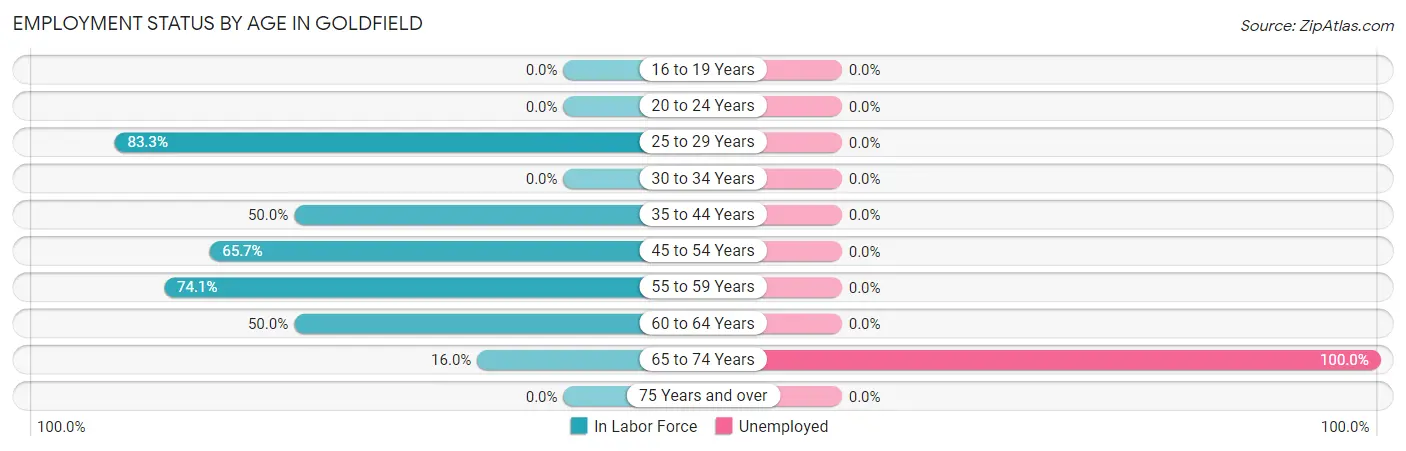
| Age Bracket | In Labor Force | Unemployed |
| 16 to 19 Years | 0 (0.0%) | 0 (0.0%) |
| 20 to 24 Years | 0 (0.0%) | 0 (0.0%) |
| 25 to 29 Years | 5 (83.3%) | 0 (0.0%) |
| 30 to 34 Years | 0 (0.0%) | 0 (0.0%) |
| 35 to 44 Years | 2 (50.0%) | 0 (0.0%) |
| 45 to 54 Years | 23 (65.7%) | 0 (0.0%) |
| 55 to 59 Years | 43 (74.1%) | 0 (0.0%) |
| 60 to 64 Years | 7 (50.0%) | 0 (0.0%) |
| 65 to 74 Years | 8 (16.0%) | 8 (100.0%) |
| 75 Years and over | 0 (0.0%) | 0 (0.0%) |
| Total | 88 (42.3%) | 8 (9.1%) |
Employment Status by Educational Attainment in Goldfield
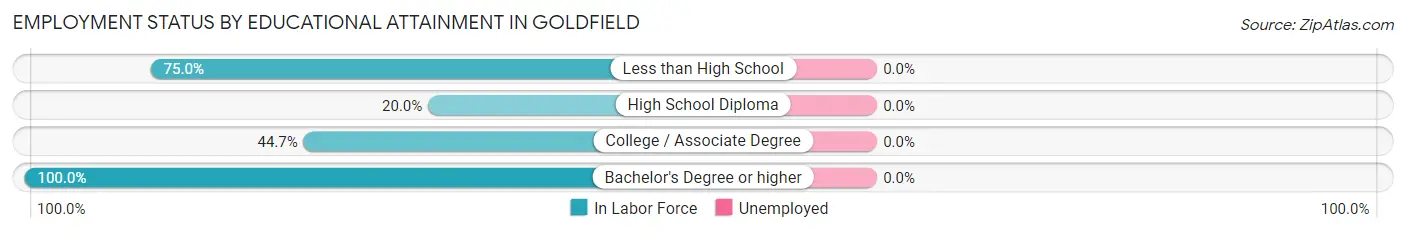
| Educational Attainment | In Labor Force | Unemployed |
| Less than High School | 3 (75.0%) | 0 (0.0%) |
| High School Diploma | 4 (20.0%) | 0 (0.0%) |
| College / Associate Degree | 17 (44.7%) | 0 (0.0%) |
| Bachelor's Degree or higher | 56 (100.0%) | 0 (0.0%) |
| Total | 80 (67.8%) | 0 (0.0%) |
Employment Occupations by Sex in Goldfield
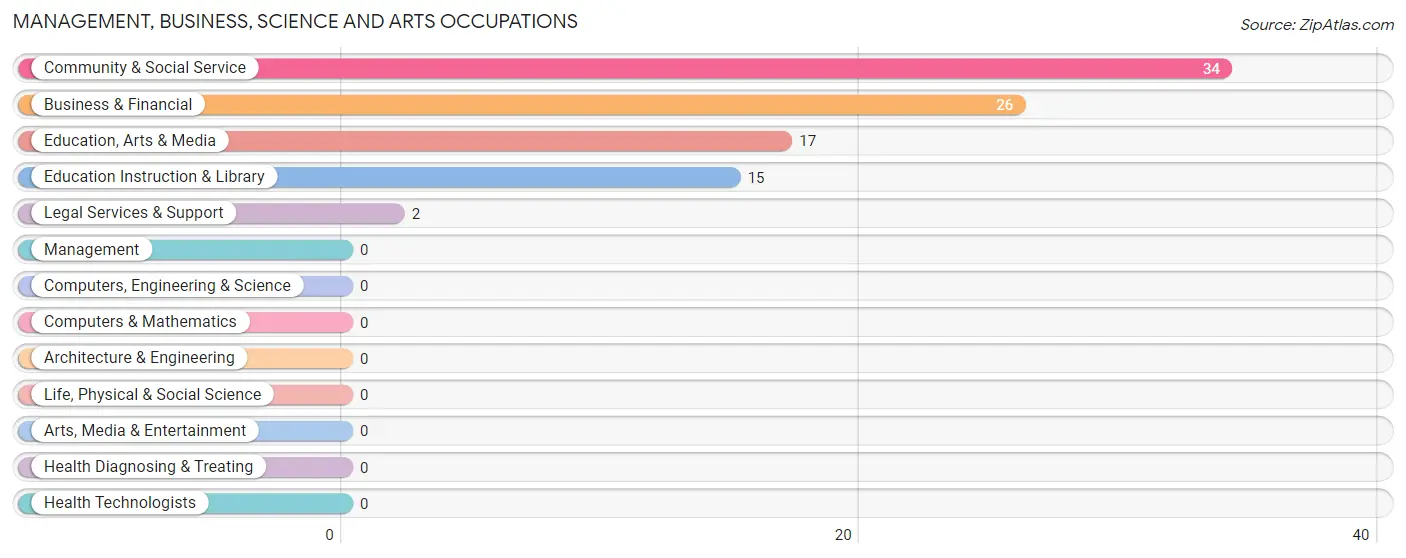
Management, Business, Science and Arts Occupations
The most common Management, Business, Science and Arts occupations in Goldfield are Community & Social Service (34 | 42.5%), Business & Financial (26 | 32.5%), Education, Arts & Media (17 | 21.2%), Education Instruction & Library (15 | 18.8%), and Legal Services & Support (2 | 2.5%).
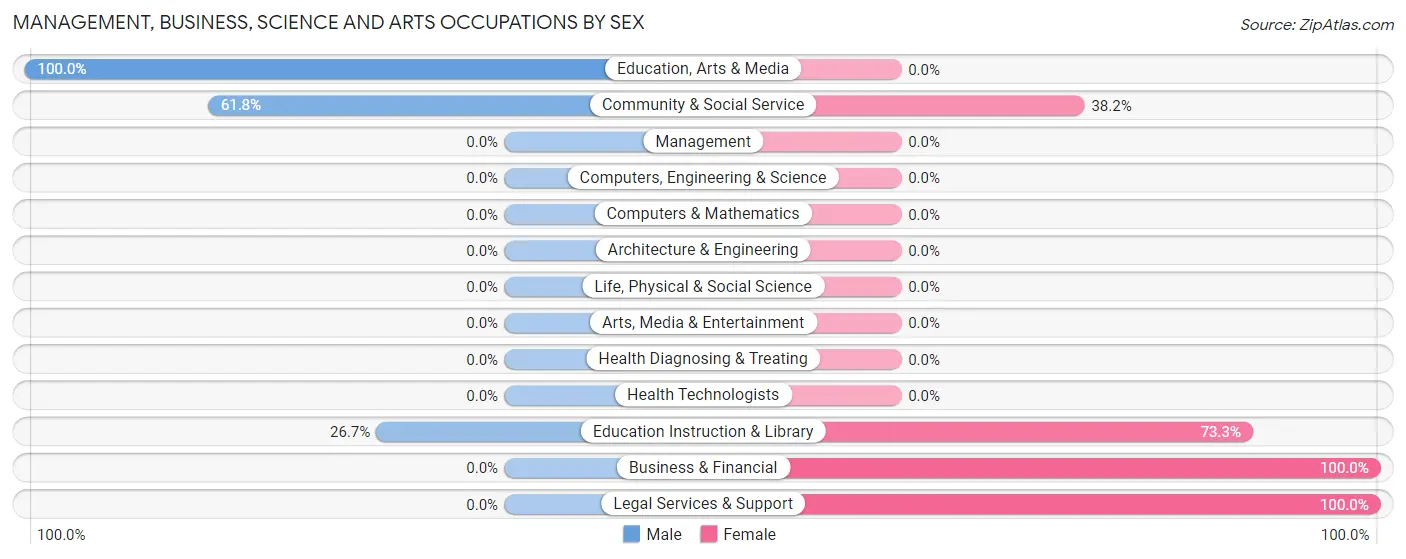
Management, Business, Science and Arts Occupations by Sex
Within the Management, Business, Science and Arts occupations in Goldfield, the most male-oriented occupations are Education, Arts & Media (100.0%), Community & Social Service (61.8%), and Education Instruction & Library (26.7%), while the most female-oriented occupations are Business & Financial (100.0%), Legal Services & Support (100.0%), and Education Instruction & Library (73.3%).
| Occupation | Male | Female |
| Management | 0 (0.0%) | 0 (0.0%) |
| Business & Financial | 0 (0.0%) | 26 (100.0%) |
| Computers, Engineering & Science | 0 (0.0%) | 0 (0.0%) |
| Computers & Mathematics | 0 (0.0%) | 0 (0.0%) |
| Architecture & Engineering | 0 (0.0%) | 0 (0.0%) |
| Life, Physical & Social Science | 0 (0.0%) | 0 (0.0%) |
| Community & Social Service | 21 (61.8%) | 13 (38.2%) |
| Education, Arts & Media | 17 (100.0%) | 0 (0.0%) |
| Legal Services & Support | 0 (0.0%) | 2 (100.0%) |
| Education Instruction & Library | 4 (26.7%) | 11 (73.3%) |
| Arts, Media & Entertainment | 0 (0.0%) | 0 (0.0%) |
| Health Diagnosing & Treating | 0 (0.0%) | 0 (0.0%) |
| Health Technologists | 0 (0.0%) | 0 (0.0%) |
| Total (Category) | 21 (35.0%) | 39 (65.0%) |
| Total (Overall) | 32 (40.0%) | 48 (60.0%) |
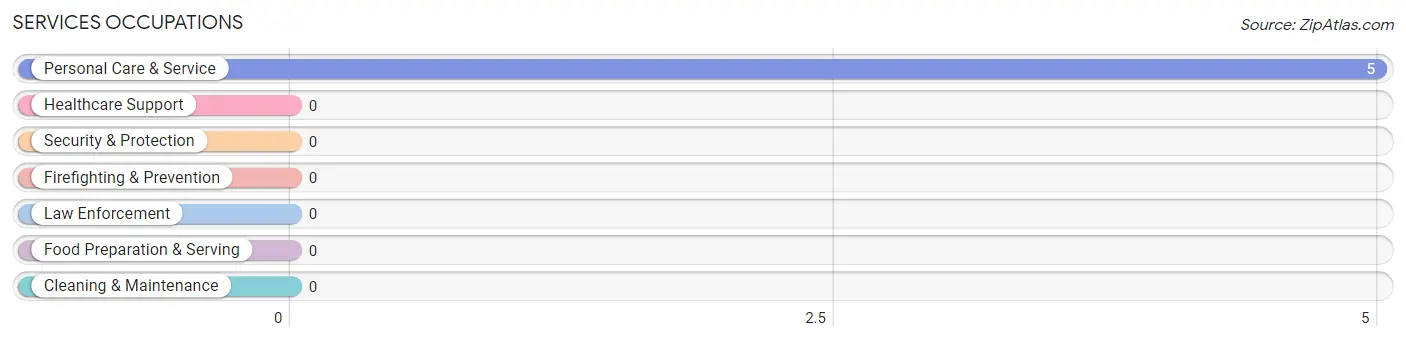
Services Occupations
The most common Services occupations in Goldfield are , and Personal Care & Service (5 | 6.2%).
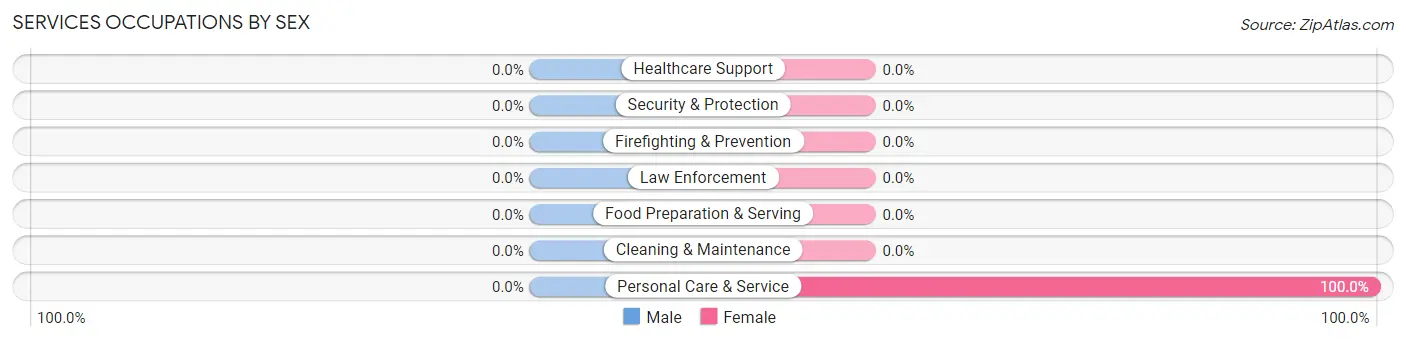
Services Occupations by Sex
| Occupation | Male | Female |
| Healthcare Support | 0 (0.0%) | 0 (0.0%) |
| Security & Protection | 0 (0.0%) | 0 (0.0%) |
| Firefighting & Prevention | 0 (0.0%) | 0 (0.0%) |
| Law Enforcement | 0 (0.0%) | 0 (0.0%) |
| Food Preparation & Serving | 0 (0.0%) | 0 (0.0%) |
| Cleaning & Maintenance | 0 (0.0%) | 0 (0.0%) |
| Personal Care & Service | 0 (0.0%) | 5 (100.0%) |
| Total (Category) | 0 (0.0%) | 5 (100.0%) |
| Total (Overall) | 32 (40.0%) | 48 (60.0%) |
Sales and Office Occupations
The most common Sales and Office occupations in Goldfield are , and Sales & Related (11 | 13.8%).
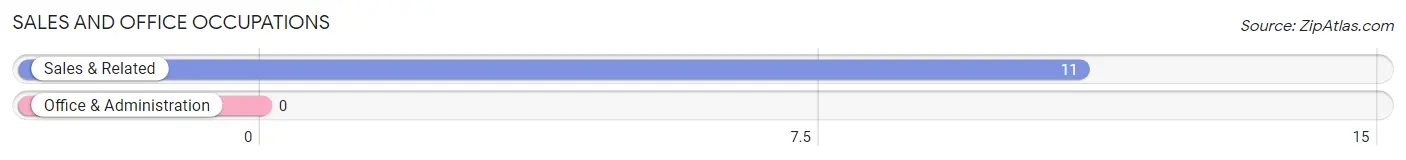
Sales and Office Occupations by Sex
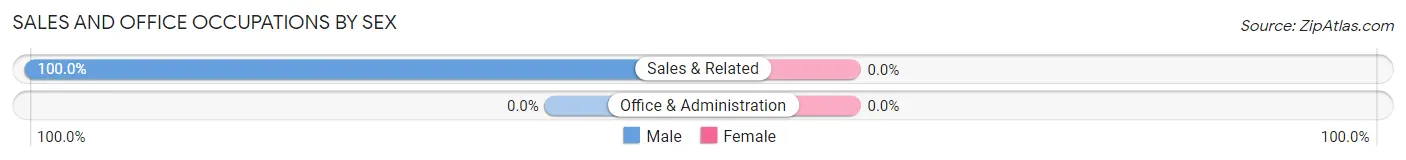
| Occupation | Male | Female |
| Sales & Related | 11 (100.0%) | 0 (0.0%) |
| Office & Administration | 0 (0.0%) | 0 (0.0%) |
| Total (Category) | 11 (100.0%) | 0 (0.0%) |
| Total (Overall) | 32 (40.0%) | 48 (60.0%) |
Natural Resources, Construction and Maintenance Occupations
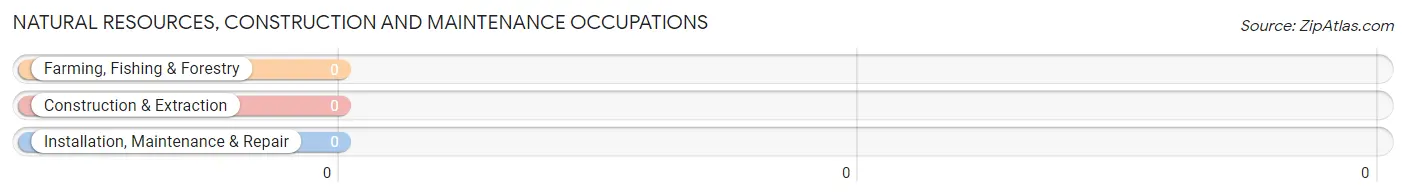
Natural Resources, Construction and Maintenance Occupations by Sex
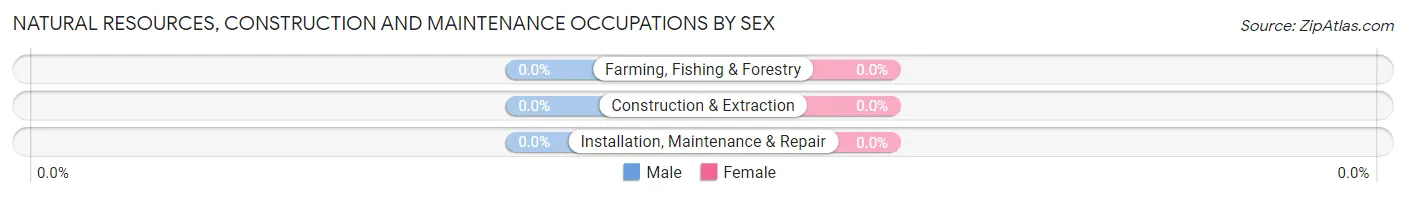
| Occupation | Male | Female |
| Farming, Fishing & Forestry | 0 (0.0%) | 0 (0.0%) |
| Construction & Extraction | 0 (0.0%) | 0 (0.0%) |
| Installation, Maintenance & Repair | 0 (0.0%) | 0 (0.0%) |
| Total (Category) | 0 (0.0%) | 0 (0.0%) |
| Total (Overall) | 32 (40.0%) | 48 (60.0%) |
Production, Transportation and Moving Occupations
The most common Production, Transportation and Moving occupations in Goldfield are , and Production (4 | 5.0%).
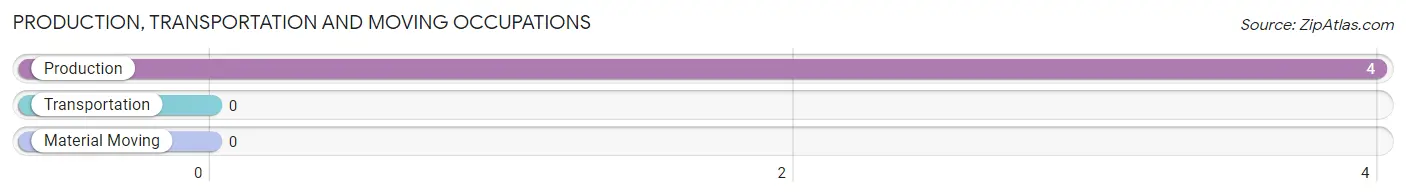
Production, Transportation and Moving Occupations by Sex
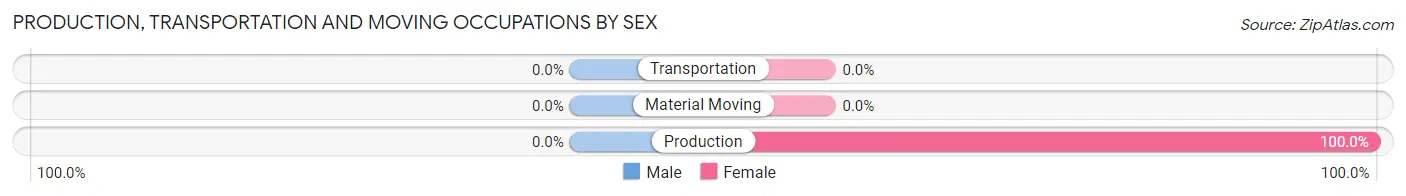
| Occupation | Male | Female |
| Production | 0 (0.0%) | 4 (100.0%) |
| Transportation | 0 (0.0%) | 0 (0.0%) |
| Material Moving | 0 (0.0%) | 0 (0.0%) |
| Total (Category) | 0 (0.0%) | 4 (100.0%) |
| Total (Overall) | 32 (40.0%) | 48 (60.0%) |
Employment Industries by Sex in Goldfield
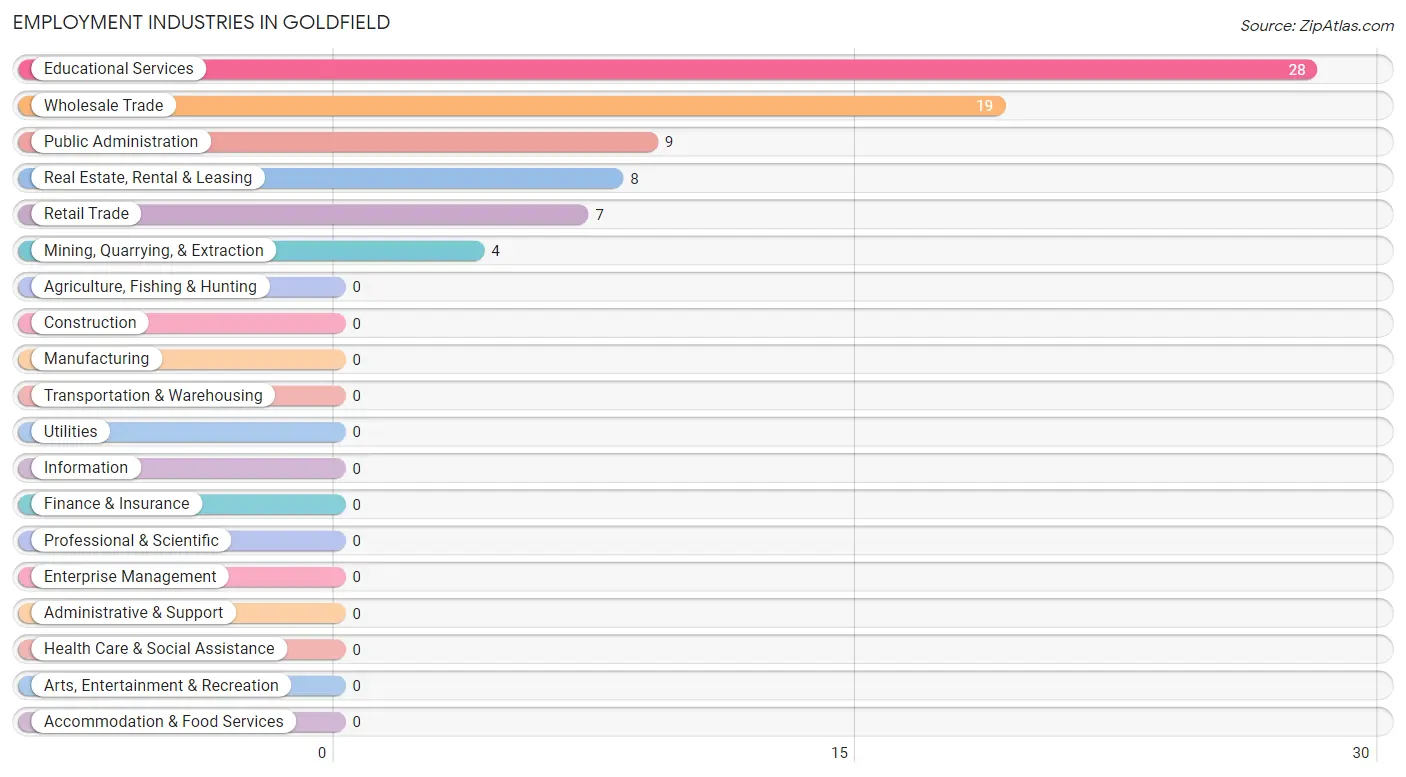
Employment Industries in Goldfield
The major employment industries in Goldfield include Educational Services (28 | 35.0%), Wholesale Trade (19 | 23.7%), Public Administration (9 | 11.3%), Real Estate, Rental & Leasing (8 | 10.0%), and Retail Trade (7 | 8.7%).
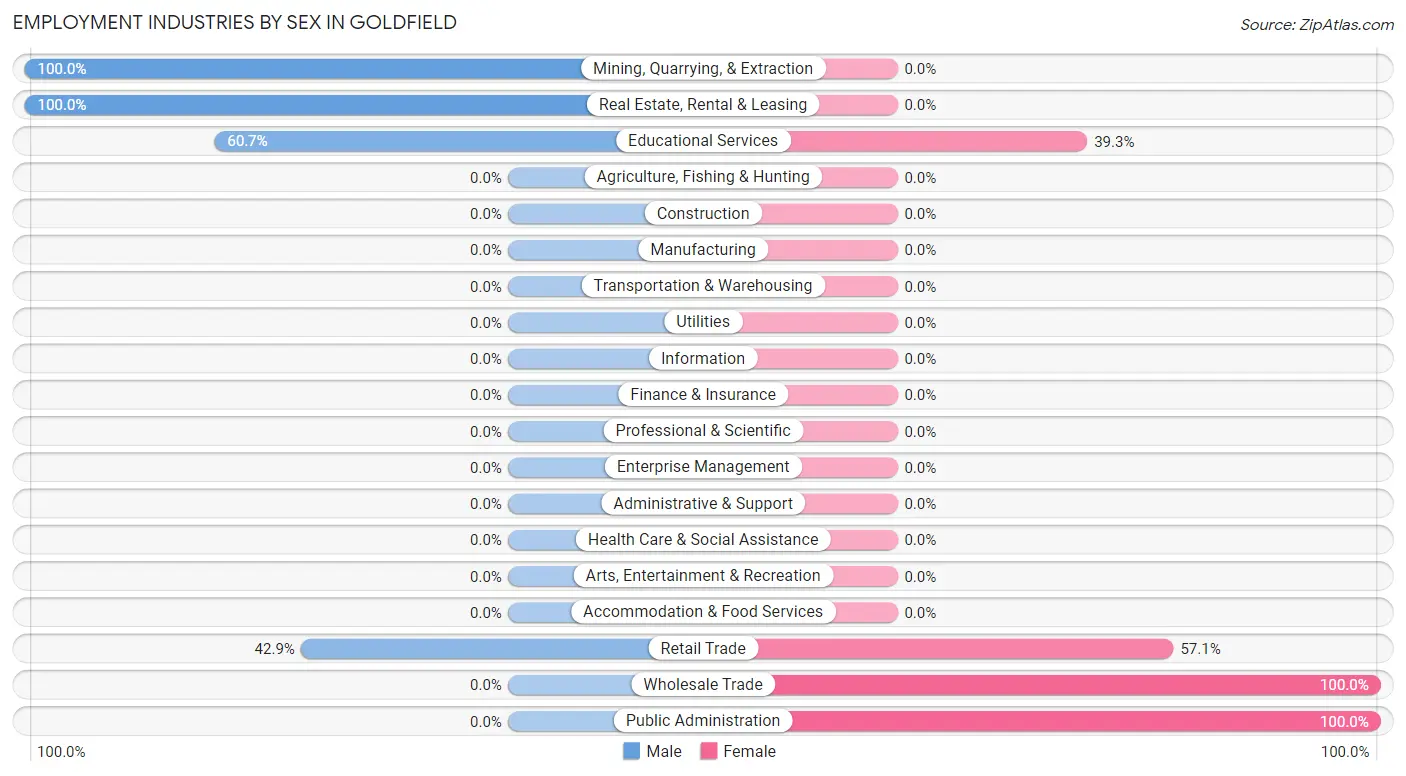
Employment Industries by Sex in Goldfield
The Goldfield industries that see more men than women are Mining, Quarrying, & Extraction (100.0%), Real Estate, Rental & Leasing (100.0%), and Educational Services (60.7%), whereas the industries that tend to have a higher number of women are Wholesale Trade (100.0%), Public Administration (100.0%), and Retail Trade (57.1%).
| Industry | Male | Female |
| Agriculture, Fishing & Hunting | 0 (0.0%) | 0 (0.0%) |
| Mining, Quarrying, & Extraction | 4 (100.0%) | 0 (0.0%) |
| Construction | 0 (0.0%) | 0 (0.0%) |
| Manufacturing | 0 (0.0%) | 0 (0.0%) |
| Wholesale Trade | 0 (0.0%) | 19 (100.0%) |
| Retail Trade | 3 (42.9%) | 4 (57.1%) |
| Transportation & Warehousing | 0 (0.0%) | 0 (0.0%) |
| Utilities | 0 (0.0%) | 0 (0.0%) |
| Information | 0 (0.0%) | 0 (0.0%) |
| Finance & Insurance | 0 (0.0%) | 0 (0.0%) |
| Real Estate, Rental & Leasing | 8 (100.0%) | 0 (0.0%) |
| Professional & Scientific | 0 (0.0%) | 0 (0.0%) |
| Enterprise Management | 0 (0.0%) | 0 (0.0%) |
| Administrative & Support | 0 (0.0%) | 0 (0.0%) |
| Educational Services | 17 (60.7%) | 11 (39.3%) |
| Health Care & Social Assistance | 0 (0.0%) | 0 (0.0%) |
| Arts, Entertainment & Recreation | 0 (0.0%) | 0 (0.0%) |
| Accommodation & Food Services | 0 (0.0%) | 0 (0.0%) |
| Public Administration | 0 (0.0%) | 9 (100.0%) |
| Total | 32 (40.0%) | 48 (60.0%) |
Education in Goldfield
School Enrollment in Goldfield
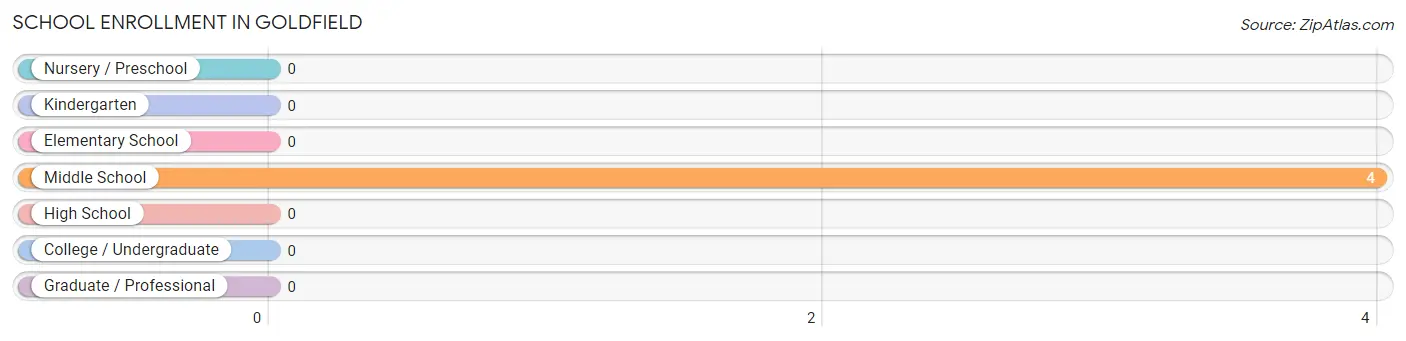
| School Level | # Students | % Students |
| Nursery / Preschool | 0 | 0.0% |
| Kindergarten | 0 | 0.0% |
| Elementary School | 0 | 0.0% |
| Middle School | 4 | 100.0% |
| High School | 0 | 0.0% |
| College / Undergraduate | 0 | 0.0% |
| Graduate / Professional | 0 | 0.0% |
| Total | 4 | 100.0% |
School Enrollment by Age by Funding Source in Goldfield
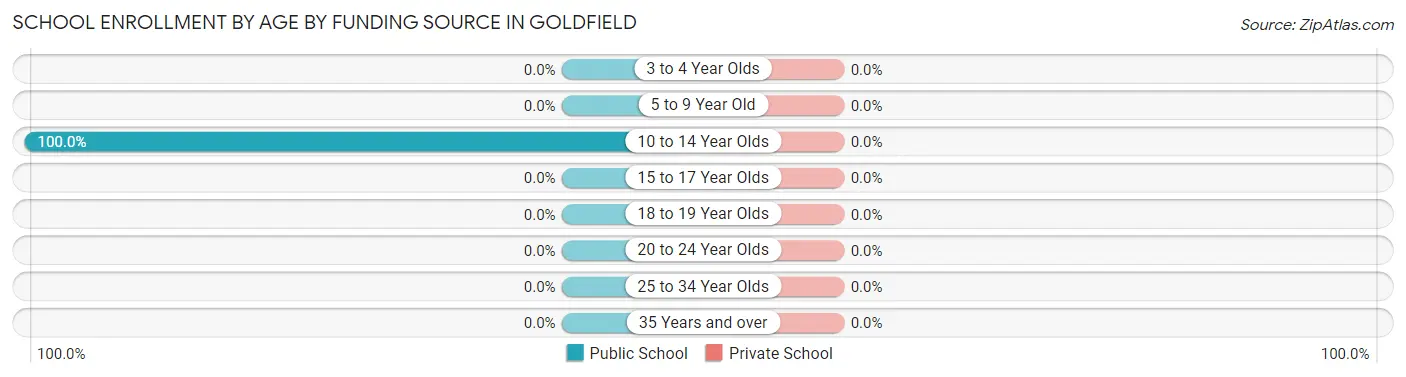
| Age Bracket | Public School | Private School |
| 3 to 4 Year Olds | 0 (0.0%) | 0 (0.0%) |
| 5 to 9 Year Old | 0 (0.0%) | 0 (0.0%) |
| 10 to 14 Year Olds | 4 (100.0%) | 0 (0.0%) |
| 15 to 17 Year Olds | 0 (0.0%) | 0 (0.0%) |
| 18 to 19 Year Olds | 0 (0.0%) | 0 (0.0%) |
| 20 to 24 Year Olds | 0 (0.0%) | 0 (0.0%) |
| 25 to 34 Year Olds | 0 (0.0%) | 0 (0.0%) |
| 35 Years and over | 0 (0.0%) | 0 (0.0%) |
| Total | 4 (100.0%) | 0 (0.0%) |
Educational Attainment by Field of Study in Goldfield
Business (34 | 47.2%), visual & performing arts (17 | 23.6%), education (11 | 15.3%), science & technology (8 | 11.1%), and arts & humanities (2 | 2.8%) are the most common fields of study among 72 individuals in Goldfield who have obtained a bachelor's degree or higher.
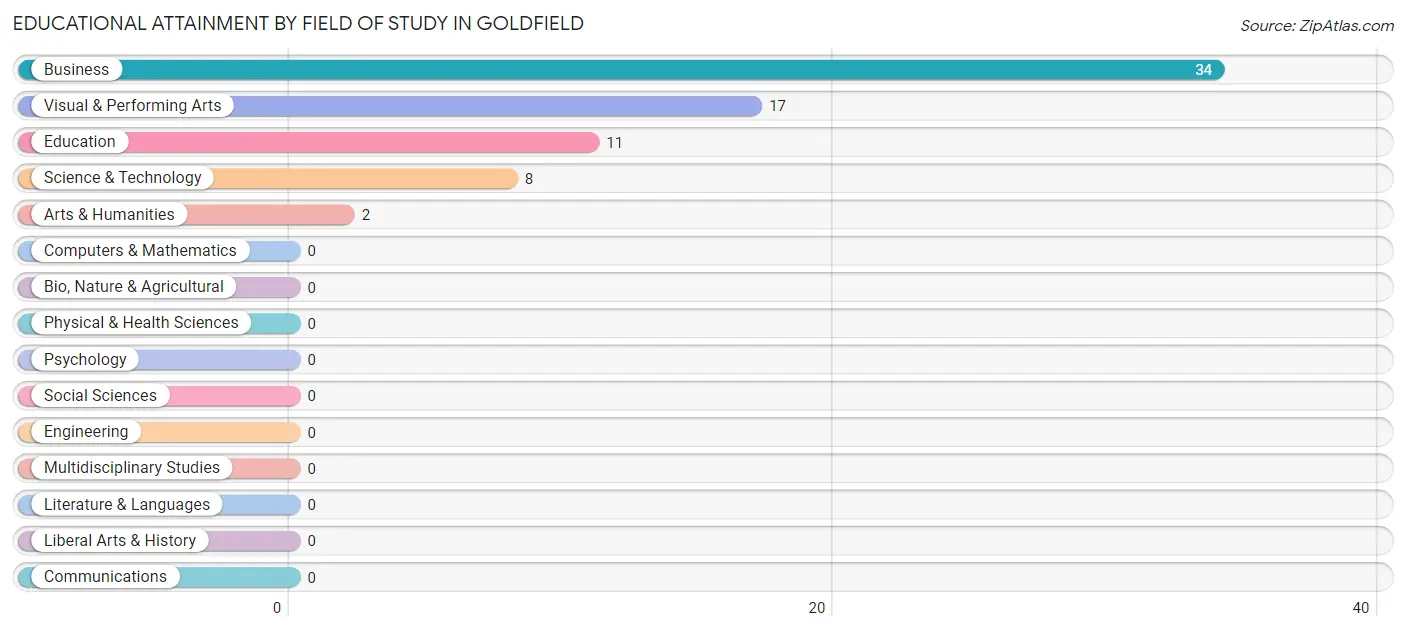
| Field of Study | # Graduates | % Graduates |
| Computers & Mathematics | 0 | 0.0% |
| Bio, Nature & Agricultural | 0 | 0.0% |
| Physical & Health Sciences | 0 | 0.0% |
| Psychology | 0 | 0.0% |
| Social Sciences | 0 | 0.0% |
| Engineering | 0 | 0.0% |
| Multidisciplinary Studies | 0 | 0.0% |
| Science & Technology | 8 | 11.1% |
| Business | 34 | 47.2% |
| Education | 11 | 15.3% |
| Literature & Languages | 0 | 0.0% |
| Liberal Arts & History | 0 | 0.0% |
| Visual & Performing Arts | 17 | 23.6% |
| Communications | 0 | 0.0% |
| Arts & Humanities | 2 | 2.8% |
| Total | 72 | 100.0% |
Transportation & Commute in Goldfield
Vehicle Availability by Sex in Goldfield
The most prevalent vehicle ownership categories in Goldfield are males with 3 vehicles (24, accounting for 75.0%) and females with 3 vehicles (18, making up 50.0%).
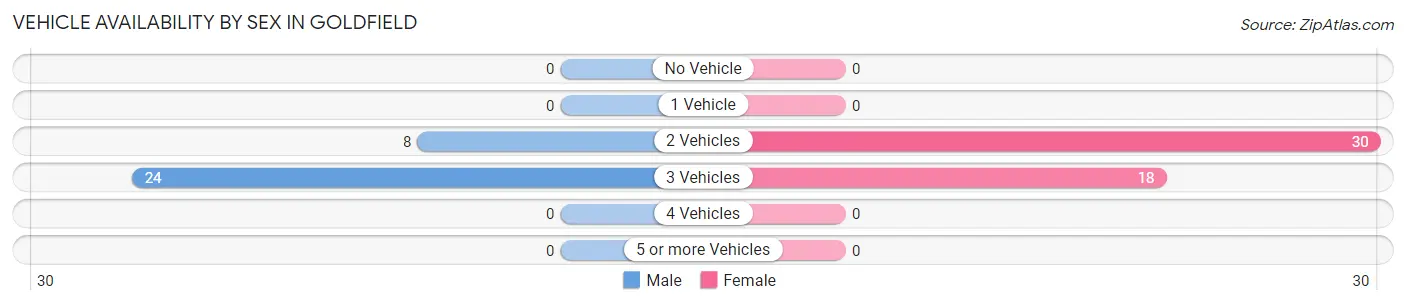
| Vehicles Available | Male | Female |
| No Vehicle | 0 (0.0%) | 0 (0.0%) |
| 1 Vehicle | 0 (0.0%) | 0 (0.0%) |
| 2 Vehicles | 8 (25.0%) | 30 (62.5%) |
| 3 Vehicles | 24 (75.0%) | 18 (37.5%) |
| 4 Vehicles | 0 (0.0%) | 0 (0.0%) |
| 5 or more Vehicles | 0 (0.0%) | 0 (0.0%) |
| Total | 32 (100.0%) | 48 (100.0%) |
Commute Time in Goldfield
The most frequently occuring commute durations in Goldfield are 5 to 9 minutes (40 commuters, 50.0%), less than 5 minutes (28 commuters, 35.0%), and 90 or more minutes (12 commuters, 15.0%).
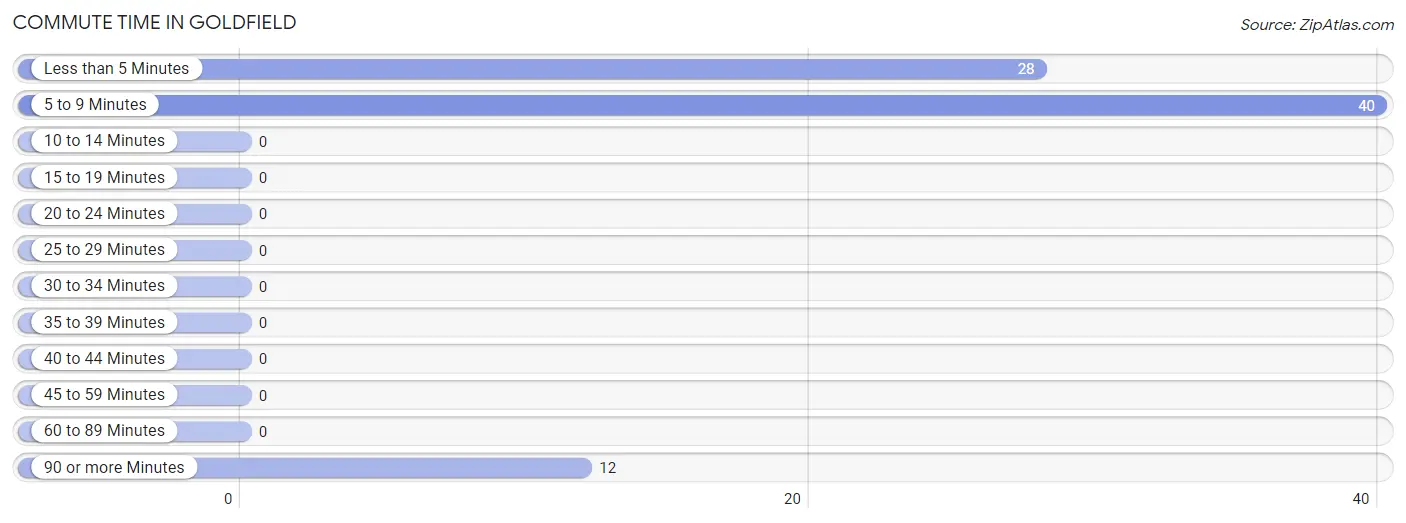
| Commute Time | # Commuters | % Commuters |
| Less than 5 Minutes | 28 | 35.0% |
| 5 to 9 Minutes | 40 | 50.0% |
| 10 to 14 Minutes | 0 | 0.0% |
| 15 to 19 Minutes | 0 | 0.0% |
| 20 to 24 Minutes | 0 | 0.0% |
| 25 to 29 Minutes | 0 | 0.0% |
| 30 to 34 Minutes | 0 | 0.0% |
| 35 to 39 Minutes | 0 | 0.0% |
| 40 to 44 Minutes | 0 | 0.0% |
| 45 to 59 Minutes | 0 | 0.0% |
| 60 to 89 Minutes | 0 | 0.0% |
| 90 or more Minutes | 12 | 15.0% |
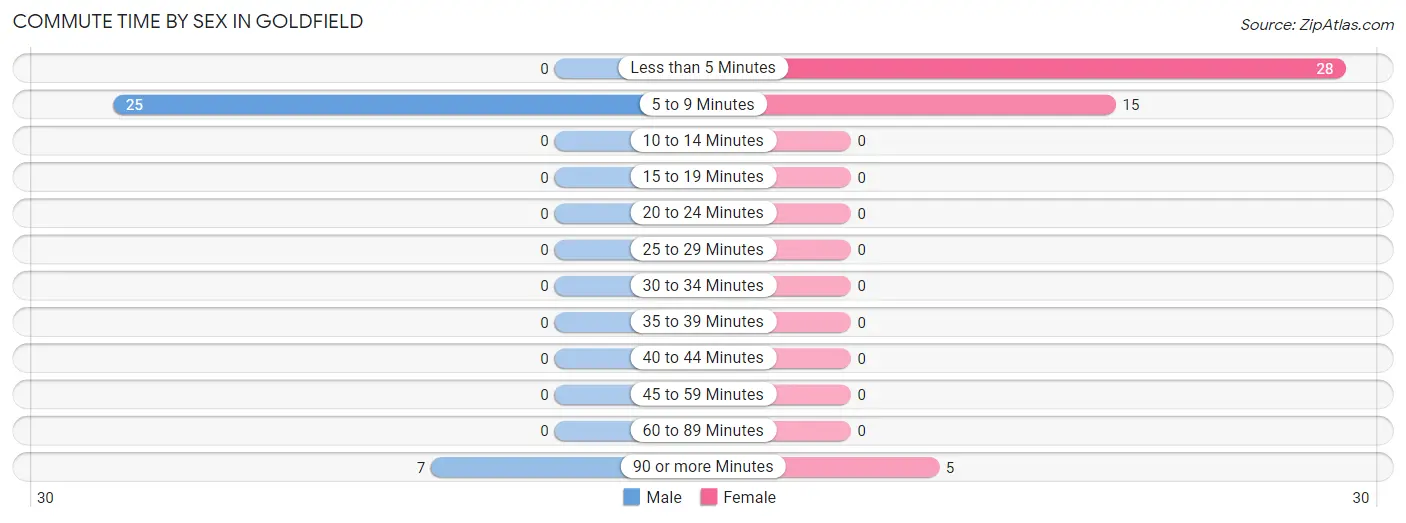
Commute Time by Sex in Goldfield
The most common commute times in Goldfield are 5 to 9 minutes (25 commuters, 78.1%) for males and less than 5 minutes (28 commuters, 58.3%) for females.
| Commute Time | Male | Female |
| Less than 5 Minutes | 0 (0.0%) | 28 (58.3%) |
| 5 to 9 Minutes | 25 (78.1%) | 15 (31.2%) |
| 10 to 14 Minutes | 0 (0.0%) | 0 (0.0%) |
| 15 to 19 Minutes | 0 (0.0%) | 0 (0.0%) |
| 20 to 24 Minutes | 0 (0.0%) | 0 (0.0%) |
| 25 to 29 Minutes | 0 (0.0%) | 0 (0.0%) |
| 30 to 34 Minutes | 0 (0.0%) | 0 (0.0%) |
| 35 to 39 Minutes | 0 (0.0%) | 0 (0.0%) |
| 40 to 44 Minutes | 0 (0.0%) | 0 (0.0%) |
| 45 to 59 Minutes | 0 (0.0%) | 0 (0.0%) |
| 60 to 89 Minutes | 0 (0.0%) | 0 (0.0%) |
| 90 or more Minutes | 7 (21.9%) | 5 (10.4%) |
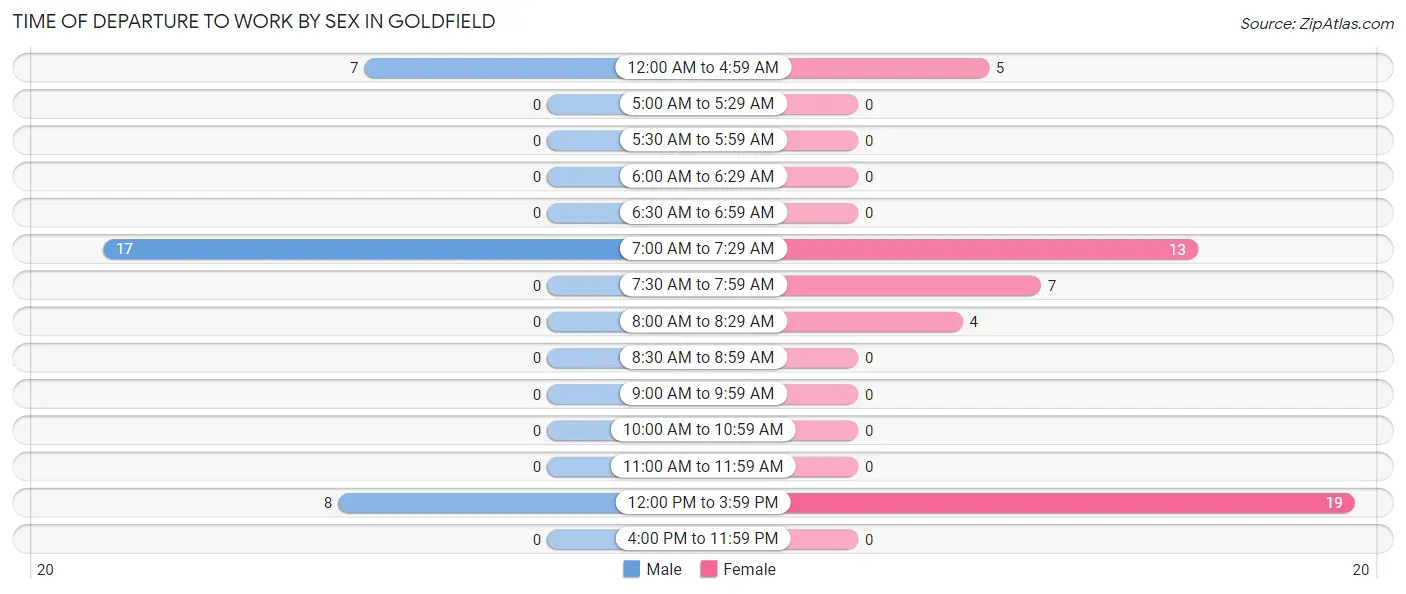
Time of Departure to Work by Sex in Goldfield
The most frequent times of departure to work in Goldfield are 7:00 AM to 7:29 AM (17, 53.1%) for males and 12:00 PM to 3:59 PM (19, 39.6%) for females.
| Time of Departure | Male | Female |
| 12:00 AM to 4:59 AM | 7 (21.9%) | 5 (10.4%) |
| 5:00 AM to 5:29 AM | 0 (0.0%) | 0 (0.0%) |
| 5:30 AM to 5:59 AM | 0 (0.0%) | 0 (0.0%) |
| 6:00 AM to 6:29 AM | 0 (0.0%) | 0 (0.0%) |
| 6:30 AM to 6:59 AM | 0 (0.0%) | 0 (0.0%) |
| 7:00 AM to 7:29 AM | 17 (53.1%) | 13 (27.1%) |
| 7:30 AM to 7:59 AM | 0 (0.0%) | 7 (14.6%) |
| 8:00 AM to 8:29 AM | 0 (0.0%) | 4 (8.3%) |
| 8:30 AM to 8:59 AM | 0 (0.0%) | 0 (0.0%) |
| 9:00 AM to 9:59 AM | 0 (0.0%) | 0 (0.0%) |
| 10:00 AM to 10:59 AM | 0 (0.0%) | 0 (0.0%) |
| 11:00 AM to 11:59 AM | 0 (0.0%) | 0 (0.0%) |
| 12:00 PM to 3:59 PM | 8 (25.0%) | 19 (39.6%) |
| 4:00 PM to 11:59 PM | 0 (0.0%) | 0 (0.0%) |
| Total | 32 (100.0%) | 48 (100.0%) |
Housing Occupancy in Goldfield
Occupancy by Ownership in Goldfield
Of the total 105 dwellings in Goldfield, owner-occupied units account for 83 (79.0%), while renter-occupied units make up 22 (20.9%).
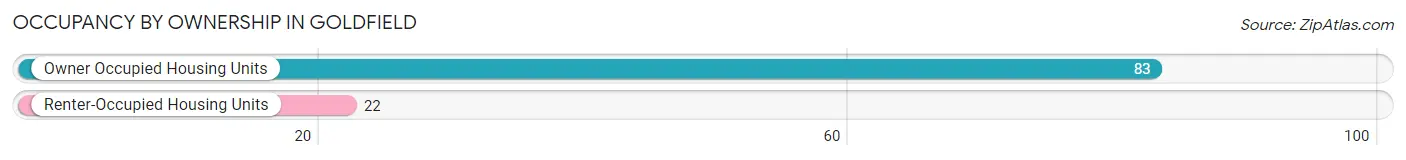
| Occupancy | # Housing Units | % Housing Units |
| Owner Occupied Housing Units | 83 | 79.0% |
| Renter-Occupied Housing Units | 22 | 20.9% |
| Total Occupied Housing Units | 105 | 100.0% |
Occupancy by Household Size in Goldfield
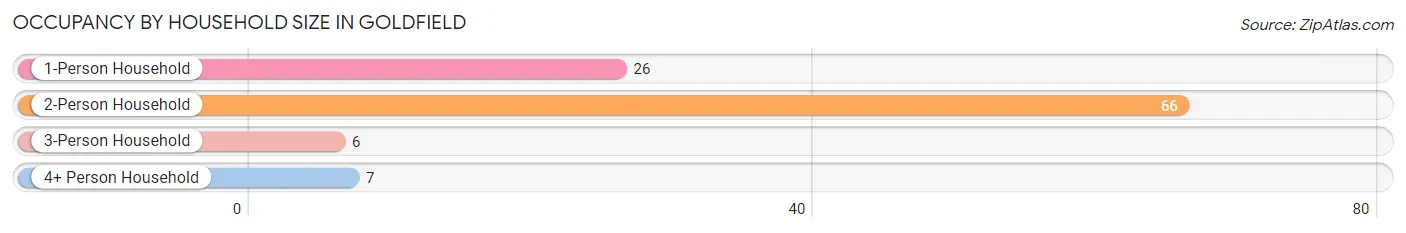
| Household Size | # Housing Units | % Housing Units |
| 1-Person Household | 26 | 24.8% |
| 2-Person Household | 66 | 62.9% |
| 3-Person Household | 6 | 5.7% |
| 4+ Person Household | 7 | 6.7% |
| Total Housing Units | 105 | 100.0% |
Occupancy by Ownership by Household Size in Goldfield
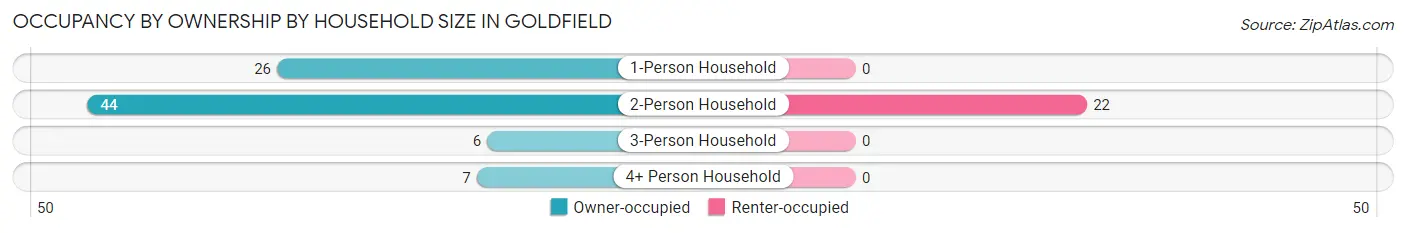
| Household Size | Owner-occupied | Renter-occupied |
| 1-Person Household | 26 (100.0%) | 0 (0.0%) |
| 2-Person Household | 44 (66.7%) | 22 (33.3%) |
| 3-Person Household | 6 (100.0%) | 0 (0.0%) |
| 4+ Person Household | 7 (100.0%) | 0 (0.0%) |
| Total Housing Units | 83 (79.0%) | 22 (20.9%) |
Occupancy by Educational Attainment in Goldfield
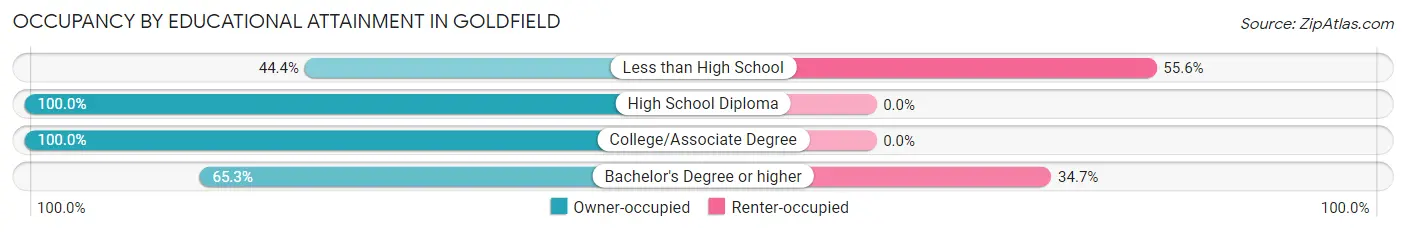
| Household Size | Owner-occupied | Renter-occupied |
| Less than High School | 4 (44.4%) | 5 (55.6%) |
| High School Diploma | 24 (100.0%) | 0 (0.0%) |
| College/Associate Degree | 23 (100.0%) | 0 (0.0%) |
| Bachelor's Degree or higher | 32 (65.3%) | 17 (34.7%) |
Occupancy by Age of Householder in Goldfield
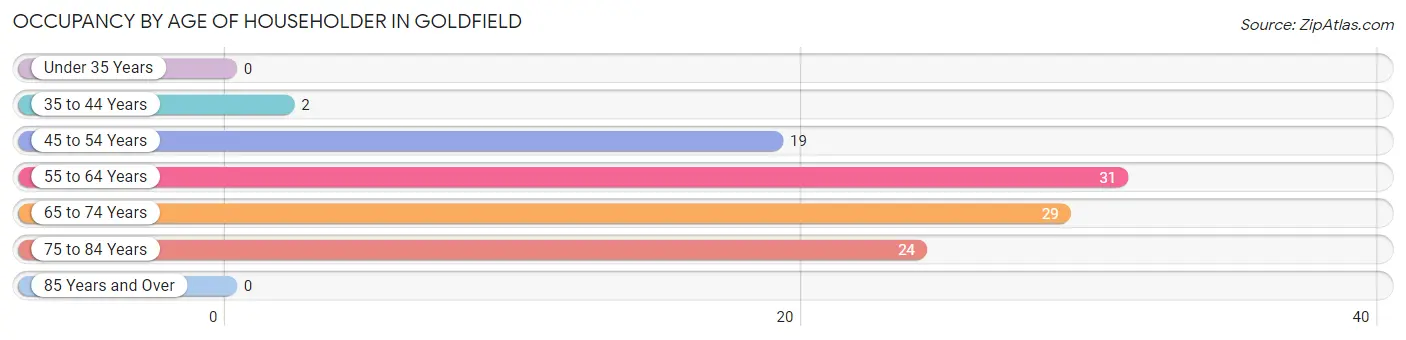
| Age Bracket | # Households | % Households |
| Under 35 Years | 0 | 0.0% |
| 35 to 44 Years | 2 | 1.9% |
| 45 to 54 Years | 19 | 18.1% |
| 55 to 64 Years | 31 | 29.5% |
| 65 to 74 Years | 29 | 27.6% |
| 75 to 84 Years | 24 | 22.9% |
| 85 Years and Over | 0 | 0.0% |
| Total | 105 | 100.0% |
Housing Finances in Goldfield
Median Income by Occupancy in Goldfield
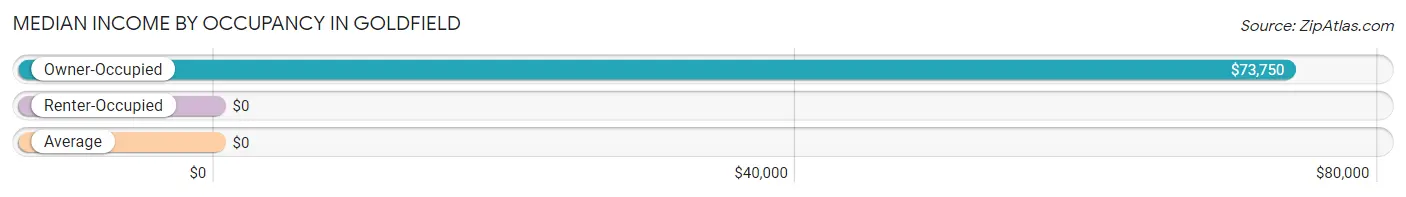
| Occupancy Type | # Households | Median Income |
| Owner-Occupied | 83 (79.0%) | $73,750 |
| Renter-Occupied | 22 (20.9%) | $0 |
| Average | 105 (100.0%) | $0 |
Occupancy by Householder Income Bracket in Goldfield
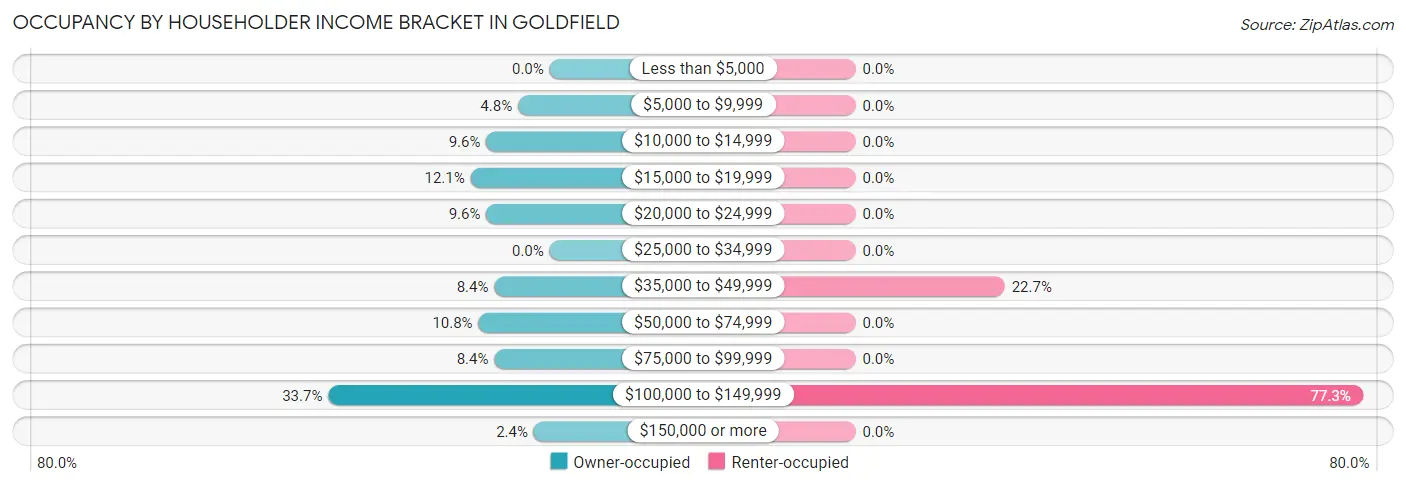
| Income Bracket | Owner-occupied | Renter-occupied |
| Less than $5,000 | 0 (0.0%) | 0 (0.0%) |
| $5,000 to $9,999 | 4 (4.8%) | 0 (0.0%) |
| $10,000 to $14,999 | 8 (9.6%) | 0 (0.0%) |
| $15,000 to $19,999 | 10 (12.0%) | 0 (0.0%) |
| $20,000 to $24,999 | 8 (9.6%) | 0 (0.0%) |
| $25,000 to $34,999 | 0 (0.0%) | 0 (0.0%) |
| $35,000 to $49,999 | 7 (8.4%) | 5 (22.7%) |
| $50,000 to $74,999 | 9 (10.8%) | 0 (0.0%) |
| $75,000 to $99,999 | 7 (8.4%) | 0 (0.0%) |
| $100,000 to $149,999 | 28 (33.7%) | 17 (77.3%) |
| $150,000 or more | 2 (2.4%) | 0 (0.0%) |
| Total | 83 (100.0%) | 22 (100.0%) |
Monthly Housing Cost Tiers in Goldfield
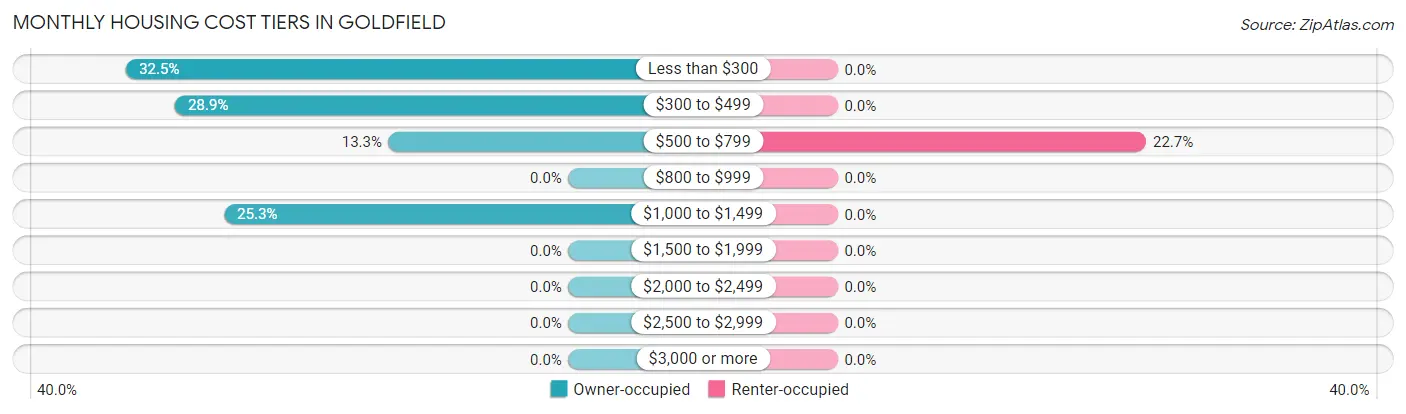
| Monthly Cost | Owner-occupied | Renter-occupied |
| Less than $300 | 27 (32.5%) | 0 (0.0%) |
| $300 to $499 | 24 (28.9%) | 0 (0.0%) |
| $500 to $799 | 11 (13.3%) | 5 (22.7%) |
| $800 to $999 | 0 (0.0%) | 0 (0.0%) |
| $1,000 to $1,499 | 21 (25.3%) | 0 (0.0%) |
| $1,500 to $1,999 | 0 (0.0%) | 0 (0.0%) |
| $2,000 to $2,499 | 0 (0.0%) | 0 (0.0%) |
| $2,500 to $2,999 | 0 (0.0%) | 0 (0.0%) |
| $3,000 or more | 0 (0.0%) | 0 (0.0%) |
| Total | 83 (100.0%) | 22 (100.0%) |
Physical Housing Characteristics in Goldfield
Housing Structures in Goldfield
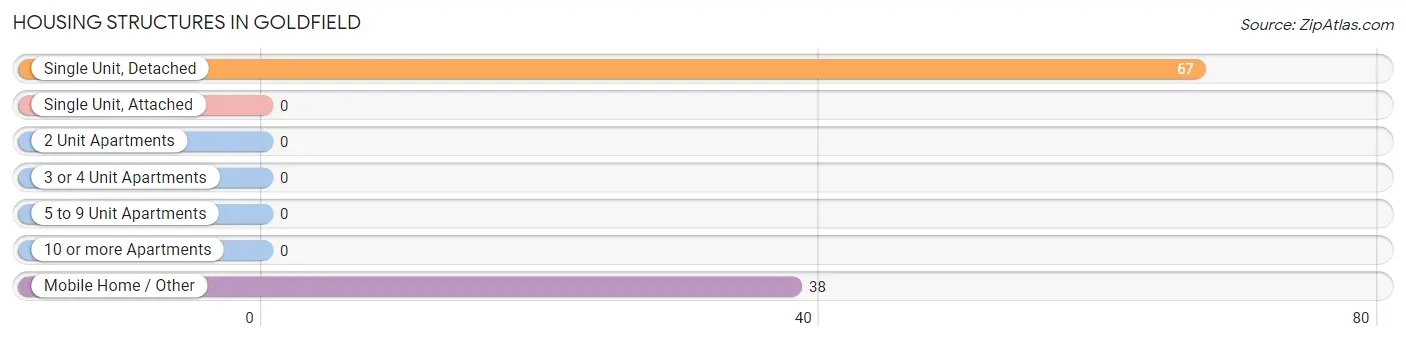
| Structure Type | # Housing Units | % Housing Units |
| Single Unit, Detached | 67 | 63.8% |
| Single Unit, Attached | 0 | 0.0% |
| 2 Unit Apartments | 0 | 0.0% |
| 3 or 4 Unit Apartments | 0 | 0.0% |
| 5 to 9 Unit Apartments | 0 | 0.0% |
| 10 or more Apartments | 0 | 0.0% |
| Mobile Home / Other | 38 | 36.2% |
| Total | 105 | 100.0% |
Housing Structures by Occupancy in Goldfield
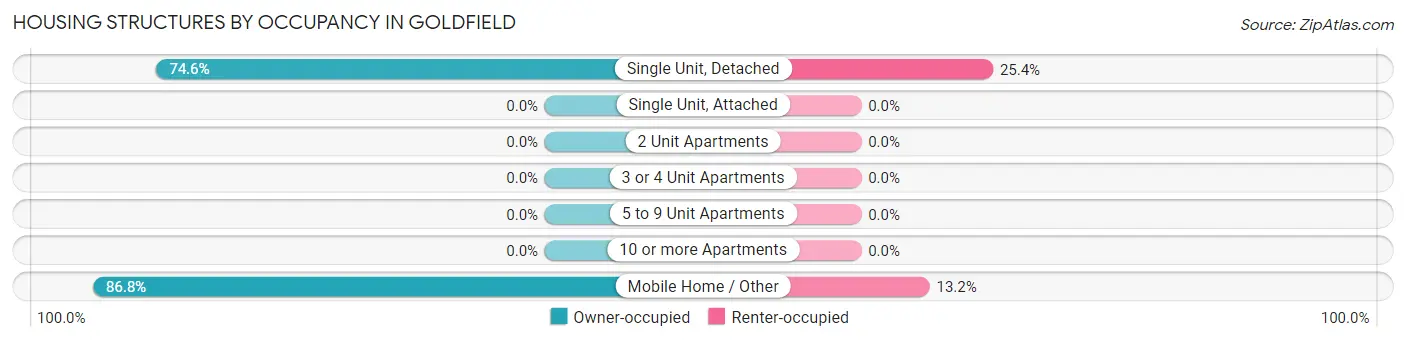
| Structure Type | Owner-occupied | Renter-occupied |
| Single Unit, Detached | 50 (74.6%) | 17 (25.4%) |
| Single Unit, Attached | 0 (0.0%) | 0 (0.0%) |
| 2 Unit Apartments | 0 (0.0%) | 0 (0.0%) |
| 3 or 4 Unit Apartments | 0 (0.0%) | 0 (0.0%) |
| 5 to 9 Unit Apartments | 0 (0.0%) | 0 (0.0%) |
| 10 or more Apartments | 0 (0.0%) | 0 (0.0%) |
| Mobile Home / Other | 33 (86.8%) | 5 (13.2%) |
| Total | 83 (79.0%) | 22 (20.9%) |
Housing Structures by Number of Rooms in Goldfield
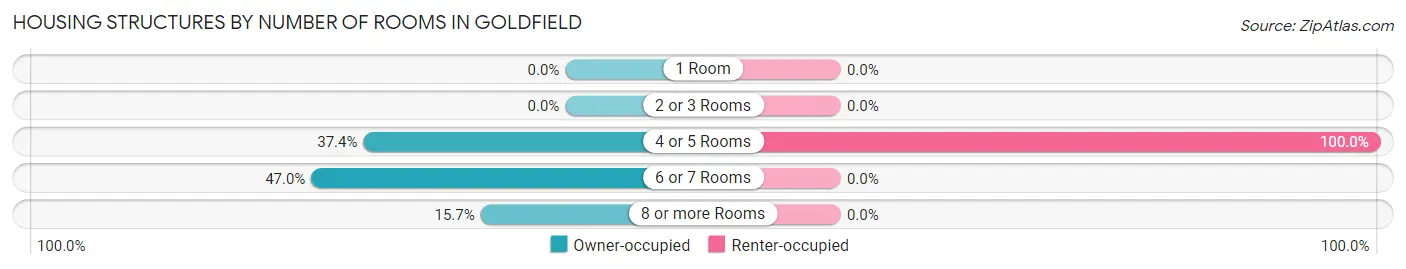
| Number of Rooms | Owner-occupied | Renter-occupied |
| 1 Room | 0 (0.0%) | 0 (0.0%) |
| 2 or 3 Rooms | 0 (0.0%) | 0 (0.0%) |
| 4 or 5 Rooms | 31 (37.3%) | 22 (100.0%) |
| 6 or 7 Rooms | 39 (47.0%) | 0 (0.0%) |
| 8 or more Rooms | 13 (15.7%) | 0 (0.0%) |
| Total | 83 (100.0%) | 22 (100.0%) |
Housing Structure by Heating Type in Goldfield
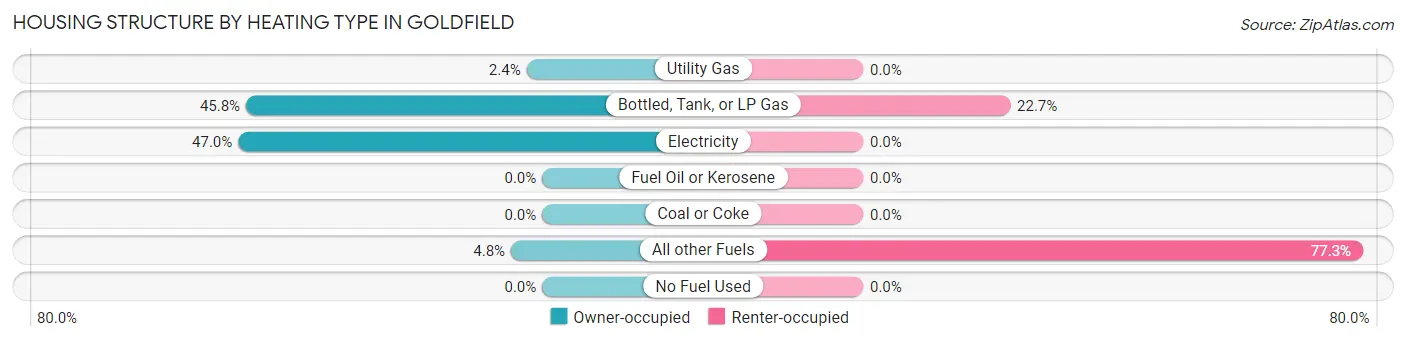
| Heating Type | Owner-occupied | Renter-occupied |
| Utility Gas | 2 (2.4%) | 0 (0.0%) |
| Bottled, Tank, or LP Gas | 38 (45.8%) | 5 (22.7%) |
| Electricity | 39 (47.0%) | 0 (0.0%) |
| Fuel Oil or Kerosene | 0 (0.0%) | 0 (0.0%) |
| Coal or Coke | 0 (0.0%) | 0 (0.0%) |
| All other Fuels | 4 (4.8%) | 17 (77.3%) |
| No Fuel Used | 0 (0.0%) | 0 (0.0%) |
| Total | 83 (100.0%) | 22 (100.0%) |
Household Vehicle Usage in Goldfield
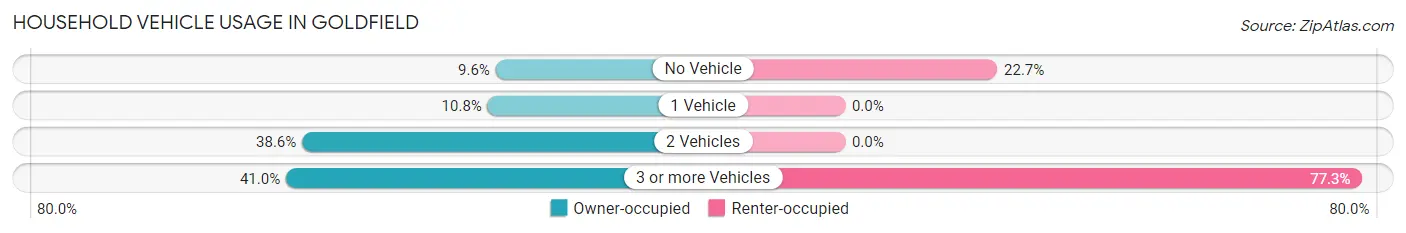
| Vehicles per Household | Owner-occupied | Renter-occupied |
| No Vehicle | 8 (9.6%) | 5 (22.7%) |
| 1 Vehicle | 9 (10.8%) | 0 (0.0%) |
| 2 Vehicles | 32 (38.6%) | 0 (0.0%) |
| 3 or more Vehicles | 34 (41.0%) | 17 (77.3%) |
| Total | 83 (100.0%) | 22 (100.0%) |
Real Estate & Mortgages in Goldfield
Real Estate and Mortgage Overview in Goldfield
| Characteristic | Without Mortgage | With Mortgage |
| Housing Units | 59 | 24 |
| Median Property Value | - | - |
| Median Household Income | - | - |
| Monthly Housing Costs | $314 | $0 |
| Real Estate Taxes | - | - |
Property Value by Mortgage Status in Goldfield
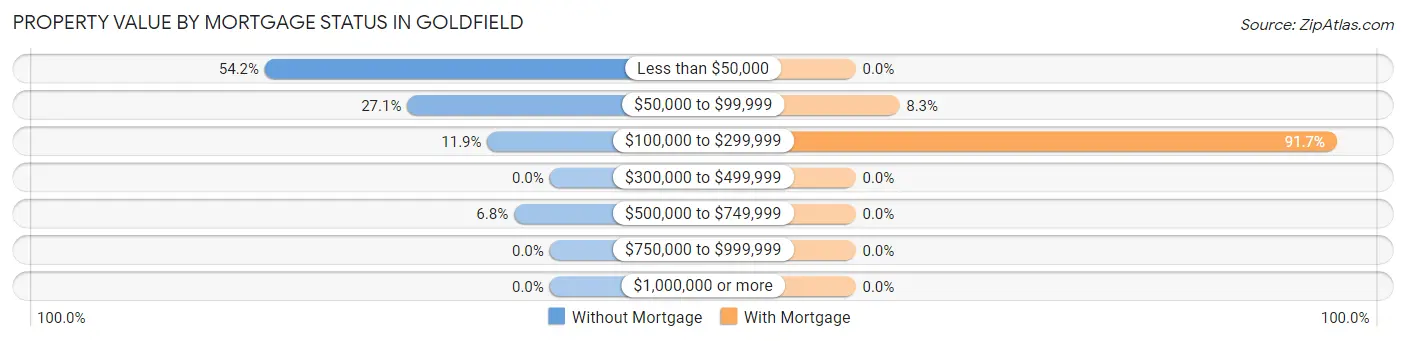
| Property Value | Without Mortgage | With Mortgage |
| Less than $50,000 | 32 (54.2%) | 0 (0.0%) |
| $50,000 to $99,999 | 16 (27.1%) | 2 (8.3%) |
| $100,000 to $299,999 | 7 (11.9%) | 22 (91.7%) |
| $300,000 to $499,999 | 0 (0.0%) | 0 (0.0%) |
| $500,000 to $749,999 | 4 (6.8%) | 0 (0.0%) |
| $750,000 to $999,999 | 0 (0.0%) | 0 (0.0%) |
| $1,000,000 or more | 0 (0.0%) | 0 (0.0%) |
| Total | 59 (100.0%) | 24 (100.0%) |
Household Income by Mortgage Status in Goldfield
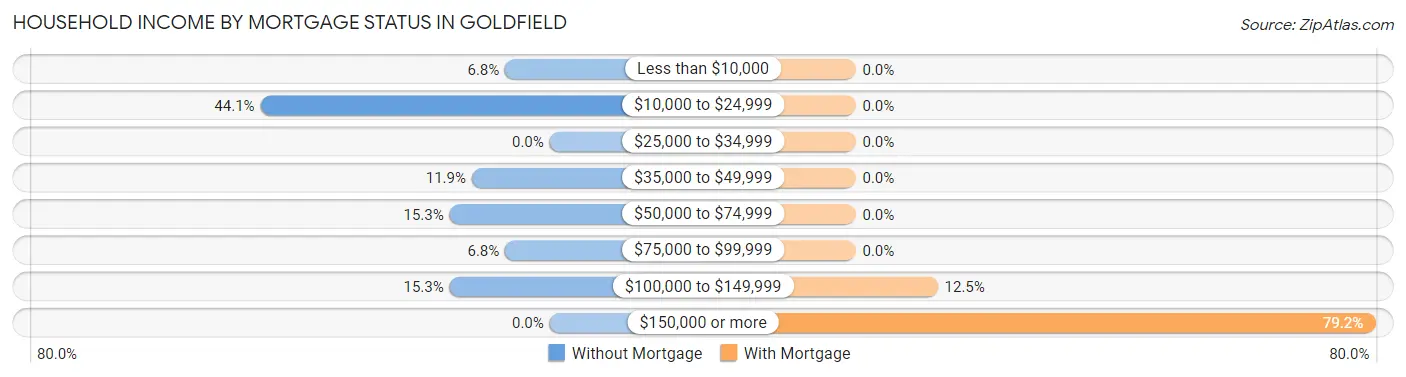
| Household Income | Without Mortgage | With Mortgage |
| Less than $10,000 | 4 (6.8%) | 0 (0.0%) |
| $10,000 to $24,999 | 26 (44.1%) | 0 (0.0%) |
| $25,000 to $34,999 | 0 (0.0%) | 0 (0.0%) |
| $35,000 to $49,999 | 7 (11.9%) | 0 (0.0%) |
| $50,000 to $74,999 | 9 (15.2%) | 0 (0.0%) |
| $75,000 to $99,999 | 4 (6.8%) | 0 (0.0%) |
| $100,000 to $149,999 | 9 (15.2%) | 3 (12.5%) |
| $150,000 or more | 0 (0.0%) | 19 (79.2%) |
| Total | 59 (100.0%) | 24 (100.0%) |
Property Value to Household Income Ratio in Goldfield
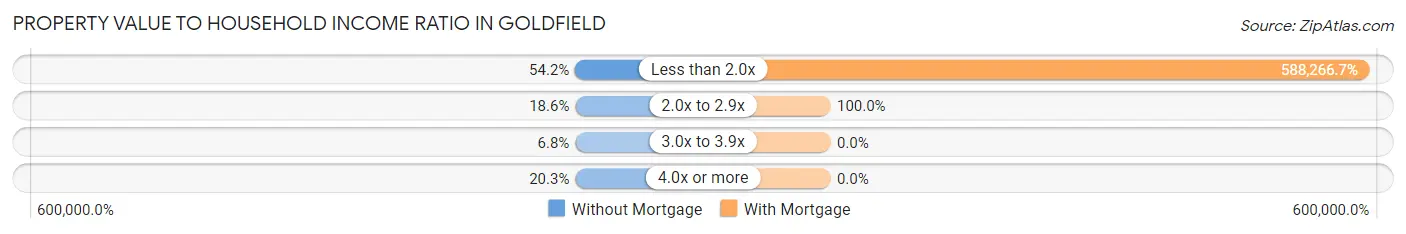
| Value-to-Income Ratio | Without Mortgage | With Mortgage |
| Less than 2.0x | 32 (54.2%) | 141,184 (588,266.7%) |
| 2.0x to 2.9x | 11 (18.6%) | 24 (100.0%) |
| 3.0x to 3.9x | 4 (6.8%) | 0 (0.0%) |
| 4.0x or more | 12 (20.3%) | 0 (0.0%) |
| Total | 59 (100.0%) | 24 (100.0%) |
Real Estate Taxes by Mortgage Status in Goldfield
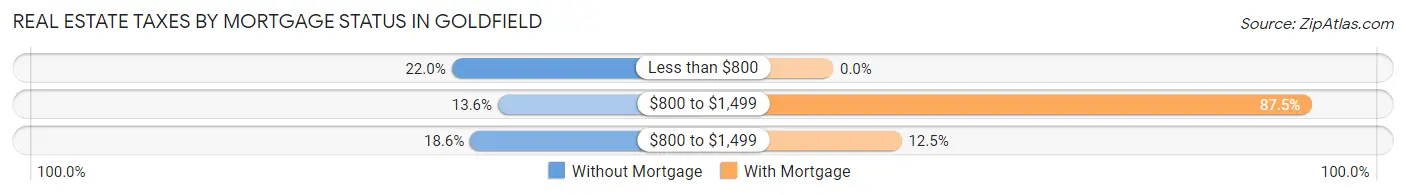
| Property Taxes | Without Mortgage | With Mortgage |
| Less than $800 | 13 (22.0%) | 0 (0.0%) |
| $800 to $1,499 | 8 (13.6%) | 21 (87.5%) |
| $800 to $1,499 | 11 (18.6%) | 3 (12.5%) |
| Total | 59 (100.0%) | 24 (100.0%) |
Health & Disability in Goldfield
Health Insurance Coverage by Age in Goldfield
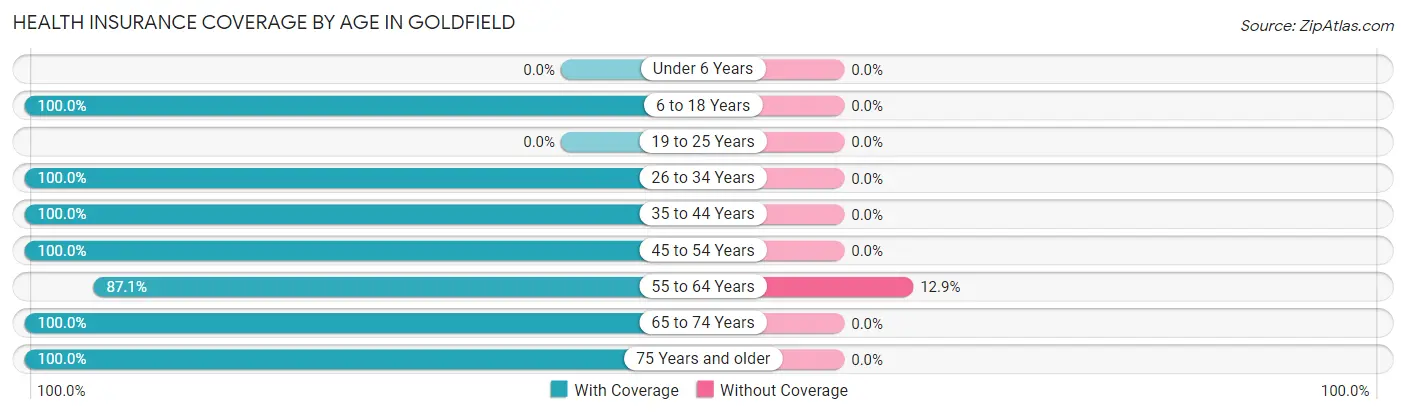
| Age Bracket | With Coverage | Without Coverage |
| Under 6 Years | 0 (0.0%) | 0 (0.0%) |
| 6 to 18 Years | 10 (100.0%) | 0 (0.0%) |
| 19 to 25 Years | 0 (0.0%) | 0 (0.0%) |
| 26 to 34 Years | 5 (100.0%) | 0 (0.0%) |
| 35 to 44 Years | 2 (100.0%) | 0 (0.0%) |
| 45 to 54 Years | 35 (100.0%) | 0 (0.0%) |
| 55 to 64 Years | 61 (87.1%) | 9 (12.9%) |
| 65 to 74 Years | 50 (100.0%) | 0 (0.0%) |
| 75 Years and older | 33 (100.0%) | 0 (0.0%) |
| Total | 196 (95.6%) | 9 (4.4%) |
Health Insurance Coverage by Citizenship Status in Goldfield
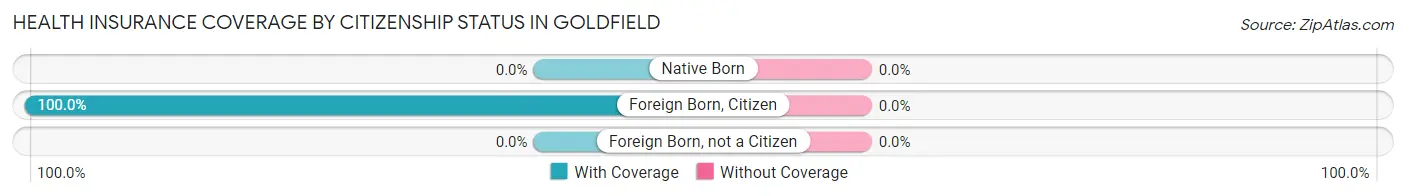
| Citizenship Status | With Coverage | Without Coverage |
| Native Born | 0 (0.0%) | 0 (0.0%) |
| Foreign Born, Citizen | 10 (100.0%) | 0 (0.0%) |
| Foreign Born, not a Citizen | 0 (0.0%) | 0 (0.0%) |
Health Insurance Coverage by Household Income in Goldfield
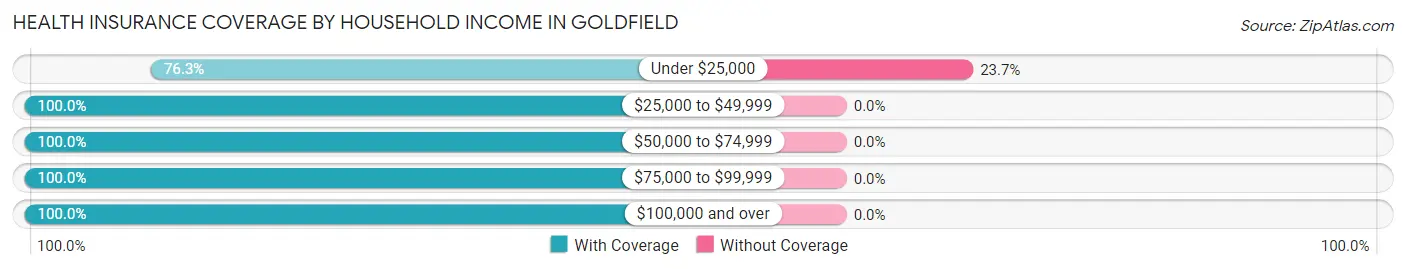
| Household Income | With Coverage | Without Coverage |
| Under $25,000 | 29 (76.3%) | 9 (23.7%) |
| $25,000 to $49,999 | 44 (100.0%) | 0 (0.0%) |
| $50,000 to $74,999 | 20 (100.0%) | 0 (0.0%) |
| $75,000 to $99,999 | 12 (100.0%) | 0 (0.0%) |
| $100,000 and over | 91 (100.0%) | 0 (0.0%) |
Public vs Private Health Insurance Coverage by Age in Goldfield
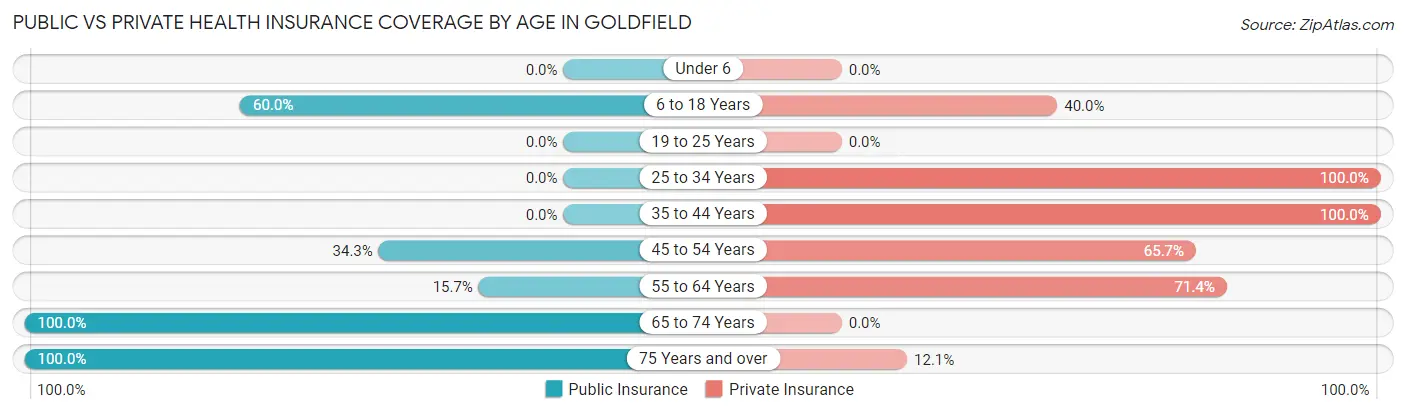
| Age Bracket | Public Insurance | Private Insurance |
| Under 6 | 0 (0.0%) | 0 (0.0%) |
| 6 to 18 Years | 6 (60.0%) | 4 (40.0%) |
| 19 to 25 Years | 0 (0.0%) | 0 (0.0%) |
| 25 to 34 Years | 0 (0.0%) | 5 (100.0%) |
| 35 to 44 Years | 0 (0.0%) | 2 (100.0%) |
| 45 to 54 Years | 12 (34.3%) | 23 (65.7%) |
| 55 to 64 Years | 11 (15.7%) | 50 (71.4%) |
| 65 to 74 Years | 50 (100.0%) | 0 (0.0%) |
| 75 Years and over | 33 (100.0%) | 4 (12.1%) |
| Total | 112 (54.6%) | 88 (42.9%) |
Disability Status by Sex by Age in Goldfield
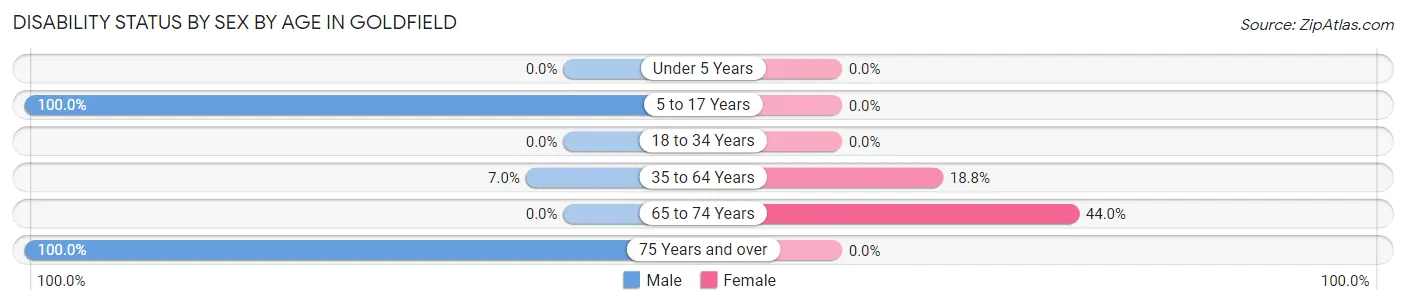
| Age Bracket | Male | Female |
| Under 5 Years | 0 (0.0%) | 0 (0.0%) |
| 5 to 17 Years | 4 (100.0%) | 0 (0.0%) |
| 18 to 34 Years | 0 (0.0%) | 0 (0.0%) |
| 35 to 64 Years | 3 (7.0%) | 12 (18.8%) |
| 65 to 74 Years | 0 (0.0%) | 11 (44.0%) |
| 75 Years and over | 33 (100.0%) | 0 (0.0%) |
Disability Class by Sex by Age in Goldfield
Disability Class: Hearing Difficulty
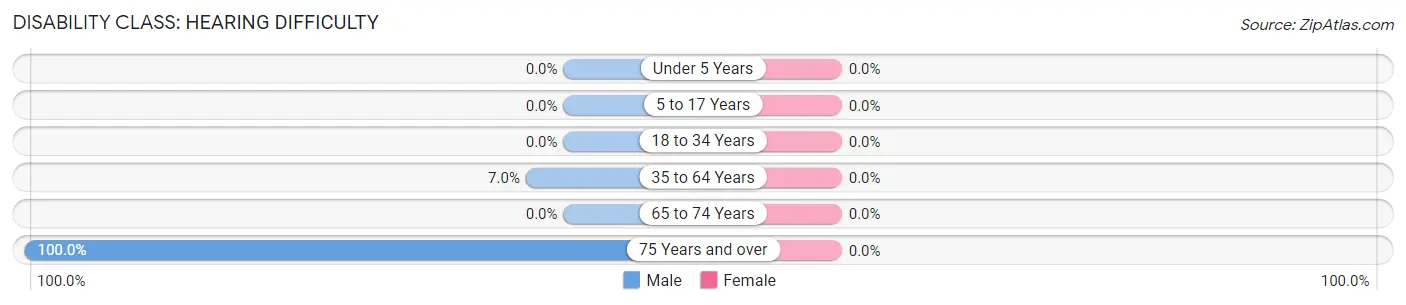
| Age Bracket | Male | Female |
| Under 5 Years | 0 (0.0%) | 0 (0.0%) |
| 5 to 17 Years | 0 (0.0%) | 0 (0.0%) |
| 18 to 34 Years | 0 (0.0%) | 0 (0.0%) |
| 35 to 64 Years | 3 (7.0%) | 0 (0.0%) |
| 65 to 74 Years | 0 (0.0%) | 0 (0.0%) |
| 75 Years and over | 33 (100.0%) | 0 (0.0%) |
Disability Class: Vision Difficulty
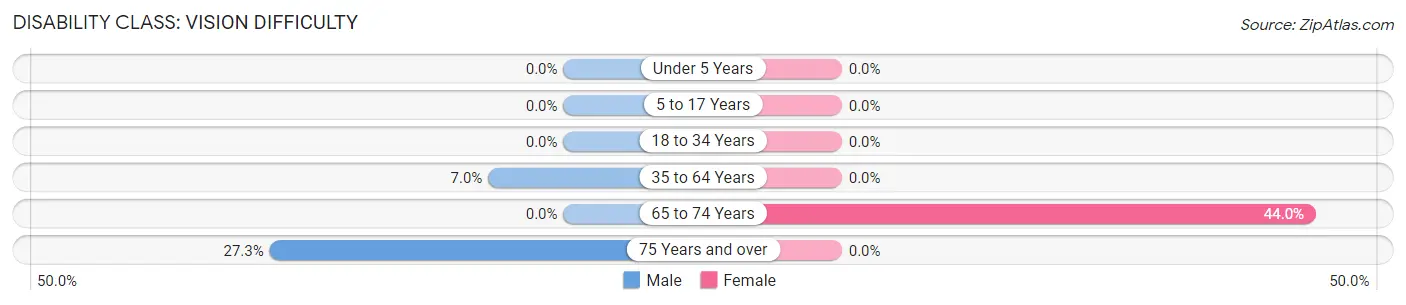
| Age Bracket | Male | Female |
| Under 5 Years | 0 (0.0%) | 0 (0.0%) |
| 5 to 17 Years | 0 (0.0%) | 0 (0.0%) |
| 18 to 34 Years | 0 (0.0%) | 0 (0.0%) |
| 35 to 64 Years | 3 (7.0%) | 0 (0.0%) |
| 65 to 74 Years | 0 (0.0%) | 11 (44.0%) |
| 75 Years and over | 9 (27.3%) | 0 (0.0%) |
Disability Class: Cognitive Difficulty
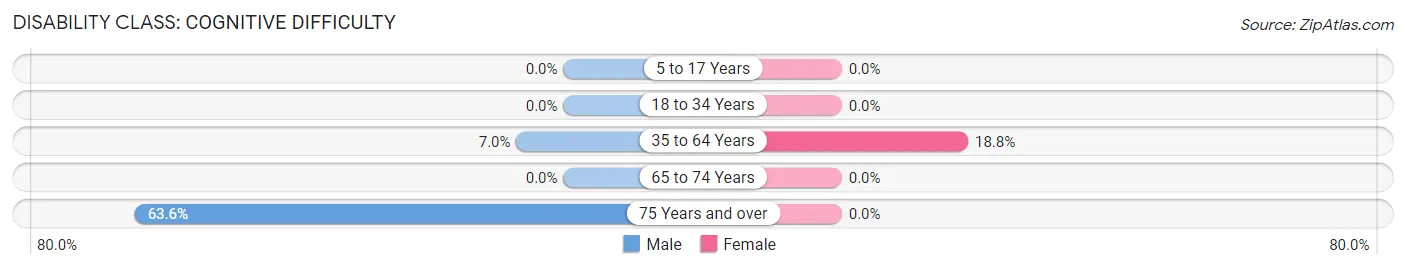
| Age Bracket | Male | Female |
| 5 to 17 Years | 0 (0.0%) | 0 (0.0%) |
| 18 to 34 Years | 0 (0.0%) | 0 (0.0%) |
| 35 to 64 Years | 3 (7.0%) | 12 (18.8%) |
| 65 to 74 Years | 0 (0.0%) | 0 (0.0%) |
| 75 Years and over | 21 (63.6%) | 0 (0.0%) |
Disability Class: Ambulatory Difficulty
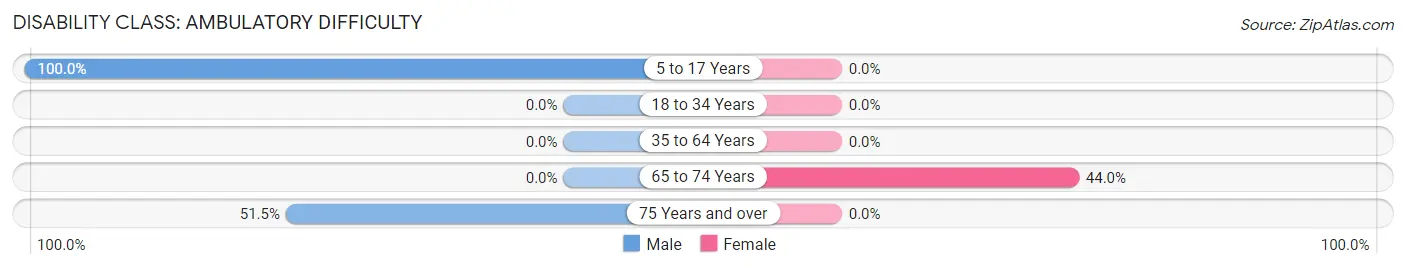
| Age Bracket | Male | Female |
| 5 to 17 Years | 4 (100.0%) | 0 (0.0%) |
| 18 to 34 Years | 0 (0.0%) | 0 (0.0%) |
| 35 to 64 Years | 0 (0.0%) | 0 (0.0%) |
| 65 to 74 Years | 0 (0.0%) | 11 (44.0%) |
| 75 Years and over | 17 (51.5%) | 0 (0.0%) |
Disability Class: Self-Care Difficulty
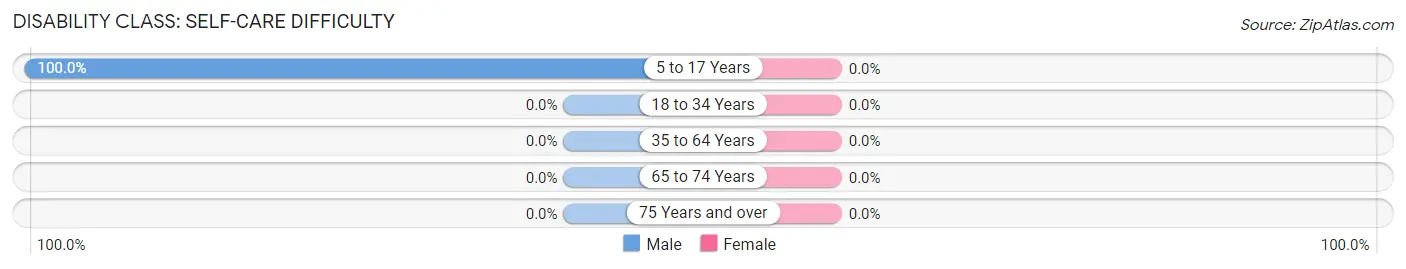
| Age Bracket | Male | Female |
| 5 to 17 Years | 4 (100.0%) | 0 (0.0%) |
| 18 to 34 Years | 0 (0.0%) | 0 (0.0%) |
| 35 to 64 Years | 0 (0.0%) | 0 (0.0%) |
| 65 to 74 Years | 0 (0.0%) | 0 (0.0%) |
| 75 Years and over | 0 (0.0%) | 0 (0.0%) |
Technology Access in Goldfield
Computing Device Access in Goldfield
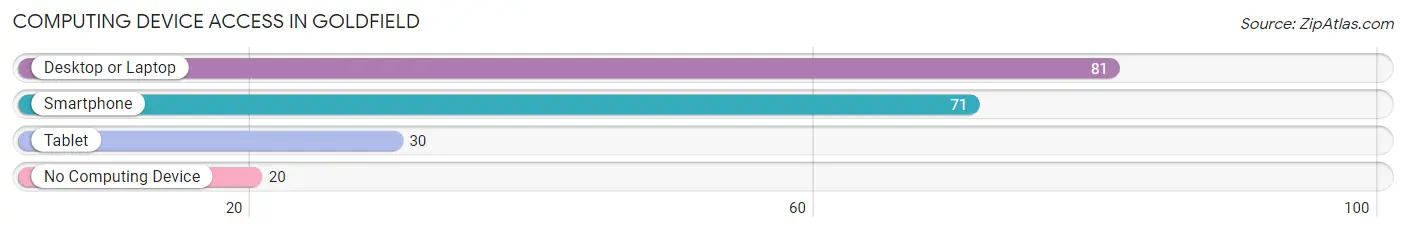
| Device Type | # Households | % Households |
| Desktop or Laptop | 81 | 77.1% |
| Smartphone | 71 | 67.6% |
| Tablet | 30 | 28.6% |
| No Computing Device | 20 | 19.1% |
| Total | 105 | 100.0% |
Internet Access in Goldfield
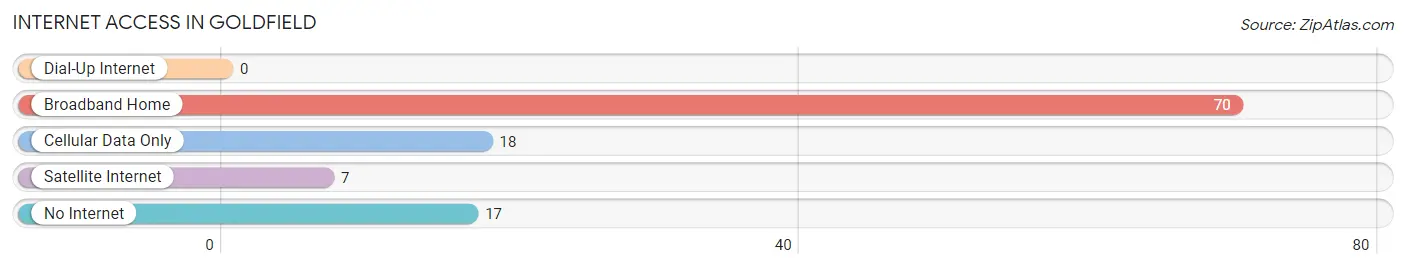
| Internet Type | # Households | % Households |
| Dial-Up Internet | 0 | 0.0% |
| Broadband Home | 70 | 66.7% |
| Cellular Data Only | 18 | 17.1% |
| Satellite Internet | 7 | 6.7% |
| No Internet | 17 | 16.2% |
| Total | 105 | 100.0% |
Goldfield Summary
Goldfield, Nevada is a small town located in Esmeralda County, Nevada. It is situated in the foothills of the Toiyabe Range, approximately halfway between Tonopah and Las Vegas. The town was founded in 1902 and was once a thriving mining town. It is now a ghost town, with a population of only about 200 people.
History
Goldfield was founded in 1902 by miners who had discovered gold in the area. The town quickly grew to a population of over 20,000 people, making it the largest city in Nevada at the time. The town was home to several saloons, hotels, and casinos, as well as a red light district. The town was also home to several large mines, including the Goldfield Consolidated Mines Company, which was the largest gold mine in the world at the time.
The town's population began to decline in the 1910s, as the gold deposits began to run out. By the 1920s, the population had dropped to only a few hundred people. The town was further devastated by a fire in 1923, which destroyed much of the town. The town never recovered from the fire, and the population continued to decline. By the 1950s, the population had dropped to only a few dozen people.
Geography
Goldfield is located in Esmeralda County, Nevada. It is situated in the foothills of the Toiyabe Range, approximately halfway between Tonopah and Las Vegas. The town is located at an elevation of 4,921 feet (1,499 m). The town is surrounded by desert and mountains, and is located in a semi-arid climate.
Economy
Goldfield's economy is largely based on tourism. The town is a popular destination for tourists who are interested in exploring the town's history and its abandoned buildings. The town also has a few small businesses, including a cafe, a gift shop, and a museum.
Demographics
As of the 2010 census, Goldfield had a population of 198 people. The racial makeup of the town was 95.5% White, 0.5% African American, 0.5% Native American, 0.5% Asian, 0.5% Pacific Islander, and 2.0% from two or more races. The median household income was $25,000, and the median family income was $30,000.
Conclusion
Goldfield, Nevada is a small town located in Esmeralda County, Nevada. It was once a thriving mining town, but is now a ghost town with a population of only about 200 people. The town's economy is largely based on tourism, and it is a popular destination for tourists who are interested in exploring the town's history and its abandoned buildings. The town has a population of 198 people, with a median household income of $25,000 and a median family income of $30,000.
Common Questions
What is Per Capita Income in Goldfield?
Per Capita income in Goldfield is $41,050.
What is the Median Family Income in Goldfield?
Median Family Income in Goldfield is $140,987.
What is Income or Wage Gap in Goldfield?
Income or Wage Gap in Goldfield is 1.7%.
Women in Goldfield earn 98.3 cents for every dollar earned by a man.
What is Inequality or Gini Index in Goldfield?
Inequality or Gini Index in Goldfield is 0.36.
What is the Total Population of Goldfield?
Total Population of Goldfield is 212.
What is the Total Male Population of Goldfield?
Total Male Population of Goldfield is 112.
What is the Total Female Population of Goldfield?
Total Female Population of Goldfield is 100.
What is the Ratio of Males per 100 Females in Goldfield?
There are 112.00 Males per 100 Females in Goldfield.
What is the Ratio of Females per 100 Males in Goldfield?
There are 89.29 Females per 100 Males in Goldfield.
What is the Median Population Age in Goldfield?
Median Population Age in Goldfield is 58.5 Years.
What is the Average Family Size in Goldfield
Average Family Size in Goldfield is 2.2 People.
What is the Average Household Size in Goldfield
Average Household Size in Goldfield is 1.9 People.
How Large is the Labor Force in Goldfield?
There are 88 People in the Labor Forcein in Goldfield.
What is the Percentage of People in the Labor Force in Goldfield?
42.3% of People are in the Labor Force in Goldfield.
What is the Unemployment Rate in Goldfield?
Unemployment Rate in Goldfield is 9.1%.