Ferron, UT Map & Demographics
Ferron Map
Ferron Overview
$24,069
PER CAPITA INCOME
$79,886
AVG FAMILY INCOME
$65,913
AVG HOUSEHOLD INCOME
77.7%
WAGE / INCOME GAP [ % ]
22.3¢/ $1
WAGE / INCOME GAP [ $ ]
0.40
INEQUALITY / GINI INDEX
1,360
TOTAL POPULATION
597
MALE POPULATION
763
FEMALE POPULATION
78.24
MALES / 100 FEMALES
127.81
FEMALES / 100 MALES
39.2
MEDIAN AGE
3.5
AVG FAMILY SIZE
2.7
AVG HOUSEHOLD SIZE
549
LABOR FORCE [ PEOPLE ]
52.3%
PERCENT IN LABOR FORCE
11.8%
UNEMPLOYMENT RATE
Ferron Zip Codes
Ferron Area Codes
Income in Ferron
Income Overview in Ferron
Per Capita Income in Ferron is $24,069, while median incomes of families and households are $79,886 and $65,913 respectively.
| Characteristic | Number | Measure |
| Per Capita Income | 1,360 | $24,069 |
| Median Family Income | 321 | $79,886 |
| Mean Family Income | 321 | $88,325 |
| Median Household Income | 483 | $65,913 |
| Mean Household Income | 483 | $66,294 |
| Income Deficit | 321 | $0 |
| Wage / Income Gap (%) | 1,360 | 77.70% |
| Wage / Income Gap ($) | 1,360 | 22.30¢ per $1 |
| Gini / Inequality Index | 1,360 | 0.40 |
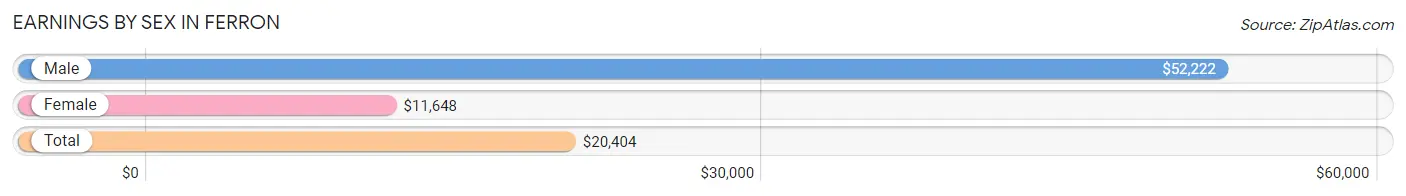
Earnings by Sex in Ferron
Average Earnings in Ferron are $20,404, $52,222 for men and $11,648 for women, a difference of 77.7%.
| Sex | Number | Average Earnings |
| Male | 310 (49.0%) | $52,222 |
| Female | 323 (51.0%) | $11,648 |
| Total | 633 (100.0%) | $20,404 |
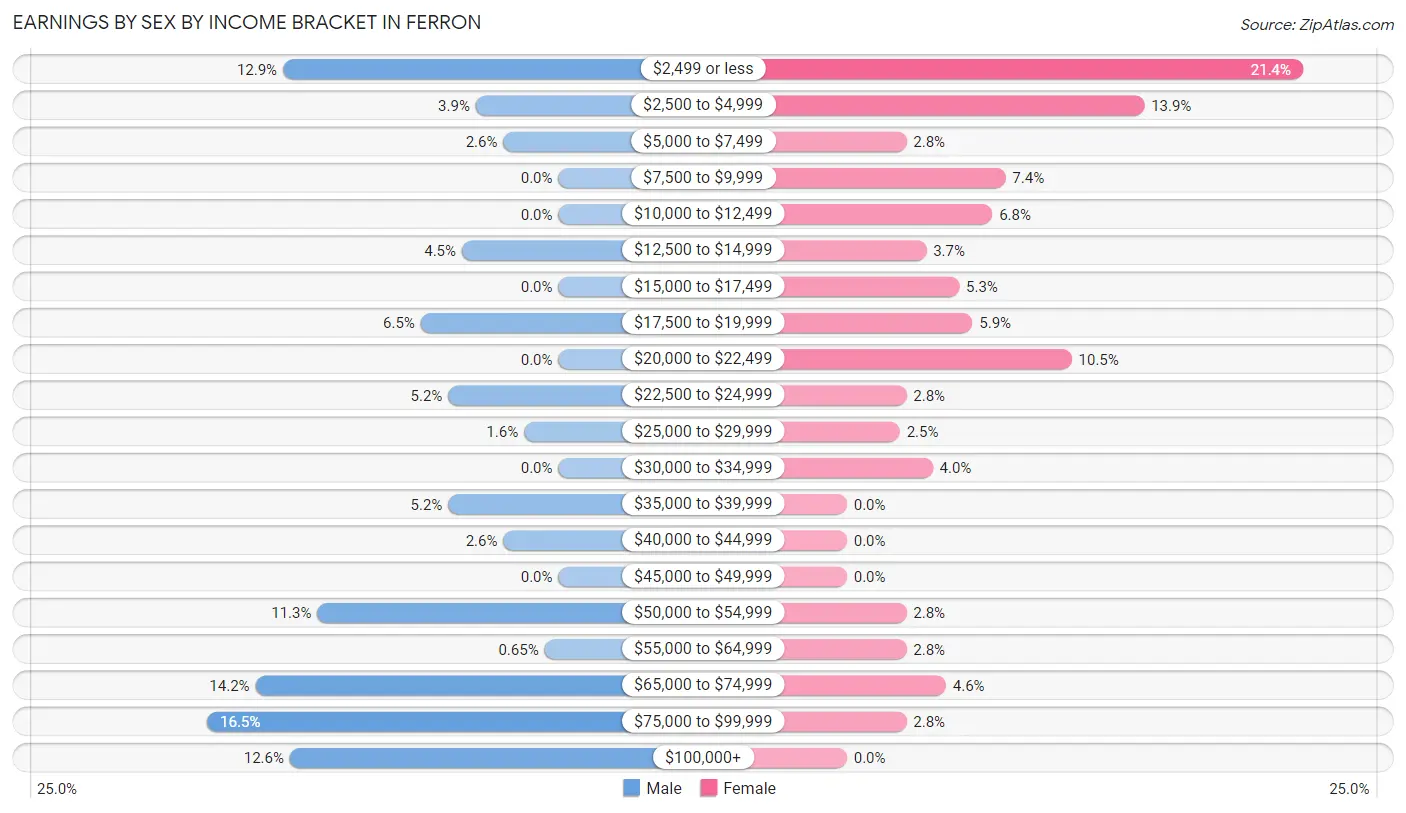
Earnings by Sex by Income Bracket in Ferron
The most common earnings brackets in Ferron are $75,000 to $99,999 for men (51 | 16.5%) and $2,499 or less for women (69 | 21.4%).
| Income | Male | Female |
| $2,499 or less | 40 (12.9%) | 69 (21.4%) |
| $2,500 to $4,999 | 12 (3.9%) | 45 (13.9%) |
| $5,000 to $7,499 | 8 (2.6%) | 9 (2.8%) |
| $7,500 to $9,999 | 0 (0.0%) | 24 (7.4%) |
| $10,000 to $12,499 | 0 (0.0%) | 22 (6.8%) |
| $12,500 to $14,999 | 14 (4.5%) | 12 (3.7%) |
| $15,000 to $17,499 | 0 (0.0%) | 17 (5.3%) |
| $17,500 to $19,999 | 20 (6.5%) | 19 (5.9%) |
| $20,000 to $22,499 | 0 (0.0%) | 34 (10.5%) |
| $22,500 to $24,999 | 16 (5.2%) | 9 (2.8%) |
| $25,000 to $29,999 | 5 (1.6%) | 8 (2.5%) |
| $30,000 to $34,999 | 0 (0.0%) | 13 (4.0%) |
| $35,000 to $39,999 | 16 (5.2%) | 0 (0.0%) |
| $40,000 to $44,999 | 8 (2.6%) | 0 (0.0%) |
| $45,000 to $49,999 | 0 (0.0%) | 0 (0.0%) |
| $50,000 to $54,999 | 35 (11.3%) | 9 (2.8%) |
| $55,000 to $64,999 | 2 (0.6%) | 9 (2.8%) |
| $65,000 to $74,999 | 44 (14.2%) | 15 (4.6%) |
| $75,000 to $99,999 | 51 (16.5%) | 9 (2.8%) |
| $100,000+ | 39 (12.6%) | 0 (0.0%) |
| Total | 310 (100.0%) | 323 (100.0%) |
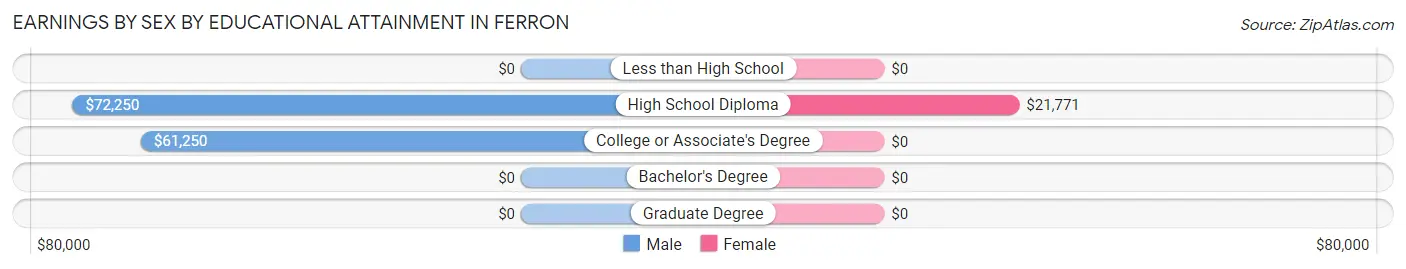
Earnings by Sex by Educational Attainment in Ferron
Average earnings in Ferron are $69,844 for men and $16,912 for women, a difference of 75.8%. Men with an educational attainment of high school diploma enjoy the highest average annual earnings of $72,250, while those with college or associate's degree education earn the least with $61,250. Women with an educational attainment of high school diploma earn the most with the average annual earnings of $21,771, while those with high school diploma education have the smallest earnings of $21,771.
| Educational Attainment | Male Income | Female Income |
| Less than High School | - | - |
| High School Diploma | $72,250 | $21,771 |
| College or Associate's Degree | $61,250 | $0 |
| Bachelor's Degree | - | - |
| Graduate Degree | - | - |
| Total | $69,844 | $16,912 |
Family Income in Ferron
Family Income Brackets in Ferron
According to the Ferron family income data, there are 76 families falling into the $100,000 to $149,999 income range, which is the most common income bracket and makes up 23.7% of all families.
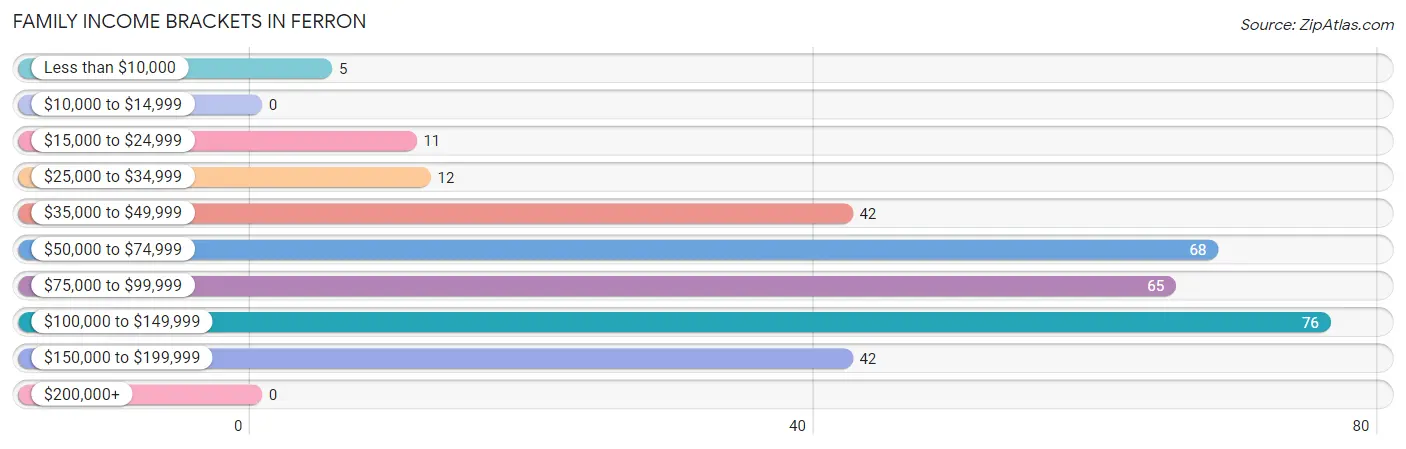
| Income Bracket | # Families | % Families |
| Less than $10,000 | 5 | 1.6% |
| $10,000 to $14,999 | 0 | 0.0% |
| $15,000 to $24,999 | 11 | 3.4% |
| $25,000 to $34,999 | 12 | 3.7% |
| $35,000 to $49,999 | 42 | 13.1% |
| $50,000 to $74,999 | 68 | 21.2% |
| $75,000 to $99,999 | 65 | 20.2% |
| $100,000 to $149,999 | 76 | 23.7% |
| $150,000 to $199,999 | 42 | 13.1% |
| $200,000+ | 0 | 0.0% |
Family Income by Famaliy Size in Ferron
3-person families (26 | 8.1%) account for the highest median family income in Ferron with $105,000 per family, while 2-person families (170 | 53.0%) have the highest median income of $38,646 per family member.
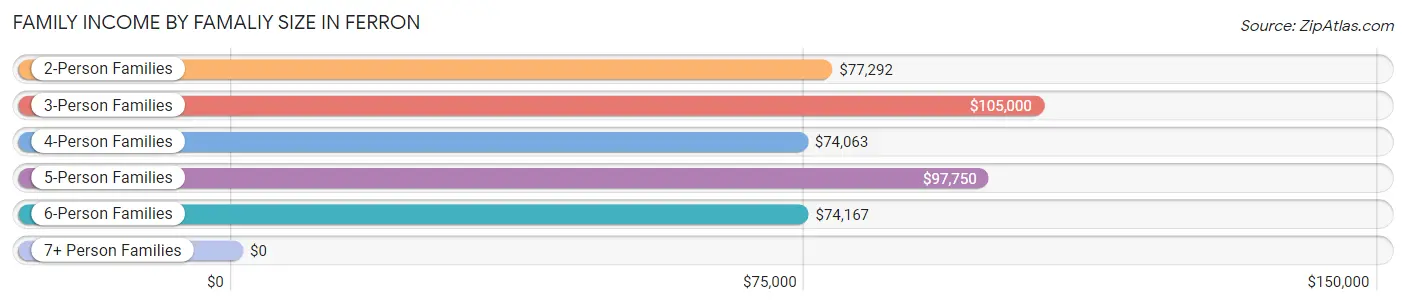
| Income Bracket | # Families | Median Income |
| 2-Person Families | 170 (53.0%) | $77,292 |
| 3-Person Families | 26 (8.1%) | $105,000 |
| 4-Person Families | 48 (14.9%) | $74,063 |
| 5-Person Families | 47 (14.6%) | $97,750 |
| 6-Person Families | 30 (9.3%) | $74,167 |
| 7+ Person Families | 0 (0.0%) | $0 |
| Total | 321 (100.0%) | $79,886 |
Family Income by Number of Earners in Ferron
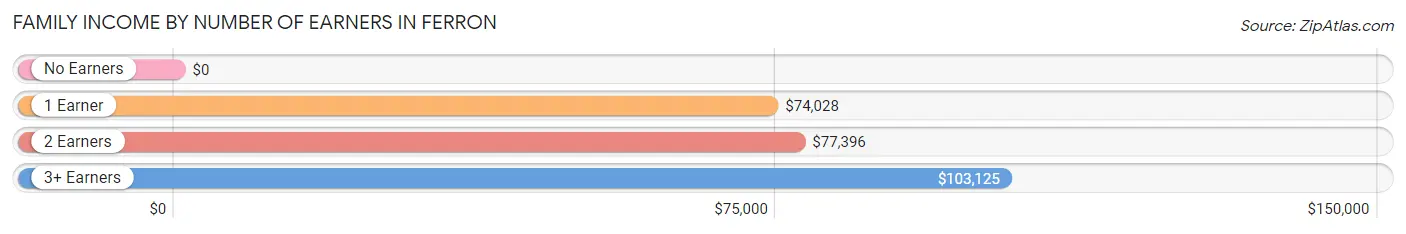
| Number of Earners | # Families | Median Income |
| No Earners | 58 (18.1%) | $0 |
| 1 Earner | 113 (35.2%) | $74,028 |
| 2 Earners | 99 (30.8%) | $77,396 |
| 3+ Earners | 51 (15.9%) | $103,125 |
| Total | 321 (100.0%) | $79,886 |
Household Income in Ferron
Household Income Brackets in Ferron
With 86 households falling in the category, the $50,000 to $74,999 income range is the most frequent in Ferron, accounting for 17.8% of all households.
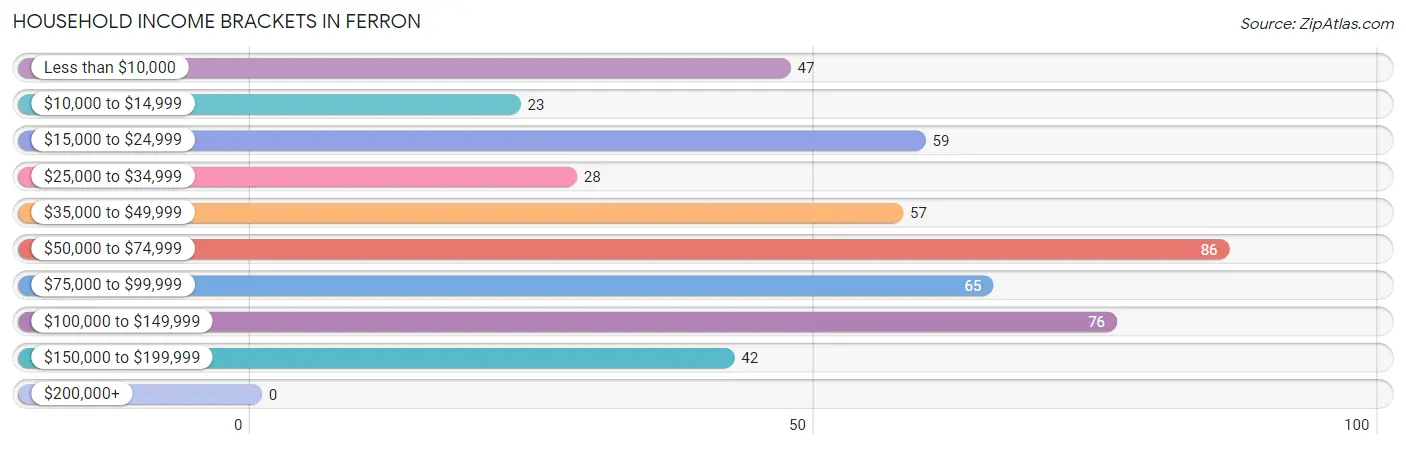
| Income Bracket | # Households | % Households |
| Less than $10,000 | 47 | 9.7% |
| $10,000 to $14,999 | 23 | 4.8% |
| $15,000 to $24,999 | 59 | 12.2% |
| $25,000 to $34,999 | 28 | 5.8% |
| $35,000 to $49,999 | 57 | 11.8% |
| $50,000 to $74,999 | 86 | 17.8% |
| $75,000 to $99,999 | 65 | 13.5% |
| $100,000 to $149,999 | 76 | 15.7% |
| $150,000 to $199,999 | 42 | 8.7% |
| $200,000+ | 0 | 0.0% |
Household Income by Householder Age in Ferron
The median household income in Ferron is $65,913, with the highest median household income of $78,523 found in the 45 to 64 years age bracket for the primary householder. A total of 185 households (38.3%) fall into this category. Meanwhile, the 15 to 24 years age bracket for the primary householder has the lowest median household income of $0, with 50 households (10.3%) in this group.
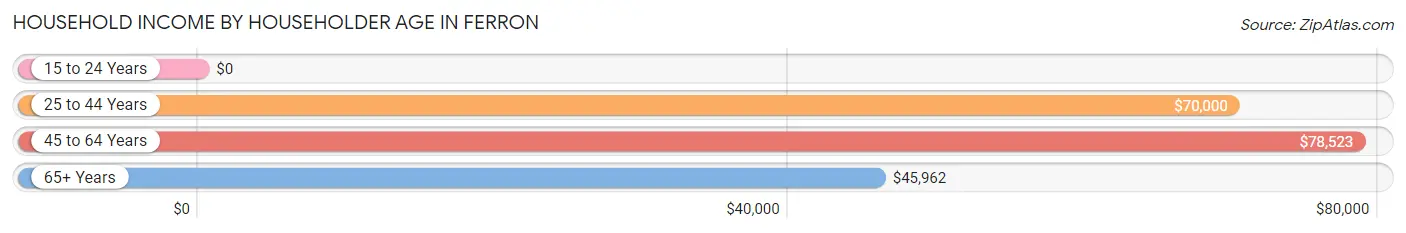
| Income Bracket | # Households | Median Income |
| 15 to 24 Years | 50 (10.3%) | $0 |
| 25 to 44 Years | 126 (26.1%) | $70,000 |
| 45 to 64 Years | 185 (38.3%) | $78,523 |
| 65+ Years | 122 (25.3%) | $45,962 |
| Total | 483 (100.0%) | $65,913 |
Poverty in Ferron
Income Below Poverty by Sex and Age in Ferron
With 14.5% poverty level for males and 15.7% for females among the residents of Ferron, 16 and 17 year old males and 18 to 24 year old females are the most vulnerable to poverty, with 8 males (100.0%) and 31 females (36.9%) in their respective age groups living below the poverty level.
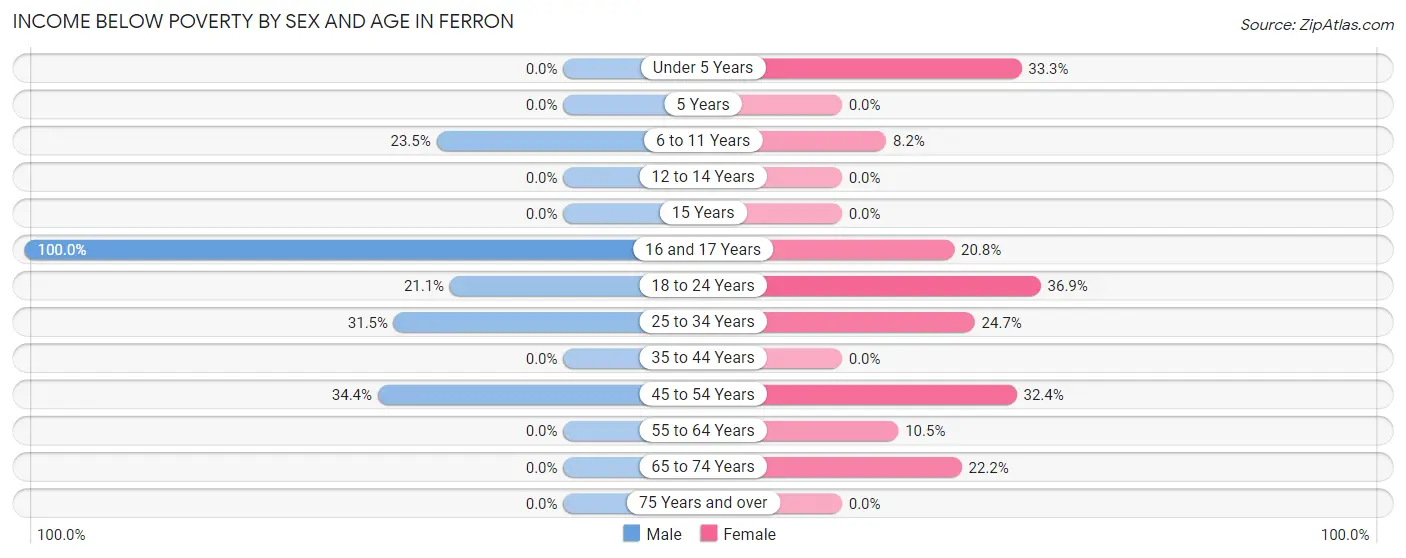
| Age Bracket | Male | Female |
| Under 5 Years | 0 (0.0%) | 11 (33.3%) |
| 5 Years | 0 (0.0%) | 0 (0.0%) |
| 6 to 11 Years | 16 (23.5%) | 6 (8.2%) |
| 12 to 14 Years | 0 (0.0%) | 0 (0.0%) |
| 15 Years | 0 (0.0%) | 0 (0.0%) |
| 16 and 17 Years | 8 (100.0%) | 10 (20.8%) |
| 18 to 24 Years | 12 (21.0%) | 31 (36.9%) |
| 25 to 34 Years | 28 (31.5%) | 18 (24.7%) |
| 35 to 44 Years | 0 (0.0%) | 0 (0.0%) |
| 45 to 54 Years | 21 (34.4%) | 12 (32.4%) |
| 55 to 64 Years | 0 (0.0%) | 13 (10.5%) |
| 65 to 74 Years | 0 (0.0%) | 14 (22.2%) |
| 75 Years and over | 0 (0.0%) | 0 (0.0%) |
| Total | 85 (14.5%) | 115 (15.7%) |
Income Above Poverty by Sex and Age in Ferron
According to the poverty statistics in Ferron, males aged under 5 years and females aged 5 years are the age groups that are most secure financially, with 100.0% of males and 100.0% of females in these age groups living above the poverty line.
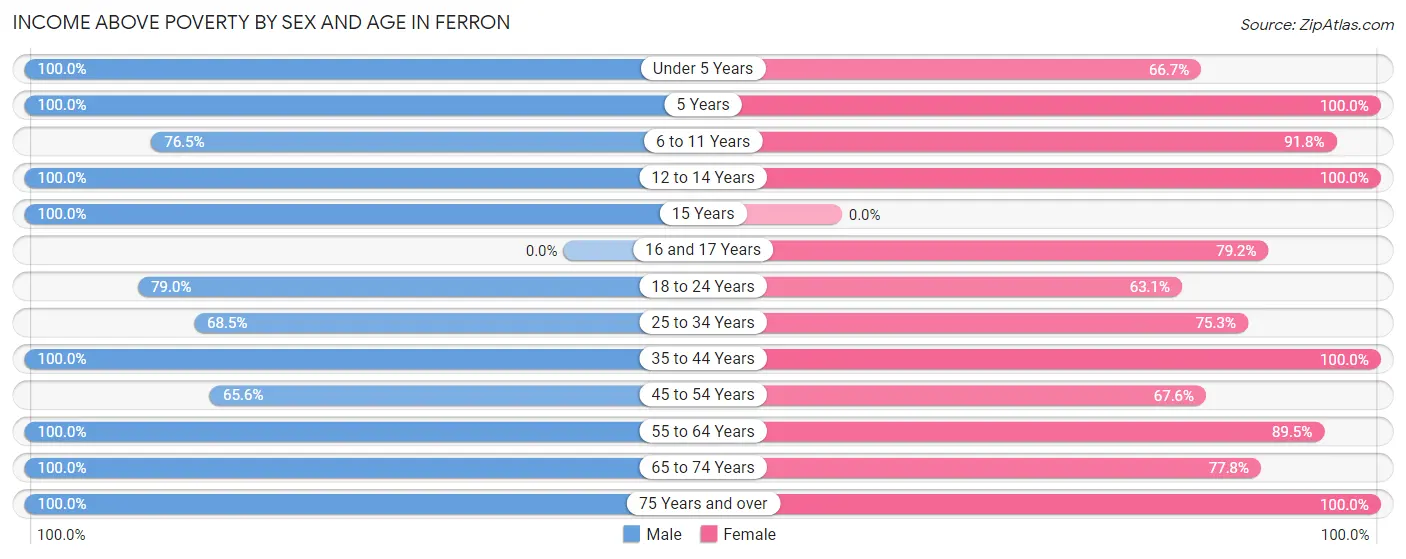
| Age Bracket | Male | Female |
| Under 5 Years | 20 (100.0%) | 22 (66.7%) |
| 5 Years | 19 (100.0%) | 31 (100.0%) |
| 6 to 11 Years | 52 (76.5%) | 67 (91.8%) |
| 12 to 14 Years | 7 (100.0%) | 42 (100.0%) |
| 15 Years | 10 (100.0%) | 0 (0.0%) |
| 16 and 17 Years | 0 (0.0%) | 38 (79.2%) |
| 18 to 24 Years | 45 (78.9%) | 53 (63.1%) |
| 25 to 34 Years | 61 (68.5%) | 55 (75.3%) |
| 35 to 44 Years | 48 (100.0%) | 93 (100.0%) |
| 45 to 54 Years | 40 (65.6%) | 25 (67.6%) |
| 55 to 64 Years | 96 (100.0%) | 111 (89.5%) |
| 65 to 74 Years | 90 (100.0%) | 49 (77.8%) |
| 75 Years and over | 11 (100.0%) | 31 (100.0%) |
| Total | 499 (85.5%) | 617 (84.3%) |
Income Below Poverty Among Married-Couple Families in Ferron
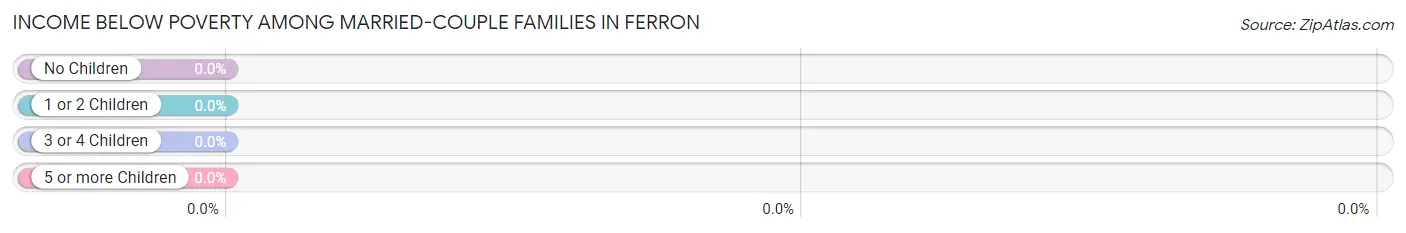
| Children | Above Poverty | Below Poverty |
| No Children | 170 (100.0%) | 0 (0.0%) |
| 1 or 2 Children | 79 (100.0%) | 0 (0.0%) |
| 3 or 4 Children | 24 (100.0%) | 0 (0.0%) |
| 5 or more Children | 0 (0.0%) | 0 (0.0%) |
| Total | 273 (100.0%) | 0 (0.0%) |
Income Below Poverty Among Single-Parent Households in Ferron
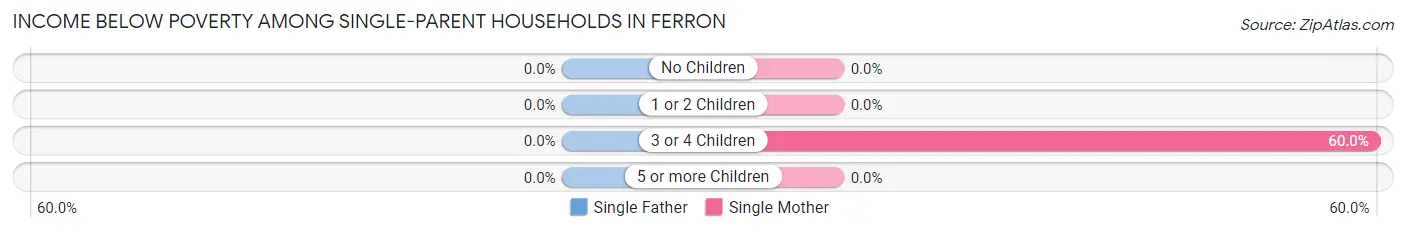
| Children | Single Father | Single Mother |
| No Children | 0 (0.0%) | 0 (0.0%) |
| 1 or 2 Children | 0 (0.0%) | 0 (0.0%) |
| 3 or 4 Children | 0 (0.0%) | 9 (60.0%) |
| 5 or more Children | 0 (0.0%) | 0 (0.0%) |
| Total | 0 (0.0%) | 9 (23.1%) |
Income Below Poverty Among Married-Couple vs Single-Parent Households in Ferron
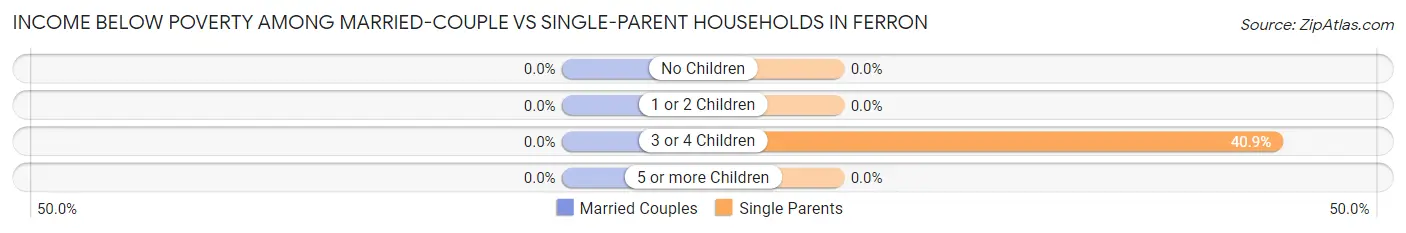
| Children | Married-Couple Families | Single-Parent Households |
| No Children | 0 (0.0%) | 0 (0.0%) |
| 1 or 2 Children | 0 (0.0%) | 0 (0.0%) |
| 3 or 4 Children | 0 (0.0%) | 9 (40.9%) |
| 5 or more Children | 0 (0.0%) | 0 (0.0%) |
| Total | 0 (0.0%) | 9 (18.8%) |
Race in Ferron
The most populous races in Ferron are White / Caucasian (1,357 | 99.8%), Hispanic or Latino (42 | 3.1%), and Two or more Races (3 | 0.2%).
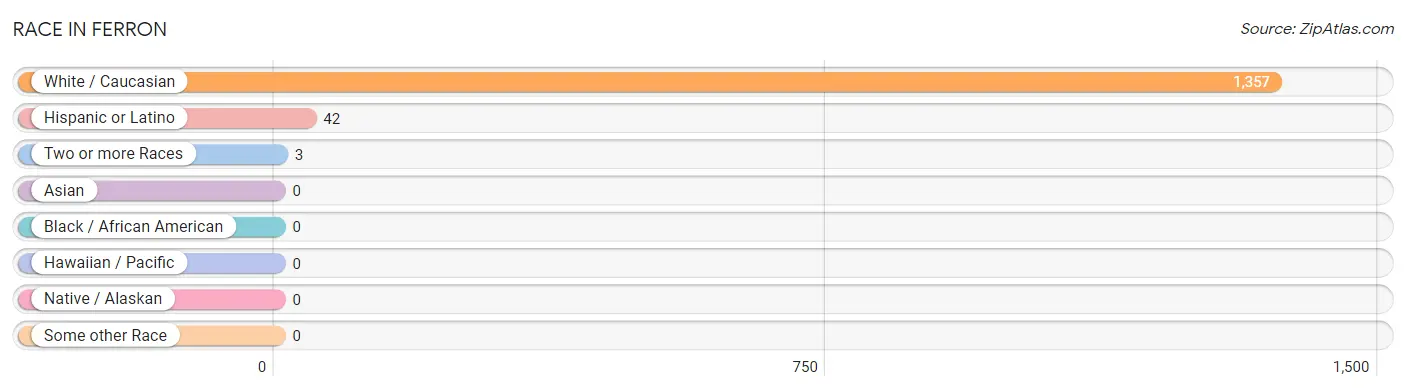
| Race | # Population | % Population |
| Asian | 0 | 0.0% |
| Black / African American | 0 | 0.0% |
| Hawaiian / Pacific | 0 | 0.0% |
| Hispanic or Latino | 42 | 3.1% |
| Native / Alaskan | 0 | 0.0% |
| White / Caucasian | 1,357 | 99.8% |
| Two or more Races | 3 | 0.2% |
| Some other Race | 0 | 0.0% |
| Total | 1,360 | 100.0% |
Ancestry in Ferron
The most populous ancestries reported in Ferron are English (250 | 18.4%), Danish (227 | 16.7%), Irish (216 | 15.9%), German (179 | 13.2%), and Swedish (85 | 6.2%), together accounting for 70.4% of all Ferron residents.
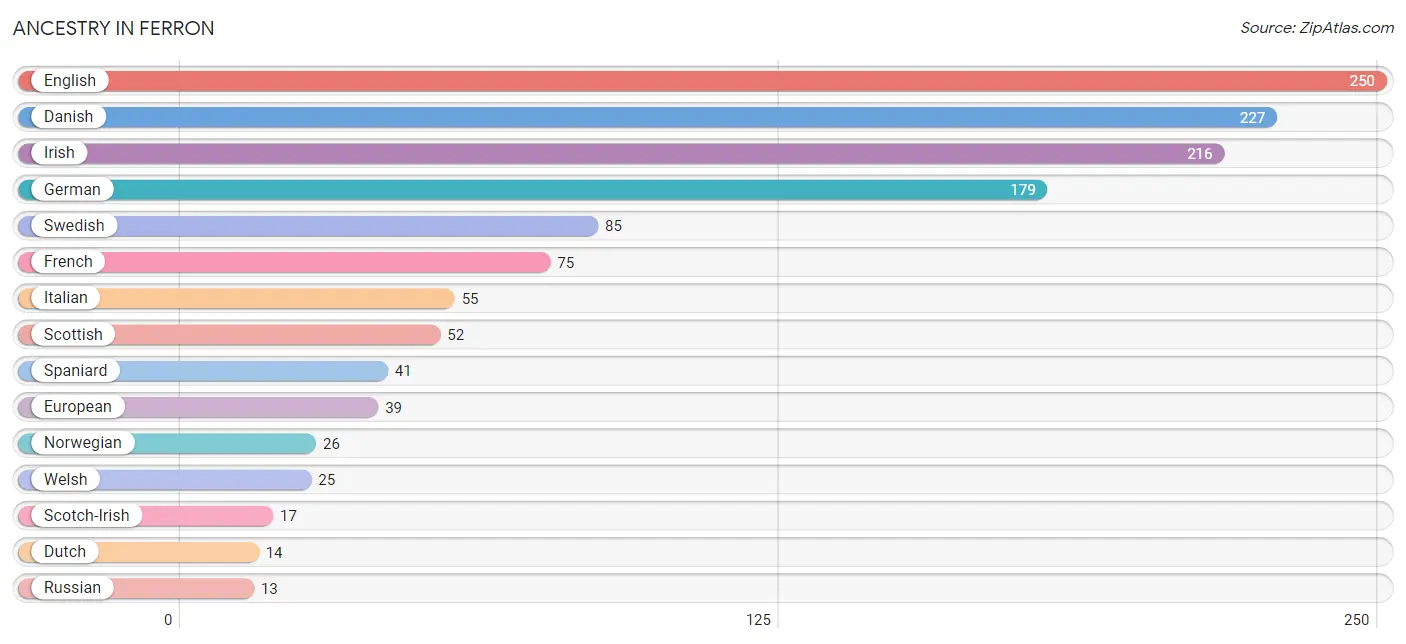
| Ancestry | # Population | % Population |
| Cherokee | 2 | 0.2% |
| Danish | 227 | 16.7% |
| Dutch | 14 | 1.0% |
| English | 250 | 18.4% |
| European | 39 | 2.9% |
| French | 75 | 5.5% |
| German | 179 | 13.2% |
| Greek | 1 | 0.1% |
| Irish | 216 | 15.9% |
| Italian | 55 | 4.0% |
| Norwegian | 26 | 1.9% |
| Polish | 8 | 0.6% |
| Russian | 13 | 1.0% |
| Scotch-Irish | 17 | 1.3% |
| Scottish | 52 | 3.8% |
| Spaniard | 41 | 3.0% |
| Swedish | 85 | 6.2% |
| Ukrainian | 2 | 0.2% |
| Welsh | 25 | 1.8% |
| Yugoslavian | 9 | 0.7% | View All 20 Rows |
Immigrants in Ferron
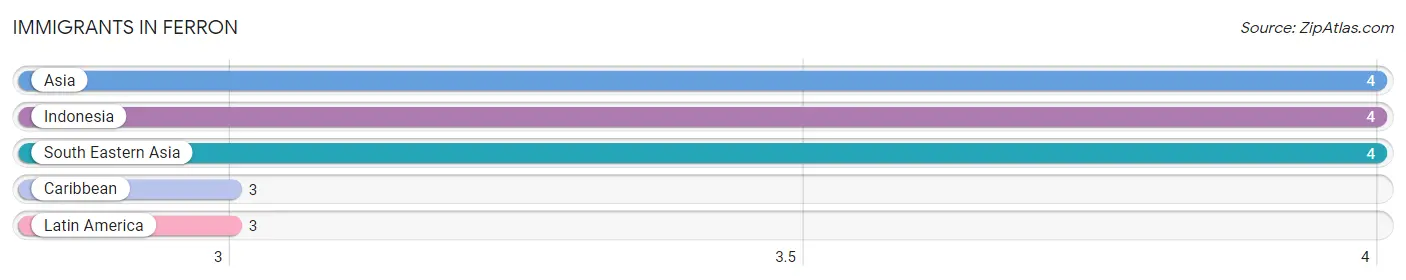
The most numerous immigrant groups reported in Ferron came from Asia (4 | 0.3%), Indonesia (4 | 0.3%), South Eastern Asia (4 | 0.3%), Caribbean (3 | 0.2%), and Latin America (3 | 0.2%), together accounting for 1.3% of all Ferron residents.
| Immigration Origin | # Population | % Population |
| Asia | 4 | 0.3% |
| Caribbean | 3 | 0.2% |
| Indonesia | 4 | 0.3% |
| Latin America | 3 | 0.2% |
| South Eastern Asia | 4 | 0.3% | View All 5 Rows |
Sex and Age in Ferron
Sex and Age in Ferron
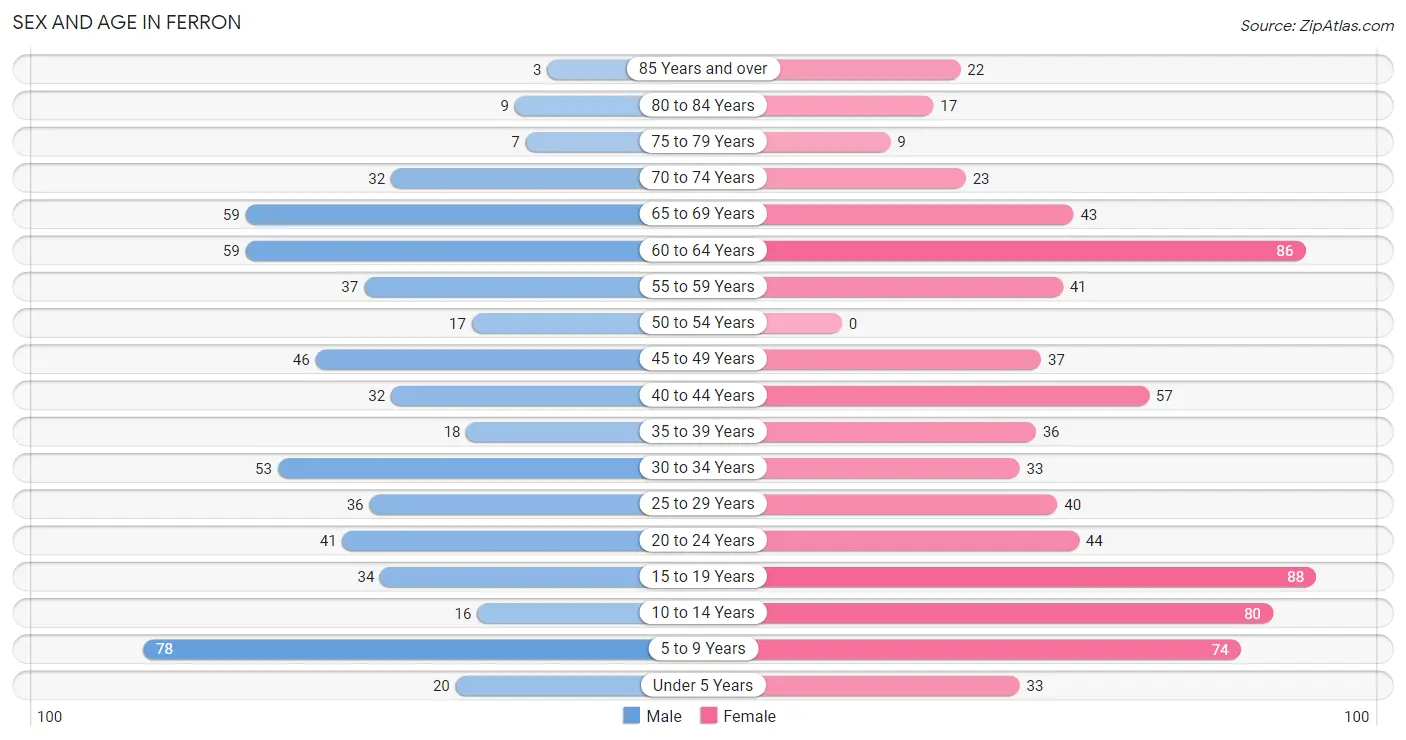
The most populous age groups in Ferron are 5 to 9 Years (78 | 13.1%) for men and 15 to 19 Years (88 | 11.5%) for women.
| Age Bracket | Male | Female |
| Under 5 Years | 20 (3.4%) | 33 (4.3%) |
| 5 to 9 Years | 78 (13.1%) | 74 (9.7%) |
| 10 to 14 Years | 16 (2.7%) | 80 (10.5%) |
| 15 to 19 Years | 34 (5.7%) | 88 (11.5%) |
| 20 to 24 Years | 41 (6.9%) | 44 (5.8%) |
| 25 to 29 Years | 36 (6.0%) | 40 (5.2%) |
| 30 to 34 Years | 53 (8.9%) | 33 (4.3%) |
| 35 to 39 Years | 18 (3.0%) | 36 (4.7%) |
| 40 to 44 Years | 32 (5.4%) | 57 (7.5%) |
| 45 to 49 Years | 46 (7.7%) | 37 (4.9%) |
| 50 to 54 Years | 17 (2.9%) | 0 (0.0%) |
| 55 to 59 Years | 37 (6.2%) | 41 (5.4%) |
| 60 to 64 Years | 59 (9.9%) | 86 (11.3%) |
| 65 to 69 Years | 59 (9.9%) | 43 (5.6%) |
| 70 to 74 Years | 32 (5.4%) | 23 (3.0%) |
| 75 to 79 Years | 7 (1.2%) | 9 (1.2%) |
| 80 to 84 Years | 9 (1.5%) | 17 (2.2%) |
| 85 Years and over | 3 (0.5%) | 22 (2.9%) |
| Total | 597 (100.0%) | 763 (100.0%) |
Families and Households in Ferron
Median Family Size in Ferron
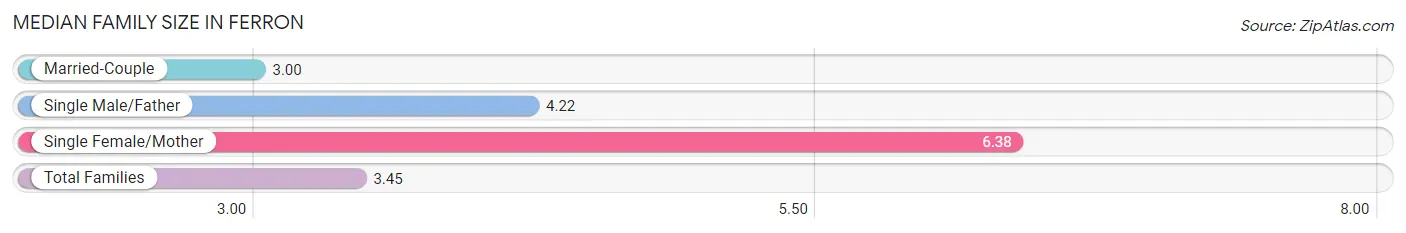
The median family size in Ferron is 3.45 persons per family, with single female/mother families (39 | 12.1%) accounting for the largest median family size of 6.38 persons per family. On the other hand, married-couple families (273 | 85.1%) represent the smallest median family size with 3.00 persons per family.
| Family Type | # Families | Family Size |
| Married-Couple | 273 (85.1%) | 3.00 |
| Single Male/Father | 9 (2.8%) | 4.22 |
| Single Female/Mother | 39 (12.1%) | 6.38 |
| Total Families | 321 (100.0%) | 3.45 |
Median Household Size in Ferron
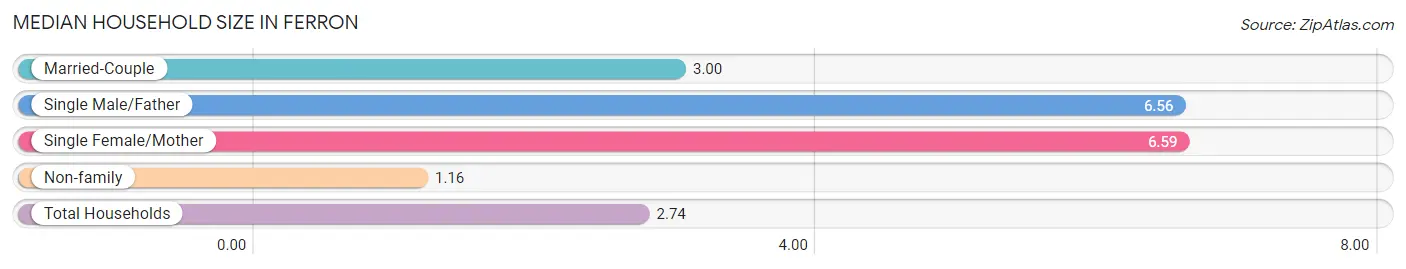
The median household size in Ferron is 2.74 persons per household, with single female/mother households (39 | 8.1%) accounting for the largest median household size of 6.59 persons per household. non-family households (162 | 33.5%) represent the smallest median household size with 1.16 persons per household.
| Household Type | # Households | Household Size |
| Married-Couple | 273 (56.5%) | 3.00 |
| Single Male/Father | 9 (1.9%) | 6.56 |
| Single Female/Mother | 39 (8.1%) | 6.59 |
| Non-family | 162 (33.5%) | 1.16 |
| Total Households | 483 (100.0%) | 2.74 |
Household Size by Marriage Status in Ferron
Out of a total of 483 households in Ferron, 321 (66.5%) are family households, while 162 (33.5%) are nonfamily households. The most numerous type of family households are 2-person households, comprising 168, and the most common type of nonfamily households are 1-person households, comprising 133.
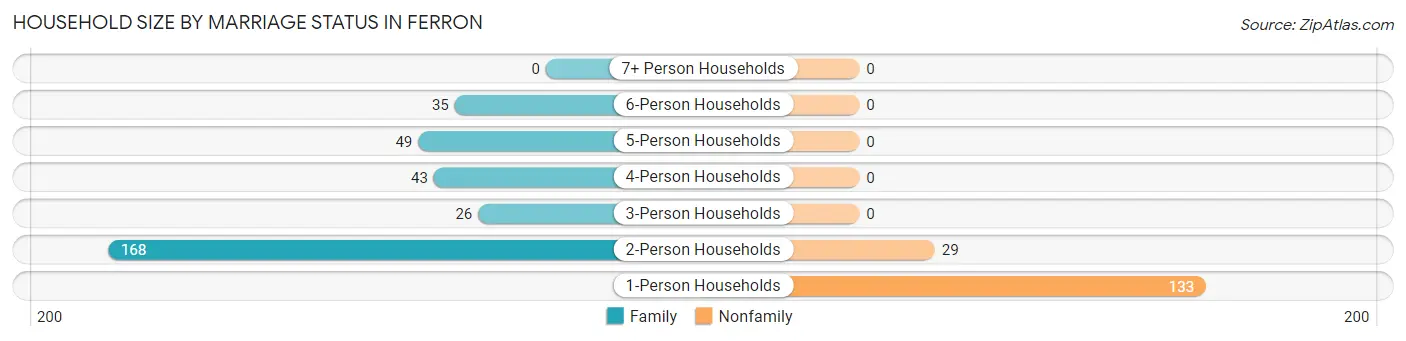
| Household Size | Family Households | Nonfamily Households |
| 1-Person Households | - | 133 (27.5%) |
| 2-Person Households | 168 (34.8%) | 29 (6.0%) |
| 3-Person Households | 26 (5.4%) | 0 (0.0%) |
| 4-Person Households | 43 (8.9%) | 0 (0.0%) |
| 5-Person Households | 49 (10.1%) | 0 (0.0%) |
| 6-Person Households | 35 (7.2%) | 0 (0.0%) |
| 7+ Person Households | 0 (0.0%) | 0 (0.0%) |
| Total | 321 (66.5%) | 162 (33.5%) |
Female Fertility in Ferron
Fertility by Age in Ferron
Average fertility rate in Ferron is 27.0 births per 1,000 women. Women in the age bracket of 20 to 34 years have the highest fertility rate with 77.0 births per 1,000 women. Women in the age bracket of 20 to 34 years acount for 100.0% of all women with births.
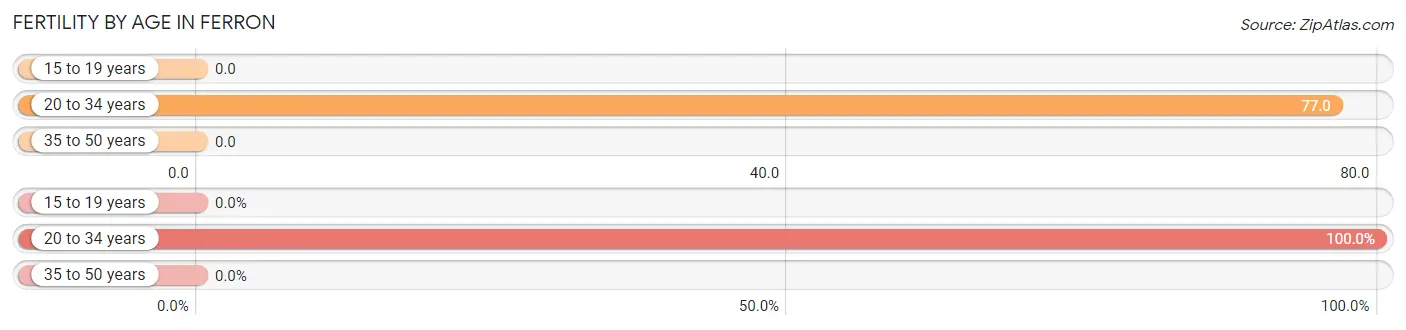
| Age Bracket | Women with Births | Births / 1,000 Women |
| 15 to 19 years | 0 (0.0%) | 0.0 |
| 20 to 34 years | 9 (100.0%) | 77.0 |
| 35 to 50 years | 0 (0.0%) | 0.0 |
| Total | 9 (100.0%) | 27.0 |
Fertility by Age by Marriage Status in Ferron
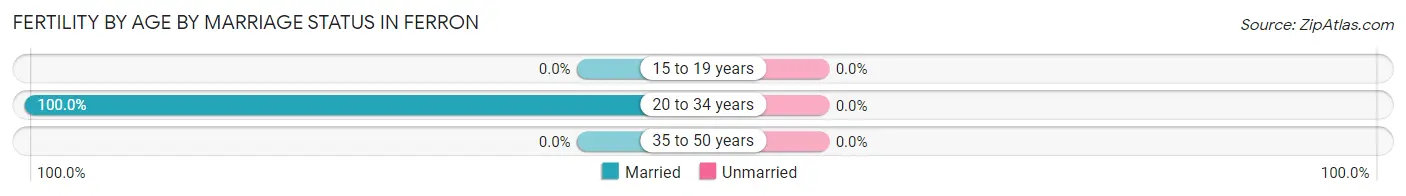
| Age Bracket | Married | Unmarried |
| 15 to 19 years | 0 (0.0%) | 0 (0.0%) |
| 20 to 34 years | 9 (100.0%) | 0 (0.0%) |
| 35 to 50 years | 0 (0.0%) | 0 (0.0%) |
| Total | 9 (100.0%) | 0 (0.0%) |
Fertility by Education in Ferron
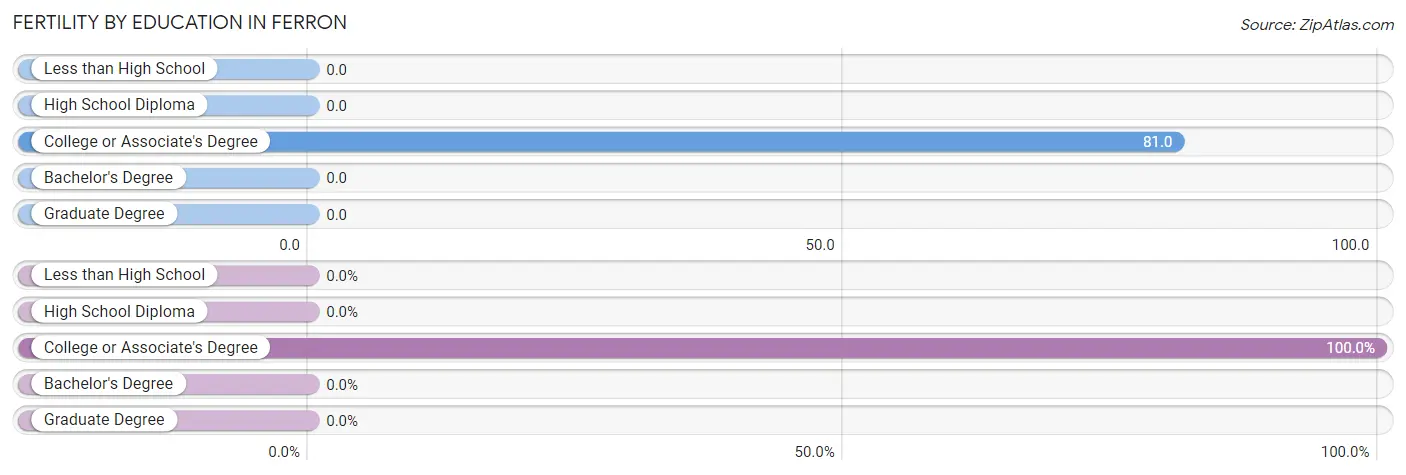
| Educational Attainment | Women with Births | Births / 1,000 Women |
| Less than High School | 0 (0.0%) | 0.0 |
| High School Diploma | 0 (0.0%) | 0.0 |
| College or Associate's Degree | 9 (100.0%) | 81.0 |
| Bachelor's Degree | 0 (0.0%) | 0.0 |
| Graduate Degree | 0 (0.0%) | 0.0 |
| Total | 9 (100.0%) | 27.0 |
Fertility by Education by Marriage Status in Ferron
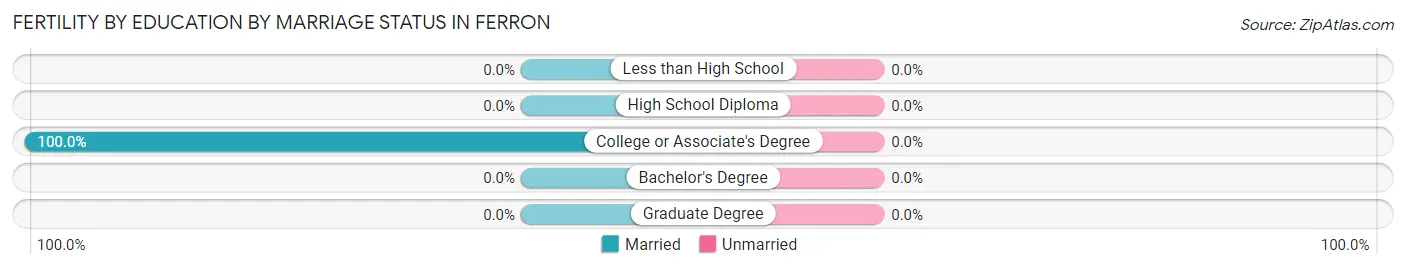
| Educational Attainment | Married | Unmarried |
| Less than High School | 0 (0.0%) | 0 (0.0%) |
| High School Diploma | 0 (0.0%) | 0 (0.0%) |
| College or Associate's Degree | 9 (100.0%) | 0 (0.0%) |
| Bachelor's Degree | 0 (0.0%) | 0 (0.0%) |
| Graduate Degree | 0 (0.0%) | 0 (0.0%) |
| Total | 9 (100.0%) | 0 (0.0%) |
Employment Characteristics in Ferron
Employment by Class of Employer in Ferron
Among the 455 employed individuals in Ferron, private company employees (272 | 59.8%), local government employees (107 | 23.5%), and state government employees (37 | 8.1%) make up the most common classes of employment.
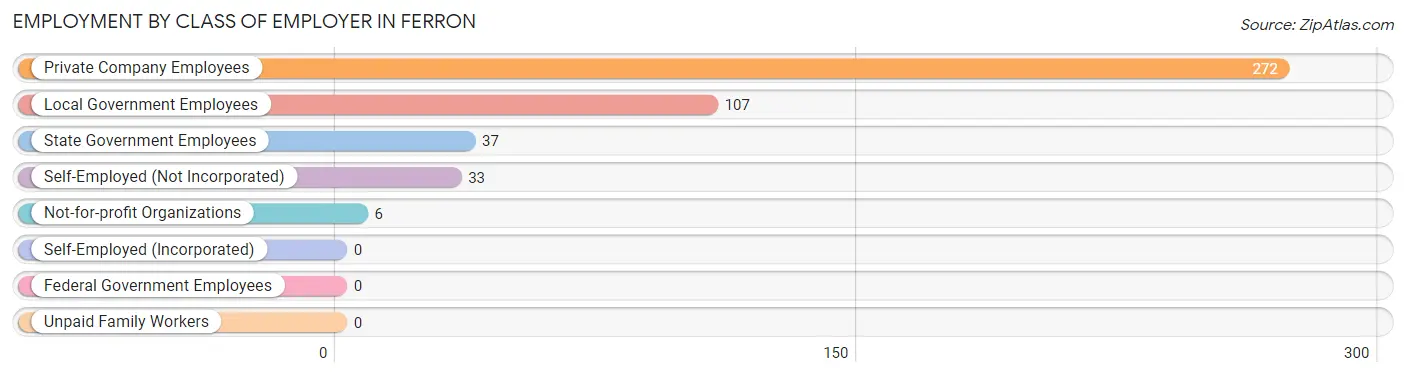
| Employer Class | # Employees | % Employees |
| Private Company Employees | 272 | 59.8% |
| Self-Employed (Incorporated) | 0 | 0.0% |
| Self-Employed (Not Incorporated) | 33 | 7.2% |
| Not-for-profit Organizations | 6 | 1.3% |
| Local Government Employees | 107 | 23.5% |
| State Government Employees | 37 | 8.1% |
| Federal Government Employees | 0 | 0.0% |
| Unpaid Family Workers | 0 | 0.0% |
| Total | 455 | 100.0% |
Employment Status by Age in Ferron
According to the labor force statistics for Ferron, out of the total population over 16 years of age (1,049), 52.3% or 549 individuals are in the labor force, with 11.8% or 65 of them unemployed. The age group with the highest labor force participation rate is 35 to 44 years, with 95.1% or 136 individuals in the labor force. Within the labor force, the 20 to 24 years age range has the highest percentage of unemployed individuals, with 43.1% or 31 of them being unemployed.
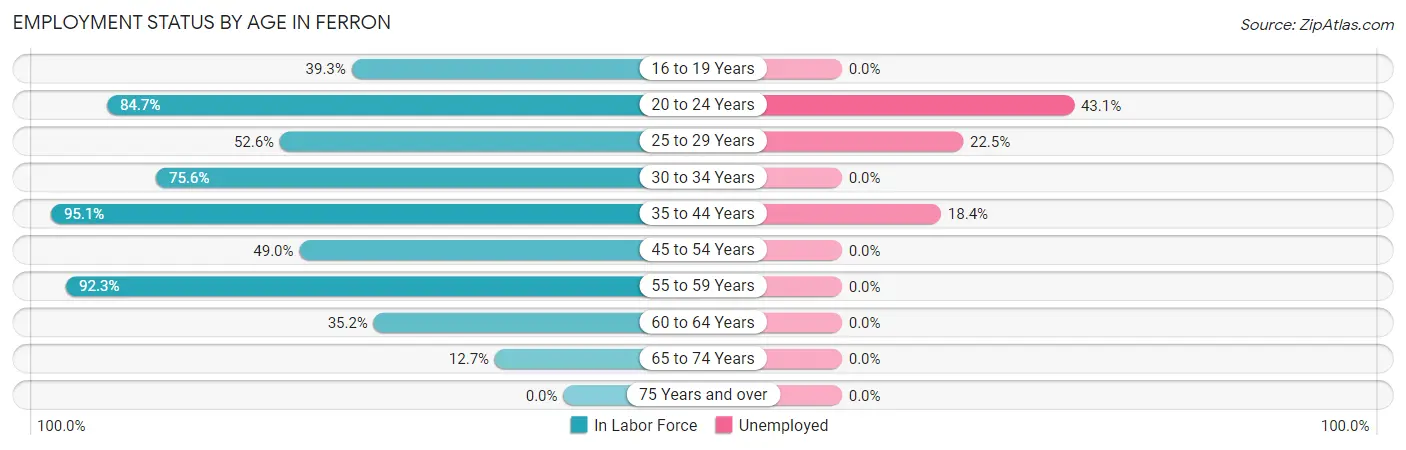
| Age Bracket | In Labor Force | Unemployed |
| 16 to 19 Years | 44 (39.3%) | 0 (0.0%) |
| 20 to 24 Years | 72 (84.7%) | 31 (43.1%) |
| 25 to 29 Years | 40 (52.6%) | 9 (22.5%) |
| 30 to 34 Years | 65 (75.6%) | 0 (0.0%) |
| 35 to 44 Years | 136 (95.1%) | 25 (18.4%) |
| 45 to 54 Years | 49 (49.0%) | 0 (0.0%) |
| 55 to 59 Years | 72 (92.3%) | 0 (0.0%) |
| 60 to 64 Years | 51 (35.2%) | 0 (0.0%) |
| 65 to 74 Years | 20 (12.7%) | 0 (0.0%) |
| 75 Years and over | 0 (0.0%) | 0 (0.0%) |
| Total | 549 (52.3%) | 65 (11.8%) |
Employment Status by Educational Attainment in Ferron
According to labor force statistics for Ferron, 65.8% of individuals (413) out of the total population between 25 and 64 years of age (628) are in the labor force, with 8.2% or 34 of them being unemployed. The group with the highest labor force participation rate are those with the educational attainment of bachelor's degree or higher, with 100.0% or 92 individuals in the labor force. Within the labor force, individuals with college / associate degree education have the highest percentage of unemployment, with 20.6% or 34 of them being unemployed.
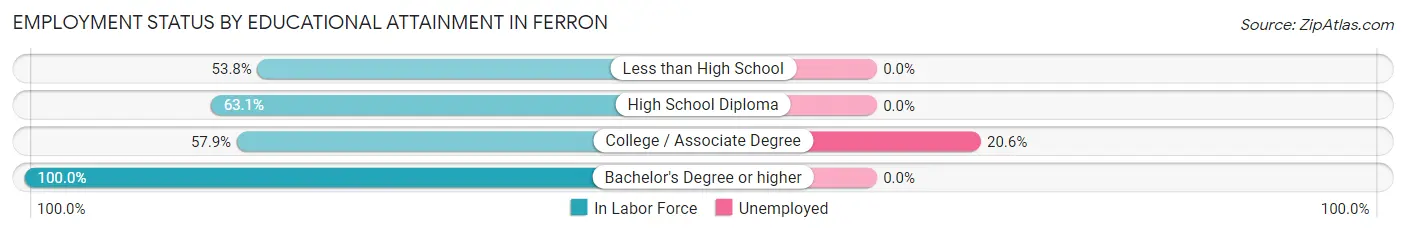
| Educational Attainment | In Labor Force | Unemployed |
| Less than High School | 14 (53.8%) | 0 (0.0%) |
| High School Diploma | 142 (63.1%) | 0 (0.0%) |
| College / Associate Degree | 165 (57.9%) | 59 (20.6%) |
| Bachelor's Degree or higher | 92 (100.0%) | 0 (0.0%) |
| Total | 413 (65.8%) | 51 (8.2%) |
Employment Occupations by Sex in Ferron
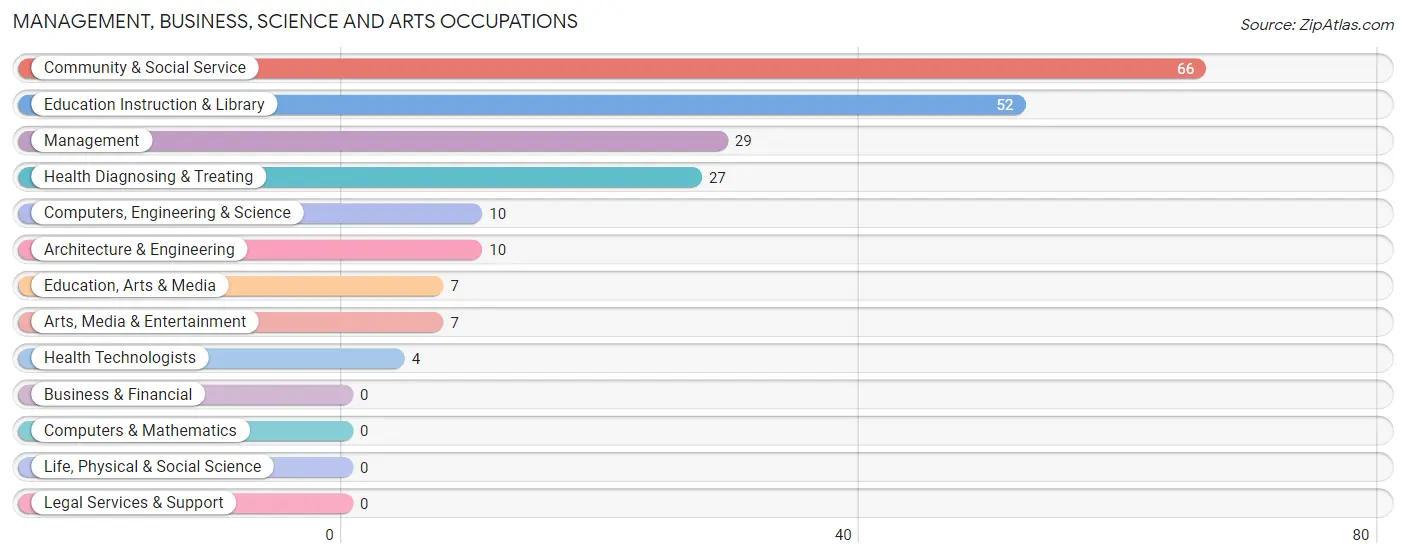
Management, Business, Science and Arts Occupations
The most common Management, Business, Science and Arts occupations in Ferron are Community & Social Service (66 | 13.6%), Education Instruction & Library (52 | 10.7%), Management (29 | 6.0%), Health Diagnosing & Treating (27 | 5.6%), and Computers, Engineering & Science (10 | 2.1%).
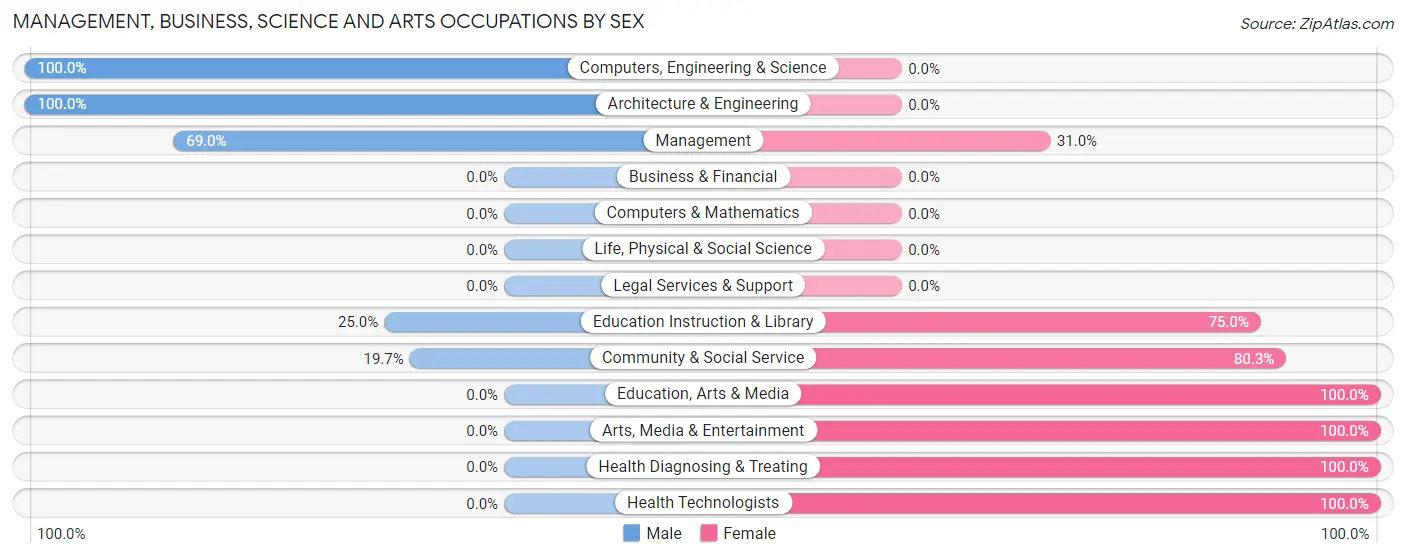
Management, Business, Science and Arts Occupations by Sex
Within the Management, Business, Science and Arts occupations in Ferron, the most male-oriented occupations are Computers, Engineering & Science (100.0%), Architecture & Engineering (100.0%), and Management (69.0%), while the most female-oriented occupations are Education, Arts & Media (100.0%), Arts, Media & Entertainment (100.0%), and Health Diagnosing & Treating (100.0%).
| Occupation | Male | Female |
| Management | 20 (69.0%) | 9 (31.0%) |
| Business & Financial | 0 (0.0%) | 0 (0.0%) |
| Computers, Engineering & Science | 10 (100.0%) | 0 (0.0%) |
| Computers & Mathematics | 0 (0.0%) | 0 (0.0%) |
| Architecture & Engineering | 10 (100.0%) | 0 (0.0%) |
| Life, Physical & Social Science | 0 (0.0%) | 0 (0.0%) |
| Community & Social Service | 13 (19.7%) | 53 (80.3%) |
| Education, Arts & Media | 0 (0.0%) | 7 (100.0%) |
| Legal Services & Support | 0 (0.0%) | 0 (0.0%) |
| Education Instruction & Library | 13 (25.0%) | 39 (75.0%) |
| Arts, Media & Entertainment | 0 (0.0%) | 7 (100.0%) |
| Health Diagnosing & Treating | 0 (0.0%) | 27 (100.0%) |
| Health Technologists | 0 (0.0%) | 4 (100.0%) |
| Total (Category) | 43 (32.6%) | 89 (67.4%) |
| Total (Overall) | 266 (55.0%) | 218 (45.0%) |
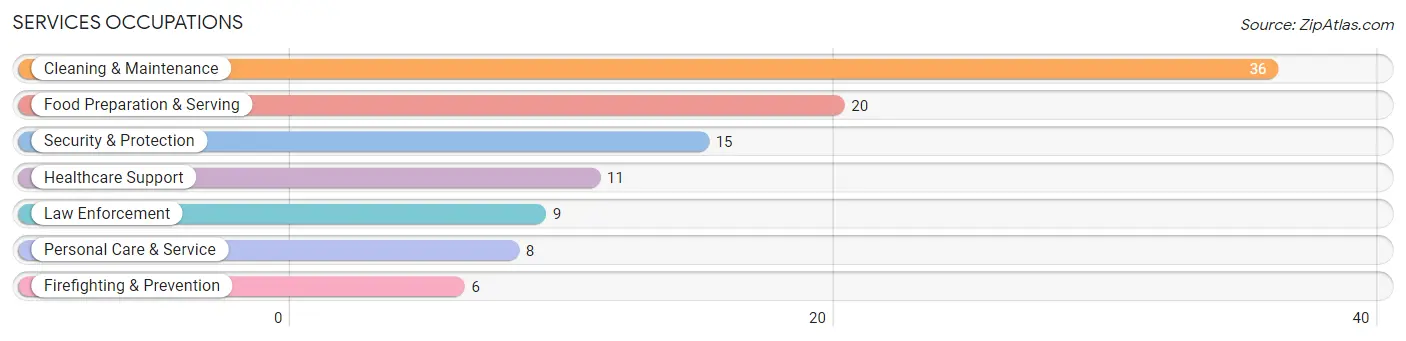
Services Occupations
The most common Services occupations in Ferron are Cleaning & Maintenance (36 | 7.4%), Food Preparation & Serving (20 | 4.1%), Security & Protection (15 | 3.1%), Healthcare Support (11 | 2.3%), and Law Enforcement (9 | 1.9%).
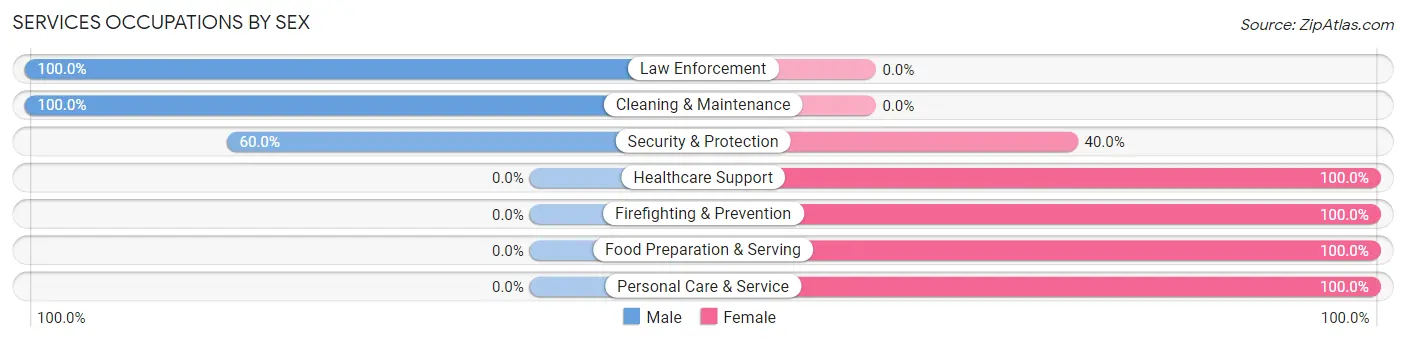
Services Occupations by Sex
Within the Services occupations in Ferron, the most male-oriented occupations are Law Enforcement (100.0%), Cleaning & Maintenance (100.0%), and Security & Protection (60.0%), while the most female-oriented occupations are Healthcare Support (100.0%), Firefighting & Prevention (100.0%), and Food Preparation & Serving (100.0%).
| Occupation | Male | Female |
| Healthcare Support | 0 (0.0%) | 11 (100.0%) |
| Security & Protection | 9 (60.0%) | 6 (40.0%) |
| Firefighting & Prevention | 0 (0.0%) | 6 (100.0%) |
| Law Enforcement | 9 (100.0%) | 0 (0.0%) |
| Food Preparation & Serving | 0 (0.0%) | 20 (100.0%) |
| Cleaning & Maintenance | 36 (100.0%) | 0 (0.0%) |
| Personal Care & Service | 0 (0.0%) | 8 (100.0%) |
| Total (Category) | 45 (50.0%) | 45 (50.0%) |
| Total (Overall) | 266 (55.0%) | 218 (45.0%) |
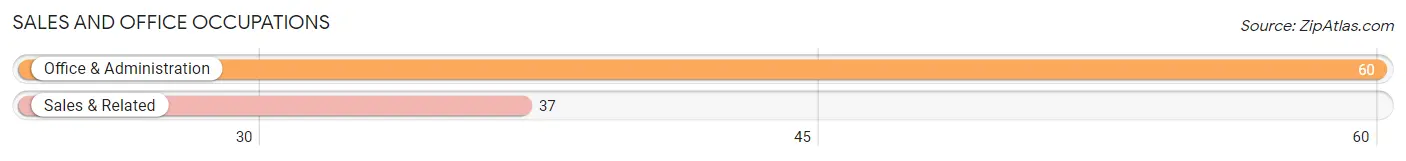
Sales and Office Occupations
The most common Sales and Office occupations in Ferron are Office & Administration (60 | 12.4%), and Sales & Related (37 | 7.6%).
Sales and Office Occupations by Sex
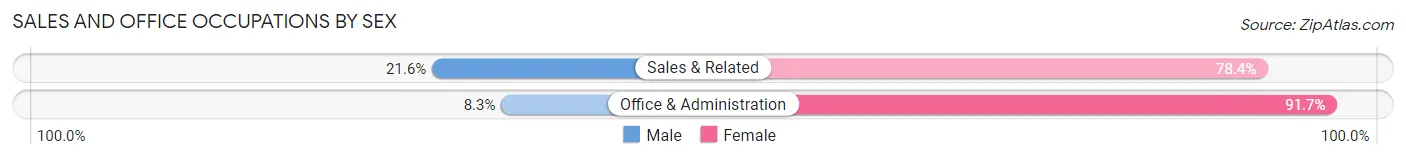
| Occupation | Male | Female |
| Sales & Related | 8 (21.6%) | 29 (78.4%) |
| Office & Administration | 5 (8.3%) | 55 (91.7%) |
| Total (Category) | 13 (13.4%) | 84 (86.6%) |
| Total (Overall) | 266 (55.0%) | 218 (45.0%) |
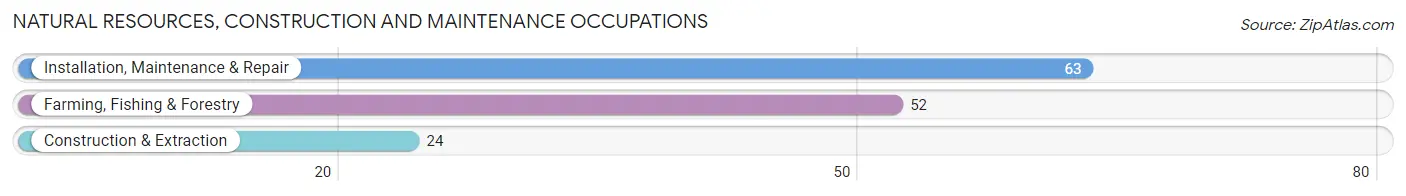
Natural Resources, Construction and Maintenance Occupations
The most common Natural Resources, Construction and Maintenance occupations in Ferron are Installation, Maintenance & Repair (63 | 13.0%), Farming, Fishing & Forestry (52 | 10.7%), and Construction & Extraction (24 | 5.0%).
Natural Resources, Construction and Maintenance Occupations by Sex
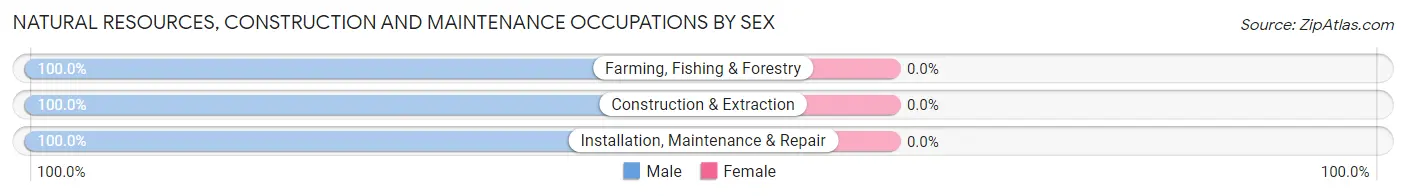
| Occupation | Male | Female |
| Farming, Fishing & Forestry | 52 (100.0%) | 0 (0.0%) |
| Construction & Extraction | 24 (100.0%) | 0 (0.0%) |
| Installation, Maintenance & Repair | 63 (100.0%) | 0 (0.0%) |
| Total (Category) | 139 (100.0%) | 0 (0.0%) |
| Total (Overall) | 266 (55.0%) | 218 (45.0%) |
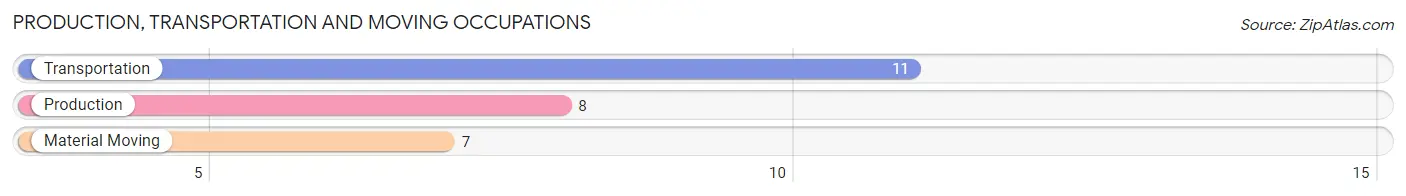
Production, Transportation and Moving Occupations
The most common Production, Transportation and Moving occupations in Ferron are Transportation (11 | 2.3%), Production (8 | 1.7%), and Material Moving (7 | 1.5%).
Production, Transportation and Moving Occupations by Sex
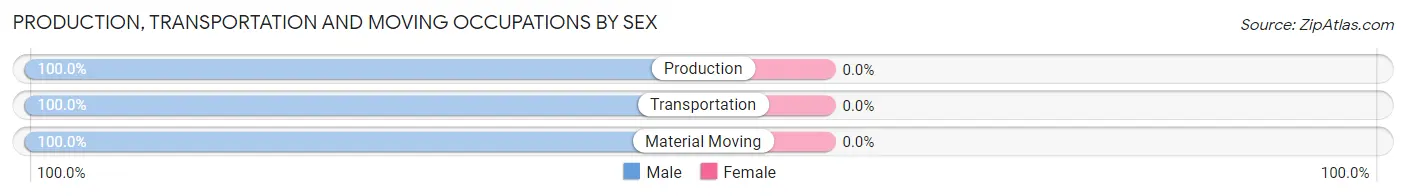
| Occupation | Male | Female |
| Production | 8 (100.0%) | 0 (0.0%) |
| Transportation | 11 (100.0%) | 0 (0.0%) |
| Material Moving | 7 (100.0%) | 0 (0.0%) |
| Total (Category) | 26 (100.0%) | 0 (0.0%) |
| Total (Overall) | 266 (55.0%) | 218 (45.0%) |
Employment Industries by Sex in Ferron
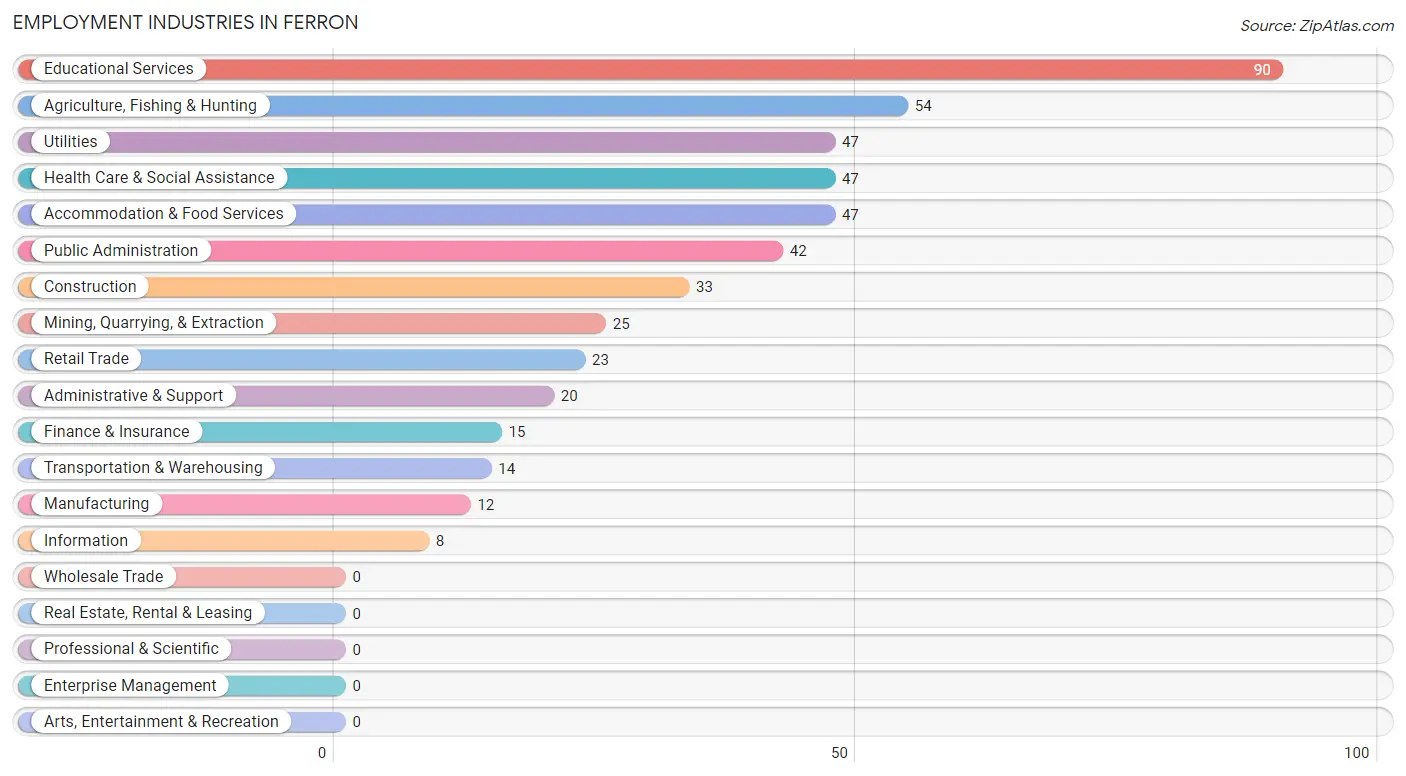
Employment Industries in Ferron
The major employment industries in Ferron include Educational Services (90 | 18.6%), Agriculture, Fishing & Hunting (54 | 11.2%), Utilities (47 | 9.7%), Health Care & Social Assistance (47 | 9.7%), and Accommodation & Food Services (47 | 9.7%).
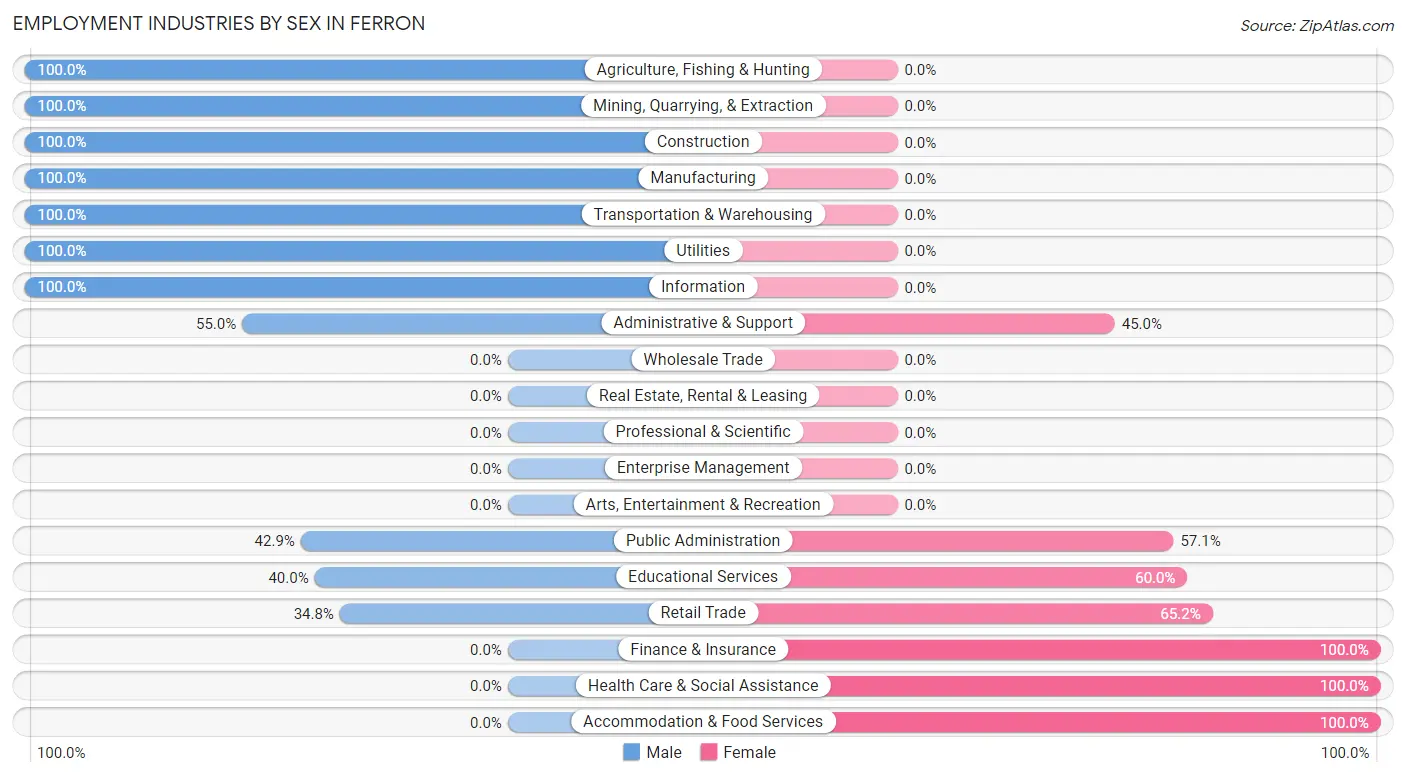
Employment Industries by Sex in Ferron
The Ferron industries that see more men than women are Agriculture, Fishing & Hunting (100.0%), Mining, Quarrying, & Extraction (100.0%), and Construction (100.0%), whereas the industries that tend to have a higher number of women are Finance & Insurance (100.0%), Health Care & Social Assistance (100.0%), and Accommodation & Food Services (100.0%).
| Industry | Male | Female |
| Agriculture, Fishing & Hunting | 54 (100.0%) | 0 (0.0%) |
| Mining, Quarrying, & Extraction | 25 (100.0%) | 0 (0.0%) |
| Construction | 33 (100.0%) | 0 (0.0%) |
| Manufacturing | 12 (100.0%) | 0 (0.0%) |
| Wholesale Trade | 0 (0.0%) | 0 (0.0%) |
| Retail Trade | 8 (34.8%) | 15 (65.2%) |
| Transportation & Warehousing | 14 (100.0%) | 0 (0.0%) |
| Utilities | 47 (100.0%) | 0 (0.0%) |
| Information | 8 (100.0%) | 0 (0.0%) |
| Finance & Insurance | 0 (0.0%) | 15 (100.0%) |
| Real Estate, Rental & Leasing | 0 (0.0%) | 0 (0.0%) |
| Professional & Scientific | 0 (0.0%) | 0 (0.0%) |
| Enterprise Management | 0 (0.0%) | 0 (0.0%) |
| Administrative & Support | 11 (55.0%) | 9 (45.0%) |
| Educational Services | 36 (40.0%) | 54 (60.0%) |
| Health Care & Social Assistance | 0 (0.0%) | 47 (100.0%) |
| Arts, Entertainment & Recreation | 0 (0.0%) | 0 (0.0%) |
| Accommodation & Food Services | 0 (0.0%) | 47 (100.0%) |
| Public Administration | 18 (42.9%) | 24 (57.1%) |
| Total | 266 (55.0%) | 218 (45.0%) |
Education in Ferron
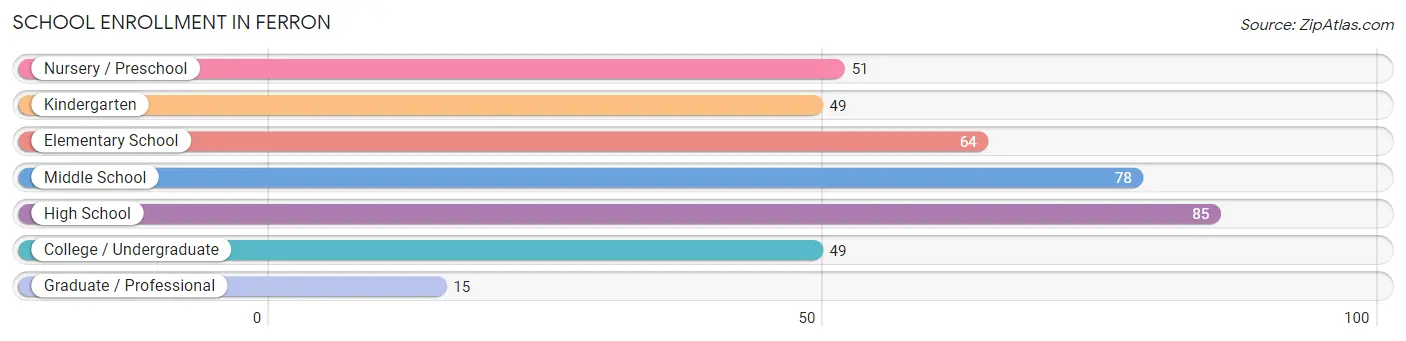
School Enrollment in Ferron
The most common levels of schooling among the 391 students in Ferron are high school (85 | 21.7%), middle school (78 | 20.0%), and elementary school (64 | 16.4%).
| School Level | # Students | % Students |
| Nursery / Preschool | 51 | 13.0% |
| Kindergarten | 49 | 12.5% |
| Elementary School | 64 | 16.4% |
| Middle School | 78 | 20.0% |
| High School | 85 | 21.7% |
| College / Undergraduate | 49 | 12.5% |
| Graduate / Professional | 15 | 3.8% |
| Total | 391 | 100.0% |
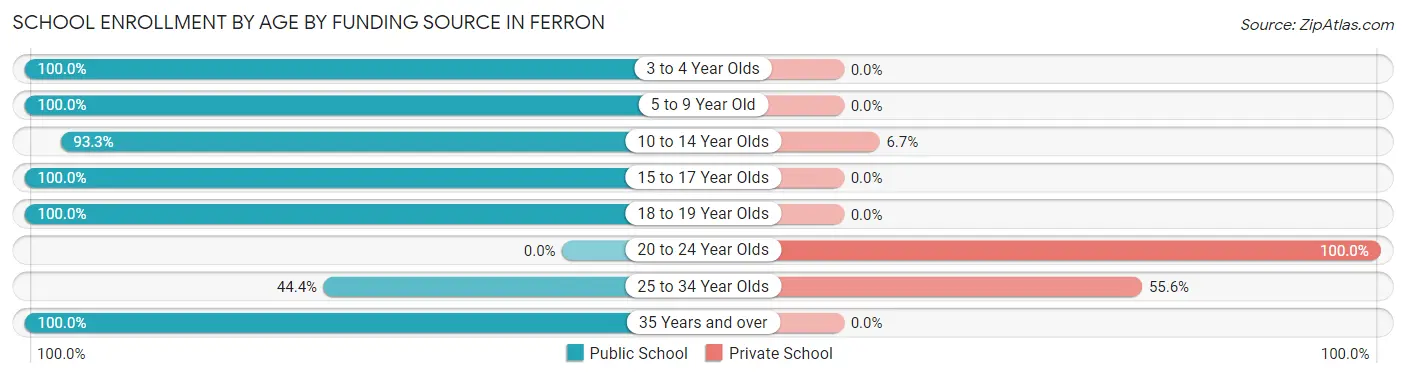
School Enrollment by Age by Funding Source in Ferron
Out of a total of 391 students who are enrolled in schools in Ferron, 42 (10.7%) attend a private institution, while the remaining 349 (89.3%) are enrolled in public schools. The age group of 20 to 24 year olds has the highest likelihood of being enrolled in private schools, with 26 (100.0% in the age bracket) enrolled. Conversely, the age group of 3 to 4 year olds has the lowest likelihood of being enrolled in a private school, with 26 (100.0% in the age bracket) attending a public institution.
| Age Bracket | Public School | Private School |
| 3 to 4 Year Olds | 26 (100.0%) | 0 (0.0%) |
| 5 to 9 Year Old | 138 (100.0%) | 0 (0.0%) |
| 10 to 14 Year Olds | 84 (93.3%) | 6 (6.7%) |
| 15 to 17 Year Olds | 56 (100.0%) | 0 (0.0%) |
| 18 to 19 Year Olds | 24 (100.0%) | 0 (0.0%) |
| 20 to 24 Year Olds | 0 (0.0%) | 26 (100.0%) |
| 25 to 34 Year Olds | 8 (44.4%) | 10 (55.6%) |
| 35 Years and over | 13 (100.0%) | 0 (0.0%) |
| Total | 349 (89.3%) | 42 (10.7%) |
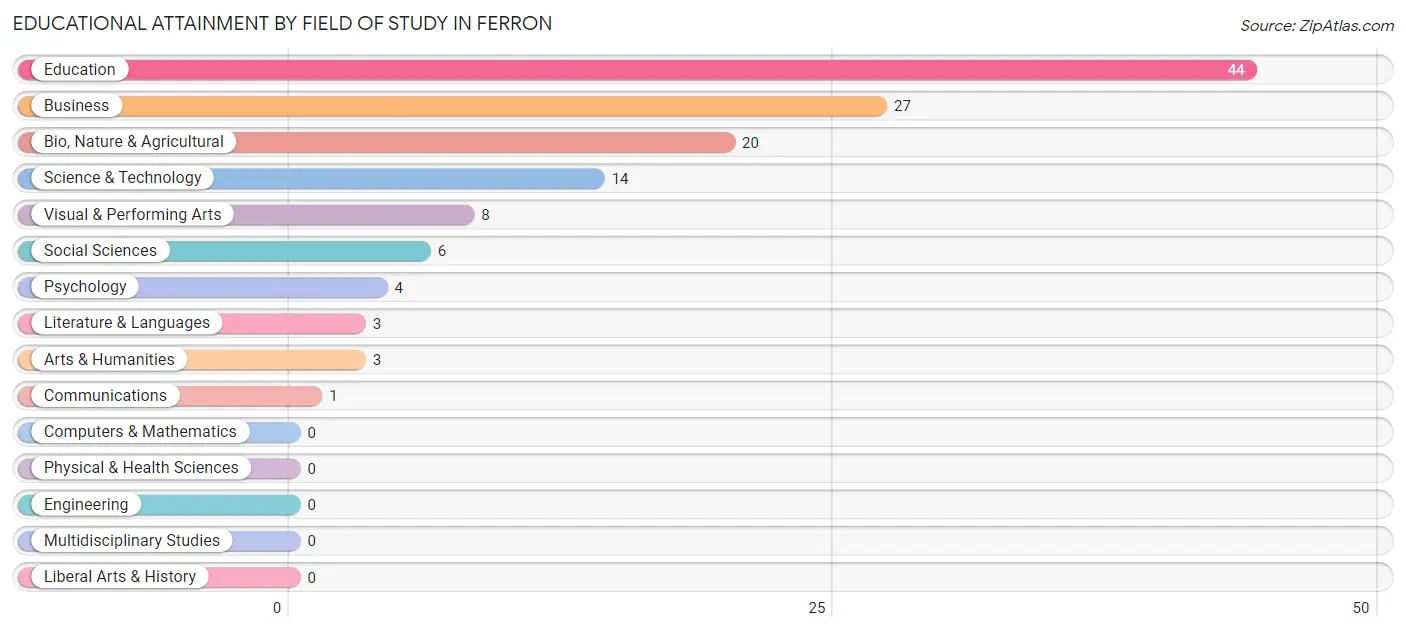
Educational Attainment by Field of Study in Ferron
Education (44 | 33.9%), business (27 | 20.8%), bio, nature & agricultural (20 | 15.4%), science & technology (14 | 10.8%), and visual & performing arts (8 | 6.1%) are the most common fields of study among 130 individuals in Ferron who have obtained a bachelor's degree or higher.
| Field of Study | # Graduates | % Graduates |
| Computers & Mathematics | 0 | 0.0% |
| Bio, Nature & Agricultural | 20 | 15.4% |
| Physical & Health Sciences | 0 | 0.0% |
| Psychology | 4 | 3.1% |
| Social Sciences | 6 | 4.6% |
| Engineering | 0 | 0.0% |
| Multidisciplinary Studies | 0 | 0.0% |
| Science & Technology | 14 | 10.8% |
| Business | 27 | 20.8% |
| Education | 44 | 33.9% |
| Literature & Languages | 3 | 2.3% |
| Liberal Arts & History | 0 | 0.0% |
| Visual & Performing Arts | 8 | 6.1% |
| Communications | 1 | 0.8% |
| Arts & Humanities | 3 | 2.3% |
| Total | 130 | 100.0% |
Transportation & Commute in Ferron
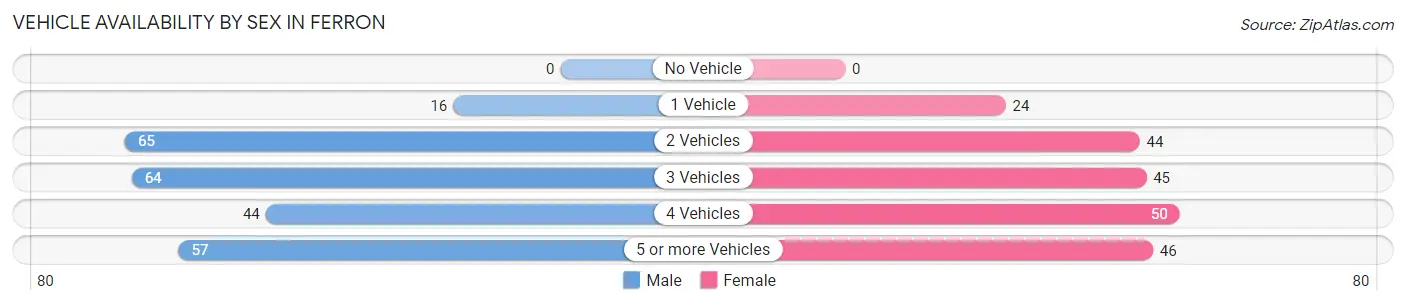
Vehicle Availability by Sex in Ferron
The most prevalent vehicle ownership categories in Ferron are males with 2 vehicles (65, accounting for 26.4%) and females with 2 vehicles (44, making up 31.1%).
| Vehicles Available | Male | Female |
| No Vehicle | 0 (0.0%) | 0 (0.0%) |
| 1 Vehicle | 16 (6.5%) | 24 (11.5%) |
| 2 Vehicles | 65 (26.4%) | 44 (21.0%) |
| 3 Vehicles | 64 (26.0%) | 45 (21.5%) |
| 4 Vehicles | 44 (17.9%) | 50 (23.9%) |
| 5 or more Vehicles | 57 (23.2%) | 46 (22.0%) |
| Total | 246 (100.0%) | 209 (100.0%) |
Commute Time in Ferron
The most frequently occuring commute durations in Ferron are less than 5 minutes (102 commuters, 24.6%), 10 to 14 minutes (58 commuters, 14.0%), and 15 to 19 minutes (58 commuters, 14.0%).
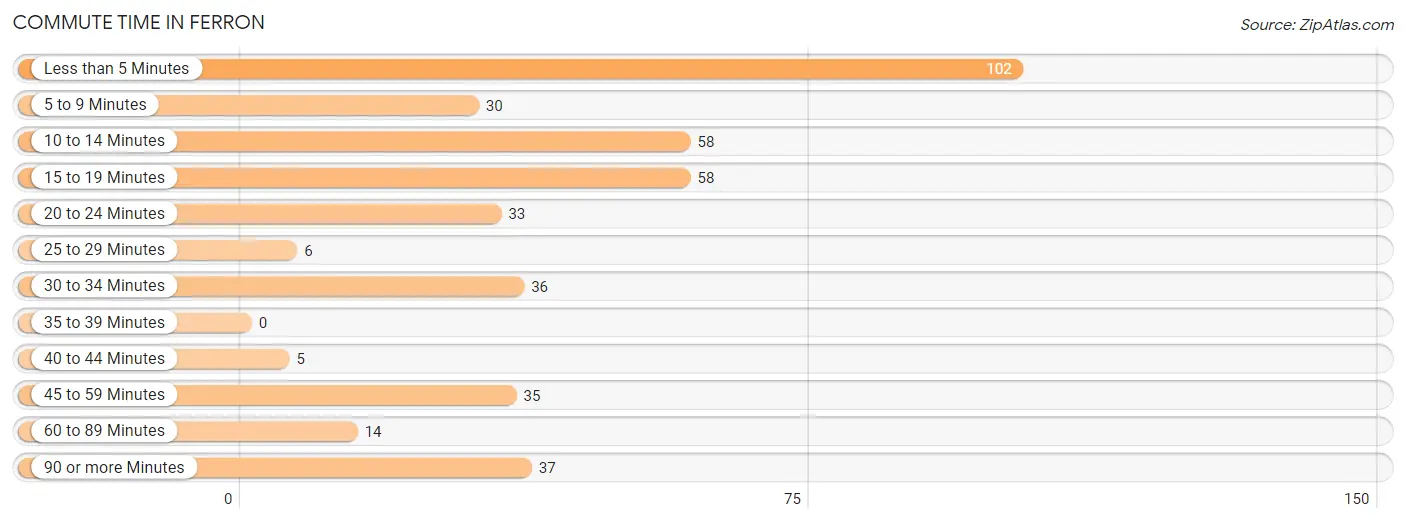
| Commute Time | # Commuters | % Commuters |
| Less than 5 Minutes | 102 | 24.6% |
| 5 to 9 Minutes | 30 | 7.2% |
| 10 to 14 Minutes | 58 | 14.0% |
| 15 to 19 Minutes | 58 | 14.0% |
| 20 to 24 Minutes | 33 | 8.0% |
| 25 to 29 Minutes | 6 | 1.5% |
| 30 to 34 Minutes | 36 | 8.7% |
| 35 to 39 Minutes | 0 | 0.0% |
| 40 to 44 Minutes | 5 | 1.2% |
| 45 to 59 Minutes | 35 | 8.5% |
| 60 to 89 Minutes | 14 | 3.4% |
| 90 or more Minutes | 37 | 8.9% |
Commute Time by Sex in Ferron
The most common commute times in Ferron are 15 to 19 minutes (44 commuters, 19.6%) for males and less than 5 minutes (80 commuters, 42.3%) for females.
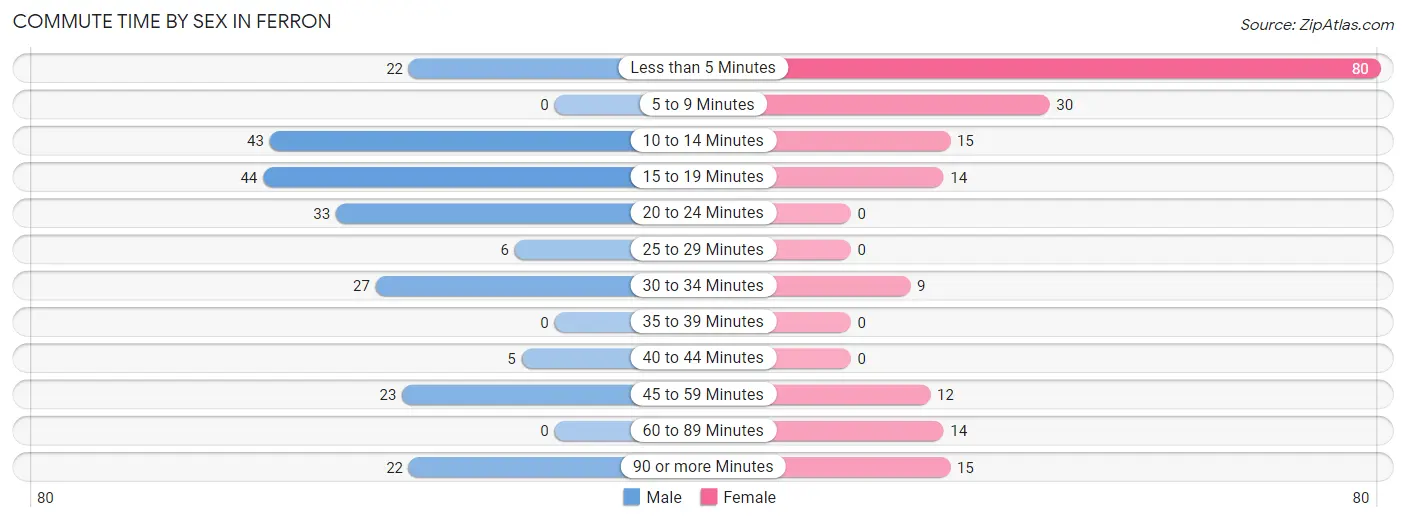
| Commute Time | Male | Female |
| Less than 5 Minutes | 22 (9.8%) | 80 (42.3%) |
| 5 to 9 Minutes | 0 (0.0%) | 30 (15.9%) |
| 10 to 14 Minutes | 43 (19.1%) | 15 (7.9%) |
| 15 to 19 Minutes | 44 (19.6%) | 14 (7.4%) |
| 20 to 24 Minutes | 33 (14.7%) | 0 (0.0%) |
| 25 to 29 Minutes | 6 (2.7%) | 0 (0.0%) |
| 30 to 34 Minutes | 27 (12.0%) | 9 (4.8%) |
| 35 to 39 Minutes | 0 (0.0%) | 0 (0.0%) |
| 40 to 44 Minutes | 5 (2.2%) | 0 (0.0%) |
| 45 to 59 Minutes | 23 (10.2%) | 12 (6.4%) |
| 60 to 89 Minutes | 0 (0.0%) | 14 (7.4%) |
| 90 or more Minutes | 22 (9.8%) | 15 (7.9%) |
Time of Departure to Work by Sex in Ferron
The most frequent times of departure to work in Ferron are 6:30 AM to 6:59 AM (57, 25.3%) for males and 7:30 AM to 7:59 AM (39, 20.6%) for females.
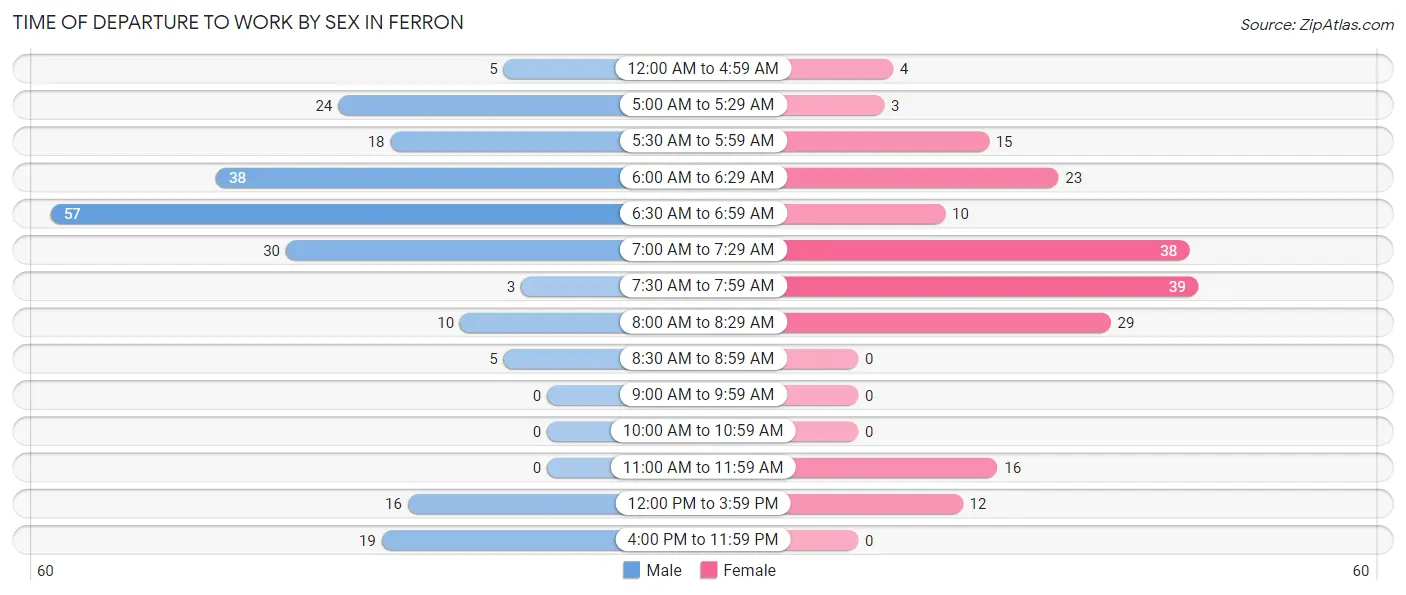
| Time of Departure | Male | Female |
| 12:00 AM to 4:59 AM | 5 (2.2%) | 4 (2.1%) |
| 5:00 AM to 5:29 AM | 24 (10.7%) | 3 (1.6%) |
| 5:30 AM to 5:59 AM | 18 (8.0%) | 15 (7.9%) |
| 6:00 AM to 6:29 AM | 38 (16.9%) | 23 (12.2%) |
| 6:30 AM to 6:59 AM | 57 (25.3%) | 10 (5.3%) |
| 7:00 AM to 7:29 AM | 30 (13.3%) | 38 (20.1%) |
| 7:30 AM to 7:59 AM | 3 (1.3%) | 39 (20.6%) |
| 8:00 AM to 8:29 AM | 10 (4.4%) | 29 (15.3%) |
| 8:30 AM to 8:59 AM | 5 (2.2%) | 0 (0.0%) |
| 9:00 AM to 9:59 AM | 0 (0.0%) | 0 (0.0%) |
| 10:00 AM to 10:59 AM | 0 (0.0%) | 0 (0.0%) |
| 11:00 AM to 11:59 AM | 0 (0.0%) | 16 (8.5%) |
| 12:00 PM to 3:59 PM | 16 (7.1%) | 12 (6.4%) |
| 4:00 PM to 11:59 PM | 19 (8.4%) | 0 (0.0%) |
| Total | 225 (100.0%) | 189 (100.0%) |
Housing Occupancy in Ferron
Occupancy by Ownership in Ferron
Of the total 483 dwellings in Ferron, owner-occupied units account for 352 (72.9%), while renter-occupied units make up 131 (27.1%).
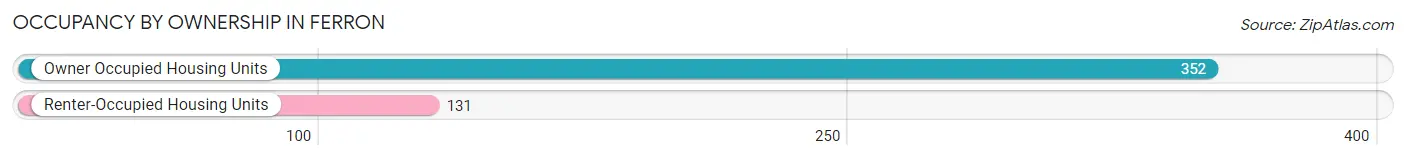
| Occupancy | # Housing Units | % Housing Units |
| Owner Occupied Housing Units | 352 | 72.9% |
| Renter-Occupied Housing Units | 131 | 27.1% |
| Total Occupied Housing Units | 483 | 100.0% |
Occupancy by Household Size in Ferron
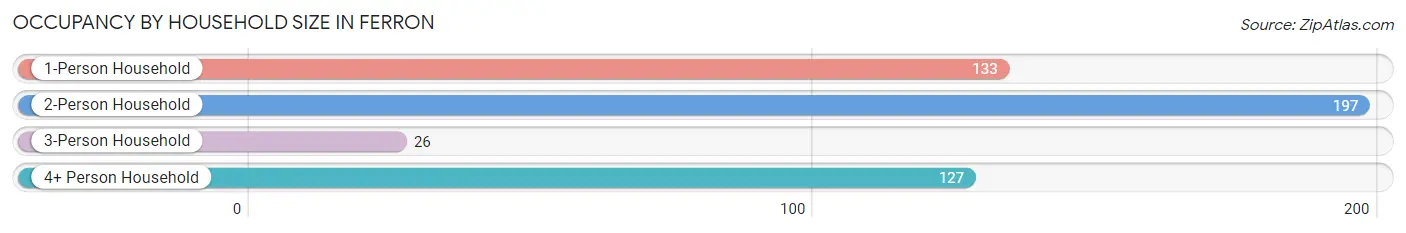
| Household Size | # Housing Units | % Housing Units |
| 1-Person Household | 133 | 27.5% |
| 2-Person Household | 197 | 40.8% |
| 3-Person Household | 26 | 5.4% |
| 4+ Person Household | 127 | 26.3% |
| Total Housing Units | 483 | 100.0% |
Occupancy by Ownership by Household Size in Ferron
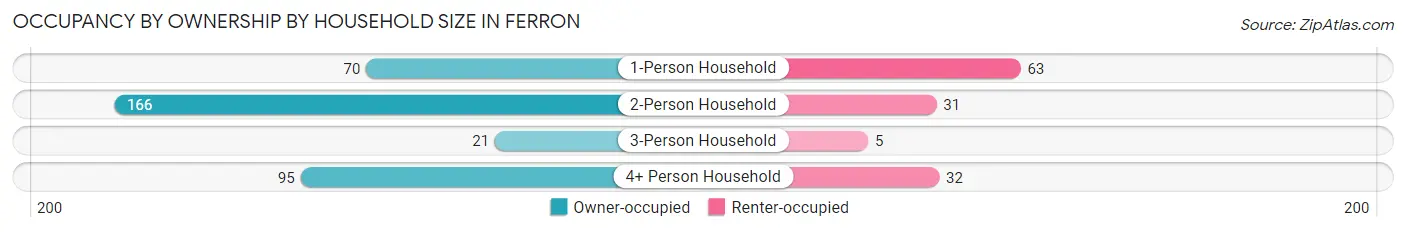
| Household Size | Owner-occupied | Renter-occupied |
| 1-Person Household | 70 (52.6%) | 63 (47.4%) |
| 2-Person Household | 166 (84.3%) | 31 (15.7%) |
| 3-Person Household | 21 (80.8%) | 5 (19.2%) |
| 4+ Person Household | 95 (74.8%) | 32 (25.2%) |
| Total Housing Units | 352 (72.9%) | 131 (27.1%) |
Occupancy by Educational Attainment in Ferron
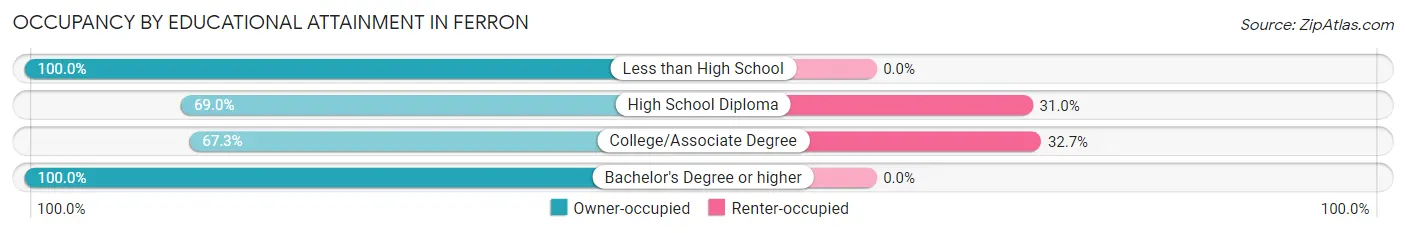
| Household Size | Owner-occupied | Renter-occupied |
| Less than High School | 18 (100.0%) | 0 (0.0%) |
| High School Diploma | 109 (69.0%) | 49 (31.0%) |
| College/Associate Degree | 169 (67.3%) | 82 (32.7%) |
| Bachelor's Degree or higher | 56 (100.0%) | 0 (0.0%) |
Occupancy by Age of Householder in Ferron
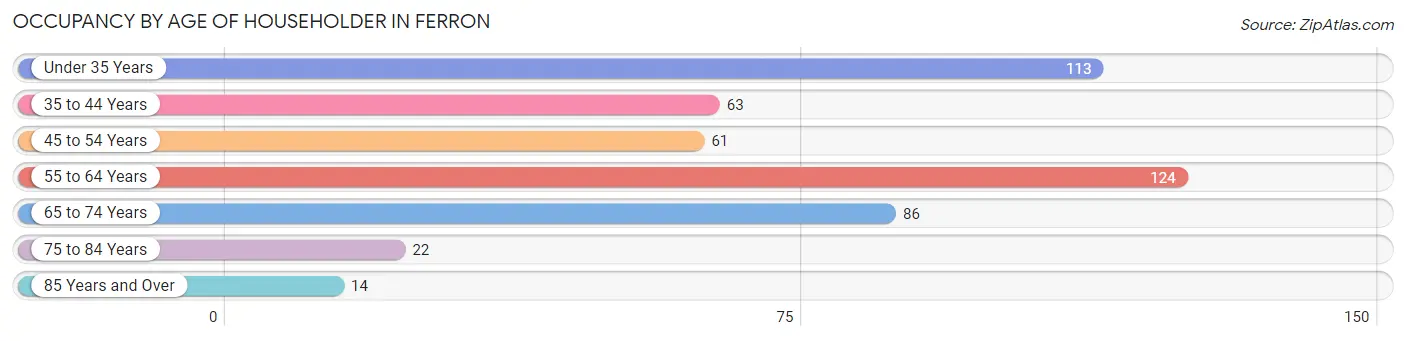
| Age Bracket | # Households | % Households |
| Under 35 Years | 113 | 23.4% |
| 35 to 44 Years | 63 | 13.0% |
| 45 to 54 Years | 61 | 12.6% |
| 55 to 64 Years | 124 | 25.7% |
| 65 to 74 Years | 86 | 17.8% |
| 75 to 84 Years | 22 | 4.5% |
| 85 Years and Over | 14 | 2.9% |
| Total | 483 | 100.0% |
Housing Finances in Ferron
Median Income by Occupancy in Ferron
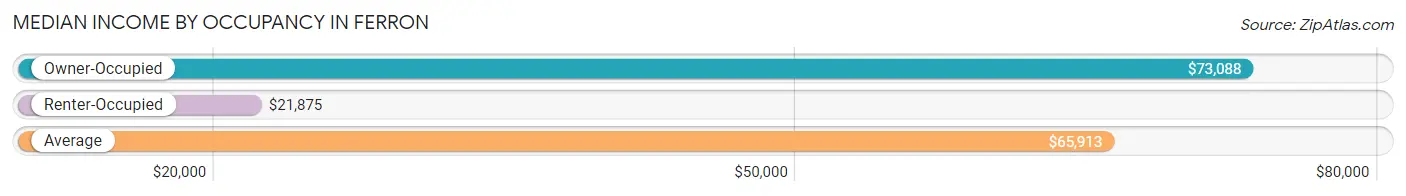
| Occupancy Type | # Households | Median Income |
| Owner-Occupied | 352 (72.9%) | $73,088 |
| Renter-Occupied | 131 (27.1%) | $21,875 |
| Average | 483 (100.0%) | $65,913 |
Occupancy by Householder Income Bracket in Ferron
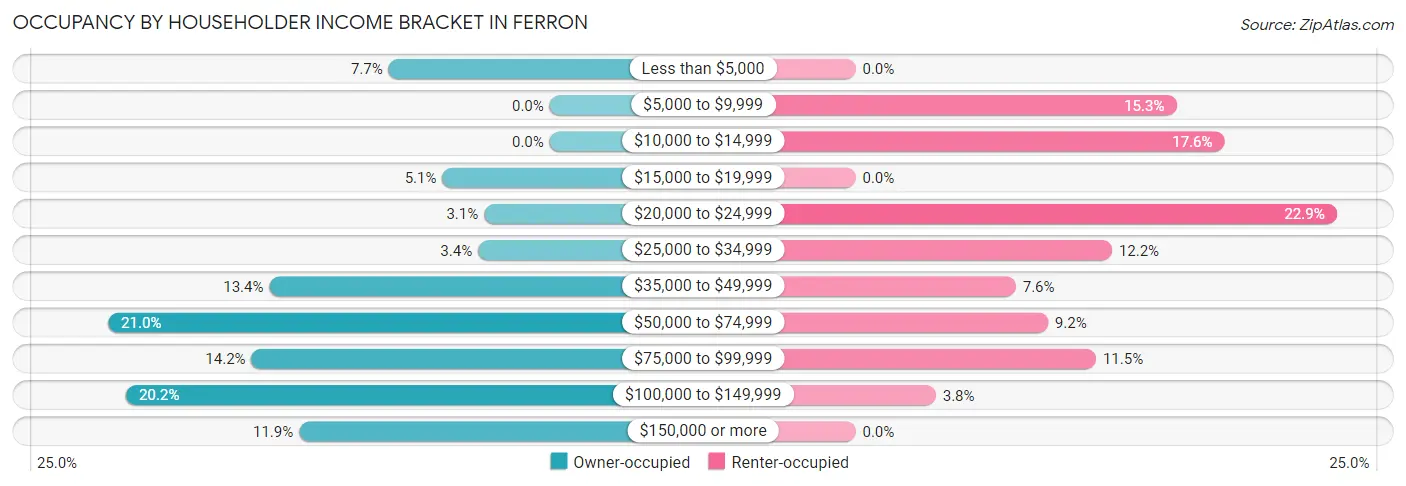
| Income Bracket | Owner-occupied | Renter-occupied |
| Less than $5,000 | 27 (7.7%) | 0 (0.0%) |
| $5,000 to $9,999 | 0 (0.0%) | 20 (15.3%) |
| $10,000 to $14,999 | 0 (0.0%) | 23 (17.6%) |
| $15,000 to $19,999 | 18 (5.1%) | 0 (0.0%) |
| $20,000 to $24,999 | 11 (3.1%) | 30 (22.9%) |
| $25,000 to $34,999 | 12 (3.4%) | 16 (12.2%) |
| $35,000 to $49,999 | 47 (13.4%) | 10 (7.6%) |
| $50,000 to $74,999 | 74 (21.0%) | 12 (9.2%) |
| $75,000 to $99,999 | 50 (14.2%) | 15 (11.5%) |
| $100,000 to $149,999 | 71 (20.2%) | 5 (3.8%) |
| $150,000 or more | 42 (11.9%) | 0 (0.0%) |
| Total | 352 (100.0%) | 131 (100.0%) |
Monthly Housing Cost Tiers in Ferron

| Monthly Cost | Owner-occupied | Renter-occupied |
| Less than $300 | 74 (21.0%) | 19 (14.5%) |
| $300 to $499 | 115 (32.7%) | 0 (0.0%) |
| $500 to $799 | 31 (8.8%) | 58 (44.3%) |
| $800 to $999 | 26 (7.4%) | 14 (10.7%) |
| $1,000 to $1,499 | 95 (27.0%) | 0 (0.0%) |
| $1,500 to $1,999 | 3 (0.9%) | 0 (0.0%) |
| $2,000 to $2,499 | 8 (2.3%) | 0 (0.0%) |
| $2,500 to $2,999 | 0 (0.0%) | 0 (0.0%) |
| $3,000 or more | 0 (0.0%) | 0 (0.0%) |
| Total | 352 (100.0%) | 131 (100.0%) |
Physical Housing Characteristics in Ferron
Housing Structures in Ferron
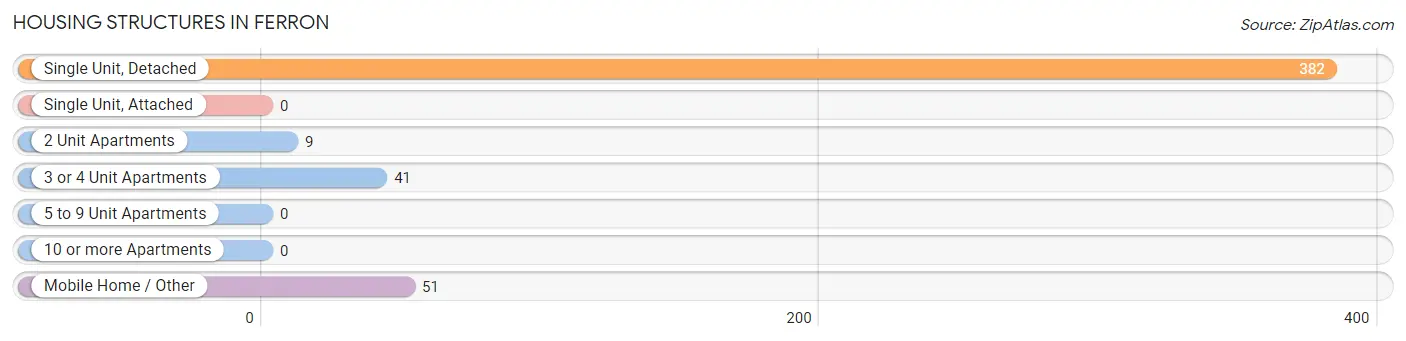
| Structure Type | # Housing Units | % Housing Units |
| Single Unit, Detached | 382 | 79.1% |
| Single Unit, Attached | 0 | 0.0% |
| 2 Unit Apartments | 9 | 1.9% |
| 3 or 4 Unit Apartments | 41 | 8.5% |
| 5 to 9 Unit Apartments | 0 | 0.0% |
| 10 or more Apartments | 0 | 0.0% |
| Mobile Home / Other | 51 | 10.6% |
| Total | 483 | 100.0% |
Housing Structures by Occupancy in Ferron
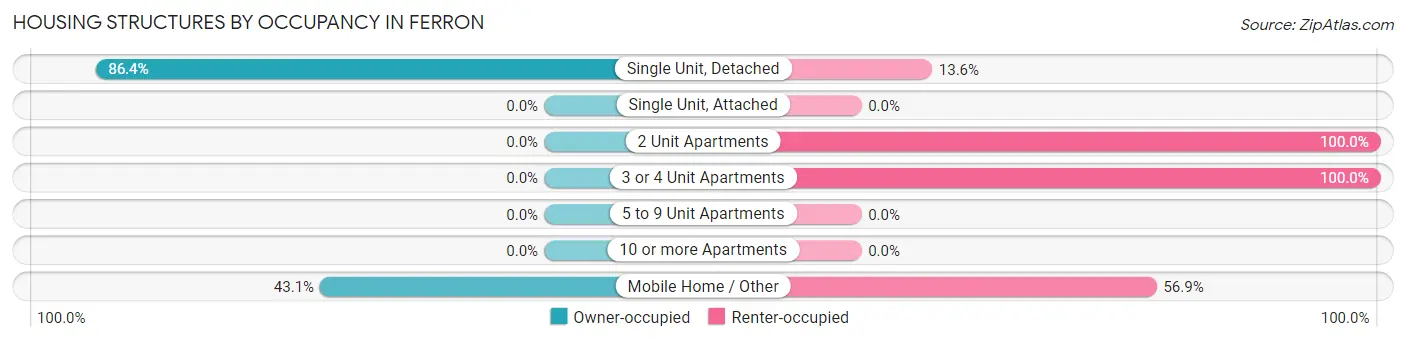
| Structure Type | Owner-occupied | Renter-occupied |
| Single Unit, Detached | 330 (86.4%) | 52 (13.6%) |
| Single Unit, Attached | 0 (0.0%) | 0 (0.0%) |
| 2 Unit Apartments | 0 (0.0%) | 9 (100.0%) |
| 3 or 4 Unit Apartments | 0 (0.0%) | 41 (100.0%) |
| 5 to 9 Unit Apartments | 0 (0.0%) | 0 (0.0%) |
| 10 or more Apartments | 0 (0.0%) | 0 (0.0%) |
| Mobile Home / Other | 22 (43.1%) | 29 (56.9%) |
| Total | 352 (72.9%) | 131 (27.1%) |
Housing Structures by Number of Rooms in Ferron
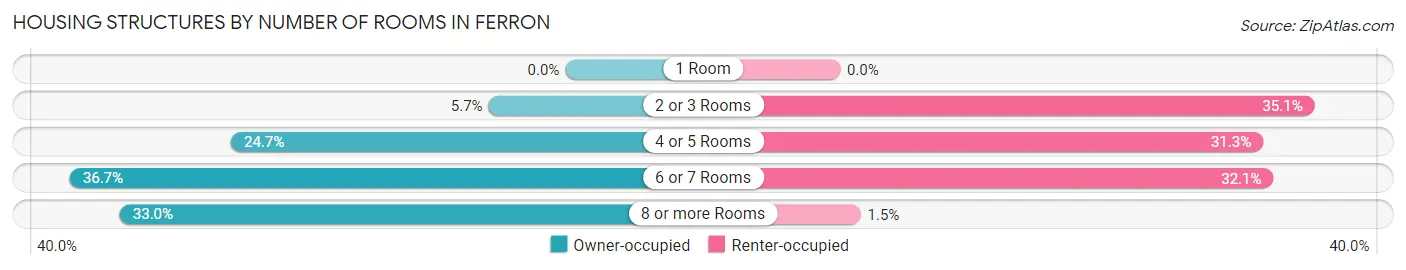
| Number of Rooms | Owner-occupied | Renter-occupied |
| 1 Room | 0 (0.0%) | 0 (0.0%) |
| 2 or 3 Rooms | 20 (5.7%) | 46 (35.1%) |
| 4 or 5 Rooms | 87 (24.7%) | 41 (31.3%) |
| 6 or 7 Rooms | 129 (36.6%) | 42 (32.1%) |
| 8 or more Rooms | 116 (33.0%) | 2 (1.5%) |
| Total | 352 (100.0%) | 131 (100.0%) |
Housing Structure by Heating Type in Ferron
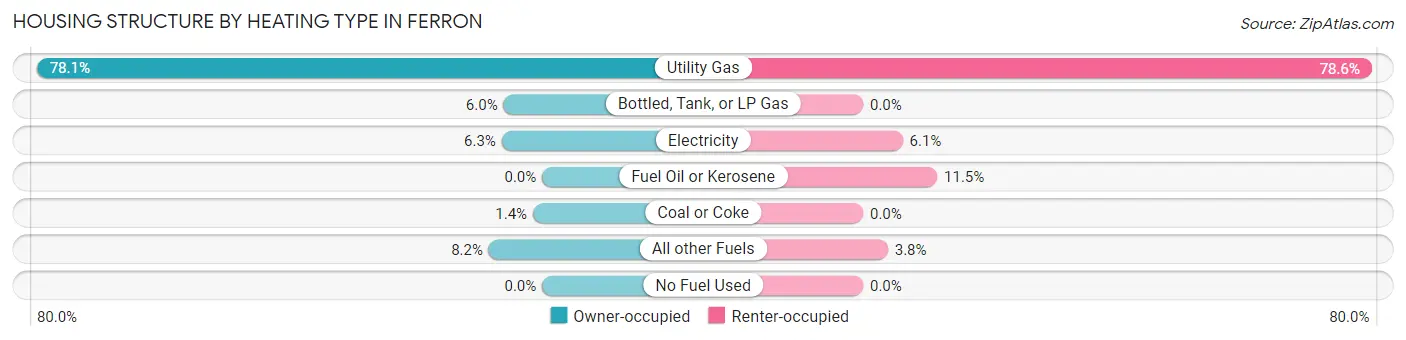
| Heating Type | Owner-occupied | Renter-occupied |
| Utility Gas | 275 (78.1%) | 103 (78.6%) |
| Bottled, Tank, or LP Gas | 21 (6.0%) | 0 (0.0%) |
| Electricity | 22 (6.2%) | 8 (6.1%) |
| Fuel Oil or Kerosene | 0 (0.0%) | 15 (11.5%) |
| Coal or Coke | 5 (1.4%) | 0 (0.0%) |
| All other Fuels | 29 (8.2%) | 5 (3.8%) |
| No Fuel Used | 0 (0.0%) | 0 (0.0%) |
| Total | 352 (100.0%) | 131 (100.0%) |
Household Vehicle Usage in Ferron
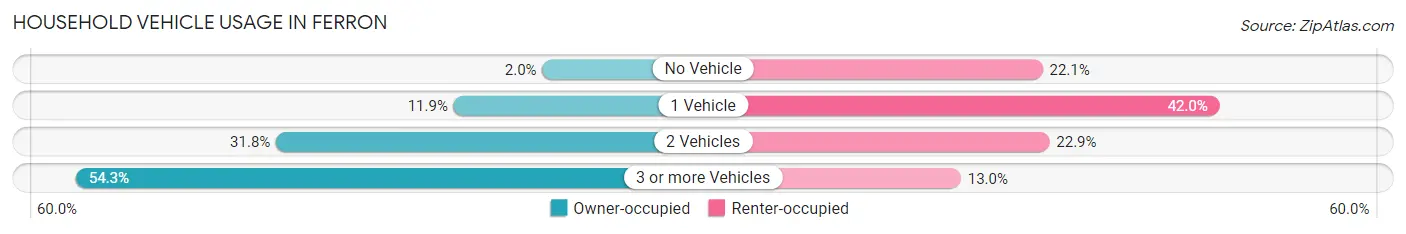
| Vehicles per Household | Owner-occupied | Renter-occupied |
| No Vehicle | 7 (2.0%) | 29 (22.1%) |
| 1 Vehicle | 42 (11.9%) | 55 (42.0%) |
| 2 Vehicles | 112 (31.8%) | 30 (22.9%) |
| 3 or more Vehicles | 191 (54.3%) | 17 (13.0%) |
| Total | 352 (100.0%) | 131 (100.0%) |
Real Estate & Mortgages in Ferron
Real Estate and Mortgage Overview in Ferron
| Characteristic | Without Mortgage | With Mortgage |
| Housing Units | 211 | 141 |
| Median Property Value | $160,800 | $187,500 |
| Median Household Income | $59,464 | $33 |
| Monthly Housing Costs | $338 | $0 |
| Real Estate Taxes | $971 | $0 |
Property Value by Mortgage Status in Ferron
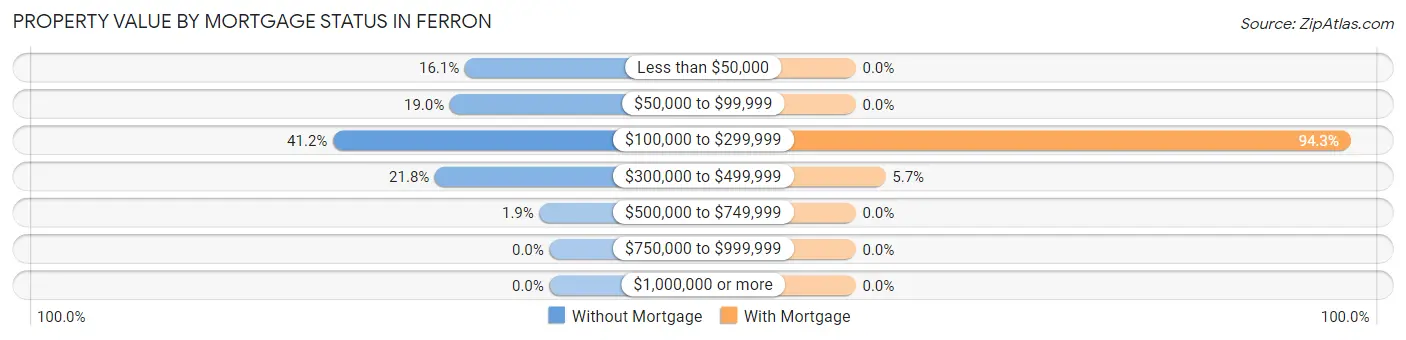
| Property Value | Without Mortgage | With Mortgage |
| Less than $50,000 | 34 (16.1%) | 0 (0.0%) |
| $50,000 to $99,999 | 40 (19.0%) | 0 (0.0%) |
| $100,000 to $299,999 | 87 (41.2%) | 133 (94.3%) |
| $300,000 to $499,999 | 46 (21.8%) | 8 (5.7%) |
| $500,000 to $749,999 | 4 (1.9%) | 0 (0.0%) |
| $750,000 to $999,999 | 0 (0.0%) | 0 (0.0%) |
| $1,000,000 or more | 0 (0.0%) | 0 (0.0%) |
| Total | 211 (100.0%) | 141 (100.0%) |
Household Income by Mortgage Status in Ferron
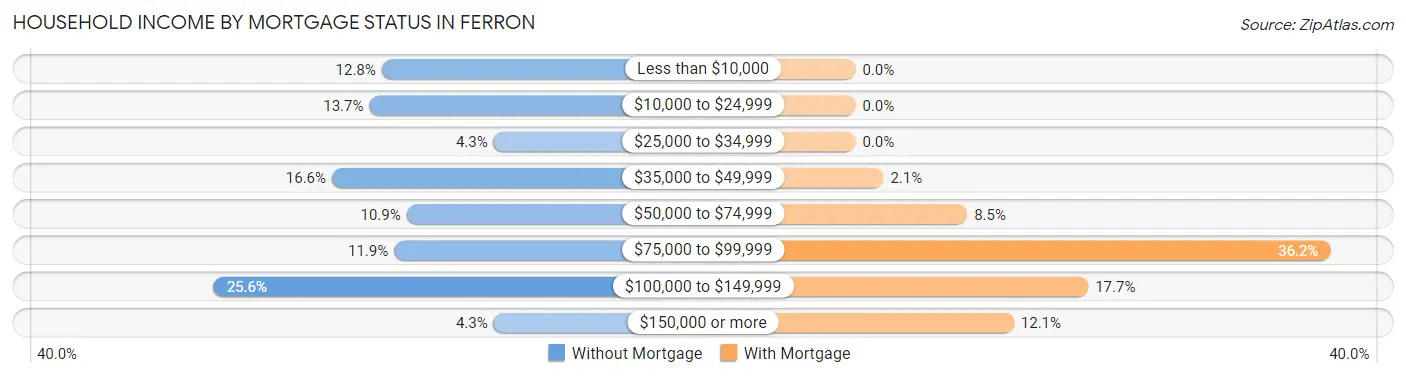
| Household Income | Without Mortgage | With Mortgage |
| Less than $10,000 | 27 (12.8%) | 0 (0.0%) |
| $10,000 to $24,999 | 29 (13.7%) | 0 (0.0%) |
| $25,000 to $34,999 | 9 (4.3%) | 0 (0.0%) |
| $35,000 to $49,999 | 35 (16.6%) | 3 (2.1%) |
| $50,000 to $74,999 | 23 (10.9%) | 12 (8.5%) |
| $75,000 to $99,999 | 25 (11.8%) | 51 (36.2%) |
| $100,000 to $149,999 | 54 (25.6%) | 25 (17.7%) |
| $150,000 or more | 9 (4.3%) | 17 (12.1%) |
| Total | 211 (100.0%) | 141 (100.0%) |
Property Value to Household Income Ratio in Ferron
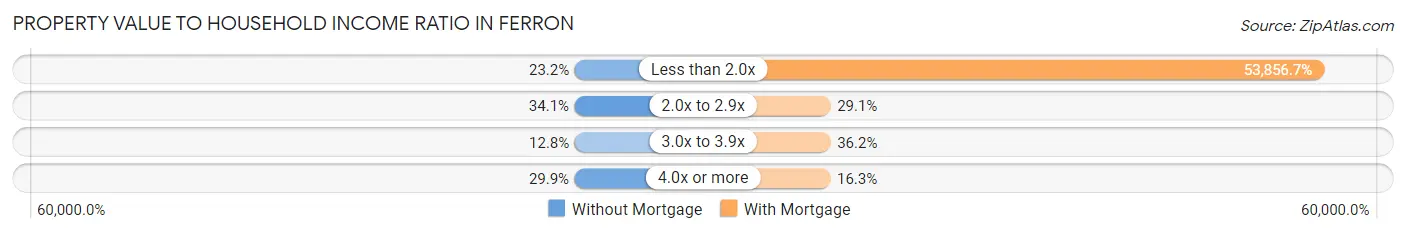
| Value-to-Income Ratio | Without Mortgage | With Mortgage |
| Less than 2.0x | 49 (23.2%) | 75,938 (53,856.7%) |
| 2.0x to 2.9x | 72 (34.1%) | 41 (29.1%) |
| 3.0x to 3.9x | 27 (12.8%) | 51 (36.2%) |
| 4.0x or more | 63 (29.9%) | 23 (16.3%) |
| Total | 211 (100.0%) | 141 (100.0%) |
Real Estate Taxes by Mortgage Status in Ferron
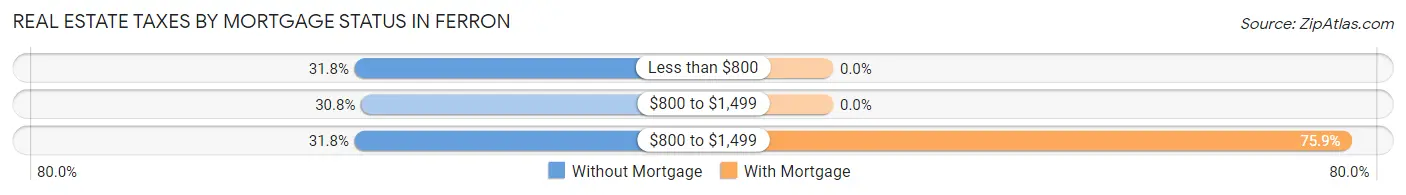
| Property Taxes | Without Mortgage | With Mortgage |
| Less than $800 | 67 (31.8%) | 0 (0.0%) |
| $800 to $1,499 | 65 (30.8%) | 0 (0.0%) |
| $800 to $1,499 | 67 (31.8%) | 107 (75.9%) |
| Total | 211 (100.0%) | 141 (100.0%) |
Health & Disability in Ferron
Health Insurance Coverage by Age in Ferron
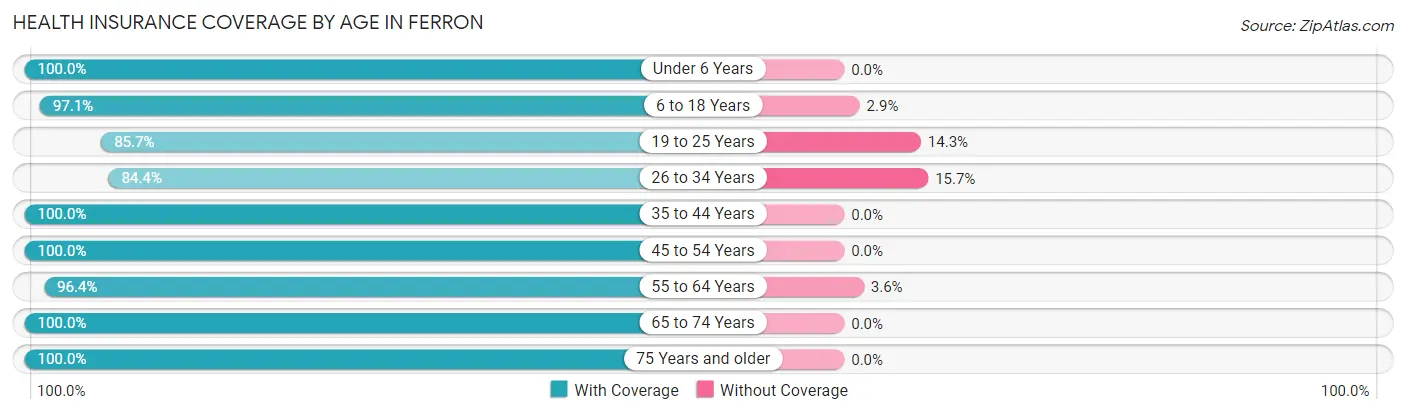
| Age Bracket | With Coverage | Without Coverage |
| Under 6 Years | 103 (100.0%) | 0 (0.0%) |
| 6 to 18 Years | 272 (97.1%) | 8 (2.9%) |
| 19 to 25 Years | 120 (85.7%) | 20 (14.3%) |
| 26 to 34 Years | 124 (84.4%) | 23 (15.7%) |
| 35 to 44 Years | 141 (100.0%) | 0 (0.0%) |
| 45 to 54 Years | 98 (100.0%) | 0 (0.0%) |
| 55 to 64 Years | 212 (96.4%) | 8 (3.6%) |
| 65 to 74 Years | 153 (100.0%) | 0 (0.0%) |
| 75 Years and older | 42 (100.0%) | 0 (0.0%) |
| Total | 1,265 (95.5%) | 59 (4.5%) |
Health Insurance Coverage by Citizenship Status in Ferron
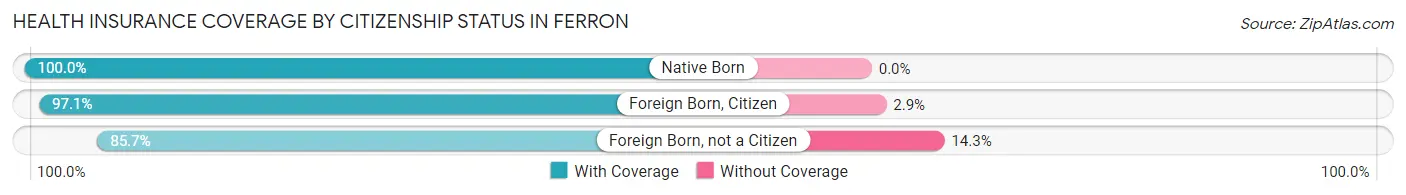
| Citizenship Status | With Coverage | Without Coverage |
| Native Born | 103 (100.0%) | 0 (0.0%) |
| Foreign Born, Citizen | 272 (97.1%) | 8 (2.9%) |
| Foreign Born, not a Citizen | 120 (85.7%) | 20 (14.3%) |
Health Insurance Coverage by Household Income in Ferron
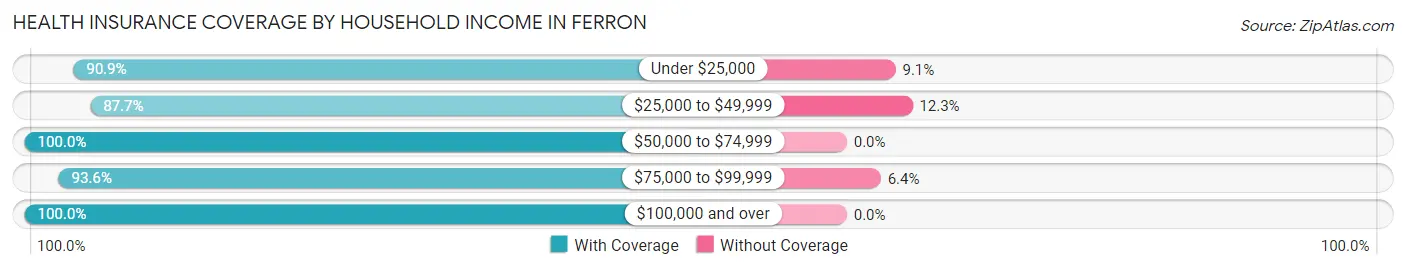
| Household Income | With Coverage | Without Coverage |
| Under $25,000 | 209 (90.9%) | 21 (9.1%) |
| $25,000 to $49,999 | 164 (87.7%) | 23 (12.3%) |
| $50,000 to $74,999 | 263 (100.0%) | 0 (0.0%) |
| $75,000 to $99,999 | 221 (93.6%) | 15 (6.4%) |
| $100,000 and over | 408 (100.0%) | 0 (0.0%) |
Public vs Private Health Insurance Coverage by Age in Ferron
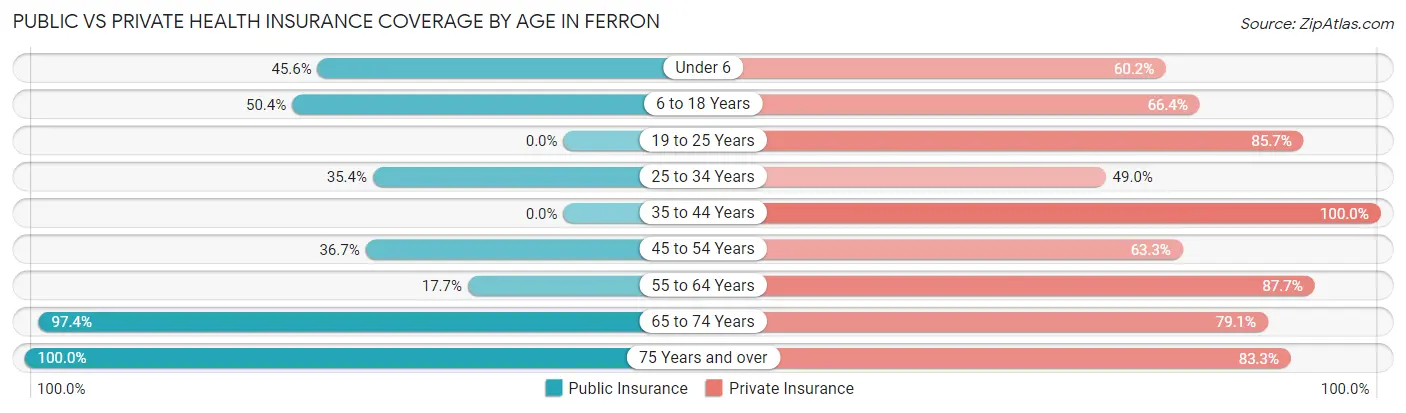
| Age Bracket | Public Insurance | Private Insurance |
| Under 6 | 47 (45.6%) | 62 (60.2%) |
| 6 to 18 Years | 141 (50.4%) | 186 (66.4%) |
| 19 to 25 Years | 0 (0.0%) | 120 (85.7%) |
| 25 to 34 Years | 52 (35.4%) | 72 (49.0%) |
| 35 to 44 Years | 0 (0.0%) | 141 (100.0%) |
| 45 to 54 Years | 36 (36.7%) | 62 (63.3%) |
| 55 to 64 Years | 39 (17.7%) | 193 (87.7%) |
| 65 to 74 Years | 149 (97.4%) | 121 (79.1%) |
| 75 Years and over | 42 (100.0%) | 35 (83.3%) |
| Total | 506 (38.2%) | 992 (74.9%) |
Disability Status by Sex by Age in Ferron
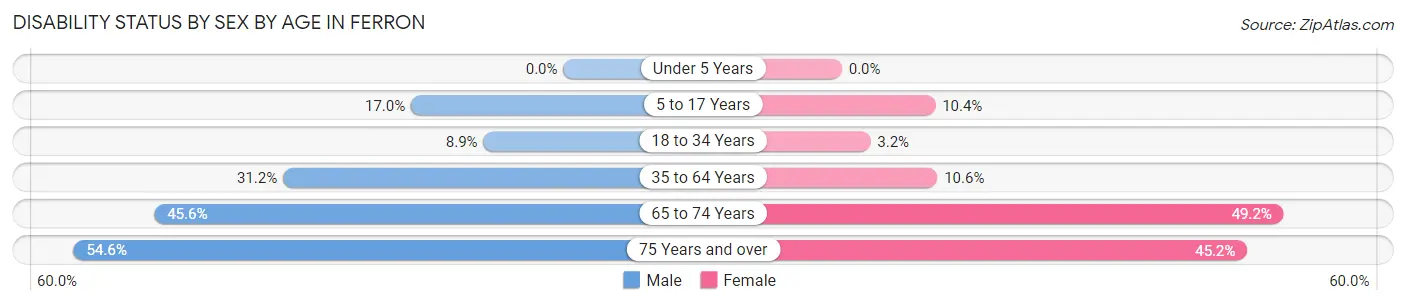
| Age Bracket | Male | Female |
| Under 5 Years | 0 (0.0%) | 0 (0.0%) |
| 5 to 17 Years | 19 (17.0%) | 21 (10.4%) |
| 18 to 34 Years | 13 (8.9%) | 5 (3.2%) |
| 35 to 64 Years | 64 (31.2%) | 27 (10.6%) |
| 65 to 74 Years | 41 (45.6%) | 31 (49.2%) |
| 75 Years and over | 6 (54.5%) | 14 (45.2%) |
Disability Class by Sex by Age in Ferron
Disability Class: Hearing Difficulty
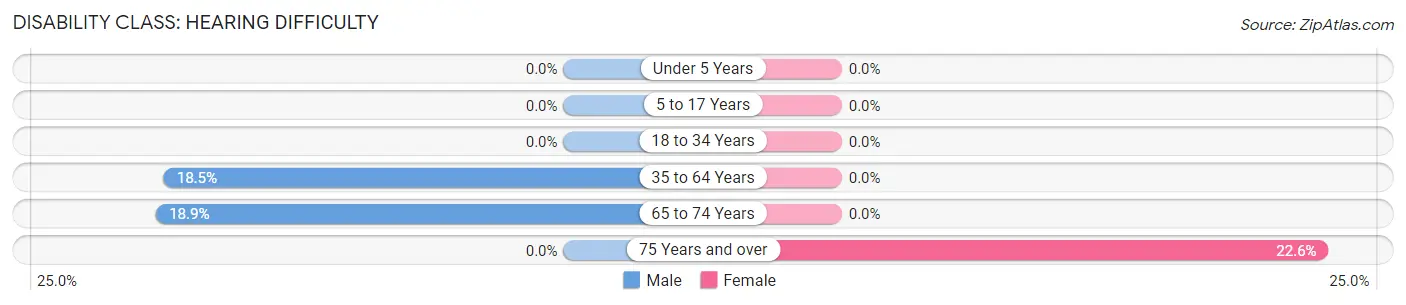
| Age Bracket | Male | Female |
| Under 5 Years | 0 (0.0%) | 0 (0.0%) |
| 5 to 17 Years | 0 (0.0%) | 0 (0.0%) |
| 18 to 34 Years | 0 (0.0%) | 0 (0.0%) |
| 35 to 64 Years | 38 (18.5%) | 0 (0.0%) |
| 65 to 74 Years | 17 (18.9%) | 0 (0.0%) |
| 75 Years and over | 0 (0.0%) | 7 (22.6%) |
Disability Class: Vision Difficulty
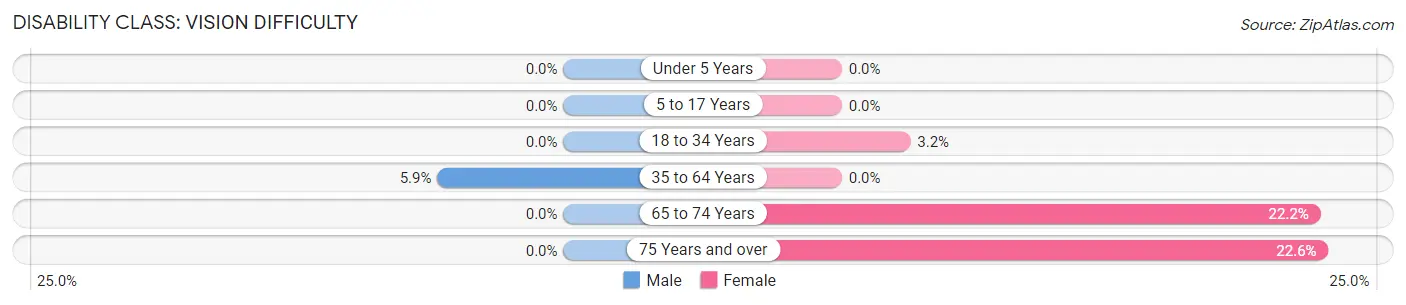
| Age Bracket | Male | Female |
| Under 5 Years | 0 (0.0%) | 0 (0.0%) |
| 5 to 17 Years | 0 (0.0%) | 0 (0.0%) |
| 18 to 34 Years | 0 (0.0%) | 5 (3.2%) |
| 35 to 64 Years | 12 (5.9%) | 0 (0.0%) |
| 65 to 74 Years | 0 (0.0%) | 14 (22.2%) |
| 75 Years and over | 0 (0.0%) | 7 (22.6%) |
Disability Class: Cognitive Difficulty
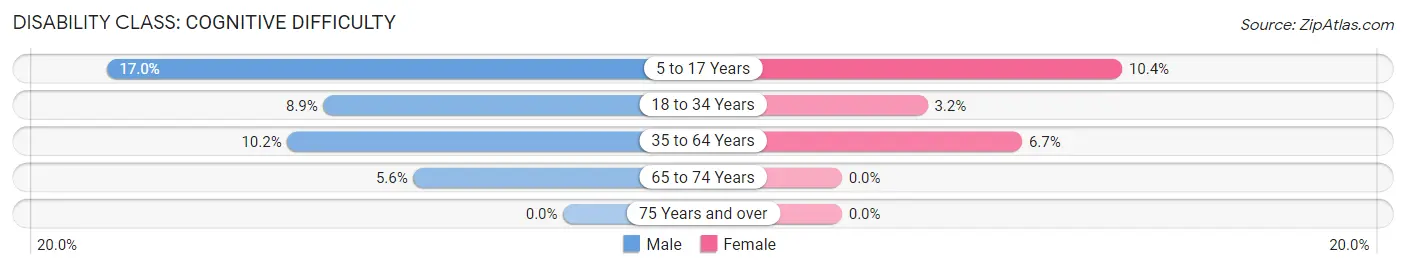
| Age Bracket | Male | Female |
| 5 to 17 Years | 19 (17.0%) | 21 (10.4%) |
| 18 to 34 Years | 13 (8.9%) | 5 (3.2%) |
| 35 to 64 Years | 21 (10.2%) | 17 (6.7%) |
| 65 to 74 Years | 5 (5.6%) | 0 (0.0%) |
| 75 Years and over | 0 (0.0%) | 0 (0.0%) |
Disability Class: Ambulatory Difficulty
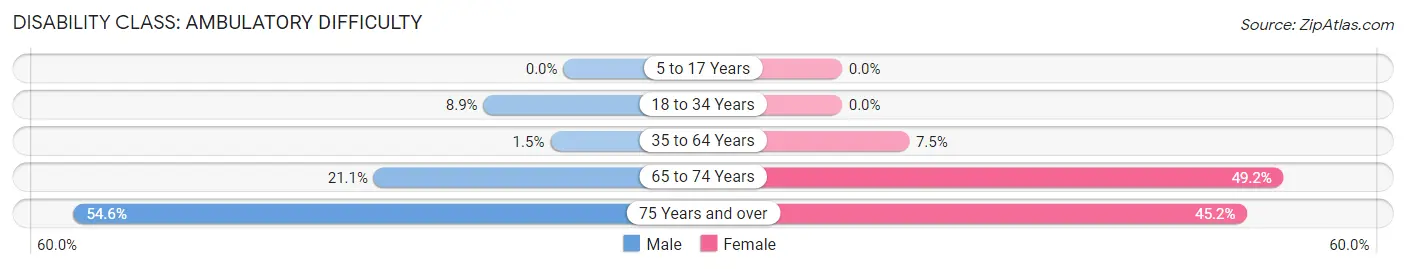
| Age Bracket | Male | Female |
| 5 to 17 Years | 0 (0.0%) | 0 (0.0%) |
| 18 to 34 Years | 13 (8.9%) | 0 (0.0%) |
| 35 to 64 Years | 3 (1.5%) | 19 (7.5%) |
| 65 to 74 Years | 19 (21.1%) | 31 (49.2%) |
| 75 Years and over | 6 (54.5%) | 14 (45.2%) |
Disability Class: Self-Care Difficulty
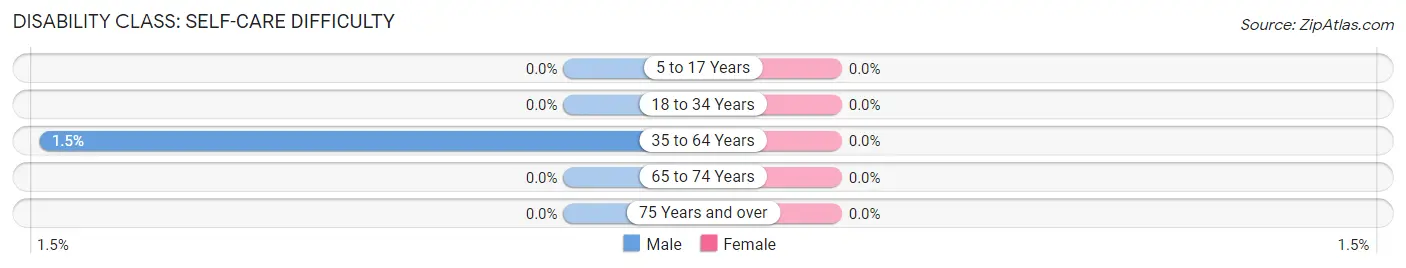
| Age Bracket | Male | Female |
| 5 to 17 Years | 0 (0.0%) | 0 (0.0%) |
| 18 to 34 Years | 0 (0.0%) | 0 (0.0%) |
| 35 to 64 Years | 3 (1.5%) | 0 (0.0%) |
| 65 to 74 Years | 0 (0.0%) | 0 (0.0%) |
| 75 Years and over | 0 (0.0%) | 0 (0.0%) |
Technology Access in Ferron
Computing Device Access in Ferron
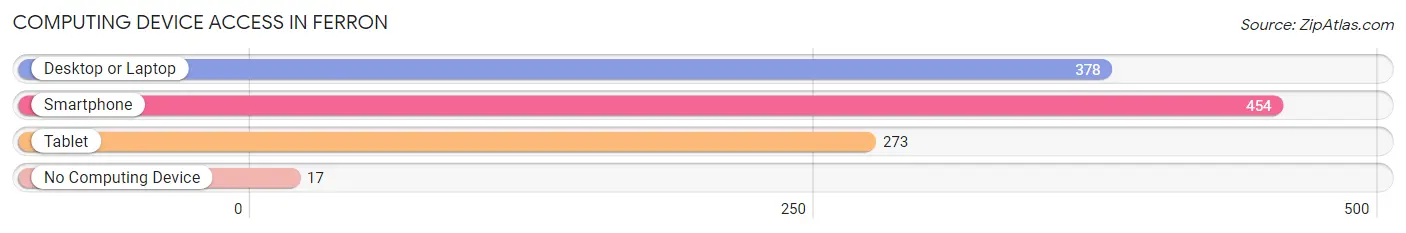
| Device Type | # Households | % Households |
| Desktop or Laptop | 378 | 78.3% |
| Smartphone | 454 | 94.0% |
| Tablet | 273 | 56.5% |
| No Computing Device | 17 | 3.5% |
| Total | 483 | 100.0% |
Internet Access in Ferron
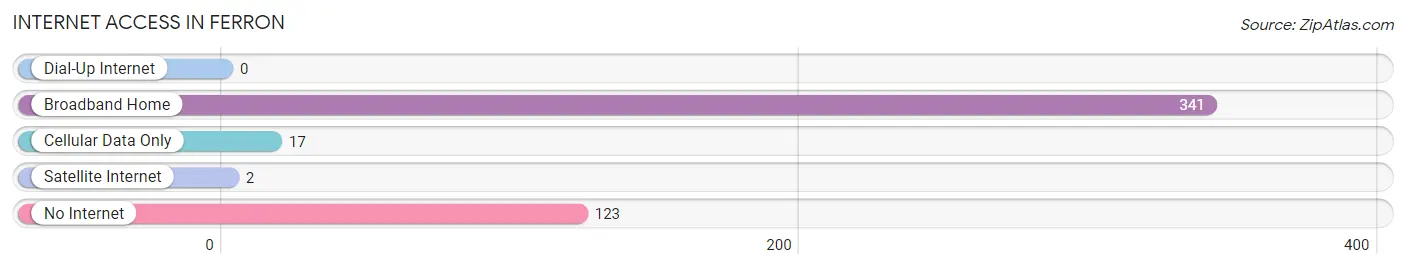
| Internet Type | # Households | % Households |
| Dial-Up Internet | 0 | 0.0% |
| Broadband Home | 341 | 70.6% |
| Cellular Data Only | 17 | 3.5% |
| Satellite Internet | 2 | 0.4% |
| No Internet | 123 | 25.5% |
| Total | 483 | 100.0% |
Ferron Summary
Ferron is a small city located in Emery County, Utah. It is situated in the San Rafael Swell region of the state, and is surrounded by the Manti-La Sal National Forest. The city has a population of 1,521 people, according to the 2010 census.
Geography
Ferron is located in the San Rafael Swell region of Utah, which is a large area of rugged terrain and canyons. The city is situated at an elevation of 5,845 feet, and is surrounded by the Manti-La Sal National Forest. The city is located on the banks of the Ferron Creek, which is a tributary of the San Rafael River. The city is located approximately 75 miles southeast of Salt Lake City, and is accessible via State Route 10.
History
Ferron was first settled in 1877 by a group of Mormon pioneers. The city was named after a local Native American chief, Chief Ferron. The city was incorporated in 1891, and has remained a small, rural community ever since.
Economy
The economy of Ferron is largely based on agriculture and tourism. The city is home to several farms and ranches, which produce hay, wheat, and other crops. The city is also home to several tourist attractions, including the Ferron Reservoir, which is a popular spot for fishing and boating.
Demographics
According to the 2010 census, the population of Ferron was 1,521 people. The racial makeup of the city was 97.2% White, 0.2% African American, 0.3% Native American, 0.2% Asian, 0.1% Pacific Islander, 0.7% from other races, and 1.3% from two or more races. The median household income in Ferron was $37,917, and the median age was 37.
Conclusion
Ferron is a small city located in Emery County, Utah. It is situated in the San Rafael Swell region of the state, and is surrounded by the Manti-La Sal National Forest. The city has a population of 1,521 people, according to the 2010 census. The economy of Ferron is largely based on agriculture and tourism, and the city is home to several farms and ranches, as well as several tourist attractions. The racial makeup of the city is predominantly White, with a median household income of $37,917 and a median age of 37.
Common Questions
What is Per Capita Income in Ferron?
Per Capita income in Ferron is $24,069.
What is the Median Family Income in Ferron?
Median Family Income in Ferron is $79,886.
What is the Median Household income in Ferron?
Median Household Income in Ferron is $65,913.
What is Income or Wage Gap in Ferron?
Income or Wage Gap in Ferron is 77.7%.
Women in Ferron earn 22.3 cents for every dollar earned by a man.
What is Inequality or Gini Index in Ferron?
Inequality or Gini Index in Ferron is 0.40.
What is the Total Population of Ferron?
Total Population of Ferron is 1,360.
What is the Total Male Population of Ferron?
Total Male Population of Ferron is 597.
What is the Total Female Population of Ferron?
Total Female Population of Ferron is 763.
What is the Ratio of Males per 100 Females in Ferron?
There are 78.24 Males per 100 Females in Ferron.
What is the Ratio of Females per 100 Males in Ferron?
There are 127.81 Females per 100 Males in Ferron.
What is the Median Population Age in Ferron?
Median Population Age in Ferron is 39.2 Years.
What is the Average Family Size in Ferron
Average Family Size in Ferron is 3.5 People.
What is the Average Household Size in Ferron
Average Household Size in Ferron is 2.7 People.
How Large is the Labor Force in Ferron?
There are 549 People in the Labor Forcein in Ferron.
What is the Percentage of People in the Labor Force in Ferron?
52.3% of People are in the Labor Force in Ferron.
What is the Unemployment Rate in Ferron?
Unemployment Rate in Ferron is 11.8%.