Oakley, UT Map & Demographics
Oakley Map
Oakley Overview
$53,958
PER CAPITA INCOME
$120,000
AVG FAMILY INCOME
$119,231
AVG HOUSEHOLD INCOME
20.2%
WAGE / INCOME GAP [ % ]
79.8¢/ $1
WAGE / INCOME GAP [ $ ]
0.48
INEQUALITY / GINI INDEX
1,744
TOTAL POPULATION
964
MALE POPULATION
780
FEMALE POPULATION
123.59
MALES / 100 FEMALES
80.91
FEMALES / 100 MALES
37.2
MEDIAN AGE
3.9
AVG FAMILY SIZE
3.7
AVG HOUSEHOLD SIZE
905
LABOR FORCE [ PEOPLE ]
68.8%
PERCENT IN LABOR FORCE
4.1%
UNEMPLOYMENT RATE
Oakley Zip Codes
Oakley Area Codes
Income in Oakley
Income Overview in Oakley
Per Capita Income in Oakley is $53,958, while median incomes of families and households are $120,000 and $119,231 respectively.
| Characteristic | Number | Measure |
| Per Capita Income | 1,744 | $53,958 |
| Median Family Income | 380 | $120,000 |
| Mean Family Income | 380 | $178,096 |
| Median Household Income | 458 | $119,231 |
| Mean Household Income | 458 | $175,241 |
| Income Deficit | 380 | $0 |
| Wage / Income Gap (%) | 1,744 | 20.18% |
| Wage / Income Gap ($) | 1,744 | 79.82¢ per $1 |
| Gini / Inequality Index | 1,744 | 0.48 |
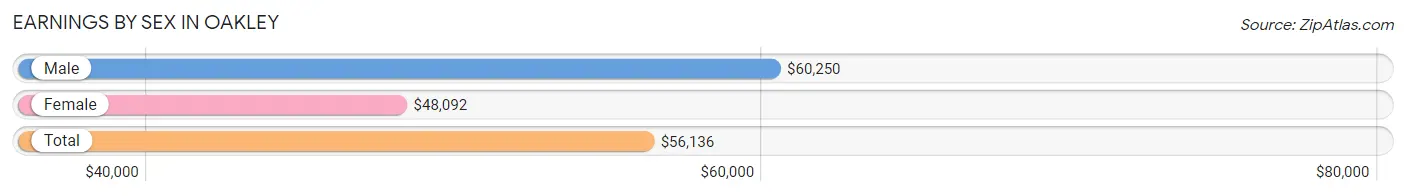
Earnings by Sex in Oakley
Average Earnings in Oakley are $56,136, $60,250 for men and $48,092 for women, a difference of 20.2%.
| Sex | Number | Average Earnings |
| Male | 625 (64.2%) | $60,250 |
| Female | 349 (35.8%) | $48,092 |
| Total | 974 (100.0%) | $56,136 |
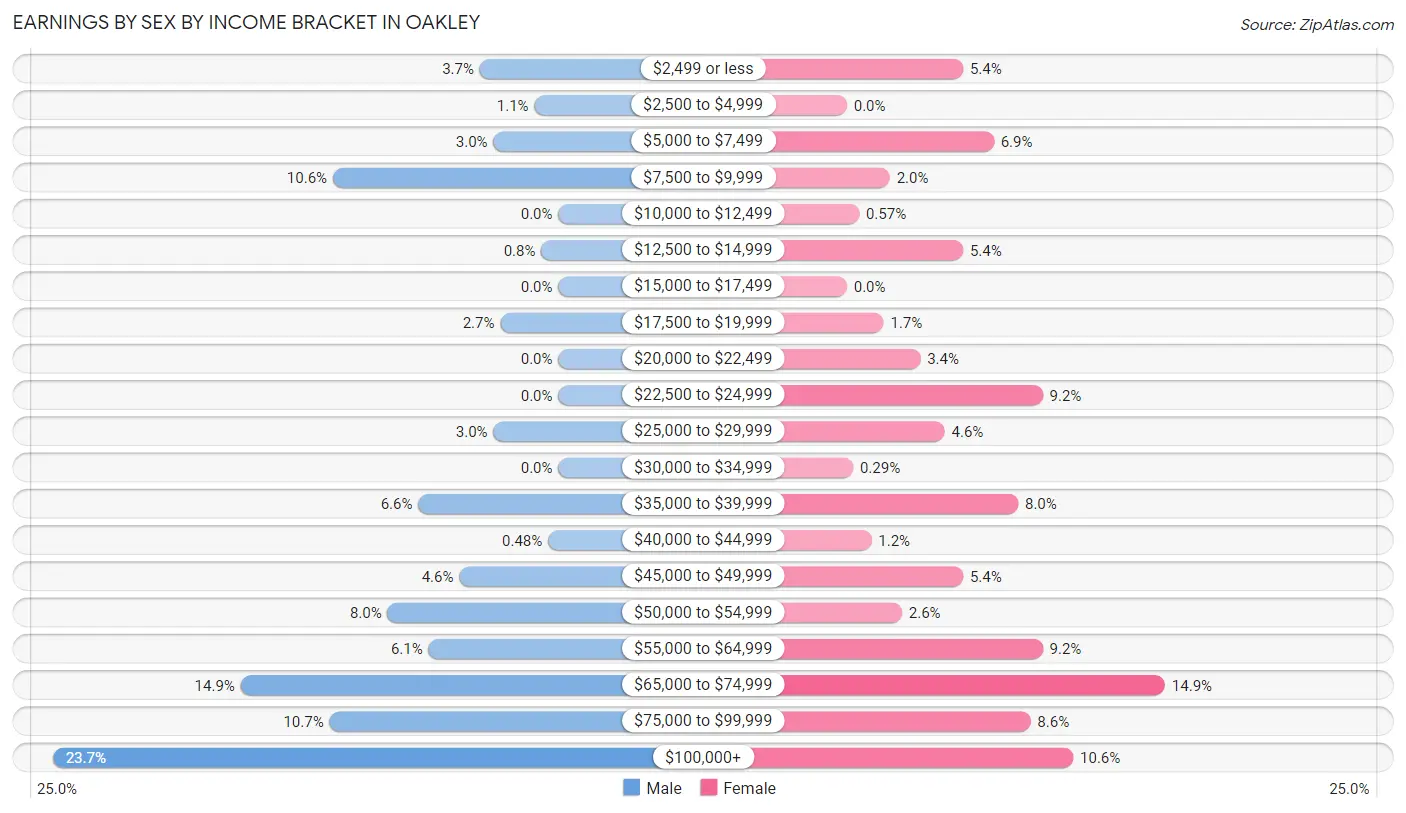
Earnings by Sex by Income Bracket in Oakley
The most common earnings brackets in Oakley are $100,000+ for men (148 | 23.7%) and $65,000 to $74,999 for women (52 | 14.9%).
| Income | Male | Female |
| $2,499 or less | 23 (3.7%) | 19 (5.4%) |
| $2,500 to $4,999 | 7 (1.1%) | 0 (0.0%) |
| $5,000 to $7,499 | 19 (3.0%) | 24 (6.9%) |
| $7,500 to $9,999 | 66 (10.6%) | 7 (2.0%) |
| $10,000 to $12,499 | 0 (0.0%) | 2 (0.6%) |
| $12,500 to $14,999 | 5 (0.8%) | 19 (5.4%) |
| $15,000 to $17,499 | 0 (0.0%) | 0 (0.0%) |
| $17,500 to $19,999 | 17 (2.7%) | 6 (1.7%) |
| $20,000 to $22,499 | 0 (0.0%) | 12 (3.4%) |
| $22,500 to $24,999 | 0 (0.0%) | 32 (9.2%) |
| $25,000 to $29,999 | 19 (3.0%) | 16 (4.6%) |
| $30,000 to $34,999 | 0 (0.0%) | 1 (0.3%) |
| $35,000 to $39,999 | 41 (6.6%) | 28 (8.0%) |
| $40,000 to $44,999 | 3 (0.5%) | 4 (1.1%) |
| $45,000 to $49,999 | 29 (4.6%) | 19 (5.4%) |
| $50,000 to $54,999 | 50 (8.0%) | 9 (2.6%) |
| $55,000 to $64,999 | 38 (6.1%) | 32 (9.2%) |
| $65,000 to $74,999 | 93 (14.9%) | 52 (14.9%) |
| $75,000 to $99,999 | 67 (10.7%) | 30 (8.6%) |
| $100,000+ | 148 (23.7%) | 37 (10.6%) |
| Total | 625 (100.0%) | 349 (100.0%) |
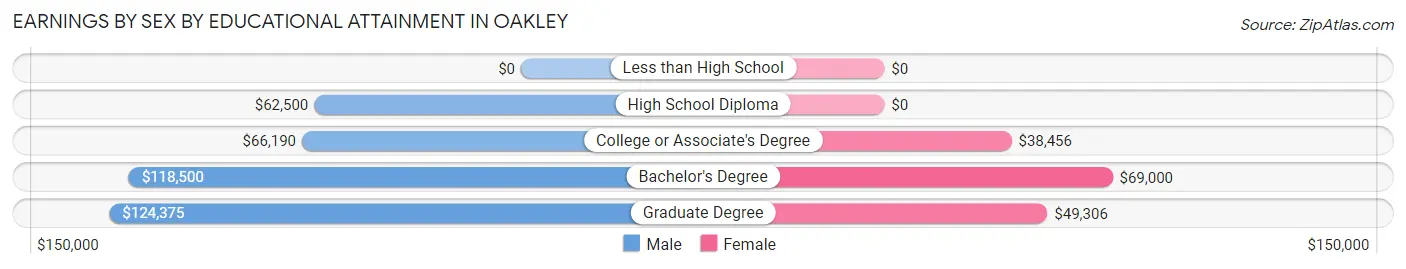
Earnings by Sex by Educational Attainment in Oakley
Average earnings in Oakley are $69,152 for men and $54,500 for women, a difference of 21.2%. Men with an educational attainment of graduate degree enjoy the highest average annual earnings of $124,375, while those with high school diploma education earn the least with $62,500. Women with an educational attainment of bachelor's degree earn the most with the average annual earnings of $69,000, while those with college or associate's degree education have the smallest earnings of $38,456.
| Educational Attainment | Male Income | Female Income |
| Less than High School | - | - |
| High School Diploma | $62,500 | $0 |
| College or Associate's Degree | $66,190 | $38,456 |
| Bachelor's Degree | $118,500 | $69,000 |
| Graduate Degree | $124,375 | $49,306 |
| Total | $69,152 | $54,500 |
Family Income in Oakley
Family Income Brackets in Oakley
According to the Oakley family income data, there are 118 families falling into the $100,000 to $149,999 income range, which is the most common income bracket and makes up 31.0% of all families.
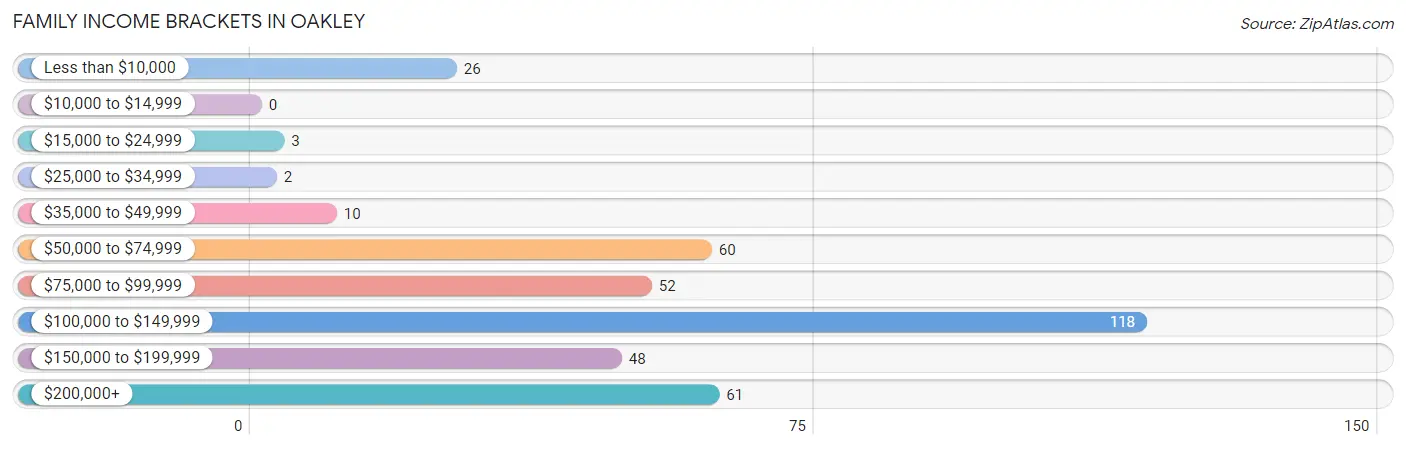
| Income Bracket | # Families | % Families |
| Less than $10,000 | 26 | 6.8% |
| $10,000 to $14,999 | 0 | 0.0% |
| $15,000 to $24,999 | 3 | 0.8% |
| $25,000 to $34,999 | 2 | 0.5% |
| $35,000 to $49,999 | 10 | 2.6% |
| $50,000 to $74,999 | 60 | 15.8% |
| $75,000 to $99,999 | 52 | 13.7% |
| $100,000 to $149,999 | 118 | 31.1% |
| $150,000 to $199,999 | 48 | 12.6% |
| $200,000+ | 61 | 16.1% |
Family Income by Famaliy Size in Oakley
7+ person families (24 | 6.3%) account for the highest median family income in Oakley with $250,001 per family, while 3-person families (55 | 14.5%) have the highest median income of $49,806 per family member.
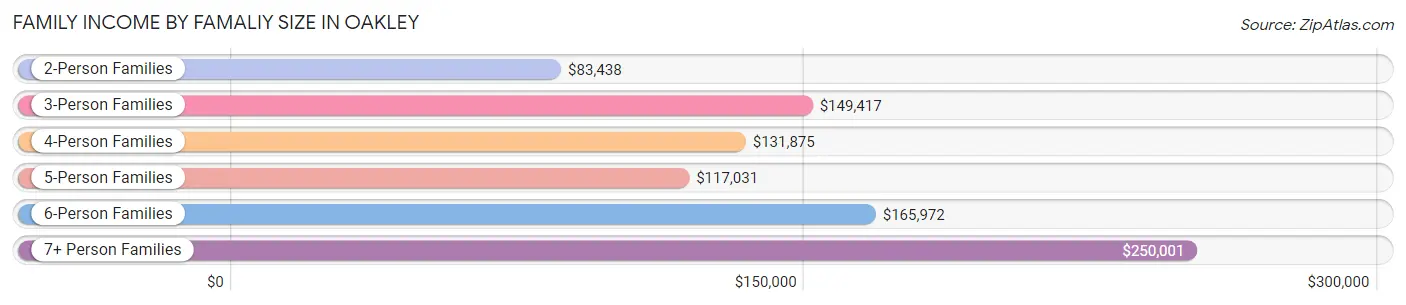
| Income Bracket | # Families | Median Income |
| 2-Person Families | 191 (50.3%) | $83,438 |
| 3-Person Families | 55 (14.5%) | $149,417 |
| 4-Person Families | 58 (15.3%) | $131,875 |
| 5-Person Families | 35 (9.2%) | $117,031 |
| 6-Person Families | 17 (4.5%) | $165,972 |
| 7+ Person Families | 24 (6.3%) | $250,001 |
| Total | 380 (100.0%) | $120,000 |
Family Income by Number of Earners in Oakley
The median family income in Oakley is $120,000, with families comprising 3+ earners (52) having the highest median family income of $147,917, while families with no earners (40) have the lowest median family income of $70,313, accounting for 13.7% and 10.5% of families, respectively.
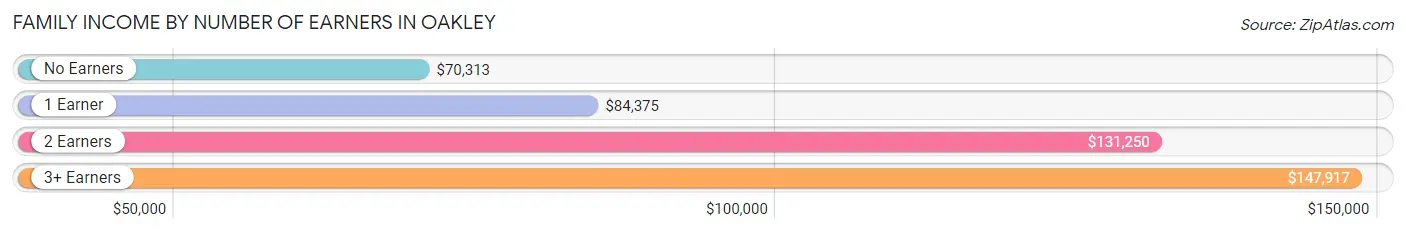
| Number of Earners | # Families | Median Income |
| No Earners | 40 (10.5%) | $70,313 |
| 1 Earner | 122 (32.1%) | $84,375 |
| 2 Earners | 166 (43.7%) | $131,250 |
| 3+ Earners | 52 (13.7%) | $147,917 |
| Total | 380 (100.0%) | $120,000 |
Household Income in Oakley
Household Income Brackets in Oakley
With 139 households falling in the category, the $100,000 to $149,999 income range is the most frequent in Oakley, accounting for 30.3% of all households.
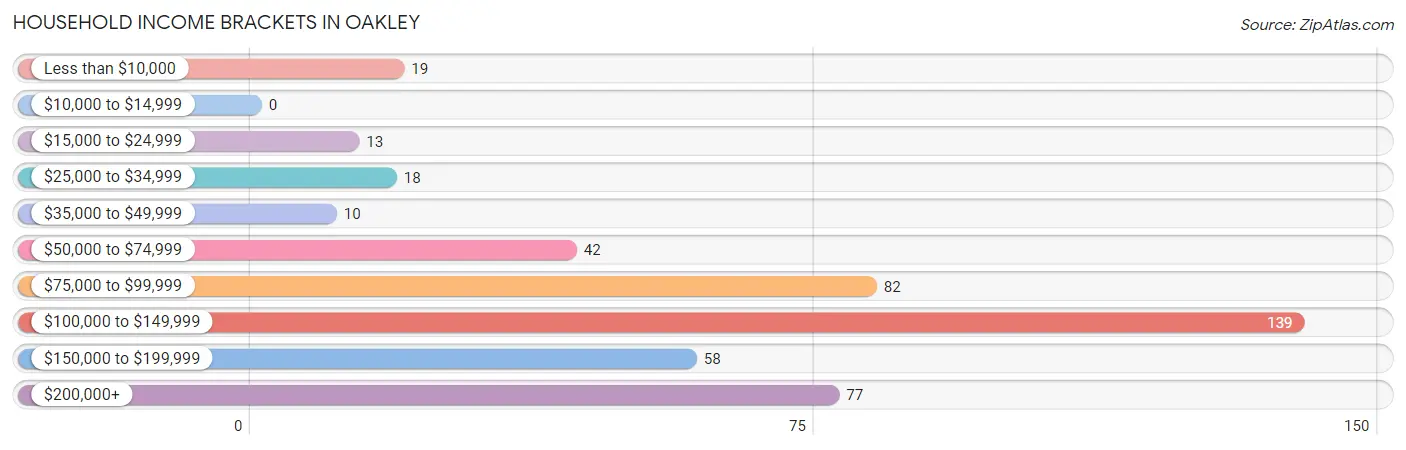
| Income Bracket | # Households | % Households |
| Less than $10,000 | 19 | 4.1% |
| $10,000 to $14,999 | 0 | 0.0% |
| $15,000 to $24,999 | 13 | 2.8% |
| $25,000 to $34,999 | 18 | 3.9% |
| $35,000 to $49,999 | 10 | 2.2% |
| $50,000 to $74,999 | 42 | 9.2% |
| $75,000 to $99,999 | 82 | 17.9% |
| $100,000 to $149,999 | 139 | 30.3% |
| $150,000 to $199,999 | 58 | 12.7% |
| $200,000+ | 77 | 16.8% |
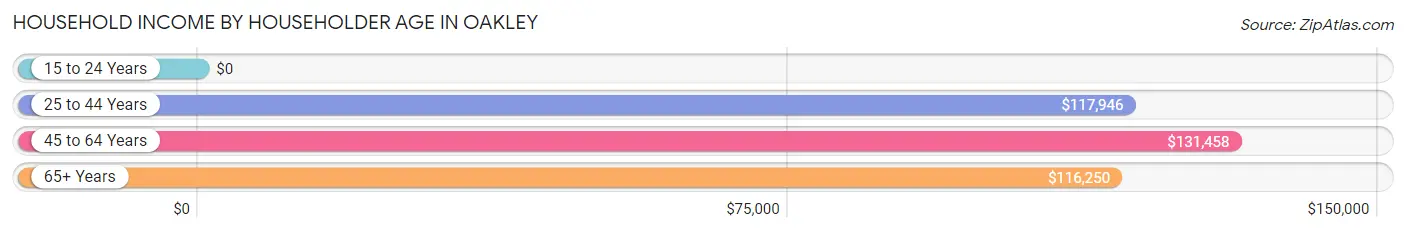
Household Income by Householder Age in Oakley
The median household income in Oakley is $119,231, with the highest median household income of $131,458 found in the 45 to 64 years age bracket for the primary householder. A total of 199 households (43.4%) fall into this category.
| Income Bracket | # Households | Median Income |
| 15 to 24 Years | 0 (0.0%) | $0 |
| 25 to 44 Years | 159 (34.7%) | $117,946 |
| 45 to 64 Years | 199 (43.4%) | $131,458 |
| 65+ Years | 100 (21.8%) | $116,250 |
| Total | 458 (100.0%) | $119,231 |
Poverty in Oakley
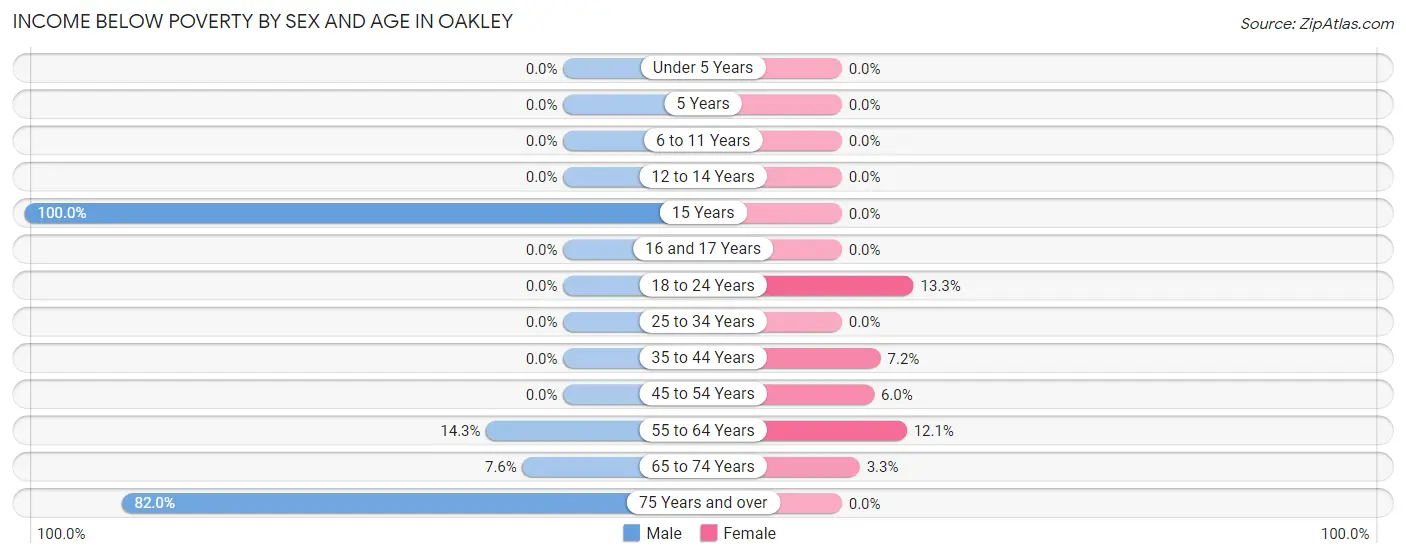
Income Below Poverty by Sex and Age in Oakley
With 8.2% poverty level for males and 4.2% for females among the residents of Oakley, 15 year old males and 18 to 24 year old females are the most vulnerable to poverty, with 10 males (100.0%) and 6 females (13.3%) in their respective age groups living below the poverty level.
| Age Bracket | Male | Female |
| Under 5 Years | 0 (0.0%) | 0 (0.0%) |
| 5 Years | 0 (0.0%) | 0 (0.0%) |
| 6 to 11 Years | 0 (0.0%) | 0 (0.0%) |
| 12 to 14 Years | 0 (0.0%) | 0 (0.0%) |
| 15 Years | 10 (100.0%) | 0 (0.0%) |
| 16 and 17 Years | 0 (0.0%) | 0 (0.0%) |
| 18 to 24 Years | 0 (0.0%) | 6 (13.3%) |
| 25 to 34 Years | 0 (0.0%) | 0 (0.0%) |
| 35 to 44 Years | 0 (0.0%) | 8 (7.2%) |
| 45 to 54 Years | 0 (0.0%) | 4 (6.0%) |
| 55 to 64 Years | 19 (14.3%) | 10 (12.0%) |
| 65 to 74 Years | 9 (7.6%) | 3 (3.3%) |
| 75 Years and over | 41 (82.0%) | 0 (0.0%) |
| Total | 79 (8.2%) | 31 (4.2%) |
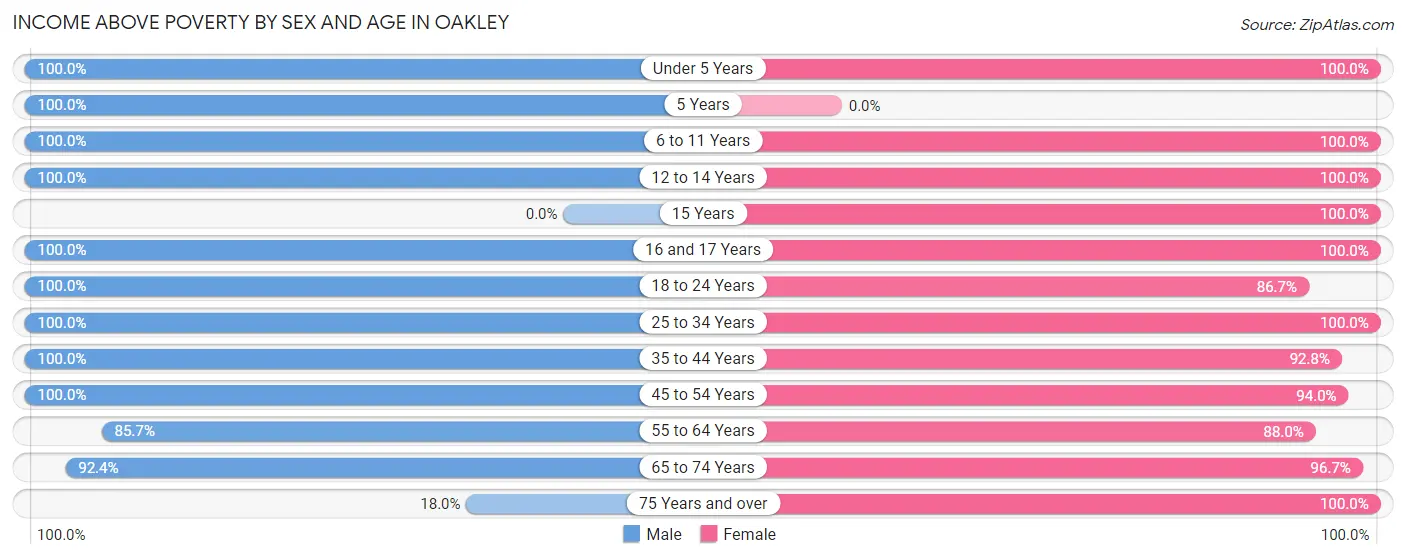
Income Above Poverty by Sex and Age in Oakley
According to the poverty statistics in Oakley, males aged under 5 years and females aged under 5 years are the age groups that are most secure financially, with 100.0% of males and 100.0% of females in these age groups living above the poverty line.
| Age Bracket | Male | Female |
| Under 5 Years | 38 (100.0%) | 86 (100.0%) |
| 5 Years | 8 (100.0%) | 0 (0.0%) |
| 6 to 11 Years | 93 (100.0%) | 90 (100.0%) |
| 12 to 14 Years | 43 (100.0%) | 51 (100.0%) |
| 15 Years | 0 (0.0%) | 3 (100.0%) |
| 16 and 17 Years | 14 (100.0%) | 15 (100.0%) |
| 18 to 24 Years | 105 (100.0%) | 39 (86.7%) |
| 25 to 34 Years | 128 (100.0%) | 86 (100.0%) |
| 35 to 44 Years | 141 (100.0%) | 103 (92.8%) |
| 45 to 54 Years | 78 (100.0%) | 63 (94.0%) |
| 55 to 64 Years | 114 (85.7%) | 73 (87.9%) |
| 65 to 74 Years | 110 (92.4%) | 87 (96.7%) |
| 75 Years and over | 9 (18.0%) | 15 (100.0%) |
| Total | 881 (91.8%) | 711 (95.8%) |
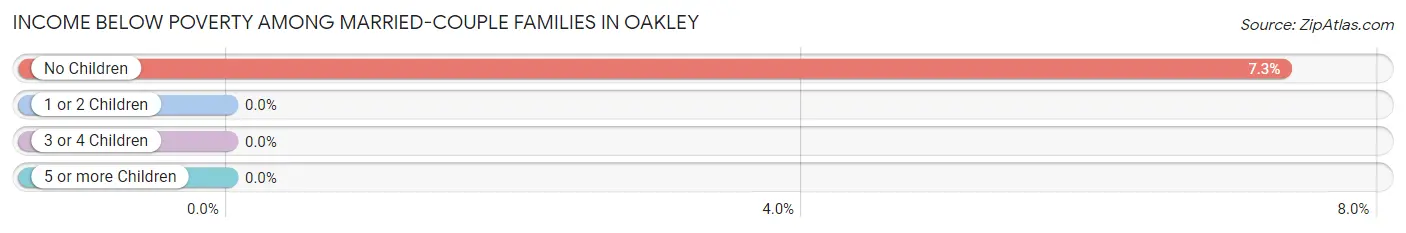
Income Below Poverty Among Married-Couple Families in Oakley
The poverty statistics for married-couple families in Oakley show that 4.2% or 13 of the total 311 families live below the poverty line. Families with no children have the highest poverty rate of 7.3%, comprising of 13 families. On the other hand, families with 1 or 2 children have the lowest poverty rate of 0.0%, which includes 0 families.
| Children | Above Poverty | Below Poverty |
| No Children | 164 (92.7%) | 13 (7.3%) |
| 1 or 2 Children | 72 (100.0%) | 0 (0.0%) |
| 3 or 4 Children | 46 (100.0%) | 0 (0.0%) |
| 5 or more Children | 16 (100.0%) | 0 (0.0%) |
| Total | 298 (95.8%) | 13 (4.2%) |
Income Below Poverty Among Single-Parent Households in Oakley
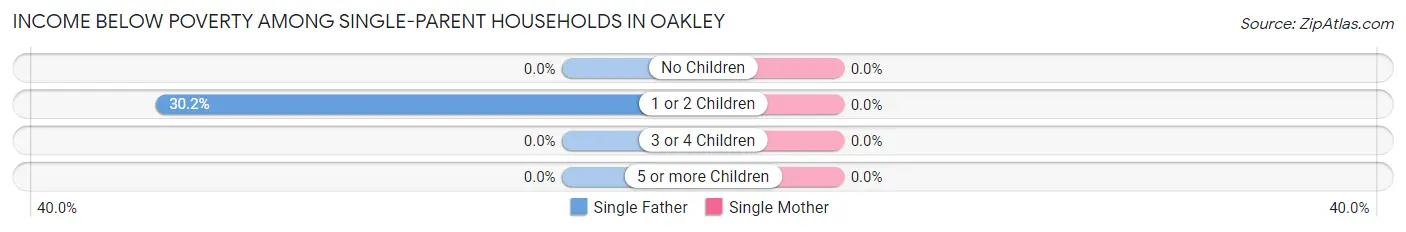
| Children | Single Father | Single Mother |
| No Children | 0 (0.0%) | 0 (0.0%) |
| 1 or 2 Children | 16 (30.2%) | 0 (0.0%) |
| 3 or 4 Children | 0 (0.0%) | 0 (0.0%) |
| 5 or more Children | 0 (0.0%) | 0 (0.0%) |
| Total | 16 (30.2%) | 0 (0.0%) |
Income Below Poverty Among Married-Couple vs Single-Parent Households in Oakley
The poverty data for Oakley shows that 13 of the married-couple family households (4.2%) and 16 of the single-parent households (23.2%) are living below the poverty level. Within the married-couple family households, those with no children have the highest poverty rate, with 13 households (7.3%) falling below the poverty line. Among the single-parent households, those with 1 or 2 children have the highest poverty rate, with 16 household (28.6%) living below poverty.
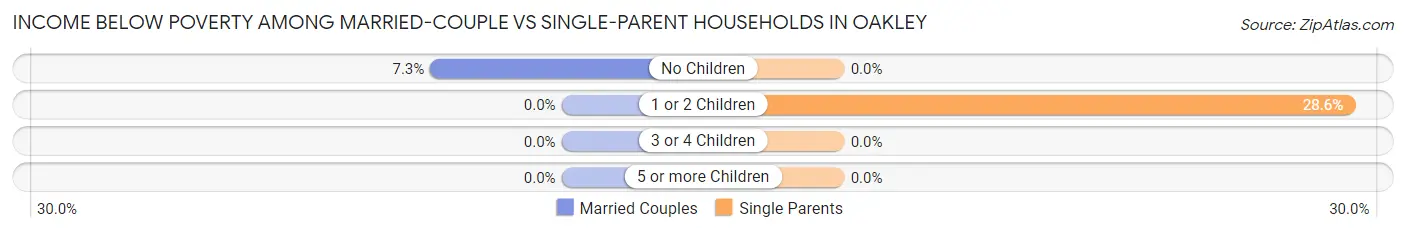
| Children | Married-Couple Families | Single-Parent Households |
| No Children | 13 (7.3%) | 0 (0.0%) |
| 1 or 2 Children | 0 (0.0%) | 16 (28.6%) |
| 3 or 4 Children | 0 (0.0%) | 0 (0.0%) |
| 5 or more Children | 0 (0.0%) | 0 (0.0%) |
| Total | 13 (4.2%) | 16 (23.2%) |
Race in Oakley
The most populous races in Oakley are White / Caucasian (1,662 | 95.3%), Hispanic or Latino (89 | 5.1%), and Some other Race (45 | 2.6%).
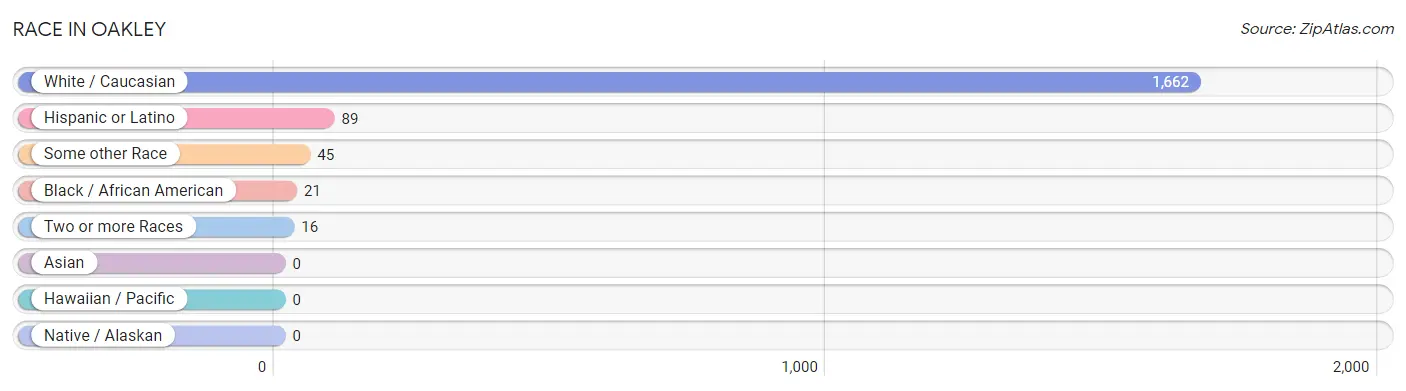
| Race | # Population | % Population |
| Asian | 0 | 0.0% |
| Black / African American | 21 | 1.2% |
| Hawaiian / Pacific | 0 | 0.0% |
| Hispanic or Latino | 89 | 5.1% |
| Native / Alaskan | 0 | 0.0% |
| White / Caucasian | 1,662 | 95.3% |
| Two or more Races | 16 | 0.9% |
| Some other Race | 45 | 2.6% |
| Total | 1,744 | 100.0% |
Ancestry in Oakley
The most populous ancestries reported in Oakley are English (360 | 20.6%), German (70 | 4.0%), French (68 | 3.9%), European (54 | 3.1%), and Swedish (38 | 2.2%), together accounting for 33.8% of all Oakley residents.
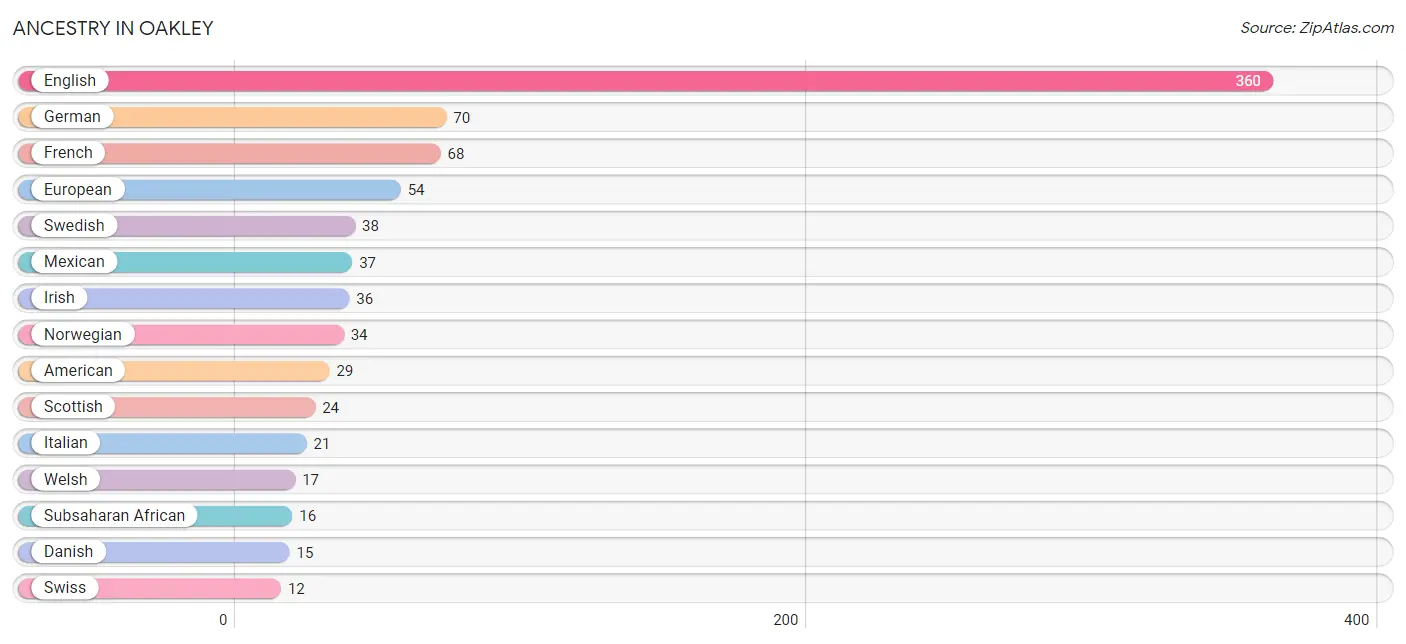
| Ancestry | # Population | % Population |
| American | 29 | 1.7% |
| British | 2 | 0.1% |
| Danish | 15 | 0.9% |
| Eastern European | 8 | 0.5% |
| English | 360 | 20.6% |
| European | 54 | 3.1% |
| French | 68 | 3.9% |
| German | 70 | 4.0% |
| Hungarian | 3 | 0.2% |
| Icelander | 2 | 0.1% |
| Irish | 36 | 2.1% |
| Italian | 21 | 1.2% |
| Mexican | 37 | 2.1% |
| Norwegian | 34 | 1.9% |
| Scandinavian | 2 | 0.1% |
| Scotch-Irish | 10 | 0.6% |
| Scottish | 24 | 1.4% |
| Spaniard | 5 | 0.3% |
| Spanish | 8 | 0.5% |
| Subsaharan African | 16 | 0.9% |
| Swedish | 38 | 2.2% |
| Swiss | 12 | 0.7% |
| Welsh | 17 | 1.0% |
| Yugoslavian | 2 | 0.1% | View All 24 Rows |
Immigrants in Oakley
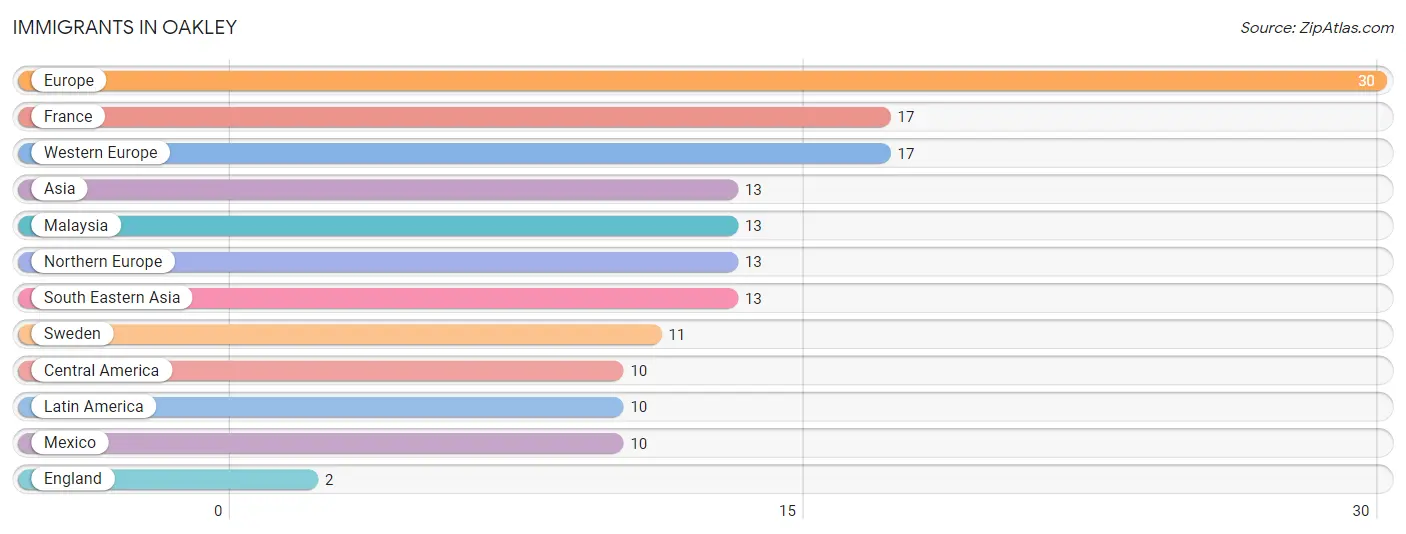
The most numerous immigrant groups reported in Oakley came from Europe (30 | 1.7%), France (17 | 1.0%), Western Europe (17 | 1.0%), Asia (13 | 0.7%), and Malaysia (13 | 0.7%), together accounting for 5.2% of all Oakley residents.
| Immigration Origin | # Population | % Population |
| Asia | 13 | 0.7% |
| Central America | 10 | 0.6% |
| England | 2 | 0.1% |
| Europe | 30 | 1.7% |
| France | 17 | 1.0% |
| Latin America | 10 | 0.6% |
| Malaysia | 13 | 0.7% |
| Mexico | 10 | 0.6% |
| Northern Europe | 13 | 0.7% |
| South Eastern Asia | 13 | 0.7% |
| Sweden | 11 | 0.6% |
| Western Europe | 17 | 1.0% | View All 12 Rows |
Sex and Age in Oakley
Sex and Age in Oakley
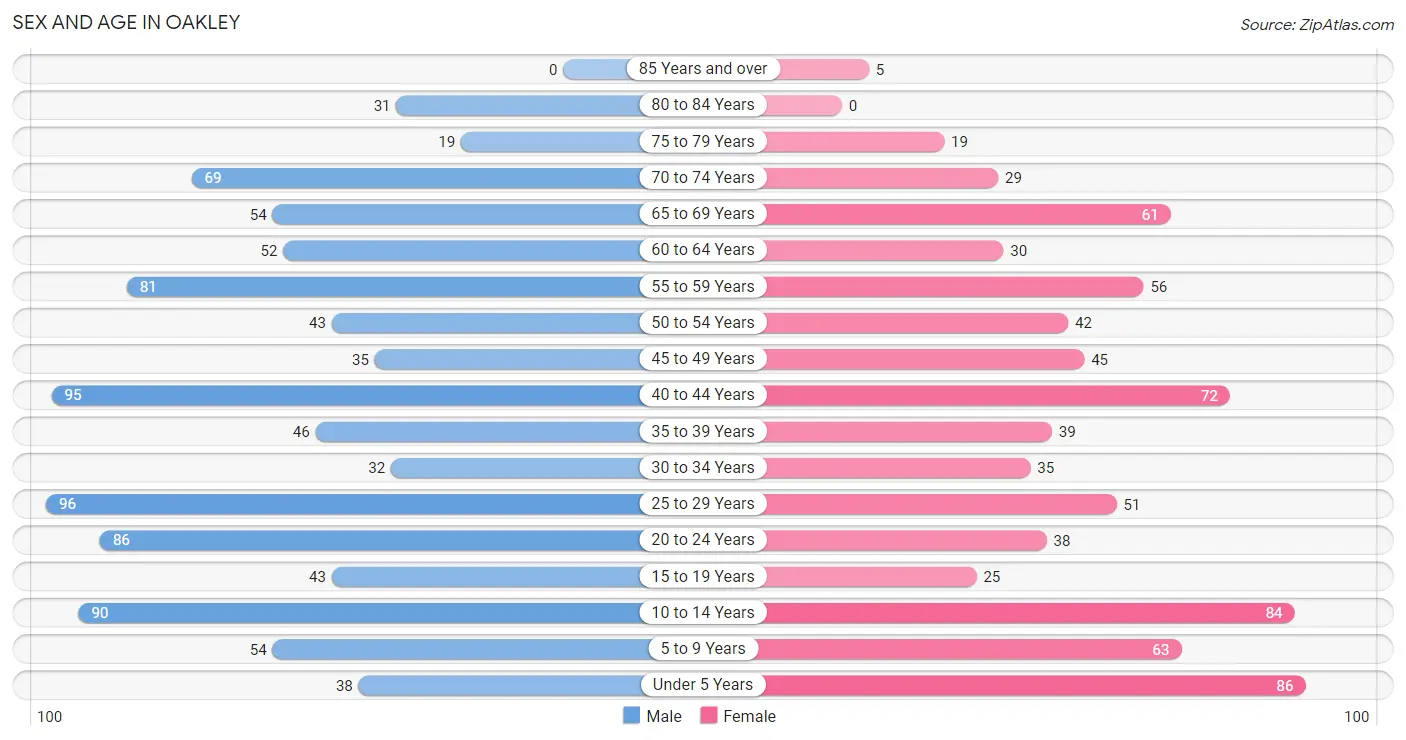
The most populous age groups in Oakley are 25 to 29 Years (96 | 10.0%) for men and Under 5 Years (86 | 11.0%) for women.
| Age Bracket | Male | Female |
| Under 5 Years | 38 (3.9%) | 86 (11.0%) |
| 5 to 9 Years | 54 (5.6%) | 63 (8.1%) |
| 10 to 14 Years | 90 (9.3%) | 84 (10.8%) |
| 15 to 19 Years | 43 (4.5%) | 25 (3.2%) |
| 20 to 24 Years | 86 (8.9%) | 38 (4.9%) |
| 25 to 29 Years | 96 (10.0%) | 51 (6.5%) |
| 30 to 34 Years | 32 (3.3%) | 35 (4.5%) |
| 35 to 39 Years | 46 (4.8%) | 39 (5.0%) |
| 40 to 44 Years | 95 (9.9%) | 72 (9.2%) |
| 45 to 49 Years | 35 (3.6%) | 45 (5.8%) |
| 50 to 54 Years | 43 (4.5%) | 42 (5.4%) |
| 55 to 59 Years | 81 (8.4%) | 56 (7.2%) |
| 60 to 64 Years | 52 (5.4%) | 30 (3.8%) |
| 65 to 69 Years | 54 (5.6%) | 61 (7.8%) |
| 70 to 74 Years | 69 (7.2%) | 29 (3.7%) |
| 75 to 79 Years | 19 (2.0%) | 19 (2.4%) |
| 80 to 84 Years | 31 (3.2%) | 0 (0.0%) |
| 85 Years and over | 0 (0.0%) | 5 (0.6%) |
| Total | 964 (100.0%) | 780 (100.0%) |
Families and Households in Oakley
Median Family Size in Oakley
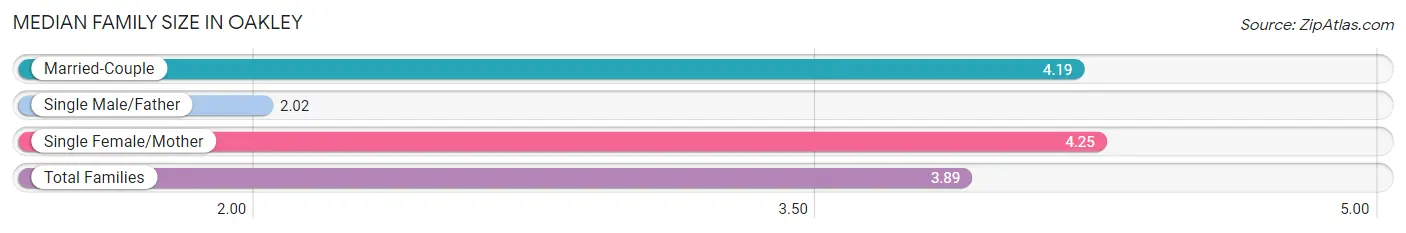
The median family size in Oakley is 3.89 persons per family, with single female/mother families (16 | 4.2%) accounting for the largest median family size of 4.25 persons per family. On the other hand, single male/father families (53 | 14.0%) represent the smallest median family size with 2.02 persons per family.
| Family Type | # Families | Family Size |
| Married-Couple | 311 (81.8%) | 4.19 |
| Single Male/Father | 53 (14.0%) | 2.02 |
| Single Female/Mother | 16 (4.2%) | 4.25 |
| Total Families | 380 (100.0%) | 3.89 |
Median Household Size in Oakley
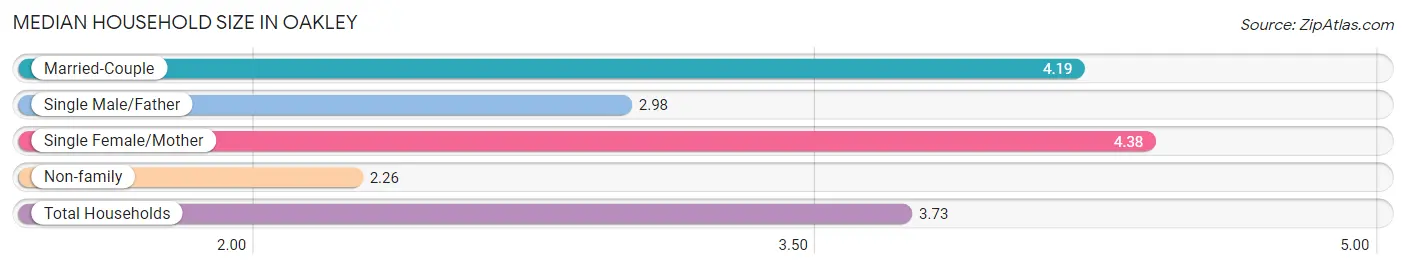
The median household size in Oakley is 3.73 persons per household, with single female/mother households (16 | 3.5%) accounting for the largest median household size of 4.38 persons per household. non-family households (78 | 17.0%) represent the smallest median household size with 2.26 persons per household.
| Household Type | # Households | Household Size |
| Married-Couple | 311 (67.9%) | 4.19 |
| Single Male/Father | 53 (11.6%) | 2.98 |
| Single Female/Mother | 16 (3.5%) | 4.38 |
| Non-family | 78 (17.0%) | 2.26 |
| Total Households | 458 (100.0%) | 3.73 |
Household Size by Marriage Status in Oakley
Out of a total of 458 households in Oakley, 380 (83.0%) are family households, while 78 (17.0%) are nonfamily households. The most numerous type of family households are 2-person households, comprising 138, and the most common type of nonfamily households are 1-person households, comprising 49.
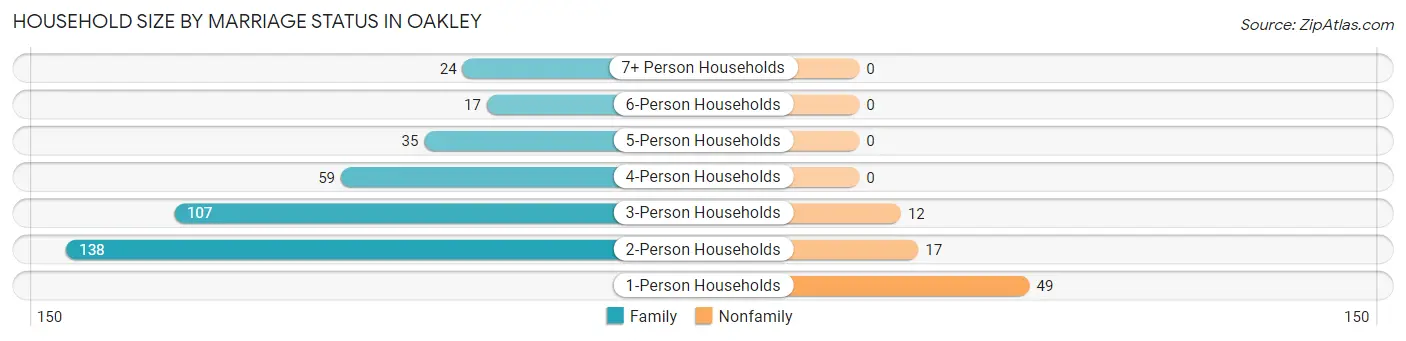
| Household Size | Family Households | Nonfamily Households |
| 1-Person Households | - | 49 (10.7%) |
| 2-Person Households | 138 (30.1%) | 17 (3.7%) |
| 3-Person Households | 107 (23.4%) | 12 (2.6%) |
| 4-Person Households | 59 (12.9%) | 0 (0.0%) |
| 5-Person Households | 35 (7.6%) | 0 (0.0%) |
| 6-Person Households | 17 (3.7%) | 0 (0.0%) |
| 7+ Person Households | 24 (5.2%) | 0 (0.0%) |
| Total | 380 (83.0%) | 78 (17.0%) |
Female Fertility in Oakley
Fertility by Age in Oakley
Average fertility rate in Oakley is 95.0 births per 1,000 women. Women in the age bracket of 20 to 34 years have the highest fertility rate with 234.0 births per 1,000 women. Women in the age bracket of 20 to 34 years acount for 100.0% of all women with births.
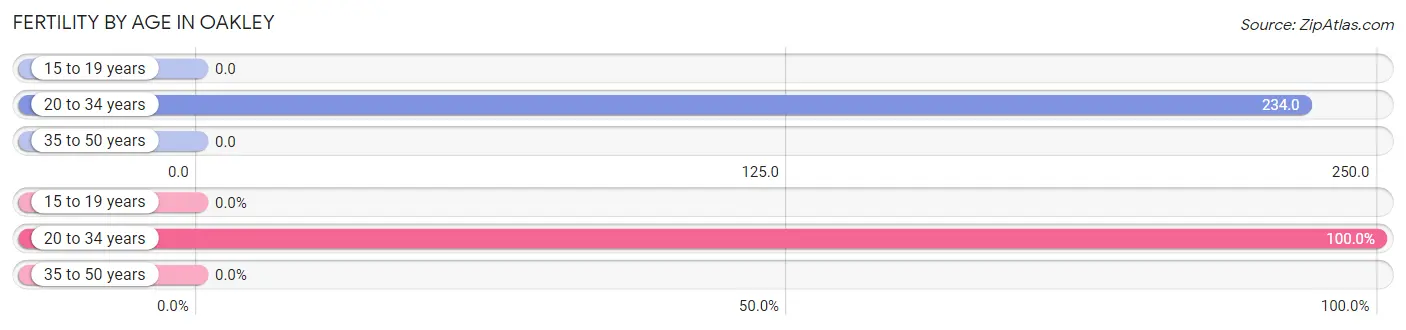
| Age Bracket | Women with Births | Births / 1,000 Women |
| 15 to 19 years | 0 (0.0%) | 0.0 |
| 20 to 34 years | 29 (100.0%) | 234.0 |
| 35 to 50 years | 0 (0.0%) | 0.0 |
| Total | 29 (100.0%) | 95.0 |
Fertility by Age by Marriage Status in Oakley
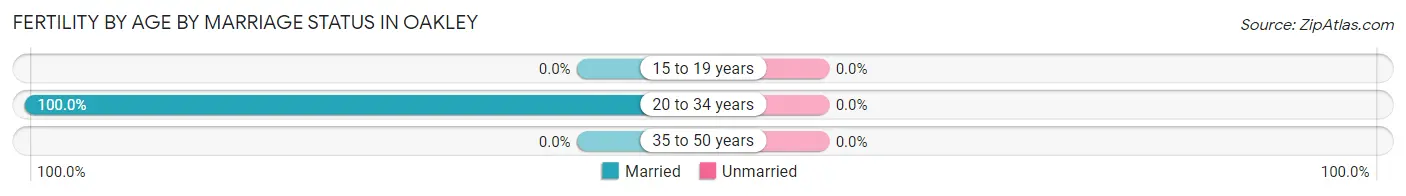
| Age Bracket | Married | Unmarried |
| 15 to 19 years | 0 (0.0%) | 0 (0.0%) |
| 20 to 34 years | 29 (100.0%) | 0 (0.0%) |
| 35 to 50 years | 0 (0.0%) | 0 (0.0%) |
| Total | 29 (100.0%) | 0 (0.0%) |
Fertility by Education in Oakley
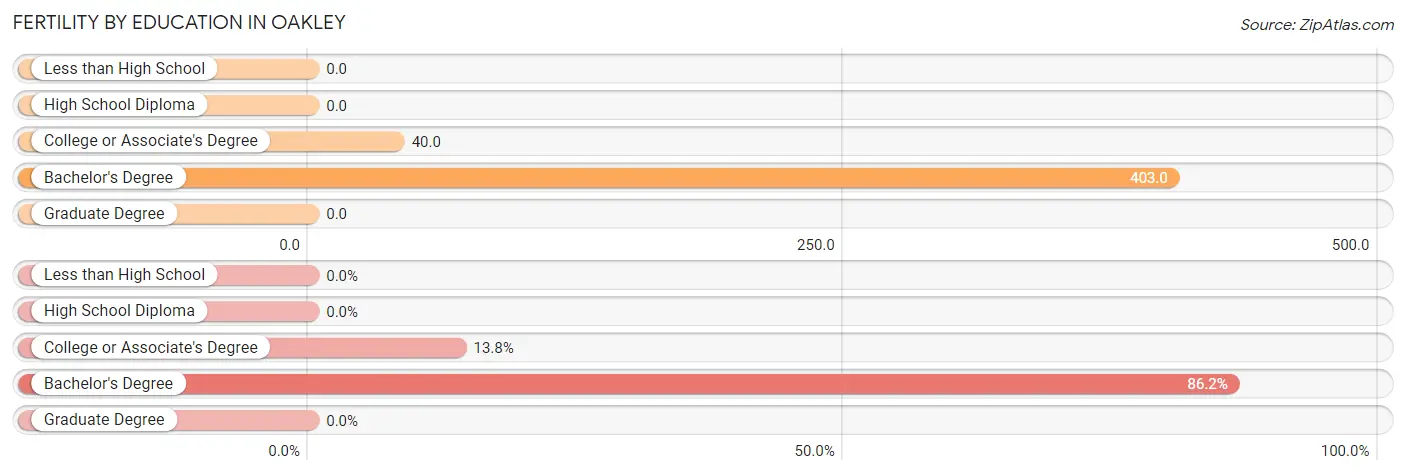
| Educational Attainment | Women with Births | Births / 1,000 Women |
| Less than High School | 0 (0.0%) | 0.0 |
| High School Diploma | 0 (0.0%) | 0.0 |
| College or Associate's Degree | 4 (13.8%) | 40.0 |
| Bachelor's Degree | 25 (86.2%) | 403.0 |
| Graduate Degree | 0 (0.0%) | 0.0 |
| Total | 29 (100.0%) | 95.0 |
Fertility by Education by Marriage Status in Oakley
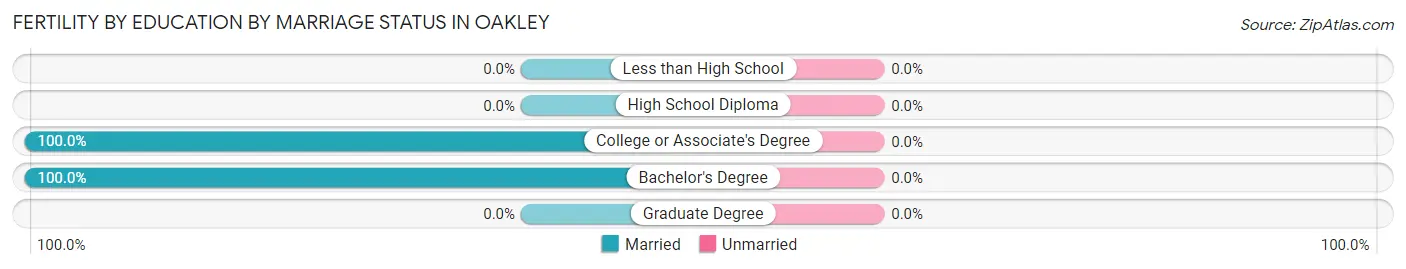
| Educational Attainment | Married | Unmarried |
| Less than High School | 0 (0.0%) | 0 (0.0%) |
| High School Diploma | 0 (0.0%) | 0 (0.0%) |
| College or Associate's Degree | 4 (100.0%) | 0 (0.0%) |
| Bachelor's Degree | 25 (100.0%) | 0 (0.0%) |
| Graduate Degree | 0 (0.0%) | 0 (0.0%) |
| Total | 29 (100.0%) | 0 (0.0%) |
Employment Characteristics in Oakley
Employment by Class of Employer in Oakley
Among the 868 employed individuals in Oakley, private company employees (476 | 54.8%), self-employed (not incorporated) (110 | 12.7%), and local government employees (92 | 10.6%) make up the most common classes of employment.
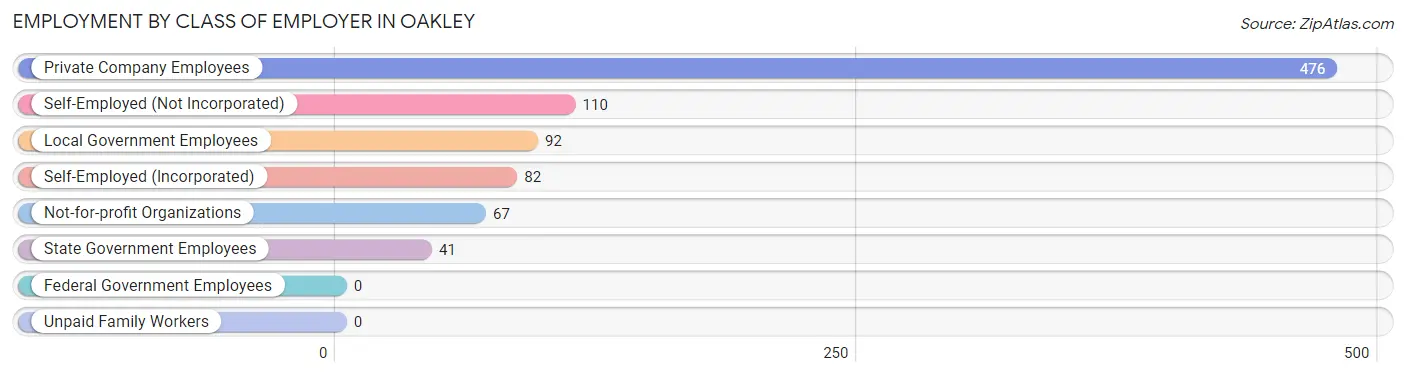
| Employer Class | # Employees | % Employees |
| Private Company Employees | 476 | 54.8% |
| Self-Employed (Incorporated) | 82 | 9.5% |
| Self-Employed (Not Incorporated) | 110 | 12.7% |
| Not-for-profit Organizations | 67 | 7.7% |
| Local Government Employees | 92 | 10.6% |
| State Government Employees | 41 | 4.7% |
| Federal Government Employees | 0 | 0.0% |
| Unpaid Family Workers | 0 | 0.0% |
| Total | 868 | 100.0% |
Employment Status by Age in Oakley
According to the labor force statistics for Oakley, out of the total population over 16 years of age (1,316), 68.8% or 905 individuals are in the labor force, with 4.1% or 37 of them unemployed. The age group with the highest labor force participation rate is 25 to 29 years, with 100.0% or 147 individuals in the labor force. Within the labor force, the 65 to 74 years age range has the highest percentage of unemployed individuals, with 21.4% or 12 of them being unemployed.
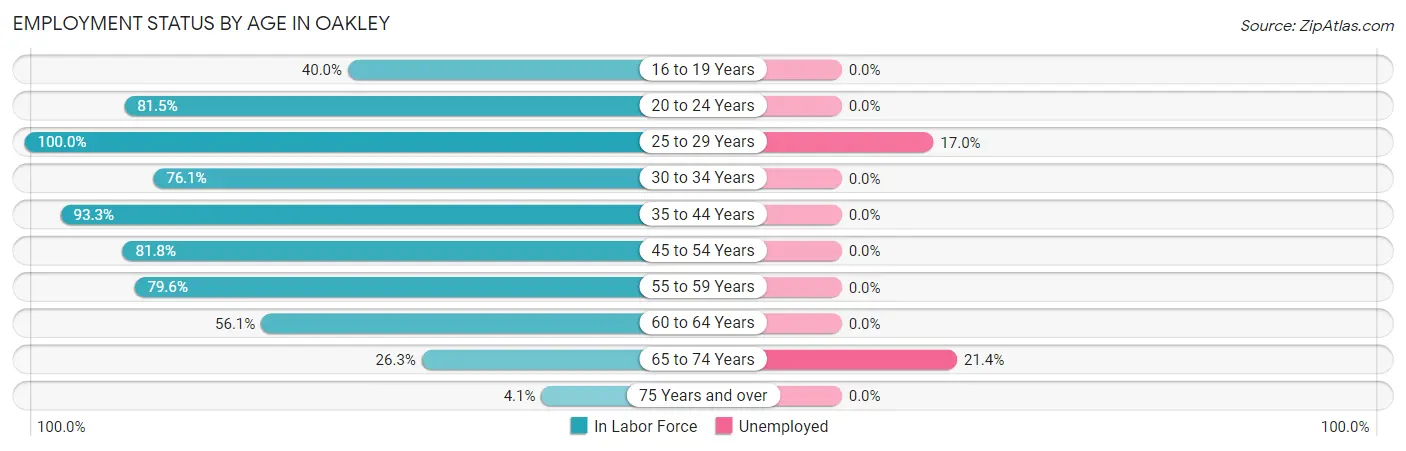
| Age Bracket | In Labor Force | Unemployed |
| 16 to 19 Years | 22 (40.0%) | 0 (0.0%) |
| 20 to 24 Years | 101 (81.5%) | 0 (0.0%) |
| 25 to 29 Years | 147 (100.0%) | 25 (17.0%) |
| 30 to 34 Years | 51 (76.1%) | 0 (0.0%) |
| 35 to 44 Years | 235 (93.3%) | 0 (0.0%) |
| 45 to 54 Years | 135 (81.8%) | 0 (0.0%) |
| 55 to 59 Years | 109 (79.6%) | 0 (0.0%) |
| 60 to 64 Years | 46 (56.1%) | 0 (0.0%) |
| 65 to 74 Years | 56 (26.3%) | 12 (21.4%) |
| 75 Years and over | 3 (4.1%) | 0 (0.0%) |
| Total | 905 (68.8%) | 37 (4.1%) |
Employment Status by Educational Attainment in Oakley
According to labor force statistics for Oakley, 85.1% of individuals (723) out of the total population between 25 and 64 years of age (850) are in the labor force, with 3.5% or 25 of them being unemployed. The group with the highest labor force participation rate are those with the educational attainment of high school diploma, with 88.5% or 224 individuals in the labor force. Within the labor force, individuals with bachelor's degree or higher education have the highest percentage of unemployment, with 12.2% or 25 of them being unemployed.
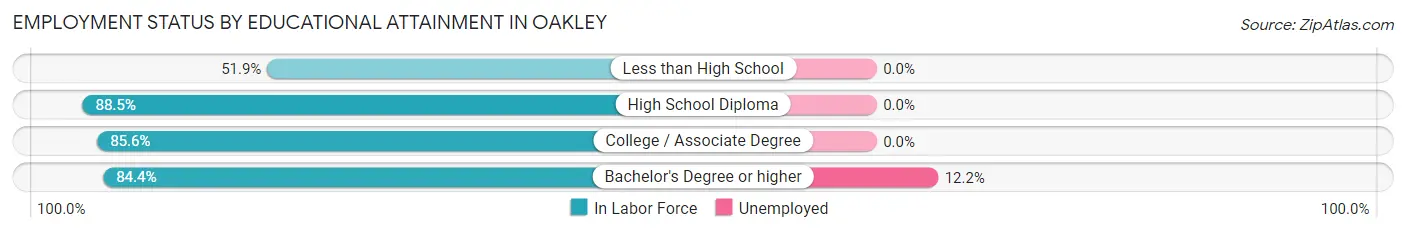
| Educational Attainment | In Labor Force | Unemployed |
| Less than High School | 14 (51.9%) | 0 (0.0%) |
| High School Diploma | 224 (88.5%) | 0 (0.0%) |
| College / Associate Degree | 280 (85.6%) | 0 (0.0%) |
| Bachelor's Degree or higher | 205 (84.4%) | 30 (12.2%) |
| Total | 723 (85.1%) | 30 (3.5%) |
Employment Occupations by Sex in Oakley
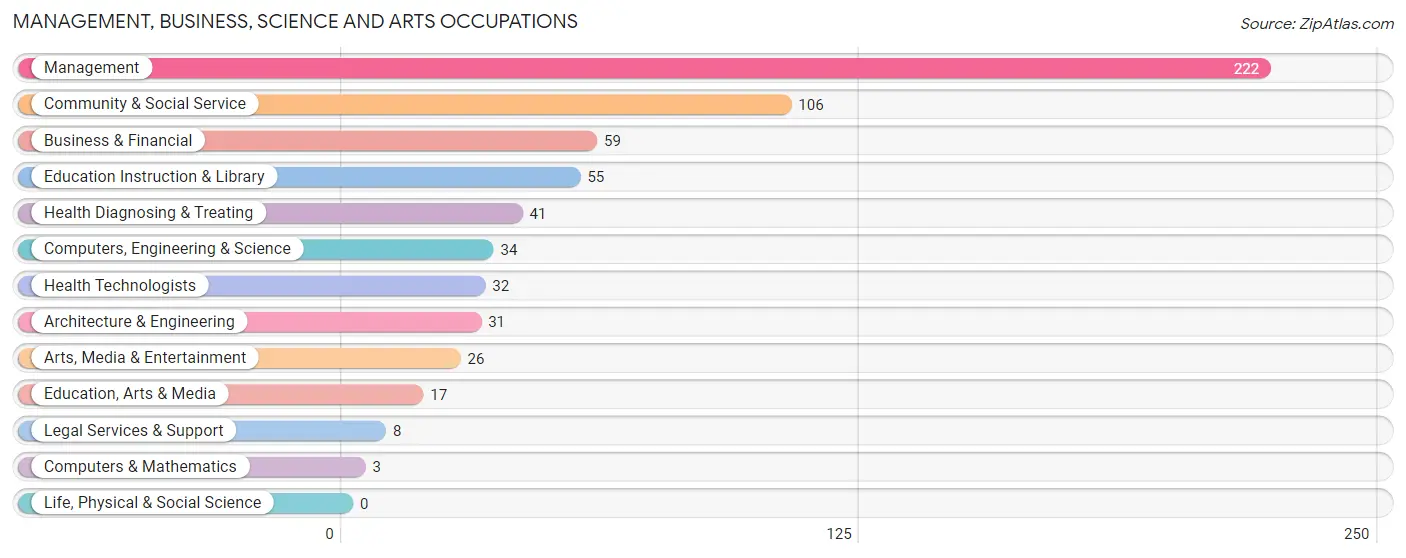
Management, Business, Science and Arts Occupations
The most common Management, Business, Science and Arts occupations in Oakley are Management (222 | 25.6%), Community & Social Service (106 | 12.2%), Business & Financial (59 | 6.8%), Education Instruction & Library (55 | 6.3%), and Health Diagnosing & Treating (41 | 4.7%).
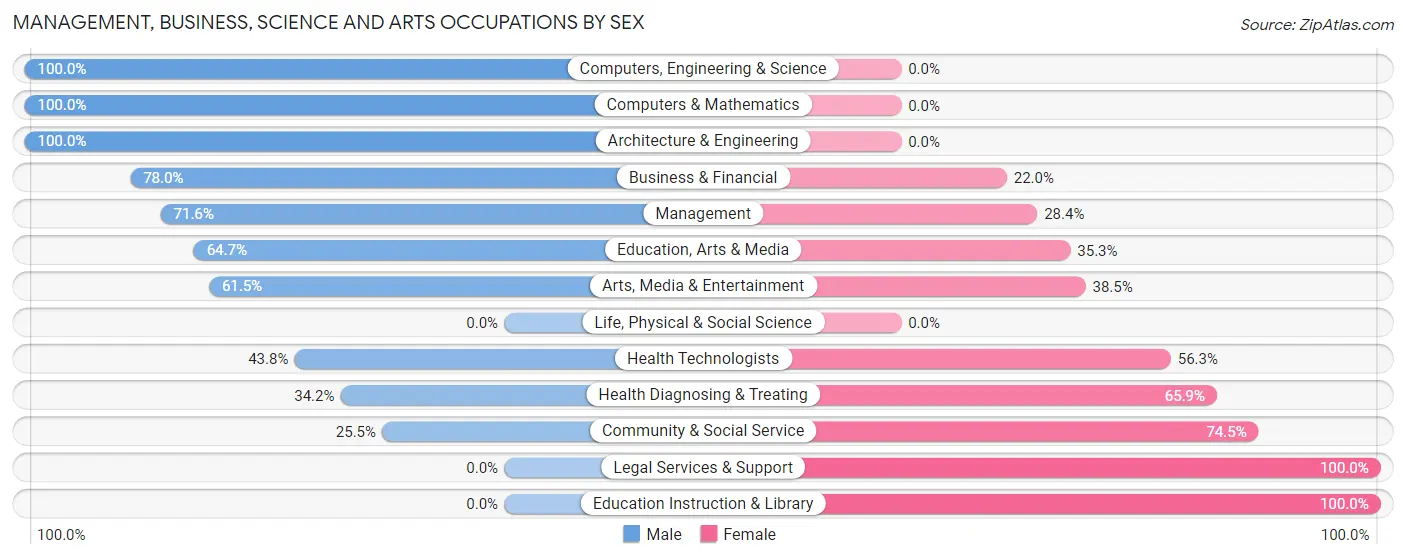
Management, Business, Science and Arts Occupations by Sex
Within the Management, Business, Science and Arts occupations in Oakley, the most male-oriented occupations are Computers, Engineering & Science (100.0%), Computers & Mathematics (100.0%), and Architecture & Engineering (100.0%), while the most female-oriented occupations are Legal Services & Support (100.0%), Education Instruction & Library (100.0%), and Community & Social Service (74.5%).
| Occupation | Male | Female |
| Management | 159 (71.6%) | 63 (28.4%) |
| Business & Financial | 46 (78.0%) | 13 (22.0%) |
| Computers, Engineering & Science | 34 (100.0%) | 0 (0.0%) |
| Computers & Mathematics | 3 (100.0%) | 0 (0.0%) |
| Architecture & Engineering | 31 (100.0%) | 0 (0.0%) |
| Life, Physical & Social Science | 0 (0.0%) | 0 (0.0%) |
| Community & Social Service | 27 (25.5%) | 79 (74.5%) |
| Education, Arts & Media | 11 (64.7%) | 6 (35.3%) |
| Legal Services & Support | 0 (0.0%) | 8 (100.0%) |
| Education Instruction & Library | 0 (0.0%) | 55 (100.0%) |
| Arts, Media & Entertainment | 16 (61.5%) | 10 (38.5%) |
| Health Diagnosing & Treating | 14 (34.2%) | 27 (65.8%) |
| Health Technologists | 14 (43.8%) | 18 (56.2%) |
| Total (Category) | 280 (60.6%) | 182 (39.4%) |
| Total (Overall) | 578 (66.6%) | 290 (33.4%) |
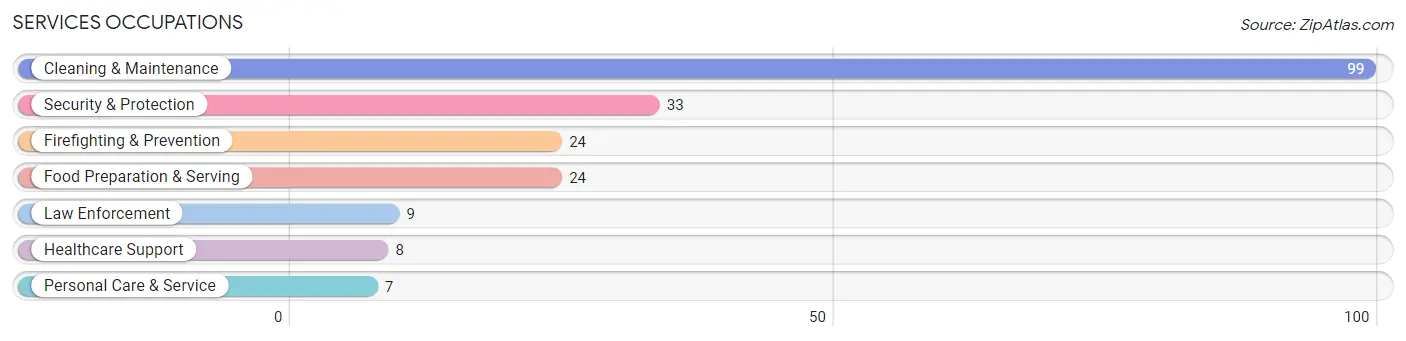
Services Occupations
The most common Services occupations in Oakley are Cleaning & Maintenance (99 | 11.4%), Security & Protection (33 | 3.8%), Firefighting & Prevention (24 | 2.8%), Food Preparation & Serving (24 | 2.8%), and Law Enforcement (9 | 1.0%).
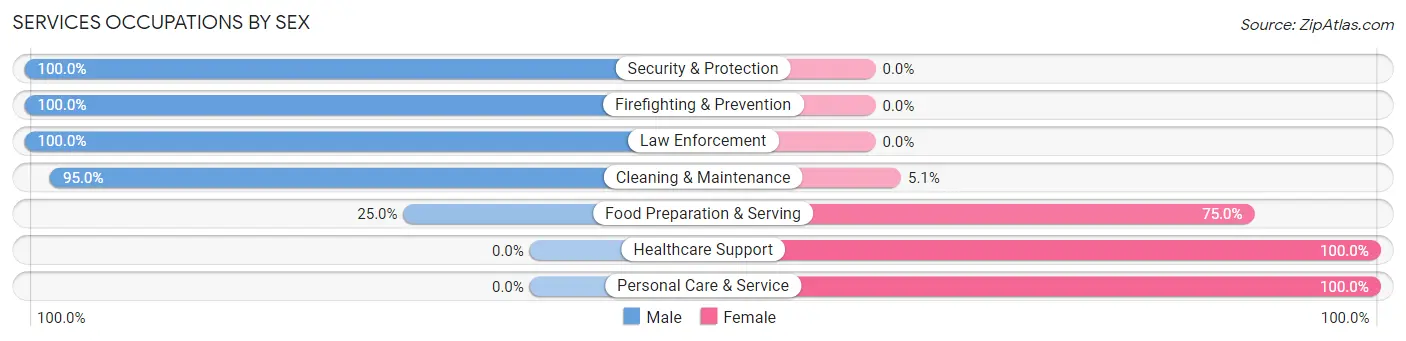
Services Occupations by Sex
Within the Services occupations in Oakley, the most male-oriented occupations are Security & Protection (100.0%), Firefighting & Prevention (100.0%), and Law Enforcement (100.0%), while the most female-oriented occupations are Healthcare Support (100.0%), Personal Care & Service (100.0%), and Food Preparation & Serving (75.0%).
| Occupation | Male | Female |
| Healthcare Support | 0 (0.0%) | 8 (100.0%) |
| Security & Protection | 33 (100.0%) | 0 (0.0%) |
| Firefighting & Prevention | 24 (100.0%) | 0 (0.0%) |
| Law Enforcement | 9 (100.0%) | 0 (0.0%) |
| Food Preparation & Serving | 6 (25.0%) | 18 (75.0%) |
| Cleaning & Maintenance | 94 (95.0%) | 5 (5.1%) |
| Personal Care & Service | 0 (0.0%) | 7 (100.0%) |
| Total (Category) | 133 (77.8%) | 38 (22.2%) |
| Total (Overall) | 578 (66.6%) | 290 (33.4%) |
Sales and Office Occupations
The most common Sales and Office occupations in Oakley are Office & Administration (59 | 6.8%), and Sales & Related (40 | 4.6%).
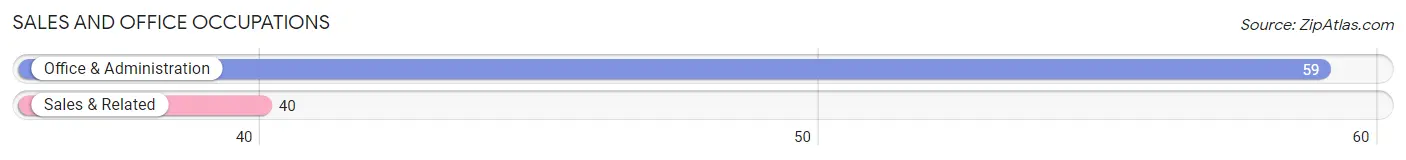
Sales and Office Occupations by Sex
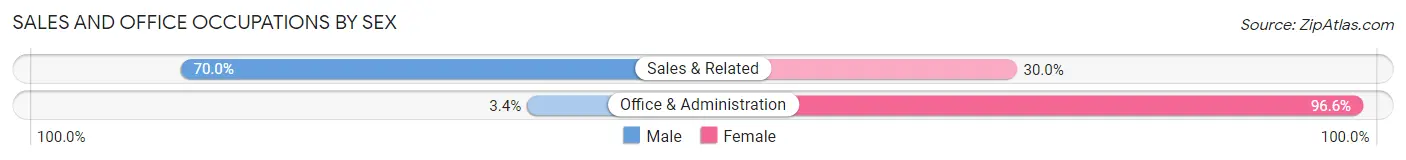
| Occupation | Male | Female |
| Sales & Related | 28 (70.0%) | 12 (30.0%) |
| Office & Administration | 2 (3.4%) | 57 (96.6%) |
| Total (Category) | 30 (30.3%) | 69 (69.7%) |
| Total (Overall) | 578 (66.6%) | 290 (33.4%) |
Natural Resources, Construction and Maintenance Occupations
The most common Natural Resources, Construction and Maintenance occupations in Oakley are Construction & Extraction (109 | 12.6%), Farming, Fishing & Forestry (6 | 0.7%), and Installation, Maintenance & Repair (5 | 0.6%).
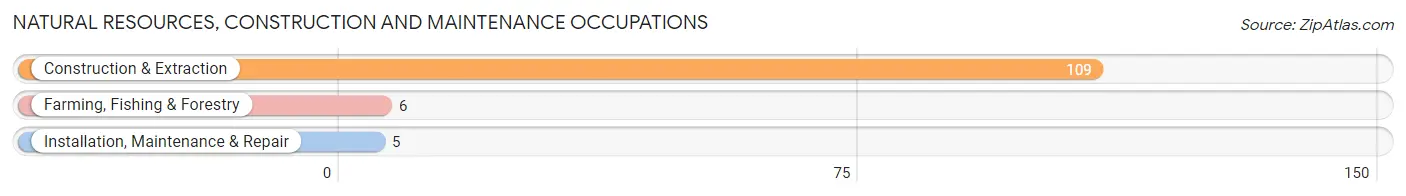
Natural Resources, Construction and Maintenance Occupations by Sex
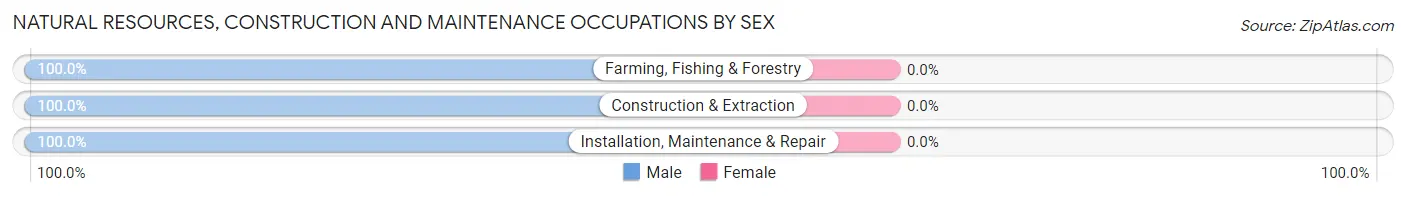
| Occupation | Male | Female |
| Farming, Fishing & Forestry | 6 (100.0%) | 0 (0.0%) |
| Construction & Extraction | 109 (100.0%) | 0 (0.0%) |
| Installation, Maintenance & Repair | 5 (100.0%) | 0 (0.0%) |
| Total (Category) | 120 (100.0%) | 0 (0.0%) |
| Total (Overall) | 578 (66.6%) | 290 (33.4%) |
Production, Transportation and Moving Occupations
The most common Production, Transportation and Moving occupations in Oakley are Transportation (12 | 1.4%), Production (3 | 0.4%), and Material Moving (1 | 0.1%).
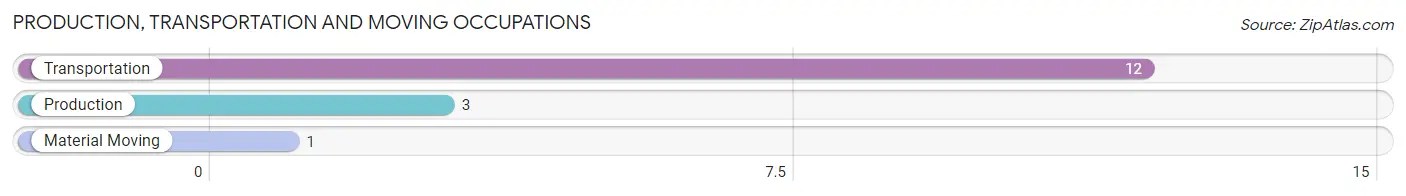
Production, Transportation and Moving Occupations by Sex

| Occupation | Male | Female |
| Production | 3 (100.0%) | 0 (0.0%) |
| Transportation | 12 (100.0%) | 0 (0.0%) |
| Material Moving | 0 (0.0%) | 1 (100.0%) |
| Total (Category) | 15 (93.8%) | 1 (6.2%) |
| Total (Overall) | 578 (66.6%) | 290 (33.4%) |
Employment Industries by Sex in Oakley
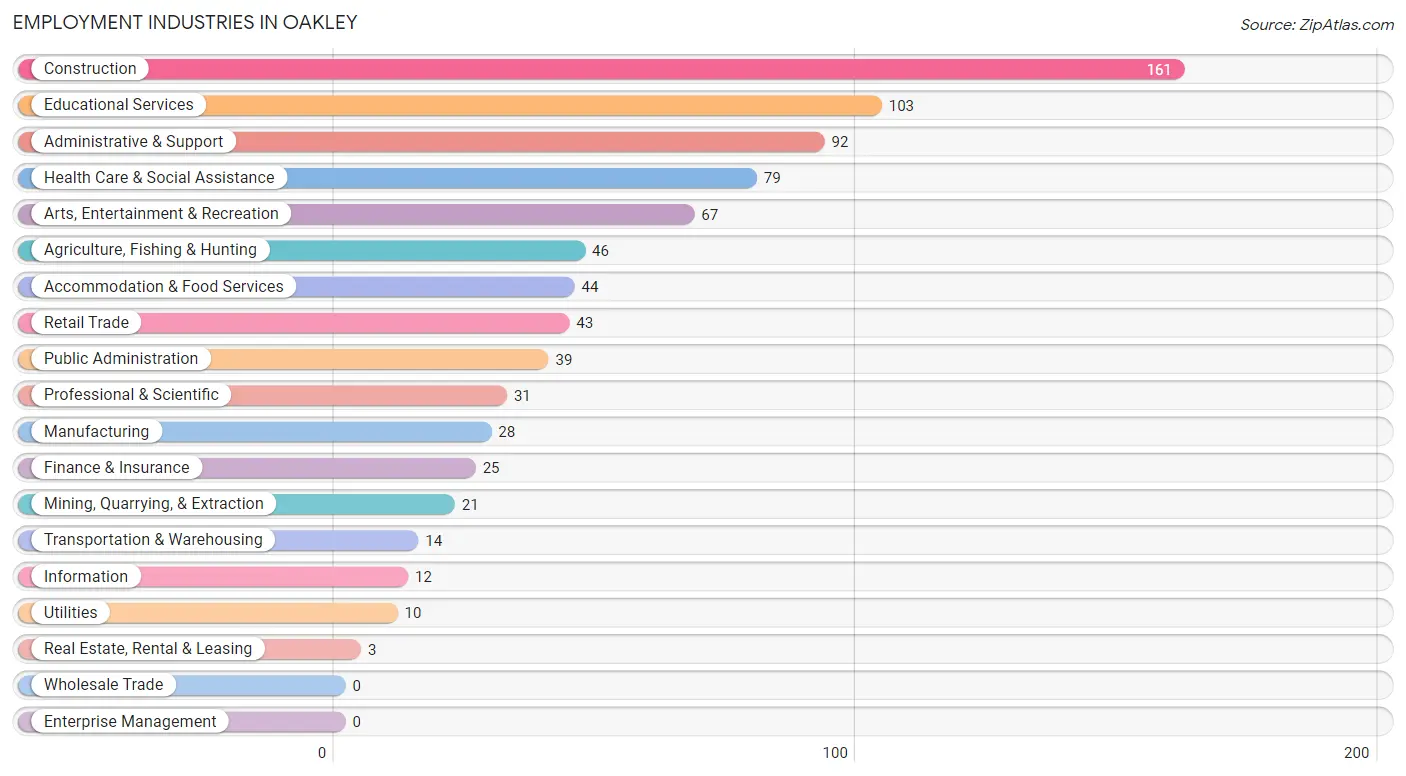
Employment Industries in Oakley
The major employment industries in Oakley include Construction (161 | 18.5%), Educational Services (103 | 11.9%), Administrative & Support (92 | 10.6%), Health Care & Social Assistance (79 | 9.1%), and Arts, Entertainment & Recreation (67 | 7.7%).
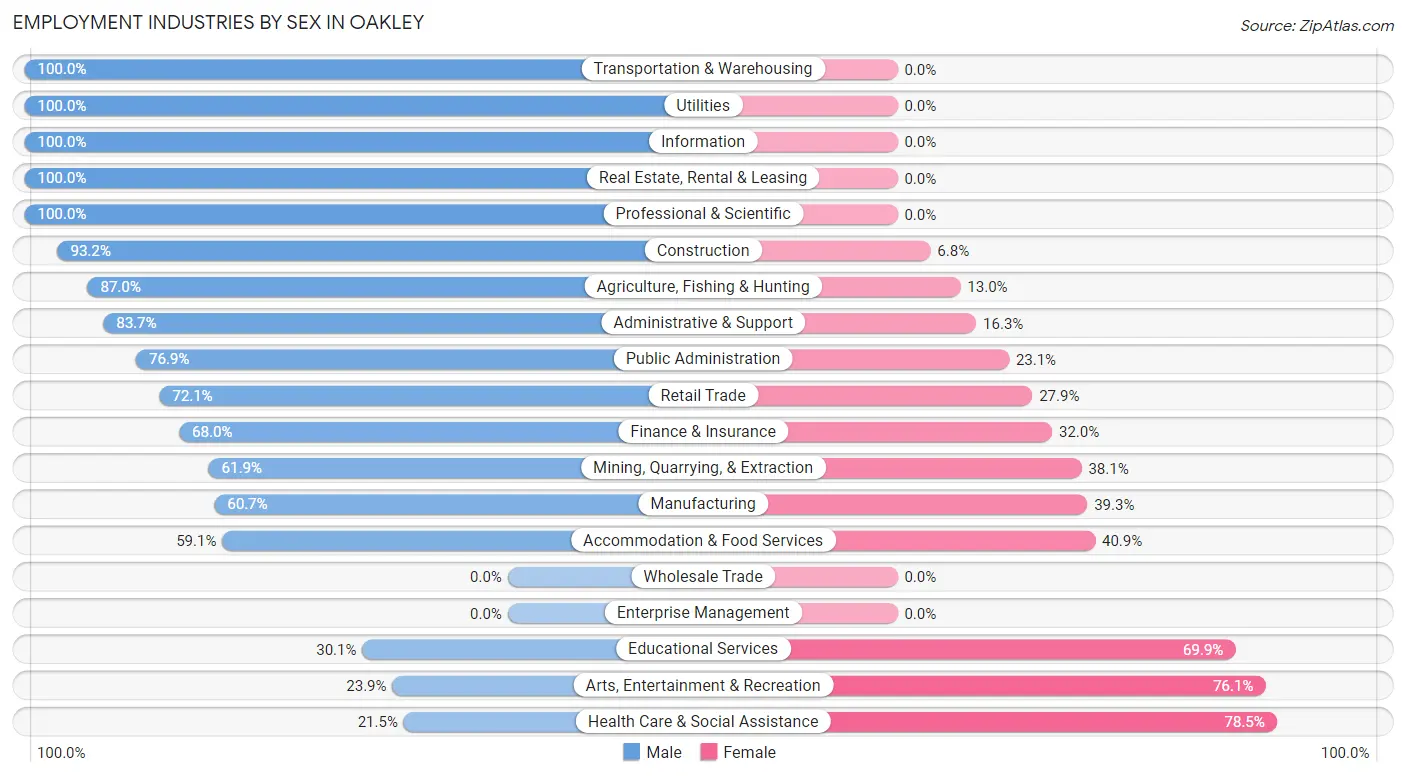
Employment Industries by Sex in Oakley
The Oakley industries that see more men than women are Transportation & Warehousing (100.0%), Utilities (100.0%), and Information (100.0%), whereas the industries that tend to have a higher number of women are Health Care & Social Assistance (78.5%), Arts, Entertainment & Recreation (76.1%), and Educational Services (69.9%).
| Industry | Male | Female |
| Agriculture, Fishing & Hunting | 40 (87.0%) | 6 (13.0%) |
| Mining, Quarrying, & Extraction | 13 (61.9%) | 8 (38.1%) |
| Construction | 150 (93.2%) | 11 (6.8%) |
| Manufacturing | 17 (60.7%) | 11 (39.3%) |
| Wholesale Trade | 0 (0.0%) | 0 (0.0%) |
| Retail Trade | 31 (72.1%) | 12 (27.9%) |
| Transportation & Warehousing | 14 (100.0%) | 0 (0.0%) |
| Utilities | 10 (100.0%) | 0 (0.0%) |
| Information | 12 (100.0%) | 0 (0.0%) |
| Finance & Insurance | 17 (68.0%) | 8 (32.0%) |
| Real Estate, Rental & Leasing | 3 (100.0%) | 0 (0.0%) |
| Professional & Scientific | 31 (100.0%) | 0 (0.0%) |
| Enterprise Management | 0 (0.0%) | 0 (0.0%) |
| Administrative & Support | 77 (83.7%) | 15 (16.3%) |
| Educational Services | 31 (30.1%) | 72 (69.9%) |
| Health Care & Social Assistance | 17 (21.5%) | 62 (78.5%) |
| Arts, Entertainment & Recreation | 16 (23.9%) | 51 (76.1%) |
| Accommodation & Food Services | 26 (59.1%) | 18 (40.9%) |
| Public Administration | 30 (76.9%) | 9 (23.1%) |
| Total | 578 (66.6%) | 290 (33.4%) |
Education in Oakley
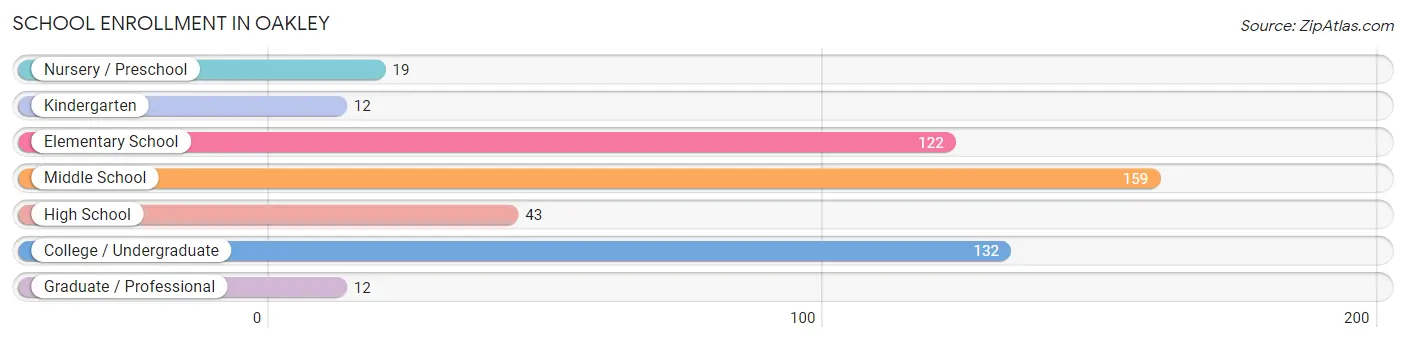
School Enrollment in Oakley
The most common levels of schooling among the 499 students in Oakley are middle school (159 | 31.9%), college / undergraduate (132 | 26.5%), and elementary school (122 | 24.4%).
| School Level | # Students | % Students |
| Nursery / Preschool | 19 | 3.8% |
| Kindergarten | 12 | 2.4% |
| Elementary School | 122 | 24.4% |
| Middle School | 159 | 31.9% |
| High School | 43 | 8.6% |
| College / Undergraduate | 132 | 26.5% |
| Graduate / Professional | 12 | 2.4% |
| Total | 499 | 100.0% |
School Enrollment by Age by Funding Source in Oakley
Out of a total of 499 students who are enrolled in schools in Oakley, 101 (20.2%) attend a private institution, while the remaining 398 (79.8%) are enrolled in public schools. The age group of 3 to 4 year olds has the highest likelihood of being enrolled in private schools, with 13 (68.4% in the age bracket) enrolled. Conversely, the age group of 18 to 19 year olds has the lowest likelihood of being enrolled in a private school, with 22 (100.0% in the age bracket) attending a public institution.
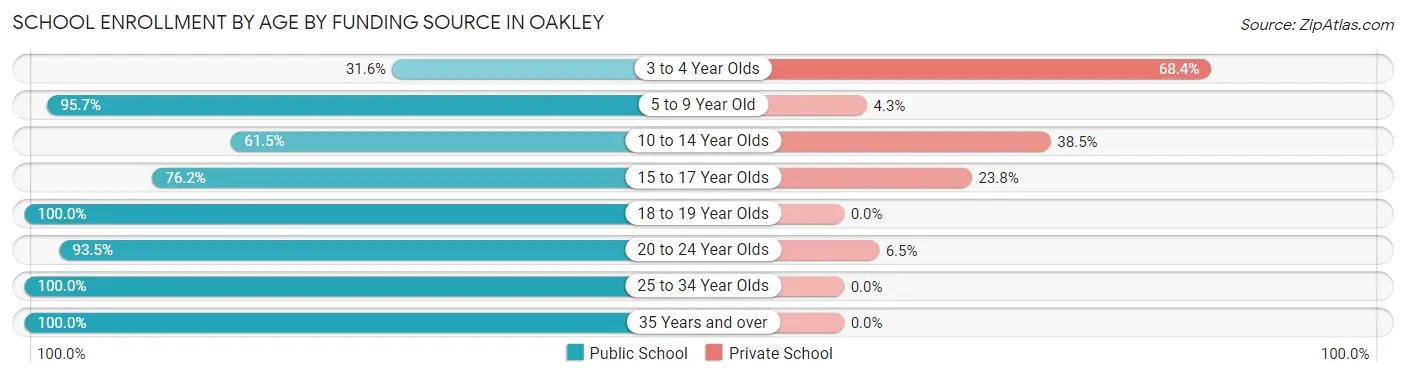
| Age Bracket | Public School | Private School |
| 3 to 4 Year Olds | 6 (31.6%) | 13 (68.4%) |
| 5 to 9 Year Old | 112 (95.7%) | 5 (4.3%) |
| 10 to 14 Year Olds | 107 (61.5%) | 67 (38.5%) |
| 15 to 17 Year Olds | 32 (76.2%) | 10 (23.8%) |
| 18 to 19 Year Olds | 22 (100.0%) | 0 (0.0%) |
| 20 to 24 Year Olds | 86 (93.5%) | 6 (6.5%) |
| 25 to 34 Year Olds | 8 (100.0%) | 0 (0.0%) |
| 35 Years and over | 25 (100.0%) | 0 (0.0%) |
| Total | 398 (79.8%) | 101 (20.2%) |
Educational Attainment by Field of Study in Oakley
Business (67 | 18.1%), education (45 | 12.1%), literature & languages (40 | 10.8%), communications (36 | 9.7%), and social sciences (31 | 8.4%) are the most common fields of study among 371 individuals in Oakley who have obtained a bachelor's degree or higher.
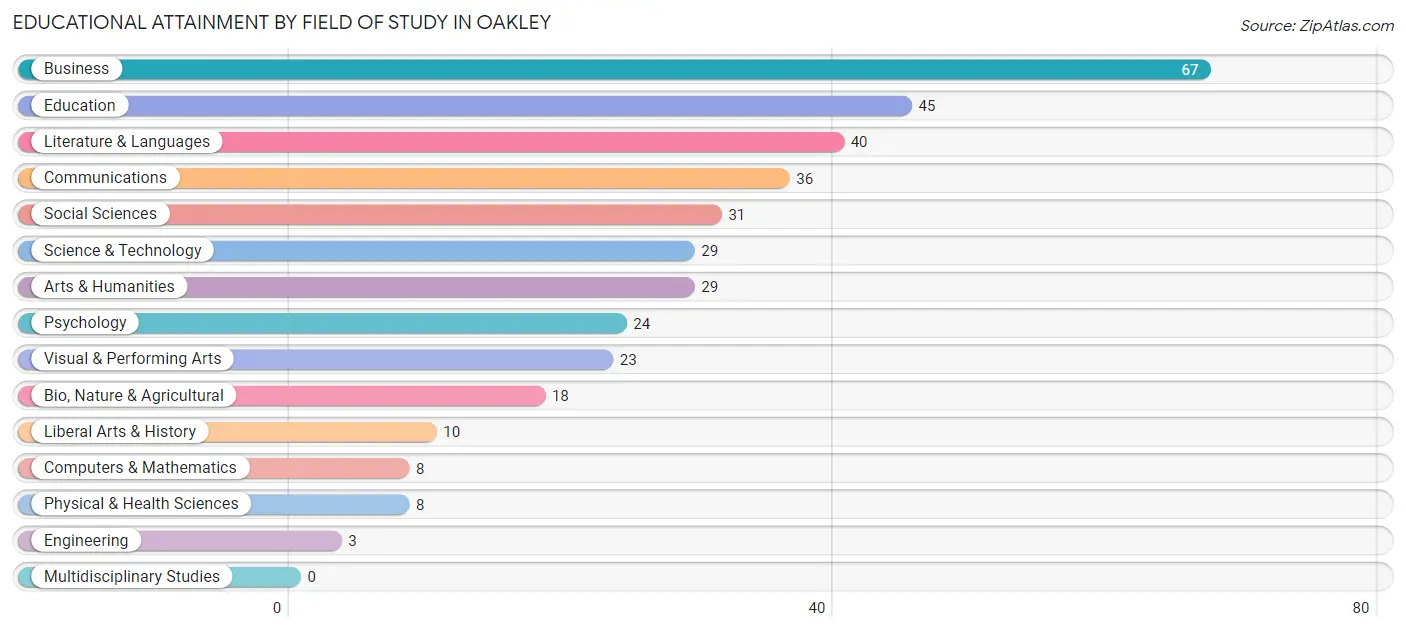
| Field of Study | # Graduates | % Graduates |
| Computers & Mathematics | 8 | 2.2% |
| Bio, Nature & Agricultural | 18 | 4.9% |
| Physical & Health Sciences | 8 | 2.2% |
| Psychology | 24 | 6.5% |
| Social Sciences | 31 | 8.4% |
| Engineering | 3 | 0.8% |
| Multidisciplinary Studies | 0 | 0.0% |
| Science & Technology | 29 | 7.8% |
| Business | 67 | 18.1% |
| Education | 45 | 12.1% |
| Literature & Languages | 40 | 10.8% |
| Liberal Arts & History | 10 | 2.7% |
| Visual & Performing Arts | 23 | 6.2% |
| Communications | 36 | 9.7% |
| Arts & Humanities | 29 | 7.8% |
| Total | 371 | 100.0% |
Transportation & Commute in Oakley
Vehicle Availability by Sex in Oakley
The most prevalent vehicle ownership categories in Oakley are males with 3 vehicles (179, accounting for 31.0%) and females with 3 vehicles (99, making up 61.7%).
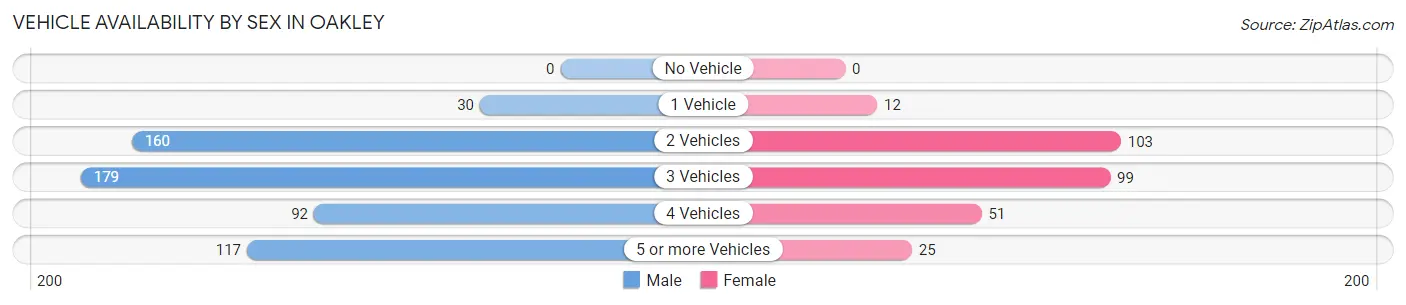
| Vehicles Available | Male | Female |
| No Vehicle | 0 (0.0%) | 0 (0.0%) |
| 1 Vehicle | 30 (5.2%) | 12 (4.1%) |
| 2 Vehicles | 160 (27.7%) | 103 (35.5%) |
| 3 Vehicles | 179 (31.0%) | 99 (34.1%) |
| 4 Vehicles | 92 (15.9%) | 51 (17.6%) |
| 5 or more Vehicles | 117 (20.2%) | 25 (8.6%) |
| Total | 578 (100.0%) | 290 (100.0%) |
Commute Time in Oakley
The most frequently occuring commute durations in Oakley are 30 to 34 minutes (137 commuters, 17.7%), 10 to 14 minutes (125 commuters, 16.2%), and 45 to 59 minutes (106 commuters, 13.7%).
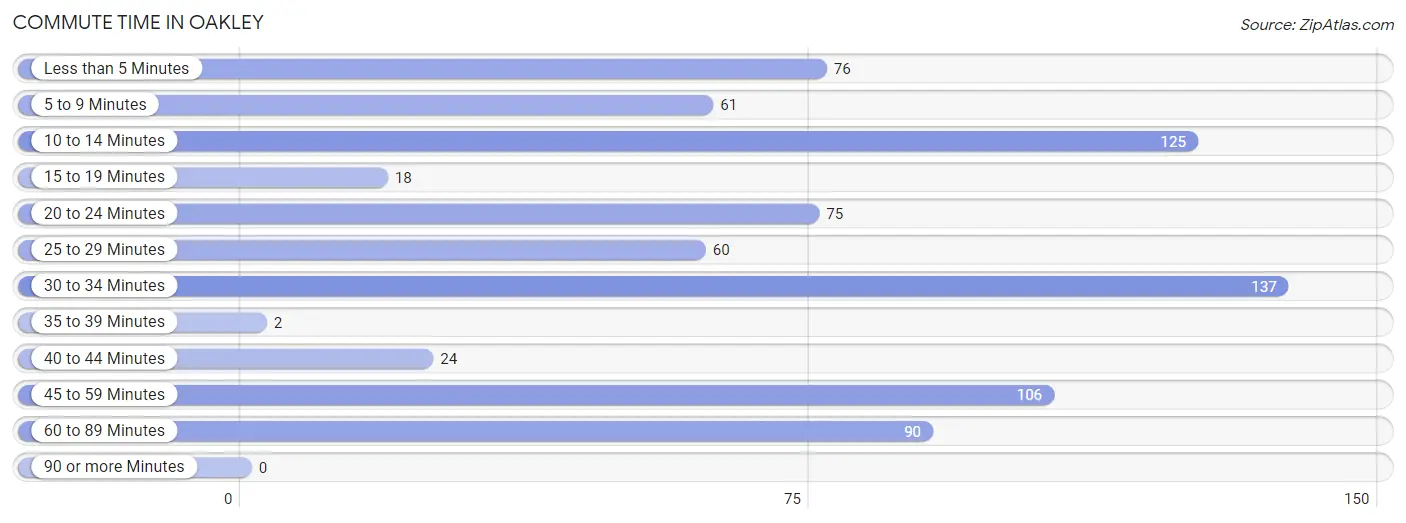
| Commute Time | # Commuters | % Commuters |
| Less than 5 Minutes | 76 | 9.8% |
| 5 to 9 Minutes | 61 | 7.9% |
| 10 to 14 Minutes | 125 | 16.2% |
| 15 to 19 Minutes | 18 | 2.3% |
| 20 to 24 Minutes | 75 | 9.7% |
| 25 to 29 Minutes | 60 | 7.7% |
| 30 to 34 Minutes | 137 | 17.7% |
| 35 to 39 Minutes | 2 | 0.3% |
| 40 to 44 Minutes | 24 | 3.1% |
| 45 to 59 Minutes | 106 | 13.7% |
| 60 to 89 Minutes | 90 | 11.6% |
| 90 or more Minutes | 0 | 0.0% |
Commute Time by Sex in Oakley
The most common commute times in Oakley are 30 to 34 minutes (91 commuters, 17.0%) for males and 10 to 14 minutes (49 commuters, 20.4%) for females.
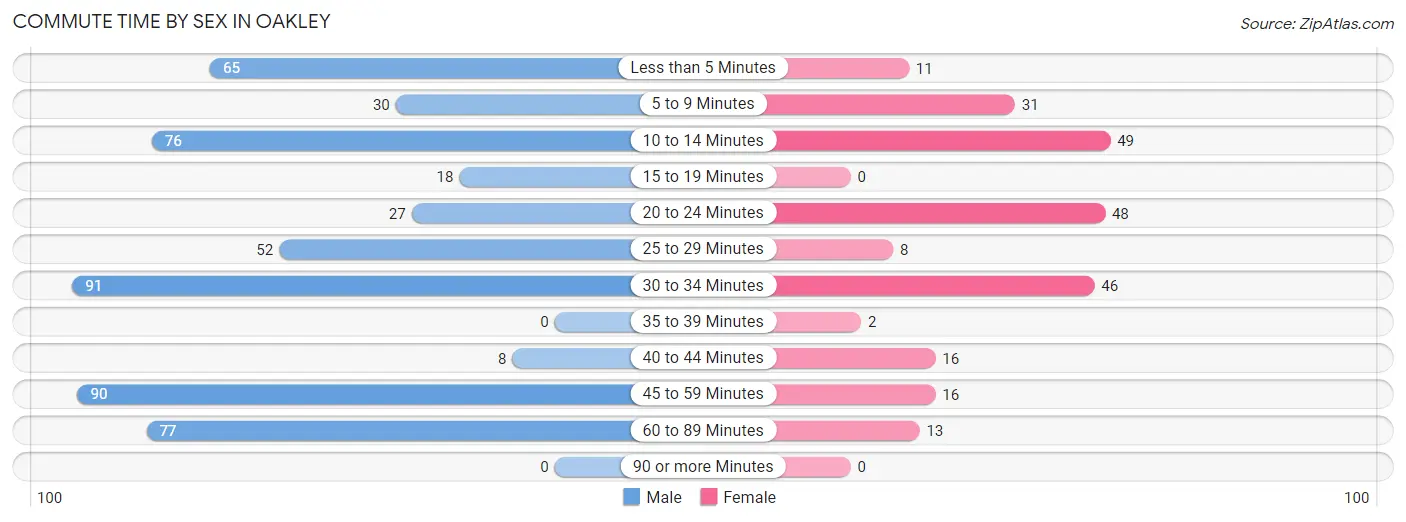
| Commute Time | Male | Female |
| Less than 5 Minutes | 65 (12.2%) | 11 (4.6%) |
| 5 to 9 Minutes | 30 (5.6%) | 31 (12.9%) |
| 10 to 14 Minutes | 76 (14.2%) | 49 (20.4%) |
| 15 to 19 Minutes | 18 (3.4%) | 0 (0.0%) |
| 20 to 24 Minutes | 27 (5.1%) | 48 (20.0%) |
| 25 to 29 Minutes | 52 (9.7%) | 8 (3.3%) |
| 30 to 34 Minutes | 91 (17.0%) | 46 (19.2%) |
| 35 to 39 Minutes | 0 (0.0%) | 2 (0.8%) |
| 40 to 44 Minutes | 8 (1.5%) | 16 (6.7%) |
| 45 to 59 Minutes | 90 (16.9%) | 16 (6.7%) |
| 60 to 89 Minutes | 77 (14.4%) | 13 (5.4%) |
| 90 or more Minutes | 0 (0.0%) | 0 (0.0%) |
Time of Departure to Work by Sex in Oakley
The most frequent times of departure to work in Oakley are 7:00 AM to 7:29 AM (236, 44.2%) for males and 7:30 AM to 7:59 AM (55, 22.9%) for females.
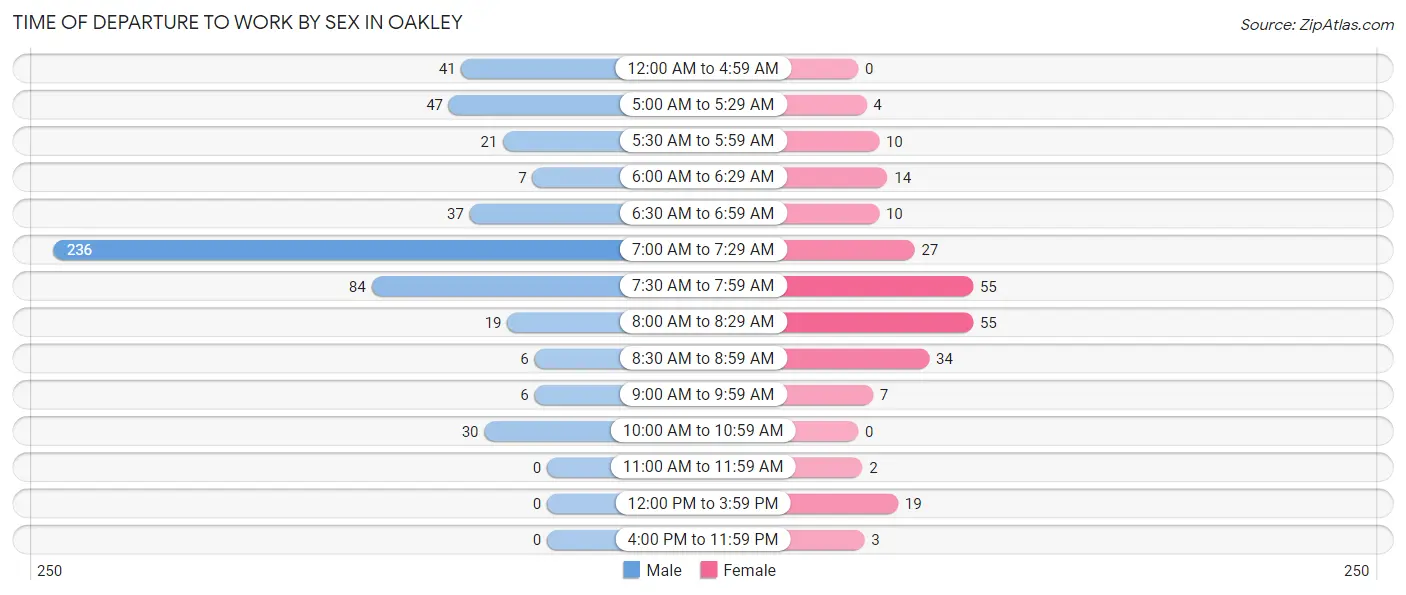
| Time of Departure | Male | Female |
| 12:00 AM to 4:59 AM | 41 (7.7%) | 0 (0.0%) |
| 5:00 AM to 5:29 AM | 47 (8.8%) | 4 (1.7%) |
| 5:30 AM to 5:59 AM | 21 (3.9%) | 10 (4.2%) |
| 6:00 AM to 6:29 AM | 7 (1.3%) | 14 (5.8%) |
| 6:30 AM to 6:59 AM | 37 (6.9%) | 10 (4.2%) |
| 7:00 AM to 7:29 AM | 236 (44.2%) | 27 (11.3%) |
| 7:30 AM to 7:59 AM | 84 (15.7%) | 55 (22.9%) |
| 8:00 AM to 8:29 AM | 19 (3.6%) | 55 (22.9%) |
| 8:30 AM to 8:59 AM | 6 (1.1%) | 34 (14.2%) |
| 9:00 AM to 9:59 AM | 6 (1.1%) | 7 (2.9%) |
| 10:00 AM to 10:59 AM | 30 (5.6%) | 0 (0.0%) |
| 11:00 AM to 11:59 AM | 0 (0.0%) | 2 (0.8%) |
| 12:00 PM to 3:59 PM | 0 (0.0%) | 19 (7.9%) |
| 4:00 PM to 11:59 PM | 0 (0.0%) | 3 (1.3%) |
| Total | 534 (100.0%) | 240 (100.0%) |
Housing Occupancy in Oakley
Occupancy by Ownership in Oakley
Of the total 458 dwellings in Oakley, owner-occupied units account for 417 (91.0%), while renter-occupied units make up 41 (8.9%).
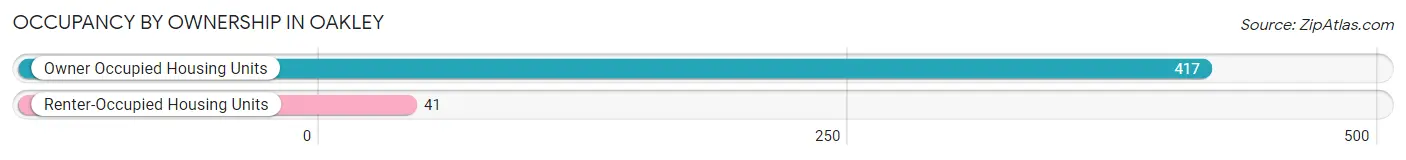
| Occupancy | # Housing Units | % Housing Units |
| Owner Occupied Housing Units | 417 | 91.0% |
| Renter-Occupied Housing Units | 41 | 8.9% |
| Total Occupied Housing Units | 458 | 100.0% |
Occupancy by Household Size in Oakley
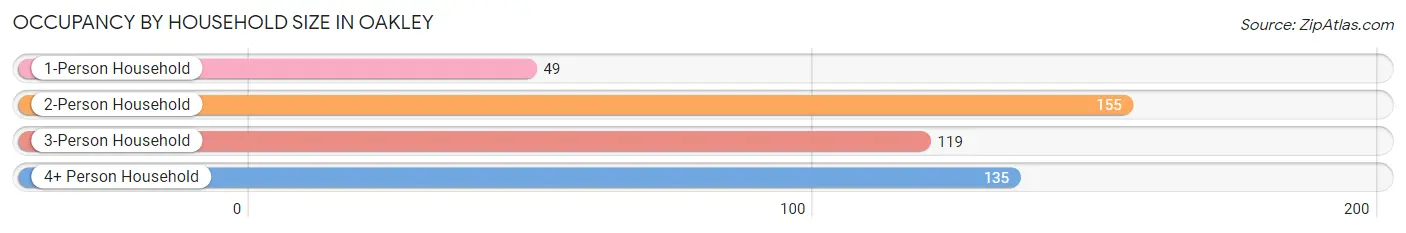
| Household Size | # Housing Units | % Housing Units |
| 1-Person Household | 49 | 10.7% |
| 2-Person Household | 155 | 33.8% |
| 3-Person Household | 119 | 26.0% |
| 4+ Person Household | 135 | 29.5% |
| Total Housing Units | 458 | 100.0% |
Occupancy by Ownership by Household Size in Oakley
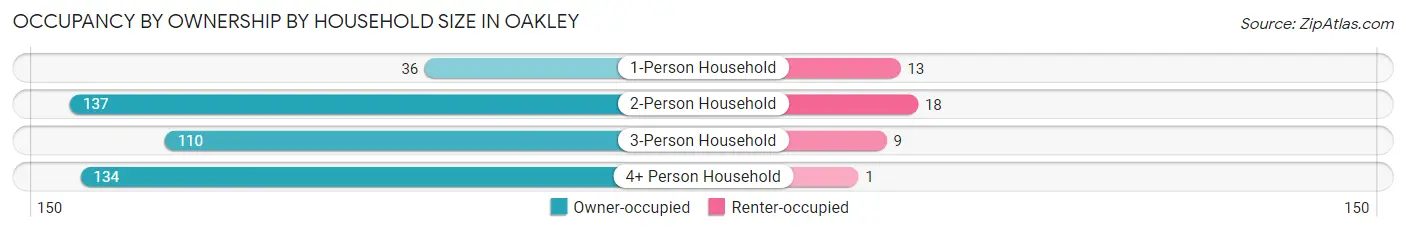
| Household Size | Owner-occupied | Renter-occupied |
| 1-Person Household | 36 (73.5%) | 13 (26.5%) |
| 2-Person Household | 137 (88.4%) | 18 (11.6%) |
| 3-Person Household | 110 (92.4%) | 9 (7.6%) |
| 4+ Person Household | 134 (99.3%) | 1 (0.7%) |
| Total Housing Units | 417 (91.0%) | 41 (8.9%) |
Occupancy by Educational Attainment in Oakley
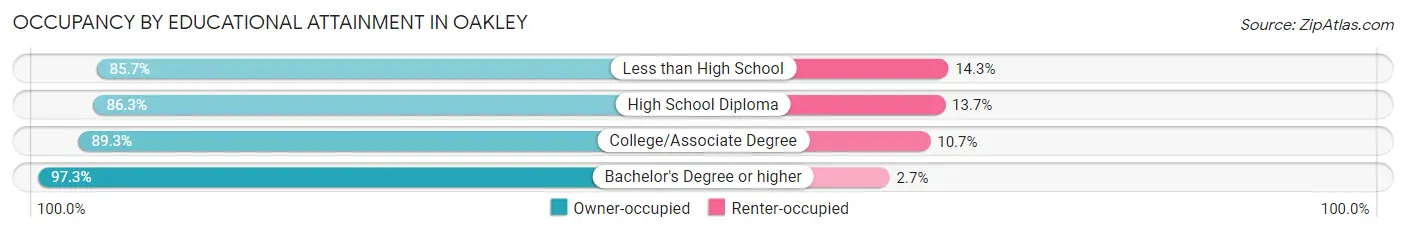
| Household Size | Owner-occupied | Renter-occupied |
| Less than High School | 12 (85.7%) | 2 (14.3%) |
| High School Diploma | 101 (86.3%) | 16 (13.7%) |
| College/Associate Degree | 158 (89.3%) | 19 (10.7%) |
| Bachelor's Degree or higher | 146 (97.3%) | 4 (2.7%) |
Occupancy by Age of Householder in Oakley
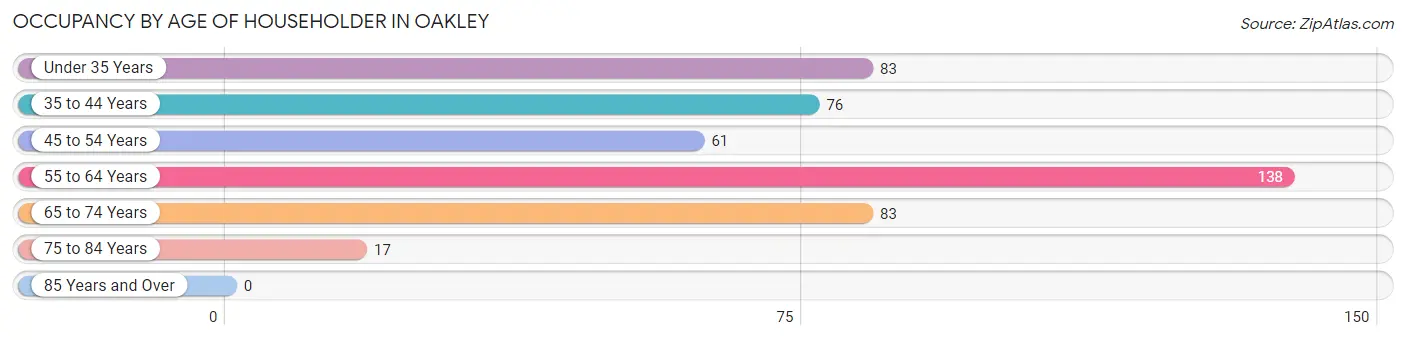
| Age Bracket | # Households | % Households |
| Under 35 Years | 83 | 18.1% |
| 35 to 44 Years | 76 | 16.6% |
| 45 to 54 Years | 61 | 13.3% |
| 55 to 64 Years | 138 | 30.1% |
| 65 to 74 Years | 83 | 18.1% |
| 75 to 84 Years | 17 | 3.7% |
| 85 Years and Over | 0 | 0.0% |
| Total | 458 | 100.0% |
Housing Finances in Oakley
Median Income by Occupancy in Oakley
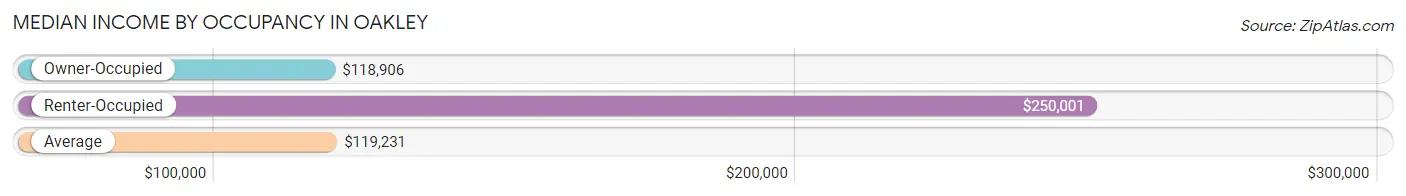
| Occupancy Type | # Households | Median Income |
| Owner-Occupied | 417 (91.0%) | $118,906 |
| Renter-Occupied | 41 (8.9%) | $250,001 |
| Average | 458 (100.0%) | $119,231 |
Occupancy by Householder Income Bracket in Oakley
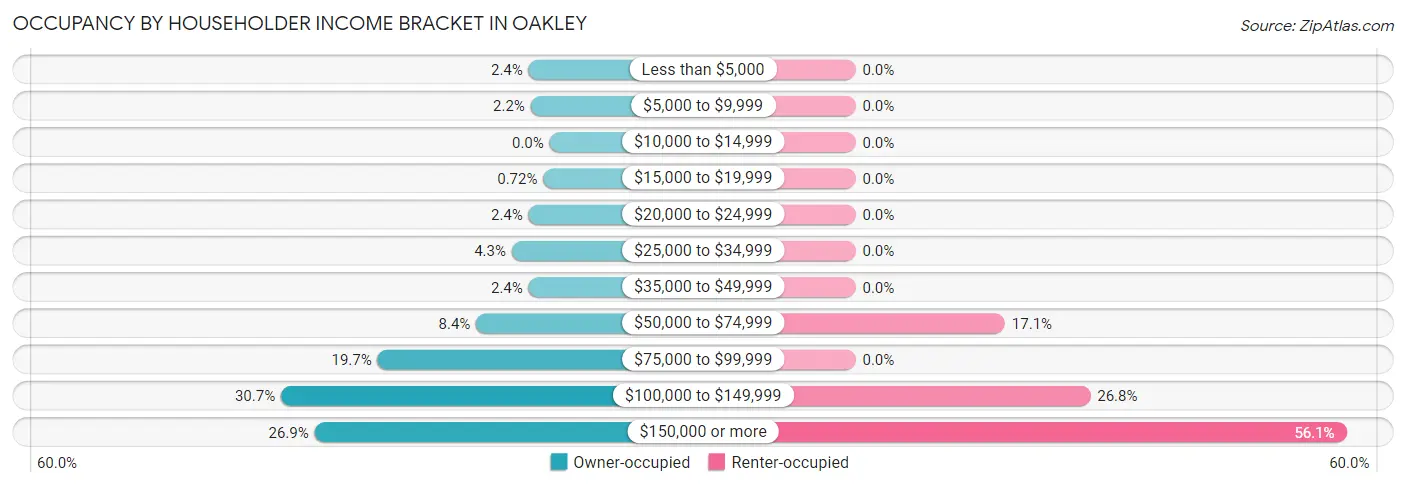
| Income Bracket | Owner-occupied | Renter-occupied |
| Less than $5,000 | 10 (2.4%) | 0 (0.0%) |
| $5,000 to $9,999 | 9 (2.2%) | 0 (0.0%) |
| $10,000 to $14,999 | 0 (0.0%) | 0 (0.0%) |
| $15,000 to $19,999 | 3 (0.7%) | 0 (0.0%) |
| $20,000 to $24,999 | 10 (2.4%) | 0 (0.0%) |
| $25,000 to $34,999 | 18 (4.3%) | 0 (0.0%) |
| $35,000 to $49,999 | 10 (2.4%) | 0 (0.0%) |
| $50,000 to $74,999 | 35 (8.4%) | 7 (17.1%) |
| $75,000 to $99,999 | 82 (19.7%) | 0 (0.0%) |
| $100,000 to $149,999 | 128 (30.7%) | 11 (26.8%) |
| $150,000 or more | 112 (26.9%) | 23 (56.1%) |
| Total | 417 (100.0%) | 41 (100.0%) |
Monthly Housing Cost Tiers in Oakley
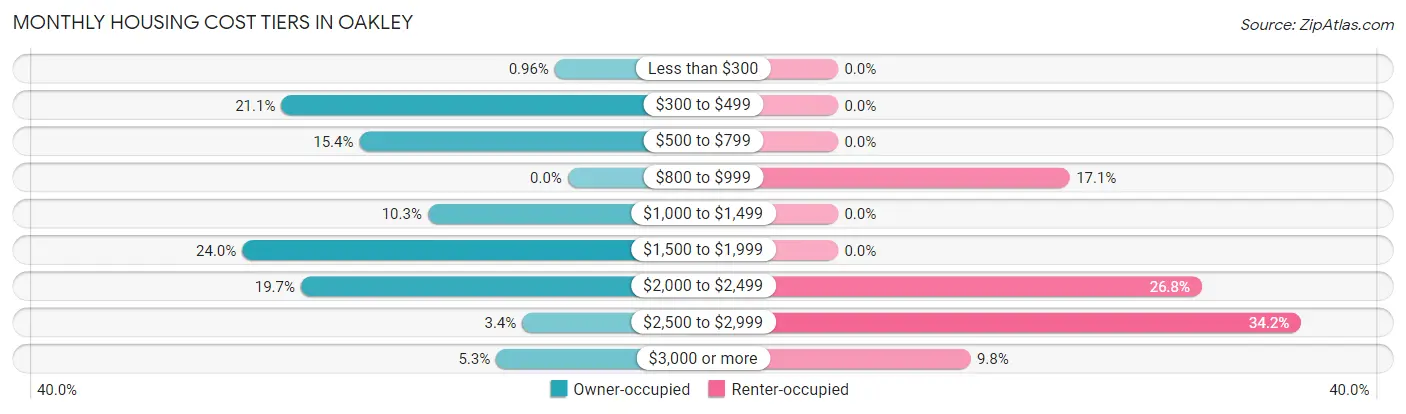
| Monthly Cost | Owner-occupied | Renter-occupied |
| Less than $300 | 4 (1.0%) | 0 (0.0%) |
| $300 to $499 | 88 (21.1%) | 0 (0.0%) |
| $500 to $799 | 64 (15.3%) | 0 (0.0%) |
| $800 to $999 | 0 (0.0%) | 7 (17.1%) |
| $1,000 to $1,499 | 43 (10.3%) | 0 (0.0%) |
| $1,500 to $1,999 | 100 (24.0%) | 0 (0.0%) |
| $2,000 to $2,499 | 82 (19.7%) | 11 (26.8%) |
| $2,500 to $2,999 | 14 (3.4%) | 14 (34.2%) |
| $3,000 or more | 22 (5.3%) | 4 (9.8%) |
| Total | 417 (100.0%) | 41 (100.0%) |
Physical Housing Characteristics in Oakley
Housing Structures in Oakley
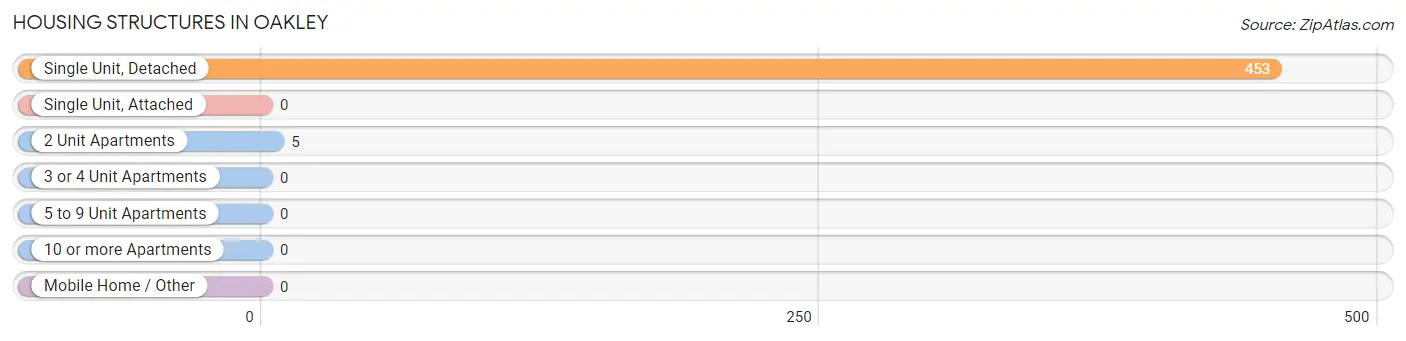
| Structure Type | # Housing Units | % Housing Units |
| Single Unit, Detached | 453 | 98.9% |
| Single Unit, Attached | 0 | 0.0% |
| 2 Unit Apartments | 5 | 1.1% |
| 3 or 4 Unit Apartments | 0 | 0.0% |
| 5 to 9 Unit Apartments | 0 | 0.0% |
| 10 or more Apartments | 0 | 0.0% |
| Mobile Home / Other | 0 | 0.0% |
| Total | 458 | 100.0% |
Housing Structures by Occupancy in Oakley
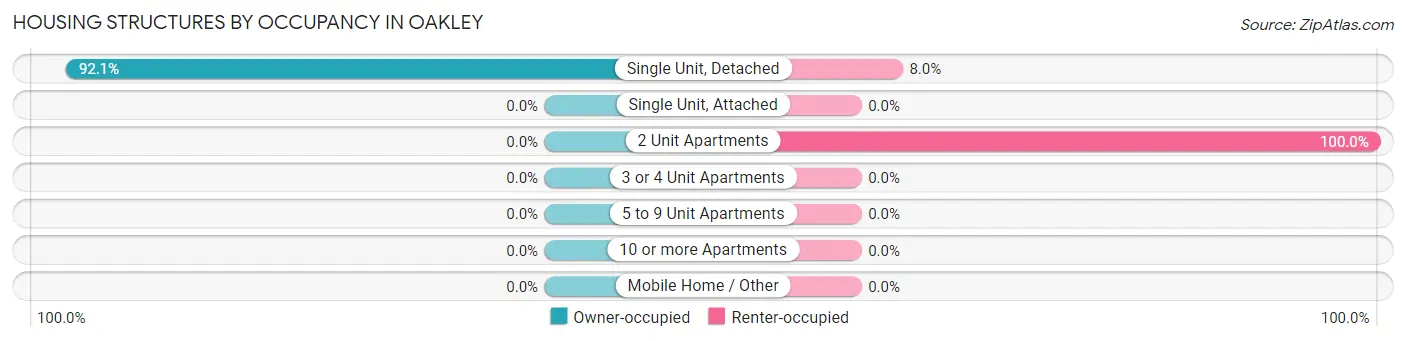
| Structure Type | Owner-occupied | Renter-occupied |
| Single Unit, Detached | 417 (92.0%) | 36 (8.0%) |
| Single Unit, Attached | 0 (0.0%) | 0 (0.0%) |
| 2 Unit Apartments | 0 (0.0%) | 5 (100.0%) |
| 3 or 4 Unit Apartments | 0 (0.0%) | 0 (0.0%) |
| 5 to 9 Unit Apartments | 0 (0.0%) | 0 (0.0%) |
| 10 or more Apartments | 0 (0.0%) | 0 (0.0%) |
| Mobile Home / Other | 0 (0.0%) | 0 (0.0%) |
| Total | 417 (91.0%) | 41 (8.9%) |
Housing Structures by Number of Rooms in Oakley
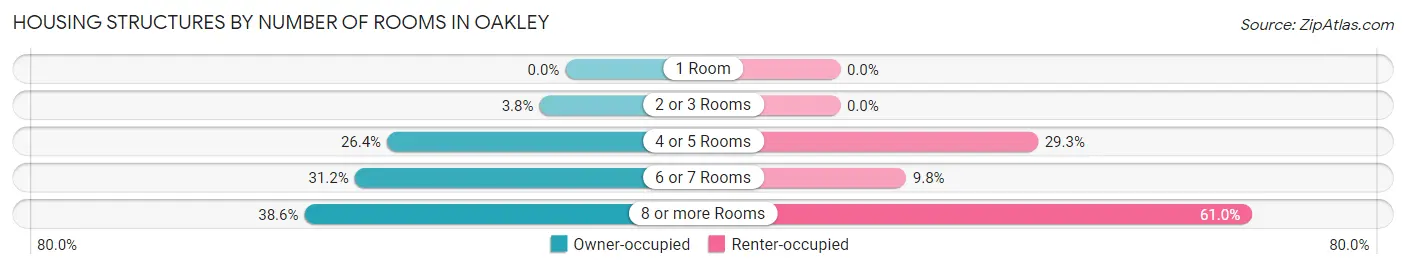
| Number of Rooms | Owner-occupied | Renter-occupied |
| 1 Room | 0 (0.0%) | 0 (0.0%) |
| 2 or 3 Rooms | 16 (3.8%) | 0 (0.0%) |
| 4 or 5 Rooms | 110 (26.4%) | 12 (29.3%) |
| 6 or 7 Rooms | 130 (31.2%) | 4 (9.8%) |
| 8 or more Rooms | 161 (38.6%) | 25 (61.0%) |
| Total | 417 (100.0%) | 41 (100.0%) |
Housing Structure by Heating Type in Oakley
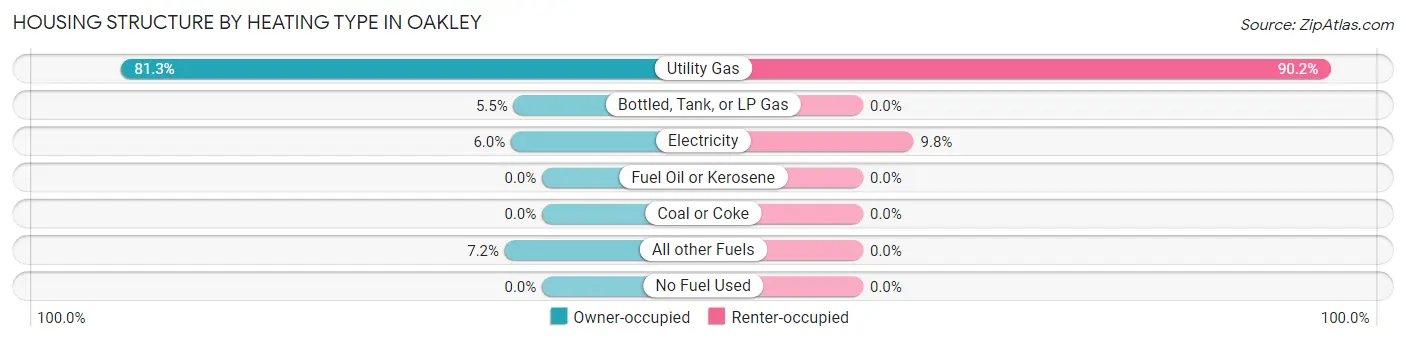
| Heating Type | Owner-occupied | Renter-occupied |
| Utility Gas | 339 (81.3%) | 37 (90.2%) |
| Bottled, Tank, or LP Gas | 23 (5.5%) | 0 (0.0%) |
| Electricity | 25 (6.0%) | 4 (9.8%) |
| Fuel Oil or Kerosene | 0 (0.0%) | 0 (0.0%) |
| Coal or Coke | 0 (0.0%) | 0 (0.0%) |
| All other Fuels | 30 (7.2%) | 0 (0.0%) |
| No Fuel Used | 0 (0.0%) | 0 (0.0%) |
| Total | 417 (100.0%) | 41 (100.0%) |
Household Vehicle Usage in Oakley
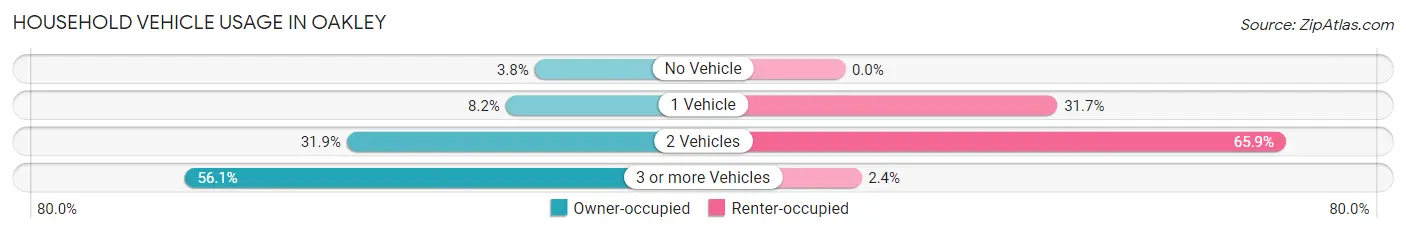
| Vehicles per Household | Owner-occupied | Renter-occupied |
| No Vehicle | 16 (3.8%) | 0 (0.0%) |
| 1 Vehicle | 34 (8.2%) | 13 (31.7%) |
| 2 Vehicles | 133 (31.9%) | 27 (65.8%) |
| 3 or more Vehicles | 234 (56.1%) | 1 (2.4%) |
| Total | 417 (100.0%) | 41 (100.0%) |
Real Estate & Mortgages in Oakley
Real Estate and Mortgage Overview in Oakley
| Characteristic | Without Mortgage | With Mortgage |
| Housing Units | 158 | 259 |
| Median Property Value | $465,500 | $535,300 |
| Median Household Income | $133,333 | $44 |
| Monthly Housing Costs | $476 | $22 |
| Real Estate Taxes | $1,703 | $0 |
Property Value by Mortgage Status in Oakley
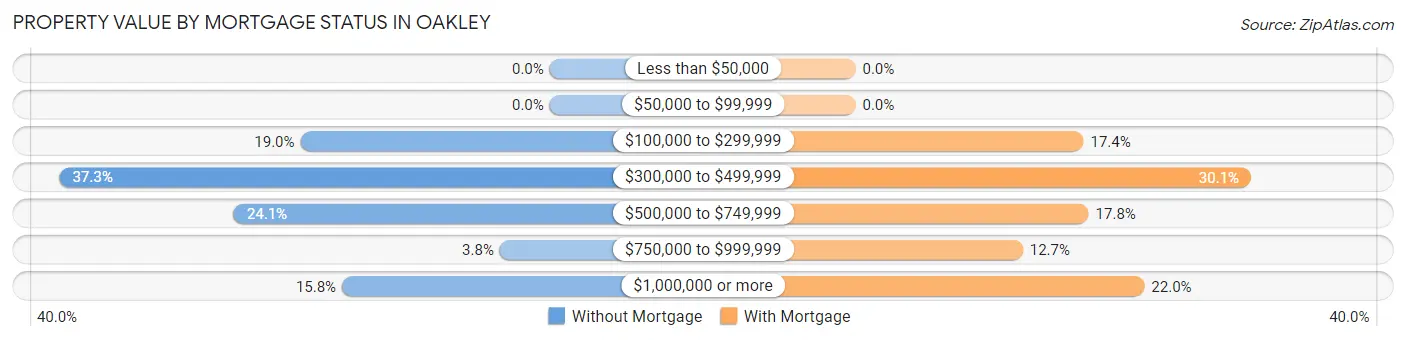
| Property Value | Without Mortgage | With Mortgage |
| Less than $50,000 | 0 (0.0%) | 0 (0.0%) |
| $50,000 to $99,999 | 0 (0.0%) | 0 (0.0%) |
| $100,000 to $299,999 | 30 (19.0%) | 45 (17.4%) |
| $300,000 to $499,999 | 59 (37.3%) | 78 (30.1%) |
| $500,000 to $749,999 | 38 (24.0%) | 46 (17.8%) |
| $750,000 to $999,999 | 6 (3.8%) | 33 (12.7%) |
| $1,000,000 or more | 25 (15.8%) | 57 (22.0%) |
| Total | 158 (100.0%) | 259 (100.0%) |
Household Income by Mortgage Status in Oakley
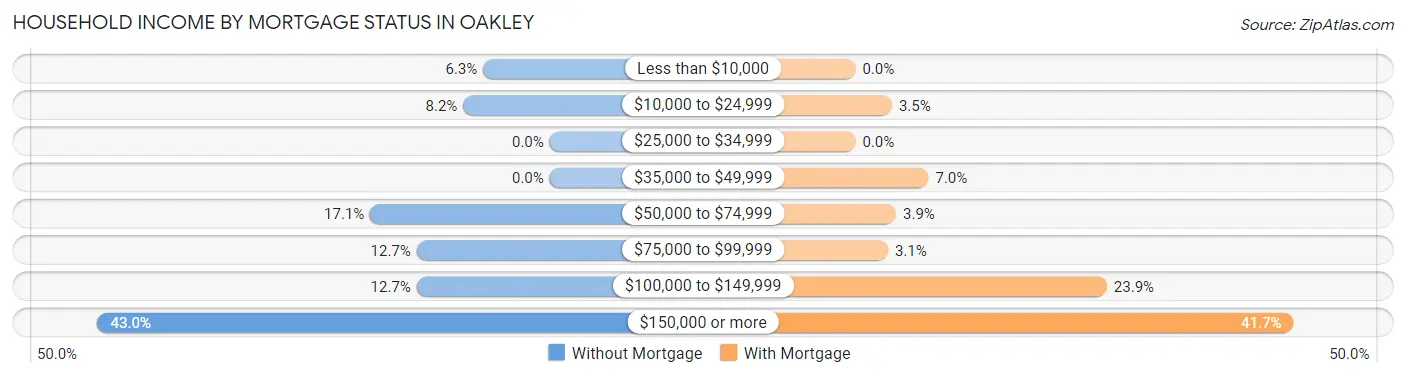
| Household Income | Without Mortgage | With Mortgage |
| Less than $10,000 | 10 (6.3%) | 0 (0.0%) |
| $10,000 to $24,999 | 13 (8.2%) | 9 (3.5%) |
| $25,000 to $34,999 | 0 (0.0%) | 0 (0.0%) |
| $35,000 to $49,999 | 0 (0.0%) | 18 (7.0%) |
| $50,000 to $74,999 | 27 (17.1%) | 10 (3.9%) |
| $75,000 to $99,999 | 20 (12.7%) | 8 (3.1%) |
| $100,000 to $149,999 | 20 (12.7%) | 62 (23.9%) |
| $150,000 or more | 68 (43.0%) | 108 (41.7%) |
| Total | 158 (100.0%) | 259 (100.0%) |
Property Value to Household Income Ratio in Oakley
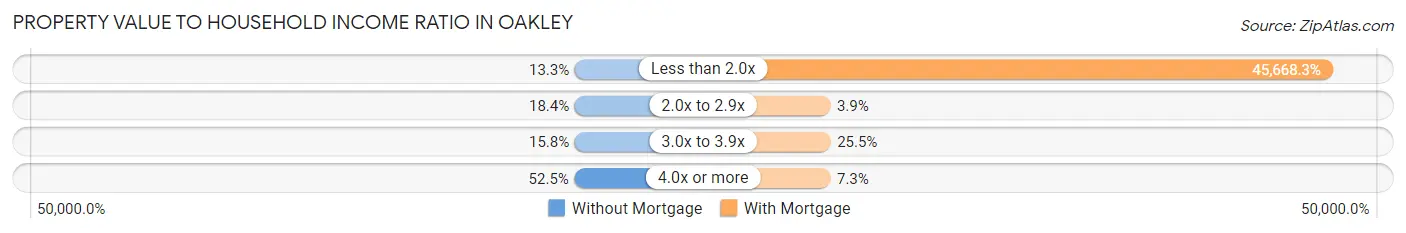
| Value-to-Income Ratio | Without Mortgage | With Mortgage |
| Less than 2.0x | 21 (13.3%) | 118,281 (45,668.3%) |
| 2.0x to 2.9x | 29 (18.3%) | 10 (3.9%) |
| 3.0x to 3.9x | 25 (15.8%) | 66 (25.5%) |
| 4.0x or more | 83 (52.5%) | 19 (7.3%) |
| Total | 158 (100.0%) | 259 (100.0%) |
Real Estate Taxes by Mortgage Status in Oakley
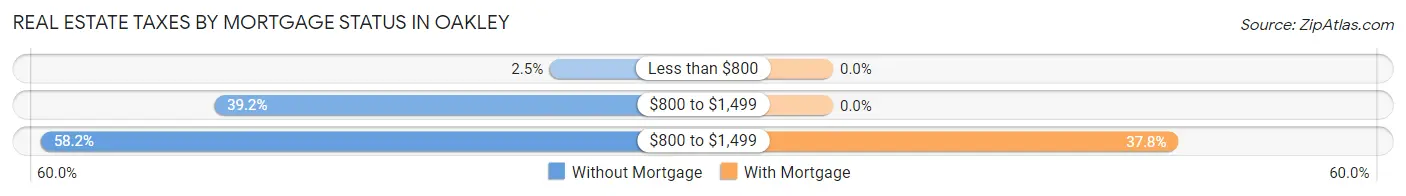
| Property Taxes | Without Mortgage | With Mortgage |
| Less than $800 | 4 (2.5%) | 0 (0.0%) |
| $800 to $1,499 | 62 (39.2%) | 0 (0.0%) |
| $800 to $1,499 | 92 (58.2%) | 98 (37.8%) |
| Total | 158 (100.0%) | 259 (100.0%) |
Health & Disability in Oakley
Health Insurance Coverage by Age in Oakley
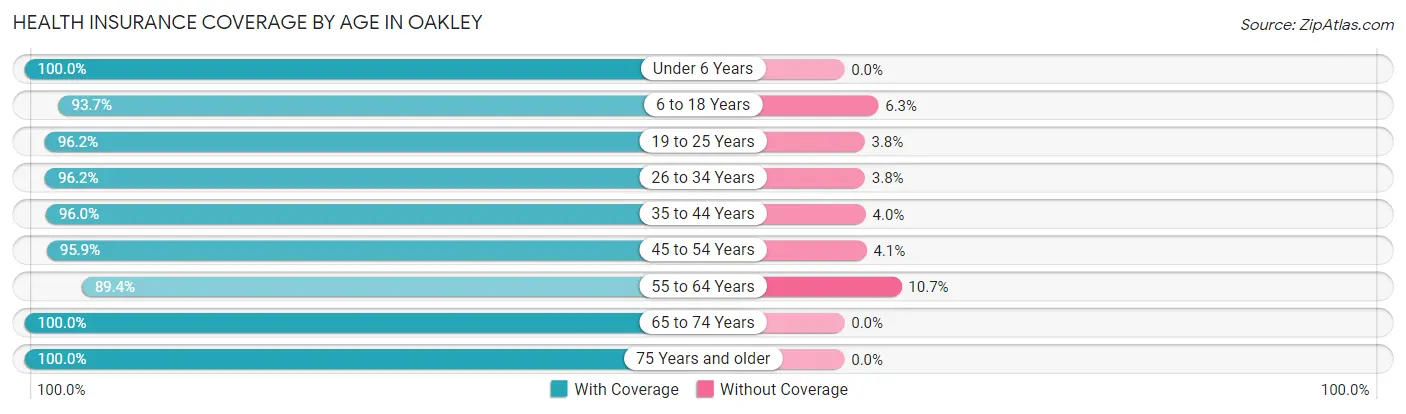
| Age Bracket | With Coverage | Without Coverage |
| Under 6 Years | 132 (100.0%) | 0 (0.0%) |
| 6 to 18 Years | 325 (93.7%) | 22 (6.3%) |
| 19 to 25 Years | 153 (96.2%) | 6 (3.8%) |
| 26 to 34 Years | 176 (96.2%) | 7 (3.8%) |
| 35 to 44 Years | 242 (96.0%) | 10 (4.0%) |
| 45 to 54 Years | 139 (95.9%) | 6 (4.1%) |
| 55 to 64 Years | 193 (89.3%) | 23 (10.6%) |
| 65 to 74 Years | 209 (100.0%) | 0 (0.0%) |
| 75 Years and older | 65 (100.0%) | 0 (0.0%) |
| Total | 1,634 (95.7%) | 74 (4.3%) |
Health Insurance Coverage by Citizenship Status in Oakley
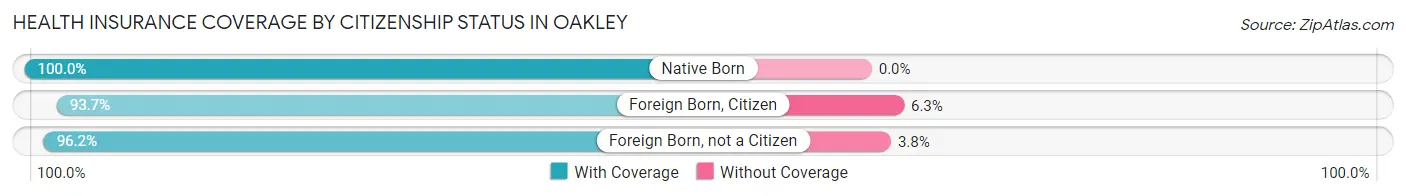
| Citizenship Status | With Coverage | Without Coverage |
| Native Born | 132 (100.0%) | 0 (0.0%) |
| Foreign Born, Citizen | 325 (93.7%) | 22 (6.3%) |
| Foreign Born, not a Citizen | 153 (96.2%) | 6 (3.8%) |
Health Insurance Coverage by Household Income in Oakley
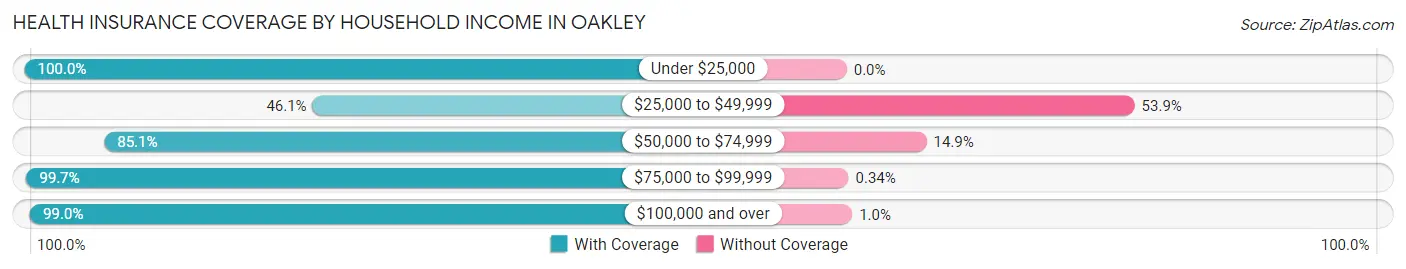
| Household Income | With Coverage | Without Coverage |
| Under $25,000 | 45 (100.0%) | 0 (0.0%) |
| $25,000 to $49,999 | 41 (46.1%) | 48 (53.9%) |
| $50,000 to $74,999 | 74 (85.1%) | 13 (14.9%) |
| $75,000 to $99,999 | 297 (99.7%) | 1 (0.3%) |
| $100,000 and over | 1,177 (99.0%) | 12 (1.0%) |
Public vs Private Health Insurance Coverage by Age in Oakley
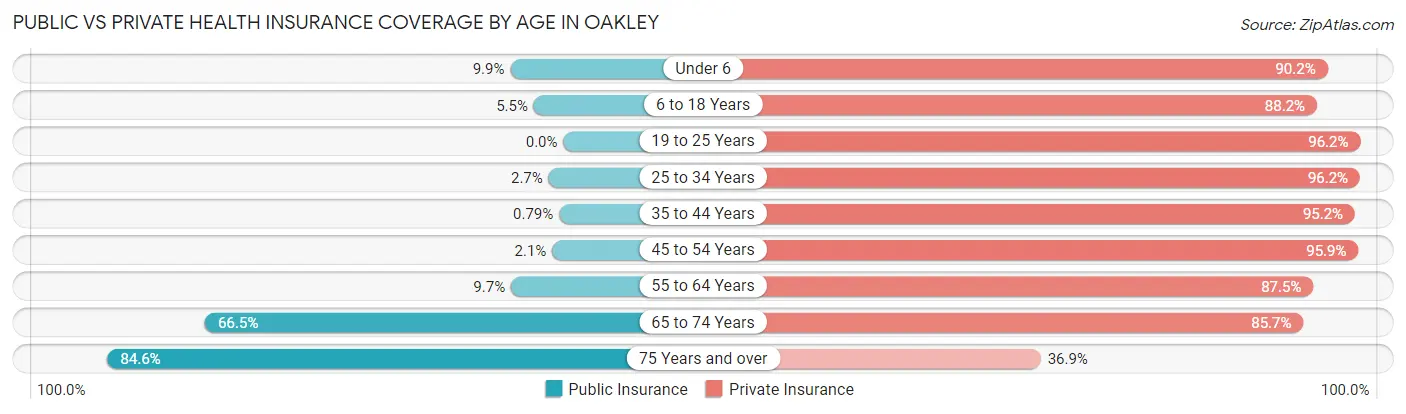
| Age Bracket | Public Insurance | Private Insurance |
| Under 6 | 13 (9.9%) | 119 (90.1%) |
| 6 to 18 Years | 19 (5.5%) | 306 (88.2%) |
| 19 to 25 Years | 0 (0.0%) | 153 (96.2%) |
| 25 to 34 Years | 5 (2.7%) | 176 (96.2%) |
| 35 to 44 Years | 2 (0.8%) | 240 (95.2%) |
| 45 to 54 Years | 3 (2.1%) | 139 (95.9%) |
| 55 to 64 Years | 21 (9.7%) | 189 (87.5%) |
| 65 to 74 Years | 139 (66.5%) | 179 (85.7%) |
| 75 Years and over | 55 (84.6%) | 24 (36.9%) |
| Total | 257 (15.0%) | 1,525 (89.3%) |
Disability Status by Sex by Age in Oakley
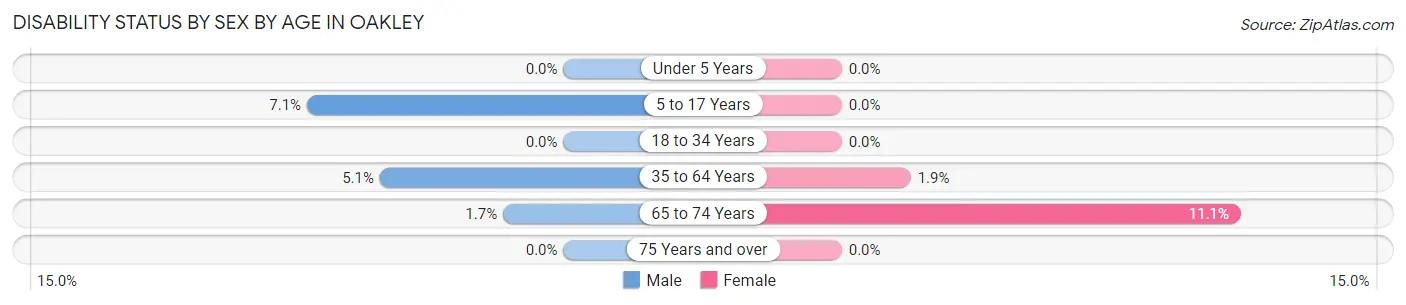
| Age Bracket | Male | Female |
| Under 5 Years | 0 (0.0%) | 0 (0.0%) |
| 5 to 17 Years | 12 (7.1%) | 0 (0.0%) |
| 18 to 34 Years | 0 (0.0%) | 0 (0.0%) |
| 35 to 64 Years | 18 (5.1%) | 5 (1.9%) |
| 65 to 74 Years | 2 (1.7%) | 10 (11.1%) |
| 75 Years and over | 0 (0.0%) | 0 (0.0%) |
Disability Class by Sex by Age in Oakley
Disability Class: Hearing Difficulty
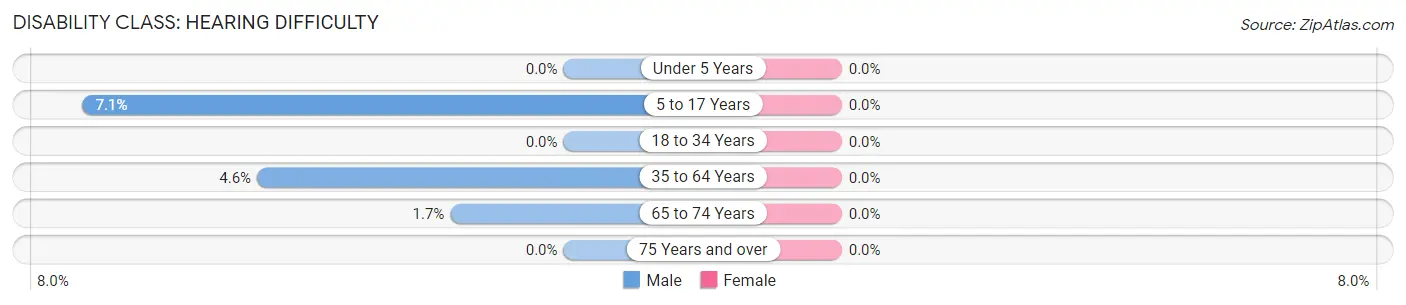
| Age Bracket | Male | Female |
| Under 5 Years | 0 (0.0%) | 0 (0.0%) |
| 5 to 17 Years | 12 (7.1%) | 0 (0.0%) |
| 18 to 34 Years | 0 (0.0%) | 0 (0.0%) |
| 35 to 64 Years | 16 (4.5%) | 0 (0.0%) |
| 65 to 74 Years | 2 (1.7%) | 0 (0.0%) |
| 75 Years and over | 0 (0.0%) | 0 (0.0%) |
Disability Class: Vision Difficulty
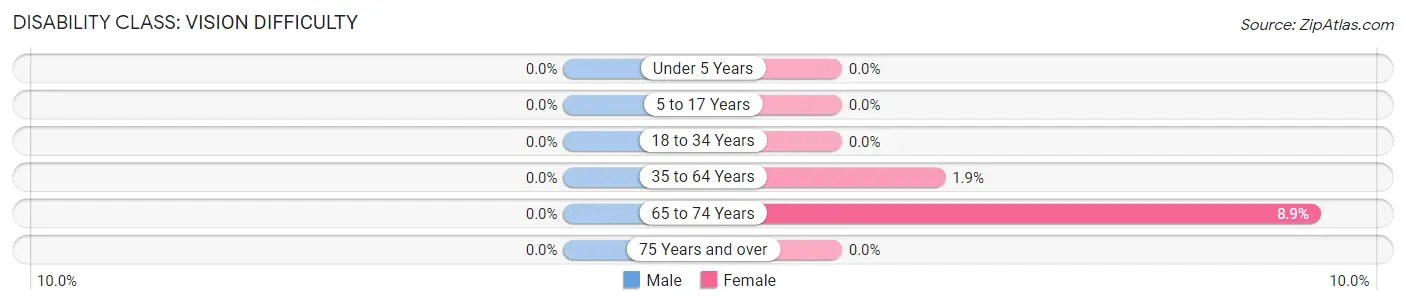
| Age Bracket | Male | Female |
| Under 5 Years | 0 (0.0%) | 0 (0.0%) |
| 5 to 17 Years | 0 (0.0%) | 0 (0.0%) |
| 18 to 34 Years | 0 (0.0%) | 0 (0.0%) |
| 35 to 64 Years | 0 (0.0%) | 5 (1.9%) |
| 65 to 74 Years | 0 (0.0%) | 8 (8.9%) |
| 75 Years and over | 0 (0.0%) | 0 (0.0%) |
Disability Class: Cognitive Difficulty
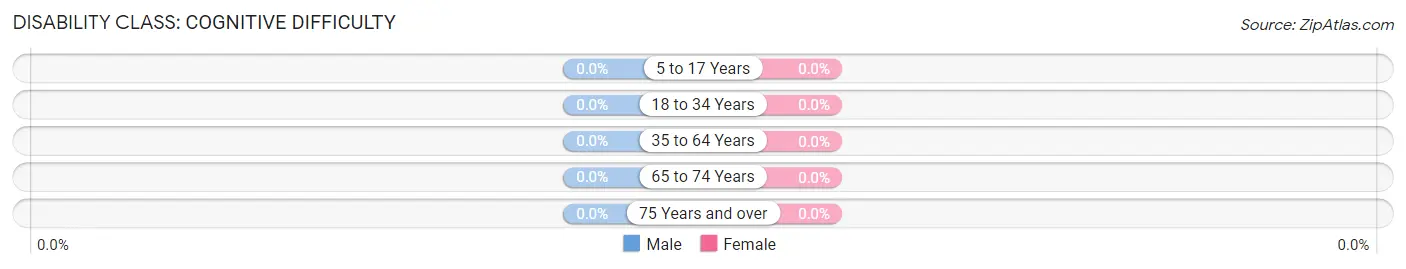
| Age Bracket | Male | Female |
| 5 to 17 Years | 0 (0.0%) | 0 (0.0%) |
| 18 to 34 Years | 0 (0.0%) | 0 (0.0%) |
| 35 to 64 Years | 0 (0.0%) | 0 (0.0%) |
| 65 to 74 Years | 0 (0.0%) | 0 (0.0%) |
| 75 Years and over | 0 (0.0%) | 0 (0.0%) |
Disability Class: Ambulatory Difficulty
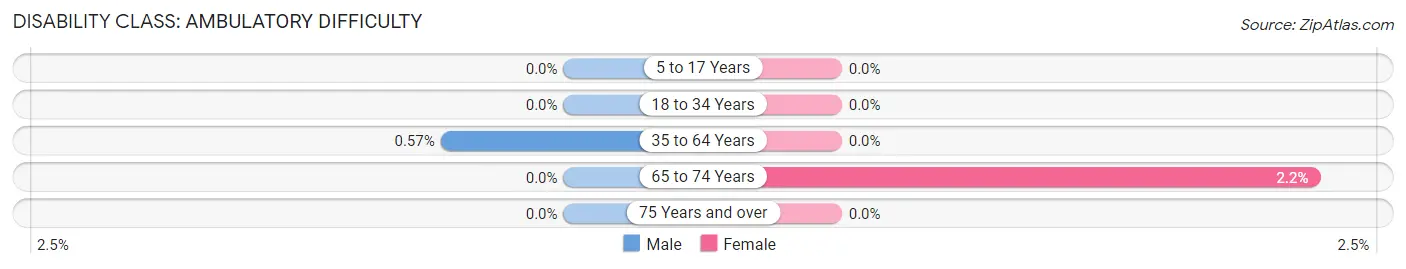
| Age Bracket | Male | Female |
| 5 to 17 Years | 0 (0.0%) | 0 (0.0%) |
| 18 to 34 Years | 0 (0.0%) | 0 (0.0%) |
| 35 to 64 Years | 2 (0.6%) | 0 (0.0%) |
| 65 to 74 Years | 0 (0.0%) | 2 (2.2%) |
| 75 Years and over | 0 (0.0%) | 0 (0.0%) |
Disability Class: Self-Care Difficulty
| Age Bracket | Male | Female |
| 5 to 17 Years | 0 (0.0%) | 0 (0.0%) |
| 18 to 34 Years | 0 (0.0%) | 0 (0.0%) |
| 35 to 64 Years | 0 (0.0%) | 0 (0.0%) |
| 65 to 74 Years | 0 (0.0%) | 0 (0.0%) |
| 75 Years and over | 0 (0.0%) | 0 (0.0%) |
Technology Access in Oakley
Computing Device Access in Oakley
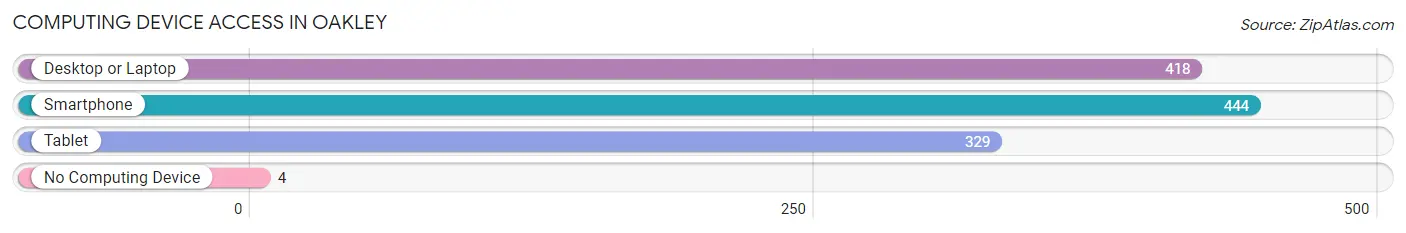
| Device Type | # Households | % Households |
| Desktop or Laptop | 418 | 91.3% |
| Smartphone | 444 | 96.9% |
| Tablet | 329 | 71.8% |
| No Computing Device | 4 | 0.9% |
| Total | 458 | 100.0% |
Internet Access in Oakley
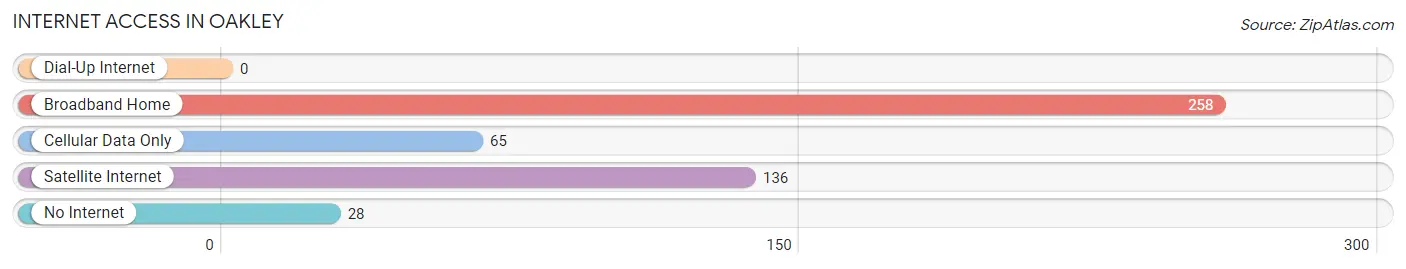
| Internet Type | # Households | % Households |
| Dial-Up Internet | 0 | 0.0% |
| Broadband Home | 258 | 56.3% |
| Cellular Data Only | 65 | 14.2% |
| Satellite Internet | 136 | 29.7% |
| No Internet | 28 | 6.1% |
| Total | 458 | 100.0% |
Oakley Summary
Oakley, Utah is a small town located in Summit County, Utah. It is situated in the Wasatch Mountains, approximately 30 miles east of Salt Lake City. The town was founded in 1876 by Mormon pioneers and is named after one of the original settlers, William Oakley. The population of Oakley was 1,521 at the 2010 census.
Geography
Oakley is located at 40°37'17" North, 111°30'17" West (40.621389, -111.504722). It is situated at an elevation of 6,000 feet (1,829 m) above sea level. The town is located in the Wasatch Mountains, and is surrounded by the Uinta National Forest. The nearest major city is Salt Lake City, which is located approximately 30 miles (48 km) to the west.
Climate
Oakley has a humid continental climate, with cold winters and warm summers. The average annual temperature is 37.2°F (2.9°C). The average annual precipitation is 17.3 inches (44 cm).
Demographics
As of the 2010 census, there were 1,521 people, 545 households, and 431 families residing in Oakley. The population density was 545.3 people per square mile (210.9/km2). The racial makeup of the town was 97.2% White, 0.2% African American, 0.2% Native American, 0.2% Asian, 0.2% Pacific Islander, 0.7% from other races, and 1.1% from two or more races. Hispanic or Latino of any race were 2.2% of the population.
Economy
Oakley's economy is largely based on tourism and recreation. The town is home to several ski resorts, including Park City Mountain Resort, Deer Valley Resort, and The Canyons. The town is also home to several restaurants, shops, and other businesses.
The town is also home to several manufacturing companies, including Oakley Manufacturing, which produces outdoor apparel and equipment. The company was founded in 1975 and is now one of the largest employers in the town.
Education
Oakley is served by the South Summit School District. The district operates two elementary schools, one middle school, and one high school. The town is also home to the Oakley Campus of Utah Valley University, which offers a variety of degree programs.
Conclusion
Oakley, Utah is a small town located in Summit County, Utah. It is situated in the Wasatch Mountains, approximately 30 miles east of Salt Lake City. The town was founded in 1876 by Mormon pioneers and is named after one of the original settlers, William Oakley. The population of Oakley was 1,521 at the 2010 census. The town's economy is largely based on tourism and recreation, and it is home to several ski resorts, restaurants, shops, and manufacturing companies. The town is served by the South Summit School District, and is also home to the Oakley Campus of Utah Valley University.
Common Questions
What is Per Capita Income in Oakley?
Per Capita income in Oakley is $53,958.
What is the Median Family Income in Oakley?
Median Family Income in Oakley is $120,000.
What is the Median Household income in Oakley?
Median Household Income in Oakley is $119,231.
What is Income or Wage Gap in Oakley?
Income or Wage Gap in Oakley is 20.2%.
Women in Oakley earn 79.8 cents for every dollar earned by a man.
What is Inequality or Gini Index in Oakley?
Inequality or Gini Index in Oakley is 0.48.
What is the Total Population of Oakley?
Total Population of Oakley is 1,744.
What is the Total Male Population of Oakley?
Total Male Population of Oakley is 964.
What is the Total Female Population of Oakley?
Total Female Population of Oakley is 780.
What is the Ratio of Males per 100 Females in Oakley?
There are 123.59 Males per 100 Females in Oakley.
What is the Ratio of Females per 100 Males in Oakley?
There are 80.91 Females per 100 Males in Oakley.
What is the Median Population Age in Oakley?
Median Population Age in Oakley is 37.2 Years.
What is the Average Family Size in Oakley
Average Family Size in Oakley is 3.9 People.
What is the Average Household Size in Oakley
Average Household Size in Oakley is 3.7 People.
How Large is the Labor Force in Oakley?
There are 905 People in the Labor Forcein in Oakley.
What is the Percentage of People in the Labor Force in Oakley?
68.8% of People are in the Labor Force in Oakley.
What is the Unemployment Rate in Oakley?
Unemployment Rate in Oakley is 4.1%.