Kanarraville, UT Map & Demographics
Kanarraville Map
Kanarraville Overview
$39,923
PER CAPITA INCOME
$129,750
AVG FAMILY INCOME
$71,250
AVG HOUSEHOLD INCOME
42.7%
WAGE / INCOME GAP [ % ]
57.3¢/ $1
WAGE / INCOME GAP [ $ ]
0.37
INEQUALITY / GINI INDEX
327
TOTAL POPULATION
159
MALE POPULATION
168
FEMALE POPULATION
94.64
MALES / 100 FEMALES
105.66
FEMALES / 100 MALES
55.6
MEDIAN AGE
2.9
AVG FAMILY SIZE
2.5
AVG HOUSEHOLD SIZE
160
LABOR FORCE [ PEOPLE ]
56.9%
PERCENT IN LABOR FORCE
Kanarraville Zip Codes
Kanarraville Area Codes
Income in Kanarraville
Income Overview in Kanarraville
Per Capita Income in Kanarraville is $39,923, while median incomes of families and households are $129,750 and $71,250 respectively.
| Characteristic | Number | Measure |
| Per Capita Income | 327 | $39,923 |
| Median Family Income | 101 | $129,750 |
| Mean Family Income | 101 | $117,322 |
| Median Household Income | 128 | $71,250 |
| Mean Household Income | 128 | $100,977 |
| Income Deficit | 101 | $0 |
| Wage / Income Gap (%) | 327 | 42.68% |
| Wage / Income Gap ($) | 327 | 57.32¢ per $1 |
| Gini / Inequality Index | 327 | 0.37 |
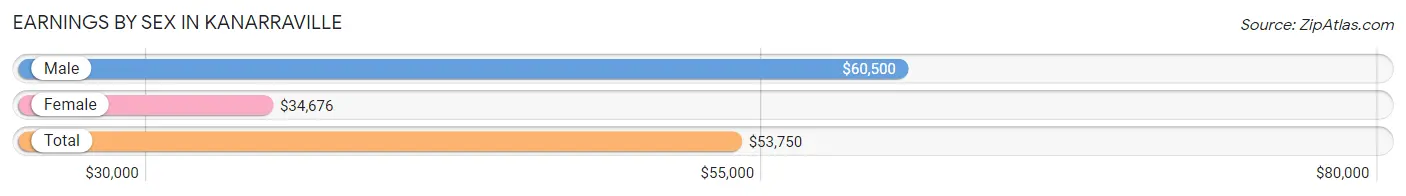
Earnings by Sex in Kanarraville
Average Earnings in Kanarraville are $53,750, $60,500 for men and $34,676 for women, a difference of 42.7%.
| Sex | Number | Average Earnings |
| Male | 82 (49.7%) | $60,500 |
| Female | 83 (50.3%) | $34,676 |
| Total | 165 (100.0%) | $53,750 |
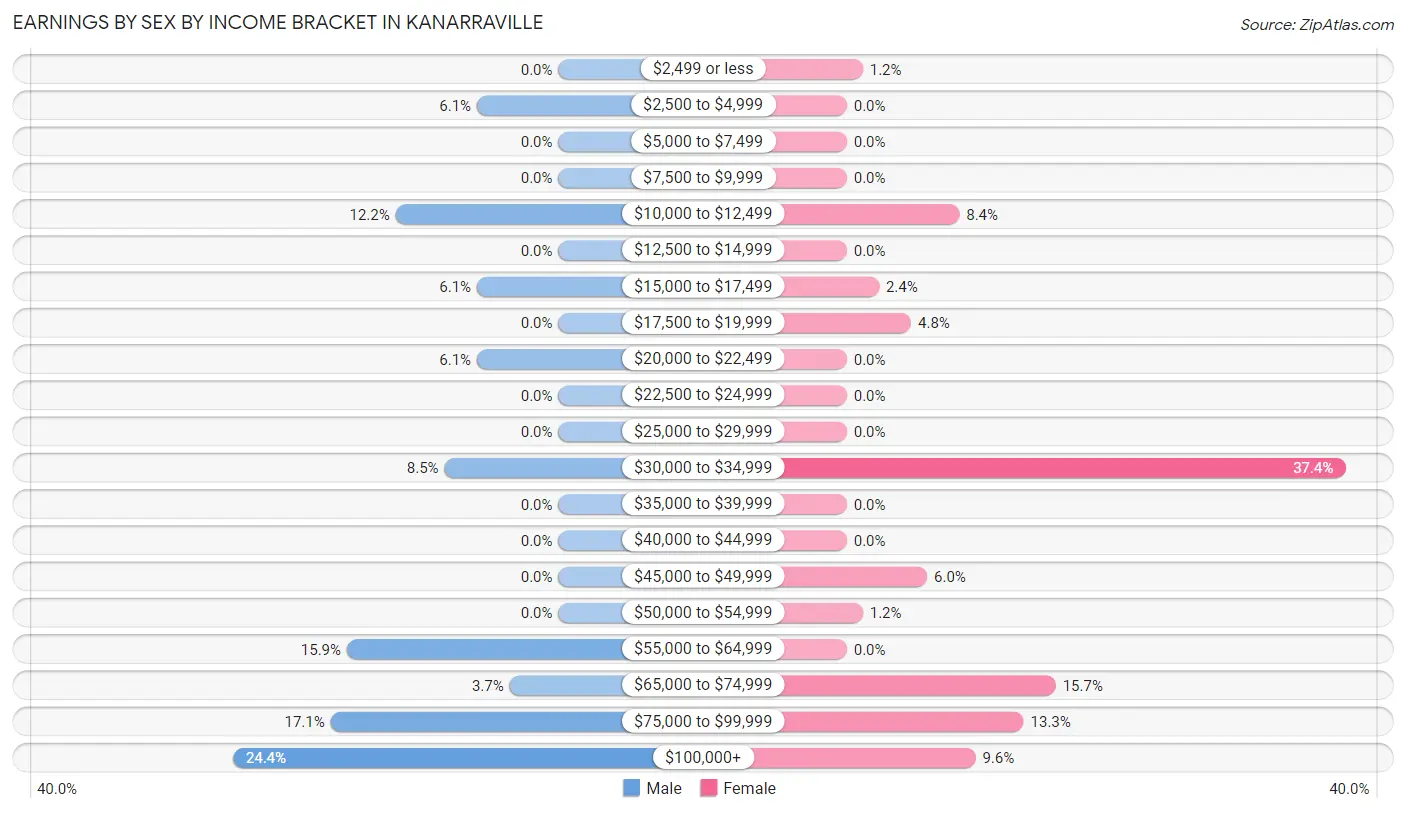
Earnings by Sex by Income Bracket in Kanarraville
The most common earnings brackets in Kanarraville are $100,000+ for men (20 | 24.4%) and $30,000 to $34,999 for women (31 | 37.3%).
| Income | Male | Female |
| $2,499 or less | 0 (0.0%) | 1 (1.2%) |
| $2,500 to $4,999 | 5 (6.1%) | 0 (0.0%) |
| $5,000 to $7,499 | 0 (0.0%) | 0 (0.0%) |
| $7,500 to $9,999 | 0 (0.0%) | 0 (0.0%) |
| $10,000 to $12,499 | 10 (12.2%) | 7 (8.4%) |
| $12,500 to $14,999 | 0 (0.0%) | 0 (0.0%) |
| $15,000 to $17,499 | 5 (6.1%) | 2 (2.4%) |
| $17,500 to $19,999 | 0 (0.0%) | 4 (4.8%) |
| $20,000 to $22,499 | 5 (6.1%) | 0 (0.0%) |
| $22,500 to $24,999 | 0 (0.0%) | 0 (0.0%) |
| $25,000 to $29,999 | 0 (0.0%) | 0 (0.0%) |
| $30,000 to $34,999 | 7 (8.5%) | 31 (37.3%) |
| $35,000 to $39,999 | 0 (0.0%) | 0 (0.0%) |
| $40,000 to $44,999 | 0 (0.0%) | 0 (0.0%) |
| $45,000 to $49,999 | 0 (0.0%) | 5 (6.0%) |
| $50,000 to $54,999 | 0 (0.0%) | 1 (1.2%) |
| $55,000 to $64,999 | 13 (15.9%) | 0 (0.0%) |
| $65,000 to $74,999 | 3 (3.7%) | 13 (15.7%) |
| $75,000 to $99,999 | 14 (17.1%) | 11 (13.3%) |
| $100,000+ | 20 (24.4%) | 8 (9.6%) |
| Total | 82 (100.0%) | 83 (100.0%) |
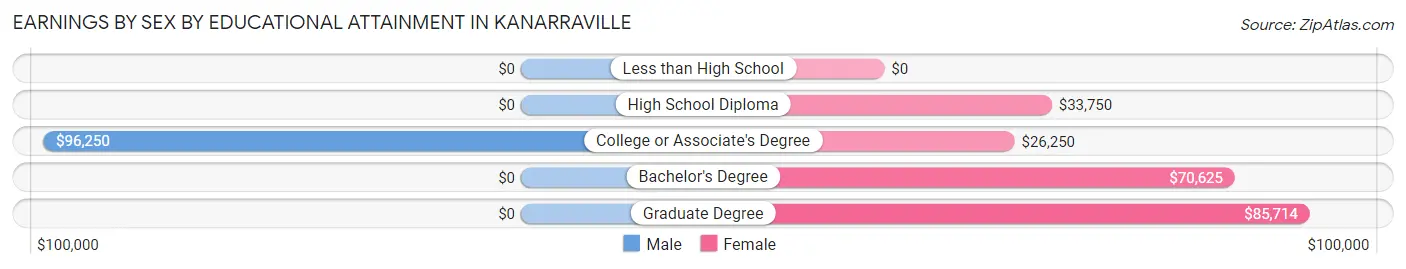
Earnings by Sex by Educational Attainment in Kanarraville
Average earnings in Kanarraville are $71,875 for men and $46,000 for women, a difference of 36.0%. Men with an educational attainment of college or associate's degree enjoy the highest average annual earnings of $96,250, while those with college or associate's degree education earn the least with $96,250. Women with an educational attainment of graduate degree earn the most with the average annual earnings of $85,714, while those with college or associate's degree education have the smallest earnings of $26,250.
| Educational Attainment | Male Income | Female Income |
| Less than High School | - | - |
| High School Diploma | - | - |
| College or Associate's Degree | $96,250 | $26,250 |
| Bachelor's Degree | - | - |
| Graduate Degree | - | - |
| Total | $71,875 | $46,000 |
Family Income in Kanarraville
Family Income Brackets in Kanarraville
According to the Kanarraville family income data, there are 29 families falling into the $150,000 to $199,999 income range, which is the most common income bracket and makes up 28.7% of all families.
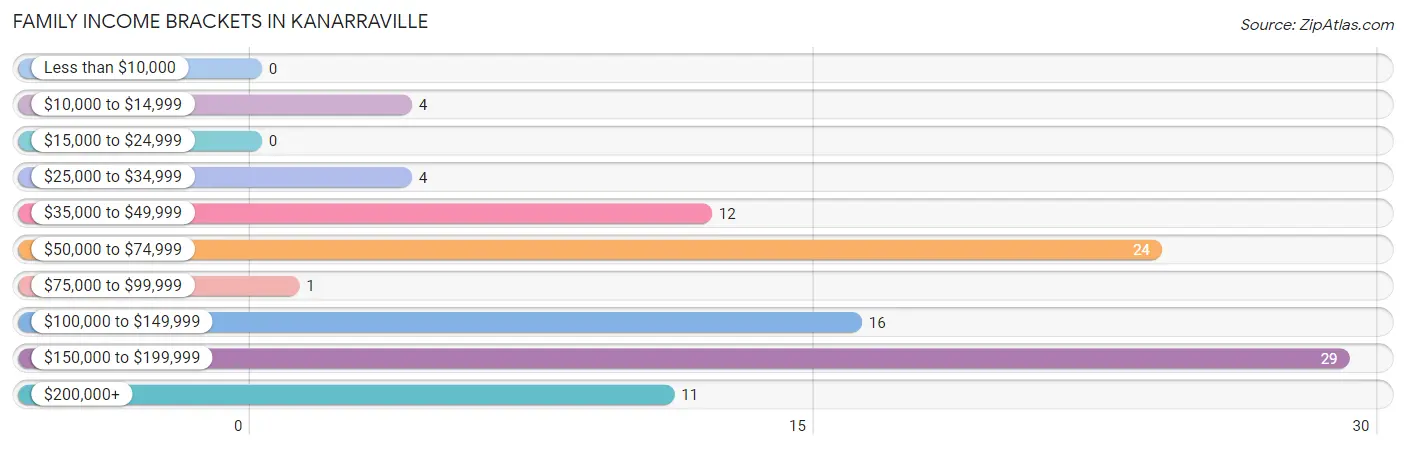
| Income Bracket | # Families | % Families |
| Less than $10,000 | 0 | 0.0% |
| $10,000 to $14,999 | 4 | 4.0% |
| $15,000 to $24,999 | 0 | 0.0% |
| $25,000 to $34,999 | 4 | 4.0% |
| $35,000 to $49,999 | 12 | 11.9% |
| $50,000 to $74,999 | 24 | 23.8% |
| $75,000 to $99,999 | 1 | 1.0% |
| $100,000 to $149,999 | 16 | 15.8% |
| $150,000 to $199,999 | 29 | 28.7% |
| $200,000+ | 11 | 10.9% |
Family Income by Famaliy Size in Kanarraville
3-person families (13 | 12.9%) account for the highest median family income in Kanarraville with $215,469 per family, while 3-person families (13 | 12.9%) have the highest median income of $71,823 per family member.
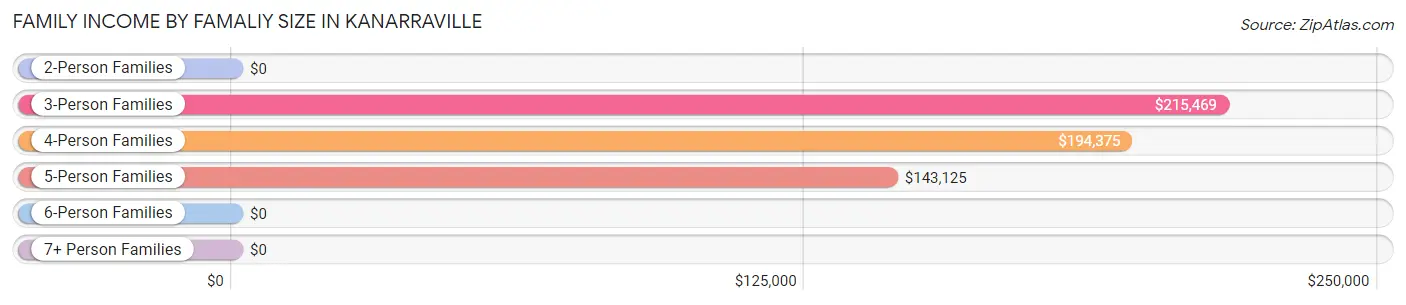
| Income Bracket | # Families | Median Income |
| 2-Person Families | 63 (62.4%) | $0 |
| 3-Person Families | 13 (12.9%) | $215,469 |
| 4-Person Families | 11 (10.9%) | $194,375 |
| 5-Person Families | 14 (13.9%) | $143,125 |
| 6-Person Families | 0 (0.0%) | $0 |
| 7+ Person Families | 0 (0.0%) | $0 |
| Total | 101 (100.0%) | $129,750 |
Family Income by Number of Earners in Kanarraville
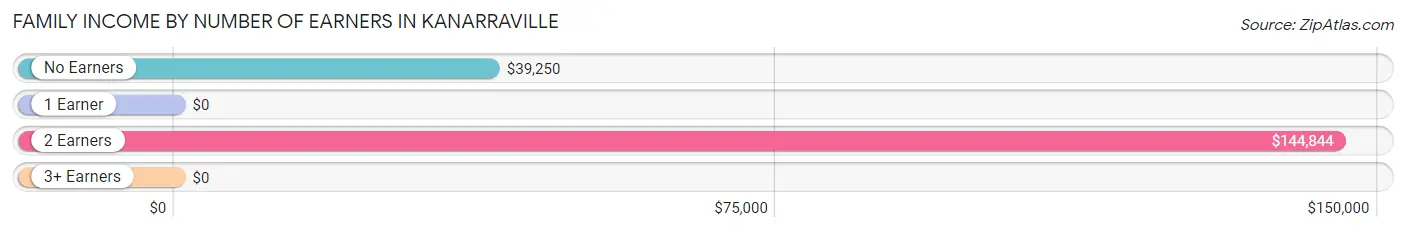
| Number of Earners | # Families | Median Income |
| No Earners | 23 (22.8%) | $39,250 |
| 1 Earner | 29 (28.7%) | $0 |
| 2 Earners | 43 (42.6%) | $144,844 |
| 3+ Earners | 6 (5.9%) | $0 |
| Total | 101 (100.0%) | $129,750 |
Household Income in Kanarraville
Household Income Brackets in Kanarraville
With 40 households falling in the category, the $50,000 to $74,999 income range is the most frequent in Kanarraville, accounting for 31.2% of all households. In contrast, only 1 households (0.8%) fall into the $75,000 to $99,999 income bracket, making it the least populous group.
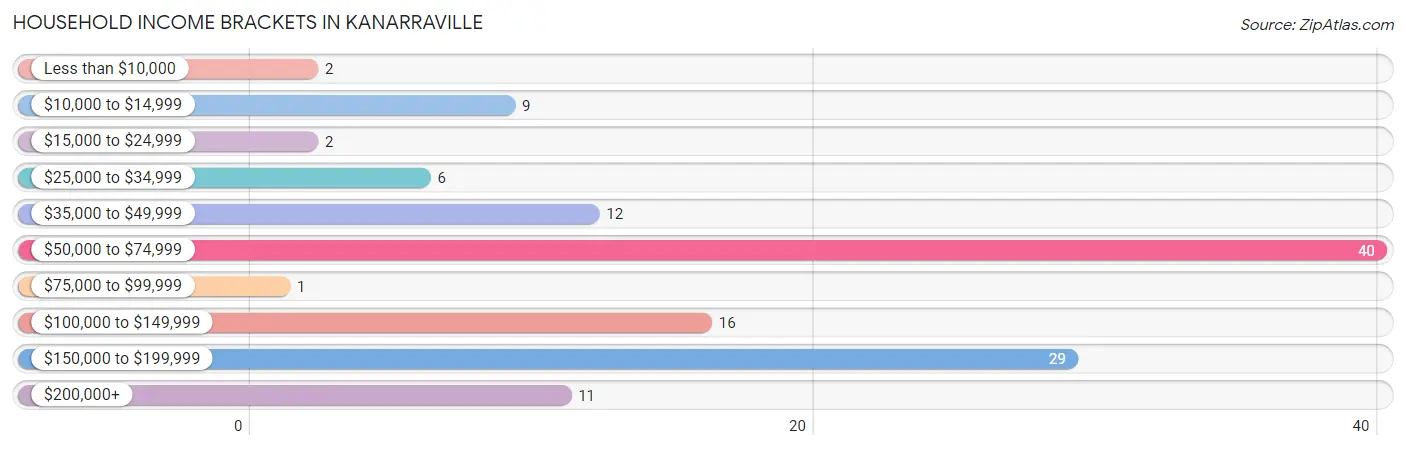
| Income Bracket | # Households | % Households |
| Less than $10,000 | 2 | 1.6% |
| $10,000 to $14,999 | 9 | 7.0% |
| $15,000 to $24,999 | 2 | 1.6% |
| $25,000 to $34,999 | 6 | 4.7% |
| $35,000 to $49,999 | 12 | 9.4% |
| $50,000 to $74,999 | 40 | 31.3% |
| $75,000 to $99,999 | 1 | 0.8% |
| $100,000 to $149,999 | 16 | 12.5% |
| $150,000 to $199,999 | 29 | 22.7% |
| $200,000+ | 11 | 8.6% |
Household Income by Householder Age in Kanarraville
The median household income in Kanarraville is $71,250, with the highest median household income of $153,250 found in the 25 to 44 years age bracket for the primary householder. A total of 17 households (13.3%) fall into this category. Meanwhile, the 15 to 24 years age bracket for the primary householder has the lowest median household income of $0, with 5 households (3.9%) in this group.
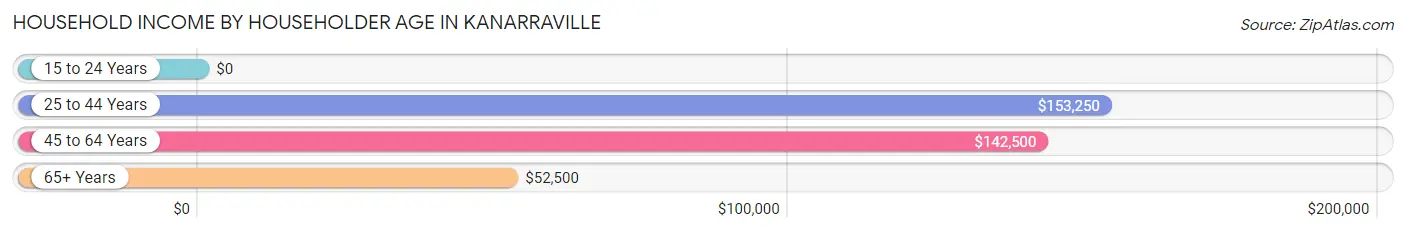
| Income Bracket | # Households | Median Income |
| 15 to 24 Years | 5 (3.9%) | $0 |
| 25 to 44 Years | 17 (13.3%) | $153,250 |
| 45 to 64 Years | 32 (25.0%) | $142,500 |
| 65+ Years | 74 (57.8%) | $52,500 |
| Total | 128 (100.0%) | $71,250 |
Poverty in Kanarraville
Income Below Poverty by Sex and Age in Kanarraville
With 6.3% poverty level for males and 4.8% for females among the residents of Kanarraville, 75 year old and over males and 75 year old and over females are the most vulnerable to poverty, with 8 males (18.2%) and 6 females (60.0%) in their respective age groups living below the poverty level.
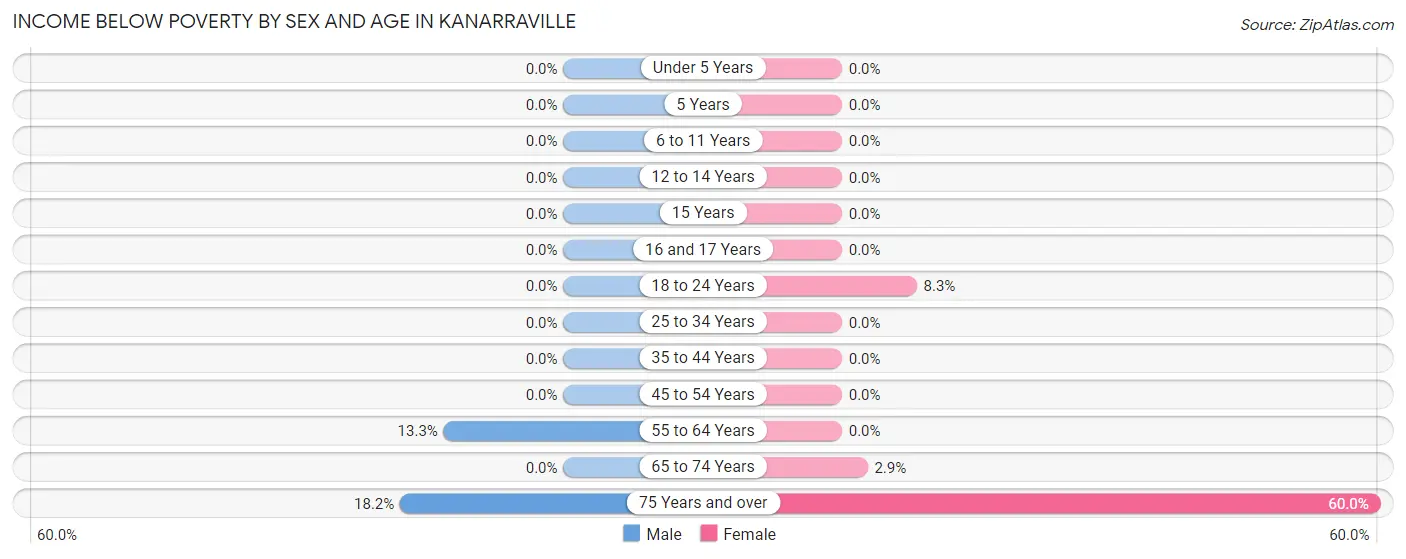
| Age Bracket | Male | Female |
| Under 5 Years | 0 (0.0%) | 0 (0.0%) |
| 5 Years | 0 (0.0%) | 0 (0.0%) |
| 6 to 11 Years | 0 (0.0%) | 0 (0.0%) |
| 12 to 14 Years | 0 (0.0%) | 0 (0.0%) |
| 15 Years | 0 (0.0%) | 0 (0.0%) |
| 16 and 17 Years | 0 (0.0%) | 0 (0.0%) |
| 18 to 24 Years | 0 (0.0%) | 1 (8.3%) |
| 25 to 34 Years | 0 (0.0%) | 0 (0.0%) |
| 35 to 44 Years | 0 (0.0%) | 0 (0.0%) |
| 45 to 54 Years | 0 (0.0%) | 0 (0.0%) |
| 55 to 64 Years | 2 (13.3%) | 0 (0.0%) |
| 65 to 74 Years | 0 (0.0%) | 1 (2.9%) |
| 75 Years and over | 8 (18.2%) | 6 (60.0%) |
| Total | 10 (6.3%) | 8 (4.8%) |
Income Above Poverty by Sex and Age in Kanarraville
According to the poverty statistics in Kanarraville, males aged under 5 years and females aged 6 to 11 years are the age groups that are most secure financially, with 100.0% of males and 100.0% of females in these age groups living above the poverty line.
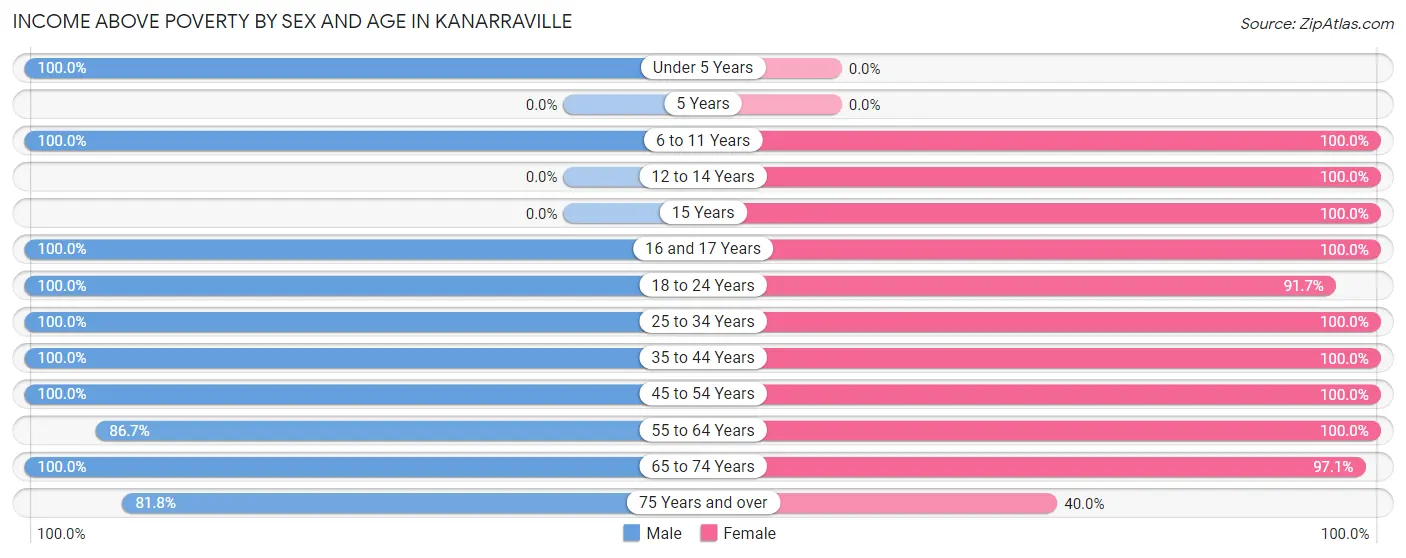
| Age Bracket | Male | Female |
| Under 5 Years | 1 (100.0%) | 0 (0.0%) |
| 5 Years | 0 (0.0%) | 0 (0.0%) |
| 6 to 11 Years | 21 (100.0%) | 1 (100.0%) |
| 12 to 14 Years | 0 (0.0%) | 8 (100.0%) |
| 15 Years | 0 (0.0%) | 14 (100.0%) |
| 16 and 17 Years | 5 (100.0%) | 9 (100.0%) |
| 18 to 24 Years | 8 (100.0%) | 11 (91.7%) |
| 25 to 34 Years | 6 (100.0%) | 1 (100.0%) |
| 35 to 44 Years | 19 (100.0%) | 24 (100.0%) |
| 45 to 54 Years | 12 (100.0%) | 18 (100.0%) |
| 55 to 64 Years | 13 (86.7%) | 35 (100.0%) |
| 65 to 74 Years | 28 (100.0%) | 34 (97.1%) |
| 75 Years and over | 36 (81.8%) | 4 (40.0%) |
| Total | 149 (93.7%) | 159 (95.2%) |
Income Below Poverty Among Married-Couple Families in Kanarraville
The poverty statistics for married-couple families in Kanarraville show that 4.2% or 4 of the total 96 families live below the poverty line. Families with no children have the highest poverty rate of 5.6%, comprising of 4 families. On the other hand, families with 1 or 2 children have the lowest poverty rate of 0.0%, which includes 0 families.
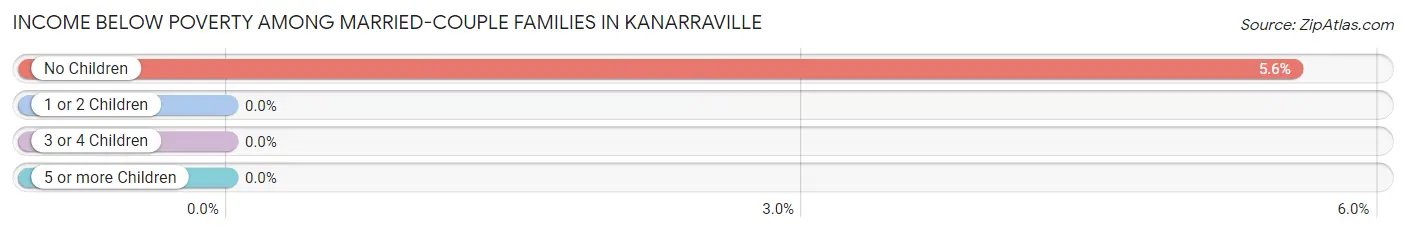
| Children | Above Poverty | Below Poverty |
| No Children | 68 (94.4%) | 4 (5.6%) |
| 1 or 2 Children | 10 (100.0%) | 0 (0.0%) |
| 3 or 4 Children | 14 (100.0%) | 0 (0.0%) |
| 5 or more Children | 0 (0.0%) | 0 (0.0%) |
| Total | 92 (95.8%) | 4 (4.2%) |
Income Below Poverty Among Single-Parent Households in Kanarraville
| Children | Single Father | Single Mother |
| No Children | 0 (0.0%) | 0 (0.0%) |
| 1 or 2 Children | 0 (0.0%) | 0 (0.0%) |
| 3 or 4 Children | 0 (0.0%) | 0 (0.0%) |
| 5 or more Children | 0 (0.0%) | 0 (0.0%) |
| Total | 0 (0.0%) | 0 (0.0%) |
Income Below Poverty Among Married-Couple vs Single-Parent Households in Kanarraville
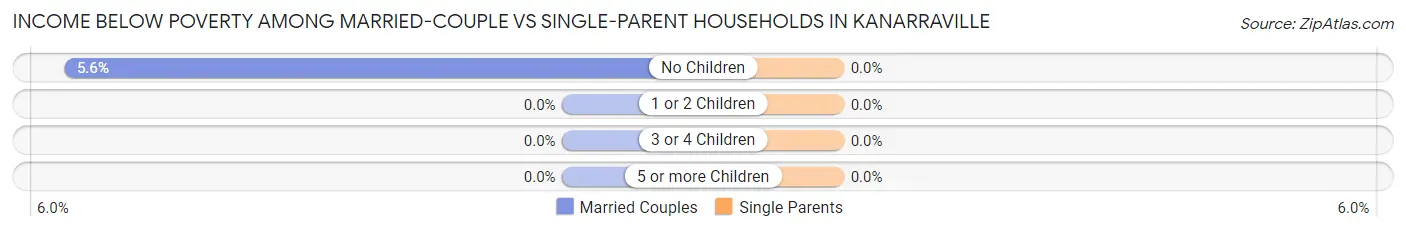
| Children | Married-Couple Families | Single-Parent Households |
| No Children | 4 (5.6%) | 0 (0.0%) |
| 1 or 2 Children | 0 (0.0%) | 0 (0.0%) |
| 3 or 4 Children | 0 (0.0%) | 0 (0.0%) |
| 5 or more Children | 0 (0.0%) | 0 (0.0%) |
| Total | 4 (4.2%) | 0 (0.0%) |
Race in Kanarraville
The most populous races in Kanarraville are White / Caucasian (304 | 93.0%), Two or more Races (17 | 5.2%), and Asian (6 | 1.8%).
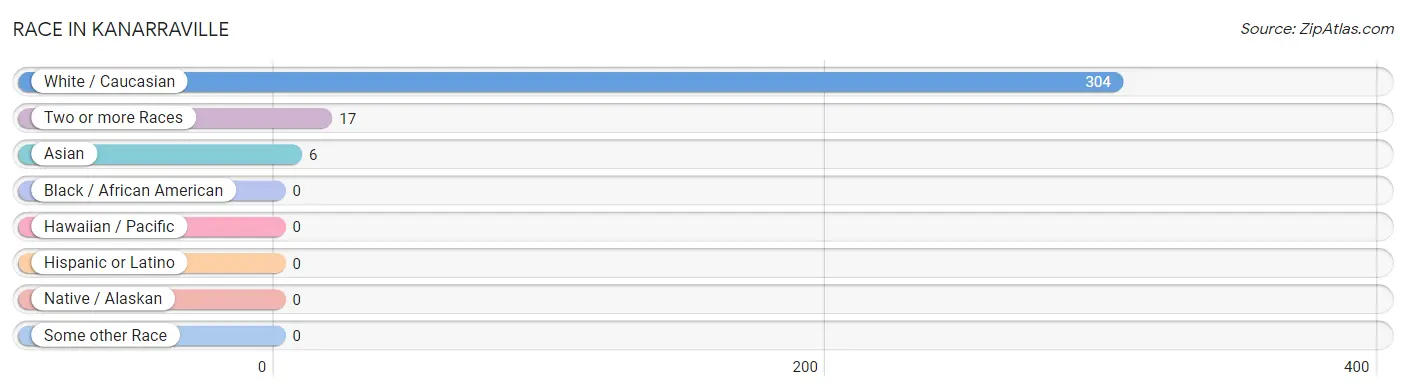
| Race | # Population | % Population |
| Asian | 6 | 1.8% |
| Black / African American | 0 | 0.0% |
| Hawaiian / Pacific | 0 | 0.0% |
| Hispanic or Latino | 0 | 0.0% |
| Native / Alaskan | 0 | 0.0% |
| White / Caucasian | 304 | 93.0% |
| Two or more Races | 17 | 5.2% |
| Some other Race | 0 | 0.0% |
| Total | 327 | 100.0% |
Ancestry in Kanarraville
The most populous ancestries reported in Kanarraville are European (91 | 27.8%), English (61 | 18.6%), American (29 | 8.9%), German (24 | 7.3%), and Irish (22 | 6.7%), together accounting for 69.4% of all Kanarraville residents.
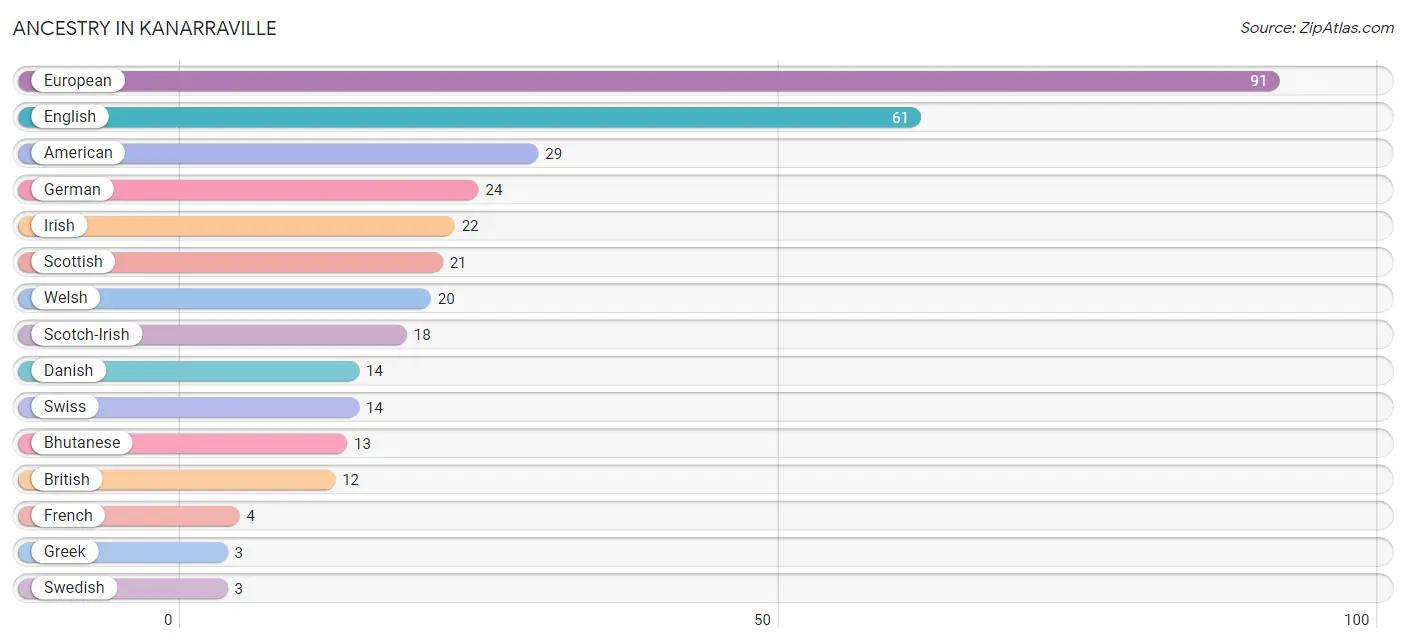
| Ancestry | # Population | % Population |
| American | 29 | 8.9% |
| Bhutanese | 13 | 4.0% |
| British | 12 | 3.7% |
| Danish | 14 | 4.3% |
| English | 61 | 18.6% |
| European | 91 | 27.8% |
| French | 4 | 1.2% |
| German | 24 | 7.3% |
| Greek | 3 | 0.9% |
| Hungarian | 2 | 0.6% |
| Irish | 22 | 6.7% |
| Norwegian | 1 | 0.3% |
| Polish | 2 | 0.6% |
| Scotch-Irish | 18 | 5.5% |
| Scottish | 21 | 6.4% |
| Swedish | 3 | 0.9% |
| Swiss | 14 | 4.3% |
| Welsh | 20 | 6.1% | View All 18 Rows |
Immigrants in Kanarraville
The most numerous immigrant groups reported in Kanarraville came from , and Canada (2 | 0.6%), together accounting for 0.6% of all Kanarraville residents.

| Immigration Origin | # Population | % Population |
| Canada | 2 | 0.6% | View All 1 Rows |
Sex and Age in Kanarraville
Sex and Age in Kanarraville
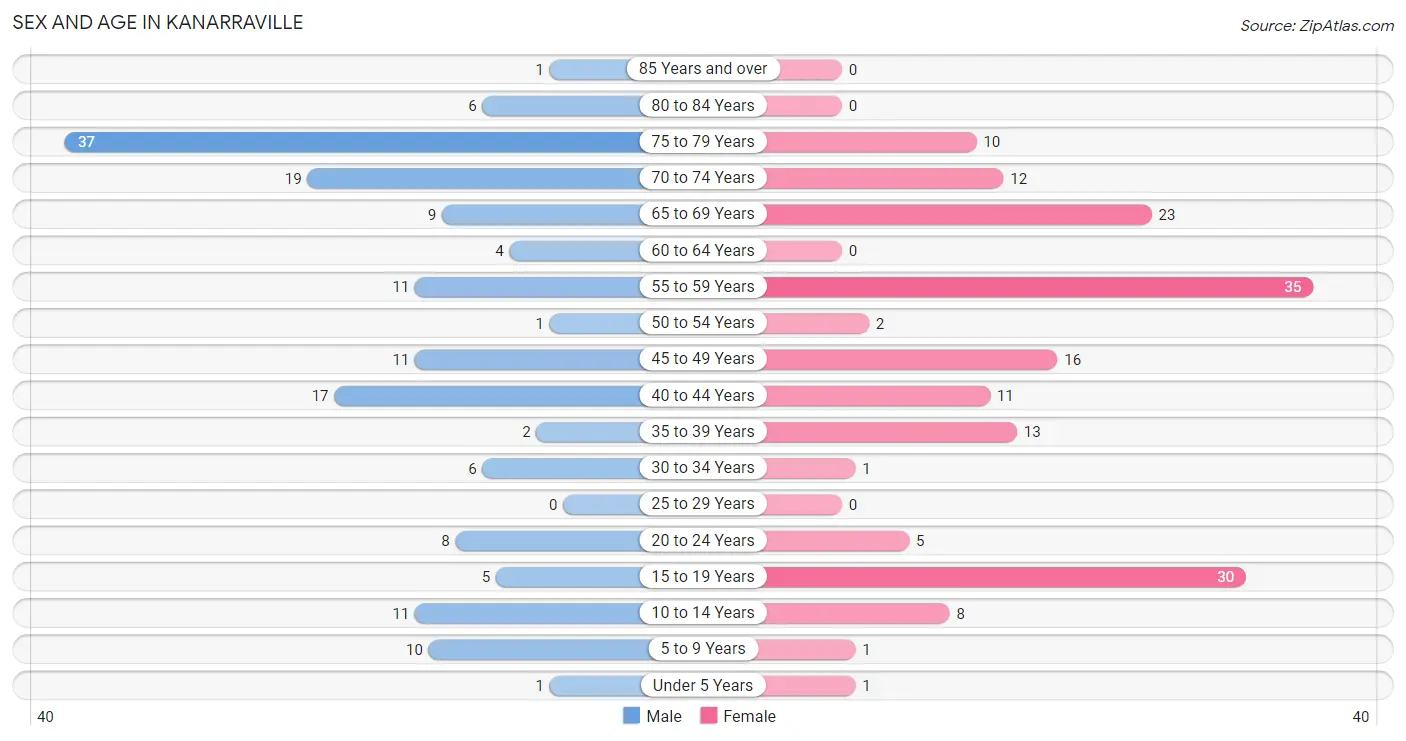
The most populous age groups in Kanarraville are 75 to 79 Years (37 | 23.3%) for men and 55 to 59 Years (35 | 20.8%) for women.
| Age Bracket | Male | Female |
| Under 5 Years | 1 (0.6%) | 1 (0.6%) |
| 5 to 9 Years | 10 (6.3%) | 1 (0.6%) |
| 10 to 14 Years | 11 (6.9%) | 8 (4.8%) |
| 15 to 19 Years | 5 (3.1%) | 30 (17.9%) |
| 20 to 24 Years | 8 (5.0%) | 5 (3.0%) |
| 25 to 29 Years | 0 (0.0%) | 0 (0.0%) |
| 30 to 34 Years | 6 (3.8%) | 1 (0.6%) |
| 35 to 39 Years | 2 (1.3%) | 13 (7.7%) |
| 40 to 44 Years | 17 (10.7%) | 11 (6.6%) |
| 45 to 49 Years | 11 (6.9%) | 16 (9.5%) |
| 50 to 54 Years | 1 (0.6%) | 2 (1.2%) |
| 55 to 59 Years | 11 (6.9%) | 35 (20.8%) |
| 60 to 64 Years | 4 (2.5%) | 0 (0.0%) |
| 65 to 69 Years | 9 (5.7%) | 23 (13.7%) |
| 70 to 74 Years | 19 (11.9%) | 12 (7.1%) |
| 75 to 79 Years | 37 (23.3%) | 10 (5.9%) |
| 80 to 84 Years | 6 (3.8%) | 0 (0.0%) |
| 85 Years and over | 1 (0.6%) | 0 (0.0%) |
| Total | 159 (100.0%) | 168 (100.0%) |
Families and Households in Kanarraville
Median Family Size in Kanarraville
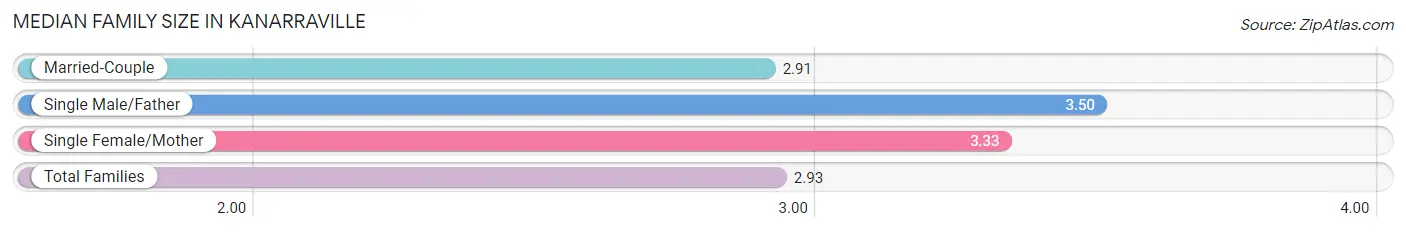
The median family size in Kanarraville is 2.93 persons per family, with single male/father families (2 | 2.0%) accounting for the largest median family size of 3.5 persons per family. On the other hand, married-couple families (96 | 95.1%) represent the smallest median family size with 2.91 persons per family.
| Family Type | # Families | Family Size |
| Married-Couple | 96 (95.1%) | 2.91 |
| Single Male/Father | 2 (2.0%) | 3.50 |
| Single Female/Mother | 3 (3.0%) | 3.33 |
| Total Families | 101 (100.0%) | 2.93 |
Median Household Size in Kanarraville
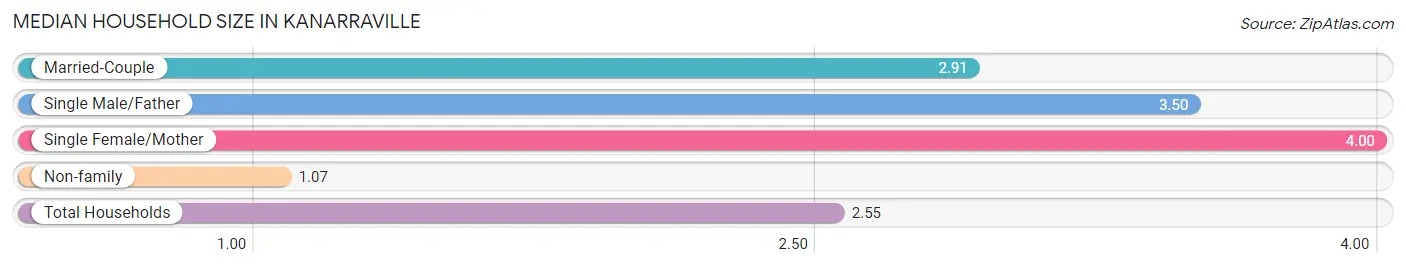
The median household size in Kanarraville is 2.55 persons per household, with single female/mother households (3 | 2.3%) accounting for the largest median household size of 4 persons per household. non-family households (27 | 21.1%) represent the smallest median household size with 1.07 persons per household.
| Household Type | # Households | Household Size |
| Married-Couple | 96 (75.0%) | 2.91 |
| Single Male/Father | 2 (1.6%) | 3.50 |
| Single Female/Mother | 3 (2.3%) | 4.00 |
| Non-family | 27 (21.1%) | 1.07 |
| Total Households | 128 (100.0%) | 2.55 |
Household Size by Marriage Status in Kanarraville
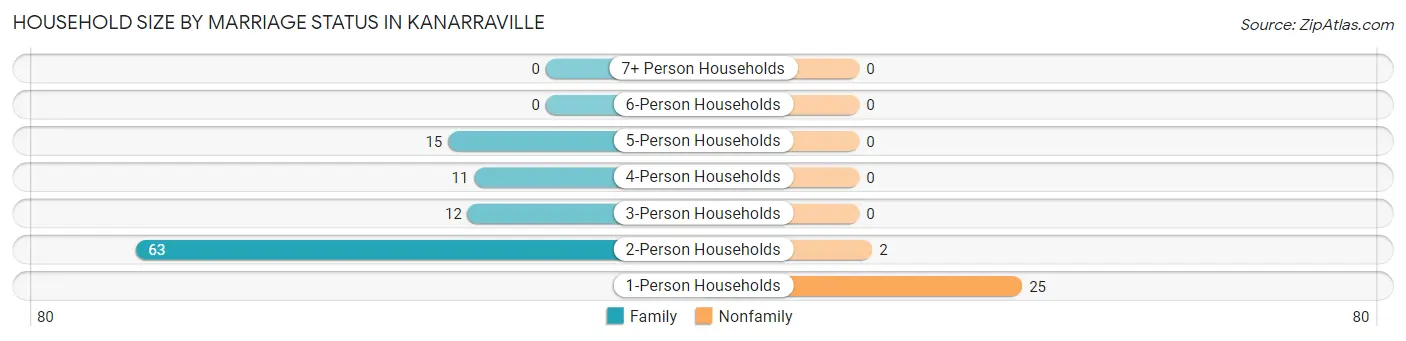
Out of a total of 128 households in Kanarraville, 101 (78.9%) are family households, while 27 (21.1%) are nonfamily households. The most numerous type of family households are 2-person households, comprising 63, and the most common type of nonfamily households are 1-person households, comprising 25.
| Household Size | Family Households | Nonfamily Households |
| 1-Person Households | - | 25 (19.5%) |
| 2-Person Households | 63 (49.2%) | 2 (1.6%) |
| 3-Person Households | 12 (9.4%) | 0 (0.0%) |
| 4-Person Households | 11 (8.6%) | 0 (0.0%) |
| 5-Person Households | 15 (11.7%) | 0 (0.0%) |
| 6-Person Households | 0 (0.0%) | 0 (0.0%) |
| 7+ Person Households | 0 (0.0%) | 0 (0.0%) |
| Total | 101 (78.9%) | 27 (21.1%) |
Female Fertility in Kanarraville
Fertility by Age in Kanarraville
| Age Bracket | Women with Births | Births / 1,000 Women |
| 15 to 19 years | 0 (0.0%) | 0.0 |
| 20 to 34 years | 0 (0.0%) | 0.0 |
| 35 to 50 years | 0 (0.0%) | 0.0 |
| Total | 0 (0.0%) | 0.0 |
Fertility by Age by Marriage Status in Kanarraville
| Age Bracket | Married | Unmarried |
| 15 to 19 years | 0 (0.0%) | 0 (0.0%) |
| 20 to 34 years | 0 (0.0%) | 0 (0.0%) |
| 35 to 50 years | 0 (0.0%) | 0 (0.0%) |
| Total | 0 (0.0%) | 0 (0.0%) |
Fertility by Education in Kanarraville
| Educational Attainment | Women with Births | Births / 1,000 Women |
| Less than High School | 0 (0.0%) | 0.0 |
| High School Diploma | 0 (0.0%) | 0.0 |
| College or Associate's Degree | 0 (0.0%) | 0.0 |
| Bachelor's Degree | 0 (0.0%) | 0.0 |
| Graduate Degree | 0 (0.0%) | 0.0 |
| Total | 0 (0.0%) | 0.0 |
Fertility by Education by Marriage Status in Kanarraville
| Educational Attainment | Married | Unmarried |
| Less than High School | 0 (0.0%) | 0 (0.0%) |
| High School Diploma | 0 (0.0%) | 0 (0.0%) |
| College or Associate's Degree | 0 (0.0%) | 0 (0.0%) |
| Bachelor's Degree | 0 (0.0%) | 0 (0.0%) |
| Graduate Degree | 0 (0.0%) | 0 (0.0%) |
| Total | 0 (0.0%) | 0 (0.0%) |
Employment Characteristics in Kanarraville
Employment by Class of Employer in Kanarraville
Among the 160 employed individuals in Kanarraville, private company employees (76 | 47.5%), self-employed (incorporated) (35 | 21.9%), and local government employees (21 | 13.1%) make up the most common classes of employment.
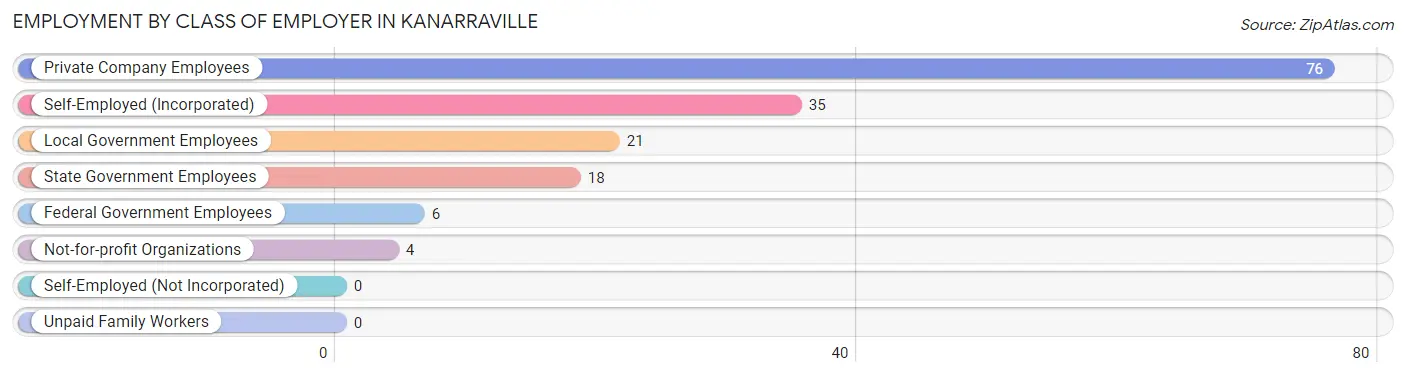
| Employer Class | # Employees | % Employees |
| Private Company Employees | 76 | 47.5% |
| Self-Employed (Incorporated) | 35 | 21.9% |
| Self-Employed (Not Incorporated) | 0 | 0.0% |
| Not-for-profit Organizations | 4 | 2.5% |
| Local Government Employees | 21 | 13.1% |
| State Government Employees | 18 | 11.3% |
| Federal Government Employees | 6 | 3.7% |
| Unpaid Family Workers | 0 | 0.0% |
| Total | 160 | 100.0% |
Employment Status by Age in Kanarraville
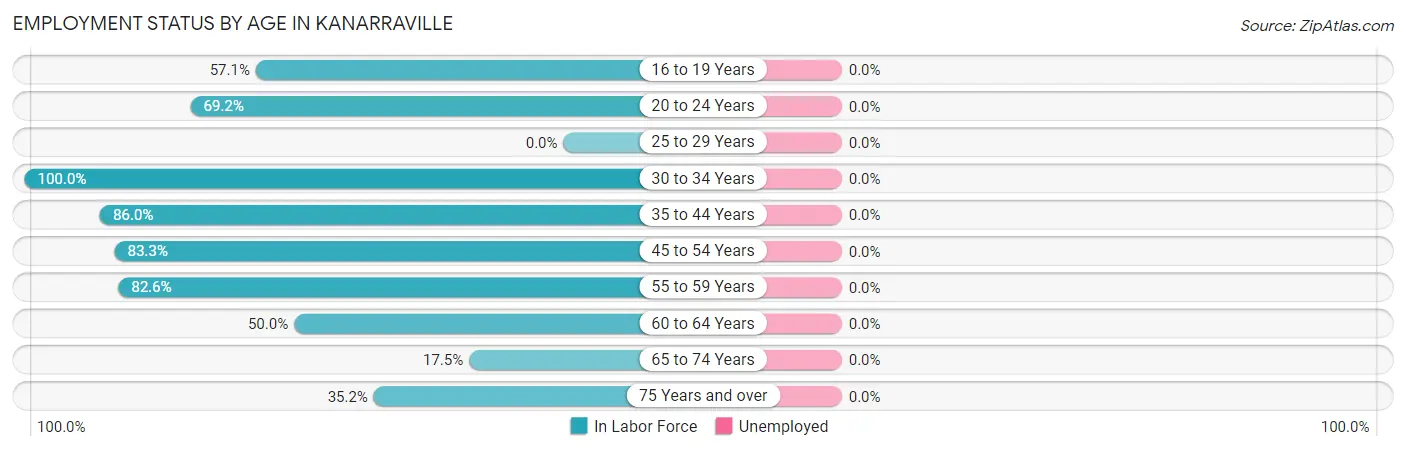
| Age Bracket | In Labor Force | Unemployed |
| 16 to 19 Years | 12 (57.1%) | 0 (0.0%) |
| 20 to 24 Years | 9 (69.2%) | 0 (0.0%) |
| 25 to 29 Years | 0 (0.0%) | 0 (0.0%) |
| 30 to 34 Years | 7 (100.0%) | 0 (0.0%) |
| 35 to 44 Years | 37 (86.0%) | 0 (0.0%) |
| 45 to 54 Years | 25 (83.3%) | 0 (0.0%) |
| 55 to 59 Years | 38 (82.6%) | 0 (0.0%) |
| 60 to 64 Years | 2 (50.0%) | 0 (0.0%) |
| 65 to 74 Years | 11 (17.5%) | 0 (0.0%) |
| 75 Years and over | 19 (35.2%) | 0 (0.0%) |
| Total | 160 (56.9%) | 0 (0.0%) |
Employment Status by Educational Attainment in Kanarraville
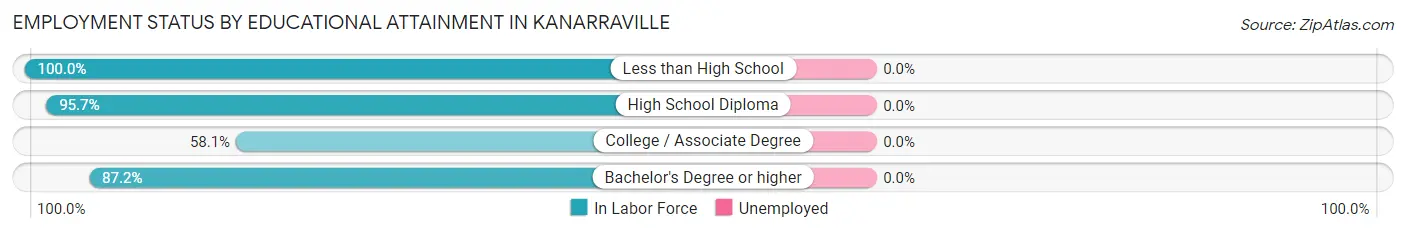
| Educational Attainment | In Labor Force | Unemployed |
| Less than High School | 5 (100.0%) | 0 (0.0%) |
| High School Diploma | 45 (95.7%) | 0 (0.0%) |
| College / Associate Degree | 18 (58.1%) | 0 (0.0%) |
| Bachelor's Degree or higher | 41 (87.2%) | 0 (0.0%) |
| Total | 109 (83.8%) | 0 (0.0%) |
Employment Occupations by Sex in Kanarraville
Management, Business, Science and Arts Occupations
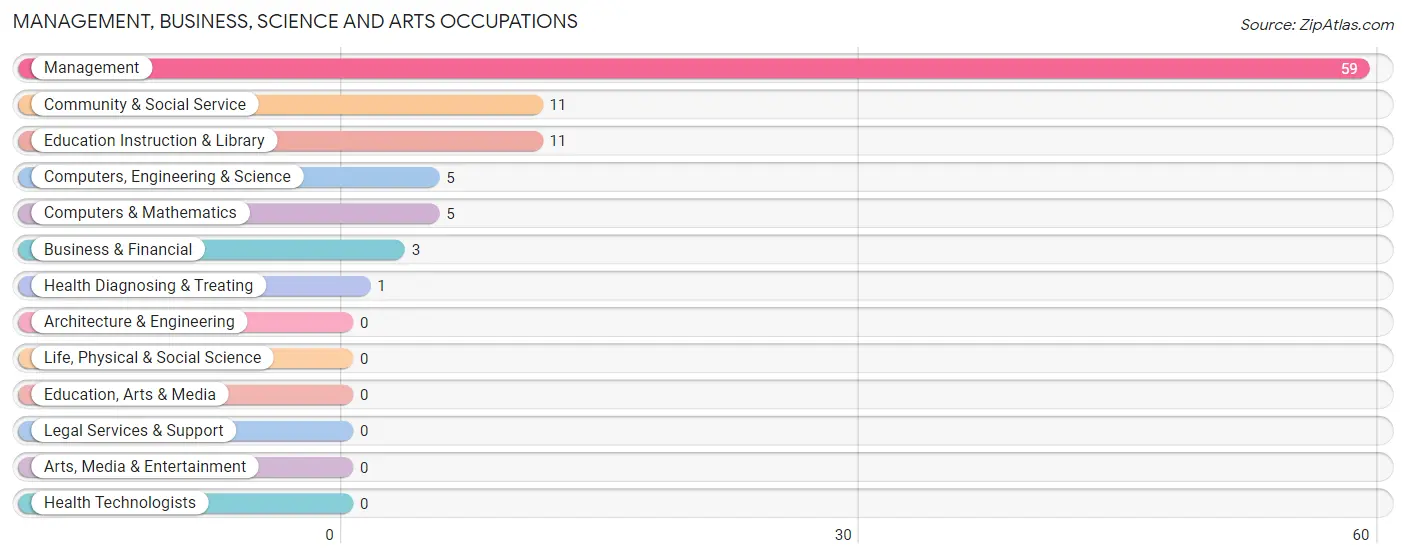
The most common Management, Business, Science and Arts occupations in Kanarraville are Management (59 | 36.9%), Community & Social Service (11 | 6.9%), Education Instruction & Library (11 | 6.9%), Computers, Engineering & Science (5 | 3.1%), and Computers & Mathematics (5 | 3.1%).
Management, Business, Science and Arts Occupations by Sex
Within the Management, Business, Science and Arts occupations in Kanarraville, the most male-oriented occupations are Business & Financial (100.0%), Computers, Engineering & Science (100.0%), and Computers & Mathematics (100.0%), while the most female-oriented occupations are Health Diagnosing & Treating (100.0%), Community & Social Service (81.8%), and Education Instruction & Library (81.8%).
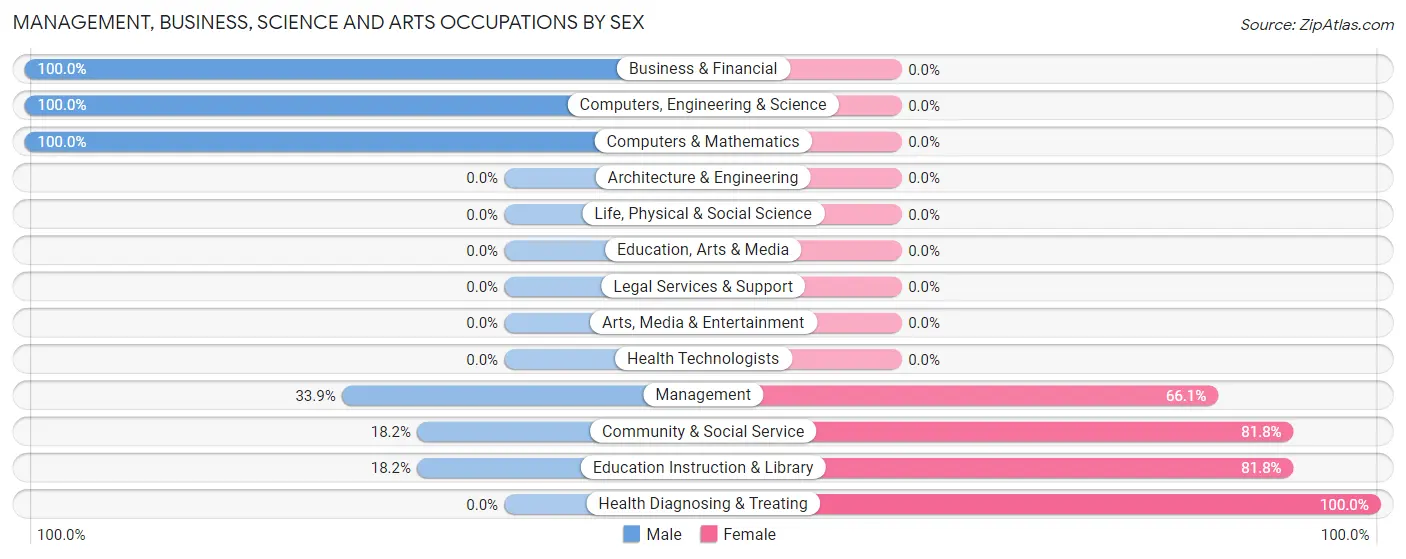
| Occupation | Male | Female |
| Management | 20 (33.9%) | 39 (66.1%) |
| Business & Financial | 3 (100.0%) | 0 (0.0%) |
| Computers, Engineering & Science | 5 (100.0%) | 0 (0.0%) |
| Computers & Mathematics | 5 (100.0%) | 0 (0.0%) |
| Architecture & Engineering | 0 (0.0%) | 0 (0.0%) |
| Life, Physical & Social Science | 0 (0.0%) | 0 (0.0%) |
| Community & Social Service | 2 (18.2%) | 9 (81.8%) |
| Education, Arts & Media | 0 (0.0%) | 0 (0.0%) |
| Legal Services & Support | 0 (0.0%) | 0 (0.0%) |
| Education Instruction & Library | 2 (18.2%) | 9 (81.8%) |
| Arts, Media & Entertainment | 0 (0.0%) | 0 (0.0%) |
| Health Diagnosing & Treating | 0 (0.0%) | 1 (100.0%) |
| Health Technologists | 0 (0.0%) | 0 (0.0%) |
| Total (Category) | 30 (38.0%) | 49 (62.0%) |
| Total (Overall) | 77 (48.1%) | 83 (51.9%) |
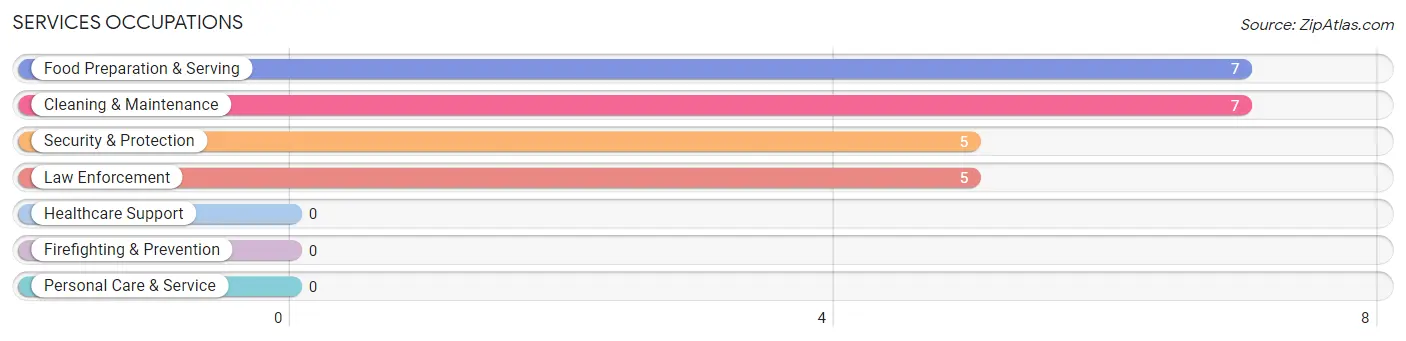
Services Occupations
The most common Services occupations in Kanarraville are Food Preparation & Serving (7 | 4.4%), Cleaning & Maintenance (7 | 4.4%), Security & Protection (5 | 3.1%), and Law Enforcement (5 | 3.1%).
Services Occupations by Sex
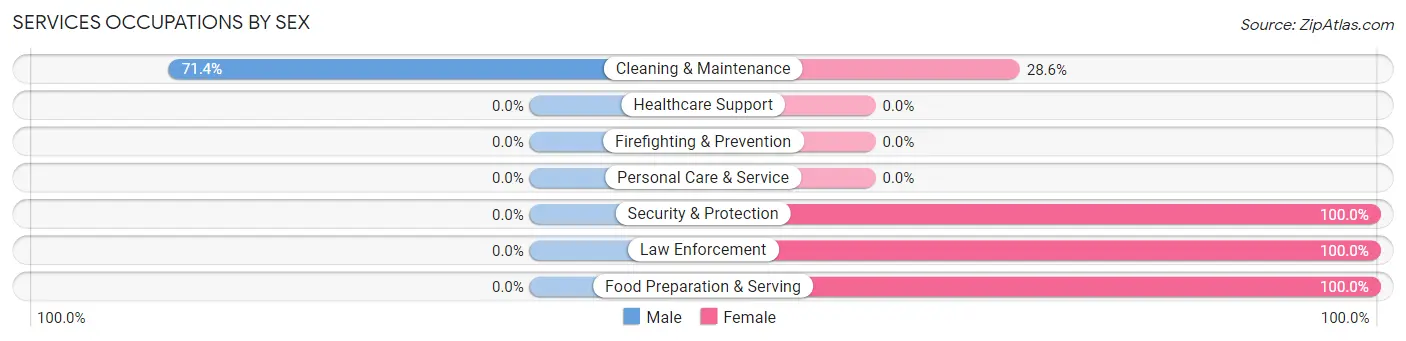
| Occupation | Male | Female |
| Healthcare Support | 0 (0.0%) | 0 (0.0%) |
| Security & Protection | 0 (0.0%) | 5 (100.0%) |
| Firefighting & Prevention | 0 (0.0%) | 0 (0.0%) |
| Law Enforcement | 0 (0.0%) | 5 (100.0%) |
| Food Preparation & Serving | 0 (0.0%) | 7 (100.0%) |
| Cleaning & Maintenance | 5 (71.4%) | 2 (28.6%) |
| Personal Care & Service | 0 (0.0%) | 0 (0.0%) |
| Total (Category) | 5 (26.3%) | 14 (73.7%) |
| Total (Overall) | 77 (48.1%) | 83 (51.9%) |
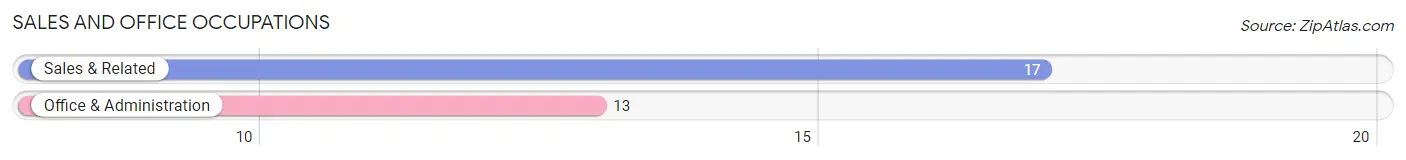
Sales and Office Occupations
The most common Sales and Office occupations in Kanarraville are Sales & Related (17 | 10.6%), and Office & Administration (13 | 8.1%).
Sales and Office Occupations by Sex
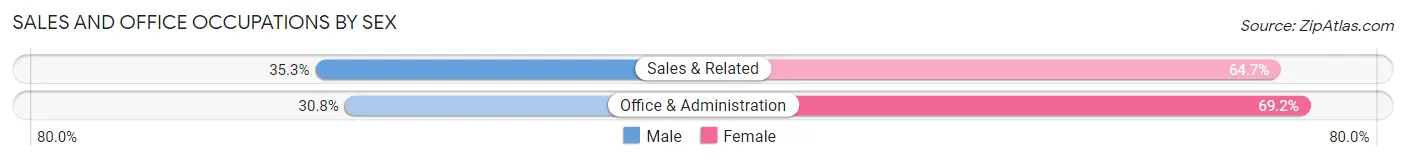
| Occupation | Male | Female |
| Sales & Related | 6 (35.3%) | 11 (64.7%) |
| Office & Administration | 4 (30.8%) | 9 (69.2%) |
| Total (Category) | 10 (33.3%) | 20 (66.7%) |
| Total (Overall) | 77 (48.1%) | 83 (51.9%) |
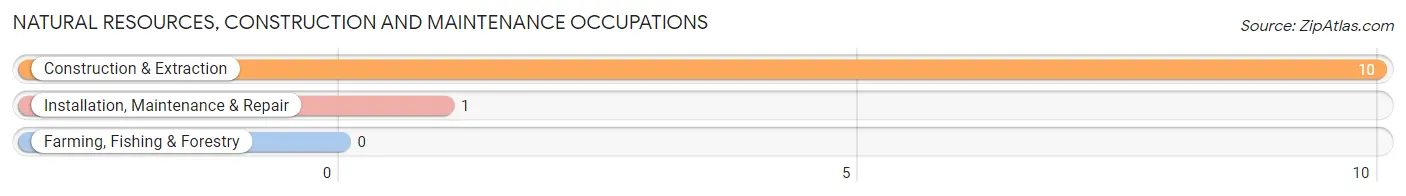
Natural Resources, Construction and Maintenance Occupations
The most common Natural Resources, Construction and Maintenance occupations in Kanarraville are Construction & Extraction (10 | 6.2%), and Installation, Maintenance & Repair (1 | 0.6%).
Natural Resources, Construction and Maintenance Occupations by Sex
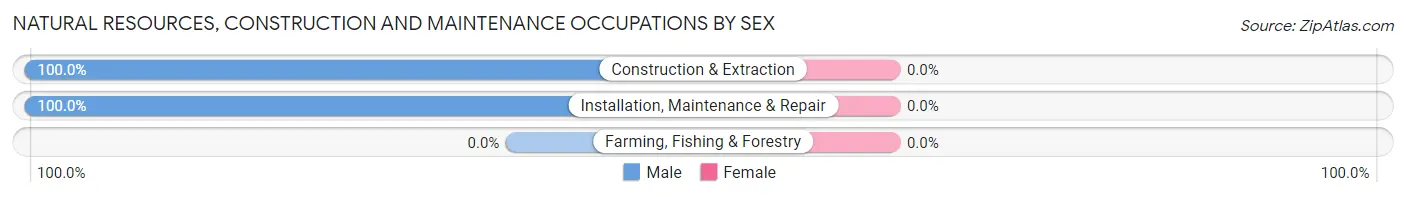
| Occupation | Male | Female |
| Farming, Fishing & Forestry | 0 (0.0%) | 0 (0.0%) |
| Construction & Extraction | 10 (100.0%) | 0 (0.0%) |
| Installation, Maintenance & Repair | 1 (100.0%) | 0 (0.0%) |
| Total (Category) | 11 (100.0%) | 0 (0.0%) |
| Total (Overall) | 77 (48.1%) | 83 (51.9%) |
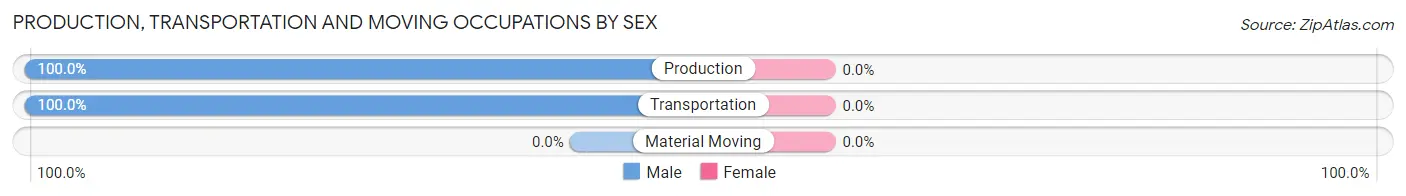
Production, Transportation and Moving Occupations
The most common Production, Transportation and Moving occupations in Kanarraville are Production (14 | 8.7%), and Transportation (7 | 4.4%).
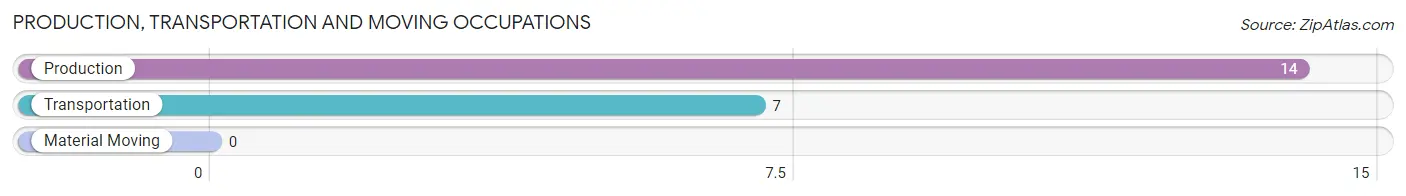
Production, Transportation and Moving Occupations by Sex
| Occupation | Male | Female |
| Production | 14 (100.0%) | 0 (0.0%) |
| Transportation | 7 (100.0%) | 0 (0.0%) |
| Material Moving | 0 (0.0%) | 0 (0.0%) |
| Total (Category) | 21 (100.0%) | 0 (0.0%) |
| Total (Overall) | 77 (48.1%) | 83 (51.9%) |
Employment Industries by Sex in Kanarraville
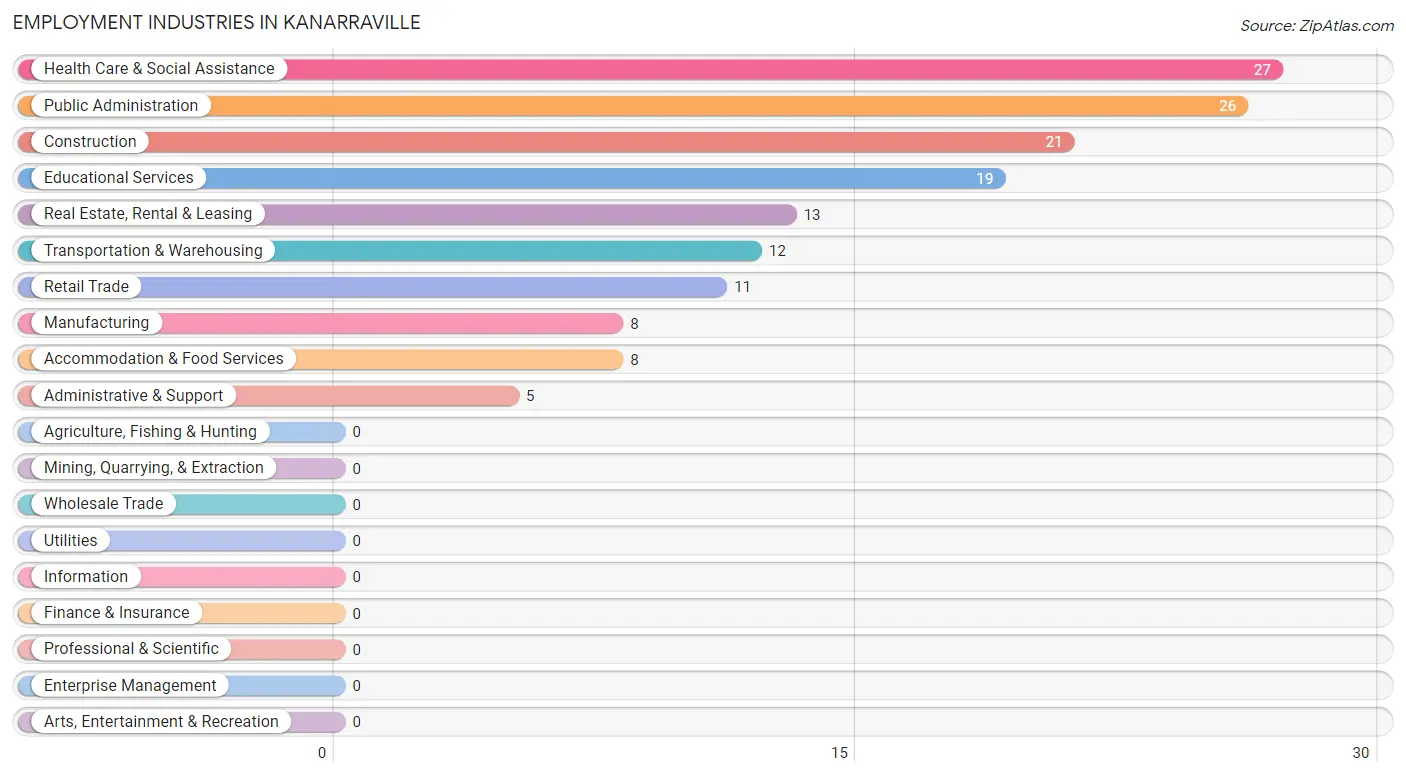
Employment Industries in Kanarraville
The major employment industries in Kanarraville include Health Care & Social Assistance (27 | 16.9%), Public Administration (26 | 16.3%), Construction (21 | 13.1%), Educational Services (19 | 11.9%), and Real Estate, Rental & Leasing (13 | 8.1%).
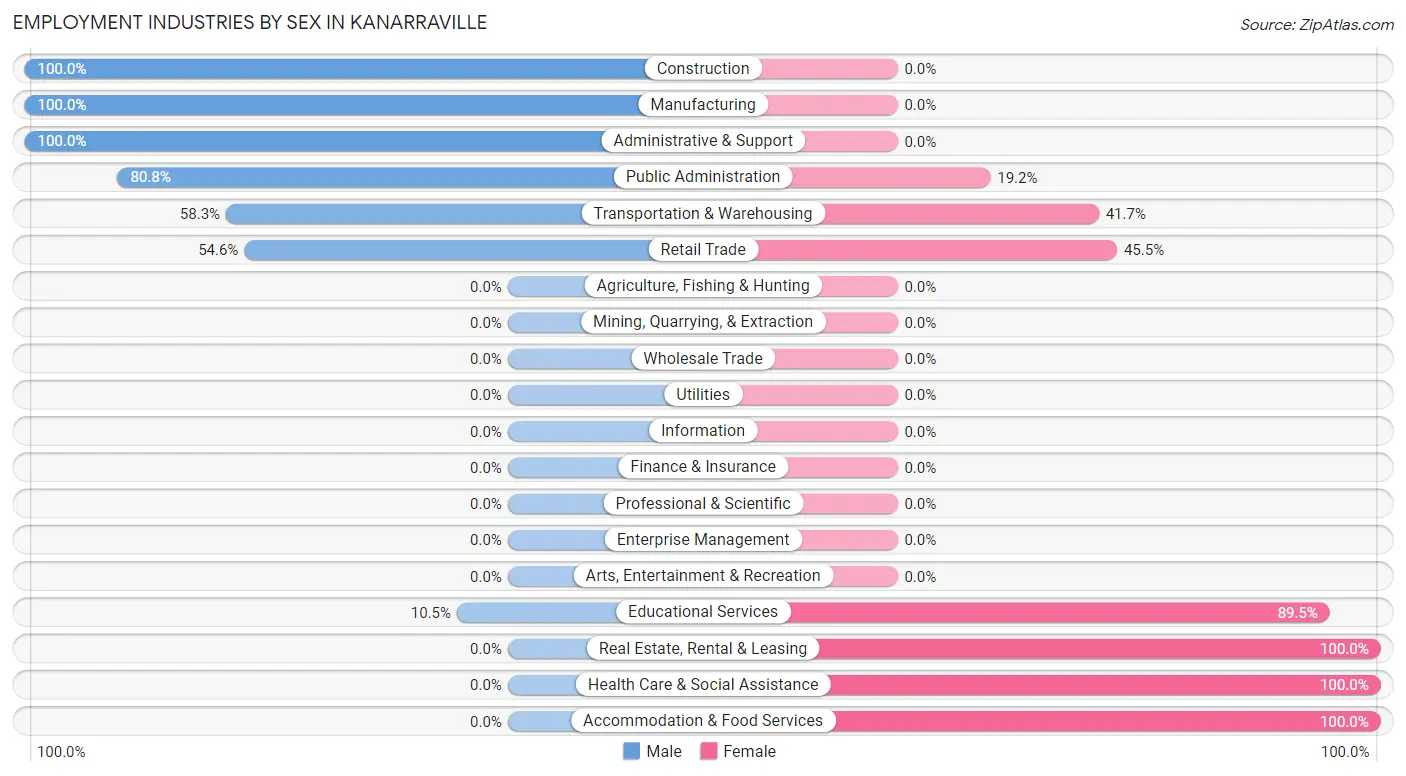
Employment Industries by Sex in Kanarraville
The Kanarraville industries that see more men than women are Construction (100.0%), Manufacturing (100.0%), and Administrative & Support (100.0%), whereas the industries that tend to have a higher number of women are Real Estate, Rental & Leasing (100.0%), Health Care & Social Assistance (100.0%), and Accommodation & Food Services (100.0%).
| Industry | Male | Female |
| Agriculture, Fishing & Hunting | 0 (0.0%) | 0 (0.0%) |
| Mining, Quarrying, & Extraction | 0 (0.0%) | 0 (0.0%) |
| Construction | 21 (100.0%) | 0 (0.0%) |
| Manufacturing | 8 (100.0%) | 0 (0.0%) |
| Wholesale Trade | 0 (0.0%) | 0 (0.0%) |
| Retail Trade | 6 (54.5%) | 5 (45.5%) |
| Transportation & Warehousing | 7 (58.3%) | 5 (41.7%) |
| Utilities | 0 (0.0%) | 0 (0.0%) |
| Information | 0 (0.0%) | 0 (0.0%) |
| Finance & Insurance | 0 (0.0%) | 0 (0.0%) |
| Real Estate, Rental & Leasing | 0 (0.0%) | 13 (100.0%) |
| Professional & Scientific | 0 (0.0%) | 0 (0.0%) |
| Enterprise Management | 0 (0.0%) | 0 (0.0%) |
| Administrative & Support | 5 (100.0%) | 0 (0.0%) |
| Educational Services | 2 (10.5%) | 17 (89.5%) |
| Health Care & Social Assistance | 0 (0.0%) | 27 (100.0%) |
| Arts, Entertainment & Recreation | 0 (0.0%) | 0 (0.0%) |
| Accommodation & Food Services | 0 (0.0%) | 8 (100.0%) |
| Public Administration | 21 (80.8%) | 5 (19.2%) |
| Total | 77 (48.1%) | 83 (51.9%) |
Education in Kanarraville
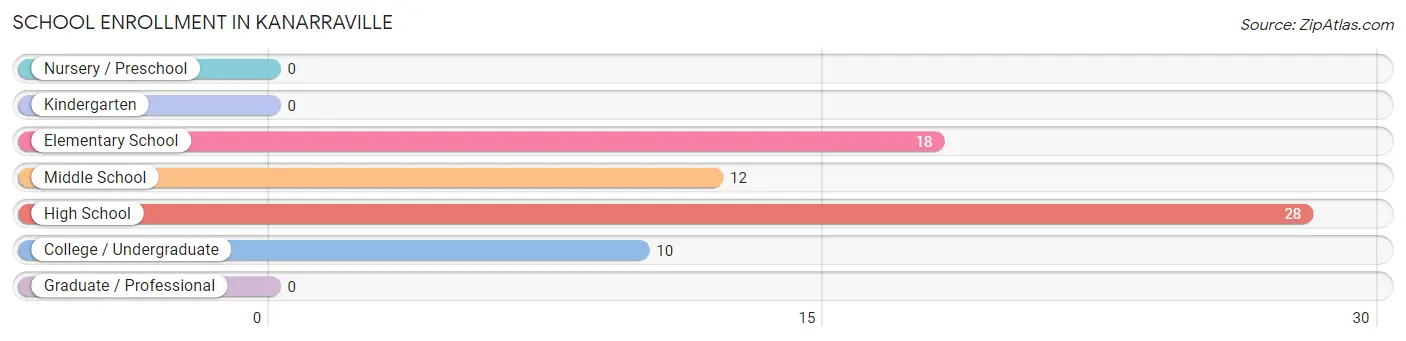
School Enrollment in Kanarraville
The most common levels of schooling among the 68 students in Kanarraville are high school (28 | 41.2%), elementary school (18 | 26.5%), and middle school (12 | 17.6%).
| School Level | # Students | % Students |
| Nursery / Preschool | 0 | 0.0% |
| Kindergarten | 0 | 0.0% |
| Elementary School | 18 | 26.5% |
| Middle School | 12 | 17.6% |
| High School | 28 | 41.2% |
| College / Undergraduate | 10 | 14.7% |
| Graduate / Professional | 0 | 0.0% |
| Total | 68 | 100.0% |
School Enrollment by Age by Funding Source in Kanarraville
Out of a total of 68 students who are enrolled in schools in Kanarraville, 2 (2.9%) attend a private institution, while the remaining 66 (97.1%) are enrolled in public schools. The age group of 5 to 9 year old has the highest likelihood of being enrolled in private schools, with 2 (18.2% in the age bracket) enrolled. Conversely, the age group of 10 to 14 year olds has the lowest likelihood of being enrolled in a private school, with 19 (100.0% in the age bracket) attending a public institution.
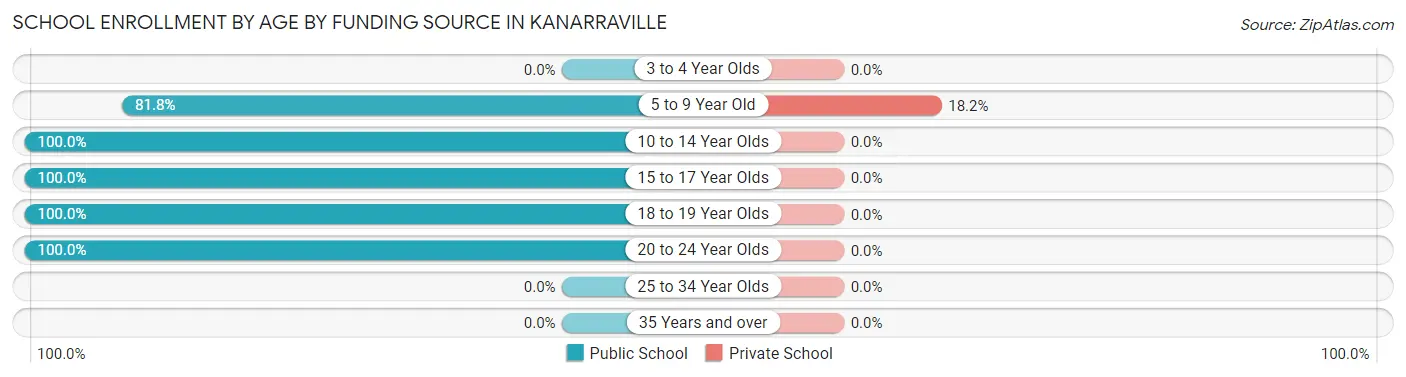
| Age Bracket | Public School | Private School |
| 3 to 4 Year Olds | 0 (0.0%) | 0 (0.0%) |
| 5 to 9 Year Old | 9 (81.8%) | 2 (18.2%) |
| 10 to 14 Year Olds | 19 (100.0%) | 0 (0.0%) |
| 15 to 17 Year Olds | 28 (100.0%) | 0 (0.0%) |
| 18 to 19 Year Olds | 7 (100.0%) | 0 (0.0%) |
| 20 to 24 Year Olds | 3 (100.0%) | 0 (0.0%) |
| 25 to 34 Year Olds | 0 (0.0%) | 0 (0.0%) |
| 35 Years and over | 0 (0.0%) | 0 (0.0%) |
| Total | 66 (97.1%) | 2 (2.9%) |
Educational Attainment by Field of Study in Kanarraville
Education (29 | 44.6%), social sciences (9 | 13.9%), science & technology (7 | 10.8%), business (6 | 9.2%), and bio, nature & agricultural (5 | 7.7%) are the most common fields of study among 65 individuals in Kanarraville who have obtained a bachelor's degree or higher.
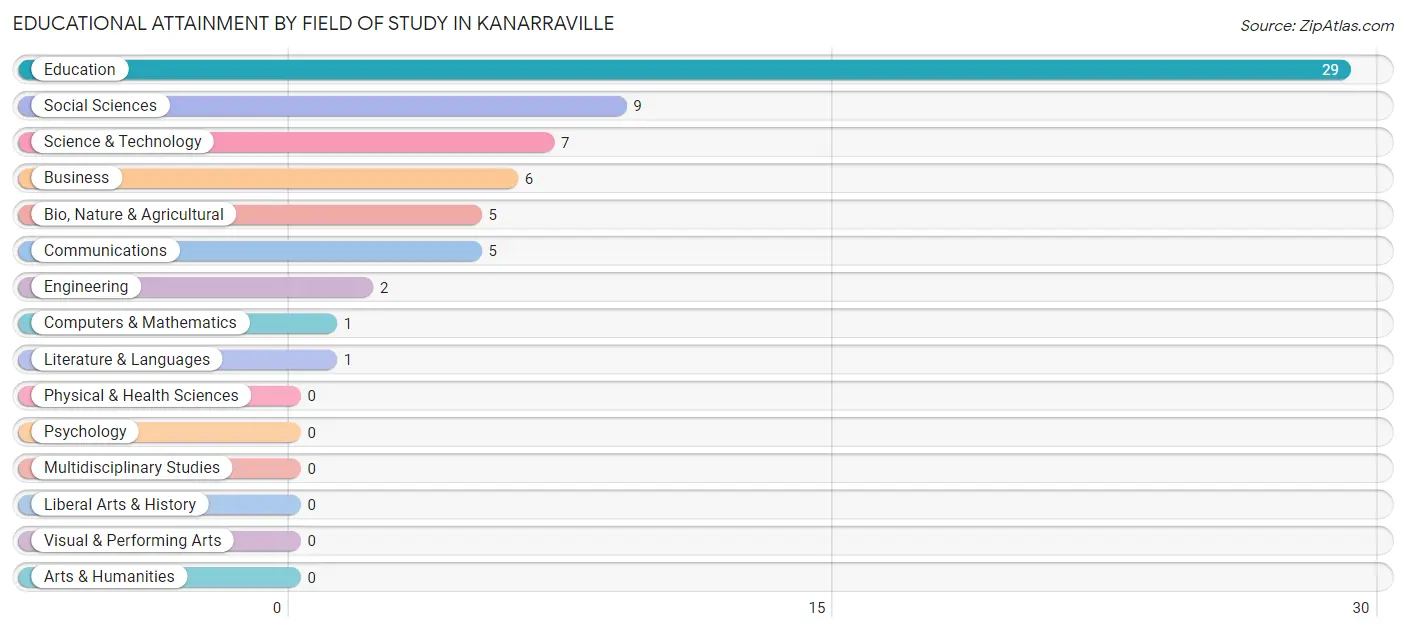
| Field of Study | # Graduates | % Graduates |
| Computers & Mathematics | 1 | 1.5% |
| Bio, Nature & Agricultural | 5 | 7.7% |
| Physical & Health Sciences | 0 | 0.0% |
| Psychology | 0 | 0.0% |
| Social Sciences | 9 | 13.9% |
| Engineering | 2 | 3.1% |
| Multidisciplinary Studies | 0 | 0.0% |
| Science & Technology | 7 | 10.8% |
| Business | 6 | 9.2% |
| Education | 29 | 44.6% |
| Literature & Languages | 1 | 1.5% |
| Liberal Arts & History | 0 | 0.0% |
| Visual & Performing Arts | 0 | 0.0% |
| Communications | 5 | 7.7% |
| Arts & Humanities | 0 | 0.0% |
| Total | 65 | 100.0% |
Transportation & Commute in Kanarraville
Vehicle Availability by Sex in Kanarraville
The most prevalent vehicle ownership categories in Kanarraville are males with 2 vehicles (30, accounting for 39.0%) and females with 2 vehicles (10, making up 36.1%).
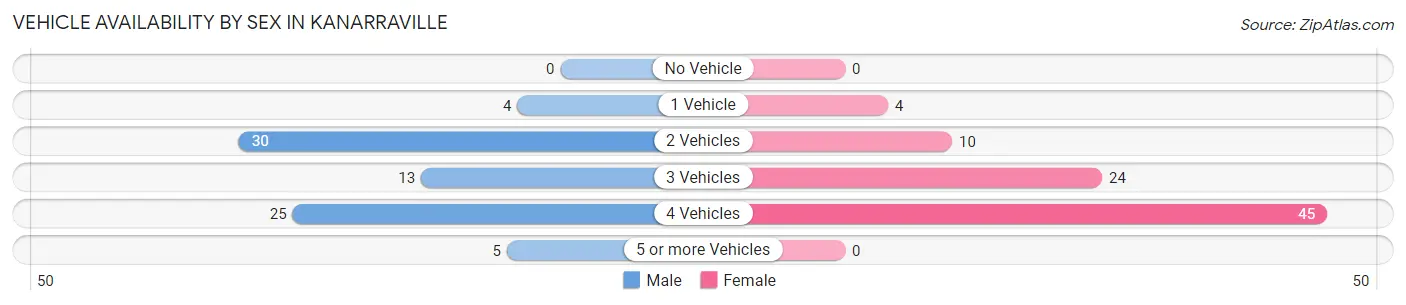
| Vehicles Available | Male | Female |
| No Vehicle | 0 (0.0%) | 0 (0.0%) |
| 1 Vehicle | 4 (5.2%) | 4 (4.8%) |
| 2 Vehicles | 30 (39.0%) | 10 (12.0%) |
| 3 Vehicles | 13 (16.9%) | 24 (28.9%) |
| 4 Vehicles | 25 (32.5%) | 45 (54.2%) |
| 5 or more Vehicles | 5 (6.5%) | 0 (0.0%) |
| Total | 77 (100.0%) | 83 (100.0%) |
Commute Time in Kanarraville
The most frequently occuring commute durations in Kanarraville are 15 to 19 minutes (59 commuters, 41.8%), 20 to 24 minutes (24 commuters, 17.0%), and 35 to 39 minutes (13 commuters, 9.2%).
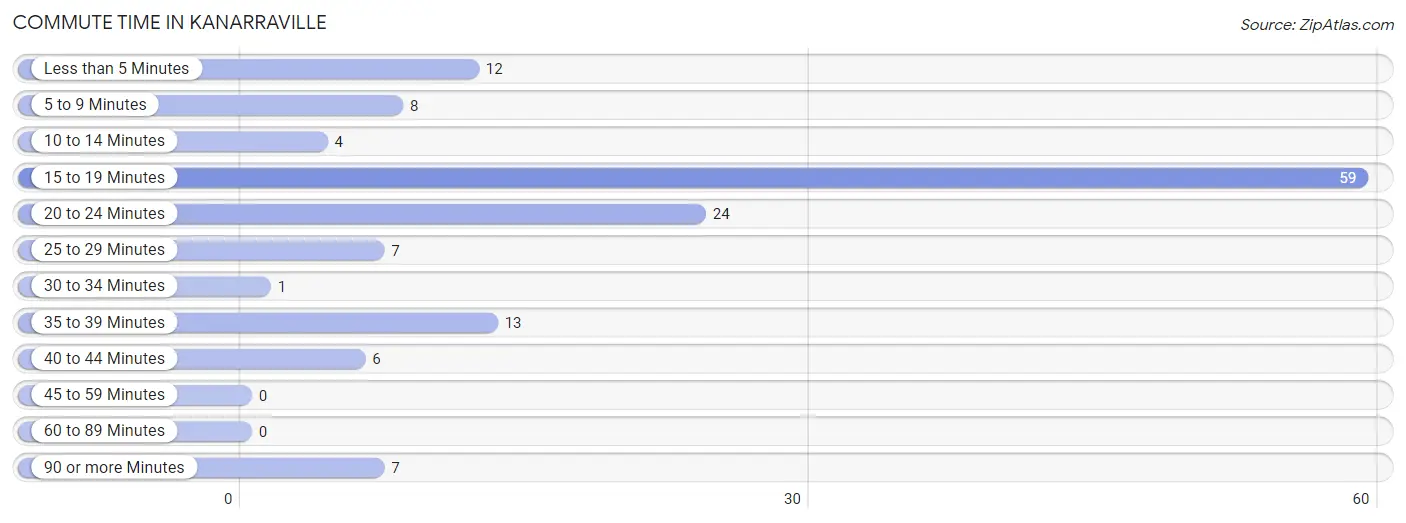
| Commute Time | # Commuters | % Commuters |
| Less than 5 Minutes | 12 | 8.5% |
| 5 to 9 Minutes | 8 | 5.7% |
| 10 to 14 Minutes | 4 | 2.8% |
| 15 to 19 Minutes | 59 | 41.8% |
| 20 to 24 Minutes | 24 | 17.0% |
| 25 to 29 Minutes | 7 | 5.0% |
| 30 to 34 Minutes | 1 | 0.7% |
| 35 to 39 Minutes | 13 | 9.2% |
| 40 to 44 Minutes | 6 | 4.3% |
| 45 to 59 Minutes | 0 | 0.0% |
| 60 to 89 Minutes | 0 | 0.0% |
| 90 or more Minutes | 7 | 5.0% |
Commute Time by Sex in Kanarraville
The most common commute times in Kanarraville are 20 to 24 minutes (19 commuters, 29.2%) for males and 15 to 19 minutes (46 commuters, 60.5%) for females.
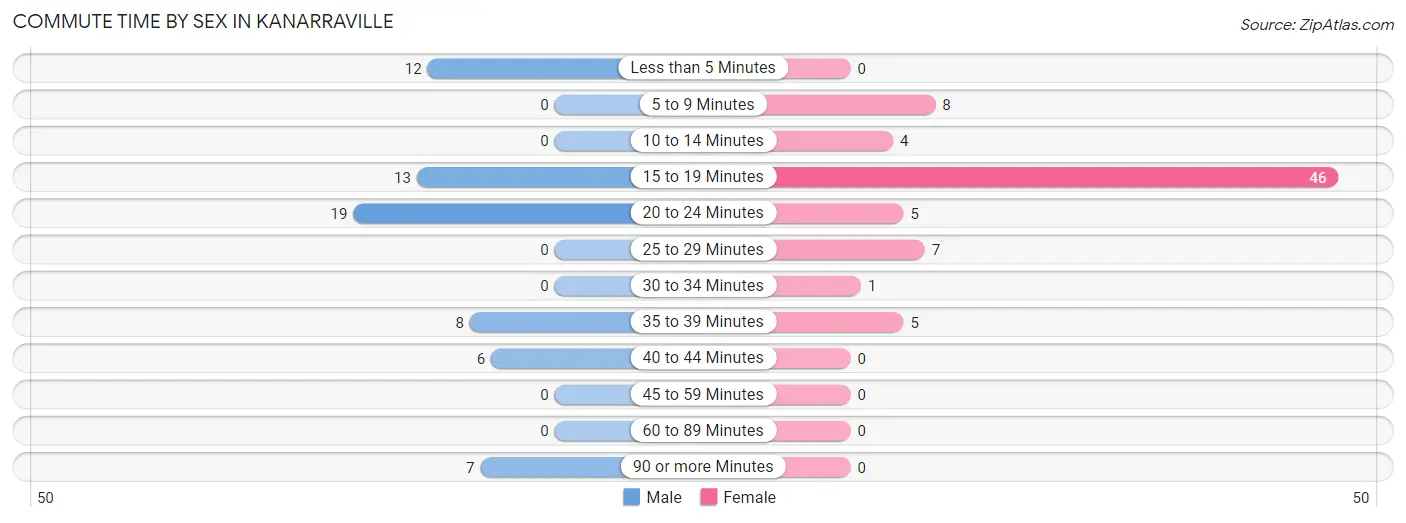
| Commute Time | Male | Female |
| Less than 5 Minutes | 12 (18.5%) | 0 (0.0%) |
| 5 to 9 Minutes | 0 (0.0%) | 8 (10.5%) |
| 10 to 14 Minutes | 0 (0.0%) | 4 (5.3%) |
| 15 to 19 Minutes | 13 (20.0%) | 46 (60.5%) |
| 20 to 24 Minutes | 19 (29.2%) | 5 (6.6%) |
| 25 to 29 Minutes | 0 (0.0%) | 7 (9.2%) |
| 30 to 34 Minutes | 0 (0.0%) | 1 (1.3%) |
| 35 to 39 Minutes | 8 (12.3%) | 5 (6.6%) |
| 40 to 44 Minutes | 6 (9.2%) | 0 (0.0%) |
| 45 to 59 Minutes | 0 (0.0%) | 0 (0.0%) |
| 60 to 89 Minutes | 0 (0.0%) | 0 (0.0%) |
| 90 or more Minutes | 7 (10.8%) | 0 (0.0%) |
Time of Departure to Work by Sex in Kanarraville
The most frequent times of departure to work in Kanarraville are 6:00 AM to 6:29 AM (19, 29.2%) for males and 7:00 AM to 7:29 AM (28, 36.8%) for females.
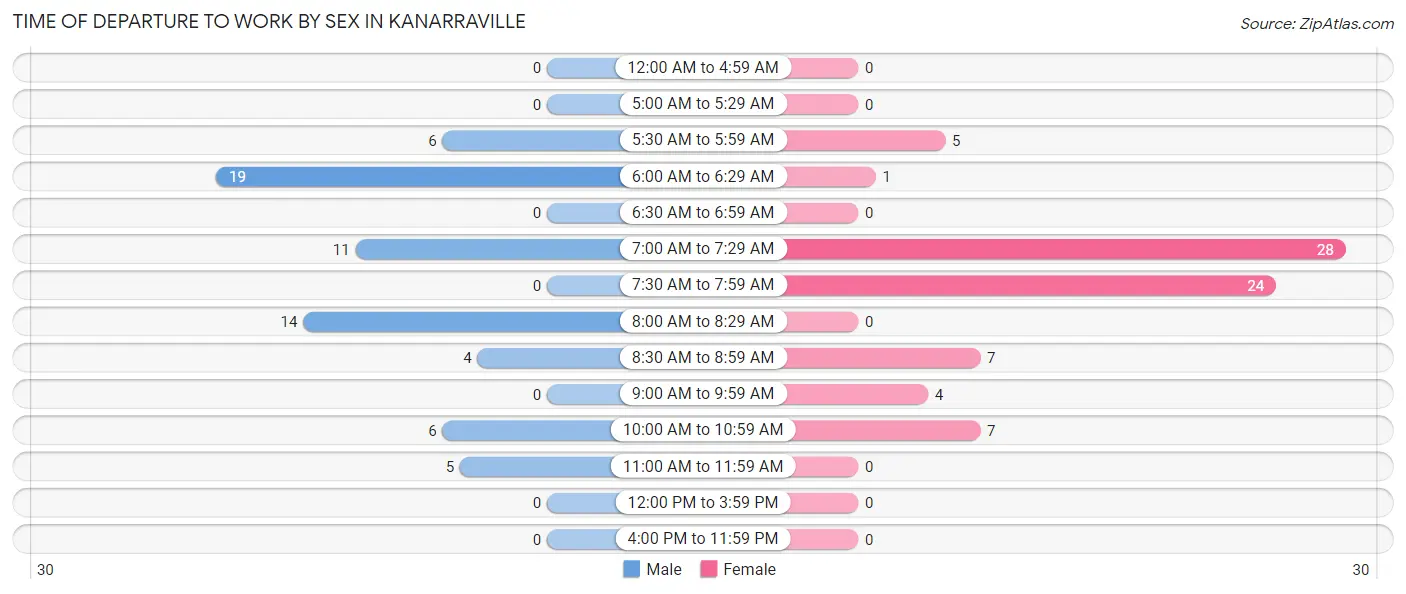
| Time of Departure | Male | Female |
| 12:00 AM to 4:59 AM | 0 (0.0%) | 0 (0.0%) |
| 5:00 AM to 5:29 AM | 0 (0.0%) | 0 (0.0%) |
| 5:30 AM to 5:59 AM | 6 (9.2%) | 5 (6.6%) |
| 6:00 AM to 6:29 AM | 19 (29.2%) | 1 (1.3%) |
| 6:30 AM to 6:59 AM | 0 (0.0%) | 0 (0.0%) |
| 7:00 AM to 7:29 AM | 11 (16.9%) | 28 (36.8%) |
| 7:30 AM to 7:59 AM | 0 (0.0%) | 24 (31.6%) |
| 8:00 AM to 8:29 AM | 14 (21.5%) | 0 (0.0%) |
| 8:30 AM to 8:59 AM | 4 (6.1%) | 7 (9.2%) |
| 9:00 AM to 9:59 AM | 0 (0.0%) | 4 (5.3%) |
| 10:00 AM to 10:59 AM | 6 (9.2%) | 7 (9.2%) |
| 11:00 AM to 11:59 AM | 5 (7.7%) | 0 (0.0%) |
| 12:00 PM to 3:59 PM | 0 (0.0%) | 0 (0.0%) |
| 4:00 PM to 11:59 PM | 0 (0.0%) | 0 (0.0%) |
| Total | 65 (100.0%) | 76 (100.0%) |
Housing Occupancy in Kanarraville
Occupancy by Ownership in Kanarraville
Of the total 128 dwellings in Kanarraville, owner-occupied units account for 119 (93.0%), while renter-occupied units make up 9 (7.0%).
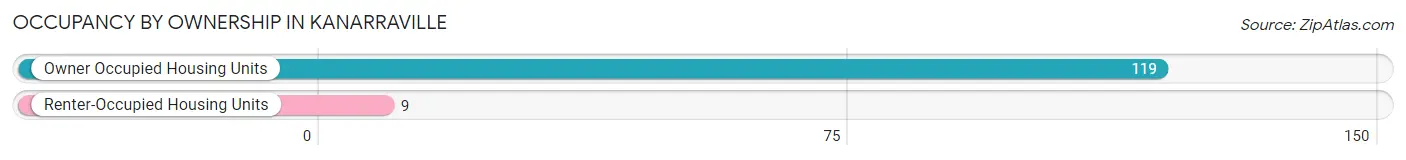
| Occupancy | # Housing Units | % Housing Units |
| Owner Occupied Housing Units | 119 | 93.0% |
| Renter-Occupied Housing Units | 9 | 7.0% |
| Total Occupied Housing Units | 128 | 100.0% |
Occupancy by Household Size in Kanarraville
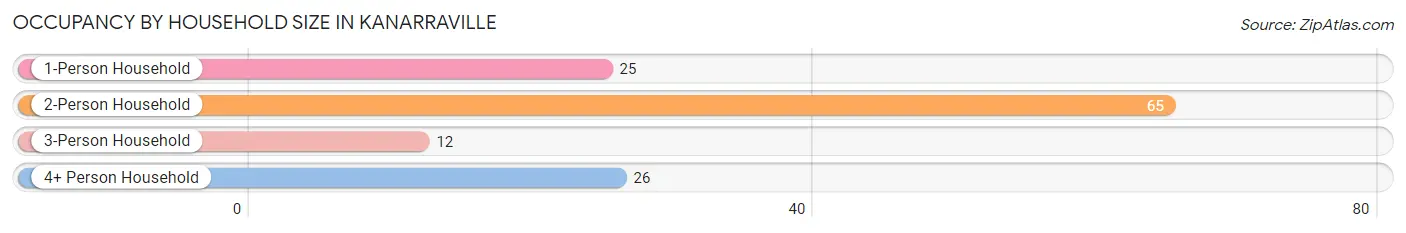
| Household Size | # Housing Units | % Housing Units |
| 1-Person Household | 25 | 19.5% |
| 2-Person Household | 65 | 50.8% |
| 3-Person Household | 12 | 9.4% |
| 4+ Person Household | 26 | 20.3% |
| Total Housing Units | 128 | 100.0% |
Occupancy by Ownership by Household Size in Kanarraville
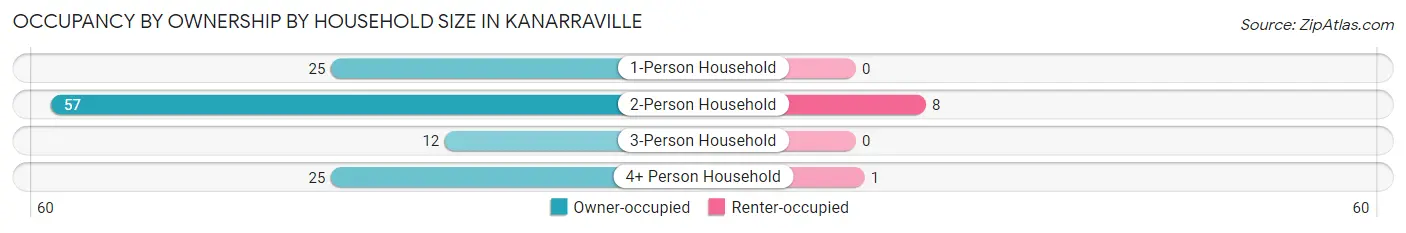
| Household Size | Owner-occupied | Renter-occupied |
| 1-Person Household | 25 (100.0%) | 0 (0.0%) |
| 2-Person Household | 57 (87.7%) | 8 (12.3%) |
| 3-Person Household | 12 (100.0%) | 0 (0.0%) |
| 4+ Person Household | 25 (96.2%) | 1 (3.8%) |
| Total Housing Units | 119 (93.0%) | 9 (7.0%) |
Occupancy by Educational Attainment in Kanarraville
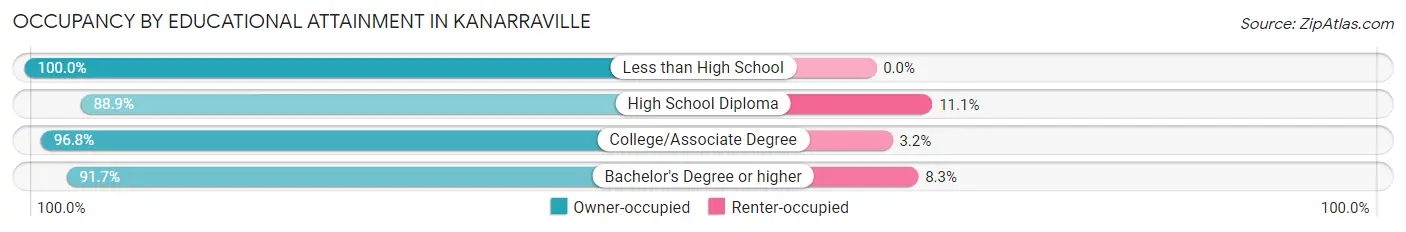
| Household Size | Owner-occupied | Renter-occupied |
| Less than High School | 16 (100.0%) | 0 (0.0%) |
| High School Diploma | 40 (88.9%) | 5 (11.1%) |
| College/Associate Degree | 30 (96.8%) | 1 (3.2%) |
| Bachelor's Degree or higher | 33 (91.7%) | 3 (8.3%) |
Occupancy by Age of Householder in Kanarraville
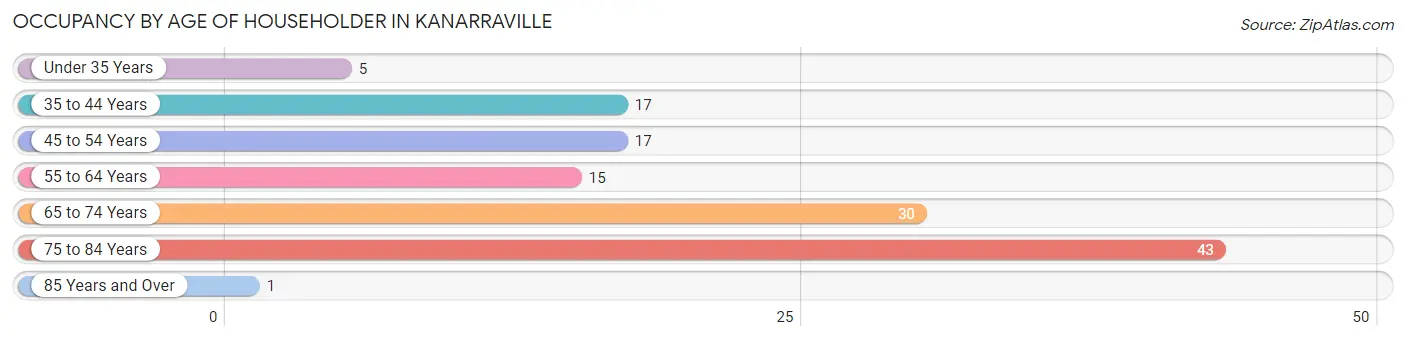
| Age Bracket | # Households | % Households |
| Under 35 Years | 5 | 3.9% |
| 35 to 44 Years | 17 | 13.3% |
| 45 to 54 Years | 17 | 13.3% |
| 55 to 64 Years | 15 | 11.7% |
| 65 to 74 Years | 30 | 23.4% |
| 75 to 84 Years | 43 | 33.6% |
| 85 Years and Over | 1 | 0.8% |
| Total | 128 | 100.0% |
Housing Finances in Kanarraville
Median Income by Occupancy in Kanarraville
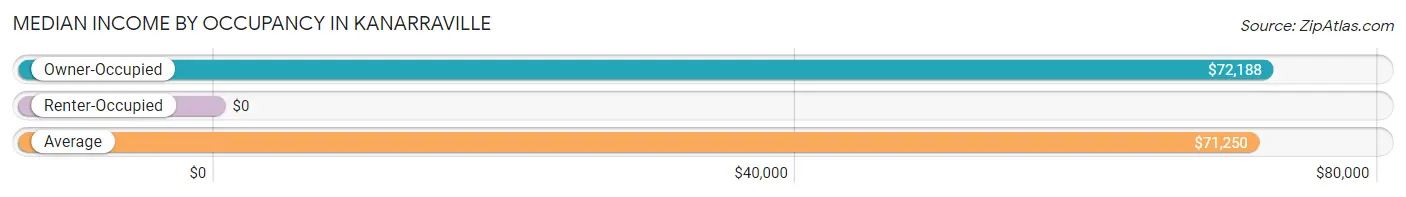
| Occupancy Type | # Households | Median Income |
| Owner-Occupied | 119 (93.0%) | $72,188 |
| Renter-Occupied | 9 (7.0%) | $0 |
| Average | 128 (100.0%) | $71,250 |
Occupancy by Householder Income Bracket in Kanarraville
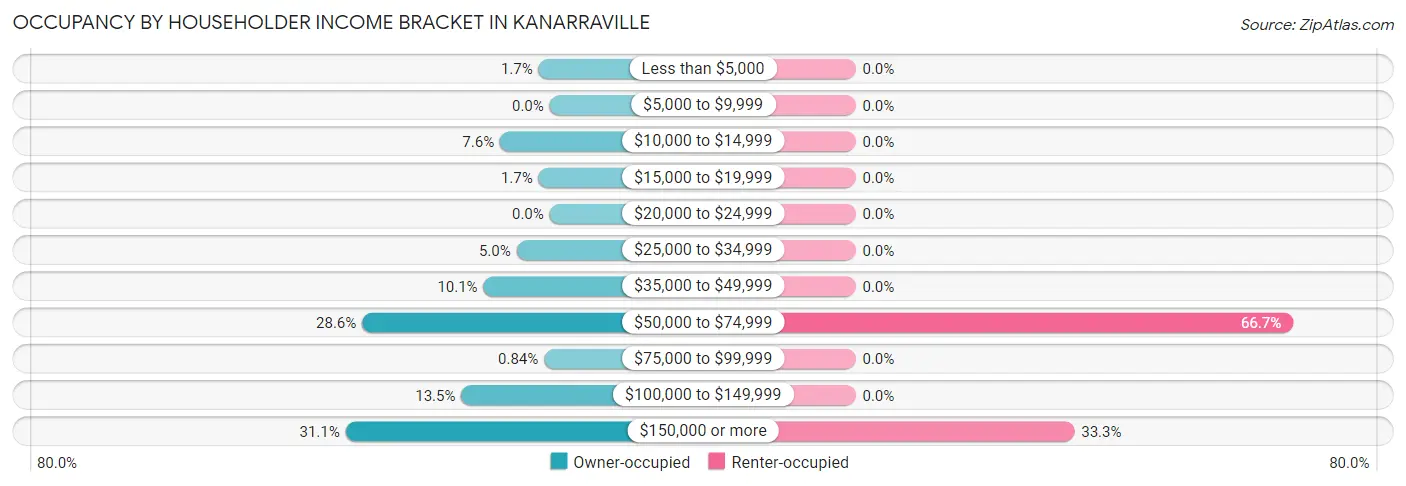
| Income Bracket | Owner-occupied | Renter-occupied |
| Less than $5,000 | 2 (1.7%) | 0 (0.0%) |
| $5,000 to $9,999 | 0 (0.0%) | 0 (0.0%) |
| $10,000 to $14,999 | 9 (7.6%) | 0 (0.0%) |
| $15,000 to $19,999 | 2 (1.7%) | 0 (0.0%) |
| $20,000 to $24,999 | 0 (0.0%) | 0 (0.0%) |
| $25,000 to $34,999 | 6 (5.0%) | 0 (0.0%) |
| $35,000 to $49,999 | 12 (10.1%) | 0 (0.0%) |
| $50,000 to $74,999 | 34 (28.6%) | 6 (66.7%) |
| $75,000 to $99,999 | 1 (0.8%) | 0 (0.0%) |
| $100,000 to $149,999 | 16 (13.5%) | 0 (0.0%) |
| $150,000 or more | 37 (31.1%) | 3 (33.3%) |
| Total | 119 (100.0%) | 9 (100.0%) |
Monthly Housing Cost Tiers in Kanarraville
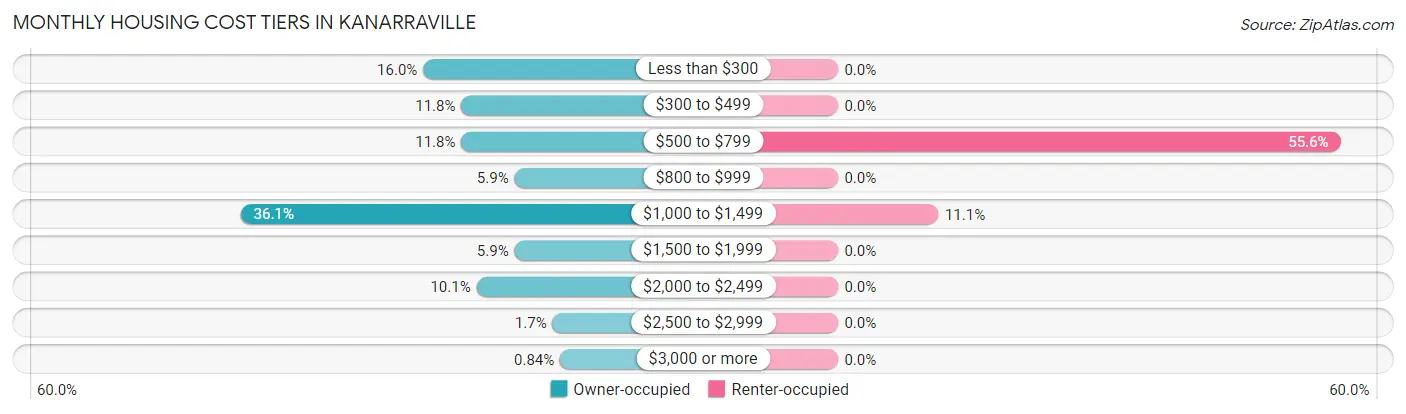
| Monthly Cost | Owner-occupied | Renter-occupied |
| Less than $300 | 19 (16.0%) | 0 (0.0%) |
| $300 to $499 | 14 (11.8%) | 0 (0.0%) |
| $500 to $799 | 14 (11.8%) | 5 (55.6%) |
| $800 to $999 | 7 (5.9%) | 0 (0.0%) |
| $1,000 to $1,499 | 43 (36.1%) | 1 (11.1%) |
| $1,500 to $1,999 | 7 (5.9%) | 0 (0.0%) |
| $2,000 to $2,499 | 12 (10.1%) | 0 (0.0%) |
| $2,500 to $2,999 | 2 (1.7%) | 0 (0.0%) |
| $3,000 or more | 1 (0.8%) | 0 (0.0%) |
| Total | 119 (100.0%) | 9 (100.0%) |
Physical Housing Characteristics in Kanarraville
Housing Structures in Kanarraville
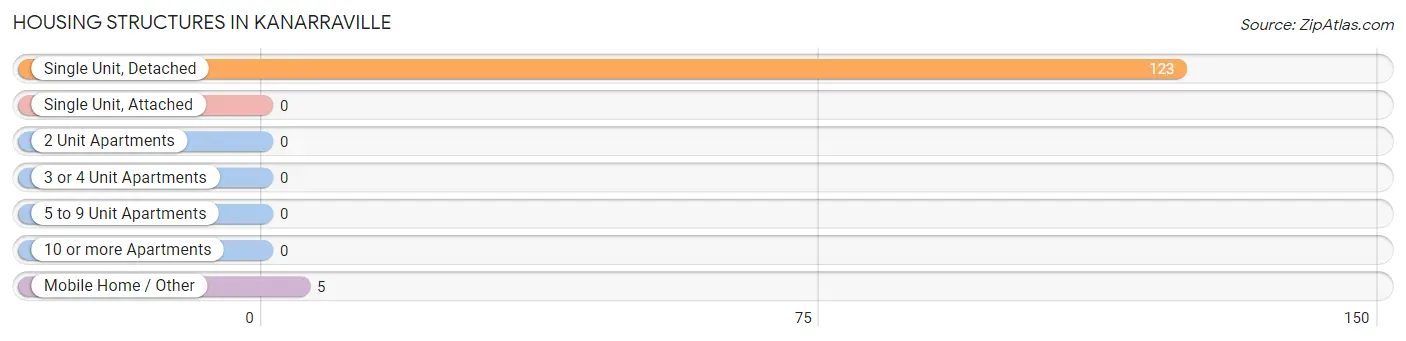
| Structure Type | # Housing Units | % Housing Units |
| Single Unit, Detached | 123 | 96.1% |
| Single Unit, Attached | 0 | 0.0% |
| 2 Unit Apartments | 0 | 0.0% |
| 3 or 4 Unit Apartments | 0 | 0.0% |
| 5 to 9 Unit Apartments | 0 | 0.0% |
| 10 or more Apartments | 0 | 0.0% |
| Mobile Home / Other | 5 | 3.9% |
| Total | 128 | 100.0% |
Housing Structures by Occupancy in Kanarraville
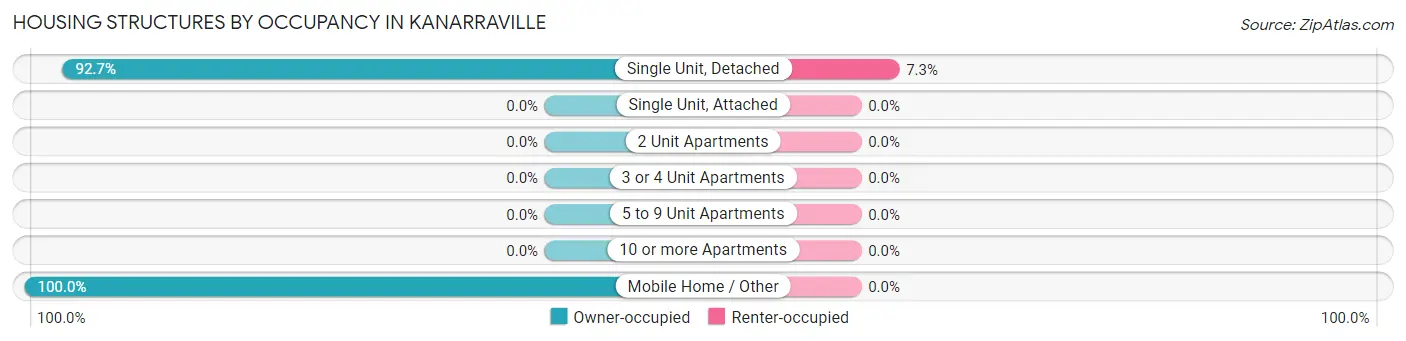
| Structure Type | Owner-occupied | Renter-occupied |
| Single Unit, Detached | 114 (92.7%) | 9 (7.3%) |
| Single Unit, Attached | 0 (0.0%) | 0 (0.0%) |
| 2 Unit Apartments | 0 (0.0%) | 0 (0.0%) |
| 3 or 4 Unit Apartments | 0 (0.0%) | 0 (0.0%) |
| 5 to 9 Unit Apartments | 0 (0.0%) | 0 (0.0%) |
| 10 or more Apartments | 0 (0.0%) | 0 (0.0%) |
| Mobile Home / Other | 5 (100.0%) | 0 (0.0%) |
| Total | 119 (93.0%) | 9 (7.0%) |
Housing Structures by Number of Rooms in Kanarraville
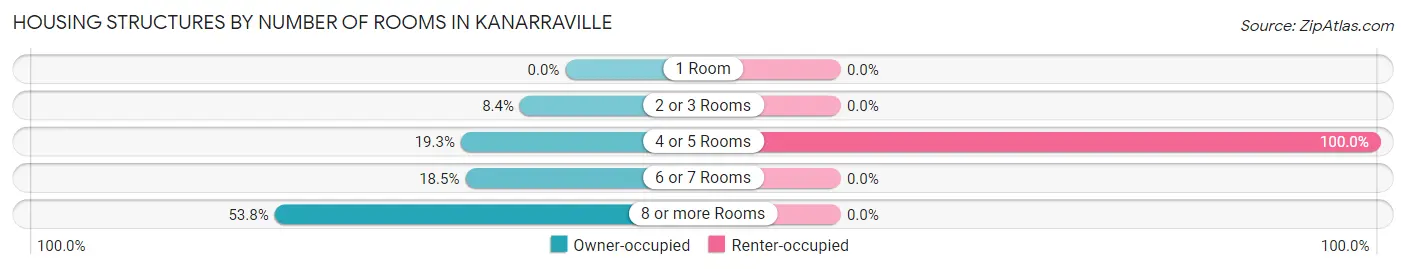
| Number of Rooms | Owner-occupied | Renter-occupied |
| 1 Room | 0 (0.0%) | 0 (0.0%) |
| 2 or 3 Rooms | 10 (8.4%) | 0 (0.0%) |
| 4 or 5 Rooms | 23 (19.3%) | 9 (100.0%) |
| 6 or 7 Rooms | 22 (18.5%) | 0 (0.0%) |
| 8 or more Rooms | 64 (53.8%) | 0 (0.0%) |
| Total | 119 (100.0%) | 9 (100.0%) |
Housing Structure by Heating Type in Kanarraville
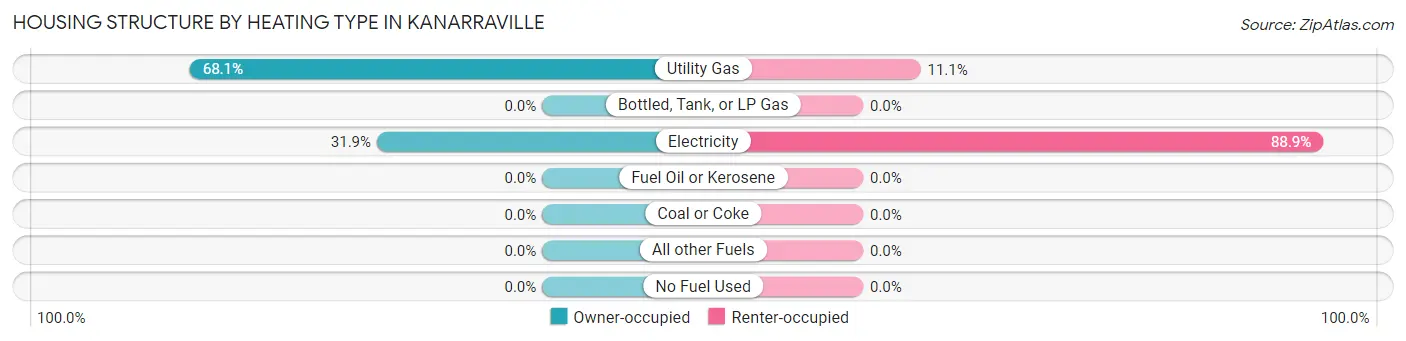
| Heating Type | Owner-occupied | Renter-occupied |
| Utility Gas | 81 (68.1%) | 1 (11.1%) |
| Bottled, Tank, or LP Gas | 0 (0.0%) | 0 (0.0%) |
| Electricity | 38 (31.9%) | 8 (88.9%) |
| Fuel Oil or Kerosene | 0 (0.0%) | 0 (0.0%) |
| Coal or Coke | 0 (0.0%) | 0 (0.0%) |
| All other Fuels | 0 (0.0%) | 0 (0.0%) |
| No Fuel Used | 0 (0.0%) | 0 (0.0%) |
| Total | 119 (100.0%) | 9 (100.0%) |
Household Vehicle Usage in Kanarraville
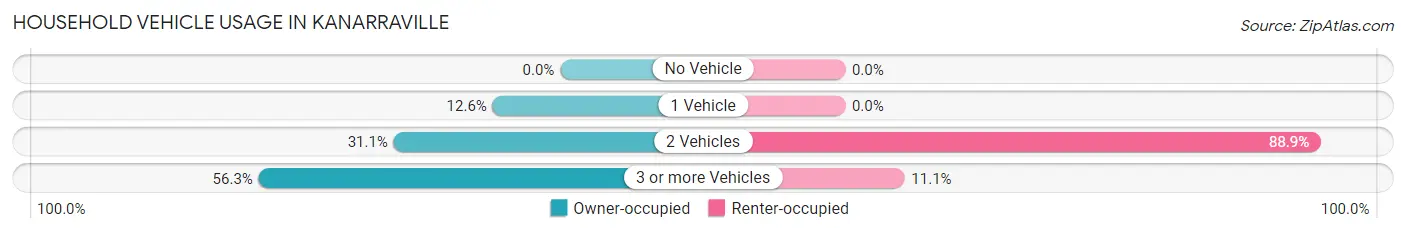
| Vehicles per Household | Owner-occupied | Renter-occupied |
| No Vehicle | 0 (0.0%) | 0 (0.0%) |
| 1 Vehicle | 15 (12.6%) | 0 (0.0%) |
| 2 Vehicles | 37 (31.1%) | 8 (88.9%) |
| 3 or more Vehicles | 67 (56.3%) | 1 (11.1%) |
| Total | 119 (100.0%) | 9 (100.0%) |
Real Estate & Mortgages in Kanarraville
Real Estate and Mortgage Overview in Kanarraville
| Characteristic | Without Mortgage | With Mortgage |
| Housing Units | 57 | 62 |
| Median Property Value | $255,400 | $363,600 |
| Median Household Income | $52,344 | $20 |
| Monthly Housing Costs | $378 | $1 |
| Real Estate Taxes | $1,625 | $0 |
Property Value by Mortgage Status in Kanarraville
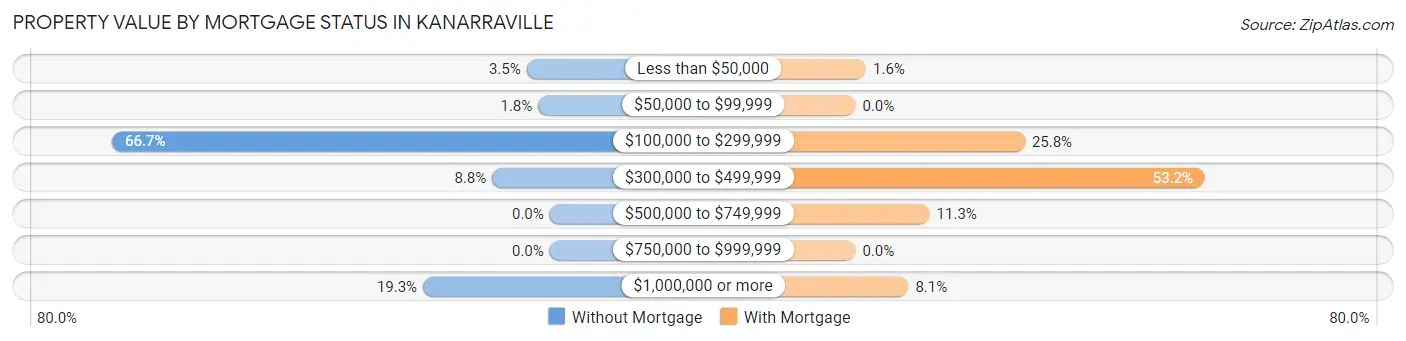
| Property Value | Without Mortgage | With Mortgage |
| Less than $50,000 | 2 (3.5%) | 1 (1.6%) |
| $50,000 to $99,999 | 1 (1.8%) | 0 (0.0%) |
| $100,000 to $299,999 | 38 (66.7%) | 16 (25.8%) |
| $300,000 to $499,999 | 5 (8.8%) | 33 (53.2%) |
| $500,000 to $749,999 | 0 (0.0%) | 7 (11.3%) |
| $750,000 to $999,999 | 0 (0.0%) | 0 (0.0%) |
| $1,000,000 or more | 11 (19.3%) | 5 (8.1%) |
| Total | 57 (100.0%) | 62 (100.0%) |
Household Income by Mortgage Status in Kanarraville
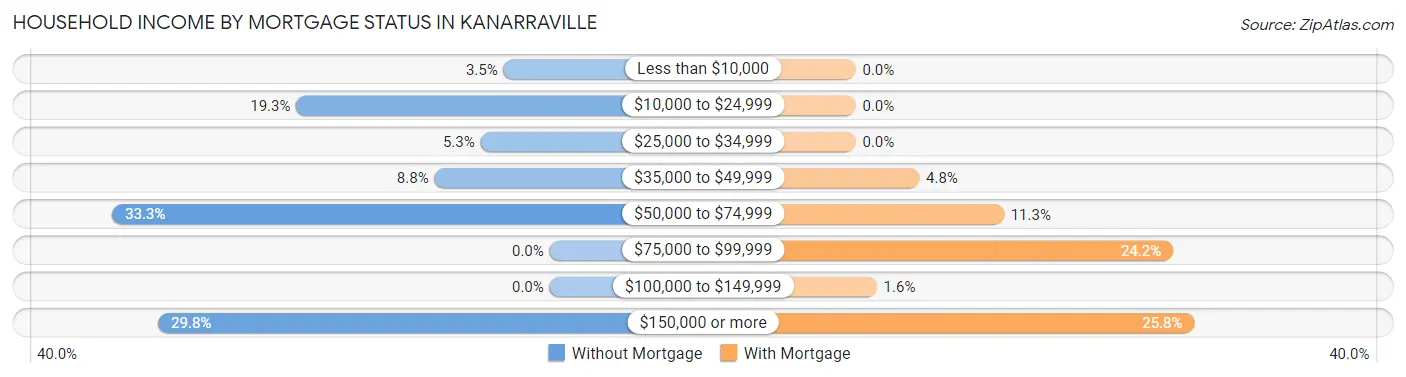
| Household Income | Without Mortgage | With Mortgage |
| Less than $10,000 | 2 (3.5%) | 0 (0.0%) |
| $10,000 to $24,999 | 11 (19.3%) | 0 (0.0%) |
| $25,000 to $34,999 | 3 (5.3%) | 0 (0.0%) |
| $35,000 to $49,999 | 5 (8.8%) | 3 (4.8%) |
| $50,000 to $74,999 | 19 (33.3%) | 7 (11.3%) |
| $75,000 to $99,999 | 0 (0.0%) | 15 (24.2%) |
| $100,000 to $149,999 | 0 (0.0%) | 1 (1.6%) |
| $150,000 or more | 17 (29.8%) | 16 (25.8%) |
| Total | 57 (100.0%) | 62 (100.0%) |
Property Value to Household Income Ratio in Kanarraville
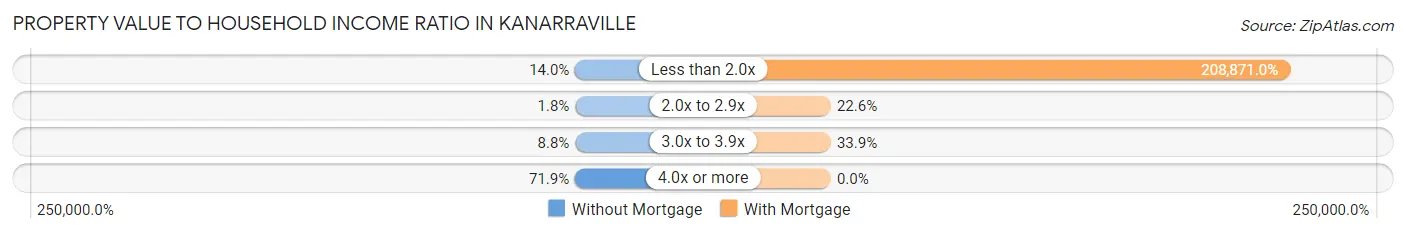
| Value-to-Income Ratio | Without Mortgage | With Mortgage |
| Less than 2.0x | 8 (14.0%) | 129,500 (208,871.0%) |
| 2.0x to 2.9x | 1 (1.8%) | 14 (22.6%) |
| 3.0x to 3.9x | 5 (8.8%) | 21 (33.9%) |
| 4.0x or more | 41 (71.9%) | 0 (0.0%) |
| Total | 57 (100.0%) | 62 (100.0%) |
Real Estate Taxes by Mortgage Status in Kanarraville
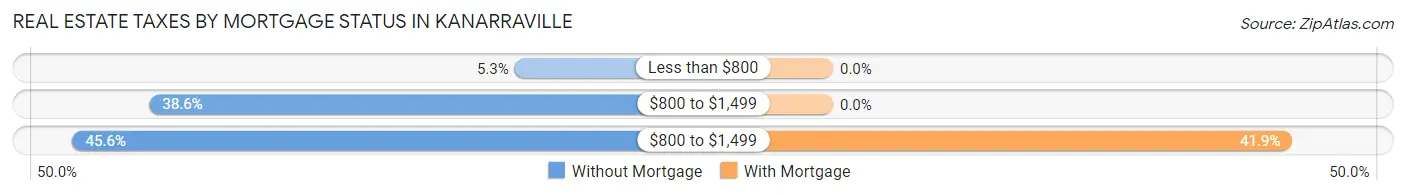
| Property Taxes | Without Mortgage | With Mortgage |
| Less than $800 | 3 (5.3%) | 0 (0.0%) |
| $800 to $1,499 | 22 (38.6%) | 0 (0.0%) |
| $800 to $1,499 | 26 (45.6%) | 26 (41.9%) |
| Total | 57 (100.0%) | 62 (100.0%) |
Health & Disability in Kanarraville
Health Insurance Coverage by Age in Kanarraville
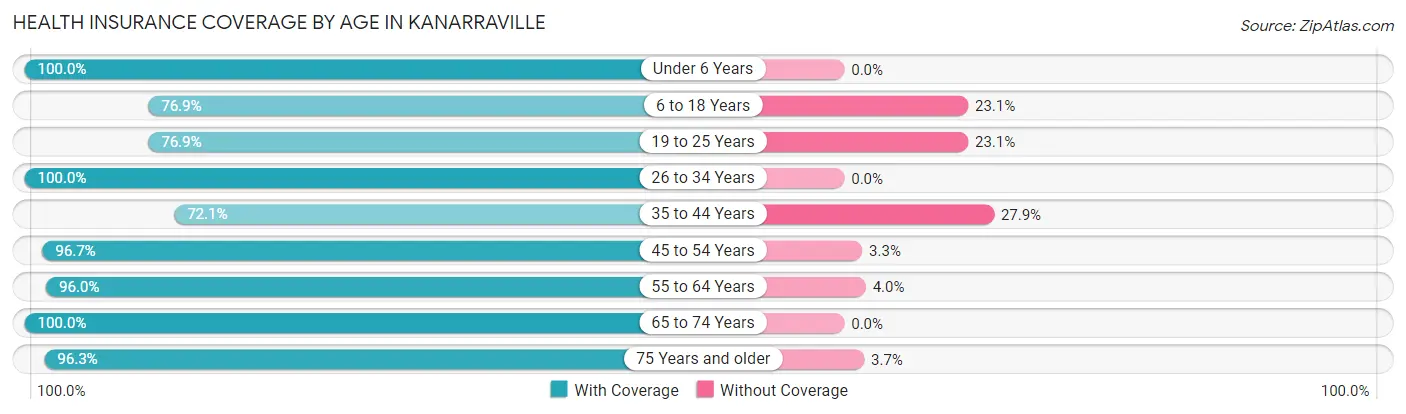
| Age Bracket | With Coverage | Without Coverage |
| Under 6 Years | 2 (100.0%) | 0 (0.0%) |
| 6 to 18 Years | 50 (76.9%) | 15 (23.1%) |
| 19 to 25 Years | 10 (76.9%) | 3 (23.1%) |
| 26 to 34 Years | 7 (100.0%) | 0 (0.0%) |
| 35 to 44 Years | 31 (72.1%) | 12 (27.9%) |
| 45 to 54 Years | 29 (96.7%) | 1 (3.3%) |
| 55 to 64 Years | 48 (96.0%) | 2 (4.0%) |
| 65 to 74 Years | 63 (100.0%) | 0 (0.0%) |
| 75 Years and older | 52 (96.3%) | 2 (3.7%) |
| Total | 292 (89.3%) | 35 (10.7%) |
Health Insurance Coverage by Citizenship Status in Kanarraville
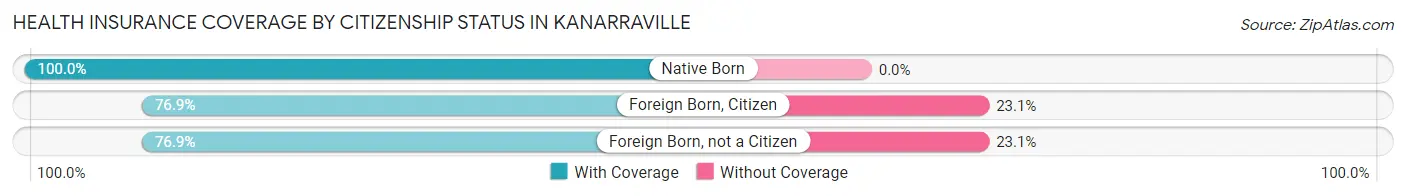
| Citizenship Status | With Coverage | Without Coverage |
| Native Born | 2 (100.0%) | 0 (0.0%) |
| Foreign Born, Citizen | 50 (76.9%) | 15 (23.1%) |
| Foreign Born, not a Citizen | 10 (76.9%) | 3 (23.1%) |
Health Insurance Coverage by Household Income in Kanarraville
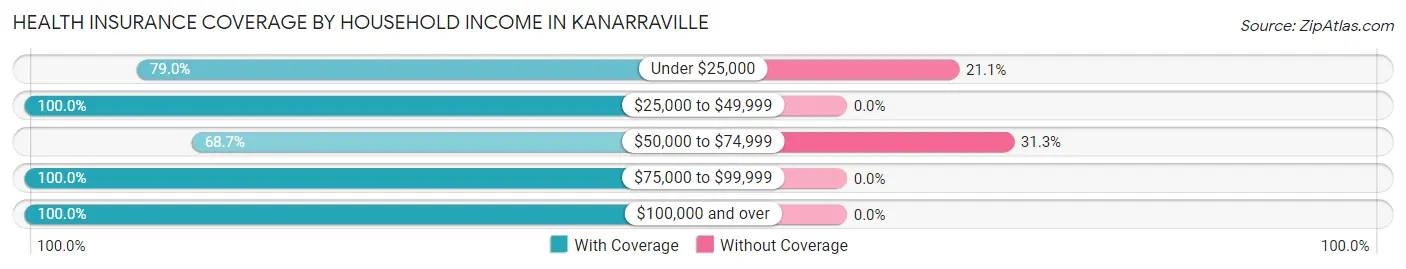
| Household Income | With Coverage | Without Coverage |
| Under $25,000 | 15 (78.9%) | 4 (21.0%) |
| $25,000 to $49,999 | 37 (100.0%) | 0 (0.0%) |
| $50,000 to $74,999 | 68 (68.7%) | 31 (31.3%) |
| $75,000 to $99,999 | 2 (100.0%) | 0 (0.0%) |
| $100,000 and over | 170 (100.0%) | 0 (0.0%) |
Public vs Private Health Insurance Coverage by Age in Kanarraville
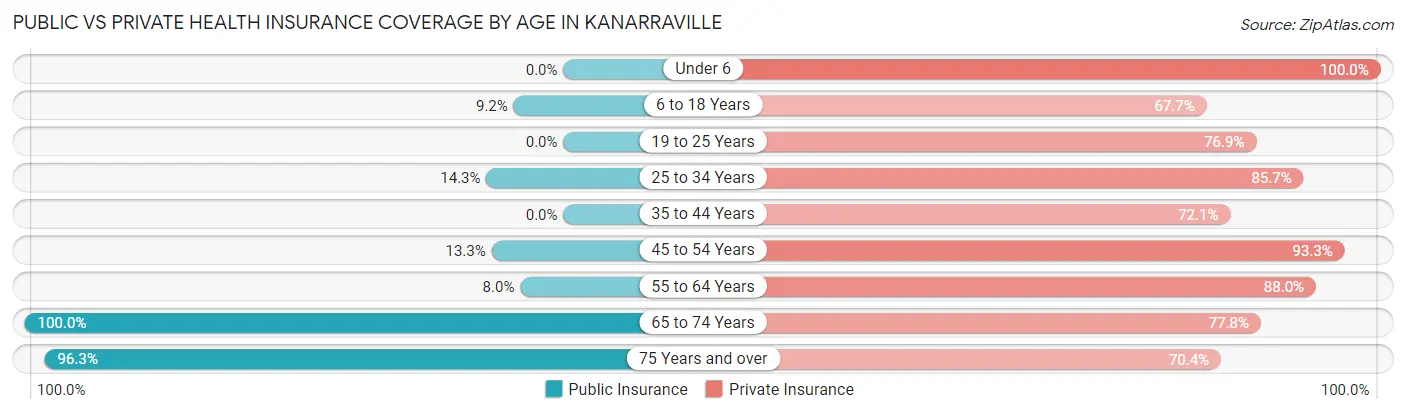
| Age Bracket | Public Insurance | Private Insurance |
| Under 6 | 0 (0.0%) | 2 (100.0%) |
| 6 to 18 Years | 6 (9.2%) | 44 (67.7%) |
| 19 to 25 Years | 0 (0.0%) | 10 (76.9%) |
| 25 to 34 Years | 1 (14.3%) | 6 (85.7%) |
| 35 to 44 Years | 0 (0.0%) | 31 (72.1%) |
| 45 to 54 Years | 4 (13.3%) | 28 (93.3%) |
| 55 to 64 Years | 4 (8.0%) | 44 (88.0%) |
| 65 to 74 Years | 63 (100.0%) | 49 (77.8%) |
| 75 Years and over | 52 (96.3%) | 38 (70.4%) |
| Total | 130 (39.8%) | 252 (77.1%) |
Disability Status by Sex by Age in Kanarraville
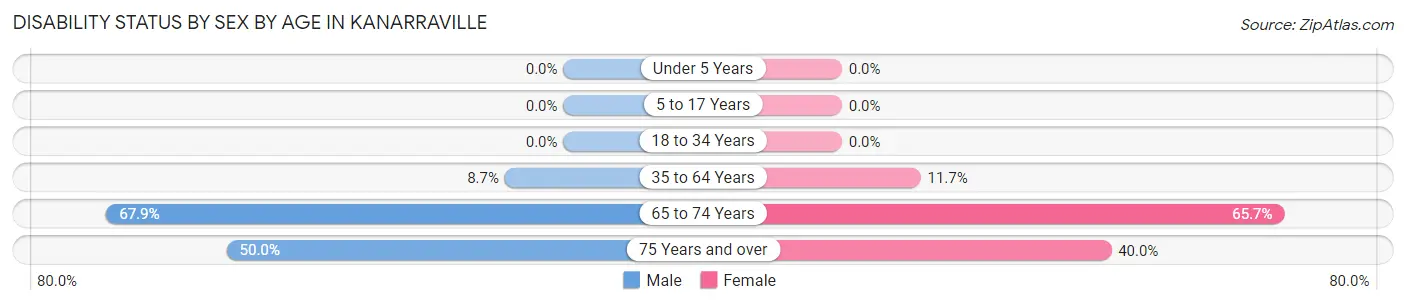
| Age Bracket | Male | Female |
| Under 5 Years | 0 (0.0%) | 0 (0.0%) |
| 5 to 17 Years | 0 (0.0%) | 0 (0.0%) |
| 18 to 34 Years | 0 (0.0%) | 0 (0.0%) |
| 35 to 64 Years | 4 (8.7%) | 9 (11.7%) |
| 65 to 74 Years | 19 (67.9%) | 23 (65.7%) |
| 75 Years and over | 22 (50.0%) | 4 (40.0%) |
Disability Class by Sex by Age in Kanarraville
Disability Class: Hearing Difficulty
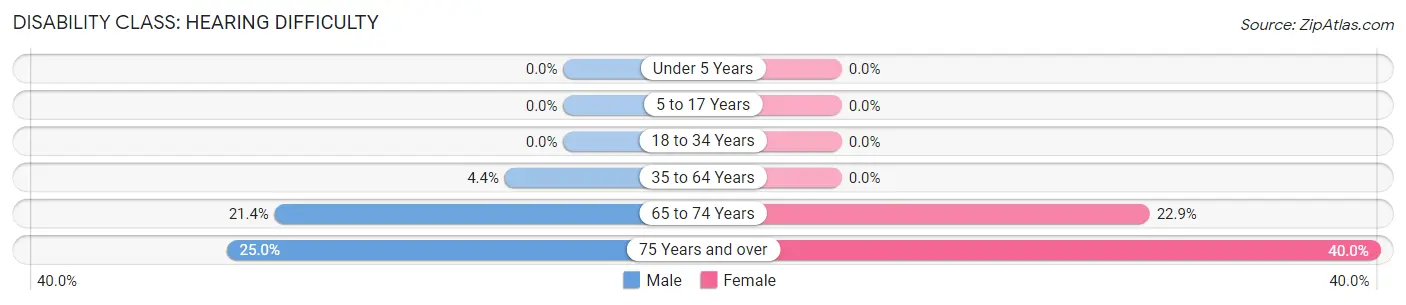
| Age Bracket | Male | Female |
| Under 5 Years | 0 (0.0%) | 0 (0.0%) |
| 5 to 17 Years | 0 (0.0%) | 0 (0.0%) |
| 18 to 34 Years | 0 (0.0%) | 0 (0.0%) |
| 35 to 64 Years | 2 (4.3%) | 0 (0.0%) |
| 65 to 74 Years | 6 (21.4%) | 8 (22.9%) |
| 75 Years and over | 11 (25.0%) | 4 (40.0%) |
Disability Class: Vision Difficulty
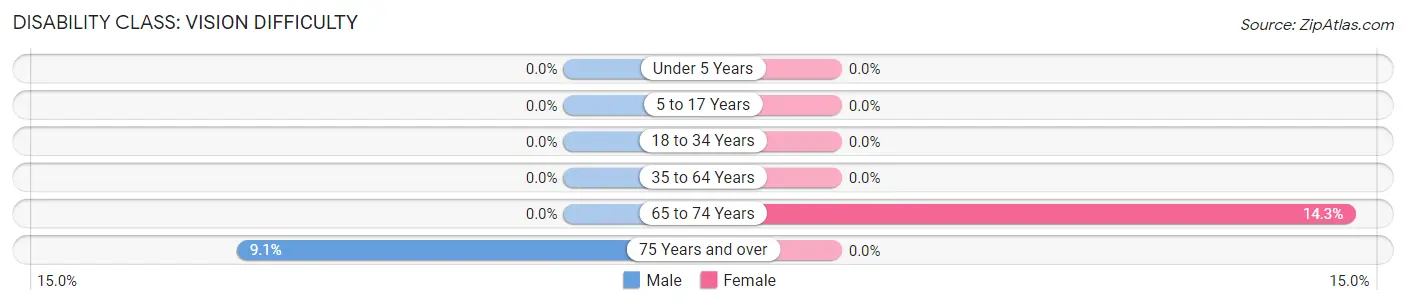
| Age Bracket | Male | Female |
| Under 5 Years | 0 (0.0%) | 0 (0.0%) |
| 5 to 17 Years | 0 (0.0%) | 0 (0.0%) |
| 18 to 34 Years | 0 (0.0%) | 0 (0.0%) |
| 35 to 64 Years | 0 (0.0%) | 0 (0.0%) |
| 65 to 74 Years | 0 (0.0%) | 5 (14.3%) |
| 75 Years and over | 4 (9.1%) | 0 (0.0%) |
Disability Class: Cognitive Difficulty
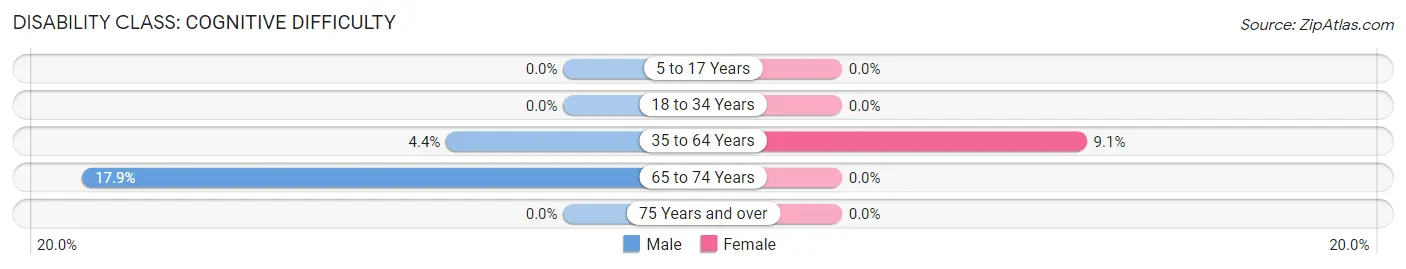
| Age Bracket | Male | Female |
| 5 to 17 Years | 0 (0.0%) | 0 (0.0%) |
| 18 to 34 Years | 0 (0.0%) | 0 (0.0%) |
| 35 to 64 Years | 2 (4.3%) | 7 (9.1%) |
| 65 to 74 Years | 5 (17.9%) | 0 (0.0%) |
| 75 Years and over | 0 (0.0%) | 0 (0.0%) |
Disability Class: Ambulatory Difficulty
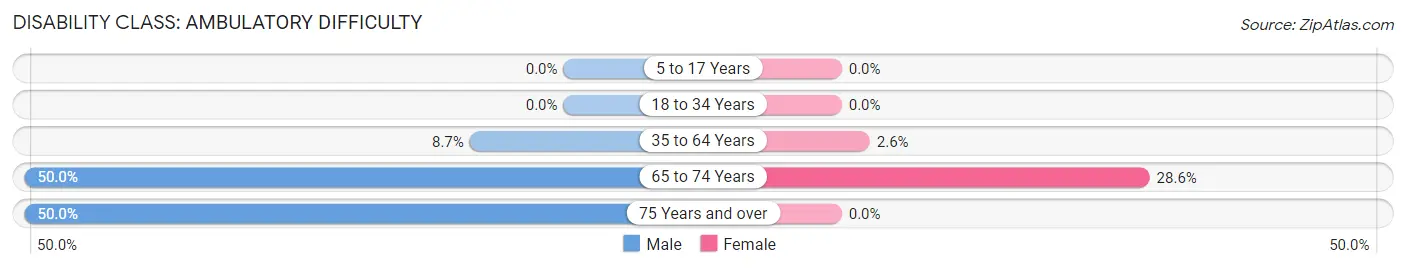
| Age Bracket | Male | Female |
| 5 to 17 Years | 0 (0.0%) | 0 (0.0%) |
| 18 to 34 Years | 0 (0.0%) | 0 (0.0%) |
| 35 to 64 Years | 4 (8.7%) | 2 (2.6%) |
| 65 to 74 Years | 14 (50.0%) | 10 (28.6%) |
| 75 Years and over | 22 (50.0%) | 0 (0.0%) |
Disability Class: Self-Care Difficulty
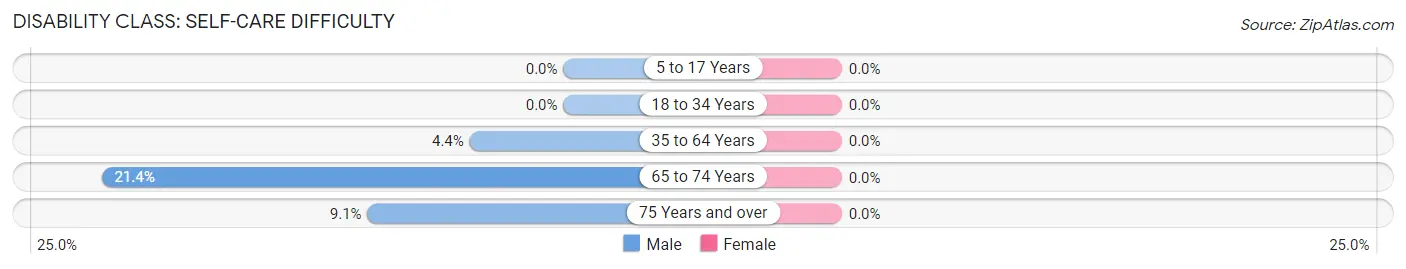
| Age Bracket | Male | Female |
| 5 to 17 Years | 0 (0.0%) | 0 (0.0%) |
| 18 to 34 Years | 0 (0.0%) | 0 (0.0%) |
| 35 to 64 Years | 2 (4.3%) | 0 (0.0%) |
| 65 to 74 Years | 6 (21.4%) | 0 (0.0%) |
| 75 Years and over | 4 (9.1%) | 0 (0.0%) |
Technology Access in Kanarraville
Computing Device Access in Kanarraville
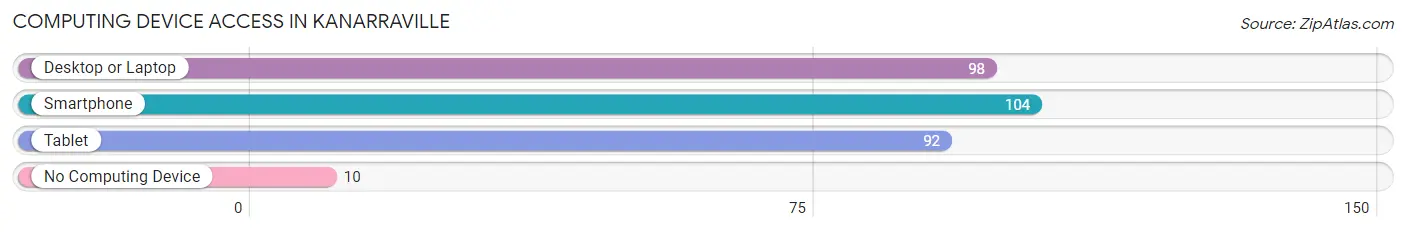
| Device Type | # Households | % Households |
| Desktop or Laptop | 98 | 76.6% |
| Smartphone | 104 | 81.2% |
| Tablet | 92 | 71.9% |
| No Computing Device | 10 | 7.8% |
| Total | 128 | 100.0% |
Internet Access in Kanarraville
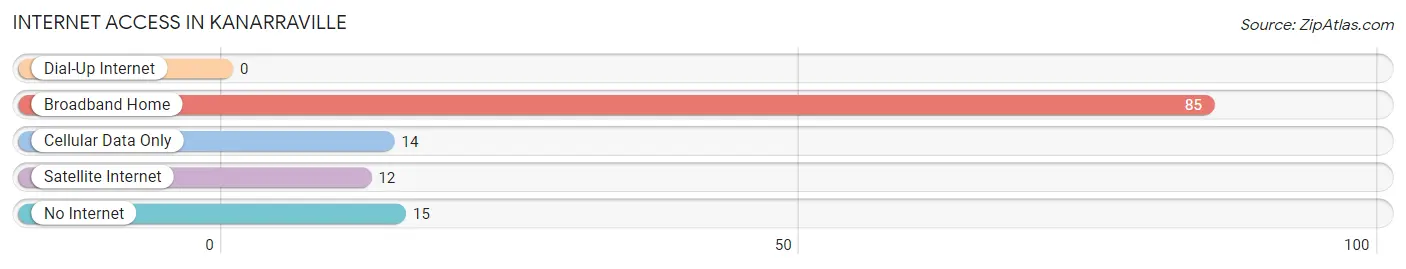
| Internet Type | # Households | % Households |
| Dial-Up Internet | 0 | 0.0% |
| Broadband Home | 85 | 66.4% |
| Cellular Data Only | 14 | 10.9% |
| Satellite Internet | 12 | 9.4% |
| No Internet | 15 | 11.7% |
| Total | 128 | 100.0% |
Kanarraville Summary
Kanarraville is a small town located in Iron County, Utah, United States. It is situated in the southwestern part of the state, near the Arizona border. The town is located along the Virgin River, and is home to a population of approximately 300 people.
History
Kanarraville was first settled in 1859 by a group of Mormon pioneers led by John D. Lee. The town was named after the nearby Kanarra Creek, which was named after a Paiute Indian chief. The town was originally intended to be a farming community, but the settlers soon discovered that the soil was not suitable for farming. Instead, they turned to ranching and mining, and the town quickly grew.
In 1866, the town was officially incorporated, and it became the county seat of Iron County. The town was a popular stop for travelers on the Old Spanish Trail, and it was also a major trading post for the local Paiute Indians.
Geography
Kanarraville is located in southwestern Utah, near the Arizona border. It is situated along the Virgin River, and is surrounded by the Kanarra Mountains. The town is located at an elevation of 4,400 feet, and has a total area of 0.7 square miles.
The climate in Kanarraville is semi-arid, with hot summers and mild winters. The average annual temperature is around 60 degrees Fahrenheit, and the average annual precipitation is around 8 inches.
Economy
Kanarraville’s economy is largely based on tourism. The town is home to several popular attractions, including the Kanarraville Falls, which is a popular hiking destination. The town is also home to several restaurants, shops, and other businesses that cater to tourists.
In addition to tourism, the town is also home to several small businesses, including a grocery store, a hardware store, and a gas station. The town is also home to a small manufacturing plant that produces plastic products.
Demographics
As of the 2010 census, Kanarraville had a population of 300 people. The racial makeup of the town was 97.3% White, 0.7% Native American, 0.3% Asian, and 1.7% from other races. The median household income was $37,500, and the median family income was $41,250.
Kanarraville is a small, rural town with a close-knit community. The town is home to several churches, and the local school district serves the town’s children. The town is also home to several parks and recreational areas, including the Kanarraville Falls.
Common Questions
What is Per Capita Income in Kanarraville?
Per Capita income in Kanarraville is $39,923.
What is the Median Family Income in Kanarraville?
Median Family Income in Kanarraville is $129,750.
What is the Median Household income in Kanarraville?
Median Household Income in Kanarraville is $71,250.
What is Income or Wage Gap in Kanarraville?
Income or Wage Gap in Kanarraville is 42.7%.
Women in Kanarraville earn 57.3 cents for every dollar earned by a man.
What is Inequality or Gini Index in Kanarraville?
Inequality or Gini Index in Kanarraville is 0.37.
What is the Total Population of Kanarraville?
Total Population of Kanarraville is 327.
What is the Total Male Population of Kanarraville?
Total Male Population of Kanarraville is 159.
What is the Total Female Population of Kanarraville?
Total Female Population of Kanarraville is 168.
What is the Ratio of Males per 100 Females in Kanarraville?
There are 94.64 Males per 100 Females in Kanarraville.
What is the Ratio of Females per 100 Males in Kanarraville?
There are 105.66 Females per 100 Males in Kanarraville.
What is the Median Population Age in Kanarraville?
Median Population Age in Kanarraville is 55.6 Years.
What is the Average Family Size in Kanarraville
Average Family Size in Kanarraville is 2.9 People.
What is the Average Household Size in Kanarraville
Average Household Size in Kanarraville is 2.5 People.
How Large is the Labor Force in Kanarraville?
There are 160 People in the Labor Forcein in Kanarraville.
What is the Percentage of People in the Labor Force in Kanarraville?
56.9% of People are in the Labor Force in Kanarraville.