Bluffdale, UT Map & Demographics
Bluffdale Map
Bluffdale Overview
$43,491
PER CAPITA INCOME
$137,679
AVG FAMILY INCOME
$119,009
AVG HOUSEHOLD INCOME
50.2%
WAGE / INCOME GAP [ % ]
49.8¢/ $1
WAGE / INCOME GAP [ $ ]
0.36
INEQUALITY / GINI INDEX
17,460
TOTAL POPULATION
8,820
MALE POPULATION
8,640
FEMALE POPULATION
102.08
MALES / 100 FEMALES
97.96
FEMALES / 100 MALES
31.4
MEDIAN AGE
3.8
AVG FAMILY SIZE
3.4
AVG HOUSEHOLD SIZE
9,415
LABOR FORCE [ PEOPLE ]
77.2%
PERCENT IN LABOR FORCE
2.2%
UNEMPLOYMENT RATE
Income in Bluffdale
Income Overview in Bluffdale
Per Capita Income in Bluffdale is $43,491, while median incomes of families and households are $137,679 and $119,009 respectively.
| Characteristic | Number | Measure |
| Per Capita Income | 17,460 | $43,491 |
| Median Family Income | 4,189 | $137,679 |
| Mean Family Income | 4,189 | $156,089 |
| Median Household Income | 5,167 | $119,009 |
| Mean Household Income | 5,167 | $145,008 |
| Income Deficit | 4,189 | $0 |
| Wage / Income Gap (%) | 17,460 | 50.21% |
| Wage / Income Gap ($) | 17,460 | 49.79¢ per $1 |
| Gini / Inequality Index | 17,460 | 0.36 |
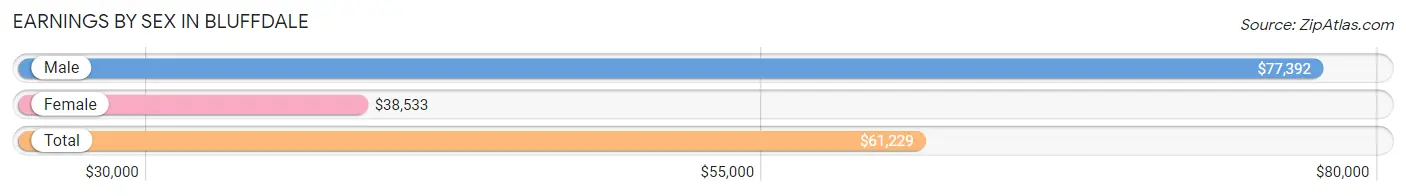
Earnings by Sex in Bluffdale
Average Earnings in Bluffdale are $61,229, $77,392 for men and $38,533 for women, a difference of 50.2%.
| Sex | Number | Average Earnings |
| Male | 5,185 (53.9%) | $77,392 |
| Female | 4,438 (46.1%) | $38,533 |
| Total | 9,623 (100.0%) | $61,229 |
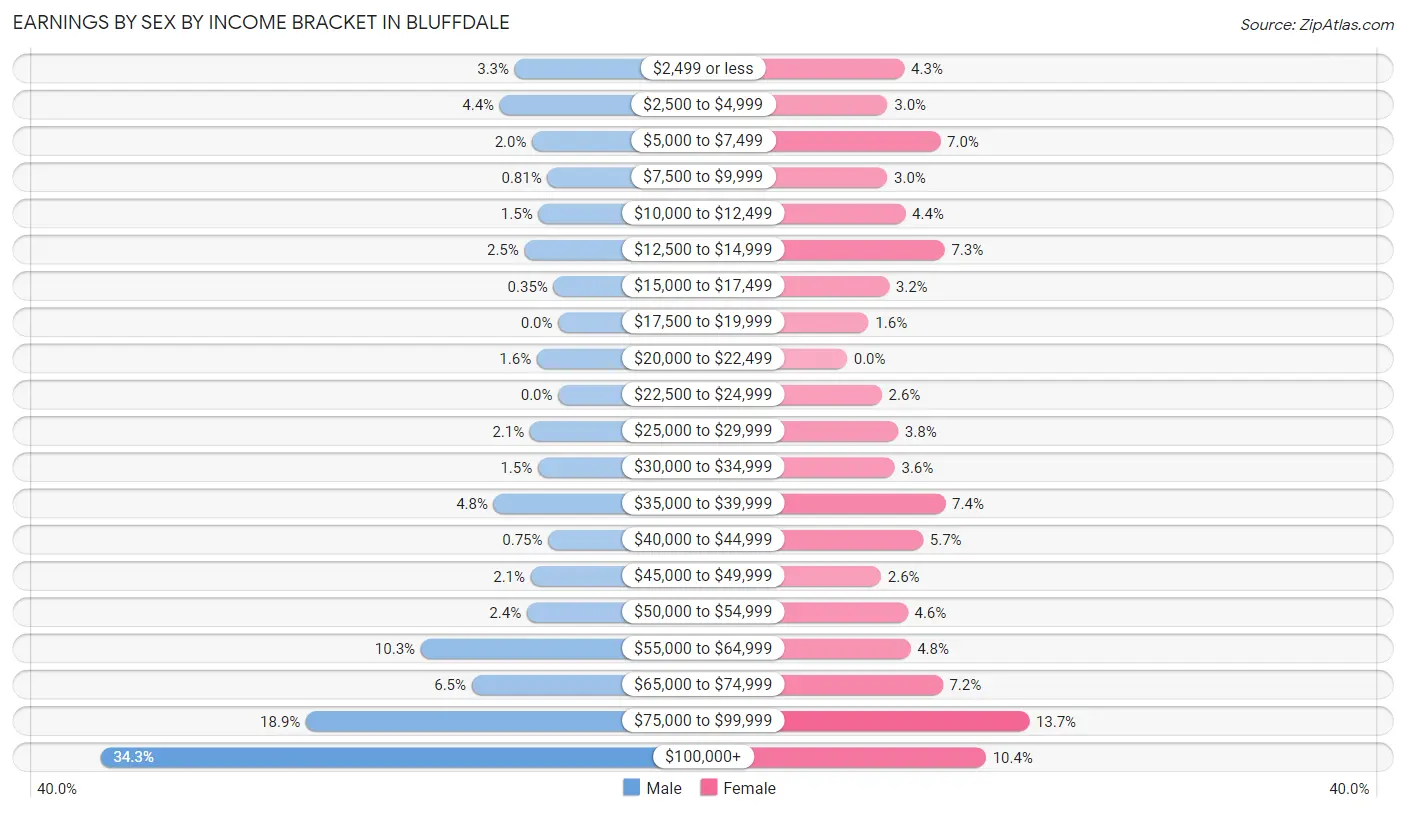
Earnings by Sex by Income Bracket in Bluffdale
The most common earnings brackets in Bluffdale are $100,000+ for men (1,779 | 34.3%) and $75,000 to $99,999 for women (606 | 13.7%).
| Income | Male | Female |
| $2,499 or less | 169 (3.3%) | 191 (4.3%) |
| $2,500 to $4,999 | 227 (4.4%) | 135 (3.0%) |
| $5,000 to $7,499 | 101 (1.9%) | 310 (7.0%) |
| $7,500 to $9,999 | 42 (0.8%) | 134 (3.0%) |
| $10,000 to $12,499 | 77 (1.5%) | 194 (4.4%) |
| $12,500 to $14,999 | 131 (2.5%) | 325 (7.3%) |
| $15,000 to $17,499 | 18 (0.4%) | 140 (3.2%) |
| $17,500 to $19,999 | 0 (0.0%) | 72 (1.6%) |
| $20,000 to $22,499 | 83 (1.6%) | 0 (0.0%) |
| $22,500 to $24,999 | 0 (0.0%) | 116 (2.6%) |
| $25,000 to $29,999 | 110 (2.1%) | 170 (3.8%) |
| $30,000 to $34,999 | 79 (1.5%) | 159 (3.6%) |
| $35,000 to $39,999 | 251 (4.8%) | 327 (7.4%) |
| $40,000 to $44,999 | 39 (0.7%) | 253 (5.7%) |
| $45,000 to $49,999 | 107 (2.1%) | 113 (2.5%) |
| $50,000 to $54,999 | 122 (2.4%) | 202 (4.5%) |
| $55,000 to $64,999 | 534 (10.3%) | 211 (4.8%) |
| $65,000 to $74,999 | 336 (6.5%) | 318 (7.2%) |
| $75,000 to $99,999 | 980 (18.9%) | 606 (13.7%) |
| $100,000+ | 1,779 (34.3%) | 462 (10.4%) |
| Total | 5,185 (100.0%) | 4,438 (100.0%) |
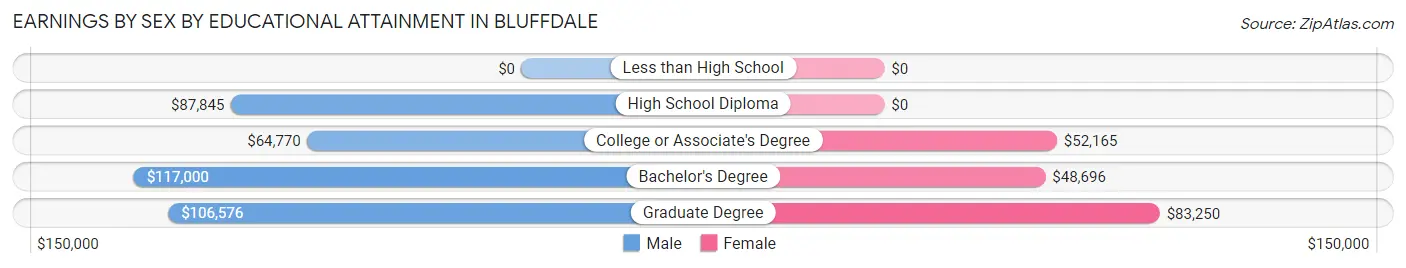
Earnings by Sex by Educational Attainment in Bluffdale
Average earnings in Bluffdale are $88,146 for men and $44,398 for women, a difference of 49.6%. Men with an educational attainment of bachelor's degree enjoy the highest average annual earnings of $117,000, while those with college or associate's degree education earn the least with $64,770. Women with an educational attainment of graduate degree earn the most with the average annual earnings of $83,250, while those with bachelor's degree education have the smallest earnings of $48,696.
| Educational Attainment | Male Income | Female Income |
| Less than High School | - | - |
| High School Diploma | $87,845 | $0 |
| College or Associate's Degree | $64,770 | $52,165 |
| Bachelor's Degree | $117,000 | $48,696 |
| Graduate Degree | $106,576 | $83,250 |
| Total | $88,146 | $44,398 |
Family Income in Bluffdale
Family Income Brackets in Bluffdale
According to the Bluffdale family income data, there are 1,060 families falling into the $200,000+ income range, which is the most common income bracket and makes up 25.3% of all families. Conversely, the less than $10,000 income bracket is the least frequent group with only 21 families (0.5%) belonging to this category.
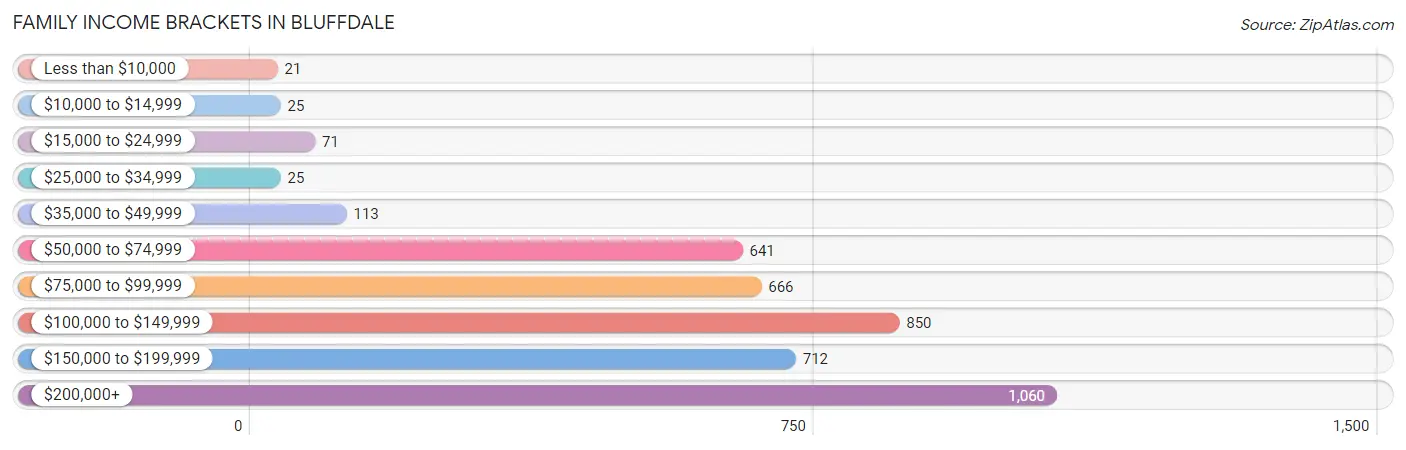
| Income Bracket | # Families | % Families |
| Less than $10,000 | 21 | 0.5% |
| $10,000 to $14,999 | 25 | 0.6% |
| $15,000 to $24,999 | 71 | 1.7% |
| $25,000 to $34,999 | 25 | 0.6% |
| $35,000 to $49,999 | 113 | 2.7% |
| $50,000 to $74,999 | 641 | 15.3% |
| $75,000 to $99,999 | 666 | 15.9% |
| $100,000 to $149,999 | 850 | 20.3% |
| $150,000 to $199,999 | 712 | 17.0% |
| $200,000+ | 1,060 | 25.3% |
Family Income by Famaliy Size in Bluffdale
7+ person families (242 | 5.8%) account for the highest median family income in Bluffdale with $193,654 per family, while 2-person families (1,250 | 29.8%) have the highest median income of $58,438 per family member.
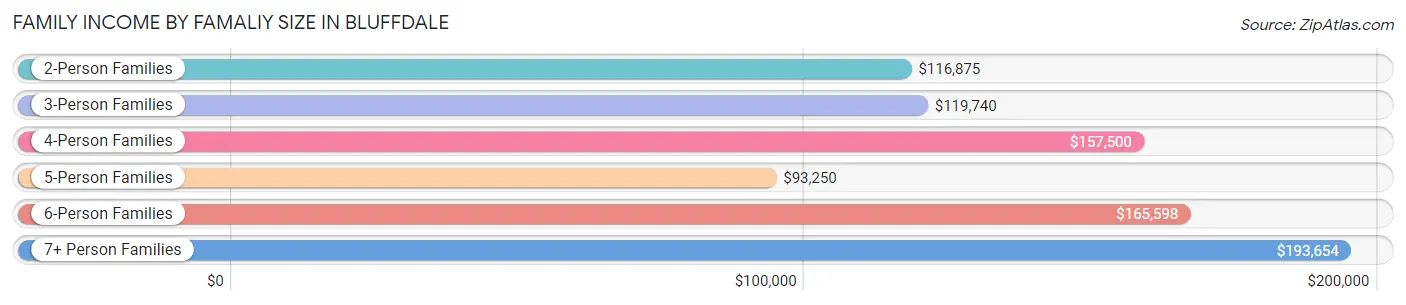
| Income Bracket | # Families | Median Income |
| 2-Person Families | 1,250 (29.8%) | $116,875 |
| 3-Person Families | 973 (23.2%) | $119,740 |
| 4-Person Families | 620 (14.8%) | $157,500 |
| 5-Person Families | 853 (20.4%) | $93,250 |
| 6-Person Families | 251 (6.0%) | $165,598 |
| 7+ Person Families | 242 (5.8%) | $193,654 |
| Total | 4,189 (100.0%) | $137,679 |
Family Income by Number of Earners in Bluffdale
The median family income in Bluffdale is $137,679, with families comprising 3+ earners (699) having the highest median family income of $217,548, while families with no earners (252) have the lowest median family income of $86,458, accounting for 16.7% and 6.0% of families, respectively.
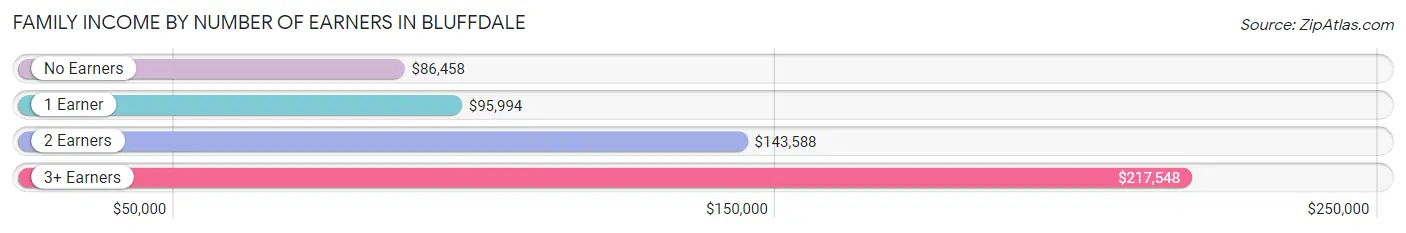
| Number of Earners | # Families | Median Income |
| No Earners | 252 (6.0%) | $86,458 |
| 1 Earner | 889 (21.2%) | $95,994 |
| 2 Earners | 2,349 (56.1%) | $143,588 |
| 3+ Earners | 699 (16.7%) | $217,548 |
| Total | 4,189 (100.0%) | $137,679 |
Household Income in Bluffdale
Household Income Brackets in Bluffdale
With 1,147 households falling in the category, the $200,000+ income range is the most frequent in Bluffdale, accounting for 22.2% of all households. In contrast, only 16 households (0.3%) fall into the $15,000 to $24,999 income bracket, making it the least populous group.
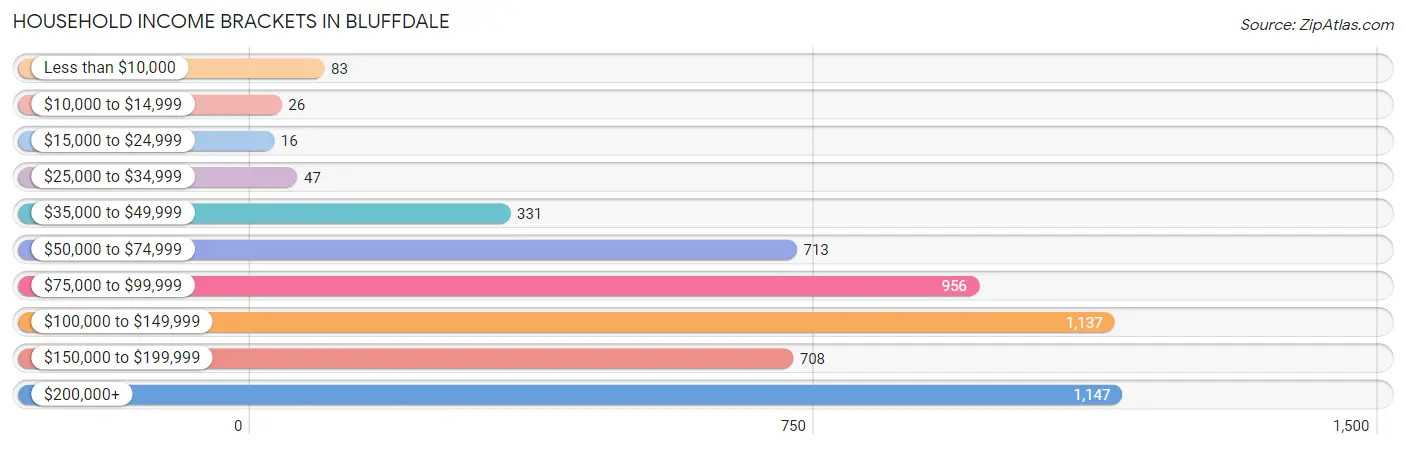
| Income Bracket | # Households | % Households |
| Less than $10,000 | 83 | 1.6% |
| $10,000 to $14,999 | 26 | 0.5% |
| $15,000 to $24,999 | 16 | 0.3% |
| $25,000 to $34,999 | 47 | 0.9% |
| $35,000 to $49,999 | 331 | 6.4% |
| $50,000 to $74,999 | 713 | 13.8% |
| $75,000 to $99,999 | 956 | 18.5% |
| $100,000 to $149,999 | 1,137 | 22.0% |
| $150,000 to $199,999 | 708 | 13.7% |
| $200,000+ | 1,147 | 22.2% |
Household Income by Householder Age in Bluffdale
The median household income in Bluffdale is $119,009, with the highest median household income of $174,953 found in the 45 to 64 years age bracket for the primary householder. A total of 1,282 households (24.8%) fall into this category. Meanwhile, the 15 to 24 years age bracket for the primary householder has the lowest median household income of $0, with 72 households (1.4%) in this group.
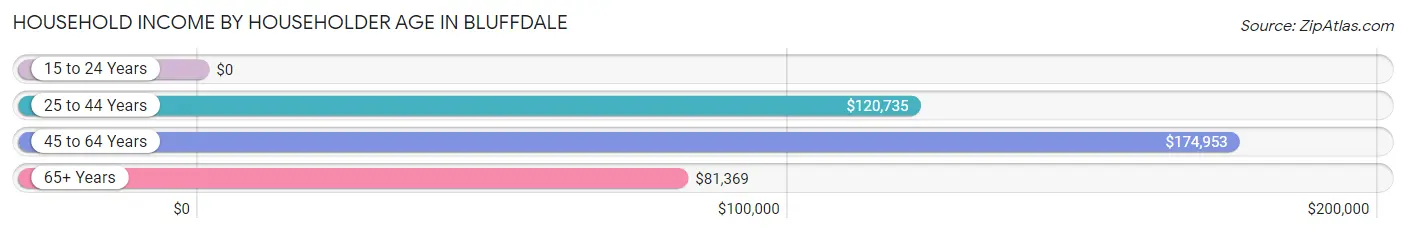
| Income Bracket | # Households | Median Income |
| 15 to 24 Years | 72 (1.4%) | $0 |
| 25 to 44 Years | 3,066 (59.3%) | $120,735 |
| 45 to 64 Years | 1,282 (24.8%) | $174,953 |
| 65+ Years | 747 (14.5%) | $81,369 |
| Total | 5,167 (100.0%) | $119,009 |
Poverty in Bluffdale
Income Below Poverty by Sex and Age in Bluffdale
With 4.0% poverty level for males and 3.2% for females among the residents of Bluffdale, 18 to 24 year old males and under 5 year old females are the most vulnerable to poverty, with 194 males (30.5%) and 68 females (10.4%) in their respective age groups living below the poverty level.
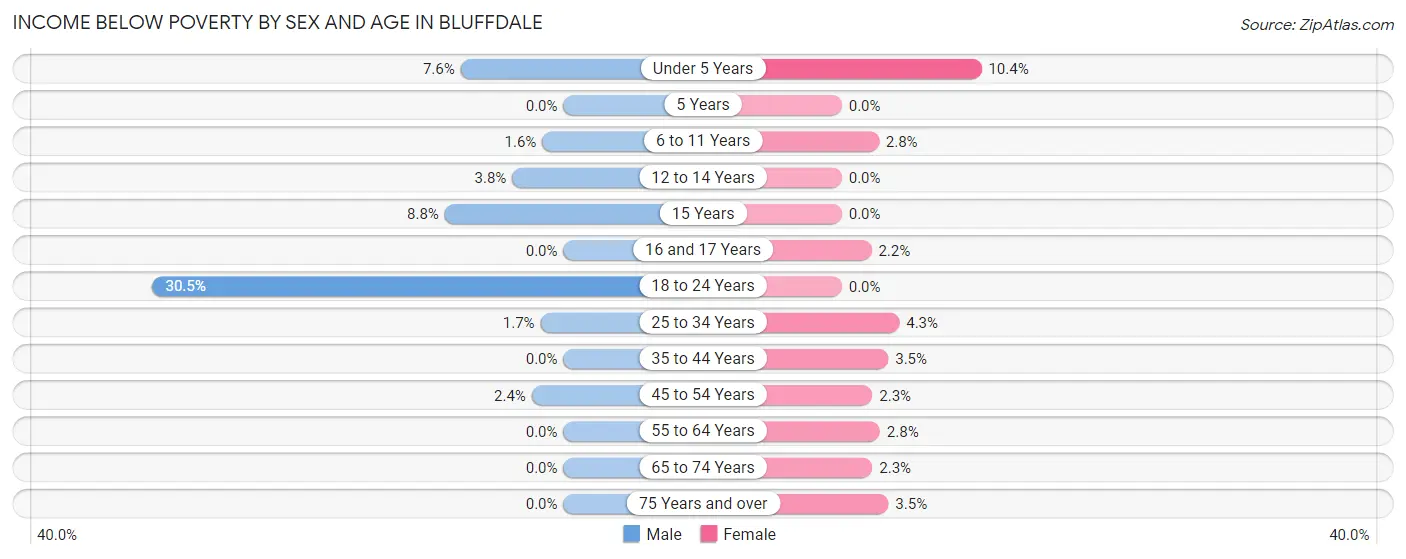
| Age Bracket | Male | Female |
| Under 5 Years | 55 (7.6%) | 68 (10.4%) |
| 5 Years | 0 (0.0%) | 0 (0.0%) |
| 6 to 11 Years | 19 (1.6%) | 27 (2.8%) |
| 12 to 14 Years | 20 (3.8%) | 0 (0.0%) |
| 15 Years | 20 (8.8%) | 0 (0.0%) |
| 16 and 17 Years | 0 (0.0%) | 8 (2.2%) |
| 18 to 24 Years | 194 (30.5%) | 0 (0.0%) |
| 25 to 34 Years | 26 (1.7%) | 56 (4.3%) |
| 35 to 44 Years | 0 (0.0%) | 65 (3.5%) |
| 45 to 54 Years | 21 (2.4%) | 21 (2.3%) |
| 55 to 64 Years | 0 (0.0%) | 13 (2.8%) |
| 65 to 74 Years | 0 (0.0%) | 7 (2.3%) |
| 75 Years and over | 0 (0.0%) | 15 (3.5%) |
| Total | 355 (4.0%) | 280 (3.2%) |
Income Above Poverty by Sex and Age in Bluffdale
According to the poverty statistics in Bluffdale, males aged 5 years and females aged 5 years are the age groups that are most secure financially, with 100.0% of males and 100.0% of females in these age groups living above the poverty line.
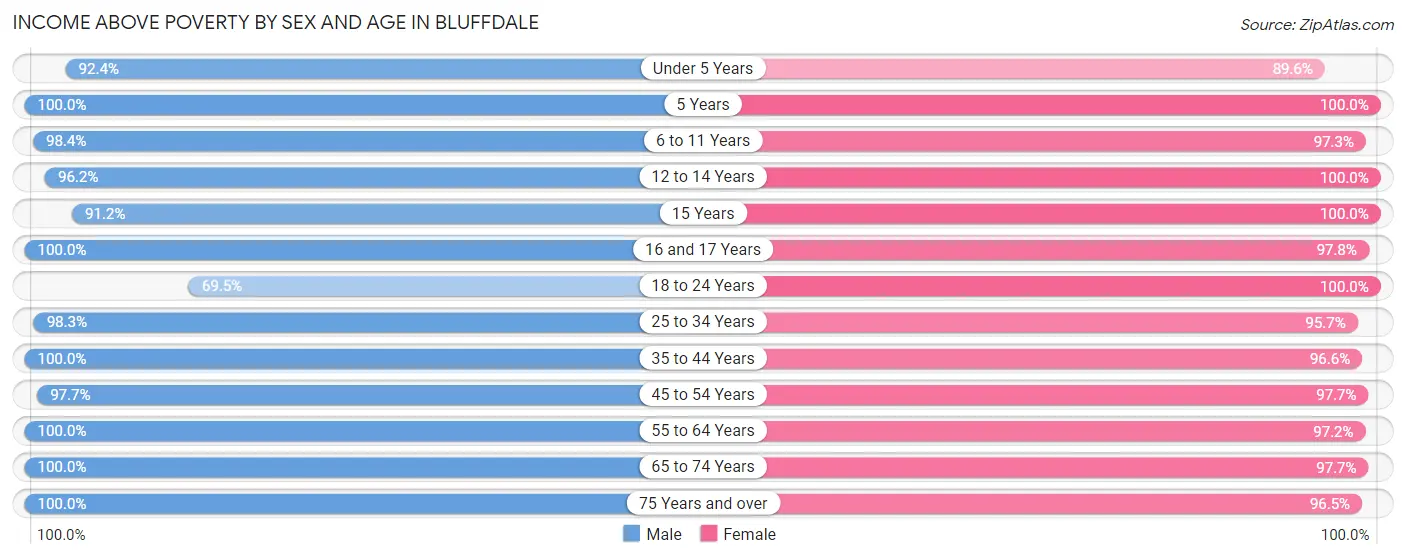
| Age Bracket | Male | Female |
| Under 5 Years | 666 (92.4%) | 588 (89.6%) |
| 5 Years | 243 (100.0%) | 184 (100.0%) |
| 6 to 11 Years | 1,190 (98.4%) | 955 (97.3%) |
| 12 to 14 Years | 506 (96.2%) | 321 (100.0%) |
| 15 Years | 207 (91.2%) | 196 (100.0%) |
| 16 and 17 Years | 268 (100.0%) | 356 (97.8%) |
| 18 to 24 Years | 442 (69.5%) | 610 (100.0%) |
| 25 to 34 Years | 1,506 (98.3%) | 1,257 (95.7%) |
| 35 to 44 Years | 1,646 (100.0%) | 1,820 (96.6%) |
| 45 to 54 Years | 871 (97.7%) | 906 (97.7%) |
| 55 to 64 Years | 367 (100.0%) | 447 (97.2%) |
| 65 to 74 Years | 360 (100.0%) | 301 (97.7%) |
| 75 Years and over | 193 (100.0%) | 419 (96.5%) |
| Total | 8,465 (96.0%) | 8,360 (96.8%) |
Income Below Poverty Among Married-Couple Families in Bluffdale
The poverty statistics for married-couple families in Bluffdale show that 1.3% or 47 of the total 3,544 families live below the poverty line. Families with 3 or 4 children have the highest poverty rate of 5.7%, comprising of 47 families. On the other hand, families with no children have the lowest poverty rate of 0.0%, which includes 0 families.
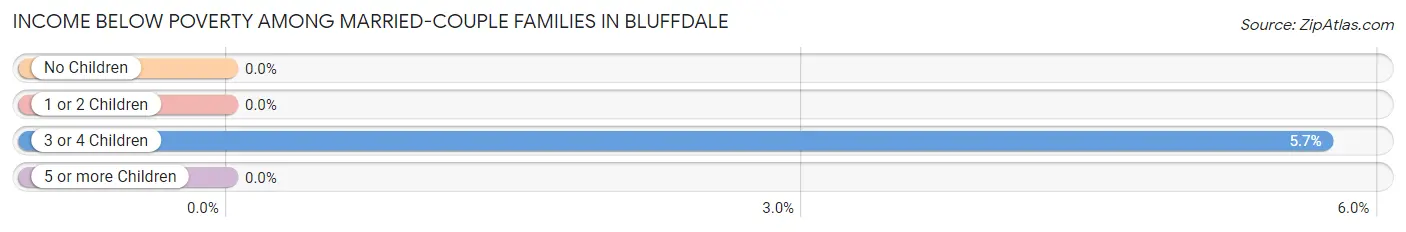
| Children | Above Poverty | Below Poverty |
| No Children | 1,301 (100.0%) | 0 (0.0%) |
| 1 or 2 Children | 1,304 (100.0%) | 0 (0.0%) |
| 3 or 4 Children | 774 (94.3%) | 47 (5.7%) |
| 5 or more Children | 118 (100.0%) | 0 (0.0%) |
| Total | 3,497 (98.7%) | 47 (1.3%) |
Income Below Poverty Among Single-Parent Households in Bluffdale
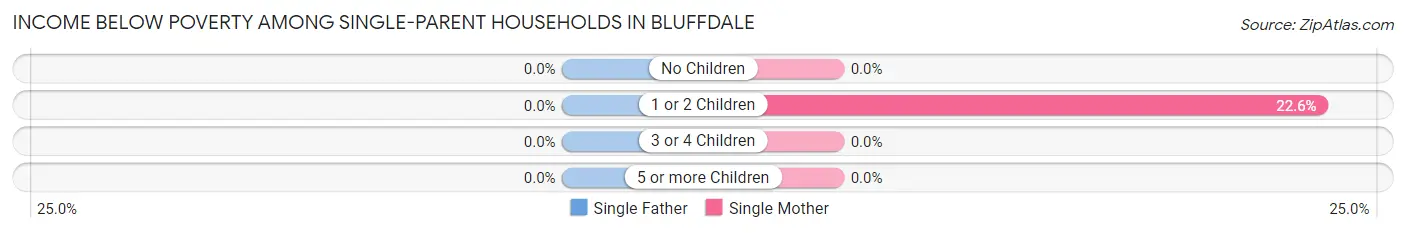
| Children | Single Father | Single Mother |
| No Children | 0 (0.0%) | 0 (0.0%) |
| 1 or 2 Children | 0 (0.0%) | 72 (22.6%) |
| 3 or 4 Children | 0 (0.0%) | 0 (0.0%) |
| 5 or more Children | 0 (0.0%) | 0 (0.0%) |
| Total | 0 (0.0%) | 72 (16.5%) |
Income Below Poverty Among Married-Couple vs Single-Parent Households in Bluffdale
The poverty data for Bluffdale shows that 47 of the married-couple family households (1.3%) and 72 of the single-parent households (11.2%) are living below the poverty level. Within the married-couple family households, those with 3 or 4 children have the highest poverty rate, with 47 households (5.7%) falling below the poverty line. Among the single-parent households, those with 1 or 2 children have the highest poverty rate, with 72 household (18.6%) living below poverty.
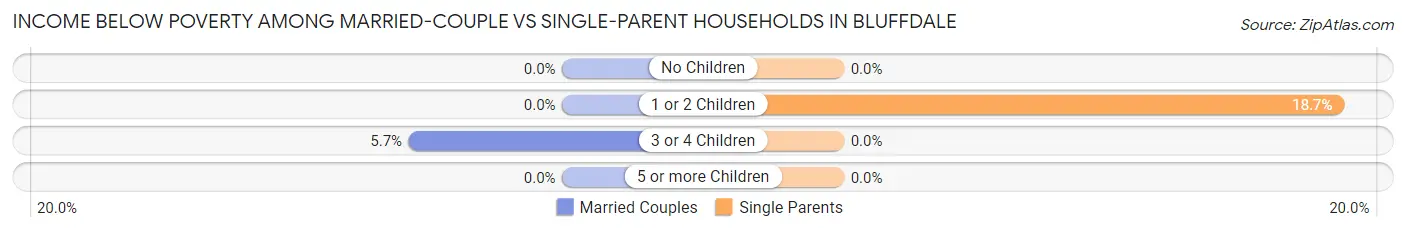
| Children | Married-Couple Families | Single-Parent Households |
| No Children | 0 (0.0%) | 0 (0.0%) |
| 1 or 2 Children | 0 (0.0%) | 72 (18.6%) |
| 3 or 4 Children | 47 (5.7%) | 0 (0.0%) |
| 5 or more Children | 0 (0.0%) | 0 (0.0%) |
| Total | 47 (1.3%) | 72 (11.2%) |
Race in Bluffdale
The most populous races in Bluffdale are White / Caucasian (15,719 | 90.0%), Hispanic or Latino (993 | 5.7%), and Two or more Races (957 | 5.5%).
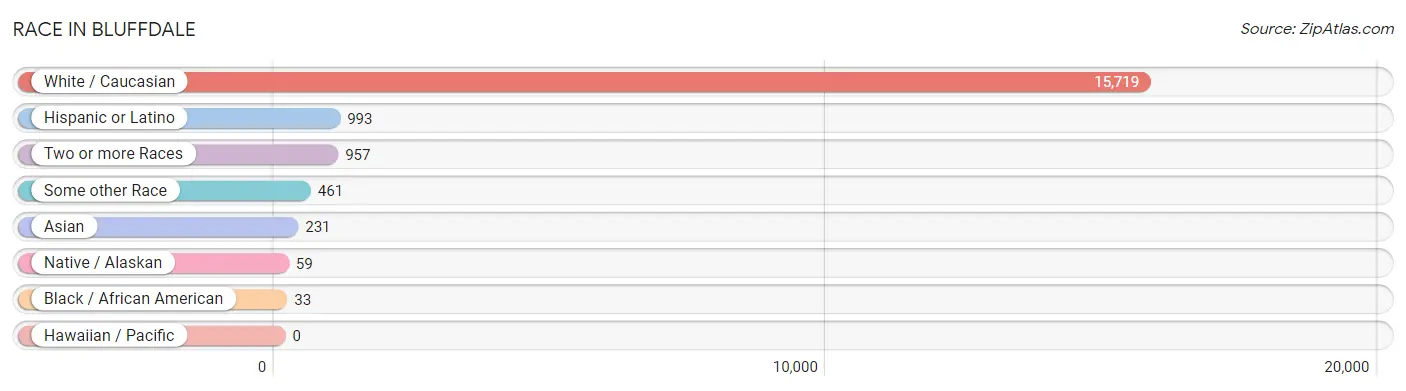
| Race | # Population | % Population |
| Asian | 231 | 1.3% |
| Black / African American | 33 | 0.2% |
| Hawaiian / Pacific | 0 | 0.0% |
| Hispanic or Latino | 993 | 5.7% |
| Native / Alaskan | 59 | 0.3% |
| White / Caucasian | 15,719 | 90.0% |
| Two or more Races | 957 | 5.5% |
| Some other Race | 461 | 2.6% |
| Total | 17,460 | 100.0% |
Ancestry in Bluffdale
The most populous ancestries reported in Bluffdale are English (5,239 | 30.0%), Irish (1,569 | 9.0%), German (1,532 | 8.8%), European (1,237 | 7.1%), and British (1,009 | 5.8%), together accounting for 60.6% of all Bluffdale residents.
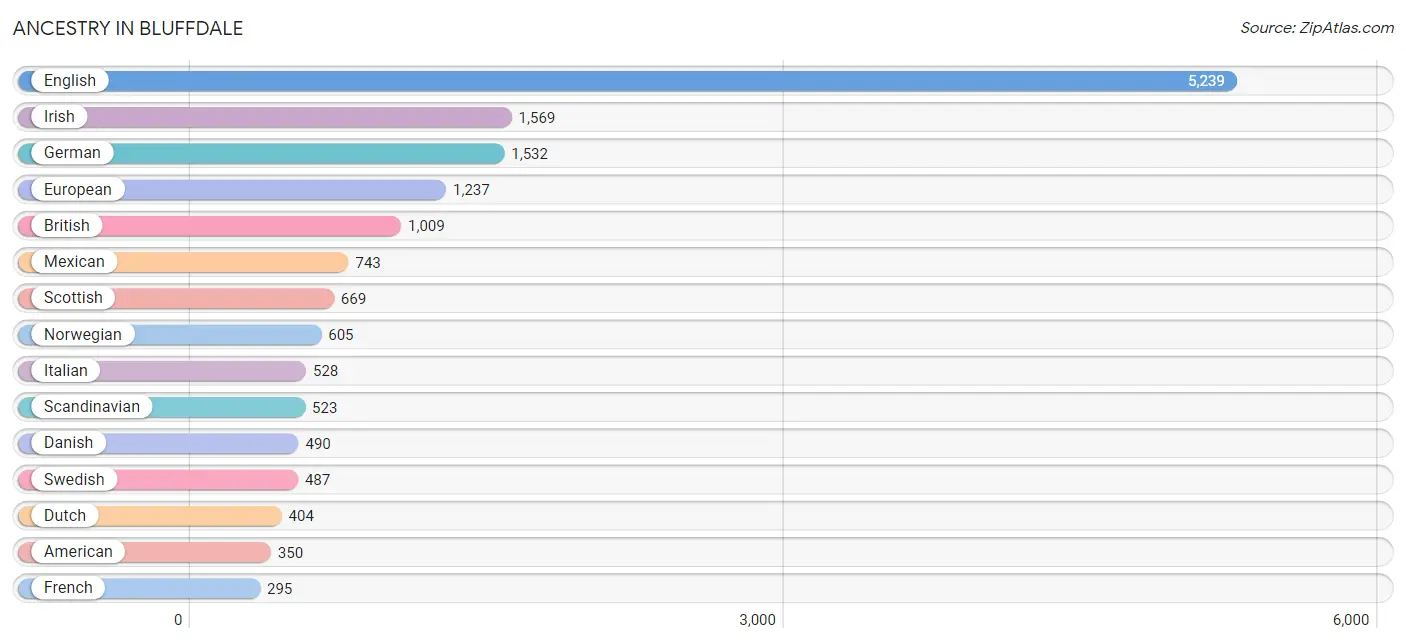
| Ancestry | # Population | % Population |
| American | 350 | 2.0% |
| Arab | 16 | 0.1% |
| Armenian | 16 | 0.1% |
| Basque | 69 | 0.4% |
| Bhutanese | 215 | 1.2% |
| Brazilian | 70 | 0.4% |
| British | 1,009 | 5.8% |
| Burmese | 60 | 0.3% |
| Canadian | 71 | 0.4% |
| Central American | 53 | 0.3% |
| Danish | 490 | 2.8% |
| Delaware | 26 | 0.2% |
| Dutch | 404 | 2.3% |
| Eastern European | 37 | 0.2% |
| English | 5,239 | 30.0% |
| European | 1,237 | 7.1% |
| Filipino | 52 | 0.3% |
| French | 295 | 1.7% |
| German | 1,532 | 8.8% |
| Greek | 85 | 0.5% |
| Indian (Asian) | 83 | 0.5% |
| Iranian | 16 | 0.1% |
| Irish | 1,569 | 9.0% |
| Iroquois | 73 | 0.4% |
| Italian | 528 | 3.0% |
| Korean | 129 | 0.7% |
| Mexican | 743 | 4.3% |
| Navajo | 33 | 0.2% |
| Nicaraguan | 22 | 0.1% |
| Northern European | 141 | 0.8% |
| Norwegian | 605 | 3.5% |
| Polish | 211 | 1.2% |
| Portuguese | 54 | 0.3% |
| Puerto Rican | 28 | 0.2% |
| Romanian | 4 | 0.0% |
| Russian | 46 | 0.3% |
| Salvadoran | 31 | 0.2% |
| Scandinavian | 523 | 3.0% |
| Scotch-Irish | 62 | 0.4% |
| Scottish | 669 | 3.8% |
| Spanish | 64 | 0.4% |
| Swedish | 487 | 2.8% |
| Swiss | 99 | 0.6% |
| Turkish | 50 | 0.3% |
| Ukrainian | 31 | 0.2% |
| Welsh | 36 | 0.2% |
| Yugoslavian | 128 | 0.7% | View All 47 Rows |
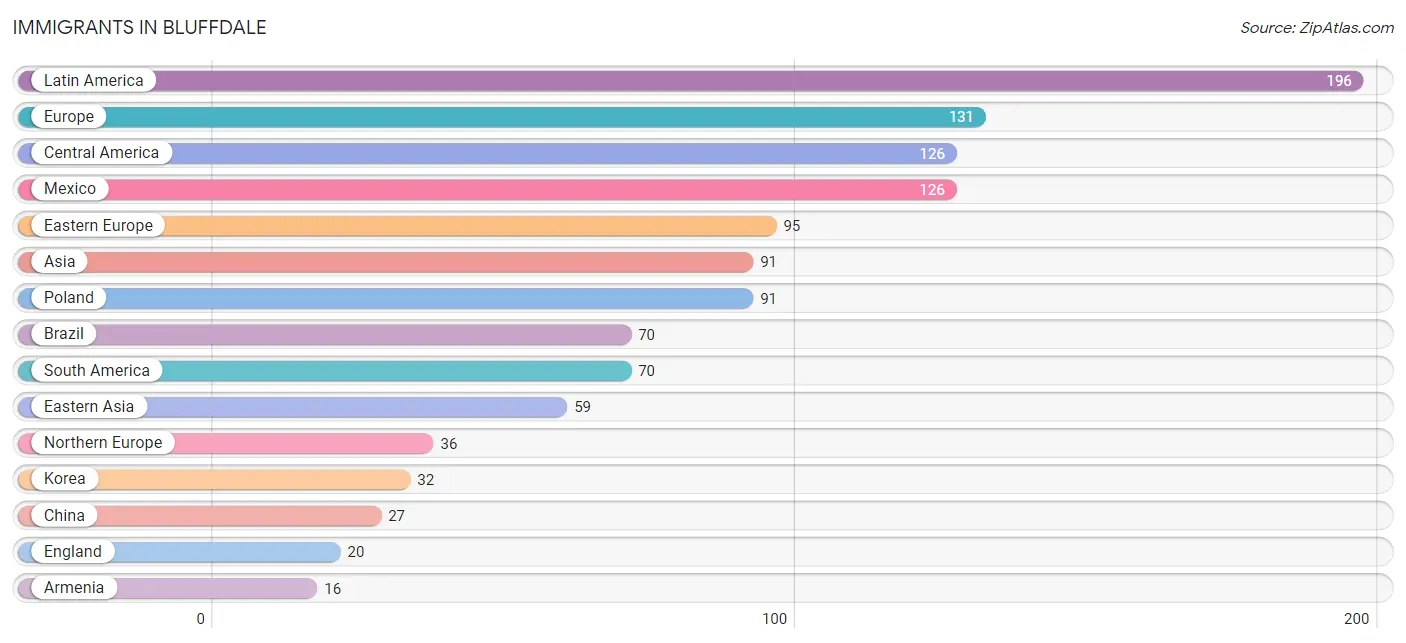
Immigrants in Bluffdale
The most numerous immigrant groups reported in Bluffdale came from Latin America (196 | 1.1%), Europe (131 | 0.7%), Central America (126 | 0.7%), Mexico (126 | 0.7%), and Eastern Europe (95 | 0.5%), together accounting for 3.8% of all Bluffdale residents.
| Immigration Origin | # Population | % Population |
| Africa | 11 | 0.1% |
| Armenia | 16 | 0.1% |
| Asia | 91 | 0.5% |
| Brazil | 70 | 0.4% |
| Central America | 126 | 0.7% |
| China | 27 | 0.2% |
| Eastern Asia | 59 | 0.3% |
| Eastern Europe | 95 | 0.5% |
| England | 20 | 0.1% |
| Europe | 131 | 0.7% |
| Hong Kong | 14 | 0.1% |
| Iran | 16 | 0.1% |
| Korea | 32 | 0.2% |
| Latin America | 196 | 1.1% |
| Mexico | 126 | 0.7% |
| Northern Europe | 36 | 0.2% |
| Norway | 16 | 0.1% |
| Poland | 91 | 0.5% |
| Romania | 4 | 0.0% |
| South Africa | 11 | 0.1% |
| South America | 70 | 0.4% |
| South Central Asia | 16 | 0.1% |
| Western Asia | 16 | 0.1% | View All 23 Rows |
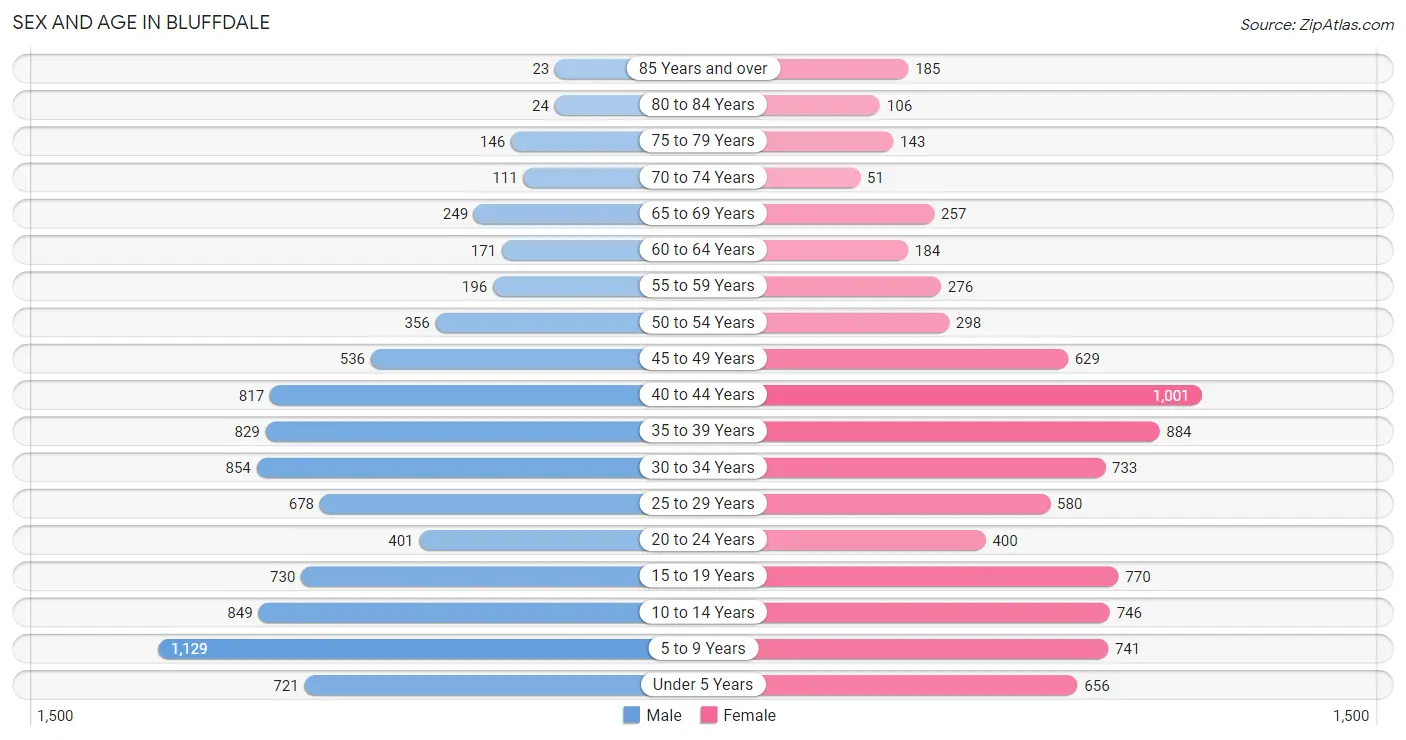
Sex and Age in Bluffdale
Sex and Age in Bluffdale
The most populous age groups in Bluffdale are 5 to 9 Years (1,129 | 12.8%) for men and 40 to 44 Years (1,001 | 11.6%) for women.
| Age Bracket | Male | Female |
| Under 5 Years | 721 (8.2%) | 656 (7.6%) |
| 5 to 9 Years | 1,129 (12.8%) | 741 (8.6%) |
| 10 to 14 Years | 849 (9.6%) | 746 (8.6%) |
| 15 to 19 Years | 730 (8.3%) | 770 (8.9%) |
| 20 to 24 Years | 401 (4.5%) | 400 (4.6%) |
| 25 to 29 Years | 678 (7.7%) | 580 (6.7%) |
| 30 to 34 Years | 854 (9.7%) | 733 (8.5%) |
| 35 to 39 Years | 829 (9.4%) | 884 (10.2%) |
| 40 to 44 Years | 817 (9.3%) | 1,001 (11.6%) |
| 45 to 49 Years | 536 (6.1%) | 629 (7.3%) |
| 50 to 54 Years | 356 (4.0%) | 298 (3.5%) |
| 55 to 59 Years | 196 (2.2%) | 276 (3.2%) |
| 60 to 64 Years | 171 (1.9%) | 184 (2.1%) |
| 65 to 69 Years | 249 (2.8%) | 257 (3.0%) |
| 70 to 74 Years | 111 (1.3%) | 51 (0.6%) |
| 75 to 79 Years | 146 (1.7%) | 143 (1.7%) |
| 80 to 84 Years | 24 (0.3%) | 106 (1.2%) |
| 85 Years and over | 23 (0.3%) | 185 (2.1%) |
| Total | 8,820 (100.0%) | 8,640 (100.0%) |
Families and Households in Bluffdale
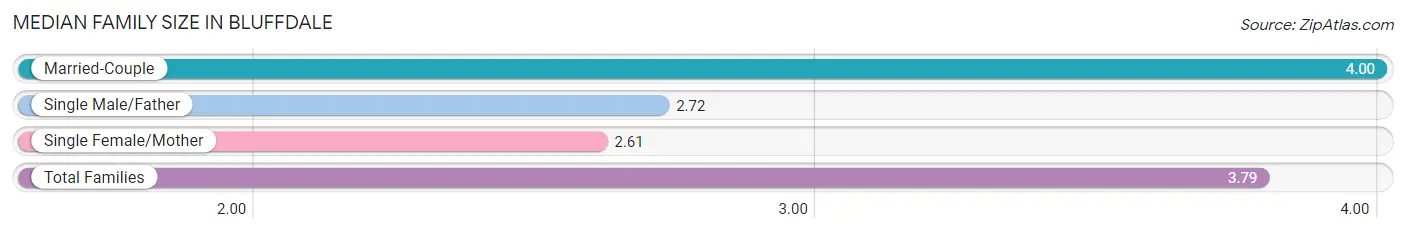
Median Family Size in Bluffdale
The median family size in Bluffdale is 3.79 persons per family, with married-couple families (3,544 | 84.6%) accounting for the largest median family size of 4 persons per family. On the other hand, single female/mother families (437 | 10.4%) represent the smallest median family size with 2.61 persons per family.
| Family Type | # Families | Family Size |
| Married-Couple | 3,544 (84.6%) | 4.00 |
| Single Male/Father | 208 (5.0%) | 2.72 |
| Single Female/Mother | 437 (10.4%) | 2.61 |
| Total Families | 4,189 (100.0%) | 3.79 |
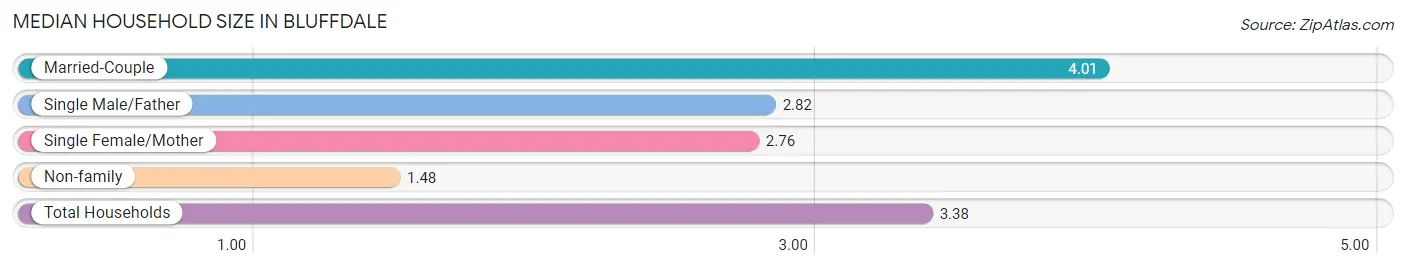
Median Household Size in Bluffdale
The median household size in Bluffdale is 3.38 persons per household, with married-couple households (3,544 | 68.6%) accounting for the largest median household size of 4.01 persons per household. non-family households (978 | 18.9%) represent the smallest median household size with 1.48 persons per household.
| Household Type | # Households | Household Size |
| Married-Couple | 3,544 (68.6%) | 4.01 |
| Single Male/Father | 208 (4.0%) | 2.82 |
| Single Female/Mother | 437 (8.5%) | 2.76 |
| Non-family | 978 (18.9%) | 1.48 |
| Total Households | 5,167 (100.0%) | 3.38 |
Household Size by Marriage Status in Bluffdale
Out of a total of 5,167 households in Bluffdale, 4,189 (81.1%) are family households, while 978 (18.9%) are nonfamily households. The most numerous type of family households are 2-person households, comprising 1,228, and the most common type of nonfamily households are 1-person households, comprising 633.
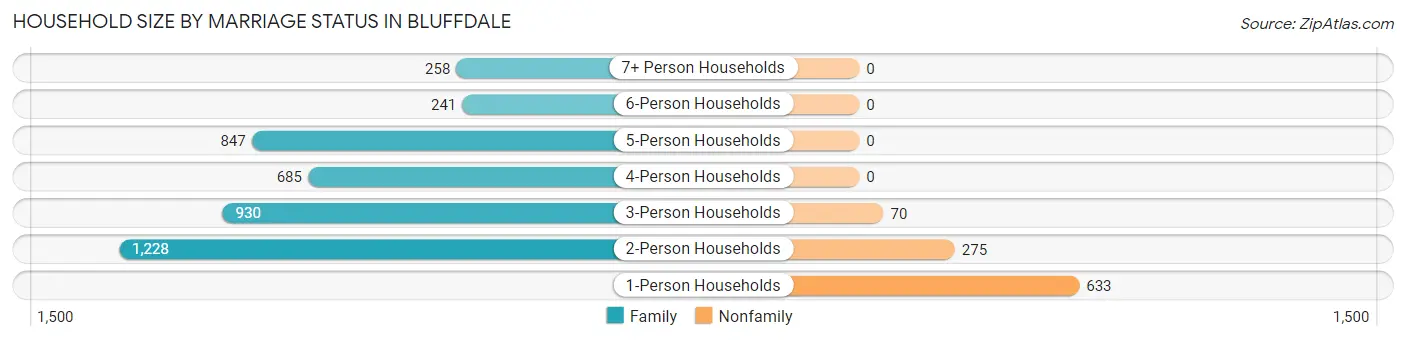
| Household Size | Family Households | Nonfamily Households |
| 1-Person Households | - | 633 (12.2%) |
| 2-Person Households | 1,228 (23.8%) | 275 (5.3%) |
| 3-Person Households | 930 (18.0%) | 70 (1.3%) |
| 4-Person Households | 685 (13.3%) | 0 (0.0%) |
| 5-Person Households | 847 (16.4%) | 0 (0.0%) |
| 6-Person Households | 241 (4.7%) | 0 (0.0%) |
| 7+ Person Households | 258 (5.0%) | 0 (0.0%) |
| Total | 4,189 (81.1%) | 978 (18.9%) |
Female Fertility in Bluffdale
Fertility by Age in Bluffdale
Average fertility rate in Bluffdale is 47.0 births per 1,000 women. Women in the age bracket of 20 to 34 years have the highest fertility rate with 114.0 births per 1,000 women. Women in the age bracket of 20 to 34 years acount for 81.9% of all women with births.
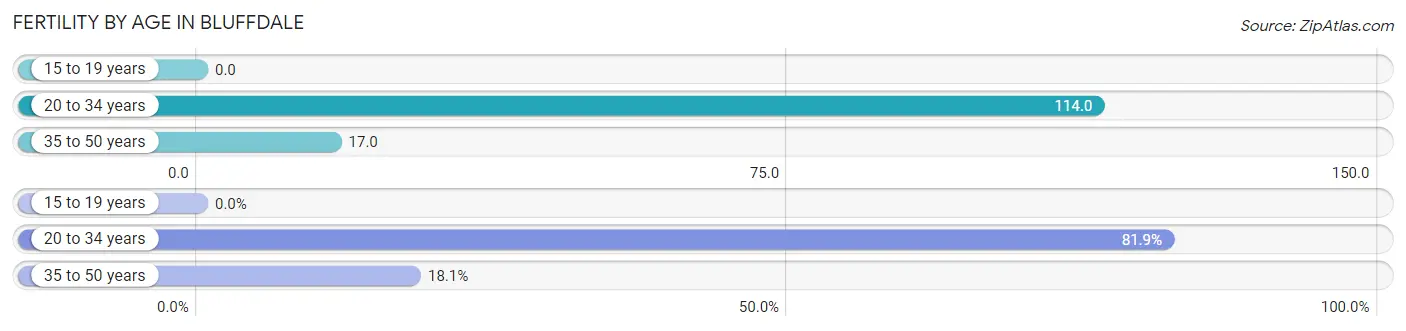
| Age Bracket | Women with Births | Births / 1,000 Women |
| 15 to 19 years | 0 (0.0%) | 0.0 |
| 20 to 34 years | 195 (81.9%) | 114.0 |
| 35 to 50 years | 43 (18.1%) | 17.0 |
| Total | 238 (100.0%) | 47.0 |
Fertility by Age by Marriage Status in Bluffdale
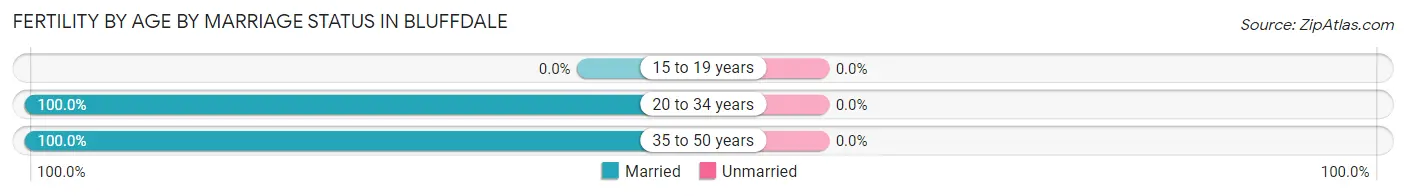
| Age Bracket | Married | Unmarried |
| 15 to 19 years | 0 (0.0%) | 0 (0.0%) |
| 20 to 34 years | 195 (100.0%) | 0 (0.0%) |
| 35 to 50 years | 43 (100.0%) | 0 (0.0%) |
| Total | 238 (100.0%) | 0 (0.0%) |
Fertility by Education in Bluffdale
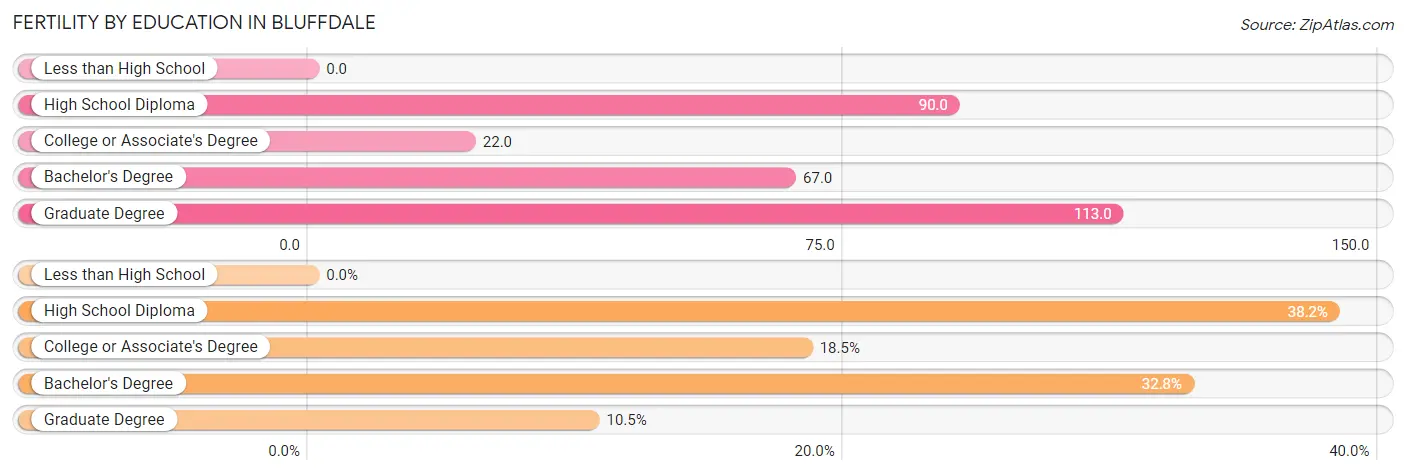
| Educational Attainment | Women with Births | Births / 1,000 Women |
| Less than High School | 0 (0.0%) | 0.0 |
| High School Diploma | 91 (38.2%) | 90.0 |
| College or Associate's Degree | 44 (18.5%) | 22.0 |
| Bachelor's Degree | 78 (32.8%) | 67.0 |
| Graduate Degree | 25 (10.5%) | 113.0 |
| Total | 238 (100.0%) | 47.0 |
Fertility by Education by Marriage Status in Bluffdale
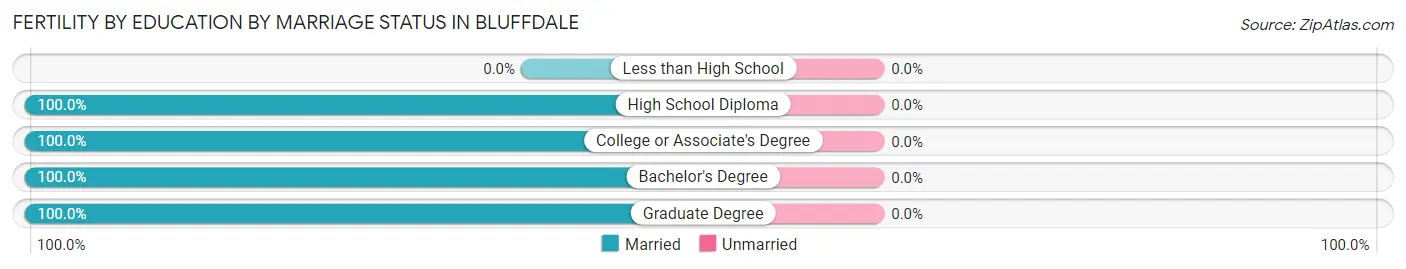
| Educational Attainment | Married | Unmarried |
| Less than High School | 0 (0.0%) | 0 (0.0%) |
| High School Diploma | 91 (100.0%) | 0 (0.0%) |
| College or Associate's Degree | 44 (100.0%) | 0 (0.0%) |
| Bachelor's Degree | 78 (100.0%) | 0 (0.0%) |
| Graduate Degree | 25 (100.0%) | 0 (0.0%) |
| Total | 238 (100.0%) | 0 (0.0%) |
Employment Characteristics in Bluffdale
Employment by Class of Employer in Bluffdale
Among the 9,171 employed individuals in Bluffdale, private company employees (6,098 | 66.5%), local government employees (867 | 9.5%), and self-employed (not incorporated) (767 | 8.4%) make up the most common classes of employment.
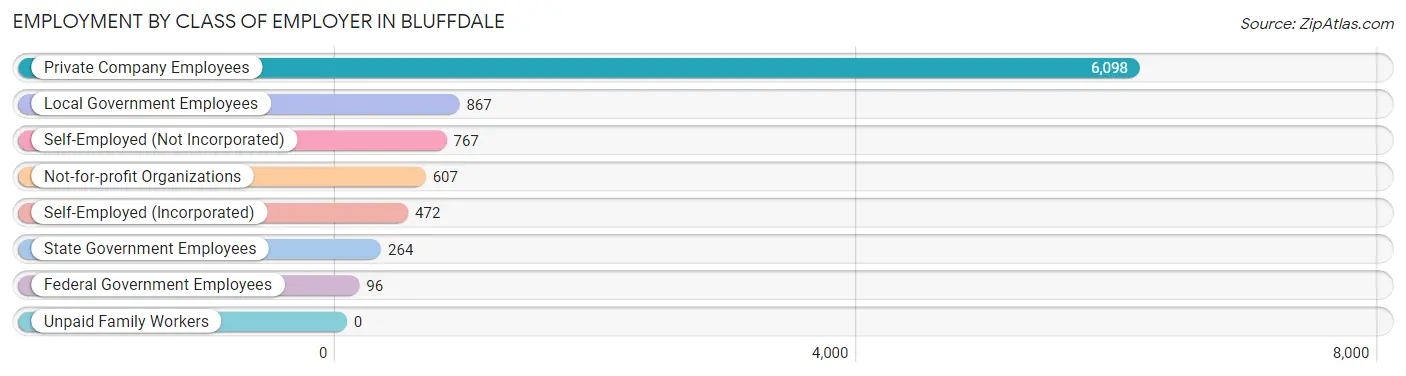
| Employer Class | # Employees | % Employees |
| Private Company Employees | 6,098 | 66.5% |
| Self-Employed (Incorporated) | 472 | 5.1% |
| Self-Employed (Not Incorporated) | 767 | 8.4% |
| Not-for-profit Organizations | 607 | 6.6% |
| Local Government Employees | 867 | 9.5% |
| State Government Employees | 264 | 2.9% |
| Federal Government Employees | 96 | 1.1% |
| Unpaid Family Workers | 0 | 0.0% |
| Total | 9,171 | 100.0% |
Employment Status by Age in Bluffdale
According to the labor force statistics for Bluffdale, out of the total population over 16 years of age (12,195), 77.2% or 9,415 individuals are in the labor force, with 2.2% or 207 of them unemployed. The age group with the highest labor force participation rate is 35 to 44 years, with 91.9% or 3,245 individuals in the labor force. Within the labor force, the 20 to 24 years age range has the highest percentage of unemployed individuals, with 15.6% or 101 of them being unemployed.
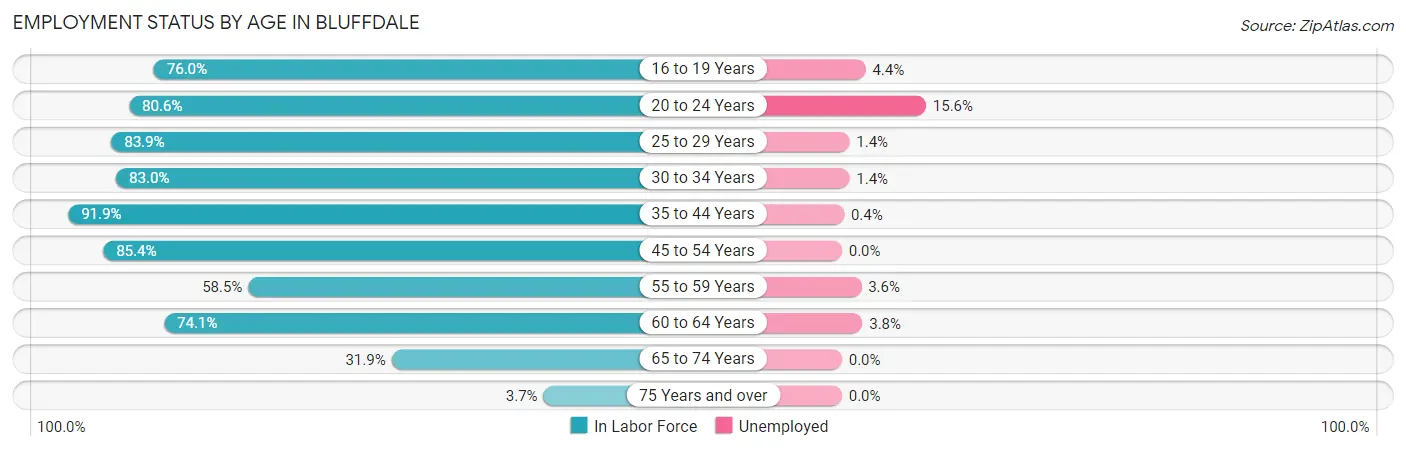
| Age Bracket | In Labor Force | Unemployed |
| 16 to 19 Years | 819 (76.0%) | 36 (4.4%) |
| 20 to 24 Years | 646 (80.6%) | 101 (15.6%) |
| 25 to 29 Years | 1,055 (83.9%) | 15 (1.4%) |
| 30 to 34 Years | 1,317 (83.0%) | 18 (1.4%) |
| 35 to 44 Years | 3,245 (91.9%) | 13 (0.4%) |
| 45 to 54 Years | 1,553 (85.4%) | 0 (0.0%) |
| 55 to 59 Years | 276 (58.5%) | 10 (3.6%) |
| 60 to 64 Years | 263 (74.1%) | 10 (3.8%) |
| 65 to 74 Years | 213 (31.9%) | 0 (0.0%) |
| 75 Years and over | 23 (3.7%) | 0 (0.0%) |
| Total | 9,415 (77.2%) | 207 (2.2%) |
Employment Status by Educational Attainment in Bluffdale
According to labor force statistics for Bluffdale, 85.5% of individuals (7,714) out of the total population between 25 and 64 years of age (9,022) are in the labor force, with 0.9% or 69 of them being unemployed. The group with the highest labor force participation rate are those with the educational attainment of bachelor's degree or higher, with 88.7% or 3,042 individuals in the labor force. Within the labor force, individuals with high school diploma education have the highest percentage of unemployment, with 1.1% or 16 of them being unemployed.
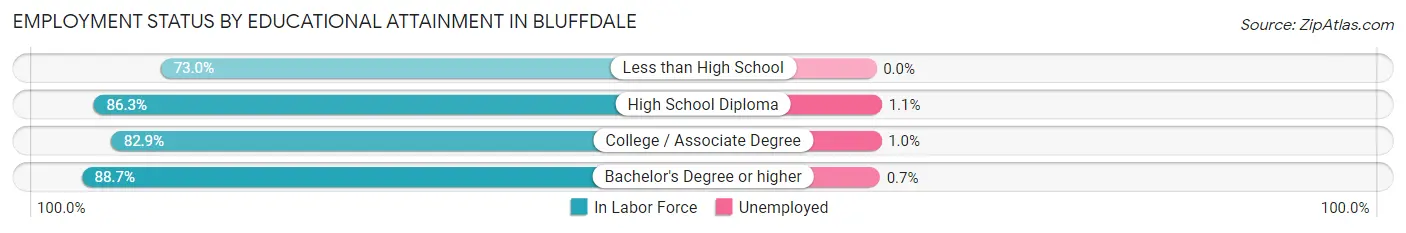
| Educational Attainment | In Labor Force | Unemployed |
| Less than High School | 187 (73.0%) | 0 (0.0%) |
| High School Diploma | 1,440 (86.3%) | 18 (1.1%) |
| College / Associate Degree | 3,041 (82.9%) | 37 (1.0%) |
| Bachelor's Degree or higher | 3,042 (88.7%) | 24 (0.7%) |
| Total | 7,714 (85.5%) | 81 (0.9%) |
Employment Occupations by Sex in Bluffdale
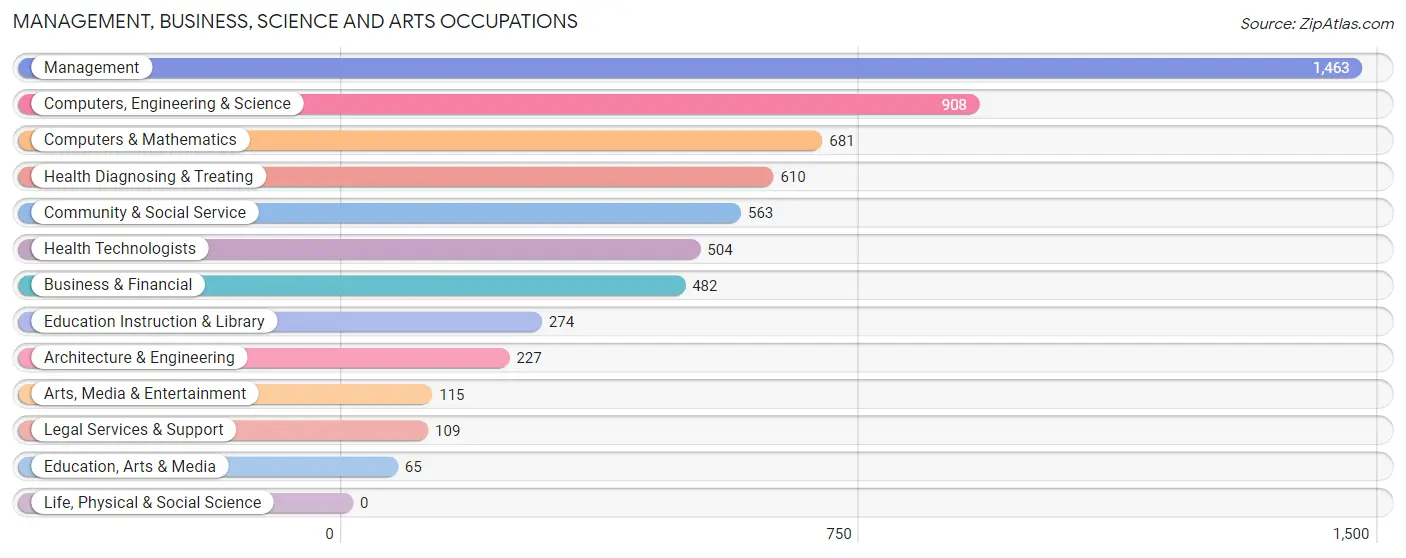
Management, Business, Science and Arts Occupations
The most common Management, Business, Science and Arts occupations in Bluffdale are Management (1,463 | 15.9%), Computers, Engineering & Science (908 | 9.9%), Computers & Mathematics (681 | 7.4%), Health Diagnosing & Treating (610 | 6.6%), and Community & Social Service (563 | 6.1%).
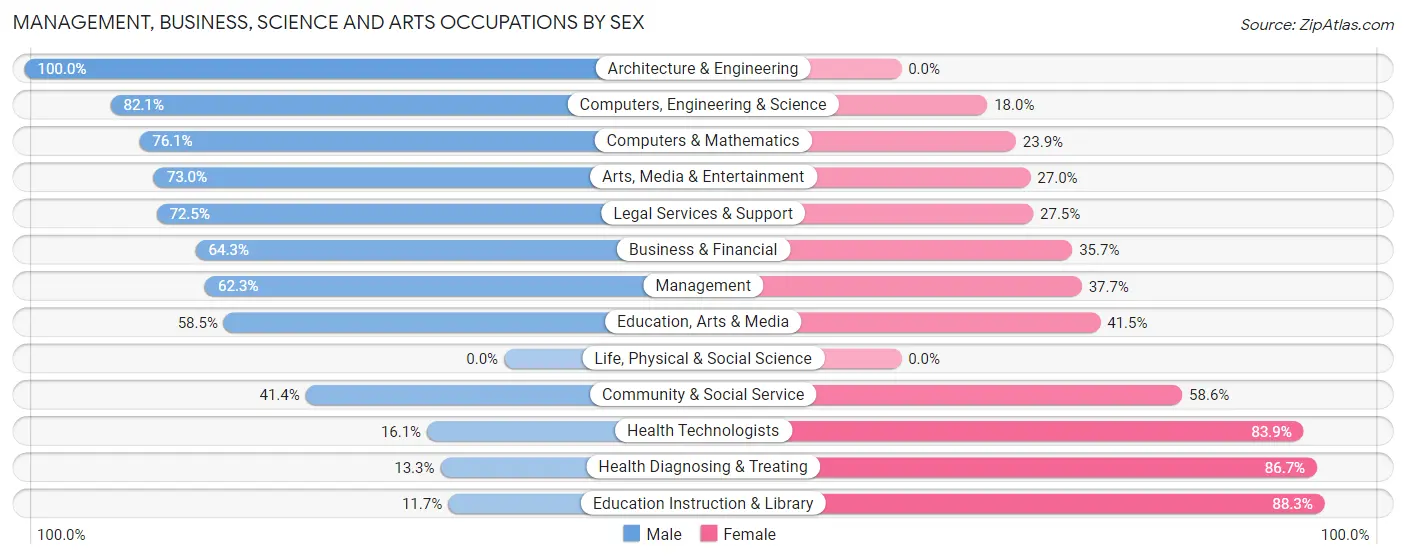
Management, Business, Science and Arts Occupations by Sex
Within the Management, Business, Science and Arts occupations in Bluffdale, the most male-oriented occupations are Architecture & Engineering (100.0%), Computers, Engineering & Science (82.1%), and Computers & Mathematics (76.1%), while the most female-oriented occupations are Education Instruction & Library (88.3%), Health Diagnosing & Treating (86.7%), and Health Technologists (83.9%).
| Occupation | Male | Female |
| Management | 912 (62.3%) | 551 (37.7%) |
| Business & Financial | 310 (64.3%) | 172 (35.7%) |
| Computers, Engineering & Science | 745 (82.1%) | 163 (17.9%) |
| Computers & Mathematics | 518 (76.1%) | 163 (23.9%) |
| Architecture & Engineering | 227 (100.0%) | 0 (0.0%) |
| Life, Physical & Social Science | 0 (0.0%) | 0 (0.0%) |
| Community & Social Service | 233 (41.4%) | 330 (58.6%) |
| Education, Arts & Media | 38 (58.5%) | 27 (41.5%) |
| Legal Services & Support | 79 (72.5%) | 30 (27.5%) |
| Education Instruction & Library | 32 (11.7%) | 242 (88.3%) |
| Arts, Media & Entertainment | 84 (73.0%) | 31 (27.0%) |
| Health Diagnosing & Treating | 81 (13.3%) | 529 (86.7%) |
| Health Technologists | 81 (16.1%) | 423 (83.9%) |
| Total (Category) | 2,281 (56.7%) | 1,745 (43.3%) |
| Total (Overall) | 4,968 (54.1%) | 4,222 (45.9%) |
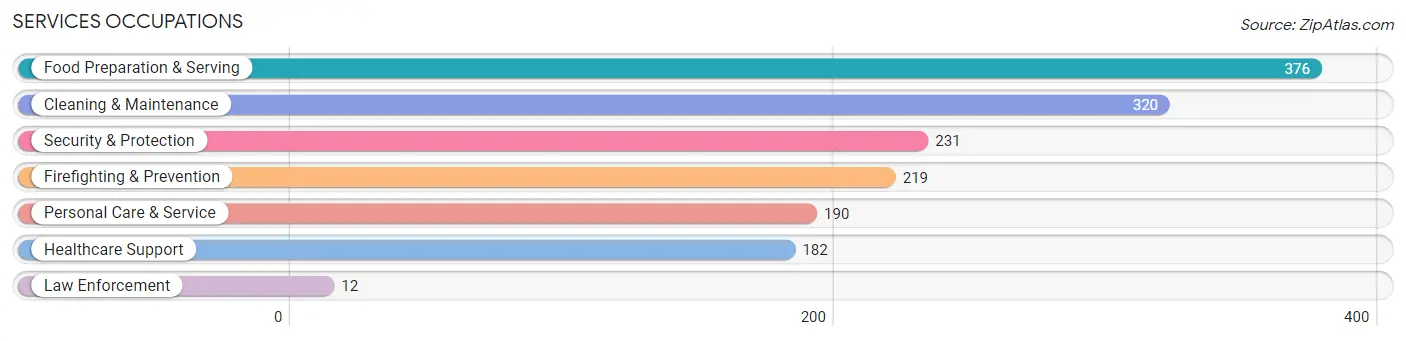
Services Occupations
The most common Services occupations in Bluffdale are Food Preparation & Serving (376 | 4.1%), Cleaning & Maintenance (320 | 3.5%), Security & Protection (231 | 2.5%), Firefighting & Prevention (219 | 2.4%), and Personal Care & Service (190 | 2.1%).
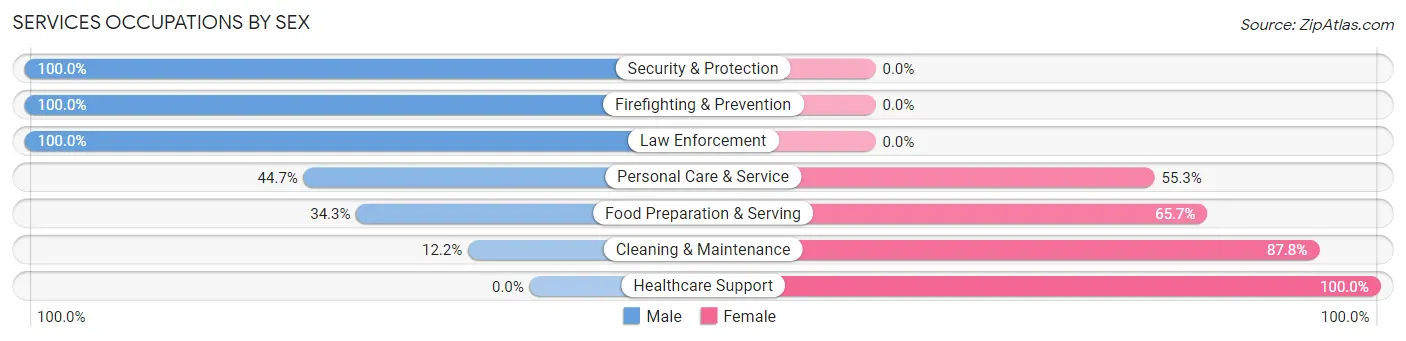
Services Occupations by Sex
Within the Services occupations in Bluffdale, the most male-oriented occupations are Security & Protection (100.0%), Firefighting & Prevention (100.0%), and Law Enforcement (100.0%), while the most female-oriented occupations are Healthcare Support (100.0%), Cleaning & Maintenance (87.8%), and Food Preparation & Serving (65.7%).
| Occupation | Male | Female |
| Healthcare Support | 0 (0.0%) | 182 (100.0%) |
| Security & Protection | 231 (100.0%) | 0 (0.0%) |
| Firefighting & Prevention | 219 (100.0%) | 0 (0.0%) |
| Law Enforcement | 12 (100.0%) | 0 (0.0%) |
| Food Preparation & Serving | 129 (34.3%) | 247 (65.7%) |
| Cleaning & Maintenance | 39 (12.2%) | 281 (87.8%) |
| Personal Care & Service | 85 (44.7%) | 105 (55.3%) |
| Total (Category) | 484 (37.3%) | 815 (62.7%) |
| Total (Overall) | 4,968 (54.1%) | 4,222 (45.9%) |
Sales and Office Occupations
The most common Sales and Office occupations in Bluffdale are Office & Administration (1,264 | 13.8%), and Sales & Related (849 | 9.2%).

Sales and Office Occupations by Sex
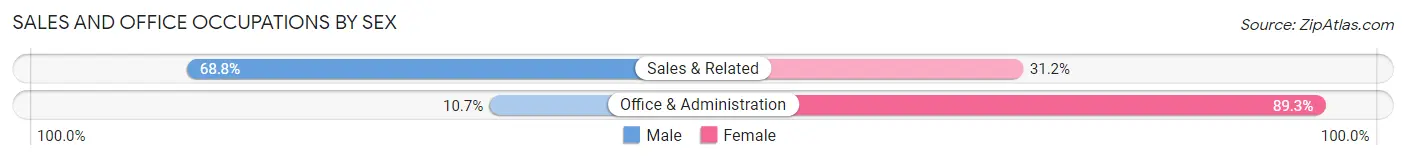
| Occupation | Male | Female |
| Sales & Related | 584 (68.8%) | 265 (31.2%) |
| Office & Administration | 135 (10.7%) | 1,129 (89.3%) |
| Total (Category) | 719 (34.0%) | 1,394 (66.0%) |
| Total (Overall) | 4,968 (54.1%) | 4,222 (45.9%) |
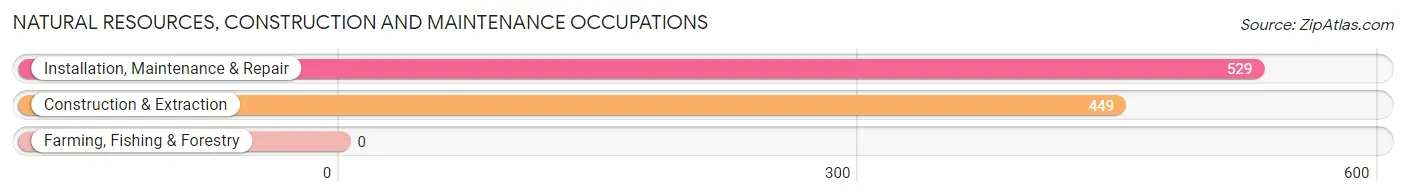
Natural Resources, Construction and Maintenance Occupations
The most common Natural Resources, Construction and Maintenance occupations in Bluffdale are Installation, Maintenance & Repair (529 | 5.8%), and Construction & Extraction (449 | 4.9%).
Natural Resources, Construction and Maintenance Occupations by Sex
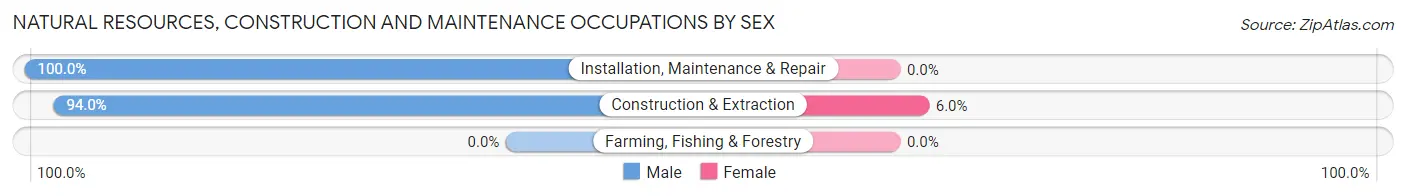
| Occupation | Male | Female |
| Farming, Fishing & Forestry | 0 (0.0%) | 0 (0.0%) |
| Construction & Extraction | 422 (94.0%) | 27 (6.0%) |
| Installation, Maintenance & Repair | 529 (100.0%) | 0 (0.0%) |
| Total (Category) | 951 (97.2%) | 27 (2.8%) |
| Total (Overall) | 4,968 (54.1%) | 4,222 (45.9%) |
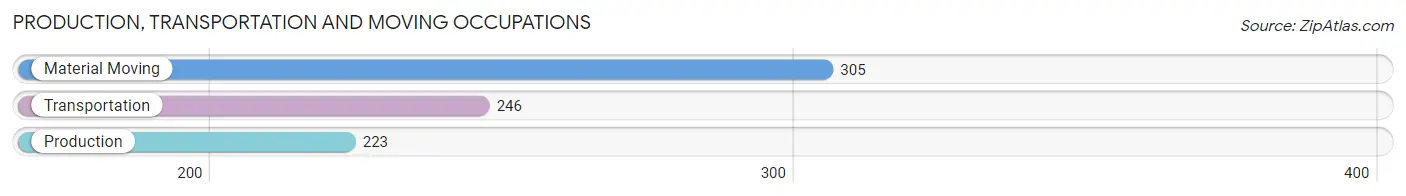
Production, Transportation and Moving Occupations
The most common Production, Transportation and Moving occupations in Bluffdale are Material Moving (305 | 3.3%), Transportation (246 | 2.7%), and Production (223 | 2.4%).
Production, Transportation and Moving Occupations by Sex
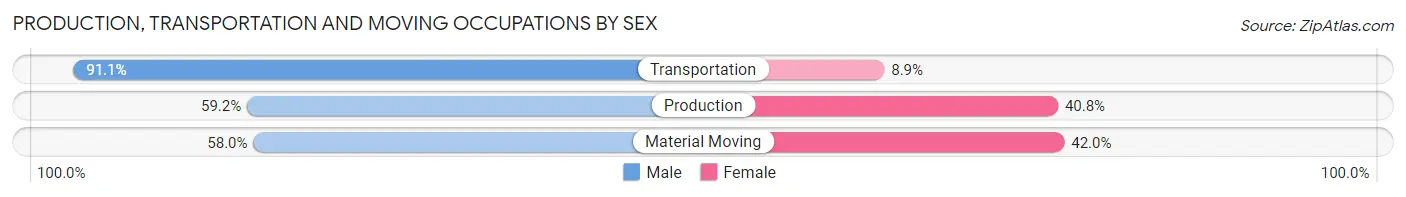
| Occupation | Male | Female |
| Production | 132 (59.2%) | 91 (40.8%) |
| Transportation | 224 (91.1%) | 22 (8.9%) |
| Material Moving | 177 (58.0%) | 128 (42.0%) |
| Total (Category) | 533 (68.9%) | 241 (31.1%) |
| Total (Overall) | 4,968 (54.1%) | 4,222 (45.9%) |
Employment Industries by Sex in Bluffdale
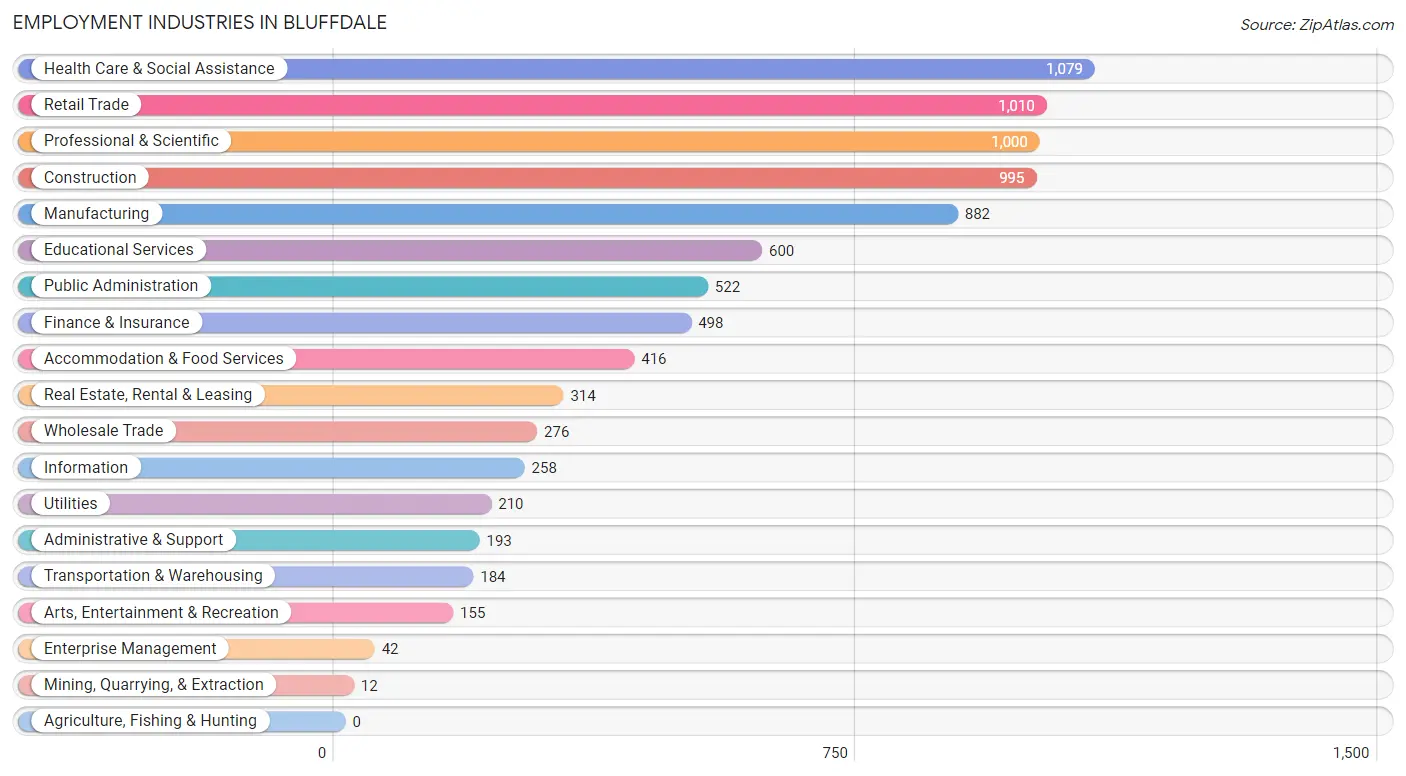
Employment Industries in Bluffdale
The major employment industries in Bluffdale include Health Care & Social Assistance (1,079 | 11.7%), Retail Trade (1,010 | 11.0%), Professional & Scientific (1,000 | 10.9%), Construction (995 | 10.8%), and Manufacturing (882 | 9.6%).
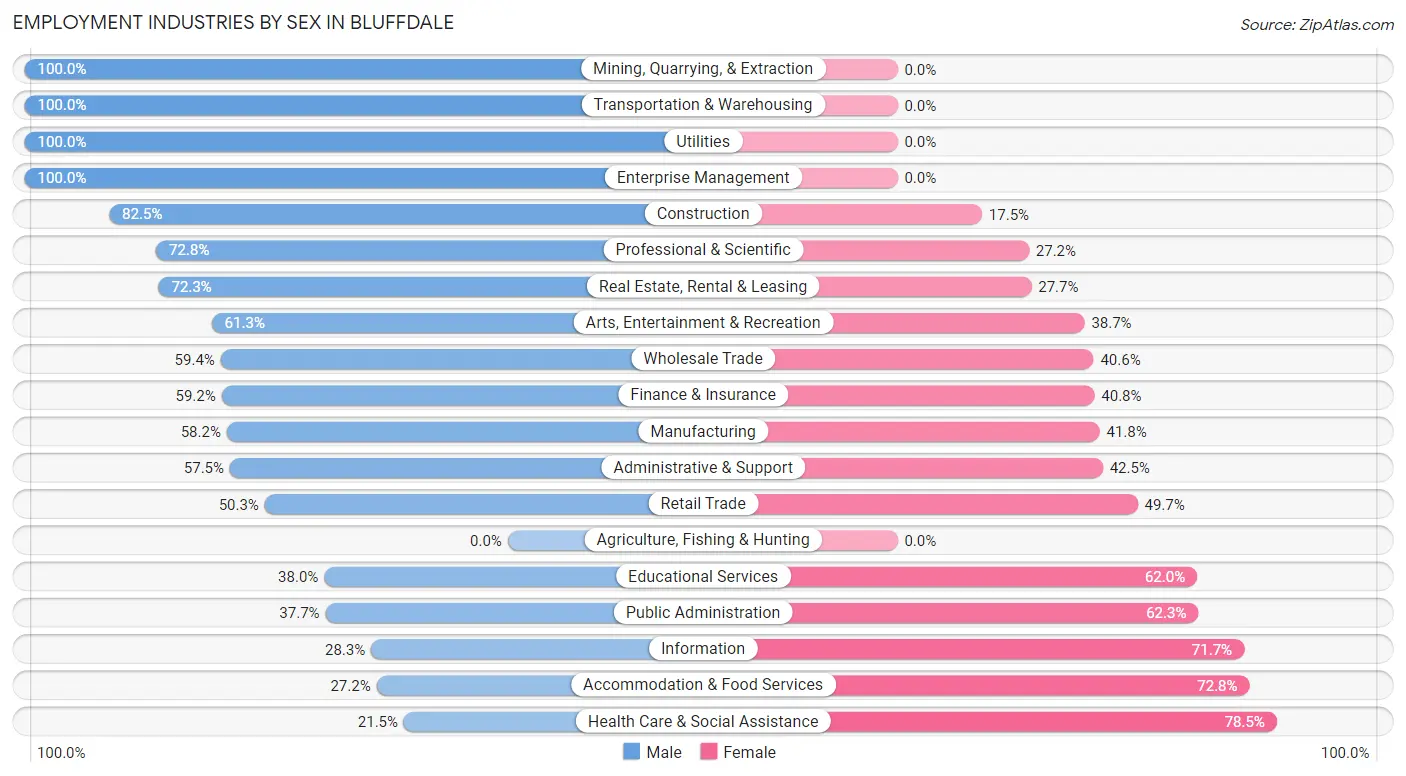
Employment Industries by Sex in Bluffdale
The Bluffdale industries that see more men than women are Mining, Quarrying, & Extraction (100.0%), Transportation & Warehousing (100.0%), and Utilities (100.0%), whereas the industries that tend to have a higher number of women are Health Care & Social Assistance (78.5%), Accommodation & Food Services (72.8%), and Information (71.7%).
| Industry | Male | Female |
| Agriculture, Fishing & Hunting | 0 (0.0%) | 0 (0.0%) |
| Mining, Quarrying, & Extraction | 12 (100.0%) | 0 (0.0%) |
| Construction | 821 (82.5%) | 174 (17.5%) |
| Manufacturing | 513 (58.2%) | 369 (41.8%) |
| Wholesale Trade | 164 (59.4%) | 112 (40.6%) |
| Retail Trade | 508 (50.3%) | 502 (49.7%) |
| Transportation & Warehousing | 184 (100.0%) | 0 (0.0%) |
| Utilities | 210 (100.0%) | 0 (0.0%) |
| Information | 73 (28.3%) | 185 (71.7%) |
| Finance & Insurance | 295 (59.2%) | 203 (40.8%) |
| Real Estate, Rental & Leasing | 227 (72.3%) | 87 (27.7%) |
| Professional & Scientific | 728 (72.8%) | 272 (27.2%) |
| Enterprise Management | 42 (100.0%) | 0 (0.0%) |
| Administrative & Support | 111 (57.5%) | 82 (42.5%) |
| Educational Services | 228 (38.0%) | 372 (62.0%) |
| Health Care & Social Assistance | 232 (21.5%) | 847 (78.5%) |
| Arts, Entertainment & Recreation | 95 (61.3%) | 60 (38.7%) |
| Accommodation & Food Services | 113 (27.2%) | 303 (72.8%) |
| Public Administration | 197 (37.7%) | 325 (62.3%) |
| Total | 4,968 (54.1%) | 4,222 (45.9%) |
Education in Bluffdale
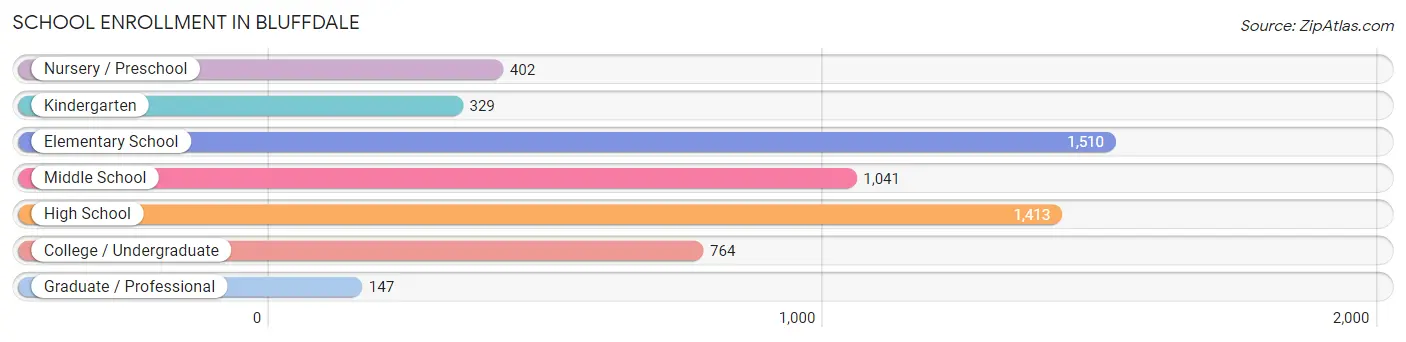
School Enrollment in Bluffdale
The most common levels of schooling among the 5,606 students in Bluffdale are elementary school (1,510 | 26.9%), high school (1,413 | 25.2%), and middle school (1,041 | 18.6%).
| School Level | # Students | % Students |
| Nursery / Preschool | 402 | 7.2% |
| Kindergarten | 329 | 5.9% |
| Elementary School | 1,510 | 26.9% |
| Middle School | 1,041 | 18.6% |
| High School | 1,413 | 25.2% |
| College / Undergraduate | 764 | 13.6% |
| Graduate / Professional | 147 | 2.6% |
| Total | 5,606 | 100.0% |
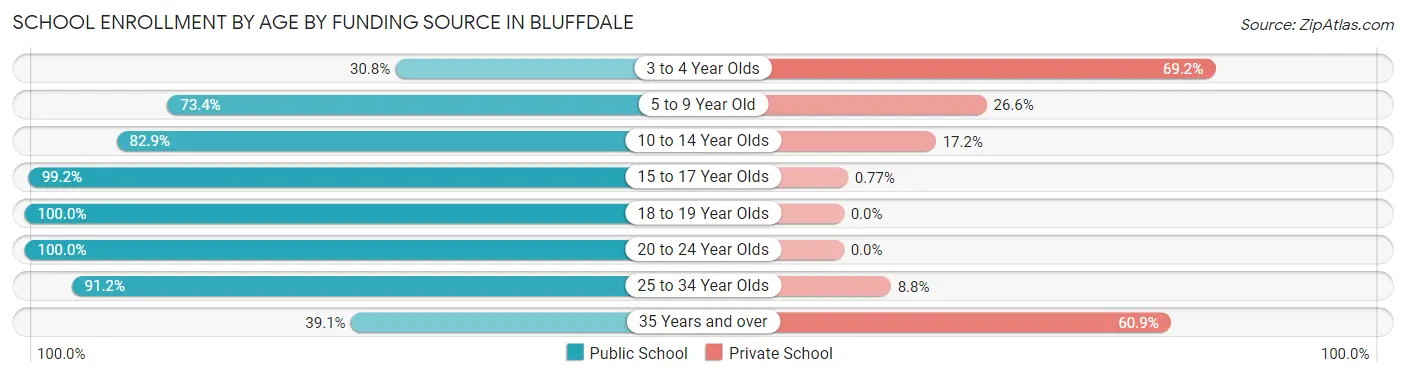
School Enrollment by Age by Funding Source in Bluffdale
Out of a total of 5,606 students who are enrolled in schools in Bluffdale, 992 (17.7%) attend a private institution, while the remaining 4,614 (82.3%) are enrolled in public schools. The age group of 3 to 4 year olds has the highest likelihood of being enrolled in private schools, with 101 (69.2% in the age bracket) enrolled. Conversely, the age group of 18 to 19 year olds has the lowest likelihood of being enrolled in a private school, with 332 (100.0% in the age bracket) attending a public institution.
| Age Bracket | Public School | Private School |
| 3 to 4 Year Olds | 45 (30.8%) | 101 (69.2%) |
| 5 to 9 Year Old | 1,302 (73.4%) | 472 (26.6%) |
| 10 to 14 Year Olds | 1,290 (82.9%) | 267 (17.2%) |
| 15 to 17 Year Olds | 1,029 (99.2%) | 8 (0.8%) |
| 18 to 19 Year Olds | 332 (100.0%) | 0 (0.0%) |
| 20 to 24 Year Olds | 359 (100.0%) | 0 (0.0%) |
| 25 to 34 Year Olds | 177 (91.2%) | 17 (8.8%) |
| 35 Years and over | 81 (39.1%) | 126 (60.9%) |
| Total | 4,614 (82.3%) | 992 (17.7%) |
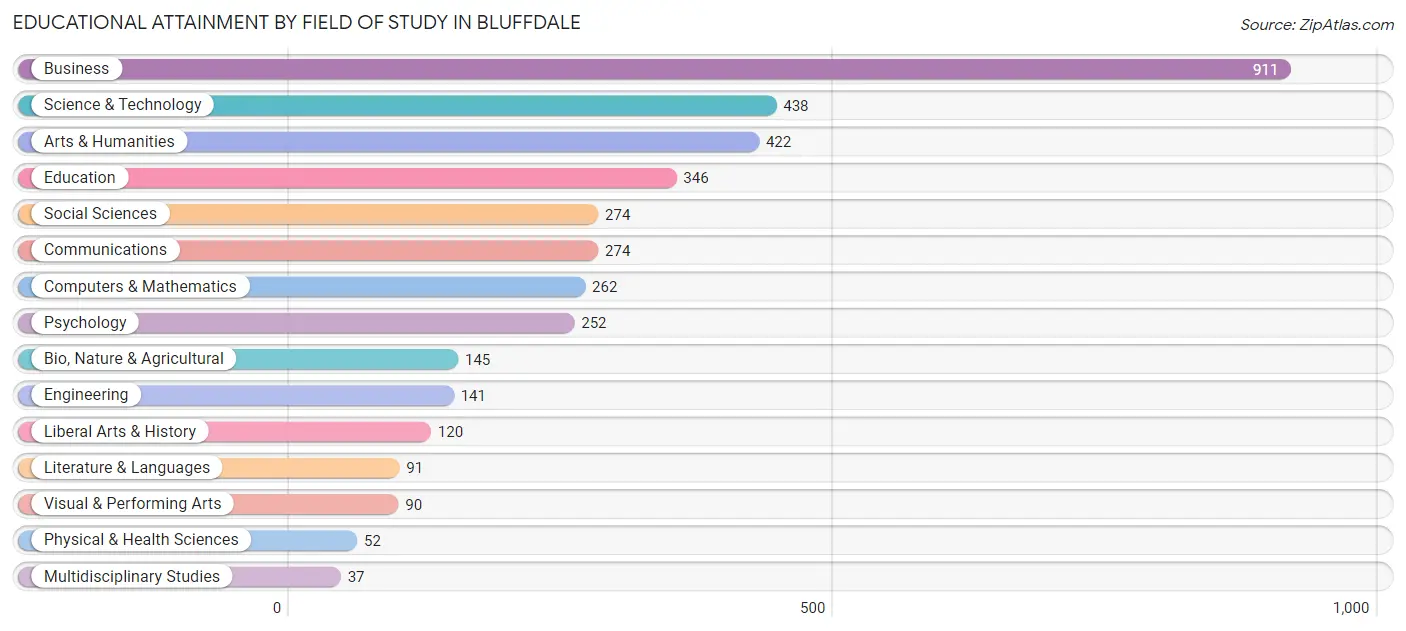
Educational Attainment by Field of Study in Bluffdale
Business (911 | 23.6%), science & technology (438 | 11.4%), arts & humanities (422 | 11.0%), education (346 | 9.0%), and social sciences (274 | 7.1%) are the most common fields of study among 3,855 individuals in Bluffdale who have obtained a bachelor's degree or higher.
| Field of Study | # Graduates | % Graduates |
| Computers & Mathematics | 262 | 6.8% |
| Bio, Nature & Agricultural | 145 | 3.8% |
| Physical & Health Sciences | 52 | 1.3% |
| Psychology | 252 | 6.5% |
| Social Sciences | 274 | 7.1% |
| Engineering | 141 | 3.7% |
| Multidisciplinary Studies | 37 | 1.0% |
| Science & Technology | 438 | 11.4% |
| Business | 911 | 23.6% |
| Education | 346 | 9.0% |
| Literature & Languages | 91 | 2.4% |
| Liberal Arts & History | 120 | 3.1% |
| Visual & Performing Arts | 90 | 2.3% |
| Communications | 274 | 7.1% |
| Arts & Humanities | 422 | 11.0% |
| Total | 3,855 | 100.0% |
Transportation & Commute in Bluffdale
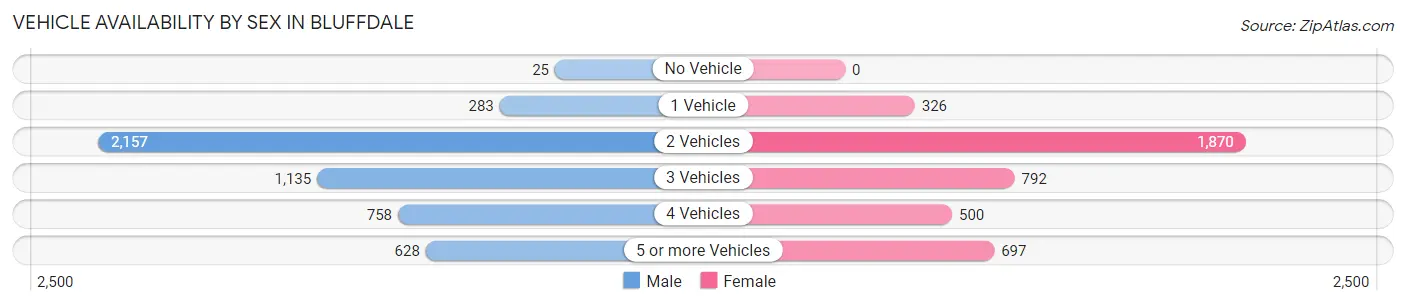
Vehicle Availability by Sex in Bluffdale
The most prevalent vehicle ownership categories in Bluffdale are males with 2 vehicles (2,157, accounting for 43.3%) and females with 2 vehicles (1,870, making up 51.5%).
| Vehicles Available | Male | Female |
| No Vehicle | 25 (0.5%) | 0 (0.0%) |
| 1 Vehicle | 283 (5.7%) | 326 (7.8%) |
| 2 Vehicles | 2,157 (43.3%) | 1,870 (44.7%) |
| 3 Vehicles | 1,135 (22.8%) | 792 (18.9%) |
| 4 Vehicles | 758 (15.2%) | 500 (11.9%) |
| 5 or more Vehicles | 628 (12.6%) | 697 (16.7%) |
| Total | 4,986 (100.0%) | 4,185 (100.0%) |
Commute Time in Bluffdale
The most frequently occuring commute durations in Bluffdale are 10 to 14 minutes (1,692 commuters, 22.5%), 20 to 24 minutes (1,125 commuters, 15.0%), and 30 to 34 minutes (1,056 commuters, 14.1%).
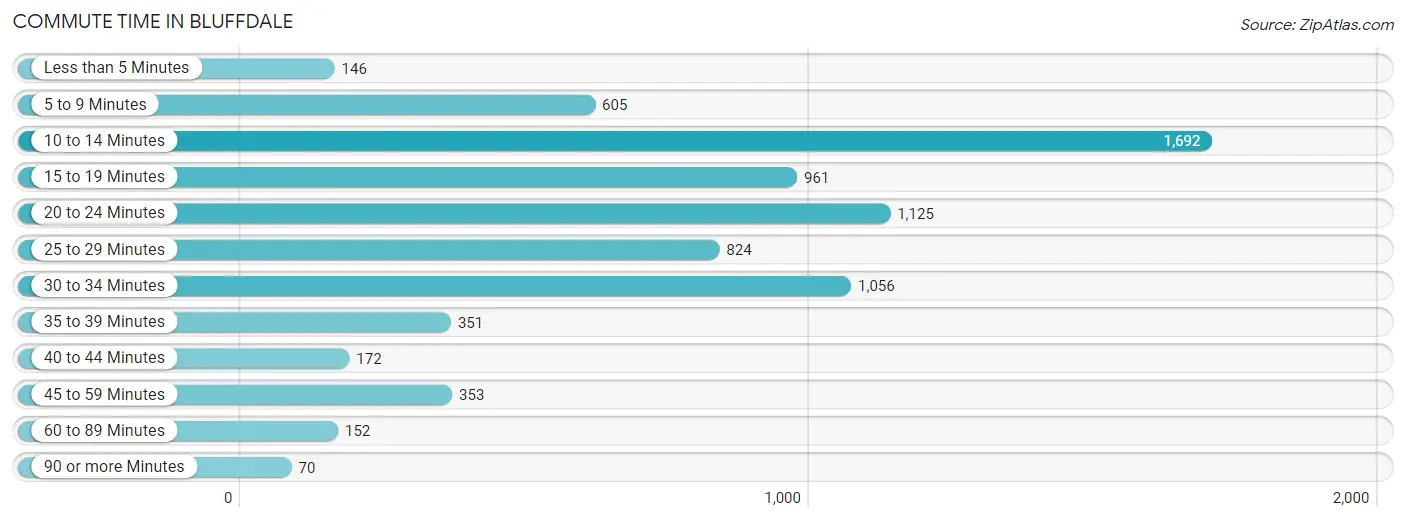
| Commute Time | # Commuters | % Commuters |
| Less than 5 Minutes | 146 | 1.9% |
| 5 to 9 Minutes | 605 | 8.1% |
| 10 to 14 Minutes | 1,692 | 22.5% |
| 15 to 19 Minutes | 961 | 12.8% |
| 20 to 24 Minutes | 1,125 | 15.0% |
| 25 to 29 Minutes | 824 | 11.0% |
| 30 to 34 Minutes | 1,056 | 14.1% |
| 35 to 39 Minutes | 351 | 4.7% |
| 40 to 44 Minutes | 172 | 2.3% |
| 45 to 59 Minutes | 353 | 4.7% |
| 60 to 89 Minutes | 152 | 2.0% |
| 90 or more Minutes | 70 | 0.9% |
Commute Time by Sex in Bluffdale
The most common commute times in Bluffdale are 10 to 14 minutes (813 commuters, 20.1%) for males and 10 to 14 minutes (879 commuters, 25.4%) for females.
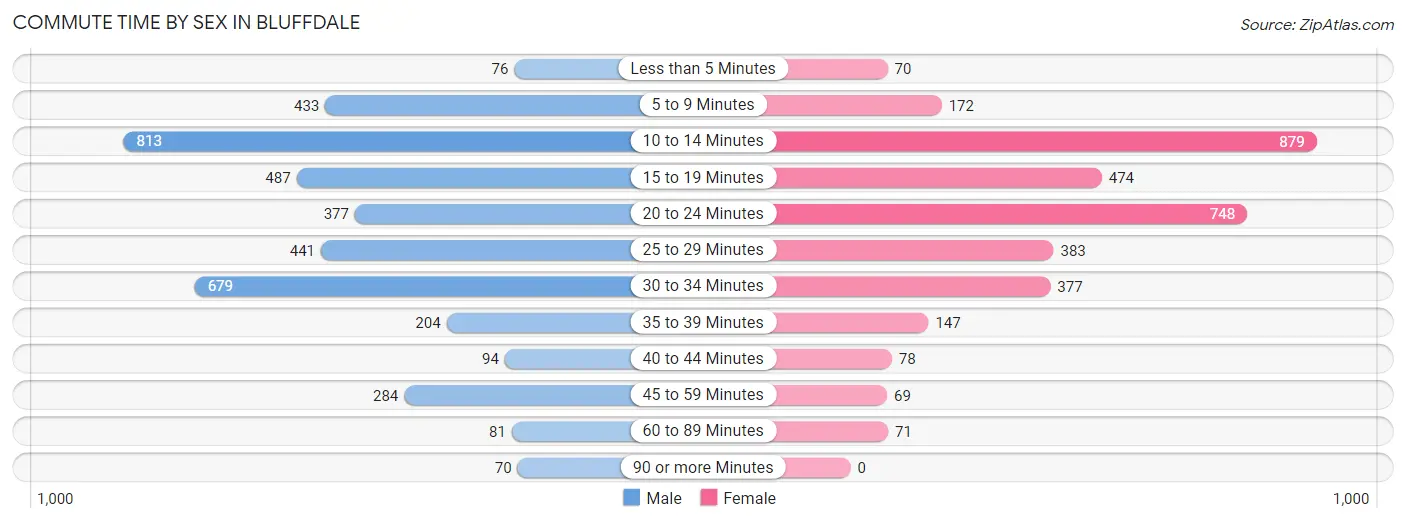
| Commute Time | Male | Female |
| Less than 5 Minutes | 76 (1.9%) | 70 (2.0%) |
| 5 to 9 Minutes | 433 (10.7%) | 172 (5.0%) |
| 10 to 14 Minutes | 813 (20.1%) | 879 (25.4%) |
| 15 to 19 Minutes | 487 (12.1%) | 474 (13.7%) |
| 20 to 24 Minutes | 377 (9.3%) | 748 (21.6%) |
| 25 to 29 Minutes | 441 (10.9%) | 383 (11.0%) |
| 30 to 34 Minutes | 679 (16.8%) | 377 (10.9%) |
| 35 to 39 Minutes | 204 (5.1%) | 147 (4.2%) |
| 40 to 44 Minutes | 94 (2.3%) | 78 (2.2%) |
| 45 to 59 Minutes | 284 (7.0%) | 69 (2.0%) |
| 60 to 89 Minutes | 81 (2.0%) | 71 (2.1%) |
| 90 or more Minutes | 70 (1.7%) | 0 (0.0%) |
Time of Departure to Work by Sex in Bluffdale
The most frequent times of departure to work in Bluffdale are 7:00 AM to 7:29 AM (563, 13.9%) for males and 8:30 AM to 8:59 AM (655, 18.9%) for females.
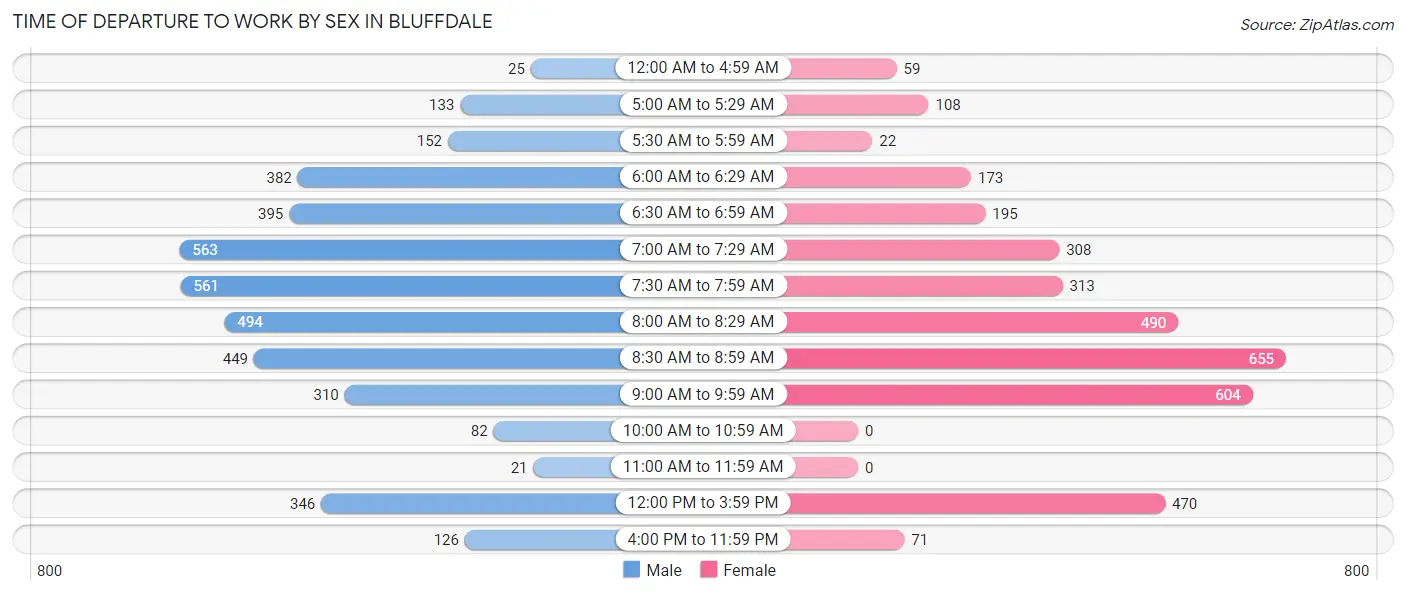
| Time of Departure | Male | Female |
| 12:00 AM to 4:59 AM | 25 (0.6%) | 59 (1.7%) |
| 5:00 AM to 5:29 AM | 133 (3.3%) | 108 (3.1%) |
| 5:30 AM to 5:59 AM | 152 (3.8%) | 22 (0.6%) |
| 6:00 AM to 6:29 AM | 382 (9.5%) | 173 (5.0%) |
| 6:30 AM to 6:59 AM | 395 (9.8%) | 195 (5.6%) |
| 7:00 AM to 7:29 AM | 563 (13.9%) | 308 (8.9%) |
| 7:30 AM to 7:59 AM | 561 (13.9%) | 313 (9.0%) |
| 8:00 AM to 8:29 AM | 494 (12.2%) | 490 (14.1%) |
| 8:30 AM to 8:59 AM | 449 (11.1%) | 655 (18.9%) |
| 9:00 AM to 9:59 AM | 310 (7.7%) | 604 (17.4%) |
| 10:00 AM to 10:59 AM | 82 (2.0%) | 0 (0.0%) |
| 11:00 AM to 11:59 AM | 21 (0.5%) | 0 (0.0%) |
| 12:00 PM to 3:59 PM | 346 (8.6%) | 470 (13.6%) |
| 4:00 PM to 11:59 PM | 126 (3.1%) | 71 (2.1%) |
| Total | 4,039 (100.0%) | 3,468 (100.0%) |
Housing Occupancy in Bluffdale
Occupancy by Ownership in Bluffdale
Of the total 5,167 dwellings in Bluffdale, owner-occupied units account for 4,141 (80.1%), while renter-occupied units make up 1,026 (19.9%).
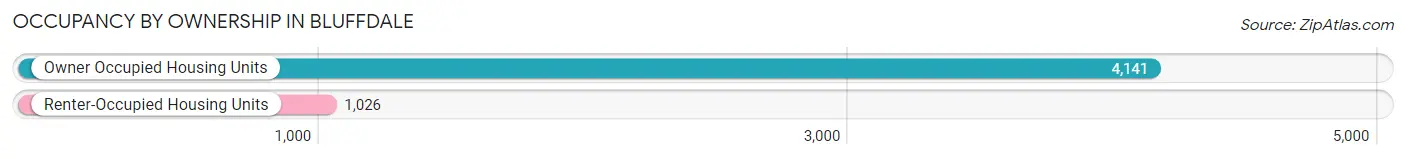
| Occupancy | # Housing Units | % Housing Units |
| Owner Occupied Housing Units | 4,141 | 80.1% |
| Renter-Occupied Housing Units | 1,026 | 19.9% |
| Total Occupied Housing Units | 5,167 | 100.0% |
Occupancy by Household Size in Bluffdale
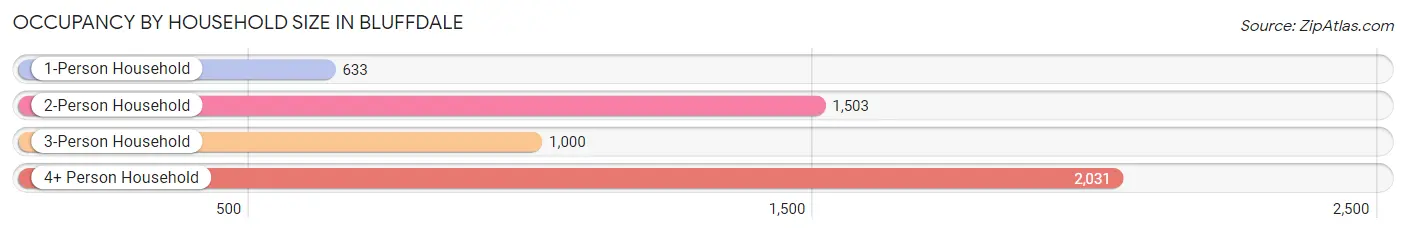
| Household Size | # Housing Units | % Housing Units |
| 1-Person Household | 633 | 12.2% |
| 2-Person Household | 1,503 | 29.1% |
| 3-Person Household | 1,000 | 19.4% |
| 4+ Person Household | 2,031 | 39.3% |
| Total Housing Units | 5,167 | 100.0% |
Occupancy by Ownership by Household Size in Bluffdale
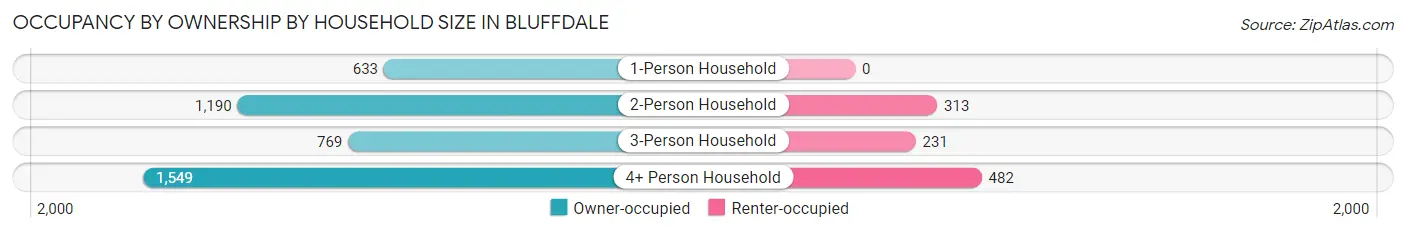
| Household Size | Owner-occupied | Renter-occupied |
| 1-Person Household | 633 (100.0%) | 0 (0.0%) |
| 2-Person Household | 1,190 (79.2%) | 313 (20.8%) |
| 3-Person Household | 769 (76.9%) | 231 (23.1%) |
| 4+ Person Household | 1,549 (76.3%) | 482 (23.7%) |
| Total Housing Units | 4,141 (80.1%) | 1,026 (19.9%) |
Occupancy by Educational Attainment in Bluffdale
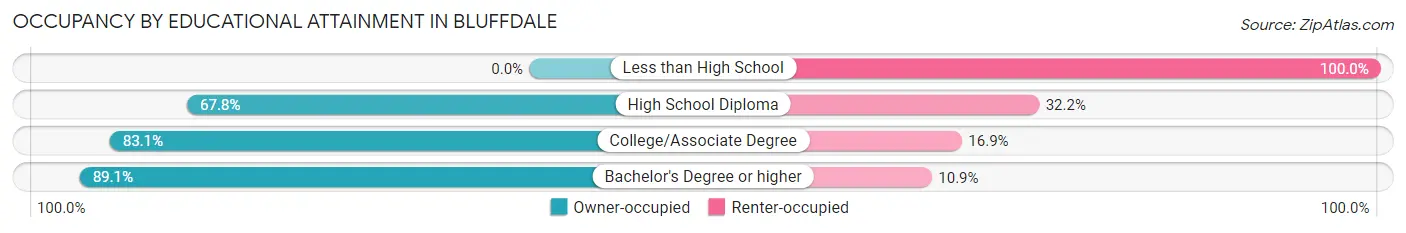
| Household Size | Owner-occupied | Renter-occupied |
| Less than High School | 0 (0.0%) | 163 (100.0%) |
| High School Diploma | 654 (67.8%) | 311 (32.2%) |
| College/Associate Degree | 1,534 (83.1%) | 312 (16.9%) |
| Bachelor's Degree or higher | 1,953 (89.1%) | 240 (10.9%) |
Occupancy by Age of Householder in Bluffdale
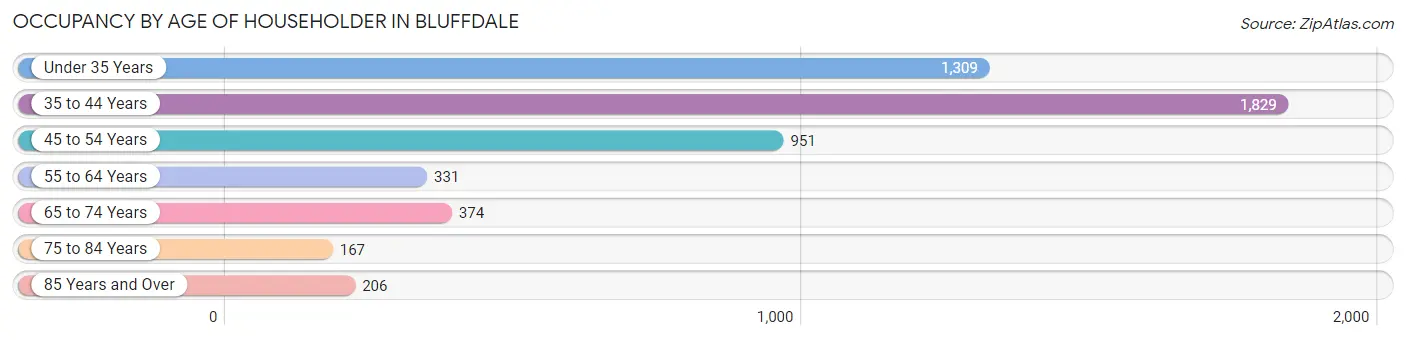
| Age Bracket | # Households | % Households |
| Under 35 Years | 1,309 | 25.3% |
| 35 to 44 Years | 1,829 | 35.4% |
| 45 to 54 Years | 951 | 18.4% |
| 55 to 64 Years | 331 | 6.4% |
| 65 to 74 Years | 374 | 7.2% |
| 75 to 84 Years | 167 | 3.2% |
| 85 Years and Over | 206 | 4.0% |
| Total | 5,167 | 100.0% |
Housing Finances in Bluffdale
Median Income by Occupancy in Bluffdale
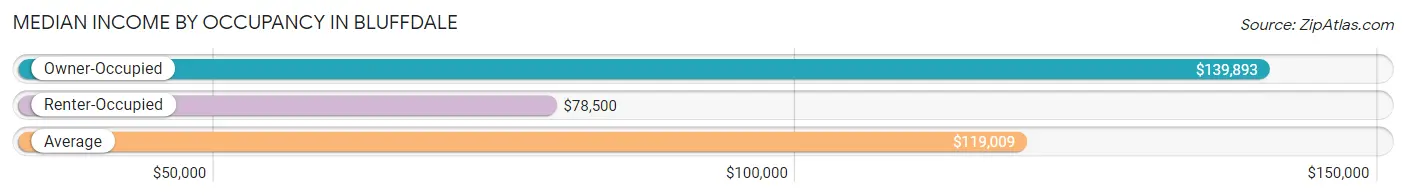
| Occupancy Type | # Households | Median Income |
| Owner-Occupied | 4,141 (80.1%) | $139,893 |
| Renter-Occupied | 1,026 (19.9%) | $78,500 |
| Average | 5,167 (100.0%) | $119,009 |
Occupancy by Householder Income Bracket in Bluffdale
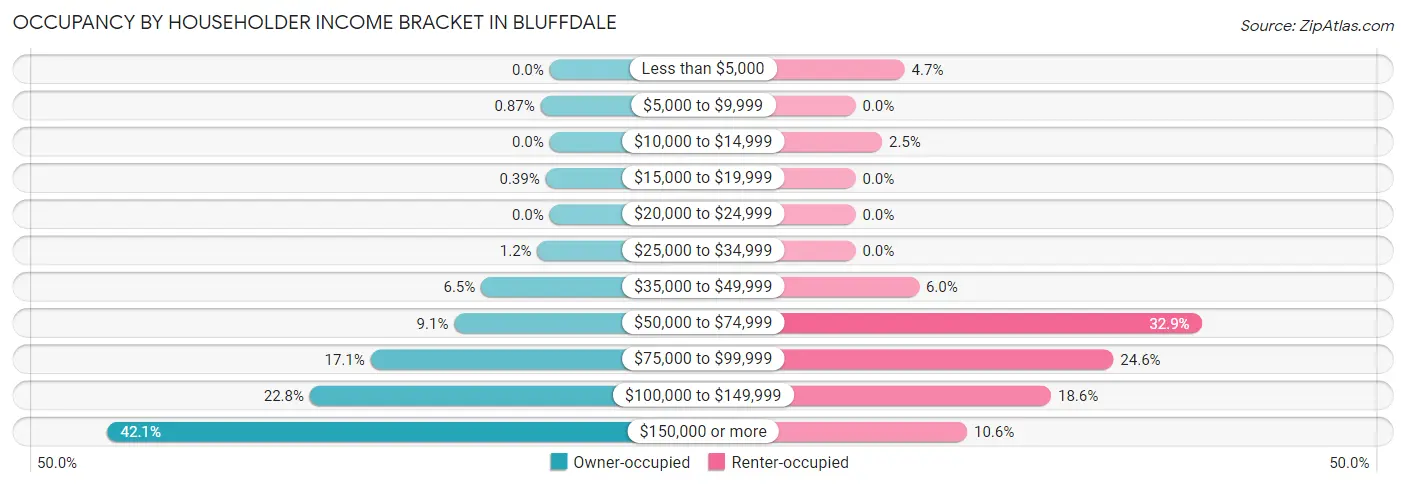
| Income Bracket | Owner-occupied | Renter-occupied |
| Less than $5,000 | 0 (0.0%) | 48 (4.7%) |
| $5,000 to $9,999 | 36 (0.9%) | 0 (0.0%) |
| $10,000 to $14,999 | 0 (0.0%) | 26 (2.5%) |
| $15,000 to $19,999 | 16 (0.4%) | 0 (0.0%) |
| $20,000 to $24,999 | 0 (0.0%) | 0 (0.0%) |
| $25,000 to $34,999 | 48 (1.2%) | 0 (0.0%) |
| $35,000 to $49,999 | 270 (6.5%) | 62 (6.0%) |
| $50,000 to $74,999 | 376 (9.1%) | 338 (32.9%) |
| $75,000 to $99,999 | 706 (17.1%) | 252 (24.6%) |
| $100,000 to $149,999 | 946 (22.8%) | 191 (18.6%) |
| $150,000 or more | 1,743 (42.1%) | 109 (10.6%) |
| Total | 4,141 (100.0%) | 1,026 (100.0%) |
Monthly Housing Cost Tiers in Bluffdale
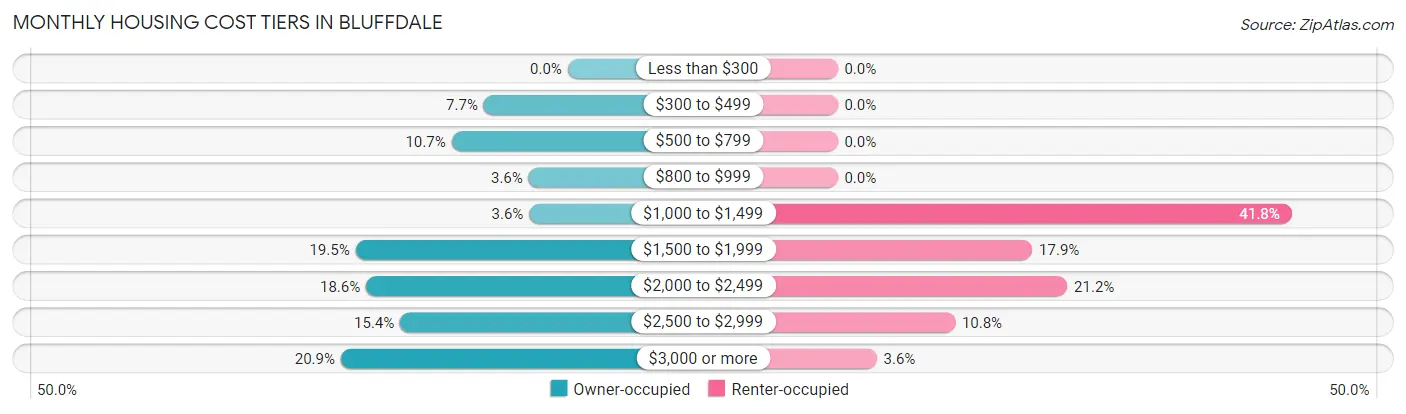
| Monthly Cost | Owner-occupied | Renter-occupied |
| Less than $300 | 0 (0.0%) | 0 (0.0%) |
| $300 to $499 | 320 (7.7%) | 0 (0.0%) |
| $500 to $799 | 443 (10.7%) | 0 (0.0%) |
| $800 to $999 | 149 (3.6%) | 0 (0.0%) |
| $1,000 to $1,499 | 147 (3.5%) | 429 (41.8%) |
| $1,500 to $1,999 | 809 (19.5%) | 184 (17.9%) |
| $2,000 to $2,499 | 769 (18.6%) | 217 (21.1%) |
| $2,500 to $2,999 | 639 (15.4%) | 111 (10.8%) |
| $3,000 or more | 865 (20.9%) | 37 (3.6%) |
| Total | 4,141 (100.0%) | 1,026 (100.0%) |
Physical Housing Characteristics in Bluffdale
Housing Structures in Bluffdale
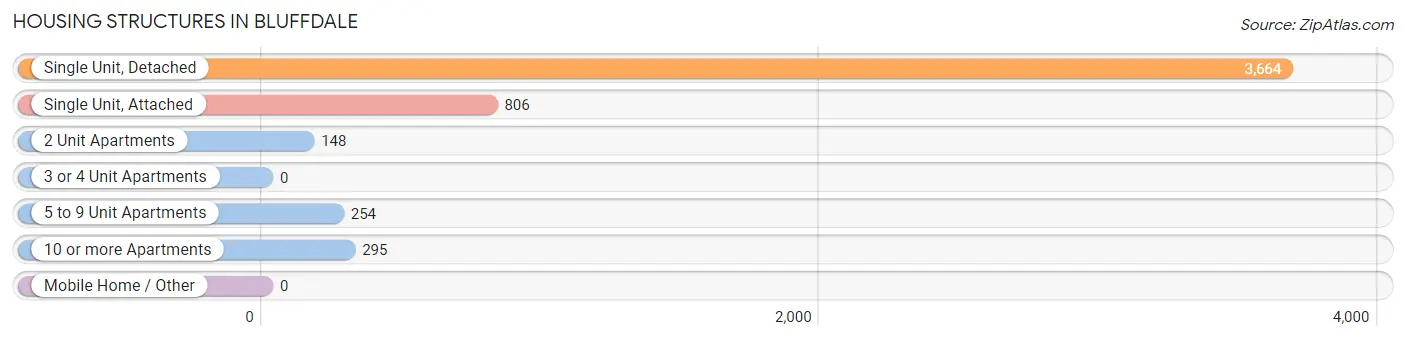
| Structure Type | # Housing Units | % Housing Units |
| Single Unit, Detached | 3,664 | 70.9% |
| Single Unit, Attached | 806 | 15.6% |
| 2 Unit Apartments | 148 | 2.9% |
| 3 or 4 Unit Apartments | 0 | 0.0% |
| 5 to 9 Unit Apartments | 254 | 4.9% |
| 10 or more Apartments | 295 | 5.7% |
| Mobile Home / Other | 0 | 0.0% |
| Total | 5,167 | 100.0% |
Housing Structures by Occupancy in Bluffdale
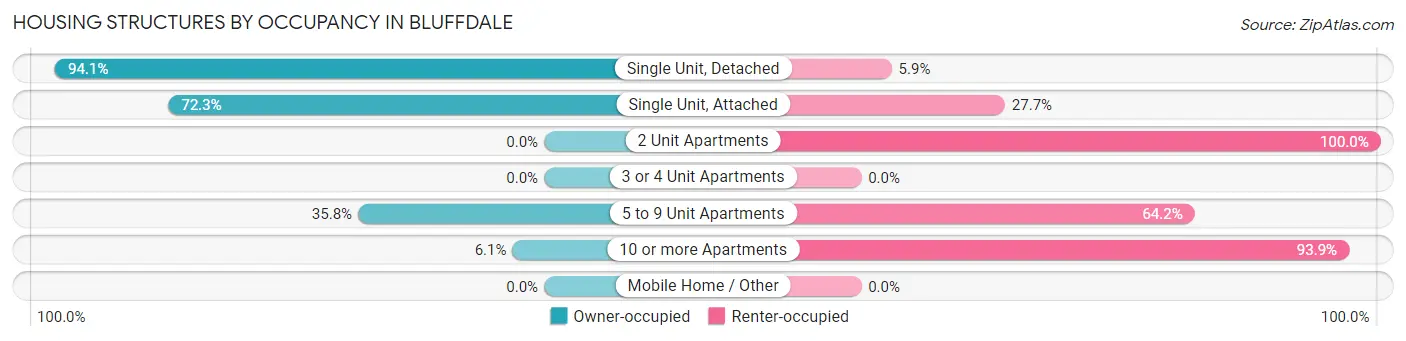
| Structure Type | Owner-occupied | Renter-occupied |
| Single Unit, Detached | 3,449 (94.1%) | 215 (5.9%) |
| Single Unit, Attached | 583 (72.3%) | 223 (27.7%) |
| 2 Unit Apartments | 0 (0.0%) | 148 (100.0%) |
| 3 or 4 Unit Apartments | 0 (0.0%) | 0 (0.0%) |
| 5 to 9 Unit Apartments | 91 (35.8%) | 163 (64.2%) |
| 10 or more Apartments | 18 (6.1%) | 277 (93.9%) |
| Mobile Home / Other | 0 (0.0%) | 0 (0.0%) |
| Total | 4,141 (80.1%) | 1,026 (19.9%) |
Housing Structures by Number of Rooms in Bluffdale
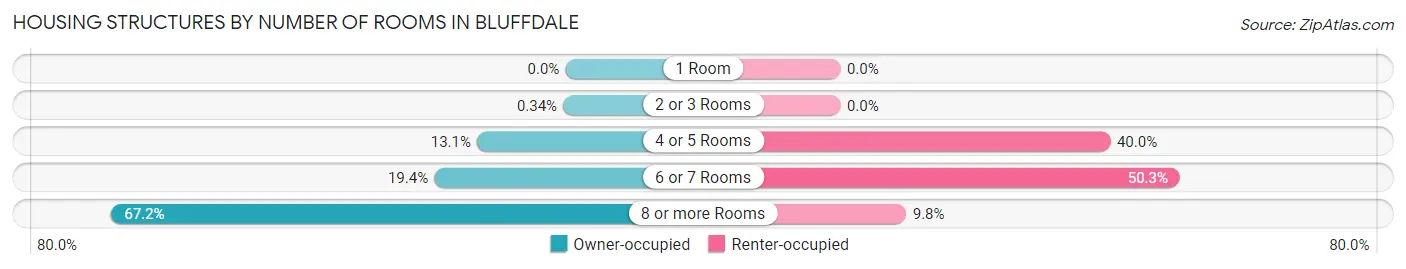
| Number of Rooms | Owner-occupied | Renter-occupied |
| 1 Room | 0 (0.0%) | 0 (0.0%) |
| 2 or 3 Rooms | 14 (0.3%) | 0 (0.0%) |
| 4 or 5 Rooms | 542 (13.1%) | 410 (40.0%) |
| 6 or 7 Rooms | 804 (19.4%) | 516 (50.3%) |
| 8 or more Rooms | 2,781 (67.2%) | 100 (9.8%) |
| Total | 4,141 (100.0%) | 1,026 (100.0%) |
Housing Structure by Heating Type in Bluffdale
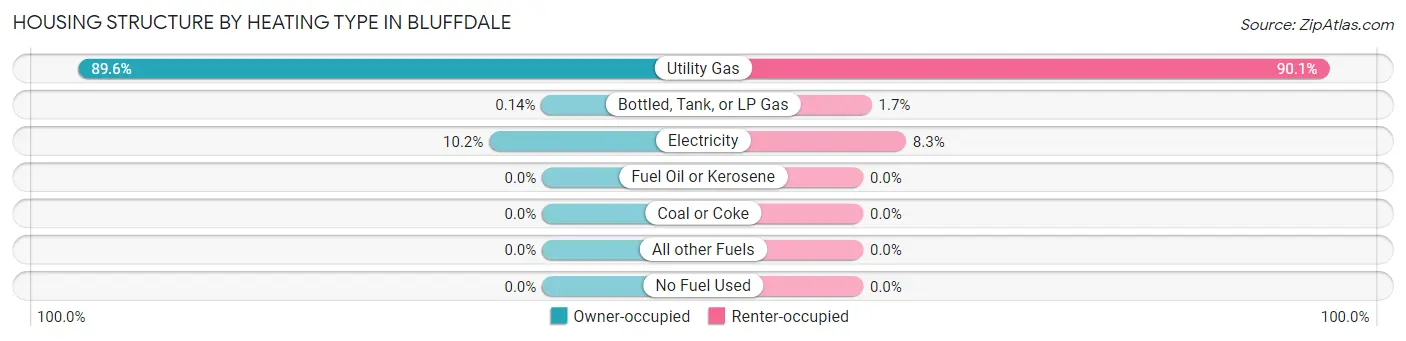
| Heating Type | Owner-occupied | Renter-occupied |
| Utility Gas | 3,711 (89.6%) | 924 (90.1%) |
| Bottled, Tank, or LP Gas | 6 (0.1%) | 17 (1.7%) |
| Electricity | 424 (10.2%) | 85 (8.3%) |
| Fuel Oil or Kerosene | 0 (0.0%) | 0 (0.0%) |
| Coal or Coke | 0 (0.0%) | 0 (0.0%) |
| All other Fuels | 0 (0.0%) | 0 (0.0%) |
| No Fuel Used | 0 (0.0%) | 0 (0.0%) |
| Total | 4,141 (100.0%) | 1,026 (100.0%) |
Household Vehicle Usage in Bluffdale
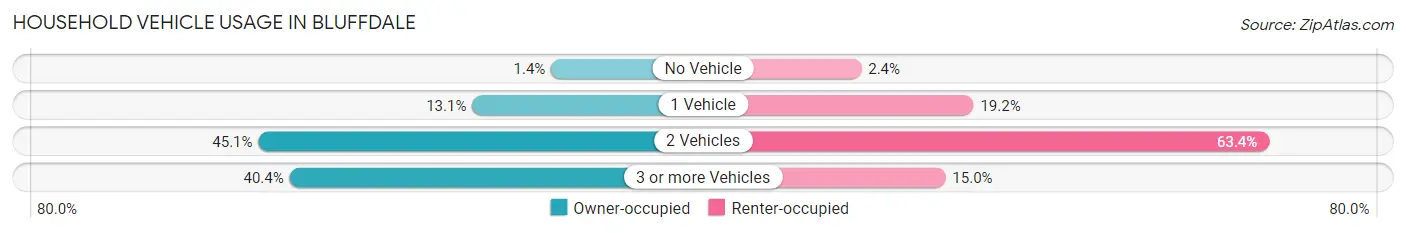
| Vehicles per Household | Owner-occupied | Renter-occupied |
| No Vehicle | 56 (1.3%) | 25 (2.4%) |
| 1 Vehicle | 544 (13.1%) | 197 (19.2%) |
| 2 Vehicles | 1,867 (45.1%) | 650 (63.3%) |
| 3 or more Vehicles | 1,674 (40.4%) | 154 (15.0%) |
| Total | 4,141 (100.0%) | 1,026 (100.0%) |
Real Estate & Mortgages in Bluffdale
Real Estate and Mortgage Overview in Bluffdale
| Characteristic | Without Mortgage | With Mortgage |
| Housing Units | 816 | 3,325 |
| Median Property Value | $528,900 | $599,300 |
| Median Household Income | $78,304 | $1,601 |
| Monthly Housing Costs | $578 | $865 |
| Real Estate Taxes | $2,899 | $91 |
Property Value by Mortgage Status in Bluffdale
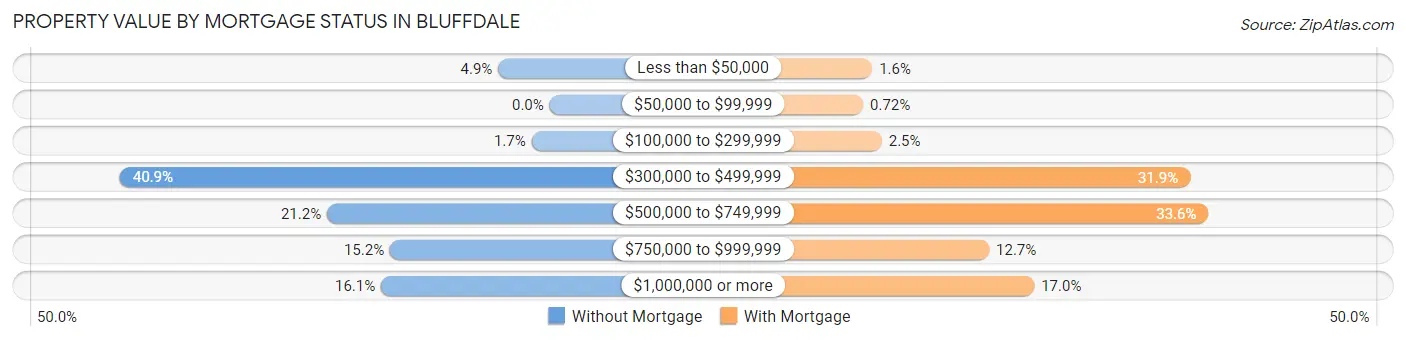
| Property Value | Without Mortgage | With Mortgage |
| Less than $50,000 | 40 (4.9%) | 53 (1.6%) |
| $50,000 to $99,999 | 0 (0.0%) | 24 (0.7%) |
| $100,000 to $299,999 | 14 (1.7%) | 83 (2.5%) |
| $300,000 to $499,999 | 334 (40.9%) | 1,059 (31.9%) |
| $500,000 to $749,999 | 173 (21.2%) | 1,117 (33.6%) |
| $750,000 to $999,999 | 124 (15.2%) | 423 (12.7%) |
| $1,000,000 or more | 131 (16.1%) | 566 (17.0%) |
| Total | 816 (100.0%) | 3,325 (100.0%) |
Household Income by Mortgage Status in Bluffdale
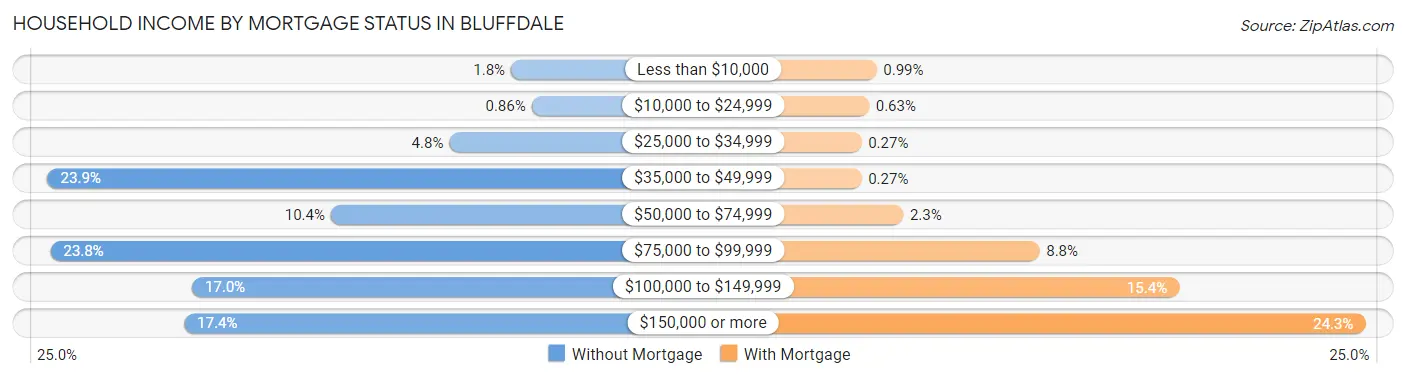
| Household Income | Without Mortgage | With Mortgage |
| Less than $10,000 | 15 (1.8%) | 33 (1.0%) |
| $10,000 to $24,999 | 7 (0.9%) | 21 (0.6%) |
| $25,000 to $34,999 | 39 (4.8%) | 9 (0.3%) |
| $35,000 to $49,999 | 195 (23.9%) | 9 (0.3%) |
| $50,000 to $74,999 | 85 (10.4%) | 75 (2.3%) |
| $75,000 to $99,999 | 194 (23.8%) | 291 (8.7%) |
| $100,000 to $149,999 | 139 (17.0%) | 512 (15.4%) |
| $150,000 or more | 142 (17.4%) | 807 (24.3%) |
| Total | 816 (100.0%) | 3,325 (100.0%) |
Property Value to Household Income Ratio in Bluffdale
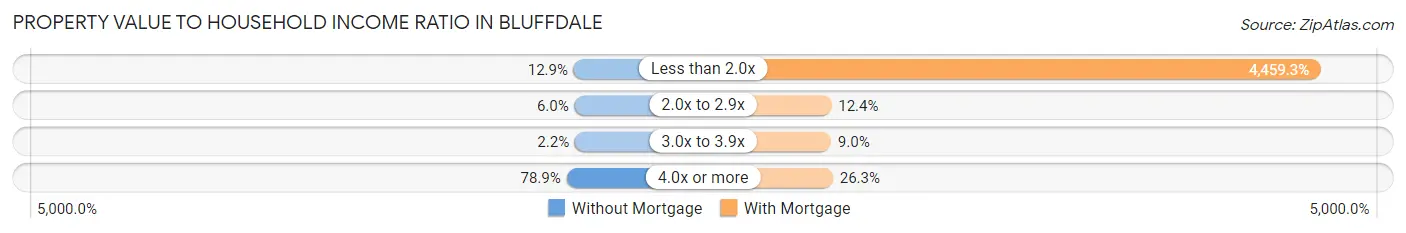
| Value-to-Income Ratio | Without Mortgage | With Mortgage |
| Less than 2.0x | 105 (12.9%) | 148,272 (4,459.3%) |
| 2.0x to 2.9x | 49 (6.0%) | 411 (12.4%) |
| 3.0x to 3.9x | 18 (2.2%) | 300 (9.0%) |
| 4.0x or more | 644 (78.9%) | 874 (26.3%) |
| Total | 816 (100.0%) | 3,325 (100.0%) |
Real Estate Taxes by Mortgage Status in Bluffdale
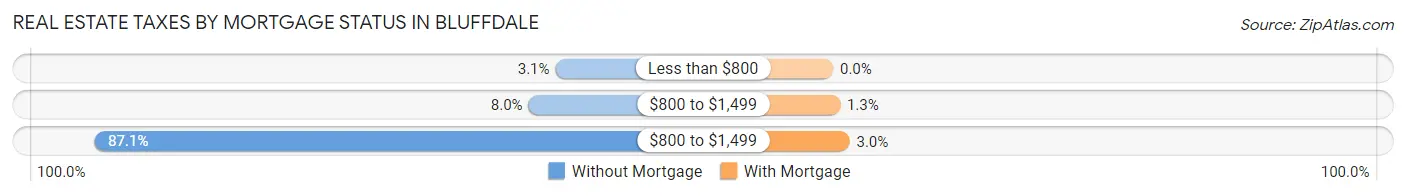
| Property Taxes | Without Mortgage | With Mortgage |
| Less than $800 | 25 (3.1%) | 0 (0.0%) |
| $800 to $1,499 | 65 (8.0%) | 42 (1.3%) |
| $800 to $1,499 | 711 (87.1%) | 100 (3.0%) |
| Total | 816 (100.0%) | 3,325 (100.0%) |
Health & Disability in Bluffdale
Health Insurance Coverage by Age in Bluffdale
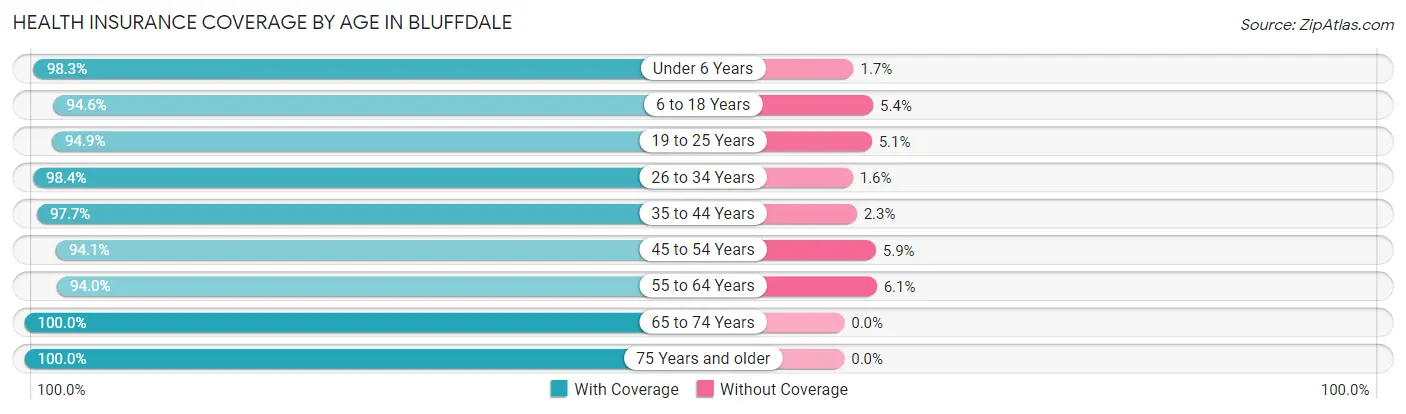
| Age Bracket | With Coverage | Without Coverage |
| Under 6 Years | 1,773 (98.3%) | 31 (1.7%) |
| 6 to 18 Years | 4,077 (94.6%) | 232 (5.4%) |
| 19 to 25 Years | 1,149 (94.9%) | 62 (5.1%) |
| 26 to 34 Years | 2,622 (98.4%) | 42 (1.6%) |
| 35 to 44 Years | 3,432 (97.7%) | 81 (2.3%) |
| 45 to 54 Years | 1,712 (94.1%) | 107 (5.9%) |
| 55 to 64 Years | 777 (94.0%) | 50 (6.0%) |
| 65 to 74 Years | 668 (100.0%) | 0 (0.0%) |
| 75 Years and older | 627 (100.0%) | 0 (0.0%) |
| Total | 16,837 (96.5%) | 605 (3.5%) |
Health Insurance Coverage by Citizenship Status in Bluffdale
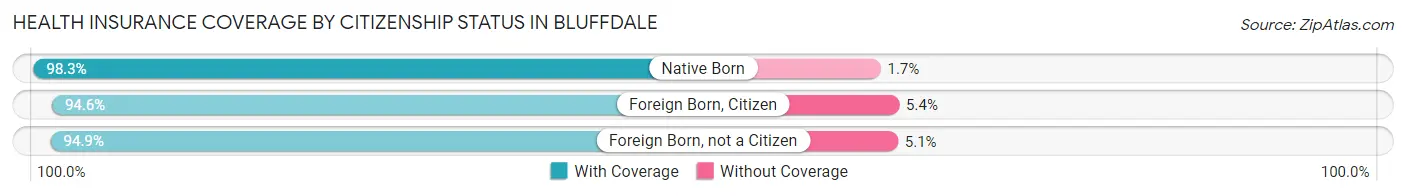
| Citizenship Status | With Coverage | Without Coverage |
| Native Born | 1,773 (98.3%) | 31 (1.7%) |
| Foreign Born, Citizen | 4,077 (94.6%) | 232 (5.4%) |
| Foreign Born, not a Citizen | 1,149 (94.9%) | 62 (5.1%) |
Health Insurance Coverage by Household Income in Bluffdale
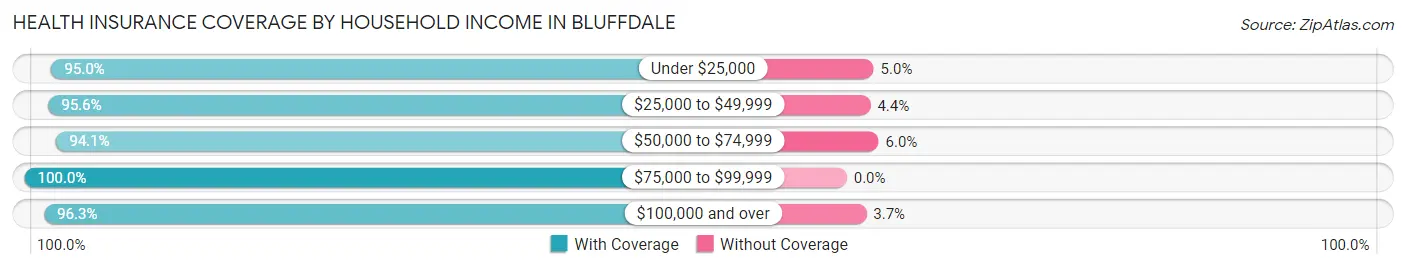
| Household Income | With Coverage | Without Coverage |
| Under $25,000 | 359 (95.0%) | 19 (5.0%) |
| $25,000 to $49,999 | 602 (95.6%) | 28 (4.4%) |
| $50,000 to $74,999 | 2,672 (94.1%) | 169 (5.9%) |
| $75,000 to $99,999 | 2,971 (100.0%) | 0 (0.0%) |
| $100,000 and over | 10,230 (96.3%) | 389 (3.7%) |
Public vs Private Health Insurance Coverage by Age in Bluffdale
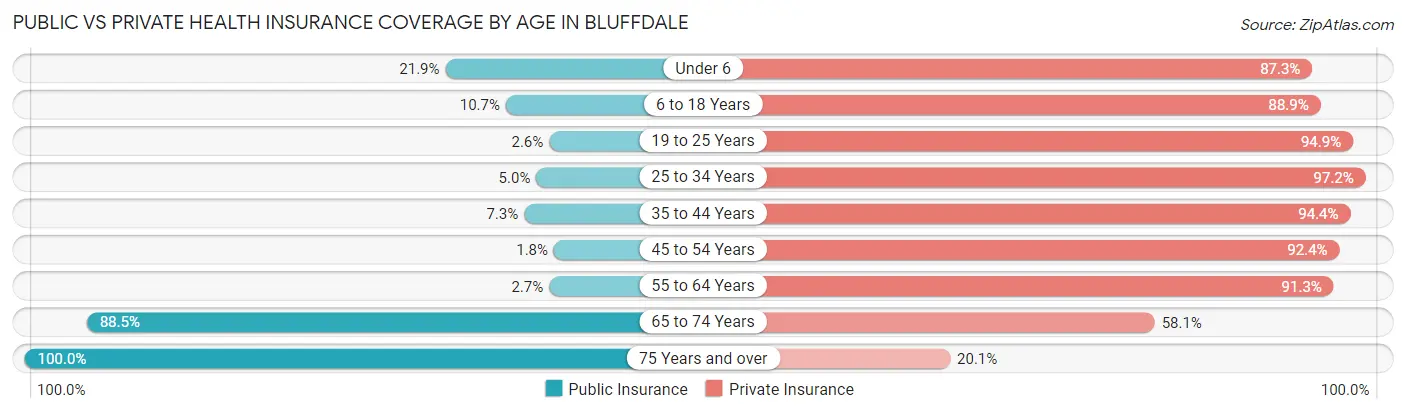
| Age Bracket | Public Insurance | Private Insurance |
| Under 6 | 395 (21.9%) | 1,575 (87.3%) |
| 6 to 18 Years | 460 (10.7%) | 3,829 (88.9%) |
| 19 to 25 Years | 32 (2.6%) | 1,149 (94.9%) |
| 25 to 34 Years | 134 (5.0%) | 2,590 (97.2%) |
| 35 to 44 Years | 256 (7.3%) | 3,316 (94.4%) |
| 45 to 54 Years | 32 (1.8%) | 1,680 (92.4%) |
| 55 to 64 Years | 22 (2.7%) | 755 (91.3%) |
| 65 to 74 Years | 591 (88.5%) | 388 (58.1%) |
| 75 Years and over | 627 (100.0%) | 126 (20.1%) |
| Total | 2,549 (14.6%) | 15,408 (88.3%) |
Disability Status by Sex by Age in Bluffdale
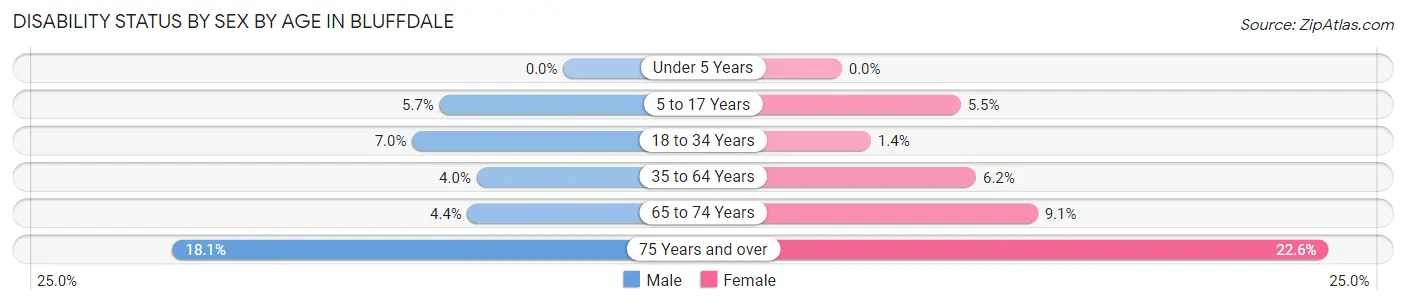
| Age Bracket | Male | Female |
| Under 5 Years | 0 (0.0%) | 0 (0.0%) |
| 5 to 17 Years | 142 (5.7%) | 113 (5.5%) |
| 18 to 34 Years | 152 (7.0%) | 26 (1.3%) |
| 35 to 64 Years | 116 (4.0%) | 204 (6.2%) |
| 65 to 74 Years | 16 (4.4%) | 28 (9.1%) |
| 75 Years and over | 35 (18.1%) | 98 (22.6%) |
Disability Class by Sex by Age in Bluffdale
Disability Class: Hearing Difficulty
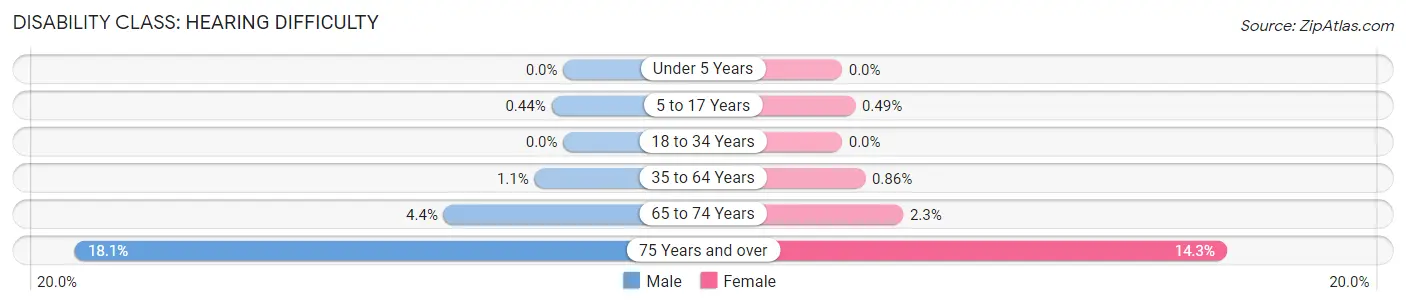
| Age Bracket | Male | Female |
| Under 5 Years | 0 (0.0%) | 0 (0.0%) |
| 5 to 17 Years | 11 (0.4%) | 10 (0.5%) |
| 18 to 34 Years | 0 (0.0%) | 0 (0.0%) |
| 35 to 64 Years | 31 (1.1%) | 28 (0.9%) |
| 65 to 74 Years | 16 (4.4%) | 7 (2.3%) |
| 75 Years and over | 35 (18.1%) | 62 (14.3%) |
Disability Class: Vision Difficulty
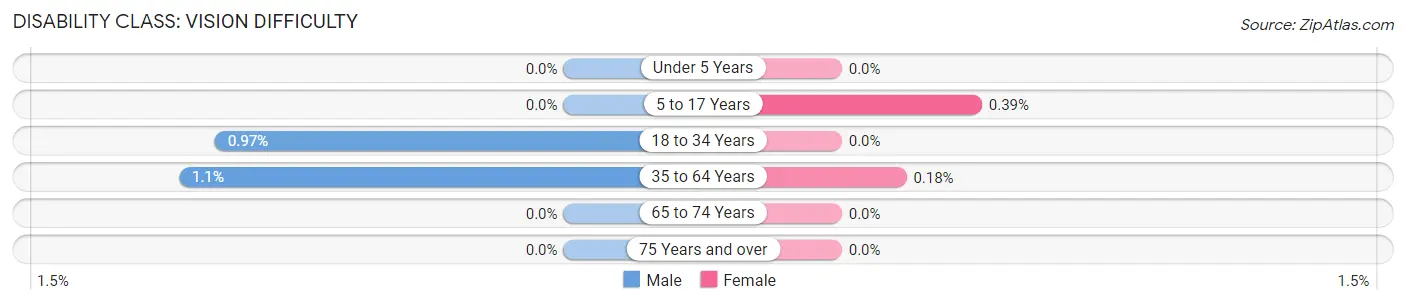
| Age Bracket | Male | Female |
| Under 5 Years | 0 (0.0%) | 0 (0.0%) |
| 5 to 17 Years | 0 (0.0%) | 8 (0.4%) |
| 18 to 34 Years | 21 (1.0%) | 0 (0.0%) |
| 35 to 64 Years | 31 (1.1%) | 6 (0.2%) |
| 65 to 74 Years | 0 (0.0%) | 0 (0.0%) |
| 75 Years and over | 0 (0.0%) | 0 (0.0%) |
Disability Class: Cognitive Difficulty
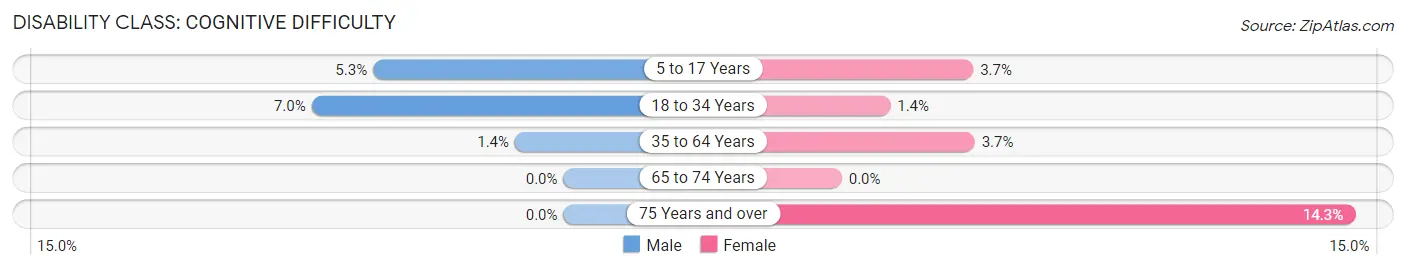
| Age Bracket | Male | Female |
| 5 to 17 Years | 131 (5.3%) | 75 (3.7%) |
| 18 to 34 Years | 152 (7.0%) | 26 (1.3%) |
| 35 to 64 Years | 39 (1.3%) | 121 (3.7%) |
| 65 to 74 Years | 0 (0.0%) | 0 (0.0%) |
| 75 Years and over | 0 (0.0%) | 62 (14.3%) |
Disability Class: Ambulatory Difficulty
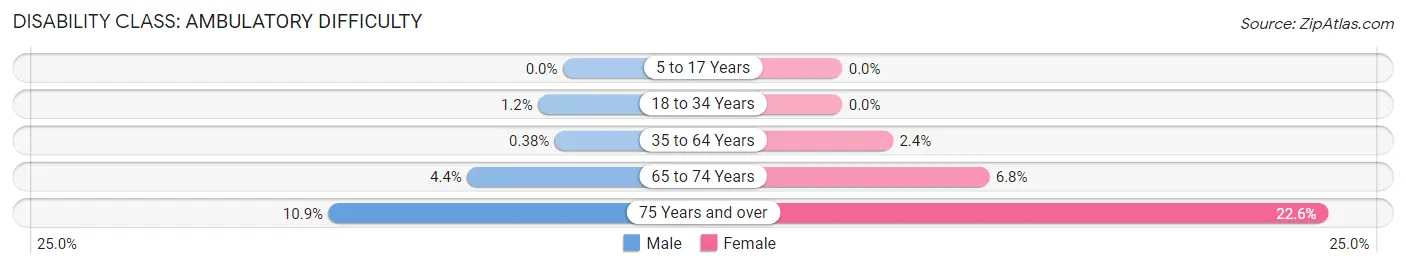
| Age Bracket | Male | Female |
| 5 to 17 Years | 0 (0.0%) | 0 (0.0%) |
| 18 to 34 Years | 25 (1.1%) | 0 (0.0%) |
| 35 to 64 Years | 11 (0.4%) | 77 (2.4%) |
| 65 to 74 Years | 16 (4.4%) | 21 (6.8%) |
| 75 Years and over | 21 (10.9%) | 98 (22.6%) |
Disability Class: Self-Care Difficulty
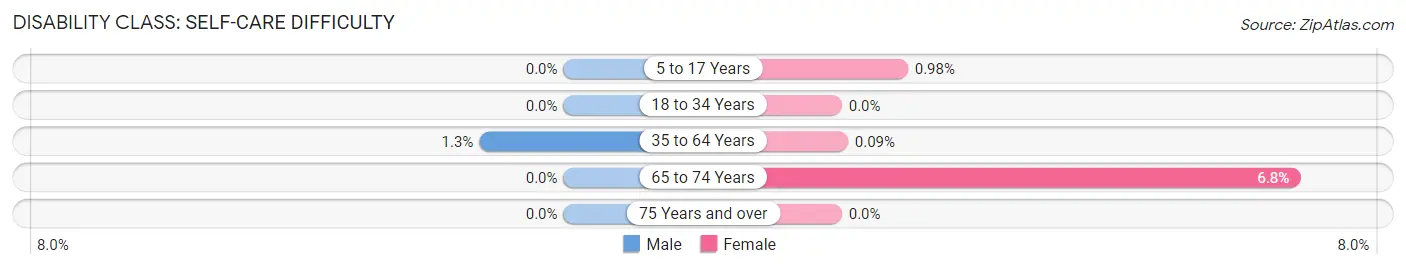
| Age Bracket | Male | Female |
| 5 to 17 Years | 0 (0.0%) | 20 (1.0%) |
| 18 to 34 Years | 0 (0.0%) | 0 (0.0%) |
| 35 to 64 Years | 36 (1.3%) | 3 (0.1%) |
| 65 to 74 Years | 0 (0.0%) | 21 (6.8%) |
| 75 Years and over | 0 (0.0%) | 0 (0.0%) |
Technology Access in Bluffdale
Computing Device Access in Bluffdale
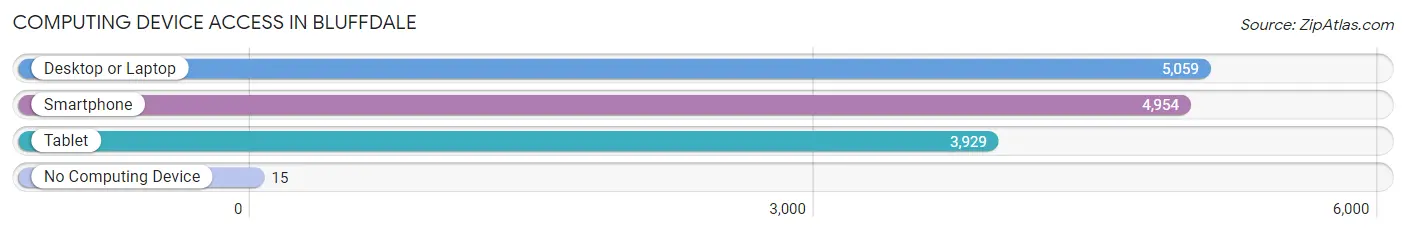
| Device Type | # Households | % Households |
| Desktop or Laptop | 5,059 | 97.9% |
| Smartphone | 4,954 | 95.9% |
| Tablet | 3,929 | 76.0% |
| No Computing Device | 15 | 0.3% |
| Total | 5,167 | 100.0% |
Internet Access in Bluffdale
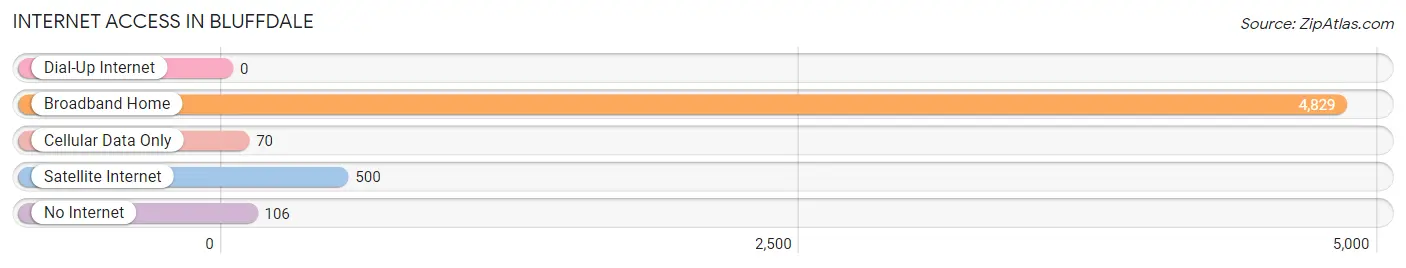
| Internet Type | # Households | % Households |
| Dial-Up Internet | 0 | 0.0% |
| Broadband Home | 4,829 | 93.5% |
| Cellular Data Only | 70 | 1.3% |
| Satellite Internet | 500 | 9.7% |
| No Internet | 106 | 2.1% |
| Total | 5,167 | 100.0% |
Bluffdale Summary
Bluffdale, Utah is a small city located in Salt Lake County, Utah, United States. It is situated in the foothills of the Wasatch Mountains, about 20 miles south of Salt Lake City. The city has a population of 8,118 as of the 2010 census.
History
Bluffdale was first settled in 1848 by a group of Mormon pioneers led by John Bluff. The town was named after him, and the area was used for farming and grazing. In 1854, the first schoolhouse was built in the area. The town was incorporated in 1891.
In the early 1900s, Bluffdale was a thriving agricultural community. The area was known for its production of hay, grain, and livestock. The town also had a number of businesses, including a bank, a hotel, a blacksmith shop, and a general store.
In the 1950s, the population of Bluffdale began to decline as people moved away to larger cities. However, the town experienced a resurgence in the late 1990s when the population began to grow again.
Geography
Bluffdale is located in the foothills of the Wasatch Mountains, about 20 miles south of Salt Lake City. The city is situated at an elevation of 4,400 feet above sea level. The area is characterized by rolling hills and valleys, with the Jordan River running through the city.
The climate in Bluffdale is semi-arid, with hot summers and cold winters. The average annual temperature is around 50 degrees Fahrenheit. The average annual precipitation is around 15 inches.
Economy
The economy of Bluffdale is largely based on agriculture and tourism. The city is home to several farms, which produce hay, grain, and livestock. The city also has a number of businesses, including restaurants, retail stores, and service providers.
The city is also home to several technology companies, including Adobe Systems, Oracle, and Symantec. These companies provide employment opportunities for many of the city’s residents.
Demographics
As of the 2010 census, the population of Bluffdale was 8,118. The racial makeup of the city was 91.3% White, 0.7% African American, 0.3% Native American, 1.2% Asian, 0.1% Pacific Islander, 4.2% from other races, and 2.4% from two or more races. Hispanic or Latino of any race were 8.3% of the population.
The median income for a household in Bluffdale was $67,917, and the median income for a family was $76,917. The per capita income for the city was $27,917. About 4.2% of families and 5.3% of the population were below the poverty line, including 6.3% of those under age 18 and 4.2% of those age 65 or over.
Common Questions
What is Per Capita Income in Bluffdale?
Per Capita income in Bluffdale is $43,491.
What is the Median Family Income in Bluffdale?
Median Family Income in Bluffdale is $137,679.
What is the Median Household income in Bluffdale?
Median Household Income in Bluffdale is $119,009.
What is Income or Wage Gap in Bluffdale?
Income or Wage Gap in Bluffdale is 50.2%.
Women in Bluffdale earn 49.8 cents for every dollar earned by a man.
What is Inequality or Gini Index in Bluffdale?
Inequality or Gini Index in Bluffdale is 0.36.
What is the Total Population of Bluffdale?
Total Population of Bluffdale is 17,460.
What is the Total Male Population of Bluffdale?
Total Male Population of Bluffdale is 8,820.
What is the Total Female Population of Bluffdale?
Total Female Population of Bluffdale is 8,640.
What is the Ratio of Males per 100 Females in Bluffdale?
There are 102.08 Males per 100 Females in Bluffdale.
What is the Ratio of Females per 100 Males in Bluffdale?
There are 97.96 Females per 100 Males in Bluffdale.
What is the Median Population Age in Bluffdale?
Median Population Age in Bluffdale is 31.4 Years.
What is the Average Family Size in Bluffdale
Average Family Size in Bluffdale is 3.8 People.
What is the Average Household Size in Bluffdale
Average Household Size in Bluffdale is 3.4 People.
How Large is the Labor Force in Bluffdale?
There are 9,415 People in the Labor Forcein in Bluffdale.
What is the Percentage of People in the Labor Force in Bluffdale?
77.2% of People are in the Labor Force in Bluffdale.
What is the Unemployment Rate in Bluffdale?
Unemployment Rate in Bluffdale is 2.2%.